Embed Size (px)
Citation preview

Title Fatigue Evaluation of Rib-to-Deck Joint in Orthotropic SteelBridge Decks( Dissertation_全文 )
Author(s) Li, Ming
Citation Kyoto University (京都大学)
Issue Date 2014-11-25
URL http://dx.doi.org/10.14989/doctor.k18653
Right 許諾条件により本文は2015/10/01に公開
Type Thesis or Dissertation
Textversion ETD
Kyoto University

Fatigue Evaluation of Rib-to-Deck Joint
in Orthotropic Steel Bridge Decks
Ming Li
Doctor of Engineering
Department of Civil and Earth Resources
Engineering, Kyoto University
2014
I
Abstract
Orthotropic steel bridge decks (OSDs) are widely used in the long-span bridges, movable
bridges and urban viaducts. However, many fatigue cracks in orthotropic steel bridge decks were
reported in japan recently. Among these fatigue cracks, the cracks occurred around the rib to deck
joints are most critical, because the rib-to-deck (RD) joint fatigue cracks will cause the asphalt
surfacing damage steel corrosion. The purpose of this study is investigating the asphalt surfacing
influence on the fatigue life of the RD joint and fatigue strength of RD joint with various welding
details.
In chapter 1, the background of the cause of fatigue damage and fatigue crack initiation and
propagation mechanics of metals and welding joints are introduced. Various fatigue life evaluation
methods are discussed. Among these fatigue evaluation methods the fatigue strength classification
for various welding joints and loading conditions based on the S-N curves are most widely used in
fatigue design specifications or recommendations. Moreover, for the fatigue cracks initiation from
the weld toe and the welding joint is not covered by the fatigue strength classification, the structure
hotspot stress method is recommended by the JSSC and IIW to be employed to evaluate the fatigue
life i.e. using the hotspot stress instead of normal stress based on the fatigue strength classification
of the corresponding cruciform welding joint. The linear elastic fracture mechanics (LEFM) is
generally used to evaluate the fatigue life of the welding joint which is not covered by the fatigue
strength classification welding joint details and the fatigue crack initiating from the weld root.
In the chapter 2, the historical development of OSDs is reviewed. Some strengthen and refit
methods for the RD joint are also introduced in this chapter. The macro analysis of rib-to-deck
fatigue cracks in the Wangan route of Hanshin expressway was carried out in this chapter. The
macro analysis result shows that most fatigue cracks around the RD joint located in the driving lines
with large traffic volume of heavy load axles. And all the RD fatigue cracks are located in the
transverse range of 800mm from tire center. It could be concluded that the fatigue damage of
rib-to-deck joint is significantly sensitive to the volume of heavy load axles and transverse locations
of wheel loads.
So in chapter 3, for the purpose to investigate the relationship of the stress around RD joints and
wheel load location, a Finite Element (FE) model of partial orthotropic steel deck was made using
the general purpose FE software Abaqus. The calculation result shows that stresses around the RD
joint are significantly sensitive to the transverse loading location. With respect to the cross section
II
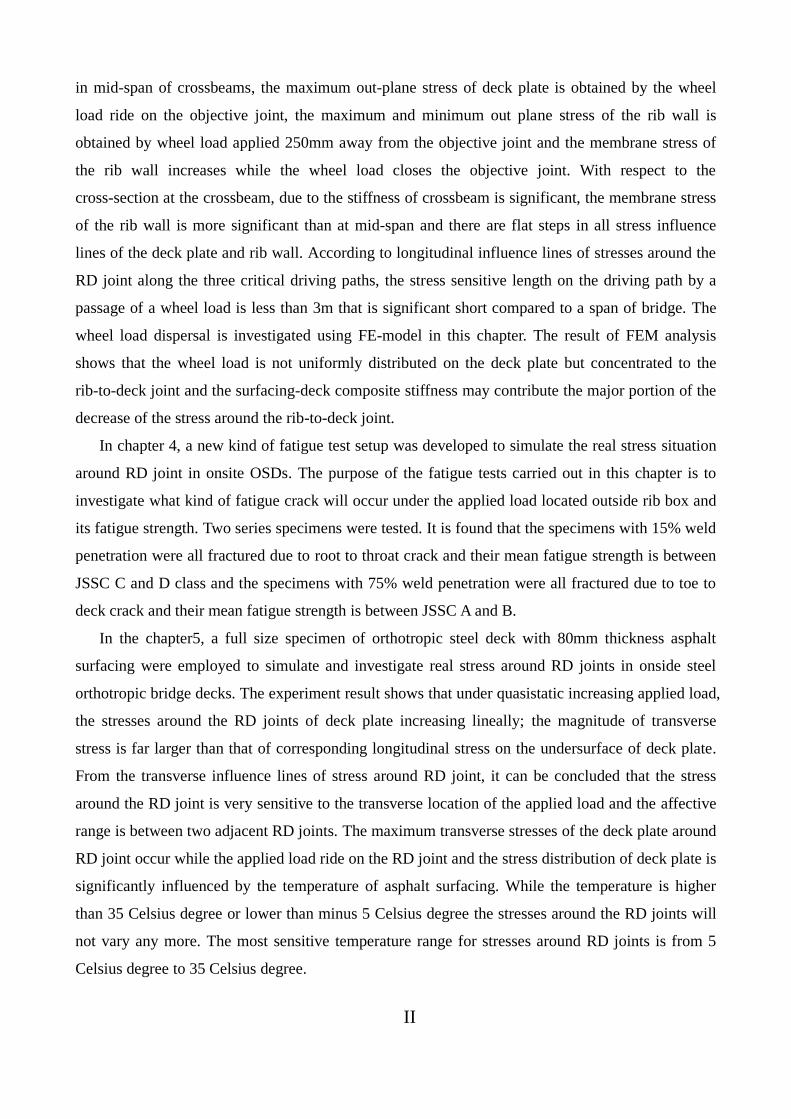
in mid-span of crossbeams, the maximum out-plane stress of deck plate is obtained by the wheel
load ride on the objective joint, the maximum and minimum out plane stress of the rib wall is
obtained by wheel load applied 250mm away from the objective joint and the membrane stress of
the rib wall increases while the wheel load closes the objective joint. With respect to the
cross-section at the crossbeam, due to the stiffness of crossbeam is significant, the membrane stress
of the rib wall is more significant than at mid-span and there are flat steps in all stress influence
lines of the deck plate and rib wall. According to longitudinal influence lines of stresses around the
RD joint along the three critical driving paths, the stress sensitive length on the driving path by a
passage of a wheel load is less than 3m that is significant short compared to a span of bridge. The
wheel load dispersal is investigated using FE-model in this chapter. The result of FEM analysis
shows that the wheel load is not uniformly distributed on the deck plate but concentrated to the
rib-to-deck joint and the surfacing-deck composite stiffness may contribute the major portion of the
decrease of the stress around the rib-to-deck joint.
In chapter 4, a new kind of fatigue test setup was developed to simulate the real stress situation
around RD joint in onsite OSDs. The purpose of the fatigue tests carried out in this chapter is to
investigate what kind of fatigue crack will occur under the applied load located outside rib box and
its fatigue strength. Two series specimens were tested. It is found that the specimens with 15% weld
penetration were all fractured due to root to throat crack and their mean fatigue strength is between
JSSC C and D class and the specimens with 75% weld penetration were all fractured due to toe to
deck crack and their mean fatigue strength is between JSSC A and B.
In the chapter5, a full size specimen of orthotropic steel deck with 80mm thickness asphalt
surfacing were employed to simulate and investigate real stress around RD joints in onside steel
orthotropic bridge decks. The experiment result shows that under quasistatic increasing applied load,
the stresses around the RD joints of deck plate increasing lineally; the magnitude of transverse
stress is far larger than that of corresponding longitudinal stress on the undersurface of deck plate.
From the transverse influence lines of stress around RD joint, it can be concluded that the stress
around the RD joint is very sensitive to the transverse location of the applied load and the affective
range is between two adjacent RD joints. The maximum transverse stresses of the deck plate around
RD joint occur while the applied load ride on the RD joint and the stress distribution of deck plate is
significantly influenced by the temperature of asphalt surfacing. While the temperature is higher
than 35 Celsius degree or lower than minus 5 Celsius degree the stresses around the RD joints will
not vary any more. The most sensitive temperature range for stresses around RD joints is from 5
Celsius degree to 35 Celsius degree.

III
Acknowledgments
The author is deeply grateful and indebted to his academic advisor, Professor Kunitomo Sugiura,
Professor of Structure Engineering, in the Department of Civil and Earth Resources Engineering,
Kyoto University, for his precious guidance, encouragement and support throughout this study.
Sincere thanks are also extended to Professor Hirotaka Kawano and Professor Shirato Hiromichi for
their detailed review of this dissertation and valuable suggestion to the research.
The author thanks the Japanese Government for providing the scholarship and chance for him to
conduct this study.
The author is thankful to Professor Chul-Woo Kim of Kyoto University, Dr. Yasuo Suzuki,
Assistant Professor of Structural Engineering Laboratory and Dr. Kunitaro Hashimoto, Associate
Professor of Kobe University, for their support and help in this study. The author also thanks Mrs.
Namie Kawano, secretary of Structural Engineering Laboratory for her kind help in various
procedures.
The author also wishes to express his grateful appreciation to Dr. Toshiyuki Ishikawa, Assistant
Professor of Kyoto University and Dr. Masaru Shimizu, Assistant Professor of Nagoya University
for their help and sharing their valuable experience in the involved research topics of this study.
The macro analysis data of orthotropic bridge deck and the full size orthotropic steel deck
specimen experiment are all provided or financial supported by Hanshin Expressway Corporation.
The author is grateful to Dr. Yukio Adachi and other excellent engineers of Hanshin Expressway
Corporation without their support this study would not be possible. The author wishes to extend
appreciation to Mr. Hiroto Arima and Mr. Yashihiro Miyasaka for their assistance on preparation of
the tests.
The author is thankful to all the students of Structural Engineering Laboratory for providing a
friendly and hospitable environment for the author form foreign country.
Special thanks are also given to Dr. Yunbiao Luo Researcher of Disaster Prevention Research
Institute Kyoto University and Dr. Kaichun Chang, Postdoctoral Fellow of Department of Civil and
Resource Engineering Kyoto University for their kind help and advice during this study.
The author expresses his deep appreciation to his parents and wife for their taking care of his
son, for giving him financial and moral support in the author’s most hard time. This dissertation is
dedicated to my family.
IV
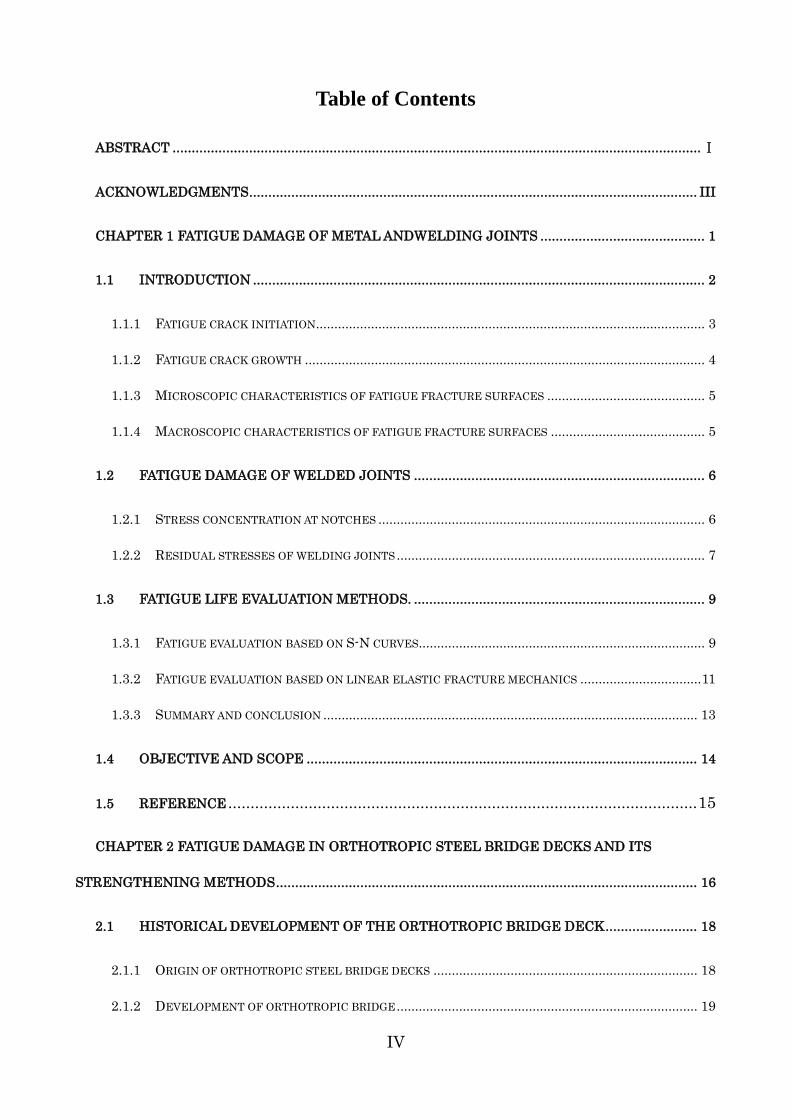
Table of Contents
ABSTRACT .......................................................................................................................................... Ⅰ
ACKNOWLEDGMENTS ..................................................................................................................... III
CHAPTER 1 FATIGUE DAMAGE OF METAL ANDWELDING JOINTS ........................................... 1
1.1 INTRODUCTION ...................................................................................................................... 2
1.1.1 FATIGUE CRACK INITIATION .......................................................................................................... 3
1.1.2 FATIGUE CRACK GROWTH ............................................................................................................. 4
1.1.3 MICROSCOPIC CHARACTERISTICS OF FATIGUE FRACTURE SURFACES ........................................... 5
1.1.4 MACROSCOPIC CHARACTERISTICS OF FATIGUE FRACTURE SURFACES .......................................... 5
1.2 FATIGUE DAMAGE OF WELDED JOINTS ............................................................................ 6
1.2.1 STRESS CONCENTRATION AT NOTCHES ......................................................................................... 6
1.2.2 RESIDUAL STRESSES OF WELDING JOINTS .................................................................................... 7
1.3 FATIGUE LIFE EVALUATION METHODS. ............................................................................ 9
1.3.1 FATIGUE EVALUATION BASED ON S-N CURVES .............................................................................. 9
1.3.2 FATIGUE EVALUATION BASED ON LINEAR ELASTIC FRACTURE MECHANICS ................................. 11
1.3.3 SUMMARY AND CONCLUSION ...................................................................................................... 13
1.4 OBJECTIVE AND SCOPE ...................................................................................................... 14
1.5 REFERENCE ......................................................................................................... 15
CHAPTER 2 FATIGUE DAMAGE IN ORTHOTROPIC STEEL BRIDGE DECKS AND ITS
STRENGTHENING METHODS .............................................................................................................. 16
2.1 HISTORICAL DEVELOPMENT OF THE ORTHOTROPIC BRIDGE DECK ........................ 18
2.1.1 ORIGIN OF ORTHOTROPIC STEEL BRIDGE DECKS ........................................................................ 18
2.1.2 DEVELOPMENT OF ORTHOTROPIC BRIDGE .................................................................................. 19
V
2.2 FATIGUE DAMAGE IN ORTHOTROPIC STEEL BRIDGE DECKS ..................................... 24
2.3 FATIGUE CRACKS OF RIB-TO-DECK (RD) JOINTS IN WANGAN ROUTE OF HANSHIN
EXPRESSWAY ......................................................................................................................................... 25
2.3.1 MACRO ANALYSIS OF FATIGUE CRACKS AROUND RD JOINT ......................................................... 25
2.3.2 RD FATIGUE CRACK IN THE BOX GIRDER BRIDGES ...................................................................... 25
2.3.3 RD FATIGUE CRACK AND VOLUME OF EQUIVALENT LOAD AXLE OF 10 TON ................................ 26
2.3.4 RD FATIGUE CRACK AND TRANSVERSE POSITION OF TIRE ........................................................ 27
2.3.5 CONCLUSIONS ............................................................................................................................ 28
2.4 FATIGUE LIFE IMPROVEMENT METHOD ......................................................................... 29
2.4.1 BURR GRINDING ......................................................................................................................... 29
2.4.2 TIG DRESSING ............................................................................................................................ 29
2.4.3 HAMMER OR NEEDLE PEENING ................................................................................................... 29
2.5 REFIT METHODS FOR RIB-TO-DECK JOINTS................................................................... 29
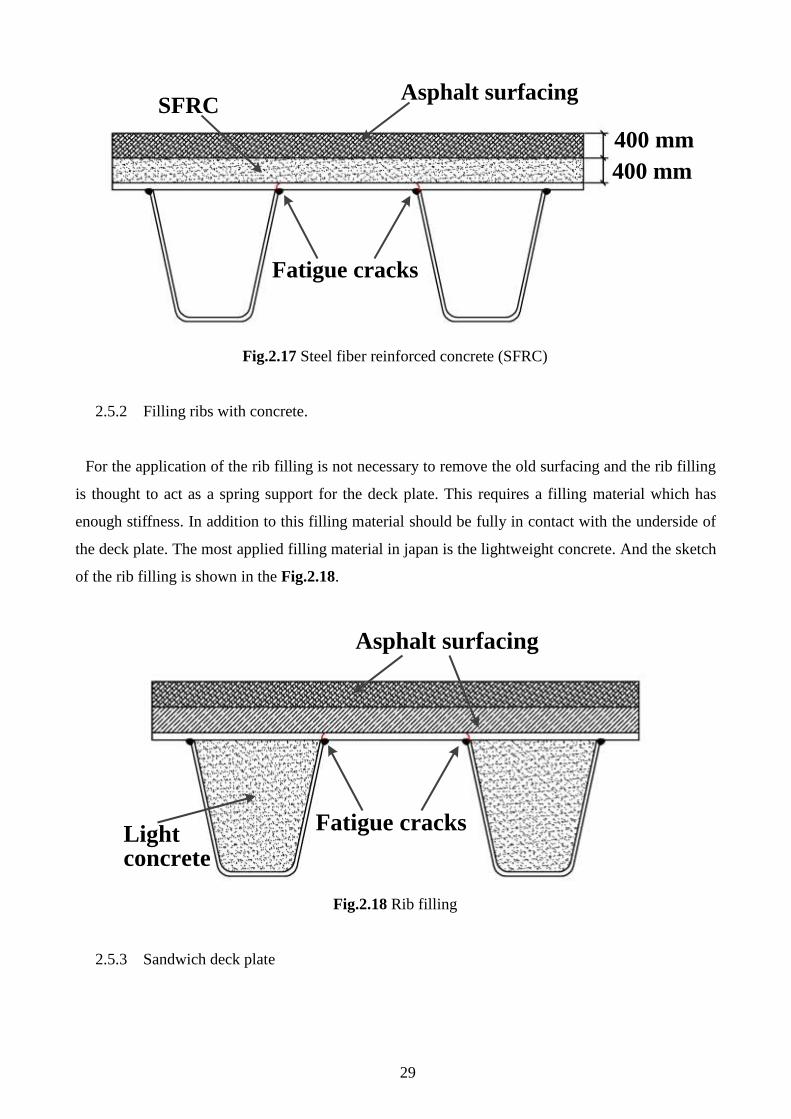
2.5.1 SFRC APPLIED ON THE DECK PLATE .......................................................................................... 29
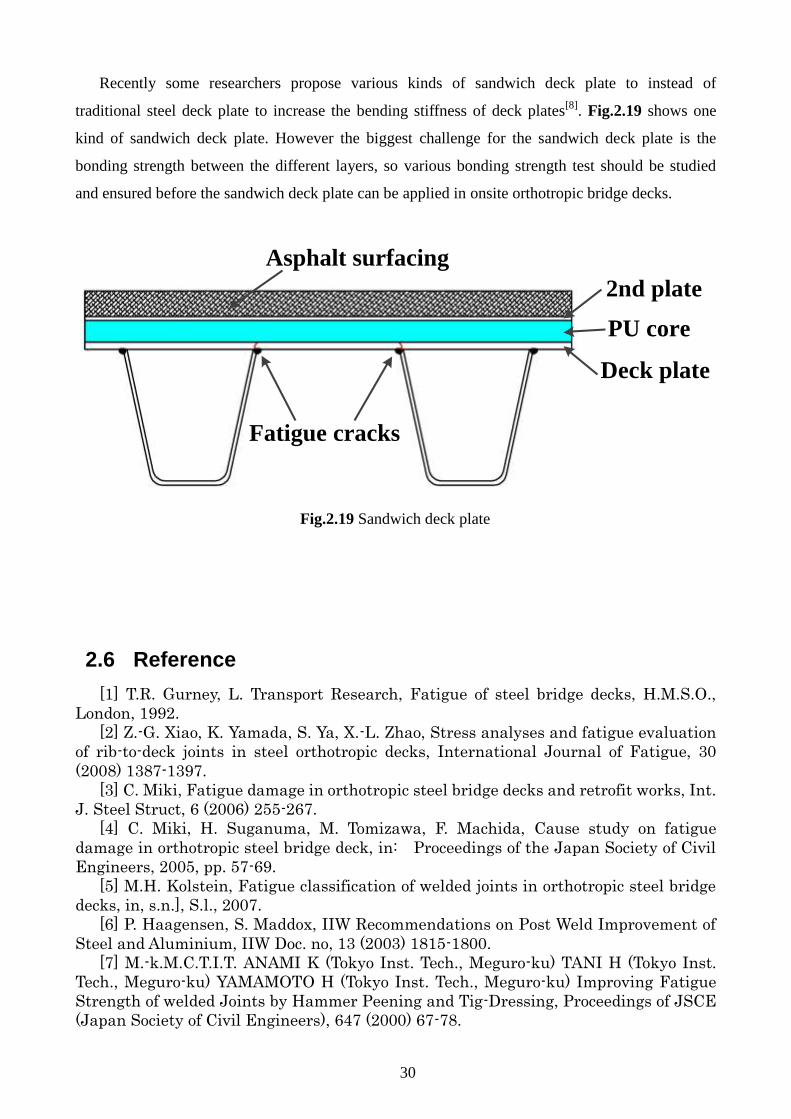
2.5.2 FILLING RIBS WITH CONCRETE. .................................................................................................. 30
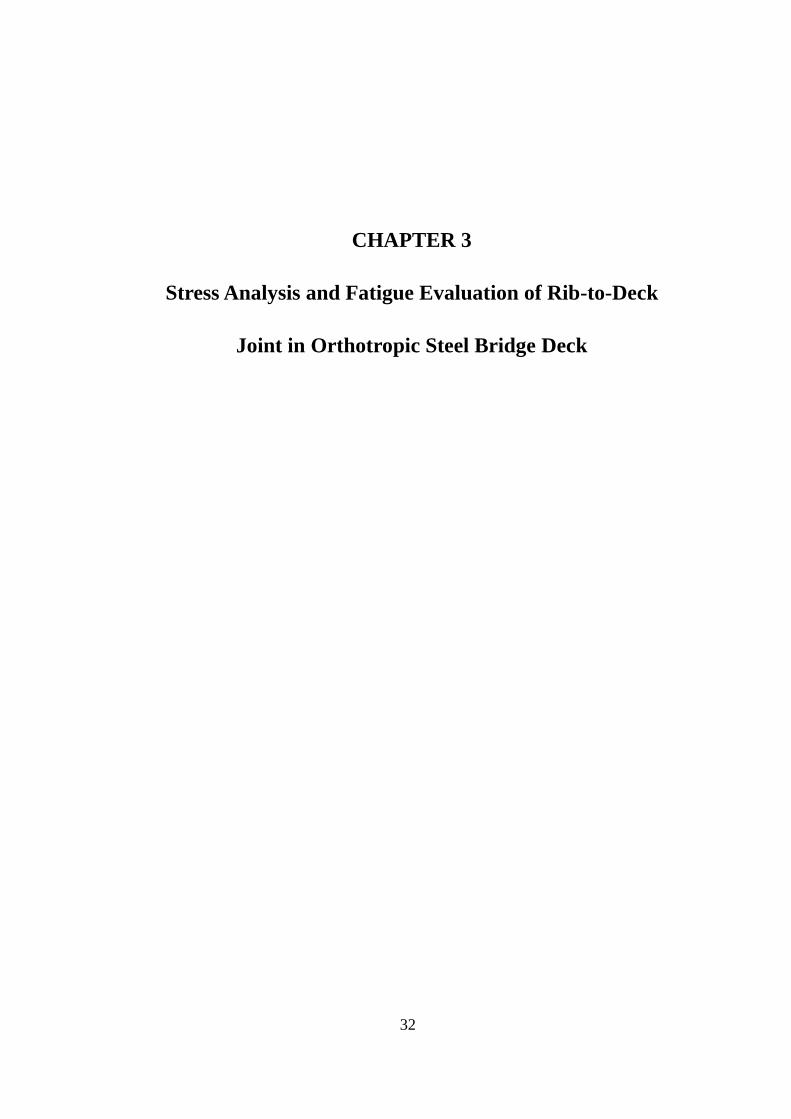
2.5.3 SANDWICH DECK PLATE .............................................................................................................. 31
2.6 REFERENCE .......................................................................................................................... 31
CHAPTER 3 STRESS ANALYSIS AND FATIGUE EVALUATION OF RIB-TO-DECK JOINT IN
ORTHOTROPIC STEEL BRIDGE DECK ............................................................................................... 32
3.1 INTRODUCTION .................................................................................................................... 34
3.2 FINITE ELEMENT MODEL AND STRESS ANALYSIS ........................................................ 35
3.2.1 FINITE ELEMENT (FE) MODEL (WITHOUT ASPHALT SURFACING) ................................................ 35
3.2.2 EFFECTS OF TRANSVERSE LOADING POSITION ............................................................................ 36
VI
3.3 STRESS RANGE OF RIB-TO-DECK JOINT PRODUCED BY A PASSAGE OF THE WHEEL
LOAD ................................................................................................................................................. 38
3.4 THE ASPHALT SURFACING INFLUENCE ON THE WHEEL LOAD DISPERSANT AND
COMPOSITED STIFFNESS .................................................................................................................... 41
3.5 FATIGUE LIFE EVALUATION BASED ON HOTSPOT METHOD AND EFFECTIVE STRESS.
................................................................................................................................................. 43
3.5.1 REFINED FE MODEL ................................................................................................................... 43
3.5.2 FATIGUE LIFE EVALUATION. ........................................................................................................ 44
3.5.3 EFFECTIVE NOTCH STRESS AROUND WELD ROOT OF RD JOINT. .................................................. 49
CHAPTER 4 FATIGUE TEST OF RIB-TO-DECK JOINT ................................................................. 52
4.1 INTRODUCTION AND OBJECTIVES ................................................................................... 53
4.2 PLATE BENDING FATIGUE TESTS ..................................................................................... 55
4.2.1 FATIGUE TEST SPECIMENS .......................................................................................................... 55
4.2.2 FATIGUE TEST MACHINE AND SETUP ........................................................................................... 56
4.2.3 FATIGUE TEST MACHINE AND SETUP ........................................................................................... 57
4.3 RESULT OF PLATE BENDING FATIGUE TESTS ................................................................ 58
4.3.1 FATIGUE CRACK INITIATION POINT AND PROPAGATION DIRECTIONS ........................................... 58
4.3.2 VARIATION IN STRESS RANGES AND FATIGUE CRACK SIZE. .......................................................... 58
4.3.3 RESIDUAL STRESSES EFFECT IN SPECIMENS .............................................................................. 60
4.4 FATIGUE TEST RESULTS IN S-N DIAGRAM ...................................................................... 62
4.4.1 DETERMINATION OF STRESS RANGE AND NUMBER OF CYCLES TO FRACTURE ............................. 62
4.4.2 FATIGUE TEST DATA .................................................................................................................... 63
4.4.3 REGRESSION ANALYSES AND DETERMINATION OF PROPOSED DESIGN S-N CURVES .................... 64
4.5 COMPARISON WITH PREVIOUS FATIGUE TESTES DATA ............................................... 67
VII
4.6 DISCUSSING AND CONCLUSION ........................................................................................ 74
4.7 REFERENCE .......................................................................................................................... 75
CHAPTER 5 EXPERIMENTAL STUDY OF FULL SIZE ORTHOTROPIC STEEL BRIDGE DECK
................................................................................................................................................. 76
5.1 INTRODUCTION .................................................................................................................... 77
5.1.1. ASPHALT SURFACING INFLUENCE ON RD JOINTS. ...................................................................... 77
5.1.3 PURPOSE OF THE FULL SIZE EXPERIMENT IN THIS STUDY. .......................................................... 80
5.2 SUMMARY OF FULL SIZE OSD EXPERIMENT .................................................................. 81
5.2.1 FULL SIZE OSD SPECIMEN ......................................................................................................... 81
5.2.2 STEEL DECK SURFACING ............................................................................................................. 82
5.2.3 STRAIN GAUGE ARRANGEMENT ................................................................................................... 83
5.2.4 APPLIED LOAD CASES ................................................................................................................. 88
5.2.5 EXPERIMENT RESULTS ............................................................................................................... 91
5.3 TEMPERATURE INFLUENCE ON THE STRESS DISTRIBUTION IN OSD. .................... 111
5.3.1 BACKGROUND OF TEMPERATURE INFLUENCE ON FATIGUE OF RD JOINT .................................. 111
5.3.2 ASPHALT HEATING AND COOLING SYSTEM ................................................................................. 112
5.3.3 TEMPERATURE VARIATION AND LOAD CASE ............................................................................... 115
5.3.4 THE INFLUENCE OF TEMPERATURE ON STRESS DISTRIBUTION OF DECK PLATE AND STRESS
AROUND RD JOINTS .................................................................................................................................... 116
5.3.5 VISCOELASTICITY RESPONSE OF ASPHALT SURFACING INFLUENCE ON STRESS AROUND RD JOINTS
................................................................................................................................................. 121
5.4 SUMMARY AND CONCLUSION ........................................................................................... 121
5.5 REFERENCE ......................................................................................................................... 122
CHAPTER 6 SUMMARIES AND CONCLUSIONS ........................................................................... 123

VIII
AUTHOR’S RESEARCH ACTIVITIES .............................................................................................. 127

1
CHAPTER 1
Fatigue Damage of Metal and
Welding Joints
2
1.1 Introduction
Fatigue damage of metal and weld joint is a well-known technical problem in wide fields such
as motor industry, aviation industry and civil engineering. The fatigue fracture in general occurred
suddenly somehow like brittle fracture without any warning. It is reported that metal fatigue
damage caused massive property damage or personal injuries and deaths. On July 19, 1989, the
Flight (registration N1819U) crash-landed in Sioux City, Iowa, USA after suffering catastrophic
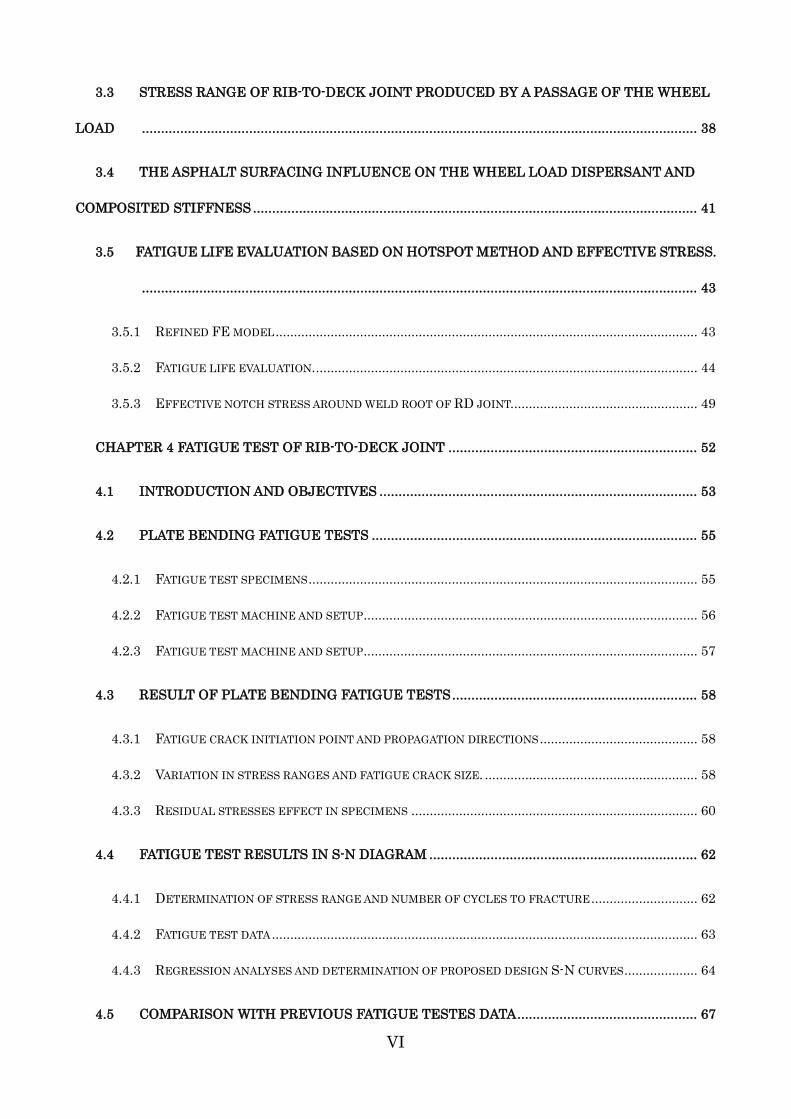
fatigue failure of its tail-mounted engine, which cost 111 lives. The photo of the fatigue damaged
engine is shown in Photo 1.1. The Silver Bridge as shown in Photo 1.2, located in West Virginia,
United States, collapsed in 1967, while it was full of rush-hour traffic, resulting in the 46 deaths and
2 disappearances. The fatigue failure of a single eyebar in a suspension chain caused the bridge
collapse.
Photo 1.1 The recovered fan disk(National
Transportation Safety Board USA)
Fig.1.1. Diagram of damaged hydraulic
systems(Wikipedia)
(a)
(b)
Photo 1.2 a). The Silver Bridge upon completion
(Federal Highway Administration USA)
b).The collapsed Silver Bridge
3
Several serious fatigue failures were reported already and the first laboratory investigations
were carried out in the 19th century. However in that time, the procedure of fatigue crack initiation
and propagation were not be discovered, fatigue damage was thought to be a mysterious
phenomenon in the material and unpredictable.
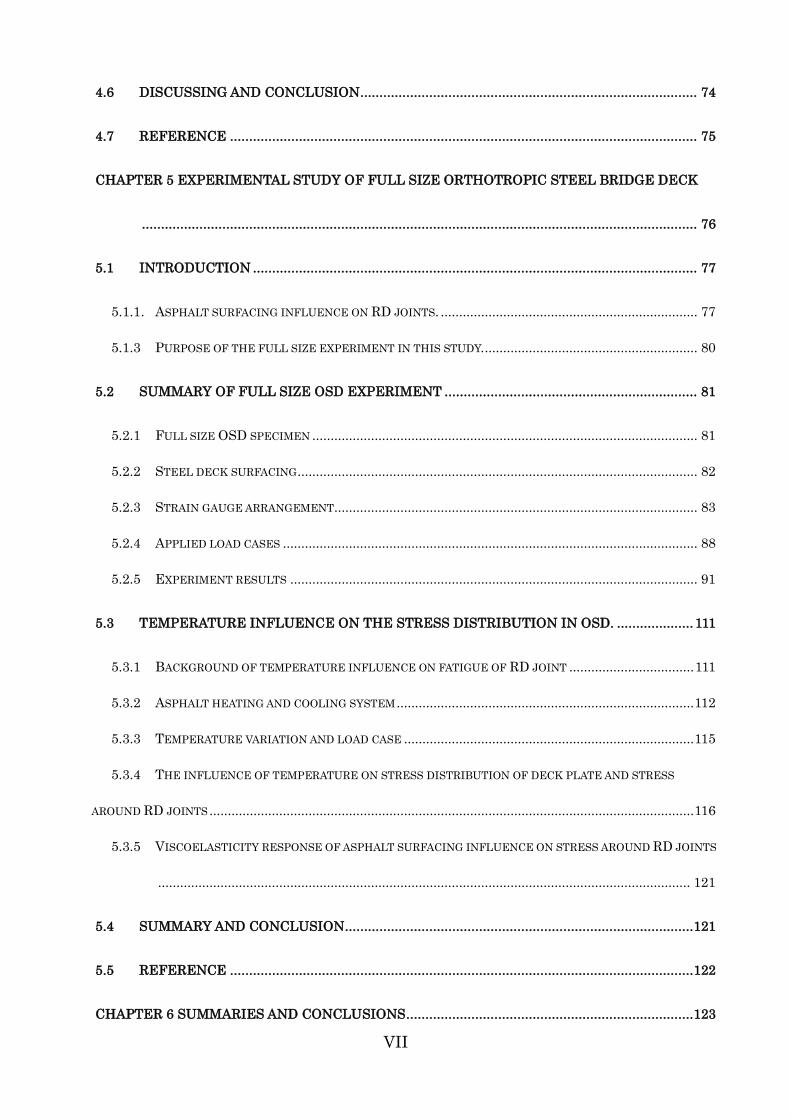
Nowadays it is well known that the fatigue damage of the material starts in the crystalline
structure and becomes visible in a later stage by plastic deformation, formation of micro-cracks on
slip bands, coalescence of micro cracks and finally propagation of a macro crack, followed by crack
growth, and ultimately to complete failure[1][2]
. The flowchart of this process is shown in Fig. 1.2
Fig. 1.2 Process of the fatigue damage
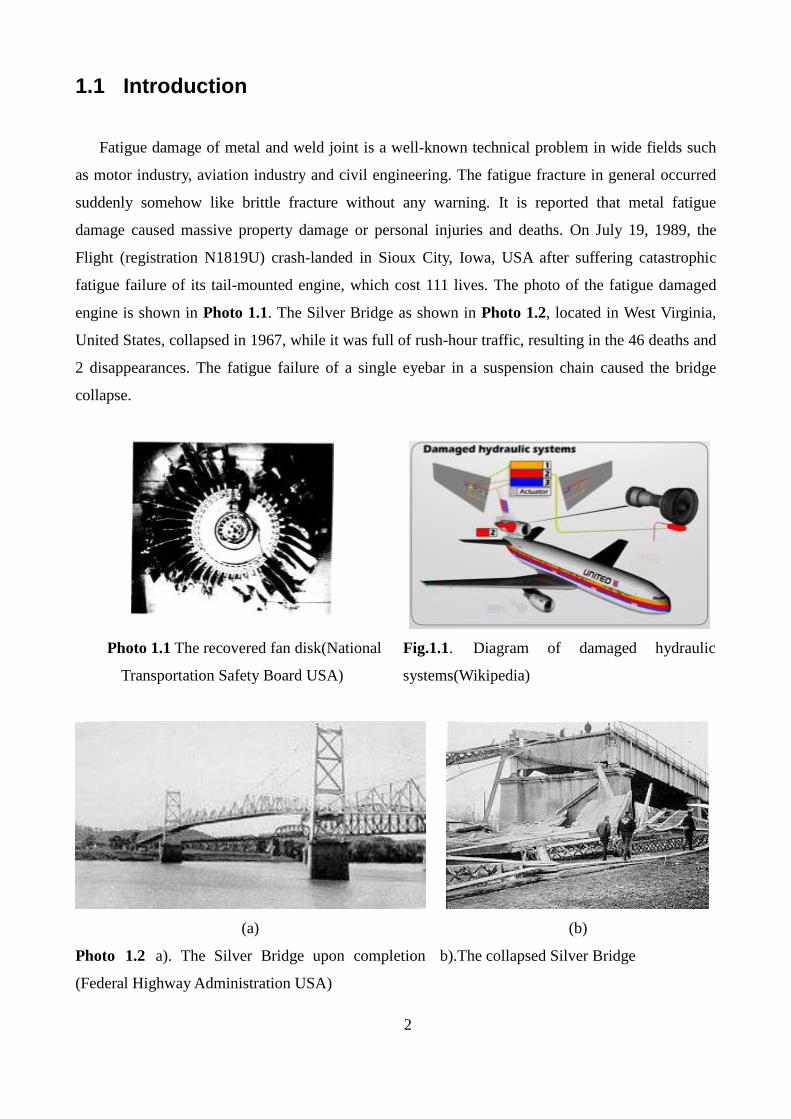
1.1.1 Fatigue crack initiation
Fatigue crack initiation is a consequence of cyclic slip. Fatigue occurs at stress amplitude below
the yield stress. Fig.1.3 shows the crack nucleation. And it should be noted that in the crack
initiation period, fatigue is a material surface phenomenon[2]
.
Fig. 1.3.Cycle slip leads to crack nucleation Photo 1.3 Development of cyclic slip bands and
a microcrack in a pure copper specimen(T.
Lassen)
Extrusion
Intrusion
Surface
Slip Plane
4
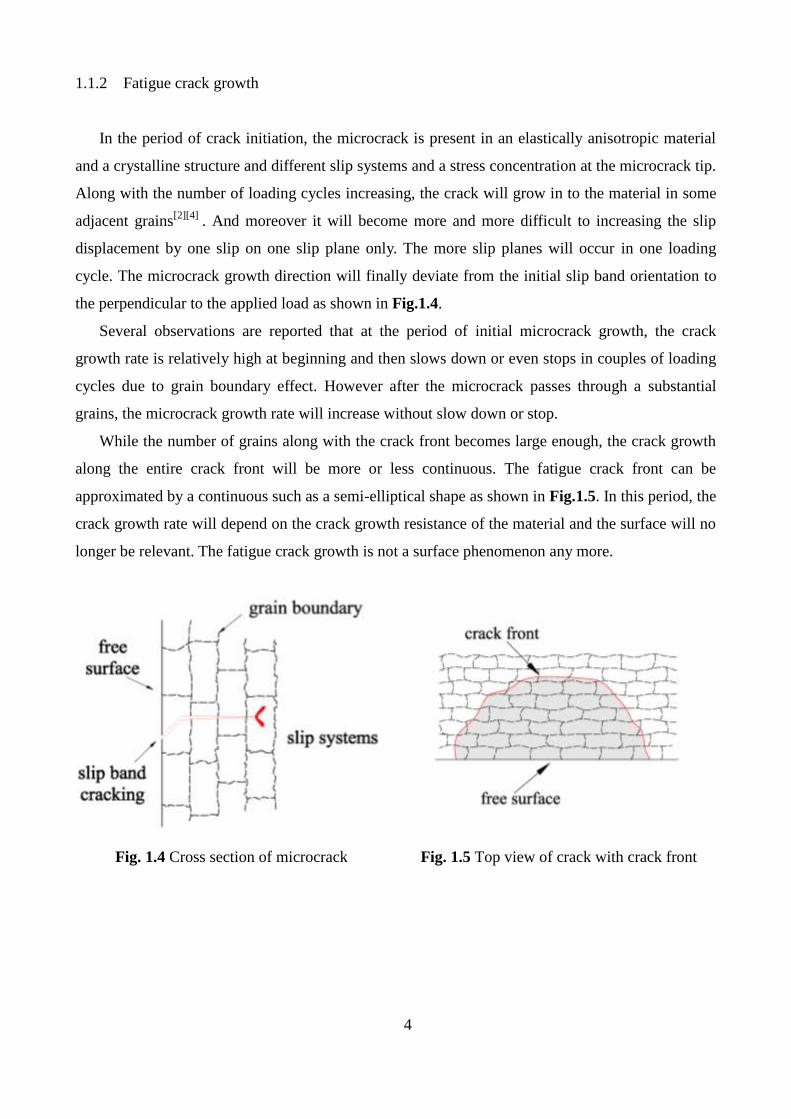
1.1.2 Fatigue crack growth
In the period of crack initiation, the microcrack is present in an elastically anisotropic material
and a crystalline structure and different slip systems and a stress concentration at the microcrack tip.
Along with the number of loading cycles increasing, the crack will grow in to the material in some
adjacent grains[2][4]
. And moreover it will become more and more difficult to increasing the slip
displacement by one slip on one slip plane only. The more slip planes will occur in one loading
cycle. The microcrack growth direction will finally deviate from the initial slip band orientation to
the perpendicular to the applied load as shown in Fig.1.4.
Several observations are reported that at the period of initial microcrack growth, the crack
growth rate is relatively high at beginning and then slows down or even stops in couples of loading
cycles due to grain boundary effect. However after the microcrack passes through a substantial
grains, the microcrack growth rate will increase without slow down or stop.
While the number of grains along with the crack front becomes large enough, the crack growth
along the entire crack front will be more or less continuous. The fatigue crack front can be
approximated by a continuous such as a semi-elliptical shape as shown in Fig.1.5. In this period, the
crack growth rate will depend on the crack growth resistance of the material and the surface will no
longer be relevant. The fatigue crack growth is not a surface phenomenon any more.
Fig. 1.4 Cross section of microcrack Fig. 1.5 Top view of crack with crack front
5
1.1.3 Microscopic characteristics of fatigue fracture surfaces
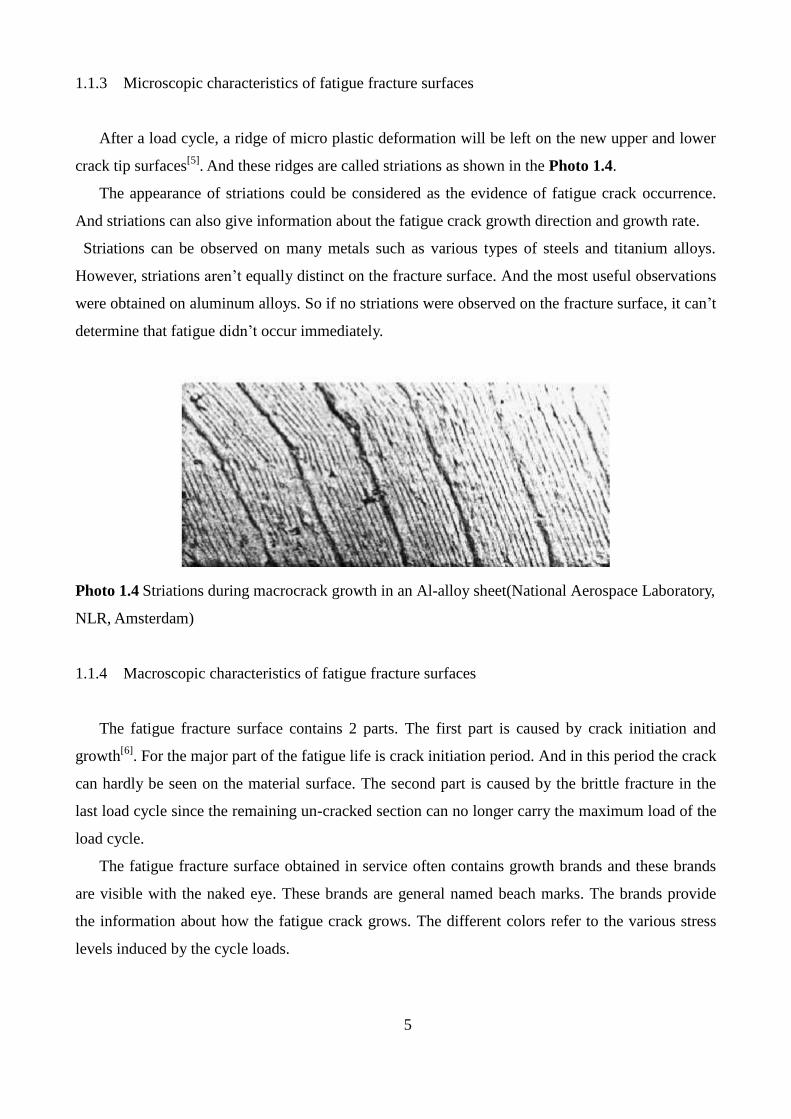
After a load cycle, a ridge of micro plastic deformation will be left on the new upper and lower
crack tip surfaces[5]
. And these ridges are called striations as shown in the Photo 1.4.
The appearance of striations could be considered as the evidence of fatigue crack occurrence.
And striations can also give information about the fatigue crack growth direction and growth rate.
Striations can be observed on many metals such as various types of steels and titanium alloys.
However, striations aren’t equally distinct on the fracture surface. And the most useful observations
were obtained on aluminum alloys. So if no striations were observed on the fracture surface, it can’t
determine that fatigue didn’t occur immediately.
Photo 1.4 Striations during macrocrack growth in an Al-alloy sheet(National Aerospace Laboratory,
NLR, Amsterdam)
1.1.4 Macroscopic characteristics of fatigue fracture surfaces
The fatigue fracture surface contains 2 parts. The first part is caused by crack initiation and
growth[6]
. For the major part of the fatigue life is crack initiation period. And in this period the crack
can hardly be seen on the material surface. The second part is caused by the brittle fracture in the
last load cycle since the remaining un-cracked section can no longer carry the maximum load of the
load cycle.
The fatigue fracture surface obtained in service often contains growth brands and these brands
are visible with the naked eye. These brands are general named beach marks. The brands provide
the information about how the fatigue crack grows. The different colors refer to the various stress
levels induced by the cycle loads.
6
1.2 Fatigue damage of welded joints
Fatigue of welds is even more complicated. Local stress concentrates at notches i.e. weld toe
and root. The residual stresses caused by the process of heating and subsequent cooling with
additional filler material in weld procedure should also cause impact on fatigue fracture.
Furthermore, a weld itself may contain inclusions, pores, cavities, undercuts etc. The weld toe and
non-welded root gaps produces high stress concentrations. All these factors could affect the fatigue
behavior. As a consequence, fatigue failures occur in welded structures such as orthotropic steel
decks mostly at the weld toe or weld root rather than the base metal.
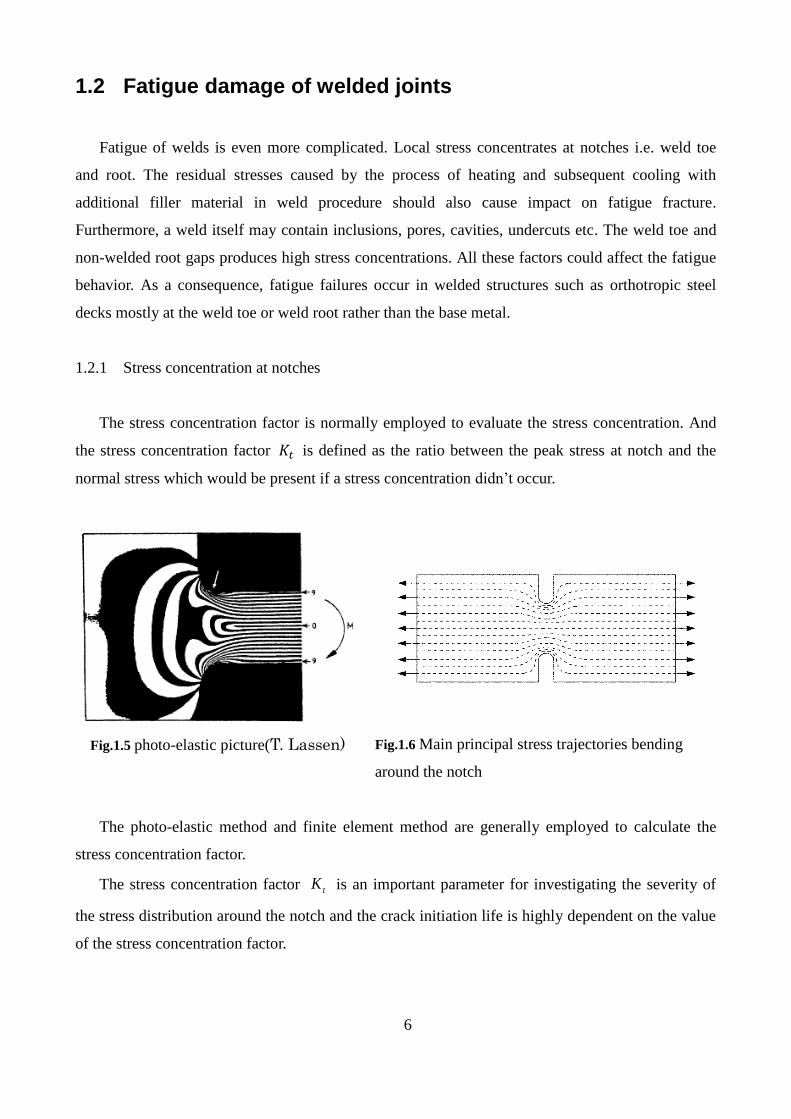
1.2.1 Stress concentration at notches
The stress concentration factor is normally employed to evaluate the stress concentration. And
the stress concentration factor 𝐾𝑡 is defined as the ratio between the peak stress at notch and the
normal stress which would be present if a stress concentration didn’t occur.
Fig.1.5 photo-elastic picture(T. Lassen) Fig.1.6 Main principal stress trajectories bending
around the notch
The photo-elastic method and finite element method are generally employed to calculate the
stress concentration factor.
The stress concentration factor tK is an important parameter for investigating the severity of
the stress distribution around the notch and the crack initiation life is highly dependent on the value
of the stress concentration factor.
7
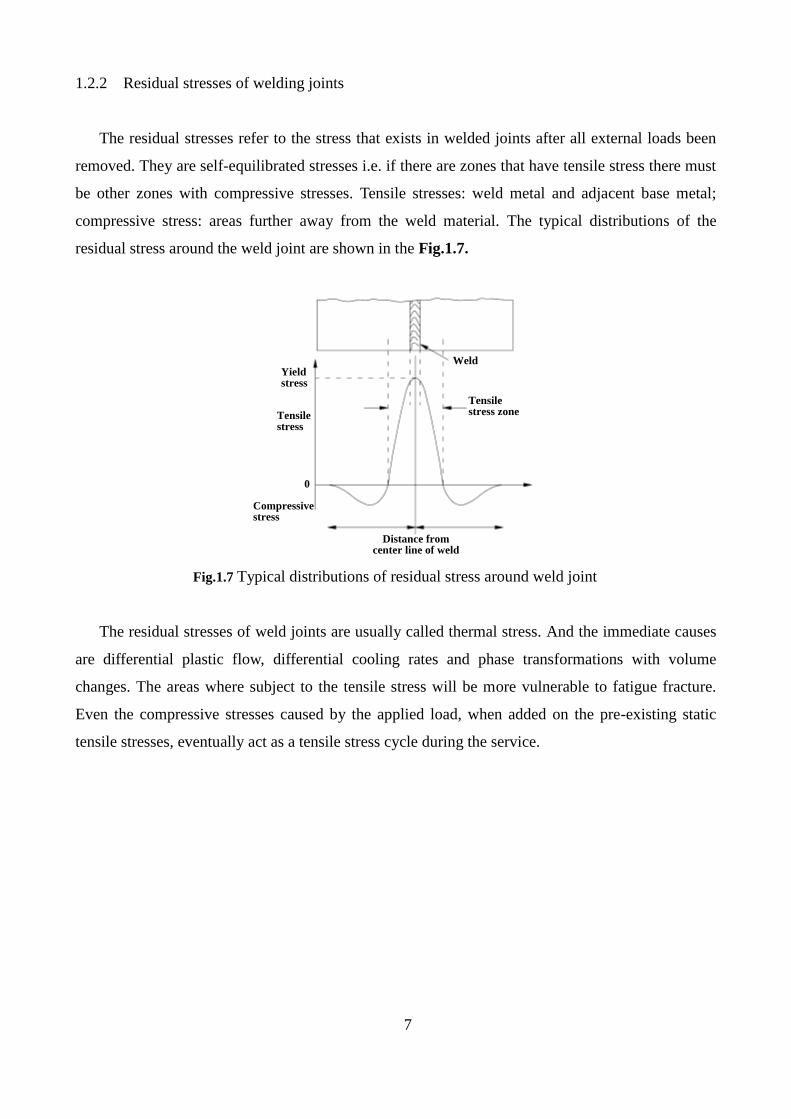
1.2.2 Residual stresses of welding joints
The residual stresses refer to the stress that exists in welded joints after all external loads been
removed. They are self-equilibrated stresses i.e. if there are zones that have tensile stress there must
be other zones with compressive stresses. Tensile stresses: weld metal and adjacent base metal;
compressive stress: areas further away from the weld material. The typical distributions of the
residual stress around the weld joint are shown in the Fig.1.7.
Fig.1.7 Typical distributions of residual stress around weld joint
The residual stresses of weld joints are usually called thermal stress. And the immediate causes
are differential plastic flow, differential cooling rates and phase transformations with volume
changes. The areas where subject to the tensile stress will be more vulnerable to fatigue fracture.
Even the compressive stresses caused by the applied load, when added on the pre-existing static
tensile stresses, eventually act as a tensile stress cycle during the service.
Weld
Tensile stress zone
Yield stress
Tensile stress
Compressive stress
0
Distance from center line of weld
8
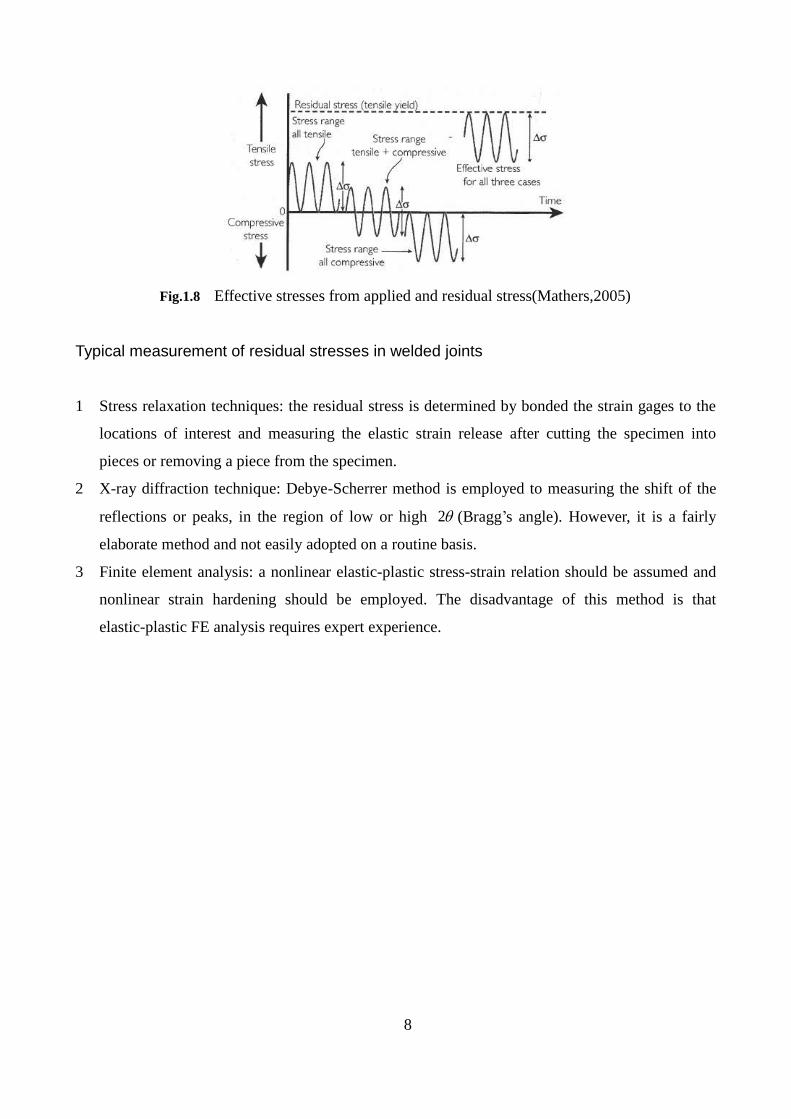
Fig.1.8 Effective stresses from applied and residual stress(Mathers,2005)
Typical measurement of residual stresses in welded joints
1 Stress relaxation techniques: the residual stress is determined by bonded the strain gages to the
locations of interest and measuring the elastic strain release after cutting the specimen into
pieces or removing a piece from the specimen.
2 X-ray diffraction technique: Debye-Scherrer method is employed to measuring the shift of the
reflections or peaks, in the region of low or high 2 (Bragg’s angle). However, it is a fairly
elaborate method and not easily adopted on a routine basis.
3 Finite element analysis: a nonlinear elastic-plastic stress-strain relation should be assumed and
nonlinear strain hardening should be employed. The disadvantage of this method is that
elastic-plastic FE analysis requires expert experience.
9
1.3 Fatigue life evaluation methods.
Different approaches exist for the fatigue life evaluation of weld joints, which can be
distinguished by the parameters used for the description of fatigue life N. Fig.2 shows the different
parameters together with characteristic diagrams.
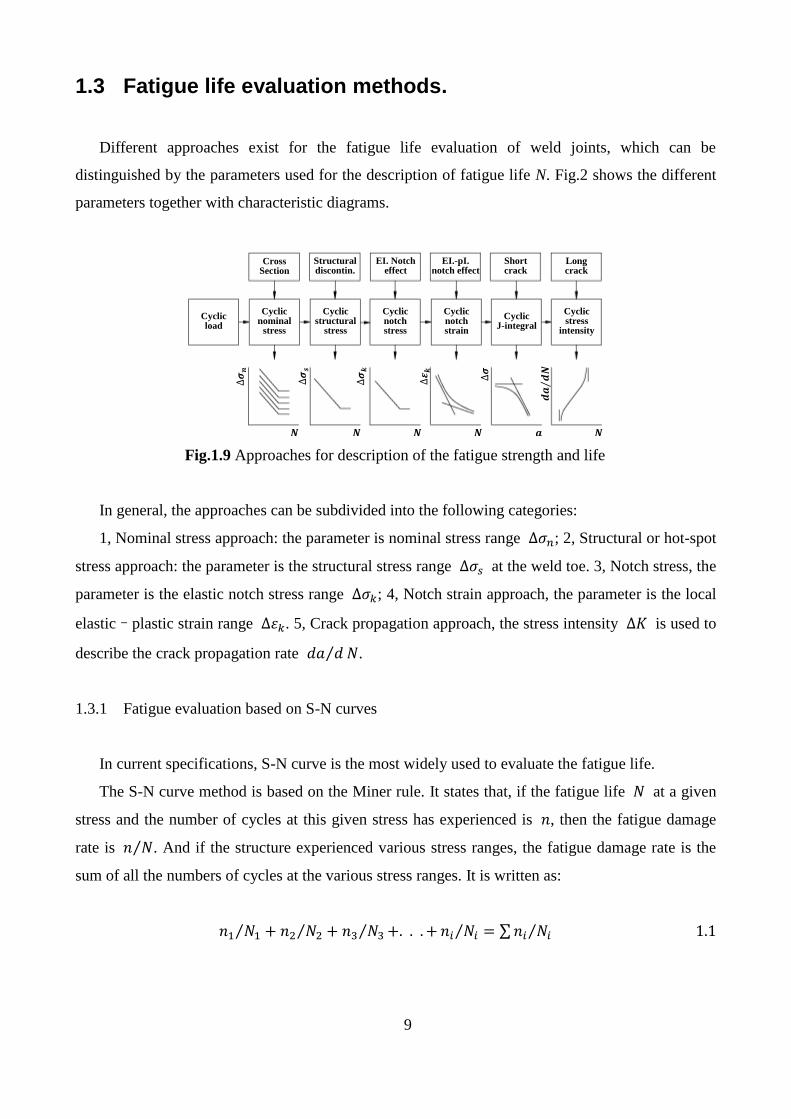
Fig.1.9 Approaches for description of the fatigue strength and life
In general, the approaches can be subdivided into the following categories:
1, Nominal stress approach: the parameter is nominal stress range ∆𝜎𝑛; 2, Structural or hot-spot
stress approach: the parameter is the structural stress range ∆𝜎𝑠 at the weld toe. 3, Notch stress, the
parameter is the elastic notch stress range ∆𝜎𝑘; 4, Notch strain approach, the parameter is the local
elastic–plastic strain range ∆𝜀𝑘. 5, Crack propagation approach, the stress intensity ∆𝐾 is used to
describe the crack propagation rate 𝑑𝑎 𝑑⁄ 𝑁.
1.3.1 Fatigue evaluation based on S-N curves
In current specifications, S-N curve is the most widely used to evaluate the fatigue life.
The S-N curve method is based on the Miner rule. It states that, if the fatigue life 𝑁 at a given
stress and the number of cycles at this given stress has experienced is 𝑛, then the fatigue damage
rate is 𝑛 𝑁⁄ . And if the structure experienced various stress ranges, the fatigue damage rate is the
sum of all the numbers of cycles at the various stress ranges. It is written as:
𝑛1 𝑁1⁄ + 𝑛2 𝑁2⁄ + 𝑛3 𝑁3⁄ +. . . + 𝑛𝑖 𝑁𝑖⁄ = ∑ 𝑛𝑖 𝑁𝑖⁄ 1.1
CrossSection
Structural discontin.
EI. Notch effect
EI.-pI.notch effect
Shortcrack
Longcrack
Cyclicload
Cyclic nominal
stress
Cyclic structural
stress
Cyclic notchstress
Cyclic notchstrain
CyclicJ-integral
Cyclic stress
intensity
𝑵
∆𝝈
𝒏
𝑵
∆𝝈
𝒔
𝑵
∆𝝈
𝒌
𝑵 ∆
𝜺𝒌
𝒂
∆𝝈
𝑵
𝒅𝒂
𝒅𝑵
⁄
10
The fatigue life is used up when the damage rate equals to 1. Although the Miner rule can’t give
a precise fatigue life of a structure, it was regarded as safe and generally adopted by various
specifications.
The S-N curve model is a kind of curve-fitting between applied stress range and experimental
lifetime data. The life, given as the number of cycles to failure, is plotted as a function of the
applied stress range. Details that have nearly the same geometry, welding quality, residual stresses
and loading mode define one experimental population. This experimental population forms the
basis for a detail-category (class) in codes. It is necessary to verify the fatigue life for each critical
welded detail in structures.
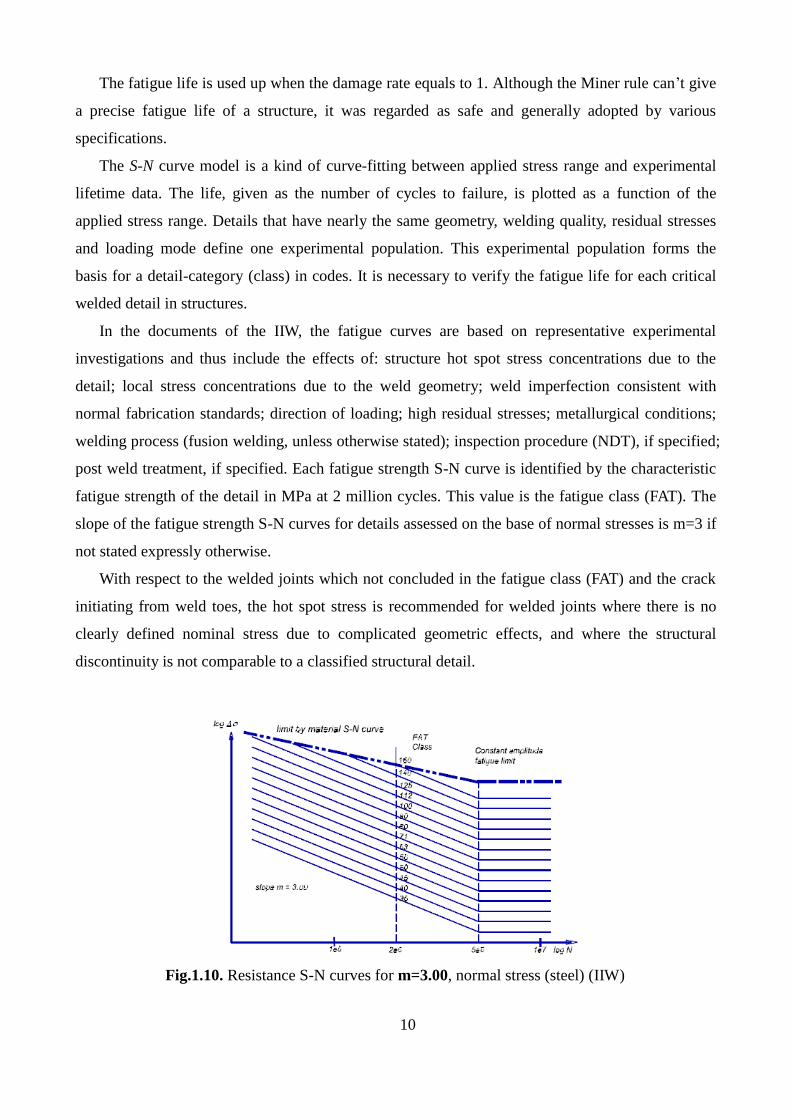
In the documents of the IIW, the fatigue curves are based on representative experimental
investigations and thus include the effects of: structure hot spot stress concentrations due to the
detail; local stress concentrations due to the weld geometry; weld imperfection consistent with
normal fabrication standards; direction of loading; high residual stresses; metallurgical conditions;
welding process (fusion welding, unless otherwise stated); inspection procedure (NDT), if specified;
post weld treatment, if specified. Each fatigue strength S-N curve is identified by the characteristic
fatigue strength of the detail in MPa at 2 million cycles. This value is the fatigue class (FAT). The
slope of the fatigue strength S-N curves for details assessed on the base of normal stresses is m=3 if
not stated expressly otherwise.
With respect to the welded joints which not concluded in the fatigue class (FAT) and the crack
initiating from weld toes, the hot spot stress is recommended for welded joints where there is no
clearly defined nominal stress due to complicated geometric effects, and where the structural
discontinuity is not comparable to a classified structural detail.
Fig.1.10. Resistance S-N curves for m=3.00, normal stress (steel) (IIW)
11
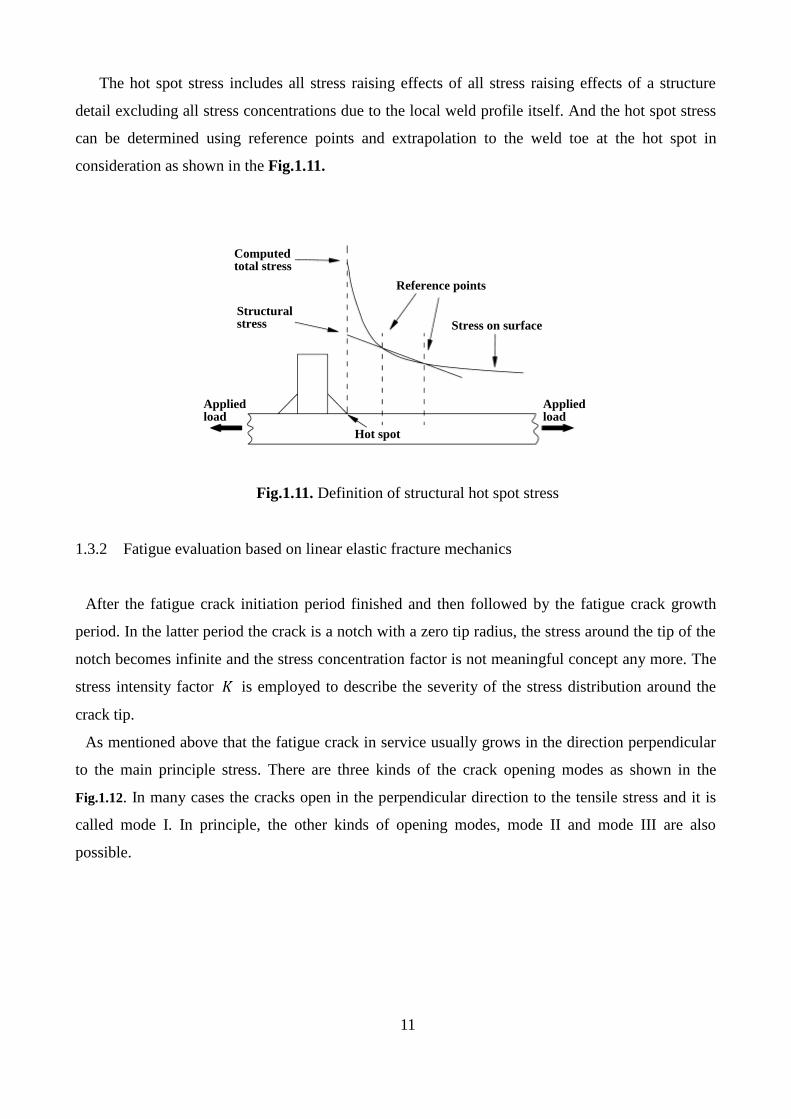
The hot spot stress includes all stress raising effects of all stress raising effects of a structure
detail excluding all stress concentrations due to the local weld profile itself. And the hot spot stress
can be determined using reference points and extrapolation to the weld toe at the hot spot in
consideration as shown in the Fig.1.11.
Fig.1.11. Definition of structural hot spot stress
1.3.2 Fatigue evaluation based on linear elastic fracture mechanics
After the fatigue crack initiation period finished and then followed by the fatigue crack growth
period. In the latter period the crack is a notch with a zero tip radius, the stress around the tip of the
notch becomes infinite and the stress concentration factor is not meaningful concept any more. The
stress intensity factor 𝐾 is employed to describe the severity of the stress distribution around the
crack tip.
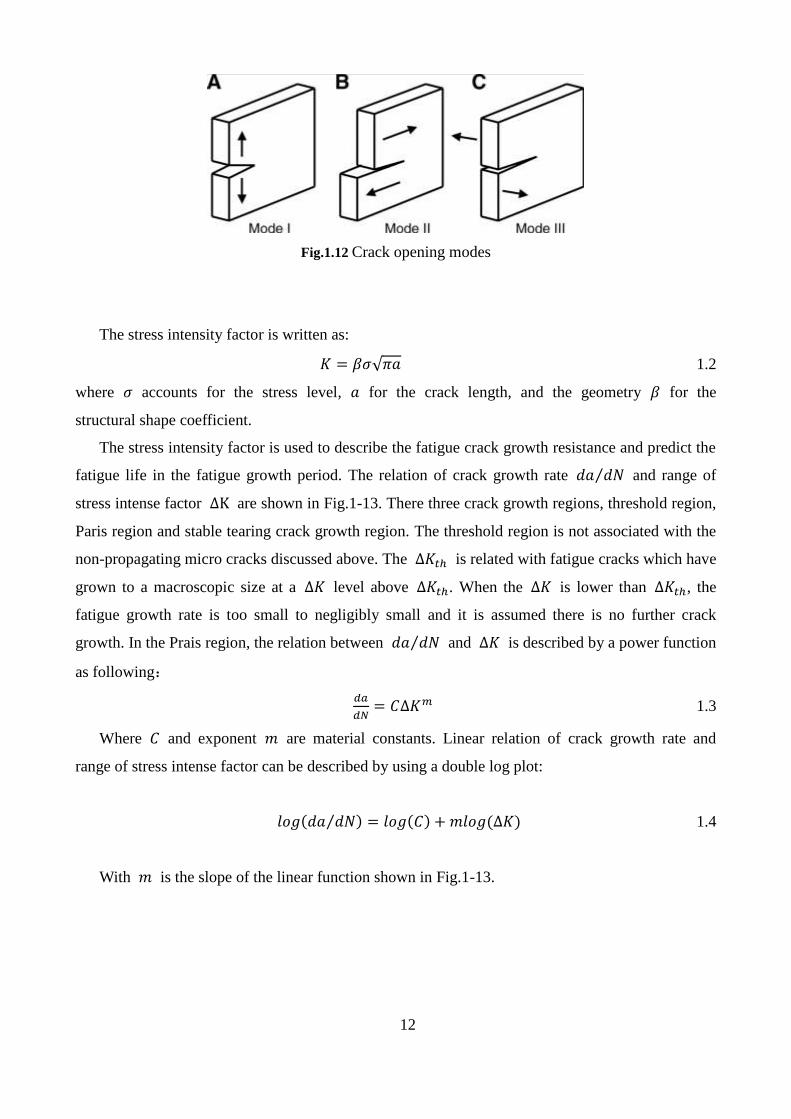
As mentioned above that the fatigue crack in service usually grows in the direction perpendicular
to the main principle stress. There are three kinds of the crack opening modes as shown in the
Fig.1.12. In many cases the cracks open in the perpendicular direction to the tensile stress and it is
called mode I. In principle, the other kinds of opening modes, mode II and mode III are also
possible.
Computed total stress
Structural stress
Reference points
Stress on surface
Hot spot
Applied load
Applied load
12
Fig.1.12 Crack opening modes
The stress intensity factor is written as:
𝐾 = 𝛽𝜎√𝜋𝑎 1.2
where 𝜎 accounts for the stress level, 𝑎 for the crack length, and the geometry 𝛽 for the
structural shape coefficient.
The stress intensity factor is used to describe the fatigue crack growth resistance and predict the
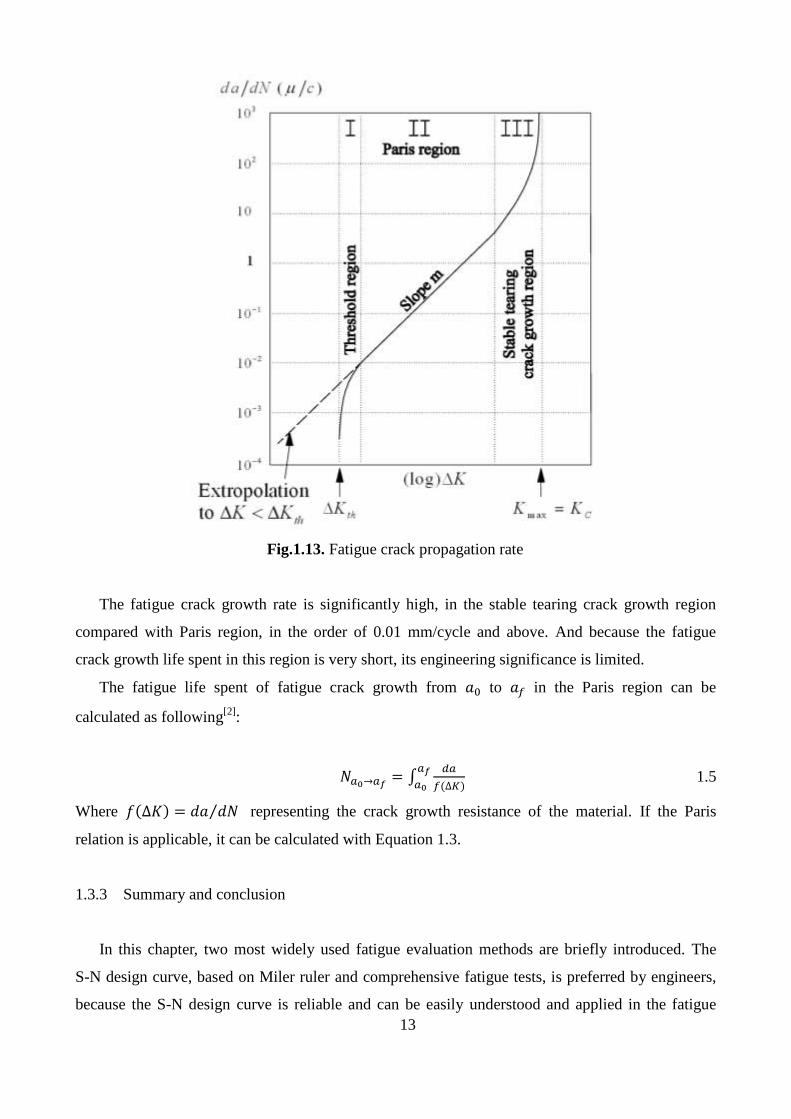
fatigue life in the fatigue growth period. The relation of crack growth rate 𝑑𝑎 𝑑𝑁⁄ and range of
stress intense factor ∆K are shown in Fig.1-13. There three crack growth regions, threshold region,
Paris region and stable tearing crack growth region. The threshold region is not associated with the
non-propagating micro cracks discussed above. The ∆𝐾𝑡ℎ is related with fatigue cracks which have
grown to a macroscopic size at a ∆𝐾 level above ∆𝐾𝑡ℎ. When the ∆𝐾 is lower than ∆𝐾𝑡ℎ, the
fatigue growth rate is too small to negligibly small and it is assumed there is no further crack
growth. In the Prais region, the relation between 𝑑𝑎 𝑑𝑁⁄ and ∆𝐾 is described by a power function
as following:
𝑑𝑎
𝑑𝑁= 𝐶∆𝐾𝑚 1.3
Where 𝐶 and exponent 𝑚 are material constants. Linear relation of crack growth rate and
range of stress intense factor can be described by using a double log plot:
𝑙𝑜𝑔(𝑑𝑎 𝑑𝑁⁄ ) = 𝑙𝑜𝑔(𝐶) + 𝑚𝑙𝑜𝑔(∆𝐾) 1.4
With 𝑚 is the slope of the linear function shown in Fig.1-13.
13
Fig.1.13. Fatigue crack propagation rate
The fatigue crack growth rate is significantly high, in the stable tearing crack growth region
compared with Paris region, in the order of 0.01 mm/cycle and above. And because the fatigue
crack growth life spent in this region is very short, its engineering significance is limited.
The fatigue life spent of fatigue crack growth from 𝑎0 to 𝑎𝑓 in the Paris region can be
calculated as following[2]
:
𝑁𝑎0→𝑎𝑓= ∫
𝑑𝑎
𝑓(∆𝐾)
𝑎𝑓
𝑎0 1.5
Where 𝑓(∆𝐾) = 𝑑𝑎 𝑑𝑁⁄ representing the crack growth resistance of the material. If the Paris
relation is applicable, it can be calculated with Equation 1.3.
1.3.3 Summary and conclusion
In this chapter, two most widely used fatigue evaluation methods are briefly introduced. The
S-N design curve, based on Miler ruler and comprehensive fatigue tests, is preferred by engineers,
because the S-N design curve is reliable and can be easily understood and applied in the fatigue
14
design for welding structure. However, the S-N design curves don’t cover all kinds of weld joints.
For the fatigue life evaluation of weld joints fractured due to the fatigue crack initiate from weld toe,
the hot spot stress and S-N design curve of corresponding cross cruciform weld joint. But there is
no S-N curve available for the uncovered kinds of weld joint fractured due to fatigue cracks
initiating from weld root.
Compared with S-N design curves, the linear elastic fracture mechanics (LEFM) is preferred by
some scholars due to this method is more academic and logical than the former. However the LEFM
can only predict the fatigue life spent in the Paris region rather than the whole fatigue life of weld
structures. And as mentioned above the initiation period is the major period of the whole fatigue life,
so the LEFM is always employed to calculate the fatigue life spent from the fatigue crack length
growth from 𝑎0 to 𝑎𝑓 in the Paris region.
1.4 Objective and Scope
The research purpose of this study are: 1 Investigate the influence factors of fatigue life of RD
joint and its strengthening methods.(chapter 2); 2 Study on the stress around the RD joint under
various loading cases to determine the most critical vehicle riding paths and corresponding fatigue
life of the RD joint. (chapter 3); 3 Fatigue test for full size specimen of rib-to-deck joint to study the
fatigue strength of RD joint with various weld details. (chapter 4); 5 Full scale OSD experiment to
investigate the stress distribution with considering asphalt surfacing and temperature effect. (chapter
5)
In the chapter one, the mechanics of fatigue fracture of metal and welding joint and most used
fatigue evaluation methods are briefly introduced. Chapter 2 is about the historic development of
orthotropic steel bridge decks, macro analysis of fatigue cracks around RD joints and its
strengthening methods. The macro analysis shows that the fatigue cracks have a high correlation
with transverse location of wheel loads and volume of heavy truck axle loads. So various shell finite
model and refined finite model were made to investigate the stress distribution around the rib to
deck joint and its fatigue life under various load cases with considering asphalt surfacing. In chapter
4, series specimens of full size rib-to-deck joint with different weld details were employed in
fatigue tests to investigate the fatigue strength and fatigue crack type under the critical load case
induced in Chapters Moreover it is found that temperature has significant influence on the stress
concentration around rib-to-deck joint, in chapter 5 a full scale orthotropic steel bridge deck and
special heating and cooling system to analyze the effect of temperature variation on the stress
15
concentration and the most sensitive temperature range. This study is summarized and concluded in
the chapter 6.
1.5 Reference
[1] T. Lassen, N. Recho, Fatigue life analyses of welded structures, Iste London,
2006.
[2] D. Radaj, Design and analysis of fatigue resistant welded structures, Elsevier,
1990.
[3] J. Schijve, J. Schijve, Fatigue of structures and materials, Springer, 2001.
[4] J. Schijve, Fatigue of structures and materials in the 20th century and the state
of the art, International Journal of Fatigue, 25 (2003) 679-702.
[5] A. Fatemi, L. Yang, Cumulative fatigue damage and life prediction theories: a
survey of the state of the art for homogeneous materials, International Journal of
Fatigue, 20 (1998) 9-34.
[6] C. Kung, M. Fine, Fatigue crack initiation and microcrack growth in 2024-T4
and 2124-T4 aluminum alloys, Metallurgical Transactions A, 10 (1979) 603-610.
[7] K.J. Miller, The three thresholds for fatigue crack propagation, ASTM special
technical publication, 1296 (1997) 267-286.
[8] R.I. Stephens, A. Fatemi, R.R. Stephens, H.O. Fuchs, Metal fatigue in
engineering, John Wiley & Sons, 2000.
[9] A. Carpinteri, Handbook of fatigue crack propagation in metallic structures,
Newnes, 1994.
[10] R. Ritchie, J. Lankford, Small fatigue cracks: a statement of the problem and
potential solutions, Materials Science and Engineering, 84 (1986) 11-16.

16
CHAPTER 2
Fatigue Damage in Orthotropic
Steel Bridge Decks and its Strengthening Methods
17
2.1 Historical development of the orthotropic bridge deck
2.1.1 Origin of orthotropic steel bridge decks
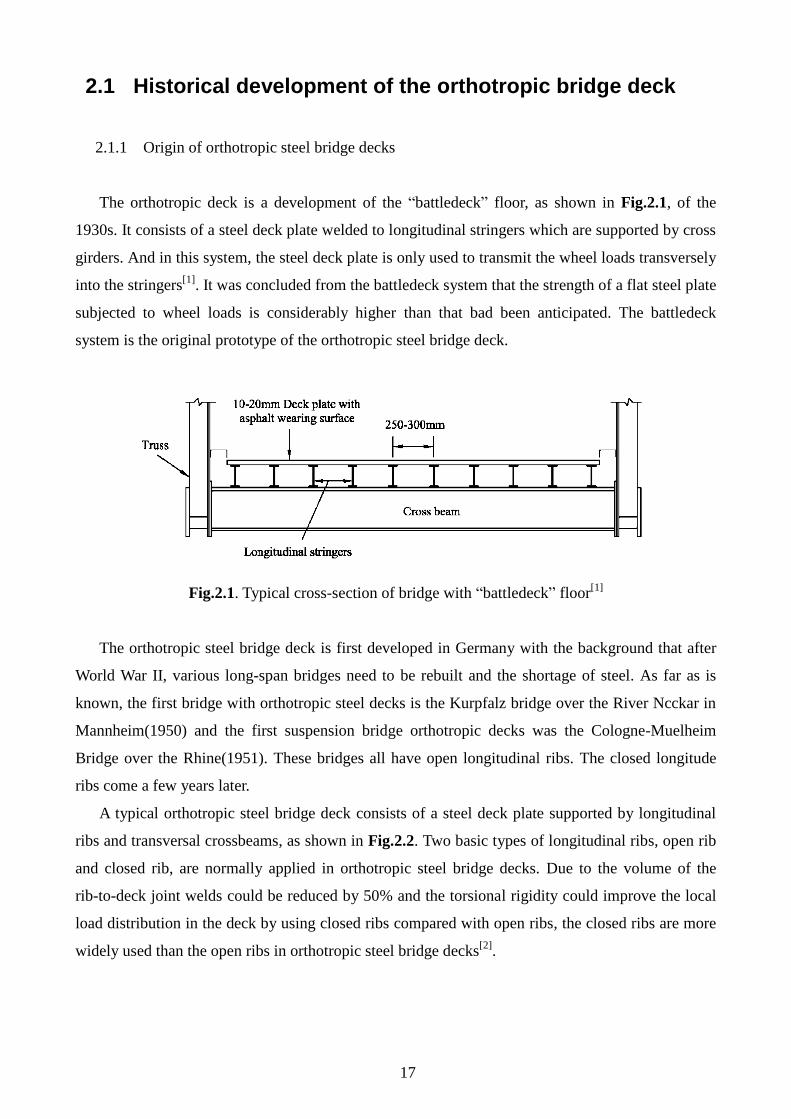
The orthotropic deck is a development of the “battledeck” floor, as shown in Fig.2.1, of the
1930s. It consists of a steel deck plate welded to longitudinal stringers which are supported by cross
girders. And in this system, the steel deck plate is only used to transmit the wheel loads transversely
into the stringers[1]
. It was concluded from the battledeck system that the strength of a flat steel plate
subjected to wheel loads is considerably higher than that bad been anticipated. The battledeck
system is the original prototype of the orthotropic steel bridge deck.
Fig.2.1. Typical cross-section of bridge with “battledeck” floor[1]
The orthotropic steel bridge deck is first developed in Germany with the background that after
World War II, various long-span bridges need to be rebuilt and the shortage of steel. As far as is
known, the first bridge with orthotropic steel decks is the Kurpfalz bridge over the River Ncckar in
Mannheim(1950) and the first suspension bridge orthotropic decks was the Cologne-Muelheim
Bridge over the Rhine(1951). These bridges all have open longitudinal ribs. The closed longitude
ribs come a few years later.
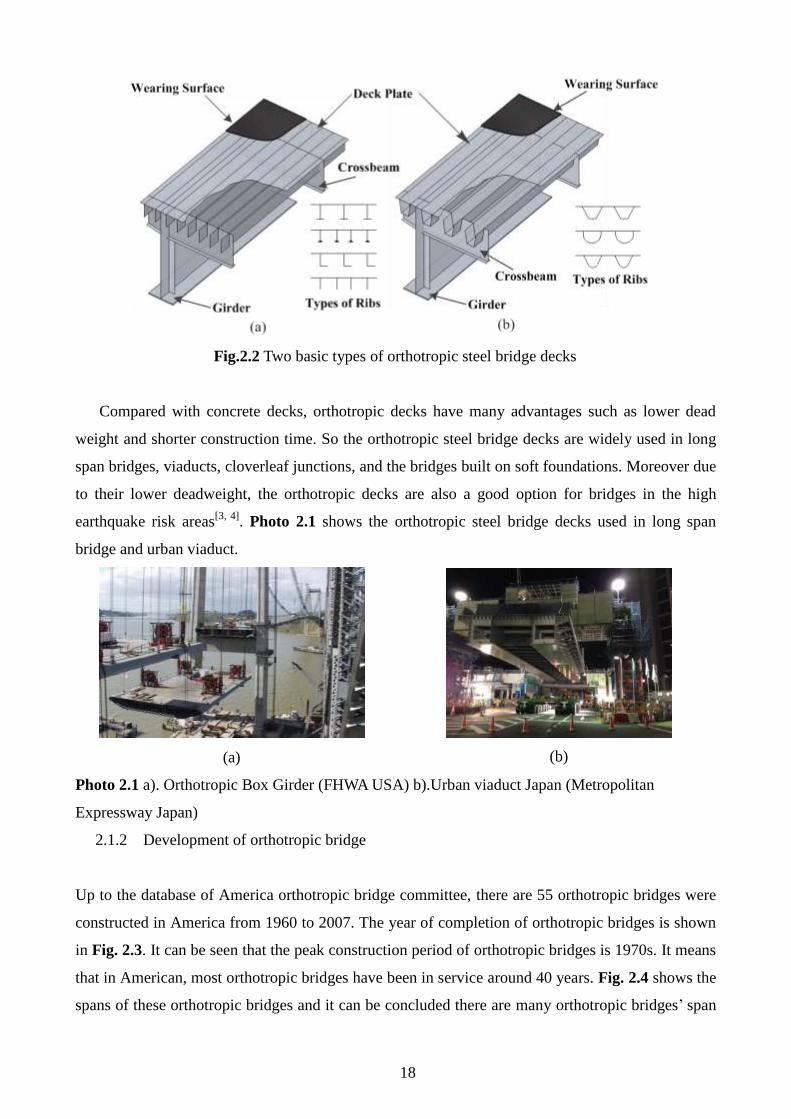
A typical orthotropic steel bridge deck consists of a steel deck plate supported by longitudinal
ribs and transversal crossbeams, as shown in Fig.2.2. Two basic types of longitudinal ribs, open rib
and closed rib, are normally applied in orthotropic steel bridge decks. Due to the volume of the
rib-to-deck joint welds could be reduced by 50% and the torsional rigidity could improve the local
load distribution in the deck by using closed ribs compared with open ribs, the closed ribs are more
widely used than the open ribs in orthotropic steel bridge decks[2]
.
18
Fig.2.2 Two basic types of orthotropic steel bridge decks
Compared with concrete decks, orthotropic decks have many advantages such as lower dead
weight and shorter construction time. So the orthotropic steel bridge decks are widely used in long
span bridges, viaducts, cloverleaf junctions, and the bridges built on soft foundations. Moreover due
to their lower deadweight, the orthotropic decks are also a good option for bridges in the high
earthquake risk areas[3, 4]
. Photo 2.1 shows the orthotropic steel bridge decks used in long span
bridge and urban viaduct.
(a)
(b)
Photo 2.1 a). Orthotropic Box Girder (FHWA USA) b).Urban viaduct Japan (Metropolitan
Expressway Japan)
2.1.2 Development of orthotropic bridge
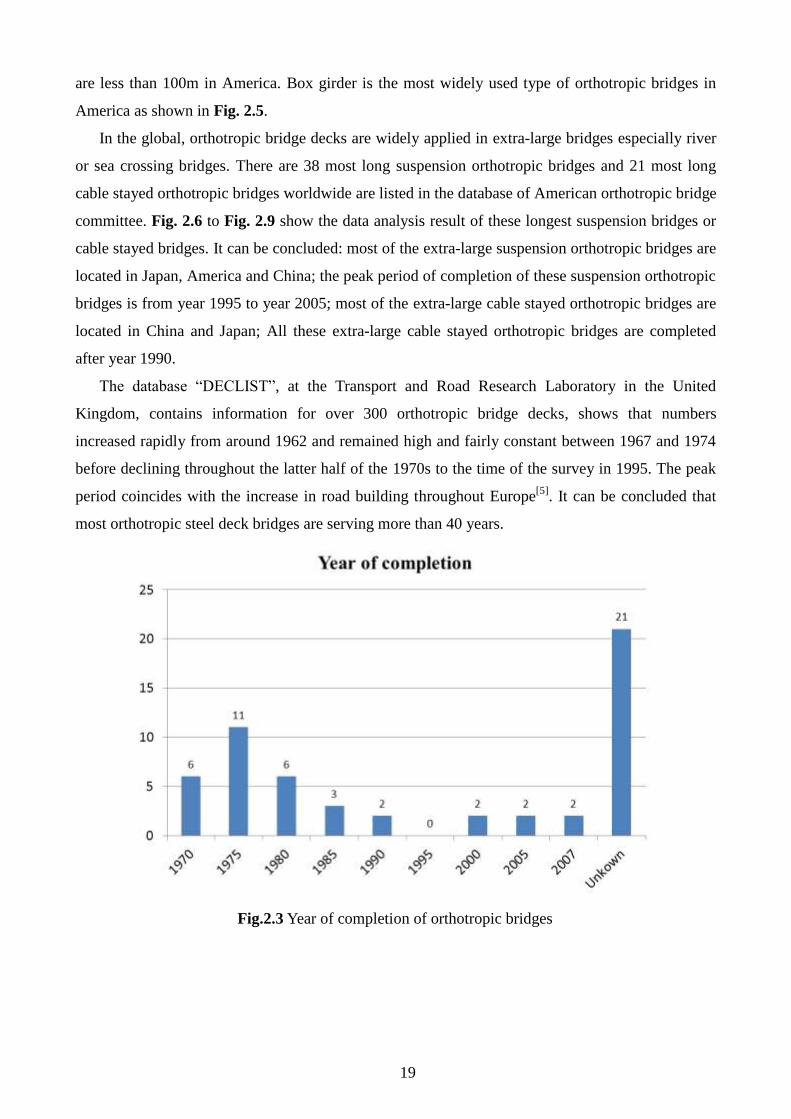
Up to the database of America orthotropic bridge committee, there are 55 orthotropic bridges were
constructed in America from 1960 to 2007. The year of completion of orthotropic bridges is shown
in Fig. 2.3. It can be seen that the peak construction period of orthotropic bridges is 1970s. It means
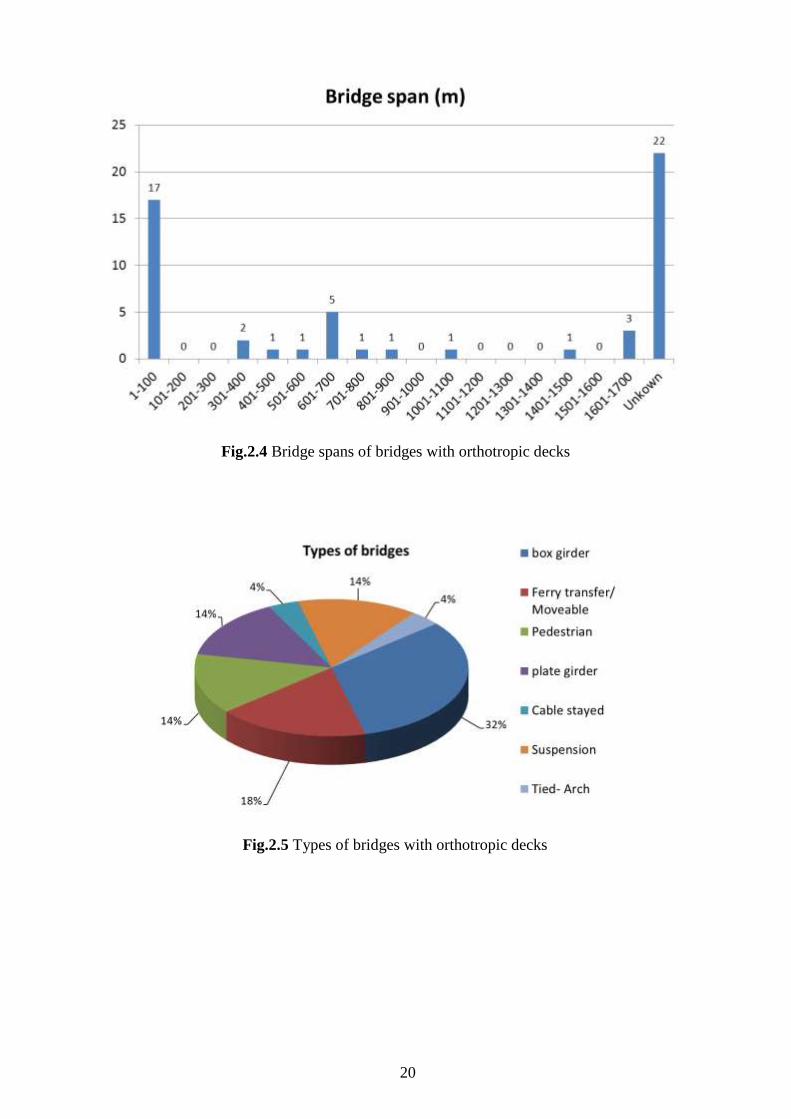
that in American, most orthotropic bridges have been in service around 40 years. Fig. 2.4 shows the
spans of these orthotropic bridges and it can be concluded there are many orthotropic bridges’ span
19
are less than 100m in America. Box girder is the most widely used type of orthotropic bridges in
America as shown in Fig. 2.5.
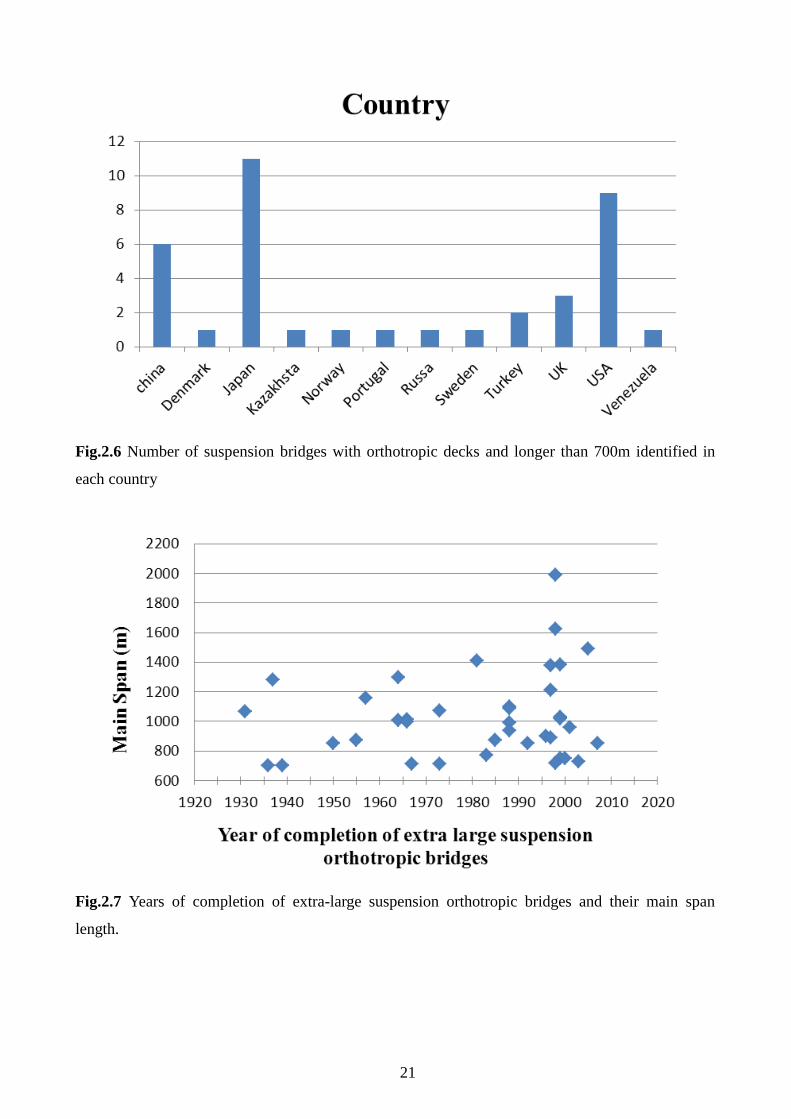
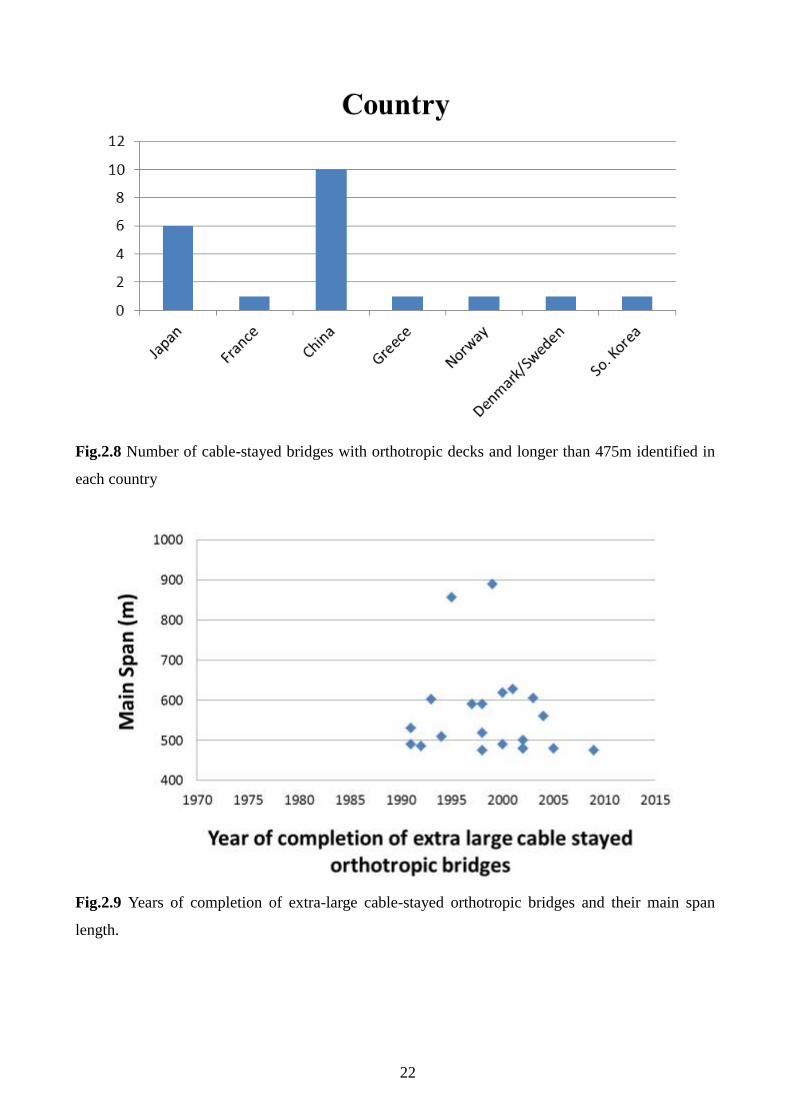
In the global, orthotropic bridge decks are widely applied in extra-large bridges especially river
or sea crossing bridges. There are 38 most long suspension orthotropic bridges and 21 most long
cable stayed orthotropic bridges worldwide are listed in the database of American orthotropic bridge
committee. Fig. 2.6 to Fig. 2.9 show the data analysis result of these longest suspension bridges or
cable stayed bridges. It can be concluded: most of the extra-large suspension orthotropic bridges are
located in Japan, America and China; the peak period of completion of these suspension orthotropic
bridges is from year 1995 to year 2005; most of the extra-large cable stayed orthotropic bridges are
located in China and Japan; All these extra-large cable stayed orthotropic bridges are completed
after year 1990.
The database “DECLIST”, at the Transport and Road Research Laboratory in the United
Kingdom, contains information for over 300 orthotropic bridge decks, shows that numbers
increased rapidly from around 1962 and remained high and fairly constant between 1967 and 1974
before declining throughout the latter half of the 1970s to the time of the survey in 1995. The peak
period coincides with the increase in road building throughout Europe[5]
. It can be concluded that
most orthotropic steel deck bridges are serving more than 40 years.
Fig.2.3 Year of completion of orthotropic bridges
20
Fig.2.4 Bridge spans of bridges with orthotropic decks
Fig.2.5 Types of bridges with orthotropic decks
21
Fig.2.6 Number of suspension bridges with orthotropic decks and longer than 700m identified in
each country
Fig.2.7 Years of completion of extra-large suspension orthotropic bridges and their main span
length.
22
Fig.2.8 Number of cable-stayed bridges with orthotropic decks and longer than 475m identified in
each country
Fig.2.9 Years of completion of extra-large cable-stayed orthotropic bridges and their main span
length.
23
2.2 Fatigue damage in orthotropic steel bridge decks
The beginning of orthotropic bridge construction is in Europe in 1950s. And after about 20 years
on service, many fatigue cracks have been observed in some orthotropic bridge decks in 1970s.
Along with the orthotropic steel bridge decks applied in other countries, many fatigue cracks in
orthotropic steel bridge decks also been reported in America, Japan and China.
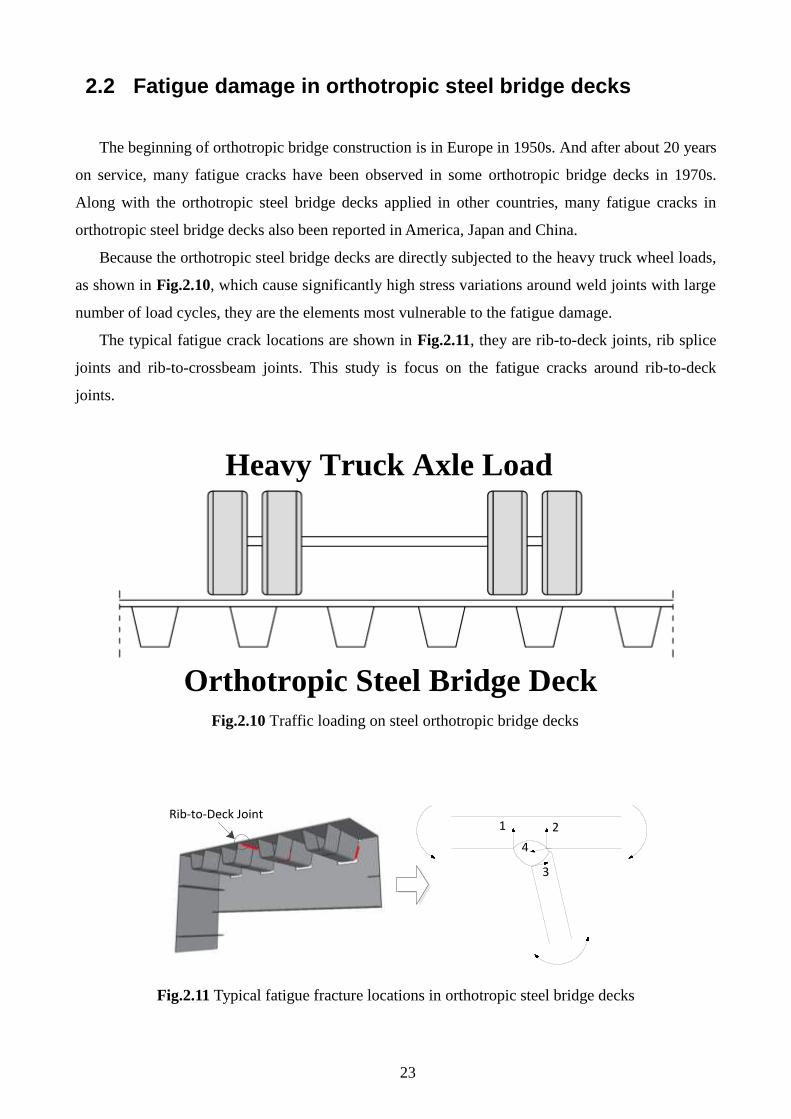
Because the orthotropic steel bridge decks are directly subjected to the heavy truck wheel loads,
as shown in Fig.2.10, which cause significantly high stress variations around weld joints with large
number of load cycles, they are the elements most vulnerable to the fatigue damage.
The typical fatigue crack locations are shown in Fig.2.11, they are rib-to-deck joints, rib splice
joints and rib-to-crossbeam joints. This study is focus on the fatigue cracks around rib-to-deck
joints.
Fig.2.10 Traffic loading on steel orthotropic bridge decks
Rib-to-Deck Joint1 2
3
4
Fig.2.11 Typical fatigue fracture locations in orthotropic steel bridge decks
Heavy Truck Axle Load
Orthotropic Steel Bridge Deck
24
2.3 Fatigue cracks of rib-to-deck (RD) joints in Wangan route
of Hanshin Expressway
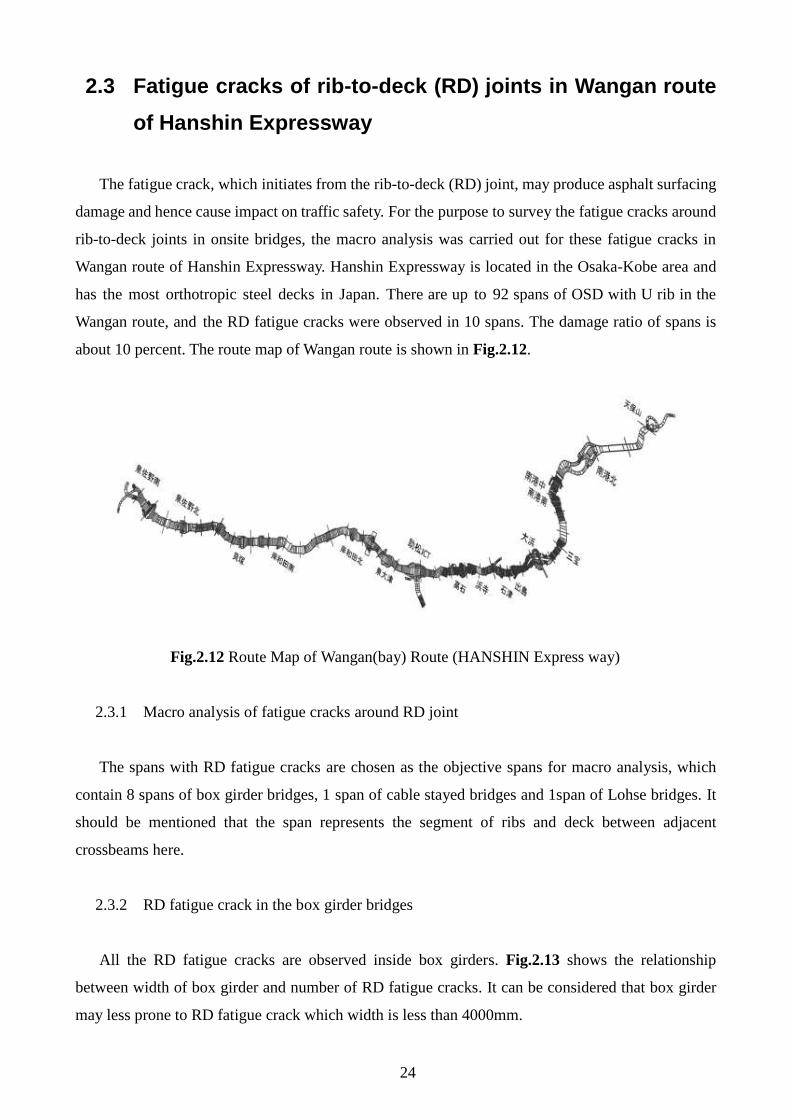
The fatigue crack, which initiates from the rib-to-deck (RD) joint, may produce asphalt surfacing
damage and hence cause impact on traffic safety. For the purpose to survey the fatigue cracks around
rib-to-deck joints in onsite bridges, the macro analysis was carried out for these fatigue cracks in
Wangan route of Hanshin Expressway. Hanshin Expressway is located in the Osaka-Kobe area and
has the most orthotropic steel decks in Japan. There are up to 92 spans of OSD with U rib in the
Wangan route, and the RD fatigue cracks were observed in 10 spans. The damage ratio of spans is
about 10 percent. The route map of Wangan route is shown in Fig.2.12.
Fig.2.12 Route Map of Wangan(bay) Route (HANSHIN Express way)
2.3.1 Macro analysis of fatigue cracks around RD joint
The spans with RD fatigue cracks are chosen as the objective spans for macro analysis, which
contain 8 spans of box girder bridges, 1 span of cable stayed bridges and 1span of Lohse bridges. It
should be mentioned that the span represents the segment of ribs and deck between adjacent
crossbeams here.
2.3.2 RD fatigue crack in the box girder bridges
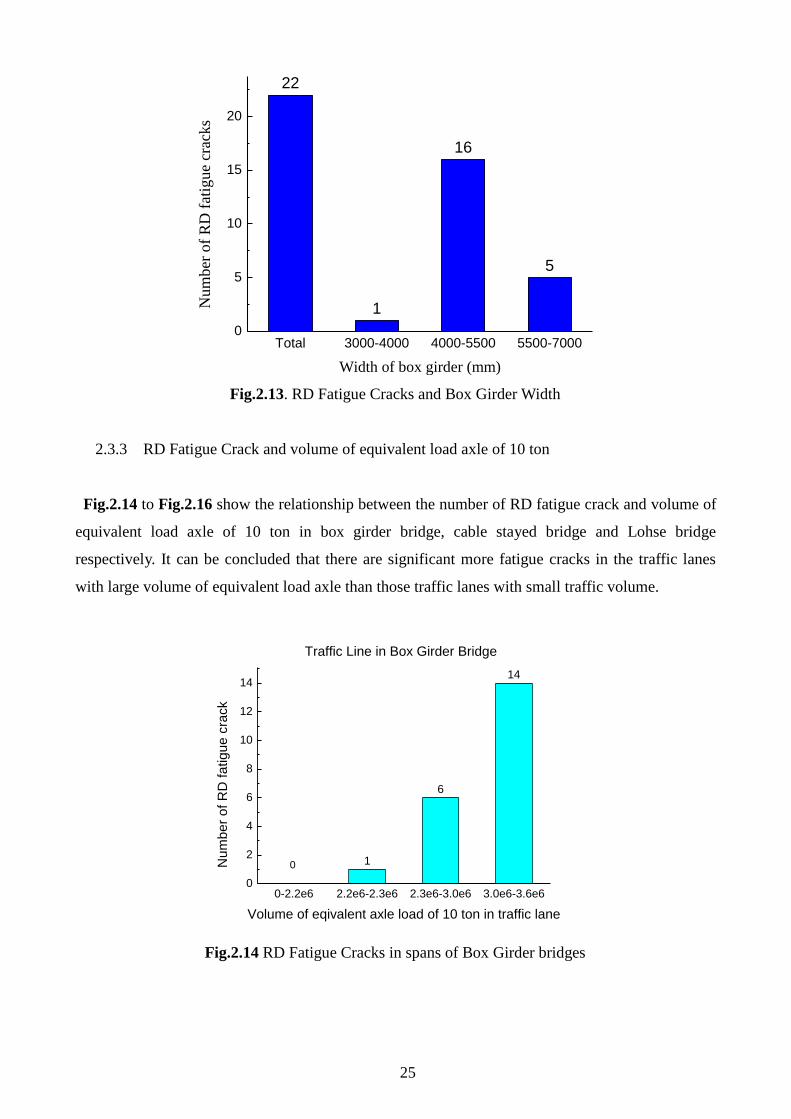
All the RD fatigue cracks are observed inside box girders. Fig.2.13 shows the relationship
between width of box girder and number of RD fatigue cracks. It can be considered that box girder
may less prone to RD fatigue crack which width is less than 4000mm.
25
Fig.2.13. RD Fatigue Cracks and Box Girder Width
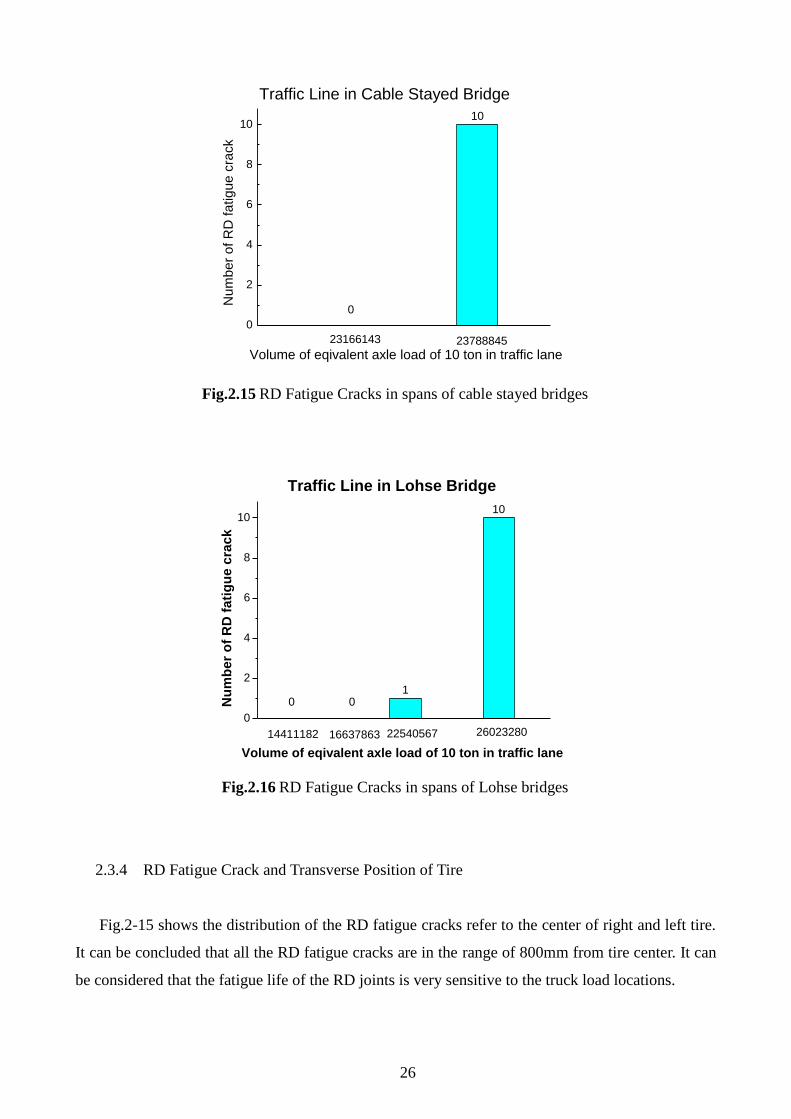
2.3.3 RD Fatigue Crack and volume of equivalent load axle of 10 ton
Fig.2.14 to Fig.2.16 show the relationship between the number of RD fatigue crack and volume of
equivalent load axle of 10 ton in box girder bridge, cable stayed bridge and Lohse bridge
respectively. It can be concluded that there are significant more fatigue cracks in the traffic lanes
with large volume of equivalent load axle than those traffic lanes with small traffic volume.
Fig.2.14 RD Fatigue Cracks in spans of Box Girder bridges
22
1
16
5
Total 3000-4000 4000-5500 5500-70000
5
10
15
20
Nu
mb
er o
f R
D f
atig
ue
crac
ks
Width of box girder (mm)
1
6
14
0-2.2e6 2.2e6-2.3e6 2.3e6-3.0e6 3.0e6-3.6e60
2
4
6
8
10
12
14
0
Traffic Line in Box Girder Bridge
Nu
mb
er
of
RD
fa
tig
ue
cra
ck
Volume of eqivalent axle load of 10 ton in traffic lane
26
Fig.2.15 RD Fatigue Cracks in spans of cable stayed bridges
Fig.2.16 RD Fatigue Cracks in spans of Lohse bridges
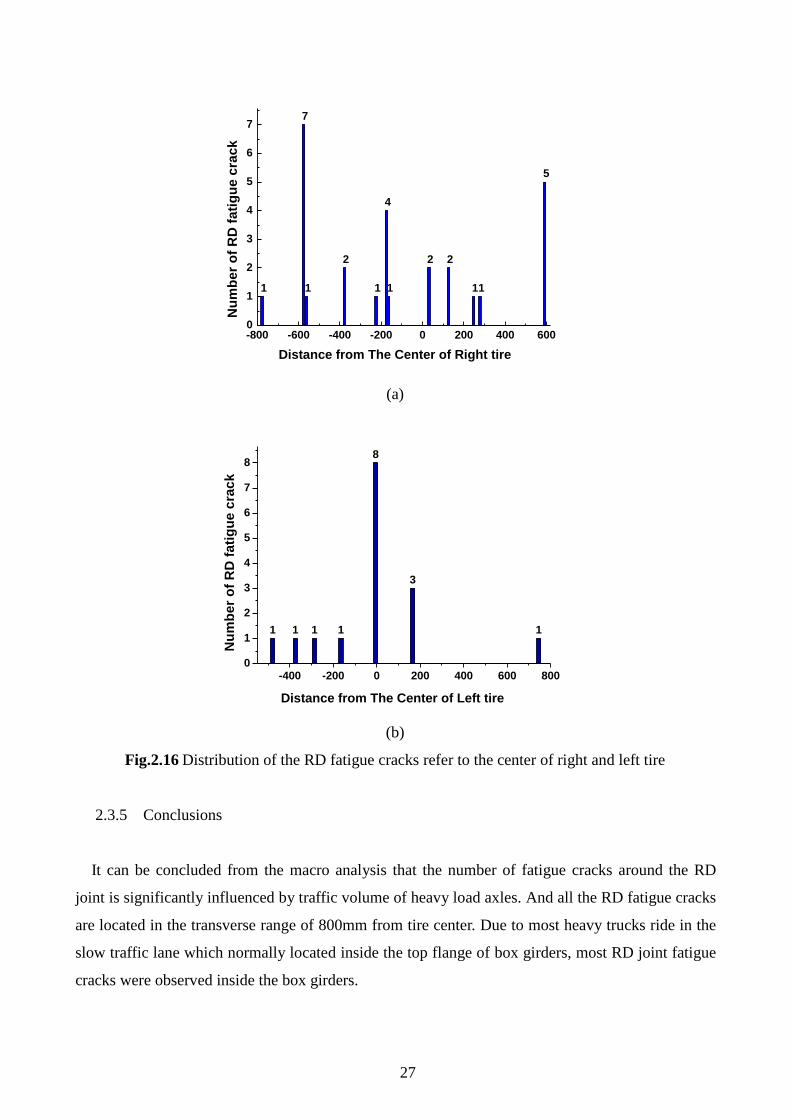
2.3.4 RD Fatigue Crack and Transverse Position of Tire
Fig.2-15 shows the distribution of the RD fatigue cracks refer to the center of right and left tire.
It can be concluded that all the RD fatigue cracks are in the range of 800mm from tire center. It can
be considered that the fatigue life of the RD joints is very sensitive to the truck load locations.
10
0
2
4
6
8
10
Traffic Line in Cable Stayed Bridge
Nu
mb
er
of
RD
fa
tig
ue
cra
ck
Volume of eqivalent axle load of 10 ton in traffic lane
0
23166143 23788845
1
10
0
2
4
6
8
10
Traffic Line in Lohse Bridge
0 0
1663786314411182 22540567 26023280
Nu
mb
er
of
RD
fa
tig
ue
cra
ck
Volume of eqivalent axle load of 10 ton in traffic lane
27
(a)
(b)
Fig.2.16 Distribution of the RD fatigue cracks refer to the center of right and left tire
2.3.5 Conclusions
It can be concluded from the macro analysis that the number of fatigue cracks around the RD
joint is significantly influenced by traffic volume of heavy load axles. And all the RD fatigue cracks
are located in the transverse range of 800mm from tire center. Due to most heavy trucks ride in the
slow traffic lane which normally located inside the top flange of box girders, most RD joint fatigue
cracks were observed inside the box girders.
1
4
1
2
1
7
1
2 2
11
5
-800 -600 -400 -200 0 200 400 6000
1
2
3
4
5
6
7
Nu
mb
er
of
RD
fa
tig
ue
cra
ck
Distance from The Center of Right tire
1 1 1 1
8
3
1
-400 -200 0 200 400 600 8000
1
2
3
4
5
6
7
8
Nu
mb
er
of
RD
fa
tig
ue
cra
ck
Distance from The Center of Left tire
28
2.4 Fatigue life improvement method
2.4.1 Burr grinding
The primary aim of the grinding is to remove or reduce size of the weld toe flaws from which
fatigue cracks propagate. At the same time, it aims to reduce the local stress concentration effect of
the weld profile by smoothly blending the transition between the plate and the weld face[6]
.
2.4.2 TIG dressing
The aim of TIG dressing is to remove the weld toe flaws by re-melting the material at the weld
toe. It also aims to reduce the local stress concentration effect of the local weld toe profile by
providing a smooth transition between the plate and the weld face[6]
. The present specifications are
not applicable to connections with main plate thickness less than 4 mm for aluminum and 6 mm for
steel.
2.4.3 Hammer or needle peening
In hammer or needle peening, compressive residual stresses are induced by repeatedly
hammering the weld toe region with a blunt-nosed chisel or round-tipped rods[6, 7]
. The present
specifications are not applicable to connections with main plate thickness less than 4 mm for steel
and 8 mm for aluminum.
2.5 Refit methods for rib-to-deck joints
2.5.1 SFRC applied on the deck plate
In Japan, Steel fiber reinforced concrete (SFRC) has been applied to some OSDs to improve the
bending stiffness of deck plate and hence refit the fatigue crack occurred in the rib-to-deck plate
joints. As shown in the Fig.2.17
29
Fig.2.17 Steel fiber reinforced concrete (SFRC)
2.5.2 Filling ribs with concrete.
For the application of the rib filling is not necessary to remove the old surfacing and the rib filling
is thought to act as a spring support for the deck plate. This requires a filling material which has
enough stiffness. In addition to this filling material should be fully in contact with the underside of
the deck plate. The most applied filling material in japan is the lightweight concrete. And the sketch
of the rib filling is shown in the Fig.2.18.
Fig.2.18 Rib filling
2.5.3 Sandwich deck plate
400 mm
Asphalt surfacing
400 mm
SFRC
Fatigue cracks
Asphalt surfacing
Light concrete
Fatigue cracks
30
Recently some researchers propose various kinds of sandwich deck plate to instead of
traditional steel deck plate to increase the bending stiffness of deck plates[8]
. Fig.2.19 shows one
kind of sandwich deck plate. However the biggest challenge for the sandwich deck plate is the
bonding strength between the different layers, so various bonding strength test should be studied
and ensured before the sandwich deck plate can be applied in onsite orthotropic bridge decks.
Fig.2.19 Sandwich deck plate
2.6 Reference
[1] T.R. Gurney, L. Transport Research, Fatigue of steel bridge decks, H.M.S.O.,
London, 1992.
[2] Z.-G. Xiao, K. Yamada, S. Ya, X.-L. Zhao, Stress analyses and fatigue evaluation
of rib-to-deck joints in steel orthotropic decks, International Journal of Fatigue, 30
(2008) 1387-1397.
[3] C. Miki, Fatigue damage in orthotropic steel bridge decks and retrofit works, Int.
J. Steel Struct, 6 (2006) 255-267.
[4] C. Miki, H. Suganuma, M. Tomizawa, F. Machida, Cause study on fatigue
damage in orthotropic steel bridge deck, in: Proceedings of the Japan Society of Civil
Engineers, 2005, pp. 57-69.
[5] M.H. Kolstein, Fatigue classification of welded joints in orthotropic steel bridge
decks, in, s.n.], S.l., 2007.
[6] P. Haagensen, S. Maddox, IIW Recommendations on Post Weld Improvement of
Steel and Aluminium, IIW Doc. no, 13 (2003) 1815-1800.
[7] M.-k.M.C.T.I.T. ANAMI K (Tokyo Inst. Tech., Meguro-ku) TANI H (Tokyo Inst.
Tech., Meguro-ku) YAMAMOTO H (Tokyo Inst. Tech., Meguro-ku) Improving Fatigue
Strength of welded Joints by Hammer Peening and Tig-Dressing, Proceedings of JSCE
(Japan Society of Civil Engineers), 647 (2000) 67-78.
Asphalt surfacing
Fatigue cracks
PU core
Deck plate
2nd plate

31
[8] S. Teixeira de Freitas, H. Kolstein, F. Bijlaard, Composite bonded systems for
renovations of orthotropic steel bridge decks, Composite Structures, 92 (2010) 853-862.
32
CHAPTER 3
Stress Analysis and Fatigue Evaluation of Rib-to-Deck
Joint in Orthotropic Steel Bridge Deck
33
3.1 Introduction
A typical orthotropic steel bridge deck (OSD), as shown in Fig.3.1, consists of a deck plate
supported by a system of transverse crossbeams and longitude ribs. The asphalt surfacing is
generally applied to the deck plate to provide a water proofing and corrosion layer for protecting the
steel deck and a flat running and skid-resistant surfacing for vehicle riding[1]
. Due to its lower
deadweight and shorter construction time compared with concrete slabs, the OSD are widely used
in long-span bridges and urban viaducts. However numerous fatigue cracks were observed in many
long-time served OSDs[2]
. Especially, the fatigue cracks that initiate from rib-to-deck (RD) joint, as
shown in Fig.3.2, may produce asphalt surfacing damage and hence cause impact on traffic safety.
Two basic types of longitude rib, open rib and closed rib, are normally applied in the OSD.
Although the volume of the RD joint welds could be reduced by 50% and the torsional rigidity
could improve the local load distribution in the deck by using closed longitude ribs compared with
open longitude ribs[3]
, the RD joints are more prone to fatigue failures in the OSDs stiffened with
closed ribs than in the OSDs with open ribs, since the closed ribs constraint the transverse
deformations of the deck plate[4]
. Nevertheless, closed ribs are more widely used than open ribs in
the OSDs[5]
. Four kinds of typical fatigue crack were observed in the RD joint[3, 6]
: type 1 initiates
from weld toe and propagates to the deck plate, type 2 initiates from weld root and propagates to the
deck plate, type 3 initiates from weld toe and propagates to the rib wall and type 4 initiates from
weld root and propagates to the weld throat. Furthermore since they grow from the inside out, these
cracks are hard to be observed until they have grown through thickness.
The stress concentration, which is relative to the fatigue life, around the RD joint is affected by
various factors such as deck plate thickness, weld detail geometry, partial joint penetration (PJP)
ratio[7]
and asphalt surfacing property[8]
.
This chapter focused on the asphalt surfacing influence on the stress concentration around the
RD joint and RD joint fatigue life evaluation. For this purpose, various FE-models and load models
were created to investigate the influence of the asphalt surfacing on the stress ranges around RD
joints.

34
Deck PlateWearing Surface
Crossbeam
Girder
Rib
Fig.3.1 Components of the Orthotropic Steel Deck Bridge Girder System
Rib-to-Deck Joint1 2
3
4
Fig.3.2 Potential fatigue cracks in the Rib-to-Deck Joint.
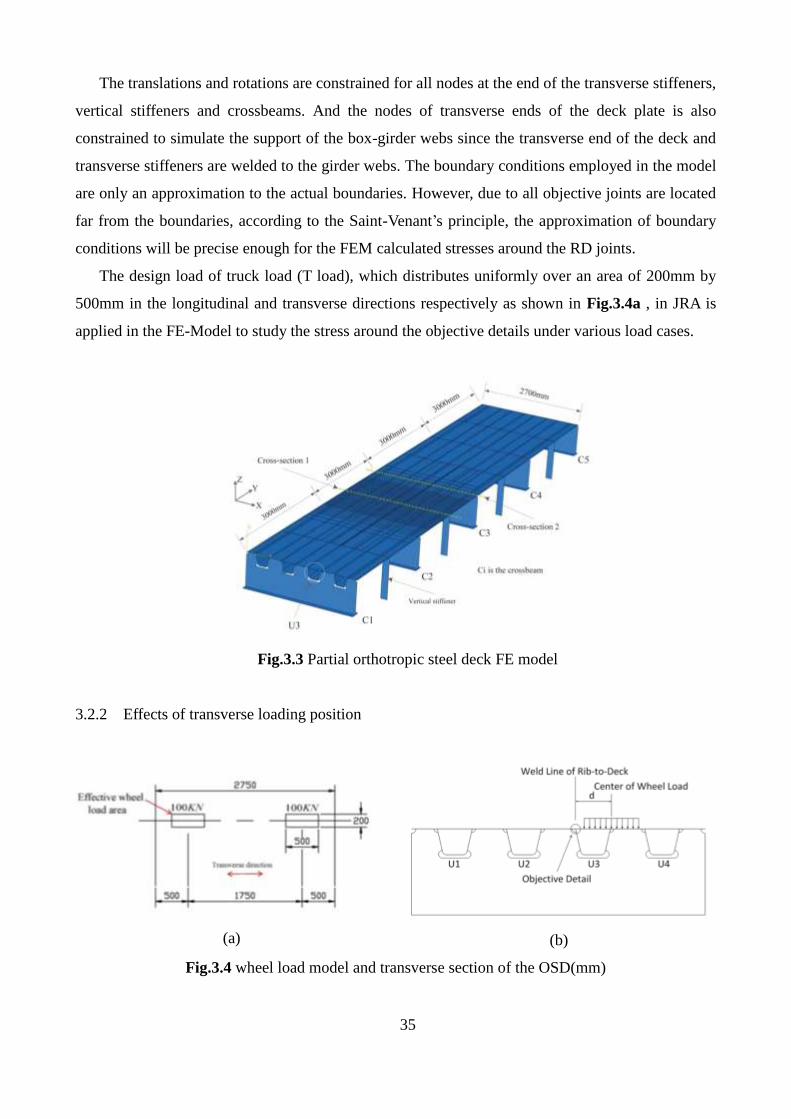
3.2 Finite element model and stress analysis
3.2.1 Finite element (FE) model (without asphalt surfacing)
For the purpose to investigate the stress around RD joints, A FE model of partial orthotropic
steel deck was made using the general purpose FE software Abaqus based on actual dimension of a
box girder bridge located in the coast line of Hanshin highway. As shown in Fig.3.3, the deck plate
is supported by four U-ribs, four pairs of vertical stiffeners and five crossbeams.
The spacing of the crossbeams is 3000 mm, and the spacing of the U-ribs is 635mm. the vertical
stiffeners are located at the mid span between crossbeams. The thickness of deck plate is 12 mm.
The top width, height and rib wall thickness of the U-rib section are 320mm, 240mm and 6mm
respectively.
In this study, the objective details are the left wall of U rib (U3) to deck plate joint at the mid
span section (section 1) between crossbeams (C2 and C3) and the intersection (section 2) of
crossbeam (C3) and deck plate.
35
The translations and rotations are constrained for all nodes at the end of the transverse stiffeners,
vertical stiffeners and crossbeams. And the nodes of transverse ends of the deck plate is also
constrained to simulate the support of the box-girder webs since the transverse end of the deck and
transverse stiffeners are welded to the girder webs. The boundary conditions employed in the model
are only an approximation to the actual boundaries. However, due to all objective joints are located
far from the boundaries, according to the Saint-Venant’s principle, the approximation of boundary
conditions will be precise enough for the FEM calculated stresses around the RD joints.
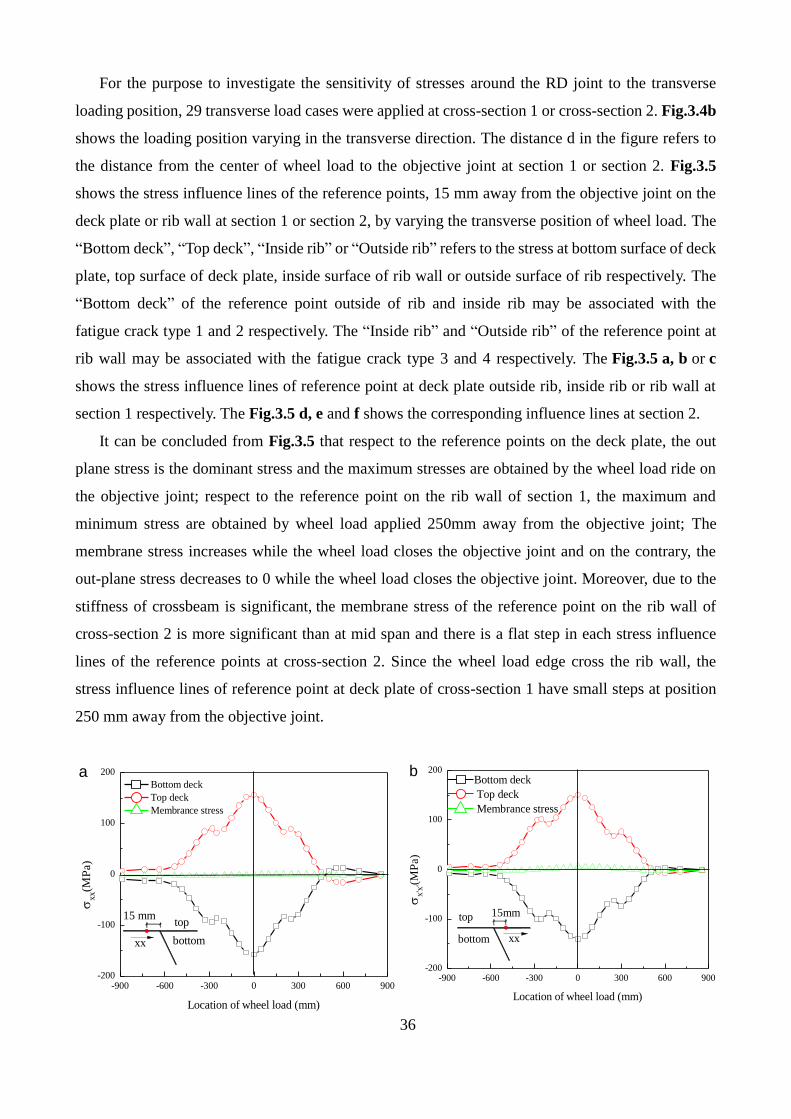
The design load of truck load (T load), which distributes uniformly over an area of 200mm by
500mm in the longitudinal and transverse directions respectively as shown in Fig.3.4a , in JRA is
applied in the FE-Model to study the stress around the objective details under various load cases.
Fig.3.3 Partial orthotropic steel deck FE model
3.2.2 Effects of transverse loading position
(a)
(b)
Fig.3.4 wheel load model and transverse section of the OSD(mm)
36
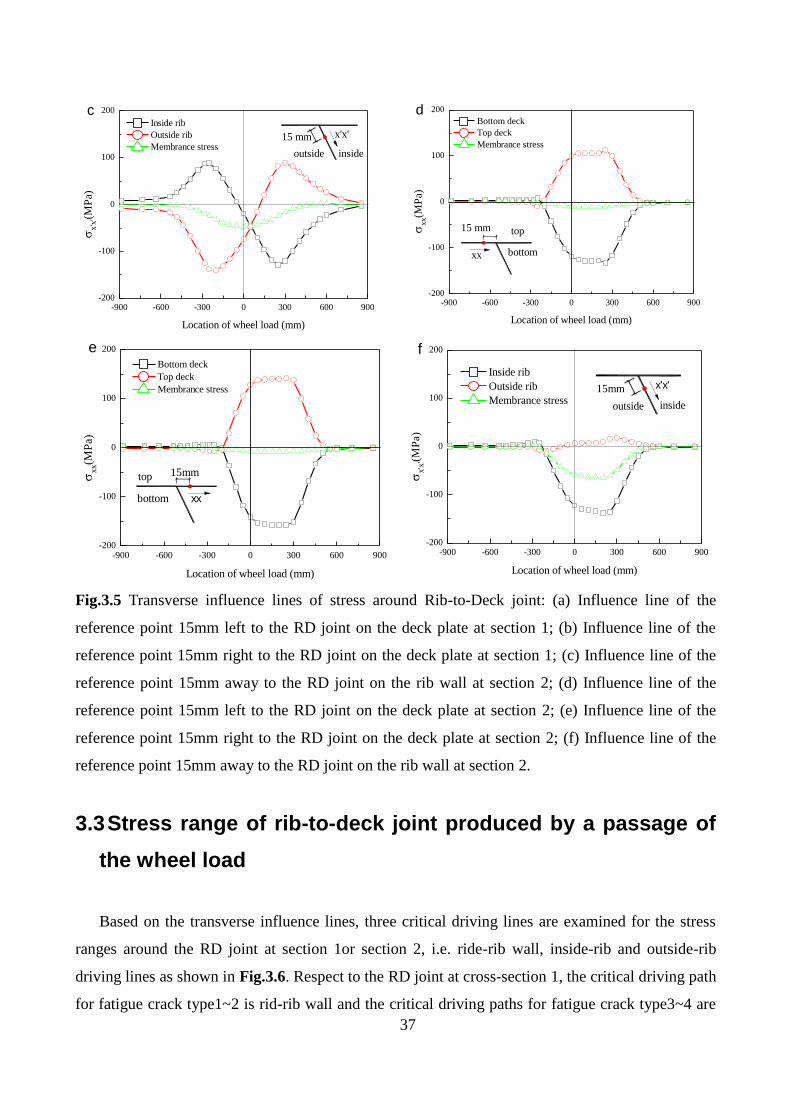
For the purpose to investigate the sensitivity of stresses around the RD joint to the transverse
loading position, 29 transverse load cases were applied at cross-section 1 or cross-section 2. Fig.3.4b
shows the loading position varying in the transverse direction. The distance d in the figure refers to
the distance from the center of wheel load to the objective joint at section 1 or section 2. Fig.3.5
shows the stress influence lines of the reference points, 15 mm away from the objective joint on the
deck plate or rib wall at section 1 or section 2, by varying the transverse position of wheel load. The
“Bottom deck”, “Top deck”, “Inside rib” or “Outside rib” refers to the stress at bottom surface of deck
plate, top surface of deck plate, inside surface of rib wall or outside surface of rib respectively. The
“Bottom deck” of the reference point outside of rib and inside rib may be associated with the
fatigue crack type 1 and 2 respectively. The “Inside rib” and “Outside rib” of the reference point at
rib wall may be associated with the fatigue crack type 3 and 4 respectively. The Fig.3.5 a, b or c
shows the stress influence lines of reference point at deck plate outside rib, inside rib or rib wall at
section 1 respectively. The Fig.3.5 d, e and f shows the corresponding influence lines at section 2.
It can be concluded from Fig.3.5 that respect to the reference points on the deck plate, the out
plane stress is the dominant stress and the maximum stresses are obtained by the wheel load ride on
the objective joint; respect to the reference point on the rib wall of section 1, the maximum and
minimum stress are obtained by wheel load applied 250mm away from the objective joint; The
membrane stress increases while the wheel load closes the objective joint and on the contrary, the
out-plane stress decreases to 0 while the wheel load closes the objective joint. Moreover, due to the
stiffness of crossbeam is significant, the membrane stress of the reference point on the rib wall of
cross-section 2 is more significant than at mid span and there is a flat step in each stress influence
lines of the reference points at cross-section 2. Since the wheel load edge cross the rib wall, the
stress influence lines of reference point at deck plate of cross-section 1 have small steps at position
250 mm away from the objective joint.
-900 -600 -300 0 300 600 900-200
-100
0
100
200
xx
15 mm
bottom
xx(M
Pa)
Location of wheel load (mm)
Bottom deck
Top deck
Membrance stress
top
a
-900 -600 -300 0 300 600 900-200
-100
0
100
200
xx
15mm
bottom
x'x
'(MP
a)
Location of wheel load (mm)
Bottom deck
Top deck
Membrance stress
top
b
37
-900 -600 -300 0 300 600 900-200
-100
0
100
200
x'x'15 mm
inside
x'x
'(MP
a)
Location of wheel load (mm)
Inside rib
Outside rib
Membrance stressoutside
c
-900 -600 -300 0 300 600 900-200
-100
0
100
200
xx
15 mm
bottom
xx(M
Pa)
Location of wheel load (mm)
Bottom deck
Top deck
Membrance stress
top
d
-900 -600 -300 0 300 600 900-200
-100
0
100
200
15mm
bottom
xx(M
Pa)
Location of wheel load (mm)
Bottom deck
Top deck
Membrance stress
top
e
xx
-900 -600 -300 0 300 600 900-200
-100
0
100
200
15mm
inside
x'x
'(MP
a)
Location of wheel load (mm)
Inside rib
Outside rib
Membrance stressoutside
f
x'x'
Fig.3.5 Transverse influence lines of stress around Rib-to-Deck joint: (a) Influence line of the
reference point 15mm left to the RD joint on the deck plate at section 1; (b) Influence line of the
reference point 15mm right to the RD joint on the deck plate at section 1; (c) Influence line of the
reference point 15mm away to the RD joint on the rib wall at section 2; (d) Influence line of the
reference point 15mm left to the RD joint on the deck plate at section 2; (e) Influence line of the
reference point 15mm right to the RD joint on the deck plate at section 2; (f) Influence line of the
reference point 15mm away to the RD joint on the rib wall at section 2.
3.3 Stress range of rib-to-deck joint produced by a passage of
the wheel load
Based on the transverse influence lines, three critical driving lines are examined for the stress
ranges around the RD joint at section 1or section 2, i.e. ride-rib wall, inside-rib and outside-rib
driving lines as shown in Fig.3.6. Respect to the RD joint at cross-section 1, the critical driving path
for fatigue crack type1~2 is rid-rib wall and the critical driving paths for fatigue crack type3~4 are
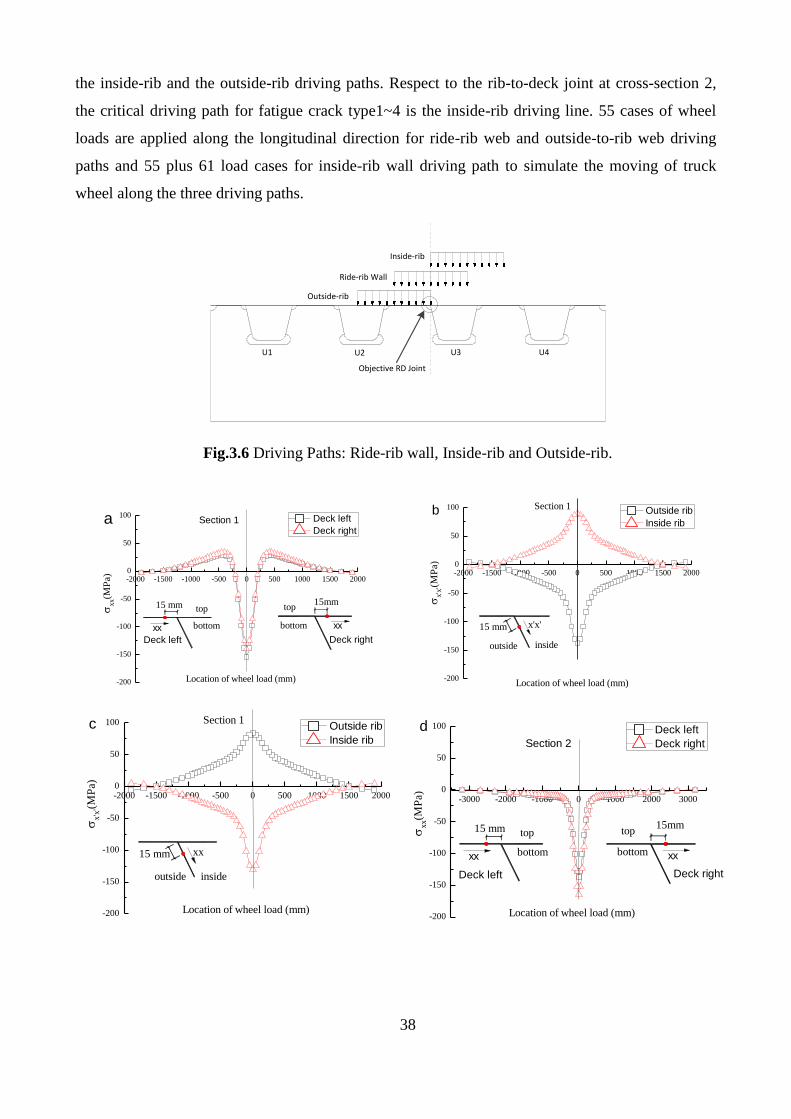
38
the inside-rib and the outside-rib driving paths. Respect to the rib-to-deck joint at cross-section 2,
the critical driving path for fatigue crack type1~4 is the inside-rib driving line. 55 cases of wheel
loads are applied along the longitudinal direction for ride-rib web and outside-to-rib web driving
paths and 55 plus 61 load cases for inside-rib wall driving path to simulate the moving of truck
wheel along the three driving paths.
Outside-rib
Ride-rib Wall
Inside-rib
U1 U2 U3 U4
Objective RD Joint
Fig.3.6 Driving Paths: Ride-rib wall, Inside-rib and Outside-rib.
-2000 -1500 -1000 -500 0 500 1000 1500 2000
-200
-150
-100
-50
0
50
100
xx
Section 1
Deck left Deck right
Location of wheel load (mm)
xx(M
Pa)
Deck left
Deck right
top
bottom
15mm
bottom
top15 mm
xx
a
-2000 -1500 -1000 -500 0 500 1000 1500 2000
-200
-150
-100
-50
0
50
100
x'x'
Section 1
x'x
'(MP
a)
Location of wheel load (mm)
Outside rib
Inside rib
15 mm
outside inside
b
-2000 -1500 -1000 -500 0 500 1000 1500 2000
-200
-150
-100
-50
0
50
100
xx
Section 1
x'x
'(MP
a)
Location of wheel load (mm)
Outside rib
Inside rib
15 mm
outside inside
c
-3000 -2000 -1000 0 1000 2000 3000
-200
-150
-100
-50
0
50
100
Section 2
xx
Deck left Deck right
Location of wheel load (mm)
xx(M
Pa)
Deck left
Deck right
top
bottom
15mm
bottom
top15 mm
xx
d
39
-3000 -2000 -1000 0 1000 2000 3000
-200
-150
-100
-50
0
50
100
x'x'
Section 2
x'x
'(MP
a)
Location of wheel load (mm)
Outside rib
Inside rib
15 mm
outside inside
e
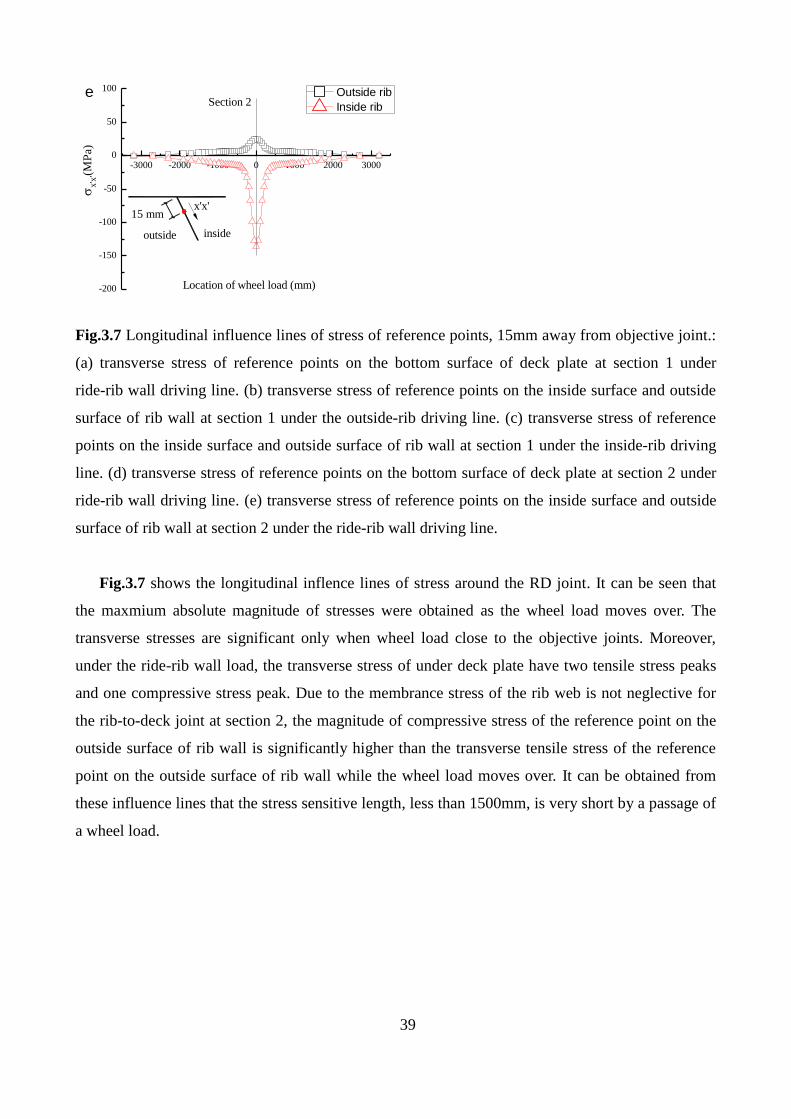
Fig.3.7 Longitudinal influence lines of stress of reference points, 15mm away from objective joint.:
(a) transverse stress of reference points on the bottom surface of deck plate at section 1 under
ride-rib wall driving line. (b) transverse stress of reference points on the inside surface and outside
surface of rib wall at section 1 under the outside-rib driving line. (c) transverse stress of reference
points on the inside surface and outside surface of rib wall at section 1 under the inside-rib driving
line. (d) transverse stress of reference points on the bottom surface of deck plate at section 2 under
ride-rib wall driving line. (e) transverse stress of reference points on the inside surface and outside
surface of rib wall at section 2 under the ride-rib wall driving line.
Fig.3.7 shows the longitudinal inflence lines of stress around the RD joint. It can be seen that
the maxmium absolute magnitude of stresses were obtained as the wheel load moves over. The
transverse stresses are significant only when wheel load close to the objective joints. Moreover,
under the ride-rib wall load, the transverse stress of under deck plate have two tensile stress peaks
and one compressive stress peak. Due to the membrance stress of the rib web is not neglective for
the rib-to-deck joint at section 2, the magnitude of compressive stress of the reference point on the
outside surface of rib wall is significantly higher than the transverse tensile stress of the reference
point on the outside surface of rib wall while the wheel load moves over. It can be obtained from
these influence lines that the stress sensitive length, less than 1500mm, is very short by a passage of
a wheel load.
40
3.4 The asphalt surfacing influence on the wheel load
dispersant and composited stiffness
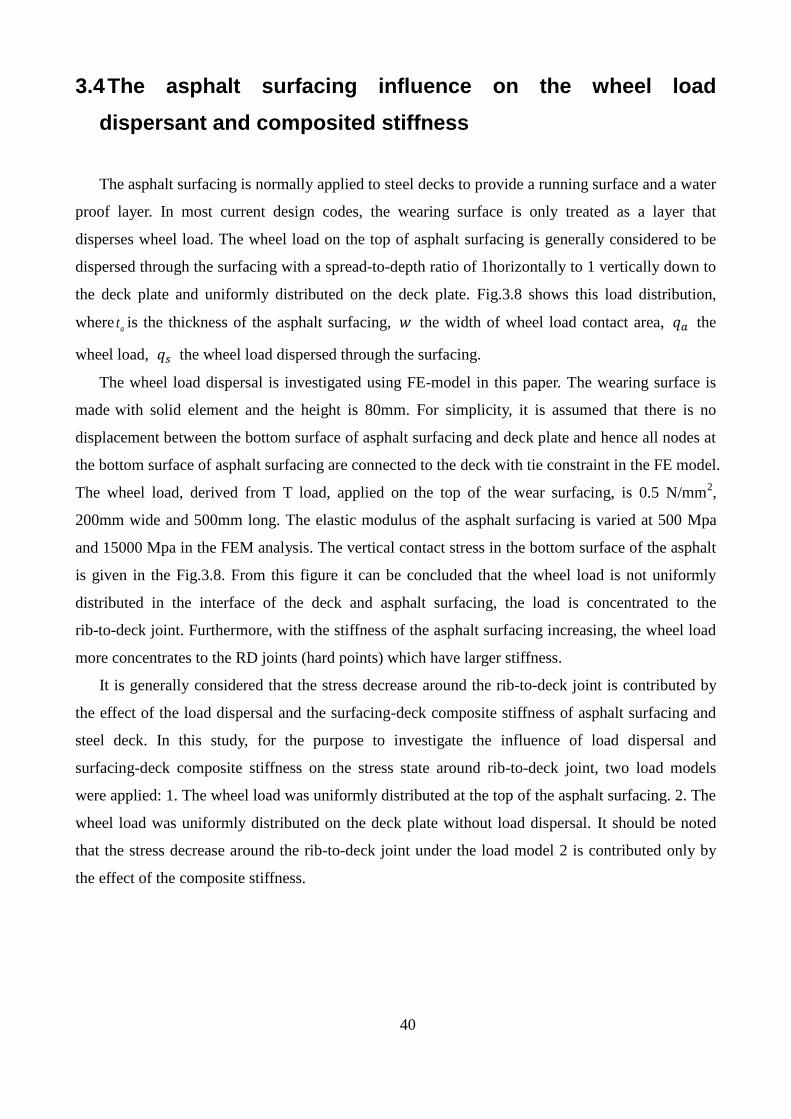
The asphalt surfacing is normally applied to steel decks to provide a running surface and a water
proof layer. In most current design codes, the wearing surface is only treated as a layer that
disperses wheel load. The wheel load on the top of asphalt surfacing is generally considered to be
dispersed through the surfacing with a spread-to-depth ratio of 1horizontally to 1 vertically down to
the deck plate and uniformly distributed on the deck plate. Fig.3.8 shows this load distribution,
whereat is the thickness of the asphalt surfacing, 𝑤 the width of wheel load contact area, 𝑞𝑎 the
wheel load, 𝑞𝑠 the wheel load dispersed through the surfacing.
The wheel load dispersal is investigated using FE-model in this paper. The wearing surface is
made with solid element and the height is 80mm. For simplicity, it is assumed that there is no
displacement between the bottom surface of asphalt surfacing and deck plate and hence all nodes at
the bottom surface of asphalt surfacing are connected to the deck with tie constraint in the FE model.
The wheel load, derived from T load, applied on the top of the wear surfacing, is 0.5 N/mm2,
200mm wide and 500mm long. The elastic modulus of the asphalt surfacing is varied at 500 Mpa
and 15000 Mpa in the FEM analysis. The vertical contact stress in the bottom surface of the asphalt
is given in the Fig.3.8. From this figure it can be concluded that the wheel load is not uniformly
distributed in the interface of the deck and asphalt surfacing, the load is concentrated to the
rib-to-deck joint. Furthermore, with the stiffness of the asphalt surfacing increasing, the wheel load
more concentrates to the RD joints (hard points) which have larger stiffness.
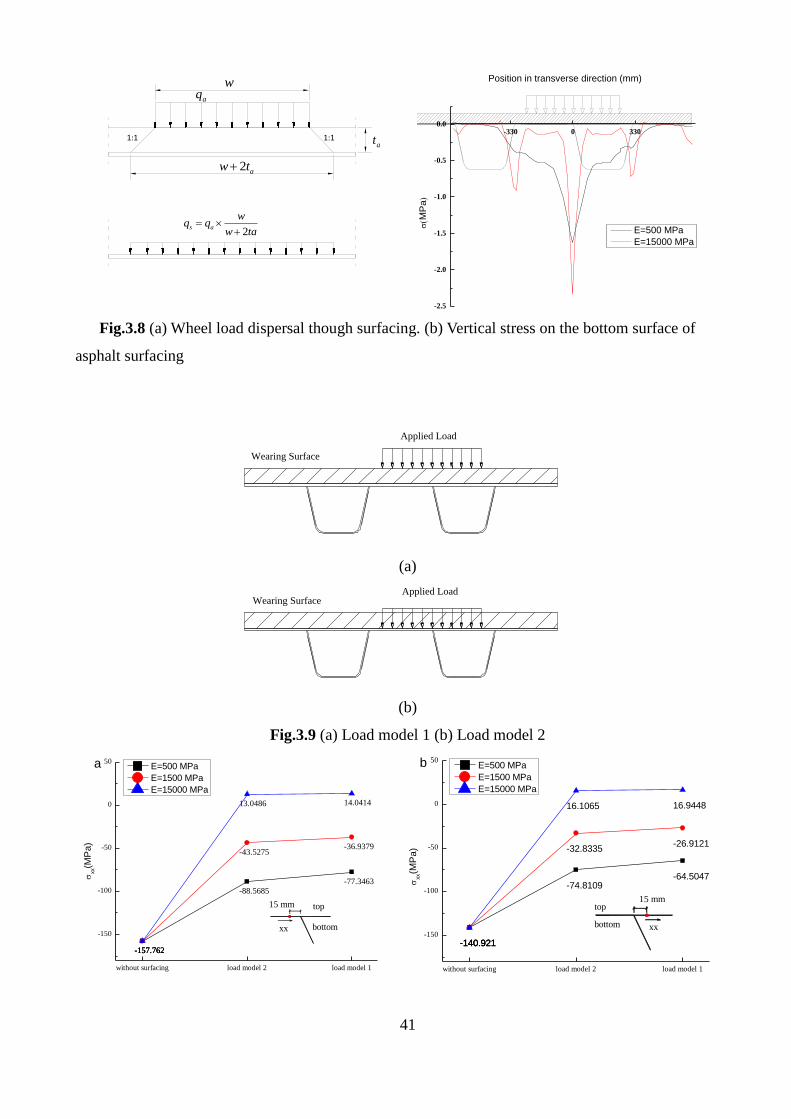
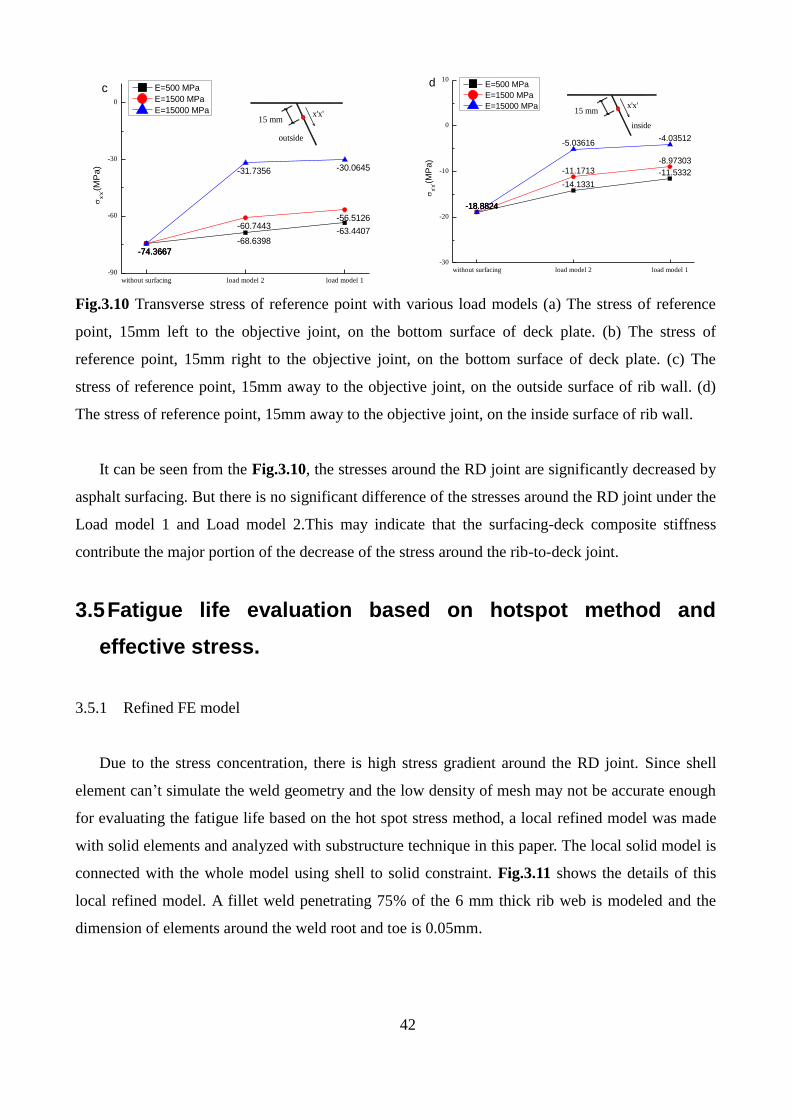
It is generally considered that the stress decrease around the rib-to-deck joint is contributed by
the effect of the load dispersal and the surfacing-deck composite stiffness of asphalt surfacing and
steel deck. In this study, for the purpose to investigate the influence of load dispersal and
surfacing-deck composite stiffness on the stress state around rib-to-deck joint, two load models
were applied: 1. The wheel load was uniformly distributed at the top of the asphalt surfacing. 2. The
wheel load was uniformly distributed on the deck plate without load dispersal. It should be noted
that the stress decrease around the rib-to-deck joint under the load model 2 is contributed only by
the effect of the composite stiffness.
41
1:1 1:1
aq
at
2 aw t
w
2s a
wq q
w ta
-330 0 330
-2.5
-2.0
-1.5
-1.0
-0.5
0.0
(M
Pa)
Position in transverse direction (mm)
E=500 MPa
E=15000 MPa
b
Fig.3.8 (a) Wheel load dispersal though surfacing. (b) Vertical stress on the bottom surface of
asphalt surfacing
Wearing Surface
Applied Load
(a)
Wearing SurfaceApplied Load
(b)
Fig.3.9 (a) Load model 1 (b) Load model 2
without surfacing load model 2 load model 1
-150
-100
-50
0
50
-157.762
-88.5685-77.3463
-157.762
-43.5275-36.9379
-157.762
13.0486 14.0414
xx
15 mm
xx(M
Pa
)
E=500 MPa
E=1500 MPa
E=15000 MPa
bottom
top
a
without surfacing load model 2 load model 1
-150
-100
-50
0
50
-140.921
-74.8109-64.5047
-140.921
-32.8335-26.9121
-140.921
16.1065 16.9448
xx(M
Pa
)
E=500 MPa
E=1500 MPa
E=15000 MPa
15 mmtop
xxbottom
b
42
without surfacing load model 2 load model 1-90
-60
-30
0
-74.3667
-68.6398-63.4407
-74.3667
-60.7443-56.5126
-74.3667
-31.7356 -30.0645
cE
x'x'
x‘x’(M
Pa
)
E=500 MPa
E=1500 MPa
E=15000 MPa15 mm
outside
without surfacing load model 2 load model 1
-30
-20
-10
0
10
-18.8824
-14.1331
-11.5332
-18.8824
-11.1713
-8.97303
-18.8824
-5.03616-4.03512
x‘x’(M
Pa
)
E=500 MPa
E=1500 MPa
E=15000 MPa x'x'15 mm
inside
d
Fig.3.10 Transverse stress of reference point with various load models (a) The stress of reference
point, 15mm left to the objective joint, on the bottom surface of deck plate. (b) The stress of
reference point, 15mm right to the objective joint, on the bottom surface of deck plate. (c) The
stress of reference point, 15mm away to the objective joint, on the outside surface of rib wall. (d)
The stress of reference point, 15mm away to the objective joint, on the inside surface of rib wall.
It can be seen from the Fig.3.10, the stresses around the RD joint are significantly decreased by
asphalt surfacing. But there is no significant difference of the stresses around the RD joint under the
Load model 1 and Load model 2.This may indicate that the surfacing-deck composite stiffness
contribute the major portion of the decrease of the stress around the rib-to-deck joint.
3.5 Fatigue life evaluation based on hotspot method and
effective stress.
3.5.1 Refined FE model
Due to the stress concentration, there is high stress gradient around the RD joint. Since shell
element can’t simulate the weld geometry and the low density of mesh may not be accurate enough
for evaluating the fatigue life based on the hot spot stress method, a local refined model was made
with solid elements and analyzed with substructure technique in this paper. The local solid model is
connected with the whole model using shell to solid constraint. Fig.3.11 shows the details of this
local refined model. A fillet weld penetrating 75% of the 6 mm thick rib web is modeled and the
dimension of elements around the weld root and toe is 0.05mm.
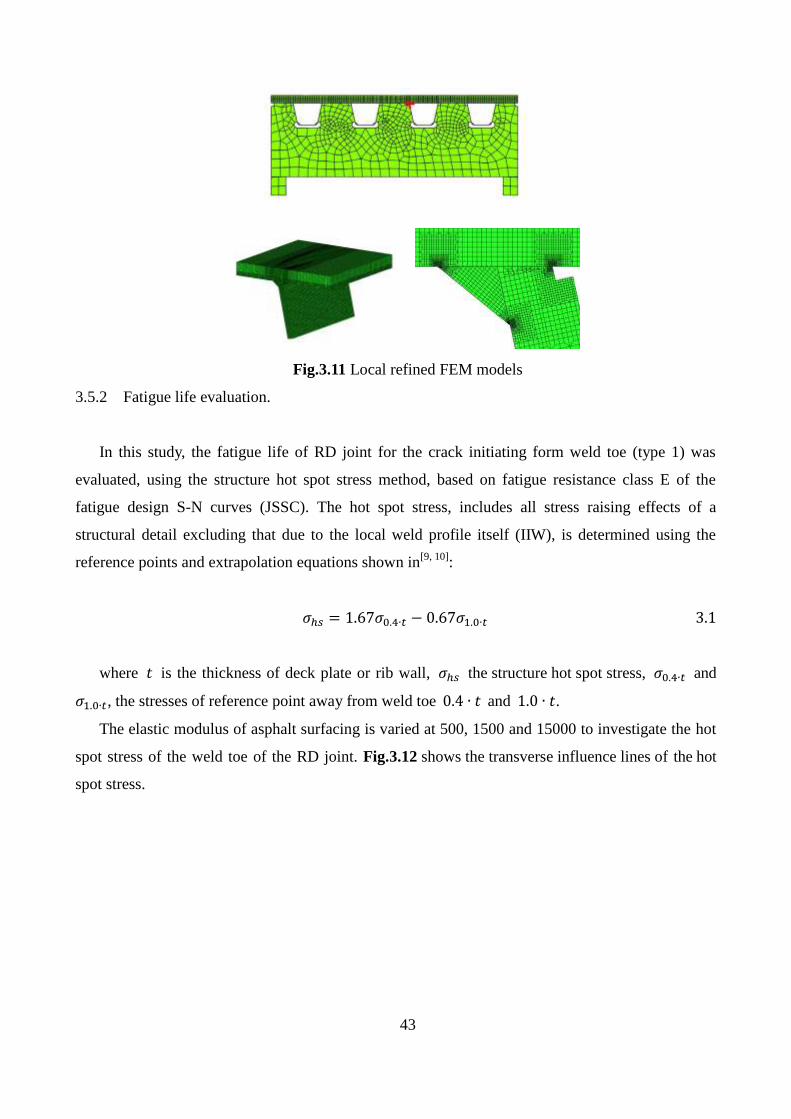
43
Fig.3.11 Local refined FEM models
3.5.2 Fatigue life evaluation.
In this study, the fatigue life of RD joint for the crack initiating form weld toe (type 1) was
evaluated, using the structure hot spot stress method, based on fatigue resistance class E of the
fatigue design S-N curves (JSSC). The hot spot stress, includes all stress raising effects of a
structural detail excluding that due to the local weld profile itself (IIW), is determined using the
reference points and extrapolation equations shown in[9, 10]
:
𝜎ℎ𝑠 = 1.67𝜎0.4∙𝑡 − 0.67𝜎1.0∙𝑡 3.1
where 𝑡 is the thickness of deck plate or rib wall, 𝜎ℎ𝑠 the structure hot spot stress, 𝜎0.4∙𝑡 and
𝜎1.0∙𝑡, the stresses of reference point away from weld toe 0.4 ∙ 𝑡 and 1.0 ∙ 𝑡.
The elastic modulus of asphalt surfacing is varied at 500, 1500 and 15000 to investigate the hot
spot stress of the weld toe of the RD joint. Fig.3.12 shows the transverse influence lines of the hot
spot stress.
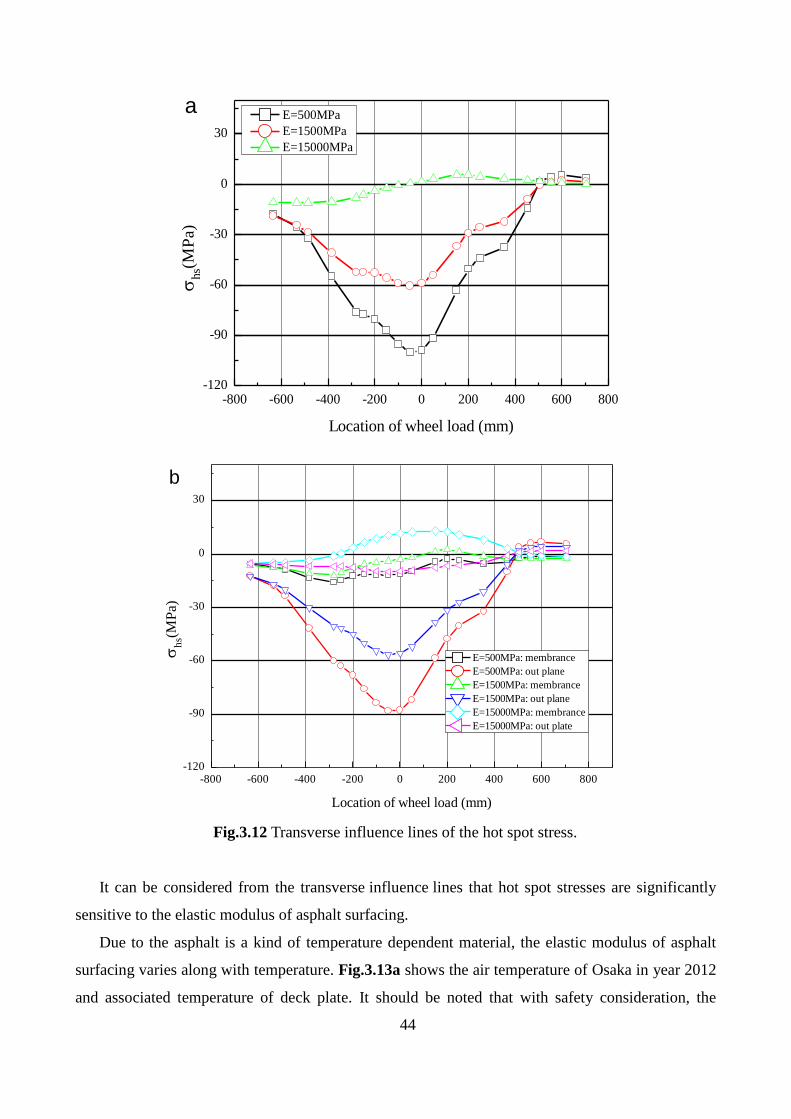
44
-800 -600 -400 -200 0 200 400 600 800-120
-90
-60
-30
0
30
hs(M
Pa)
Location of wheel load (mm)
E=500MPa
E=1500MPa
E=15000MPa
a
-800 -600 -400 -200 0 200 400 600 800-120
-90
-60
-30
0
30
h
s(MP
a)
Location of wheel load (mm)
E=500MPa: membrance
E=500MPa: out plane
E=1500MPa: membrance
E=1500MPa: out plane
E=15000MPa: membrance
E=15000MPa: out plate
b
Fig.3.12 Transverse influence lines of the hot spot stress.
It can be considered from the transverse influence lines that hot spot stresses are significantly
sensitive to the elastic modulus of asphalt surfacing.
Due to the asphalt is a kind of temperature dependent material, the elastic modulus of asphalt
surfacing varies along with temperature. Fig.3.13a shows the air temperature of Osaka in year 2012
and associated temperature of deck plate. It should be noted that with safety consideration, the
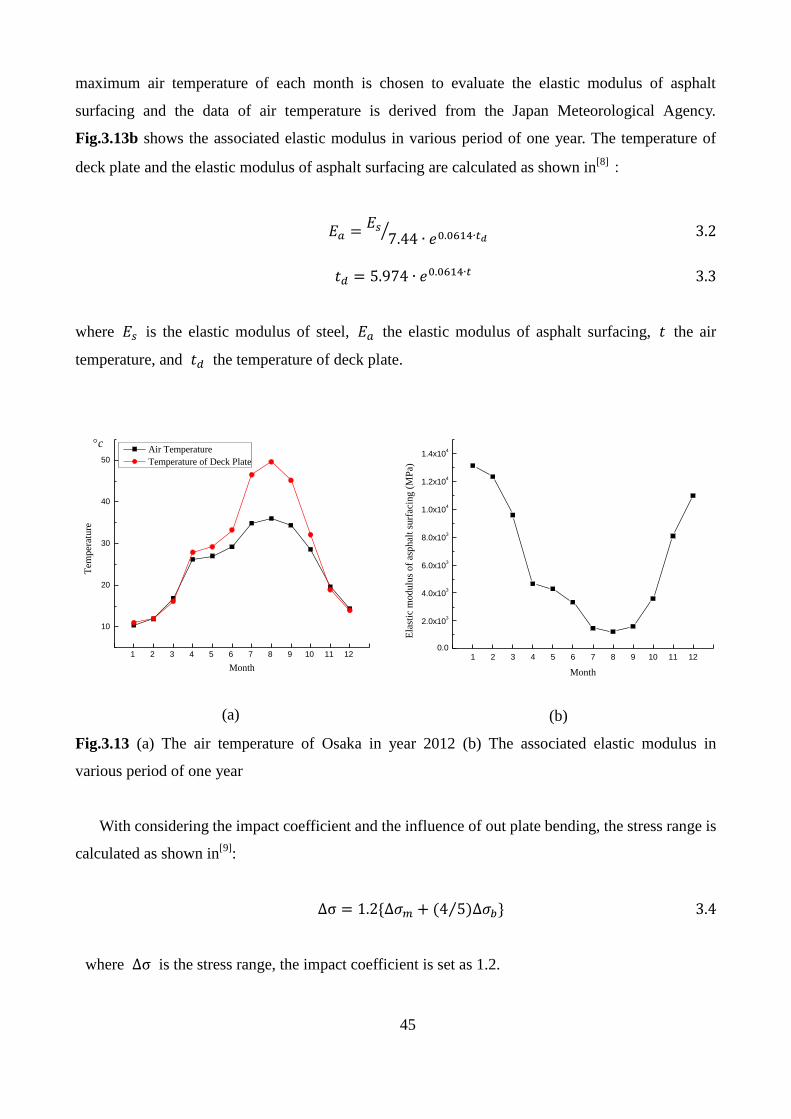
45
maximum air temperature of each month is chosen to evaluate the elastic modulus of asphalt
surfacing and the data of air temperature is derived from the Japan Meteorological Agency.
Fig.3.13b shows the associated elastic modulus in various period of one year. The temperature of
deck plate and the elastic modulus of asphalt surfacing are calculated as shown in[8]:
𝐸𝑎 =𝐸𝑠
7.44 ∙ 𝑒0.0614∙𝑡𝑑⁄ 3.2
𝑡𝑑 = 5.974 ∙ 𝑒0.0614∙𝑡 3.3
where 𝐸𝑠 is the elastic modulus of steel, 𝐸𝑎 the elastic modulus of asphalt surfacing, 𝑡 the air
temperature, and 𝑡𝑑 the temperature of deck plate.
1 2 3 4 5 6 7 8 9 10 11 12
10
20
30
40
50
Tem
per
ature
Month
Air Temperature
Temperature of Deck Plate
c
(a)
1 2 3 4 5 6 7 8 9 10 11 120.0
2.0x10³
4.0x10³
6.0x10³
8.0x10³
1.0x10⁴
1.2x10⁴
1.4x10⁴
Ela
stic
modulu
s of
asphal
t su
rfac
ing (
MP
a)
Month
(b)
Fig.3.13 (a) The air temperature of Osaka in year 2012 (b) The associated elastic modulus in
various period of one year
With considering the impact coefficient and the influence of out plate bending, the stress range is
calculated as shown in[9]
:
∆σ = 1.2{∆𝜎𝑚 + (4 5⁄ )∆𝜎𝑏} 3.4
where ∆σ is the stress range, the impact coefficient is set as 1.2.

46
The out plane bending and the membrane stress and out plane stress are calculated as shown in:
σ𝑚 =𝜎𝐻𝑆𝑆+𝜎𝑢
2, σ𝑏 =
𝜎𝐻𝑆𝑆−𝜎𝑢
2 3.4
where 𝜎𝐻𝑆𝑆 is the hot spot stress, 𝜎𝑢 the relevant stress on the deck up surface or rib wall inner
surface, σ𝑚 the membrane stress, and σ𝑏 the out plane stress.
The scatter in the transverse location of truck wheels is also considered in the fatigue life
evaluation. A normal distribution with a standard deviation of 120mm is assumed for the transverse
location of truck wheels.
The average daily truck traffic (ADTT) of 1500 is assumed on the objective driving paths. The
average daily truck traffic on the transverse location i is 𝐴𝐷𝑇𝑇 ∙ 𝑝𝑖. The daily cumulative fatigue
damage rate is calculated as shown in:
D =𝐴𝐷𝑇𝑇
𝐶0∑ ∆𝜎𝑖
3𝑝𝑖𝑖 3.5
where 𝑝𝑖 is the relative frequency of wheel load locating on the transverse location 𝑖, and 𝐶0 is the
weld class related constant with respect to the average stress influence factor.
The fatigue life is calculated as shown in:
1
∑ 𝐷𝑖∙𝑁𝑖121
3.6
where 𝐷𝑖 is the daily cumulative fatigue damage rate of 𝑖 month, 𝑁𝑖 the number of days of 𝑖
month.
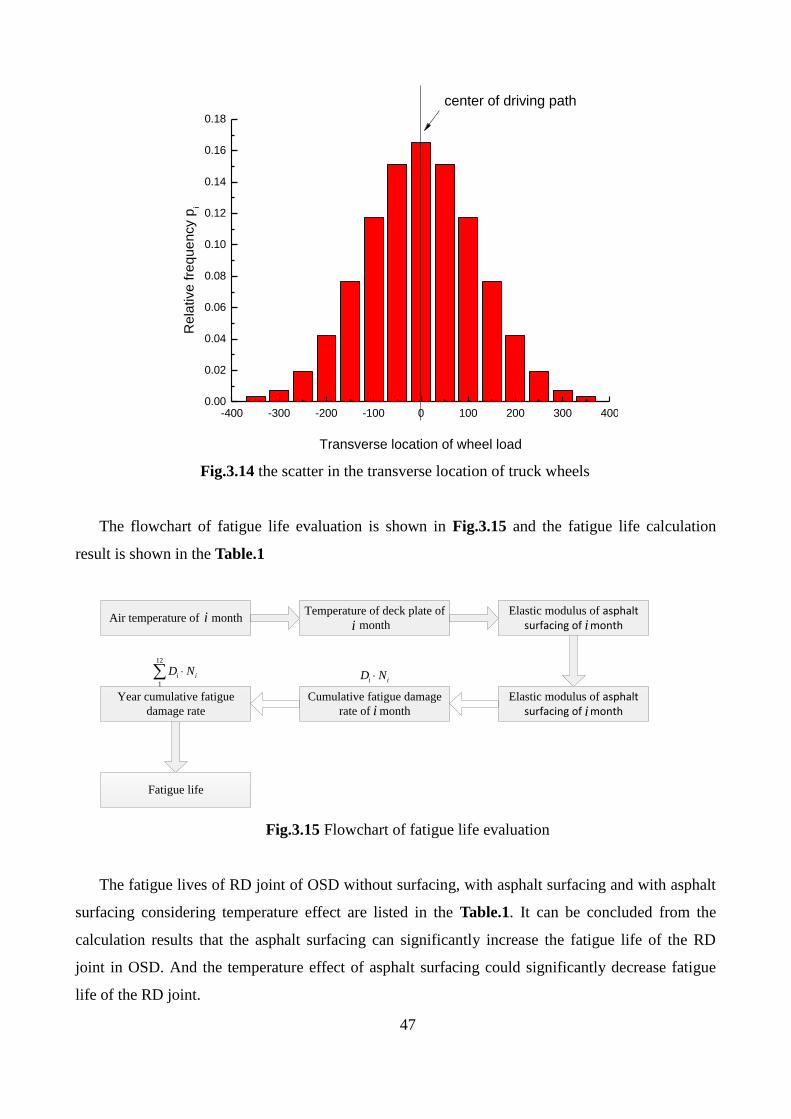
47
-400 -300 -200 -100 0 100 200 300 4000.00
0.02
0.04
0.06
0.08
0.10
0.12
0.14
0.16
0.18
center of driving path
Re
lative
fre
qu
en
cy p
i
Transverse location of wheel load
Fig.3.14 the scatter in the transverse location of truck wheels
The flowchart of fatigue life evaluation is shown in Fig.3.15 and the fatigue life calculation
result is shown in the Table.1
Air temperature of monthTemperature of deck plate of
month
Elastic modulus of asphalt surfacing of month
Elastic modulus of asphalt surfacing of month
Cumulative fatigue damage
rate of month
Year cumulative fatigue
damage rate
Fatigue life
ii i
i i
i iD N
12
1
i iD N
Fig.3.15 Flowchart of fatigue life evaluation
The fatigue lives of RD joint of OSD without surfacing, with asphalt surfacing and with asphalt
surfacing considering temperature effect are listed in the Table.1. It can be concluded from the
calculation results that the asphalt surfacing can significantly increase the fatigue life of the RD
joint in OSD. And the temperature effect of asphalt surfacing could significantly decrease fatigue
life of the RD joint.
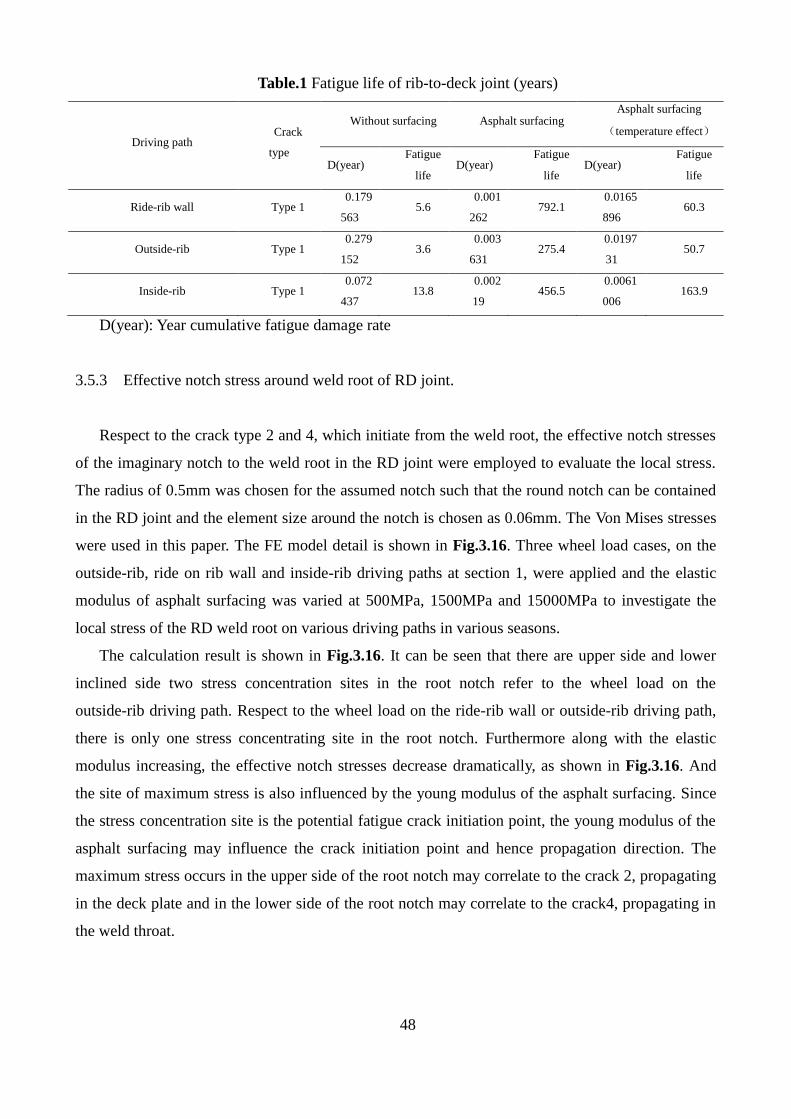
48
Table.1 Fatigue life of rib-to-deck joint (years)
Driving path Crack
type
Without surfacing Asphalt surfacing Asphalt surfacing
(temperature effect)
D(year) Fatigue
D(year) Fatigue
D(year) Fatigue
life life life
Ride-rib wall Type 1 0.179
563 5.6
0.001
262 792.1
0.0165
896 60.3
Outside-rib Type 1 0.279
152 3.6
0.003
631 275.4
0.0197
31 50.7
Inside-rib Type 1 0.072
437 13.8
0.002
19 456.5
0.0061
006 163.9
D(year): Year cumulative fatigue damage rate
3.5.3 Effective notch stress around weld root of RD joint.
Respect to the crack type 2 and 4, which initiate from the weld root, the effective notch stresses
of the imaginary notch to the weld root in the RD joint were employed to evaluate the local stress.
The radius of 0.5mm was chosen for the assumed notch such that the round notch can be contained
in the RD joint and the element size around the notch is chosen as 0.06mm. The Von Mises stresses
were used in this paper. The FE model detail is shown in Fig.3.16. Three wheel load cases, on the
outside-rib, ride on rib wall and inside-rib driving paths at section 1, were applied and the elastic
modulus of asphalt surfacing was varied at 500MPa, 1500MPa and 15000MPa to investigate the
local stress of the RD weld root on various driving paths in various seasons.
The calculation result is shown in Fig.3.16. It can be seen that there are upper side and lower
inclined side two stress concentration sites in the root notch refer to the wheel load on the
outside-rib driving path. Respect to the wheel load on the ride-rib wall or outside-rib driving path,
there is only one stress concentrating site in the root notch. Furthermore along with the elastic
modulus increasing, the effective notch stresses decrease dramatically, as shown in Fig.3.16. And
the site of maximum stress is also influenced by the young modulus of the asphalt surfacing. Since
the stress concentration site is the potential fatigue crack initiation point, the young modulus of the
asphalt surfacing may influence the crack initiation point and hence propagation direction. The
maximum stress occurs in the upper side of the root notch may correlate to the crack 2, propagating
in the deck plate and in the lower side of the root notch may correlate to the crack4, propagating in
the weld throat.
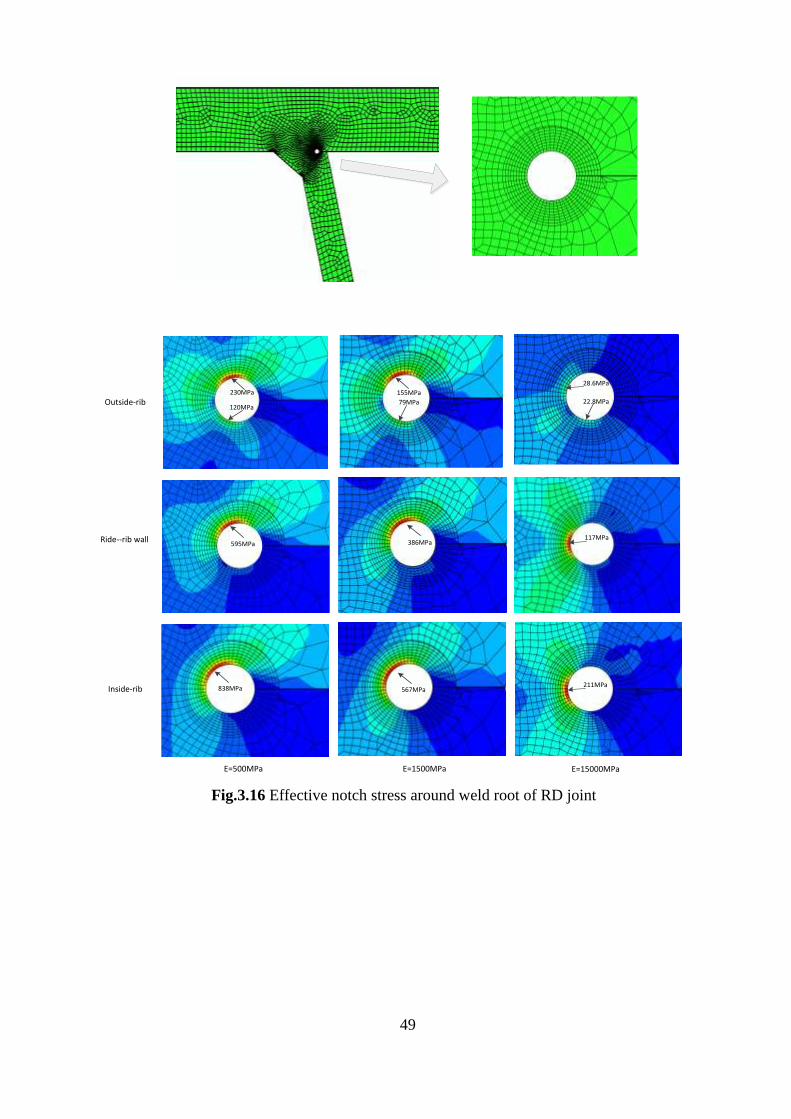
49
117MPa
28.6MPa
22.8MPa
211MPa
230MPa
120MPaOutside-rib
595MPa
838MPa
155MPa
79MPa
386MPa
567MPa
Ride--rib wall
Inside-rib
E=500MPa E=1500MPa E=15000MPa
Fig.3.16 Effective notch stress around weld root of RD joint
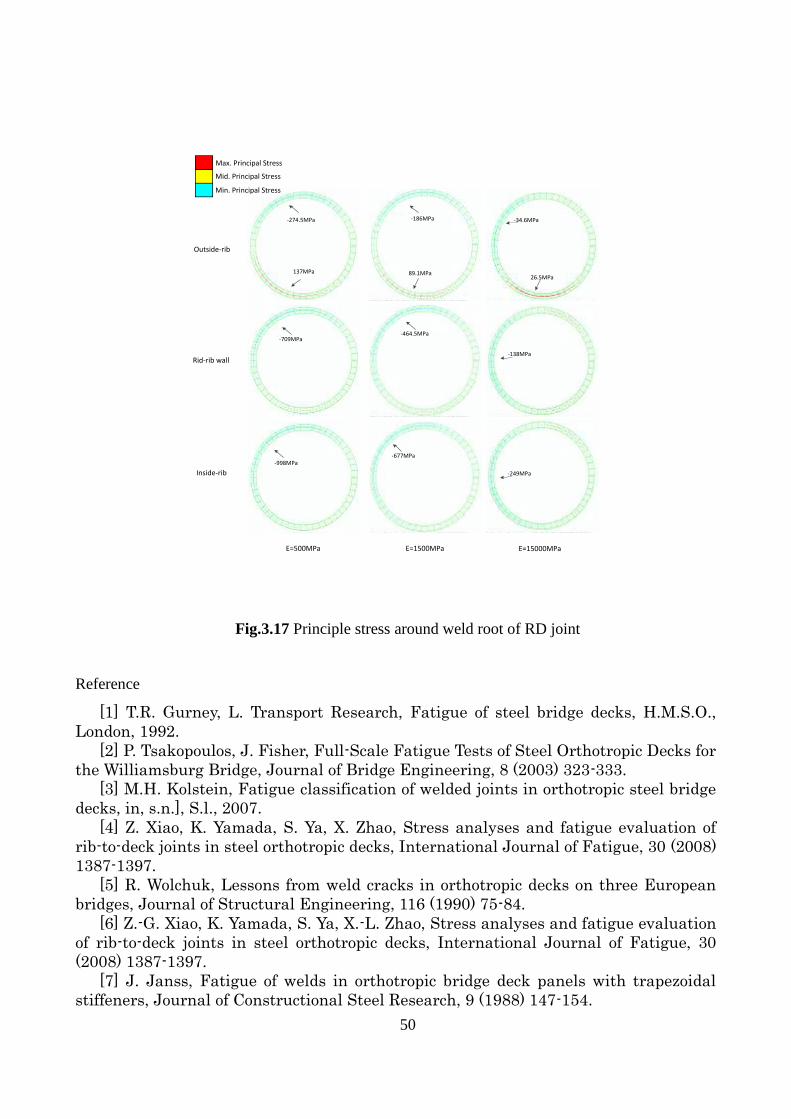
50
Outside-rib
Rid-rib wall
Inside-rib
-274.5MPa
137MPa
-709MPa
-998MPa
-186MPa
89.1MPa
-464.5MPa
-677MPa
-34.6MPa
26.5MPa
-138MPa
-249MPa
E=500MPa E=1500MPa E=15000MPa
Max. Principal Stress
Mid. Principal Stress
Min. Principal Stress
Fig.3.17 Principle stress around weld root of RD joint
Reference
[1] T.R. Gurney, L. Transport Research, Fatigue of steel bridge decks, H.M.S.O.,
London, 1992.
[2] P. Tsakopoulos, J. Fisher, Full-Scale Fatigue Tests of Steel Orthotropic Decks for
the Williamsburg Bridge, Journal of Bridge Engineering, 8 (2003) 323-333.
[3] M.H. Kolstein, Fatigue classification of welded joints in orthotropic steel bridge
decks, in, s.n.], S.l., 2007.
[4] Z. Xiao, K. Yamada, S. Ya, X. Zhao, Stress analyses and fatigue evaluation of
rib-to-deck joints in steel orthotropic decks, International Journal of Fatigue, 30 (2008)
1387-1397.
[5] R. Wolchuk, Lessons from weld cracks in orthotropic decks on three European
bridges, Journal of Structural Engineering, 116 (1990) 75-84.
[6] Z.-G. Xiao, K. Yamada, S. Ya, X.-L. Zhao, Stress analyses and fatigue evaluation
of rib-to-deck joints in steel orthotropic decks, International Journal of Fatigue, 30
(2008) 1387-1397.
[7] J. Janss, Fatigue of welds in orthotropic bridge deck panels with trapezoidal
stiffeners, Journal of Constructional Steel Research, 9 (1988) 147-154.

51
[8] S. Inokuchi, H. Ishii, T. Ishigaki, H. Maeno, T. Sumi, K. Yamada, Fatigue
assessment for weld between deck plate and u-rib in orthotropic steel decks with
consideration of pavement properties, Journal of Structural Mechanics and
Earthquake Engineering, 66 (2010) 79-91.
[9] J.S.o.S.C. (JSSC), Fatigue design recommendations for steel structures and
commentary, Gihodo Publishing, 1993.
[10] A. Hobbacher, Recommendations for fatigue design of welded joints and
components, Welding Research Council Shaker Heights, OH, 2009.

52
CHAPTER 4
Fatigue Test of Rib-to-Deck Joint
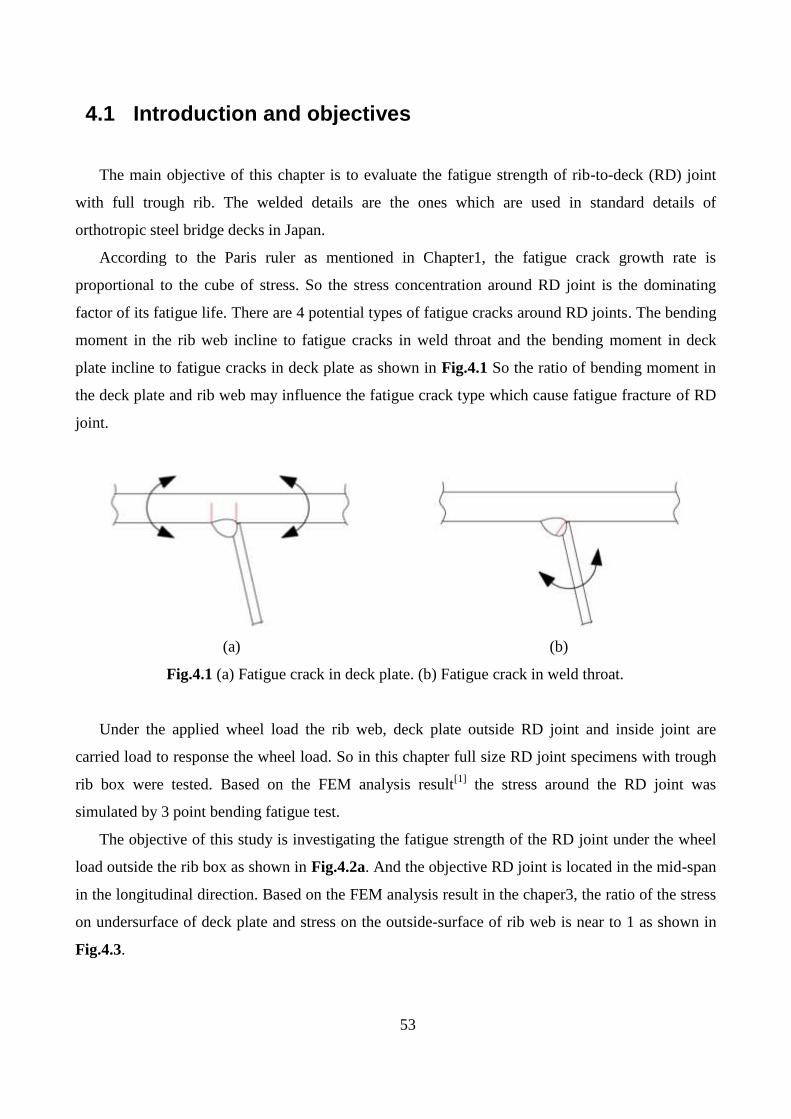
53
4.1 Introduction and objectives
The main objective of this chapter is to evaluate the fatigue strength of rib-to-deck (RD) joint
with full trough rib. The welded details are the ones which are used in standard details of
orthotropic steel bridge decks in Japan.
According to the Paris ruler as mentioned in Chapter1, the fatigue crack growth rate is
proportional to the cube of stress. So the stress concentration around RD joint is the dominating
factor of its fatigue life. There are 4 potential types of fatigue cracks around RD joints. The bending
moment in the rib web incline to fatigue cracks in weld throat and the bending moment in deck
plate incline to fatigue cracks in deck plate as shown in Fig.4.1 So the ratio of bending moment in
the deck plate and rib web may influence the fatigue crack type which cause fatigue fracture of RD
joint.
(a)
(b)
Fig.4.1 (a) Fatigue crack in deck plate. (b) Fatigue crack in weld throat.
Under the applied wheel load the rib web, deck plate outside RD joint and inside joint are
carried load to response the wheel load. So in this chapter full size RD joint specimens with trough
rib box were tested. Based on the FEM analysis result[1]
the stress around the RD joint was
simulated by 3 point bending fatigue test.
The objective of this study is investigating the fatigue strength of the RD joint under the wheel
load outside the rib box as shown in Fig.4.2a. And the objective RD joint is located in the mid-span
in the longitudinal direction. Based on the FEM analysis result in the chaper3, the ratio of the stress
on undersurface of deck plate and stress on the outside-surface of rib web is near to 1 as shown in
Fig.4.3.
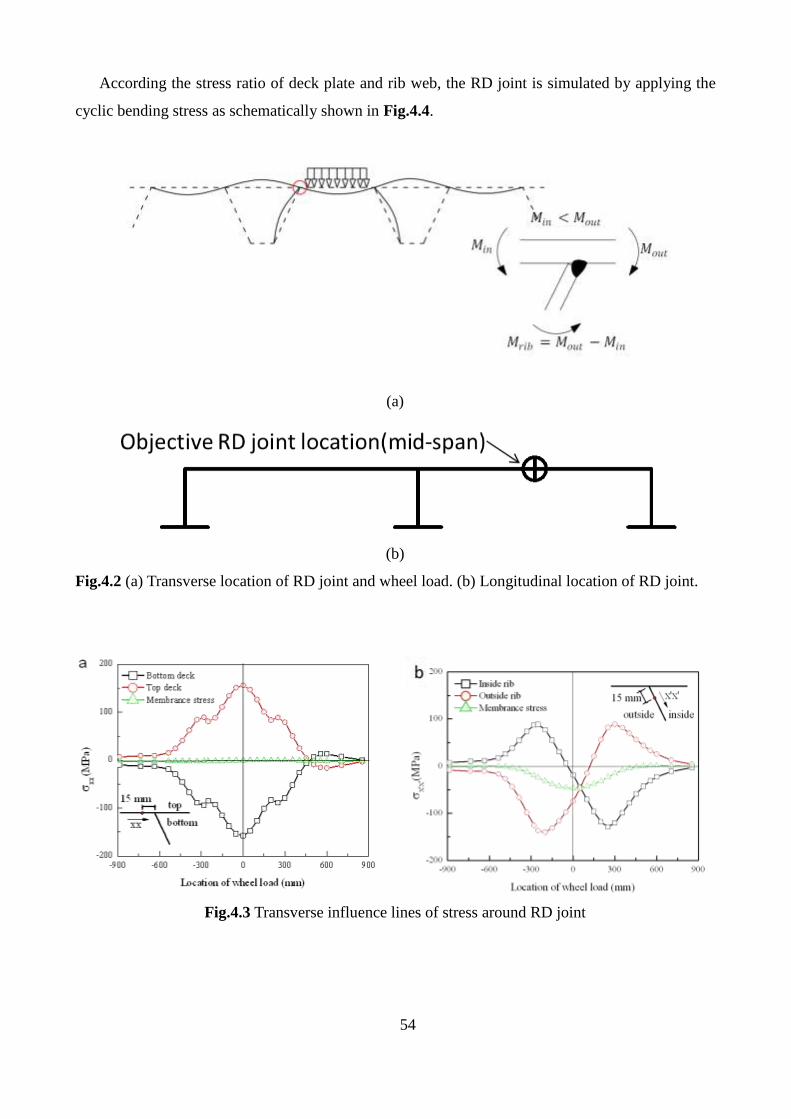
54
According the stress ratio of deck plate and rib web, the RD joint is simulated by applying the
cyclic bending stress as schematically shown in Fig.4.4.
(a)
(b)
Fig.4.2 (a) Transverse location of RD joint and wheel load. (b) Longitudinal location of RD joint.
Fig.4.3 Transverse influence lines of stress around RD joint
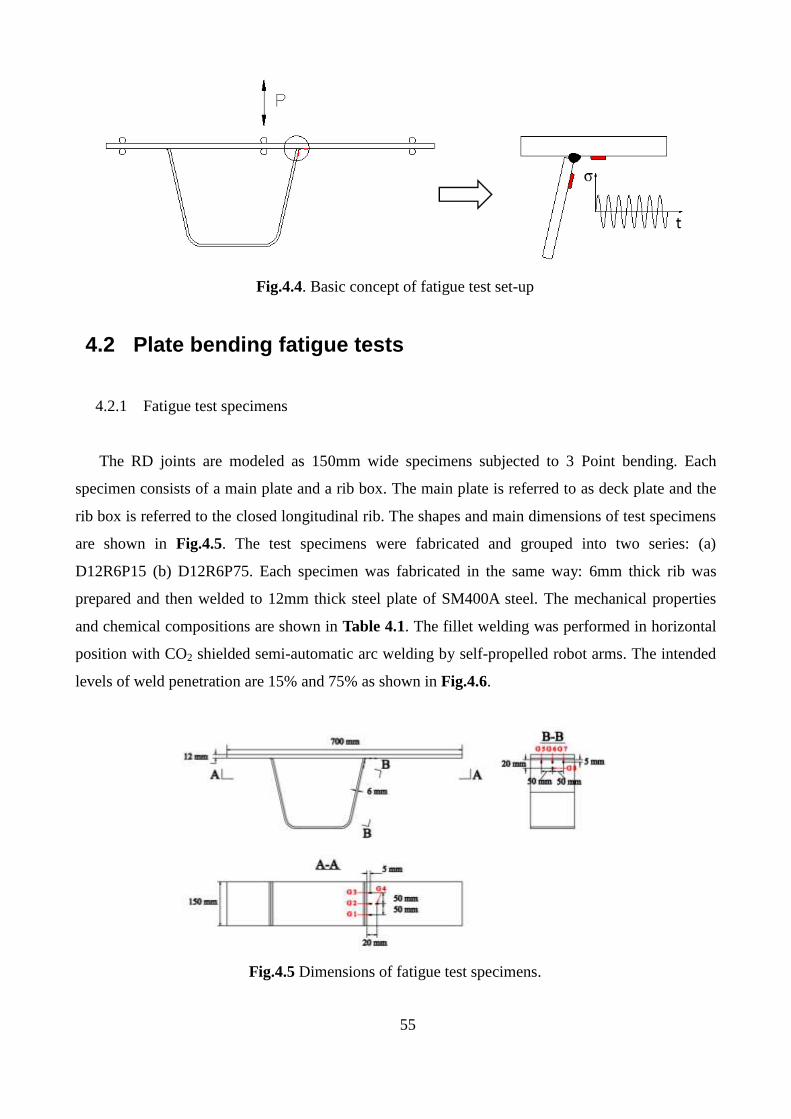
55
Fig.4.4. Basic concept of fatigue test set-up
4.2 Plate bending fatigue tests
4.2.1 Fatigue test specimens
The RD joints are modeled as 150mm wide specimens subjected to 3 Point bending. Each
specimen consists of a main plate and a rib box. The main plate is referred to as deck plate and the
rib box is referred to the closed longitudinal rib. The shapes and main dimensions of test specimens
are shown in Fig.4.5. The test specimens were fabricated and grouped into two series: (a)
D12R6P15 (b) D12R6P75. Each specimen was fabricated in the same way: 6mm thick rib was
prepared and then welded to 12mm thick steel plate of SM400A steel. The mechanical properties
and chemical compositions are shown in Table 4.1. The fillet welding was performed in horizontal
position with CO2 shielded semi-automatic arc welding by self-propelled robot arms. The intended
levels of weld penetration are 15% and 75% as shown in Fig.4.6.
Fig.4.5 Dimensions of fatigue test specimens.
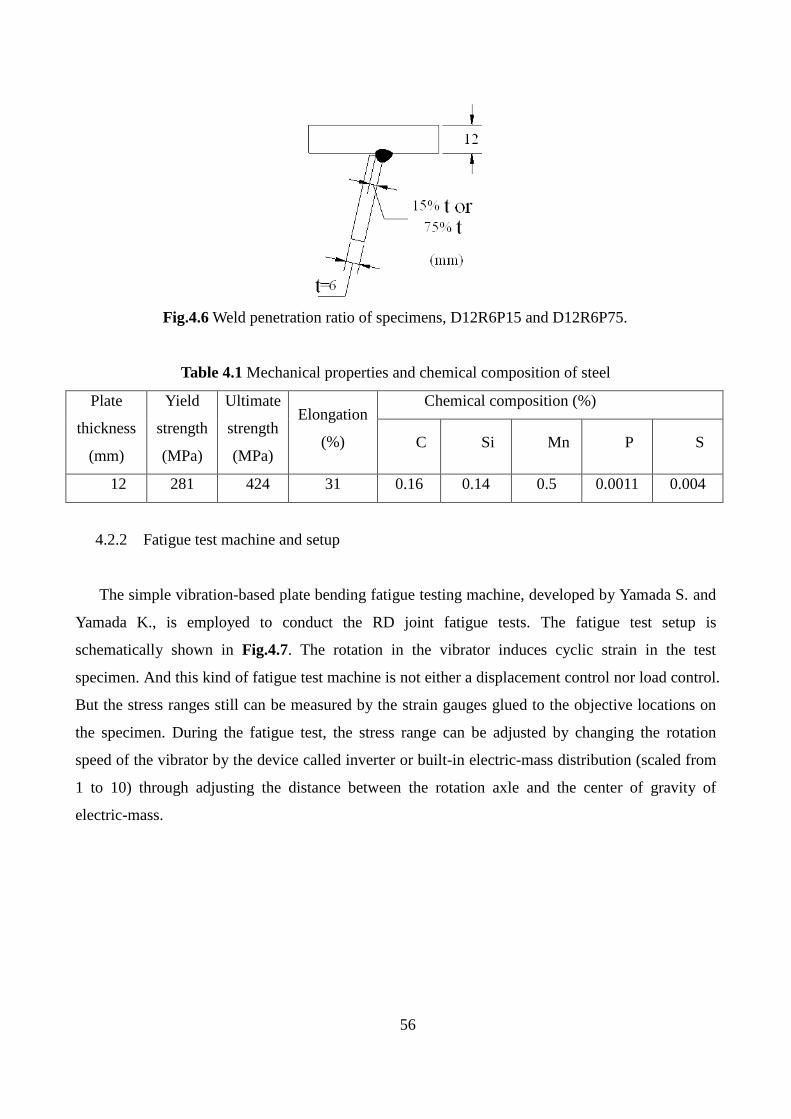
56
Fig.4.6 Weld penetration ratio of specimens, D12R6P15 and D12R6P75.
Table 4.1 Mechanical properties and chemical composition of steel
Plate
thickness
(mm)
Yield
strength
(MPa)
Ultimate
strength
(MPa)
Elongation
(%)
Chemical composition (%)
C Si Mn P S
12 281 424 31 0.16 0.14 0.5 0.0011 0.004
4.2.2 Fatigue test machine and setup
The simple vibration-based plate bending fatigue testing machine, developed by Yamada S. and
Yamada K., is employed to conduct the RD joint fatigue tests. The fatigue test setup is
schematically shown in Fig.4.7. The rotation in the vibrator induces cyclic strain in the test
specimen. And this kind of fatigue test machine is not either a displacement control nor load control.
But the stress ranges still can be measured by the strain gauges glued to the objective locations on
the specimen. During the fatigue test, the stress range can be adjusted by changing the rotation
speed of the vibrator by the device called inverter or built-in electric-mass distribution (scaled from
1 to 10) through adjusting the distance between the rotation axle and the center of gravity of
electric-mass.
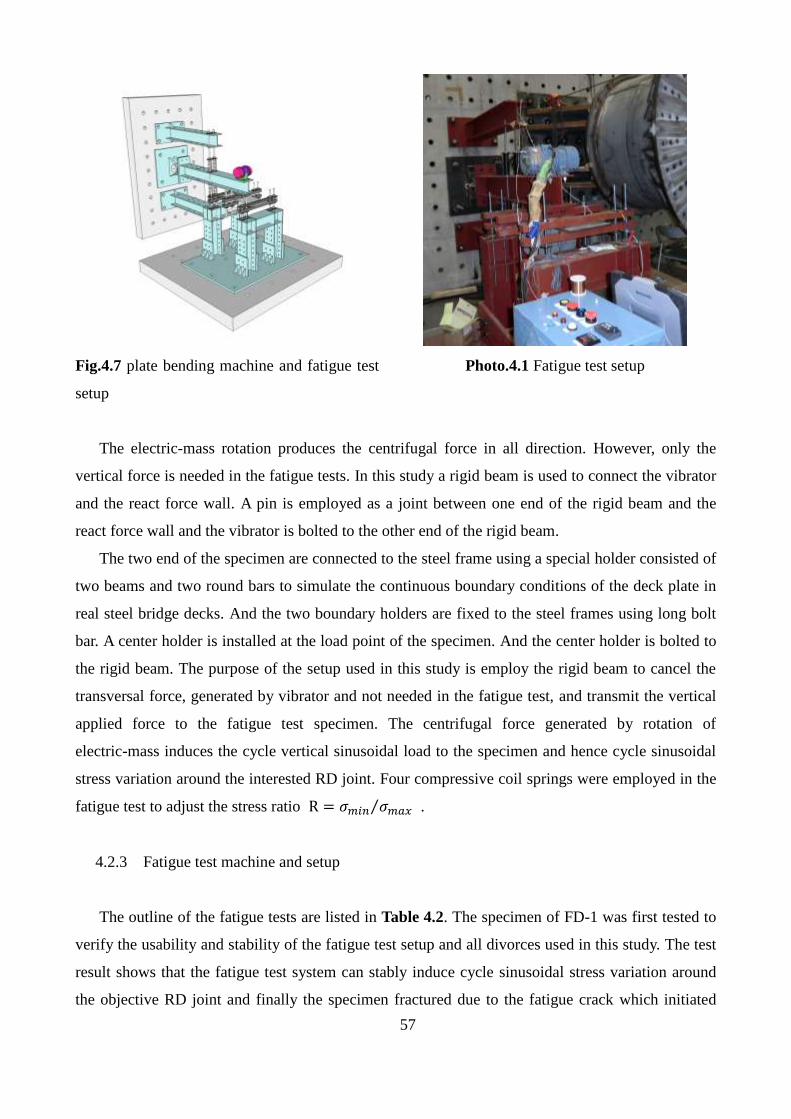
57
Fig.4.7 plate bending machine and fatigue test
setup
Photo.4.1 Fatigue test setup
The electric-mass rotation produces the centrifugal force in all direction. However, only the
vertical force is needed in the fatigue tests. In this study a rigid beam is used to connect the vibrator
and the react force wall. A pin is employed as a joint between one end of the rigid beam and the
react force wall and the vibrator is bolted to the other end of the rigid beam.
The two end of the specimen are connected to the steel frame using a special holder consisted of
two beams and two round bars to simulate the continuous boundary conditions of the deck plate in
real steel bridge decks. And the two boundary holders are fixed to the steel frames using long bolt
bar. A center holder is installed at the load point of the specimen. And the center holder is bolted to
the rigid beam. The purpose of the setup used in this study is employ the rigid beam to cancel the
transversal force, generated by vibrator and not needed in the fatigue test, and transmit the vertical
applied force to the fatigue test specimen. The centrifugal force generated by rotation of
electric-mass induces the cycle vertical sinusoidal load to the specimen and hence cycle sinusoidal
stress variation around the interested RD joint. Four compressive coil springs were employed in the
fatigue test to adjust the stress ratio R = 𝜎𝑚𝑖𝑛 𝜎𝑚𝑎𝑥⁄ .
4.2.3 Fatigue test machine and setup
The outline of the fatigue tests are listed in Table 4.2. The specimen of FD-1 was first tested to
verify the usability and stability of the fatigue test setup and all divorces used in this study. The test
result shows that the fatigue test system can stably induce cycle sinusoidal stress variation around
the objective RD joint and finally the specimen fractured due to the fatigue crack which initiated
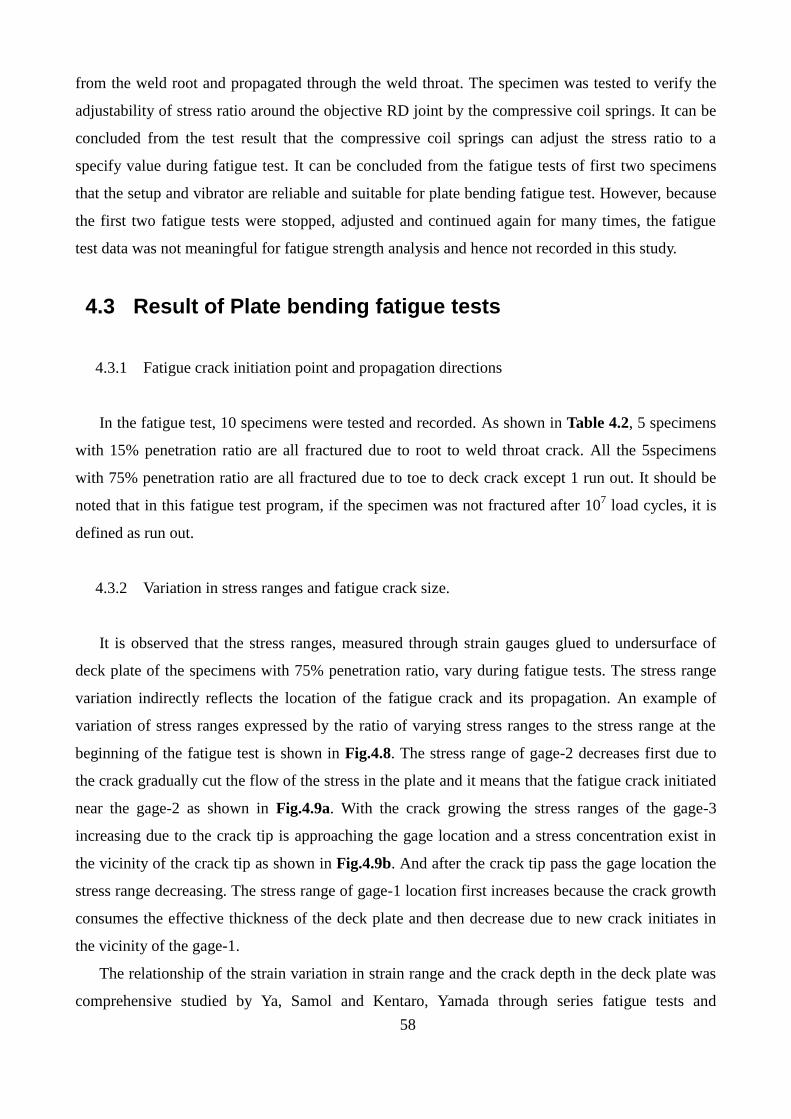
58
from the weld root and propagated through the weld throat. The specimen was tested to verify the
adjustability of stress ratio around the objective RD joint by the compressive coil springs. It can be
concluded from the test result that the compressive coil springs can adjust the stress ratio to a
specify value during fatigue test. It can be concluded from the fatigue tests of first two specimens
that the setup and vibrator are reliable and suitable for plate bending fatigue test. However, because
the first two fatigue tests were stopped, adjusted and continued again for many times, the fatigue
test data was not meaningful for fatigue strength analysis and hence not recorded in this study.
4.3 Result of Plate bending fatigue tests
4.3.1 Fatigue crack initiation point and propagation directions
In the fatigue test, 10 specimens were tested and recorded. As shown in Table 4.2, 5 specimens
with 15% penetration ratio are all fractured due to root to weld throat crack. All the 5specimens
with 75% penetration ratio are all fractured due to toe to deck crack except 1 run out. It should be
noted that in this fatigue test program, if the specimen was not fractured after 107 load cycles, it is
defined as run out.
4.3.2 Variation in stress ranges and fatigue crack size.
It is observed that the stress ranges, measured through strain gauges glued to undersurface of
deck plate of the specimens with 75% penetration ratio, vary during fatigue tests. The stress range
variation indirectly reflects the location of the fatigue crack and its propagation. An example of
variation of stress ranges expressed by the ratio of varying stress ranges to the stress range at the
beginning of the fatigue test is shown in Fig.4.8. The stress range of gage-2 decreases first due to
the crack gradually cut the flow of the stress in the plate and it means that the fatigue crack initiated
near the gage-2 as shown in Fig.4.9a. With the crack growing the stress ranges of the gage-3
increasing due to the crack tip is approaching the gage location and a stress concentration exist in
the vicinity of the crack tip as shown in Fig.4.9b. And after the crack tip pass the gage location the
stress range decreasing. The stress range of gage-1 location first increases because the crack growth
consumes the effective thickness of the deck plate and then decrease due to new crack initiates in
the vicinity of the gage-1.
The relationship of the strain variation in strain range and the crack depth in the deck plate was
comprehensive studied by Ya, Samol and Kentaro, Yamada through series fatigue tests and
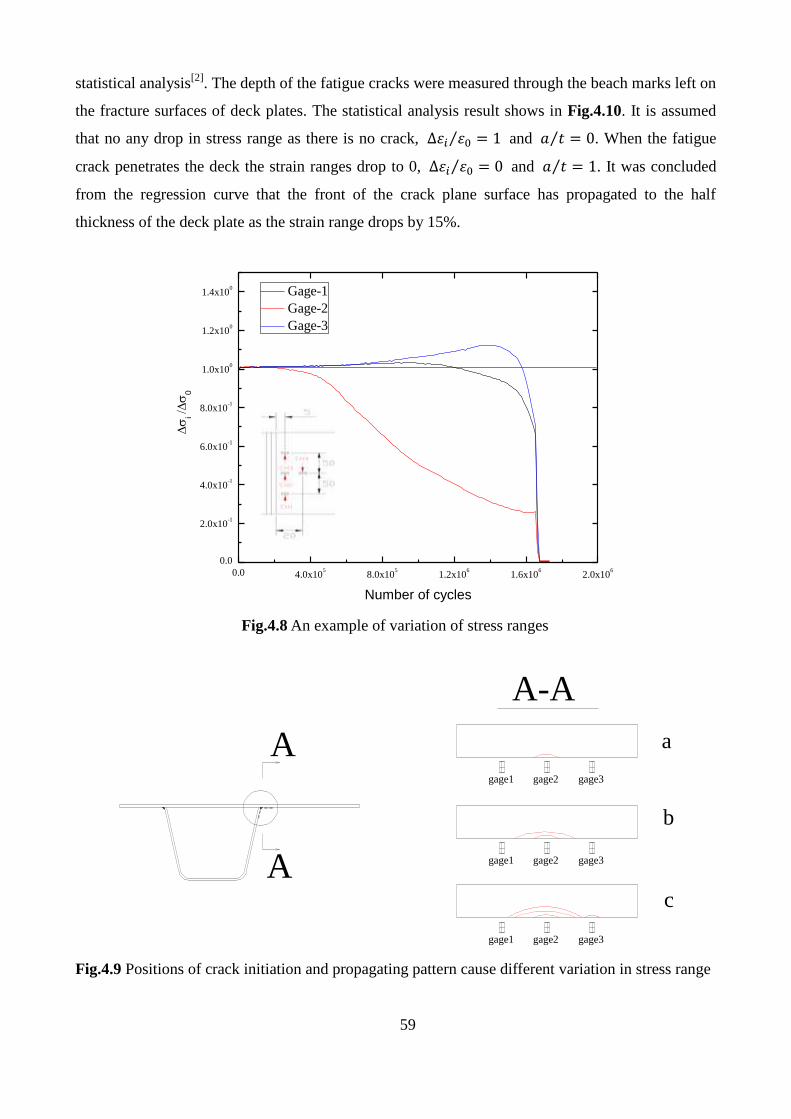
59
statistical analysis[2]
. The depth of the fatigue cracks were measured through the beach marks left on
the fracture surfaces of deck plates. The statistical analysis result shows in Fig.4.10. It is assumed
that no any drop in stress range as there is no crack, ∆𝜀𝑖 𝜀0 = 1⁄ and 𝑎 𝑡⁄ = 0. When the fatigue
crack penetrates the deck the strain ranges drop to 0, ∆𝜀𝑖 𝜀0 = 0⁄ and 𝑎 𝑡⁄ = 1. It was concluded
from the regression curve that the front of the crack plane surface has propagated to the half
thickness of the deck plate as the strain range drops by 15%.
Fig.4.8 An example of variation of stress ranges
Fig.4.9 Positions of crack initiation and propagating pattern cause different variation in stress range
0.0 4.0x10⁵
8.0x10⁵
1.2x10⁶
1.6x10⁶
2.0x10⁶
0.0
2.0x10⁻¹
4.0x10⁻¹
6.0x10⁻¹
8.0x10⁻¹
1.0x100
1.2x100
1.4x100
i
0
Number of cycles
Gage-1
Gage-2
Gage-3
A
A
A-A
gage1 gage2 gage3
gage1 gage2 gage3
gage1 gage2 gage3
a
b
c
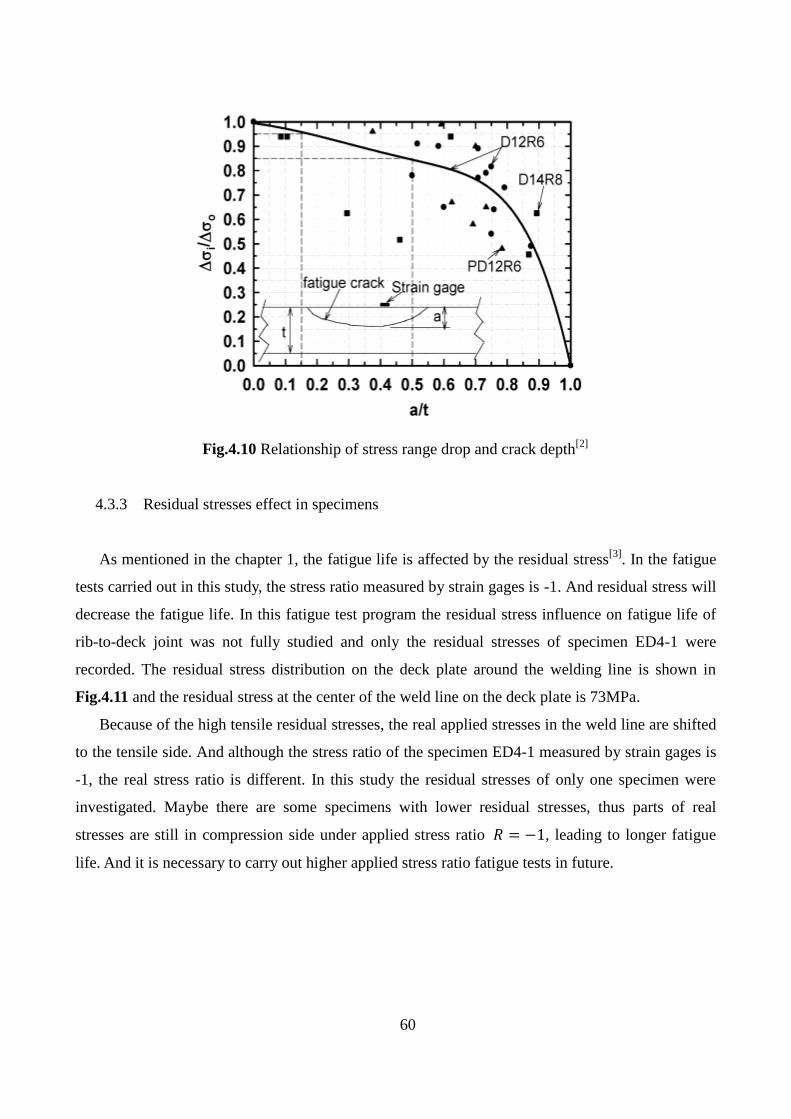
60
Fig.4.10 Relationship of stress range drop and crack depth[2]
4.3.3 Residual stresses effect in specimens
As mentioned in the chapter 1, the fatigue life is affected by the residual stress[3]
. In the fatigue
tests carried out in this study, the stress ratio measured by strain gages is -1. And residual stress will
decrease the fatigue life. In this fatigue test program the residual stress influence on fatigue life of
rib-to-deck joint was not fully studied and only the residual stresses of specimen ED4-1 were
recorded. The residual stress distribution on the deck plate around the welding line is shown in
Fig.4.11 and the residual stress at the center of the weld line on the deck plate is 73MPa.
Because of the high tensile residual stresses, the real applied stresses in the weld line are shifted
to the tensile side. And although the stress ratio of the specimen ED4-1 measured by strain gages is
-1, the real stress ratio is different. In this study the residual stresses of only one specimen were
investigated. Maybe there are some specimens with lower residual stresses, thus parts of real
stresses are still in compression side under applied stress ratio 𝑅 = −1, leading to longer fatigue
life. And it is necessary to carry out higher applied stress ratio fatigue tests in future.
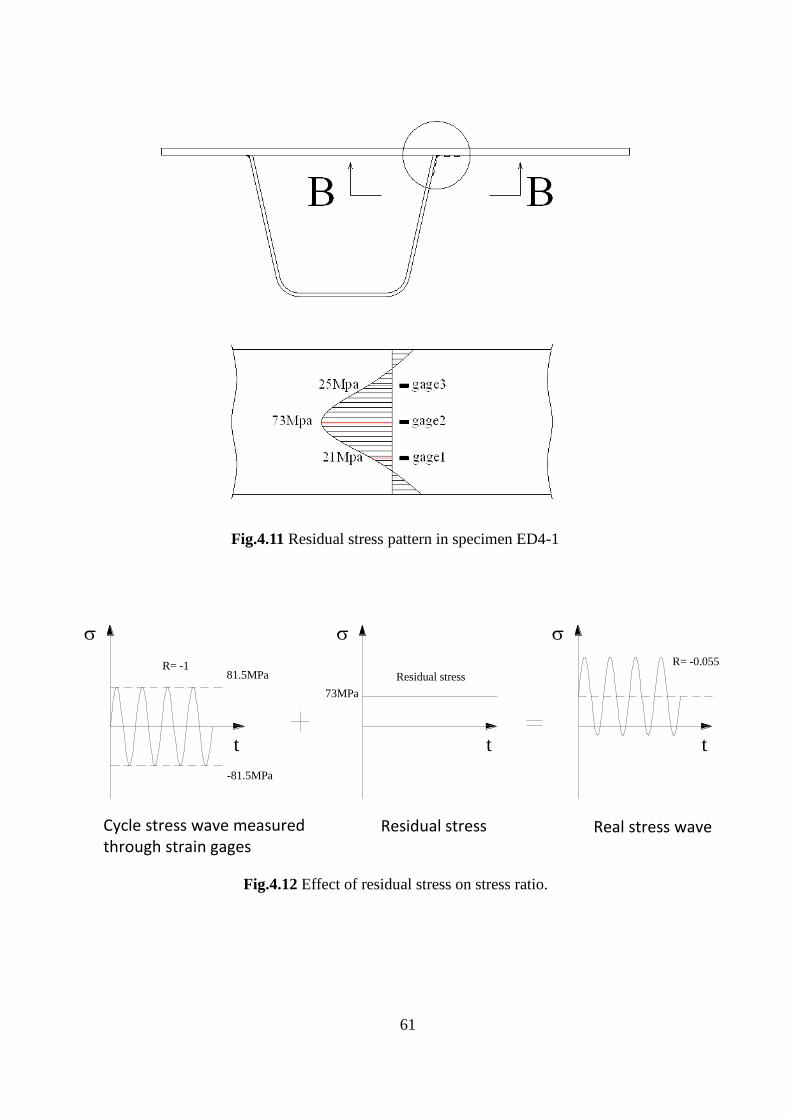
61
Fig.4.11 Residual stress pattern in specimen ED4-1
Fig.4.12 Effect of residual stress on stress ratio.
73MPa
R= -181.5MPa
-81.5MPa
Residual stress
t t t
R= -0.055
Cycle stress wave measuredthrough strain gages
Residual stress Real stress wave
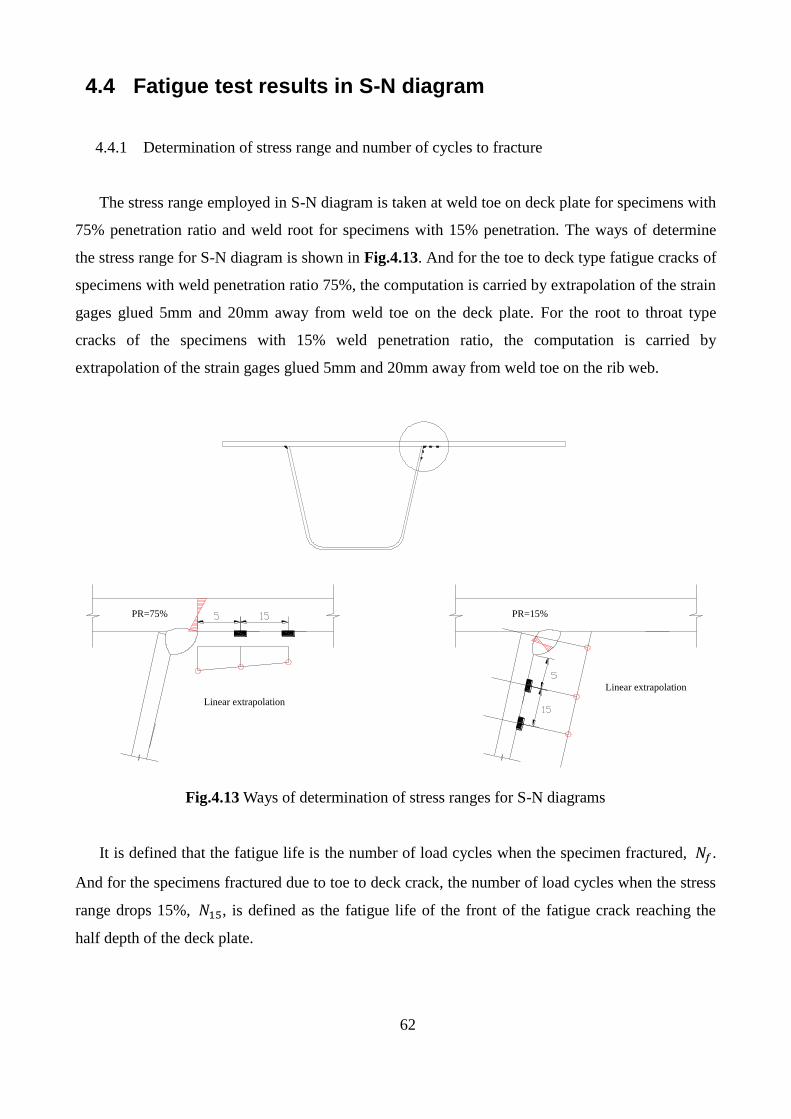
62
4.4 Fatigue test results in S-N diagram
4.4.1 Determination of stress range and number of cycles to fracture
The stress range employed in S-N diagram is taken at weld toe on deck plate for specimens with
75% penetration ratio and weld root for specimens with 15% penetration. The ways of determine
the stress range for S-N diagram is shown in Fig.4.13. And for the toe to deck type fatigue cracks of
specimens with weld penetration ratio 75%, the computation is carried by extrapolation of the strain
gages glued 5mm and 20mm away from weld toe on the deck plate. For the root to throat type
cracks of the specimens with 15% weld penetration ratio, the computation is carried by
extrapolation of the strain gages glued 5mm and 20mm away from weld toe on the rib web.
Fig.4.13 Ways of determination of stress ranges for S-N diagrams
It is defined that the fatigue life is the number of load cycles when the specimen fractured, 𝑁𝑓.
And for the specimens fractured due to toe to deck crack, the number of load cycles when the stress
range drops 15%, 𝑁15, is defined as the fatigue life of the front of the fatigue crack reaching the
half depth of the deck plate.
PR=75% PR=15%
Linear extrapolation
Linear extrapolation
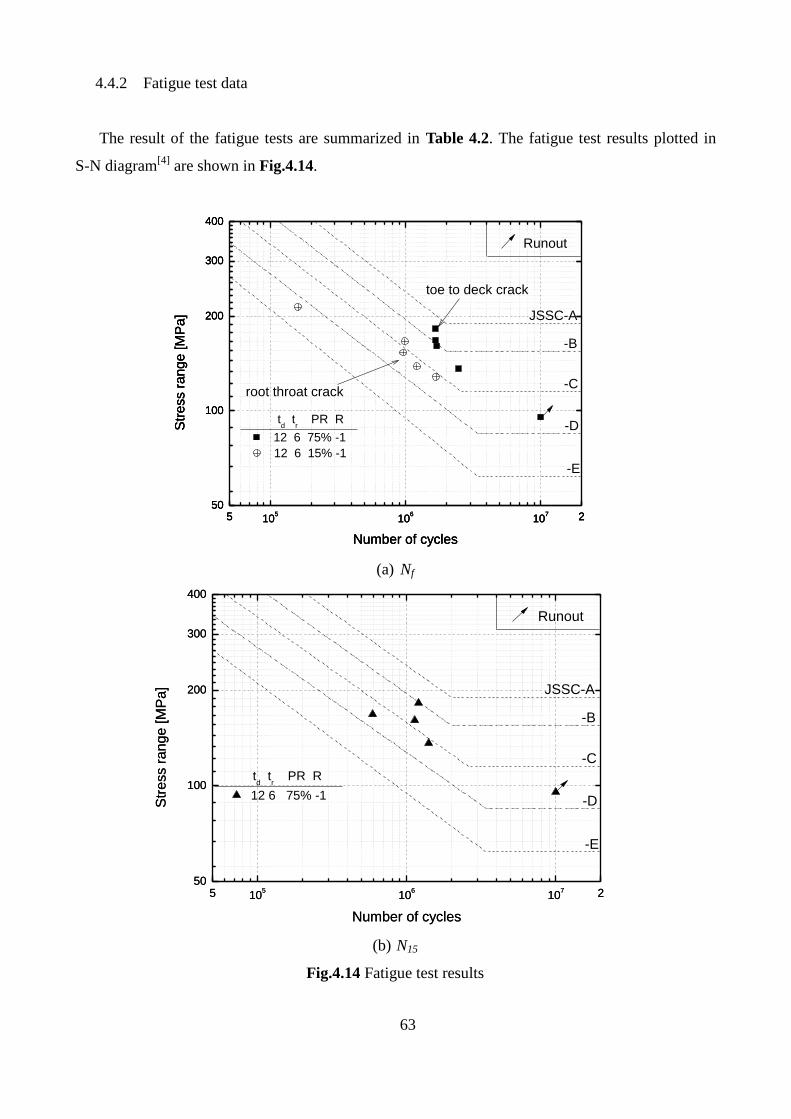
63
4.4.2 Fatigue test data
The result of the fatigue tests are summarized in Table 4.2. The fatigue test results plotted in
S-N diagram[4]
are shown in Fig.4.14.
(a) Nf
(b) N15
Fig.4.14 Fatigue test results
5 105
106
107 2
50
100
200
300
400
5 105
106
107 2
50
100
200
300
400
5 105
106
107 2
50
100
200
300
400
Runout
-E
-D
-C
-B
JSSC-A
Str
ess r
an
ge
[M
Pa
]
Number of cycles
td t
r PR R
12 6 75% -1
Str
ess r
an
ge
[M
Pa
]
Number of cycles
root throat crack
12 6 15% -1
Str
ess r
an
ge
[M
Pa
]
Number of cycles
toe to deck crack
5 105
106
107 2
50
100
200
300
400
5 105
106
107 2
50
100
200
300
400
Runout
-E
-D
-C
-B
JSSC-A
Str
ess r
an
ge
[M
Pa
]
Number of cycles
12 6 75% -1
Str
ess r
an
ge
[M
Pa
]
Number of cycles
td t
r PR R
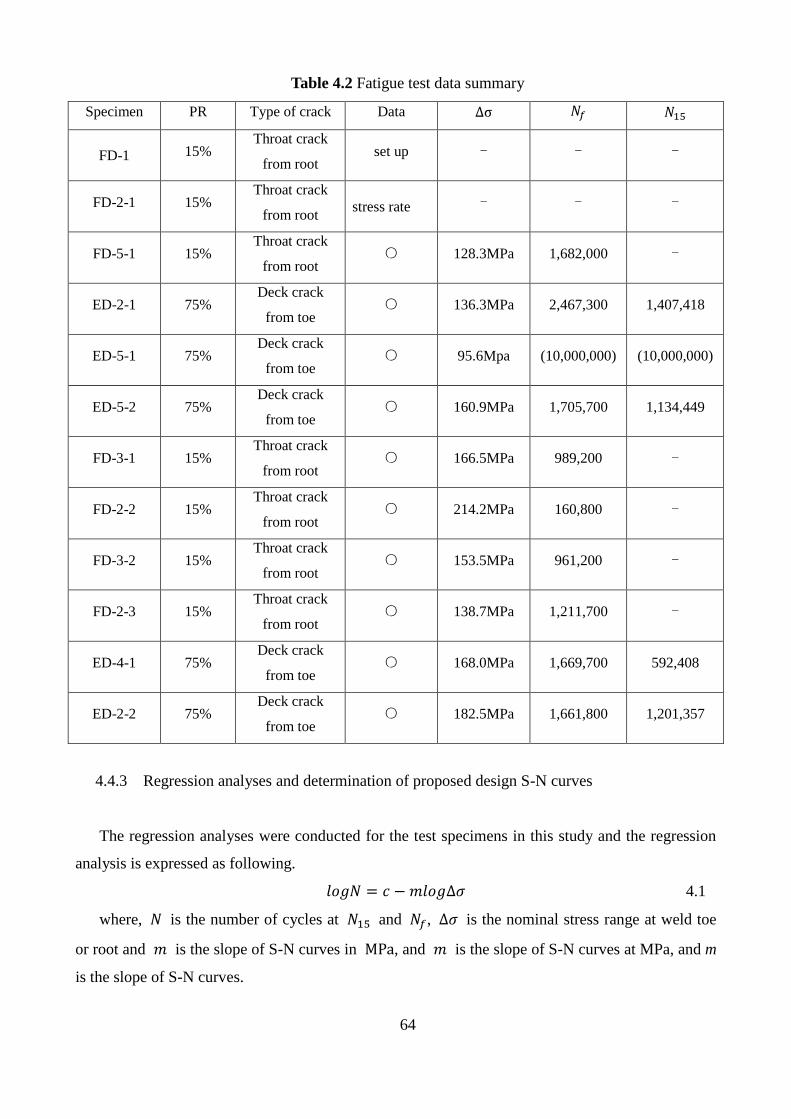
64
Table 4.2 Fatigue test data summary
Specimen PR Type of crack Data ∆σ 𝑁𝑓 𝑁15
FD-1 15% Throat crack
from root set up - - -
FD-2-1 15% Throat crack
from root stress rate - - -
FD-5-1 15% Throat crack
from root ○ 128.3MPa 1,682,000 -
ED-2-1 75% Deck crack
from toe ○ 136.3MPa 2,467,300 1,407,418
ED-5-1 75% Deck crack
from toe ○ 95.6Mpa (10,000,000) (10,000,000)
ED-5-2 75% Deck crack
from toe ○ 160.9MPa 1,705,700 1,134,449
FD-3-1 15% Throat crack
from root ○ 166.5MPa 989,200 -
FD-2-2 15% Throat crack
from root ○ 214.2MPa 160,800 -
FD-3-2 15% Throat crack
from root ○ 153.5MPa 961,200 -
FD-2-3 15% Throat crack
from root ○ 138.7MPa 1,211,700 -
ED-4-1 75% Deck crack
from toe ○ 168.0MPa 1,669,700 592,408
ED-2-2 75% Deck crack
from toe ○ 182.5MPa 1,661,800 1,201,357
4.4.3 Regression analyses and determination of proposed design S-N curves
The regression analyses were conducted for the test specimens in this study and the regression
analysis is expressed as following.
𝑙𝑜𝑔𝑁 = 𝑐 −𝑚𝑙𝑜𝑔∆𝜎 4.1
where, 𝑁 is the number of cycles at 𝑁15 and 𝑁𝑓, ∆𝜎 is the nominal stress range at weld toe
or root and 𝑚 is the slope of S-N curves in MPa, and 𝑚 is the slope of S-N curves at MPa, and m
is the slope of S-N curves.
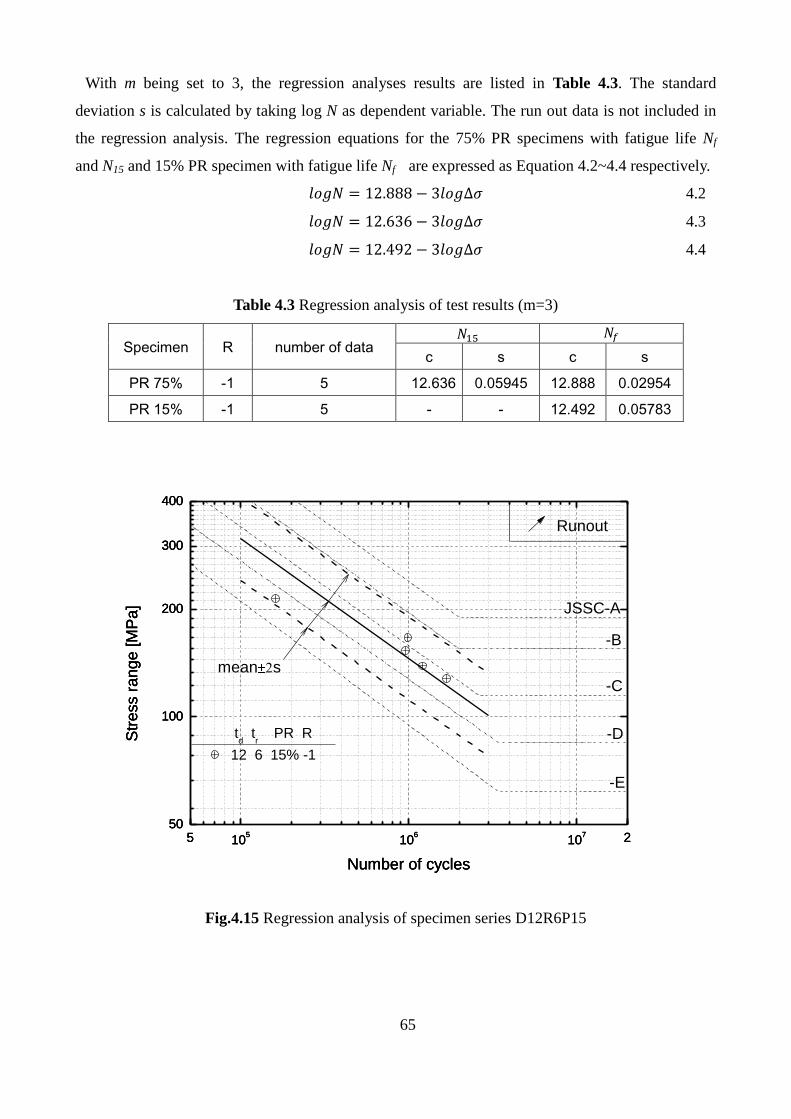
65
With m being set to 3, the regression analyses results are listed in Table 4.3. The standard
deviation s is calculated by taking log N as dependent variable. The run out data is not included in
the regression analysis. The regression equations for the 75% PR specimens with fatigue life Nf
and N15 and 15% PR specimen with fatigue life Nf are expressed as Equation 4.2~4.4 respectively.
𝑙𝑜𝑔𝑁 = 12.888 − 3𝑙𝑜𝑔∆𝜎 4.2
𝑙𝑜𝑔𝑁 = 12.636 − 3𝑙𝑜𝑔∆𝜎 4.3
𝑙𝑜𝑔𝑁 = 12.492 − 3𝑙𝑜𝑔∆𝜎 4.4
Table 4.3 Regression analysis of test results (m=3)
Specimen R number of data 𝑁15 𝑁𝑓
c s c s
PR 75% -1 5 12.636 0.05945 12.888 0.02954
PR 15% -1 5 - - 12.492 0.05783
Fig.4.15 Regression analysis of specimen series D12R6P15
5 105
106
107 2
50
100
200
300
400
5 105
106
107 2
50
100
200
300
400
5 105
106
107 2
50
100
200
300
400
Runout
-E
-D
-C
-B
JSSC-A
Str
ess r
an
ge
[M
Pa
]
Number of cycles
12 6 15% -1
Str
ess r
an
ge
[M
Pa
]
Number of cycles
td t
r PR R
mean s
Str
ess r
an
ge
[M
Pa
]
Number of cycles
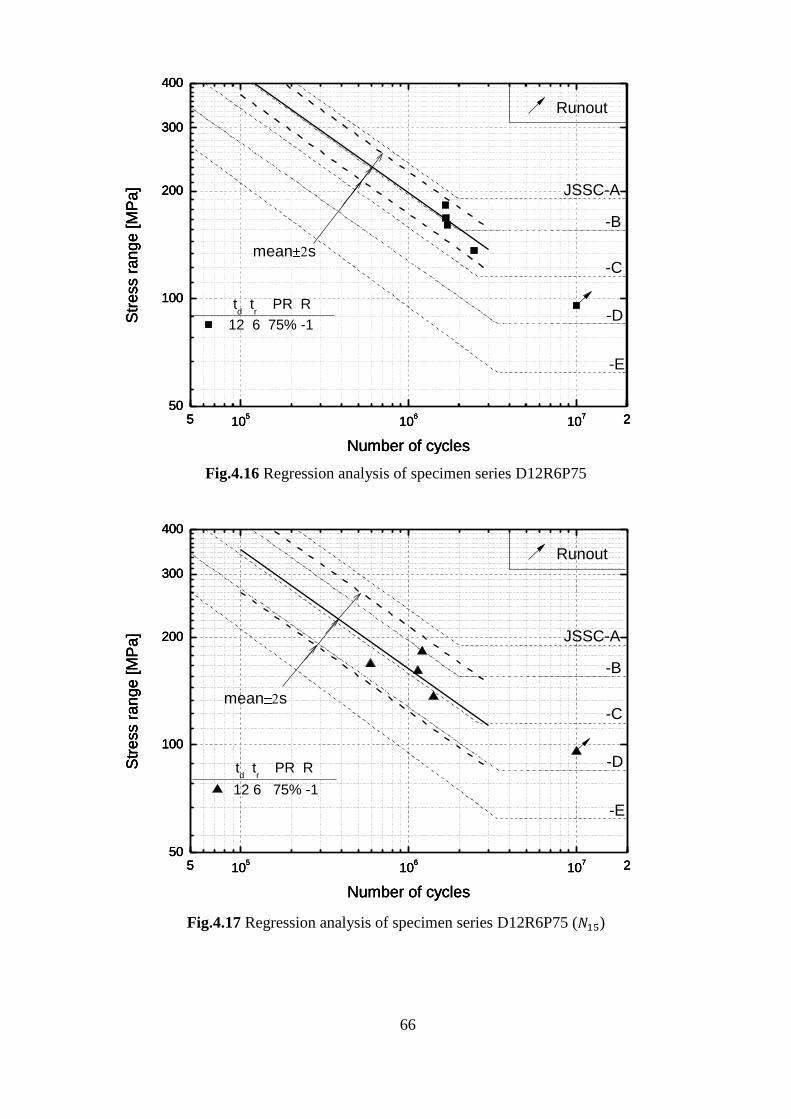
66
Fig.4.16 Regression analysis of specimen series D12R6P75
Fig.4.17 Regression analysis of specimen series D12R6P75 (𝑁15)
5 105
106
107 2
50
100
200
300
400
5 105
106
107 2
50
100
200
300
400
5 105
106
107 2
50
100
200
300
400
Runout
-E
-D
-C
-B
JSSC-A
Str
ess r
an
ge
[M
Pa
]
Number of cycles
td t
r PR R
12 6 75% -1Str
ess r
an
ge
[M
Pa
]
Number of cycles
mean s
Str
ess r
an
ge
[M
Pa
]
Number of cycles
5 105
106
107 2
50
100
200
300
400
5 105
106
107 2
50
100
200
300
400
5 105
106
107 2
50
100
200
300
400
mean s
Str
ess r
an
ge
[M
Pa
]
Number of cycles
Runout
-E
-D
-C
-B
JSSC-A
Str
ess r
an
ge
[M
Pa
]
Number of cycles
12 6 75% -1
Str
ess r
an
ge
[M
Pa
]
Number of cycles
td t
r PR R
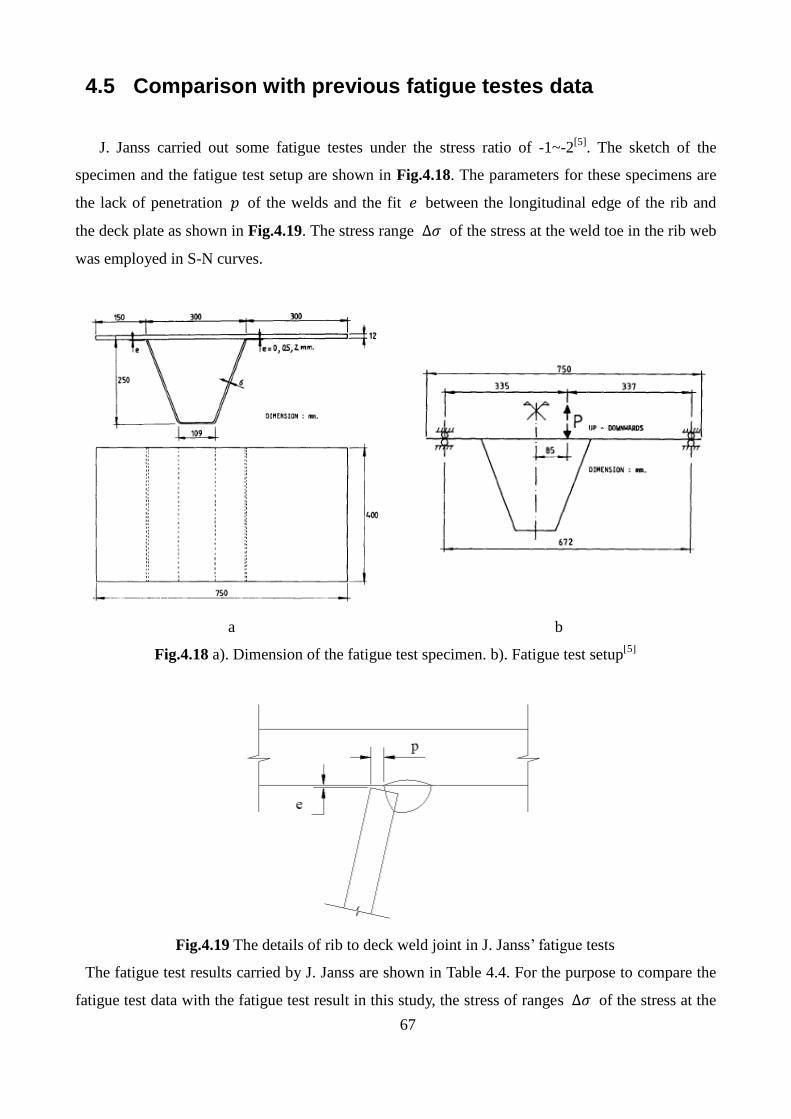
67
4.5 Comparison with previous fatigue testes data
J. Janss carried out some fatigue testes under the stress ratio of -1~-2[5]
. The sketch of the
specimen and the fatigue test setup are shown in Fig.4.18. The parameters for these specimens are
the lack of penetration 𝑝 of the welds and the fit 𝑒 between the longitudinal edge of the rib and
the deck plate as shown in Fig.4.19. The stress range ∆𝜎 of the stress at the weld toe in the rib web
was employed in S-N curves.
a b
Fig.4.18 a). Dimension of the fatigue test specimen. b). Fatigue test setup[5]
Fig.4.19 The details of rib to deck weld joint in J. Janss’ fatigue tests
The fatigue test results carried by J. Janss are shown in Table 4.4. For the purpose to compare the
fatigue test data with the fatigue test result in this study, the stress of ranges ∆𝜎 of the stress at the
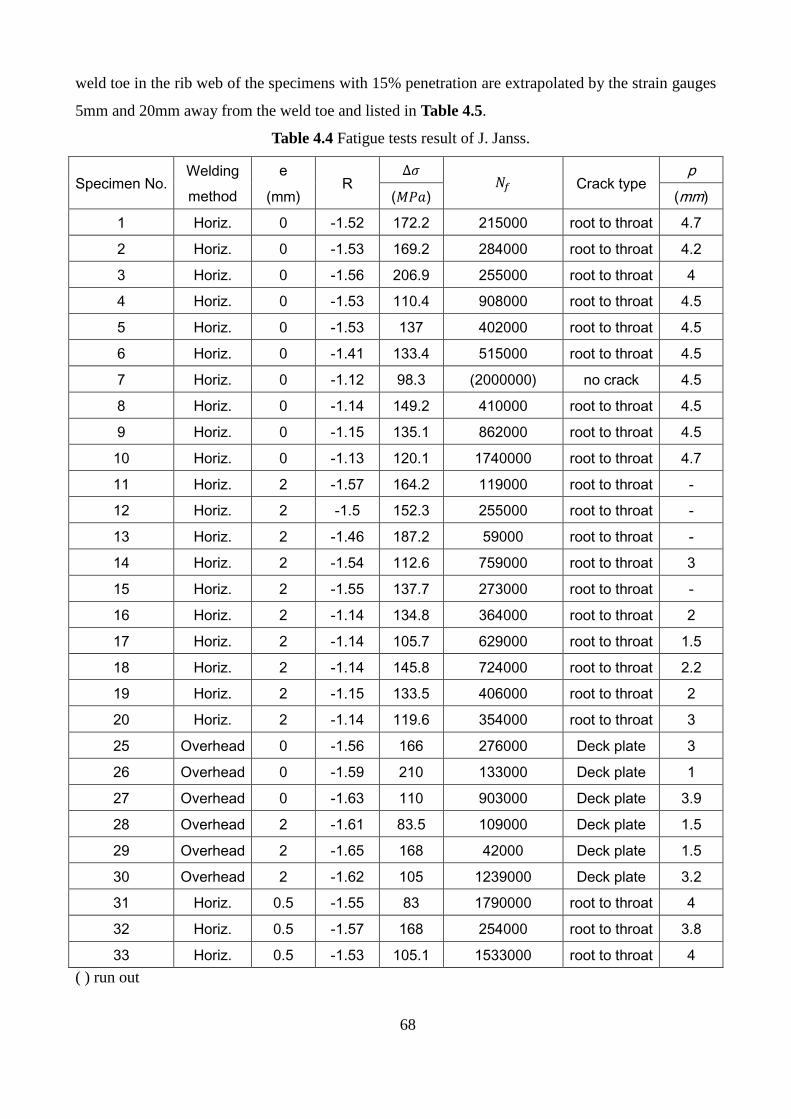
68
weld toe in the rib web of the specimens with 15% penetration are extrapolated by the strain gauges
5mm and 20mm away from the weld toe and listed in Table 4.5.
Table 4.4 Fatigue tests result of J. Janss.
Specimen No. Welding
method
e R
∆𝜎 𝑁𝑓 Crack type
p
(mm) (𝑀𝑃𝑎) (mm)
1 Horiz. 0 -1.52 172.2 215000 root to throat 4.7
2 Horiz. 0 -1.53 169.2 284000 root to throat 4.2
3 Horiz. 0 -1.56 206.9 255000 root to throat 4
4 Horiz. 0 -1.53 110.4 908000 root to throat 4.5
5 Horiz. 0 -1.53 137 402000 root to throat 4.5
6 Horiz. 0 -1.41 133.4 515000 root to throat 4.5
7 Horiz. 0 -1.12 98.3 (2000000) no crack 4.5
8 Horiz. 0 -1.14 149.2 410000 root to throat 4.5
9 Horiz. 0 -1.15 135.1 862000 root to throat 4.5
10 Horiz. 0 -1.13 120.1 1740000 root to throat 4.7
11 Horiz. 2 -1.57 164.2 119000 root to throat -
12 Horiz. 2 -1.5 152.3 255000 root to throat -
13 Horiz. 2 -1.46 187.2 59000 root to throat -
14 Horiz. 2 -1.54 112.6 759000 root to throat 3
15 Horiz. 2 -1.55 137.7 273000 root to throat -
16 Horiz. 2 -1.14 134.8 364000 root to throat 2
17 Horiz. 2 -1.14 105.7 629000 root to throat 1.5
18 Horiz. 2 -1.14 145.8 724000 root to throat 2.2
19 Horiz. 2 -1.15 133.5 406000 root to throat 2
20 Horiz. 2 -1.14 119.6 354000 root to throat 3
25 Overhead 0 -1.56 166 276000 Deck plate 3
26 Overhead 0 -1.59 210 133000 Deck plate 1
27 Overhead 0 -1.63 110 903000 Deck plate 3.9
28 Overhead 2 -1.61 83.5 109000 Deck plate 1.5
29 Overhead 2 -1.65 168 42000 Deck plate 1.5
30 Overhead 2 -1.62 105 1239000 Deck plate 3.2
31 Horiz. 0.5 -1.55 83 1790000 root to throat 4
32 Horiz. 0.5 -1.57 168 254000 root to throat 3.8
33 Horiz. 0.5 -1.53 105.1 1533000 root to throat 4
( ) run out

69
Table 4.5 Fatigue tests result of 15% penetration ratio specimens.
Specimen R PR ∆𝜎(toe)
𝑁𝑓 Type of crack toe (𝑀𝑃𝑎)
FD-5-1 -1 0.15 125.0503 1682000 Throat crack from root As welded
FD-3-1 -1 0.15 163.327 989200 Throat crack from root As welded
FD-2-2 -1 0.15 208.8176 160800 Throat crack from root As welded
FD-3-2 -1 0.15 149.717 961200 Throat crack from root As welded
FD-2-3 -1 0.15 135.8176 1211700 Throat crack from root As welded
With m being set to 3, the regression analyses results are summarized in Table 4.6. The standard
deviation s is calculated by taking log N as dependent variable. The regression equations for the 15%
PR specimens, horizontal welded specimens with the fit 𝑒 = 0~0.5𝑚𝑚 and horizontal welded
specimens with the fit 𝑒 = 2𝑚𝑚 of J. Janss’ fatigue tests are shown in Equations 4.5~4.7
respectively.
𝑙𝑜𝑔𝑁 = 12.462 − 3𝑙𝑜𝑔∆𝜎 4.5
𝑙𝑜𝑔𝑁 = 12.168 − 3𝑙𝑜𝑔∆𝜎 4.6
𝑙𝑜𝑔𝑁 = 11.910 − 3𝑙𝑜𝑔∆𝜎 4.7
where N is the number of load cycles, and ∆𝜎 is the stress range at the weld toe on the rib web.
Table 4.6 Regression analysis of test results (m=3)
Specimen R Number of data 𝑁𝑓
c s
PR 15% -1 5 12.462 0.0585
e=0~0.5mm -1~-2 12 12.168 0.05036
e=2mm -1~-2 11 11.910 0.06847
The regression result and fatigue test results are plotted in Fig.4.20. It can be concluded from
the fatigue test results that the scatter of the data of specimens with the fit e=2mm is larger than the
specimens with the fit e=0~0.5mm and the reason may be that the uniform of welding quality of the
specimens with the fit e=2mm is lower than the specimens with the fit e=0~0.5mm. Moreover, It
can be induced from the regression curves the mean fatigue strength of the specimens with 15%
penetration ratio in this study is higher than the horizontal welded specimens in J. Janss fatigue test.
And the mean and mean ± 2 standard deviations of logN fitted curves are shown in Fig.4.21.
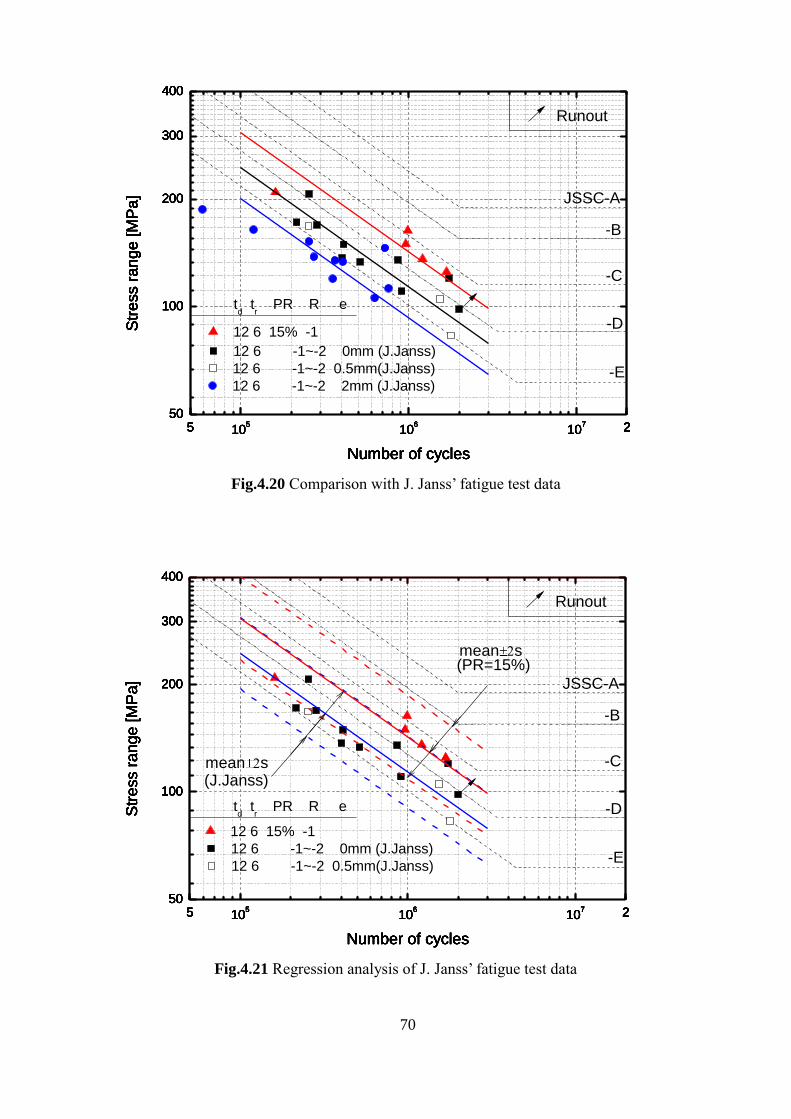
70
Fig.4.20 Comparison with J. Janss’ fatigue test data
Fig.4.21 Regression analysis of J. Janss’ fatigue test data
5 105
106
107 2
50
100
200
300
400
5 105
106
107 2
50
100
200
300
400
5 105
106
107 2
50
100
200
300
400
5 105
106
107 2
50
100
200
300
400
5 105
106
107 2
50
100
200
300
400
5 105
106
107 2
50
100
200
300
400
Runout
-E
-D
-C
-B
JSSC-A
Str
ess r
an
ge
[M
Pa
]
Number of cycles
12 6 -1~-2 0mm (J.Janss)
Str
ess r
an
ge
[M
Pa
]
Number of cycles
12 6 -1~-2 2mm (J.Janss)
Str
ess r
an
ge
[M
Pa
]
Number of cycles
12 6 -1~-2 0.5mm(J.Janss)
Str
ess r
an
ge
[M
Pa
]
Number of cycles
td t
r PR R e
12 6 15% -1Str
ess r
an
ge
[M
Pa
]
Number of cycles
Str
ess r
an
ge
[M
Pa
]
Number of cycles
5 105
106
107 2
50
100
200
300
400
5 105
106
107 2
50
100
200
300
400
5 105
106
107 2
50
100
200
300
400
5 105
106
107 2
50
100
200
300
400
5 105
106
107 2
50
100
200
300
400
5 105
106
107 2
50
100
200
300
400
mean s
mean s
Runout
-E
-D
-C
-B
JSSC-A
Str
ess r
an
ge
[M
Pa
]
Number of cycles
12 6 -1~-2 0mm (J.Janss)
Str
ess r
an
ge
[M
Pa
]
Number of cycles
(PR=15%)
(J.Janss)
12 6 -1~-2 0.5mm(J.Janss)
Str
ess r
an
ge
[M
Pa
]
Number of cycles
12 6 15% -1
Str
ess r
an
ge
[M
Pa
]
Number of cycles
Str
ess r
an
ge
[M
Pa
]
Number of cycles
Str
ess r
an
ge
[M
Pa
]
Number of cycles
td t
r PR R e
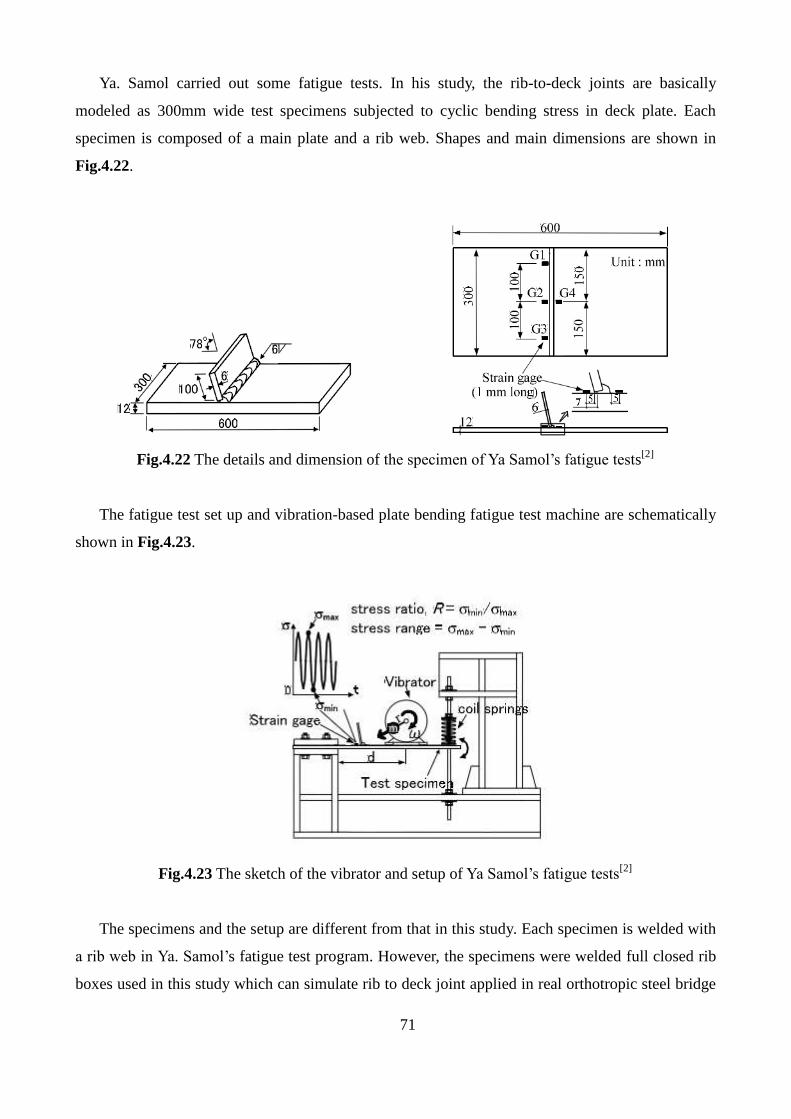
71
Ya. Samol carried out some fatigue tests. In his study, the rib-to-deck joints are basically
modeled as 300mm wide test specimens subjected to cyclic bending stress in deck plate. Each
specimen is composed of a main plate and a rib web. Shapes and main dimensions are shown in
Fig.4.22.
Fig.4.22 The details and dimension of the specimen of Ya Samol’s fatigue tests[2]
The fatigue test set up and vibration-based plate bending fatigue test machine are schematically
shown in Fig.4.23.
Fig.4.23 The sketch of the vibrator and setup of Ya Samol’s fatigue tests[2]
The specimens and the setup are different from that in this study. Each specimen is welded with
a rib web in Ya. Samol’s fatigue test program. However, the specimens were welded full closed rib
boxes used in this study which can simulate rib to deck joint applied in real orthotropic steel bridge

72
decks considering the influence of the closed rib box. In Ya. Samol’s fatigue test setup, one side of
the specimen is fixed to the rest frame to simulate cantilever boundary condition, the weld root is
closer to fixed end than weld toe and the weld toe is grounder for the purpose to induce the fatigue
crack initiates from weld root and propagate to deck plate. But in this study, the two transversal
edge of the fatigue test specimen is supported by roller bar and the fatigue load is applied near the
objective rib-to-deck joint to simulate real stress situation of the rib to deck joint under wheel load
applied outside the rib box. And then investigate that in this kind of fatigue load case what kind of
fatigue crack will occur and its fatigue life.
The fatigue test result of Ya Samol’s fatigue test program is listed in Table 4.7.
Table 4.7 data of Ya Samol’s fatigue test results
Specimen R △ 𝜎𝑟𝑜𝑜𝑡
(MPa)
△ 𝜎𝑟𝑜𝑜𝑡
(MPa) 𝑁15 𝑁𝑓
root to
deck
crack
toe to
deck
crack
root to
throat
crack
toe condition
D12R6-1 -1 167 159 1475000 1475000 ○ ground
D12R6-2 -1 165 157 781000 781000 ○ ground
D12R6-4 -1 166 158 1362000 1362000 ○ ground
D12R6-6 -1 145 138 2996000 2996000 ○ ground
PD12R6-8 0 85 81 (10000000) (10000000) ○ ground
PD12R6-10 0 119 113 4693000 6190000 ○ ground
PD12R6-11 0 113 107 7728000 8784000 ○ ground
PD12R6-12 0 121 115 6673000 6673000 ○ ground
( ) run out
The data of Ya. Samol’s fatigue tests, the fatigue test in this study and the JSCE S-N curves are
all plotted in Fig.4.24. In Ya. Samol’s fatigue tests, the fatigue strength of most specimens is
between JSSC B class and C class. The fatigue strength of most specimens tested with stress ratio
𝑅 = −1 is in the upside range and the fatigue strength of most specimens tested with stress ratio
𝑅 = 0 is in the downside range of the area between the fatigue strength class B and C in JSSC.
The reason may be that due to the higher residual stress around the weld line in some specimen,
the effective stress ratio is lower than 𝑅 = −1 which is measured by stain gages and this will
increase the fatigue life of this specimens
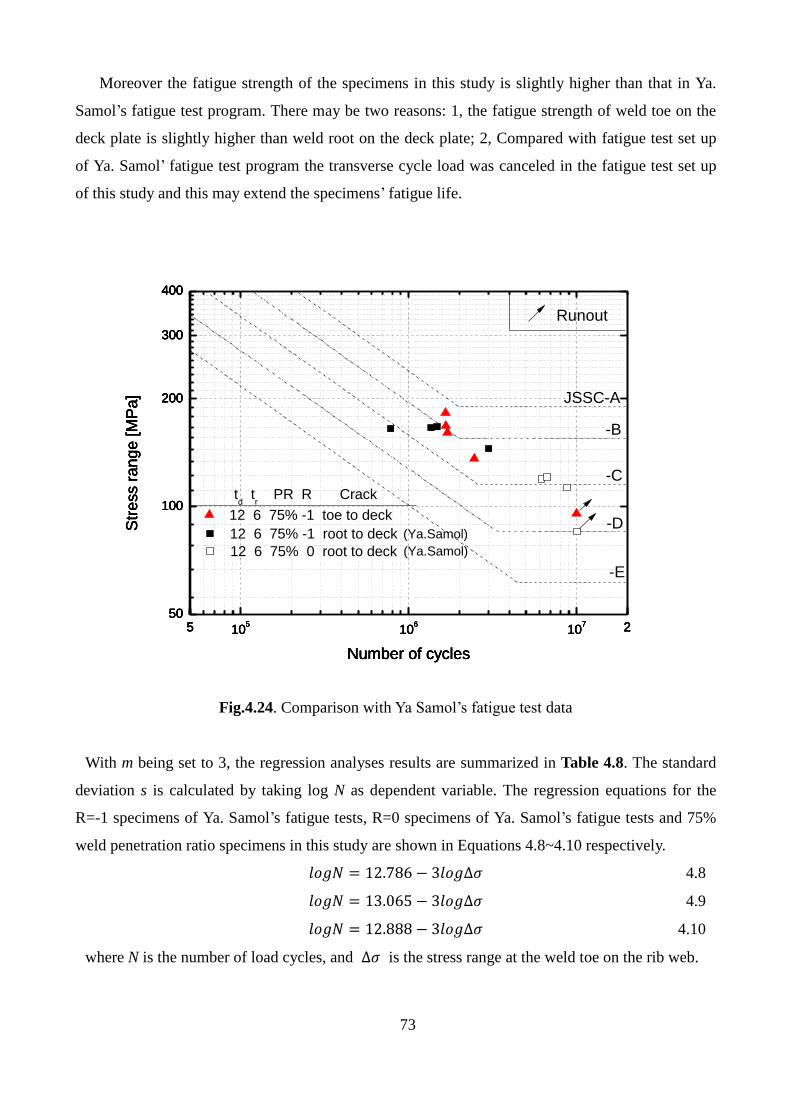
73
Moreover the fatigue strength of the specimens in this study is slightly higher than that in Ya.
Samol’s fatigue test program. There may be two reasons: 1, the fatigue strength of weld toe on the
deck plate is slightly higher than weld root on the deck plate; 2, Compared with fatigue test set up
of Ya. Samol’ fatigue test program the transverse cycle load was canceled in the fatigue test set up
of this study and this may extend the specimens’ fatigue life.
Fig.4.24. Comparison with Ya Samol’s fatigue test data
With m being set to 3, the regression analyses results are summarized in Table 4.8. The standard
deviation s is calculated by taking log N as dependent variable. The regression equations for the
R=-1 specimens of Ya. Samol’s fatigue tests, R=0 specimens of Ya. Samol’s fatigue tests and 75%
weld penetration ratio specimens in this study are shown in Equations 4.8~4.10 respectively.
𝑙𝑜𝑔𝑁 = 12.786 − 3𝑙𝑜𝑔∆𝜎 4.8
𝑙𝑜𝑔𝑁 = 13.065 − 3𝑙𝑜𝑔∆𝜎 4.9
𝑙𝑜𝑔𝑁 = 12.888 − 3𝑙𝑜𝑔∆𝜎 4.10
where N is the number of load cycles, and ∆𝜎 is the stress range at the weld toe on the rib web.
5 105
106
107 2
50
100
200
300
400
5 105
106
107 2
50
100
200
300
400
5 105
106
107 2
50
100
200
300
400
5 105
106
107 2
50
100
200
300
400
Runout
-E
-D
-C
-B
JSSC-A
Str
ess r
an
ge
[M
Pa
]
Number of cycles
(Ya.Samol)
(Ya.Samol)
td t
r PR R Crack
12 6 75% -1 toe to deck
Str
ess r
an
ge
[M
Pa
]
Number of cycles
12 6 75% -1 root to deck
Str
ess r
an
ge
[M
Pa
]
Number of cycles
12 6 75% 0 root to deck
Str
ess r
an
ge
[M
Pa
]
Number of cycles
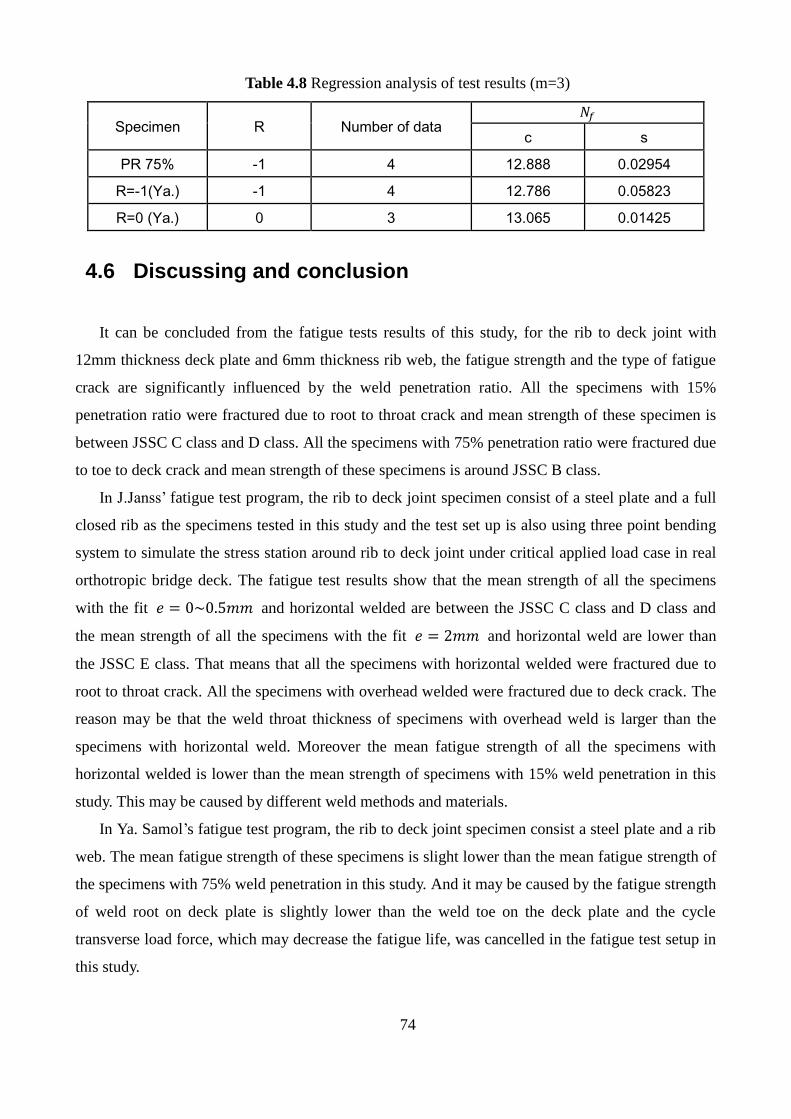
74
Table 4.8 Regression analysis of test results (m=3)
Specimen R Number of data 𝑁𝑓
c s
PR 75% -1 4 12.888 0.02954
R=-1(Ya.) -1 4 12.786 0.05823
R=0 (Ya.) 0 3 13.065 0.01425
4.6 Discussing and conclusion
It can be concluded from the fatigue tests results of this study, for the rib to deck joint with
12mm thickness deck plate and 6mm thickness rib web, the fatigue strength and the type of fatigue
crack are significantly influenced by the weld penetration ratio. All the specimens with 15%
penetration ratio were fractured due to root to throat crack and mean strength of these specimen is
between JSSC C class and D class. All the specimens with 75% penetration ratio were fractured due
to toe to deck crack and mean strength of these specimens is around JSSC B class.
In J.Janss’ fatigue test program, the rib to deck joint specimen consist of a steel plate and a full
closed rib as the specimens tested in this study and the test set up is also using three point bending
system to simulate the stress station around rib to deck joint under critical applied load case in real
orthotropic bridge deck. The fatigue test results show that the mean strength of all the specimens
with the fit 𝑒 = 0~0.5𝑚𝑚 and horizontal welded are between the JSSC C class and D class and
the mean strength of all the specimens with the fit 𝑒 = 2𝑚𝑚 and horizontal weld are lower than
the JSSC E class. That means that all the specimens with horizontal welded were fractured due to
root to throat crack. All the specimens with overhead welded were fractured due to deck crack. The
reason may be that the weld throat thickness of specimens with overhead weld is larger than the
specimens with horizontal weld. Moreover the mean fatigue strength of all the specimens with
horizontal welded is lower than the mean strength of specimens with 15% weld penetration in this
study. This may be caused by different weld methods and materials.
In Ya. Samol’s fatigue test program, the rib to deck joint specimen consist a steel plate and a rib
web. The mean fatigue strength of these specimens is slight lower than the mean fatigue strength of
the specimens with 75% weld penetration in this study. And it may be caused by the fatigue strength
of weld root on deck plate is slightly lower than the weld toe on the deck plate and the cycle
transverse load force, which may decrease the fatigue life, was cancelled in the fatigue test setup in
this study.
75
4.7 Reference
[1] M. Li, K. Hashimoto, K. Sugiura, Influence of Asphalt Surfacing on Fatigue
Evaluation of Rib-to-Deck Joints in Orthotropic Steel Bridge Decks, J Bridge Eng,
(2014).
[2] S. Ya, Fatigue durability evaluations of trough to deck plate welded details of
orthotropic steel deck, in, Doctoral Thesis, Nagoya University, 2009.
[3] A. Hobbacher, Recommendations for fatigue design of welded joints and
components, Welding Research Council Shaker Heights, OH, 2009.
[4] J.S.o.S.C. (JSSC), Fatigue design recommendations for steel structures and
commentary, Gihodo Publishing, 1993.
[5] J. Janss, Fatigue of welds in orthotropic bridge deck panels with trapezoidal
stiffeners, Journal of Constructional Steel Research, 9 (1988) 147-154.

76
CHAPTER 5
Experimental Study of Full Size Orthotropic
Steel Bridge Deck
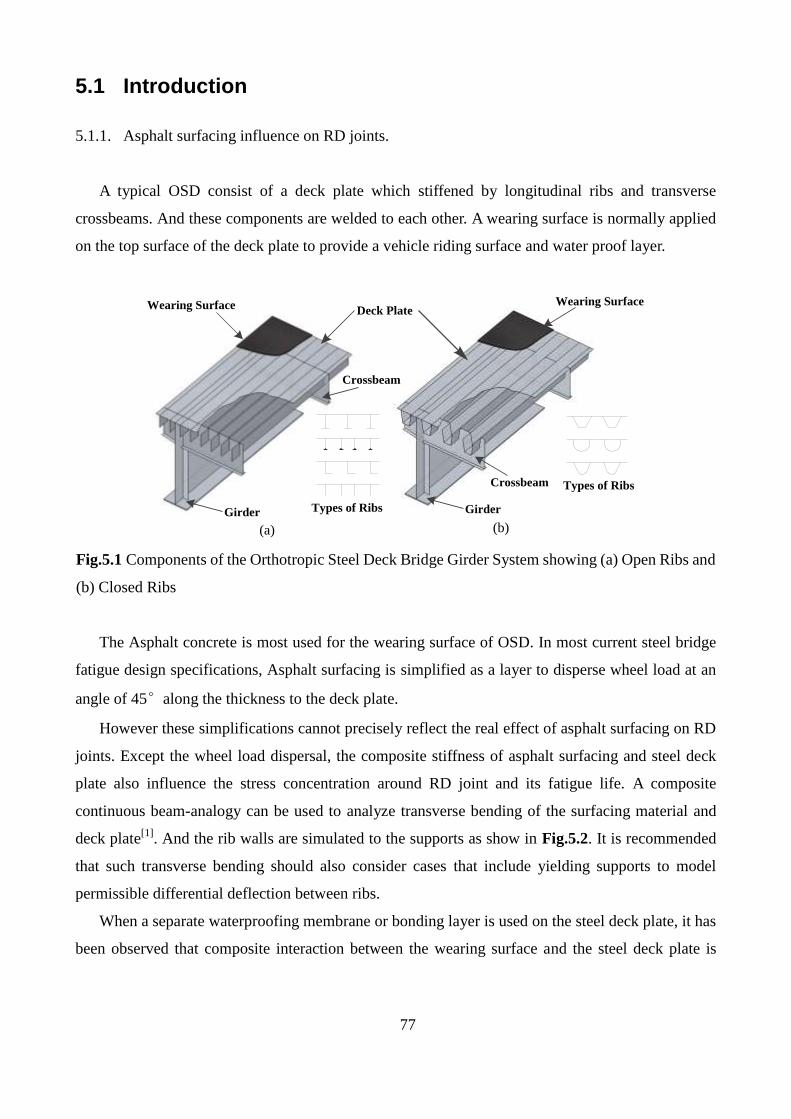
77
5.1 Introduction
5.1.1. Asphalt surfacing influence on RD joints.
A typical OSD consist of a deck plate which stiffened by longitudinal ribs and transverse
crossbeams. And these components are welded to each other. A wearing surface is normally applied
on the top surface of the deck plate to provide a vehicle riding surface and water proof layer.
Fig.5.1 Components of the Orthotropic Steel Deck Bridge Girder System showing (a) Open Ribs and
(b) Closed Ribs
The Asphalt concrete is most used for the wearing surface of OSD. In most current steel bridge
fatigue design specifications, Asphalt surfacing is simplified as a layer to disperse wheel load at an
angle of 45°along the thickness to the deck plate.
However these simplifications cannot precisely reflect the real effect of asphalt surfacing on RD
joints. Except the wheel load dispersal, the composite stiffness of asphalt surfacing and steel deck
plate also influence the stress concentration around RD joint and its fatigue life. A composite
continuous beam-analogy can be used to analyze transverse bending of the surfacing material and
deck plate[1]
. And the rib walls are simulated to the supports as show in Fig.5.2. It is recommended
that such transverse bending should also consider cases that include yielding supports to model
permissible differential deflection between ribs.
When a separate waterproofing membrane or bonding layer is used on the steel deck plate, it has
been observed that composite interaction between the wearing surface and the steel deck plate is
Deck PlateWearing SurfaceWearing Surface
Crossbeam
Crossbeam
Girder Types of Ribs
Types of Ribs
Girder
(a) (b)
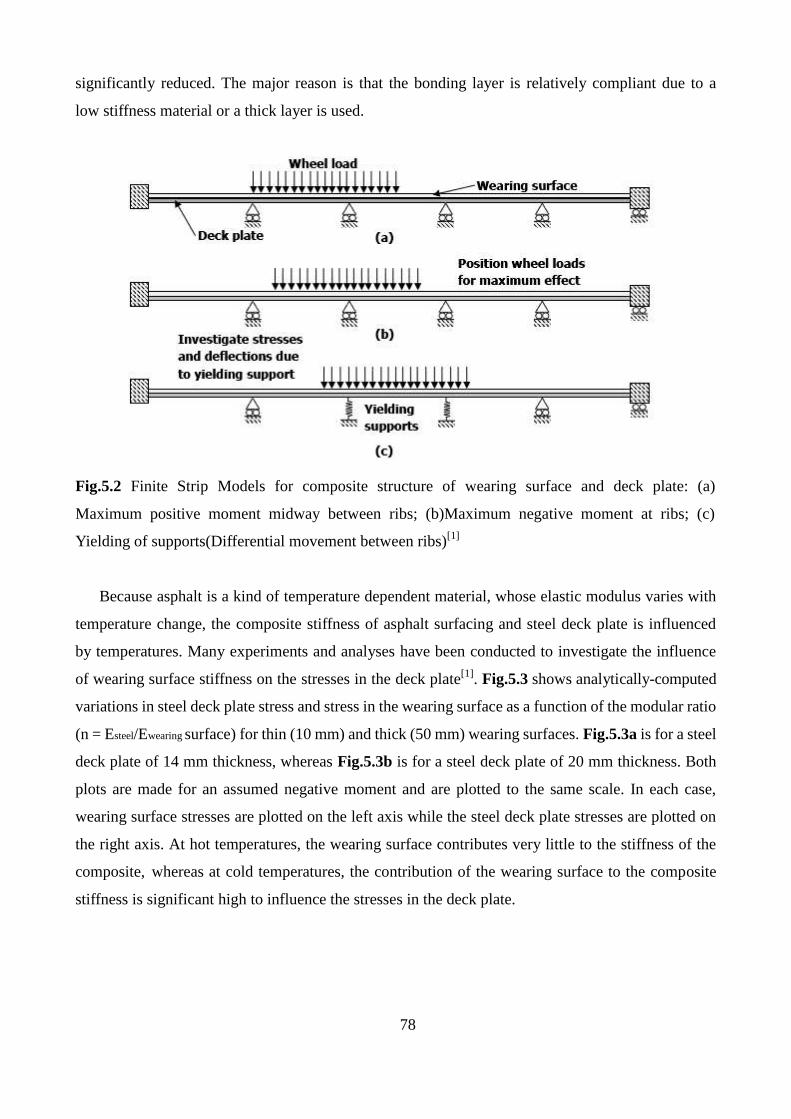
78
significantly reduced. The major reason is that the bonding layer is relatively compliant due to a
low stiffness material or a thick layer is used.
Fig.5.2 Finite Strip Models for composite structure of wearing surface and deck plate: (a)
Maximum positive moment midway between ribs; (b)Maximum negative moment at ribs; (c)
Yielding of supports(Differential movement between ribs)[1]
Because asphalt is a kind of temperature dependent material, whose elastic modulus varies with
temperature change, the composite stiffness of asphalt surfacing and steel deck plate is influenced
by temperatures. Many experiments and analyses have been conducted to investigate the influence
of wearing surface stiffness on the stresses in the deck plate[1]
. Fig.5.3 shows analytically-computed
variations in steel deck plate stress and stress in the wearing surface as a function of the modular ratio
(n = Esteel/Ewearing surface) for thin (10 mm) and thick (50 mm) wearing surfaces. Fig.5.3a is for a steel
deck plate of 14 mm thickness, whereas Fig.5.3b is for a steel deck plate of 20 mm thickness. Both
plots are made for an assumed negative moment and are plotted to the same scale. In each case,
wearing surface stresses are plotted on the left axis while the steel deck plate stresses are plotted on
the right axis. At hot temperatures, the wearing surface contributes very little to the stiffness of the
composite, whereas at cold temperatures, the contribution of the wearing surface to the composite
stiffness is significant high to influence the stresses in the deck plate.
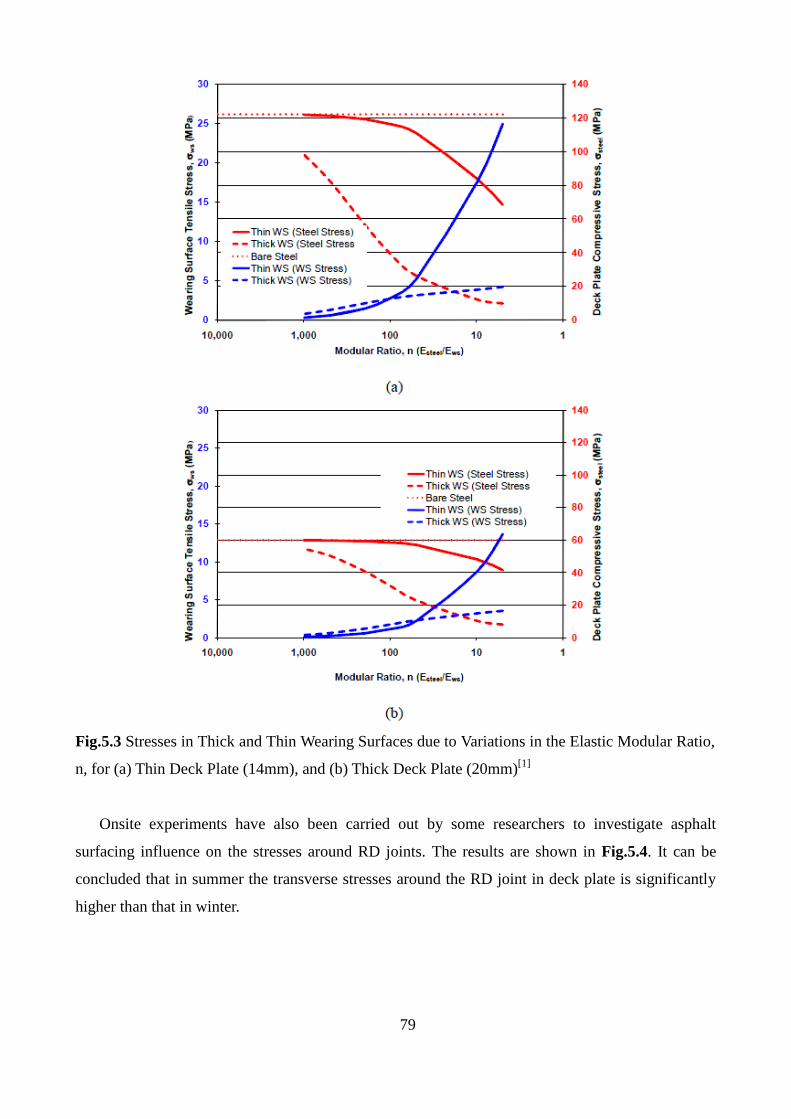
79
Fig.5.3 Stresses in Thick and Thin Wearing Surfaces due to Variations in the Elastic Modular Ratio,
n, for (a) Thin Deck Plate (14mm), and (b) Thick Deck Plate (20mm)[1]
Onsite experiments have also been carried out by some researchers to investigate asphalt
surfacing influence on the stresses around RD joints. The results are shown in Fig.5.4. It can be
concluded that in summer the transverse stresses around the RD joint in deck plate is significantly
higher than that in winter.
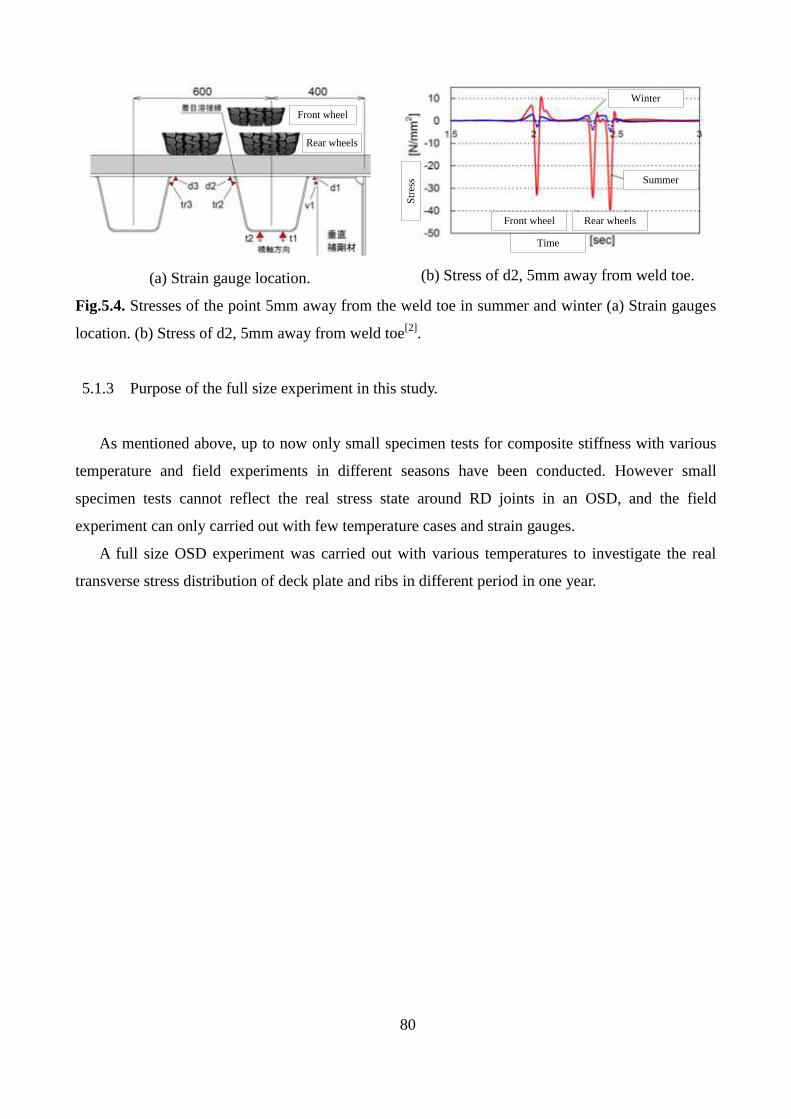
80
Front wheel
Rear wheels
(a) Strain gauge location.
Winter
Summer
Front wheel Rear wheels
Time
Str
ess
(b) Stress of d2, 5mm away from weld toe.
Fig.5.4. Stresses of the point 5mm away from the weld toe in summer and winter (a) Strain gauges
location. (b) Stress of d2, 5mm away from weld toe[2]
.
5.1.3 Purpose of the full size experiment in this study.
As mentioned above, up to now only small specimen tests for composite stiffness with various
temperature and field experiments in different seasons have been conducted. However small
specimen tests cannot reflect the real stress state around RD joints in an OSD, and the field
experiment can only carried out with few temperature cases and strain gauges.
A full size OSD experiment was carried out with various temperatures to investigate the real
transverse stress distribution of deck plate and ribs in different period in one year.
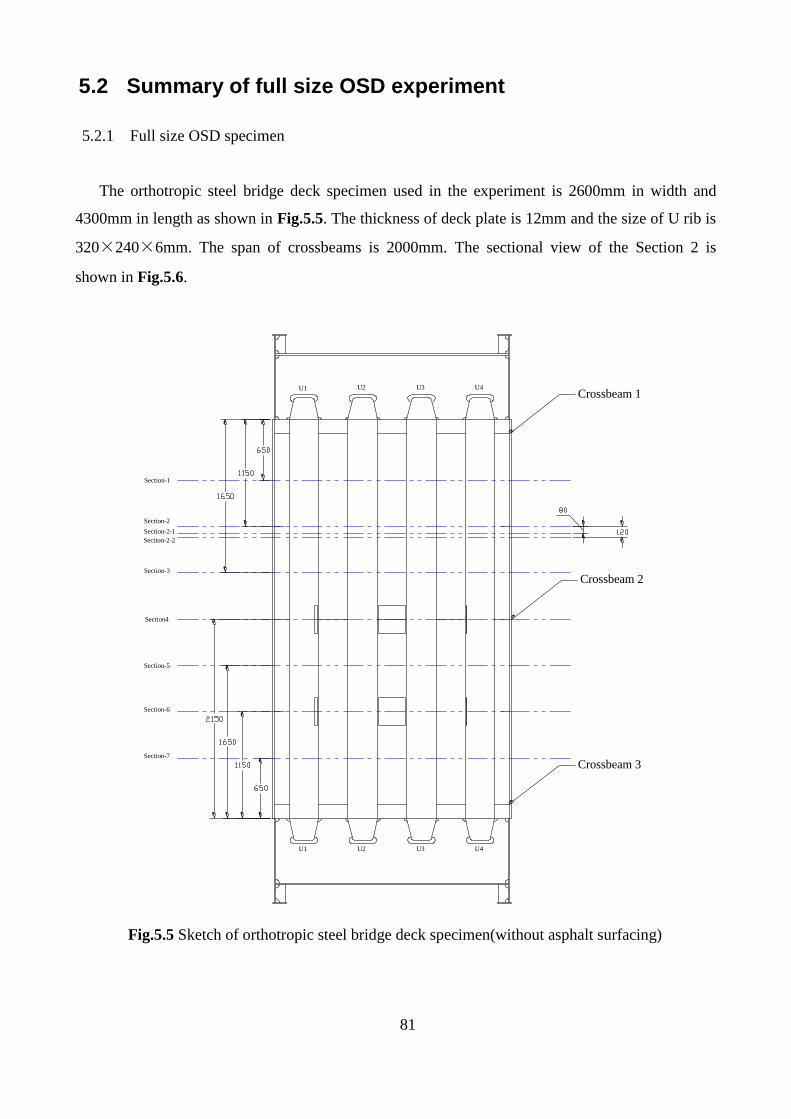
81
5.2 Summary of full size OSD experiment
5.2.1 Full size OSD specimen
The orthotropic steel bridge deck specimen used in the experiment is 2600mm in width and
4300mm in length as shown in Fig.5.5. The thickness of deck plate is 12mm and the size of U rib is
320×240×6mm. The span of crossbeams is 2000mm. The sectional view of the Section 2 is
shown in Fig.5.6.
Section-2
Section-3
Section4
Section-6
Section-1
Section-5
Section-7
Section-2-1
U4U3U2U1
U4U3U2U1Crossbeam 1
Crossbeam 2
Crossbeam 3
Section-2-2
Fig.5.5 Sketch of orthotropic steel bridge deck specimen(without asphalt surfacing)
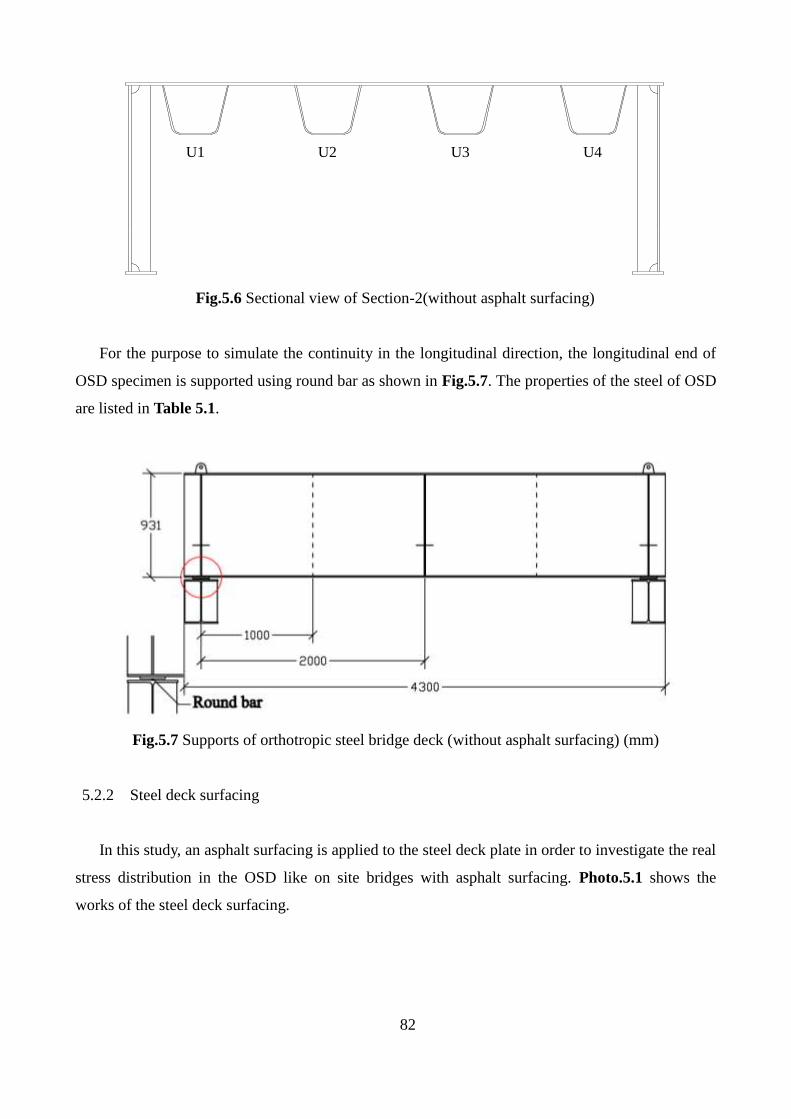
82
U1 U2 U3 U4
Fig.5.6 Sectional view of Section-2(without asphalt surfacing)
For the purpose to simulate the continuity in the longitudinal direction, the longitudinal end of
OSD specimen is supported using round bar as shown in Fig.5.7. The properties of the steel of OSD
are listed in Table 5.1.
Fig.5.7 Supports of orthotropic steel bridge deck (without asphalt surfacing) (mm)
5.2.2 Steel deck surfacing
In this study, an asphalt surfacing is applied to the steel deck plate in order to investigate the real
stress distribution in the OSD like on site bridges with asphalt surfacing. Photo.5.1 shows the
works of the steel deck surfacing.
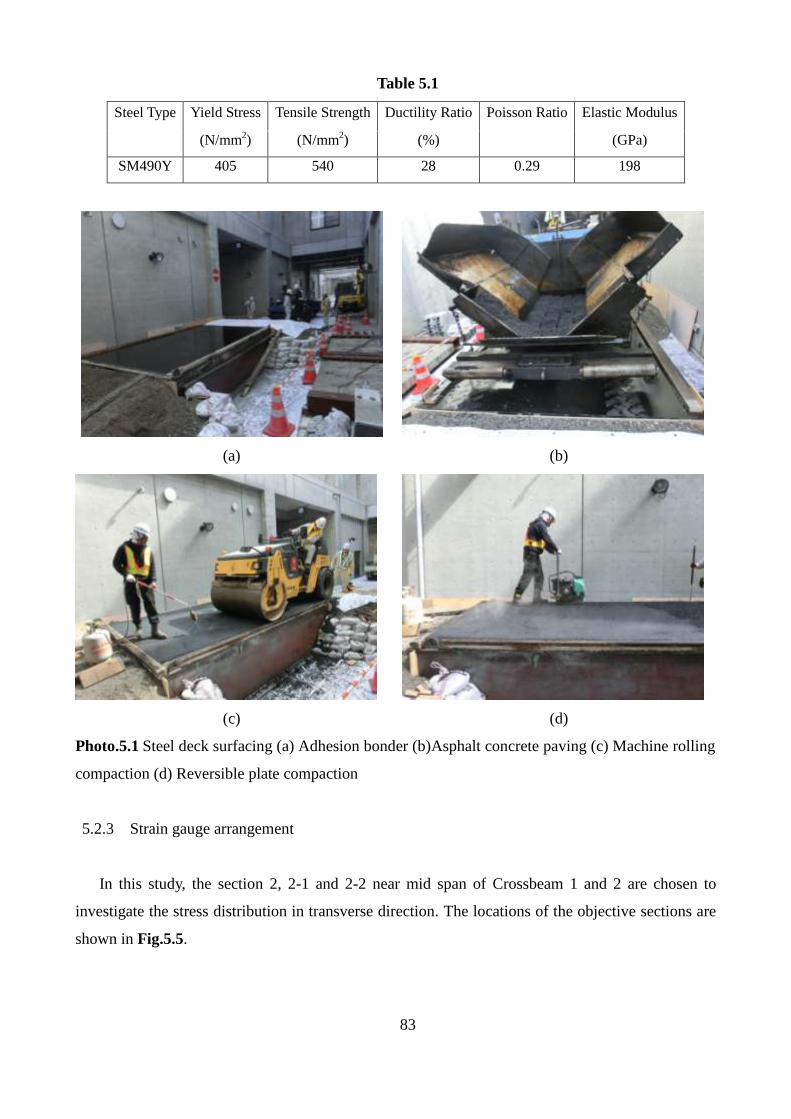
83
Table 5.1
Steel Type Yield Stress Tensile Strength Ductility Ratio Poisson Ratio Elastic Modulus
(N/mm2) (N/mm
2) (%) (GPa)
SM490Y 405 540 28 0.29 198
(a)
(b)
(c)
(d)
Photo.5.1 Steel deck surfacing (a) Adhesion bonder (b)Asphalt concrete paving (c) Machine rolling
compaction (d) Reversible plate compaction
5.2.3 Strain gauge arrangement
In this study, the section 2, 2-1 and 2-2 near mid span of Crossbeam 1 and 2 are chosen to
investigate the stress distribution in transverse direction. The locations of the objective sections are
shown in Fig.5.5.
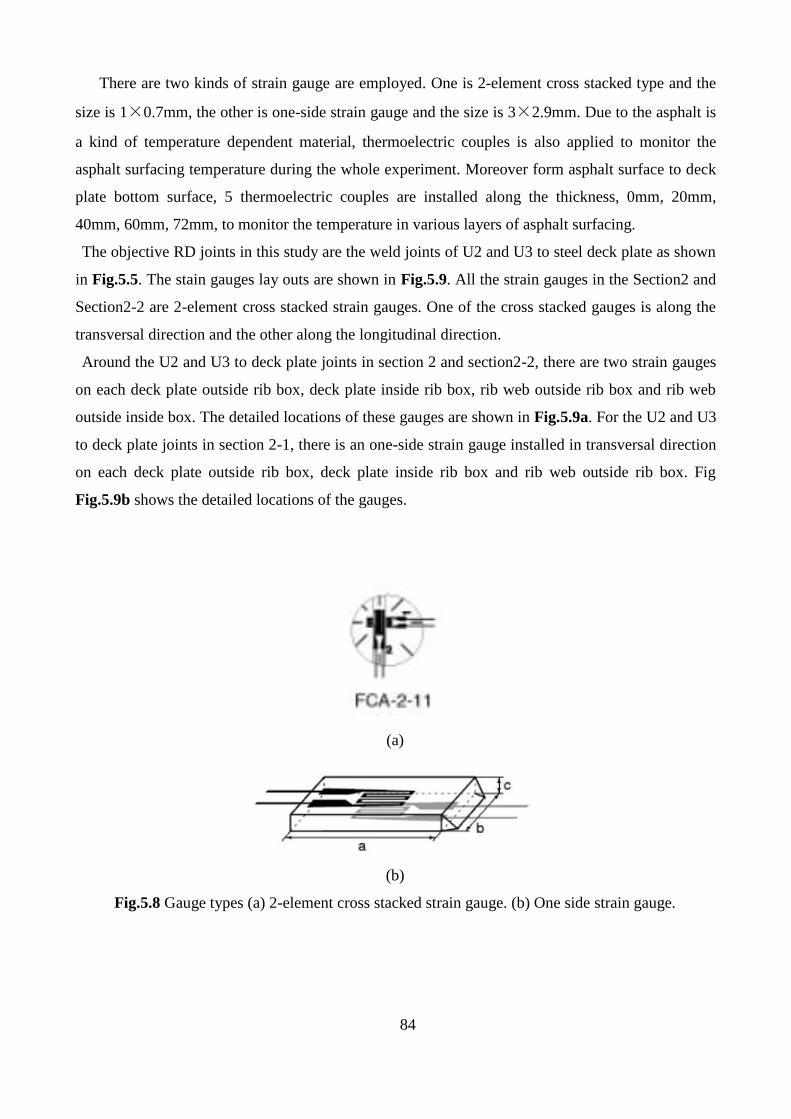
84
There are two kinds of strain gauge are employed. One is 2-element cross stacked type and the
size is 1×0.7mm, the other is one-side strain gauge and the size is 3×2.9mm. Due to the asphalt is
a kind of temperature dependent material, thermoelectric couples is also applied to monitor the
asphalt surfacing temperature during the whole experiment. Moreover form asphalt surface to deck
plate bottom surface, 5 thermoelectric couples are installed along the thickness, 0mm, 20mm,
40mm, 60mm, 72mm, to monitor the temperature in various layers of asphalt surfacing.
The objective RD joints in this study are the weld joints of U2 and U3 to steel deck plate as shown
in Fig.5.5. The stain gauges lay outs are shown in Fig.5.9. All the strain gauges in the Section2 and
Section2-2 are 2-element cross stacked strain gauges. One of the cross stacked gauges is along the
transversal direction and the other along the longitudinal direction.
Around the U2 and U3 to deck plate joints in section 2 and section2-2, there are two strain gauges
on each deck plate outside rib box, deck plate inside rib box, rib web outside rib box and rib web
outside inside box. The detailed locations of these gauges are shown in Fig.5.9a. For the U2 and U3
to deck plate joints in section 2-1, there is an one-side strain gauge installed in transversal direction
on each deck plate outside rib box, deck plate inside rib box and rib web outside rib box. Fig
Fig.5.9b shows the detailed locations of the gauges.
(a)
(b)
Fig.5.8 Gauge types (a) 2-element cross stacked strain gauge. (b) One side strain gauge.
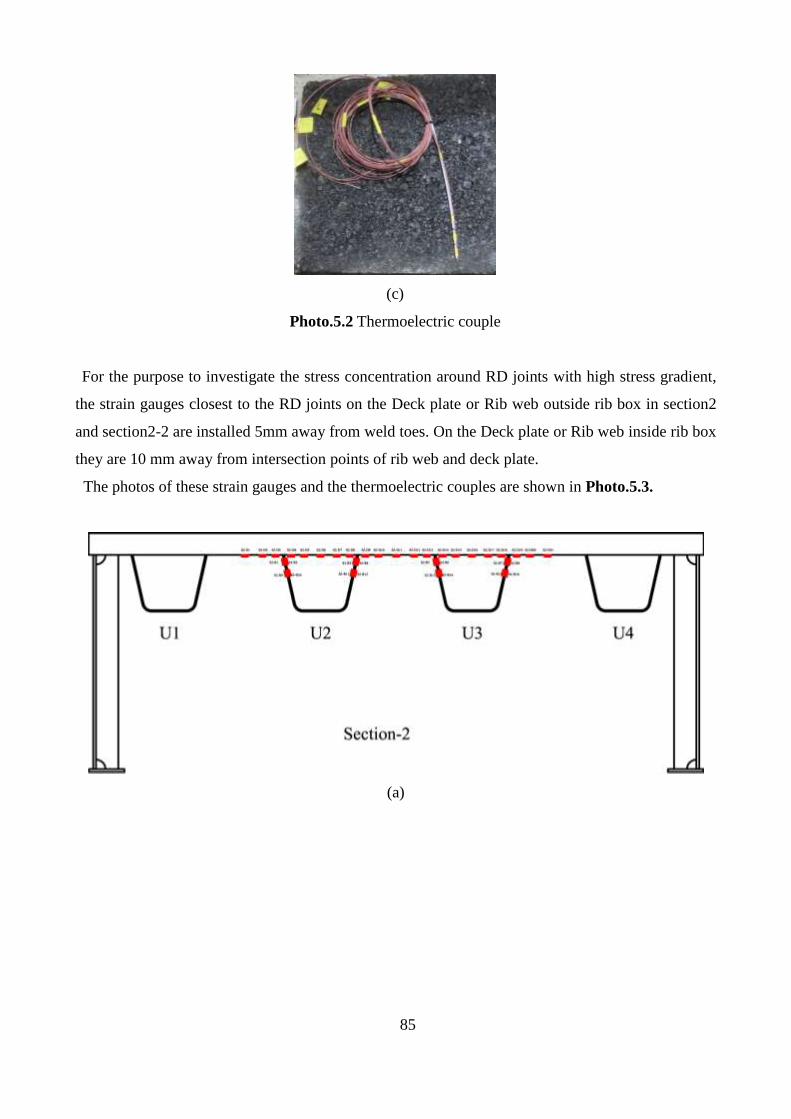
85
(c)
Photo.5.2 Thermoelectric couple
For the purpose to investigate the stress concentration around RD joints with high stress gradient,
the strain gauges closest to the RD joints on the Deck plate or Rib web outside rib box in section2
and section2-2 are installed 5mm away from weld toes. On the Deck plate or Rib web inside rib box
they are 10 mm away from intersection points of rib web and deck plate.
The photos of these strain gauges and the thermoelectric couples are shown in Photo.5.3.
(a)
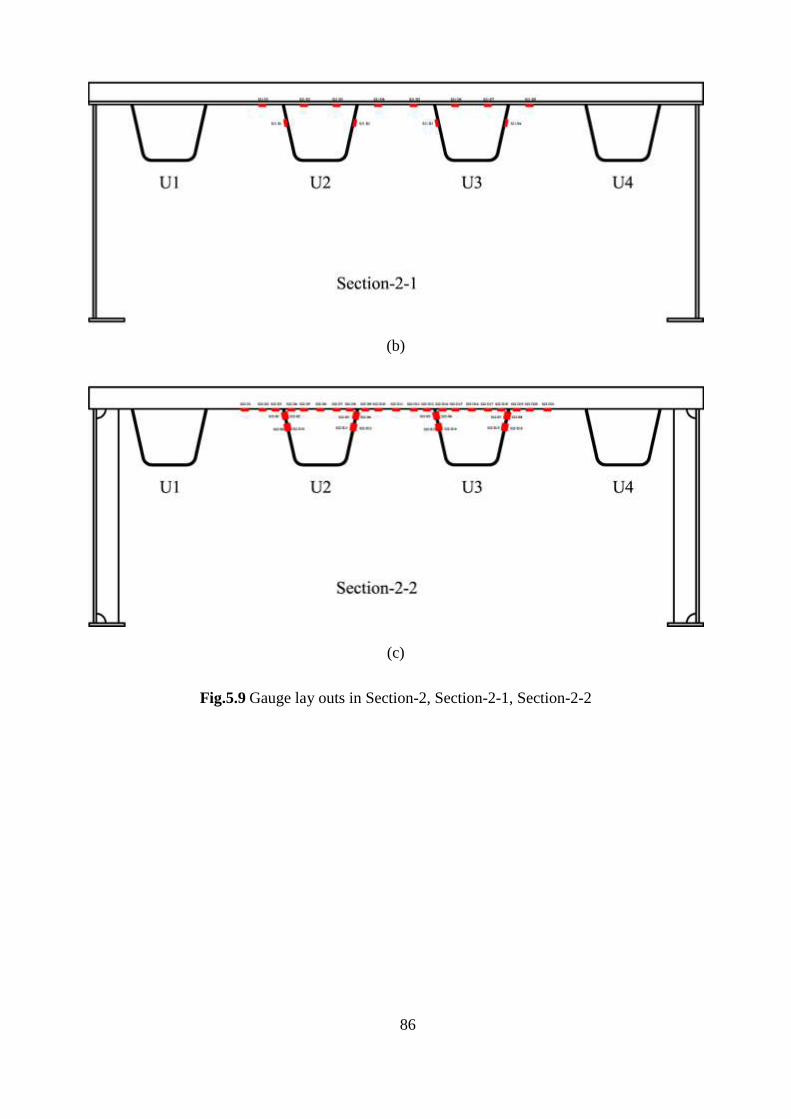
86
(b)
(c)
Fig.5.9 Gauge lay outs in Section-2, Section-2-1, Section-2-2
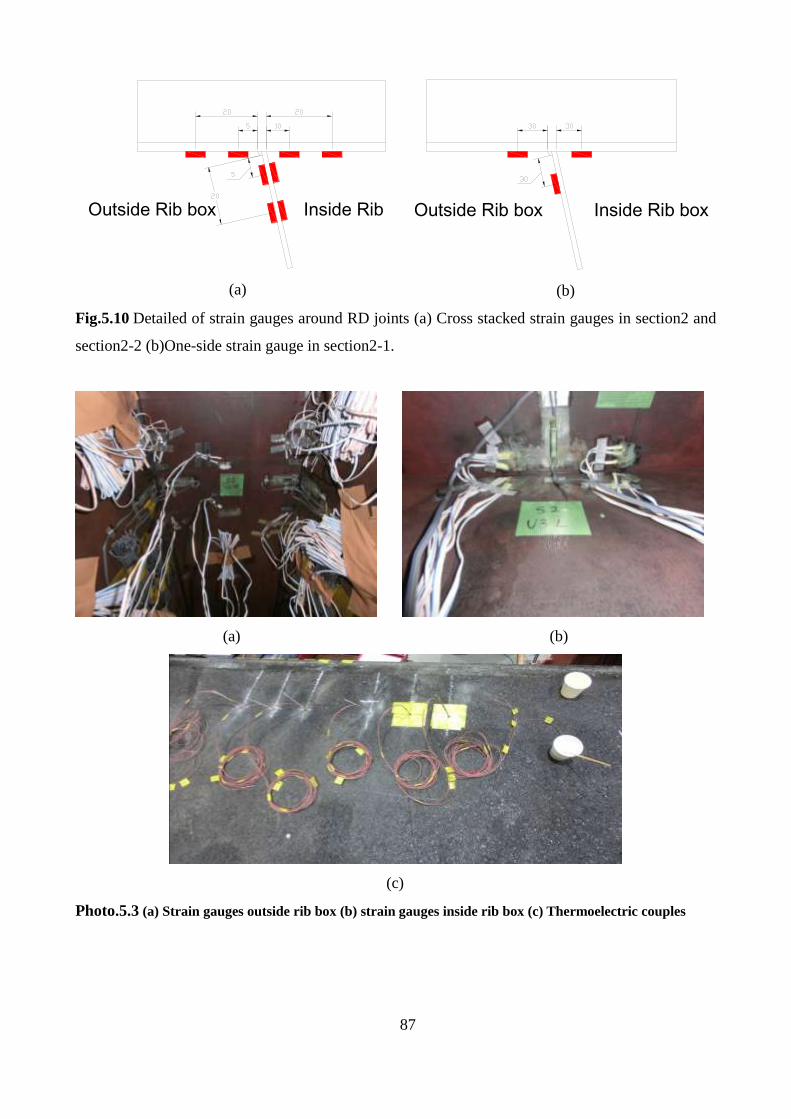
87
(a)
(b)
Fig.5.10 Detailed of strain gauges around RD joints (a) Cross stacked strain gauges in section2 and
section2-2 (b)One-side strain gauge in section2-1.
(a)
(b)
(c)
Photo.5.3 (a) Strain gauges outside rib box (b) strain gauges inside rib box (c) Thermoelectric couples
Outside Rib box Inside Rib box
Outside Rib box Inside Rib boxOutside Rib box Inside Rib box
Outside Rib box Inside Rib box
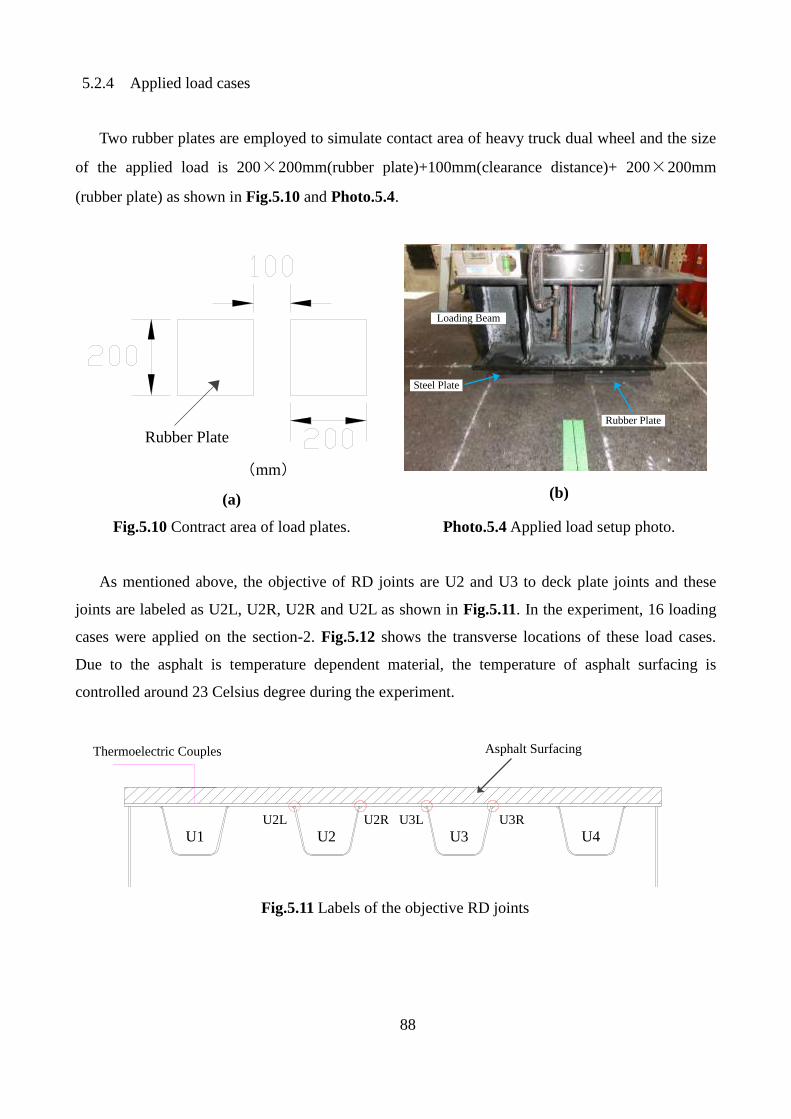
88
5.2.4 Applied load cases
Two rubber plates are employed to simulate contact area of heavy truck dual wheel and the size
of the applied load is 200×200mm(rubber plate)+100mm(clearance distance)+ 200×200mm
(rubber plate) as shown in Fig.5.10 and Photo.5.4.
(a)
(b)
Fig.5.10 Contract area of load plates. Photo.5.4 Applied load setup photo.
As mentioned above, the objective of RD joints are U2 and U3 to deck plate joints and these
joints are labeled as U2L, U2R, U2R and U2L as shown in Fig.5.11. In the experiment, 16 loading
cases were applied on the section-2. Fig.5.12 shows the transverse locations of these load cases.
Due to the asphalt is temperature dependent material, the temperature of asphalt surfacing is
controlled around 23 Celsius degree during the experiment.
Fig.5.11 Labels of the objective RD joints
Rubber Plate
(mm)
Loading Beam
Steel Plate
Rubber Plate
U1 U2 U3 U4
U2L U2R U3L U3R
Thermoelectric Couples Asphalt Surfacing
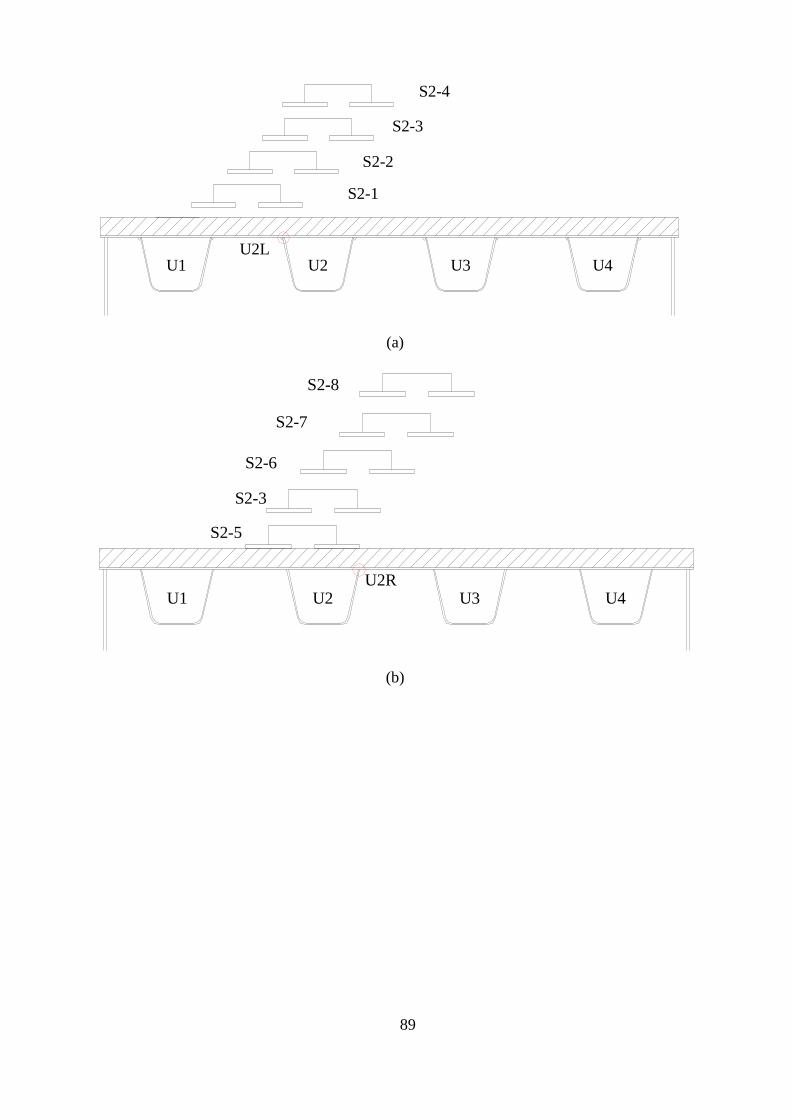
89
(a)
(b)
U2L
S2-1
S2-2
S2-3
S2-4
U1 U2 U3 U4
U2R
S2-5
S2-6
S2-3
S2-7
S2-8
U1 U2 U3 U4
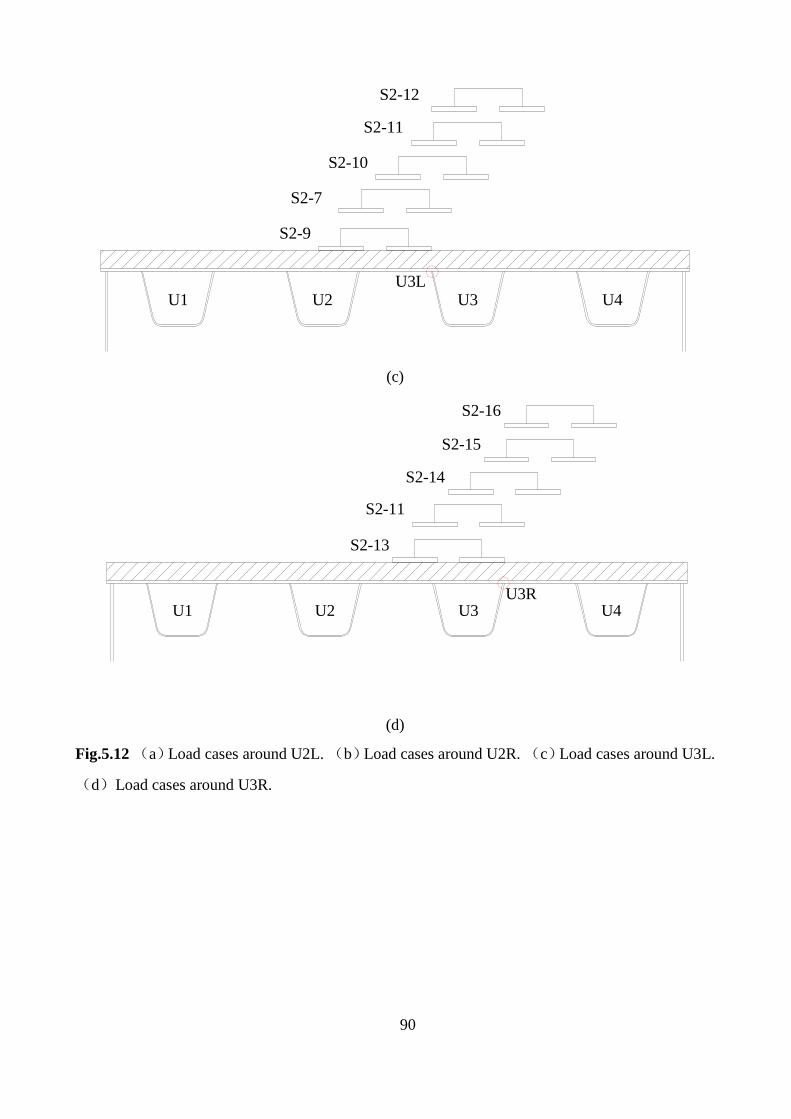
90
(c)
(d)
Fig.5.12 (a)Load cases around U2L. (b)Load cases around U2R. (c)Load cases around U3L.
(d)Load cases around U3R.
U3L
S2-9
S2-10
S2-11
S2-12
S2-7
U1 U2 U3 U4
U3RU1 U2 U3 U4
S2-13
S2-14
S2-15
S2-16
S2-11

91
5.2.5 Experiment results
Stress distribution in deck plate of Section2
The temperature of asphalt is controlled around 23 Celsius degree and the applied load increases
from 0KN to 100KN at the speed of 1KN/s. The transverse stress distribution is very sensitive to
transverse location of applied loads. The distributions of stress in deck plate at Section 2 under
various load cases are shown in Fig.5.13~5.28. The transverse stresses or longitude stresses are
calculated as following:
𝜎𝑥 =𝐸𝑠
1 − 𝜈𝑠2(𝜀𝑥 + 𝜈𝑠𝜀𝑦) 5-1
𝜎𝑦 =𝐸𝑠
1 − 𝜈𝑠2(𝜀𝑦 + 𝜈𝑠𝜀𝑥) 5-2
where 𝜎𝑥 is the transverse stress; 𝜎𝑦 is the longitudinal stress; 𝐸𝑠 is the elastic modulus of steel
deck plate; 𝜈𝑠 is the Poisson ratio of steel deck plate; 𝜀𝑥 is the transverse strain and 𝜀𝑦 is the
longitudinal strain.
From the stress distribution on the undersurface of steel deck plate in Section2, it could be
concluded that: 1. under quasistatic increasing applied load, the stresses around the RD joints, near
the applied load, of deck plate increasing lineally; 2. the stresses of undersurfaces of deck plate
around the RD joints, near the applied load, are negative value under all applied loads.; 3.most
undersurface deck plate stresses distributed in the range between the closest RD joints; 4.the
magnitude of transverse stress is far larger than that of corresponding longitudinal stress of the
undersurface of deck plate. 5 the applied load, while it riding on the RD joint, causes the minimum
value of stress on undersurface of deck plate around the RD joint.
Out plane strain and membrane strain
The deck plate and ribs are made from thin steel plates, thickness of deck plate and rib are 12mm
and 6mm respectively. For the purpose to distinguish the out plane strain and membrane strain,
strain gauges are installed to the outside and inside surfaces of rib web around RD joints in
Section2-1. However, because the up surface of deck plate is covered by asphalt surfacing, only the
undersurface is installed strain gauges.
The transverse stress influence lines of strain gauge in the cross section 2 are shown in
Fig.5.30~5.31. It can be induced from these transverse influence lines that the stress around the RD
joint is very sensitive to the transverse location of the applied load and the sensitive range is
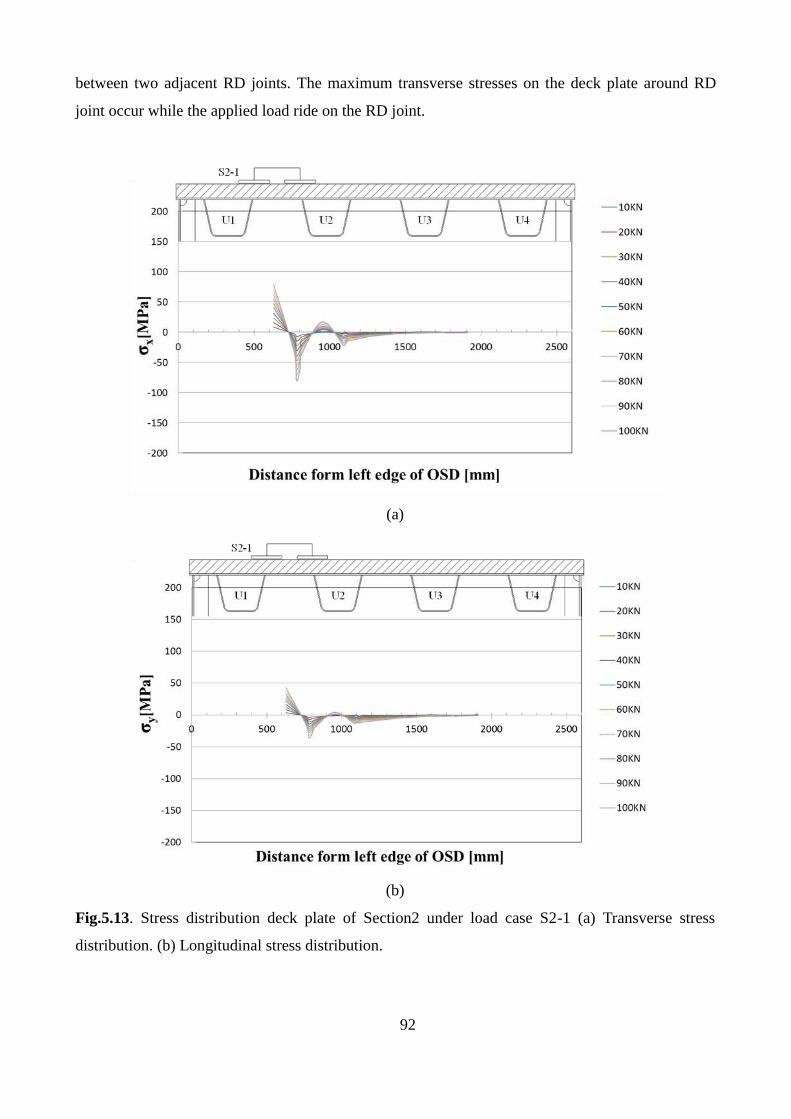
92
between two adjacent RD joints. The maximum transverse stresses on the deck plate around RD
joint occur while the applied load ride on the RD joint.
(a)
(b)
Fig.5.13. Stress distribution deck plate of Section2 under load case S2-1 (a) Transverse stress
distribution. (b) Longitudinal stress distribution.
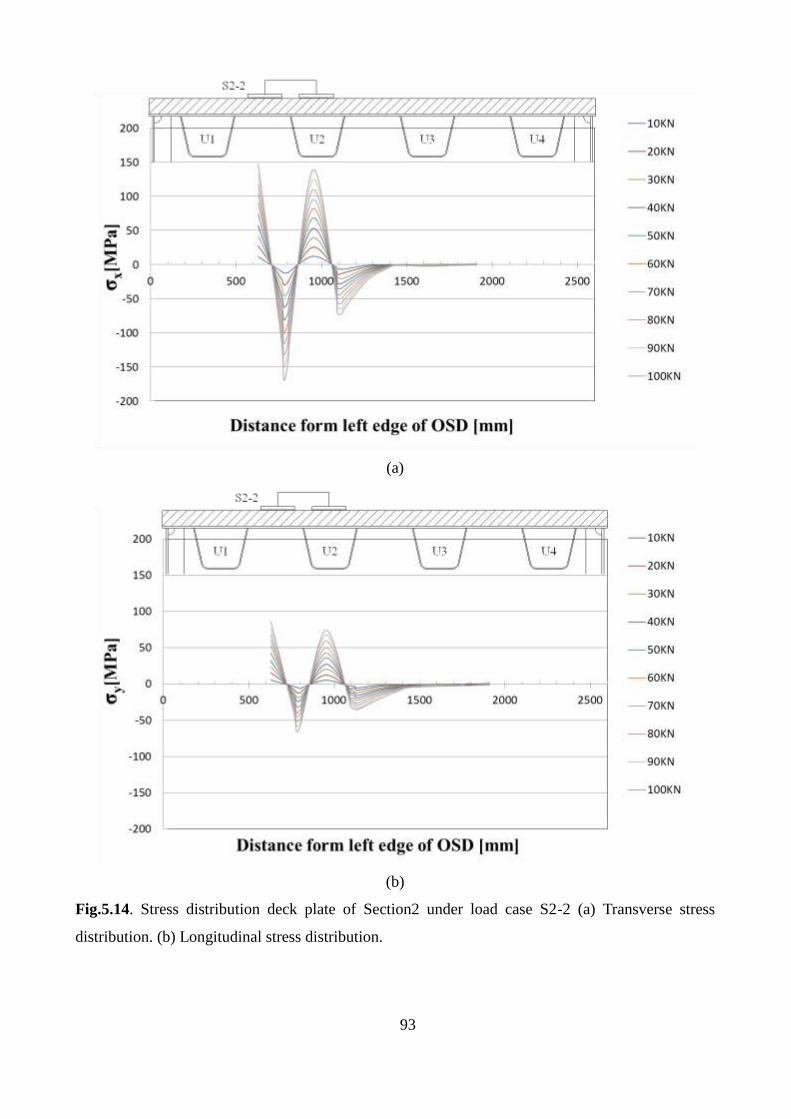
93
(a)
(b)
Fig.5.14. Stress distribution deck plate of Section2 under load case S2-2 (a) Transverse stress
distribution. (b) Longitudinal stress distribution.
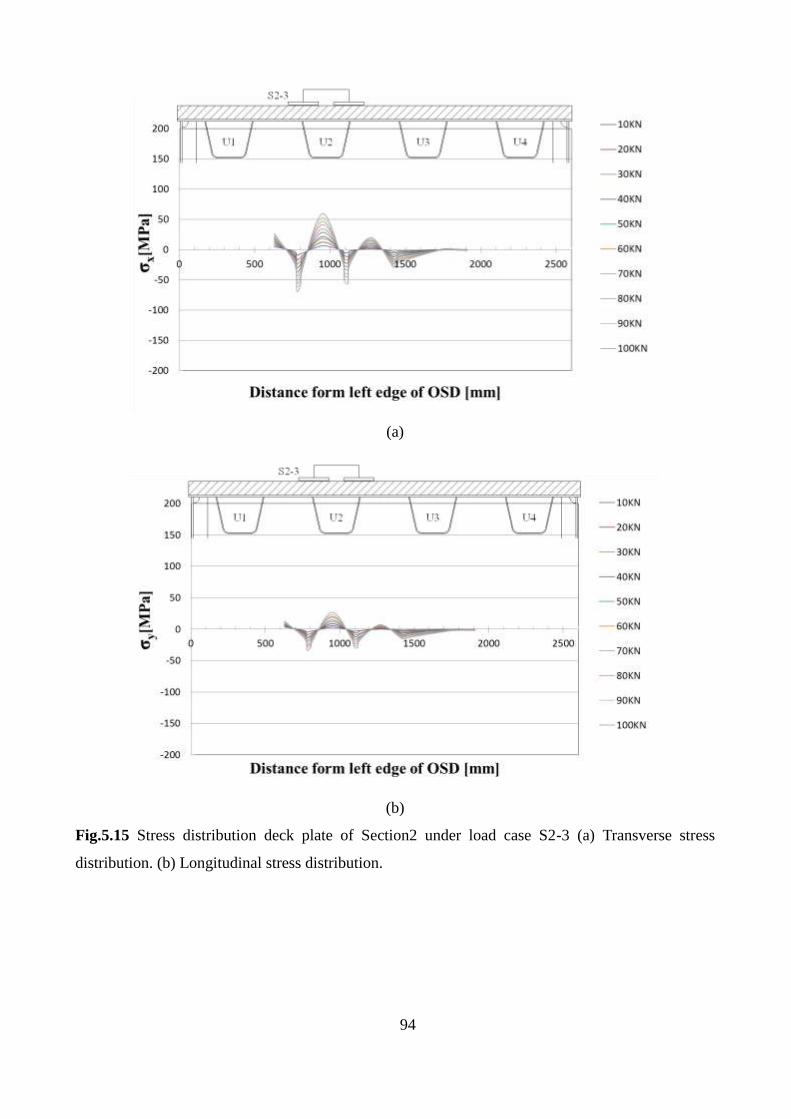
94
(a)
(b)
Fig.5.15 Stress distribution deck plate of Section2 under load case S2-3 (a) Transverse stress
distribution. (b) Longitudinal stress distribution.
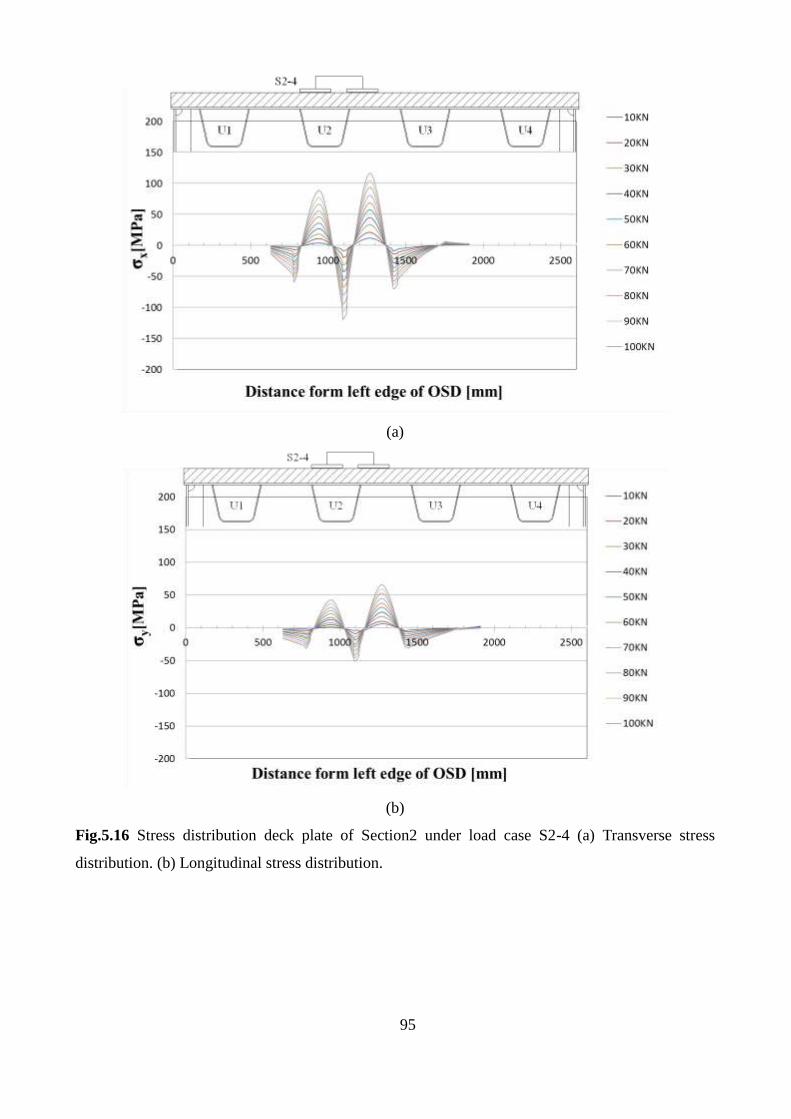
95
(a)
(b)
Fig.5.16 Stress distribution deck plate of Section2 under load case S2-4 (a) Transverse stress
distribution. (b) Longitudinal stress distribution.
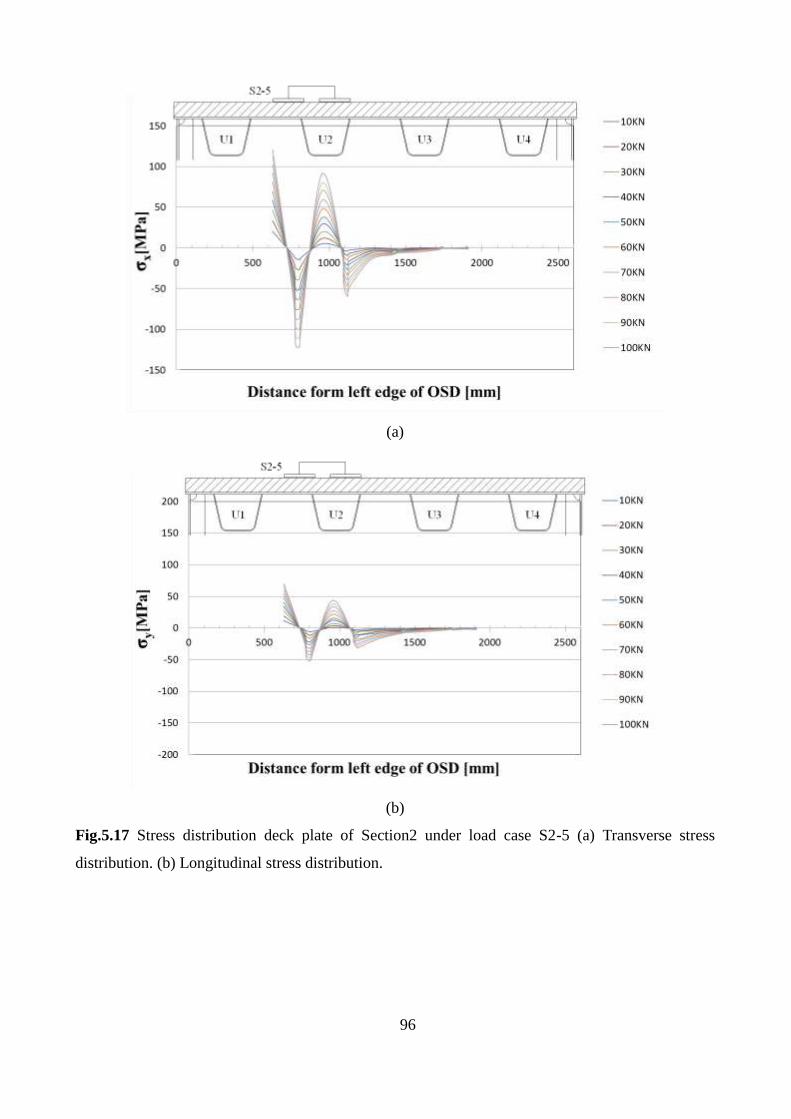
96
(a)
(b)
Fig.5.17 Stress distribution deck plate of Section2 under load case S2-5 (a) Transverse stress
distribution. (b) Longitudinal stress distribution.
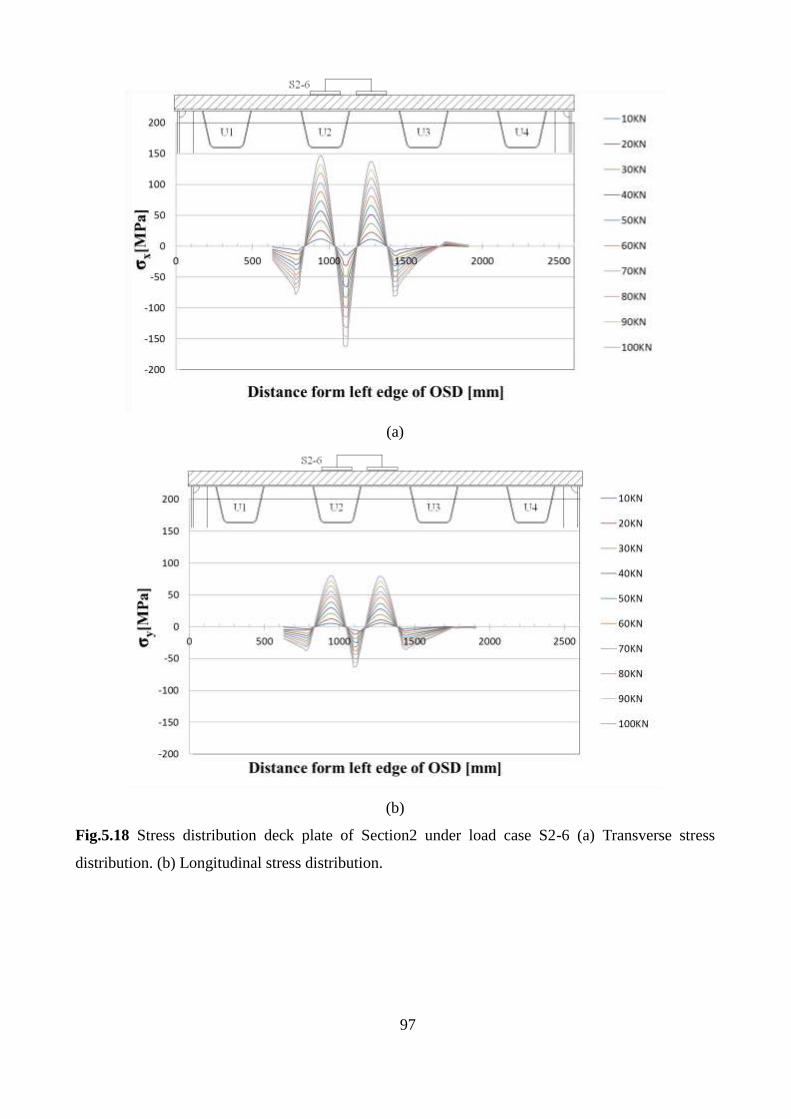
97
(a)
(b)
Fig.5.18 Stress distribution deck plate of Section2 under load case S2-6 (a) Transverse stress
distribution. (b) Longitudinal stress distribution.
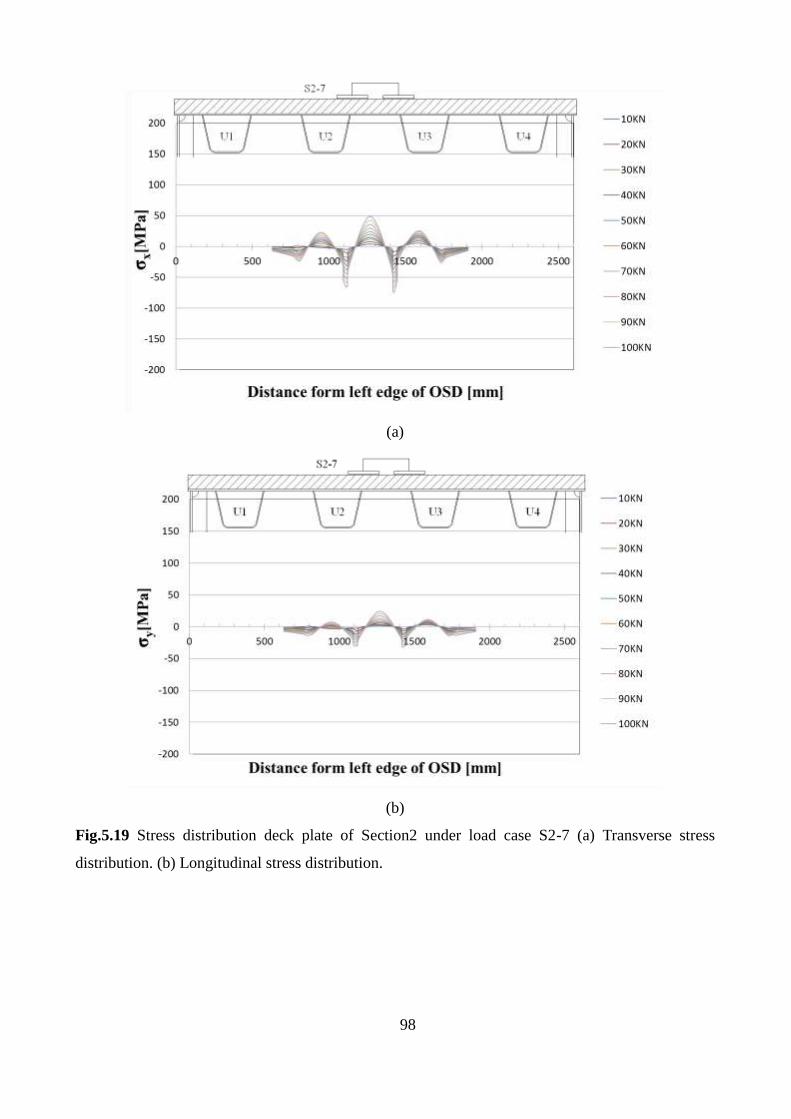
98
(a)
(b)
Fig.5.19 Stress distribution deck plate of Section2 under load case S2-7 (a) Transverse stress
distribution. (b) Longitudinal stress distribution.
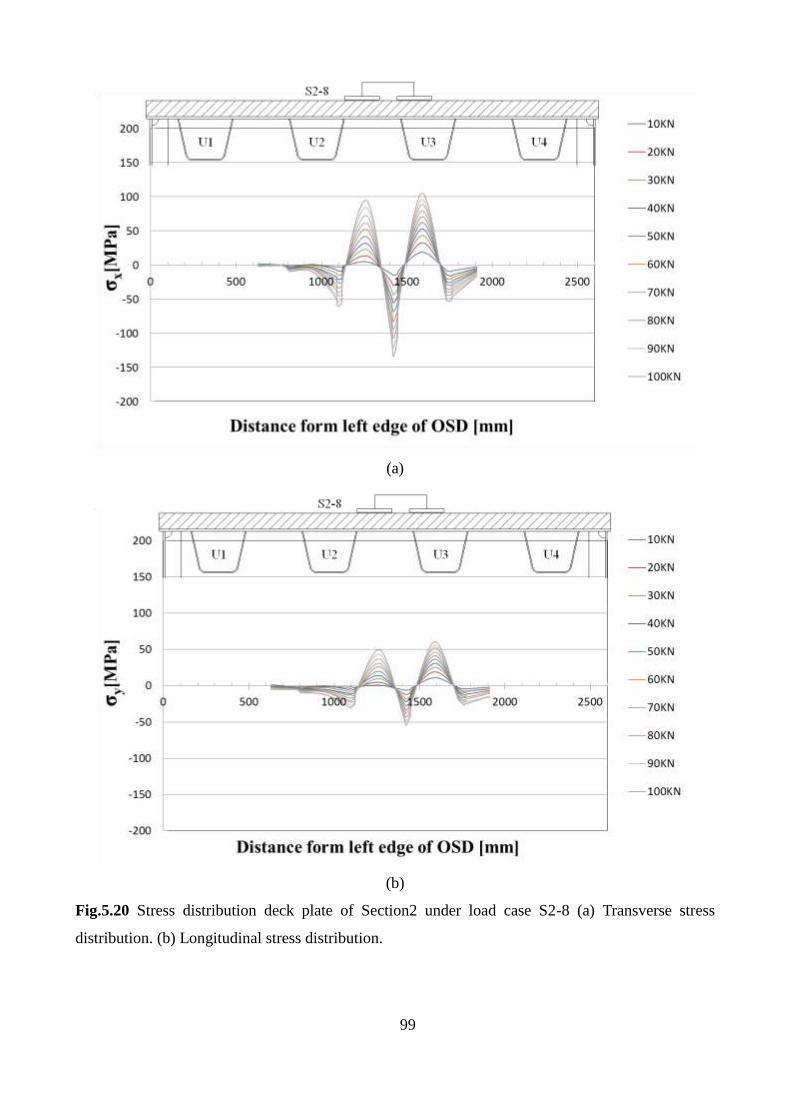
99
(a)
(b)
Fig.5.20 Stress distribution deck plate of Section2 under load case S2-8 (a) Transverse stress
distribution. (b) Longitudinal stress distribution.
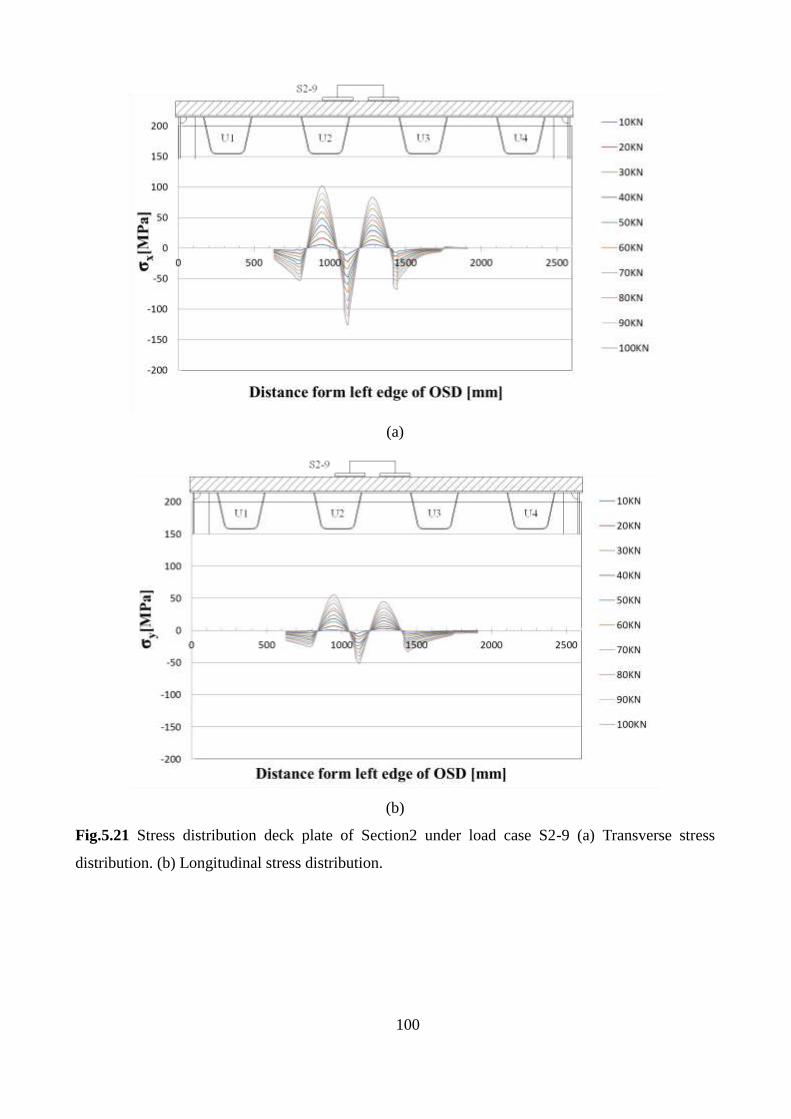
100
(a)
(b)
Fig.5.21 Stress distribution deck plate of Section2 under load case S2-9 (a) Transverse stress
distribution. (b) Longitudinal stress distribution.
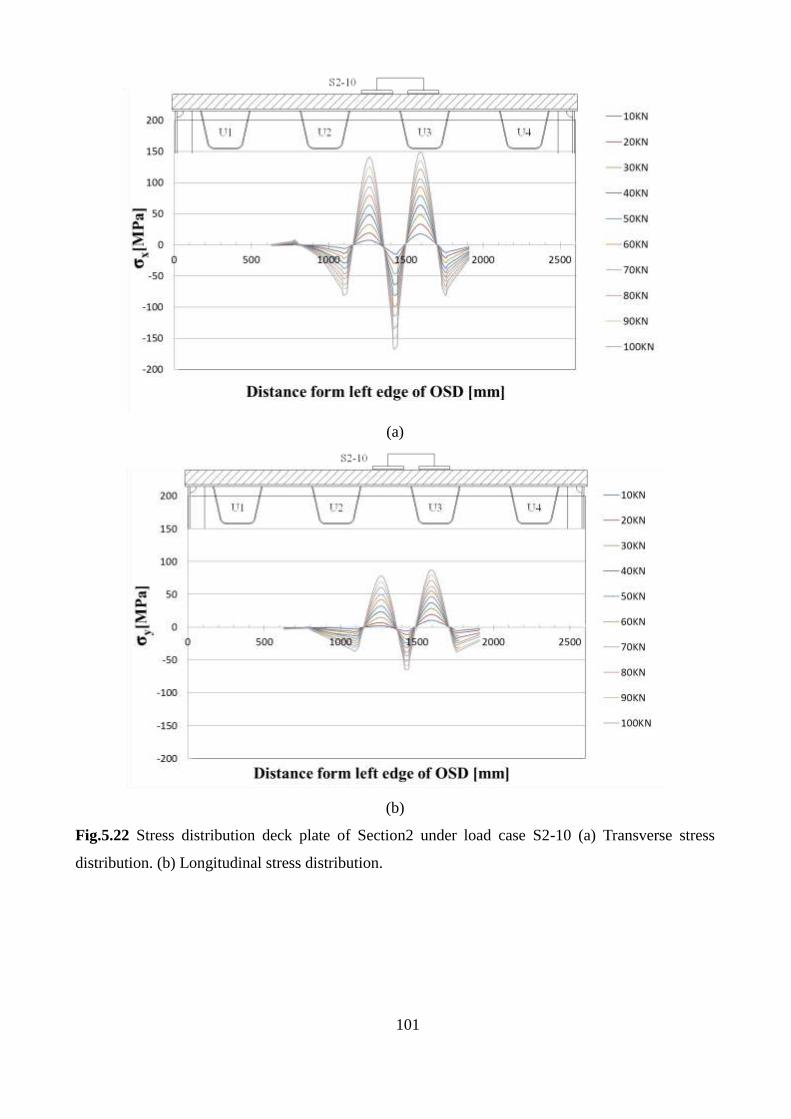
101
(a)
(b)
Fig.5.22 Stress distribution deck plate of Section2 under load case S2-10 (a) Transverse stress
distribution. (b) Longitudinal stress distribution.
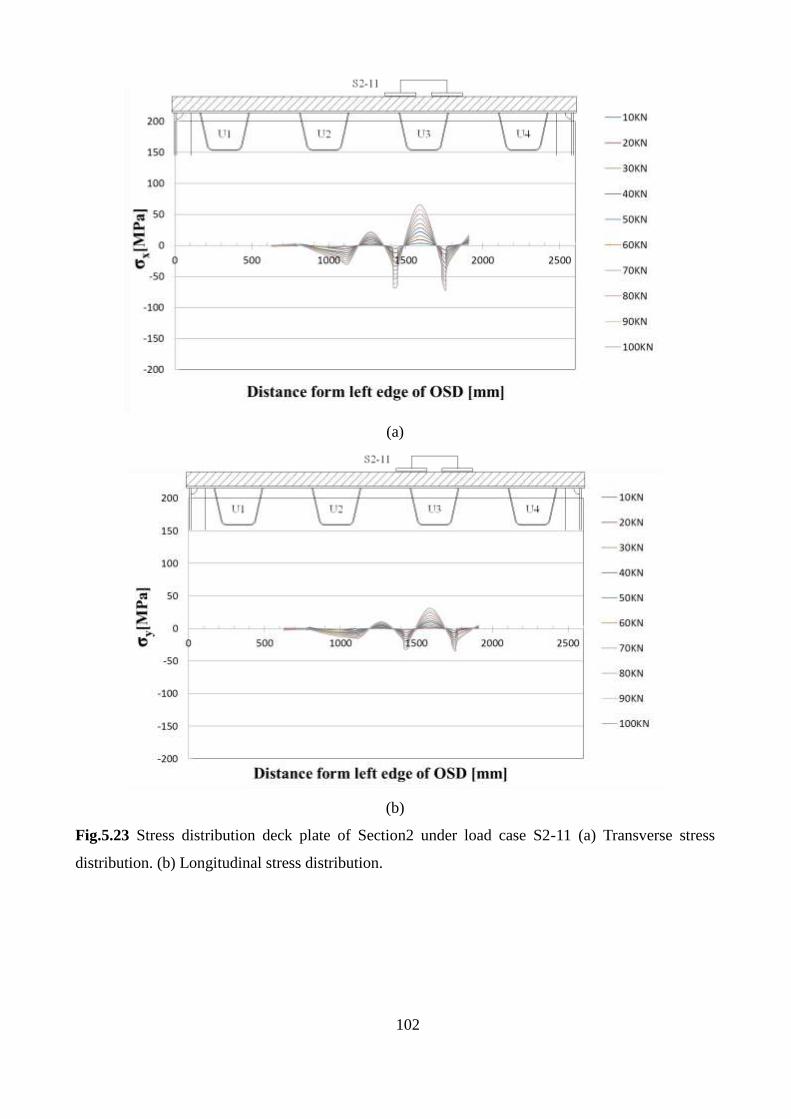
102
(a)
(b)
Fig.5.23 Stress distribution deck plate of Section2 under load case S2-11 (a) Transverse stress
distribution. (b) Longitudinal stress distribution.
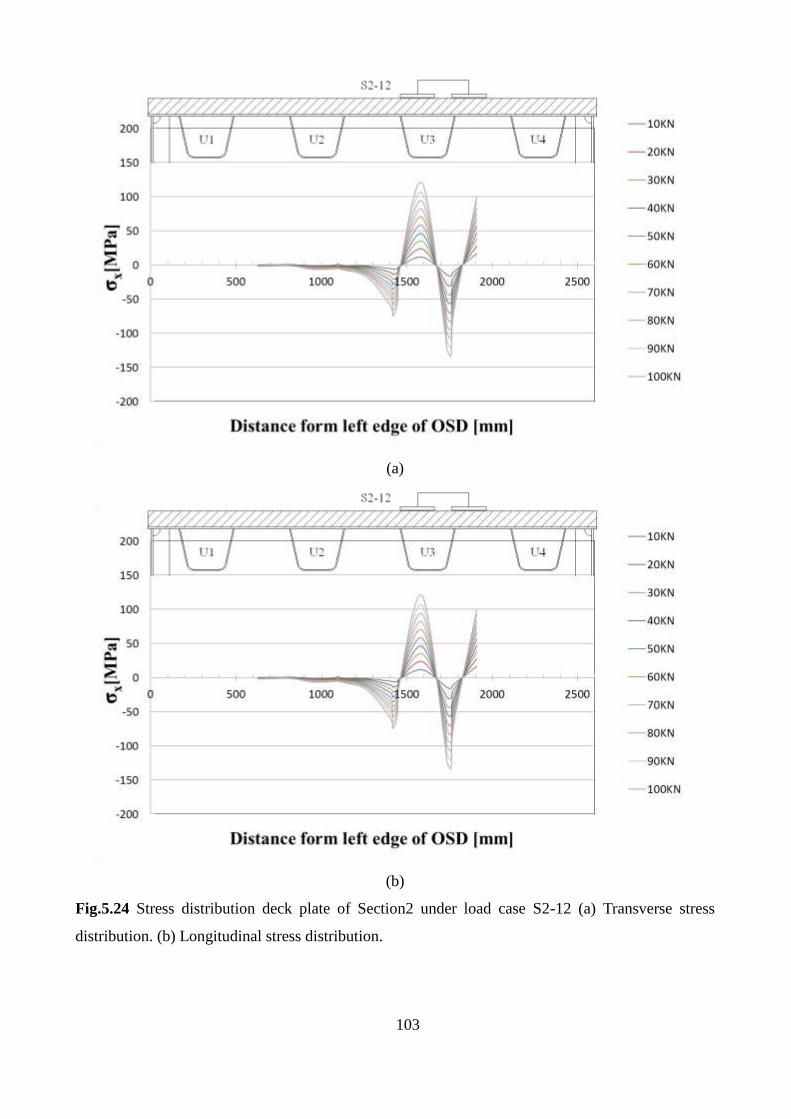
103
(a)
(b)
Fig.5.24 Stress distribution deck plate of Section2 under load case S2-12 (a) Transverse stress
distribution. (b) Longitudinal stress distribution.
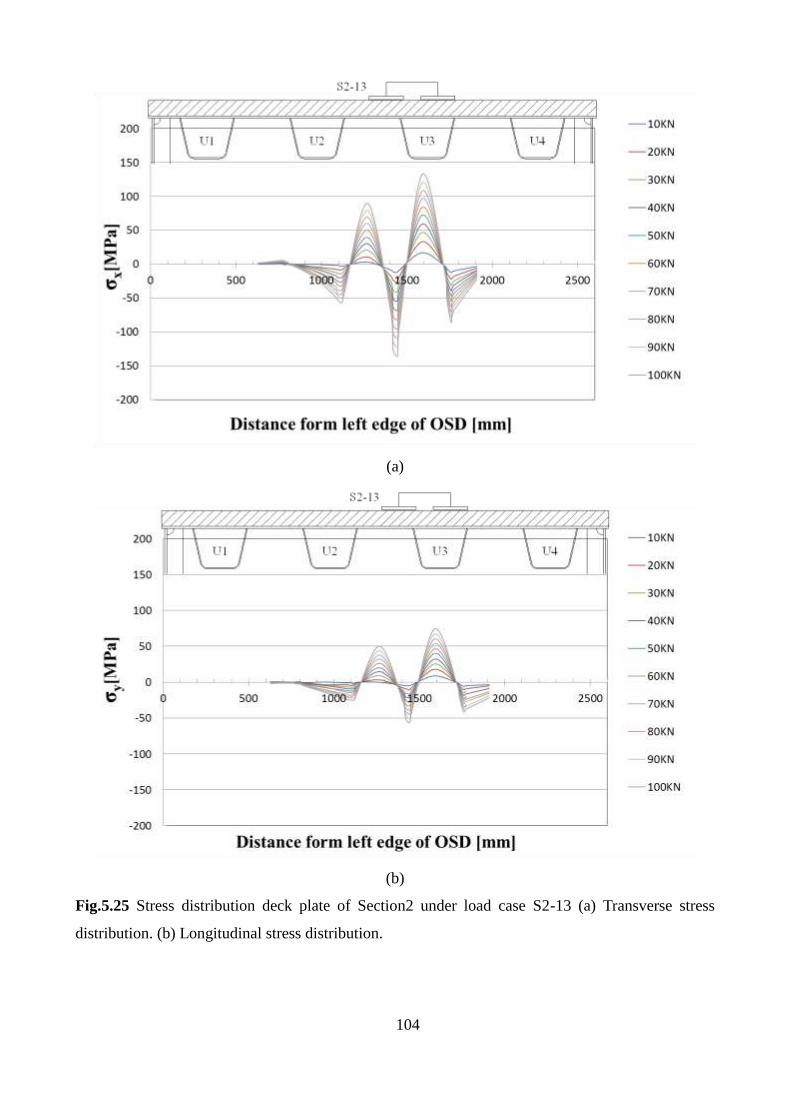
104
(a)
(b)
Fig.5.25 Stress distribution deck plate of Section2 under load case S2-13 (a) Transverse stress
distribution. (b) Longitudinal stress distribution.
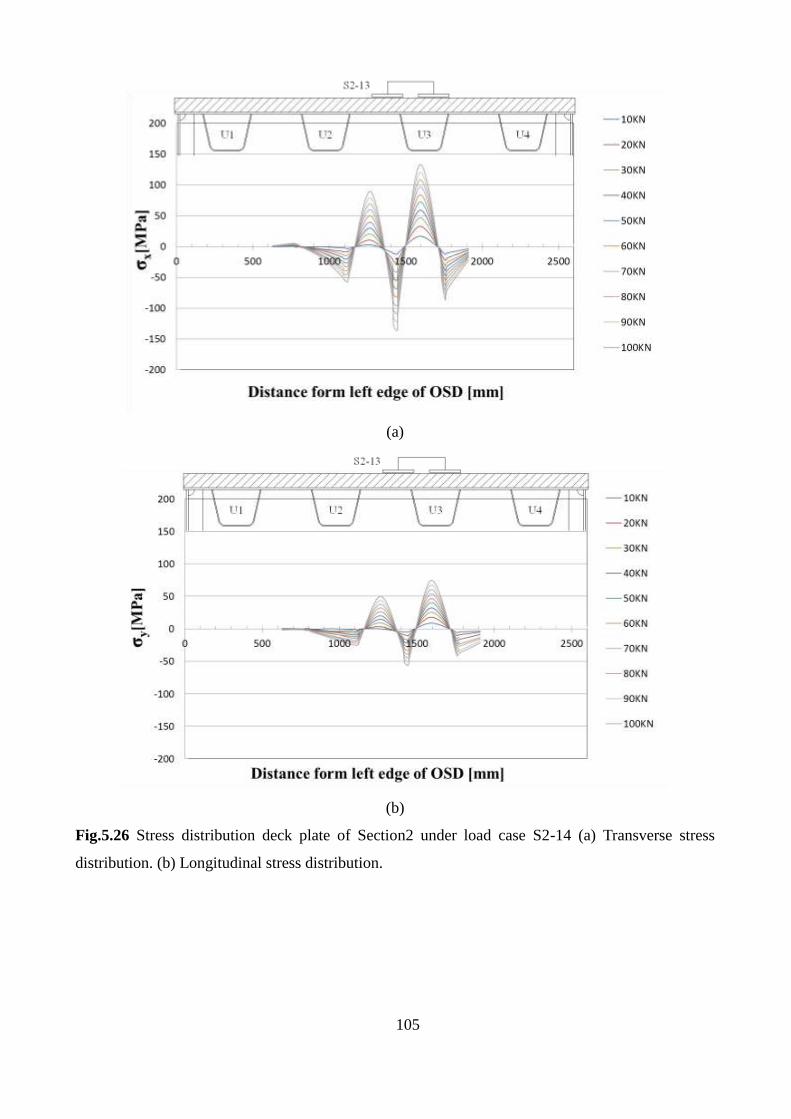
105
(a)
(b)
Fig.5.26 Stress distribution deck plate of Section2 under load case S2-14 (a) Transverse stress
distribution. (b) Longitudinal stress distribution.
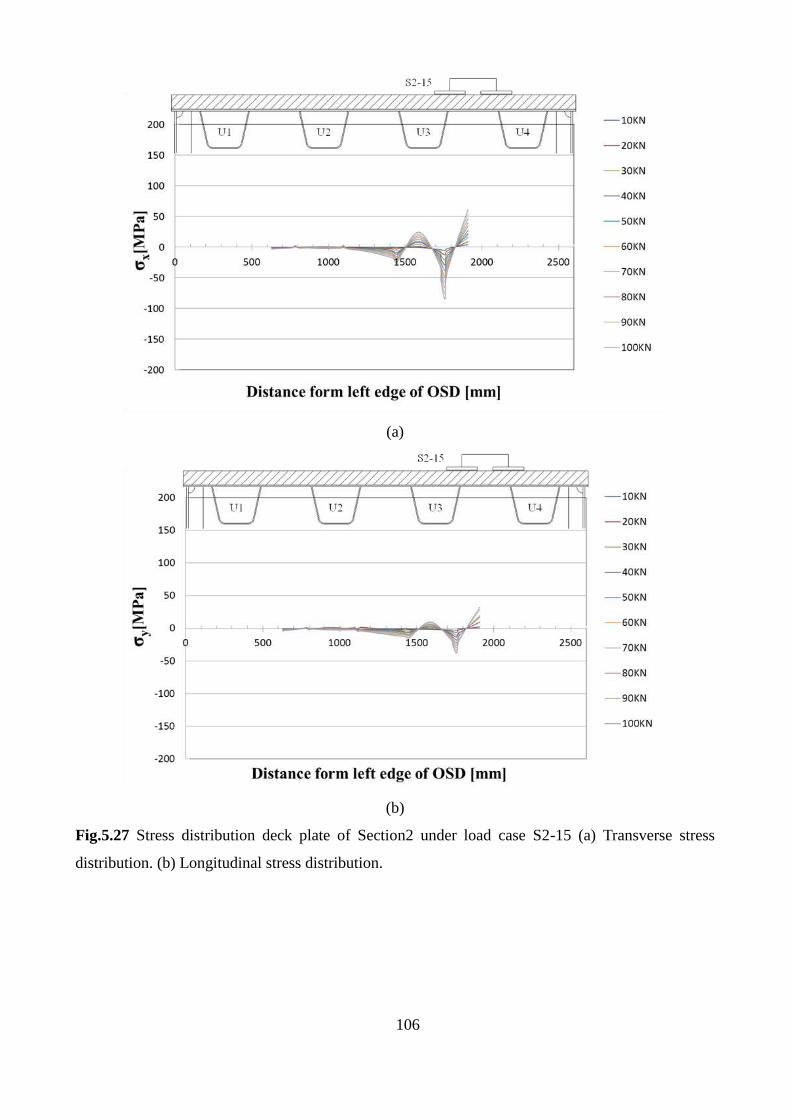
106
(a)
(b)
Fig.5.27 Stress distribution deck plate of Section2 under load case S2-15 (a) Transverse stress
distribution. (b) Longitudinal stress distribution.
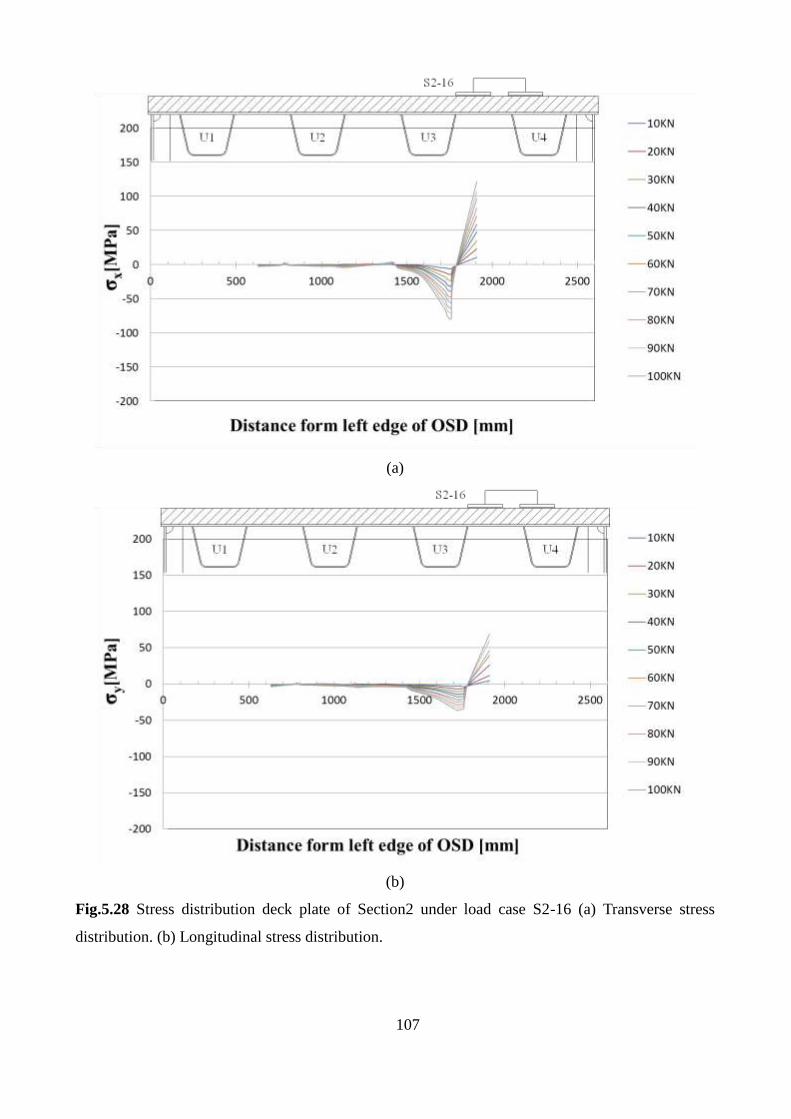
107
(a)
(b)
Fig.5.28 Stress distribution deck plate of Section2 under load case S2-16 (a) Transverse stress
distribution. (b) Longitudinal stress distribution.
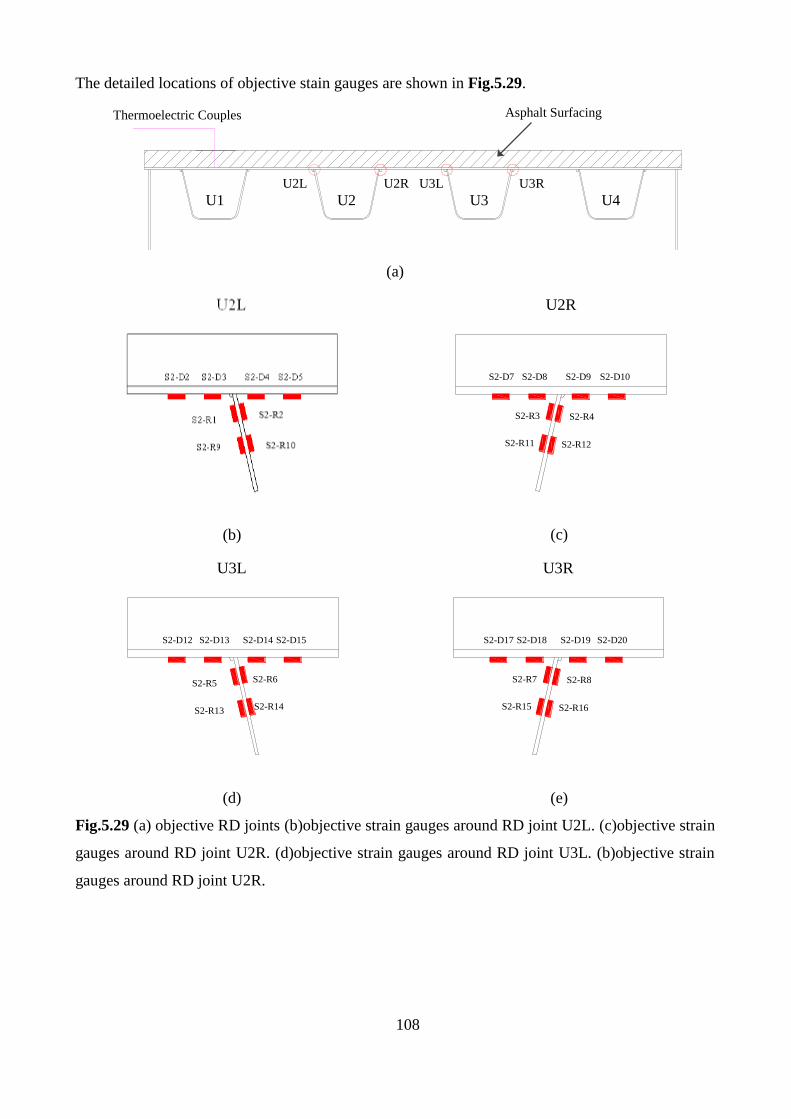
108
The detailed locations of objective stain gauges are shown in Fig.5.29.
(a)
(b)
(c)
(d)
(e)
Fig.5.29 (a) objective RD joints (b)objective strain gauges around RD joint U2L. (c)objective strain
gauges around RD joint U2R. (d)objective strain gauges around RD joint U3L. (b)objective strain
gauges around RD joint U2R.
U1 U2 U3 U4
U2L U2R U3L U3R
Thermoelectric Couples Asphalt Surfacing
S2-R9
S2-R1
S2-D3S2-D2 S2-D4 S2-D5
S2-R9
S2-R1
U2L
S2-R12
S2-R4
S2-D9 S2-D10S2-D8S2-D7
S2-R11
S2-R3
U2R
S2-R13
S2-R5
S2-D13S2-D12 S2-D14 S2-D15
S2-R14
S2-R6
U3L
S2-R16
S2-R8
S2-D19 S2-D20S2-D18S2-D17
S2-R15
S2-R7
U3R
S2-R9
S2-R1
S2-D3S2-D2 S2-D4 S2-D5
S2-R9
S2-R1
U2L
S2-R12
S2-R4
S2-D9 S2-D10S2-D8S2-D7
S2-R11
S2-R3
U2R
S2-R13
S2-R5
S2-D13S2-D12 S2-D14 S2-D15
S2-R14
S2-R6
U3L
S2-R16
S2-R8
S2-D19 S2-D20S2-D18S2-D17
S2-R15
S2-R7
U3R
S2-R9
S2-R1
S2-D3S2-D2 S2-D4 S2-D5
S2-R9
S2-R1
U2L
S2-R12
S2-R4
S2-D9 S2-D10S2-D8S2-D7
S2-R11
S2-R3
U2R
S2-R13
S2-R5
S2-D13S2-D12 S2-D14 S2-D15
S2-R14
S2-R6
U3L
S2-R16
S2-R8
S2-D19 S2-D20S2-D18S2-D17
S2-R15
S2-R7
U3R
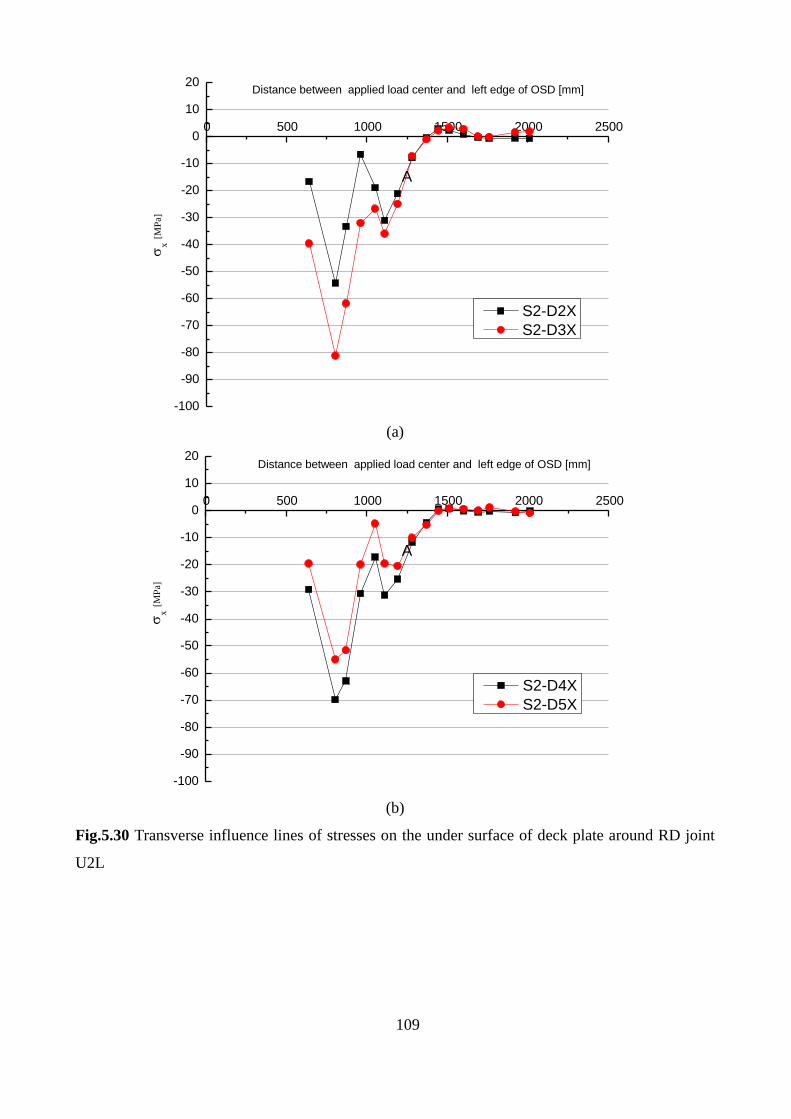
109
(a)
(b)
Fig.5.30 Transverse influence lines of stresses on the under surface of deck plate around RD joint
U2L
0 500 1000 1500 2000 2500
-100
-90
-80
-70
-60
-50
-40
-30
-20
-10
0
10
20Distance between applied load center and left edge of OSD [mm]
x [
MP
a]
A
S2-D2X
S2-D3X
0 500 1000 1500 2000 2500
-100
-90
-80
-70
-60
-50
-40
-30
-20
-10
0
10
20Distance between applied load center and left edge of OSD [mm]
x [
MP
a]
A
S2-D4X
S2-D5X
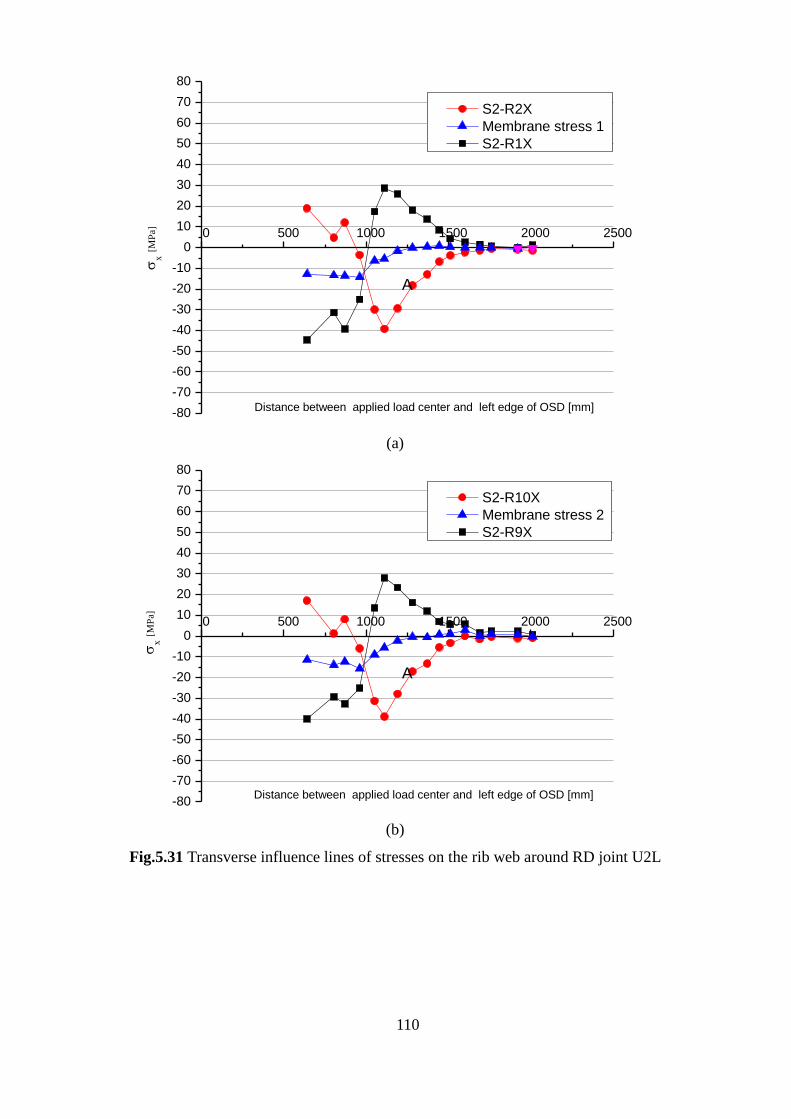
110
(a)
(b)
Fig.5.31 Transverse influence lines of stresses on the rib web around RD joint U2L
0 500 1000 1500 2000 2500
-80
-70
-60
-50
-40
-30
-20
-10
0
10
20
30
40
50
60
70
80
x [
MP
a]
Distance between applied load center and left edge of OSD [mm]
A
S2-R2X
Membrane stress 1
S2-R1X
0 500 1000 1500 2000 2500
-80
-70
-60
-50
-40
-30
-20
-10
0
10
20
30
40
50
60
70
80
x [
MP
a]
Distance between applied load center and left edge of OSD [mm]
A
S2-R10X
Membrane stress 2
S2-R9X
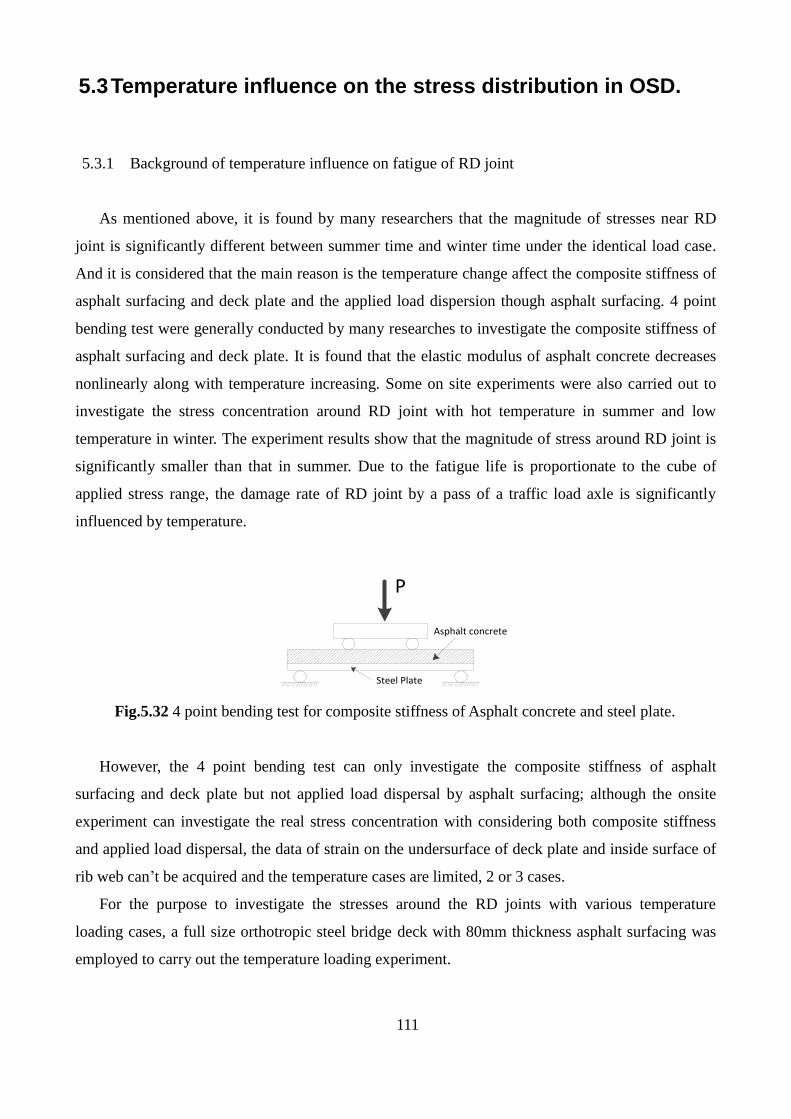
111
5.3 Temperature influence on the stress distribution in OSD.
5.3.1 Background of temperature influence on fatigue of RD joint
As mentioned above, it is found by many researchers that the magnitude of stresses near RD
joint is significantly different between summer time and winter time under the identical load case.
And it is considered that the main reason is the temperature change affect the composite stiffness of
asphalt surfacing and deck plate and the applied load dispersion though asphalt surfacing. 4 point
bending test were generally conducted by many researches to investigate the composite stiffness of
asphalt surfacing and deck plate. It is found that the elastic modulus of asphalt concrete decreases
nonlinearly along with temperature increasing. Some on site experiments were also carried out to
investigate the stress concentration around RD joint with hot temperature in summer and low
temperature in winter. The experiment results show that the magnitude of stress around RD joint is
significantly smaller than that in summer. Due to the fatigue life is proportionate to the cube of
applied stress range, the damage rate of RD joint by a pass of a traffic load axle is significantly
influenced by temperature.
Steel Plate
Asphalt concrete
P
Fig.5.32 4 point bending test for composite stiffness of Asphalt concrete and steel plate.
However, the 4 point bending test can only investigate the composite stiffness of asphalt
surfacing and deck plate but not applied load dispersal by asphalt surfacing; although the onsite
experiment can investigate the real stress concentration with considering both composite stiffness
and applied load dispersal, the data of strain on the undersurface of deck plate and inside surface of
rib web can’t be acquired and the temperature cases are limited, 2 or 3 cases.
For the purpose to investigate the stresses around the RD joints with various temperature
loading cases, a full size orthotropic steel bridge deck with 80mm thickness asphalt surfacing was
employed to carry out the temperature loading experiment.
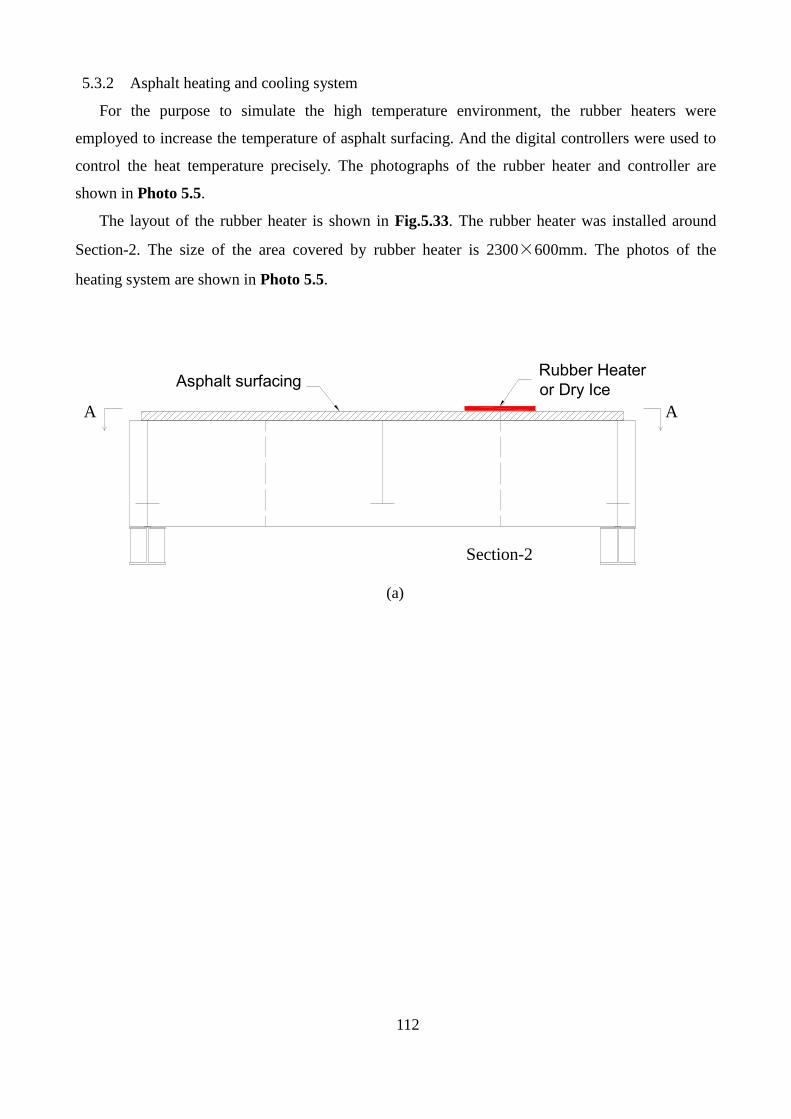
112
5.3.2 Asphalt heating and cooling system
For the purpose to simulate the high temperature environment, the rubber heaters were
employed to increase the temperature of asphalt surfacing. And the digital controllers were used to
control the heat temperature precisely. The photographs of the rubber heater and controller are
shown in Photo 5.5.
The layout of the rubber heater is shown in Fig.5.33. The rubber heater was installed around
Section-2. The size of the area covered by rubber heater is 2300×600mm. The photos of the
heating system are shown in Photo 5.5.
(a)
A A
Section-2
Rubber Heater
or Dry IceAsphalt surfacing
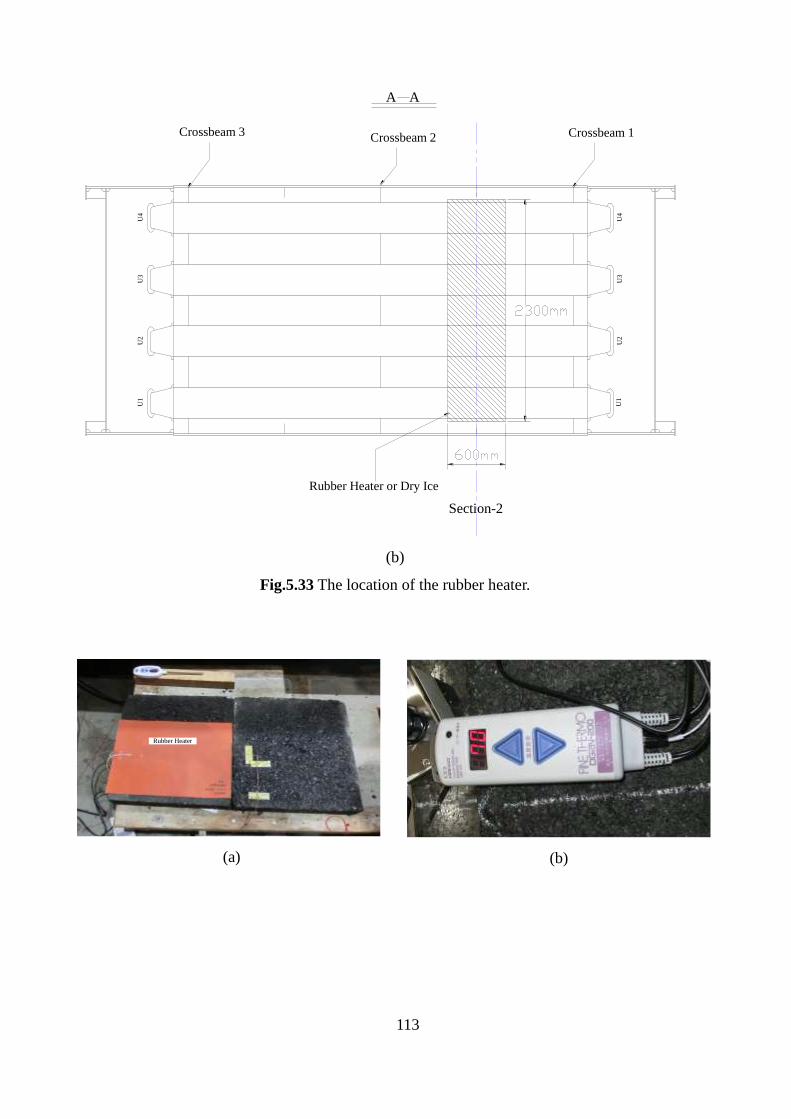
113
(b)
Fig.5.33 The location of the rubber heater.
(a)
(b)
A A
Section-2
U4
U3
U2
U1
U4
U3
U2
U1
Crossbeam 1Crossbeam 2Crossbeam 3
Rubber Heater or Dry Ice
Rubber Heater
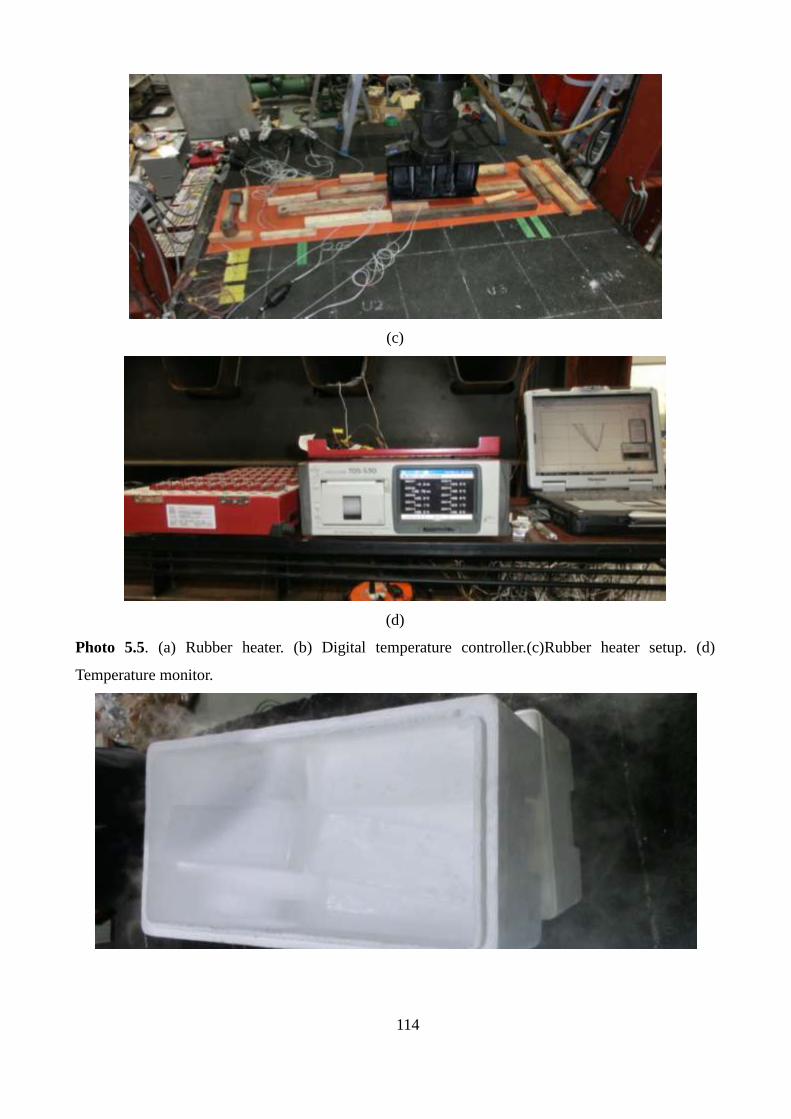
114
(c)
(d)
Photo 5.5. (a) Rubber heater. (b) Digital temperature controller.(c)Rubber heater setup. (d)
Temperature monitor.
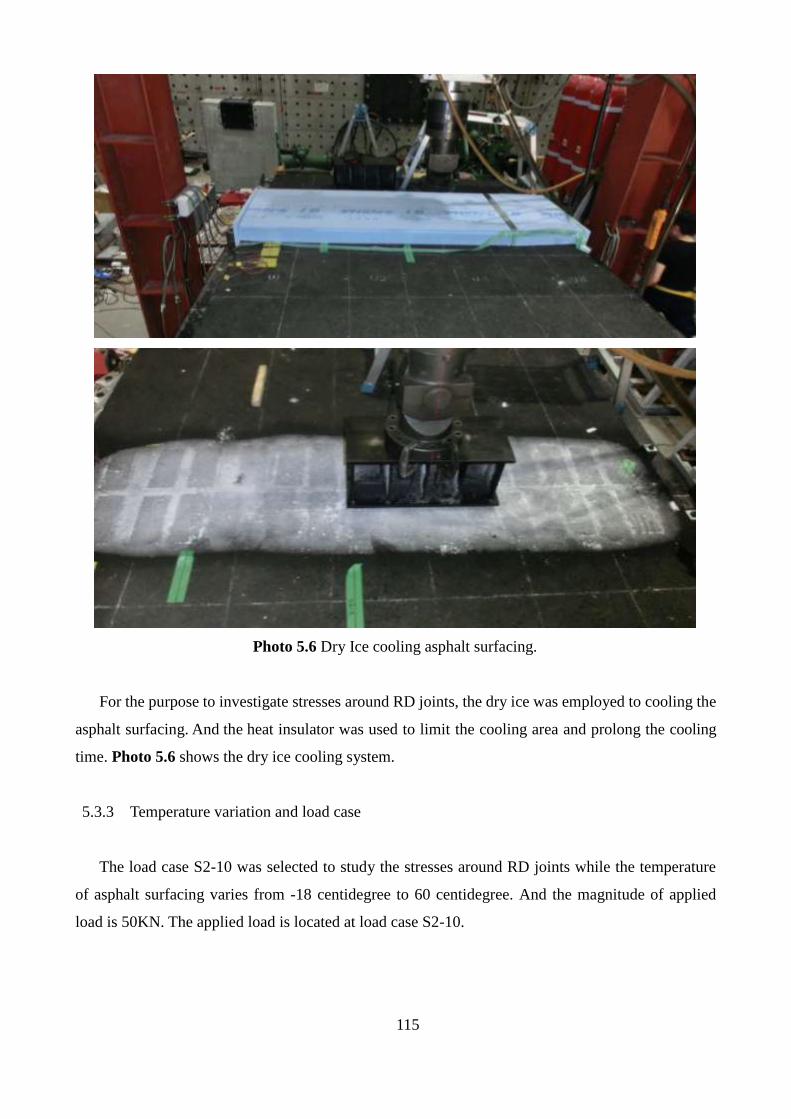
115
Photo 5.6 Dry Ice cooling asphalt surfacing.
For the purpose to investigate stresses around RD joints, the dry ice was employed to cooling the
asphalt surfacing. And the heat insulator was used to limit the cooling area and prolong the cooling
time. Photo 5.6 shows the dry ice cooling system.
5.3.3 Temperature variation and load case
The load case S2-10 was selected to study the stresses around RD joints while the temperature
of asphalt surfacing varies from -18 centidegree to 60 centidegree. And the magnitude of applied
load is 50KN. The applied load is located at load case S2-10.
116
5.3.4 The influence of temperature on stress distribution of deck plate and stress around RD
joints
The stress distribution of deck plate under applied load case S2-10 with various temperatures is
shown in Fig.5.34.
It can be seen form these figures that the stress distribution of deck plate is significantly
influenced by the temperature of asphalt surfacing. When the temperature higher than 35
centidegree or lower than minus 5 centidegree, the stresses around the RD joints don’t vary any
more. The most sensitive temperature range for stresses around RD joints is from 5 centidegree to
35 centidegree.
The stress around objective RD joints are shown in Fig.5.35 to Fig.5.40.
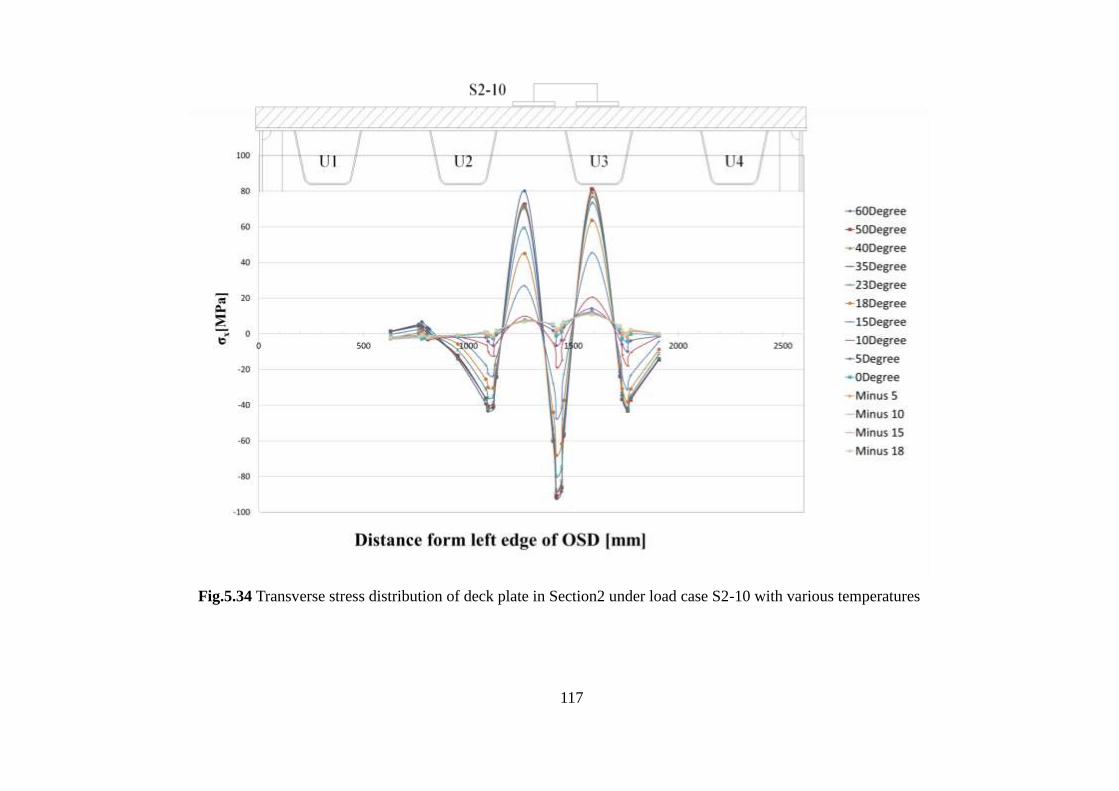
117
Fig.5.34 Transverse stress distribution of deck plate in Section2 under load case S2-10 with various temperatures
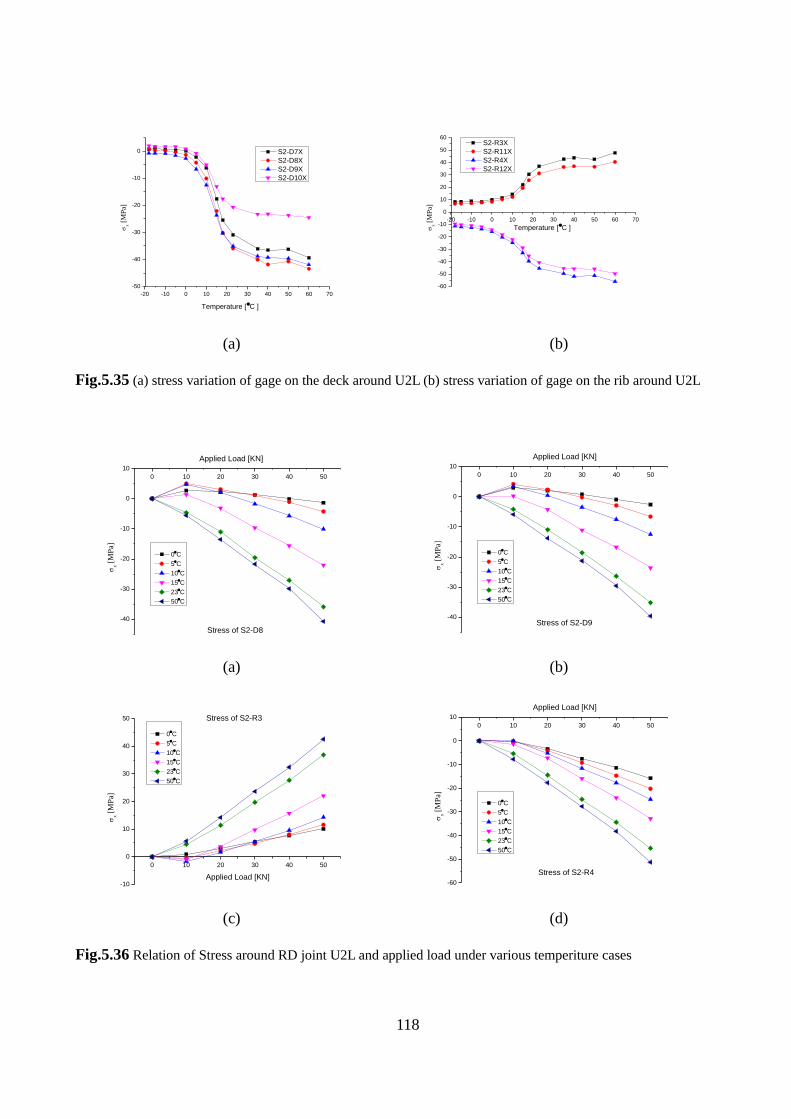
118
(a)
(b)
Fig.5.35 (a) stress variation of gage on the deck around U2L (b) stress variation of gage on the rib around U2L
(a)
(b)
(c)
(d)
Fig.5.36 Relation of Stress around RD joint U2L and applied load under various temperiture cases
-20 -10 0 10 20 30 40 50 60 70
-50
-40
-30
-20
-10
0
x [
MP
a]
Temperature [C ]
S2-D7X
S2-D8X
S2-D9X
S2-D10X
-20 -10 0 10 20 30 40 50 60 70
-60
-50
-40
-30
-20
-10
0
10
20
30
40
50
60
x [
MP
a]
Temperature [C ]
S2-R3X
S2-R11X
S2-R4X
S2-R12X
0 10 20 30 40 50
-40
-30
-20
-10
0
10
Stress of S2-D8
x [
MP
a]
Applied Load [KN]
0C
5C
10C
15C
23C
50C
0 10 20 30 40 50
-40
-30
-20
-10
0
10
Stress of S2-D9
x [
MP
a]
Applied Load [KN]
0C
5C
10C
15C
23C
50C
0 10 20 30 40 50
-10
0
10
20
30
40
50 Stress of S2-R3
x [
MP
a]
Applied Load [KN]
0C
5C
10C
15C
23C
50C
0 10 20 30 40 50
-60
-50
-40
-30
-20
-10
0
10
Stress of S2-R4
x [
MP
a]
Applied Load [KN]
0C
5C
10C
15C
23C
50C
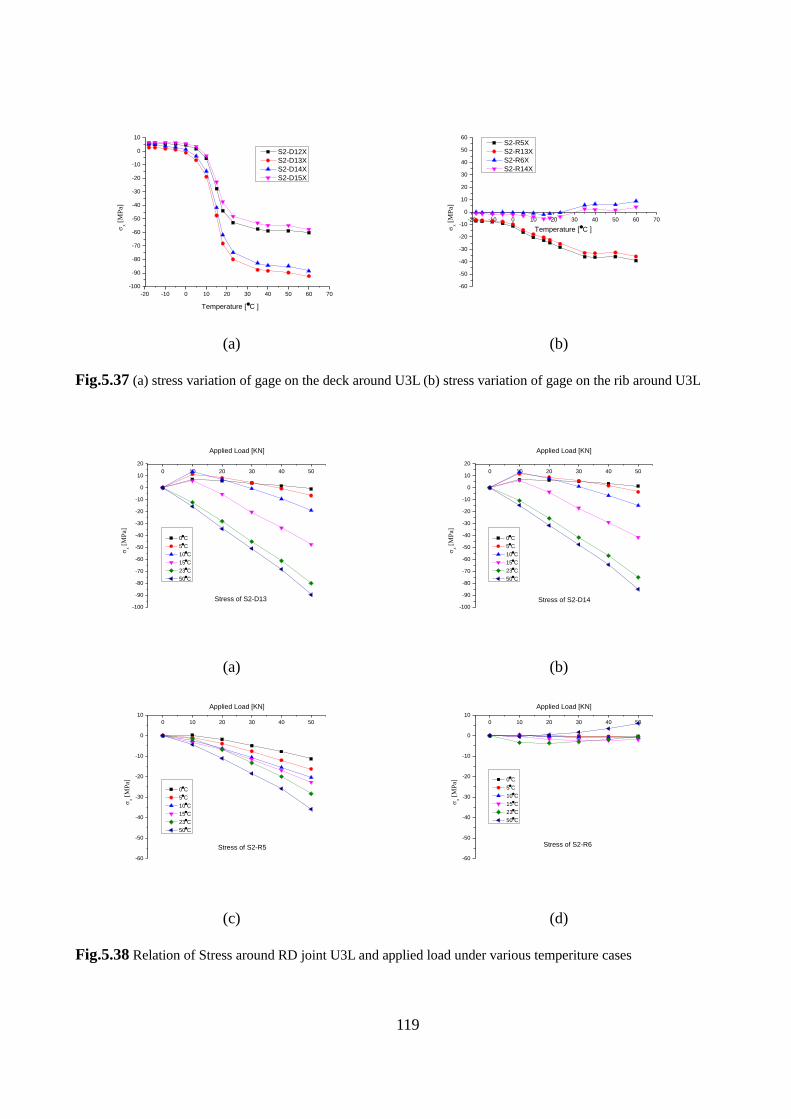
119
(a)
(b)
Fig.5.37 (a) stress variation of gage on the deck around U3L (b) stress variation of gage on the rib around U3L
(a)
(b)
(c)
(d)
Fig.5.38 Relation of Stress around RD joint U3L and applied load under various temperiture cases
-20 -10 0 10 20 30 40 50 60 70
-100
-90
-80
-70
-60
-50
-40
-30
-20
-10
0
10
x [
MP
a]
Temperature [C ]
S2-D12X
S2-D13X
S2-D14X
S2-D15X
-20 -10 0 10 20 30 40 50 60 70
-60
-50
-40
-30
-20
-10
0
10
20
30
40
50
60
x [
MP
a]
Temperature [C ]
S2-R5X
S2-R13X
S2-R6X
S2-R14X
0 10 20 30 40 50
-100
-90
-80
-70
-60
-50
-40
-30
-20
-10
0
10
20
Stress of S2-D13
x [
MP
a]
Applied Load [KN]
0C
5C
10C
15C
23C
50C
0 10 20 30 40 50
-100
-90
-80
-70
-60
-50
-40
-30
-20
-10
0
10
20
Stress of S2-D14
x [
MP
a]Applied Load [KN]
0C
5C
10C
15C
23C
50C
0 10 20 30 40 50
-60
-50
-40
-30
-20
-10
0
10
Stress of S2-R5
x [
MP
a]
Applied Load [KN]
0C
5C
10C
15C
23C
50C
0 10 20 30 40 50
-60
-50
-40
-30
-20
-10
0
10
Stress of S2-R6
x [
MP
a]
Applied Load [KN]
0C
5C
10C
15C
23C
50C
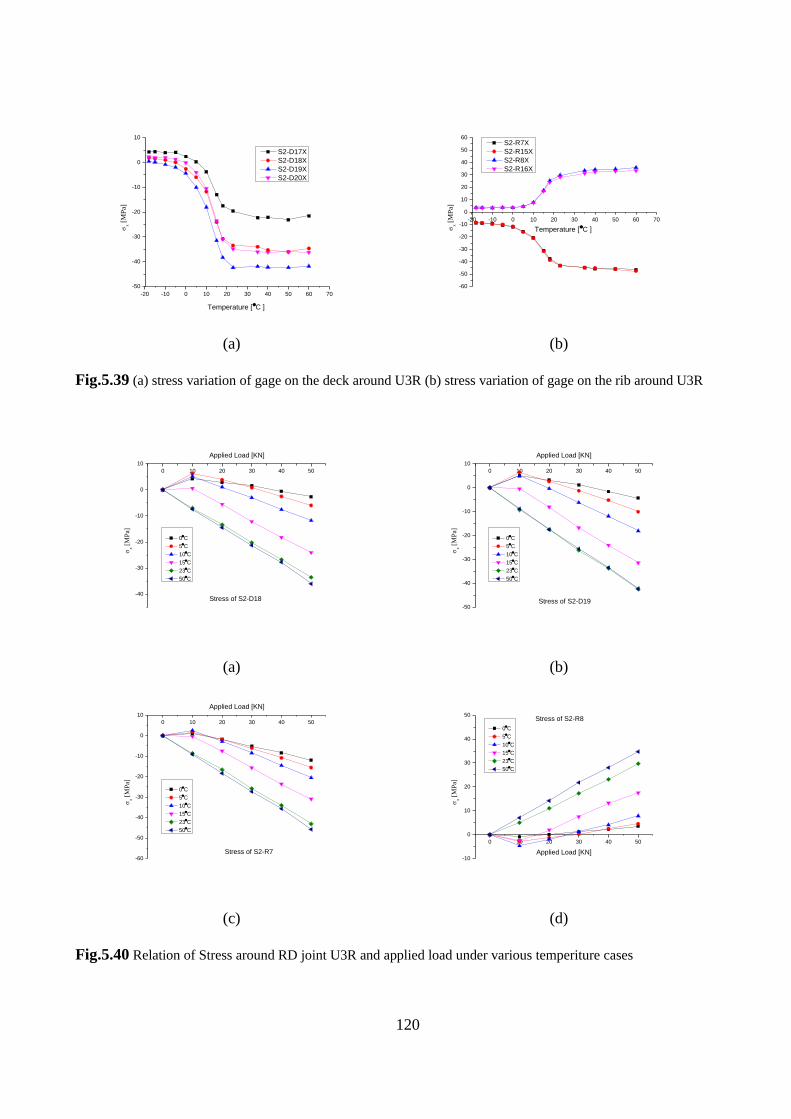
120
(a)
(b)
Fig.5.39 (a) stress variation of gage on the deck around U3R (b) stress variation of gage on the rib around U3R
(a)
(b)
(c)
(d)
Fig.5.40 Relation of Stress around RD joint U3R and applied load under various temperiture cases
-20 -10 0 10 20 30 40 50 60 70
-50
-40
-30
-20
-10
0
10
x [
MP
a]
Temperature [C ]
S2-D17X
S2-D18X
S2-D19X
S2-D20X
-20 -10 0 10 20 30 40 50 60 70
-60
-50
-40
-30
-20
-10
0
10
20
30
40
50
60
x [
MP
a]
Temperature [C ]
S2-R7X
S2-R15X
S2-R8X
S2-R16X
0 10 20 30 40 50
-40
-30
-20
-10
0
10
Stress of S2-D18
x [
MP
a]
Applied Load [KN]
0C
5C
10C
15C
23C
50C
0 10 20 30 40 50
-50
-40
-30
-20
-10
0
10
Stress of S2-D19
x [
MP
a]Applied Load [KN]
0C
5C
10C
15C
23C
50C
0 10 20 30 40 50
-60
-50
-40
-30
-20
-10
0
10
Stress of S2-R7
x [
MP
a]
Applied Load [KN]
0C
5C
10C
15C
23C
50C
0 10 20 30 40 50
-10
0
10
20
30
40
50Stress of S2-R8
x [
MP
a]
Applied Load [KN]
0C
5C
10C
15C
23C
50C
121
5.3.5 Viscoelasticity response of asphalt surfacing influence on stress around RD joints
Due to the asphalt is a kind of viscoelastic material, the property of the asphalt is affected by the
load endurance time and magnitude of load. Under a constant applied load, the elastic modulus of
asphalt decreases along with time lapsing. Because the heavy truck speed is more faster than the
loading speed we used in the experiment, the loading case in the experiment is more harmful for RD
joints and it is good for security considering. Refer to the magnitude of load, in this study when the
applied load is increasing from 0 to 100KN in the speed of 1 KN per second, the response of stress
around the RD joint is linear, near elastic response. And the viscoelastic is only expressed in unload
period. It will not influence the fatigue evaluation of RD joint, because the stress peak of RD joint
in one load cycle is only related to the load period rather than unload period.
5.4 Summary and conclusion
In this study, a full size specimen of orthotropic steel deck with 80mm thickness asphalt surfacing
were employed to simulate and investigate real stress around RD joints in onside steel orthotropic
bridge decks. The experiment result shows: 1. under quasistatic increasing applied load, the stresses
around the RD joints, near the applied load, of deck plate increasing lineally; 2. the stresses of
undersurfaces of deck plate around the RD joints, near the applied load, are negative value under all
applied loads.; 3.significant undersurface deck plate stresses distributed in the range between the
closest RD joints; 4.the magnitude of transverse stress is far larger than that of corresponding
longitudinal stress on the undersurface of deck plate. 5 the applied load, while it riding on the RD
joint, causes the minimum value of stress on undersurface of deck plate around the RD joint.
From the transverse influence lines of stress around RD joint, it can be concluded that the stress
around the RD joint is very sensitive to the transverse location of the applied load and the influence
122
range is between two adjacent RD joints. The maximum transverse stresses on the deck plate
around RD joint occur while the applied load ride on the RD joint.
Due to asphalt is kind of temperature dependent material, in this study a special heating and
cooling system were designed to investigate the stress distribution on the deck plate and the stress
concentration around RD joints under applied load with various temperature from -18 centidegree
to 60 centidegree. The experiment results shows that stress distribution of deck plate is significantly
influenced by the temperature of asphalt surfacing. While the temperature is higher than 35 Celsius
degree or lower than minus 5 Celsius degree, the stresses around the RD joints don’t vary any more.
The most sensitive temperature range for stresses around RD joints is from 5 Celsius degree to 35
Celsius degree.
5.5 Reference
[1] R. Connor, J. Fisher, W. Gatti, V. Gopalaratnam, B. Kozy, B. Leshko, D.L. McQuaid, R.
Medlock, D. Mertz, T. Murphy, Manual for design, construction, and maintenance of orthotropic
steel deck bridges, in, 2012.
[2] S. Inokuchi, H. Ishii, T. Ishigaki, H. Maeno, T. Sumi, K. Yamata, Fatigue assessment for
weld between deck plate and U-rib in orthotropic steel consideration of pavement properties,
Journal of Structural Mechanics and Earthquake Engineering, 66 (2010) 79-91.
123
CHAPTER 6
SUMMARIES and CONCLUSIONS
Orthotropic steel bridge decks (OSDs) are widely used in the long-span bridges, movable
bridges and urban viaducts. However, after long with the traffic volume of overload axles increasing
and the orthotropic steel bridge decks directly submit to the wheel loads, many fatigue cracks in
orthotropic steel bridge decks were reported in japan recently. Among these fatigue cracks, the
cracks occurred around the rib to deck joints are one kind of the most critical fatigue cracks which
may cause impact on the traffic safety, because the rib to deck joint fatigue fracture will induce the
asphalt surfacing damage or rain water leaking in into the inside of the orthotropic steel decks and
hence steel corrosion. However, due to the complicated geometry and stress state of the rib-to-deck
joints, until now, the fatigue test data for rib-to-deck joint is far more from sufficient to determine
any comprehensive fatigue classification for fatigue design in Japan. This study is focused on the
fatigue behavior of the rib-to-deck joints in orthotropic steel bridge decks.
In chapter 1, the background of the cause of fatigue fracture and fatigue crack initiation and
propagation mechanics for metals and welding joints are introduced. Various fatigue life evaluation
methods are introduced and discussed. Among these evaluation methods the fatigue strength
classification for different welding details and loading conditions based on the S-N curves are most
widely used in fatigue design specifications or recommendations not only in japan but also in
abroad. And the S-N curves are the most acceptable method for designers and engineers due to it is
easy for design and understand. For the fatigue cracks initiation from the weld toe and the welding
joint is not covered by the fatigue strength classification welding joint details, the structure hotspot
stress method is recommended by the JSSC and IIW i.e. using the hotspot stress instead of normal
stress based on the fatigue strength classification of the corresponding cruciform welding joint.
However the hot spot stress method doesn’t cover the fatigue crack initiation from weld root.
The linear elastic fracture mechanics (LEFM) is always employed to evaluate the fatigue life of
the welding joint which is not covered by the fatigue strength classification welding joint details
with the fatigue crack initiating from the weld root. Most scholars prefer using the LEFM to
evaluate the fatigue life of welding joints rather than the fatigue strength classification, since the
LEFM is more theoretical rather than the fatigue strength classification which based on statistical
analysis of results of fatigue tests. But the disadvantage of the LEFM is that it can only be
employed to evaluate the fatigue life in the fatigue crack growth period not the initiation period. It is
124
very hard to evaluate the fatigue life of weld joint accurately. So in a sense, the fatigue strength
classification is more accurate and practicable.
In the chapter 2, the historical development of OSDs is reviewed. The typical components of
OSDs are introduced. The OSDs in abroad and japan and the direct cause of typical fatigue cracks
in OSDs are introduced. The macro analysis of rib-to-deck fatigue cracks in the Wangan route of
Hanshin expressway was carried out in this chapter. The macro analysis shows that most fatigue
cracks around the RD joint located in the driving lines with large traffic volume of heavy load axles.
And all the RD fatigue cracks are located in the transverse range of 800mm from tire center. It
could be concluded that the fatigue fracture of rib-to-deck joint is significantly sensitive to the
volume of heavy load axles and transverse locations of wheel loads.
In the chapter 3, for the purpose to investigate the stress around RD joints, A FE model of
partial orthotropic steel deck was made using the general purpose FE software Abaqus based on
actual dimension of a box girder bridge located in the coast line of Hanshin highway. The
calculation result of stresses around the RD joint under various loading cases shows that the
out-plane stresses are dominate stresses and significantly sensitive to the transverse loading location.
With respect to the cross-section 1, the maximum out-plane stress of deck pate is obtained by the
wheel load ride on the objective joint, the maximum and minimum out-plane stress of the rib wall is
obtained by wheel load applied 250mm away from the objective joint and the membrane stress of
the rib wall increases while the wheel load closes the objective joint. With respect to the
cross-section 2, due to the stiffness of crossbeam is significant, the membrane stress of the rib wall
is more significant than at cross-section 1 and there are flat steps in all stress influence lines of the
deck plate and rib wall. According to longitudinal influence lines of stresses around the RD joint
along the three critical driving paths, the stress sensitive length on the driving path by a passage of a
wheel load is less than 3m that is significant short compared to a span of bridge.
The wheel load dispersal is investigated using FE-model in this chapter. The vertical contact
stress of the bottom surface of the asphalt surfacing is used to investigate wheel load dispersal
through asphalt surfacing and the analysis result shows that the wheel load is not uniformly
distributed on the deck plate, the load is concentrated to the rib-to-deck joint. Furthermore, with the
stiffness of the asphalt surfacing increasing, the wheel load concentrates significantly to the RD
joints (hard points) which have larger stiffness. Two load models were employed to investigate the
influence of load dispersal and surfacing-deck composite stiffness on the stresses around rib-to-deck
joint, and the result shows that the stresses around the RD joint are significantly decreased by
asphalt surfacing. But there is no significant difference of the stresses around the RD joint under the
125
Load model 1 and Load model 2. This may indicate that the surfacing-deck composite stiffness
contribute the major portion of the decrease of the stress around the rib-to-deck joint.
In this chapter, the fatigue life of RD joint in various kinds of OSDs (without surfacing, with
asphalt surfacing, and with asphalt surfacing considering temperature effect) for the crack initiating
form weld toe (type 1) was evaluated, using the structure hot spot stress method, based on fatigue
resistance class E of the fatigue design S-N curves (JSSC). The calculation result shows that the
asphalt surfacing can increase the fatigue life of the RD joint dramatically. However due to the
asphalt which is a kind of temperature dependent material, the RD joint fatigue life is significantly
shorter with considering temperature effect. Moreover the effective notch stresses associated with
the type 2 and type 4 is also calculated. The result shows that along with the elastic modulus
increasing, the effective notch stresses decrease dramatically, and the location of maximum stress is
also influenced by the elastic modulus of asphalt surfacing. Since the stress concentration location
is the potential fatigue crack initiation point, the elastic modulus of the asphalt surfacing may
influence the crack initiation point and hence propagation direction. The maximum stress occurs in
the upper side of the root notch may correlate to the crack type 2, propagating in the deck plate and
in the lower side of the root notch may correlate to the crack type 4, propagating in the weld throat.
In chapter 4, due to fatigue test data is for from sufficient to determine the fatigue strength class
for the rib-to-deck joint and for the purpose to investigate the influence of weld penetration rate on
the fatigue strength of rib-to-deck joint. Two series full scale rib-to-deck joint specimens were
tested.
A new kind fatigue test system based on the electrical vibrator-loading was designed with
considering the cycle loading frequency and economical cost. And the boundary condition and
applied loading location employed in this test program is to simulate the stress state around the
rib-to-deck joint in the mid-span between crossbeams under the wheel load applied out the rib box.
The fatigue test result shows that all the specimens with weld penetration ratio 15% all fatigue
fractured due to the fatigue crack initiating from weld root and propagating to the weld bead surface;
all the specimens with weld penetration ratio 75% all fatigue test fatigue fractured due to the fatigue
crack initiating from weld toe and propagating to the deck plate. Moreover the fatigue strength of
the rib-to-deck joint with weld penetration ratio 75% is significantly higher than the rib-to-deck
with weld penetration ratio 15%.
In chapter 5, a full size specimen of orthotropic steel deck with 80mm thickness asphalt
surfacing were employed to simulate and investigate real stress around RD joints in onside steel
orthotropic bridge decks. The experiment result shows that under quasistatic increasing applied load,
the stresses around the RD joints, near the applied load, of deck plate increasing lineally; 2. The
126
stresses of undersurfaces of deck plate around the RD joints, near the applied load, are negative
value under all applied loads; 3.most significant stresses distributed in the range between the closest
RD joints; 4.the magnitude of transverse stress is far larger than that of corresponding longitudinal
stress on the undersurface of deck plate. 5 the applied load, while it riding on the RD joint, causes
the minimum value of stress on undersurface of deck plate around the RD joint. Due to asphalt is
kind of temperature dependent material, in this study a special heating and cooling system were
designed to investigate the stress distribution on the deck plate and the stress concentration around
RD joints under applied load with various temperature from -18 centidegree to 60 centidegree. The
experiment results shows that stress distribution of deck plate is significantly influenced by the
temperature of asphalt surfacing. While the temperature is higher than 35 Celsius degree or lower
than minus 5 Celsius degree, the stresses around the RD joints don’t vary any more. The most
sensitive temperature range for stresses around RD joints is from 5 Celsius degree to 35 Celsius
degree.
127
Author’s Research Activities
Journal Papers with Reviewing
Ming. Li, K. Hashimoto, K. Sugiura, “Influence of asphalt surfacing on fatigue evaluation of
Rib-to-Deck joints in orthotropic steel bridge decks”, J Bridge Eng., ASCE, Vol.19(10),
pp.04014038. 1-14, 2014.10
Ming. Li, K. Hashimoto, Y. Suzuki, K. Sugiura, “Experimental study on fatigue strength of
Rib-to-Deck joints in orthotropic steel bridge decks”, (Preparing).
Ming. Li, K. Hashimoto, Y. Suzuki, K. Sugiura, “Experimental and numerical investigation on
stress distribution around Rib-to-Deck Joints with considering temperature influence.”
(Preparing).
Conference, Symposium, Colloquium and Seminar paper
Ming Li, Kunitaro Hashimoto, Kunitomo Sugiura, “Stress Analysis of Rib-To-Deck Joint In
Orthotropic Steel Bridge Deck Considering Asphalt Surfacing Influence” The
Twenty-Sixth KKHTCNN Symposium on Civil Engineering , Singapore,2013 .
Yukio Adachi, Yasumoto Aoki, Ming Li, “Macro analysis of fatigue cracks around rib-to-deck joint
in orthotropic steel bridge deck with u rib” Proceedings of the 68th Annual Conference of
the Japan Society of Civil Engineers, Japan, 2013.
Ming Li, Kunitomo Sugiura, “ Fatigue Life Evaluation of U-rib to Deck joints in Orthotropic Steel
Decks Considering Asphalt Pavement Property” The Twenty-Fifth KKCNN Symposium on
Civil Engineering , Korea, 2012.
Ming Li, Kunitomo Sugiura, Kunitaro Hashimoto, “Study on evaluation of orthotropic steel bridge
deck fatigue life considering influence of asphalt pavement property” 9th
German-Japanese Bridge Symposium , Japan, 2012.
Ming Li, Y. Suzuki, Kunitomo Sugiura, “Fatigue Evaluation of Rib-to-Deck Joint in Orthotropic
Steel Bridge Deck” The Twenty-Seventh KKHTCNN Symposium on Civil Engineering,
Shanghai, 2014.