Embed Size (px)
Citation preview
Research Article
TLR2 Promotes Glioma Immune Evasion byDownregulating MHC Class II Molecules inMicrogliaJiawen Qian1,2, Feifei Luo2,3, Jiao Yang1,2, Jun Liu1, Ronghua Liu1, Luman Wang1,Chen Wang1,2, Yuting Deng1,2, Zhou Lu1, Yuedi Wang1,2, Mingfang Lu1,Ji-Yang Wang1, and Yiwei Chu1,2
Abstract
Gliomas, the most common primary neoplasms in thebrain, are notorious for their ability to evade the immuneresponse. Despite microglial infiltration in gliomas, expres-sion of MHC class II molecules in those microglia iscompromised. Here, we report that Toll-like receptor 2(TLR2) activation downregulated expression of MHC classII molecules in microglia in an orthotopic murine gliomamodel. TLR2-induced microglial impairment hindered theproliferation and activation of CD4þ T cells, which facili-tated glioma immune evasion. TLR2-induced downregula-tion of MHC class II molecules was caused by suppressionof the master regulator of MHC class II molecule transcrip-tion, Ciita. TLR2 activation triggered downstream MAPK/
ERK1/2 signaling and loss of histone H3 acetylation atCiita promoters, which in turn inhibited Ciita expression.In glioblastoma tissues, various endogenous TLR2 ligands,including the heat shock proteins that are endogenous TLR2ligands, were upregulated, a response that correlated withCIITA inhibition. Thus, TLR2 promotes glioma immune-system evasion. These results advance our understandingof microglia as antigen-presenting cells in the contextof glioma. In the glioma tumor microenvironment, TLR2activation of microglia induces downregulation of micro-glial MHC class II expression. Impaired MHC class IIexpression limits T-cell–dependent antitumor immunity.Cancer Immunol Res; 6(10); 1220–33. �2018 AACR.
IntroductionGliomas are the most common primary intracranial malig-
nancy in humans, and despite clinical intervention, the prog-nosis for patients with glioma remains dismal (1). Medianoverall survival of the patients with IDH1/2 wild-type (WT)glioblastoma multiforme (GBM) is shorter than 15 months (2).Fortunately, immunotherapies are being investigated for glio-mas, including peptide or dendritic cell–based vaccines, chi-meric T-cell receptors, and checkpoint inhibitors (3). Many ofthese strategies are dependent on the T-cell–mediated immuneresponse, which needs local antigen-presenting cells (APCs) forinitiation and sustenance (4). Microglia, the major APC subsetwithin the central nervous system (CNS; refs. 5, 6), infiltrategliomas (7). However, microglia are functionally compromisedin the glioma microenvironment, thus limiting the effective-ness of T-cell–dependent tumor eradication.
Normally, microglia scan the environment to detect pathogensand other disturbances (8). Resting microglia express lowamounts of the accessory molecules needed for antigen presen-tation (8). Under pathologic conditions like multiple sclerosisand infections, microglia move toward lesions, transform toamoeboid-like phagocytic cells, and upregulate expression ofMHC class II molecules (MHC class II; refs. 6, 9), suggesting theirparticipation in antigen presentation. Glioma-associated micro-glia (GAM),which show compromised ability to upregulateMHCclass II expression in a murine model (10), are likely less effectivethan they could be at activating T helper cells. In humans,expression of MHC class II by microglia is reduced in high-gradegliomas (11). Expression of costimulatory molecules CD80 andCD86 in glioma-infiltrating microglia (10, 12) is also reduced.Expression of MHC class II, CD80, and CD86 increased aftermicroglia were isolated from intracranial tumors and culturedex vivo (13). These studies indicate that the tumor microenviron-ment renders GAM incompetent to induce T-cell activationand antiglioma immunity. The mechanism by which moleculesrelated to antigen-presenting in GAM are downregulated has notbeen identified.
Toll-like receptors (TLR) are necessary for microglia to ini-tiate the innate and adaptive immune responses in the CNS(14). TLRs are activated not only by pathogen-associatedmolecular patterns but also by danger-associated molecularpatterns, such as heat shock proteins (HSP) and extracellularmatrix (ECM) components (15). Activation of TLR signalingpathways leads to the induction of several genes that functionin host defense, including those encoding inflammatory cyto-kines and chemokines (16). In certain types of innate immune
1Department of Immunology, School of Basic Medical Sciences, and Institute ofBiomedical Sciences, Fudan University, Shanghai, P.R. China. 2BiotherapyResearch Center, Fudan University, Shanghai, P.R. China. 3Department ofDigestive Diseases, Huashan Hospital, Fudan University, Shanghai, P.R. China.
Note: Supplementary data for this article are available at Cancer ImmunologyResearch Online (http://cancerimmunolres.aacrjournals.org/).
Corresponding Author: Yiwei Chu, Fudan University, No. 138, Yi Xue Yuan Rd.,Shanghai 200032, P.R. China. Phone: 8602154237324; Fax: 8602154237324;E-mail: [email protected]
doi: 10.1158/2326-6066.CIR-18-0020
�2018 American Association for Cancer Research.
CancerImmunologyResearch
Cancer Immunol Res; 6(10) October 20181220
on May 17, 2020. © 2018 American Association for Cancer Research. cancerimmunolres.aacrjournals.org Downloaded from
Published OnlineFirst August 21, 2018; DOI: 10.1158/2326-6066.CIR-18-0020
cells, such as macrophage and dendritic cells, activationof TLR signaling is associated with the expression of costimu-latory molecules and MHC molecules (17, 18). Whether TLRsignaling regulates the antigen-presentation function of GAMremains unknown.
In the present study, we found that TLR2 expression wasupregulated inGAM.Glioma-derived factors impairedMHC classII expression of microglia in a TLR2-dependent manner, whichdampened the activation and proliferation of CD4þ T cells.According to The Cancer Genome Atlas (TCGA) database andthe Human Protein Atlas database, several kinds of endogenousTLR2 ligands are upregulated in human glioblastoma tissues.Among these ligands, we identified HSPs as inducers of TLR2activation in correlation with the MHC class II inhibition inhuman GBM samples. Our results clarified the mechanismsbehind glioma-induced impairment of APCs and revealed thefunction of TLR in tumor immune evasion.
Materials and MethodsMice
C57BL/6mice (6–8weeks) were purchased from Shanghai SlacLaboratory Animal Co., Ltd. TLR2-deficient C57BL/6 mice werepurchased from the Model Animal Research Center, NanjingUniversity (Nanjing, China). OT II transgenic mice were kindlyprovided by Dr. Rui He (Fudan University, Shanghai, China). Allmice were housed under the pathogen-free condition in theAnimal Facility of FudanUniversity (Shanghai, China). All animalexperiments adhered to the Guidelines for the Care and Use ofLaboratory Animals (No. 55 issued by Ministry of Health, thePeople's Republic of China on January 25, 1998) and wereapproved by the Institutional Animal Care and Use Committeeof Fudan University.
Cell linesThe murine glioma cell line, GL261, was kindly provided by
Dr. Liangfu Zhou (Huashan Hospital, Shanghai, China) in 2012.The murine microglial cell line, BV2, was obtained from theShanghaiCell Bankof theChineseAcademyof Science (Shanghai,China) in 2014. After obtaining the cell lines, cells were expandedto passage 5 and stored in aliquots in liquid nitrogen. All cell lineswere grown in DMEM/F12 (Thermo Fisher) supplemented with10% heat-inactivated FBS (Thermo Fisher), 2 mmol/L glutamine(Thermo Fisher), 100 U/mL penicillin (Thermo Fisher), and100 mg/mL streptomycin (Thermo Fisher). Cell cultures weremaintained in the incubator at 37�C in a humidified atmosphereof 5% CO2/95% with routine checks for mycoplasma contami-nation every 3 months. All cells were used in experiments beforethey reach passage 15. All cell lines were authenticated using shorttandem repeat profiling in 2015. Glioma-derived conditionedmedium (GCM)was collected after 24 hours from 80% confluentGL261 cultures, filtered through 0.2 mm filter, and applied tomicroglia cultures.
Primary adult microglia culture, cell stimulation, and T-cellcoculture assay
Microglia were prepared from 6- to 8-week-old mice: thecerebrum was dissected and transferred to cold PBS. The tissuewas triturated mechanically and collected in a 50-mL Falcontube and washed with PBS by centrifuging for 7 minutes at500 � g at 4�C. The supernatant was discarded, and pellets
were resuspended and adjusted to 37% Percoll. Percoll gradients(70%/37%/30%/0%)were set up and centrifuged for 5minutes at500 � g at 18�C with low acceleration with the brake off.Mononuclear cells were collected at the 70%/37% interface andwashed with PBS.Microglia were enriched by adhesion to CD11bmicrobeads (BD Bioscience) and harvested for purity check andfurther tests. For cultivation, microglia were plated onto 24-wellplates at a density of 1 � 105 cells per well with DMEM/F12supplemented with 10% heat-inactivated FBS, 2 mmol/L gluta-mine, 100 U/mL penicillin, 100 mg/mL streptomycin, 5 ng/mLrecombination TGFb1 (Miltenyi), and 10 ng/mL RecombinantMouse M-CSF Protein (R&D). Half of the medium was changedevery 3 days, for a total of 10 to 14 days.
In most cases of the study, for microglial TLR2 activation,primary microglia or BV2 cells were treated with 100 ng/mLPam3CSK4 (Invivogen) or GCM (20%, vol/vol) for 24 hours.For MHC class II induction, primary microglia or BV2 cells weretreated with 20 ng/mL IFNg (PeproTech) for another 24 hours.Other TLR agonists (Invivogen) used in the study include Poly(I:C) (10 mg/mL), LPS (100 ng/mL), Pam2CSK4 (100 ng/mL),and CpG (2.5 mmol/L). The inhibitors in specific experimentswere used by pretreatment of cell cultures for 30 minutes. Theworking concentrations of inhibitors are listed as follows: PI3Kinhibitor (CST), Ly294002 (10 mmol/L); ERK1/2 inhibitor(Selleck), U0126 (10 mmol/L); p38 inhibitor (Selleck), SB203580(10 mmol/L); JNK inhibitor (Selleck), SP600125 (10 mmol/L);DNMT inhibitor (Sigma-Aldrich), 5-aza-20-deoxycytidine(5-AZA, 1mmol/L); histonedeacetylase (HDAC) inhibitor (MCE),Trichostatin A (TSA, 0.1 mmol/L); HDAC inhibitor (Selleck),Nicotinamide (Nico, 10 mmol/L).
For T-cell coculture assays, freshly isolated adultmicroglia wereplated onto 96-well plates at a density of 1 � 105 cells per well.Half of themediumwas changed every 3 days, for a total of 7 days.On day 8, microglia were treated with 100 ng/mL Pam3CSK4 or20% GCM for 24 hours. Then, microglia were washed with PBSafter stimulation. The CD4þ T Cell Isolation Kit (Miltenyi)was used for purification of CD4þ T cells from the spleen ofOT II mice. CD4þ T cells were stained with carboxyfluoresceinsuccinimidyl ester (CFSE) dye (Invitrogen) following the manu-facturer's instructions. The microglia were washed with PBS for3 times, and then cocultured with CD4þ T cells (4� 105 cells perwell) for 4 days supplied with 0.1 mmol/L OVA323-339 peptides(Sigma-Aldrich). After coculture, both microglia and T cells weredetermined by flow cytometric analysis.
Stereotactic intracranial tumor inoculation and cannulaimplantation
GL261 glioma cells were harvested and diluted to a concen-tration of 2 � 107 cells/mL. Anesthetized mice were immobi-lized and mounted onto a stereotactic head holder in the flat-skull position. The skin of the skull was dissected in the midlineby a scalpel. The skull was carefully drilled with a 20-gaugeneedle tip (ML: þ2.0 RC: þ1.0 DV: 3.0 mm). Then a microliterHamilton syringe was inserted to a depth of 3 mm and retractedto a depth of 2.5 mm from the dural surface. Note that 5 mL(2 � 104 cells/mL) cell suspension or PBS was slowly injectedover 2 minutes. The needle was then slowly taken out fromthe injection canal, and the skin was sutured. For cannulaimplantation, a hole was drilled for insertion of the cannula(ML: þ1.0 RC: –0.4 DV: 2.0 mm), which was used for intracer-ebroventricular (ICV) injection. In the study, Pam3CSK4 (5 mg)
TLR2 Downregulates Microglial MHC Class II in Glioma
www.aacrjournals.org Cancer Immunol Res; 6(10) October 2018 1221
on May 17, 2020. © 2018 American Association for Cancer Research. cancerimmunolres.aacrjournals.org Downloaded from
Published OnlineFirst August 21, 2018; DOI: 10.1158/2326-6066.CIR-18-0020
were delivered to the lateral ventricle via cannula on days 6, 12,and 18 after tumor inoculation, and mice were sacrificed on day20 for further analysis.
RNA isolation, reverse transcription, and quantitative RT-PCRRNA was isolated with RNAiso (Takara) following the man-
ufacturer's protocol. RNA samples were reversely transcribedusing the PrimeScriptTM RT reagent Kit with gDNA Eraser(Perfect Real Time; Takara), and gene expression was detectedusing the SYBR Premix Ex TaqTM II (Tli RNaseH Plus) Kit(Takara). All real-time PCR amplifications were performed intriplicates in a 20 mL reaction volume with the indicated primerpairs (Supplementary Table S1). RT-PCRs were performedusing 7500 Fast Real-Time PCR System (Applied Biosystems).The amount of target mRNA was normalized to the expressionlevel of b-actin generated from the same sample and subse-quently to controls. Relative expression was calculated as 2�DCt.Fold induction was calculated as 2�DDCt.
Chromatin immunoprecipitationPrimary microglia (contain 5.0 � 105–1.0 � 106 cells per
sample)were used for following chromatin immunoprecipitation(ChIP), performed using the SimpleChIP Enzymatic ChromatinIP Kit (Cell Signaling Technology) according to the manufac-turer's protocol. DNA was eluted and purified, followed by qPCRanalysis using primers specific forCiita promoter (SupplementaryTable S1). All antibodies used for these experiments were listed inSupplementary Table S1, and normal rabbit IgG (Cell SignalingTechnology) was used as the isotype control. The fold enrichmentmethod was used for data normalization.
RNA-seqTotal RNA was extracted using TRIZOL Reagent (Thermo
Fisher) following the manufacturer's protocol. Paired-endlibraries were synthesized by using the TruSeq RNA SamplePreparation Kit (Illumina) following TruSeq RNA SamplePreparation Guide. The cluster was generated by cBot with thelibrary diluted to 10 pmol/L and then was sequenced on theIllumina HiSeq X Ten (Illumina). The P value significancethreshold in multiple tests was set by the FDR. The fold changeswere also estimated according to the fragments per kilobaseofexon per million fragments mapped (FPKM) in each sample.The differentially expressed genes were selected using the fol-lowing filter criteria: FDR � 0.05 and fold change � 2. Rlanguage was used for Kyoto Encyclopedia of Genes and Gen-omes (KEGG) pathway analysis and Gene Ontology analysis.The Gene Expression Omnibus (GEO) accession number forthe RNA-seq data is GSE109297.
ImmunofluorescenceFor frozen sections, mice were fully anesthetized, transcardially
perfused with 20 mL of PBS, and followed by 20 mL of parafor-maldehyde (PFA; 4% in PBS). Tissues were incubated in PFAovernight at 4�C, then transferred to sucrose (20%) for 1 day at4�C, and finally transferred to sucrose (30%) for another day at4�C. All tissues were embedded and frozen in Optimal CuttingTemperature compound, and the brains were mounted on afreezingmicrotome (Leica). Sections (20mmthick)were obtainedand stored at –80�C for all subsequent staining and analysis.
For immunofluorescence, sections were thawed and dried atroom temperature and rinsed in PBS. For cell culture, cells were
washedwith PBS and followed by 4%PFA cell fixation (5minutesat room temperature). Samples were permeabilized with 0.25%Triton-X 100 for 15 minutes at room temperature and blocked inblocking buffer containing 10% donkey serum for 2 hours atroom temperature or overnight at 4�C. Then, samples wereincubated with indicated primary antibodies (SupplementaryTable S2) overnight at 4�C. Samples were then washed with PBSand incubated with the appropriate fluorophore-conjugated sec-ondary antibodies: Alexa Flour-488, 594 (Thermo Fisher), andCy3 (Jackson ImmunoResearch Laboratory) at a dilution of 1:500in 1%BSA for 1 hour at room temperature, and 40, 6-diamidino-2-phenylindole (DAPI) were used as a counterstain. Images wereacquired by a fluorescencemicroscopeOlympus IX73 (Olympus)or a spectral confocal microscope (TCS SP5, TCS SP8; Leica).Appropriate gain and black level settings were determined bycontrol tissues stained with secondary antibodies alone. Analysesof images were performed using ImageJ software (U.S. NationalInstitutes of Health).
Fluorescence-activated cell sorting analysesFor fluorescence-activated cell sorting (FACS) analysis of brain
tumor–infiltrated immune cells, mice were euthanized at thedefined endpoint or when symptomatic (poor grooming, lethar-gy, weight loss, or seizures). Brains were harvested with olfactorybulbs and cerebella removed, dissociated mechanically withDounce homogenizers to make homogenates, and then forcedthrough a filter for single-cell suspension and washed with PBS.Cell pallets were resuspended in 37% Percoll. Percoll gradients(70%/37%/30%/0%) were set up and centrifuged for 40minutesat 200 � g at 18�C with low acceleration with the brake off.Mononuclear cells were collected at 70%/37% interface andwashed with PBS. Mononuclear cells were stained afterward withthe respective antibodies for FACS analysis.
For flow cytometry, cells were counted and incubated with Fcblock (eBioscience) for 30 minutes, followed by another30-minute incubation with conjugated antibodies for extracellu-lar markers. For intracellular cytokine detection, cells were stim-ulated in vitro with Cell Stimulation Cocktail (eBioscience) for5 hours at 37�C before FACS analysis. After stimulation, the cellswere stained for surface markers and cytokines with IntracellularFixation and Permeabilization Buffer Set (eBioscience). All anti-bodies used for these experiments were listed in SupplementaryTable S2. Proper isotype controls and compensation controlswere performed in parallel. A BD Biosciences Canto II was usedfor flow cytometry, and a Beckman Coulter MoFlo XDP wasused for cell sorting. FlowJo software (Tree Star) was used forFACS data analysis.
Immunoblotting analysisThe procedure was performed as described previously. Briefly,
proteins were extracted using radio-immunoprecipitation assay(RIPA) buffer (Cell Signaling Technology) according to the man-ufacturer's protocol. Equal amounts of protein were resolved bySDS/PAGE (Beyotime) and then transferred to polyvinylidenedifluoride membranes (Merck Millipore). Membranes wereprobed with the primary Abs after blocking with 5% nonfat milk.All antibodies used for these experiments were listed in Supple-mentary Table S2. After that, membranes were washed andincubated with horseradish peroxidase–conjugated secondaryAbs. Specific proteins were detected by enhanced chemilumines-cence (Thermo Fisher).
Qian et al.
Cancer Immunol Res; 6(10) October 2018 Cancer Immunology Research1222
on May 17, 2020. © 2018 American Association for Cancer Research. cancerimmunolres.aacrjournals.org Downloaded from
Published OnlineFirst August 21, 2018; DOI: 10.1158/2326-6066.CIR-18-0020
Data presentation and statistical analysisGraphPad Prism 6.0 (GraphPad Software Inc.) was used for all
data analysis. Parametric data are presented as mean � SEM.Differences between two groups were analyzed using the Studentunpaired t test. ANOVA was used to investigate more than twogroups, and the Pearson correlation coefficient was used toanalyze the correlation among the levels of genes. For survivalcurves, the cumulative survival time was calculated usingthe Kaplan–Meier method and analyzed using the log-rank test.P < 0.05 was considered statistically significant.
ResultsMicroglia accumulate at the tumor site and upregulate TLR2expression
To investigate the mechanism underlying the downregulationof molecules related to antigen-presenting in GAM, we used theGL261 murine glioma model due to its immunogenic featuresand predictable tumor progression (19). The GL261 tumor-bearing WT C57BL/6 mice died around 4 weeks after GL261inoculation. The histologic hematoxylin and eosin (H&E) stain-ing showed that tumor size expanded 20 days after of inoculation(Supplementary Fig. S1A), with significant loss of body weight(Supplementary Fig. S1B). Weight of spleens of tumor-bearingmice significantly increased between day 10 and day 20 (Supple-mentary Fig. S1C), concomitant with increased numbers oftumor-infiltrating peripheral immune cells (CD45hi cells; Sup-plementary Fig. S1D and S1E). These results indicate that immunemicroenvironment is established along with glioma progression.Around day 20, the balance tilts in favor of the tumor, resulting inrapid deterioration of the mouse.
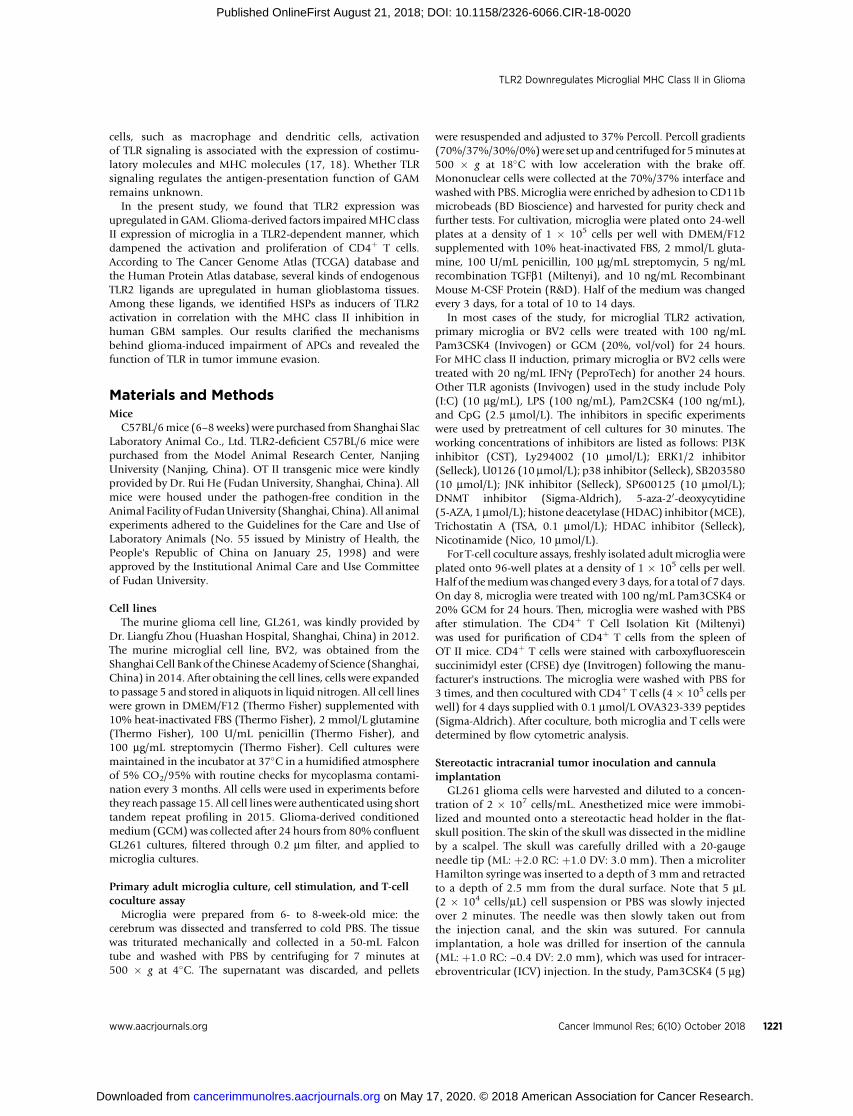
We found that expressionofmicroglial protumor genes, includ-ing Il6, Il10, Tgfb2,Mmp14 (encodingMT-MMP1),Cd274 (encod-ing PDL1), and Ccl2 (7), was elevated in the tumor-bearing brain;expression of some of these genes peaked on day 20 (Supple-mentary Fig. S1F). Next, we investigated themicroglial infiltrationpattern on day 20 after GL261 inoculation. Immunofluorescencestaining showed that Iba1þ microglia accumulated along thetumor perimeter, where they change morphology from ramified,characteristic of normal tissue, to the amoeboid form character-istic of tumor invasion. Within the tumor, microglia appearas rod-like shapes (Fig. 1A). Based on the Iba1þ cell counts andIba1-labeled area, microglial density increased successively fromnormal tissue, tumor rim, invasivemargin, to intratumoral region(Fig. 1B).
We then focused on expression of TLRs in GAM. In the normalbrain, according to an RNA-sequencing database of the cerebralcortex (20), most TLRs are expressed by microglia. Certain TLRs,namely TLR2, TLR7, and TLR9, are predominantly expressed inmicroglia (Fig. 1C). We compared the TLR expression patternbetween microglia isolated from the normal and tumor-bearingbrain by qPCR analysis. The results revealed that Tlr2 and Tlr8mRNA levels were upregulated in the GAM (Fig. 1D), which isconsistent with the previous study of the GL261 model (21). Ina genetically engineered mouse model of glioma, TLR2 is also thepredominant TLR expressed by GAM (22). Expression of TLR2in human glioma samples was higher than that in normal tissuesand was associated with higher-grade malignancy (Fig. 1E).The amount of TLR2 protein in GAM was consistent with theamount of mRNA (Fig. 1F and G). TLR2 is mainly expressed inmicroglia andperipheralmacrophages in the tumor-bearing brain
(Supplementary Fig. S2A–S2C). These findings indicate that TLR2is upregulated in GAM and may modulate GAM function.
TLR2 activation downregulates MHC class II in microgliaTo investigate the role of TLR2 in the modification of anti-
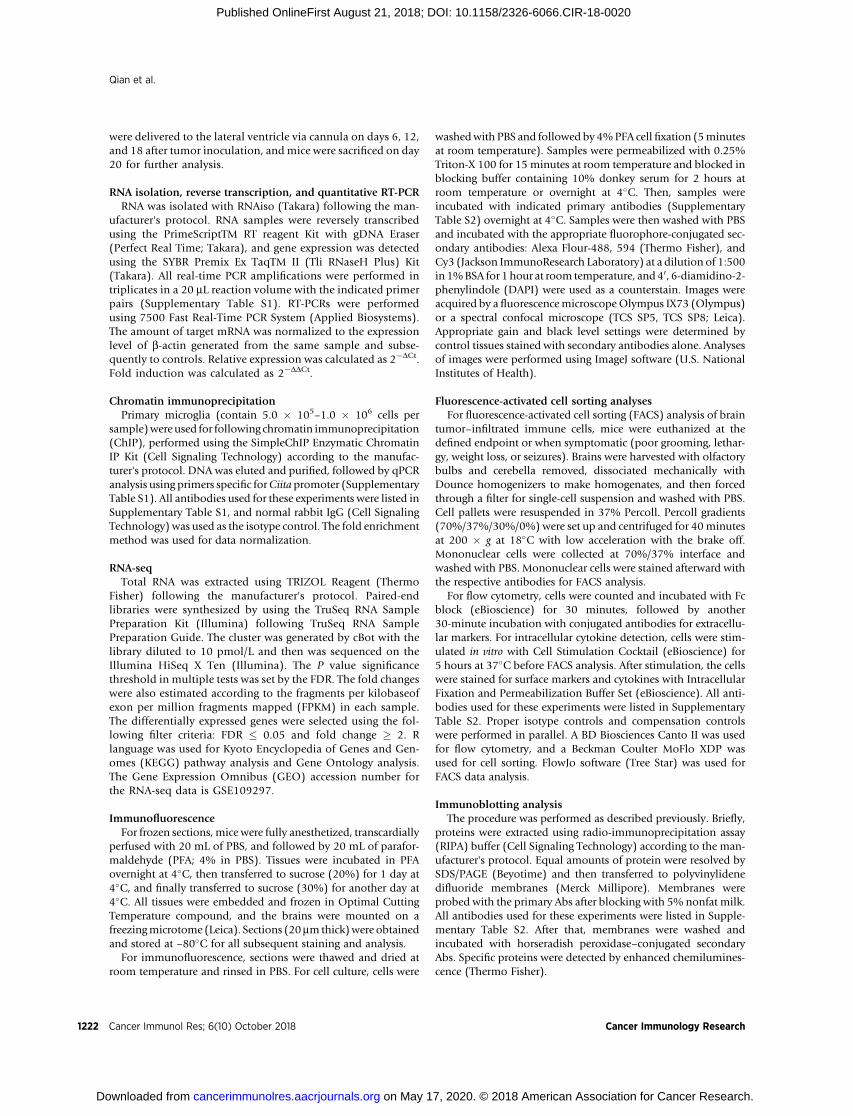
gen-presenting function of GAM, we established the GL261model in Tlr2�/� and WT mice. The analysis of cumulativesurvival revealed that Tlr2�/� mice survived longer than WTmice (Fig. 2A) with less tumor burden on day 20 according tothe histologic H&E staining (Fig. 2B). We evaluated the expres-sion of molecules related to antigen-presenting in GAM by flowcytometry (Supplementary Fig. S3). The brain-resident micro-glia were gated as CD45loCD11bþCD49d�/lo cells according tothe previous report (22). Molecules related to antigen-present-ing function on Tlr2�/� and WT-derived microglia were mea-sured. Results showed no difference in the expression of costi-mulatory molecules (CD80 and CD86) or the coinhibitorymolecule (PD-L1) between Tlr2�/� and WT mice, whereasexpression of MHC class II was upregulated in microglia fromTlr2�/� mice (Fig. 2C). Histology indicated the MHC class IIþ
microglia were mainly in the tumor invasive margin, and thatmicroglia in Tlr2�/� mice expressed more MHC class II thanWT mice (Fig. 2D).
To clarify that MHC class II downregulation was caused byactivation of TLR2 on microglia rather than on other cells, weset up a primary adult microglia culture system. Murine adultmicroglia were isolated with the purity checked by flow cyto-metry (Supplementary Fig. S4A) and cultured in the presence ofM-CSF and TGFb1. TGFb1 is essential for maintenance andsurvival of microglia (23). The reactivity of the primary micro-glia was tested (Supplementary Fig. S4B). The expression ofmicroglia-specific genes (23) was higher in adult microgliacultured with TGFb1 (Supplementary Fig. S4C). GCM was usedto stimulate the primary cultured microglia. MHC class IIexpression could be induced in normal microglia by IFNg , butless so in GCM-treated microglia (Fig. 2E). Primary microgliaappeared more amoeboid in shape, consistent with the previ-ous observation in tumor sites. These results indicate thattumor-derived factors could impair microglial MHC class IIexpression.
When WT and Tlr2�/� microglia were treated with GCM, andwe observed no morphologic change in Tlr2�/� microglia, weevaluated the MHC class II expression of GCM-treated Tlr2�/�
microglia by flow cytometry and found that theMHC class II levelremained unchanged (Fig. 2F), indicating that tumor-derivedendogenous TLR2 ligands triggered microglial MHC class IIdownregulation. We then applied TLR2 agonist Pam3CSK4 tomimic the GCM-induced effect. The MHC class II level ofPam3CSK4-treated cells showed a dose-dependent decreasecompared with control cells (Fig. 2G). We confirmed thatTLR2-mediated downregulation of MHC class II also occurs inbone marrow–derived macrophage (BMDM) (SupplementaryFig. S5A and S5B) and CD45þCD11bþ peripheral myeloid cells(Supplementary Fig. S5C). We tested the TLR2-induced effectin vivo by ICV injection of Pam3CSK4 in the glioma model. Weburied the cannula in the lateral ventricle ipsilateral to the tumorinoculation site. Pam3CSK4orPBSwas given via cannulaonday6after tumor inoculation and given every 6 days for a total of 3times. All animals were sacrificed on day 20 for further analysis(Fig. 2H).We found thatMHC class II expression inmicroglia waslower in the Pam3CSK4-treated group in a time-dependent
TLR2 Downregulates Microglial MHC Class II in Glioma
www.aacrjournals.org Cancer Immunol Res; 6(10) October 2018 1223
on May 17, 2020. © 2018 American Association for Cancer Research. cancerimmunolres.aacrjournals.org Downloaded from
Published OnlineFirst August 21, 2018; DOI: 10.1158/2326-6066.CIR-18-0020
manner (Fig. 2I). These data suggest that TLR2 induced down-regulation of MHC class II in microglia.
Downregulation of MHC class II in microglia impedes theirantigen-presenting function
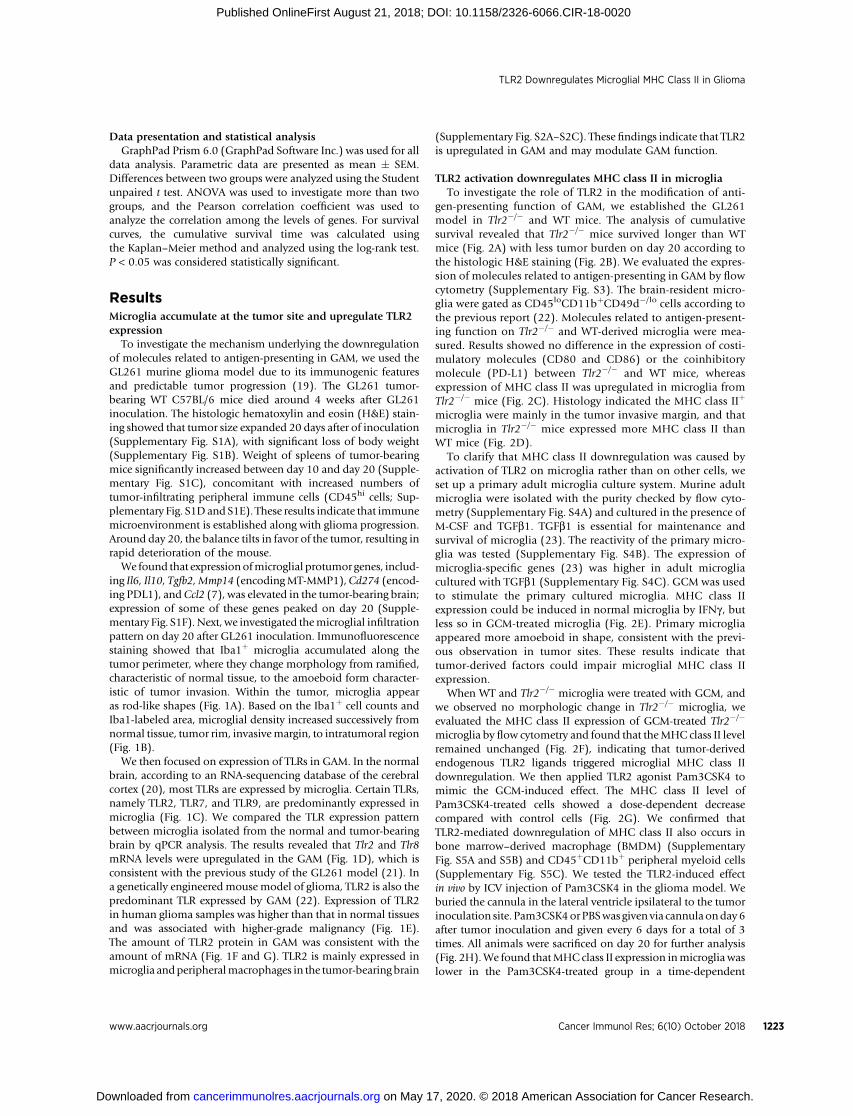
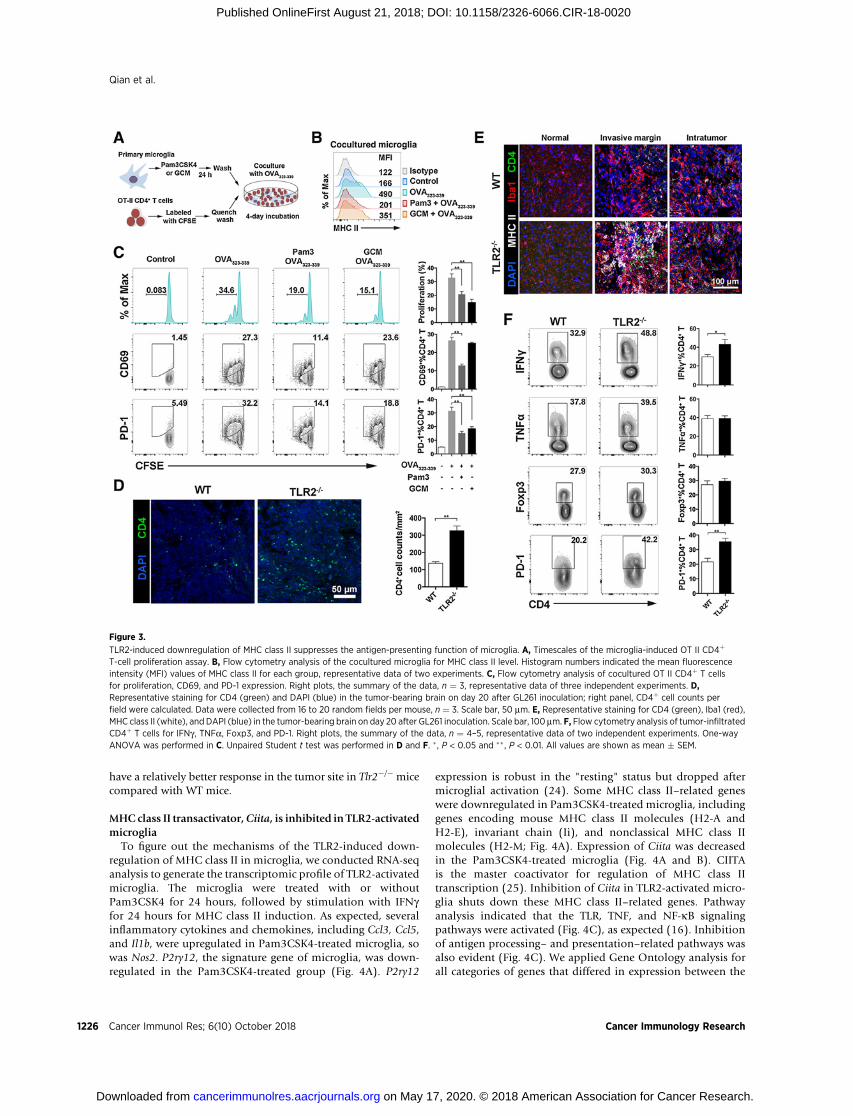
To elucidate whether the TLR2-induced downregulationof MHC class II affected the antigen-presenting function ofmicroglia, we assayed OT-II T-cell proliferation (Fig. 3A). Aftercoculture, microglia in both the Pam3CSK4- and GCM-treatedgroups showed impaired MHC class II expression (Fig. 3B). T-cellproliferation was evaluated by the percentage of divided cells. Tcells in both Pam3CSK4- and GCM-treated groups showed less
proliferation than the OVA group (Fig. 3C). When TLR2�/�
microglia were tested, T cells in the GCM-treated group showedconsistent proliferation as in the OVA group (Supplementary Fig.S6A). With CD69 and PD-1 as T-cell activation markers, T cells inboth Pam3CSK4- and GCM-treated groups showed diminishedactivation (Fig. 3C). These results demonstrate that TLR2-inducedmicroglial MHC class II downregulation could diminish theantigen-presenting function of microglia.
We then analyzed the condition of CD4þ T cells in vivo. CD4þ
T-cell density in the tumor tissue of Tlr2�/� mice was higher thanin the tumor tissue of WT mice (Fig. 3D). The MHC class IIþ
microglia accumulated at the invasive margin and colocalized
Figure 1.
Microglia accumulate at tumor sites and upregulate TLR2 expression. A, Representative staining for Iba1 (green) and DAPI (blue) in the tumor-bearing brainon day 20 after GL261 inoculation. Right plots, different regions of the tumor-bearing brain. N, normal tissue; TR, tumor rim; IM, invasive margin; IT,intratumoral region. B, Iba1þ cell counts per field and percentage of Iba1 labeled area were calculated. Data were collected from 20 random fields for eachregion per mouse, n ¼ 3. C, TLR expression in different cell subsets of the normal brain according to GEO dataset (GSE52564). D, qPCR analysis of TLRs'expression pattern in FACS-sorted CD45loCD11bþ microglia isolated from glioma model (day 20) and normal brain, each sample represents 5 mice brainspooled, and expression was normalized to b-actin (n ¼ 3). E, mRNA expression of TLR2 in human glioma samples, data from TCGA LGG/GBM datasets. N,normal tissue, n ¼ 4; OD, oligodendroglioma, n ¼ 191; OA, oligoastrocytoma, n ¼ 130; AST, astrocytoma, n ¼ 194; GBM, n ¼ 152. F and G, Flow cytometryanalysis of CD45loCD11bþ microglia for TLRs' expression pattern, n ¼ 5. Unpaired Student t test was performed in D and G. One-way ANOVA was performed in E.� , P < 0.05 and �� , P < 0.01. All values are shown as mean � SEM.
Qian et al.
Cancer Immunol Res; 6(10) October 2018 Cancer Immunology Research1224
on May 17, 2020. © 2018 American Association for Cancer Research. cancerimmunolres.aacrjournals.org Downloaded from
Published OnlineFirst August 21, 2018; DOI: 10.1158/2326-6066.CIR-18-0020
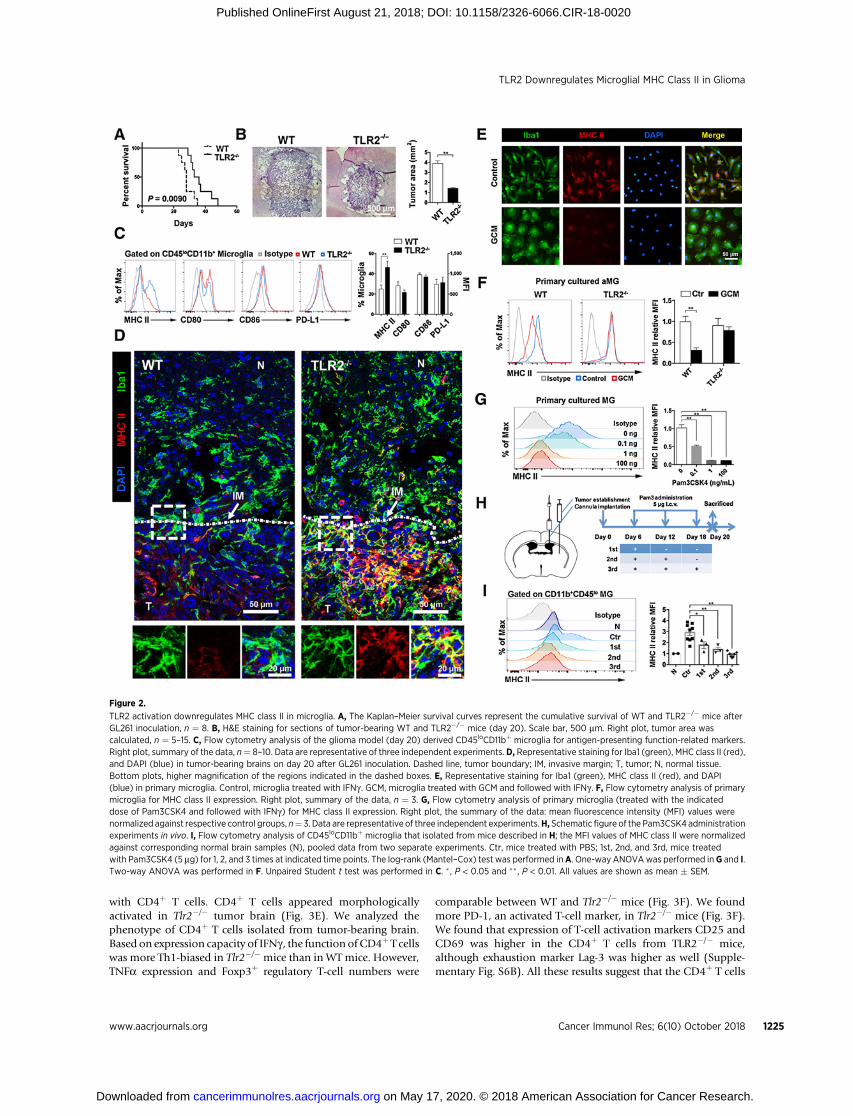
with CD4þ T cells. CD4þ T cells appeared morphologicallyactivated in Tlr2�/� tumor brain (Fig. 3E). We analyzed thephenotype of CD4þ T cells isolated from tumor-bearing brain.Based on expression capacity of IFNg , the function of CD4þ T cellswas more Th1-biased in Tlr2�/� mice than in WT mice. However,TNFa expression and Foxp3þ regulatory T-cell numbers were
comparable between WT and Tlr2�/� mice (Fig. 3F). We foundmore PD-1, an activated T-cell marker, in Tlr2�/� mice (Fig. 3F).We found that expression of T-cell activation markers CD25 andCD69 was higher in the CD4þ T cells from TLR2�/� mice,although exhaustion marker Lag-3 was higher as well (Supple-mentary Fig. S6B). All these results suggest that the CD4þ T cells
Figure 2.
TLR2 activation downregulates MHC class II in microglia. A, The Kaplan–Meier survival curves represent the cumulative survival of WT and TLR2�/� mice afterGL261 inoculation, n ¼ 8. B, H&E staining for sections of tumor-bearing WT and TLR2�/� mice (day 20). Scale bar, 500 mm. Right plot, tumor area wascalculated, n ¼ 5–15. C, Flow cytometry analysis of the glioma model (day 20) derived CD45loCD11bþ microglia for antigen-presenting function-related markers.Right plot, summary of the data, n¼ 8–10. Data are representative of three independent experiments. D, Representative staining for Iba1 (green), MHC class II (red),and DAPI (blue) in tumor-bearing brains on day 20 after GL261 inoculation. Dashed line, tumor boundary; IM, invasive margin; T, tumor; N, normal tissue.Bottom plots, higher magnification of the regions indicated in the dashed boxes. E, Representative staining for Iba1 (green), MHC class II (red), and DAPI(blue) in primary microglia. Control, microglia treated with IFNg . GCM, microglia treated with GCM and followed with IFNg . F, Flow cytometry analysis of primarymicroglia for MHC class II expression. Right plot, summary of the data, n ¼ 3. G, Flow cytometry analysis of primary microglia (treated with the indicateddose of Pam3CSK4 and followed with IFNg) for MHC class II expression. Right plot, the summary of the data: mean fluorescence intensity (MFI) values werenormalized against respective control groups, n¼ 3. Data are representative of three independent experiments.H, Schematic figure of the Pam3CSK4 administrationexperiments in vivo. I, Flow cytometry analysis of CD45loCD11bþ microglia that isolated from mice described in H; the MFI values of MHC class II were normalizedagainst corresponding normal brain samples (N), pooled data from two separate experiments. Ctr, mice treated with PBS; 1st, 2nd, and 3rd, mice treatedwith Pam3CSK4 (5 mg) for 1, 2, and 3 times at indicated time points. The log-rank (Mantel–Cox) test was performed inA. One-way ANOVAwas performed inG and I.Two-way ANOVA was performed in F. Unpaired Student t test was performed in C. � , P < 0.05 and �� , P < 0.01. All values are shown as mean � SEM.
TLR2 Downregulates Microglial MHC Class II in Glioma
www.aacrjournals.org Cancer Immunol Res; 6(10) October 2018 1225
on May 17, 2020. © 2018 American Association for Cancer Research. cancerimmunolres.aacrjournals.org Downloaded from
Published OnlineFirst August 21, 2018; DOI: 10.1158/2326-6066.CIR-18-0020
have a relatively better response in the tumor site in Tlr2�/� micecompared with WT mice.
MHC class II transactivator,Ciita, is inhibited in TLR2-activatedmicroglia
To figure out the mechanisms of the TLR2-induced down-regulation of MHC class II in microglia, we conducted RNA-seqanalysis to generate the transcriptomic profile of TLR2-activatedmicroglia. The microglia were treated with or withoutPam3CSK4 for 24 hours, followed by stimulation with IFNgfor 24 hours for MHC class II induction. As expected, severalinflammatory cytokines and chemokines, including Ccl3, Ccl5,and Il1b, were upregulated in Pam3CSK4-treated microglia, sowas Nos2. P2ry12, the signature gene of microglia, was down-regulated in the Pam3CSK4-treated group (Fig. 4A). P2ry12
expression is robust in the "resting" status but dropped aftermicroglial activation (24). Some MHC class II–related geneswere downregulated in Pam3CSK4-treated microglia, includinggenes encoding mouse MHC class II molecules (H2-A andH2-E), invariant chain (Ii), and nonclassical MHC class IImolecules (H2-M; Fig. 4A). Expression of Ciita was decreasedin the Pam3CSK4-treated microglia (Fig. 4A and B). CIITAis the master coactivator for regulation of MHC class IItranscription (25). Inhibition of Ciita in TLR2-activated micro-glia shuts down these MHC class II–related genes. Pathwayanalysis indicated that the TLR, TNF, and NF-kB signalingpathways were activated (Fig. 4C), as expected (16). Inhibitionof antigen processing– and presentation–related pathways wasalso evident (Fig. 4C). We applied Gene Ontology analysis forall categories of genes that differed in expression between the
Figure 3.
TLR2-induced downregulation of MHC class II suppresses the antigen-presenting function of microglia. A, Timescales of the microglia-induced OT II CD4þ
T-cell proliferation assay. B, Flow cytometry analysis of the cocultured microglia for MHC class II level. Histogram numbers indicated the mean fluorescenceintensity (MFI) values of MHC class II for each group, representative data of two experiments. C, Flow cytometry analysis of cocultured OT II CD4þ T cellsfor proliferation, CD69, and PD-1 expression. Right plots, the summary of the data, n ¼ 3, representative data of three independent experiments. D,Representative staining for CD4 (green) and DAPI (blue) in the tumor-bearing brain on day 20 after GL261 inoculation; right panel, CD4þ cell counts perfield were calculated. Data were collected from 16 to 20 random fields per mouse, n ¼ 3. Scale bar, 50 mm. E, Representative staining for CD4 (green), Iba1 (red),MHC class II (white), and DAPI (blue) in the tumor-bearing brain on day 20 after GL261 inoculation. Scale bar, 100 mm. F, Flow cytometry analysis of tumor-infiltratedCD4þ T cells for IFNg , TNFa, Foxp3, and PD-1. Right plots, the summary of the data, n ¼ 4–5, representative data of two independent experiments. One-wayANOVA was performed in C. Unpaired Student t test was performed in D and F. � , P < 0.05 and �� , P < 0.01. All values are shown as mean � SEM.
Qian et al.
Cancer Immunol Res; 6(10) October 2018 Cancer Immunology Research1226
on May 17, 2020. © 2018 American Association for Cancer Research. cancerimmunolres.aacrjournals.org Downloaded from
Published OnlineFirst August 21, 2018; DOI: 10.1158/2326-6066.CIR-18-0020
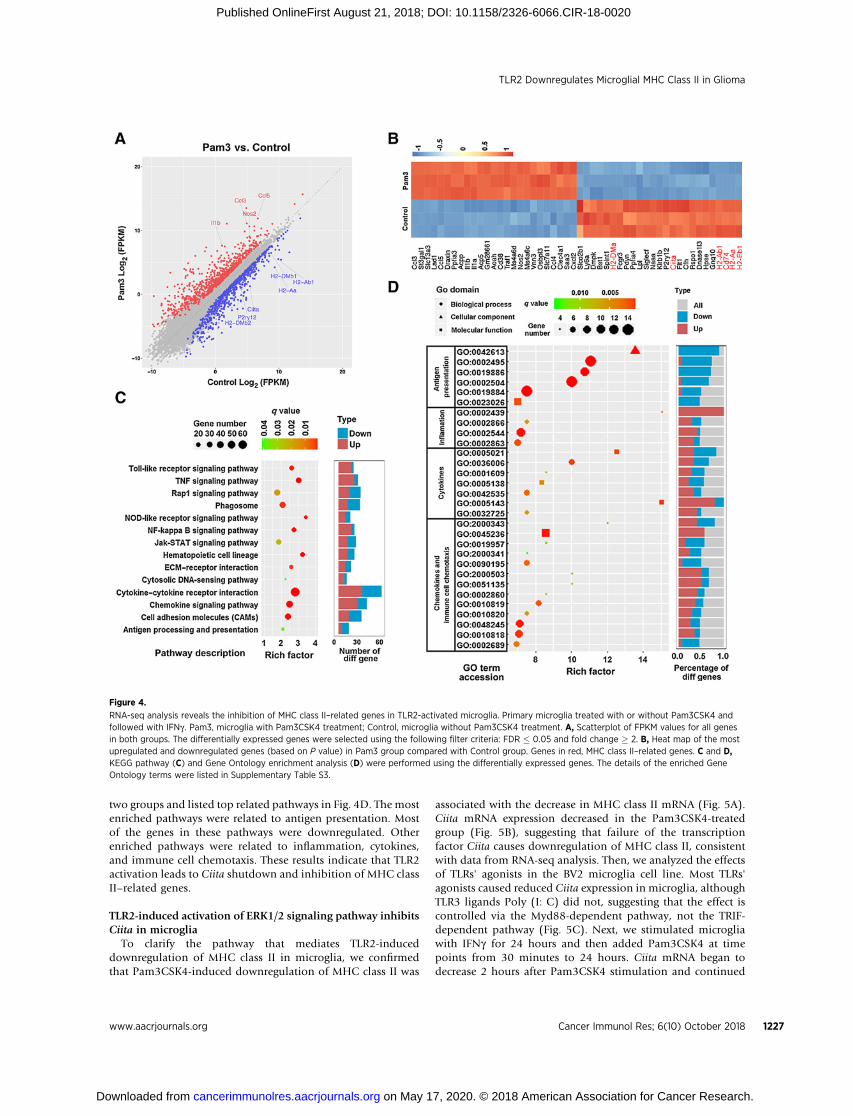
two groups and listed top related pathways in Fig. 4D. The mostenriched pathways were related to antigen presentation. Mostof the genes in these pathways were downregulated. Otherenriched pathways were related to inflammation, cytokines,and immune cell chemotaxis. These results indicate that TLR2activation leads to Ciita shutdown and inhibition of MHC classII–related genes.
TLR2-induced activation of ERK1/2 signaling pathway inhibitsCiita in microglia
To clarify the pathway that mediates TLR2-induceddownregulation of MHC class II in microglia, we confirmedthat Pam3CSK4-induced downregulation of MHC class II was
associated with the decrease in MHC class II mRNA (Fig. 5A).Ciita mRNA expression decreased in the Pam3CSK4-treatedgroup (Fig. 5B), suggesting that failure of the transcriptionfactor Ciita causes downregulation of MHC class II, consistentwith data from RNA-seq analysis. Then, we analyzed the effectsof TLRs' agonists in the BV2 microglia cell line. Most TLRs'agonists caused reduced Ciita expression in microglia, althoughTLR3 ligands Poly (I: C) did not, suggesting that the effect iscontrolled via the Myd88-dependent pathway, not the TRIF-dependent pathway (Fig. 5C). Next, we stimulated microgliawith IFNg for 24 hours and then added Pam3CSK4 at timepoints from 30 minutes to 24 hours. Ciita mRNA began todecrease 2 hours after Pam3CSK4 stimulation and continued
Figure 4.
RNA-seq analysis reveals the inhibition of MHC class II–related genes in TLR2-activated microglia. Primary microglia treated with or without Pam3CSK4 andfollowed with IFNg . Pam3, microglia with Pam3CSK4 treatment; Control, microglia without Pam3CSK4 treatment. A, Scatterplot of FPKM values for all genesin both groups. The differentially expressed genes were selected using the following filter criteria: FDR � 0.05 and fold change � 2. B, Heat map of the mostupregulated and downregulated genes (based on P value) in Pam3 group compared with Control group. Genes in red, MHC class II–related genes. C and D,KEGG pathway (C) and Gene Ontology enrichment analysis (D) were performed using the differentially expressed genes. The details of the enriched GeneOntology terms were listed in Supplementary Table S3.
TLR2 Downregulates Microglial MHC Class II in Glioma
www.aacrjournals.org Cancer Immunol Res; 6(10) October 2018 1227
on May 17, 2020. © 2018 American Association for Cancer Research. cancerimmunolres.aacrjournals.org Downloaded from
Published OnlineFirst August 21, 2018; DOI: 10.1158/2326-6066.CIR-18-0020
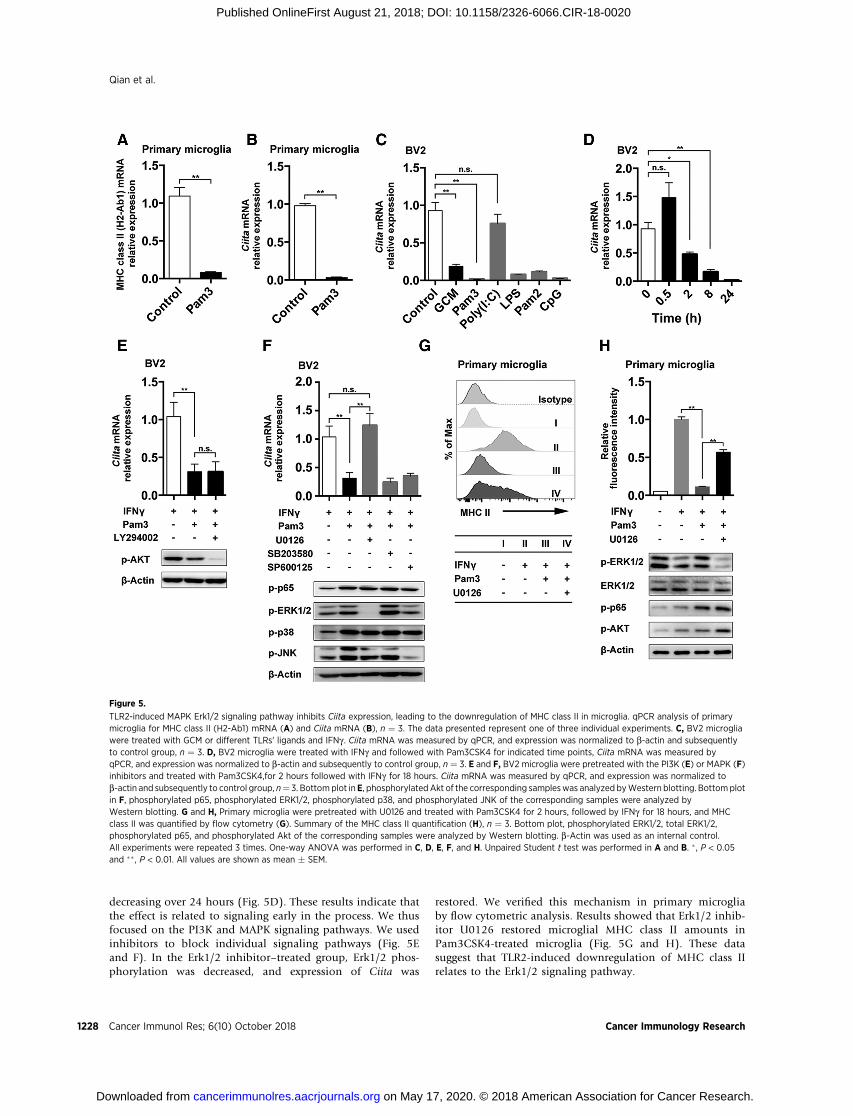
decreasing over 24 hours (Fig. 5D). These results indicate thatthe effect is related to signaling early in the process. We thusfocused on the PI3K and MAPK signaling pathways. We usedinhibitors to block individual signaling pathways (Fig. 5Eand F). In the Erk1/2 inhibitor–treated group, Erk1/2 phos-phorylation was decreased, and expression of Ciita was
restored. We verified this mechanism in primary microgliaby flow cytometric analysis. Results showed that Erk1/2 inhib-itor U0126 restored microglial MHC class II amounts inPam3CSK4-treated microglia (Fig. 5G and H). These datasuggest that TLR2-induced downregulation of MHC class IIrelates to the Erk1/2 signaling pathway.
Figure 5.
TLR2-induced MAPK Erk1/2 signaling pathway inhibits Ciita expression, leading to the downregulation of MHC class II in microglia. qPCR analysis of primarymicroglia for MHC class II (H2-Ab1) mRNA (A) and Ciita mRNA (B), n ¼ 3. The data presented represent one of three individual experiments. C, BV2 microgliawere treated with GCM or different TLRs' ligands and IFNg . Ciita mRNA was measured by qPCR, and expression was normalized to b-actin and subsequentlyto control group, n ¼ 3. D, BV2 microglia were treated with IFNg and followed with Pam3CSK4 for indicated time points, Ciita mRNA was measured byqPCR, and expression was normalized to b-actin and subsequently to control group, n ¼ 3. E and F, BV2 microglia were pretreated with the PI3K (E) or MAPK (F)inhibitors and treated with Pam3CSK4,for 2 hours followed with IFNg for 18 hours. Ciita mRNA was measured by qPCR, and expression was normalized tob-actin and subsequently to control group, n¼ 3. Bottomplot inE, phosphorylated Akt of the corresponding sampleswas analyzed byWestern blotting. Bottomplotin F, phosphorylated p65, phosphorylated ERK1/2, phosphorylated p38, and phosphorylated JNK of the corresponding samples were analyzed byWestern blotting. G and H, Primary microglia were pretreated with U0126 and treated with Pam3CSK4 for 2 hours, followed by IFNg for 18 hours, and MHCclass II was quantified by flow cytometry (G). Summary of the MHC class II quantification (H), n ¼ 3. Bottom plot, phosphorylated ERK1/2, total ERK1/2,phosphorylated p65, and phosphorylated Akt of the corresponding samples were analyzed by Western blotting. b-Actin was used as an internal control.All experiments were repeated 3 times. One-way ANOVA was performed in C, D, E, F, and H. Unpaired Student t test was performed in A and B. � , P < 0.05and �� , P < 0.01. All values are shown as mean � SEM.
Qian et al.
Cancer Immunol Res; 6(10) October 2018 Cancer Immunology Research1228
on May 17, 2020. © 2018 American Association for Cancer Research. cancerimmunolres.aacrjournals.org Downloaded from
Published OnlineFirst August 21, 2018; DOI: 10.1158/2326-6066.CIR-18-0020
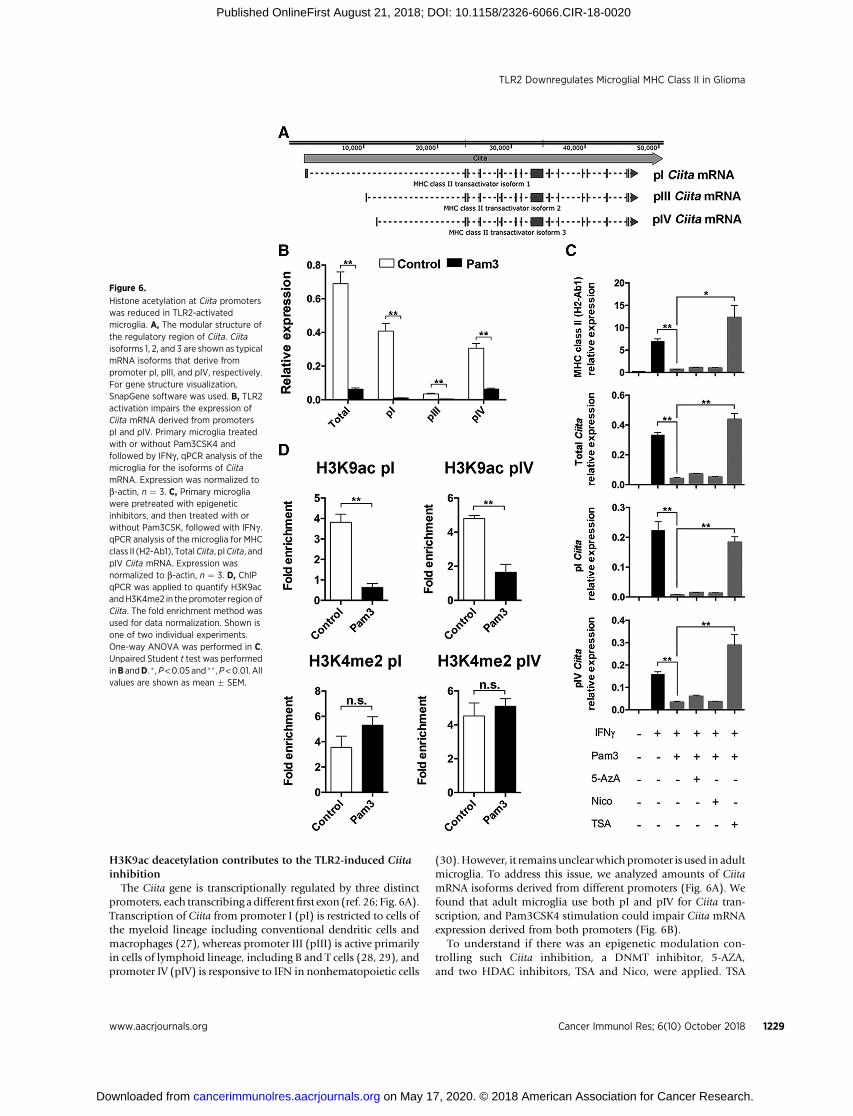
H3K9ac deacetylation contributes to the TLR2-induced Ciitainhibition
The Ciita gene is transcriptionally regulated by three distinctpromoters, each transcribing adifferentfirst exon (ref. 26; Fig. 6A).Transcription of Ciita from promoter I (pI) is restricted to cells ofthe myeloid lineage including conventional dendritic cells andmacrophages (27), whereas promoter III (pIII) is active primarilyin cells of lymphoid lineage, including B and T cells (28, 29), andpromoter IV (pIV) is responsive to IFN in nonhematopoietic cells
(30).However, it remains unclear which promoter is used in adultmicroglia. To address this issue, we analyzed amounts of CiitamRNA isoforms derived from different promoters (Fig. 6A). Wefound that adult microglia use both pI and pIV for Ciita tran-scription, and Pam3CSK4 stimulation could impair Ciita mRNAexpression derived from both promoters (Fig. 6B).
To understand if there was an epigenetic modulation con-trolling such Ciita inhibition, a DNMT inhibitor, 5-AZA,and two HDAC inhibitors, TSA and Nico, were applied. TSA
Figure 6.
Histone acetylation at Ciita promoterswas reduced in TLR2-activatedmicroglia. A, The modular structure ofthe regulatory region of Ciita. Ciitaisoforms 1, 2, and 3 are shown as typicalmRNA isoforms that derive frompromoter pI, pIII, and pIV, respectively.For gene structure visualization,SnapGene software was used. B, TLR2activation impairs the expression ofCiita mRNA derived from promoterspI and pIV. Primary microglia treatedwith or without Pam3CSK4 andfollowed by IFNg , qPCR analysis of themicroglia for the isoforms of CiitamRNA. Expression was normalized tob-actin, n ¼ 3. C, Primary microgliawere pretreated with epigeneticinhibitors, and then treated with orwithout Pam3CSK, followed with IFNg .qPCR analysis of the microglia for MHCclass II (H2-Ab1), TotalCiita, pICiita, andpIV Ciita mRNA. Expression wasnormalized to b-actin, n ¼ 3. D, ChIPqPCR was applied to quantify H3K9acandH3K4me2 in the promoter region ofCiita. The fold enrichment method wasused for data normalization. Shown isone of two individual experiments.One-way ANOVA was performed in C.Unpaired Student t test was performedinB andD. � ,P<0.05 and �� ,P<0.01. Allvalues are shown as mean � SEM.
TLR2 Downregulates Microglial MHC Class II in Glioma
www.aacrjournals.org Cancer Immunol Res; 6(10) October 2018 1229
on May 17, 2020. © 2018 American Association for Cancer Research. cancerimmunolres.aacrjournals.org Downloaded from
Published OnlineFirst August 21, 2018; DOI: 10.1158/2326-6066.CIR-18-0020
selectively inhibits class I and II HDACs (31), whereas Nicoinhibits class III HDACs (32). The results indicated that TSAcould reverse the Pam3CSK4-induced Ciita inhibition inboth promoters (Fig. 6C), indicating that class I or II HDACsparticipate in Pam3CSK4-induced histone deacetylation ofCIITA promoters. Next, to assess H3 acetylation at promoters,ChIP qPCR was performed. We found that H3K9ac at bothpI and pIV promoters was decreased after Pam3CSK4 stimu-lation, but H3K4me2 remained unchanged (Fig. 6D). Thesedata indicate that TLR2 activation in microglia could lead tothe H3 deacetylation of the Ciita promoters, inhibiting Ciitaexpression.
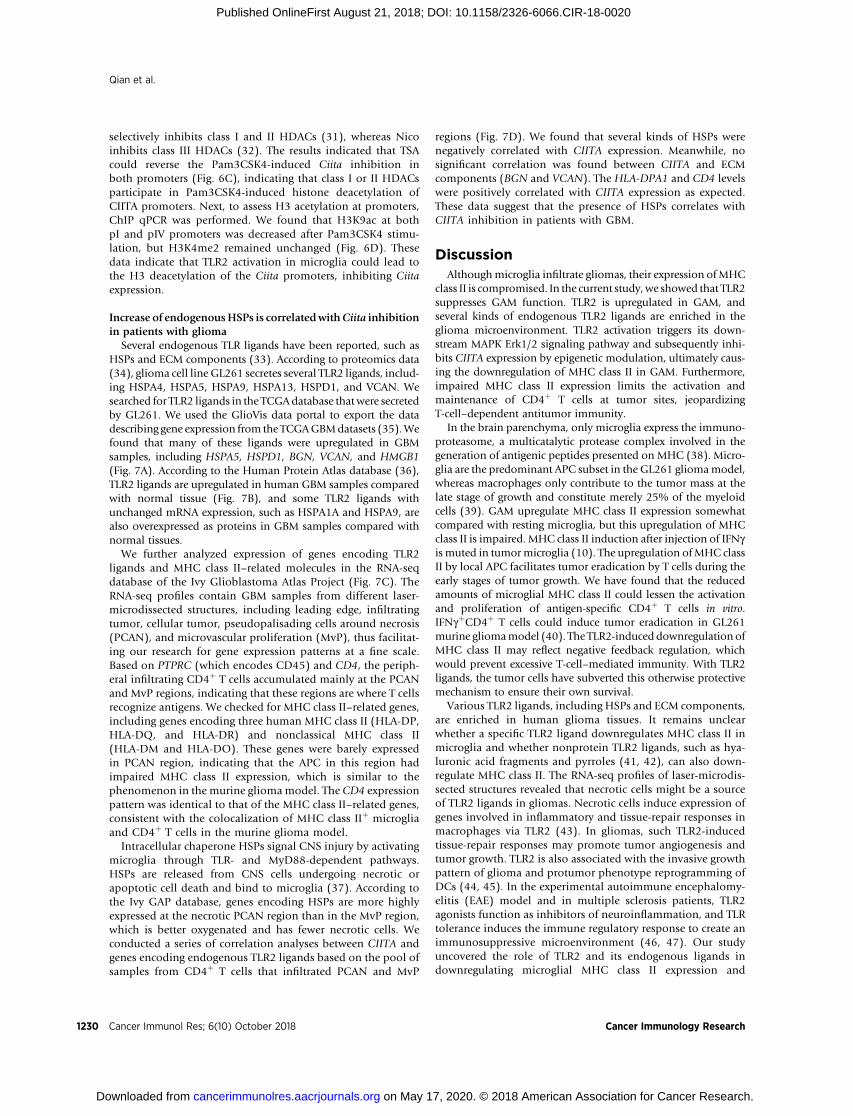
Increase of endogenousHSPs is correlatedwithCiita inhibitionin patients with glioma
Several endogenous TLR ligands have been reported, such asHSPs and ECM components (33). According to proteomics data(34), glioma cell line GL261 secretes several TLR2 ligands, includ-ing HSPA4, HSPA5, HSPA9, HSPA13, HSPD1, and VCAN. Wesearched for TLR2 ligands in the TCGAdatabase thatwere secretedby GL261. We used the GlioVis data portal to export the datadescribing gene expression from the TCGAGBMdatasets (35).Wefound that many of these ligands were upregulated in GBMsamples, including HSPA5, HSPD1, BGN, VCAN, and HMGB1(Fig. 7A). According to the Human Protein Atlas database (36),TLR2 ligands are upregulated in human GBM samples comparedwith normal tissue (Fig. 7B), and some TLR2 ligands withunchanged mRNA expression, such as HSPA1A and HSPA9, arealso overexpressed as proteins in GBM samples compared withnormal tissues.
We further analyzed expression of genes encoding TLR2ligands and MHC class II–related molecules in the RNA-seqdatabase of the Ivy Glioblastoma Atlas Project (Fig. 7C). TheRNA-seq profiles contain GBM samples from different laser-microdissected structures, including leading edge, infiltratingtumor, cellular tumor, pseudopalisading cells around necrosis(PCAN), and microvascular proliferation (MvP), thus facilitat-ing our research for gene expression patterns at a fine scale.Based on PTPRC (which encodes CD45) and CD4, the periph-eral infiltrating CD4þ T cells accumulated mainly at the PCANand MvP regions, indicating that these regions are where T cellsrecognize antigens. We checked for MHC class II–related genes,including genes encoding three human MHC class II (HLA-DP,HLA-DQ, and HLA-DR) and nonclassical MHC class II(HLA-DM and HLA-DO). These genes were barely expressedin PCAN region, indicating that the APC in this region hadimpaired MHC class II expression, which is similar to thephenomenon in the murine gliomamodel. The CD4 expressionpattern was identical to that of the MHC class II–related genes,consistent with the colocalization of MHC class IIþ microgliaand CD4þ T cells in the murine glioma model.
Intracellular chaperone HSPs signal CNS injury by activatingmicroglia through TLR- and MyD88-dependent pathways.HSPs are released from CNS cells undergoing necrotic orapoptotic cell death and bind to microglia (37). According tothe Ivy GAP database, genes encoding HSPs are more highlyexpressed at the necrotic PCAN region than in the MvP region,which is better oxygenated and has fewer necrotic cells. Weconducted a series of correlation analyses between CIITA andgenes encoding endogenous TLR2 ligands based on the pool ofsamples from CD4þ T cells that infiltrated PCAN and MvP
regions (Fig. 7D). We found that several kinds of HSPs werenegatively correlated with CIITA expression. Meanwhile, nosignificant correlation was found between CIITA and ECMcomponents (BGN and VCAN). The HLA-DPA1 and CD4 levelswere positively correlated with CIITA expression as expected.These data suggest that the presence of HSPs correlates withCIITA inhibition in patients with GBM.
DiscussionAlthoughmicroglia infiltrate gliomas, their expression ofMHC
class II is compromised. In the current study,we showed that TLR2suppresses GAM function. TLR2 is upregulated in GAM, andseveral kinds of endogenous TLR2 ligands are enriched in theglioma microenvironment. TLR2 activation triggers its down-stream MAPK Erk1/2 signaling pathway and subsequently inhi-bits CIITA expression by epigenetic modulation, ultimately caus-ing the downregulation of MHC class II in GAM. Furthermore,impaired MHC class II expression limits the activation andmaintenance of CD4þ T cells at tumor sites, jeopardizingT-cell–dependent antitumor immunity.
In the brain parenchyma, only microglia express the immuno-proteasome, a multicatalytic protease complex involved in thegeneration of antigenic peptides presented on MHC (38). Micro-glia are the predominant APC subset in the GL261 gliomamodel,whereas macrophages only contribute to the tumor mass at thelate stage of growth and constitute merely 25% of the myeloidcells (39). GAM upregulate MHC class II expression somewhatcompared with resting microglia, but this upregulation of MHCclass II is impaired. MHC class II induction after injection of IFNgis muted in tumormicroglia (10). The upregulation ofMHC classII by local APC facilitates tumor eradication by T cells during theearly stages of tumor growth. We have found that the reducedamounts of microglial MHC class II could lessen the activationand proliferation of antigen-specific CD4þ T cells in vitro.IFNgþCD4þ T cells could induce tumor eradication in GL261murine gliomamodel (40). The TLR2-induced downregulation ofMHC class II may reflect negative feedback regulation, whichwould prevent excessive T-cell–mediated immunity. With TLR2ligands, the tumor cells have subverted this otherwise protectivemechanism to ensure their own survival.
Various TLR2 ligands, including HSPs and ECM components,are enriched in human glioma tissues. It remains unclearwhether a specific TLR2 ligand downregulates MHC class II inmicroglia and whether nonprotein TLR2 ligands, such as hya-luronic acid fragments and pyrroles (41, 42), can also down-regulate MHC class II. The RNA-seq profiles of laser-microdis-sected structures revealed that necrotic cells might be a sourceof TLR2 ligands in gliomas. Necrotic cells induce expression ofgenes involved in inflammatory and tissue-repair responses inmacrophages via TLR2 (43). In gliomas, such TLR2-inducedtissue-repair responses may promote tumor angiogenesis andtumor growth. TLR2 is also associated with the invasive growthpattern of glioma and protumor phenotype reprogramming ofDCs (44, 45). In the experimental autoimmune encephalomy-elitis (EAE) model and in multiple sclerosis patients, TLR2agonists function as inhibitors of neuroinflammation, and TLRtolerance induces the immune regulatory response to create animmunosuppressive microenvironment (46, 47). Our studyuncovered the role of TLR2 and its endogenous ligands indownregulating microglial MHC class II expression and
Qian et al.
Cancer Immunol Res; 6(10) October 2018 Cancer Immunology Research1230
on May 17, 2020. © 2018 American Association for Cancer Research. cancerimmunolres.aacrjournals.org Downloaded from
Published OnlineFirst August 21, 2018; DOI: 10.1158/2326-6066.CIR-18-0020
elucidated the mechanisms that underlie glioma escape fromthe attack of infiltrated immune cells.
Activation of TLRs' signaling initiates the immune response andleads to the increase of MHC class II expression in myeloid cellslike DCs (16). NF-kB activation induced by TLR signaling leadsto assembly of the transcription complex regulatingCIITA expres-sion in DCs (48). However, during DCmaturation, TLR signalinginhibits de novo biosynthesis of MHC class II by reduction ofCIITA mRNA expression (49, 50). TLR signaling–induced CIITAshutdown limits the presentation of antigens associated withthe maturation stimulus and prohibits the presentation of
antigens experienced by the APCs (49). The mechanismsdrive immune regulation as well as functional accuracy andefficiency. In gliomas, microglia transiently upregulate MHCclass II in the early stage of tumor growth. However, long-termexposure to TLR2 ligands results in the shutdown of Ciitaexpression and downregulation of MHC class II in microglia.We believe that the CIITA shutdown by TLR2 ligands is aprotective mechanism by which microglia shield brain tissuefrom the attack of immune system and initiate tissue-repairingprocess. Unfortunately, such mechanisms allow the glioma toescape the immune system.
Figure 7.
HSPs are enriched in GBM samples and correlate with CIITA inhibition. A, Expression of endogenous TLR2 ligand mRNAs in human GBM samples, datafrom TCGA database. Normal, n ¼ 4; GBM, n ¼ 156. Underlined ligands are detectable in GL261 glioma supernatants. Unpaired Student t test was performed.�� , P < 0.01. Values are shown as mean � SEM. B, Immunohistochemistry staining for TLR2 ligands in human GBM samples; image credit, Human Protein Atlas.Scale bar, 200 mm. The information details (including URL links) of the GBM samples were listed in Supplementary Table S4. C, The RNA-seq profiles oflaser-microdissected structures of GBM samples. Expression from genes encoding TLR2 ligands and MHC class II–related molecules is indicated as heat maps.The data were derived from the Ivy Glioblastoma Atlas Project; image credit, Allen Institute. D, Correlation analysis between CIITA and genes encodingendogenous TLR2 ligands was based on the pool of samples from immune cells' infiltrated PCAN and MvP regions. The data were derived from the IvyGlioblastoma Atlas Project. Pearson correlation coefficient was calculated to analyze the correlation between gene expression levels.
TLR2 Downregulates Microglial MHC Class II in Glioma
www.aacrjournals.org Cancer Immunol Res; 6(10) October 2018 1231
on May 17, 2020. © 2018 American Association for Cancer Research. cancerimmunolres.aacrjournals.org Downloaded from
Published OnlineFirst August 21, 2018; DOI: 10.1158/2326-6066.CIR-18-0020
In conclusion, our findings highlight the role of TLR2 in GAM.TLR2 ligands in the tumor microenvironment could facilitatetumor immune evasion. Similar mechanisms may also occur inmacrophages or dendritic cells in various solid tumors. BecauseMHC class II are downregulated in GAM, antagonists for TLR2or downstream signaling might modify the function of tumor-infiltrated APCs and improve antiglioma immunity. Our resultsmight inform the development of more efficient immunothera-pies for the treatment of glioma.
Disclosure of Potential Conflicts of InterestNo potential conflicts of interest were disclosed.
Authors' ContributionsConception and design: J. Qian, Y. ChuDevelopment of methodology: J. Qian, F. Luo, J. Yang, J. Liu, Z. Lu, Y. ChuAcquisition of data (provided animals, acquired and managed patients,provided facilities, etc.): J. Qian, F. Luo, J. Yang, R. LiuAnalysis and interpretation of data (e.g., statistical analysis, biostatistics,computational analysis): J. Qian
Writing, review, and/or revision of the manuscript: J. Qian, J. Liu, R. Liu,C. Wang, Y. ChuAdministrative, technical, or material support (i.e., reporting or organizingdata, constructing databases): F. Luo, J. Yang, R. Liu, Y. Deng, Y. Wang, Y. ChuStudy supervision: J.-Y. Wang, Y. ChuOther (provided advice): J. Liu, L. Wang, Y. Deng, Z. Lu, Y. Wang, M. Lu
AcknowledgmentsThis work was supported by the National Science Foundation of China
(31570892, 31770992, 81730045, and 91527305) and the Science and Tech-nology Commission of Shanghai Municipality (15JC1401200).
We thank Dr. Rui He for providing the OT-II transgenic mice, Dr. LiangfuZhou for providing GL261 murine glioma cell line, and Dr. Dapeng Yan for thehelpful support and discussions. We thank Dr. Xiaoming Liu and Enyu Huangfor critiquing the article.
The costs of publication of this articlewere defrayed inpart by the payment ofpage charges. This article must therefore be hereby marked advertisement inaccordance with 18 U.S.C. Section 1734 solely to indicate this fact.
Received January 19, 2018; revised June 15, 2018; accepted August 15, 2018;published first August 21, 2018.
References1. Prados MD, Byron SA, Tran NL, Phillips JJ, Molinaro AM, Ligon KL, et al.
Toward precision medicine in glioblastoma: the promise and the chal-lenges. Neuro Oncol 2015;17:1051–63.
2. Louis DN, Perry A, Reifenberger G, von Deimling A, Figarella-Branger D,Cavenee WK, et al. The 2016 World Health Organization classification oftumors of the central nervous system: a summary. Acta Neuropathol (Berl)2016;131:803–20.
3. Dunn-Pirio AM, Vlahovic G. Immunotherapy approaches in the treatmentof malignant brain tumors. Cancer 2017;123:734–50.
4. Korn T, Kallies A. T cell responses in the central nervous system. Nat RevImmunol 2017;17:179–94.
5. Herz J, Filiano AJ, Smith A, Yogev N, Kipnis J. Myeloid cells in the centralnervous system. Immunity 2017;46:943–56.
6. Ousman SS, Kubes P. Immune surveillance in the central nervous system.Nat Neurosci 2012;15:1096–101.
7. Hambardzumyan D, Gutmann DH, Kettenmann H. The role of microgliaand macrophages in glioma maintenance and progression. Nat Neurosci2015;19:20–7.
8. Ransohoff RM, Engelhardt B. The anatomical and cellular basis of immunesurveillance in the central nervous system. Nat Rev Immunol 2012;12:623–35.
9. Ponomarev ED, Shriver LP, Maresz K, Dittel BN. Microglial cell activationand proliferation precedes the onset of CNS autoimmunity. J Neurosci Res2005;81:374–89.
10. Schartner JM, Hagar AR, Van Handel M, Zhang L, Nadkarni N, Badie B.Impaired capacity for upregulation of MHC class II in tumor-associatedmicroglia. Glia 2005;51:279–85.
11. Tran CT, Wolz P, Egensperger R, Kosel S, Imai Y, Bise K, et al. Differentialexpression ofMHCclass IImolecules bymicroglia and neoplastic astroglia:relevance for the escape of astrocytoma cells from immune surveillance.Neuropathol Appl Neurobiol 1998;24:293–301.
12. Hussain SF, Yang D, Suki D, Aldape K, Grimm E, Heimberger AB.The role of human glioma-infiltrating microglia/macrophagesin mediating antitumor immune responses. Neuro Oncol 2006;8:261–79.
13. Badie B, Bartley B, Schartner J. Differential expression of MHC class II andB7 costimulatory molecules by microglia in rodent gliomas. J Neuroim-munol 2002;133:39–45.
14. Olson JK, Miller SD. Microglia initiate central nervous system innate andadaptive immune responses throughmultiple TLRs. J Immunol 2004;173:3916–24.
15. Bianchi ME. DAMPs, PAMPs and alarmins: all we need to know aboutdanger. J Leukoc Biol 2007;81:1–5.
16. Kawai T, Akira S. The role of pattern-recognition receptors in innateimmunity: update on Toll-like receptors. Nat Immunol 2010;11:373–84.
17. Watts C,West MA, Zaru R. TLR signalling regulated antigen presentation indendritic cells. Curr Opin Immunol 2010;22:124–30.
18. Akira S, Takeda K, Kaisho T. Toll-like receptors: critical proteins linkinginnate and acquired immunity. Nat Immunol 2001;2:675–80.
19. Maes W, Van Gool SW. Experimental immunotherapy for malignantglioma: lessons from two decades of research in the GL261 model. CancerImmunol Immunother 2011;60:153–60.
20. Zhang Y, Chen K, Sloan SA, Bennett ML, Scholze AR, O'Keeffe S, et al.An RNA-sequencing transcriptome and splicing database of glia, neu-rons, and vascular cells of the cerebral cortex. J Neurosci 2014;34:11929–47.
21. Szulzewsky F, Pelz A, Feng X, Synowitz M, Markovic D, Langmann T, et al.Glioma-associated microglia/macrophages display an expression profiledifferent from M1 and M2 polarization and highly express Gpnmb andSpp1. PLoS One 2015;10:e0116644.
22. Bowman RL, Klemm F, Akkari L, Pyonteck SM, Sevenich L, Quail DF, et al.Macrophage ontogeny underlies differences in tumor-specific education inbrain malignancies. Cell Rep 2016;17:2445–59.
23. Butovsky O, Jedrychowski MP, Moore CS, Cialic R, Lanser AJ, Gabriely G,et al. Identification of a unique TGF-beta-dependent molecular and func-tional signature in microglia. Nat Neurosci 2014;17:131–43.
24. Haynes SE, Hollopeter G, Yang G, Kurpius D, Dailey ME, Gan WB, et al.The P2Y12 receptor regulates microglial activation by extracellular nucleo-tides. Nat Neurosci 2006;9:1512–9.
25. Chang CH, Fontes JD, PeterlinM, Flavell RA. Class II transactivator (CIITA)is sufficient for the inducible expression of major histocompatibilitycomplex class II genes. J Exp Med 1994;180:1367–74.
26. Muhlethaler-Mottet A, Otten LA, Steimle V, Mach B. Expression of MHCclass II molecules in different cellular and functional compartments iscontrolled by differential usage ofmultiple promoters of the transactivatorCIITA. EMBO J 1997;16:2851–60.
27. Reith W, LeibundGut-Landmann S, Waldburger JM. Regulation of MHCclass II gene expression by the class II transactivator. Nat Rev Immunol2005;5:793–806.
28. Lennon AM, Ottone C, Rigaud G, Deaven LL, Longmire J, Fellous M, et al.Isolation of a B-cell-specific promoter for the human class II transactivator.Immunogenetics 1997;45:266–73.
29. Wong AW, Ghosh N, McKinnon KP, ReedW, Piskurich JF, Wright KL, et al.Regulation and specificity ofMHC2TApromoter usage inhumanprimary Tlymphocytes and cell line. J Immunol 2002;169:3112–9.
Qian et al.
Cancer Immunol Res; 6(10) October 2018 Cancer Immunology Research1232
on May 17, 2020. © 2018 American Association for Cancer Research. cancerimmunolres.aacrjournals.org Downloaded from
Published OnlineFirst August 21, 2018; DOI: 10.1158/2326-6066.CIR-18-0020
30. Muhlethaler-Mottet A,Di BerardinoW,Otten LA,Mach B. Activation of theMHC class II transactivator CIITA by interferon-gamma requires cooper-ative interaction between Stat1 and USF-1. Immunity 1998;8:157–66.
31. Vanhaecke T, Papeleu P, Elaut G, Rogiers V. Trichostatin A-like hydro-xamate histone deacetylase inhibitors as therapeutic agents: toxicologicalpoint of view. Curr Med Chem 2004;11:1629–43.
32. Avalos JL, Bever KM, Wolberger C. Mechanism of sirtuin inhibition bynicotinamide: altering the NAD(þ) cosubstrate specificity of a Sir2enzyme. Mol Cell 2005;17:855–68.
33. Erridge C.Endogenous ligands of TLR2 and TLR4: agonists or assistants?J Leukoc Biol 2010;87:989–99.
34. Hu F, a Dzaye OD, Hahn A, Yu Y, Scavetta RJ, Dittmar G, et al. Glioma-derived versican promotes tumor expansion via glioma-associated micro-glial/macrophages Toll-like receptor 2 signaling. Neuro Oncol 2015;17:200–10.
35. Bowman RL, Wang Q, Carro A, Verhaak RG, Squatrito M. GlioVis dataportal for visualization and analysis of brain tumor expression datasets.Neuro Oncol 2017;19:139–41.
36. Uhlen M, Bjorling E, Agaton C, Szigyarto CA, Amini B, Andersen E, et al.A human protein atlas for normal and cancer tissues based on antibodyproteomics. Mol Cell Proteomics 2005;4:1920–32.
37. Lehnardt S, Schott E, Trimbuch T, Laubisch D, Krueger C, Wulczyn G, et al.A vicious cycle involving release of heat shock protein 60 from injured cellsand activation of toll-like receptor 4 mediates neurodegeneration in theCNS. J Neurosci 2008;28:2320–31.
38. Stohwasser R, Giesebrecht J, Kraft R, Muller EC, Hausler KG, KettenmannH, et al. Biochemical analysis of proteasomes from mouse microglia:induction of immunoproteasomes by interferon-gamma and lipopolysac-charide. Glia 2000;29:355–65.
39. Muller A, Brandenburg S, Turkowski K, Muller S, Vajkoczy P. Residentmicroglia, and not peripheral macrophages, are the main source of braintumor mononuclear cells. Int J Cancer 2015;137:278–88.
40. VomBerg J, VrohlingsM,Haller S, Haimovici A, Kulig P, Sledzinska A, et al.Intratumoral IL-12 combinedwith CTLA-4 blockade elicits T cell-mediatedglioma rejection. J Exp Med 2013;210:2803–11.
41. Scheibner KA, Lutz MA, Boodoo S, Fenton MJ, Powell JD, Horton MR.Hyaluronan fragments act as an endogenous danger signal by engagingTLR2. J Immunol 2006;177:1272–81.
42. West XZ, Malinin NL, Merkulova AA, Tischenko M, Kerr BA, Borden EC,et al. Oxidative stress induces angiogenesis by activating TLR2 with novelendogenous ligands. Nature 2010;467:972–6.
43. LiM,CarpioDF, ZhengY, BruzzoP, SinghV,Ouaaz F, et al. An essential roleof theNF-kappaB/Toll-like receptor pathway in induction of inflammatoryand tissue-repair gene expression by necrotic cells. J Immunol2001;166:7128–35.
44. Vinnakota K, Hu F, KuMC,Georgieva PB, Szulzewsky F, Pohlmann A, et al.Toll-like receptor 2 mediates microglia/brain macrophage MT1-MMPexpression and glioma expansion. Neuro Oncol 2013;15:1457–68.
45. Tang M, Diao J, Gu H, Khatri I, Zhao J, Cattral MS. Toll-likereceptor 2 activation promotes tumor dendritic cell dysfunctionby regulating IL-6 and IL-10 receptor signaling. Cell Rep 2015;13:2851–64.
46. Holtman IR, Bsibsi M, Gerritsen WH, Boddeke HW, Eggen BJ, van der ValkP, et al. Identification of highly connected hub genes in the protectiveresponse program of human macrophages and microglia activated byalpha B-crystallin. Glia 2017;65:460–73.
47. Anstadt EJ, Fujiwara M, Wasko N, Nichols F, Clark RB. TLR tolerance as atreatment for central nervous system autoimmunity. J Immunol2016;197:2110–8.
48. Neefjes J, JongsmaML, Paul P, Bakke O. Towards a systems understandingof MHC class I and MHC class II antigen presentation. Nat Rev Immunol2011;11:823–36.
49. Simmons DP, Wearsch PA, Canaday DH, Meyerson HJ, Liu YC, Wang Y,et al. Type I IFN drives a distinctive dendritic cell maturation phenotypethat allows continued class II MHC synthesis and antigen processing.J Immunol 2012;188:3116–26.
50. Landmann S,Muhlethaler-Mottet A, Bernasconi L, Suter T,Waldburger JM,Masternak K, et al. Maturation of dendritic cells is accompanied by rapidtranscriptional silencing of class II transactivator (CIITA) expression. J ExpMed 2001;194:379–91.
www.aacrjournals.org Cancer Immunol Res; 6(10) October 2018 1233
TLR2 Downregulates Microglial MHC Class II in Glioma
on May 17, 2020. © 2018 American Association for Cancer Research. cancerimmunolres.aacrjournals.org Downloaded from
Published OnlineFirst August 21, 2018; DOI: 10.1158/2326-6066.CIR-18-0020
2018;6:1220-1233. Published OnlineFirst August 21, 2018.Cancer Immunol Res Jiawen Qian, Feifei Luo, Jiao Yang, et al. Class II Molecules in MicrogliaTLR2 Promotes Glioma Immune Evasion by Downregulating MHC
Updated version
10.1158/2326-6066.CIR-18-0020doi:
Access the most recent version of this article at:
Material
Supplementary
http://cancerimmunolres.aacrjournals.org/content/suppl/2018/08/21/2326-6066.CIR-18-0020.DC1
Access the most recent supplemental material at:
Cited articles
http://cancerimmunolres.aacrjournals.org/content/6/10/1220.full#ref-list-1
This article cites 50 articles, 13 of which you can access for free at:
E-mail alerts related to this article or journal.Sign up to receive free email-alerts
Subscriptions
Reprints and
To order reprints of this article or to subscribe to the journal, contact the AACR Publications Department
Permissions
Rightslink site. Click on "Request Permissions" which will take you to the Copyright Clearance Center's (CCC)
.http://cancerimmunolres.aacrjournals.org/content/6/10/1220To request permission to re-use all or part of this article, use this link
on May 17, 2020. © 2018 American Association for Cancer Research. cancerimmunolres.aacrjournals.org Downloaded from
Published OnlineFirst August 21, 2018; DOI: 10.1158/2326-6066.CIR-18-0020


![immungenetikaantropologia.elte.hu/~anthrop/immungenetika_4.pdfIsmert allélek száma (2012) MHC class I MHC class II locus #[9][10] Major Antigens HLA ‐A1 ‐B1 ‐B3 to ‐B51 Theor](https://img.pdfslide.tips/doc/110x75/6071826e7c80dc48cc4e1a02/immun-anthropimmungenetika4pdf-ismert-alllek-szma-2012-mhc-class-i-mhc.jpg)