Embed Size (px)
Citation preview
『国際開発研究フォーラム』21(2002. 3)Forum of International Development Studies, 21 (Mar.2002)
-189-
Trade Reforms in Vietnam
A Computable General Equilibrium Analysis
Nguyen Tien Dung*
Abstract
Vietnam’s integration with the global economy has accelerated in recent years. Vietnam
became a member of ASEAN in 1995, joined APEC in 1998, and has applied for membership
in the WTO. Various commitments to trade liberalization have been made under bilateral
and multilateral trade agreements and will be carried out in coming years. The ongoing
trade reforms will significantly change Vietnam’s highly protective trade regimes and bring
about profound implications on the economy. In this paper, we have used a computable
general equilibrium(CGE)model to assess the impacts of unilateral trade liberalization at
both macro and sectoral levels and examine the role of complementary policies. The
simulation results have indicated that tariff reductions cause a decline in GDP, but the
overall output loss is small. Capital producing industries and public services suffer
considerable losses, while export-oriented industries experience a significant expansion.
Sustaining the fiscal revenue mitigate the negative effects of tariff cuts on public services
and reduce the output loss. Currency devaluation appears to have a strong impact on
exports, imports and the trade balance.
Acknowledgements
I am gratefully indebted to professor Mitsuo Ezaki, who has provided me with guidance and
valuable suggestions. I would like to thank Ms. Susan Tennant for correcting the draft of the paper,
and two anonymous referees for their comments and suggestions.
I. Introduction
In the late 1980s, Vietnam began profound social and economic reforms, which have significantly
transformed Vietnam from a centrally planned economy to a market economy. Over the last decade,
trade reforms and the open door policy have constituted an important part of the comprehensive
reforms. Restrictions and limitations on trade activities have been progressively relaxed, and the
country has successfully expanded trade and investment relations with nations in Asia, Europe and
North America. The growth of trade has been high and contributed significantly to the overall
economic growth.
The integration with the global economy has accelerated in recent years. Vietnam became a
* Doctoral student, Graduate School of International Development, Nagoya University
Trade Reforms in Vietnam A Computable General Equilibrium Analysis
-190-
member of ASEAN in 1995, joined APEC in 1998, and has applied for membership in the WTO.
However integration with the world economy brings about both benefits and costs, and the issue has
been debated among Vietnamese policy makers and economists. On the one hand, the integration will
expand Vietnam’s exports markets and bring about greater opportunities for technological transfers
as well as greater inflows of foreign investment and economic assistance. On the other hand, Vietnam
will be obligated to requirements of international trade agreements concerning the removal of tariff
and non-tariff barriers and the opening of investment regimes to foreign firms. Domestic firms, lacking
of business skills and poorly equipped, may fail to compete with foreign firms. Trade liberalization
may lead to a loss in output and increased unemployment, or it may worsen the trade balance and
fiscal balance.
Although there have been numerous studies on economic and trade reforms in Vietnam, limited
attention has been paid to quantitative studies. In this paper we attempt to analyze Vietnam’s trade
reforms, and to quantify impacts of the reforms on the economy using a computable general
equilibrium(CGE)model. The paper is organized as follows. Section2examines the recent economic
development in Vietnam, current trade regimes and the reform agenda in coming years. The
structure of the model, data sources and the calibration procedure are discussed in section 3.
Simulation scenarios are performed in section 4, and conclusions are drawn in the last section.
II. Reforms and Open Door Policy
II.1. Reforms and Growth: an Overview
In late 1980s Vietnam began profound social and economic reforms, commonly known as doimoi,
which aimed to develop a market economy to replace the centrally planned economy and to open up
the economy to the world economy. Over the last decade, the economic reforms have brought about
significant changes in both social and economic aspects. Price controls have been abolished for most
commodities, and prices are determined by the market demand and supply. The private sector has
been officially accepted and encouraged, and the state sector has been restructured.
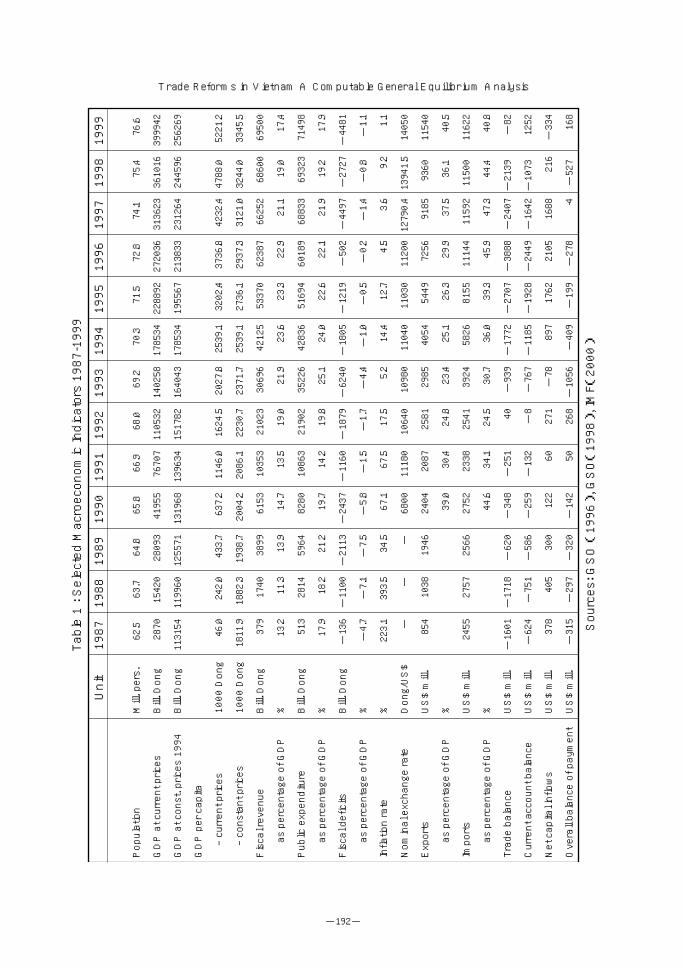
After the hard transition period characterized by hyperinflation in the late 1980s, Vietnam
successfully stabilized the macroeconomic situation and resumed growth in the early 1990s. The
country achieved an impressive economic performance, with the growth of GDP averaging the annual
rate of 8.8 per cent during the period 1992-1997. The high growth was achieved in a stable
macroeconomic environment. Inflation and fiscal deficits were kept within a controllable range.
The economic and political crisis in the former Soviet Union interrupted traditional trading and
economic relations with countries in the Soviet bloc and badly affected the economy in the late 1980s.
Vietnam liberalized trade regimes to promote trading and economic relations with the countries in the
convertible currency area. The growth of exports averaged the annual rate of over 30 per cent, and
-191-
was led by light manufacturing exports. The lifting of the US embargo in 1993 removed political
obstacles to foreign investment and development assistance. The inflows of foreign capital increased
dramatically, particularly between 1995 and 1997. Stimulated by the surge in the capital inflows,
imports grew rapidly and worsened the trade balance, which reached nearly 16 per cent of GDP in
1996.
The country was not able to sustain the initial performance. The rapid growth brought about over-
optimism and reduced pressure for further reforms. There was little progress in the restructuring of
the state sector and banking system, and the economy suffered from serious weaknesses as reflected
in inefficient and heavily indebted state-owned enterprises(SOEs), the large build-up of non-
performing loans and the high and increasing trade deficit.
The Asian economic crisis adversely affected the economy and further exacerbated domestic
economic problems. The economic recession in Japan and East Asian countries, which are Vietnam’s
major trading and investment partners, led to a sharp contraction of Vietnam’s export markets and a
decline in the inflows of foreign investment. The growth rate of exports dropped to 1.9 per cent in
1998, and exports to East Asia declined by 8.5 per cent. The recent resumption of export growth has
been attributed to the surge in oil prices and the successful efforts in redirecting Vietnam’s exports
toward new markets in North America and Europe.
In order to reduce trade deficits, the government imposed quantitative restrictions and temporary
prohibitions on the import of several consumer goods. Currency controls were adopted to prevent the
outflows of foreign currency and to limit imports. Imports grew only few percents in 1997 and
declined slightly in 1998 and 1999. As a result, the trade balance has improved significantly, and the
country had a current account surplus in 1999.
The decline in exports, along together with stagnating domestic demand, has caused a slowdown in
economic growth in recent years. The growth of GDP declined to 5.8 per cent in 1998 and 4.8 per cent
in 19991). Despite inflation being kept under control, the macroeconomic situation has been
deteriorating in many aspects. Fiscal revenue fell from over 25 per cent of GDP in 1993 to around 18
per cent of GDP in 1999, resulting in lower public spending on social services and increased deficits.
The inflows of foreign direct investments dropped sharply and put pressure on domestic currency to
depreciate.
The slowdown in economic growth has amplified social and economic problems. According to
official statistics, the unemployment rate increased from6per cent of the labor force in 1997 to 7.4 in
1999, while underemployment has remained high in both rural and urban areas. The poverty
incidence, which declined sharply in the mid of 1990s thanks to the high growth, may have increased.
In order to resume economic growth, economic reforms have been accelerated with the emphasis on
the restructuring of SOEs and banking sector and trade reforms.
Trade Reforms in Vietnam A Computable General Equilibrium Analysis
-192-
63.7
1542
0
1199
60
242.0
1882
.3
1740
11.3
2814
18.2
-11
00
-7.1
393.5 -
1038
2757
-17
18
-75
1
405
-29
7
64.8
2809
3
1255
71
433.7
1938
.7
3899
13.9
5964
21.2
-21
13
-7.5
34.5
-
1946
2566
-62
0
-58
6
300
-32
0
65.8
4195
5
1319
68
637.2
2004
.2
6153
14.7
8280
19.7
-24
37
-5.8
67.1
6800
2404
39.0
2752
44.6
-34
8
-25
9
122
-14
2
66.9
7670
7
1396
34
1146
.0
2086
.1
1035
3
13.5
1086
3
14.2
-11
60
-1.5
67.5
1118
0
2087
30.4
2338
34.1
-25
1
-13
2 60
50
Population
GDP at current prices
GDP at const. prices 1994
GDP per capita
- current prices
- constant prices
Fiscal revenue
as percentage of GDP
Public expenditure
as percentage of GDP
Fiscal deficits
as percentage of GDP
Inflation rate
Nominal exchange rate
Exports
as percentage of GDP
Imports
as percentage of GDP
Trade balance
Current account balance
Net capital inflows
Overall balance of payment
Mill. pers.
Bill. Dong
Bill. Dong
1000 Dong
1000 Dong
Bill. Dong
%
Bill. Dong
%
Bill. Dong
%
%
Dong/US$
US$ mill.
%
US$ mill.
%
US$ mill.
US$ mill.
US$ mill.
US$ mill.
62.5
2870
1131
54
46.0
1811
.9
379
13.2
513
17.9
-13
6
-4.7
223.1 -
854
2455
-16
01
-62
4
378
-31
5
Unit
1987
1988
1989
1990
1991
68.0
1105
32
1517
82
1624
.5
2230
.7
2102
3
19.0
2190
2
19.8
-18
79
-1.7
17.5
1064
0
2581
24.8
2541
24.5
40
-8
271
268
1992
69.2
1402
58
1640
43
2027
.8
2371
.7
3069
6
21.9
3522
6
25.1
-62
40
-4.4
5.2
1098
0
2985
23.4
3924
30.7
-93
9
-76
7
-78
-10
56
1993
70.3
1785
34
1785
34
2539
.1
2539
.1
4212
5
23.6
4283
6
24.0
-18
05
-1.0
14.4
1104
0
4054
25.1
5826
36.0
-17
72
-11
85
897
-40
9
1994
71.5
2288
92
1955
67
3202
.4
2736
.1
5337
0
23.3
5169
4
22.6
-12
19
-0.5
12.7
1103
0
5449
26.3
8155
39.3
-27
07
-19
28
1762
-19
9
1995
72.8
2720
36
2138
33
3736
.8
2937
.3
6238
7
22.9
6018
9
22.1
-50
2
-0.2
4.5
1120
0
7256
29.9
1114
4
45.9
-38
88
-24
49
2105
-27
8
1996
74.1
3136
23
2312
64
4232
.4
3121
.0
6625
2
21.1
6883
3
21.9
-44
97
-1.4
3.6
1279
0.4
9185
37.5
1159
2
47.3
-24
07
-16
42
1688
-4
1997
75.4
3610
16
2445
96
4788
.0
3244
.0
6860
0
19.0
6932
3
19.2
-27
27
-0.8
9.2
1394
1.5
9360
36.1
1150
0
44.4
-21
39
-10
73
216
-52
7
1998
76.6
3999
42
2562
69
5221
.2
3345
.5
6950
0
17.4
7149
8
17.9
-44
81
-1.1
1.1
1405
0
1154
0
40.5
1162
2
40.8
-82
1252
-33
4
168
1999
Table 1 : Selected Macroeconomic Indicators 1987-1999
Sources: GSO (1996), GSO(1998), IMF(2000)
-193-
II.2. Current Trade Regimes
The reform of trade regimes has constituted a major component of the overall economic reforms in
Vietnam. Until the late 1980s, foreign trade activities in Vietnam were subject to central decisions by
the planning authorities, and could be carried out by only a small number of state trading enterprises.
Over the last decade, entry to trade activities has been significantly liberalized through removing the
trade monopoly of state trading enterprises and allowing producers in the state sector and private
sector to engage in trade. All enterprises are now allowed to export or import any commodities in
accordance with their field of business. In 1989, the parallel exchange rate system was unified, and the
domestic currency was devaluated to promote exports. A managed floating exchange rate regime has
been adopted and gradually liberalized.
Export duties are imposed on a small range of agricultural products and crude materials, and only
a few exports are subject to quantitative restrictions and regulation mainly for security and
environmental concerns. Only exports of garment and textiles to Norway, Canada and the European
Union are subject to quantitative restrictions determined in bilateral agreements with these countries.
The import regimes have been gradually liberalized, but remain highly restrictive as reflected in
high tariffs and pervasive non-tariff barriers(NTBs). The maximum tariff rate was reduced from 200
per cent in 1992 to 60 per cent in 1999, and the average tariff rate fell from nearly 20 per cent in the
mid 1990s to around 15 per cent2). Many domestic industries have been protected through NTBs,
which are numerous and strong in Vietnam(McCarthy 1999: p.13). Among these NTBs, quantitative
restrictions and currency controls have been extensively employed. Quantitative restrictions are being
imposed on 11 groups of commodities, most of which are consumer commodities. It was estimated that
approximately 40 per cent of imports are subject to explicit quantitative restrictions, and nearly one-
fourth of domestic production of goods is subject to protection from quantitative restrictions(Centre
for International Economics(CIE)1999: p.23).
Currency controls have been adopted to prevent capital out-flight and limit imports. The surrender
requirement introduced in 1997 requires firms to sell up to 50 per cent of their foreign exchange
earnings to designated banks, and the use of foreign exchange is subject to the allocation procedures
designed by the state bank to limit imports of consumer goods. The restriction on imported consumer
goods is also implemented through the cash margin requirement or the balancing requirement.
Imports of certain commodities are subject to minimum price valuation, which is designed to
counter under-invoicing problems and can raise the prices of imports. The different tax treatments
between domestic producers and imported goods have provided further protection for certain
industries. Custom surcharges imposed on some imports can be regarded as additional tariffs. Anti-
dumping and counter-veiling measures were introduced in 1988 to protect domestic producers from
Trade Reforms in Vietnam A Computable General Equilibrium Analysis
-194-
unfair trade in both domestic and foreign markets.
Generally, high tariffs and non-tariff barriers are imposed on consumer goods, while low tariffs are
generally imposed on capital goods and intermediate inputs. However several intermediate inputs,
which are being produced domestically such as cement, steel, glass, fertilizers and papers, are also
highly protected. Since the mid of 1990s, protection through tariff and non-tariff barriers has been
extended to absorb foreign investments into so-called infant industries, such as automobile, cement or
steal. As a result, a large portion of foreign direct investment has flowed into highly protected
industries. Around 65 per cent of investment occurred in the sectors with the effective rate of
protection of above 60 per cent(CIE 1998: p.131).
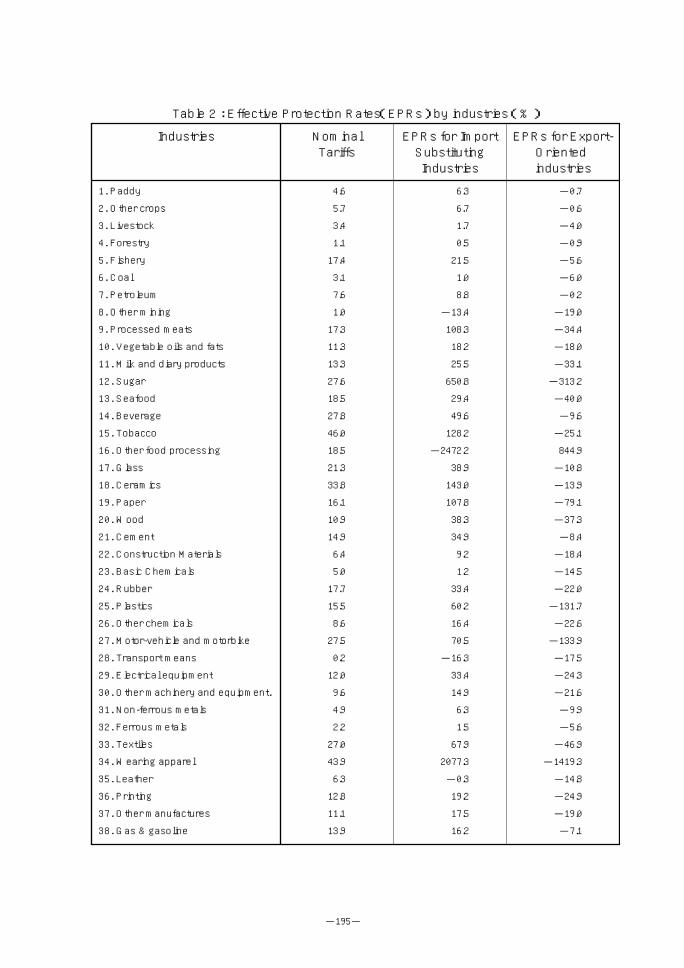
Table2presents the estimated effective protection rates(EPRs)by industries, based on the 1996
input-output table and nominal tariff rates estimated by CIE(1998: p.122). The effective protection
rates are computed separately for import substitution industries, which benefit from higher domestic
prices caused by protection, and for export-oriented industries, which sell products in foreign markets
and face world prices3). With respect to the effective protection provided to import substitution
industries, most industries enjoy higher effective rates of protection as compared to nominal rates of
protection. Some industries, such as sugar or wearing apparel, receive very high effective rates of
protection4). Mining, excluding oil exploitation, fertilizers and transportation means that receive low
nominal protection face negative effective protection. Export-oriented industries face negative
effective protection since they pay higher prices for imported inputs.
II.3. Commitments to Trade Liberalization
The process of opening up to the world economy has been accelerated since the mid of 1990s.
Vietnam became a member of ASEAN in 1995, joined APEC in 1998, and has applied for membership
in the WTO. In July 2000, Vietnam and the United States agreed on a bilateral agreement. Various
commitments to trade liberalization have been made under bilateral and multilateral trade agreements
and will be carried out in coming years
-195-
1. Paddy
2. Other crops
3. Livestock
4. Forestry
5. Fishery
6. Coal
7. Petroleum
8. Other mining
9. Processed meats
10. Vegetable oils and fats
11. Milk and diary products
12. Sugar
13. Seafood
14. Beverage
15. Tobacco
16. Other food processing
17. Glass
18. Ceramics
19. Paper
20. Wood
21. Cement
22. Construction Materials
23. Basic Chemicals
24. Rubber
25. Plastics
26. Other chemicals
27. Motor-vehicle and motorbike
28. Transport means
29. Electrical equipment
30. Other machinery and equipment.
31. Non-ferrous metals
32. Ferrous metals
33. Textiles
34. Wearing apparel
35. Leather
36. Printing
37. Other manufactures
38. Gas & gasoline
Industries Nominal Tariffs
Table 2 : Effective Protection Rates(EPRs) by industries (%)
4.6
5.7
3.4
1.1
17.4
3.1
7.6
1.0
17.3
11.3
13.3
27.6
18.5
27.8
46.0
18.5
21.3
33.8
16.1
10.9
14.9
6.4
5.0
17.7
15.5
8.6
27.5
0.2
12.0
9.6
4.9
2.2
27.0
43.9
6.3
12.8
11.1
13.9
EPRs for Import Substituting Industries
EPRs for Export- Oriented industries
6.3
6.7
1.7
0.5
21.5
1.0
8.8
-13.4
108.3
18.2
25.5
650.8
29.4
49.6
128.2
-2472.2
38.9
143.0
107.8
38.3
34.9
9.2
1.2
33.4
60.2
16.4
70.5
-16.3
33.4
14.9
6.3
1.5
67.9
2077.3
-0.3
19.2
17.5
16.2
-0.7
-0.6
-4.0
-0.9
-5.6
-6.0
-0.2
-19.0
-34.4
-18.0
-33.1
-313.2
-40.0
-9.6
-25.1
844.9
-10.8
-13.9
-79.1
-37.3
-8.4
-18.4
-14.5
-22.0
-131.7
-22.6
-133.9
-17.5
-24.3
-21.6
-9.9
-5.6
-46.9
-1419.3
-14.8
-24.9
-19.0
-7.1
Trade Reforms in Vietnam A Computable General Equilibrium Analysis
-196-
As a member of the ASEAN Free Trade Area(AFTA), Vietnam is obligated to cut tariffs and
remove its NTBs. According to the Common Effective Preferential Tariff(CEPT)agreement, the
AFTA members are obligated to reduce tariffs on intra-ASEAN trade to less than5per cent by the
year 2002. Later members of ASEAN, including Vietnam, are allowed to complete tariff reductions
over a longer period, by the year 2006. Under the CEPT scheme, tariff reductions are carried out with
different schedules, namely Inclusion List(IL), Temporary Exclusion List(TEL), Unprocessed
Agricultural Products(UAP)and Exclusion List(EL)5).
The implementation of the CEPT began in 1996, but progressed slowly until 1999. Most products
that were initially introduced in the Inclusion List were subject to very few non-tariff barriers and low
tariffs. In 2000, tariff reductions began for the highly protected products in the TEL, and around two-
thirds of the total tariff lines were already included the IL(IMF 2000, p. 38). When the tariff
reductions are completed by 2006, over 97 per cent of Vietnam’s tariff lines will have their tariffs
reduced to under5per cent. In addition to tariff reductions, Vietnam is obligated to remove
quantitative restrictions and non-tariff barriers. The removal of NTBs will begin as soon as products
are phased in the IL and have to be completed within a period of five years.
Since ASEAN countries account for only one fifth of Vietnam’s imports, the impacts of AFTA
appear limited. Moreover, Singapore, the largest ASEAN trading partner of Vietnam, alone accounts
for over 50 per cent of the total imports from ASEAN. A significant share of imports from Singapore
does not meet with the principle of origin that requires a product to have at least 40 per cent of its
content produced in the AFTA area to be qualified for preferential tariff treatments, and thereby
these imports are not subject to tariff reductions.
The APEC requires its member countries to carry out unilateral trade liberalization, including free
trade, liberalization of investment regimes and the opening of service sectors to foreign providers.
Vietnam is committed to fulfill APEC objective of free trade and investment by the year 2020, but has
not made any specific commitment on tariff reductions and NTBs. Vietnam’s bid for WTO
membership began in 1995, and the country expects to join this organization by 2005(VET
September 5, 2001). To acquire WTO membership, Vietnam has to lower tariffs significantly and
remove non-tariff barriers.
Unilateral trade liberalization is also a major component of structural adjustment programs.
According to a recent agreement with the World Bank and the IMF on short-term economic reforms
(SRV, 2001), Vietnam will remove import quotas for six commodities by the year 20036). The
surrender requirement will be phased out, and regulations and restrictions in the foreign exchange
market will be relaxed to allow a greater role for market forces.
-197-
III. Model Specification and Calibration
III.1. Model specification
This section discusses the structure of the model used in this paper to analyze the trade reforms in
Vietnam. Our model follows closely the neoclassical CGE model for an open economy developed by K.
Dervis, J. de Melo and S. Robinson in the early 1980s7). Our model uses constant elasticity of
substitution(CES)functions in production and imports. Export supply is also determined by constant
elasticity of transformation(CET)functions. The model assumes factor mobility, but takes into
account distortions in factor markets. The structure of the model is discussed in detail below8).
The model identifies several kinds of prices, consisting of export prices, import prices, domestic
prices, producer prices, wages and capital rents. The world prices of imports are treated exogenously
in accordance with the small country assumption, which states that a country is a price taker and
cannot affect international prices. Assuming that the country sells differentiated products in the world
market, the small country assumption is no longer applied to exports. Exporters face a downward
sloping world demand curve, and any increase in the volume of exports results in a decline in the
dollar price received by exporters. Export and import prices in dollars are translated into domestic
currency by using the exchange rate with tariffs added(in the case of imports)or export duties
subtracted(in the case of exports).
Composite prices are computed from domestic prices of domestically produced goods and import
prices. Producer prices are the composite prices of export prices and domestic prices. Value added
prices are producer prices minus production taxes and intermediate costs. Since CGE models
determine only relative prices, the choice of a numeraire is required to determine the absolute price
level. In this model, the exchange rate, or the GDP deflator in some cases, is defined as the numeraire.
Domestic output in each sector is a CES function between capital and labor. Factor demand is
derived from the profit maximization condition, which requires that factor prices equal their marginal
revenue products. Our model is medium-term in the sense that labor and capital are mobile among
industries but takes into consideration distortions in factor markets. Sectoral factor prices are equal to
the average factor price level times fixed coefficients, which reflect the differences in sectoral
marginal products of labor and capital.
Imports and domestically produced products are imperfect substitutes. The composite product in
each sector is a CES function of domestically produced products and imports. Demand for domestic
and imported products is derived from the cost minimization condition. Domestic producers seeking to
maximize revenue decide how much to sell in domestic markets and in foreign markets. The
treatment of exports is based on CET functions. Assuming producers maximize revenue given a level
of output, the amounts of export and domestic supply are derived from the revenue maximization
Trade Reforms in Vietnam A Computable General Equilibrium Analysis
-198-
condition. The sectoral export demand is the function of the world export price.
The model identifies two economic agents, that is government and households, which get income,
consume and save a part of their income. Household income is equal to the sum of factor income
minus the direct tax payment. Government revenue consists of revenues from direct taxes, indirect
taxes, tariffs and export duties. Government and households are assumed to save fixed shares of their
income or revenue. The household consumption demand is based on a Cobb-Douglas utility function,
with fixed expenditure shares. The governmental final demand is defined using fixed expenditure
shares of real spending. Total nominal fixed investment is converted into real fixed investment by
using an investment deflator. Sectoral demand for capital goods is then computed through fixed
coefficients. Since the model is static, investment simply represents a demand component with no
effect on the supply side.
Equilibrium conditions identified in the model consist of equilibrium conditions in product and
factor markets, and three macro equilibrium conditions in the foreign exchange market, fiscal balance
and investment-savings balance. Equilibrium conditions in factor markets are implied in the
treatments of factor markets, with factor prices serving as equilibrating variables. Equilibrium in
product markets equates the supply of the domestic product to its demand in each sector, with
domestic prices serving as equilibrating variables.
The fiscal balance is also implied in the treatment of the government sector, in which government
consumption is determined as the difference between government revenue and government savings.
Equilibrium in foreign exchange markets requires that the difference between exports and imports
equals the inflow of foreign capital or foreign savings. Foreign savings is typically treated as
exogenous, and the exchange rate will adjust to achieve equilibrium through its effects on import and
export prices. In some simulations, the exchange rate is exogenous, and in these cases, foreign savings
will serve as an equilibrating variable.
The savings-investment balance requires that total nominal investment, which consists of fixed
investment and inventory investment, is equal to total savings. Total savings is the sum of private
savings, government saving and foreign savings in the term of domestic currency. The model adopts
the neoclassical closure, under which investment is determined by total saving9). Since the model
satisfies Walras’s law, the saving-investment balance is considered as redundant and is dropped.
III.2. Data and Calibration of the Model
The model makes use of the 1996 input-output table developed by Vietnam’s General Statistical
Office(GSO, 1999). It differentiates 24 sectors aggregated from 97 sectors in the input-output table.
Among these 24 sectors, there are2agricultural sectors,2mining sectors, 13 manufacturing sectors, 5
service sectors and electricity, gas and water, construction. The input-output table is valued at
-199-
producer prices.
Parameters and exogenous variables are computed using information contained in the input-output
table and other data sources. Sectoral wage rates are estimated using income-to-labor data in the
input-output table and employment data from official statistics. Although data on capital stock is
available in some business surveys, such data provides only fixed price value that do not reflect the
actual value of capital. Our approach, adapted from Ezaki and Son(1997: p.17), is to estimate total
capital stock and then allocate it to each sector using the income-to-capital data in the I-O table and
the relative profit rates obtained from GSO(1997).
Total revenue from import tariffs is allocated among sectors by using average weighted tariff rates
estimated by CIE(1998). Government revenue consists of revenue from taxes. Total savings is equal
to total capital accumulation in the input-output table. Private savings is calculated from total savings
after subtracting government savings and foreign savings. Household income or private income is the
sum of factor income minus the direct tax payment to government. Subtracting private savings from
private income, we get household or private consumption. Other parameters relating to demand for
inputs(I-O coefficients), composition of consumption and demand for capital goods by sectors of
origin are computed using data in the input-output table.
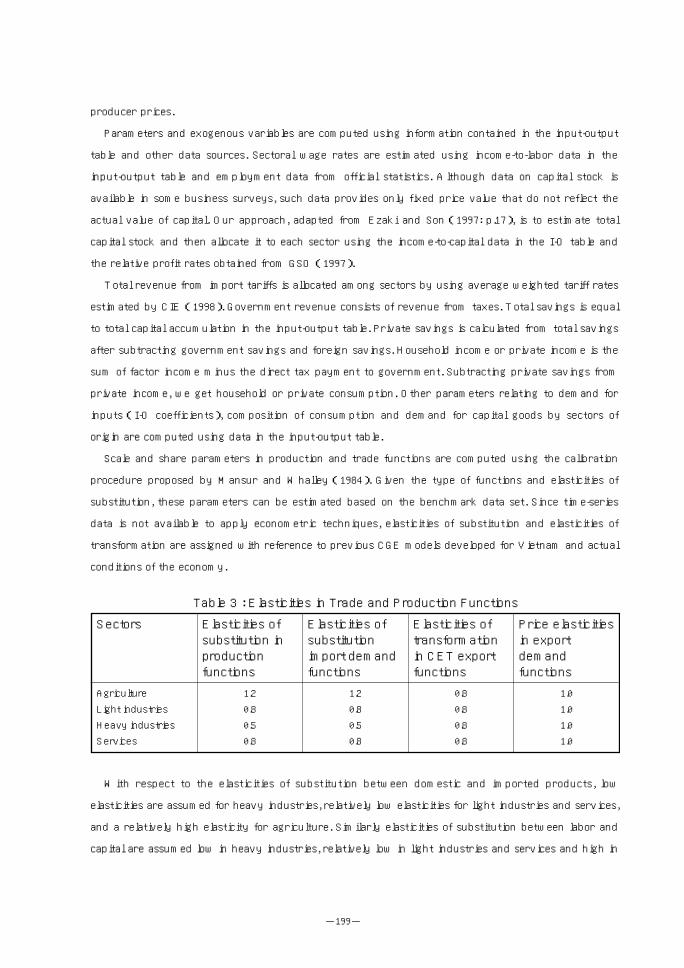
Scale and share parameters in production and trade functions are computed using the calibration
procedure proposed by Mansur and Whalley(1984). Given the type of functions and elasticities of
substitution, these parameters can be estimated based on the benchmark data set. Since time-series
data is not available to apply econometric techniques, elasticities of substitution and elasticities of
transformation are assigned with reference to previous CGE models developed for Vietnam and actual
conditions of the economy.
With respect to the elasticities of substitution between domestic and imported products, low
elasticities are assumed for heavy industries, relatively low elasticities for light industries and services,
and a relatively high elasticity for agriculture. Similarly elasticities of substitution between labor and
capital are assumed low in heavy industries, relatively low in light industries and services and high in
Agriculture Light industries Heavy industries Services
Table 3 : Elasticities in Trade and Production Functions
1.2
0.8
0.5
0.8
Elasticities of substitution in production functions
Elasticities of substitution import demand functions
Elasticities of transformation in CET export functions
Price elasticities in export demand functions
Sectors
1.2
0.8
0.5
0.8
0.8
0.8
0.8
0.8
1.0
1.0
1.0
1.0
Trade Reforms in Vietnam A Computable General Equilibrium Analysis
-200-
agriculture. An elasticity of 0.8 is used in CET functions, and a price elasticity of 1 is assumed in the
export demand functions10) .
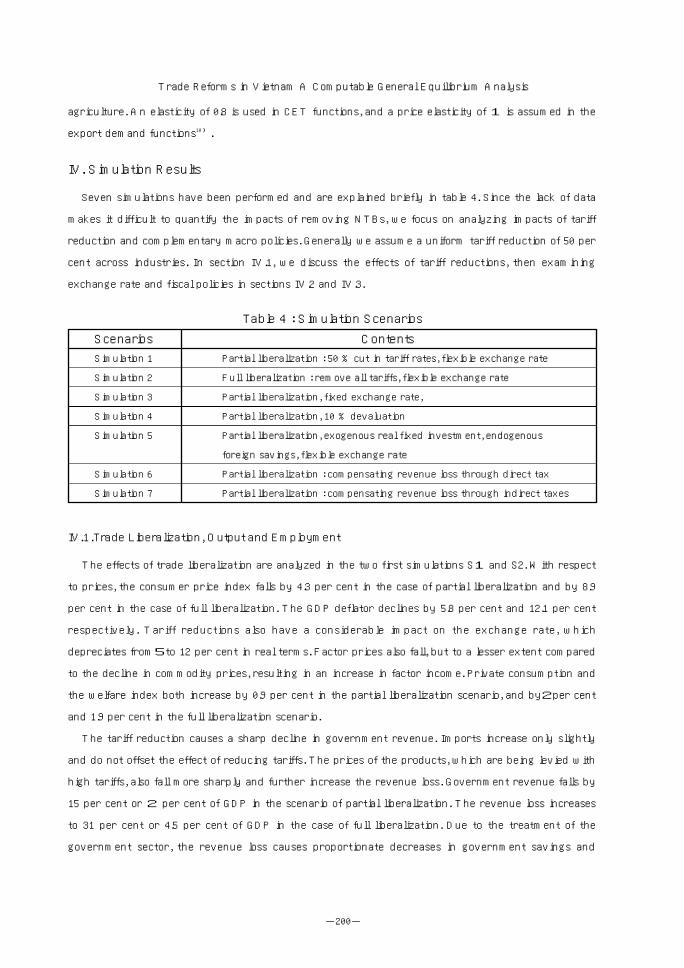
IV. Simulation Results
Seven simulations have been performed and are explained briefly in table 4. Since the lack of data
makes it difficult to quantify the impacts of removing NTBs, we focus on analyzing impacts of tariff
reduction and complementary macro policies. Generally we assume a uniform tariff reduction of 50 per
cent across industries. In section IV.1, we discuss the effects of tariff reductions, then examining
exchange rate and fiscal policies in sections IV.2 and IV.3.
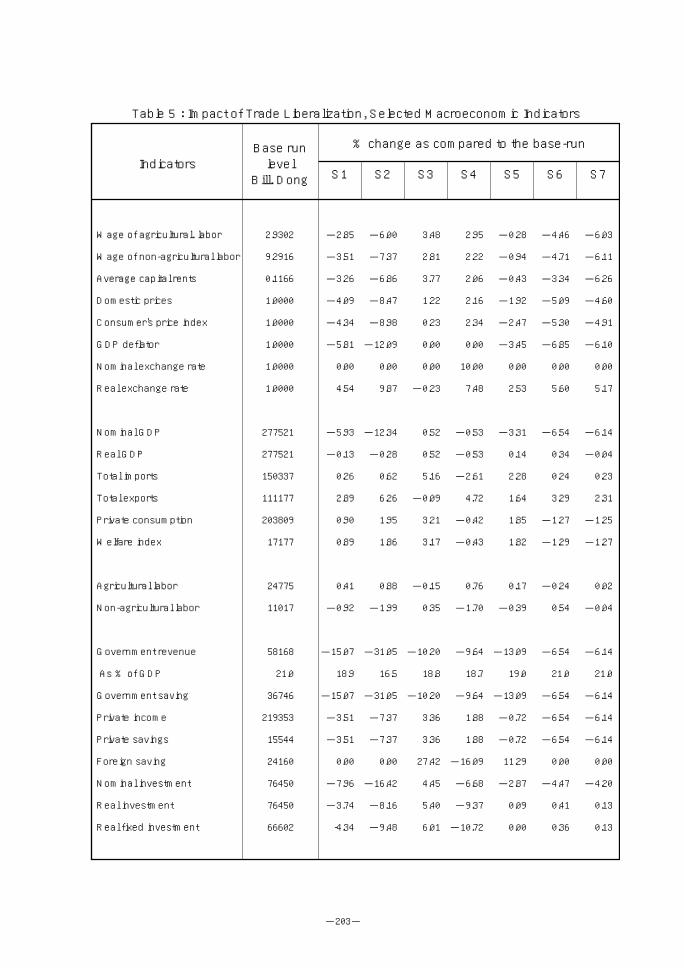
IV.1.Trade Liberalization, Output and Employment
The effects of trade liberalization are analyzed in the two first simulations S1 and S2. With respect
to prices, the consumer price index falls by 4.3 per cent in the case of partial liberalization and by 8.9
per cent in the case of full liberalization. The GDP deflator declines by 5.8 per cent and 12.1 per cent
respectively. Tariff reductions also have a considerable impact on the exchange rate, which
depreciates from5to 12 per cent in real terms. Factor prices also fall, but to a lesser extent compared
to the decline in commodity prices, resulting in an increase in factor income. Private consumption and
the welfare index both increase by 0.9 per cent in the partial liberalization scenario, and by2per cent
and 1.9 per cent in the full liberalization scenario.
The tariff reduction causes a sharp decline in government revenue. Imports increase only slightly
and do not offset the effect of reducing tariffs. The prices of the products, which are being levied with
high tariffs, also fall more sharply and further increase the revenue loss. Government revenue falls by
15 per cent or 2 per cent of GDP in the scenario of partial liberalization. The revenue loss increases
to 31 per cent or 4.5 per cent of GDP in the case of full liberalization. Due to the treatment of the
government sector, the revenue loss causes proportionate decreases in government savings and
Simulation 1
Simulation 2
Simulation 3
Simulation 4
Simulation 5
Simulation 6
Simulation 7
Table 4 : Simulation Scenarios
Scenarios ContentsPartial liberalization : 50 % cut in tariff rates, flexible exchange rate
Full liberalization : remove all tariffs, flexible exchange rate
Partial liberalization, fixed exchange rate,
Partial liberalization, 10 % devaluation
Partial liberalization, exogenous real fixed investment, endogenous
foreign savings, flexible exchange rate
Partial liberalization : compensating revenue loss through direct tax
Partial liberalization : compensating revenue loss through indirect taxes
-201-
consumption. The decrease in government savings also leads to a decrease in total savings and
investment. Real fixed investment falls by 4.3 per cent in the case of partial liberalization and 9.5 per
cent in the case of full liberalization.
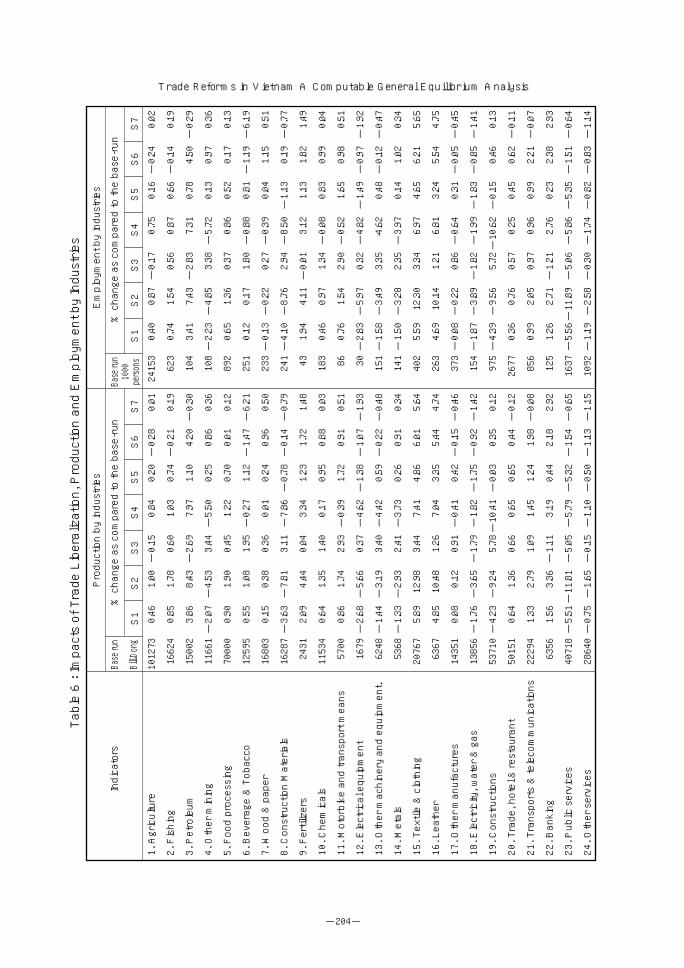
The decline in domestic prices stimulates exports, and a significant growth of exports can be seen
in many industries. Imports increase significantly in some sectors, which are being levied with high
tariff rates such as in tobacco and beverages and textiles. Export-oriented and light industries benefit
from trade liberalization. Output in textile industries increases by 5.9 per cent in the case of partial
liberalization and by 13 per cent when tariffs are completely removed. The decline in investment
leads to a contraction of output in construction and other industries producing capital goods. It is,
however, public services that suffer the greatest loss as a result of the sharp reduction in government
revenue and expenditure.
The output gain in export-oriented industries does not fully offset the loss incurred by capital
producing industries and public services. Real GDP falls by 0.1 per cent in the partial liberalization
scenario, but increases to 0.3 per cent in the case of full liberalization. Employment in non-agricultural
sectors falls by 0.9 per cent in the partial liberalization simulation and by2per cent in the case of full
liberalization. Since the model adopts the full-employment assumption, redundant workers in non-
agricultural sectors are absorbed into agriculture, resulting in a small increase in this sector.
The pattern of changes in employment among sectors follows closely the shift in the production
sectors. Labor moves toward expanding industries, such as textile, clothing and food processing.
Employment in textiles and clothing and leather increases by 5.6 per cent and 4.7 per cent in the
partial liberalization scenario, and by 12.3 per cent and 10.1 per cent in the full liberalization scenario.
Employment falls in machinery and equipment, construction, construction materials and public
services.
IV.2.Exchange Rate and Foreign Savings
When foreign savings is treated exogenously and the exchange rate is flexible, the decline in the
domestic prices of imports causes an increase in imported goods, which then requires a real
depreciation to maintain the initial trade balance. To examine the effect of liberalization on the
external balance, we use an alternative external closure in simulations S3 and S4, in which foreign
savings is treated endogenously and the exchange rate is fixed. In these simulations, the GDP deflator
serves as the numeraire in place of the exchange rate.
In simulation S3, the exchange rate is fixed at the benchmark level, and simulation S4 assumes a
devaluation of domestic currency. With the assumption of flexible foreign savings, imports increase
significantly, by more than5per cent as compared to the base run level. Significant increases in
imports are seen in certain sectors, such as fisheries(15.4 per cent), tobacco and beverage(26.1 per
Trade Reforms in Vietnam A Computable General Equilibrium Analysis
-202-
cent)and construction materials(10.4 per cent). Exports decline by 0.1 per cent and, as a result, the
trade deficit increases by 27.4 per cent.
The increase in foreign savings more than offsets the decline in government savings and results in
increases in total savings and investment. Real GDP increases by 0.5 per cent, and the expansion of
production are seen in most manufacturing sectors. In export-oriented industries such as textile and
leather, however, the increase in output is not as high when compared to the case of the flexible
exchange rate. Employment in non-agricultural sectors increases by 0.4 per cent and causes a small
decline in agricultural employment and output.
In simulation S4, a currency devaluation of 10 per cent reduces the trade deficit by 16 per cent.
This is achieved by a 2.6 per cent decline in imports and a 4.7 per cent increase in exports. The
currency devaluation raises the consumer price index by2per cent, resulting in slight declines in
private consumption and the welfare index. Due to the treatment of foreign savings, the decline in
trade deficits causes a sharp fall in total saving and investment. As a result, real GDP declines by1
per cent. It is likely, however, that there will be an increase in foreign capital inflows and domestic
investment following trade liberalization and devaluation.
In the simulations discussed above, the decline in investment caused by decreased government or
foreign savings partly leads to the decline in GDP. In the simulation S5, we treat the real fixed
investment as exogenous and foreign savings is adjusted to obtain the level of investment. The results
show that an increase of 11.3 per cent in foreign savings is required to sustain investment. Sustaining
real investment maintains output in capital producing industries, and real GDP increases slightly.
IV.3.Trade Liberalization and Complementary Tax Policies
The last two simulations presented in this section are both revenue neutral, but they differ in the
way government revenue is sustained. Government revenue is a fixed share of nominal GDP, and
either the direct tax or production taxes are allowed to adjust to achieve the targeted revenue. In the
simulation S6, government compensates for the revenue loss by raising the profit tax or direct tax, or
by increasing production taxes by a uniform rate in the simulation S7.
The computation results show that an increase of 20 per cent in all production taxes is required to
compensate for the revenue loss caused by the 50 per cent cut in tariffs. Due to the relatively small
tax base, an increase of 40 per cent in the direct tax rate is required if government wants to maintain
revenue through the profit tax. In both simulations, the increase in tax rates causes a decline in
private income, which in turn leads to a proportionate decline in private savings and consumption.
Total private consumption falls by nearly 1.3 per cent in both simulations, and the welfare index also
declines to a similar extent.
Sustaining revenue mitigates the adverse impacts of tariff cuts and almost eliminates the output
-203-
Wage of agricultural. labor
Wage of non-agricultural labor
Average capital rents
Domestic prices
Consumer's price index
GDP deflator
Nominal exchange rate
Real exchange rate
Nominal GDP
Real GDP
Total imports
Total exports
Private consumption
Welfare index
Agricultural labor
Non-agricultural labor
Government revenue
As % of GDP
Government saving
Private income
Private savings
Foreign saving
Nominal investment
Real investment
Real fixed investment
Table 5 : Impact of Trade Liberalization, Selected Macroeconomic Indicators
IndicatorsBase run level
Bill. Dong
% change as compared to the base-run
S4 S5 S6 S7S1 S2 S3
2.9302
9.2916
0.1166
1.0000
1.0000
1.0000
1.0000
1.0000
277521
277521
150337
111177
203809
17177
24775
11017
58168
21.0
36746
219353
15544
24160
76450
76450
66602
-2.85
-3.51
-3.26
-4.09
-4.34
-5.81
0.00
4.54
-5.93
-0.13
0.26
2.89
0.90
0.89
0.41
-0.92
-15.07
18.9
-15.07
-3.51
-3.51
0.00
-7.96
-3.74
-4.34
-6.00
-7.37
-6.86
-8.47
-8.98
-12.09
0.00
9.87
-12.34
-0.28
0.62
6.26
1.95
1.86
0.88
-1.99
-31.05
16.5
-31.05
-7.37
-7.37
0.00
-16.42
-8.16
-9.48
3.48
2.81
3.77
1.22
0.23
0.00
0.00
-0.23
0.52
0.52
5.16
-0.09
3.21
3.17
-0.15
0.35
-10.20
18.8
-10.20
3.36
3.36
27.42
4.45
5.40
6.01
2.95
2.22
2.06
2.16
2.34
0.00
10.00
7.48
-0.53
-0.53
-2.61
4.72
-0.42
-0.43
0.76
-1.70
-9.64
18.7
-9.64
1.88
1.88
-16.09
-6.68
-9.37
-10.72
-0.28
-0.94
-0.43
-1.92
-2.47
-3.45
0.00
2.53
-3.31
0.14
2.28
1.64
1.85
1.82
0.17
-0.39
-13.09
19.0
-13.09
-0.72
-0.72
11.29
-2.87
0.09
0.00
-4.46
-4.71
-3.34
-5.09
-5.30
-6.85
0.00
5.60
-6.54
0.34
0.24
3.29
-1.27
-1.29
-0.24
0.54
-6.54
21.0
-6.54
-6.54
-6.54
0.00
-4.47
0.41
0.36
-6.03
-6.11
-6.26
-4.60
-4.91
-6.10
0.00
5.17
-6.14
-0.04
0.23
2.31
-1.25
-1.27
0.02
-0.04
-6.14
21.0
-6.14
-6.14
-6.14
0.00
-4.20
0.13
0.13
Trade Reforms in Vietnam A Computable General Equilibrium Analysis
-204-
1. Agriculture
2. Fishing
3. Petroleum
4. Other mining
5. Food processing
6. Beverage & Tobacco
7. Wood & paper
8. Construction Materials
9. Fertilizers
10. Chemicals
11. Motorbike and transport means
12. Electrical equipment
13. Other machinery and equipment.
14. Metals
15. Textile & clothing
16. Leather
17. Other manufactures
18. Electricity, water & gas
19. Constructions
20. Trade, hotel & restaurant
21. Transports & telecommunications
22. Banking
23. Public services
24. Other services
% change as compared to the base-run
Production by industries
S4
Base run
Bill.Dong
Indicators
1012
73
1662
4
1500
2
1166
1
7000
0
1259
5
1680
3
1628
7
2431
1153
4
5700
1679
6248
5368
2076
7
6367
1435
1
1385
6
5371
0
5015
1
2229
4
6356
4071
8
2864
0
Table 6 : Impacts of Trade Liberalization, Production and Employment by Industries
0.46
0.85
3.86
-2.07
0.90
0.55
0.15
-3.63
2.09
0.64
0.86
-2.68
-1.44
-1.33
5.89
4.85
0.08
-1.76
-4.23
0.64
1.33
1.56
-5.51
-0.75
1.00
1.78
8.43
-4.53
1.90
1.08
0.38
-7.81
4.44
1.35
1.74
-5.66
-3.19
-2.93
12.98
10.48
0.12
-3.65
-9.24
1.36
2.79
3.36
-11
.81
-1.65
-0.15
0.60
-2.69
3.44
0.45
1.95
0.36
3.11
0.04
1.40
2.93
0.37
3.40
2.41
3.44
1.26
0.91
-1.79
5.78
0.66
1.09
-1.11
-5.05
-0.15
0.84
1.03
7.97
-5.50
1.22
-0.27
0.01
-7.86
3.34
0.17
-0.39
-4.62
-4.42
-3.73
7.41
7.04
-0.41
-1.82
-10
.41
0.65
1.45
3.19
-5.79
-1.10
0.20
0.74
1.10
0.25
0.70
1.12
0.24
-0.78
1.23
0.95
1.72
-1.38
0.59
0.26
4.86
3.35
0.42
-1.75
-0.03
0.65
1.24
0.44
-5.32
-0.50
-0.28
-0.21
4.20
0.86
0.01
-1.47
0.96
-0.14
1.72
0.88
0.91
-1.07
-0.22
0.91
6.01
5.44
-0.15
-0.92
0.35
0.44
1.98
2.18
-1.54
-1.13
0.01
0.19
-0.30
0.36
0.12
-6.21
0.50
-0.79
1.48
0.03
0.51
-1.93
-0.48
0.34
5.64
4.74
-0.46
-1.42
0.12
-0.12
-0.08
2.92
-0.65
-1.15
S5
S6
S7
S1
S2
S3
% change as compared to the base-run
Employment by industries
S4
Base run
1000
persons
2415
3
623
104
108
892
251
233
241
43
183
86
30
151
141
402
263
373
154
975
2677
856
125
1637
1092
0.40
0.74
3.41
-2.23
0.65
0.12
-0.13
-4.10
1.94
0.46
0.76
-2.83
-1.58
-1.50
5.59
4.69
-0.08
-1.87
-4.39
0.36
0.99
1.26
-5.56
-1.19
0.87
1.54
7.43
-4.85
1.36
0.17
-0.22
-8.76
4.11
0.97
1.54
-5.97
-3.49
-3.28
12.30
10.14
-0.22
-3.89
-9.56
0.76
2.05
2.71
-11
.89
-2.58
-0.17
0.56
-2.83
3.38
0.37
1.80
0.27
2.94
-0.01
1.34
2.90
0.32
3.35
2.35
3.34
1.21
0.86
-1.82
5.72
0.57
0.97
-1.21
-5.06
-0.30
0.75
0.87
7.31
-5.72
0.86
-0.88
-0.39
-8.50
3.12
-0.08
-0.52
-4.82
-4.62
-3.97
6.97
6.81
-0.64
-1.99
-10
.62
0.25
0.96
2.76
-5.86
-1.74
0.16
0.66
0.78
0.13
0.52
0.81
0.04
-1.13
1.13
0.83
1.65
-1.49
0.48
0.14
4.65
3.24
0.31
-1.83
-0.15
0.45
0.99
0.23
-5.35
-0.82
-0.24
-0.14
4.50
0.97
0.17
-1.19
1.15
0.19
1.82
0.99
0.98
-0.97
-0.12
1.02
6.21
5.54
-0.05
-0.85
0.46
0.62
2.21
2.38
-1.51
-0.83
0.02
0.19
-0.29
0.36
0.13
-6.19
0.51
-0.77
1.49
0.04
0.51
-1.92
-0.47
0.34
5.65
4.75
-0.45
-1.41
0.13
-0.11
-0.07
2.93
-0.64
-1.14
S5
S6
S7
S1
S2
S3
-205-
1. Agriculture
2. Fishing
3. Petroleum
4. Other mining
5. Food processing
6. Beverage & Tobacco
7. Wood & paper
8. Construction Materials
9. Fertilizers
10. Chemicals
11. Motorbike and transport means
12. Electrical equipment
13. Other machinery and equipment.
14. Metals
15. Textile & clothing
16. Leather
17. Other manufactures
18. Electricity, water & gas
19. Constructions
20. Trade, hotel & restaurant
21. Transports & telecommunications
22. Banking
23. Public services
24. Other services
% change as compared to the base-run
Exports by industries
S4
Base run
Bill.Dong
Indicators
1478
3
2792
1491
7
2127
2018
6
637
4628
1109
259
1701
1622
5
672
54
1225
4
5575
1511
0
0
1256
1
7772
3075
1436
1502
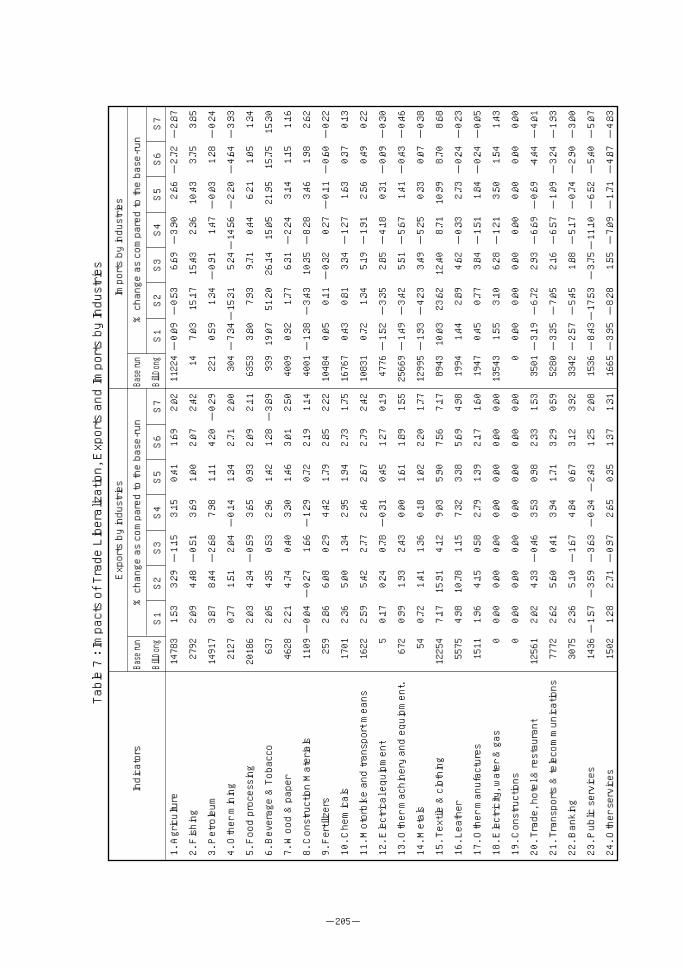
Table 7 : Impacts of Trade Liberalization, Exports and Imports by Industries
1.53
2.09
3.87
0.77
2.03
2.05
2.21
-0.04
2.86
2.36
2.59
0.17
0.99
0.72
7.17
4.98
1.96
0.00
0.00
2.02
2.62
2.36
-1.57
1.28
3.29
4.48
8.44
1.51
4.34
4.35
4.74
-0.27
6.08
5.00
5.42
0.24
1.93
1.41
15.91
10.78
4.15
0.00
0.00
4.33
5.60
5.10
-3.59
2.71
-1.15
-0.51
-2.68
2.04
-0.59
0.53
0.40
1.66
0.29
1.34
2.77
0.78
2.43
1.36
4.12
1.15
0.58
0.00
0.00
-0.46
0.41
-1.67
-3.63
-0.97
3.15
3.69
7.98
-0.14
3.65
2.96
3.30
-1.29
4.42
2.95
2.46
-0.31
0.00
0.18
9.03
7.32
2.79
0.00
0.00
3.53
3.94
4.84
-0.34
2.65
0.41
1.00
1.11
1.34
0.93
1.42
1.46
0.72
1.79
1.94
2.67
0.45
1.61
1.02
5.90
3.38
1.39
0.00
0.00
0.98
1.71
0.67
-2.43
0.35
1.69
2.07
4.20
2.71
2.09
1.28
3.01
2.19
2.85
2.73
2.79
1.27
1.89
2.20
7.56
5.69
2.17
0.00
0.00
2.33
3.29
3.12
1.25
1.37
2.02
2.42
-0.29
2.00
2.11
-3.89
2.50
1.14
2.22
1.75
2.42
0.19
1.55
1.77
7.17
4.98
1.60
0.00
0.00
1.53
0.59
3.92
2.08
1.31
S5
S6
S7
S1
S2
S3
% change as compared to the base-run
Imports by industries
S4
Base run
Bill.Dong
1122
4
14
221
304
6353
939
4009
4001
1048
4
1676
7
1083
1
4776
2566
9
1299
5
8943
1994
1947
1354
3
0
3501
5280
3342
1536
1665
-0.09
7.03
0.59
-7.34
3.80
19.07
0.92
-1.38
0.05
0.43
0.72
-1.52
-1.49
-1.93
10.03
1.44
0.45
1.55
0.00
-3.19
-3.35
-2.57
-8.43
-3.95
-0.53
15.17
1.34
-15
.31
7.93
51.20
1.77
-3.43
0.11
0.81
1.34
-3.35
-3.42
-4.23
23.62
2.89
0.77
3.10
0.00
-6.72
-7.05
-5.45
-17
.53
-8.28
6.69
15.43
-0.91
5.24
9.71
26.14
6.31
10.35
-0.32
3.34
5.19
2.85
5.51
3.49
12.40
4.62
3.84
6.28
0.00
2.93
2.16
1.88
-3.75
1.55
-3.90
2.36
1.47
-14
.56
0.44
15.05
-2.24
-8.28
0.27
-1.27
-1.91
-4.18
-5.67
-5.25
8.71
-0.33
-1.51
-1.21
0.00
-6.69
-6.57
-5.17
-11
.10
-7.09
2.66
10.43
-0.03
-2.20
6.21
21.95
3.14
3.46
-0.11
1.63
2.56
0.31
1.41
0.33
10.99
2.73
1.84
3.50
0.00
-0.69
-1.09
-0.74
-6.52
-1.71
-2.72
3.75
1.28
-4.64
1.05
15.75
1.15
1.98
-0.60
0.37
0.49
-0.09
-0.43
0.07
8.70
-0.24
-0.24
1.54
0.00
-4.44
-3.24
-2.90
-5.40
-4.87
-2.87
3.85
-0.24
-3.93
1.34
15.30
1.16
2.62
-0.22
0.13
0.22
-0.30
-0.46
-0.38
8.68
-0.23
-0.05
1.43
0.00
-4.01
-1.93
-3.00
-5.07
-4.83
S5
S6
S7
S1
S2
S3
Trade Reforms in Vietnam A Computable General Equilibrium Analysis
-206-
loss in the case of endogenous production taxes. Moreover there is a small gain of 0.3 per cent of GDP
in the case of the endogenous direct tax. The increase in government savings more than offsets the
decline in private savings and, as a result, total real investment increases. Sectors producing capital
goods, such as construction, construction materials, machinery and metals, expand or have their
output decline to a lesser extent compared to the case of partial liberalization, largely due to the
recovery in investment and the increased demand for capital goods. Similarly the contraction in public
services falls sharply as government revenue is sustained.
The effects of the complementary tax policies differ among sectors. In the case of endogenous
production taxes, many sectors producing consumer goods, which are being levied with high rates
such as the beverage and tobacco, trade, transport, and petroleum undergo a considerable contraction
as compared to the partial liberalization scenario. Raising production taxes seems work against
exports, with the growth of exports falling to 2.3 per cent in the scenario S7as compared to 3.9 per
cent in the scenario S6. Exports decline in highly taxed industries, such as petroleum, beverage, and
some heavy industries.
Sustaining government revenue through direct taxes appears to have more positive impacts as
compared to the case of increasing production taxes. However given the small direct tax base,
increasing the share of direct taxes in total tax revenue should be a long-term policy objective. In the
short-term, it has been suggested to expand the special sale tax, which is being imposed on several
luxury consumer goods, to compensate for the decrease in tariff revenue.
V. Conclusions
In this paper, we have used a CGE model to assess the impacts of unilateral trade liberalization at
both macro and sectoral levels and to examine the role of complementary policies. At the aggregate
level, the tariff reduction causes a decline in GDP, but the overall output loss is small. Capital
producing industries and public services suffer considerable losses, while export-oriented industries
experience a significant expansion. It should be noted that, as a single country model, the model is not
able to capture the benefit of a greater export market access resulting from liberalization in its
trading partners, thereby not capturing the overall effect of a multilateral liberalization.
The simulation results have also indicated the need for the introduction of complementary macro
policies. Without currency depreciation, tariff reduction may critically worsen trade deficits. With a
flexible exchange rate in place, there is a strong depreciation of domestic currency that offset the
adverse impacts of tariff reductions. Currency devaluation appears to have a strong impact on
exports, imports and the trade balance. Government revenue may fall sharply as tariffs are cut,
raising the need for complementary tax policies. Sustaining government revenue through
complementary tax policies not only sustains public expenditure, but mitigates the adverse impacts of
-207-
trade liberalization.
Endnotes
1)According to estimates by the IMF staff, the growth rate of GDP was 3.5 per cent in 1998 and 4.2 per cent
in 1999. See IMF(2000), p. 6.
2)In 2000, the tariff system was revised as government removed some of the quantitative restrictions. For
some products, the tariff rate of 100 per cent is employed in place of NTBs(IMF 2000: p. 35)
3)See, for example, Fukase and Martin(1998)for a discussion on the difference between the effective protec-
tion provided to import substitution and export-oriented industries. See also Fukase and Martin(1998, p 15)
or CIE(1998, p.124)for other estimates of EPRs
4)High EPRs observed in these industries are due to their inefficiency. The sugar and wearing apparel indus-
tries have very low value added at world prices, while other food processing has negative value added.
5)Products phased in IL are subject to immediate tariff reduction following fast track(tariffs are to be
reduced to less than 4% by the year 2000)or normal track(products with current tariff rates under 20%
will have tariff reduced to 0-5% by the year 2003). For products with tariffs above 20%, rates are to be
reduced to 0-5% by the year 2006. Products in the TEL are phased into the IL from the year 2000 in equal
installments over the period of five years. Certain products in the UAP are transferred to the IL or the TEL,
and. the remaining is referred as the Sensitive List and has tariffs reduced to 0-5% by the year 2013. Prod-
ucts in the EL are not subject to tariff reduction due to security or health reasons.
6)The six products are cement and clinker, steel, paper, construction glass, vegetable oil, granite and ceramic.
Quotas remain on motorcar, motorcycles, sugar, alcohol and petroleum.
7)See Dervis K. et al.(1982), chapter 7. See also Robinson et al.(1999).
8)For an algebraic expression of the model, see Nguyen(2001)
9)The neoclassical closure assumes that investment is brought into equilibrium with savings through certain
mechanisms such as the interest rate. An alternative closure is to assume savings to be determined by an
exogenous level of investment. For a review of different closure rules and their impacts on simulation results,
see Rattso(1982).
10)For further discussion about trade and production elasticities, see Dixon et al.(1992)or Sadoulet and Jan-
vry(1995, p. 354). See also Dao et al(1998, p.31)for elasticity parameters used in a CGE model for Viet-
nam.
References
Anh, Vu Tuan. 1997. Economic Policy Reforms: an Introductory Overview. In Norlund Irene et al. eds.
Vietnam in a Changing World. Richmond: Curzon Press.
Centre for International Economics(CIE). 1998. Trade Policies in Vietnam, 1998. Canberra and
Trade Reforms in Vietnam A Computable General Equilibrium Analysis
-208-
Sydney: Centre for International Economics.
Centre for International Economics(CIE). 1999. Non-tariff Barriers in Vietnam: a framework for
developing a phase out strategy. Canberra and Sydney: Centre for International Economics.
Dervis, Kemal, Jaime de Melo and Sherman Robinson. 1982. General Equilibrium Models for
Development Policies. Cambridge: Cambridge University Press.
Devarajan, Shantayanan, Jeffrey D. Lewis and Sherman Robinson. 1990. Policy Lessons from Trade-
Focused, Two-Sector Models. Journal of Policy Modeling. 12(4): 625-657.
Ezaki, Mitsuo and Le Anh Son. 1997. Prospect of the Vietnamese Economy in the Medium and Long
Run: a Dynamic CGE Analysis. APEC Discussion Paper, No. 10. APEC Study Center, GSID, Nagoya
University.
Ezaki, Mitsuo and Sun Lin. 2000. Trade Liberalization and the Economy of China: A Dynamic CGE
Analysis(1997-2010). APEC Discussion Paper, No. 29. APEC Study Center, GSID, Nagoya
University.
Fukase, Emiko and Will Martin. 1998. A Quantitative Evaluation of Vietnam’s Accession to the
ASEAN Free Trade Area(AFTA). Development Research Group, World Bank, Washington DC.
Fukase, Emiko and Will Martin. 1999. The effect of the United States’Granting Most Favored Nation
Status to Vietnam. Development Research Group, World Bank, Washington DC.
General Statistical Office(GSO). 1996. Dong thai va Thuc trang Kinh te Xa hoi Viet nam Sau Muoi
Nam Doi moi’(Impetus and present situation of Vietnam society and economy after ten years of Doi
moi). Hanoi: Statistical Publishing House.
General Statistical Office(GSO). 1997. Mot so Chi tieu Chu yeu ve Quy mo va Hieu Qua cua 1.9 trieu
Co so San xuat Kinh doanh tren Lanh tho Viet nam.(The main facts and figures on the extent and
effectiveness of 1.9 million businesses and enterprises in Vietnam’s territory). Hanoi: Statistical
Publishing House.
General Statistical Office(GSO). 1998. Statistical Yearbook 1997. Hanoi: Statistical Publishing House.
General Statistical Office(GSO). 1999. Intersectoral Table on Production and Use of Products in
Vietnam 1996. Hanoi: Statistical Publishing House.
International Monetary Fund(IMF). 1999. Vietnam: Selected Issues. IMF Staff Country Report No.
99/55, Washington DC.
International Monetary Fund(IMF). 2000. Vietnam: Statistical Appendix and Background Notes. IMF
Staff Country Report No. 00/116. Washington DC.
Mansur, Ahsan and John Whalley. 1984. Numerical Specification: of Applied General Equilibrium
Models: Estimation, Calibration and Data. In Scarf H. E. and Shoven J.B., Applied General
Equilibrium Analysis. Cambridge: Cambridge University Press.
McCarty, Adam. 1999. Vietnam's Integration with ASEAN: Survey of Non-Tariff Measures Affecting
-209-
Trade. A report prepared for the Office of the Government of Vietnam. United Nations
Development Program, Project VIE 95/015, Hanoi.
Nguyen, Tien Dung. 2001. Trade Reforms in Vietnam and its Integration with the World economy.
Unpublished master thesis. Nagoya: Graduate School of International Development(GSID), Nagoya
University.
Rattso, Jorn. 1982. Different Macro Closures of the Original Johansen Model and Their Impact on
Policy Evaluation. Journal of Policy Modeling, 4(2), p. 65-76.
Robinson, Sherman, A. Yunez Naude, R. Hinojosa Ojeda, J. Lewis and S. Devarajan. 1999. From
Stylized to Applied Models. North American of Economics and Finance. 10(1)p5-38.
Sadoulet, Elisabeth & Alain de Janvry. 1995. Quantitative Development Policy Analysis. Baltimore and
London: Johns Hopkins University Press.
Socialist Republic of Vietnam(SRV). 1999. Individual Action Plan, 1999. The document submitted to
the APEC Secretariats. APEC homepage: http://www.apecsec.org.
Socialist Republic of Vietnam(SRV). 2001. Memorandum on Economic and Financial Policies of the
Government of Vietnam for 2001. The IMF homepage: http;//www.imf.org.
Vietnam Economic Times(VET). 2001. Vietnam is expected to join the WTO by 2005. Vietnam
Economic Times, September 5, 2001.
『国際開発研究フォーラム』執筆・投稿・審査規程
2002年3月1日改訂
『国際開発研究フォーラム』23号より適用
I. 執筆
(1)本誌は、国際開発、国際協力、国際コミュニケーションの分野における学術的研究に寄与
することを目的とし、掲載の種類は、研究論文および書評論文とする。
(2)論文の長さは、和文原稿の場合400字詰め原稿用紙50枚以内を原則とし、英文原稿の場合
は約8000語を目安とする(いずれの場合も図表、注記、文献表示を含み、図表は1枚400字
相当と換算する)。和文・英文いずれの場合も、英文にて200語程度の要約を付けるものと
する。書評論文については和文10000字、英文4000語以内を原則とする。ただし、上記字
数制限を大幅に超過する場合は、紀要編集委員会に事前に申し出、委員会がその理由を正
当であると見なした場合に限り、字数の上限を引き上げることを認めることもある。投稿
者は事前に委員会に相談されたい。
(3)使用言語は、原則として日本語もしくは英語とする。それ以外の言語、特殊な文字・記号
の使用に関しては、紀要編集委員会に相談されたい。
(4)本文中の章題番号はローマ数字(ゴシック)I, II, III, IV……を使用し、節題番号はアラビ
ア数字1、2、3……を使用すること。
(5)図表の提示の仕方は以下の通りとする。
和文原稿の場合 図1 ベトナムにおける直接投資の推移
(注)
(出所)
表1 世界の主要な地域統合
(注)
(出所)
-211-
-212-
英文原稿の場合
Figure 1 FDI to Vietnam
Note:
Source:
Table 1 Regional Integration
Note:
Source:
(6)本文または注記における文献の引用は、次のとおりとする。
主語の場合:
松下(1997)は、…大野・藤野(1990)によれば、…Kuznets(1953a)によれば、… Krueger とBhagwati(1973)は、……
文末表示の場合:
…である(緒方: 1984)。…と言える(鶴見・川田: 1989)。
…と言えよう(Drèze and Sen: 1990)。
ページを特定する場合:
…という指摘がある(青木 1999: 25-27)。
…と考えられる(Taylor and Wilson 1989: 145-150)。
(7)注記について
注記のつけ方は、(……と考えられる(1)。)とする。注記は論文末に一括掲載する。
(8)引用文献の表示方法
・日本語文献と外国語文献とを一つにまとめて、各文献を筆頭著者の姓のアルファベット
順にする。
・同一発行年に同一著者による著作が複数ある場合には、(1999a)(1999b)のようにし区
別する。
日本語単行本:著者. 発行年.『書名』出版社名.
<例> 鶴見和子・川田侃(編). 1989.『内発的発展論』東京大学出版会.
日本語雑誌論文:著者. 発行年.「題名」『雑誌名』巻(号):頁‐頁.
<例> 岡部達味. 1997.「国際政治と中国外交」『国際政治』114: 42‐56.
(2行にわたる場合は2行目以降を全角1文字(英数2文字)落しで記述する。)
安田信之. 1999.「知的協力としての法制度の移転:制度知としての法の移植」『国際
開発研究』8(2): 5‐18.
外国語単行本:著者. 発行年. 書名. 出版地: 出版社名.
<例> Fawsett, L. and Andrew Hurrell eds. 1995. Regionalism in World
Politics. New York: Oxford University Press.
外国語雑誌論文:著者. 発行年. 論文名. 雑誌名 巻数(号数): 頁‐頁.
<例> Rosenau, James N. 1995. Governance in the Twenty-first Century.
Global Governance.1(1): 13-43.
II. 投稿
(1)本研究科の学生が投稿する場合、投稿者は投稿申込書に必要事項を記入するとともに、指
導教官の許諾を得ることを条件とする。投稿申込書に記載してある事項に基づき、校正等
の連絡を行う。
(2)投稿原稿は無記名とし、論文のタイトルのみを表紙につけるものとする。これにより投稿
者の匿名性は保持される。
(3)原稿はA4用紙にワープロ印刷し2部提出する。フロッピー・ディスクについてはレフェリー
審査の結果、掲載可となった後に修正稿と共に提出する。
(4)投稿は年間を通して随時受け付けるものとするが、修正の程度によっては希望する号への
掲載が不可能となる事がある。
(5)初校のみを著者校正とし、その時点での加筆・修正は原則として認められない。
(6)稿料の支払い、掲載料の徴収は行わない。ただし抜き刷り30部を贈呈する。なお、それ以
上の部数を希望する場合は、あらかじめ注文の上、実費にてこれに応じる。
III. 審査
(1)紀要編集委員会は、投稿の内容・テーマなどを考慮し、2名の審査者を選任する。
(2)2名の審査者は、投稿論文の採択の可否、修正箇所、コメント等を所定の審査結果用紙に
記入し、審査から原則として1ヶ月以内に紀要編集委員会に提出する。
(3)審査者の匿名性は完全に保持される。
(4)審査基準はA~Dの4段階とし、2名の審査者による評価がどちらもB以上とならなけれ
ば掲載可とはならない。
(5)仮に審査結果がCまたはDであったとしても、修正後の再投稿を拒むものではない。
(6)紀要編集委員および出版物編集担当助手からの投稿があった場合でも、査読者の匿名性は
保持される。その際、査読者選定段階において投稿者がその選定に関わることはなく、査
読結果の通知に関しても他の委員を経由した後、本人に通知される。
-213-
-214-
Rules Regarding the Writing, Contribution and Examination for
Forum of International Development Studies
Revised on March 1, 2002
I. Writing
(1) The purpose of this journal is to contribute to academic research in the field of international
development, cooperation and communication. The types of manuscripts are theses and book
reviews.
(2) The length of a manuscript should, as a rule, not exceed 20,000 letters in Japanese and about
8,000 words in English, both including tables, figures, notes and references. A table or a figure is
counted as 400 letters. A manuscript must include about 200 word-abstract in English. The
length of a book review should not exceed 10,000 letters in Japanese and 4,000 words in English.
However, if the length of an article or a book review will greatly exceed the above limitation,
contributors must consult the Editorial Committee. The Editorial Committee may approve it but
only if there exists sufficient reason.
(3) Articles may be written either in Japanese or in English. Contributors should consult the
editorial committee on the use of other languages, special letters and special symbols.
(4) Roman gothic numbers (I, II, III, IV, ……) must be used for the chapter numbering, and Arabian
numbers (1,2,3…) for the section numbering.
(5) Tables and Figures must be shown as follows.
Figure 1 FDI to Vietnam
Note:
Source:
Table 1 Regional Integration
Note:
Source:
(6) References must be written by the following style:
Wilson (1997) asserts that…….According to Krueger and Bhagwati (1973), … .…(see Smith: 1990).…
-215-
(Kuznets 1953a: 25-34).
(7) As for annotations, the numbers should be put at the upper-right
(e.g. ...in the regime theory(1)… ) . Annotations must be listed at the end of the thesis.
(8) References should be listed by alphabetical order of authors’ surnames. If there are more than
two articles of the same author in the same year, the articles should be distinguished by the
small alphabet letters (e.g. 1999a, 1999b…).
Books: Author. Year. Title. Place of publishing: Publisher.
(e.g.) Fawsett, L. and Andrew Hurrell eds. 1995. Regionalism in World Politics. New York:
Oxford University Press.
Articles: Author. Year. Title. Title of the journal. Vol.(No): ##-##.
(e.g.) Rosenau, James N. 1995. Governance in the Twenty-first Century. Global Governance.
1(1): 13-43.
II. Contribution
(1) If a contributor is GSID student, he/she must fill in the application form and receive an approval
of the primary supervisor. After submitting the application form, the research associate will
contact the contributor.
(2) The contributor should not write his/her name on the manuscript. Only the title of the article
should be written on the front page.
(3) The contributor should submit two copies of the article printed out on A4 paper. The floppy
diskette should be submitted after the article has passed the examination.
(4) Contributions are accepted at any time, but we cannot guarantee that the article will be
published on the volume requested.
(5) The author should check the first proof, but modifying or adding something that will change the
idea must be refrained at this stage.
(6) The editorial committee will not pay any fee for the manuscript and not charge any fee for
publishing. Contributors will receive 30 copies of offprints. If the contributor needs more
offprints, the editorial committee will respond to the request.
III. Examination
(1) The Editorial Committee will select two referees, considering the theme and concept of the
contribution.
(2) The referees will fill in the answer form with the result of the examination and their comments,
-216-
and will submit it to the committee within one month, as a rule.
(3) The referees remain anonymous completely.
(4) A contribution is ranked from A to D. Contributions will not to be adopted unless two referees’
results should be more than B.
(5) The editorial committee will not reject the revised version of the manuscript even if it is ranked
as C or D at the first examination.
(6) Even in the case of submissions of articles from members of the Editorial Committee, the
referees remain anonymous. The member who submits the article must not be involved in
selecting the referees, and will only be informed of the results of the review via other members
of the Editorial Committee.