Embed Size (px)
Citation preview
Traffic Impact Study and Transportation Management Plan
West Rosslyn Development
Arlington County, VA
Revised: January 11, 2017 May 10, 2016 Prepared for: Penzance 2400 N Street, NW, Suite 600 Washington, DC 20037
Prepared by:
1140 Connecticut Avenue NW Suite 600
Washington, DC 20036 Tel: 202.296.8625 Fax: 202.785.1276
3914 Centreville Road Suite 330
Chantilly, VA 20151 Tel: 703.787.9595 Fax: 703.787.9905
15125 Washington Street Suite 316
Haymarket, VA 20169 Tel: 703.787.9595 Fax: 703.787.9905
www.goroveslade.com
This document, together with the concepts and designs presented herein, as an instrument of services, is
intended for the specific purpose and client for which it was prepared. Reuse of and improper reliance on
this document without written authorization by Gorove/Slade Associates, Inc., shall be without liability to
Gorove/Slade Associates, Inc.
Traffic Impact Study and Transportation Management Plan – West Rosslyn Gorove/Slade Associates
January 11, 2017 i
TABLE OF CONTENTS
List of Appendices ........................................................................................................................................................................ ii
List of Figures .............................................................................................................................................................................. iii
List of Tables ............................................................................................................................................................................... iv
Executive Summary ..................................................................................................................................................................... 1
Introduction and Summary .......................................................................................................................................................... 4
Study Objectives ...................................................................................................................................................................... 4
Study Tasks .............................................................................................................................................................................. 4
Data Sources ............................................................................................................................................................................ 5
Proposed Development and Context ........................................................................................................................................... 6
Site Description ........................................................................................................................................................................ 6
Site Location ........................................................................................................................................................................ 6
Parcel Information ............................................................................................................................................................... 8
General Land Use Plan Recommendations .......................................................................................................................... 9
Proposed Site Plan ............................................................................................................................................................. 11
Scope and Limits of the Study Area ....................................................................................................................................... 13
Existing Conditions (2016) ......................................................................................................................................................... 15
Existing Transit Service .......................................................................................................................................................... 15
Metrorail ............................................................................................................................................................................ 15
Bus ..................................................................................................................................................................................... 15
Existing Bicycle and Pedestrian Facilities ............................................................................................................................... 19
Existing Roadway Network .................................................................................................................................................... 22
Existing Traffic Volumes ......................................................................................................................................................... 24
Existing Capacity Analysis ...................................................................................................................................................... 26
Future Conditions without Development (2019) ....................................................................................................................... 30
Planned Transportation Network Improvements .................................................................................................................. 30
Future without Development Traffic Volumes ...................................................................................................................... 30
Future without Development Capacity Analysis .................................................................................................................... 37
Future Conditions with Development (2019) ............................................................................................................................ 41
Site Access ............................................................................................................................................................................. 41
Site Generated Traffic ............................................................................................................................................................ 41
Site Trip Distribution .............................................................................................................................................................. 43
Future with Development Traffic Volumes ............................................................................................................................ 43
Future with Development Capacity Analysis ......................................................................................................................... 48
Traffic Impact Study and Transportation Management Plan – West Rosslyn Gorove/Slade Associates
January 11, 2017 ii
Future Conditions with Development (2025) ............................................................................................................................ 53
Future with Development Traffic Volumes ............................................................................................................................ 53
Future with Development Capacity Analysis ......................................................................................................................... 57
Summary of Vehicular Capacity Analysis ................................................................................................................................... 61
Traffic Signal Warrant Analysis .................................................................................................................................................. 70
Warrant 3: 4 Hour Vehicular Volume .................................................................................................................................... 70
Transportation Management Plan ............................................................................................................................................. 71
Participation and Funding ...................................................................................................................................................... 71
Facilities and Improvements .................................................................................................................................................. 72
Parking Management Plan ..................................................................................................................................................... 72
Promotions, Services, Policies ............................................................................................................................................... 72
Performance and Monitoring ................................................................................................................................................ 72
Conclusion ................................................................................................................................................................................. 73
LIST OF APPENDICES
Appendix A – Signed Scoping Document
Appendix B – Existing Turning Movement Counts
Appendix C – Existing (2016) Capacity Analysis Worksheets
Appendix D – Background Development Trips
Appendix E – Future Conditions Without Development (2019) Capacity Analysis Worksheets
Appendix F – Future Conditions With Development (2019) Capacity Analysis Worksheets
Appendix G – Future Conditions With Development (2019) Capacity Analysis Worksheets, with Mitigations
Appendix H – Future Conditions With Development (2025) Capacity Analysis Worksheets

Traffic Impact Study and Transportation Management Plan – West Rosslyn Gorove/Slade Associates
January 11, 2017 iii
LIST OF FIGURES
Figure 1: Site Map ........................................................................................................................................................................ 7
Figure 2: Parcel Map (Source: Arlington County Real Estate Map, September 2015) ................................................................. 8
Figure 3: Planned Land Uses (Source: Arlington General Land Use Plan (GLUP), July 2015) ....................................................... 9
Figure 4: Zoning Map (Source: Arlington County) ..................................................................................................................... 10
Figure 5: Site Plan ...................................................................................................................................................................... 12
Figure 6: Study Area ................................................................................................................................................................... 14
Figure 7: Existing Transit Service ............................................................................................................................................... 17
Figure 8: Existing Pedestrian Peak Hour Volumes ..................................................................................................................... 20
Figure 9: Nearby Bicycle Facilities (Information from Arlington County Bike Map, July 2015) ................................................. 21
Figure 10: Existing (2016) Local Roadway Network ................................................................................................................... 23
Figure 11: Existing (2016) Traffic Volumes ................................................................................................................................ 25
Figure 12: Existing (2016) LOS Results ....................................................................................................................................... 29
Figure 13: Future Background Developments ........................................................................................................................... 33
Figure 14: Background Growth (2019) Traffic Volumes ............................................................................................................ 34
Figure 15: Background Development (2019) Traffic Volumes ................................................................................................... 35
Figure 16: Future without Development (2019) Traffic Volumes .............................................................................................. 36
Figure 17: Future without Development (2019) LOS Results .................................................................................................... 40
Figure 18: Future with Development (2019) Local Roadway Network ...................................................................................... 42
Figure 19: Direction of Approach ............................................................................................................................................... 44
Figure 20: Net New Site Generated Peak Hour Volumes .......................................................................................................... 45
Figure 21: Pass‐By Peak Hour Volumes ..................................................................................................................................... 46
Figure 22: Future with Development (2019) Traffic Volumes ................................................................................................... 47
Figure 23: Future with Development (2019) LOS Results .......................................................................................................... 52
Figure 24: Background Growth (2025) Traffic Volumes ............................................................................................................ 54
Figure 25: Background Developments (2025) Traffic Volumes ................................................................................................. 55
Figure 26: Future with Development (2025) Traffic Volumes ................................................................................................... 56
Figure 27: Future with Development (2025) LOS Results .......................................................................................................... 60
Figure 28: Peak Hour Signal Warrant ......................................................................................................................................... 71
Traffic Impact Study and Transportation Management Plan – West Rosslyn Gorove/Slade Associates
January 11, 2017 iv
LIST OF TABLES
Table 1: Bus Routes from Rosslyn Metro ................................................................................................................................... 18
Table 2: Existing Roadway Network ........................................................................................................................................... 22
Table 3: Existing Capacity Analysis ............................................................................................................................................. 27
Table 4: Traffic Generated by Background Developments ........................................................................................................ 32
Table 5: Future without Development (2019) Capacity Results ................................................................................................ 38
Table 6: Trip Generation ............................................................................................................................................................ 43
Table 7: Future with Development (2019) Capacity Results ...................................................................................................... 49
Table 8: Future with Development (2025) Capacity Results ...................................................................................................... 58
Table 9: AM Peak Hour Comparison of Capacity Analysis Results ............................................................................................. 61
Table 10: PM Peak Hour Comparison of Capacity Analysis Results ........................................................................................... 64
Table 11: Saturday Peak Hour Comparison of Capacity Analysis Results .................................................................................. 66
Traffic Impact Study and Transportation Management Plan – West Rosslyn Gorove/Slade Associates
January 11, 2017 1
EXECUTIVE SUMMARY
This report presents findings of a transportation impact study conducted for the proposed development in West Rosslyn in
Arlington, Virginia. This study was developed in accordance with VDOT and Arlington County transportation impact analysis
guidelines.
Site Location and Study Area
The site is located in the West Rosslyn area of Arlington, Virginia, south of 18th Street N, north of Wilson Boulevard, east of N
Quinn Street, and west of N Oak Street. Regional access to the site is provided via I‐66/US29 and the George Washington
Memorial Parkway from the north and east, US 50 (Arlington Blvd) to the south and Wilson Boulevard/Clarendon Boulevard
to the west. Immediate vehicular access to the site will be provided via a new north‐south street which will bisect the site
and connect Wilson Boulevard to 18th Street N.
Description of Proposed Development
According to Arlington County’s General Land Use Plan (GLUP), this site is currently listed as “High Office‐Apartment‐Hotel”
and “Public Space.” The new development will be divided in two parts, the eastern parcel will include one residential tower
and space for ground‐floor retail. The eastern parcel will also include the redevelopment of the existing fire station. The
western parcel will include a tower with office space and ground floor retail, and the redevelopment of the existing Rosslyn
Highlands Park. The proposed project build‐out year is 2019.
Principal Findings, Conclusions, and Recommendations
The analysis presented in this report supports the following major conclusions:
Existing Conditions (2016)
The subject site is well‐served by transit:
The site is approximately less than one‐half mile walking distance from the Rosslyn Metro station, which serve
the Blue, Orange, and Silver lines.
There are four bus stops within one block of the site. These stops are directly served by WMATA (Metrobus)
and Arlington Transit (ART) routes.
Vehicular traffic operations in the study area are good overall. All intersection movements within the study area
operate at the target Level of Service (LOS) D or better during the AM, PM, and Saturday peak hours, with the
exception of the following:
N Quinn Street and Wilson Boulevard
Southbound right lane (AM peak hour)
N Oak Street and Key Boulevard
Northbound left/right lane (AM peak hour)
N Oak Street and Wilson Boulevard
Northbound left/thru lane (AM peak hour)
N Nash Street (east) and Key Boulevard (AM peak hour)
Traffic Impact Study and Transportation Management Plan – West Rosslyn Gorove/Slade Associates
January 11, 2017 2
Eastbound left lane (AM and PM peak hour)
N Nash Street and Lee Highway
Southbound left lane (AM peak hour)
None of the movements listed above cause the intersection to operate below acceptable LOS thresholds with the
exception of the intersection of N Nash Street (east) and Key Boulevard in the AM peak hour. Signalization as
mitigation at this intersection is considered with a signal warrant analysis.
Future Conditions without Development (2019)
Historical roadway volumes indicate negative growth has occurred in the study area; however, a conservative 0.5%
annual background growth was applied at the study intersections as per agreement with VDOT and Arlington County.
Ten planned background developments in the vicinity of the site were also taken into consideration. The trips
generated by these sites were added to the roadway network to reflect future conditions without the proposed
development in 2019.
Under future without development conditions, all movements at the study intersections operate at acceptable levels
of service consistent with the Existing Conditions scenario, with the exception of the following:
N Quinn Street and Key Boulevard
Southbound left/thru lane (AM peak hour)
N Pierce Street and Clarendon Boulevard
Southbound left/thru lane (AM peak hour)
N Oak Street and Clarendon Boulevard
Eastbound left lane (AM peak hour)
N Nash Street (east) and Key Boulevard (PM peak hour)
N Nash Street and Lee Highway
Southbound left lane (PM peak hour)
None of the movements listed above cause the intersection to operate below acceptable LOS thresholds with the
exception of the intersection of N Nash Street (east) and Key Boulevard in the PM peak hour. Signalization as
mitigation at this intersection is considered with a signal warrant analysis.
Future Conditions with Development (2019)
The proposed mixed‐use development will generate approximately 268 net trips in the AM peak hour, 348 net trips
in the PM peak hour, and 287 net trips in the Saturday peak hour.
Under future with development conditions, all intersection movements within the study area operate at acceptable
levels of service consistent with the Future without Development scenario, with the exception of the following:
N Quinn Street and Key Boulevard (AM peak hour)
Southbound left/thru lanes (AM peak hour)
N Pierce Street and Clarendon Boulevard
Traffic Impact Study and Transportation Management Plan – West Rosslyn Gorove/Slade Associates
January 11, 2017 3
Southbound left/thru lane (PM peak hour)
N Oak Street and Wilson Boulevard (AM peak hour)
Northbound left/thru lane (PM and Saturday peak hour)
N Oak Street and Clarendon Boulevard
Eastbound left lane (PM peak hour)
All movements caused to operate below acceptable LOS thresholds by the proposed development have been
mitigated with signal timing adjustments. No additional mitigations are required.
Future Conditions with Development (2025)
There are no additional site‐added trips between 2019 and 2025. A regional growth rate of 0.5% annually has been
applied between the 2019 and 2025 scenarios
Under future (2025) with development conditions, all intersection movements within the study area continue to
operate consistent with future (2019) with development results with the exception of the following:
N Quinn Street and Key Boulevard
Westbound left/thru/right lane (AM peak hour)
Southbound left/thru lane (AM peak hour)
Other movements caused to operate below acceptable LOS thresholds by the proposed development have been
mitigated with signal timing adjustments. Although movements at the intersection of N Quinn Street and Key
Boulevard exceeds County standards, the 2025 analysis was done as a planning scenario; therefore, no mitigation is
proposed at this intersection.
Transportation Management Plan
A TMP will be required for the project based on the County’s requirements. The initial framework for a TMP is
included in this report. The ultimate TMP will be determined per the approved site plan conditions.
Traffic Impact Study and Transportation Management Plan – West Rosslyn Gorove/Slade Associates
January 11, 2017 4
INTRODUCTION AND SUMMARY
This report presents the findings of a traffic impact study conducted for the proposed West Rosslyn mixed use development
in Arlington, VA. The site is currently occupied by a park, fire station, and office building with a parking garage. The new
development will be developed in two parts. The east side will include one residential tower, and space for ground‐floor
retail. The eastern development will also include the redevelopment of the existing Fire Station #10. The western parcel will
include a tower with approximately 400,000 square feet of office, additional ground floor retail space, and redevelopment of
existing Rosslyn Highlands Park. Access to the development will be provided from a newly created street bisecting the site
connecting Wilson Boulevard to 18th Street N. The east parcel will have loading areas off of 18th Street N or an alley from 18th
Street N that is shared with the fire station. The fire station will also have access to Wilson Boulevard for a pull through
configuration from 18th Street. The western development parcel will have loading access provided off of the new street
connection. The proposed project build‐out year is 2019.
Study Objectives
The objectives of this study are to evaluate the transportation network in the vicinity of the site and identify any potential
transportation impacts that may result from the proposed redevelopment. Elements of this report include a description of
the proposed development, an evaluation of the existing transportation network, and evaluations of the future
transportation network with and without the proposed development.
Study Tasks
The following tasks were completed as part of this study.
A scoping meeting was conducted on March 15, 2016, and a scope dated March 31, 2016 was agreed upon by
Gorove/Slade, VDOT, and representatives from Arlington County. This scope includes discussions about the
parameters of the study and relevant background information. A copy of the scoping document confirming the
agreed upon parameters and assumptions is included in Appendix A.
Field reconnaissance in the vicinity of the site was performed to collect information related to the existing traffic
controls, roadway geometry, and traffic flow characteristics.
Traffic counts at the study area intersections were conducted on Wednesday, April 1, 2015, Tuesday, February 23,
2016, Thursday, March 10th, 2016, Tuesday, March 29th, 2016, and Thursday, April 14th, 2016 during the weekday
morning and evening peak periods. Traffic counts at the study area intersections were conducted on Saturday, March
5, 2016 and Saturday, April 2nd, 2016 during the Saturday peak period. All counts were collected during typical
conditions.
As outlined in the scoping document, 10 planned developments in the vicinity of the proposed project were also
assumed to be in place for the future conditions analysis. As determined based on historical traffic patterns and
projected traffic volumes, a growth rate of 0.5 percent per year was applied to account for a regional increase in
background traffic.
Proposed site traffic volumes were generated based on the methodology outlined in Trip Generation, 9th Edition
published by the Institute of Transportation Engineers (ITE).
Intersection capacity analyses were performed using the software package Synchro, Version 9.1 based on the
Highway Capacity Manual (HCM) 2000 and 2010 methodology. Traffic analyses were performed for the existing
Traffic Impact Study and Transportation Management Plan – West Rosslyn Gorove/Slade Associates
January 11, 2017 5
conditions (2016), future (2019) with and without development conditions, and future (2025) with development
conditions.
An initial Transportation Management Plan framework was developed as a TMP will be necessary to meet County
requirements.
Data Sources
Sources of data for this study include Arlington County, the Virginia Department of Transportation (VDOT), the Institute of
Transportation Engineers (ITE) Trip Generation, 9th Edition, Penzance, Hickok Cole Architects, and the office files and field
reconnaissance efforts of Gorove/Slade Associates, Inc.

Traffic Impact Study and Transportation Management Plan – West Rosslyn Gorove/Slade Associates
January 11, 2017 6
PROPOSED DEVELOPMENT AND CONTEXT
Site Description
Site Location
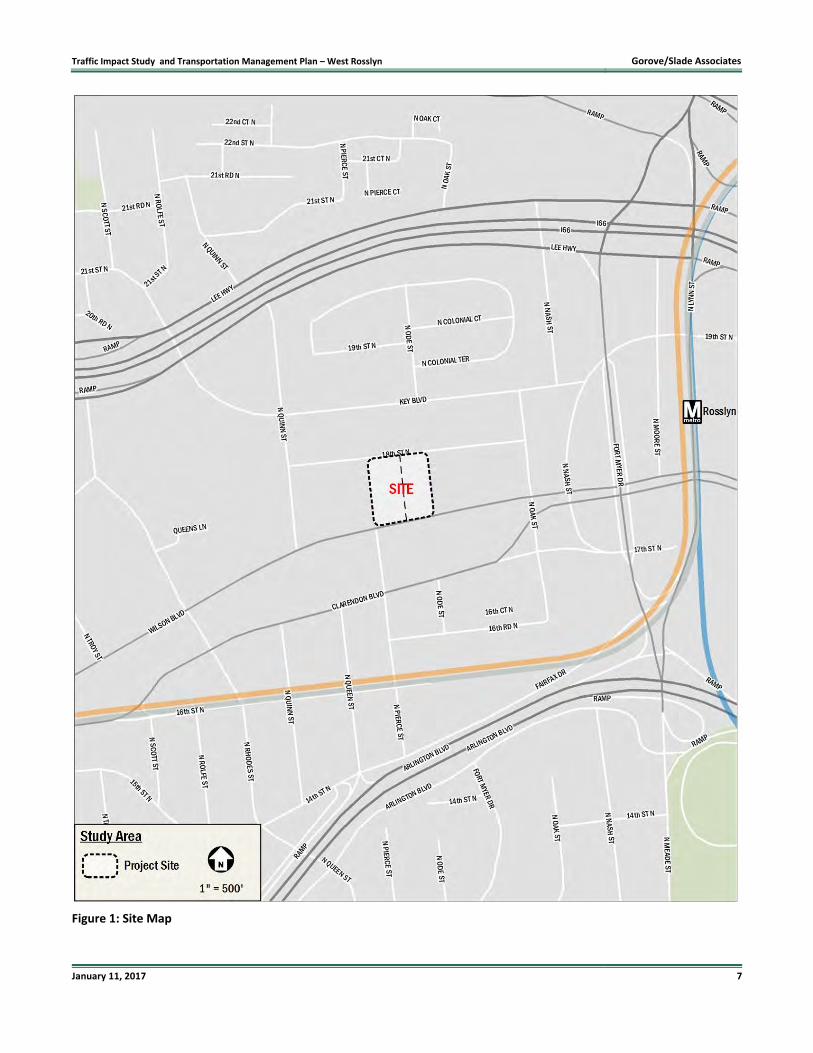
The site is located in the Rosslyn area of Arlington, Virginia between 18th Street N, Wilson Boulevard, N Quinn Street, and N
Oak Street. Vehicular access to the development will be provided via a newly created street bisecting the east and west
parcels and connecting Wilson Boulevard to 18th Street N. The site location is shown in Figure 1.
The site location falls within the bounds of the Western Rosslyn Area Planning Study (WRAPS), the Rosslyn Coordinated
Redevelopment District (RCRD), and the Rosslyn Metro Station Area (RMSA). WRAPS was a study undertaken in 2015 by the
Arlington County Board to consider the various uses of the redevelopment of the area surrounding the Rosslyn Highlands
Park, school, and firehouse. Due to the proximity of the development’s location in the WRAPS area, coordination between
the West Rosslyn development and WRAPS was undertaken to make sure the Board’s goals were met. The County Board set
out goals for reinvigorating the area in a public‐private partnership designed to facilitate the rebuilding of the firehouse and
public park as well as making the West Rosslyn area a destination day and night for students, residents, and office workers of
all income levels. The proposed West Rosslyn development will meet the Board’s goal of creating privately‐developed office,
residential, and retail space.
Traffic Impact Study and Transportation Management Plan – West Rosslyn Gorove/Slade Associates
January 11, 2017 7
Figure 1: Site Map
Traffic Impact Study and Transportation Management Plan – West Rosslyn Gorove/Slade Associates
January 11, 2017 8
Parcel Information
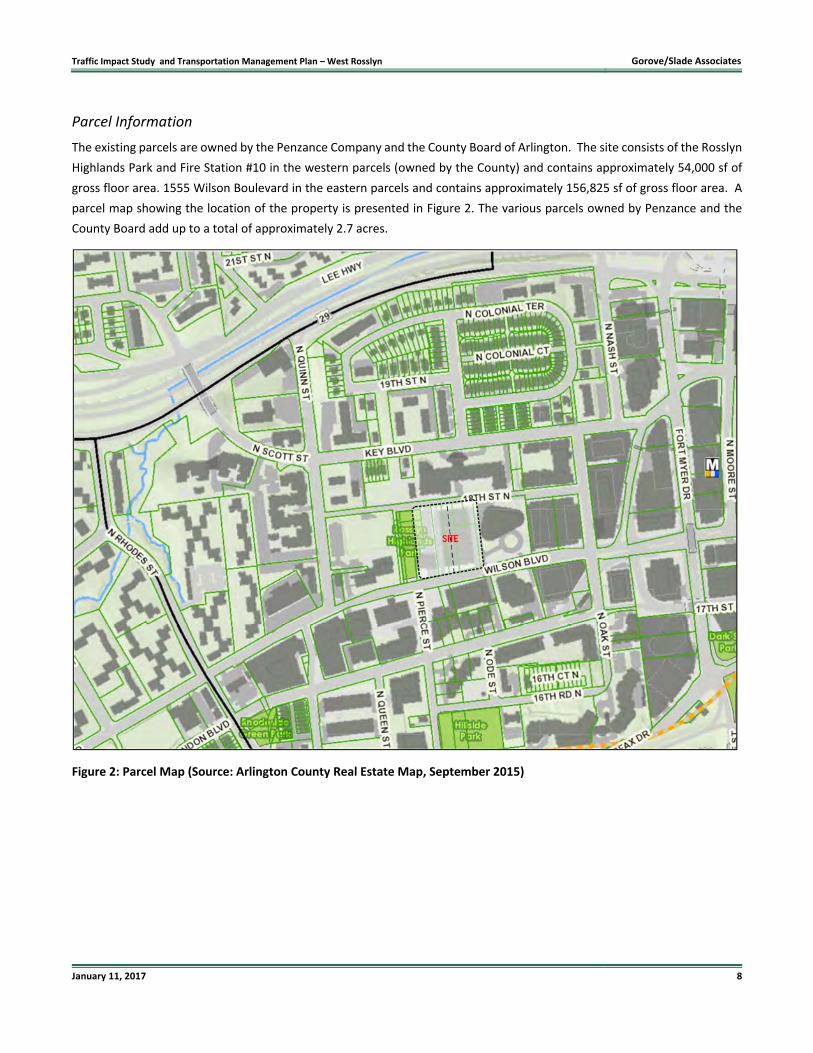
The existing parcels are owned by the Penzance Company and the County Board of Arlington. The site consists of the Rosslyn
Highlands Park and Fire Station #10 in the western parcels (owned by the County) and contains approximately 54,000 sf of
gross floor area. 1555 Wilson Boulevard in the eastern parcels and contains approximately 156,825 sf of gross floor area. A
parcel map showing the location of the property is presented in Figure 2. The various parcels owned by Penzance and the
County Board add up to a total of approximately 2.7 acres.
Figure 2: Parcel Map (Source: Arlington County Real Estate Map, September 2015)
Traffic Impact Study and Transportation Management Plan – West Rosslyn Gorove/Slade Associates
January 11, 2017 9
General Land Use Plan Recommendations
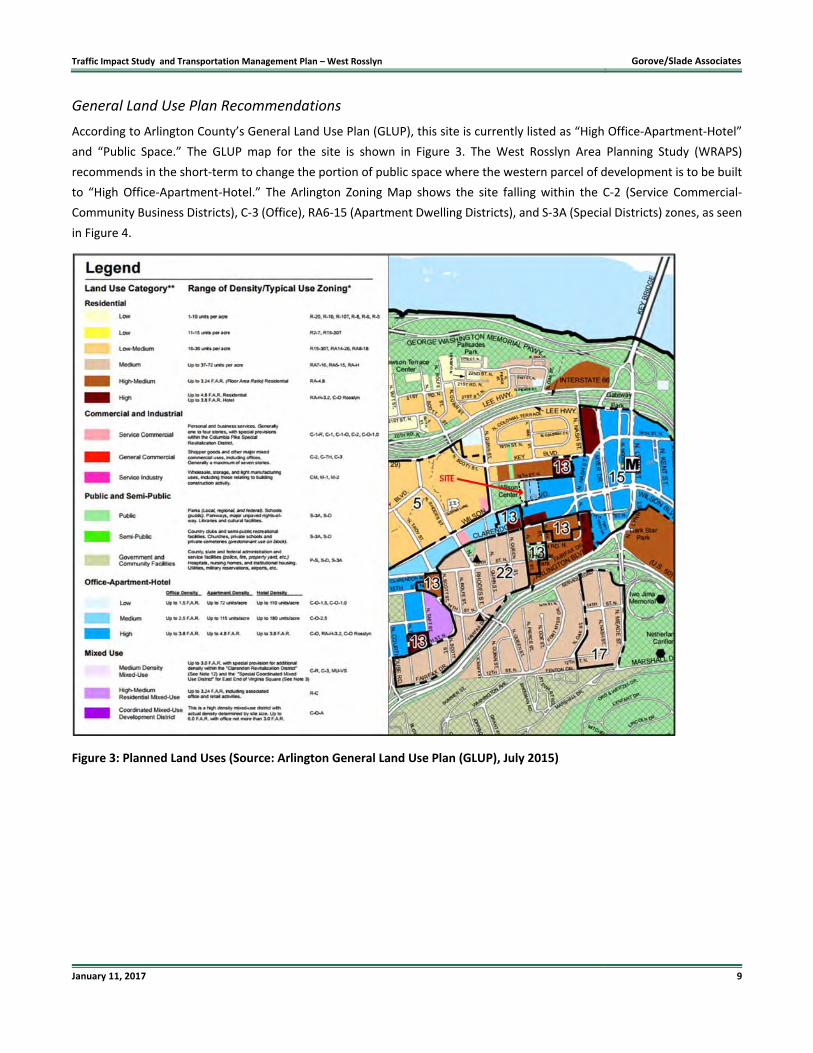
According to Arlington County’s General Land Use Plan (GLUP), this site is currently listed as “High Office‐Apartment‐Hotel”
and “Public Space.” The GLUP map for the site is shown in Figure 3. The West Rosslyn Area Planning Study (WRAPS)
recommends in the short‐term to change the portion of public space where the western parcel of development is to be built
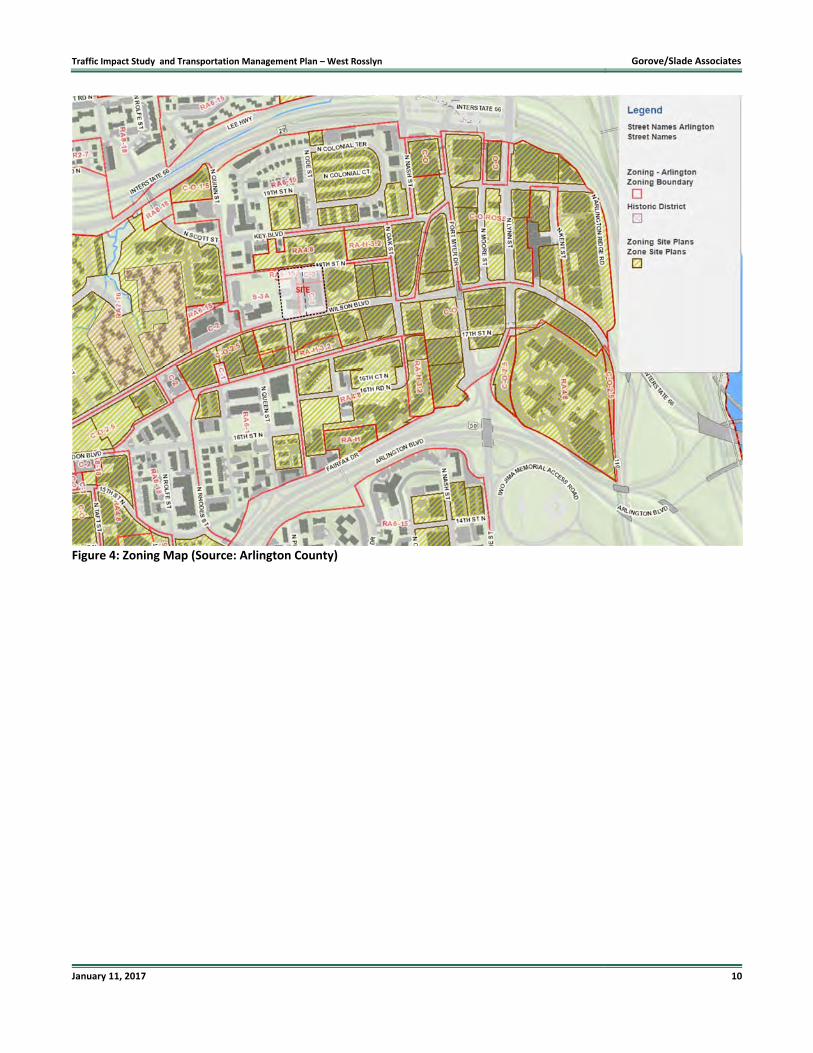
to “High Office‐Apartment‐Hotel.” The Arlington Zoning Map shows the site falling within the C‐2 (Service Commercial‐
Community Business Districts), C‐3 (Office), RA6‐15 (Apartment Dwelling Districts), and S‐3A (Special Districts) zones, as seen
in Figure 4.
Figure 3: Planned Land Uses (Source: Arlington General Land Use Plan (GLUP), July 2015)
Traffic Impact Study and Transportation Management Plan – West Rosslyn Gorove/Slade Associates
January 11, 2017 10
Figure 4: Zoning Map (Source: Arlington County)
Traffic Impact Study and Transportation Management Plan – West Rosslyn Gorove/Slade Associates
January 11, 2017 11
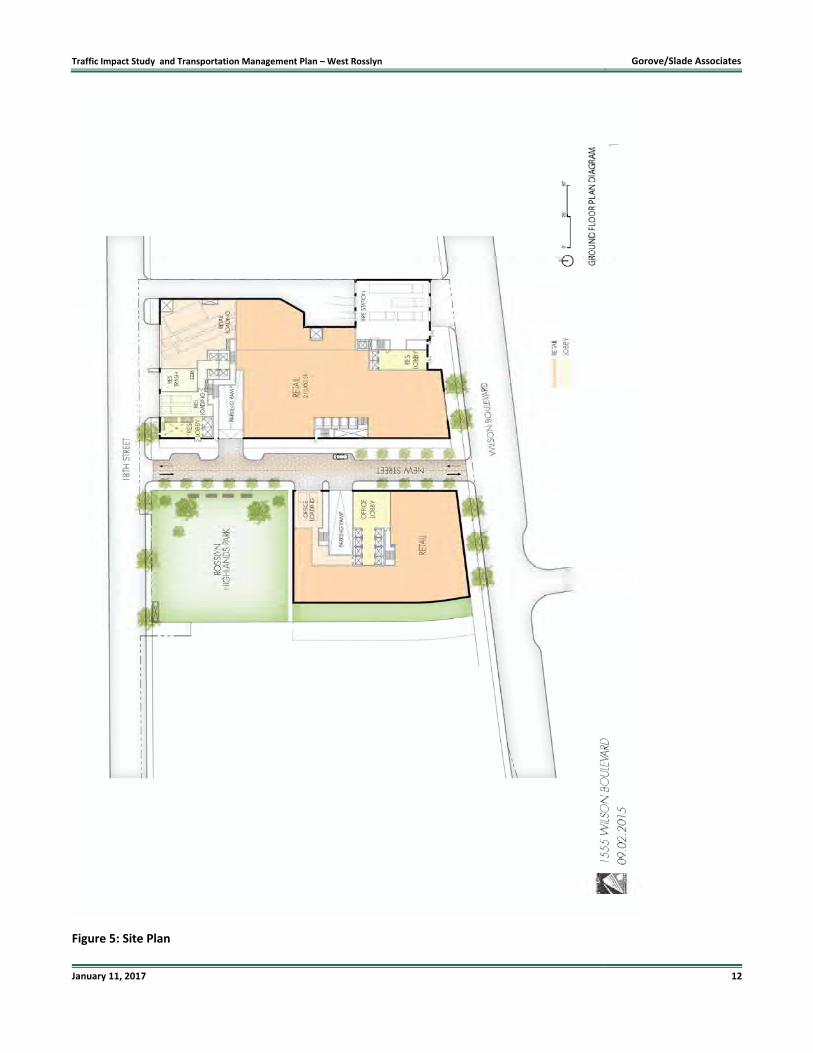
Proposed Site Plan
The proposed West Rosslyn development will be divided in two parts, with the eastern parcel will include one residential
tower and space for ground‐floor retail. The eastern parcel will also include the redevelopment of the existing fire station.
The western parcel will include a tower with office space and ground floor retail, and the redevelopment of the existing
Rosslyn Highlands Park. The proposed site plan is presented in Figure 5. Vehicular access to the site will be provided via a new
north‐south street connecting Wilson Boulevard with 18th Street N.
Traffic Impact Study and Transportation Management Plan – West Rosslyn Gorove/Slade Associates
January 11, 2017 12
Figure 5: Site Plan
Traffic Impact Study and Transportation Management Plan – West Rosslyn Gorove/Slade Associates
January 11, 2017 13
Scope and Limits of the Study Area
The study area is bound by 18th Street N, Wilson Boulevard, N Quinn Street, and N Oak Street. Regional access to the site is
provided via I‐66/US‐29 and George Washington Memorial Parkway from the north and east, US 50 (Arlington Blvd) to the
south and Wilson Boulevard/Clarendon Boulevard to the west. The following intersections were identified for inclusion in
this study, as shown in Figure 6.
1. N Quinn Street and Key Boulevard and N Scott Street
2. N Quinn Street and 18th Street N
3. N Quinn Street and Wilson Boulevard
4. N Pierce Street and Wilson Boulevard
5. N Pierce Street and Clarendon Boulevard
6. Wilson Boulevard and New Street
7. 18th Street N and New Street
8. N Oak Street and Key Boulevard
9. N Oak Street and 18th Street N
10. N Oak Street and Wilson Boulevard
11. N Oak Street and Clarendon Boulevard
12. N Nash Street and Key Boulevard
13. N Nash Street/19th Street N and Key Boulevard
14. N Nash Street and Key Highway
15. N Fort Myer Drive and Lee Highway

Traffic Impact Study and Transportation Management Plan – West Rosslyn Gorove/Slade Associates
January 11, 2017 14
Figure 6: Study Area

Traffic Impact Study and Transportation Management Plan – West Rosslyn Gorove/Slade Associates
January 11, 2017 15
EXISTING CONDITIONS (2016)
Existing Transit Service
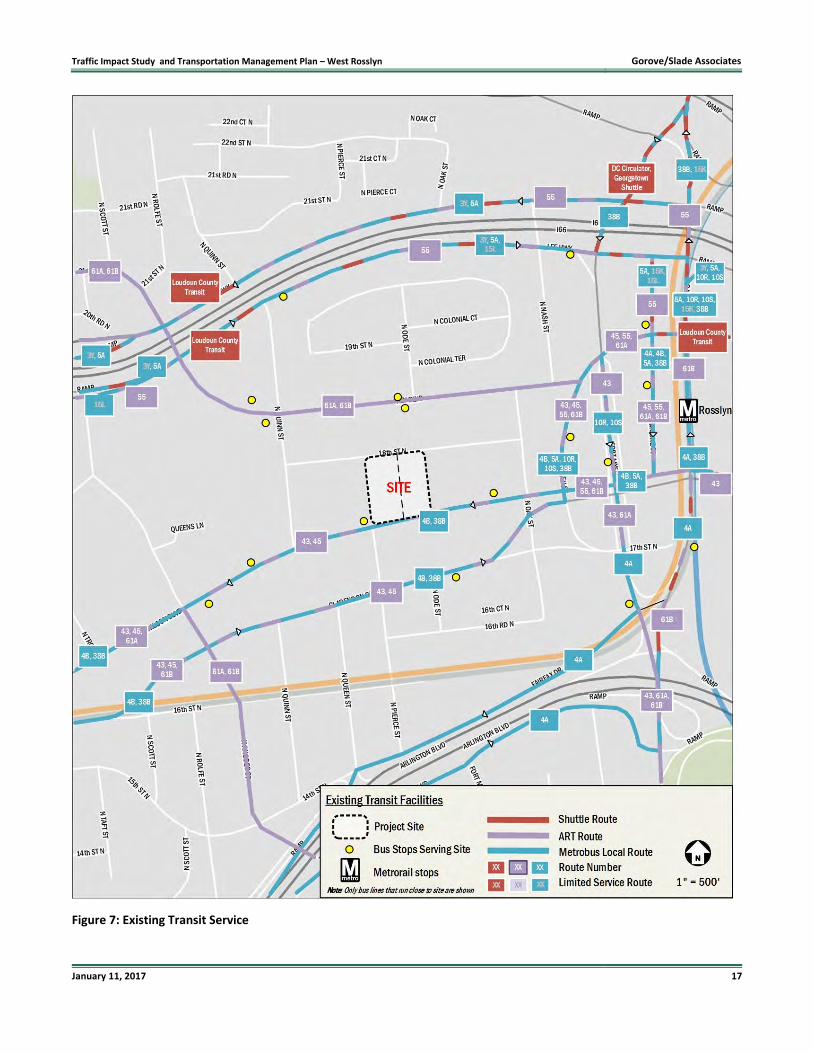
The study area is served by numerous transit options under existing conditions as shown in Figure 7 and described in the
following sections.
Metrorail
There are two Metro stations within one‐half mile walking distance of the site:
Rosslyn Metro Station– The Rosslyn Metro station is located between 19th Street N and Wilson Blvd on N Moore
Street, with the closest entrance on N Fort Myer Drive between 19th Street N and Wilson Blvd. The station is located
within a ¼ mile walking distance from the site via Wilson Boulevard to N Fort Myer Drive to the station entrance on
N Fort Myer Drive. The Rosslyn Metro serves the Blue, Orange, and Silver lines and is a major transfer point for
locations to the south (Arlington County, City of Alexandria), west (Fairfax County), and north (Washington, D.C.).
Daily ridership at this station in 2015 was approximately 14,800 boardings on weekdays according to the publication
Metrorail Average Weekday Passenger Boardings (WMATA, December 2015). Based on the Metro Station Access &
Capacity Analysis report dated April 2008, neither the Rosslyn nor Court House Metro Station are currently or
predicted to have capacity issues.
The Rosslyn Metro station is served by 16 bus routes including routes provided by WMATA (Metrobus), Arlington
County Transit (ART), Loudoun County Transit, DC Circulator, and Georgetown University. The majority of the routes
are bidirectional and have service throughout the day; however, some of these routes are rush hour only. A list of
the routes, frequencies, and destinations are provided in Figure 7 and Table 1.
Court House Metro Station ‐ The Court House Metro station is located southwest of the development site at the
intersection of Clarendon Boulevard and 15th Street N on N Uhle Street. It can be reached by walking south from
the site on Wilson Boulevard to N Uhle Street. There are sidewalks along this route. The Court House Metro serves
Orange and Silver lines, and average daily ridership at the station in 2015 was approximately 7,448 boardings on
weekdays according to the publication Metrorail Average Weekday Passenger Boardings (WMATA, December 2015).
The Court House Metro station is the further of the two Metro stations. It is expected that many of the tenants,
customers, and employees of the propose development will utilize the closer Rosslyn Metro Station. The station is
served by ten bus routes including four routes provided by WMATA (Metrobus) and six routes provided by ART.
Based on the Metro Station Access & Capacity Analysis report dated April 2008, neither the Rosslyn nor Court House Metro
Station are currently or predicted to have capacity issues.
Bus
There are four bus stops within one block of the site, represented in Figure 7. These stops are served by the following routes:
WMATA (Metrobus) – Two Metrobus routes directly serve the bus stops closest to the site: 4B and 38B. These lines
run westbound on Wilson Boulevard, outbound from Rosslyn Station. One block further south, the inbound lines
run along Clarendon Boulevard. These routes, along with the other nearby Metrobus routes and their destinations
and frequencies are presented in Table 1.
Traffic Impact Study and Transportation Management Plan – West Rosslyn Gorove/Slade Associates
January 11, 2017 16
ART (Arlington Transit) – The 43, 45, 61A, and 61B ART bus routes directly serves the bus stops closest to the site.
The 61A and 61B routes form a loop connecting the Rosslyn and Court House Metro stations and the 43 and 45 lines
provide connection to Crystal City and Columbia Pike corridor, respectively. All nearby ART Routes and their
frequencies are presented in Table 1.
Traffic Impact Study and Transportation Management Plan – West Rosslyn Gorove/Slade Associates
January 11, 2017 17
Figure 7: Existing Transit Service
Traffic Impact Study and Transportation Management Plan – West Rosslyn Gorove/Slade Associates
January 11, 2017 18
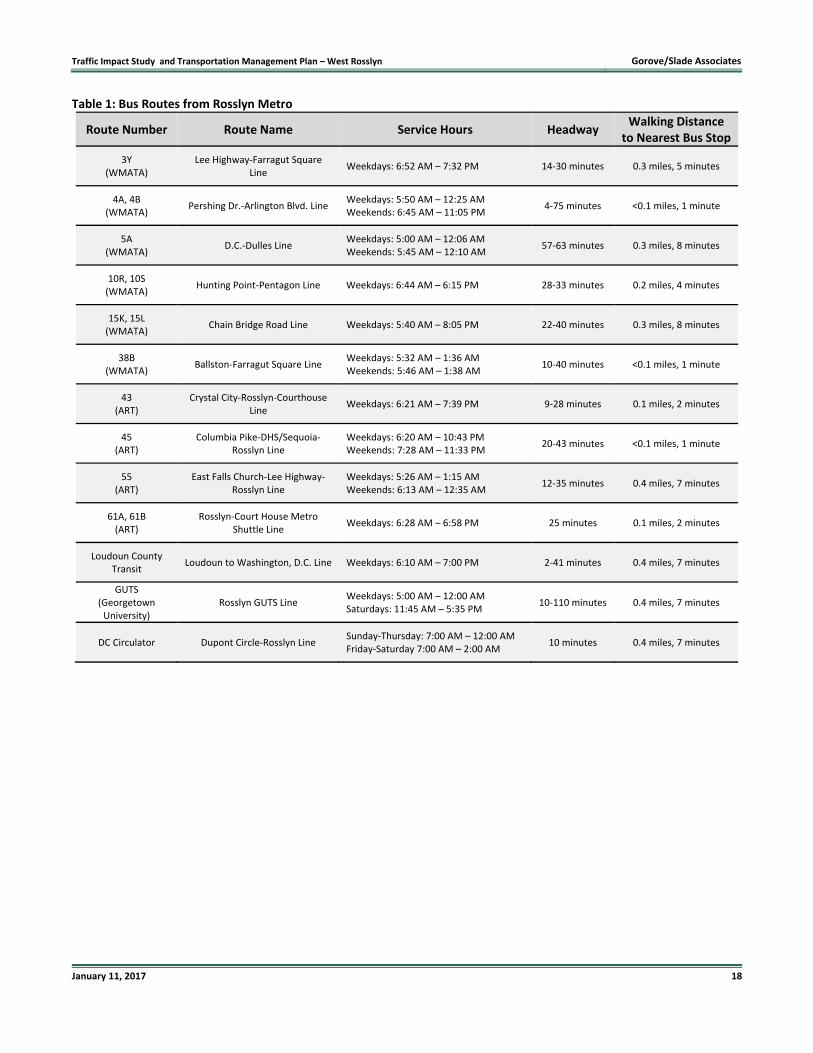
Table 1: Bus Routes from Rosslyn Metro
Route Number Route Name Service Hours Headway Walking Distance
to Nearest Bus Stop
3Y (WMATA)
Lee Highway‐Farragut Square Line
Weekdays: 6:52 AM – 7:32 PM 14‐30 minutes 0.3 miles, 5 minutes
4A, 4B (WMATA)
Pershing Dr.‐Arlington Blvd. Line Weekdays: 5:50 AM – 12:25 AM Weekends: 6:45 AM – 11:05 PM
4‐75 minutes <0.1 miles, 1 minute
5A (WMATA)
D.C.‐Dulles Line Weekdays: 5:00 AM – 12:06 AM Weekends: 5:45 AM – 12:10 AM
57‐63 minutes 0.3 miles, 8 minutes
10R, 10S (WMATA)
Hunting Point‐Pentagon Line Weekdays: 6:44 AM – 6:15 PM 28‐33 minutes 0.2 miles, 4 minutes
15K, 15L (WMATA)
Chain Bridge Road Line Weekdays: 5:40 AM – 8:05 PM 22‐40 minutes 0.3 miles, 8 minutes
38B (WMATA)
Ballston‐Farragut Square Line Weekdays: 5:32 AM – 1:36 AM Weekends: 5:46 AM – 1:38 AM
10‐40 minutes <0.1 miles, 1 minute
43 (ART)
Crystal City‐Rosslyn‐Courthouse Line
Weekdays: 6:21 AM – 7:39 PM 9‐28 minutes 0.1 miles, 2 minutes
45 (ART)
Columbia Pike‐DHS/Sequoia‐Rosslyn Line
Weekdays: 6:20 AM – 10:43 PM Weekends: 7:28 AM – 11:33 PM
20‐43 minutes <0.1 miles, 1 minute
55 (ART)
East Falls Church‐Lee Highway‐Rosslyn Line
Weekdays: 5:26 AM – 1:15 AM Weekends: 6:13 AM – 12:35 AM
12‐35 minutes 0.4 miles, 7 minutes
61A, 61B (ART)
Rosslyn‐Court House Metro Shuttle Line
Weekdays: 6:28 AM – 6:58 PM 25 minutes 0.1 miles, 2 minutes
Loudoun County Transit
Loudoun to Washington, D.C. Line Weekdays: 6:10 AM – 7:00 PM 2‐41 minutes 0.4 miles, 7 minutes
GUTS (Georgetown University)
Rosslyn GUTS Line Weekdays: 5:00 AM – 12:00 AM Saturdays: 11:45 AM – 5:35 PM
10‐110 minutes 0.4 miles, 7 minutes
DC Circulator Dupont Circle‐Rosslyn Line Sunday‐Thursday: 7:00 AM – 12:00 AM Friday‐Saturday 7:00 AM – 2:00 AM
10 minutes 0.4 miles, 7 minutes
Traffic Impact Study and Transportation Management Plan – West Rosslyn Gorove/Slade Associates
January 11, 2017 19
Existing Bicycle and Pedestrian Facilities
The West Rosslyn development site is situated within an urban transportation network, with quality pedestrian and bicycle
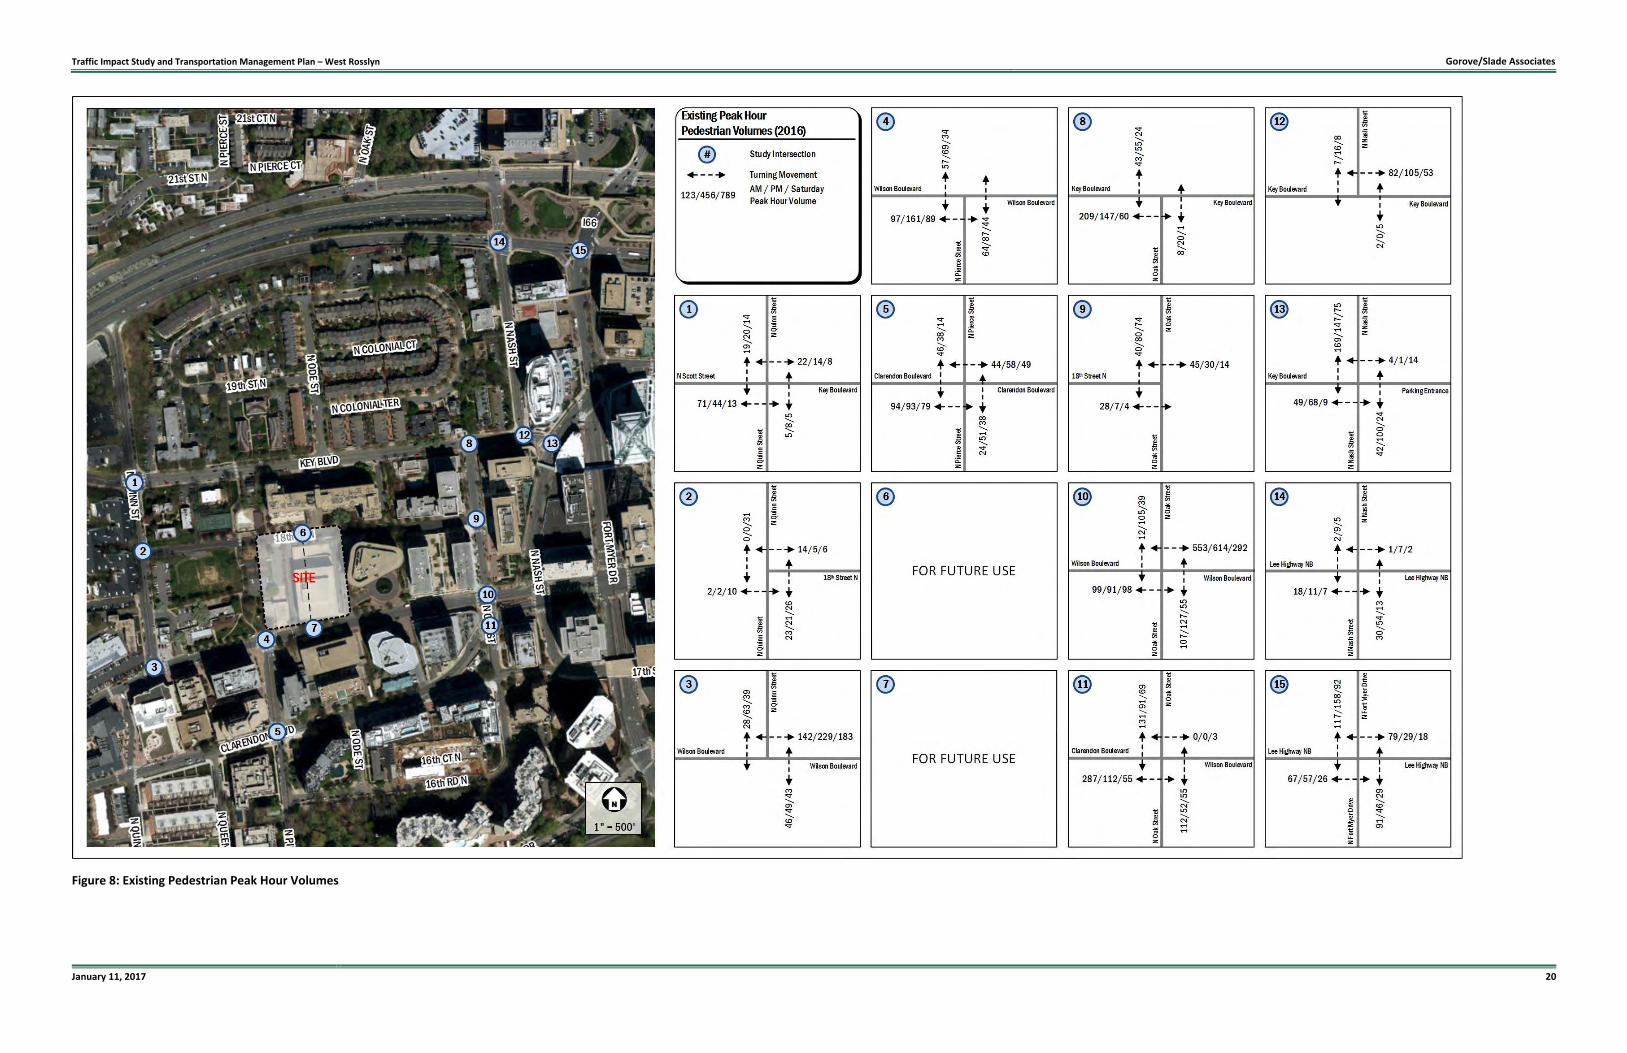
access. Figure 8 shows the existing pedestrian peak hour volumes at all study area intersections. Figure 9 shows the existing
conditions for bicycle travel and bicycle facilities within the study area.
There are existing sidewalks on one or both sides of the roadways within the study area. There is significant pedestrian activity
within the study area as shown in Figure 8. The most heavily‐used crosswalk is across Wilson Boulevard and N Oak Street,
with approximately 553 pedestrians crossing at this location during the weekday AM peak hour, approximately 614 during
the weekday PM peak hour, and approximately 292 in the Saturday peak hour.
The Arlington County Bike Map (Bike Arlington, July 2015) shows on‐street signed routes on N Fort Myer Drive, Fairfax Drive,
N Meade Street, and N Nash Street between N Fort Myer Drive and Wilson Boulevard. Bicycle lanes are provided along the
majority of Wilson Boulevard (westbound) and Clarendon Boulevard (eastbound), N Quinn Street between Lee Highway and
Wilson Boulevard, N Lynn Street between Lee Highway and N Fort Myer Boulevard, and Key Boulevard between Lee Highway
and N Nash Street. These on‐street bike routes link up to the Custis trail, which leads eastward to the Potomac Heritage and
Mt. Vernon trails that connect Rosslyn to areas such as Ballston, the Memorial Bridge, the Tidal Basin, Fairfax, and Potomac
Park.
Bike racks are available at the Rosslyn Metro station. There is a Capital Bikeshare station one block south of the site at the
northwest corner of N Pierce Street and Clarendon Boulevard; several other Capital Bikeshare stations around the site vicinity
are presented in Figure 9.
Traffic Impact Study and Transportation Management Plan – West Rosslyn Gorove/Slade Associates
January 11, 2017 20
Figure 8: Existing Pedestrian Peak Hour Volumes

Traffic Impact Study and Transportation Management Plan – West Rosslyn Gorove/Slade Associates
January 11, 2017 21
Figure 9: Nearby Bicycle Facilities (Information from Arlington County Bike Map, July 2015)
Traffic Impact Study and Transportation Management Plan – West Rosslyn Gorove/Slade Associates
January 11, 2017 22
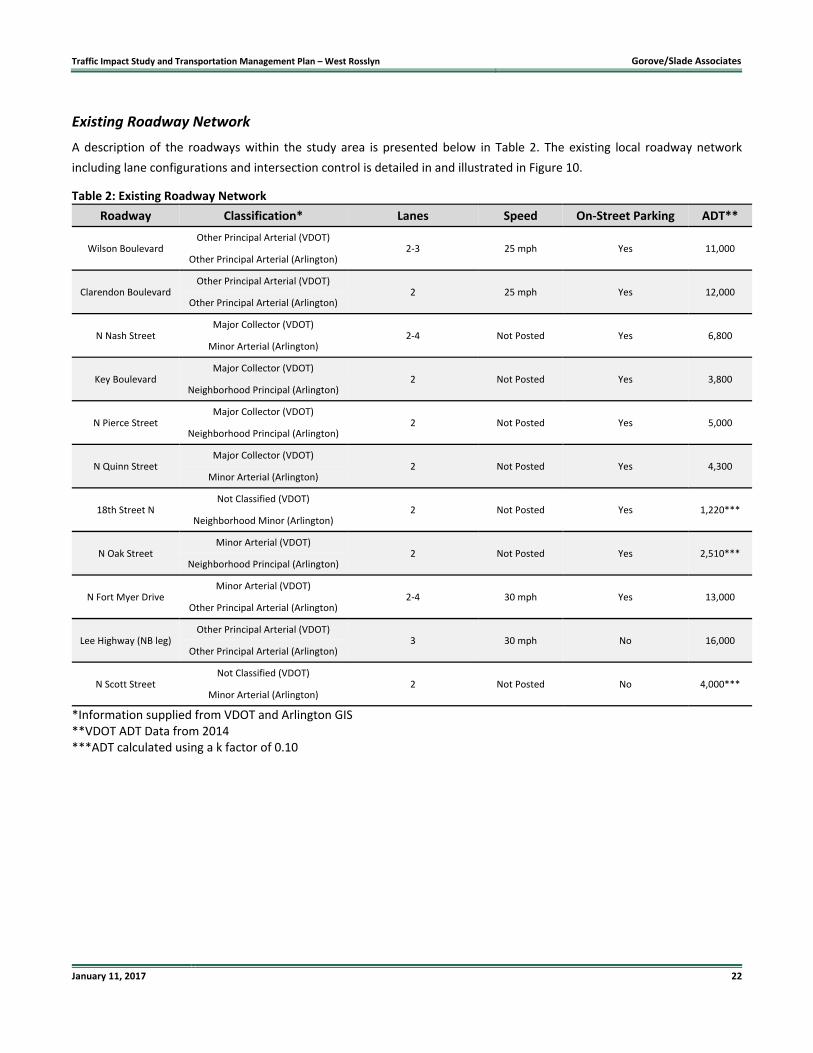
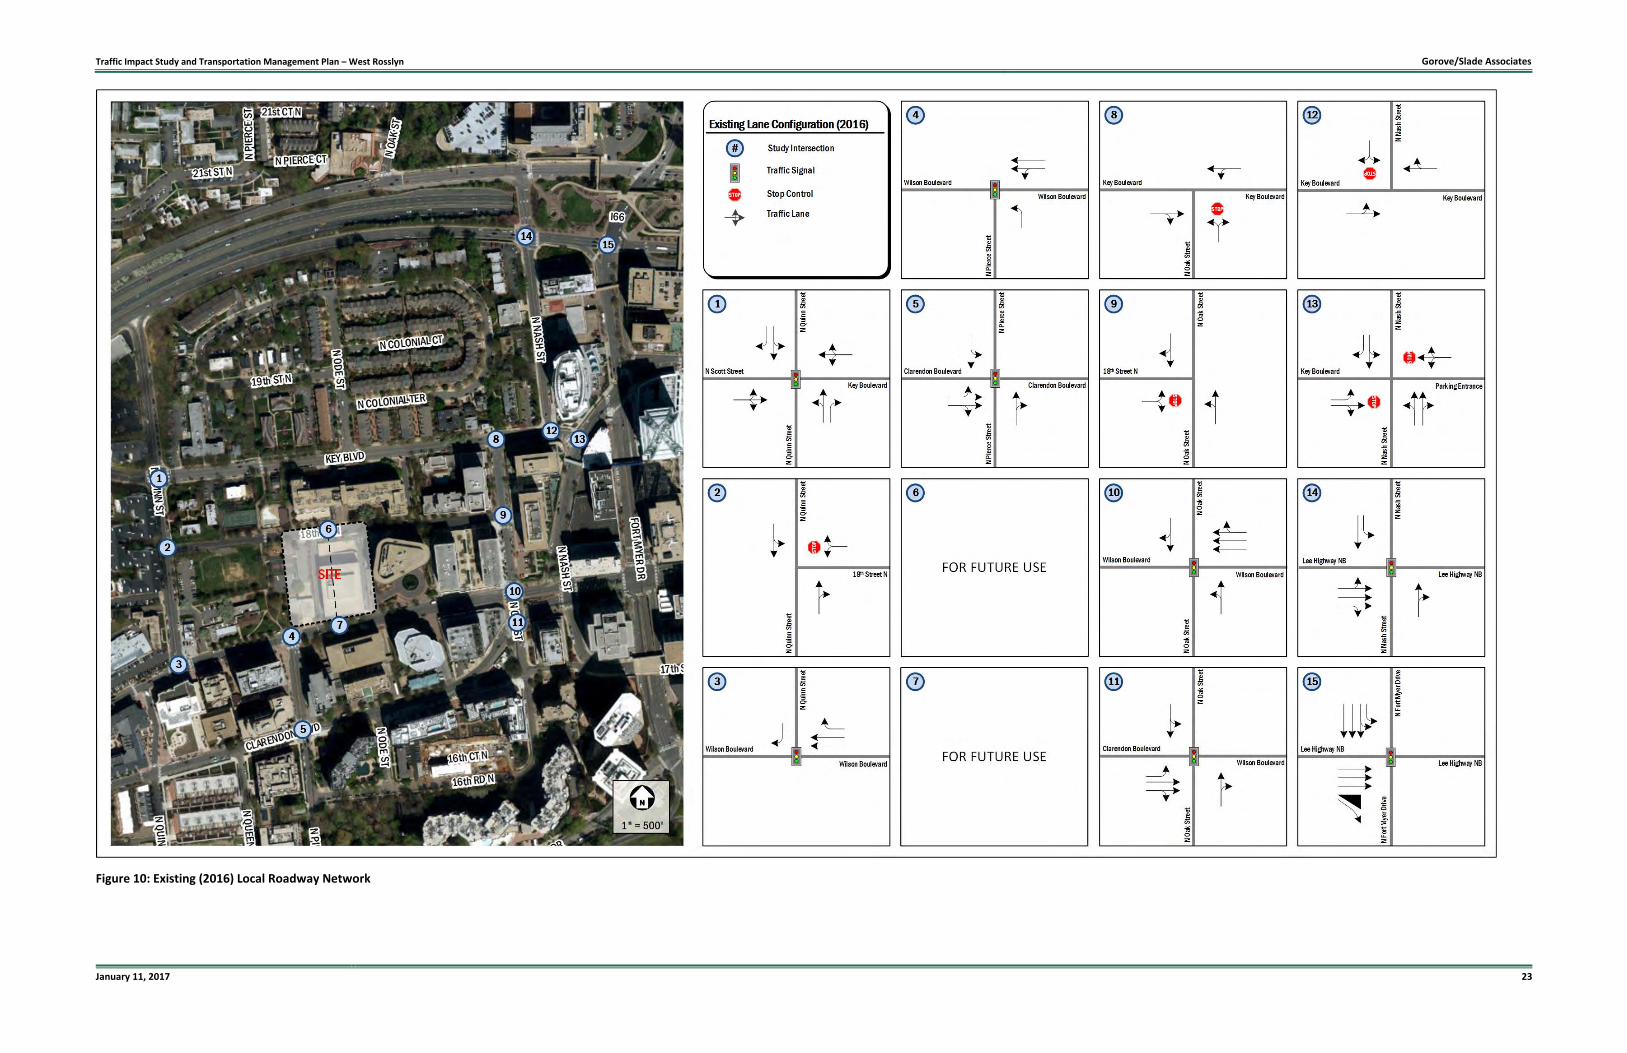
Existing Roadway Network
A description of the roadways within the study area is presented below in Table 2. The existing local roadway network
including lane configurations and intersection control is detailed in and illustrated in Figure 10.
Table 2: Existing Roadway Network
Roadway Classification* Lanes Speed On‐Street Parking ADT**
Wilson Boulevard Other Principal Arterial (VDOT)
2‐3 25 mph Yes 11,000 Other Principal Arterial (Arlington)
Clarendon Boulevard Other Principal Arterial (VDOT)
2 25 mph Yes 12,000 Other Principal Arterial (Arlington)
N Nash Street Major Collector (VDOT)
2‐4 Not Posted Yes 6,800 Minor Arterial (Arlington)
Key Boulevard Major Collector (VDOT)
2 Not Posted Yes 3,800 Neighborhood Principal (Arlington)
N Pierce Street Major Collector (VDOT)
2 Not Posted Yes 5,000 Neighborhood Principal (Arlington)
N Quinn Street Major Collector (VDOT)
2 Not Posted Yes 4,300 Minor Arterial (Arlington)
18th Street N Not Classified (VDOT)
2 Not Posted Yes 1,220*** Neighborhood Minor (Arlington)
N Oak Street Minor Arterial (VDOT)
2 Not Posted Yes 2,510*** Neighborhood Principal (Arlington)
N Fort Myer Drive Minor Arterial (VDOT)
2‐4 30 mph Yes 13,000 Other Principal Arterial (Arlington)
Lee Highway (NB leg) Other Principal Arterial (VDOT)
3 30 mph No 16,000 Other Principal Arterial (Arlington)
N Scott Street Not Classified (VDOT)
2 Not Posted No 4,000*** Minor Arterial (Arlington)
*Information supplied from VDOT and Arlington GIS **VDOT ADT Data from 2014 ***ADT calculated using a k factor of 0.10
Traffic Impact Study and Transportation Management Plan – West Rosslyn Gorove/Slade Associates
January 11, 2017 23
Figure 10: Existing (2016) Local Roadway Network
Traffic Impact Study and Transportation Management Plan – West Rosslyn Gorove/Slade Associates
January 11, 2017 24
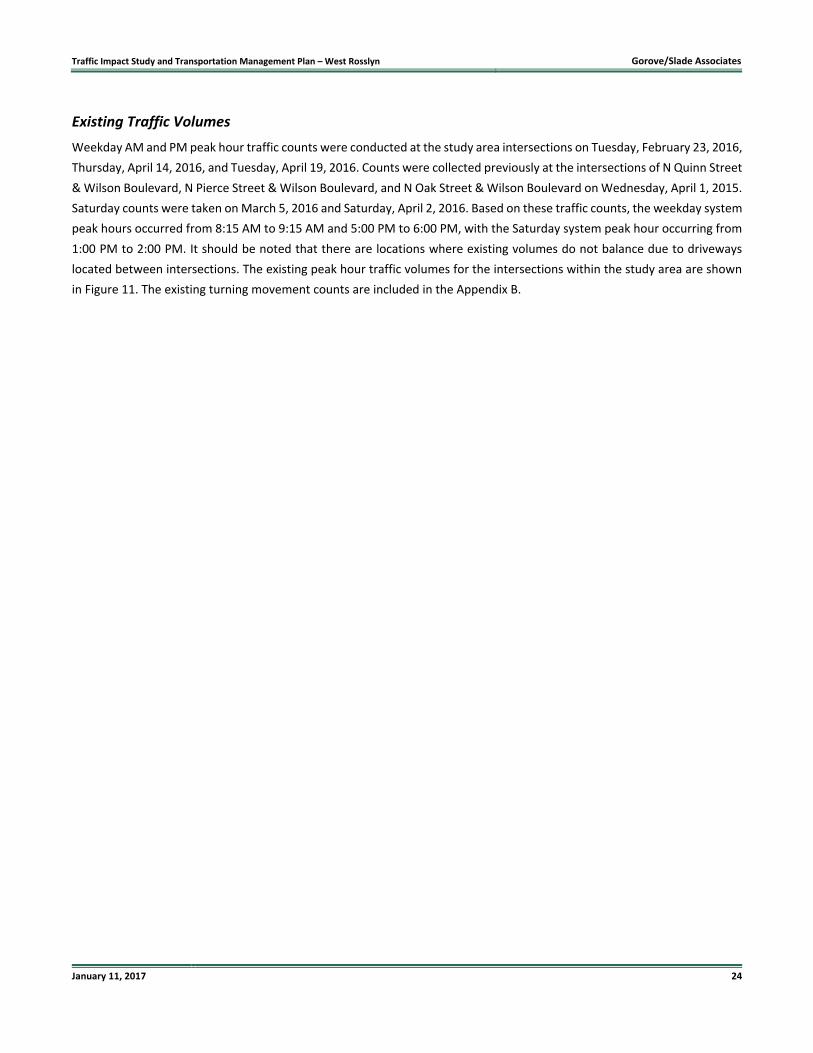
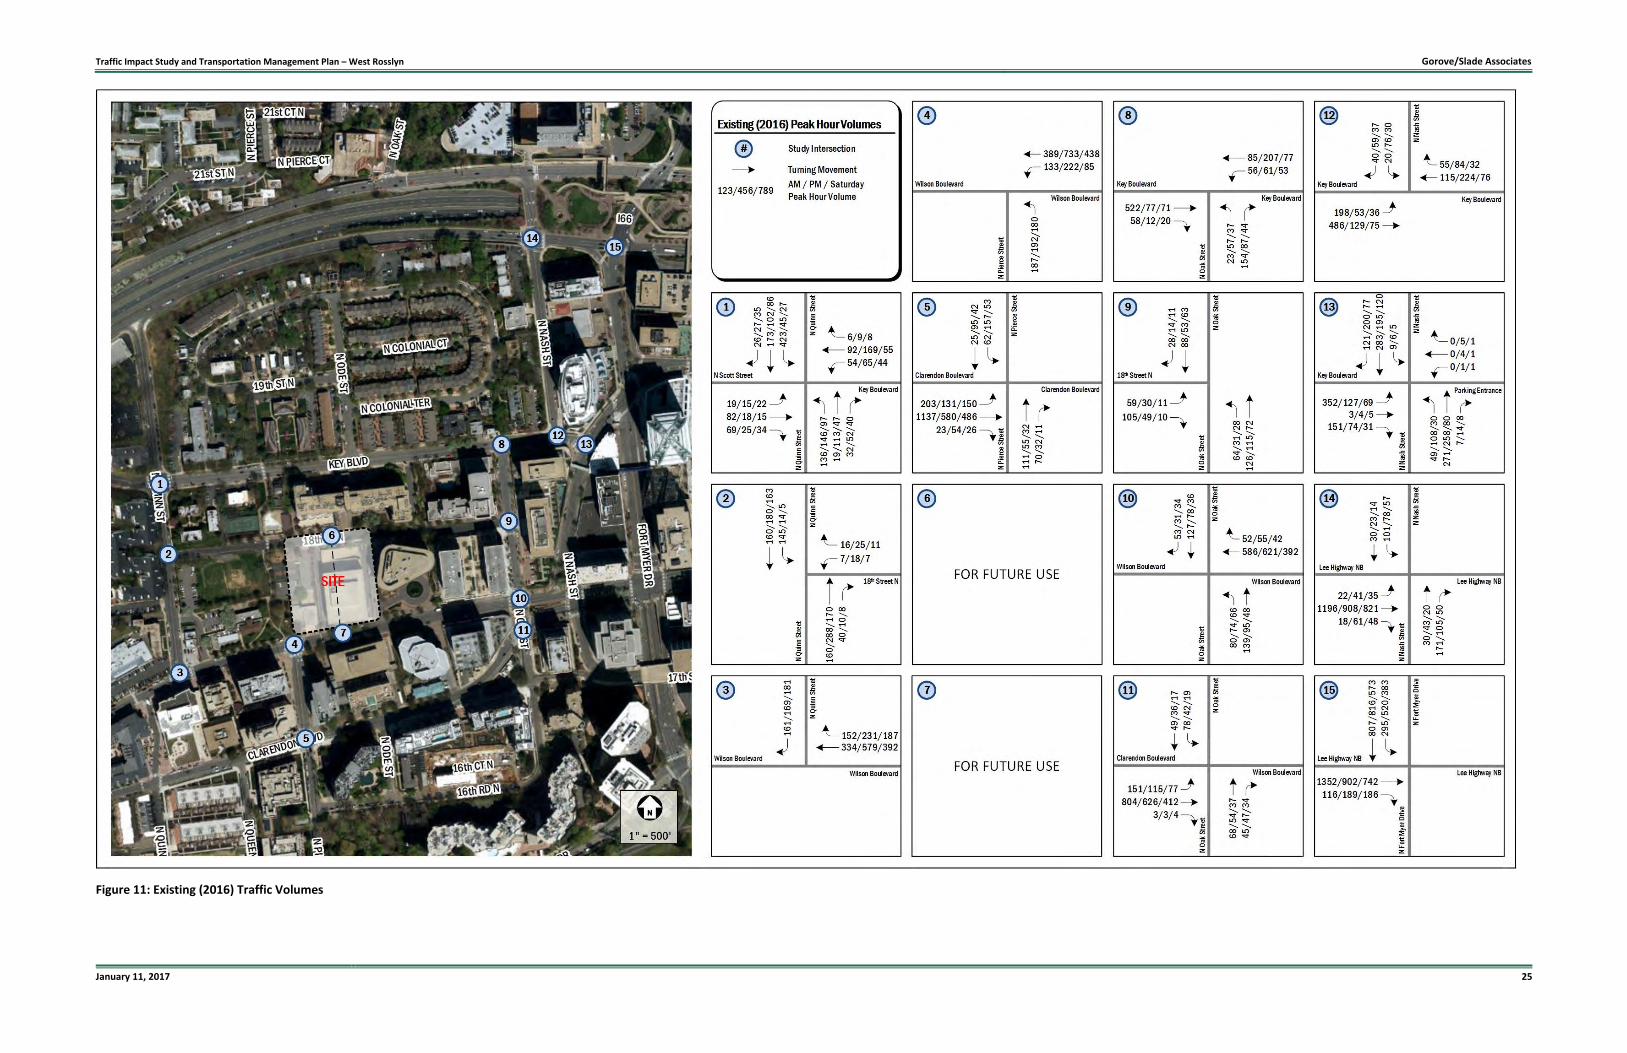
Existing Traffic Volumes
Weekday AM and PM peak hour traffic counts were conducted at the study area intersections on Tuesday, February 23, 2016,
Thursday, April 14, 2016, and Tuesday, April 19, 2016. Counts were collected previously at the intersections of N Quinn Street
& Wilson Boulevard, N Pierce Street & Wilson Boulevard, and N Oak Street & Wilson Boulevard on Wednesday, April 1, 2015.
Saturday counts were taken on March 5, 2016 and Saturday, April 2, 2016. Based on these traffic counts, the weekday system
peak hours occurred from 8:15 AM to 9:15 AM and 5:00 PM to 6:00 PM, with the Saturday system peak hour occurring from
1:00 PM to 2:00 PM. It should be noted that there are locations where existing volumes do not balance due to driveways
located between intersections. The existing peak hour traffic volumes for the intersections within the study area are shown
in Figure 11. The existing turning movement counts are included in the Appendix B.
Traffic Impact Study and Transportation Management Plan – West Rosslyn Gorove/Slade Associates
January 11, 2017 25
Figure 11: Existing (2016) Traffic Volumes
Traffic Impact Study and Transportation Management Plan – West Rosslyn Gorove/Slade Associates
January 11, 2017 26
Existing Capacity Analysis
Capacity analyses were performed for the intersections within the study area during the weekday AM, weekday PM, and
Saturday peak hours under existing conditions. Synchro, Version 9.1 was used to analyze the study intersections based on
the Highway Capacity Manual (HCM) methodology and include level of service, delay, and queue length comparisons for the
turning movements analyzed.
Peak hour factors were applied in accordance with Traffic Impact Analysis Regulations Administrative Guidelines prepared by
VDOT and Traffic Operations and Safety Analysis Manual (TOSAM) prepared by VODOT dated July 2012 and November 2015,
respectively. As such, peak hour factors by approach between 0.85 and 1.00 were used for the existing year analysis. Where
the calculated peak hour factor based on the existing turning movement counts was greater than 0.85, the calculated factor
was applied. Where the calculated PHF was 0.85 or less, a factor of 0.85 was used.
Existing signal timings were provided by Arlington County for signalized intersections in the study area.
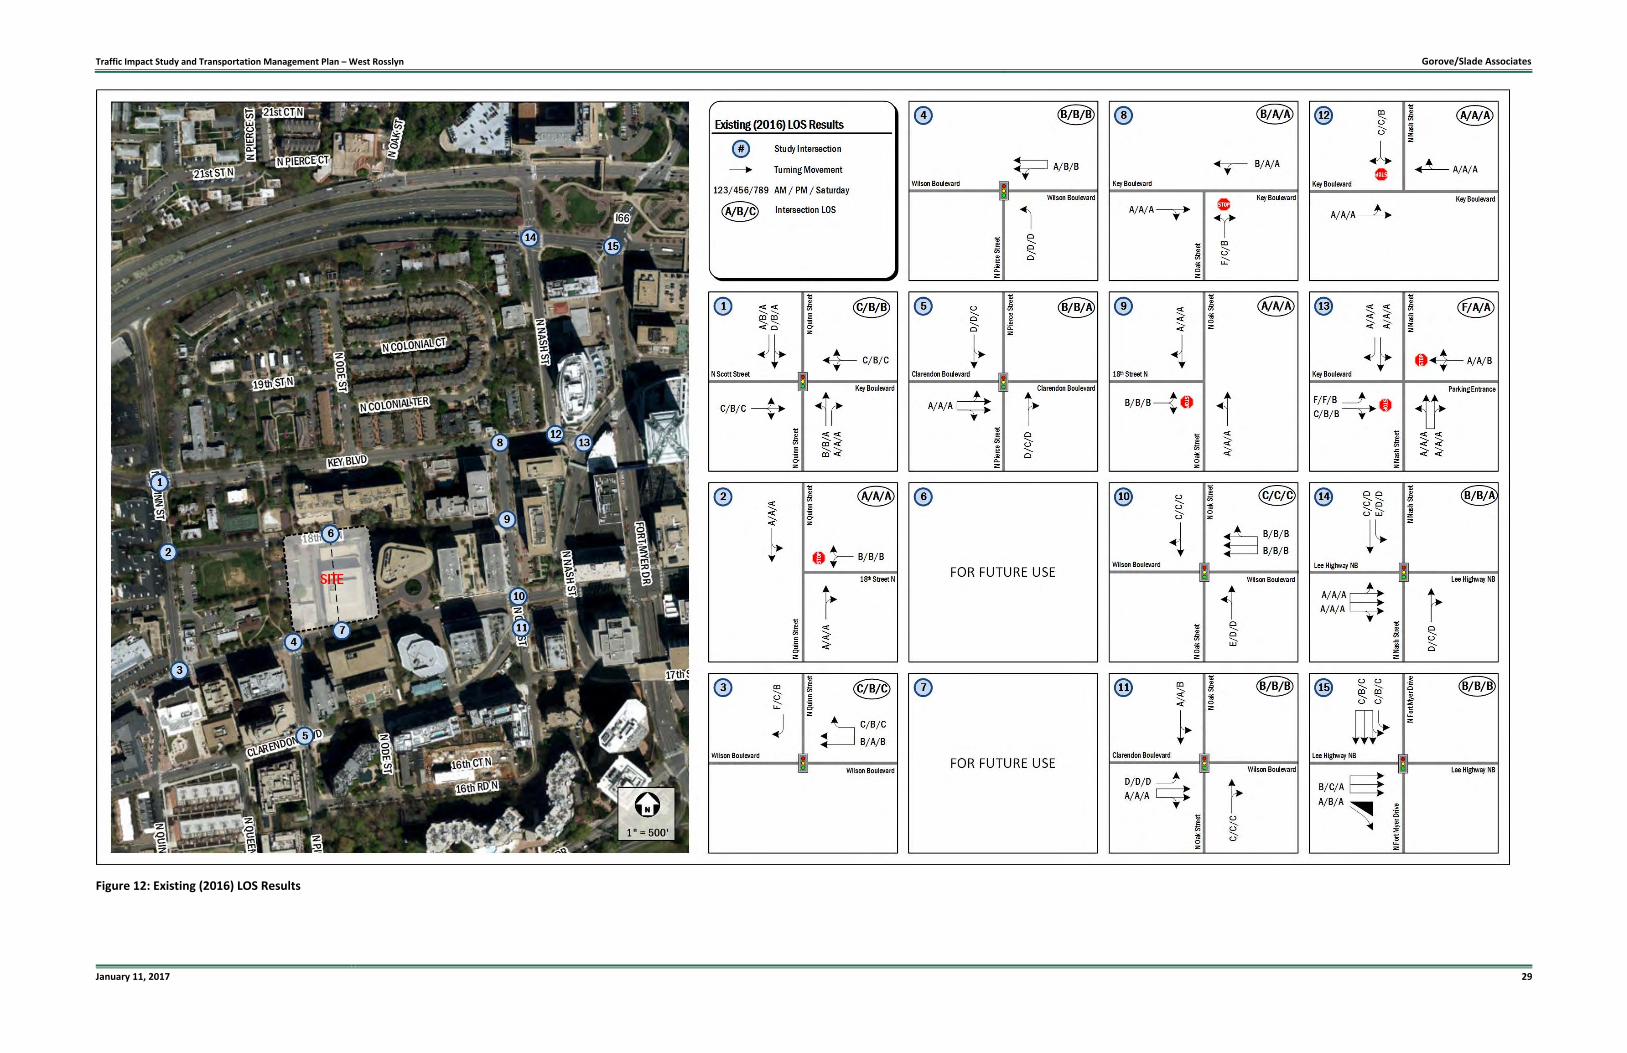
The results of the intersection capacity analyses are presented in Table 3, and are expressed in level of service (LOS) and delay
(seconds per vehicle) per lane group and presented in Figure 12. The 95% and 50% queue results for each intersection are
also presented in Table 3, and are expressed in feet. The detailed analysis worksheets are included in Appendix C.
For the purpose of this analysis, it is desirable to achieve a level of service (LOS) of D or better for each lane group at the
intersections. The capacity analysis results indicate that all movements operate at acceptable LOS under existing conditions
with the exception of the following:
N Quinn Street and Wilson Boulevard
Southbound right lane (AM peak hour)
N Oak Street and Key Boulevard
Northbound left/right lane (AM peak hour)
N Oak Street and Wilson Boulevard
Northbound left/thru lane (AM peak hour)
N Nash Street (east) and Key Boulevard (AM peak hour)
Eastbound left lane (AM and PM peak hour)
N Nash Street and Lee Highway
Southbound left lane (AM peak hour)
None of the movements listed above cause the intersections to operate below acceptable LOS thresholds with the exception
of the intersection of N Nash Street (east) and Key Boulevard in the AM peak hour. Signalization as mitigation at this
intersection is considered in the signal warrant analysis section.
Traffic Impact Study and Transportation Management Plan – West Rosslyn Gorove/Slade Associates
January 11, 2017 27
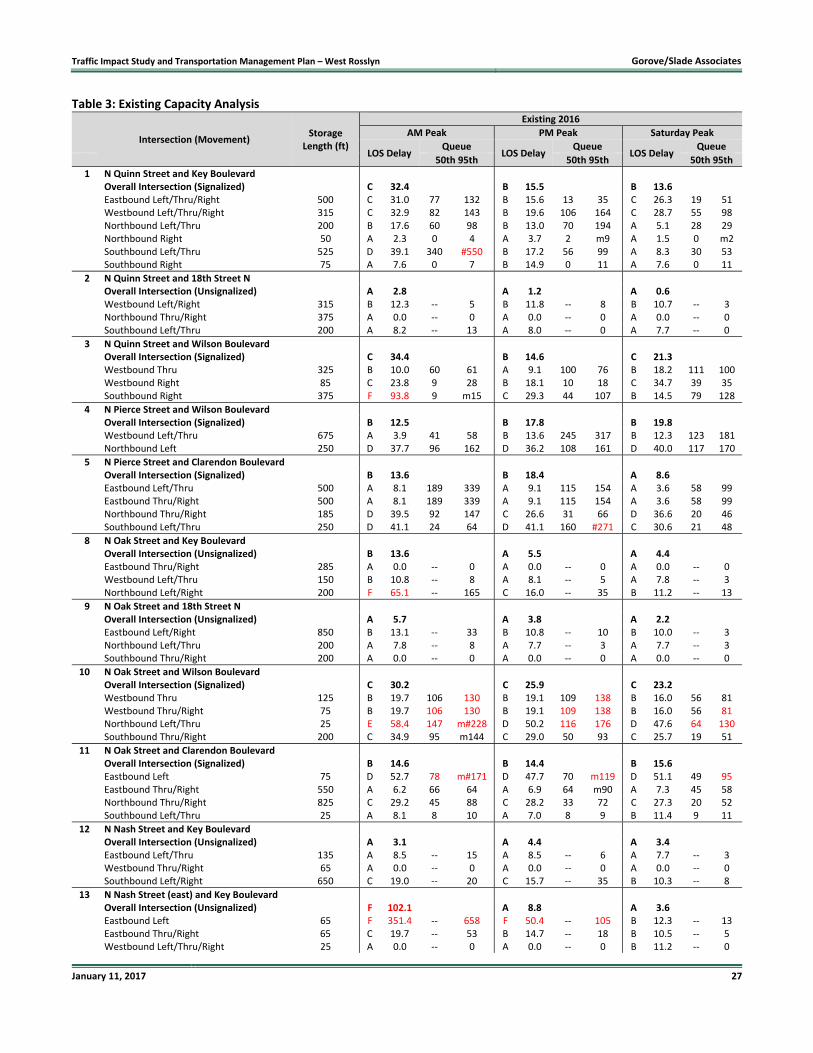
Table 3: Existing Capacity Analysis
Intersection (Movement)
Storage Length (ft)
Existing 2016
AM Peak PM Peak Saturday Peak
LOS Delay Queue
LOS Delay Queue
LOS Delay Queue
50th 95th 50th 95th 50th 95th
1 N Quinn Street and Key Boulevard Overall Intersection (Signalized) C 32.4 B 15.5 B 13.6 Eastbound Left/Thru/Right 500 C 31.0 77 132 B 15.6 13 35 C 26.3 19 51 Westbound Left/Thru/Right 315 C 32.9 82 143 B 19.6 106 164 C 28.7 55 98 Northbound Left/Thru 200 B 17.6 60 98 B 13.0 70 194 A 5.1 28 29 Northbound Right 50 A 2.3 0 4 A 3.7 2 m9 A 1.5 0 m2 Southbound Left/Thru 525 D 39.1 340 #550 B 17.2 56 99 A 8.3 30 53
Southbound Right 75 A 7.6 0 7 B 14.9 0 11 A 7.6 0 11
2 N Quinn Street and 18th Street N Overall Intersection (Unsignalized) A 2.8 A 1.2 A 0.6 Westbound Left/Right 315 B 12.3 ‐‐ 5 B 11.8 ‐‐ 8 B 10.7 ‐‐ 3 Northbound Thru/Right 375 A 0.0 ‐‐ 0 A 0.0 ‐‐ 0 A 0.0 ‐‐ 0 Southbound Left/Thru 200 A 8.2 ‐‐ 13 A 8.0 ‐‐ 0 A 7.7 ‐‐ 0
3 N Quinn Street and Wilson Boulevard Overall Intersection (Signalized) C 34.4 B 14.6 C 21.3 Westbound Thru 325 B 10.0 60 61 A 9.1 100 76 B 18.2 111 100 Westbound Right 85 C 23.8 9 28 B 18.1 10 18 C 34.7 39 35 Southbound Right 375 F 93.8 9 m15 C 29.3 44 107 B 14.5 79 128
4 N Pierce Street and Wilson Boulevard Overall Intersection (Signalized) B 12.5 B 17.8 B 19.8 Westbound Left/Thru 675 A 3.9 41 58 B 13.6 245 317 B 12.3 123 181 Northbound Left 250 D 37.7 96 162 D 36.2 108 161 D 40.0 117 170
5 N Pierce Street and Clarendon Boulevard Overall Intersection (Signalized) B 13.6 B 18.4 A 8.6 Eastbound Left/Thru 500 A 8.1 189 339 A 9.1 115 154 A 3.6 58 99 Eastbound Thru/Right 500 A 8.1 189 339 A 9.1 115 154 A 3.6 58 99 Northbound Thru/Right 185 D 39.5 92 147 C 26.6 31 66 D 36.6 20 46 Southbound Left/Thru 250 D 41.1 24 64 D 41.1 160 #271 C 30.6 21 48
8 N Oak Street and Key Boulevard Overall Intersection (Unsignalized) B 13.6 A 5.5 A 4.4 Eastbound Thru/Right 285 A 0.0 ‐‐ 0 A 0.0 ‐‐ 0 A 0.0 ‐‐ 0 Westbound Left/Thru 150 B 10.8 ‐‐ 8 A 8.1 ‐‐ 5 A 7.8 ‐‐ 3
Northbound Left/Right 200 F 65.1 ‐‐ 165 C 16.0 ‐‐ 35 B 11.2 ‐‐ 13
9 N Oak Street and 18th Street N Overall Intersection (Unsignalized) A 5.7 A 3.8 A 2.2 Eastbound Left/Right 850 B 13.1 ‐‐ 33 B 10.8 ‐‐ 10 B 10.0 ‐‐ 3 Northbound Left/Thru 200 A 7.8 ‐‐ 8 A 7.7 ‐‐ 3 A 7.7 ‐‐ 3 Southbound Thru/Right 200 A 0.0 ‐‐ 0 A 0.0 ‐‐ 0 A 0.0 ‐‐ 0
10 N Oak Street and Wilson Boulevard Overall Intersection (Signalized) C 30.2 C 25.9 C 23.2 Westbound Thru 125 B 19.7 106 130 B 19.1 109 138 B 16.0 56 81 Westbound Thru/Right 75 B 19.7 106 130 B 19.1 109 138 B 16.0 56 81 Northbound Left/Thru 25 E 58.4 147 m#228 D 50.2 116 176 D 47.6 64 130 Southbound Thru/Right 200 C 34.9 95 m144 C 29.0 50 93 C 25.7 19 51
11 N Oak Street and Clarendon Boulevard Overall Intersection (Signalized) B 14.6 B 14.4 B 15.6 Eastbound Left 75 D 52.7 78 m#171 D 47.7 70 m119 D 51.1 49 95 Eastbound Thru/Right 550 A 6.2 66 64 A 6.9 64 m90 A 7.3 45 58 Northbound Thru/Right 825 C 29.2 45 88 C 28.2 33 72 C 27.3 20 52 Southbound Left/Thru 25 A 8.1 8 10 A 7.0 8 9 B 11.4 9 11
12 N Nash Street and Key Boulevard Overall Intersection (Unsignalized) A 3.1 A 4.4 A 3.4 Eastbound Left/Thru 135 A 8.5 ‐‐ 15 A 8.5 ‐‐ 6 A 7.7 ‐‐ 3 Westbound Thru/Right 65 A 0.0 ‐‐ 0 A 0.0 ‐‐ 0 A 0.0 ‐‐ 0
Southbound Left/Right 650 C 19.0 ‐‐ 20 C 15.7 ‐‐ 35 B 10.3 ‐‐ 8
13 N Nash Street (east) and Key Boulevard Overall Intersection (Unsignalized) F 102.1 A 8.8 A 3.6 Eastbound Left 65 F 351.4 ‐‐ 658 F 50.4 ‐‐ 105 B 12.3 ‐‐ 13 Eastbound Thru/Right 65 C 19.7 ‐‐ 53 B 14.7 ‐‐ 18 B 10.5 ‐‐ 5 Westbound Left/Thru/Right 25 A 0.0 ‐‐ 0 A 0.0 ‐‐ 0 B 11.2 ‐‐ 0
Traffic Impact Study and Transportation Management Plan – West Rosslyn Gorove/Slade Associates
January 11, 2017 28
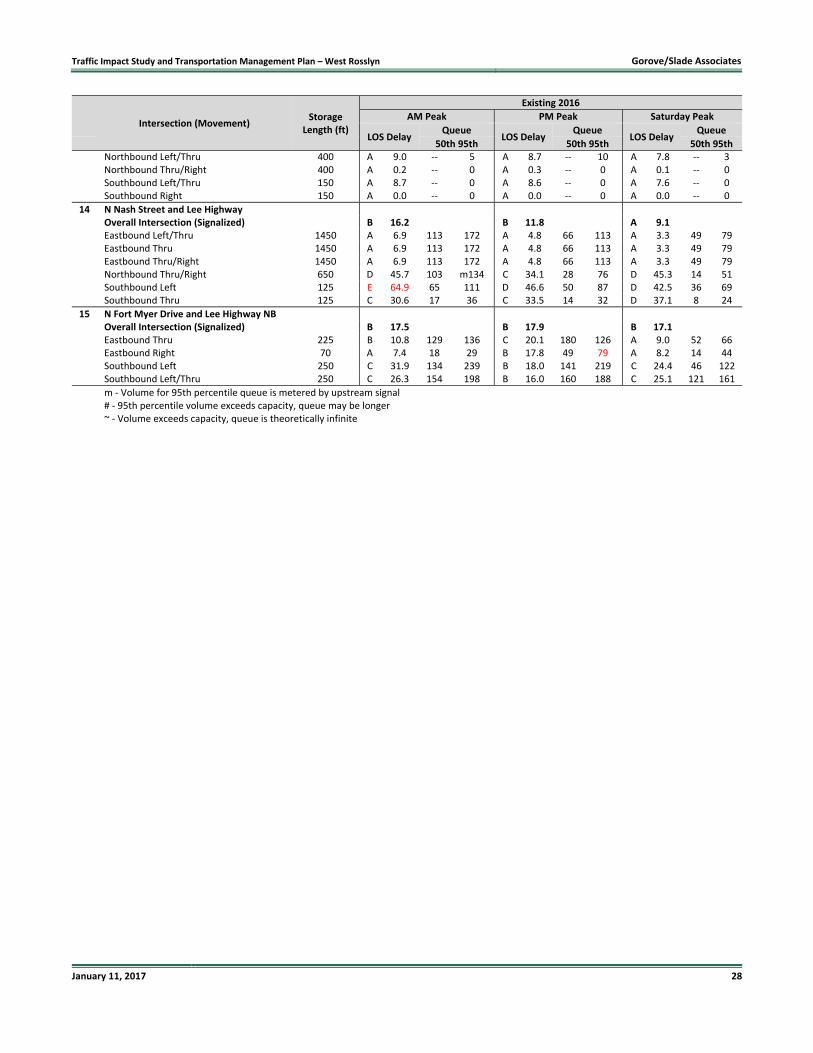
Intersection (Movement)
Storage Length (ft)
Existing 2016
AM Peak PM Peak Saturday Peak
LOS Delay Queue
LOS Delay Queue
LOS Delay Queue
50th 95th 50th 95th 50th 95th Northbound Left/Thru 400 A 9.0 ‐‐ 5 A 8.7 ‐‐ 10 A 7.8 ‐‐ 3 Northbound Thru/Right 400 A 0.2 ‐‐ 0 A 0.3 ‐‐ 0 A 0.1 ‐‐ 0 Southbound Left/Thru 150 A 8.7 ‐‐ 0 A 8.6 ‐‐ 0 A 7.6 ‐‐ 0 Southbound Right 150 A 0.0 ‐‐ 0 A 0.0 ‐‐ 0 A 0.0 ‐‐ 0
14 N Nash Street and Lee Highway Overall Intersection (Signalized) B 16.2 B 11.8 A 9.1 Eastbound Left/Thru 1450 A 6.9 113 172 A 4.8 66 113 A 3.3 49 79 Eastbound Thru 1450 A 6.9 113 172 A 4.8 66 113 A 3.3 49 79 Eastbound Thru/Right 1450 A 6.9 113 172 A 4.8 66 113 A 3.3 49 79 Northbound Thru/Right 650 D 45.7 103 m134 C 34.1 28 76 D 45.3 14 51 Southbound Left 125 E 64.9 65 111 D 46.6 50 87 D 42.5 36 69 Southbound Thru 125 C 30.6 17 36 C 33.5 14 32 D 37.1 8 24
15 N Fort Myer Drive and Lee Highway NB Overall Intersection (Signalized) B 17.5 B 17.9 B 17.1 Eastbound Thru 225 B 10.8 129 136 C 20.1 180 126 A 9.0 52 66 Eastbound Right 70 A 7.4 18 29 B 17.8 49 79 A 8.2 14 44 Southbound Left 250 C 31.9 134 239 B 18.0 141 219 C 24.4 46 122
Southbound Left/Thru 250 C 26.3 154 198 B 16.0 160 188 C 25.1 121 161 m ‐ Volume for 95th percentile queue is metered by upstream signal
# ‐ 95th percentile volume exceeds capacity, queue may be longer ~ ‐ Volume exceeds capacity, queue is theoretically infinite
Traffic Impact Study and Transportation Management Plan – West Rosslyn Gorove/Slade Associates
January 11, 2017 29
Figure 12: Existing (2016) LOS Results
Traffic Impact Study and Transportation Management Plan – West Rosslyn Gorove/Slade Associates
January 11, 2017 30
FUTURE CONDITIONS WITHOUT DEVELOPMENT (2019)
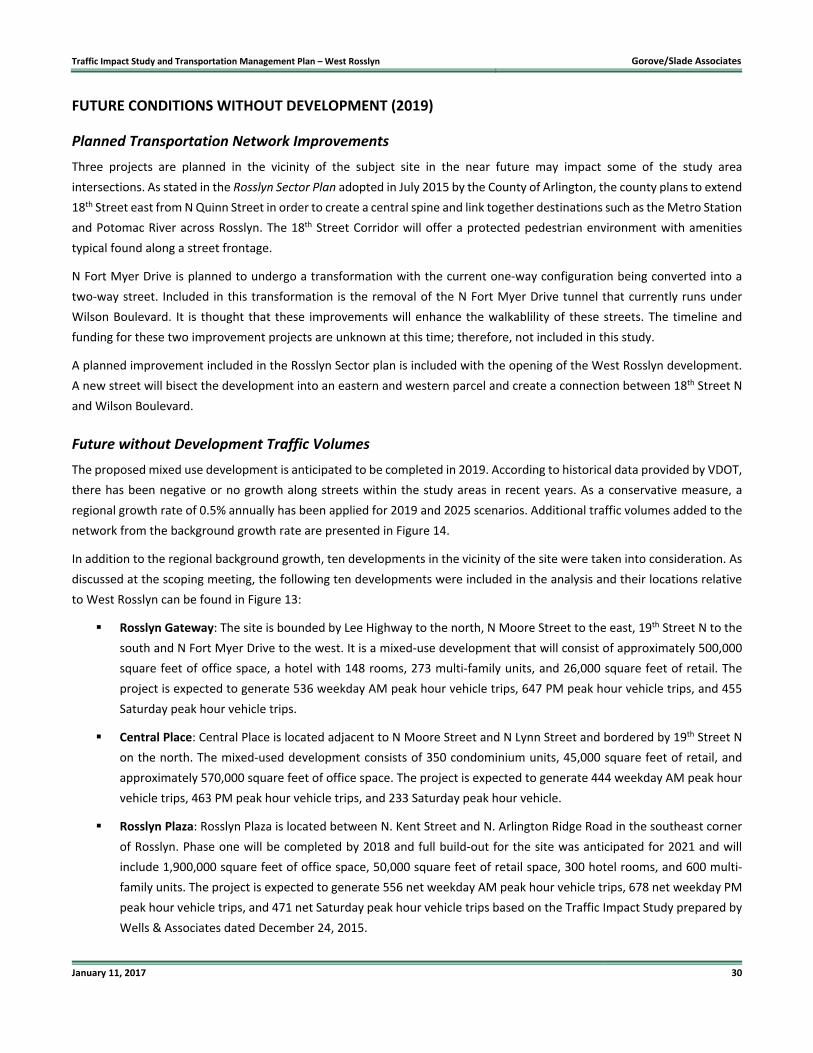
Planned Transportation Network Improvements
Three projects are planned in the vicinity of the subject site in the near future may impact some of the study area
intersections. As stated in the Rosslyn Sector Plan adopted in July 2015 by the County of Arlington, the county plans to extend
18th Street east from N Quinn Street in order to create a central spine and link together destinations such as the Metro Station
and Potomac River across Rosslyn. The 18th Street Corridor will offer a protected pedestrian environment with amenities
typical found along a street frontage.
N Fort Myer Drive is planned to undergo a transformation with the current one‐way configuration being converted into a
two‐way street. Included in this transformation is the removal of the N Fort Myer Drive tunnel that currently runs under
Wilson Boulevard. It is thought that these improvements will enhance the walkablility of these streets. The timeline and
funding for these two improvement projects are unknown at this time; therefore, not included in this study.
A planned improvement included in the Rosslyn Sector plan is included with the opening of the West Rosslyn development.
A new street will bisect the development into an eastern and western parcel and create a connection between 18th Street N
and Wilson Boulevard.
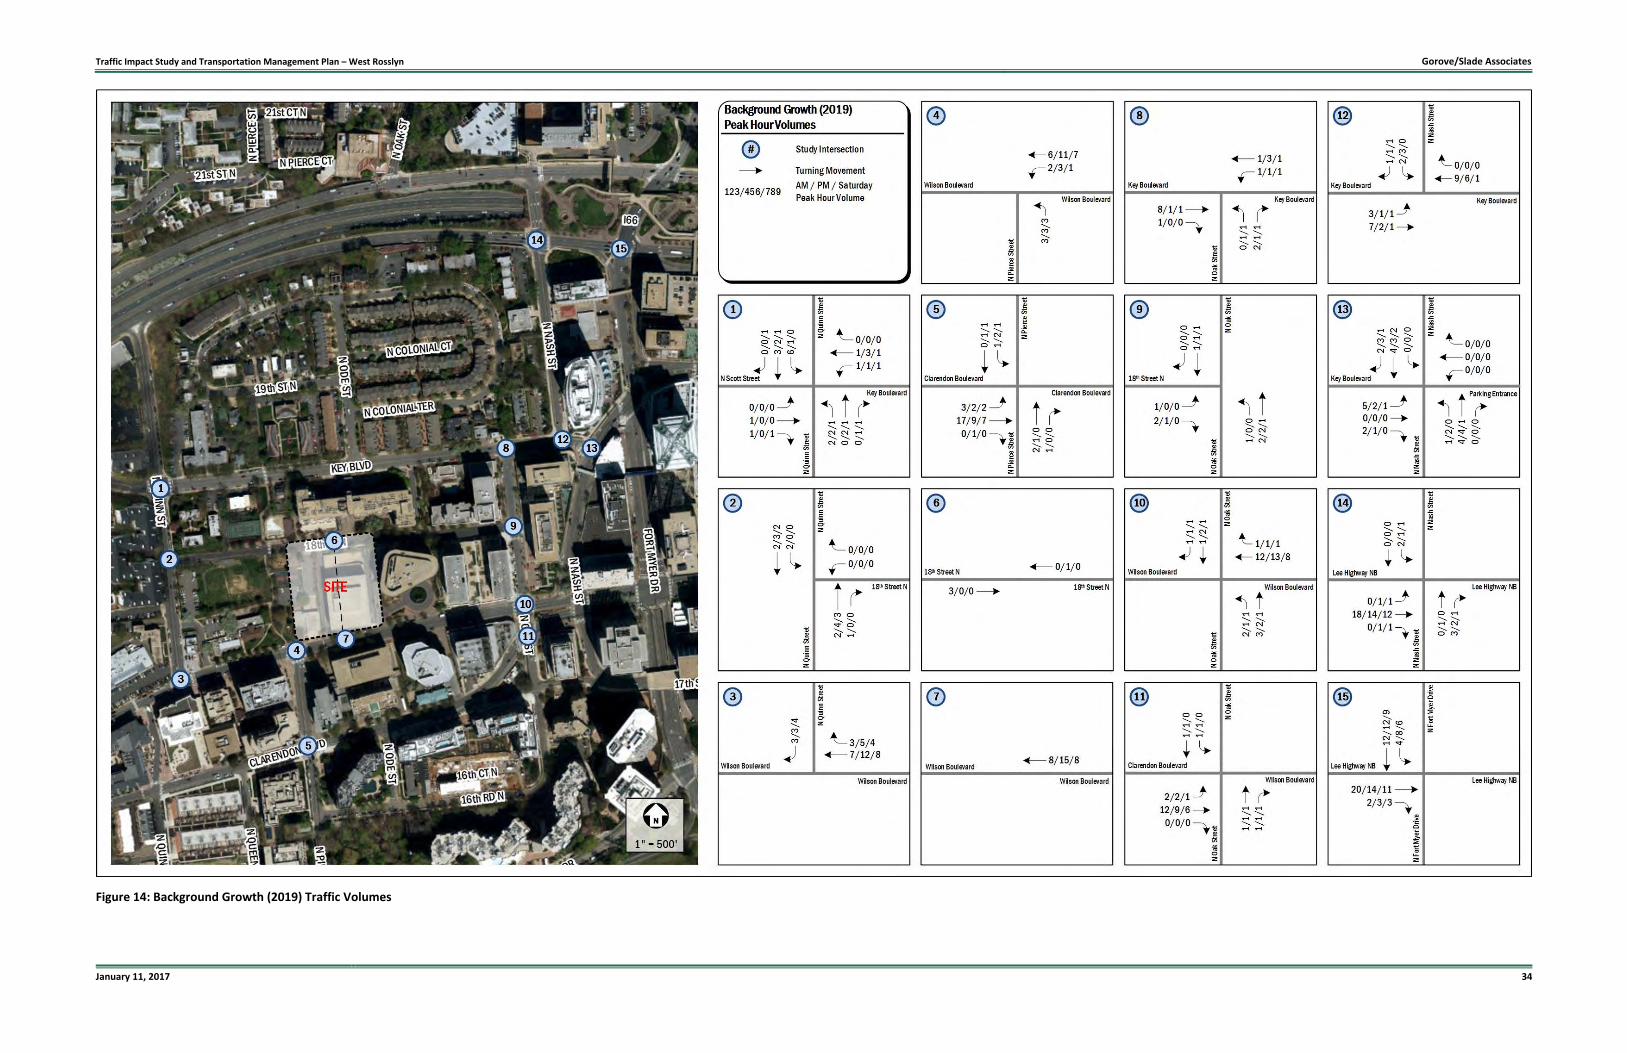
Future without Development Traffic Volumes
The proposed mixed use development is anticipated to be completed in 2019. According to historical data provided by VDOT,
there has been negative or no growth along streets within the study areas in recent years. As a conservative measure, a
regional growth rate of 0.5% annually has been applied for 2019 and 2025 scenarios. Additional traffic volumes added to the
network from the background growth rate are presented in Figure 14.
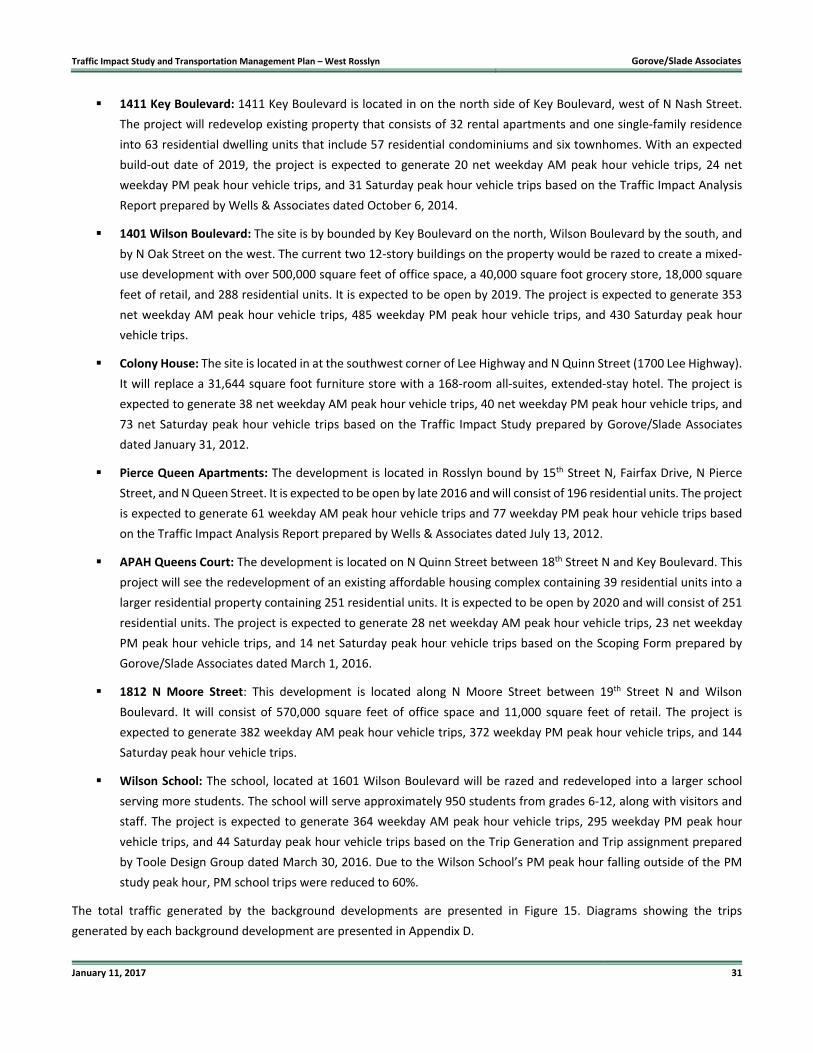
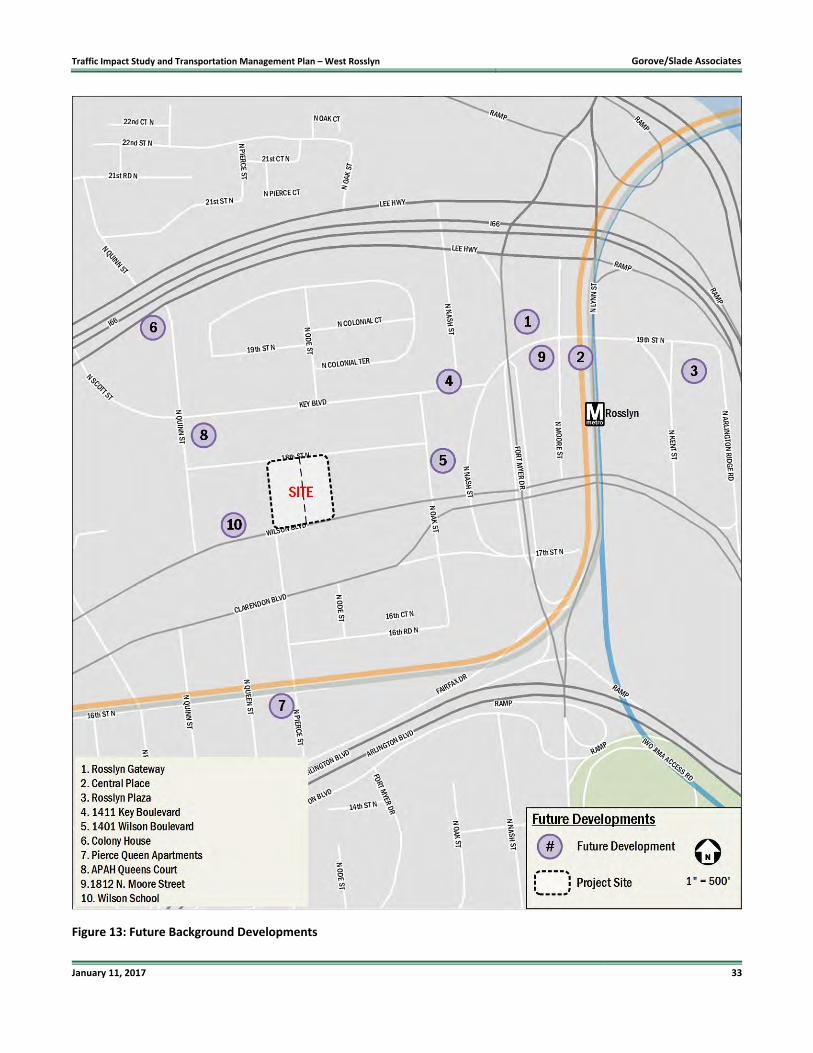
In addition to the regional background growth, ten developments in the vicinity of the site were taken into consideration. As
discussed at the scoping meeting, the following ten developments were included in the analysis and their locations relative
to West Rosslyn can be found in Figure 13:
Rosslyn Gateway: The site is bounded by Lee Highway to the north, N Moore Street to the east, 19th Street N to the
south and N Fort Myer Drive to the west. It is a mixed‐use development that will consist of approximately 500,000
square feet of office space, a hotel with 148 rooms, 273 multi‐family units, and 26,000 square feet of retail. The
project is expected to generate 536 weekday AM peak hour vehicle trips, 647 PM peak hour vehicle trips, and 455
Saturday peak hour vehicle trips.
Central Place: Central Place is located adjacent to N Moore Street and N Lynn Street and bordered by 19th Street N
on the north. The mixed‐used development consists of 350 condominium units, 45,000 square feet of retail, and
approximately 570,000 square feet of office space. The project is expected to generate 444 weekday AM peak hour
vehicle trips, 463 PM peak hour vehicle trips, and 233 Saturday peak hour vehicle.
Rosslyn Plaza: Rosslyn Plaza is located between N. Kent Street and N. Arlington Ridge Road in the southeast corner
of Rosslyn. Phase one will be completed by 2018 and full build‐out for the site was anticipated for 2021 and will
include 1,900,000 square feet of office space, 50,000 square feet of retail space, 300 hotel rooms, and 600 multi‐
family units. The project is expected to generate 556 net weekday AM peak hour vehicle trips, 678 net weekday PM
peak hour vehicle trips, and 471 net Saturday peak hour vehicle trips based on the Traffic Impact Study prepared by
Wells & Associates dated December 24, 2015.
Traffic Impact Study and Transportation Management Plan – West Rosslyn Gorove/Slade Associates
January 11, 2017 31
1411 Key Boulevard: 1411 Key Boulevard is located in on the north side of Key Boulevard, west of N Nash Street.
The project will redevelop existing property that consists of 32 rental apartments and one single‐family residence
into 63 residential dwelling units that include 57 residential condominiums and six townhomes. With an expected
build‐out date of 2019, the project is expected to generate 20 net weekday AM peak hour vehicle trips, 24 net
weekday PM peak hour vehicle trips, and 31 Saturday peak hour vehicle trips based on the Traffic Impact Analysis
Report prepared by Wells & Associates dated October 6, 2014.
1401 Wilson Boulevard: The site is by bounded by Key Boulevard on the north, Wilson Boulevard by the south, and
by N Oak Street on the west. The current two 12‐story buildings on the property would be razed to create a mixed‐
use development with over 500,000 square feet of office space, a 40,000 square foot grocery store, 18,000 square
feet of retail, and 288 residential units. It is expected to be open by 2019. The project is expected to generate 353
net weekday AM peak hour vehicle trips, 485 weekday PM peak hour vehicle trips, and 430 Saturday peak hour
vehicle trips.
Colony House: The site is located in at the southwest corner of Lee Highway and N Quinn Street (1700 Lee Highway).
It will replace a 31,644 square foot furniture store with a 168‐room all‐suites, extended‐stay hotel. The project is
expected to generate 38 net weekday AM peak hour vehicle trips, 40 net weekday PM peak hour vehicle trips, and
73 net Saturday peak hour vehicle trips based on the Traffic Impact Study prepared by Gorove/Slade Associates
dated January 31, 2012.
Pierce Queen Apartments: The development is located in Rosslyn bound by 15th Street N, Fairfax Drive, N Pierce
Street, and N Queen Street. It is expected to be open by late 2016 and will consist of 196 residential units. The project
is expected to generate 61 weekday AM peak hour vehicle trips and 77 weekday PM peak hour vehicle trips based
on the Traffic Impact Analysis Report prepared by Wells & Associates dated July 13, 2012.
APAH Queens Court: The development is located on N Quinn Street between 18th Street N and Key Boulevard. This
project will see the redevelopment of an existing affordable housing complex containing 39 residential units into a
larger residential property containing 251 residential units. It is expected to be open by 2020 and will consist of 251
residential units. The project is expected to generate 28 net weekday AM peak hour vehicle trips, 23 net weekday
PM peak hour vehicle trips, and 14 net Saturday peak hour vehicle trips based on the Scoping Form prepared by
Gorove/Slade Associates dated March 1, 2016.
1812 N Moore Street: This development is located along N Moore Street between 19th Street N and Wilson
Boulevard. It will consist of 570,000 square feet of office space and 11,000 square feet of retail. The project is
expected to generate 382 weekday AM peak hour vehicle trips, 372 weekday PM peak hour vehicle trips, and 144
Saturday peak hour vehicle trips.
Wilson School: The school, located at 1601 Wilson Boulevard will be razed and redeveloped into a larger school
serving more students. The school will serve approximately 950 students from grades 6‐12, along with visitors and
staff. The project is expected to generate 364 weekday AM peak hour vehicle trips, 295 weekday PM peak hour
vehicle trips, and 44 Saturday peak hour vehicle trips based on the Trip Generation and Trip assignment prepared
by Toole Design Group dated March 30, 2016. Due to the Wilson School’s PM peak hour falling outside of the PM
study peak hour, PM school trips were reduced to 60%.
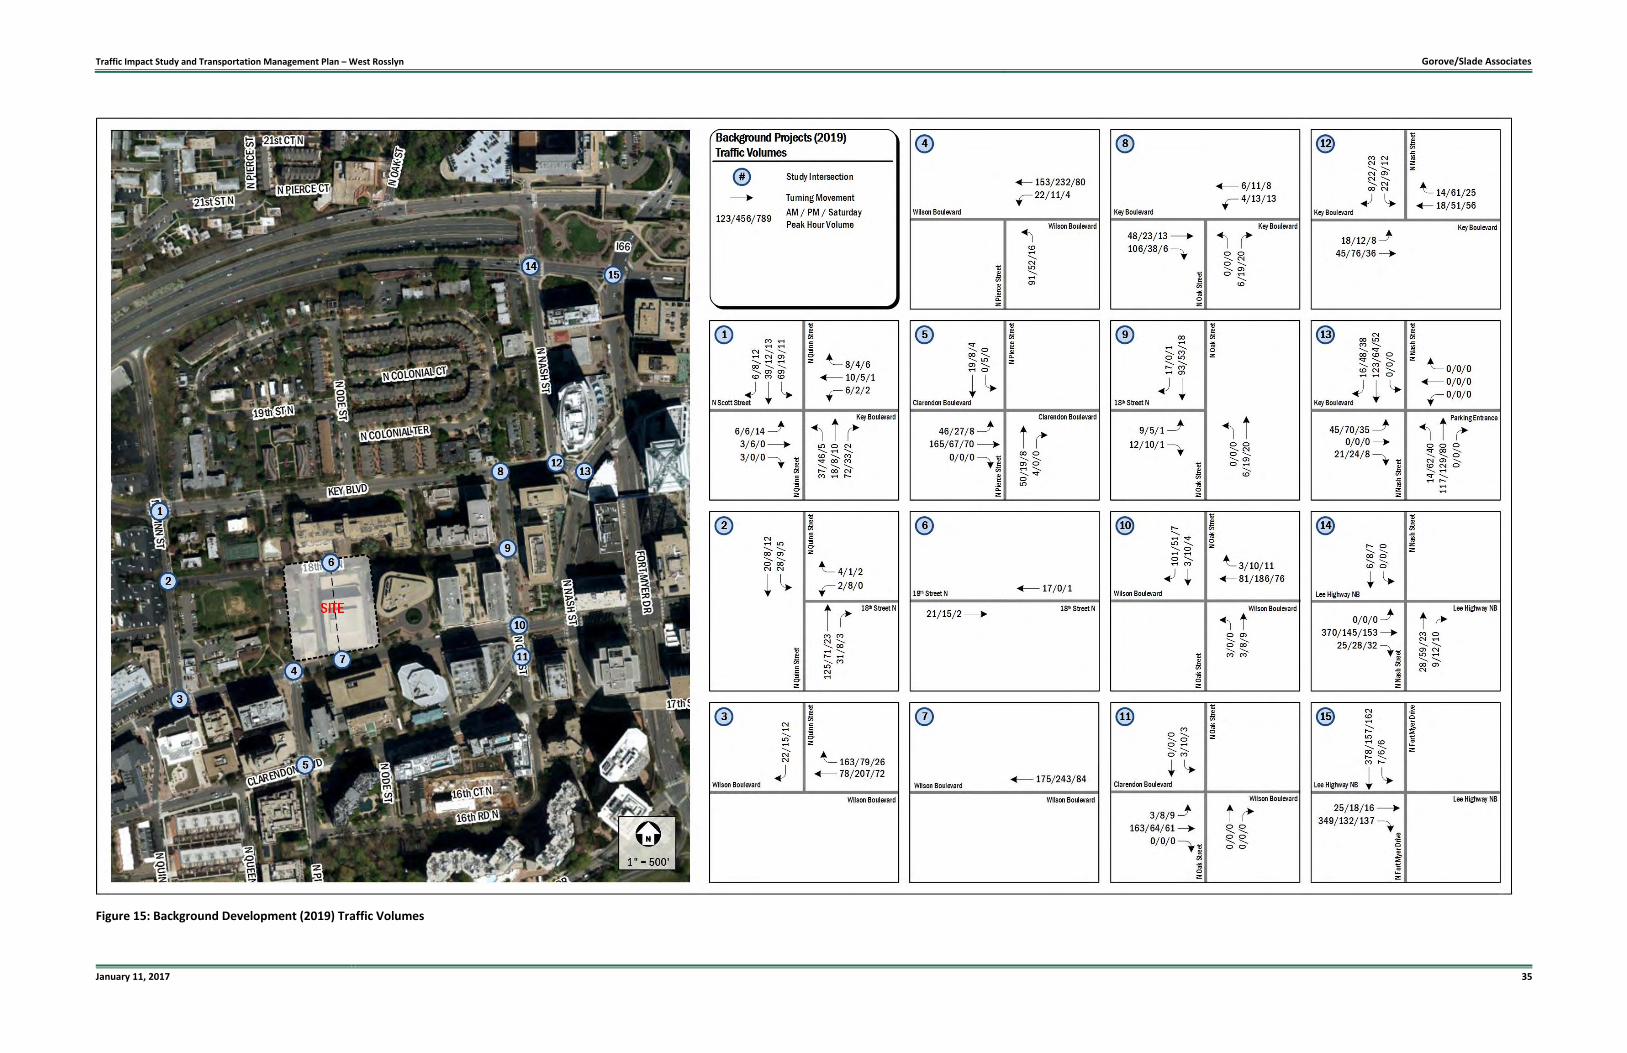
The total traffic generated by the background developments are presented in Figure 15. Diagrams showing the trips
generated by each background development are presented in Appendix D.

Traffic Impact Study and Transportation Management Plan – West Rosslyn Gorove/Slade Associates
January 11, 2017 32
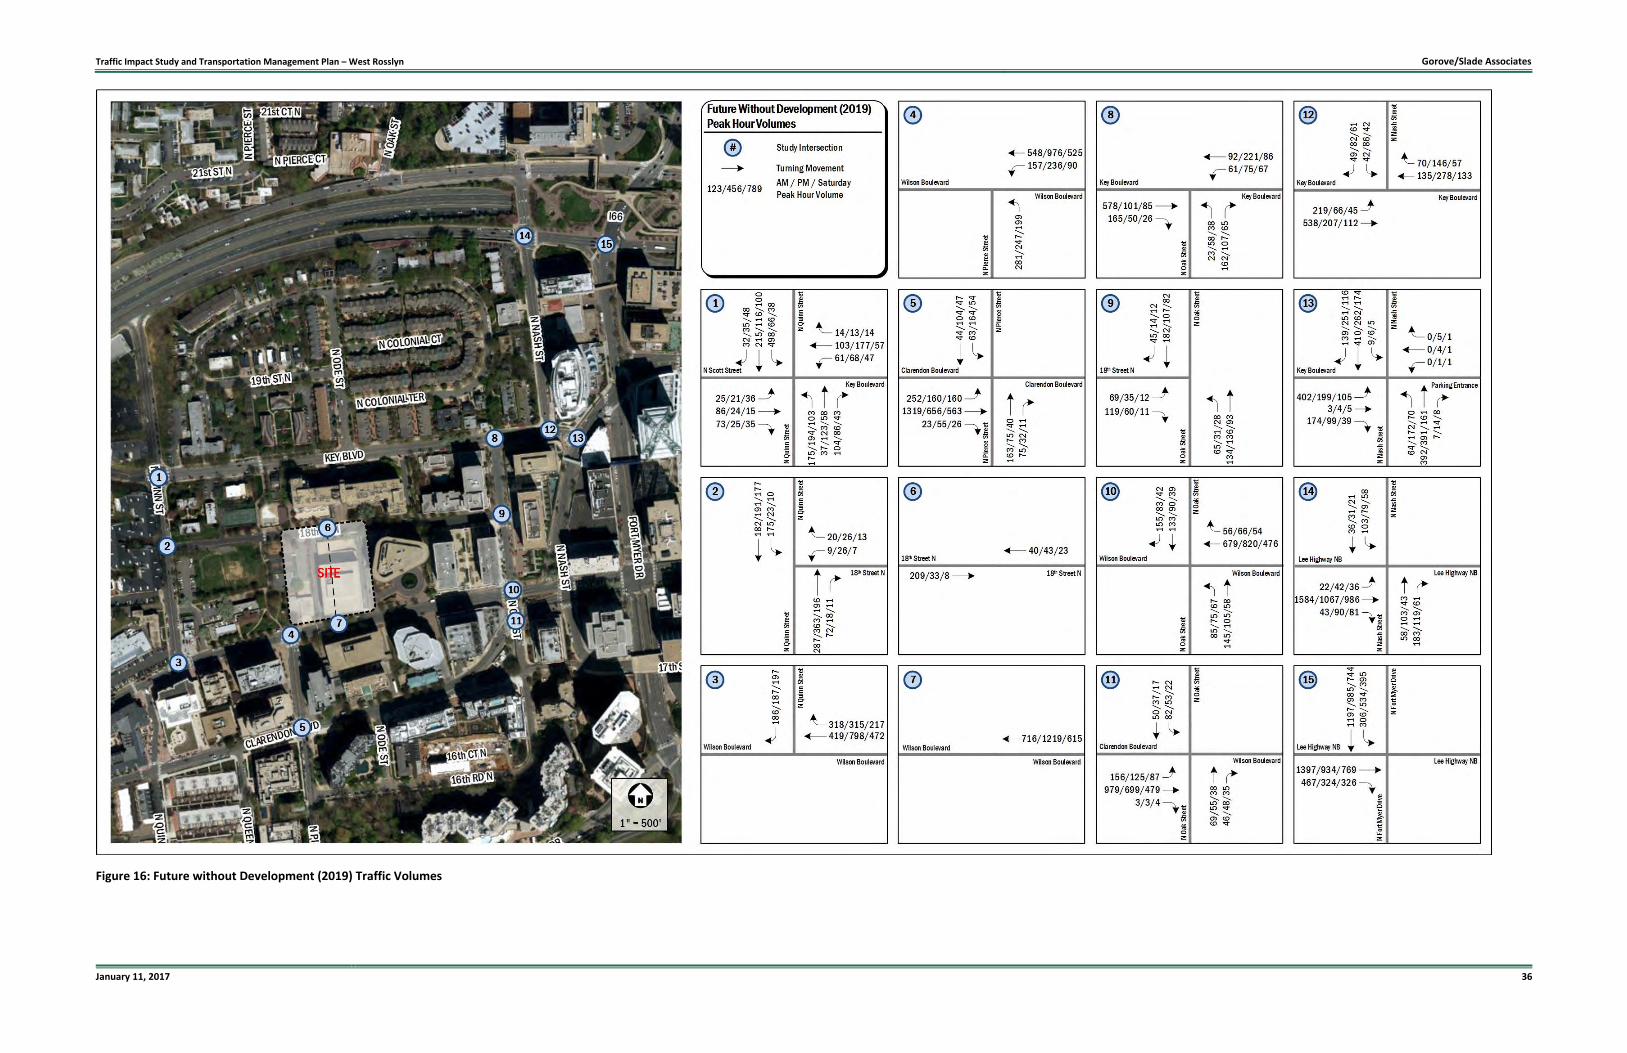
Trips generated by the approved background developments were added to the existing traffic volume with approved growth
rates in order to generate future conditions without development (2019) traffic volumes. The Future without Development
(2019) traffic volumes are shown in Figure 16.
Table 4: Traffic Generated by Background Developments
Daily Daily
In Out Total In Out Total Total In Out Total
Rosslyn Gateway (1)
Total New Vehicle‐Trips 407 129 536 213 434 647 240 215 455
Central Place (2)
Total New Vehicle‐Trips 348 96 444 124 339 463 125 108 233
Rosslyn Plaza (3)
Total Development Trips 1,992 585 2,577 889 2,245 3,134 985 868 1853
Total New External Trips 388 168 556 232 446 678 263 208 471
1411 Key Boulevard (4)
Net New Residential Site Trips 4 17 21 17 8 20 249 19 12 31
1401 Wilson Boulevard and 1400 Key Boulevard (5)
Total Net New Vehicle‐Trips 266 87 353 150 335 485 223 207 430
Colony House (6)
Total Trips 21 16 38 18 22 40 494 41 32 73
Pierce Queen Apartments (7)
Total Trips 12 49 61 50 27 77 803 31 30 61
APAH Queens Court (8)
Proposed Residential
Net New Trips 5 23 28 0 15 8 23 298 6 8 14
1812 North Moore Street (9)
Total New Vehicle‐Trips 335 47 382 68 304 372 77 67 144
Wilson School (10)
Total 227 137 364 104 191 295 27 17 44
Total Background Trips 2,013 769 2,783 991 2,114 3,100 1,844 1,052 909 1,941
‐‐‐‐‐‐ W e e k e n d ‐‐‐‐‐‐
AM Peak Hour PM Peak Hour Sat Peak Hour
(7): Extracted from Pierce Queen Apartments TIA (07.13.2012) prepared by Wells + Associates
Land Use ITE Code Size
‐‐‐‐‐‐ W e e k d a y ‐‐‐‐‐‐
(1), (2), (5), (9): Extracted from Rosslyn Plaza TIA (Updated TIA Submission 12.24.15) prepared by Wells + Associates
(6) Extracted from 1700 Lee Highway (1.31.12) TIA prepared by Gorove Slade Associates
Traffic Impact Study and Transportation Management Plan – West Rosslyn Gorove/Slade Associates
January 11, 2017 33
Figure 13: Future Background Developments
Traffic Impact Study and Transportation Management Plan – West Rosslyn Gorove/Slade Associates
January 11, 2017 34
Figure 14: Background Growth (2019) Traffic Volumes
Traffic Impact Study and Transportation Management Plan – West Rosslyn Gorove/Slade Associates
January 11, 2017 35
Figure 15: Background Development (2019) Traffic Volumes
Traffic Impact Study and Transportation Management Plan – West Rosslyn Gorove/Slade Associates
January 11, 2017 36
Figure 16: Future without Development (2019) Traffic Volumes
Traffic Impact Study and Transportation Management Plan – West Rosslyn Gorove/Slade Associates
March 29, 2016 37
Future without Development Capacity Analysis
Capacity analyses were performed at the intersections within the study area during the weekday AM, weekday PM, and
Saturday peak hours for the future conditions without development scenario. Synchro, Version 9.1 was used to analyze the
study intersections based on the Highway Capacity Manual (HCM) methodology and include level of service, delay, and queue
length comparisons for the turning movements analyzed.
Peak hour factors were applied in accordance with Traffic Impact Analysis Regulations Administrative Guidelines prepared by
VDOT dated July 2012. As such, peak hour factors by approach between 0.92 and 1.00 were used for all future scenarios.
Where the calculated peak hour factor based on the existing turning movement counts was greater than 0.92, the calculated
factor was applied. Where the calculated factor was 0.92 or less, a factor of 0.92 was applied.
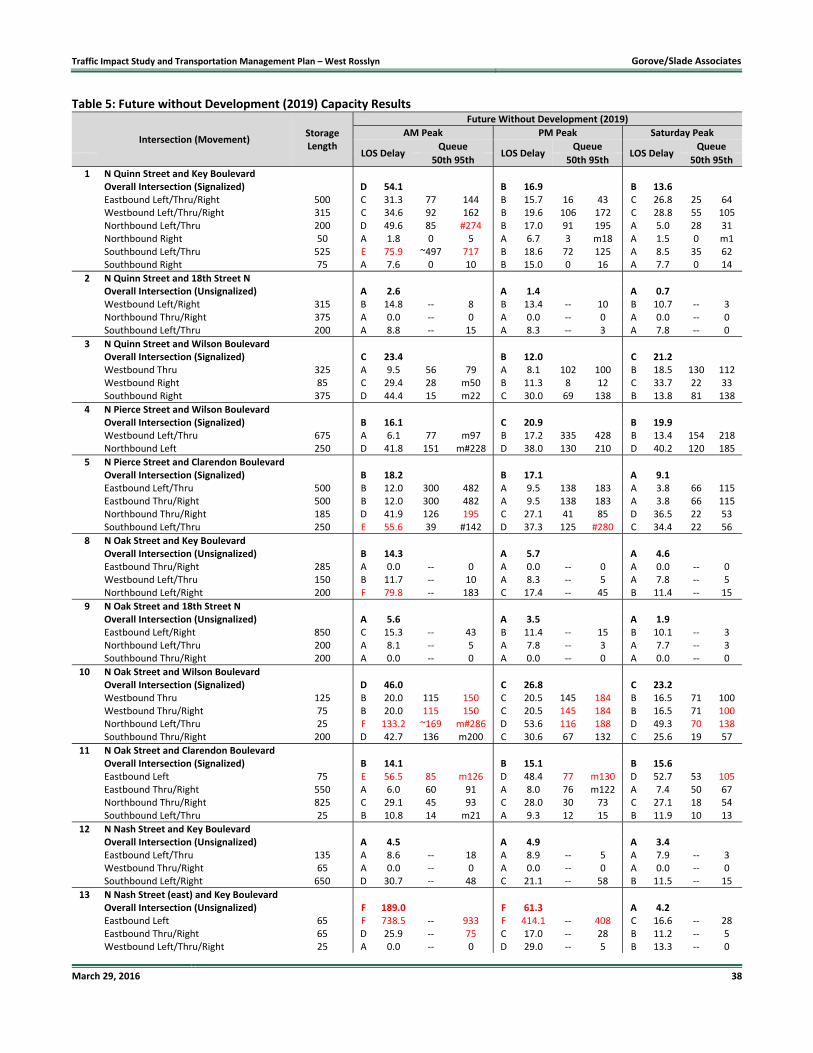
The results of the intersection capacity analysis are presented in Table 5, and are expressed in level of service (LOS) and delay
(seconds per vehicle) per lane group. The 95% and 50% queue results for each intersection are also presented in Table 5, and
are expressed in feet. The detailed analysis worksheets are contained in Appendix E.
For the purpose of this analysis, it is desirable to achieve a level of service (LOS) of D or better for each lane group at the
intersections. All movements at the study intersections operate at acceptable levels of service consistent with the Existing
Conditions scenario, with the exception of the following:
N Quinn Street and Key Boulevard
Southbound left/thru lane (AM peak hour)
N Pierce Street and Clarendon Boulevard
Southbound left/thru lane (AM peak hour)
N Oak Street and Clarendon Boulevard
Eastbound left lane (AM peak hour)
N Nash Street (east) and Key Boulevard (PM peak hour)
N Nash Street and Lee Highway
Southbound left lane (PM peak hour)
None of the movements listed above cause the intersections to operate below acceptable LOS thresholds with the exception
of the intersection of N Nash Street (east) and Key Boulevard in the PM peak hour. Signalization as mitigation at this
intersection is considered in the signal warrant analysis section.
Traffic Impact Study and Transportation Management Plan – West Rosslyn Gorove/Slade Associates
March 29, 2016 38
Table 5: Future without Development (2019) Capacity Results
Intersection (Movement)
Storage Length
Future Without Development (2019)
AM Peak PM Peak Saturday Peak
LOS Delay Queue
LOS Delay Queue
LOS Delay Queue
50th 95th 50th 95th 50th 95th
1 N Quinn Street and Key Boulevard Overall Intersection (Signalized) D 54.1 B 16.9 B 13.6 Eastbound Left/Thru/Right 500 C 31.3 77 144 B 15.7 16 43 C 26.8 25 64 Westbound Left/Thru/Right 315 C 34.6 92 162 B 19.6 106 172 C 28.8 55 105 Northbound Left/Thru 200 D 49.6 85 #274 B 17.0 91 195 A 5.0 28 31 Northbound Right 50 A 1.8 0 5 A 6.7 3 m18 A 1.5 0 m1 Southbound Left/Thru 525 E 75.9 ~497 717 B 18.6 72 125 A 8.5 35 62
Southbound Right 75 A 7.6 0 10 B 15.0 0 16 A 7.7 0 14
2 N Quinn Street and 18th Street N Overall Intersection (Unsignalized) A 2.6 A 1.4 A 0.7 Westbound Left/Right 315 B 14.8 ‐‐ 8 B 13.4 ‐‐ 10 B 10.7 ‐‐ 3 Northbound Thru/Right 375 A 0.0 ‐‐ 0 A 0.0 ‐‐ 0 A 0.0 ‐‐ 0 Southbound Left/Thru 200 A 8.8 ‐‐ 15 A 8.3 ‐‐ 3 A 7.8 ‐‐ 0
3 N Quinn Street and Wilson Boulevard Overall Intersection (Signalized) C 23.4 B 12.0 C 21.2 Westbound Thru 325 A 9.5 56 79 A 8.1 102 100 B 18.5 130 112 Westbound Right 85 C 29.4 28 m50 B 11.3 8 12 C 33.7 22 33 Southbound Right 375 D 44.4 15 m22 C 30.0 69 138 B 13.8 81 138
4 N Pierce Street and Wilson Boulevard Overall Intersection (Signalized) B 16.1 C 20.9 B 19.9 Westbound Left/Thru 675 A 6.1 77 m97 B 17.2 335 428 B 13.4 154 218 Northbound Left 250 D 41.8 151 m#228 D 38.0 130 210 D 40.2 120 185
5 N Pierce Street and Clarendon Boulevard Overall Intersection (Signalized) B 18.2 B 17.1 A 9.1 Eastbound Left/Thru 500 B 12.0 300 482 A 9.5 138 183 A 3.8 66 115 Eastbound Thru/Right 500 B 12.0 300 482 A 9.5 138 183 A 3.8 66 115 Northbound Thru/Right 185 D 41.9 126 195 C 27.1 41 85 D 36.5 22 53 Southbound Left/Thru 250 E 55.6 39 #142 D 37.3 125 #280 C 34.4 22 56
8 N Oak Street and Key Boulevard Overall Intersection (Unsignalized) B 14.3 A 5.7 A 4.6 Eastbound Thru/Right 285 A 0.0 ‐‐ 0 A 0.0 ‐‐ 0 A 0.0 ‐‐ 0 Westbound Left/Thru 150 B 11.7 ‐‐ 10 A 8.3 ‐‐ 5 A 7.8 ‐‐ 5
Northbound Left/Right 200 F 79.8 ‐‐ 183 C 17.4 ‐‐ 45 B 11.4 ‐‐ 15
9 N Oak Street and 18th Street N Overall Intersection (Unsignalized) A 5.6 A 3.5 A 1.9 Eastbound Left/Right 850 C 15.3 ‐‐ 43 B 11.4 ‐‐ 15 B 10.1 ‐‐ 3 Northbound Left/Thru 200 A 8.1 ‐‐ 5 A 7.8 ‐‐ 3 A 7.7 ‐‐ 3 Southbound Thru/Right 200 A 0.0 ‐‐ 0 A 0.0 ‐‐ 0 A 0.0 ‐‐ 0
10 N Oak Street and Wilson Boulevard Overall Intersection (Signalized) D 46.0 C 26.8 C 23.2 Westbound Thru 125 B 20.0 115 150 C 20.5 145 184 B 16.5 71 100 Westbound Thru/Right 75 B 20.0 115 150 C 20.5 145 184 B 16.5 71 100 Northbound Left/Thru 25 F 133.2 ~169 m#286 D 53.6 116 188 D 49.3 70 138 Southbound Thru/Right 200 D 42.7 136 m200 C 30.6 67 132 C 25.6 19 57
11 N Oak Street and Clarendon Boulevard Overall Intersection (Signalized) B 14.1 B 15.1 B 15.6 Eastbound Left 75 E 56.5 85 m126 D 48.4 77 m130 D 52.7 53 105 Eastbound Thru/Right 550 A 6.0 60 91 A 8.0 76 m122 A 7.4 50 67 Northbound Thru/Right 825 C 29.1 45 93 C 28.0 30 73 C 27.1 18 54 Southbound Left/Thru 25 B 10.8 14 m21 A 9.3 12 15 B 11.9 10 13
12 N Nash Street and Key Boulevard Overall Intersection (Unsignalized) A 4.5 A 4.9 A 3.4 Eastbound Left/Thru 135 A 8.6 ‐‐ 18 A 8.9 ‐‐ 5 A 7.9 ‐‐ 3 Westbound Thru/Right 65 A 0.0 ‐‐ 0 A 0.0 ‐‐ 0 A 0.0 ‐‐ 0
Southbound Left/Right 650 D 30.7 ‐‐ 48 C 21.1 ‐‐ 58 B 11.5 ‐‐ 15
13 N Nash Street (east) and Key Boulevard Overall Intersection (Unsignalized) F 189.0 F 61.3 A 4.2 Eastbound Left 65 F 738.5 ‐‐ 933 F 414.1 ‐‐ 408 C 16.6 ‐‐ 28 Eastbound Thru/Right 65 D 25.9 ‐‐ 75 C 17.0 ‐‐ 28 B 11.2 ‐‐ 5 Westbound Left/Thru/Right 25 A 0.0 ‐‐ 0 D 29.0 ‐‐ 5 B 13.3 ‐‐ 0
Traffic Impact Study and Transportation Management Plan – West Rosslyn Gorove/Slade Associates
March 29, 2016 39
Intersection (Movement)
Storage Length
Future Without Development (2019)
AM Peak PM Peak Saturday Peak
LOS Delay Queue
LOS Delay Queue
LOS Delay Queue
50th 95th 50th 95th 50th 95th Northbound Left/Thru 400 A 9.5 ‐‐ 8 A 9.2 ‐‐ 18 A 8.0 ‐‐ 5 Northbound Thru/Right 400 A 0.4 ‐‐ 0 A 0.6 ‐‐ 0 A 0.1 ‐‐ 0 Southbound Left/Thru 150 A 9.0 ‐‐ 0 A 9.0 ‐‐ 0 A 7.8 ‐‐ 0 Southbound Right 150 A 0.0 ‐‐ 0 A 0.0 ‐‐ 0 A 0.0 ‐‐ 0
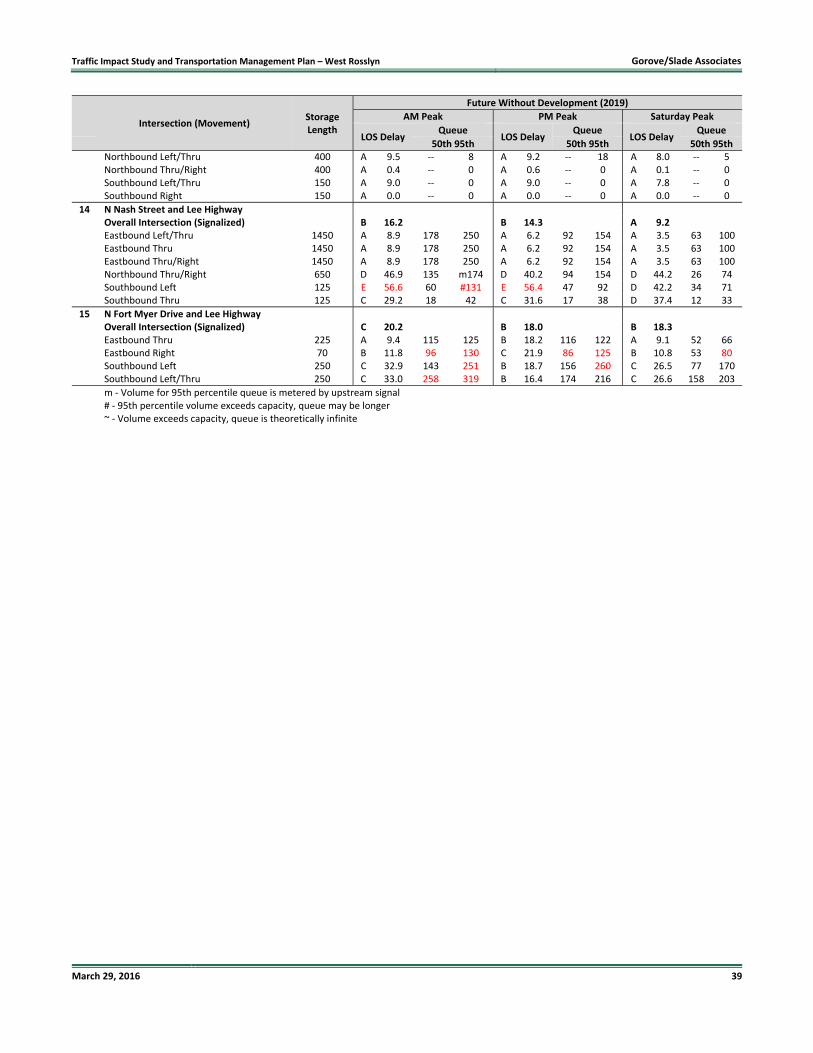
14 N Nash Street and Lee Highway Overall Intersection (Signalized) B 16.2 B 14.3 A 9.2 Eastbound Left/Thru 1450 A 8.9 178 250 A 6.2 92 154 A 3.5 63 100 Eastbound Thru 1450 A 8.9 178 250 A 6.2 92 154 A 3.5 63 100 Eastbound Thru/Right 1450 A 8.9 178 250 A 6.2 92 154 A 3.5 63 100 Northbound Thru/Right 650 D 46.9 135 m174 D 40.2 94 154 D 44.2 26 74 Southbound Left 125 E 56.6 60 #131 E 56.4 47 92 D 42.2 34 71 Southbound Thru 125 C 29.2 18 42 C 31.6 17 38 D 37.4 12 33
15 N Fort Myer Drive and Lee Highway Overall Intersection (Signalized) C 20.2 B 18.0 B 18.3 Eastbound Thru 225 A 9.4 115 125 B 18.2 116 122 A 9.1 52 66 Eastbound Right 70 B 11.8 96 130 C 21.9 86 125 B 10.8 53 80 Southbound Left 250 C 32.9 143 251 B 18.7 156 260 C 26.5 77 170
Southbound Left/Thru 250 C 33.0 258 319 B 16.4 174 216 C 26.6 158 203 m ‐ Volume for 95th percentile queue is metered by upstream signal
# ‐ 95th percentile volume exceeds capacity, queue may be longer ~ ‐ Volume exceeds capacity, queue is theoretically infinite
Traffic Impact Study and Transportation Management Plan – West Rosslyn Gorove/Slade Associates
January 11, 2017 40
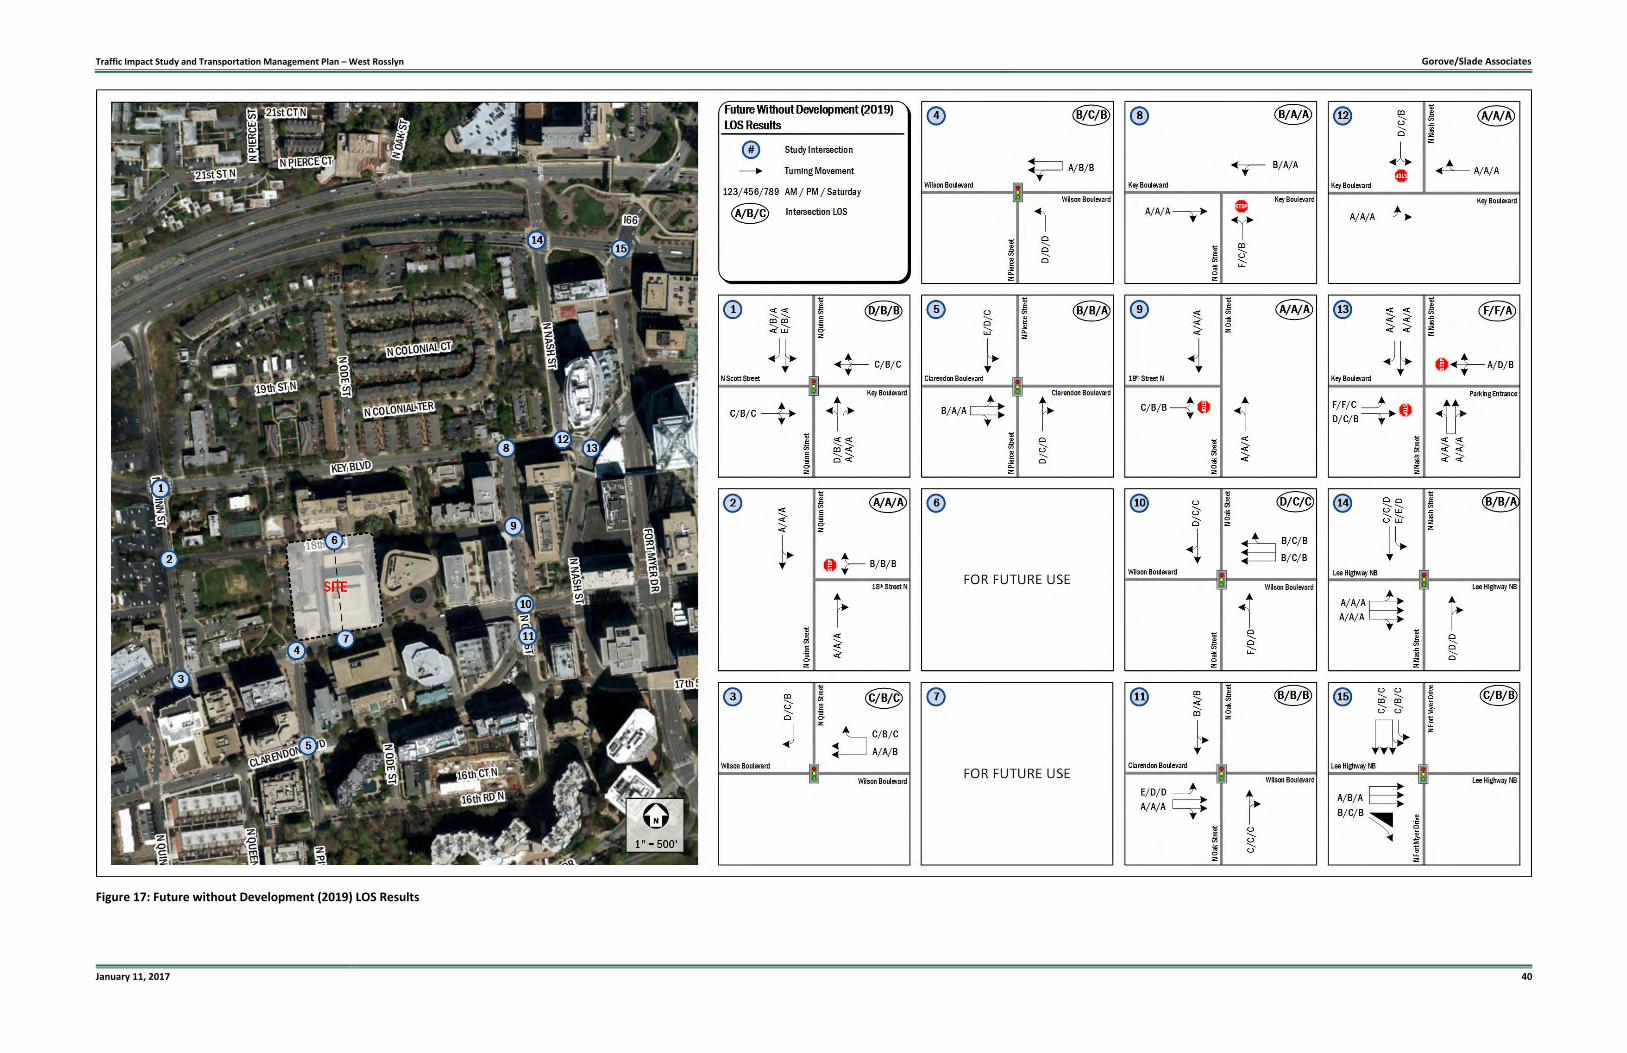
Figure 17: Future without Development (2019) LOS Results
Traffic Impact Study and Transportation Management Plan – West Rosslyn Gorove/Slade Associates
January 11, 2017 41
FUTURE CONDITIONS WITH DEVELOPMENT (2019)
The proposed development will consist of approximately 700 residential units, 400,000 square feet of office space, 22,000
square feet of retail, 20,000 square feet of grocery space, a 25,000 square foot reconstruction of Rosslyn Highlands Park, and
a redevelopment of the existing fire station. The existing 50,000 square feet office building, existing fire station, and City Park
will be replaced by the proposed development.
Site Access
The proposed site is located between 18th Street N and Wilson Boulevard, with the western border of the site near the
northern terminus of N Pierce Street. The site location is shown in Figure 1. The proposed site plan for the redevelopment is
shown in Figure 5.
Entry to the site on the new street will be accessible from Wilson Boulevard (traveling westbound) and 18th Street N (traveling
westbound and eastbound). The proposed western parcel site driveway off the new street will provide direct access to the
parking garage as shown on Figure 6. Loading access will be provided to the eastern parcel off of 18th Street N, with western
parcel loading available off the new street. The relocation of the fire station to the southeast corner of the site will include a
driveway from 18th Street N, in addition to the front entrance along Wilson Boulevard. The roadway configuration for the
future with development scenario is shown in Figure 18.
Site Generated Traffic
The Institute of Transportation Engineers (ITE) Trip Generation, 9th Edition, was used to determine the future trips generated
by the proposed development.
The site has multiple bus stops surrounding the site and a Metro stations within one‐half mile of the site. It is expected that
a significant portion of those accessing the site will travel by Metrorail, bus, cab, or on foot/by bicycle during the peak hours,
rather than by personal vehicle. Based on data from Table S‐3 and Table S‐4 of the WMATA Development‐Related Ridership
Survey (WMATA, 2005), the Arlington County Commercial Building Research Topline Report, and the Arlington County
Residential Building Transportation Performance Monitoring study, a TDM/transit mode split reduction of 60% for residential,
40% for office, and 50% of retail was applied to the peak hour vehicular trip generation for the residential land use to reflect
the non‐auto modes for the proposed development. The retail space planned for the site is envisioned to be primarily
neighborhood‐serving retail site, justifying the 50% TDM/transit mode split reduction assumed. Table 6 shows the vehicular
trips expected to be generated by the proposed project.
Driveway counts were taken at the existing office building, park, and fire station driveways to determine trip generation for
the existing uses. The existing office park generated 184 AM peak hour trips, 130 PM peak hour trips, and 26 Saturday peak
hour trips. The existing fire station generated 5 AM peak hour trips, 9 PM peak hour trips, and 8 Saturday peak hour trips.
The park indicated no peak hour trip generation.

Traffic Impact Study and Transportation Management Plan – West Rosslyn Gorove/Slade Associates
January 11, 2017 42
Figure 18: Future with Development (2019) Local Roadway Network
Traffic Impact Study and Transportation Management Plan – West Rosslyn Gorove/Slade Associates
January 11, 2017 43
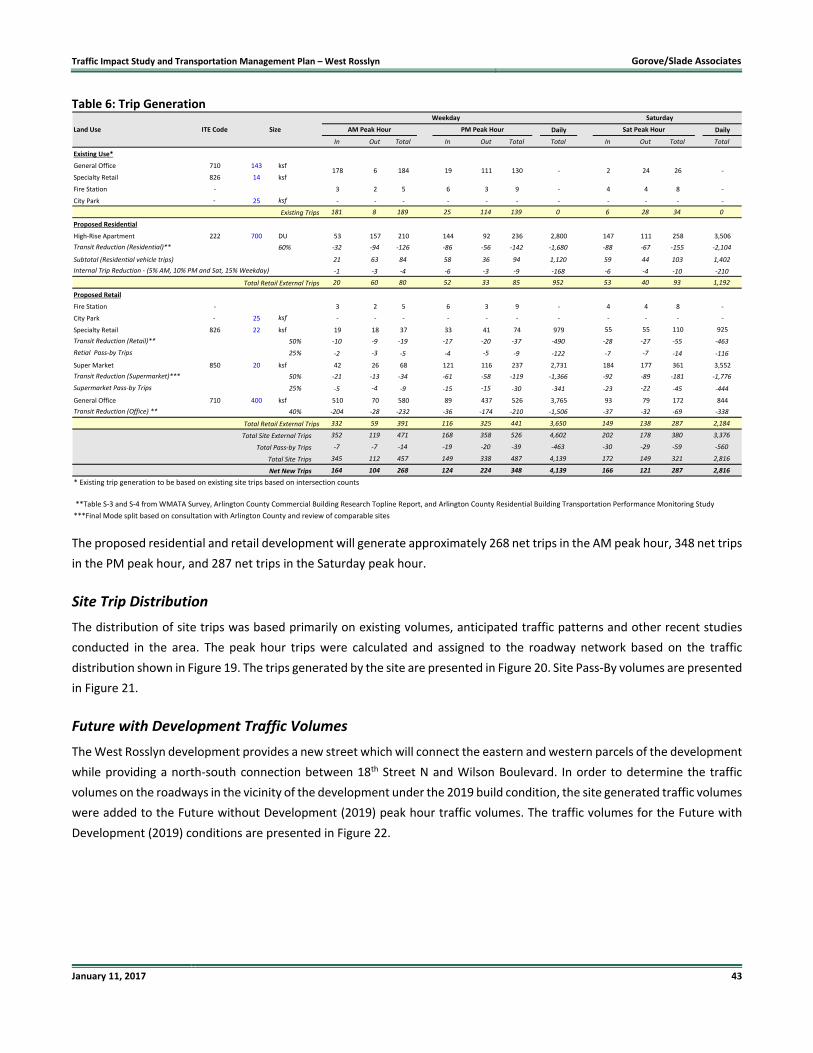
Table 6: Trip Generation
The proposed residential and retail development will generate approximately 268 net trips in the AM peak hour, 348 net trips
in the PM peak hour, and 287 net trips in the Saturday peak hour.
Site Trip Distribution
The distribution of site trips was based primarily on existing volumes, anticipated traffic patterns and other recent studies
conducted in the area. The peak hour trips were calculated and assigned to the roadway network based on the traffic
distribution shown in Figure 19. The trips generated by the site are presented in Figure 20. Site Pass‐By volumes are presented
in Figure 21.
Future with Development Traffic Volumes
The West Rosslyn development provides a new street which will connect the eastern and western parcels of the development
while providing a north‐south connection between 18th Street N and Wilson Boulevard. In order to determine the traffic
volumes on the roadways in the vicinity of the development under the 2019 build condition, the site generated traffic volumes
were added to the Future without Development (2019) peak hour traffic volumes. The traffic volumes for the Future with
Development (2019) conditions are presented in Figure 22.
Daily Daily
In Out Total In Out Total Total In Out Total Total
Existing Use*
General Office 710 143 ksf
Specialty Retail 826 14 ksf
Fire Station ‐ 3 2 5 6 3 9 ‐ 4 4 8 ‐
City Park ‐ 25 ksf ‐ ‐ ‐ ‐ ‐ ‐ ‐ ‐ ‐ ‐ ‐
181 8 189 25 114 139 0 6 28 34 0
Proposed Residential
High‐Rise Apartment 222 700 DU # 53 1 157 210 1 144 0 92 236 2,800 1 147 0 111 258 3,506
60% ‐32 ‐94 ‐126 ‐86 ‐56 ‐142 ‐1,680 ‐88 ‐67 ‐155 ‐2,104
21 63 84 58 36 94 1,120 59 44 103 1,402
‐1 ‐3 ‐4 ‐6 ‐3 ‐9 ‐168 ‐6 ‐4 ‐10 ‐210
20 60 80 52 33 85 952 53 40 93 1,192
Proposed Retail
Fire Station ‐ 3 2 5 6 3 9 ‐ 4 4 8 ‐
City Park ‐ 25 ksf ‐ ‐ ‐ ‐ ‐ ‐ ‐ ‐ ‐ ‐ ‐
Specialty Retail 826 22 ksf # 19 1 18 37 0 33 1 41 74 979 1 55 55 110 925
50% ‐10 ‐9 ‐19 ‐17 ‐20 ‐37 ‐490 ‐28 ‐27 ‐55 ‐463
25% ‐2 ‐3 ‐5 ‐4 ‐5 ‐9 ‐122 ‐7 ‐7 ‐14 ‐116
Super Market 850 20 ksf # 42 0 26 68 1 121 0 116 237 2,731 1 184 0 177 361 3,552
50% ‐21 ‐13 ‐34 ‐61 ‐58 ‐119 ‐1,366 ‐92 ‐89 ‐181 ‐1,776
25% ‐5 ‐4 ‐9 ‐15 ‐15 ‐30 ‐341 ‐23 ‐22 ‐45 ‐444
General Office 710 400 ksf # 510 0 70 580 0 89 1 437 526 3,765 1 93 0 79 172 844
40% ‐204 ‐28 ‐232 ‐36 ‐174 ‐210 ‐1,506 ‐37 ‐32 ‐69 ‐338
332 59 391 116 325 441 3,650 149 138 287 2,184
352 119 471 168 358 526 4,602 202 178 380 3,376
‐7 ‐7 ‐14 ‐19 ‐20 ‐39 ‐463 ‐30 ‐29 ‐59 ‐560
345 112 457 149 338 487 4,139 172 149 321 2,816
164 104 268 124 224 348 4,139 166 121 287 2,816
* Existing trip generation to be based on existing site trips based on intersection counts
178 6 ‐26242‐13011119184
Land Use ITE Code Size
Weekday Saturday
AM Peak Hour PM Peak Hour Sat Peak Hour
Total Site External Trips
Existing Trips
Transit Reduction (Residential)**
Subtotal (Residential vehicle trips)
Internal Trip Reduction ‐ (5% AM, 10% PM and Sat, 15% Weekday)
Total Retail External Trips
Transit Reduction (Retail)**
Retial Pass‐by Trips
Transit Reduction (Supermarket)***
Supermarket Pass‐by Trips
Transit Reduction (Office) **
Total Retail External Trips
Total Pass‐by Trips
Total Site Trips
Net New Trips
**Table S‐3 and S‐4 from WMATA Survey, Arlington County Commercial Building Research Topline Report, and Arlington County Residential Building Transportation Performance Monitoring Study
***Final Mode split based on consultation with Arlington County and review of comparable sites
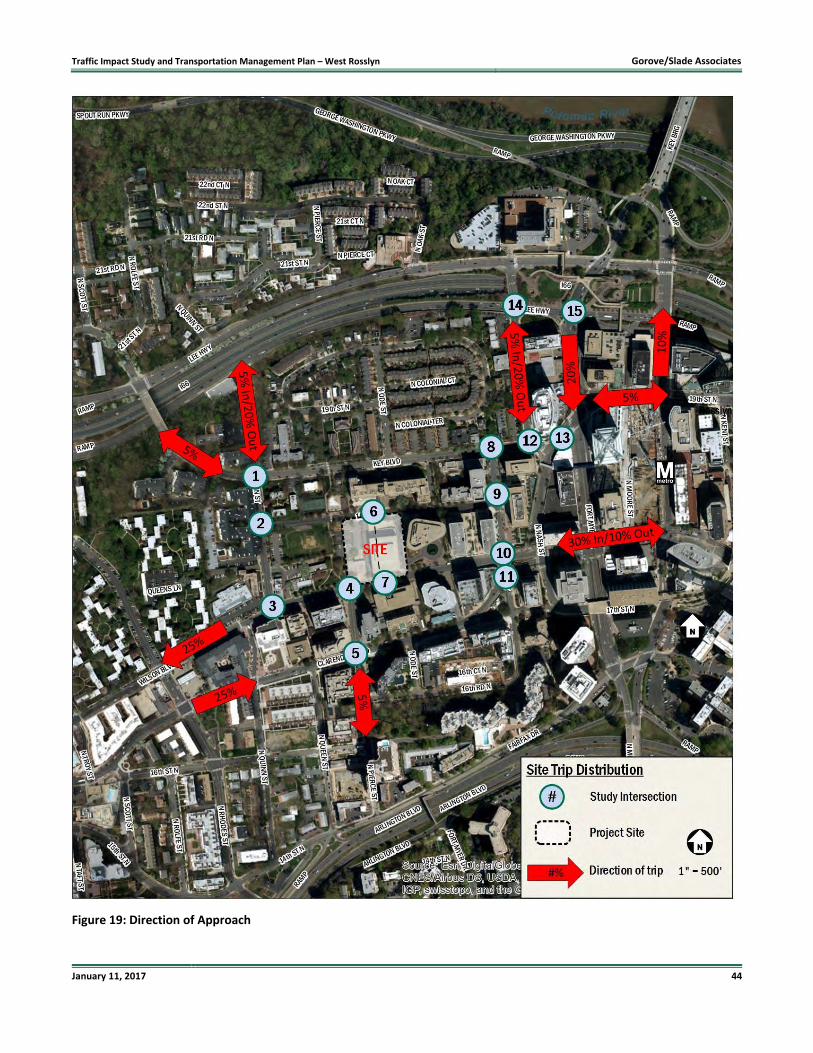
Traffic Impact Study and Transportation Management Plan – West Rosslyn Gorove/Slade Associates
January 11, 2017 44
Figure 19: Direction of Approach
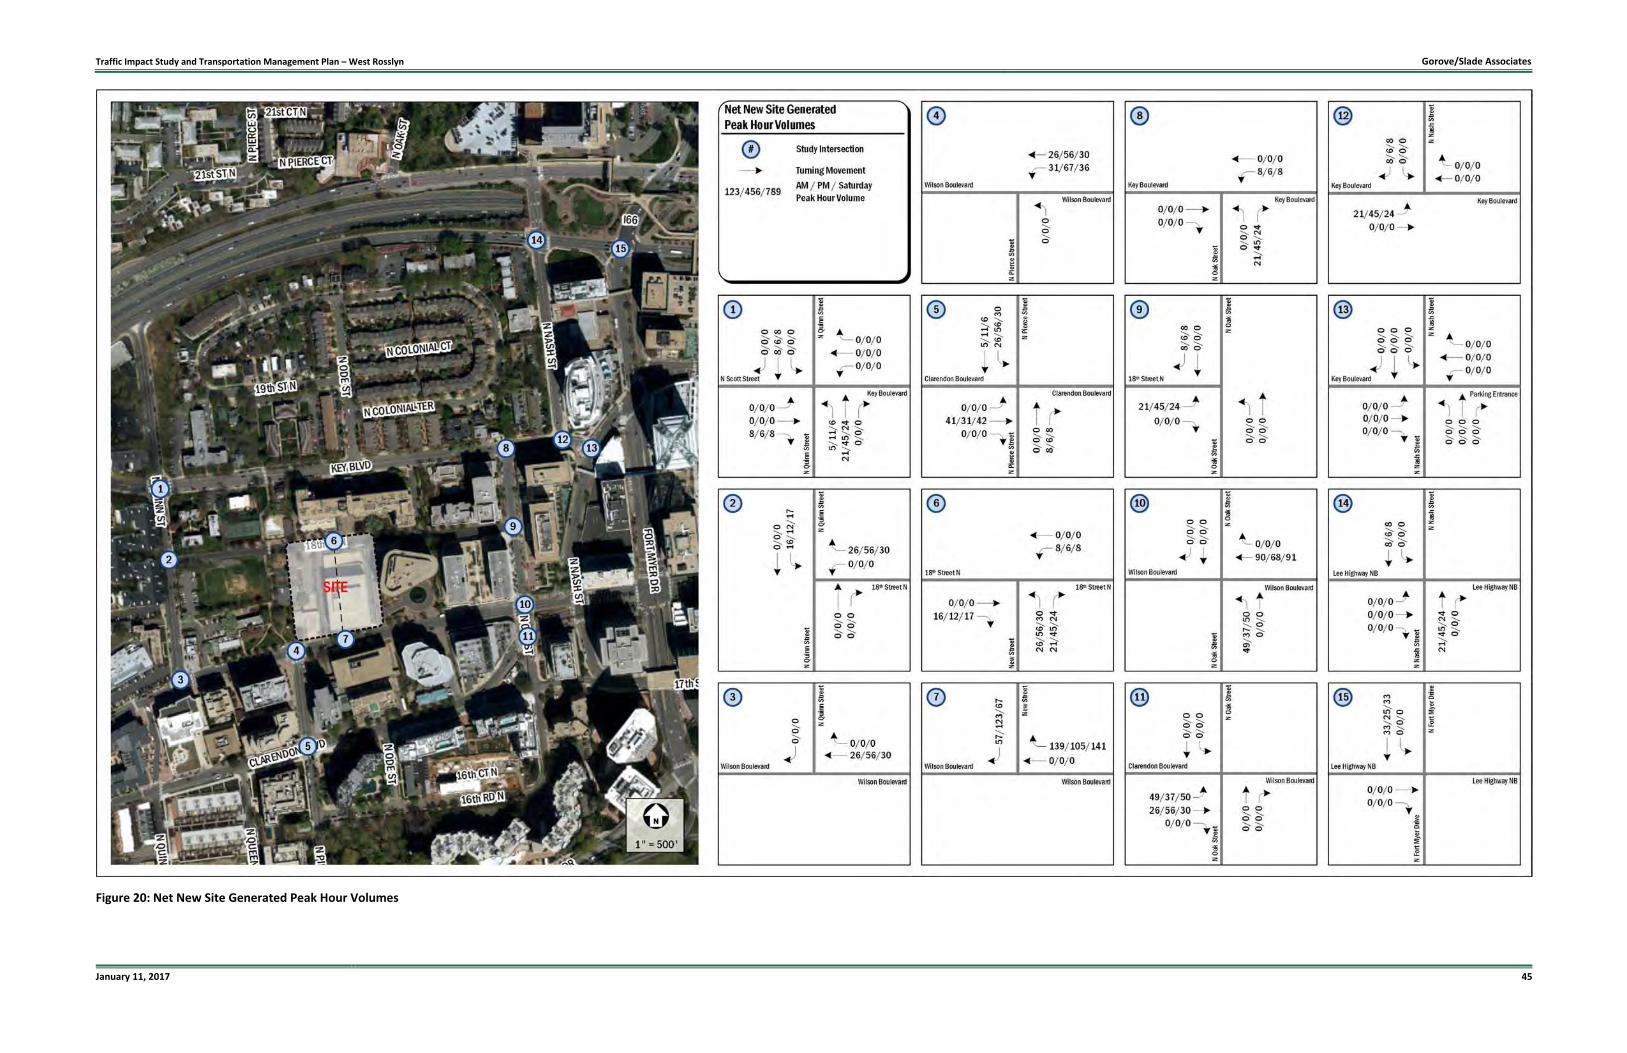
Traffic Impact Study and Transportation Management Plan – West Rosslyn Gorove/Slade Associates
January 11, 2017 45
Figure 20: Net New Site Generated Peak Hour Volumes
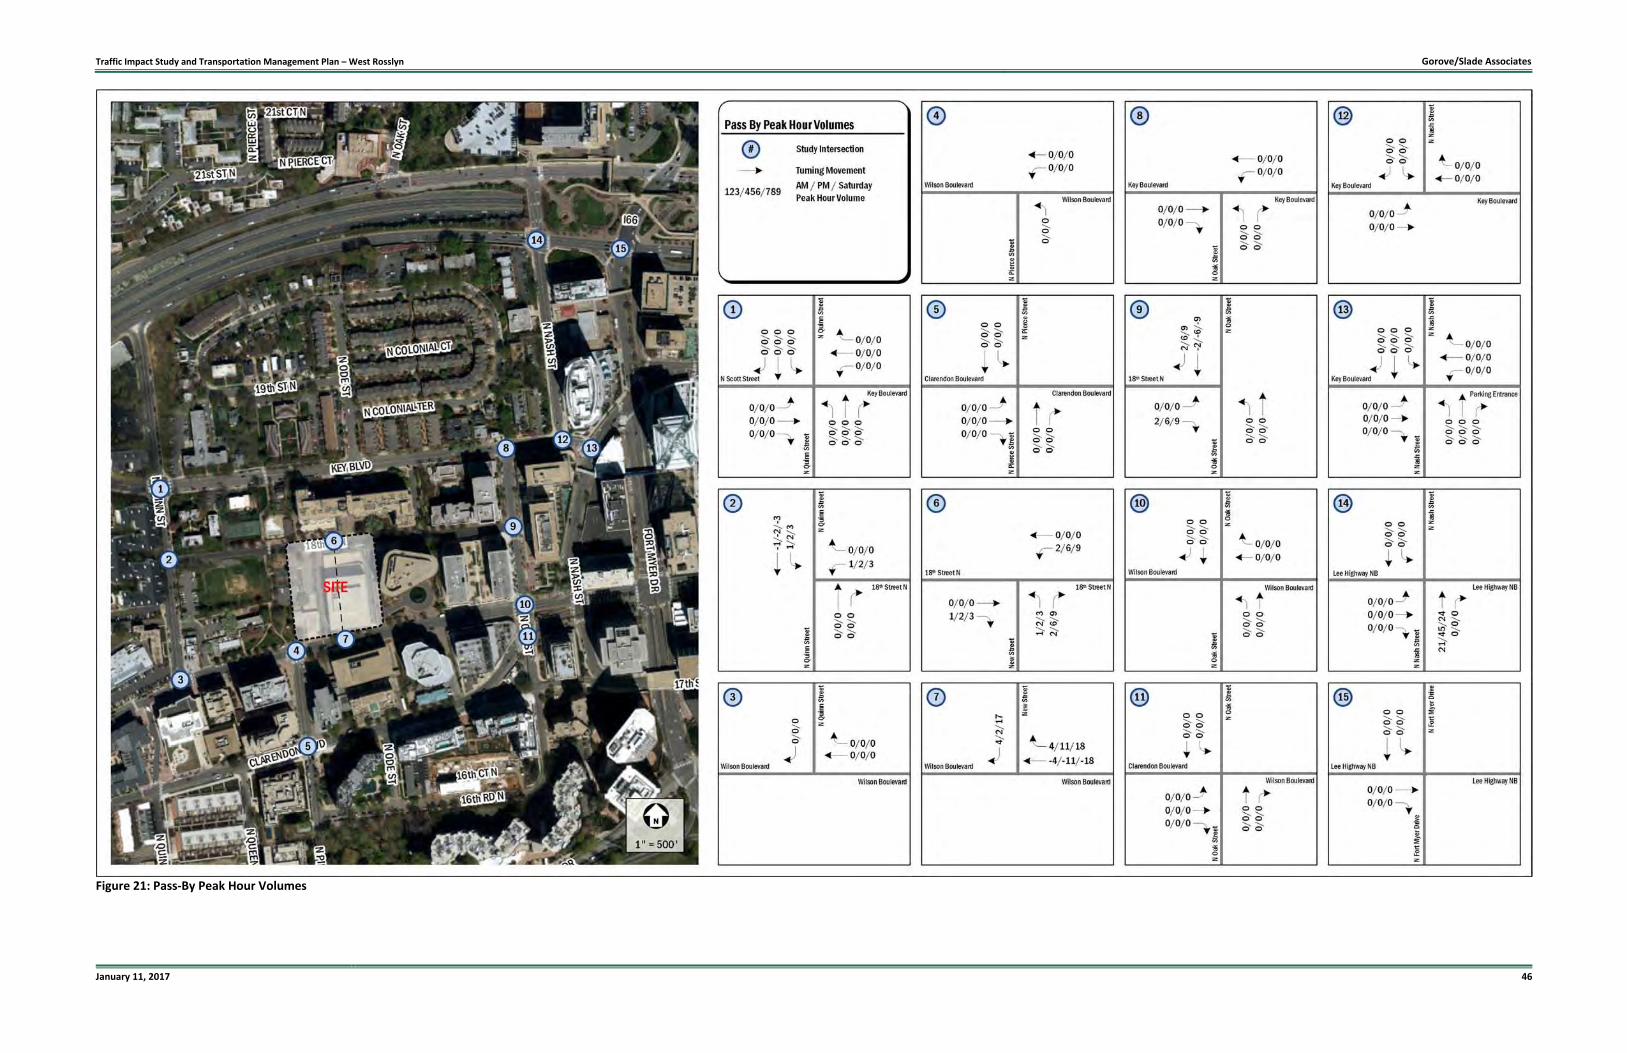
Traffic Impact Study and Transportation Management Plan – West Rosslyn Gorove/Slade Associates
January 11, 2017 46
Figure 21: Pass‐By Peak Hour Volumes
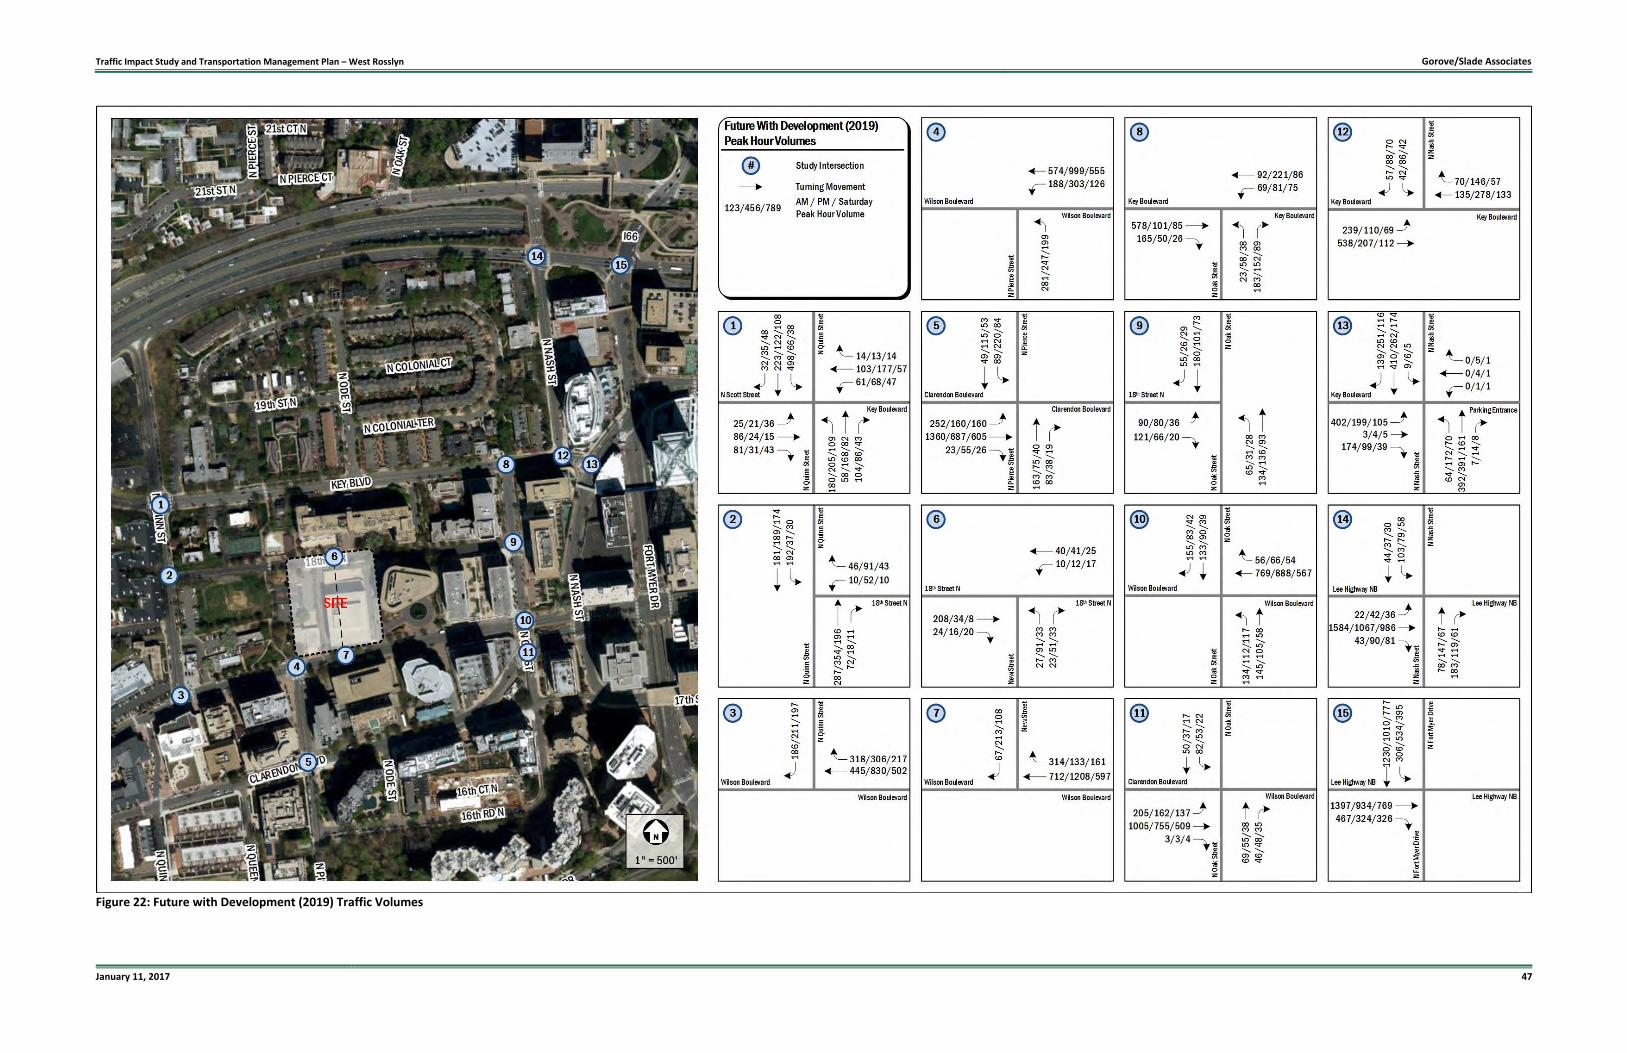
Traffic Impact Study and Transportation Management Plan – West Rosslyn Gorove/Slade Associates
January 11, 2017 47
Figure 22: Future with Development (2019) Traffic Volumes
Traffic Impact Study and Transportation Management Plan – West Rosslyn Gorove/Slade Associates
January 11, 2017 48
Future with Development Capacity Analysis
Capacity analyses were performed at the intersections within the study area during the weekday AM, weekday PM, and
Saturday peak hours, for the future conditions with development scenario. Synchro, Version 9.1 was used to analyze the study
intersections based on the Highway Capacity Manual (HCM) methodology and include level of service, delay, and queue
length comparisons for the turning movements analyzed. As previously described, a peak hour factor of 0.92 to 1.00 was used
in the analysis of the future traffic conditions, consistent with VDOT practice.
The results of the intersection capacity analysis are presented in Table 7 and are expressed in level of service (LOS) and delay
(seconds per vehicle) per lane group as shown in Figure 22. The 95% and 50% queue results for each intersection are also
presented in Table 7, and are expressed in feet. The detailed analysis worksheets are included in Appendix F.
For the purpose of this analysis, it is desirable to achieve a level of service (LOS) of D or better for each lane group at the
intersections. All movements at the study intersections operate at acceptable levels of service consistent with the Future
without Development scenario, with the exception of the following:
N Quinn Street and Key Boulevard (AM peak hour)
Southbound left/thru lanes (AM peak hour)
N Pierce Street and Clarendon Boulevard
Southbound left/thru lane (PM peak hour)
N Oak Street and Wilson Boulevard (AM peak hour)
Northbound left/thru lane (PM and Saturday peak hour)
N Oak Street and Clarendon Boulevard
Eastbound left lane (PM peak hour)
All movements caused to operate below acceptable LOS thresholds by the proposed development have been mitigated with
signal timing adjustments. These results are shaded and included in Table 7. The intersection of N Nash Street (east) and Key
Boulevard currently operates below acceptable LOS thresholds. Historical counts and a field visit indicate vehicles are getting
off Lee Highway at Quinn Street and using Key Boulevard as a cut‐through to Rosslyn. Analysis of a signalized intersection has
been included in Table 7 and a signal warrant analysis is included in later in the report.

Traffic Impact Study and Transportation Management Plan – West Rosslyn Gorove/Slade Associates
January 11, 2017 49
Table 7: Future with Development (2019) Capacity Results
Intersection (Movement)
Storage Length
Future With Development (2019)
AM Peak PM Peak Saturday Peak
LOS Delay Queue
LOS Delay Queue
LOS Delay Queue
50th 95th 50th 95th 50th 95th
1 N Quinn Street and Key Boulevard Overall Intersection (Signalized) E 63.1 B 19.5 B 13.5 Eastbound Left/Thru/Right 500 C 31.7 80 149 B 15.8 16 44 C 26.9 25 65 Westbound Left/Thru/Right 315 C 34.8 92 163 B 19.6 106 172 C 28.8 55 105 Northbound Left/Thru 200 E 68.5 150 #311 C 22.8 143 275 A 5.5 37 44 Northbound Right 50 A 1.9 0 6 A 9.4 4 m29 A 1.8 0 m2 Southbound Left/Thru 525 F 87.9 ~515 #735 B 19.5 76 132 A 8.5 37 65 Southbound Right 75 A 7.6 0 10 B 15.0 0 16 A 7.7 0 14
1 N Quinn Street and Key Boulevard (Mitigated) Overall Intersection (Signalized) D 41.8 ‐ ‐ ‐ ‐ ‐ ‐ ‐ ‐ Eastbound Left/Thru/Right 500 D 40.1 89 163 ‐ ‐ ‐ ‐ ‐ ‐ ‐ ‐ Westbound Left/Thru/Right 315 D 53.3 98 #211 ‐ ‐ ‐ ‐ ‐ ‐ ‐ ‐ Northbound Left/Thru 200 C 23.9 95 #266 ‐ ‐ ‐ ‐ ‐ ‐ ‐ ‐ Northbound Right 50 A 1.3 0 4 ‐ ‐ ‐ ‐ ‐ ‐ ‐ ‐ Southbound Left/Thru 525 D 52.9 ~432 #696 ‐ ‐ ‐ ‐ ‐ ‐ ‐ ‐ Southbound Right 75 A 5.7 0 8 ‐ ‐ ‐ ‐ ‐ ‐ ‐ ‐
2 N Quinn Street and 18th Street N Overall Intersection (Unsignalized) A 3.2 A 3.4 A 1.8 Westbound Left/Right 315 B 14.0 ‐‐ 13 C 15.1 ‐‐ 23 B 10.8 ‐‐ 8 Northbound Thru/Right 375 A 0.0 ‐‐ 0 A 0.0 ‐‐ 0 A 0.0 ‐‐ 0 Southbound Left/Thru 200 A 8.9 ‐‐ 18 A 8.3 ‐‐ 3 A 7.8 ‐‐ 3
3 N Quinn Street and Wilson Boulevard Overall Intersection (Signalized) C 21.8 B 11.5 C 20.5 Westbound Thru 325 A 9.3 58 81 A 7.8 101 101 C 20.3 146 135 Westbound Right 85 C 27.3 25 m47 A 7.8 7 11 C 27.4 14 26 Southbound Right 375 D 42.3 15 m24 C 31.9 85 159 B 13.4 80 139
4 N Pierce Street and Wilson Boulevard Overall Intersection (Signalized) B 15.9 C 20.3 B 18.4 Westbound Left/Thru 675 A 6.2 91 m108 B 16.8 341 452 B 12.6 156 220 Northbound Left 250 D 43.0 159 m217 D 37.4 129 206 D 38.4 119 185
5 N Pierce Street and Clarendon Boulevard Overall Intersection (Signalized) C 21.4 C 27.7 B 10.1 Eastbound Left/Thru 500 B 15.3 387 511 B 10.9 145 192 A 5.5 84 146 Eastbound Thru/Right 500 B 15.3 387 511 B 10.9 145 192 A 5.5 84 146 Northbound Thru/Right 185 D 36.0 120 201 C 25.6 42 87 C 32.6 21 52 Southbound Left/Thru 250 E 67.2 69 #191 E 72.7 ~228 #389 C 26.8 30 57
5 N Pierce Street and Clarendon Boulevard (Mitigated) Overall Intersection (Signalized) ‐ ‐ ‐ ‐ C 22.7 ‐ ‐ ‐ ‐ Eastbound Left/Thru 500 ‐ ‐ ‐ ‐ B 12.1 155 205 ‐ ‐ ‐ ‐ Eastbound Thru/Right 500 ‐ ‐ ‐ ‐ B 12.1 155 205 ‐ ‐ ‐ ‐ Northbound Thru/Right 185 ‐ ‐ ‐ ‐ C 24.1 40 83 ‐ ‐ ‐ ‐ Southbound Left/Thru 250 ‐ ‐ ‐ ‐ D 50.1 166 #371 ‐ ‐ ‐ ‐
6 New Street and 18th Street N Overall Intersection (Unsignalized) A 1.8 A 6.0 A 5.3 Eastbound Thru/Right A 0.0 ‐‐ 0 A 0.0 ‐‐ 0 A 0.0 ‐‐ 0 Westbound Left/Thru A 7.8 ‐‐ 0 A 7.3 ‐‐ 0 A 7.3 ‐‐ 0 Northbound Left/Right B 10.3 ‐‐ 5 A 9.7 ‐‐ 13 A 9.0 ‐‐ 5
7 New Street and Wilson Boulevard Overall Intersection (Unsignalized) A 0.9 A 4.2 A 1.6 Westbound Thru/Right A 0.0 ‐‐ 0 A 0.0 ‐‐ 0 A 0.0 ‐‐ 0 Southbound Right B 14.0 ‐‐ 13 D 30.3 ‐‐ 140 B 12.6 ‐‐ 18
8 N Oak Street and Key Boulevard Overall Intersection (Unsignalized) C 20.1 A 7.0 A 5.1 Eastbound Thru/Right 285 A 0.0 ‐‐ 0 A 0.0 ‐‐ 0 A 0.0 ‐‐ 0 Westbound Left/Thru 150 B 11.8 ‐‐ 10 A 8.4 ‐‐ 5 A 7.8 ‐‐ 5 Northbound Left/Right 200 F 104.6 ‐‐ 230 C 19.0 ‐‐ 63 B 11.6 ‐‐ 18
9 N Oak Street and 18th Street N Overall Intersection (Unsignalized) A 6.3 A 4.7 A 2.9 Eastbound Left/Right 850 C 16.7 ‐‐ 53 B 12.5 ‐‐ 25 B 10.5 ‐‐ 8 Northbound Left/Thru 200 A 8.2 ‐‐ 5 A 7.8 ‐‐ 3 A 7.7 ‐‐ 3
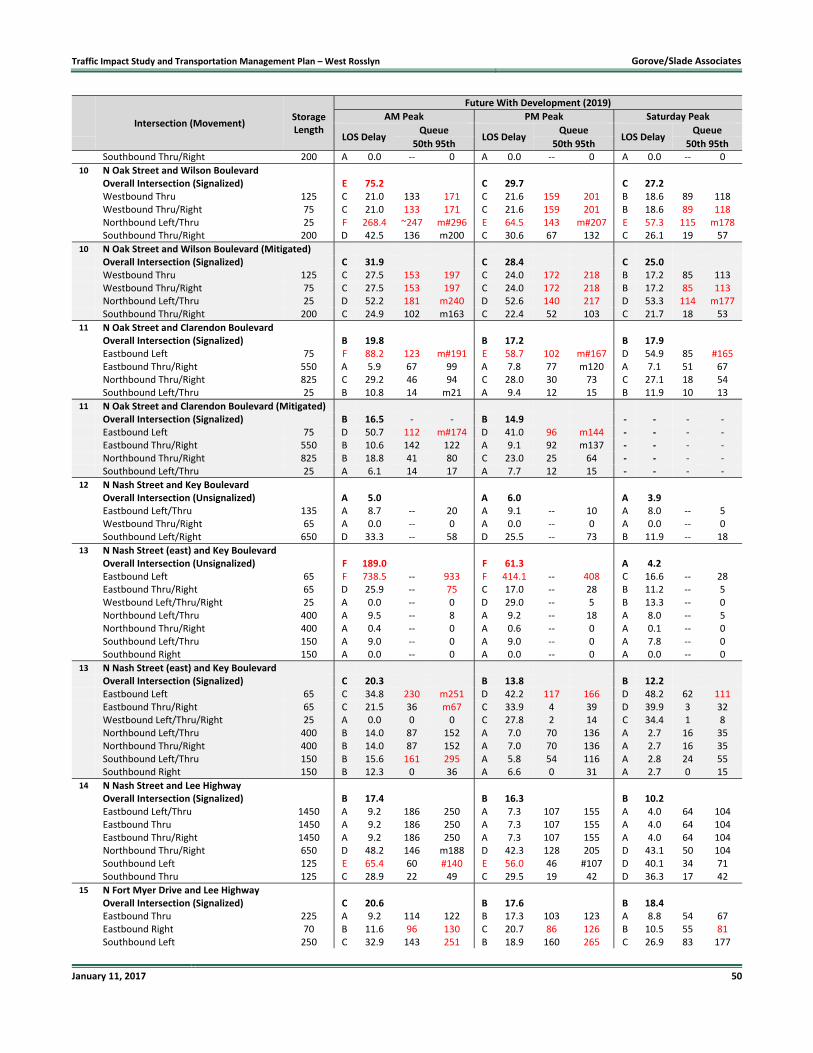
Traffic Impact Study and Transportation Management Plan – West Rosslyn Gorove/Slade Associates
January 11, 2017 50
Intersection (Movement)
Storage Length
Future With Development (2019)
AM Peak PM Peak Saturday Peak
LOS Delay Queue
LOS Delay Queue
LOS Delay Queue
50th 95th 50th 95th 50th 95th Southbound Thru/Right 200 A 0.0 ‐‐ 0 A 0.0 ‐‐ 0 A 0.0 ‐‐ 0
10 N Oak Street and Wilson Boulevard Overall Intersection (Signalized) E 75.2 C 29.7 C 27.2 Westbound Thru 125 C 21.0 133 171 C 21.6 159 201 B 18.6 89 118 Westbound Thru/Right 75 C 21.0 133 171 C 21.6 159 201 B 18.6 89 118 Northbound Left/Thru 25 F 268.4 ~247 m#296 E 64.5 143 m#207 E 57.3 115 m178 Southbound Thru/Right 200 D 42.5 136 m200 C 30.6 67 132 C 26.1 19 57
10 N Oak Street and Wilson Boulevard (Mitigated) Overall Intersection (Signalized) C 31.9 C 28.4 C 25.0 Westbound Thru 125 C 27.5 153 197 C 24.0 172 218 B 17.2 85 113 Westbound Thru/Right 75 C 27.5 153 197 C 24.0 172 218 B 17.2 85 113 Northbound Left/Thru 25 D 52.2 181 m240 D 52.6 140 217 D 53.3 114 m177 Southbound Thru/Right 200 C 24.9 102 m163 C 22.4 52 103 C 21.7 18 5311 N Oak Street and Clarendon Boulevard Overall Intersection (Signalized) B 19.8 B 17.2 B 17.9 Eastbound Left 75 F 88.2 123 m#191 E 58.7 102 m#167 D 54.9 85 #165 Eastbound Thru/Right 550 A 5.9 67 99 A 7.8 77 m120 A 7.1 51 67 Northbound Thru/Right 825 C 29.2 46 94 C 28.0 30 73 C 27.1 18 54 Southbound Left/Thru 25 B 10.8 14 m21 A 9.4 12 15 B 11.9 10 13
11 N Oak Street and Clarendon Boulevard (Mitigated) Overall Intersection (Signalized) B 16.5 ‐ ‐ B 14.9 ‐ ‐ ‐ ‐ Eastbound Left 75 D 50.7 112 m#174 D 41.0 96 m144 ‐ ‐ ‐ ‐ Eastbound Thru/Right 550 B 10.6 142 122 A 9.1 92 m137 ‐ ‐ ‐ ‐ Northbound Thru/Right 825 B 18.8 41 80 C 23.0 25 64 ‐ ‐ ‐ ‐ Southbound Left/Thru 25 A 6.1 14 17 A 7.7 12 15 ‐ ‐ ‐ ‐12 N Nash Street and Key Boulevard Overall Intersection (Unsignalized) A 5.0 A 6.0 A 3.9 Eastbound Left/Thru 135 A 8.7 ‐‐ 20 A 9.1 ‐‐ 10 A 8.0 ‐‐ 5 Westbound Thru/Right 65 A 0.0 ‐‐ 0 A 0.0 ‐‐ 0 A 0.0 ‐‐ 0
Southbound Left/Right 650 D 33.3 ‐‐ 58 D 25.5 ‐‐ 73 B 11.9 ‐‐ 1813 N Nash Street (east) and Key Boulevard
Overall Intersection (Unsignalized) F 189.0 F 61.3 A 4.2 Eastbound Left 65 F 738.5 ‐‐ 933 F 414.1 ‐‐ 408 C 16.6 ‐‐ 28 Eastbound Thru/Right 65 D 25.9 ‐‐ 75 C 17.0 ‐‐ 28 B 11.2 ‐‐ 5 Westbound Left/Thru/Right 25 A 0.0 ‐‐ 0 D 29.0 ‐‐ 5 B 13.3 ‐‐ 0 Northbound Left/Thru 400 A 9.5 ‐‐ 8 A 9.2 ‐‐ 18 A 8.0 ‐‐ 5 Northbound Thru/Right 400 A 0.4 ‐‐ 0 A 0.6 ‐‐ 0 A 0.1 ‐‐ 0 Southbound Left/Thru 150 A 9.0 ‐‐ 0 A 9.0 ‐‐ 0 A 7.8 ‐‐ 0 Southbound Right 150 A 0.0 ‐‐ 0 A 0.0 ‐‐ 0 A 0.0 ‐‐ 0
13 N Nash Street (east) and Key Boulevard Overall Intersection (Signalized) C 20.3 B 13.8 B 12.2 Eastbound Left 65 C 34.8 230 m251 D 42.2 117 166 D 48.2 62 111 Eastbound Thru/Right 65 C 21.5 36 m67 C 33.9 4 39 D 39.9 3 32 Westbound Left/Thru/Right 25 A 0.0 0 0 C 27.8 2 14 C 34.4 1 8 Northbound Left/Thru 400 B 14.0 87 152 A 7.0 70 136 A 2.7 16 35 Northbound Thru/Right 400 B 14.0 87 152 A 7.0 70 136 A 2.7 16 35 Southbound Left/Thru 150 B 15.6 161 295 A 5.8 54 116 A 2.8 24 55 Southbound Right 150 B 12.3 0 36 A 6.6 0 31 A 2.7 0 15
14 N Nash Street and Lee Highway Overall Intersection (Signalized) B 17.4 B 16.3 B 10.2 Eastbound Left/Thru 1450 A 9.2 186 250 A 7.3 107 155 A 4.0 64 104 Eastbound Thru 1450 A 9.2 186 250 A 7.3 107 155 A 4.0 64 104 Eastbound Thru/Right 1450 A 9.2 186 250 A 7.3 107 155 A 4.0 64 104 Northbound Thru/Right 650 D 48.2 146 m188 D 42.3 128 205 D 43.1 50 104 Southbound Left 125 E 65.4 60 #140 E 56.0 46 #107 D 40.1 34 71 Southbound Thru 125 C 28.9 22 49 C 29.5 19 42 D 36.3 17 42
15 N Fort Myer Drive and Lee Highway Overall Intersection (Signalized) C 20.6 B 17.6 B 18.4 Eastbound Thru 225 A 9.2 114 122 B 17.3 103 123 A 8.8 54 67 Eastbound Right 70 B 11.6 96 130 C 20.7 86 126 B 10.5 55 81 Southbound Left 250 C 32.9 143 251 B 18.9 160 265 C 26.9 83 177

Traffic Impact Study and Transportation Management Plan – West Rosslyn Gorove/Slade Associates
January 11, 2017 51
Intersection (Movement)
Storage Length
Future With Development (2019)
AM Peak PM Peak Saturday Peak
LOS Delay Queue
LOS Delay Queue
LOS Delay Queue
50th 95th 50th 95th 50th 95th Southbound Left/Thru 250 C 34.0 268 331 B 16.5 178 221 C 26.9 164 210 m ‐ Volume for 95th percentile queue is metered by upstream signal
# ‐ 95th percentile volume exceeds capacity, queue may be longer ~ ‐ Volume exceeds capacity, queue is theoretically infinite
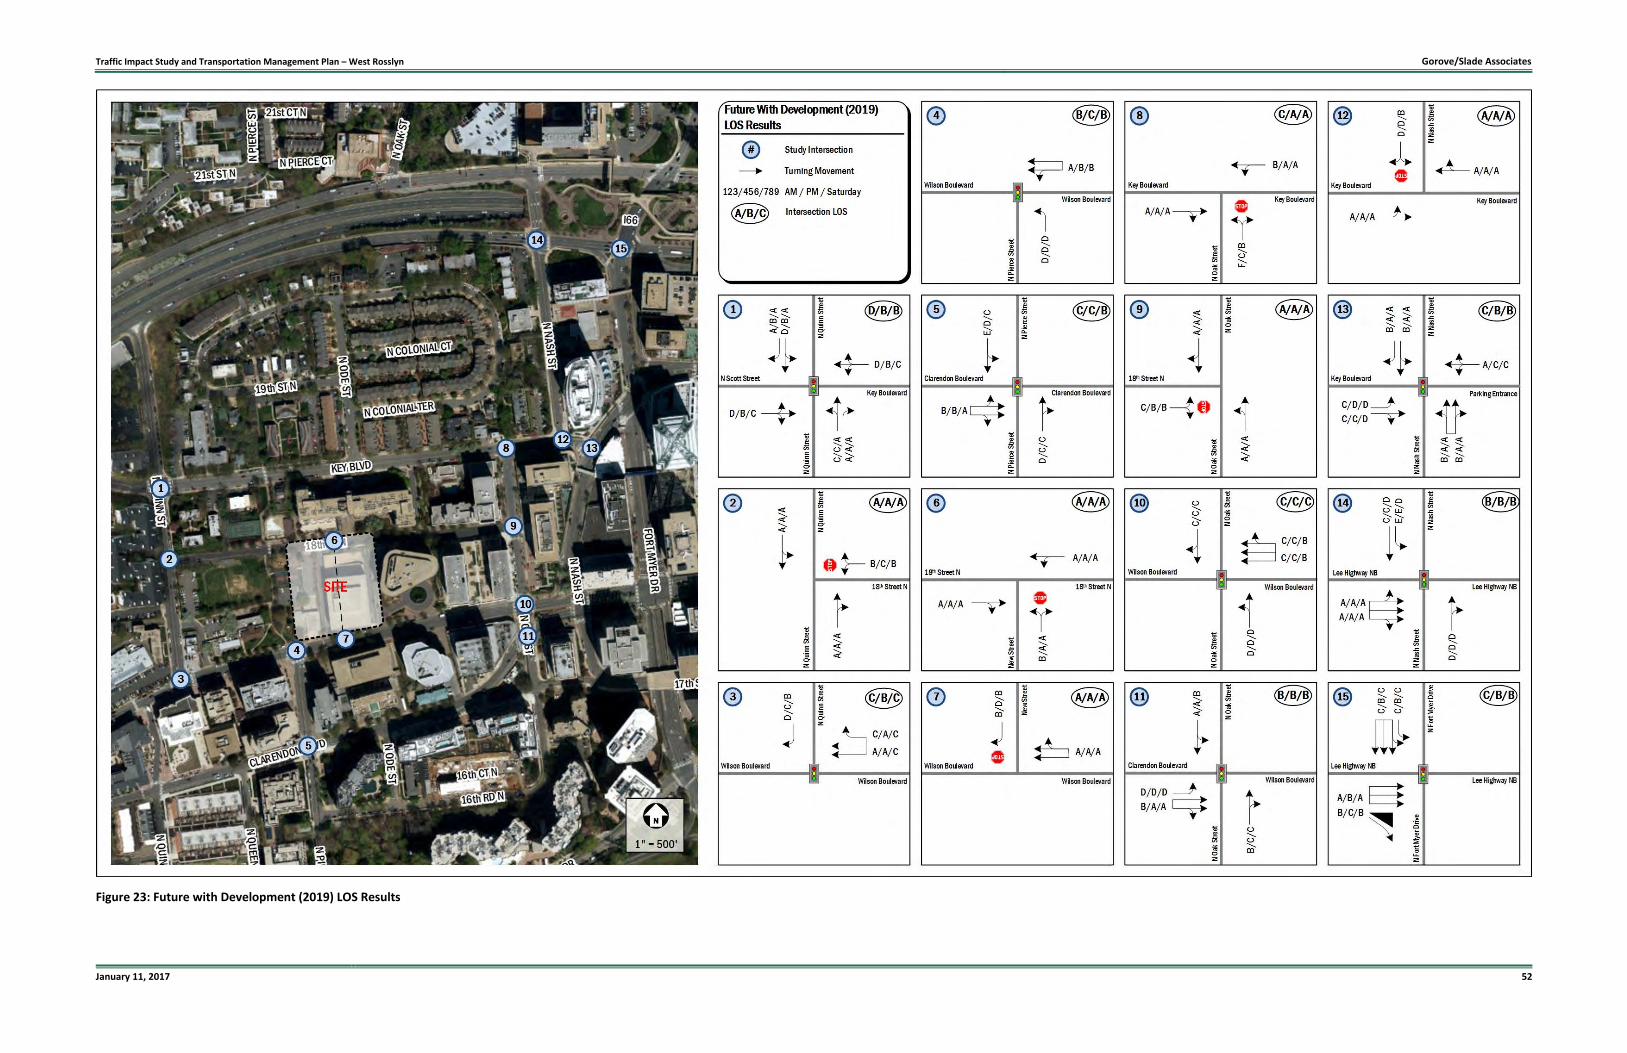
Traffic Impact Study and Transportation Management Plan – West Rosslyn Gorove/Slade Associates
January 11, 2017 52
Figure 23: Future with Development (2019) LOS Results
Traffic Impact Study and Transportation Management Plan – West Rosslyn Gorove/Slade Associates
January 11, 2017 53
FUTURE CONDITIONS WITH DEVELOPMENT (2025)
As requested by VDOT, a future with development scenario for 2025 has been analyzed. A regional growth rate of 0.5%
annually has been applied for 2025 analysis scenario. Additional traffic volumes added to the network from the background
growth are presented in Figure 24. Increase in traffic volumes for the full buildout of the background development projects
identified is shown in Figure 25. Only the Rosslyn Plaza background development will see an increase in site trips from 2019
to 2025.
Future with Development Traffic Volumes
With no definitive changes to the roadway network between 2019 and 2025, there are no considerations for a rerouting of
site trips. In order to determine the traffic volumes on the roadways in the vicinity of the development under the 2025 build
condition, the future with development (2019) roadway volumes were added to the projected background growth and
background development trips. The traffic volumes for the total future with development conditions in 2025 are presented
in Figure 26.

Traffic Impact Study and Transportation Management Plan – West Rosslyn Gorove/Slade Associates
January 11, 2017 54
Figure 24: Background Growth (2025) Traffic Volumes
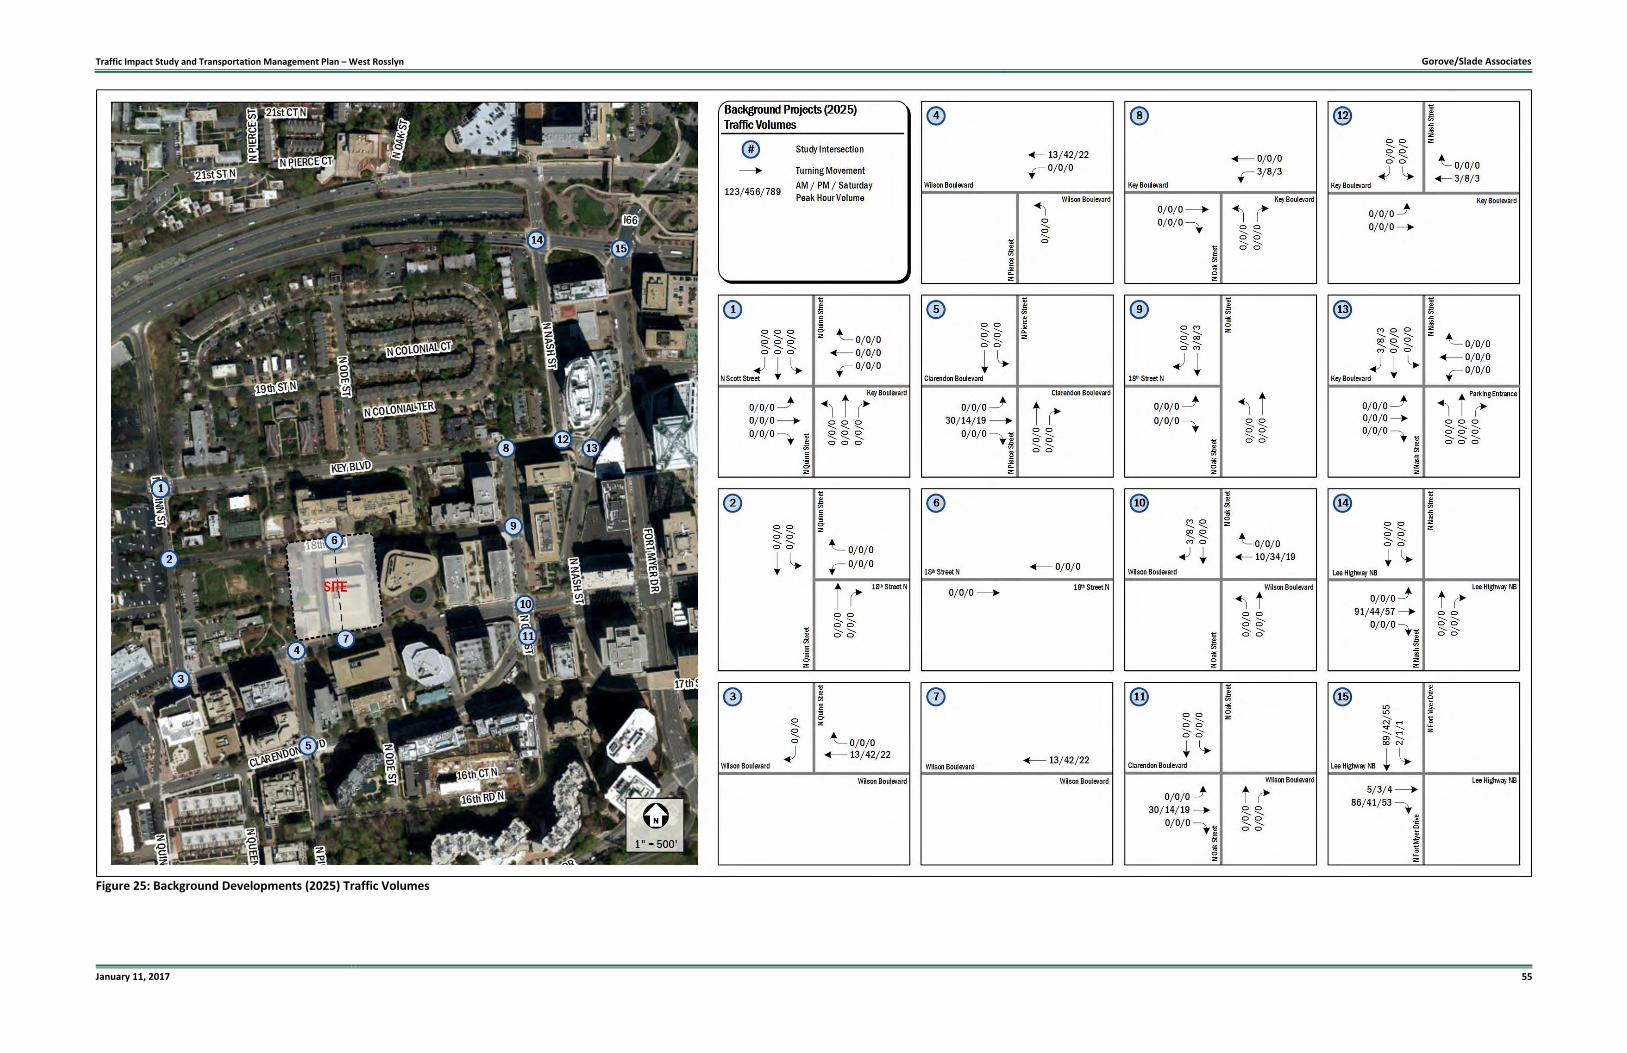
Traffic Impact Study and Transportation Management Plan – West Rosslyn Gorove/Slade Associates
January 11, 2017 55
Figure 25: Background Developments (2025) Traffic Volumes

Traffic Impact Study and Transportation Management Plan – West Rosslyn Gorove/Slade Associates
January 11, 2017 56
Figure 26: Future with Development (2025) Traffic Volumes
Traffic Impact Study and Transportation Management Plan – West Rosslyn Gorove/Slade Associates
January 11, 2017 57
Future with Development Capacity Analysis
Capacity analyses were performed at the intersections within the study area during the weekday AM, weekday PM, and
Saturday peak hours, for the future conditions with development scenario. Synchro, Version 9.1 was used to analyze the
study intersections based on the Highway Capacity Manual (HCM) methodology and include level of service, delay, and queue
length comparisons for the turning movements analyzed. As previously described, a peak hour factor of 0.92 to 1.00 was used
in the analysis of the future traffic conditions, consistent with VDOT practice.
The results of the intersection capacity analysis are presented in Table 8 and are expressed in level of service (LOS) and delay
(seconds per vehicle) per lane group as shown in Figure 27. The 95% and 50% queue results for each intersection are also
presented in Table 8 and are expressed in feet. The detailed analysis worksheets are included in Appendix F.
Under future with development (2025) conditions, all intersection movements within the study area continue to operate
consistent with future with development (2019) results with the exception of the following:
N Quinn Street and Key Boulevard
Westbound left/thru/right lane (AM peak hour)
Southbound left/thru lane (AM peak hour)
Other movements caused to operate below acceptable LOS thresholds by the proposed development in 2019 have been
mitigated with signal timing adjustments. These results are shaded and included in Table 8. Although movements at the
intersection of N Quinn Street and Key Boulevard exceeds County standards, the 2025 analysis was done as a planning
scenario; therefore, no mitigation is proposed at this intersection.
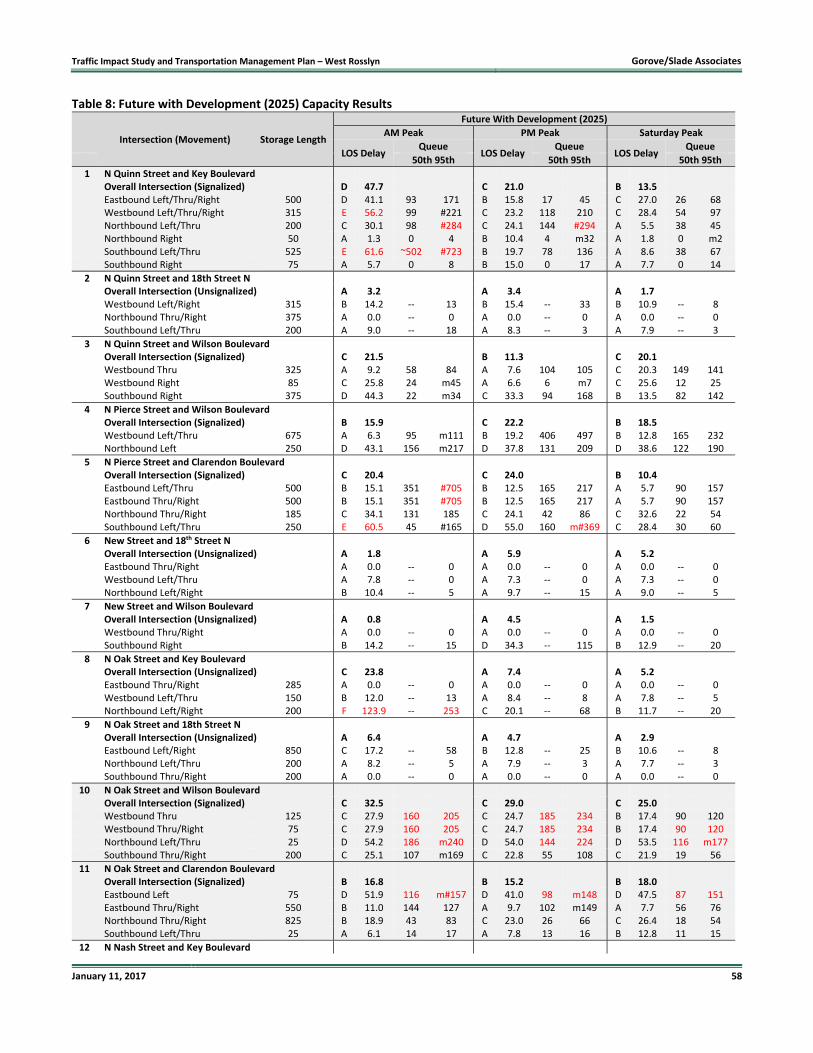
Traffic Impact Study and Transportation Management Plan – West Rosslyn Gorove/Slade Associates
January 11, 2017 58
Table 8: Future with Development (2025) Capacity Results
Intersection (Movement) Storage Length
Future With Development (2025)
AM Peak PM Peak Saturday Peak
LOS Delay Queue
LOS Delay Queue
LOS Delay Queue
50th 95th 50th 95th 50th 95th
1 N Quinn Street and Key Boulevard Overall Intersection (Signalized) D 47.7 C 21.0 B 13.5 Eastbound Left/Thru/Right 500 D 41.1 93 171 B 15.8 17 45 C 27.0 26 68 Westbound Left/Thru/Right 315 E 56.2 99 #221 C 23.2 118 210 C 28.4 54 97 Northbound Left/Thru 200 C 30.1 98 #284 C 24.1 144 #294 A 5.5 38 45 Northbound Right 50 A 1.3 0 4 B 10.4 4 m32 A 1.8 0 m2 Southbound Left/Thru 525 E 61.6 ~502 #723 B 19.7 78 136 A 8.6 38 67 Southbound Right 75 A 5.7 0 8 B 15.0 0 17 A 7.7 0 14
2 N Quinn Street and 18th Street N Overall Intersection (Unsignalized) A 3.2 A 3.4 A 1.7 Westbound Left/Right 315 B 14.2 ‐‐ 13 B 15.4 ‐‐ 33 B 10.9 ‐‐ 8 Northbound Thru/Right 375 A 0.0 ‐‐ 0 A 0.0 ‐‐ 0 A 0.0 ‐‐ 0 Southbound Left/Thru 200 A 9.0 ‐‐ 18 A 8.3 ‐‐ 3 A 7.9 ‐‐ 3
3 N Quinn Street and Wilson Boulevard Overall Intersection (Signalized) C 21.5 B 11.3 C 20.1 Westbound Thru 325 A 9.2 58 84 A 7.6 104 105 C 20.3 149 141 Westbound Right 85 C 25.8 24 m45 A 6.6 6 m7 C 25.6 12 25 Southbound Right 375 D 44.3 22 m34 C 33.3 94 168 B 13.5 82 142
4 N Pierce Street and Wilson Boulevard Overall Intersection (Signalized) B 15.9 C 22.2 B 18.5 Westbound Left/Thru 675 A 6.3 95 m111 B 19.2 406 497 B 12.8 165 232 Northbound Left 250 D 43.1 156 m217 D 37.8 131 209 D 38.6 122 190
5 N Pierce Street and Clarendon Boulevard Overall Intersection (Signalized) C 20.4 C 24.0 B 10.4 Eastbound Left/Thru 500 B 15.1 351 #705 B 12.5 165 217 A 5.7 90 157 Eastbound Thru/Right 500 B 15.1 351 #705 B 12.5 165 217 A 5.7 90 157 Northbound Thru/Right 185 C 34.1 131 185 C 24.1 42 86 C 32.6 22 54 Southbound Left/Thru 250 E 60.5 45 #165 D 55.0 160 m#369 C 28.4 30 60
6 New Street and 18th Street N Overall Intersection (Unsignalized) A 1.8 A 5.9 A 5.2 Eastbound Thru/Right A 0.0 ‐‐ 0 A 0.0 ‐‐ 0 A 0.0 ‐‐ 0 Westbound Left/Thru A 7.8 ‐‐ 0 A 7.3 ‐‐ 0 A 7.3 ‐‐ 0 Northbound Left/Right B 10.4 ‐‐ 5 A 9.7 ‐‐ 15 A 9.0 ‐‐ 5
7 New Street and Wilson Boulevard Overall Intersection (Unsignalized) A 0.8 A 4.5 A 1.5 Westbound Thru/Right A 0.0 ‐‐ 0 A 0.0 ‐‐ 0 A 0.0 ‐‐ 0 Southbound Right B 14.2 ‐‐ 15 D 34.3 ‐‐ 115 B 12.9 ‐‐ 20
8 N Oak Street and Key Boulevard Overall Intersection (Unsignalized) C 23.8 A 7.4 A 5.2 Eastbound Thru/Right 285 A 0.0 ‐‐ 0 A 0.0 ‐‐ 0 A 0.0 ‐‐ 0 Westbound Left/Thru 150 B 12.0 ‐‐ 13 A 8.4 ‐‐ 8 A 7.8 ‐‐ 5 Northbound Left/Right 200 F 123.9 ‐‐ 253 C 20.1 ‐‐ 68 B 11.7 ‐‐ 20
9 N Oak Street and 18th Street N Overall Intersection (Unsignalized) A 6.4 A 4.7 A 2.9 Eastbound Left/Right 850 C 17.2 ‐‐ 58 B 12.8 ‐‐ 25 B 10.6 ‐‐ 8 Northbound Left/Thru 200 A 8.2 ‐‐ 5 A 7.9 ‐‐ 3 A 7.7 ‐‐ 3 Southbound Thru/Right 200 A 0.0 ‐‐ 0 A 0.0 ‐‐ 0 A 0.0 ‐‐ 0
10 N Oak Street and Wilson Boulevard Overall Intersection (Signalized) C 32.5 C 29.0 C 25.0 Westbound Thru 125 C 27.9 160 205 C 24.7 185 234 B 17.4 90 120 Westbound Thru/Right 75 C 27.9 160 205 C 24.7 185 234 B 17.4 90 120 Northbound Left/Thru 25 D 54.2 186 m240 D 54.0 144 224 D 53.5 116 m177 Southbound Thru/Right 200 C 25.1 107 m169 C 22.8 55 108 C 21.9 19 56
11 N Oak Street and Clarendon Boulevard Overall Intersection (Signalized) B 16.8 B 15.2 B 18.0 Eastbound Left 75 D 51.9 116 m#157 D 41.0 98 m148 D 47.5 87 151 Eastbound Thru/Right 550 B 11.0 144 127 A 9.7 102 m149 A 7.7 56 76 Northbound Thru/Right 825 B 18.9 43 83 C 23.0 26 66 C 26.4 18 54 Southbound Left/Thru 25 A 6.1 14 17 A 7.8 13 16 B 12.8 11 15
12 N Nash Street and Key Boulevard
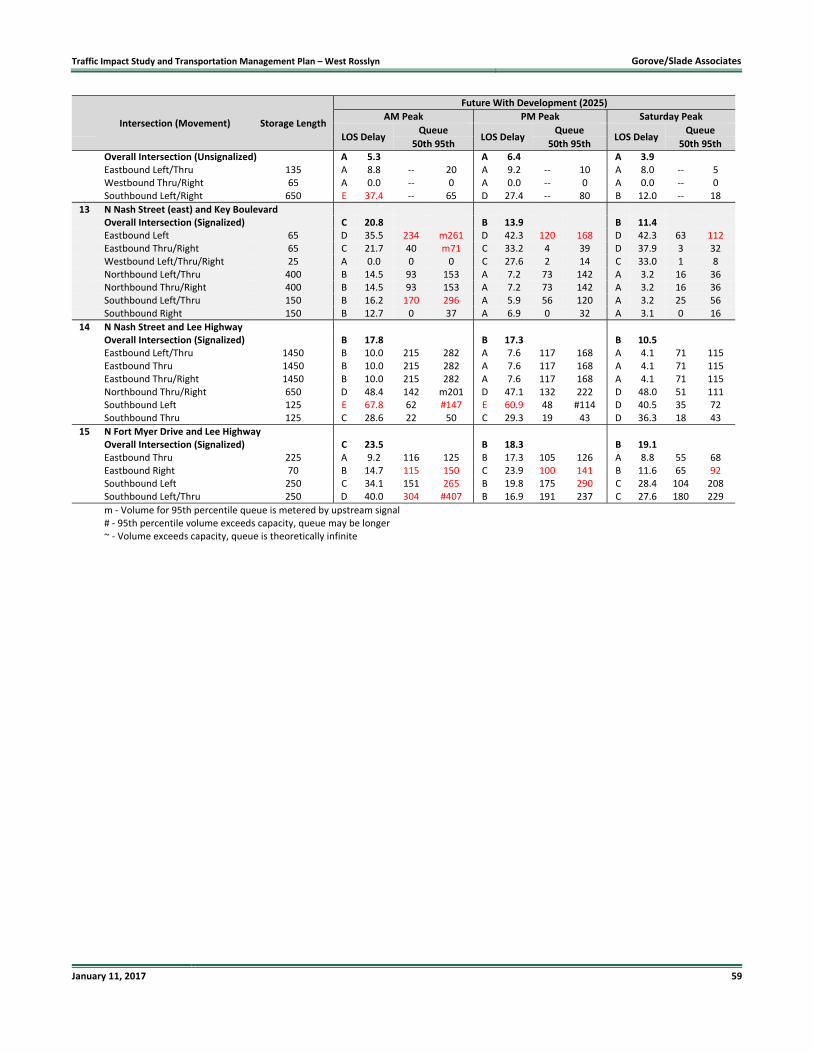
Traffic Impact Study and Transportation Management Plan – West Rosslyn Gorove/Slade Associates
January 11, 2017 59
Intersection (Movement) Storage Length
Future With Development (2025)
AM Peak PM Peak Saturday Peak
LOS Delay Queue
LOS Delay Queue
LOS Delay Queue
50th 95th 50th 95th 50th 95th Overall Intersection (Unsignalized) A 5.3 A 6.4 A 3.9 Eastbound Left/Thru 135 A 8.8 ‐‐ 20 A 9.2 ‐‐ 10 A 8.0 ‐‐ 5 Westbound Thru/Right 65 A 0.0 ‐‐ 0 A 0.0 ‐‐ 0 A 0.0 ‐‐ 0
Southbound Left/Right 650 E 37.4 ‐‐ 65 D 27.4 ‐‐ 80 B 12.0 ‐‐ 18
13 N Nash Street (east) and Key Boulevard Overall Intersection (Signalized) C 20.8 B 13.9 B 11.4 Eastbound Left 65 D 35.5 234 m261 D 42.3 120 168 D 42.3 63 112 Eastbound Thru/Right 65 C 21.7 40 m71 C 33.2 4 39 D 37.9 3 32 Westbound Left/Thru/Right 25 A 0.0 0 0 C 27.6 2 14 C 33.0 1 8 Northbound Left/Thru 400 B 14.5 93 153 A 7.2 73 142 A 3.2 16 36 Northbound Thru/Right 400 B 14.5 93 153 A 7.2 73 142 A 3.2 16 36 Southbound Left/Thru 150 B 16.2 170 296 A 5.9 56 120 A 3.2 25 56 Southbound Right 150 B 12.7 0 37 A 6.9 0 32 A 3.1 0 16
14 N Nash Street and Lee Highway Overall Intersection (Signalized) B 17.8 B 17.3 B 10.5 Eastbound Left/Thru 1450 B 10.0 215 282 A 7.6 117 168 A 4.1 71 115 Eastbound Thru 1450 B 10.0 215 282 A 7.6 117 168 A 4.1 71 115 Eastbound Thru/Right 1450 B 10.0 215 282 A 7.6 117 168 A 4.1 71 115 Northbound Thru/Right 650 D 48.4 142 m201 D 47.1 132 222 D 48.0 51 111 Southbound Left 125 E 67.8 62 #147 E 60.9 48 #114 D 40.5 35 72 Southbound Thru 125 C 28.6 22 50 C 29.3 19 43 D 36.3 18 43
15 N Fort Myer Drive and Lee Highway Overall Intersection (Signalized) C 23.5 B 18.3 B 19.1 Eastbound Thru 225 A 9.2 116 125 B 17.3 105 126 A 8.8 55 68 Eastbound Right 70 B 14.7 115 150 C 23.9 100 141 B 11.6 65 92 Southbound Left 250 C 34.1 151 265 B 19.8 175 290 C 28.4 104 208
Southbound Left/Thru 250 D 40.0 304 #407 B 16.9 191 237 C 27.6 180 229 m ‐ Volume for 95th percentile queue is metered by upstream signal
# ‐ 95th percentile volume exceeds capacity, queue may be longer ~ ‐ Volume exceeds capacity, queue is theoretically infinite

Traffic Impact Study and Transportation Management Plan – West Rosslyn Gorove/Slade Associates
January 11, 2017 60
Figure 27: Future with Development (2025) LOS Results
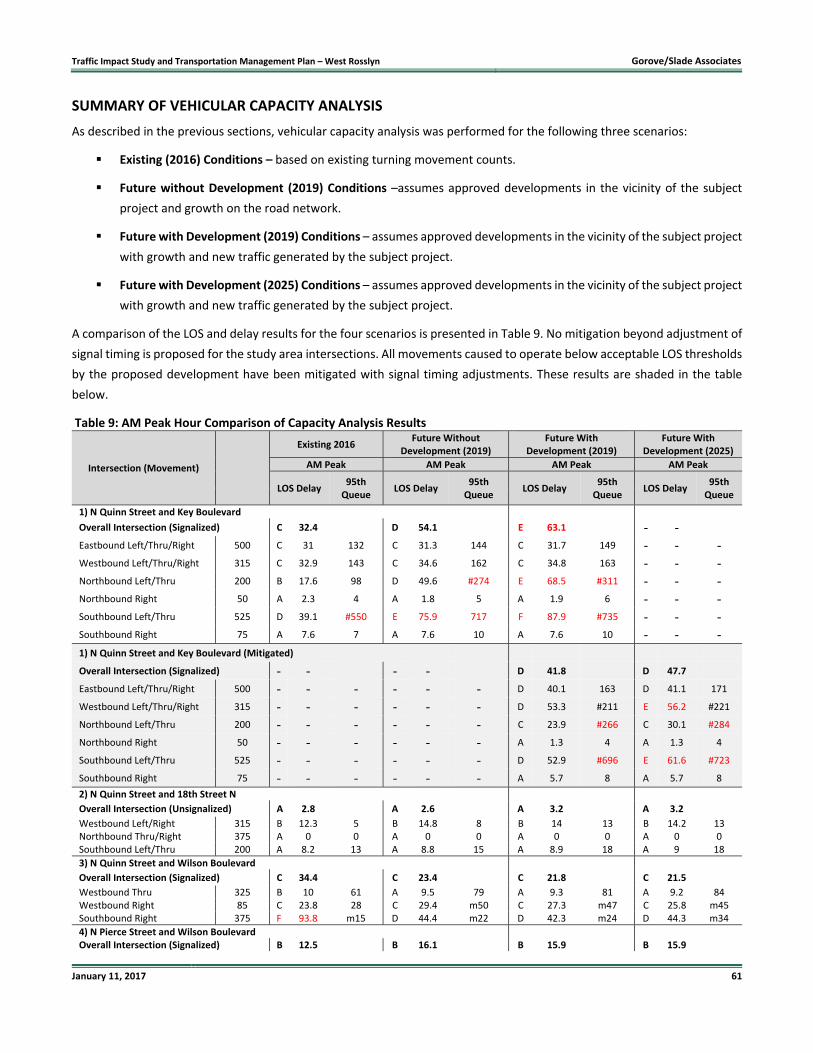
Traffic Impact Study and Transportation Management Plan – West Rosslyn Gorove/Slade Associates
January 11, 2017 61
SUMMARY OF VEHICULAR CAPACITY ANALYSIS
As described in the previous sections, vehicular capacity analysis was performed for the following three scenarios:
Existing (2016) Conditions – based on existing turning movement counts.
Future without Development (2019) Conditions –assumes approved developments in the vicinity of the subject
project and growth on the road network.
Future with Development (2019) Conditions – assumes approved developments in the vicinity of the subject project
with growth and new traffic generated by the subject project.
Future with Development (2025) Conditions – assumes approved developments in the vicinity of the subject project
with growth and new traffic generated by the subject project.
A comparison of the LOS and delay results for the four scenarios is presented in Table 9. No mitigation beyond adjustment of
signal timing is proposed for the study area intersections. All movements caused to operate below acceptable LOS thresholds
by the proposed development have been mitigated with signal timing adjustments. These results are shaded in the table
below.
Table 9: AM Peak Hour Comparison of Capacity Analysis Results
Intersection (Movement)
Existing 2016 Future Without
Development (2019) Future With
Development (2019) Future With
Development (2025)
AM Peak AM Peak AM Peak AM Peak
LOS Delay 95th Queue
LOS Delay 95th Queue
LOS Delay 95th Queue
LOS Delay 95th Queue
1) N Quinn Street and Key Boulevard Overall Intersection (Signalized) C 32.4 D 54.1 E 63.1 ‐ ‐ Eastbound Left/Thru/Right 500 C 31 132 C 31.3 144 C 31.7 149 ‐ ‐ ‐ Westbound Left/Thru/Right 315 C 32.9 143 C 34.6 162 C 34.8 163 ‐ ‐ ‐ Northbound Left/Thru 200 B 17.6 98 D 49.6 #274 E 68.5 #311 ‐ ‐ ‐ Northbound Right 50 A 2.3 4 A 1.8 5 A 1.9 6 ‐ ‐ ‐ Southbound Left/Thru 525 D 39.1 #550 E 75.9 717 F 87.9 #735 ‐ ‐ ‐ Southbound Right 75 A 7.6 7 A 7.6 10 A 7.6 10 ‐ ‐ ‐ 1) N Quinn Street and Key Boulevard (Mitigated)
Overall Intersection (Signalized) ‐ ‐ ‐ ‐ D 41.8 D 47.7
Eastbound Left/Thru/Right 500 ‐ ‐ ‐ ‐ ‐ ‐ D 40.1 163 D 41.1 171
Westbound Left/Thru/Right 315 ‐ ‐ ‐ ‐ ‐ ‐ D 53.3 #211 E 56.2 #221
Northbound Left/Thru 200 ‐ ‐ ‐ ‐ ‐ ‐ C 23.9 #266 C 30.1 #284
Northbound Right 50 ‐ ‐ ‐ ‐ ‐ ‐ A 1.3 4 A 1.3 4
Southbound Left/Thru 525 ‐ ‐ ‐ ‐ ‐ ‐ D 52.9 #696 E 61.6 #723
Southbound Right 75 ‐ ‐ ‐ ‐ ‐ ‐ A 5.7 8 A 5.7 8
2) N Quinn Street and 18th Street N
Overall Intersection (Unsignalized) A 2.8 A 2.6 A 3.2 A 3.2
Westbound Left/Right 315 B 12.3 5 B 14.8 8 B 14 13 B 14.2 13Northbound Thru/Right 375 A 0 0 A 0 0 A 0 0 A 0 0Southbound Left/Thru 200 A 8.2 13 A 8.8 15 A 8.9 18 A 9 18
3) N Quinn Street and Wilson Boulevard
Overall Intersection (Signalized) C 34.4 C 23.4 C 21.8 C 21.5
Westbound Thru 325 B 10 61 A 9.5 79 A 9.3 81 A 9.2 84Westbound Right 85 C 23.8 28 C 29.4 m50 C 27.3 m47 C 25.8 m45Southbound Right 375 F 93.8 m15 D 44.4 m22 D 42.3 m24 D 44.3 m34
4) N Pierce Street and Wilson Boulevard
Overall Intersection (Signalized) B 12.5 B 16.1 B 15.9 B 15.9

Traffic Impact Study and Transportation Management Plan – West Rosslyn Gorove/Slade Associates
January 11, 2017 62
Intersection (Movement)
Existing 2016 Future Without
Development (2019) Future With
Development (2019) Future With
Development (2025)
AM Peak AM Peak AM Peak AM Peak
LOS Delay 95th Queue
LOS Delay 95th Queue
LOS Delay 95th Queue
LOS Delay 95th Queue
Westbound Left/Thru 675 A 3.9 58 A 6.1 m97 A 6.2 m108 A 6.3 m111Northbound Left 250 D 37.7 162 D 41.8 m#228 D 43 m217 D 43.1 m217
5) N Pierce Street and Clarendon Boulevard
Overall Intersection (Signalized) B 13.6 B 18.2 C 21.4 C 20.4
Eastbound Left/Thru 500 A 8.1 339 B 12 482 B 15.3 511 B 15.1 #705Eastbound Thru/Right 500 A 8.1 339 B 12 482 B 15.3 511 B 15.1 #705Northbound Thru/Right 185 D 39.5 147 D 41.9 195 D 36 201 C 34.1 185Southbound Left/Thru 250 D 41.1 64 E 55.6 #142 E 67.2 #191 E 60.5 #165
6) New Street and 18th Street N
Overall Intersection (Unsignalized) ‐ ‐ ‐ ‐ A 1.8 A 1.8
Eastbound Thru/Right ‐ ‐ ‐ ‐ ‐ ‐ A 0 0 A 0 0
Westbound Left/Thru ‐ ‐ ‐ ‐ ‐ ‐ A 7.8 0 A 7.8 0
Northbound Left/Right ‐ ‐ ‐ ‐ ‐ ‐ B 10.3 5 B 10.4 5
7) New Street and Wilson Boulevard
Overall Intersection (Unsignalized) ‐ ‐ ‐ ‐ A 0.9 A 0.8
Westbound Thru/Right ‐ ‐ ‐ ‐ ‐ ‐ A 0 0 A 0 0
Southbound Right ‐ ‐ ‐ ‐ ‐ ‐ B 14 13 B 14.2 15
8) N Oak Street and Key Boulevard
Overall Intersection (Unsignalized) B 13.6 B 14.3 C 20.1 C 23.8
Eastbound Thru/Right 285 A 0 0 A 0 0 A 0 0 A 0 0Westbound Left/Thru 150 B 10.8 8 B 11.7 10 B 11.8 10 B 12 13Northbound Left/Right 200 F 65.1 165 F 79.8 183 F 104.6 230 F 123.9 253
9) N Oak Street and 18th Street N
Overall Intersection (Unsignalized) A 5.7 A 5.6 A 6.3 A 6.4
Eastbound Left/Right 850 B 13.1 33 C 15.3 43 C 16.7 53 C 17.2 58Northbound Left/Thru 200 A 7.8 8 A 8.1 5 A 8.2 5 A 8.2 5Southbound Thru/Right 200 A 0 0 A 0 0 A 0 0 A 0 0
10) N Oak Street and Wilson Boulevard Overall Intersection (Signalized) C 30.2 D 46 E 75.2 ‐ ‐ Westbound Thru 125 B 19.7 130 B 20 150 C 21 171 ‐ ‐ ‐
Westbound Thru/Right 75 B 19.7 130 B 20 150 C 21 171 ‐ ‐ ‐
Northbound Left/Thru 25 E 58.4 m#228 F 133.2 m#286 F 268.4 m#296 ‐ ‐ ‐
Southbound Thru/Right 200 C 34.9 m144 D 42.7 m200 D 42.5 m200 ‐ ‐ ‐
10) N Oak Street and Wilson Boulevard (Mitigated)
Overall Intersection (Signalized) ‐ ‐ ‐ ‐ C 31.9 C 32.5
Westbound Thru 125 ‐ ‐ ‐ ‐ ‐ ‐ C 27.5 197 C 27.9 205
Westbound Thru/Right 75 ‐ ‐ ‐ ‐ ‐ ‐ C 27.5 197 C 27.9 205
Northbound Left/Thru 25 ‐ ‐ ‐ ‐ ‐ ‐ D 52.2 m240 D 54.2 m240
Southbound Thru/Right 200 ‐ ‐ ‐ ‐ ‐ ‐ C 24.9 m163 C 25.1 m169
11) N Oak Street and Clarendon Boulevard Overall Intersection (Signalized) B 14.6 B 14.1 B 19.8 ‐ ‐ Eastbound Left 75 D 52.7 m#171 E 56.5 m126 F 88.2 m#191 ‐ ‐ ‐
Eastbound Thru/Right 550 A 6.2 64 A 6 91 A 5.9 99 ‐ ‐ ‐
Northbound Thru/Right 825 C 29.2 88 C 29.1 93 C 29.2 94 ‐ ‐ ‐
Southbound Left/Thru 25 A 8.1 10 B 10.8 m21 B 10.8 m21 ‐ ‐ ‐
11) N Oak Street and Clarendon Boulevard (Mitigated)
Overall Intersection (Signalized) ‐ ‐ ‐ ‐ B 16.5 ‐ B 16.8
Eastbound Left 75 ‐ ‐ ‐ ‐ ‐ ‐ D 50.7 m#174 D 51.9 m#157
Eastbound Thru/Right 550 ‐ ‐ ‐ ‐ ‐ ‐ B 10.6 122 B 11 127
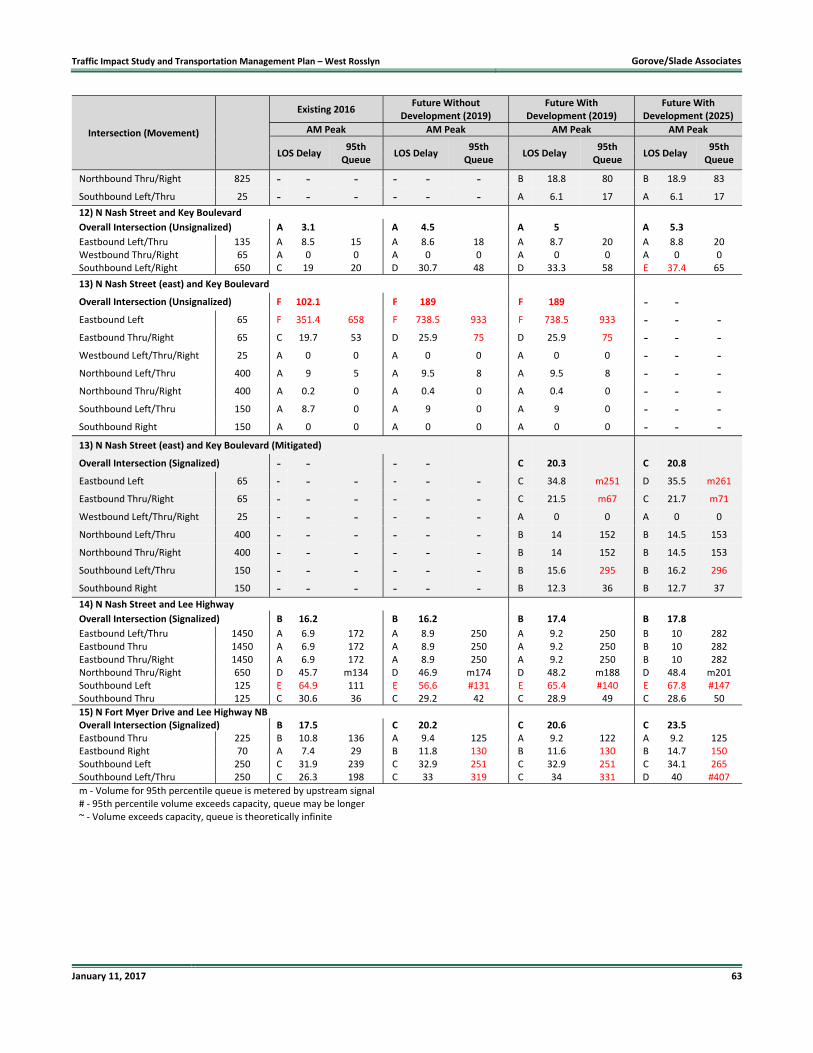
Traffic Impact Study and Transportation Management Plan – West Rosslyn Gorove/Slade Associates
January 11, 2017 63
Intersection (Movement)
Existing 2016 Future Without
Development (2019) Future With
Development (2019) Future With
Development (2025)
AM Peak AM Peak AM Peak AM Peak
LOS Delay 95th Queue
LOS Delay 95th Queue
LOS Delay 95th Queue
LOS Delay 95th Queue
Northbound Thru/Right 825 ‐ ‐ ‐ ‐ ‐ ‐ B 18.8 80 B 18.9 83
Southbound Left/Thru 25 ‐ ‐ ‐ ‐ ‐ ‐ A 6.1 17 A 6.1 17
12) N Nash Street and Key Boulevard
Overall Intersection (Unsignalized) A 3.1 A 4.5 A 5 A 5.3
Eastbound Left/Thru 135 A 8.5 15 A 8.6 18 A 8.7 20 A 8.8 20Westbound Thru/Right 65 A 0 0 A 0 0 A 0 0 A 0 0Southbound Left/Right 650 C 19 20 D 30.7 48 D 33.3 58 E 37.4 65
13) N Nash Street (east) and Key Boulevard Overall Intersection (Unsignalized) F 102.1 F 189 F 189 ‐ ‐ Eastbound Left 65 F 351.4 658 F 738.5 933 F 738.5 933 ‐ ‐ ‐ Eastbound Thru/Right 65 C 19.7 53 D 25.9 75 D 25.9 75 ‐ ‐ ‐ Westbound Left/Thru/Right 25 A 0 0 A 0 0 A 0 0 ‐ ‐ ‐ Northbound Left/Thru 400 A 9 5 A 9.5 8 A 9.5 8 ‐ ‐ ‐ Northbound Thru/Right 400 A 0.2 0 A 0.4 0 A 0.4 0 ‐ ‐ ‐ Southbound Left/Thru 150 A 8.7 0 A 9 0 A 9 0 ‐ ‐ ‐ Southbound Right 150 A 0 0 A 0 0 A 0 0 ‐ ‐ ‐ 13) N Nash Street (east) and Key Boulevard (Mitigated)
Overall Intersection (Signalized) ‐ ‐ ‐ ‐ C 20.3 C 20.8
Eastbound Left 65 ‐ ‐ ‐ ‐ ‐ ‐ C 34.8 m251 D 35.5 m261
Eastbound Thru/Right 65 ‐ ‐ ‐ ‐ ‐ ‐ C 21.5 m67 C 21.7 m71
Westbound Left/Thru/Right 25 ‐ ‐ ‐ ‐ ‐ ‐ A 0 0 A 0 0
Northbound Left/Thru 400 ‐ ‐ ‐ ‐ ‐ ‐ B 14 152 B 14.5 153
Northbound Thru/Right 400 ‐ ‐ ‐ ‐ ‐ ‐ B 14 152 B 14.5 153
Southbound Left/Thru 150 ‐ ‐ ‐ ‐ ‐ ‐ B 15.6 295 B 16.2 296
Southbound Right 150 ‐ ‐ ‐ ‐ ‐ ‐ B 12.3 36 B 12.7 37
14) N Nash Street and Lee Highway
Overall Intersection (Signalized) B 16.2 B 16.2 B 17.4 B 17.8
Eastbound Left/Thru 1450 A 6.9 172 A 8.9 250 A 9.2 250 B 10 282Eastbound Thru 1450 A 6.9 172 A 8.9 250 A 9.2 250 B 10 282Eastbound Thru/Right 1450 A 6.9 172 A 8.9 250 A 9.2 250 B 10 282Northbound Thru/Right 650 D 45.7 m134 D 46.9 m174 D 48.2 m188 D 48.4 m201Southbound Left 125 E 64.9 111 E 56.6 #131 E 65.4 #140 E 67.8 #147Southbound Thru 125 C 30.6 36 C 29.2 42 C 28.9 49 C 28.6 50
15) N Fort Myer Drive and Lee Highway NB Overall Intersection (Signalized) B 17.5 C 20.2 C 20.6 C 23.5Eastbound Thru 225 B 10.8 136 A 9.4 125 A 9.2 122 A 9.2 125Eastbound Right 70 A 7.4 29 B 11.8 130 B 11.6 130 B 14.7 150Southbound Left 250 C 31.9 239 C 32.9 251 C 32.9 251 C 34.1 265Southbound Left/Thru 250 C 26.3 198 C 33 319 C 34 331 D 40 #407
m ‐ Volume for 95th percentile queue is metered by upstream signal# ‐ 95th percentile volume exceeds capacity, queue may be longer~ ‐ Volume exceeds capacity, queue is theoretically infinite
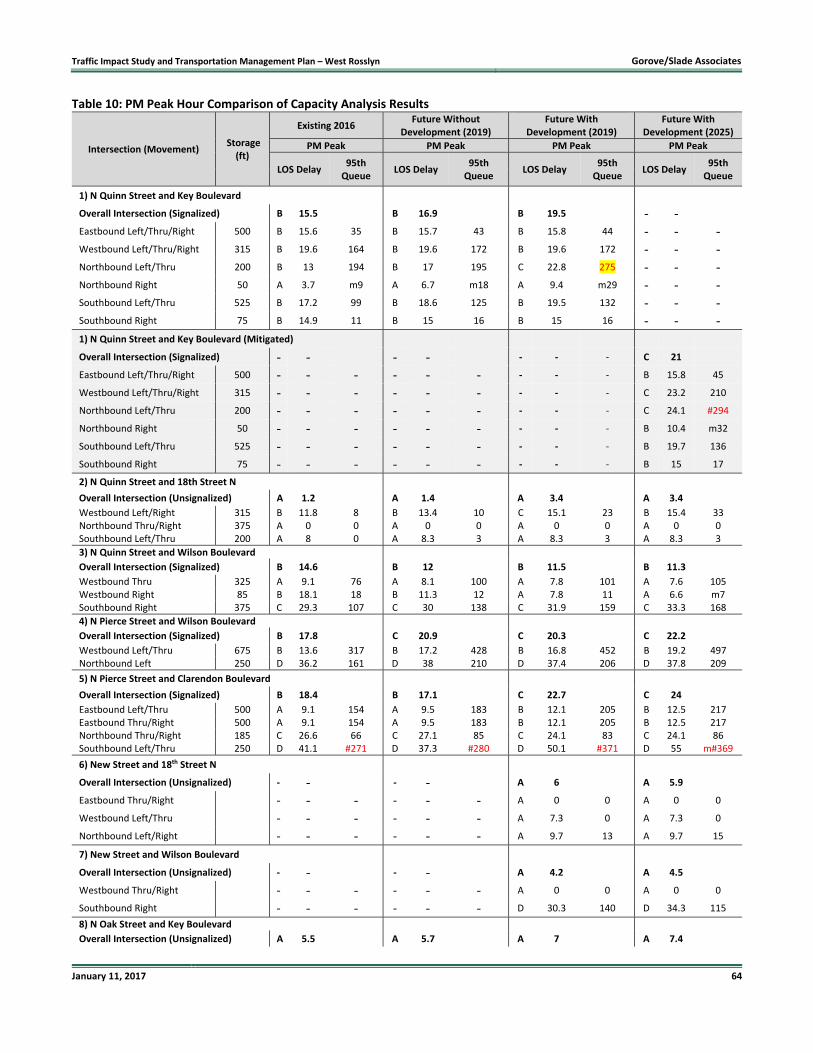
Traffic Impact Study and Transportation Management Plan – West Rosslyn Gorove/Slade Associates
January 11, 2017 64
Table 10: PM Peak Hour Comparison of Capacity Analysis Results
Intersection (Movement) Storage
(ft)
Existing 2016 Future Without
Development (2019) Future With
Development (2019) Future With
Development (2025)
PM Peak PM Peak PM Peak PM Peak
LOS Delay 95th Queue
LOS Delay 95th Queue
LOS Delay 95th Queue
LOS Delay 95th Queue
1) N Quinn Street and Key Boulevard Overall Intersection (Signalized) B 15.5 B 16.9 B 19.5 ‐ ‐ Eastbound Left/Thru/Right 500 B 15.6 35 B 15.7 43 B 15.8 44 ‐ ‐ ‐ Westbound Left/Thru/Right 315 B 19.6 164 B 19.6 172 B 19.6 172 ‐ ‐ ‐ Northbound Left/Thru 200 B 13 194 B 17 195 C 22.8 275 ‐ ‐ ‐ Northbound Right 50 A 3.7 m9 A 6.7 m18 A 9.4 m29 ‐ ‐ ‐ Southbound Left/Thru 525 B 17.2 99 B 18.6 125 B 19.5 132 ‐ ‐ ‐ Southbound Right 75 B 14.9 11 B 15 16 B 15 16 ‐ ‐ ‐ 1) N Quinn Street and Key Boulevard (Mitigated)
Overall Intersection (Signalized) ‐ ‐ ‐ ‐ ‐ ‐ ‐ C 21
Eastbound Left/Thru/Right 500 ‐ ‐ ‐ ‐ ‐ ‐ ‐ ‐ ‐ B 15.8 45
Westbound Left/Thru/Right 315 ‐ ‐ ‐ ‐ ‐ ‐ ‐ ‐ ‐ C 23.2 210
Northbound Left/Thru 200 ‐ ‐ ‐ ‐ ‐ ‐ ‐ ‐ ‐ C 24.1 #294
Northbound Right 50 ‐ ‐ ‐ ‐ ‐ ‐ ‐ ‐ ‐ B 10.4 m32
Southbound Left/Thru 525 ‐ ‐ ‐ ‐ ‐ ‐ ‐ ‐ ‐ B 19.7 136
Southbound Right 75 ‐ ‐ ‐ ‐ ‐ ‐ ‐ ‐ ‐ B 15 17
2) N Quinn Street and 18th Street N
Overall Intersection (Unsignalized) A 1.2 A 1.4 A 3.4 A 3.4
Westbound Left/Right 315 B 11.8 8 B 13.4 10 C 15.1 23 B 15.4 33Northbound Thru/Right 375 A 0 0 A 0 0 A 0 0 A 0 0Southbound Left/Thru 200 A 8 0 A 8.3 3 A 8.3 3 A 8.3 3
3) N Quinn Street and Wilson Boulevard
Overall Intersection (Signalized) B 14.6 B 12 B 11.5 B 11.3
Westbound Thru 325 A 9.1 76 A 8.1 100 A 7.8 101 A 7.6 105Westbound Right 85 B 18.1 18 B 11.3 12 A 7.8 11 A 6.6 m7Southbound Right 375 C 29.3 107 C 30 138 C 31.9 159 C 33.3 168
4) N Pierce Street and Wilson Boulevard
Overall Intersection (Signalized) B 17.8 C 20.9 C 20.3 C 22.2
Westbound Left/Thru 675 B 13.6 317 B 17.2 428 B 16.8 452 B 19.2 497Northbound Left 250 D 36.2 161 D 38 210 D 37.4 206 D 37.8 209
5) N Pierce Street and Clarendon Boulevard
Overall Intersection (Signalized) B 18.4 B 17.1 C 22.7 C 24
Eastbound Left/Thru 500 A 9.1 154 A 9.5 183 B 12.1 205 B 12.5 217Eastbound Thru/Right 500 A 9.1 154 A 9.5 183 B 12.1 205 B 12.5 217Northbound Thru/Right 185 C 26.6 66 C 27.1 85 C 24.1 83 C 24.1 86Southbound Left/Thru 250 D 41.1 #271 D 37.3 #280 D 50.1 #371 D 55 m#369
6) New Street and 18th Street N
Overall Intersection (Unsignalized) ‐ ‐ ‐ ‐ A 6 A 5.9
Eastbound Thru/Right ‐ ‐ ‐ ‐ ‐ ‐ A 0 0 A 0 0
Westbound Left/Thru ‐ ‐ ‐ ‐ ‐ ‐ A 7.3 0 A 7.3 0
Northbound Left/Right ‐ ‐ ‐ ‐ ‐ ‐ A 9.7 13 A 9.7 15
7) New Street and Wilson Boulevard
Overall Intersection (Unsignalized) ‐ ‐ ‐ ‐ A 4.2 A 4.5
Westbound Thru/Right ‐ ‐ ‐ ‐ ‐ ‐ A 0 0 A 0 0
Southbound Right ‐ ‐ ‐ ‐ ‐ ‐ D 30.3 140 D 34.3 115
8) N Oak Street and Key Boulevard
Overall Intersection (Unsignalized) A 5.5 A 5.7 A 7 A 7.4
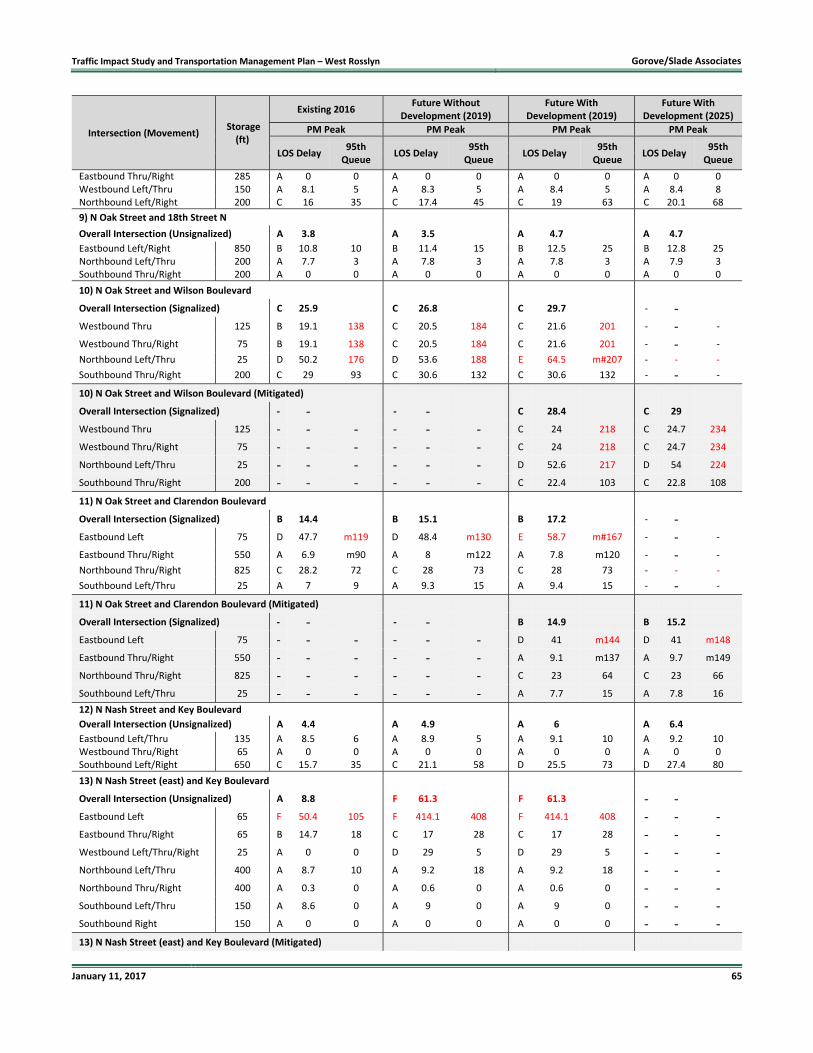
Traffic Impact Study and Transportation Management Plan – West Rosslyn Gorove/Slade Associates
January 11, 2017 65
Intersection (Movement) Storage
(ft)
Existing 2016 Future Without
Development (2019) Future With
Development (2019) Future With
Development (2025)
PM Peak PM Peak PM Peak PM Peak
LOS Delay 95th Queue
LOS Delay 95th Queue
LOS Delay 95th Queue
LOS Delay 95th Queue
Eastbound Thru/Right 285 A 0 0 A 0 0 A 0 0 A 0 0Westbound Left/Thru 150 A 8.1 5 A 8.3 5 A 8.4 5 A 8.4 8Northbound Left/Right 200 C 16 35 C 17.4 45 C 19 63 C 20.1 68
9) N Oak Street and 18th Street N
Overall Intersection (Unsignalized) A 3.8 A 3.5 A 4.7 A 4.7
Eastbound Left/Right 850 B 10.8 10 B 11.4 15 B 12.5 25 B 12.8 25Northbound Left/Thru 200 A 7.7 3 A 7.8 3 A 7.8 3 A 7.9 3Southbound Thru/Right 200 A 0 0 A 0 0 A 0 0 A 0 0
10) N Oak Street and Wilson Boulevard Overall Intersection (Signalized) C 25.9 C 26.8 C 29.7 ‐ ‐ Westbound Thru 125 B 19.1 138 C 20.5 184 C 21.6 201 ‐ ‐ ‐
Westbound Thru/Right 75 B 19.1 138 C 20.5 184 C 21.6 201 ‐ ‐ ‐
Northbound Left/Thru 25 D 50.2 176 D 53.6 188 E 64.5 m#207 ‐ ‐ ‐
Southbound Thru/Right 200 C 29 93 C 30.6 132 C 30.6 132 ‐ ‐ ‐
10) N Oak Street and Wilson Boulevard (Mitigated)
Overall Intersection (Signalized) ‐ ‐ ‐ ‐ C 28.4 C 29
Westbound Thru 125 ‐ ‐ ‐ ‐ ‐ ‐ C 24 218 C 24.7 234
Westbound Thru/Right 75 ‐ ‐ ‐ ‐ ‐ ‐ C 24 218 C 24.7 234
Northbound Left/Thru 25 ‐ ‐ ‐ ‐ ‐ ‐ D 52.6 217 D 54 224
Southbound Thru/Right 200 ‐ ‐ ‐ ‐ ‐ ‐ C 22.4 103 C 22.8 108
11) N Oak Street and Clarendon Boulevard Overall Intersection (Signalized) B 14.4 B 15.1 B 17.2 ‐ ‐ Eastbound Left 75 D 47.7 m119 D 48.4 m130 E 58.7 m#167 ‐ ‐ ‐
Eastbound Thru/Right 550 A 6.9 m90 A 8 m122 A 7.8 m120 ‐ ‐ ‐
Northbound Thru/Right 825 C 28.2 72 C 28 73 C 28 73 ‐ ‐ ‐
Southbound Left/Thru 25 A 7 9 A 9.3 15 A 9.4 15 ‐ ‐ ‐
11) N Oak Street and Clarendon Boulevard (Mitigated)
Overall Intersection (Signalized) ‐ ‐ ‐ ‐ B 14.9 B 15.2
Eastbound Left 75 ‐ ‐ ‐ ‐ ‐ ‐ D 41 m144 D 41 m148
Eastbound Thru/Right 550 ‐ ‐ ‐ ‐ ‐ ‐ A 9.1 m137 A 9.7 m149
Northbound Thru/Right 825 ‐ ‐ ‐ ‐ ‐ ‐ C 23 64 C 23 66
Southbound Left/Thru 25 ‐ ‐ ‐ ‐ ‐ ‐ A 7.7 15 A 7.8 16
12) N Nash Street and Key Boulevard
Overall Intersection (Unsignalized) A 4.4 A 4.9 A 6 A 6.4
Eastbound Left/Thru 135 A 8.5 6 A 8.9 5 A 9.1 10 A 9.2 10Westbound Thru/Right 65 A 0 0 A 0 0 A 0 0 A 0 0Southbound Left/Right 650 C 15.7 35 C 21.1 58 D 25.5 73 D 27.4 80
13) N Nash Street (east) and Key Boulevard Overall Intersection (Unsignalized) A 8.8 F 61.3 F 61.3 ‐ ‐ Eastbound Left 65 F 50.4 105 F 414.1 408 F 414.1 408 ‐ ‐ ‐ Eastbound Thru/Right 65 B 14.7 18 C 17 28 C 17 28 ‐ ‐ ‐ Westbound Left/Thru/Right 25 A 0 0 D 29 5 D 29 5 ‐ ‐ ‐ Northbound Left/Thru 400 A 8.7 10 A 9.2 18 A 9.2 18 ‐ ‐ ‐ Northbound Thru/Right 400 A 0.3 0 A 0.6 0 A 0.6 0 ‐ ‐ ‐ Southbound Left/Thru 150 A 8.6 0 A 9 0 A 9 0 ‐ ‐ ‐ Southbound Right 150 A 0 0 A 0 0 A 0 0 ‐ ‐ ‐ 13) N Nash Street (east) and Key Boulevard (Mitigated)
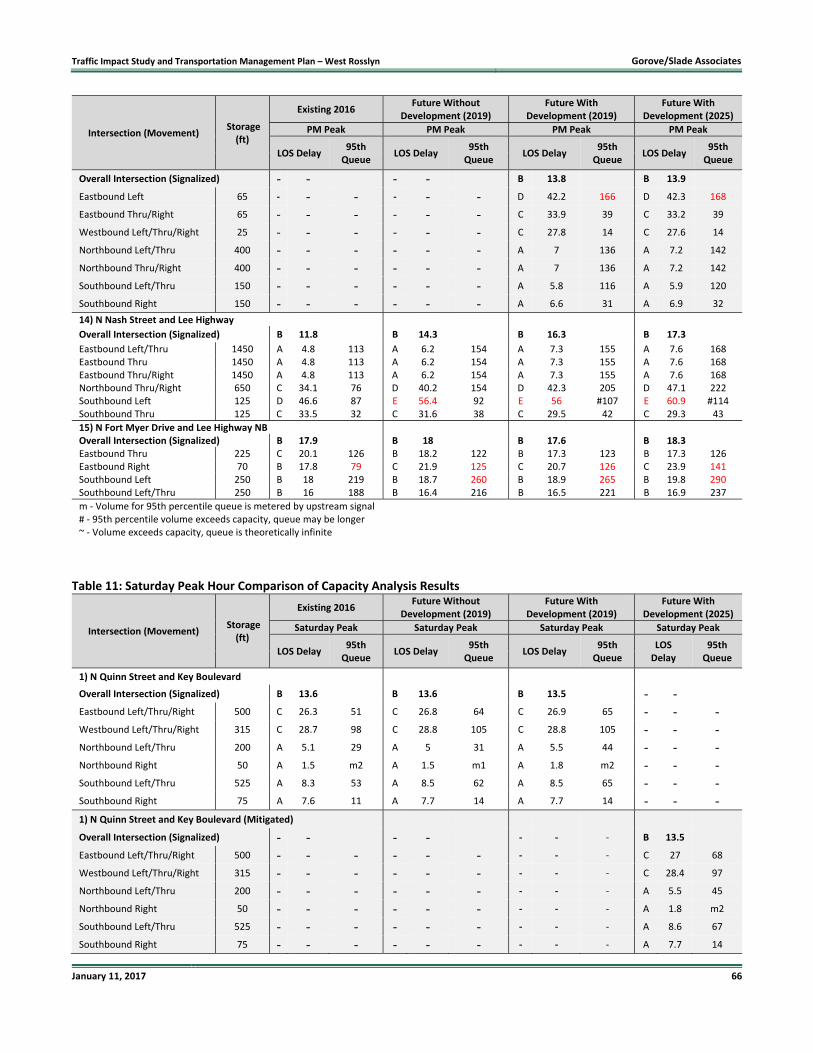
Traffic Impact Study and Transportation Management Plan – West Rosslyn Gorove/Slade Associates
January 11, 2017 66
Intersection (Movement) Storage
(ft)
Existing 2016 Future Without
Development (2019) Future With
Development (2019) Future With
Development (2025)
PM Peak PM Peak PM Peak PM Peak
LOS Delay 95th Queue
LOS Delay 95th Queue
LOS Delay 95th Queue
LOS Delay 95th Queue
Overall Intersection (Signalized) ‐ ‐ ‐ ‐ B 13.8 B 13.9
Eastbound Left 65 ‐ ‐ ‐ ‐ ‐ ‐ D 42.2 166 D 42.3 168
Eastbound Thru/Right 65 ‐ ‐ ‐ ‐ ‐ ‐ C 33.9 39 C 33.2 39
Westbound Left/Thru/Right 25 ‐ ‐ ‐ ‐ ‐ ‐ C 27.8 14 C 27.6 14
Northbound Left/Thru 400 ‐ ‐ ‐ ‐ ‐ ‐ A 7 136 A 7.2 142
Northbound Thru/Right 400 ‐ ‐ ‐ ‐ ‐ ‐ A 7 136 A 7.2 142
Southbound Left/Thru 150 ‐ ‐ ‐ ‐ ‐ ‐ A 5.8 116 A 5.9 120
Southbound Right 150 ‐ ‐ ‐ ‐ ‐ ‐ A 6.6 31 A 6.9 32
14) N Nash Street and Lee Highway
Overall Intersection (Signalized) B 11.8 B 14.3 B 16.3 B 17.3
Eastbound Left/Thru 1450 A 4.8 113 A 6.2 154 A 7.3 155 A 7.6 168Eastbound Thru 1450 A 4.8 113 A 6.2 154 A 7.3 155 A 7.6 168Eastbound Thru/Right 1450 A 4.8 113 A 6.2 154 A 7.3 155 A 7.6 168Northbound Thru/Right 650 C 34.1 76 D 40.2 154 D 42.3 205 D 47.1 222Southbound Left 125 D 46.6 87 E 56.4 92 E 56 #107 E 60.9 #114Southbound Thru 125 C 33.5 32 C 31.6 38 C 29.5 42 C 29.3 43
15) N Fort Myer Drive and Lee Highway NB Overall Intersection (Signalized) B 17.9 B 18 B 17.6 B 18.3Eastbound Thru 225 C 20.1 126 B 18.2 122 B 17.3 123 B 17.3 126Eastbound Right 70 B 17.8 79 C 21.9 125 C 20.7 126 C 23.9 141Southbound Left 250 B 18 219 B 18.7 260 B 18.9 265 B 19.8 290Southbound Left/Thru 250 B 16 188 B 16.4 216 B 16.5 221 B 16.9 237
m ‐ Volume for 95th percentile queue is metered by upstream signal# ‐ 95th percentile volume exceeds capacity, queue may be longer ~ ‐ Volume exceeds capacity, queue is theoretically infinite
Table 11: Saturday Peak Hour Comparison of Capacity Analysis Results
Intersection (Movement) Storage
(ft)
Existing 2016 Future Without
Development (2019) Future With
Development (2019) Future With
Development (2025)
Saturday Peak Saturday Peak Saturday Peak Saturday Peak
LOS Delay 95th Queue
LOS Delay 95th Queue
LOS Delay 95th Queue
LOS Delay
95th Queue
1) N Quinn Street and Key Boulevard Overall Intersection (Signalized) B 13.6 B 13.6 B 13.5 ‐ ‐ Eastbound Left/Thru/Right 500 C 26.3 51 C 26.8 64 C 26.9 65 ‐ ‐ ‐ Westbound Left/Thru/Right 315 C 28.7 98 C 28.8 105 C 28.8 105 ‐ ‐ ‐ Northbound Left/Thru 200 A 5.1 29 A 5 31 A 5.5 44 ‐ ‐ ‐ Northbound Right 50 A 1.5 m2 A 1.5 m1 A 1.8 m2 ‐ ‐ ‐ Southbound Left/Thru 525 A 8.3 53 A 8.5 62 A 8.5 65 ‐ ‐ ‐ Southbound Right 75 A 7.6 11 A 7.7 14 A 7.7 14 ‐ ‐ ‐ 1) N Quinn Street and Key Boulevard (Mitigated)
Overall Intersection (Signalized) ‐ ‐ ‐ ‐ ‐ ‐ ‐ B 13.5
Eastbound Left/Thru/Right 500 ‐ ‐ ‐ ‐ ‐ ‐ ‐ ‐ ‐ C 27 68
Westbound Left/Thru/Right 315 ‐ ‐ ‐ ‐ ‐ ‐ ‐ ‐ ‐ C 28.4 97
Northbound Left/Thru 200 ‐ ‐ ‐ ‐ ‐ ‐ ‐ ‐ ‐ A 5.5 45
Northbound Right 50 ‐ ‐ ‐ ‐ ‐ ‐ ‐ ‐ ‐ A 1.8 m2
Southbound Left/Thru 525 ‐ ‐ ‐ ‐ ‐ ‐ ‐ ‐ ‐ A 8.6 67
Southbound Right 75 ‐ ‐ ‐ ‐ ‐ ‐ ‐ ‐ ‐ A 7.7 14
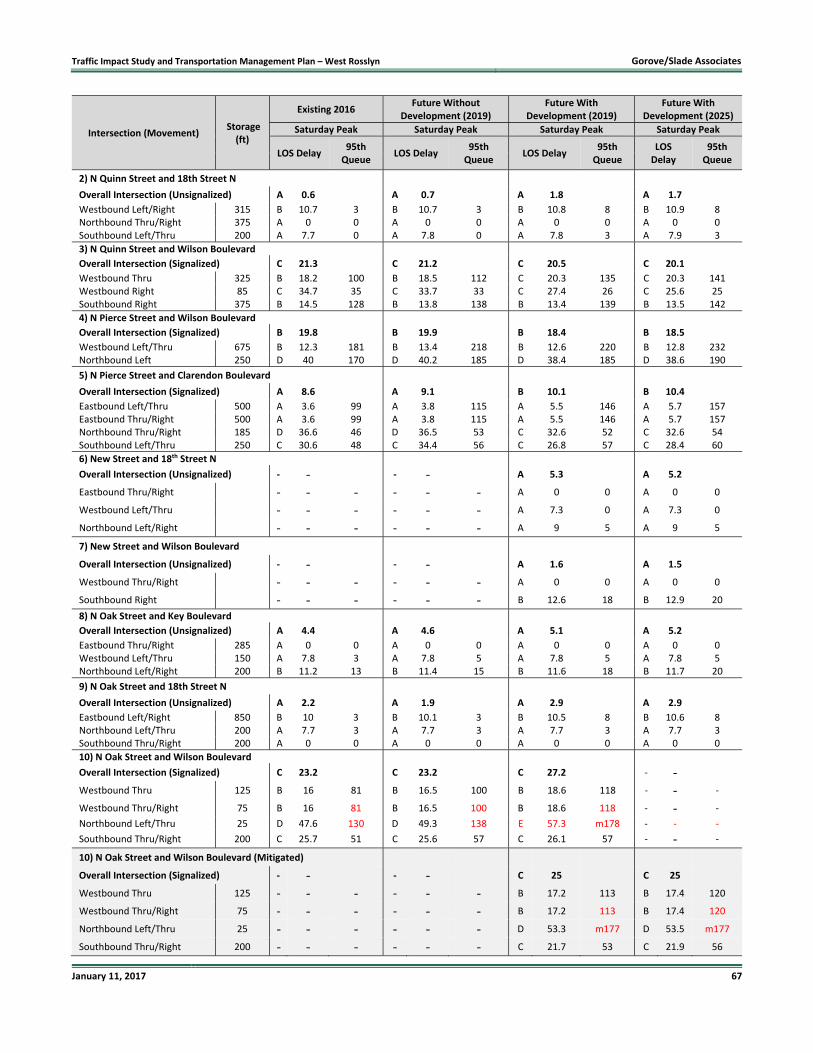
Traffic Impact Study and Transportation Management Plan – West Rosslyn Gorove/Slade Associates
January 11, 2017 67
Intersection (Movement) Storage
(ft)
Existing 2016 Future Without
Development (2019) Future With
Development (2019) Future With
Development (2025)
Saturday Peak Saturday Peak Saturday Peak Saturday Peak
LOS Delay 95th Queue
LOS Delay 95th Queue
LOS Delay 95th Queue
LOS Delay
95th Queue
2) N Quinn Street and 18th Street N
Overall Intersection (Unsignalized) A 0.6 A 0.7 A 1.8 A 1.7
Westbound Left/Right 315 B 10.7 3 B 10.7 3 B 10.8 8 B 10.9 8Northbound Thru/Right 375 A 0 0 A 0 0 A 0 0 A 0 0Southbound Left/Thru 200 A 7.7 0 A 7.8 0 A 7.8 3 A 7.9 3
3) N Quinn Street and Wilson Boulevard
Overall Intersection (Signalized) C 21.3 C 21.2 C 20.5 C 20.1
Westbound Thru 325 B 18.2 100 B 18.5 112 C 20.3 135 C 20.3 141Westbound Right 85 C 34.7 35 C 33.7 33 C 27.4 26 C 25.6 25Southbound Right 375 B 14.5 128 B 13.8 138 B 13.4 139 B 13.5 142
4) N Pierce Street and Wilson Boulevard
Overall Intersection (Signalized) B 19.8 B 19.9 B 18.4 B 18.5
Westbound Left/Thru 675 B 12.3 181 B 13.4 218 B 12.6 220 B 12.8 232Northbound Left 250 D 40 170 D 40.2 185 D 38.4 185 D 38.6 190
5) N Pierce Street and Clarendon Boulevard
Overall Intersection (Signalized) A 8.6 A 9.1 B 10.1 B 10.4
Eastbound Left/Thru 500 A 3.6 99 A 3.8 115 A 5.5 146 A 5.7 157Eastbound Thru/Right 500 A 3.6 99 A 3.8 115 A 5.5 146 A 5.7 157Northbound Thru/Right 185 D 36.6 46 D 36.5 53 C 32.6 52 C 32.6 54Southbound Left/Thru 250 C 30.6 48 C 34.4 56 C 26.8 57 C 28.4 60
6) New Street and 18th Street N
Overall Intersection (Unsignalized) ‐ ‐ ‐ ‐ A 5.3 A 5.2
Eastbound Thru/Right ‐ ‐ ‐ ‐ ‐ ‐ A 0 0 A 0 0
Westbound Left/Thru ‐ ‐ ‐ ‐ ‐ ‐ A 7.3 0 A 7.3 0
Northbound Left/Right ‐ ‐ ‐ ‐ ‐ ‐ A 9 5 A 9 5
7) New Street and Wilson Boulevard
Overall Intersection (Unsignalized) ‐ ‐ ‐ ‐ A 1.6 A 1.5
Westbound Thru/Right ‐ ‐ ‐ ‐ ‐ ‐ A 0 0 A 0 0
Southbound Right ‐ ‐ ‐ ‐ ‐ ‐ B 12.6 18 B 12.9 20
8) N Oak Street and Key Boulevard
Overall Intersection (Unsignalized) A 4.4 A 4.6 A 5.1 A 5.2
Eastbound Thru/Right 285 A 0 0 A 0 0 A 0 0 A 0 0Westbound Left/Thru 150 A 7.8 3 A 7.8 5 A 7.8 5 A 7.8 5Northbound Left/Right 200 B 11.2 13 B 11.4 15 B 11.6 18 B 11.7 20
9) N Oak Street and 18th Street N
Overall Intersection (Unsignalized) A 2.2 A 1.9 A 2.9 A 2.9
Eastbound Left/Right 850 B 10 3 B 10.1 3 B 10.5 8 B 10.6 8Northbound Left/Thru 200 A 7.7 3 A 7.7 3 A 7.7 3 A 7.7 3Southbound Thru/Right 200 A 0 0 A 0 0 A 0 0 A 0 0
10) N Oak Street and Wilson Boulevard Overall Intersection (Signalized) C 23.2 C 23.2 C 27.2 ‐ ‐ Westbound Thru 125 B 16 81 B 16.5 100 B 18.6 118 ‐ ‐ ‐
Westbound Thru/Right 75 B 16 81 B 16.5 100 B 18.6 118 ‐ ‐ ‐
Northbound Left/Thru 25 D 47.6 130 D 49.3 138 E 57.3 m178 ‐ ‐ ‐
Southbound Thru/Right 200 C 25.7 51 C 25.6 57 C 26.1 57 ‐ ‐ ‐
10) N Oak Street and Wilson Boulevard (Mitigated)
Overall Intersection (Signalized) ‐ ‐ ‐ ‐ C 25 C 25
Westbound Thru 125 ‐ ‐ ‐ ‐ ‐ ‐ B 17.2 113 B 17.4 120
Westbound Thru/Right 75 ‐ ‐ ‐ ‐ ‐ ‐ B 17.2 113 B 17.4 120
Northbound Left/Thru 25 ‐ ‐ ‐ ‐ ‐ ‐ D 53.3 m177 D 53.5 m177
Southbound Thru/Right 200 ‐ ‐ ‐ ‐ ‐ ‐ C 21.7 53 C 21.9 56
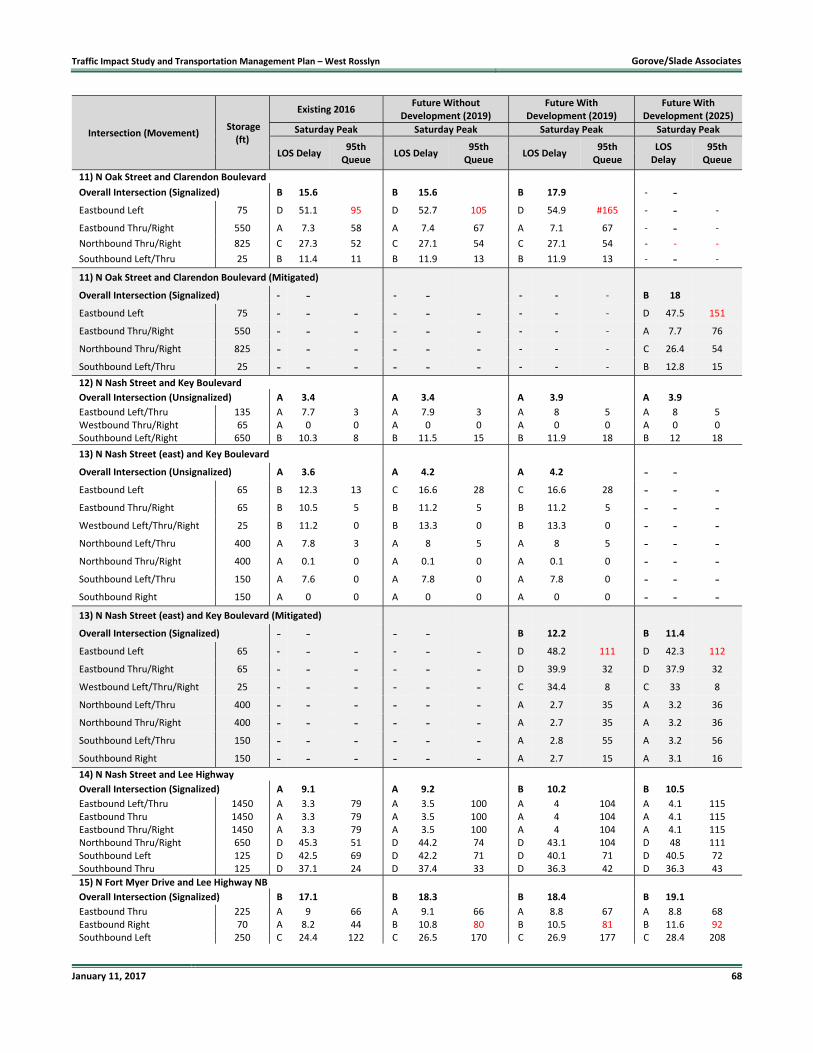
Traffic Impact Study and Transportation Management Plan – West Rosslyn Gorove/Slade Associates
January 11, 2017 68
Intersection (Movement) Storage
(ft)
Existing 2016 Future Without
Development (2019) Future With
Development (2019) Future With
Development (2025)
Saturday Peak Saturday Peak Saturday Peak Saturday Peak
LOS Delay 95th Queue
LOS Delay 95th Queue
LOS Delay 95th Queue
LOS Delay
95th Queue
11) N Oak Street and Clarendon Boulevard Overall Intersection (Signalized) B 15.6 B 15.6 B 17.9 ‐ ‐ Eastbound Left 75 D 51.1 95 D 52.7 105 D 54.9 #165 ‐ ‐ ‐
Eastbound Thru/Right 550 A 7.3 58 A 7.4 67 A 7.1 67 ‐ ‐ ‐
Northbound Thru/Right 825 C 27.3 52 C 27.1 54 C 27.1 54 ‐ ‐ ‐
Southbound Left/Thru 25 B 11.4 11 B 11.9 13 B 11.9 13 ‐ ‐ ‐
11) N Oak Street and Clarendon Boulevard (Mitigated)
Overall Intersection (Signalized) ‐ ‐ ‐ ‐ ‐ ‐ ‐ B 18
Eastbound Left 75 ‐ ‐ ‐ ‐ ‐ ‐ ‐ ‐ ‐ D 47.5 151
Eastbound Thru/Right 550 ‐ ‐ ‐ ‐ ‐ ‐ ‐ ‐ ‐ A 7.7 76
Northbound Thru/Right 825 ‐ ‐ ‐ ‐ ‐ ‐ ‐ ‐ ‐ C 26.4 54
Southbound Left/Thru 25 ‐ ‐ ‐ ‐ ‐ ‐ ‐ ‐ ‐ B 12.8 15
12) N Nash Street and Key Boulevard
Overall Intersection (Unsignalized) A 3.4 A 3.4 A 3.9 A 3.9
Eastbound Left/Thru 135 A 7.7 3 A 7.9 3 A 8 5 A 8 5Westbound Thru/Right 65 A 0 0 A 0 0 A 0 0 A 0 0Southbound Left/Right 650 B 10.3 8 B 11.5 15 B 11.9 18 B 12 18
13) N Nash Street (east) and Key Boulevard Overall Intersection (Unsignalized) A 3.6 A 4.2 A 4.2 ‐ ‐ Eastbound Left 65 B 12.3 13 C 16.6 28 C 16.6 28 ‐ ‐ ‐ Eastbound Thru/Right 65 B 10.5 5 B 11.2 5 B 11.2 5 ‐ ‐ ‐ Westbound Left/Thru/Right 25 B 11.2 0 B 13.3 0 B 13.3 0 ‐ ‐ ‐ Northbound Left/Thru 400 A 7.8 3 A 8 5 A 8 5 ‐ ‐ ‐ Northbound Thru/Right 400 A 0.1 0 A 0.1 0 A 0.1 0 ‐ ‐ ‐ Southbound Left/Thru 150 A 7.6 0 A 7.8 0 A 7.8 0 ‐ ‐ ‐ Southbound Right 150 A 0 0 A 0 0 A 0 0 ‐ ‐ ‐ 13) N Nash Street (east) and Key Boulevard (Mitigated)
Overall Intersection (Signalized) ‐ ‐ ‐ ‐ B 12.2 B 11.4
Eastbound Left 65 ‐ ‐ ‐ ‐ ‐ ‐ D 48.2 111 D 42.3 112
Eastbound Thru/Right 65 ‐ ‐ ‐ ‐ ‐ ‐ D 39.9 32 D 37.9 32
Westbound Left/Thru/Right 25 ‐ ‐ ‐ ‐ ‐ ‐ C 34.4 8 C 33 8
Northbound Left/Thru 400 ‐ ‐ ‐ ‐ ‐ ‐ A 2.7 35 A 3.2 36
Northbound Thru/Right 400 ‐ ‐ ‐ ‐ ‐ ‐ A 2.7 35 A 3.2 36
Southbound Left/Thru 150 ‐ ‐ ‐ ‐ ‐ ‐ A 2.8 55 A 3.2 56
Southbound Right 150 ‐ ‐ ‐ ‐ ‐ ‐ A 2.7 15 A 3.1 16
14) N Nash Street and Lee Highway
Overall Intersection (Signalized) A 9.1 A 9.2 B 10.2 B 10.5
Eastbound Left/Thru 1450 A 3.3 79 A 3.5 100 A 4 104 A 4.1 115Eastbound Thru 1450 A 3.3 79 A 3.5 100 A 4 104 A 4.1 115Eastbound Thru/Right 1450 A 3.3 79 A 3.5 100 A 4 104 A 4.1 115Northbound Thru/Right 650 D 45.3 51 D 44.2 74 D 43.1 104 D 48 111Southbound Left 125 D 42.5 69 D 42.2 71 D 40.1 71 D 40.5 72Southbound Thru 125 D 37.1 24 D 37.4 33 D 36.3 42 D 36.3 43
15) N Fort Myer Drive and Lee Highway NB
Overall Intersection (Signalized) B 17.1 B 18.3 B 18.4 B 19.1
Eastbound Thru 225 A 9 66 A 9.1 66 A 8.8 67 A 8.8 68Eastbound Right 70 A 8.2 44 B 10.8 80 B 10.5 81 B 11.6 92Southbound Left 250 C 24.4 122 C 26.5 170 C 26.9 177 C 28.4 208
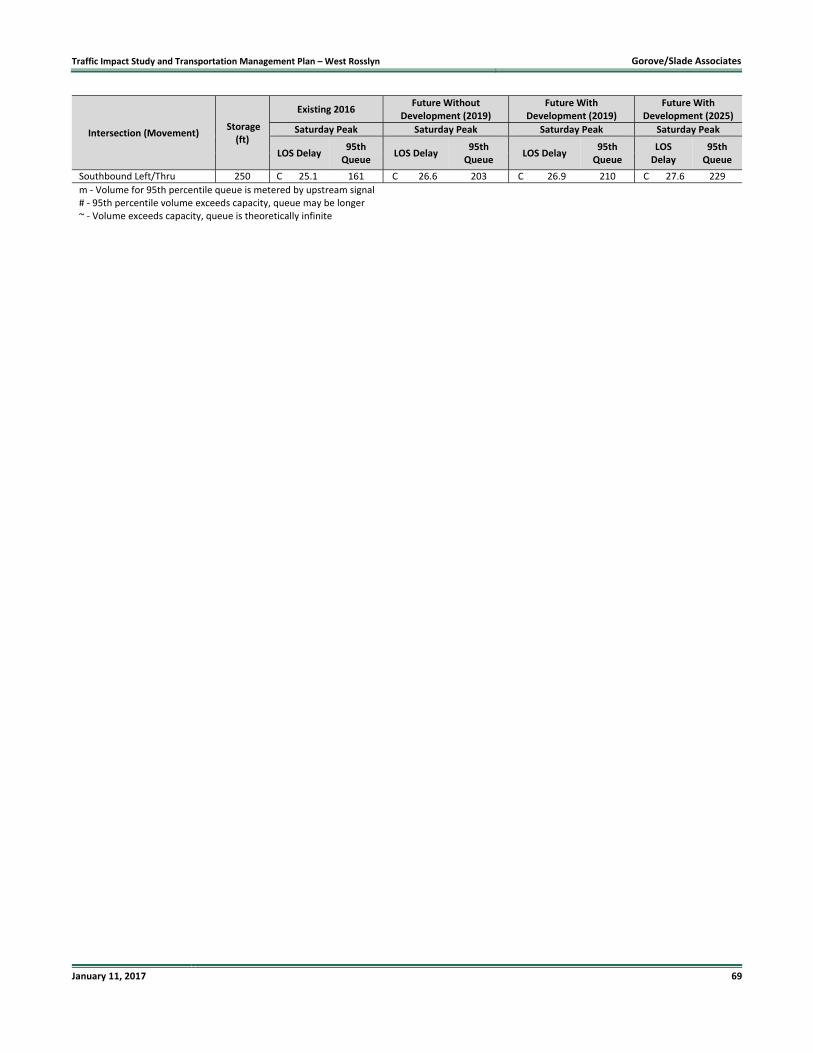
Traffic Impact Study and Transportation Management Plan – West Rosslyn Gorove/Slade Associates
January 11, 2017 69
Intersection (Movement) Storage
(ft)
Existing 2016 Future Without
Development (2019) Future With
Development (2019) Future With
Development (2025)
Saturday Peak Saturday Peak Saturday Peak Saturday Peak
LOS Delay 95th Queue
LOS Delay 95th Queue
LOS Delay 95th Queue
LOS Delay
95th Queue
Southbound Left/Thru 250 C 25.1 161 C 26.6 203 C 26.9 210 C 27.6 229
m ‐ Volume for 95th percentile queue is metered by upstream signal # ‐ 95th percentile volume exceeds capacity, queue may be longer ~ ‐ Volume exceeds capacity, queue is theoretically infinite
Traffic Impact Study and Transportation Management Plan – West Rosslyn Gorove/Slade Associates
January 11, 2017 70
TRAFFIC SIGNAL WARRANT ANALYSIS
This section presents the evaluation of the traffic signal control warrant for the intersection of N Nash Street (east) and Key
Boulevard. The signal warrant analyses were performed following the procedures outlined in the 2009 Manual on Uniform
Traffic Control Devices (MUTCD) for Warrant 3 (peak‐hour vehicular volume).
A signal is not needed at the intersection of N Nash Street (east) and Key Boulevard under existing conditions; however, a
considerable number of vehicle trips will be added to the study area and this intersection with the 10 planned developments
near the West Rosslyn development. Therefore, the future without development (2019) conditions traffic volumes were
analyzed. The data points consider the traffic on Key Boulevard as the minor street traffic and the total traffic on N Nash
Street as the major street traffic. The major street (N Nash Street) is analyzed as two lanes, and the minor street (Key
Boulevard) is analyzed as two lanes. According to the MUTCD, only one warrant needs to be satisfied to allow for the
installation of a traffic control signal.
Warrant 3: 4 Hour Vehicular Volume
Typically, hourly traffic volumes of an average day are plotted on the MUTCD Figure 4C‐3 and, if any point is above the
appropriate curve, the warrant criterion is met. As noted in the MUTCD Figure 4C‐3, 150 vehicles per hour apply as the lower
threshold volume for a minor‐street approach with two lanes.
The future without development traffic conditions are plotted on Figure 28. As shown in Figure 28, one of the points lie above
the curve for 2 lanes on the major and 2 lanes on the minor streets. The requirement for the warrant to be satisfied is data
points for any hour in an average day that lie above the corresponding curve in Figure 4C‐3. Therefore, Warrant 3 is satisfied.
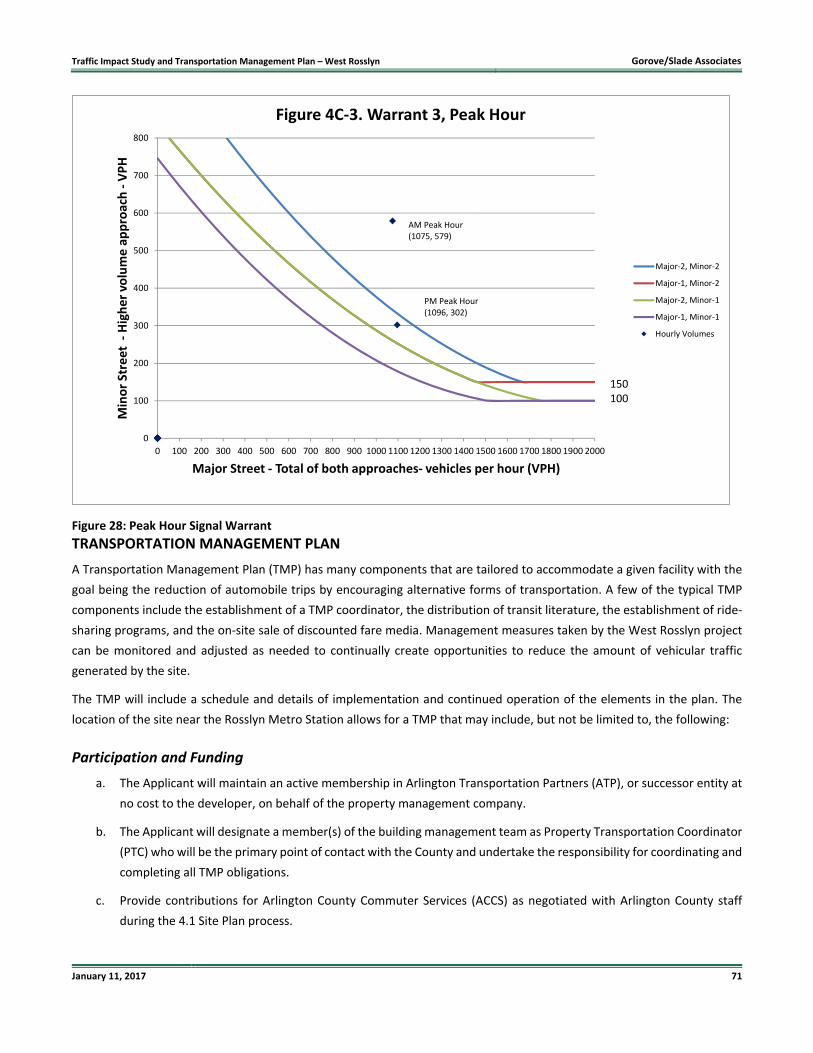
Traffic Impact Study and Transportation Management Plan – West Rosslyn Gorove/Slade Associates
January 11, 2017 71
Figure 28: Peak Hour Signal Warrant
TRANSPORTATION MANAGEMENT PLAN
A Transportation Management Plan (TMP) has many components that are tailored to accommodate a given facility with the
goal being the reduction of automobile trips by encouraging alternative forms of transportation. A few of the typical TMP
components include the establishment of a TMP coordinator, the distribution of transit literature, the establishment of ride‐
sharing programs, and the on‐site sale of discounted fare media. Management measures taken by the West Rosslyn project
can be monitored and adjusted as needed to continually create opportunities to reduce the amount of vehicular traffic
generated by the site.
The TMP will include a schedule and details of implementation and continued operation of the elements in the plan. The
location of the site near the Rosslyn Metro Station allows for a TMP that may include, but not be limited to, the following:
Participation and Funding
a. The Applicant will maintain an active membership in Arlington Transportation Partners (ATP), or successor entity at
no cost to the developer, on behalf of the property management company.
b. The Applicant will designate a member(s) of the building management team as Property Transportation Coordinator
(PTC) who will be the primary point of contact with the County and undertake the responsibility for coordinating and
completing all TMP obligations.
c. Provide contributions for Arlington County Commuter Services (ACCS) as negotiated with Arlington County staff
during the 4.1 Site Plan process.
0
100
200
300
400
500
600
700
800
0 100 200 300 400 500 600 700 800 900 1000 1100 1200 1300 1400 1500 1600 1700 1800 1900 2000
Minor Street ‐Higher vo
lume approach ‐VPH
Major Street ‐ Total of both approaches‐ vehicles per hour (VPH)
Figure 4C‐3. Warrant 3, Peak Hour
Major‐2, Minor‐2
Major‐1, Minor‐2
Major‐2, Minor‐1
Major‐1, Minor‐1
Hourly Volumes
150 100
AM Peak Hour (1075, 579)
PM Peak Hour (1096, 302)
Traffic Impact Study and Transportation Management Plan – West Rosslyn Gorove/Slade Associates
January 11, 2017 72
Facilities and Improvements
a. Provide in the new building one information display with transportation related information for residents,
employees and visitors, the content/design/location of which shall be mutually agreeable to ACCS and Applicant.
b. Comply with requirements of the Site Plan conditions to provide bicycle parking/storage facilities and construction
worker parking.
Parking Management Plan
a. Prepare a Parking Management Plan to show how adjacent curb space to the site will be designated for parking and
potential on‐street loading zones.
b. Provide effective directional signage to direct residents and visitors to appropriate location on the property, to
include provision for the items specified in the Parking Management Plan.
Promotions, Services, Policies
a. Provide one time, per person, at initial lease‐up, to residents and on‐site property management employees, the
choice of one of the following:
i. $65 Metro fare on a SmarTrip card
ii. A one year bikeshare membership
iii. A one year carshare membership
b. Provide website hotlinks to CommuterPage.comTM under a “transportation information” heading from the property
manager’s websites regarding this development.
c. Distribute new‐resident and new‐employee packages, materials provided by Arlington County including site‐specific
transit‐related information to all residents and all on‐site employees of the building management company.
d. Place a reference to the Rosslyn Metro and nearby bus routes in promotional materials and advertisements.
e. Cooperate, at no cost to the Applicant, with Arlington County to assist the County in implementing a transit‐
advertising program that will distribute information four times per year to all residents and employees.
f. Participate in regionally sponsored clean air, transit, and traffic mitigation promotions by posting notice of such
promotions in locations within the building.
g. Provide marketing support to encourage ridesharing.
Performance and Monitoring
a. Reimburse the County, for a specified amount subject to CPI, for and participate in a transportation performance
monitoring study at two years, five years, and at each subsequent five years (at the County’s option) after issuance
of first Certificate of Occupancy.
b. During the first year of startup of the TMP and on an annual basis thereafter for a duration of years to be determined,
the Applicant will submit an annual letter to the County Manager describing the TDM related activities of the site.
Traffic Impact Study and Transportation Management Plan – West Rosslyn Gorove/Slade Associates
January 11, 2017 73
CONCLUSION
The site is located in the West Rosslyn area of Arlington, Virginia, south of 18th Street N, north of Wilson Boulevard, east of N
Quinn Street, and west of N Oak Street. The vehicular study area includes three (3) intersections along N Quinn Street, 18th
Street N, Key Boulevard, and N Nash Street, four (4) intersections along N Oak Street and Wilson Boulevard, and two (2)
intersections along Lee Highway NB and N Pierce Street. Regional access to the site is provided via I‐66/US29 and the George
Washington Memorial Parkway from the north and east, US 50 (Arlington Blvd) to the south and Wilson Boulevard/Clarendon
Boulevard to the west. Immediate vehicular access to the site will be provided via a new north‐south street which will bisect
the site and connect Wilson Boulevard to 18th Street N.
According to Arlington County’s General Land Use Plan (GLUP), this site is currently listed as “High Office‐Apartment‐Hotel”
and “Public Space.” The new development will be divided in two parts, with the eastern parcel including one residential tower
and space for ground‐floor retail while the western parcel will include a tower with office space, additional ground floor retail,
and the redevelopment of the existing Rosslyn Highlands Park. The proposed project build‐out year is 2019.
The analysis presented in this report supports the following major conclusions:
Existing Conditions (2016)
The subject site is well‐served by transit:
The site is approximately less than one‐half mile walking distance from the Rosslyn Metro station, which serve
the Blue, Orange, and Silver lines.
There are four bus stops within one block of the site. These stops are directly served by WMATA (Metrobus)
and Arlington Transit (ART) routes.
Vehicular traffic operations in the study area are good overall. All intersection movements within the study area
operate at the target Level of Service (LOS) D or better during the AM, PM, and Saturday peak hours, with the
exception of the following:
N Quinn Street and Wilson Boulevard
Southbound right lane (AM peak hour)
N Oak Street and Key Boulevard
Northbound left/right lane (AM peak hour)
N Oak Street and Wilson Boulevard
Northbound left/thru lane (AM peak hour)
N Nash Street (east) and Key Boulevard (AM peak hour)
Eastbound left lane (AM and PM peak hour)
N Nash Street and Lee Highway
Southbound left lane (AM peak hour)
None of the movements listed above cause the intersections to operate below acceptable LOS thresholds with the
exception of the intersection of N Nash Street (east) and Key Boulevard in the AM peak hour. Signalization as
mitigation at this intersection is considered.

Traffic Impact Study and Transportation Management Plan – West Rosslyn Gorove/Slade Associates
January 11, 2017 74
Future Conditions without Development (2019)
Historical roadway volumes indicate negative growth has occurred in the study area; however a 0.5% annual
background growth was applied at the study intersections as per agreement with VDOT and Arlington County. Ten
planned background developments in the vicinity of the site were also taken into consideration. The trips generated
by these sites were added to the roadway network to reflect future conditions without the proposed development
in 2019.
Under future without development conditions, all movements at the study intersections operate at acceptable levels
of service consistent with the Existing Conditions scenario, with the exception of the following:
N Quinn Street and Key Boulevard
Southbound left/thru lane (AM peak hour)
N Pierce Street and Clarendon Boulevard
Southbound left/thru lane (AM peak hour)
N Oak Street and Clarendon Boulevard
Eastbound left lane (AM peak hour)
N Nash Street (east) and Key Boulevard (PM peak hour)
N Nash Street and Lee Highway
Southbound left lane (PM peak hour)
None of the movements listed above cause the intersections to operate below acceptable LOS thresholds with the
exception of the intersection of N Nash Street (east) and Key Boulevard in the PM peak hour. Signalization as
mitigation at this intersection is considered.
Future Conditions with Development (2019)
The proposed mixed‐use development will generate approximately 268 net trips in the AM peak hour, 348 net trips
in the PM peak hour, and 287 net trips in the Saturday peak hour.
Under future with development conditions, all intersection movements within the study area operate at acceptable
levels of service consistent with the Future without Development scenario, with the exception of the following:
N Quinn Street and Key Boulevard (AM peak hour)
Southbound left/thru lanes (AM peak hour)
N Pierce Street and Clarendon Boulevard
Southbound left/thru lane (PM peak hour)
N Oak Street and Wilson Boulevard (AM peak hour)
Northbound left/thru lane (PM and Saturday peak hour)
N Oak Street and Clarendon Boulevard
Eastbound left lane (PM peak hour)

Traffic Impact Study and Transportation Management Plan – West Rosslyn Gorove/Slade Associates
January 11, 2017 75
All movements caused to operate below acceptable LOS thresholds by the proposed development have been
mitigated with signal timing adjustments. No additional mitigations are required.
Future Conditions with Development (2025)
There are no additional site‐added trips between 2019 and 2025.
Under future (2025) with development conditions, all intersection movements within the study area continue to
operate consistent with future (2019) with development results with the exception of the following:
N Quinn Street and Key Boulevard
Westbound left/thru/right lane (AM peak hour)
Southbound left/thru lane (AM peak hour)
Other movements caused to operate below acceptable LOS thresholds by the proposed development have been
mitigated with signal timing adjustments. Although movements at the intersection of N Quinn Street and Key
Boulevard exceeds County standards, the 2025 analysis was done as a planning scenario; therefore, no mitigation is
proposed at this intersection.
Transportation Management Plan
A TMP will be required for the project based on the County’s requirements. The initial framework for a TMP is
included in this report. The ultimate TMP will be determined per the approved site plan conditions.