Embed Size (px)
Citation preview
8/7/2019 Trans Resp
http://slidepdf.com/reader/full/trans-resp 1/18
Transpiration and Respiration of Fruits and Vegetables
Bryan R. Becker, Ph.D., P.E. and Brian A. Fricke1
ABSTRACT
Transpiration is the process by which fresh fruits and vegetables lose moisture. This process
includes the transport of moisture through the skin of the commodity, the evaporation of this moisture from
the commodity surface and the convective mass transport of the moisture to the surroundings. This paper
discusses the pertinent factors which affect transpiration and identifies mathematical models for predicting
the rate of transpiration. Predicted transpiration coefficients and transpiration rates are compared to
experimental data found in the literature. Respiration is the chemical process by which fruits and vegetables
convert sugars and oxygen into carbon dioxide, water, and heat. The effect of respiration upon the
transpiration rate of commodities is discussed and correlations are developed to estimate the respiratory heat
generation of various commodities.
Keywords. Fresh fruits and vegetables, Mathematical model, Vapor pressure, Rates
INTRODUCTION
During postharvest handling and storage, fresh fruits and vegetables lose moisture through their
skins via the transpiration process. Commodity deterioration, such as shriveling or impaired flavor, may
result if moisture loss is high. In order to minimize losses due to transpiration, and thereby increase both
market quality and shelf life, commodities must be stored in a low temperature, high humidity environment.
In addition to proper storage conditions, various skin coatings and moisture-proof films can be used during
commodity packaging to significantly reduce transpiration and extend storage life (Ben-Yehoshua, 1969).
Metabolic activity in fresh fruits and vegetables continues for a short period after harvest. The
energy required to sustain this activity comes from the respiration process (Mannapperuma, 1991).
Respiration involves the oxidation of sugars to produce carbon dioxide, water and heat. The storage life of acommodity is influenced by its respiratory activity. By storing a commodity at low temperature, respiration
is reduced and senescence is delayed, thus extending storage life (Halachmy and Mannheim, 1991). Proper
control of the oxygen and carbon dioxide concentrations surrounding a commodity is also effective in
reducing the rate of respiration.
Properly designed and operated refrigerated storage facilities will extend the storage life of
commodities by providing a low temperature, high humidity environment which reduces moisture loss and
decreases respiratory activity. A thorough knowledge of the transpiration and respiration processes will
allow both the designer and operator of cold storage facilities to achieve optimum storage conditions. This
paper identifies the pertinent factors which influence the transpiration and respiration processes. In addition,
mathematical models for estimating transpiration rates are identified. Furthermore, correlations are
developed to determine the rate of carbon dioxide production and the heat generation due to respiration.
FACTORS AFFECTING TRANSPIRATION
1Bryan R. Becker, Ph.D., P.E. is an Associate Professor and Brian A. Fricke is a Research
Assistant in the Mechanical and Aerospace Engineering Department, University of Missouri-Kansas City,
Kansas City, MO 64110-2823.
8/7/2019 Trans Resp
http://slidepdf.com/reader/full/trans-resp 2/18
Moisture loss from a fruit or vegetable is driven by a difference in water vapor pressure between
the product surface and the environment. The product surface may be assumed to be saturated, and thus,
the water vapor pressure at the commodity surface is equal to the water vapor saturation pressure evaluated
at the product's surface temperature. However, dissolved substances in the moisture of the commodity tend
to lower the vapor pressure at the evaporating surface slightly (Sastry et al., 1978).
Evaporation which occurs at the product surface is an endothermic process which will cool the
surface, thus lowering the vapor pressure at the surface and reducing transpiration. Respiration within thefruit or vegetable, on the other hand, tends to increase the product's temperature, thus raising the vapor
pressure at the surface and increasing transpiration. Furthermore, the respiration rate is itself a function of
the commodity's temperature (Gaffney et al., 1985). In addition, factors such as surface structure, skin
permeability, and air flow also effect the transpiration rate (Sastry et al., 1978). Thus, it can be seen that
within fruits and vegetables, complex heat and mass transfer phenomena occur, which must be considered
when evaluating the transpiration rates of commodities.
TRANSPIRATION MODELS
The basic form of the transpiration model is given as follows:
In its simplest form, the transpiration coefficient, k t , is considered to be a constant for a particular
commodity. Additionally, it is assumed that the commodity surface temperature and the ambient air
temperature are equal. Thus, assuming that the surface is in a saturated condition, the surface water vapor
pressure, Ps , becomes the water vapor saturation pressure evaluated at the ambient temperature.
Sastry et al. (1978) performed an extensive literature review, compiled a list of constant
transpiration coefficients for various fruits and vegetables, and discussed a simplified transpiration model.
The compiled transpiration coefficients omitted any dependence upon water vapor pressure deficit, skin
permeability, or air velocity.
Various researchers (Pieniazek, 1942; and Lentz and Rooke, 1964) have noted that the
transpiration rate decreases at high vapor pressure deficits. Drying of the skin tissue, or the decrease in skinpermeability which results from the drying, was believed to be the cause of reduced transpiration at high
vapor pressure deficits. Fockens and Meffert (1972) modified the simple transpiration coefficient to model
variable skin permeability and to account for air flow rate. Their modified transpiration coefficient takes the
following form:
The air film mass transfer coefficient, k a , describes the convective mass transfer which occurs at the
surface of the commodity and is a function of air flow rate. The skin mass transfer coefficient, k s ,
describes the skin's diffusional resistance to moisture migration and is a function of the water vapor pressuredeficit. Hence, variable air flow rate and skin permeability were both accounted for in the Fockens and
Meffert transpiration coefficient model. However, evaporative cooling, respiration, and vapor pressure
lowering effect were neglected in Fockens and Meffert's work.
Various researchers, Lentz and Rooke (1964), Gac (1971), Gentry (1970), Dypolt (1972) and
Talbot (1973), have noted that evaporative cooling and respiration have a significant influence upon the
surface temperature of the commodity and thus, the commodity surface temperature and the ambient air
temperature may not be equal. Therefore, the water vapor pressure at the commodity surface may not be
equal to the water vapor saturation pressure evaluated at the ambient air temperature. The surface water
)P-P(k =m ast& (1)
k
1 +
k
1
1 =k
sa
t (2)
8/7/2019 Trans Resp
http://slidepdf.com/reader/full/trans-resp 3/18
8/7/2019 Trans Resp
http://slidepdf.com/reader/full/trans-resp 4/18
The diffusional resistance, µ, is the ratio of the diffusion of water vapor in air to that of the diffusion of
water vapor through the porous skin of the commodity. When performing experiments on apples, Fockens
and Meffert noted that the quantity µs varied with humidity. At high humidity, the diffusional resistance
was found to be low. Fockens and Meffert attributed this to the swelling of skin cells due to the absorption
of moisture. Large intercellular spaces are then created and the resistance to diffusion is decreased. At low
humidity, the skin cells lose moisture and become flattened. The intercellular spaces become smaller and
the diffusional resistance is increased.
Sastry and Buffington (1982) also proposed a similar relation for the skin mass transfer coefficient:
However, in contrast to the observations of Fockens and Meffert, Sastry and Buffington noted that in their
experiments on tomatoes the skin mass transfer coefficient did not vary appreciably with vapor pressure
deficit.
As with the air film mass transfer coefficient, dimensional analysis of the skin mass transfer
coefficient indicates that the driving force is concentration. Thus, the skin mass transfer coefficient must be
converted from concentration to vapor pressure before it is used in the transpiration models:
Experimental Determination of the Skin Mass Transfer Coefficient
The skin mass transfer coefficient, k s, can be determined experimentally by placing the fruit or
vegetable into an environmental chamber, in which the dry bulb and dew point temperatures can be
controlled. The weight loss from the commodity is measured frequently during the course of the
experiment. The weight loss of the commodity includes both the moisture loss due to transpiration and the
carbon loss due to respiration.
Physical dimensions of the commodity, such as surface area, volume, and diameter, are measured
and an air flow rate reading past the commodity is also taken. With this information, the air film mass
transfer coefficient, k a , can be calculated using a Sherwood-Reynolds-Schmidt correlation.
Air temperature readings are taken and the surface temperature of the commodity is measured or
estimated with theoretical equations. The vapor pressure lowering effect at the product surface is
determined by analysis of the commodity's skin. Thus, the water vapor pressure at the commodity surface
and the water vapor pressure of the surrounding air can be determined.
The transpiration rate, m& 10, water vapor pressure difference, (Ps - Pa), and the air film mass
transfer coefficient, k a , are now known. The skin mass transfer coefficient, k s , can then be determined by
using the following transpiration model:
Experimental determination of the skin mass transfer coefficient, k s , has been performed by Chau
et al. (1987) and Gan and Woods (1989). These experimental values of k s , along with estimated values of
s =k sµ
δ′ (7)
s =k sδφ
′ (8)
k TR
1 =k s
O2H
s ′ (9)
k
1 +
k
1P-P
=m
as
as& (10)
8/7/2019 Trans Resp
http://slidepdf.com/reader/full/trans-resp 5/18
skin mass transfer coefficient for grapes, onions, plums and potatoes, are given in Table 1.
Determination of the Vapor Pressure Difference
In order to use the transpiration models, the difference between the water vapor pressure at the
evaporating surface of the commodity and the water vapor pressure in the ambient air must be determined.
The surface water vapor pressure is a function of the temperature at the surface of the commodity and thevapor pressure lowering effect (VPL) caused by dissolved substances. Thus, the water vapor pressure at
the evaporating surface, Ps , becomes:
Chau et al. (1987) have performed experiments to determine the vapor pressure lowering effect for various
fruits and vegetables (see Table 1). The ambient water vapor pressure is a function of both the ambient dry
and wet bulb temperatures and may be determined by psychrometric formulae.
P*VPL=P Tsat,s S(11)
8/7/2019 Trans Resp
http://slidepdf.com/reader/full/trans-resp 6/18
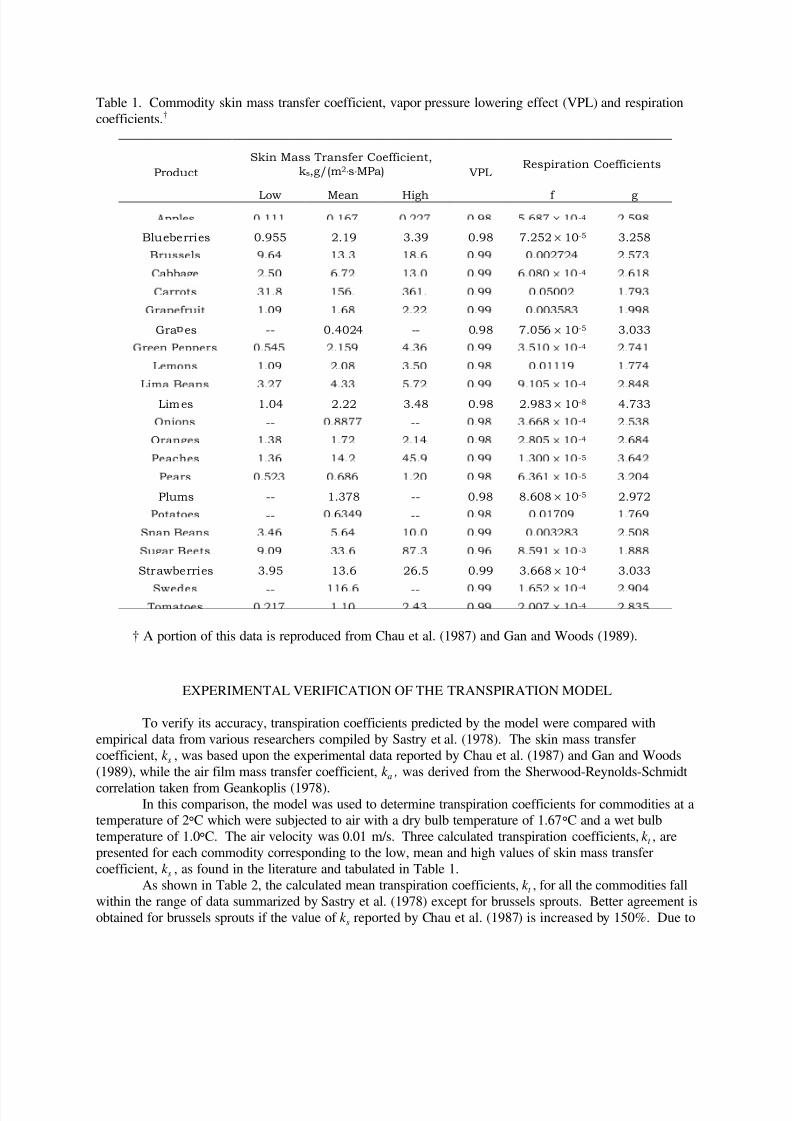
Table 1. Commodity skin mass transfer coefficient, vapor pressure lowering effect (VPL) and respiration
coefficients.†
Product
Skin Mass Transfer Coefficient,
ks,g/(m2⋅s⋅MPa) VPL Respiration Coefficients
Low Mean High f g
-4
Blueberries 0.955 2.19 3.39 0.98 7.252 × 10⁻⁵ 3.258
-4
Gra es -- 0.4024 -- 0.98 7.056 × 10⁻⁵ 3.033
-4
-4
Limes 1.04 2.22 3.48 0.98 2.983 × 10⁻⁸ 4.733
-- -- -4
-4
-5
-5
Plums -- 1.378 -- 0.98 8.608 × 10⁻⁵ 2.972
-- --
-3
Strawberries 3.95 13.6 26.5 0.99 3.668 × 10⁻⁴ 3.033
-- -- -4 -4
† A portion of this data is reproduced from Chau et al. (1987) and Gan and Woods (1989).
EXPERIMENTAL VERIFICATION OF THE TRANSPIRATION MODEL
To verify its accuracy, transpiration coefficients predicted by the model were compared with
empirical data from various researchers compiled by Sastry et al. (1978). The skin mass transfer
coefficient, k s , was based upon the experimental data reported by Chau et al. (1987) and Gan and Woods
(1989), while the air film mass transfer coefficient, k a , was derived from the Sherwood-Reynolds-Schmidt
correlation taken from Geankoplis (1978).In this comparison, the model was used to determine transpiration coefficients for commodities at a
temperature of 2°C which were subjected to air with a dry bulb temperature of 1.67°C and a wet bulb
temperature of 1.0°C. The air velocity was 0.01 m/s. Three calculated transpiration coefficients, k t , are
presented for each commodity corresponding to the low, mean and high values of skin mass transfer
coefficient, k s , as found in the literature and tabulated in Table 1.
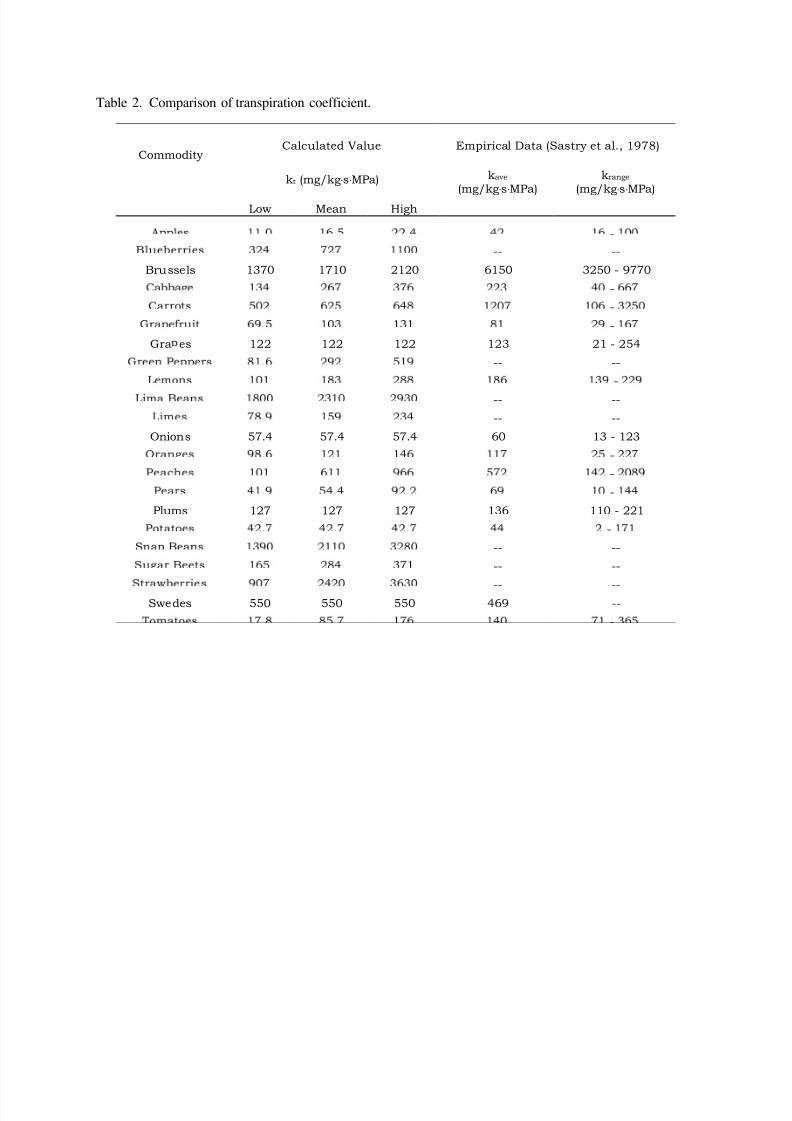
As shown in Table 2, the calculated mean transpiration coefficients, k t , for all the commodities fall
within the range of data summarized by Sastry et al. (1978) except for brussels sprouts. Better agreement is
obtained for brussels sprouts if the value of k s reported by Chau et al. (1987) is increased by 150%. Due to

8/7/2019 Trans Resp
http://slidepdf.com/reader/full/trans-resp 7/18
differences in the experimental techniques used by the various researchers, the empirical data shown in
Table 2 has a wide variation. Nevertheless, it is encouraging that the current model predicts transpiration
coefficients which agree well with this experimental data.
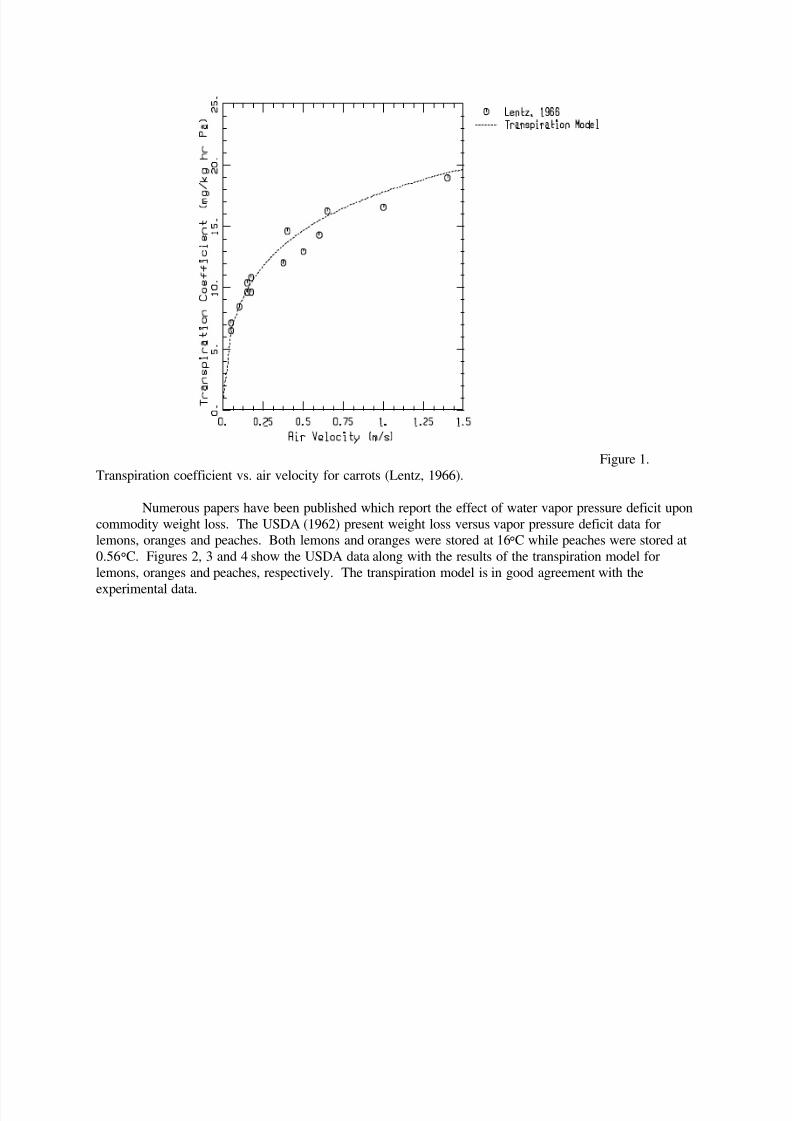
Lentz (1966) experimentally studied the effects of air velocity on the transpiration coefficient of
carrots. Air at a temperature of 1.0°C with a water vapor pressure deficit of 46.7 Pa flowed past the
carrots. Commodity weight loss was recorded at various air velocities ranging from 0 to 1.4 m/s. Figure 1
shows the experimentally determined transpiration coefficients versus air velocity along with thetranspiration coefficients calculated by the mathematical model. The transpiration model is in very good
agreement with Lentz's experimental data.
8/7/2019 Trans Resp
http://slidepdf.com/reader/full/trans-resp 8/18
Table 2. Comparison of transpiration coefficient.
CommodityCalculated Value Empirical Data (Sastry et al., 1978)
kt (mg/kg⋅s⋅MPa) kave
(mg/kg⋅s⋅MPa)
krange
(mg/kg⋅s⋅MPa)
Low Mean High
-
-- --
Brussels 1370 1710 2120 6150 3250 - 9770
-
-
-
Gra es 122 122 122 123 21 - 254
-- --
-
-- --
-- --
Onions 57.4 57.4 57.4 60 13 - 123
-
-
-
Plums 127 127 127 136 110 - 221
-
-- --
-- --
-- --Swedes 550 550 550 469 --
-
8/7/2019 Trans Resp
http://slidepdf.com/reader/full/trans-resp 9/18
Figure 1.
Transpiration coefficient vs. air velocity for carrots (Lentz, 1966).
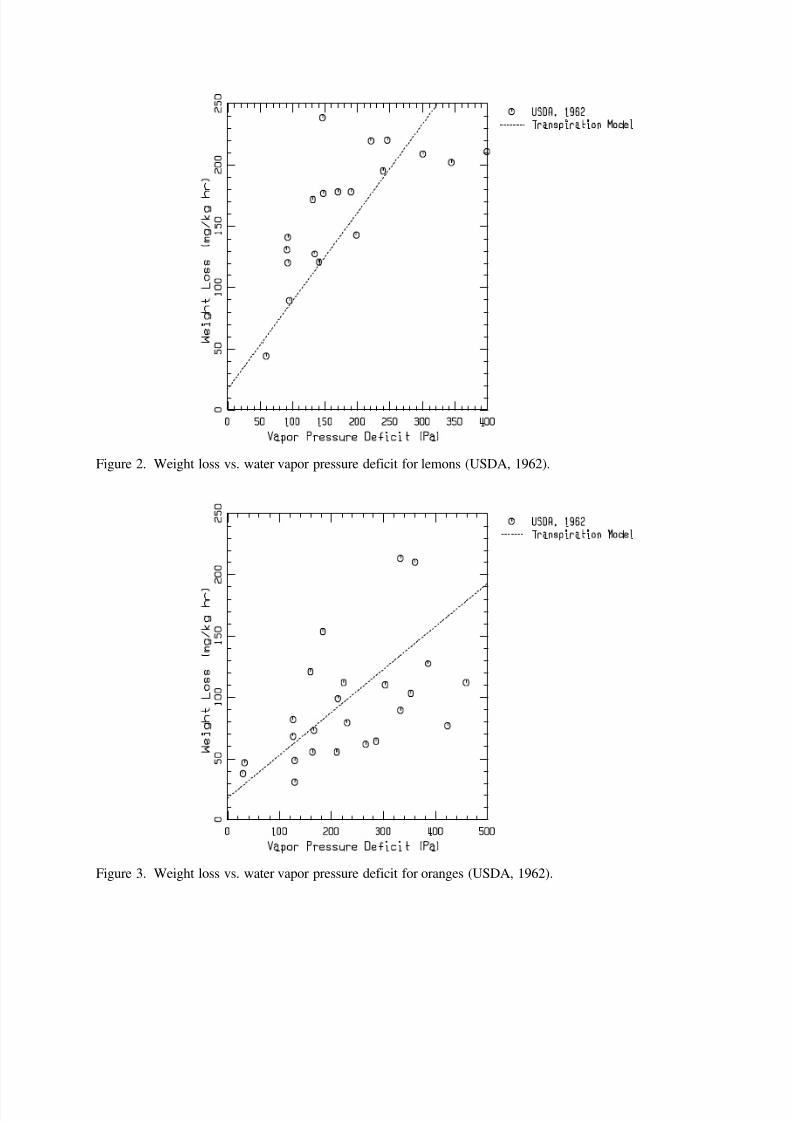
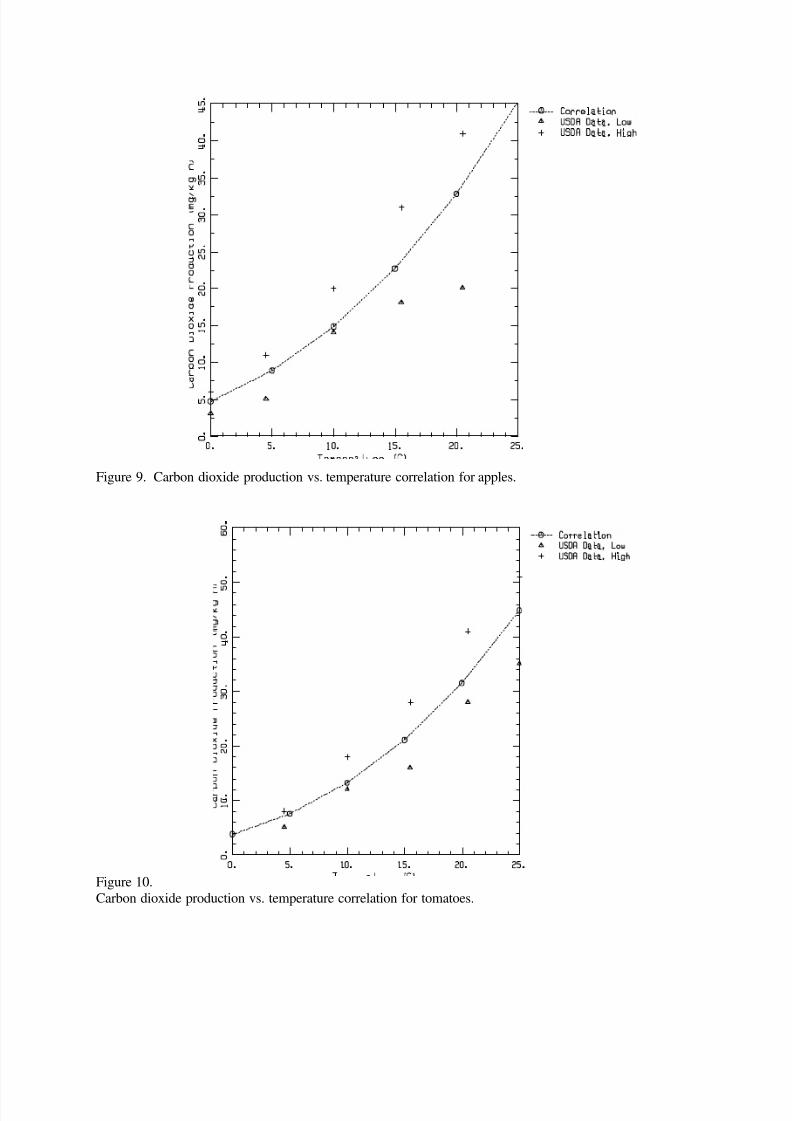
Numerous papers have been published which report the effect of water vapor pressure deficit upon
commodity weight loss. The USDA (1962) present weight loss versus vapor pressure deficit data for
lemons, oranges and peaches. Both lemons and oranges were stored at 16°C while peaches were stored at
0.56°C. Figures 2, 3 and 4 show the USDA data along with the results of the transpiration model for
lemons, oranges and peaches, respectively. The transpiration model is in good agreement with the
experimental data.
8/7/2019 Trans Resp
http://slidepdf.com/reader/full/trans-resp 10/18
Figure 2. Weight loss vs. water vapor pressure deficit for lemons (USDA, 1962).
Figure 3. Weight loss vs. water vapor pressure deficit for oranges (USDA, 1962).
8/7/2019 Trans Resp
http://slidepdf.com/reader/full/trans-resp 11/18
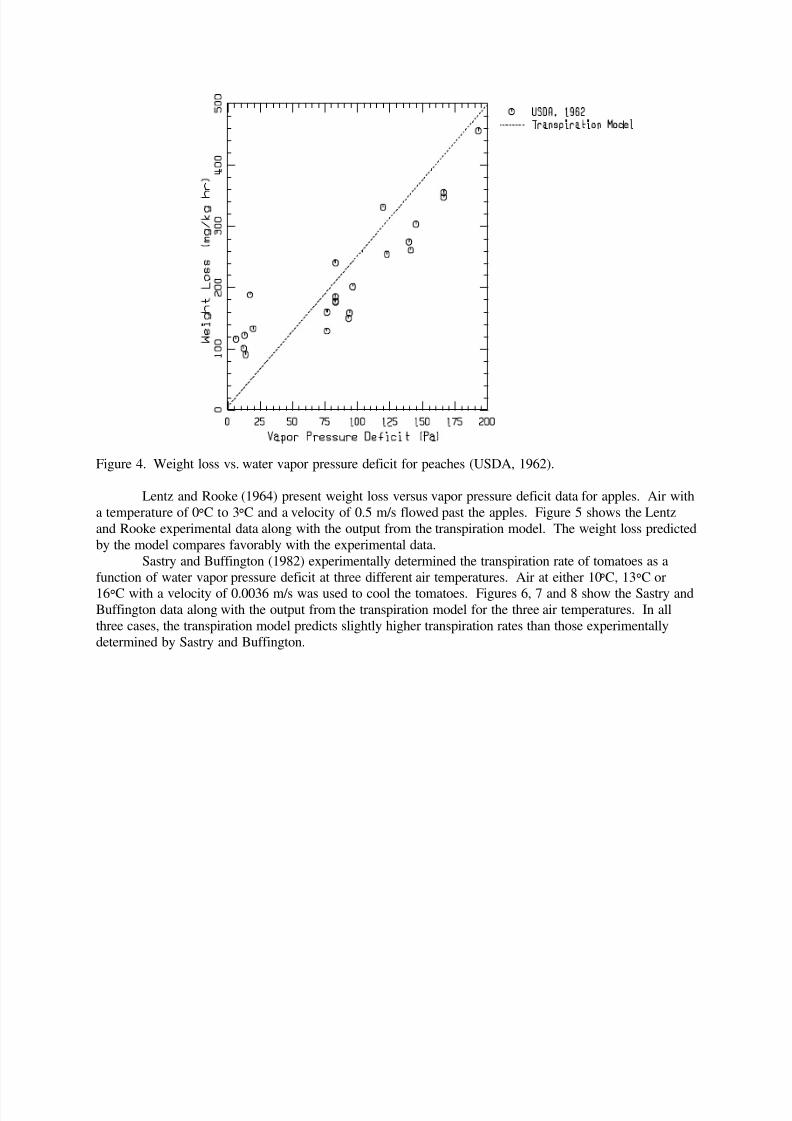
Figure 4. Weight loss vs. water vapor pressure deficit for peaches (USDA, 1962).
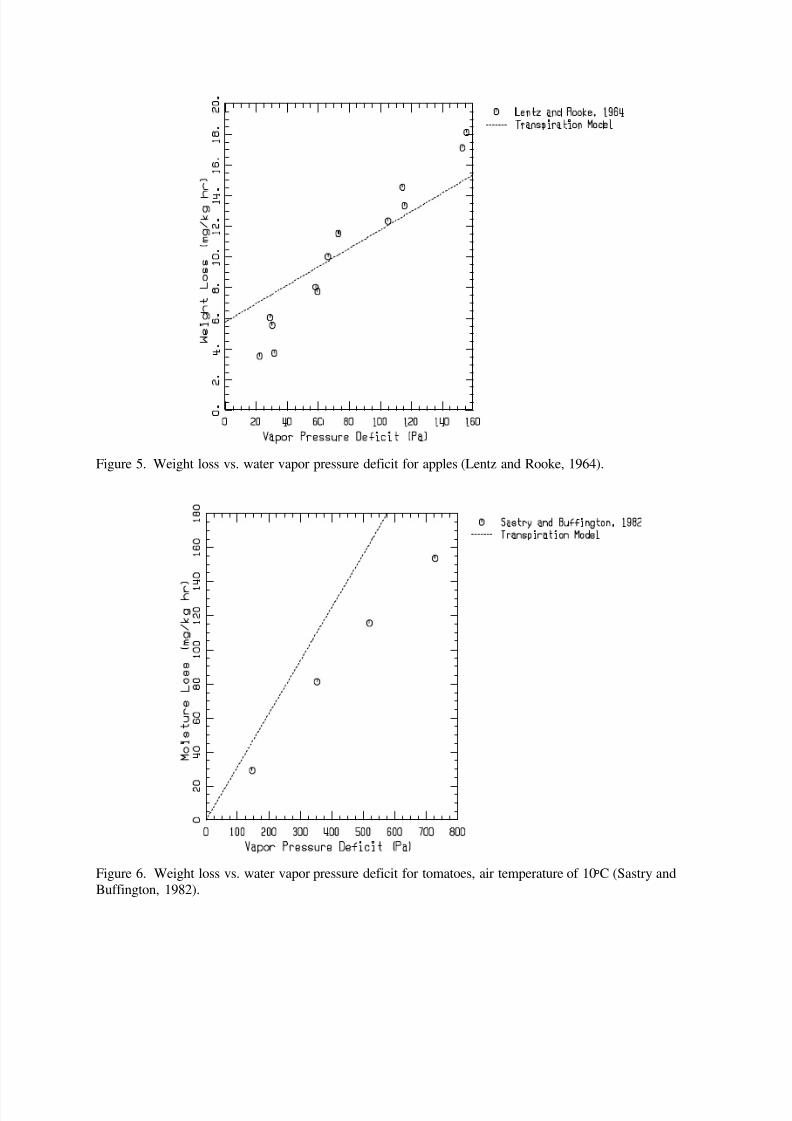
Lentz and Rooke (1964) present weight loss versus vapor pressure deficit data for apples. Air with
a temperature of 0°C to 3°C and a velocity of 0.5 m/s flowed past the apples. Figure 5 shows the Lentz
and Rooke experimental data along with the output from the transpiration model. The weight loss predicted
by the model compares favorably with the experimental data.
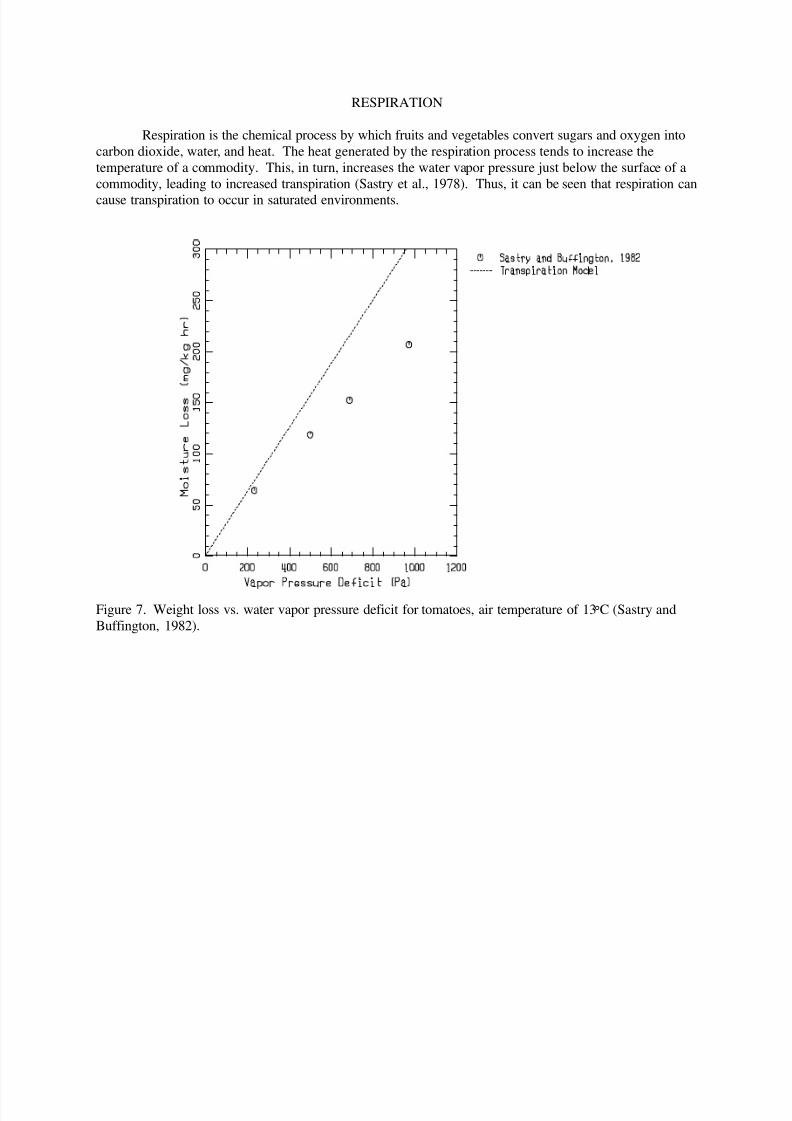
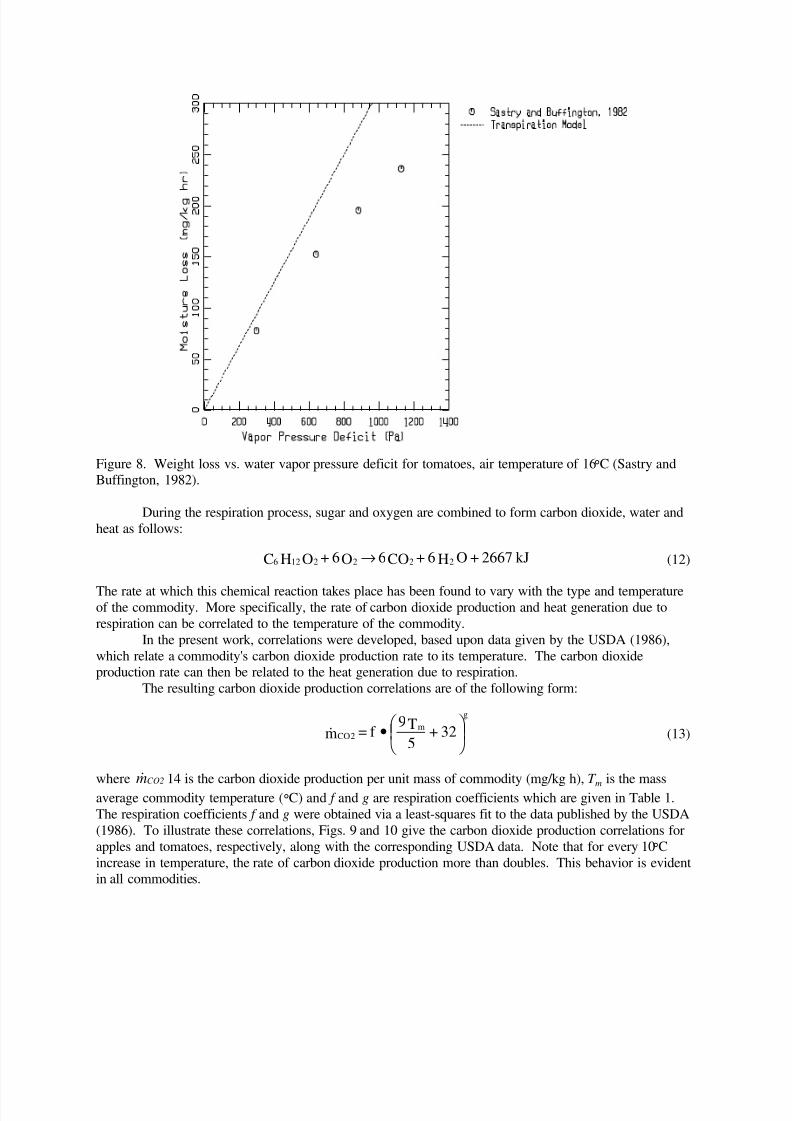
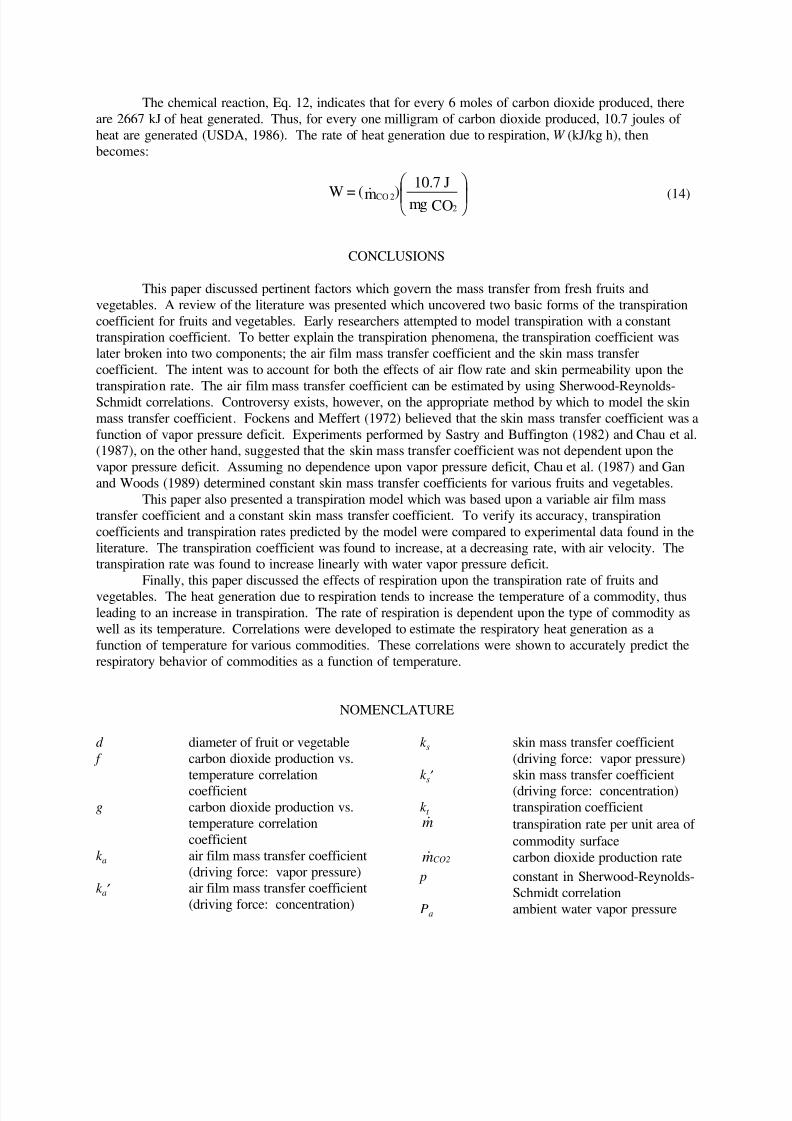
Sastry and Buffington (1982) experimentally determined the transpiration rate of tomatoes as a
function of water vapor pressure deficit at three different air temperatures. Air at either 10°C, 13°C or
16°C with a velocity of 0.0036 m/s was used to cool the tomatoes. Figures 6, 7 and 8 show the Sastry andBuffington data along with the output from the transpiration model for the three air temperatures. In all
three cases, the transpiration model predicts slightly higher transpiration rates than those experimentally
determined by Sastry and Buffington.
8/7/2019 Trans Resp
http://slidepdf.com/reader/full/trans-resp 12/18
Figure 5. Weight loss vs. water vapor pressure deficit for apples (Lentz and Rooke, 1964).
Figure 6. Weight loss vs. water vapor pressure deficit for tomatoes, air temperature of 10°C (Sastry and
Buffington, 1982).
8/7/2019 Trans Resp
http://slidepdf.com/reader/full/trans-resp 13/18
RESPIRATION
Respiration is the chemical process by which fruits and vegetables convert sugars and oxygen into
carbon dioxide, water, and heat. The heat generated by the respiration process tends to increase the
temperature of a commodity. This, in turn, increases the water vapor pressure just below the surface of a
commodity, leading to increased transpiration (Sastry et al., 1978). Thus, it can be seen that respiration can
cause transpiration to occur in saturated environments.
Figure 7. Weight loss vs. water vapor pressure deficit for tomatoes, air temperature of 13°C (Sastry and
Buffington, 1982).
8/7/2019 Trans Resp
http://slidepdf.com/reader/full/trans-resp 14/18
8/7/2019 Trans Resp
http://slidepdf.com/reader/full/trans-resp 15/18
8/7/2019 Trans Resp
http://slidepdf.com/reader/full/trans-resp 16/18
The chemical reaction, Eq. 12, indicates that for every 6 moles of carbon dioxide produced, there
are 2667 kJ of heat generated. Thus, for every one milligram of carbon dioxide produced, 10.7 joules of
heat are generated (USDA, 1986). The rate of heat generation due to respiration, W (kJ/kg h), then
becomes:
CONCLUSIONS
This paper discussed pertinent factors which govern the mass transfer from fresh fruits and
vegetables. A review of the literature was presented which uncovered two basic forms of the transpiration
coefficient for fruits and vegetables. Early researchers attempted to model transpiration with a constant
transpiration coefficient. To better explain the transpiration phenomena, the transpiration coefficient was
later broken into two components; the air film mass transfer coefficient and the skin mass transfer
coefficient. The intent was to account for both the effects of air flow rate and skin permeability upon the
transpiration rate. The air film mass transfer coefficient can be estimated by using Sherwood-Reynolds-Schmidt correlations. Controversy exists, however, on the appropriate method by which to model the skin
mass transfer coefficient. Fockens and Meffert (1972) believed that the skin mass transfer coefficient was a
function of vapor pressure deficit. Experiments performed by Sastry and Buffington (1982) and Chau et al.
(1987), on the other hand, suggested that the skin mass transfer coefficient was not dependent upon the
vapor pressure deficit. Assuming no dependence upon vapor pressure deficit, Chau et al. (1987) and Gan
and Woods (1989) determined constant skin mass transfer coefficients for various fruits and vegetables.
This paper also presented a transpiration model which was based upon a variable air film mass
transfer coefficient and a constant skin mass transfer coefficient. To verify its accuracy, transpiration
coefficients and transpiration rates predicted by the model were compared to experimental data found in the
literature. The transpiration coefficient was found to increase, at a decreasing rate, with air velocity. The
transpiration rate was found to increase linearly with water vapor pressure deficit.
Finally, this paper discussed the effects of respiration upon the transpiration rate of fruits and
vegetables. The heat generation due to respiration tends to increase the temperature of a commodity, thus
leading to an increase in transpiration. The rate of respiration is dependent upon the type of commodity as
well as its temperature. Correlations were developed to estimate the respiratory heat generation as a
function of temperature for various commodities. These correlations were shown to accurately predict the
respiratory behavior of commodities as a function of temperature.
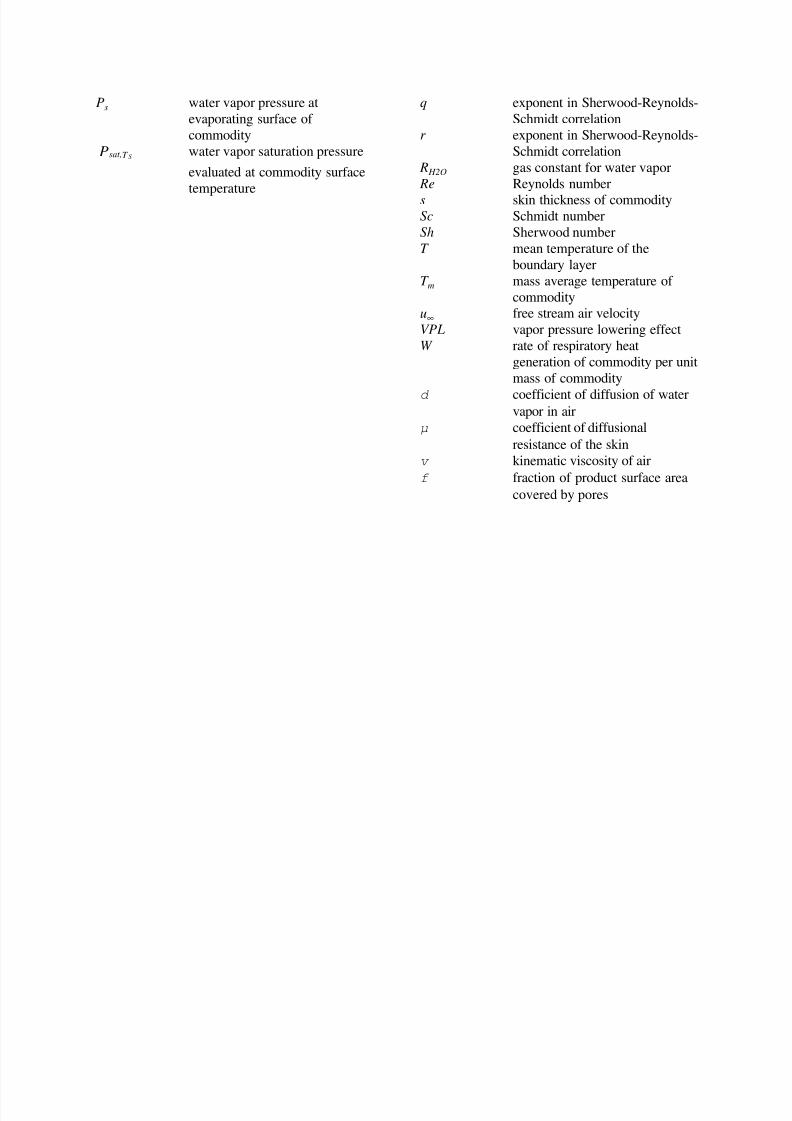
NOMENCLATURE
d diameter of fruit or vegetable
f carbon dioxide production vs.
temperature correlation
coefficient
g carbon dioxide production vs.
temperature correlation
coefficient
k a air film mass transfer coefficient
(driving force: vapor pressure)
k a′ air film mass transfer coefficient
(driving force: concentration)
k s skin mass transfer coefficient
(driving force: vapor pressure)
k s′ skin mass transfer coefficient
(driving force: concentration)
k t transpiration coefficientm& transpiration rate per unit area of
commodity surface
mCO2& carbon dioxide production rate
p constant in Sherwood-Reynolds-
Schmidt correlation
Pa ambient water vapor pressure
COmg
J10.7
)m(=W2
2CO&
(14)
8/7/2019 Trans Resp
http://slidepdf.com/reader/full/trans-resp 17/18
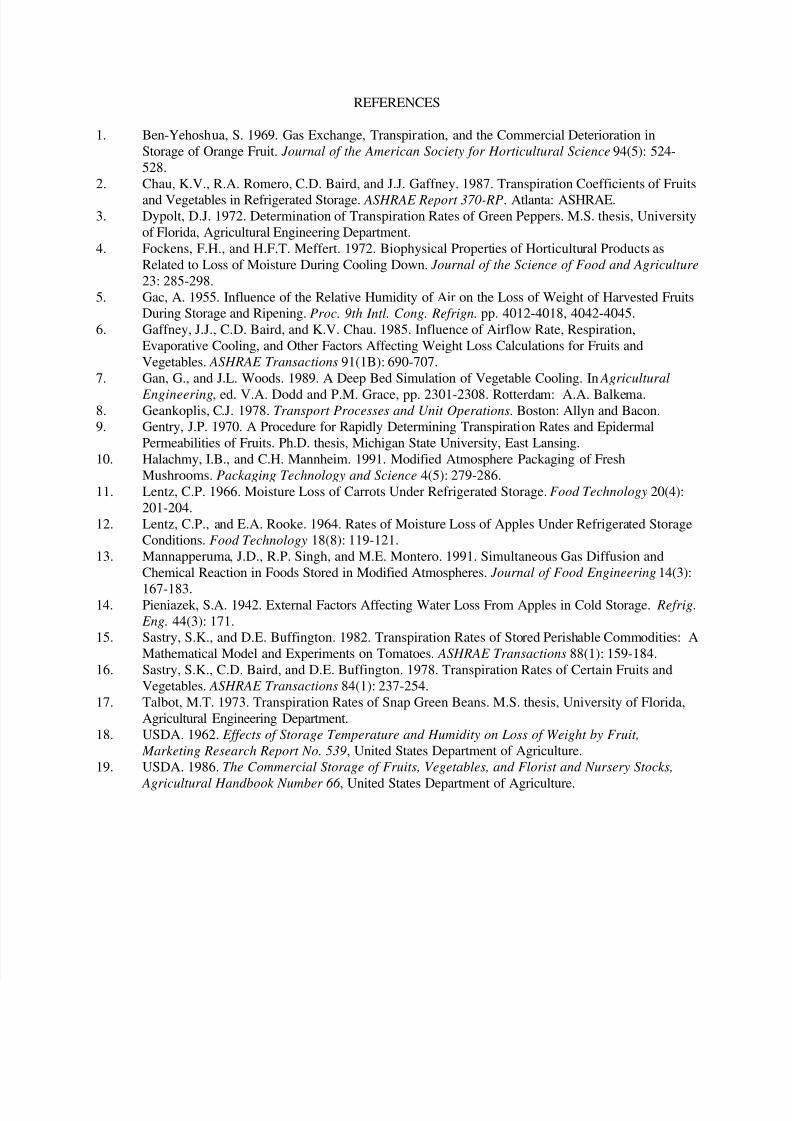
Ps water vapor pressure at
evaporating surface of
commodity
P T sat, Swater vapor saturation pressure
evaluated at commodity surface
temperature
q exponent in Sherwood-Reynolds-
Schmidt correlation
r exponent in Sherwood-Reynolds-
Schmidt correlation
R H2O gas constant for water vapor
Re Reynolds number
s skin thickness of commoditySc Schmidt number
Sh Sherwood number
T mean temperature of the
boundary layer
T m mass average temperature of
commodity
u∞ free stream air velocity
VPL vapor pressure lowering effect
W rate of respiratory heat
generation of commodity per unit
mass of commodity
d coefficient of diffusion of watervapor in air
µ coefficient of diffusional
resistance of the skin
v kinematic viscosity of air
f fraction of product surface area
covered by pores
8/7/2019 Trans Resp
http://slidepdf.com/reader/full/trans-resp 18/18
REFERENCES
1. Ben-Yehoshua, S. 1969. Gas Exchange, Transpiration, and the Commercial Deterioration in
Storage of Orange Fruit. Journal of the American Society for Horticultural Science 94(5): 524-
528.
2. Chau, K.V., R.A. Romero, C.D. Baird, and J.J. Gaffney. 1987. Transpiration Coefficients of Fruits
and Vegetables in Refrigerated Storage. ASHRAE Report 370-RP. Atlanta: ASHRAE.3. Dypolt, D.J. 1972. Determination of Transpiration Rates of Green Peppers. M.S. thesis, University
of Florida, Agricultural Engineering Department.
4. Fockens, F.H., and H.F.T. Meffert. 1972. Biophysical Properties of Horticultural Products as
Related to Loss of Moisture During Cooling Down. Journal of the Science of Food and Agriculture
23: 285-298.
5. Gac, A. 1955. Influence of the Relative Humidity of Air on the Loss of Weight of Harvested Fruits
During Storage and Ripening. Proc. 9th Intl. Cong. Refrign. pp. 4012-4018, 4042-4045.
6. Gaffney, J.J., C.D. Baird, and K.V. Chau. 1985. Influence of Airflow Rate, Respiration,
Evaporative Cooling, and Other Factors Affecting Weight Loss Calculations for Fruits and
Vegetables. ASHRAE Transactions 91(1B): 690-707.
7. Gan, G., and J.L. Woods. 1989. A Deep Bed Simulation of Vegetable Cooling. In Agricultural
Engineering, ed. V.A. Dodd and P.M. Grace, pp. 2301-2308. Rotterdam: A.A. Balkema.8. Geankoplis, C.J. 1978. Transport Processes and Unit Operations. Boston: Allyn and Bacon.
9. Gentry, J.P. 1970. A Procedure for Rapidly Determining Transpiration Rates and Epidermal
Permeabilities of Fruits. Ph.D. thesis, Michigan State University, East Lansing.
10. Halachmy, I.B., and C.H. Mannheim. 1991. Modified Atmosphere Packaging of Fresh
Mushrooms. Packaging Technology and Science 4(5): 279-286.
11. Lentz, C.P. 1966. Moisture Loss of Carrots Under Refrigerated Storage. Food Technology 20(4):
201-204.
12. Lentz, C.P., and E.A. Rooke. 1964. Rates of Moisture Loss of Apples Under Refrigerated Storage
Conditions. Food Technology 18(8): 119-121.
13. Mannapperuma, J.D., R.P. Singh, and M.E. Montero. 1991. Simultaneous Gas Diffusion and
Chemical Reaction in Foods Stored in Modified Atmospheres. Journal of Food Engineering 14(3):
167-183.14. Pieniazek, S.A. 1942. External Factors Affecting Water Loss From Apples in Cold Storage. Refrig.
Eng. 44(3): 171.
15. Sastry, S.K., and D.E. Buffington. 1982. Transpiration Rates of Stored Perishable Commodities: A
Mathematical Model and Experiments on Tomatoes. ASHRAE Transactions 88(1): 159-184.
16. Sastry, S.K., C.D. Baird, and D.E. Buffington. 1978. Transpiration Rates of Certain Fruits and
Vegetables. ASHRAE Transactions 84(1): 237-254.
17. Talbot, M.T. 1973. Transpiration Rates of Snap Green Beans. M.S. thesis, University of Florida,
Agricultural Engineering Department.
18. USDA. 1962. Effects of Storage Temperature and Humidity on Loss of Weight by Fruit,
Marketing Research Report No. 539, United States Department of Agriculture.
19. USDA. 1986. The Commercial Storage of Fruits, Vegetables, and Florist and Nursery Stocks,
Agricultural Handbook Number 66 , United States Department of Agriculture.