Embed Size (px)
Citation preview
1
Transportation & Air Quality Planning
AMPO MPO Educational SeriesNovember 8, 2012
2
Purpose of the Session
Provide an overview of air quality and transportation planning requirements for new MPOs and existing MPOs that are new to the topic of air quality planning.
3
Overview
Clean Air Act Air quality planning Transportation Conformity Resources and
contacts
4
AQ Terms and Acronyms
National Ambient Air Quality Standards (NAAQS)
Designation Attainment/Nonattainment/Maintenance State Implementation Plan (SIP) Transportation Conformity Motor Vehicle Emissions Budget (MVEB)
5
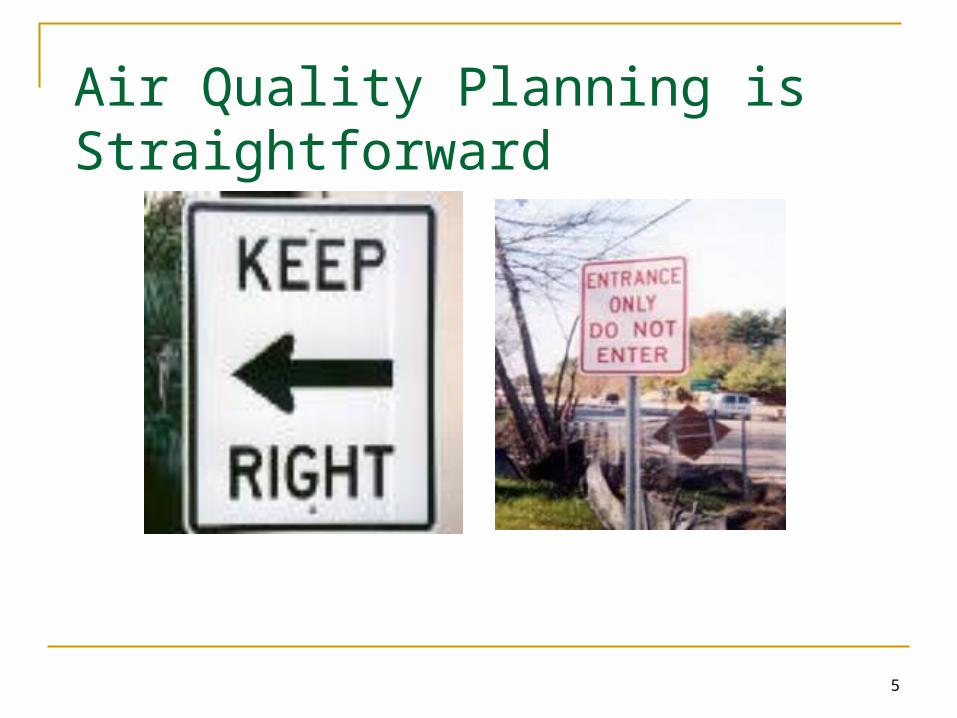
Air Quality Planning is Straightforward
6
Transportation and Air Quality Planning Clean Air Act: air quality planning (Title 42) Transportation planning (Title 23)
TEA-21 CAA
Title 23Clean Air Act
Clean Air Act
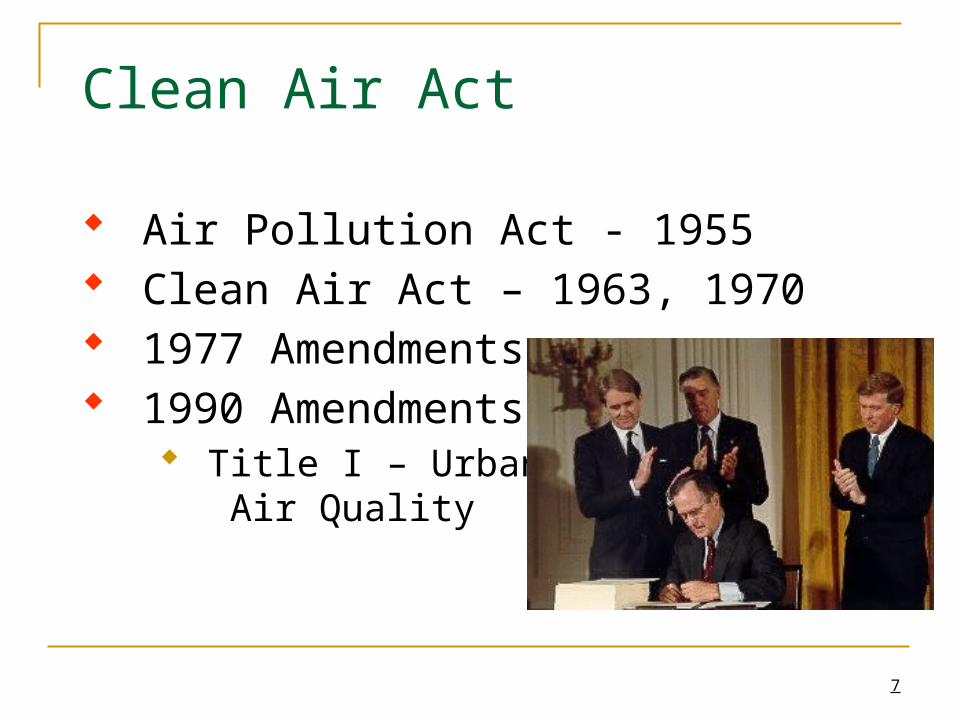
Air Pollution Act - 1955 Clean Air Act – 1963, 1970 1977 Amendments 1990 Amendments
Title I – Urban Air Quality
7
8
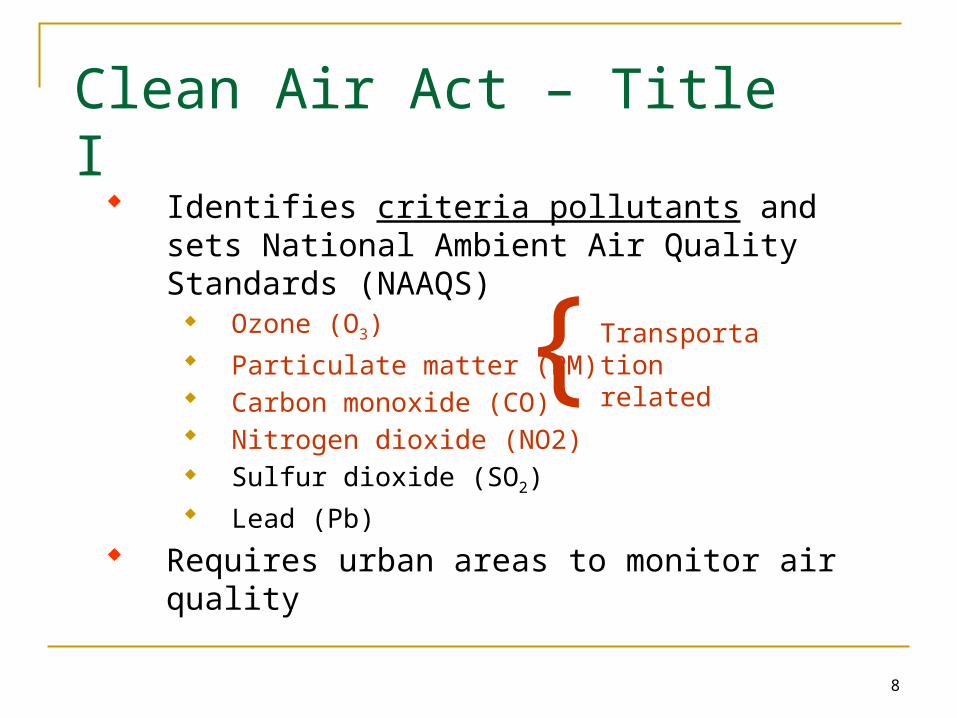
Clean Air Act – Title I
Identifies criteria pollutants and sets National Ambient Air Quality Standards (NAAQS) Ozone (O3)
Particulate matter (PM) Carbon monoxide (CO) Nitrogen dioxide (NO2) Sulfur dioxide (SO2)
Lead (Pb)
Requires urban areas to monitor air quality
Transportation related{
9
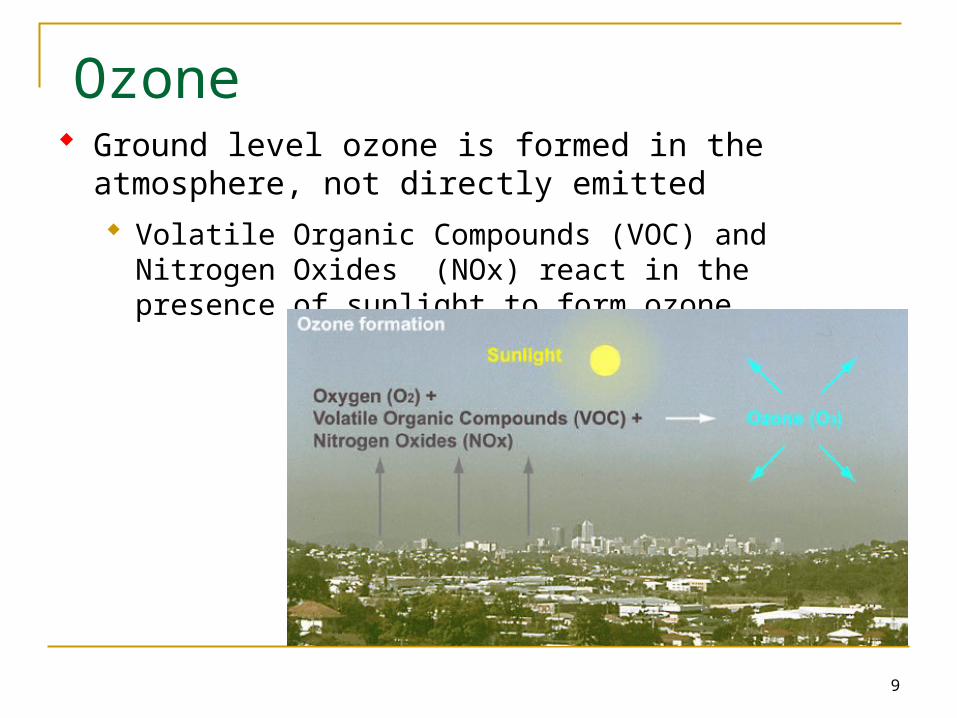
Ozone Ground level ozone is formed in the atmosphere, not
directly emitted
Volatile Organic Compounds (VOC) and Nitrogen Oxides (NOx) react in the presence of sunlight to form ozone
10
Ozone Standard
8-Hour ozone standard
Met when the annual fourth-highest daily maximum 8-hr concentration, averaged over 3 years, is less than 0.075 ppm (primary standard).
11
Gasoline and diesel on-road vehicles emit ozone precursors NOx – from tailpipe
VOC - from tailpipe, and from evaporative emissions while car is at rest
Transportation Ozone Emissions
12
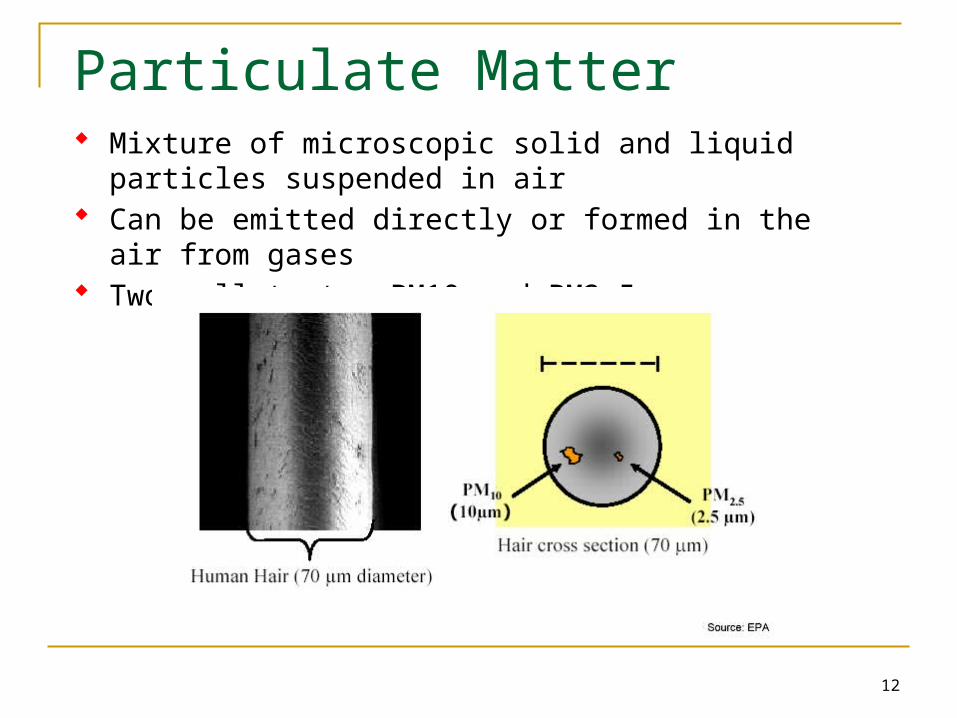
Particulate Matter Mixture of microscopic solid and liquid particles
suspended in air Can be emitted directly or formed in the air from gases Two pollutants: PM10 and PM2.5
13
Particulate Matter Standards PM10 – particulate matter less than 10 microns in diameter
24 hour standard: 150 µg/m3 (averaged over each 24-hour period), not to be exceeded more than once per year on average over 3 years
PM2.5 – particulate matter less than 2.5 microns in diameter Annual standard: 15 µg/m3 (annual mean concentration
averaged over 3 years) 24 hour standard: 35 µg/m3 (determined by the 3-year
average of the 98th percentile of each monitor) PM2.5 is a different pollutant than PM10, not just a different
standard
14
Gasoline and diesel on-road vehicles emit: Direct PM2.5
exhaust
brake and tire wear
re-entrained dust from paved and unpaved roads
PM2.5 precursors NOx, VOCs, SOx
ammonia (primarily emitted by gasoline vehicles)
Transportation Particulate Emissions
15
Carbon Monoxide (CO) Colorless and odorless gas Forms when carbon in fuel is not burned
completely High concentrations can occur in areas with
heavy traffic congestion/idling Standard
1-hour standard: 35 ppm 8-hour standard: 9 ppm Both not to be exceeded more than once per
year
16
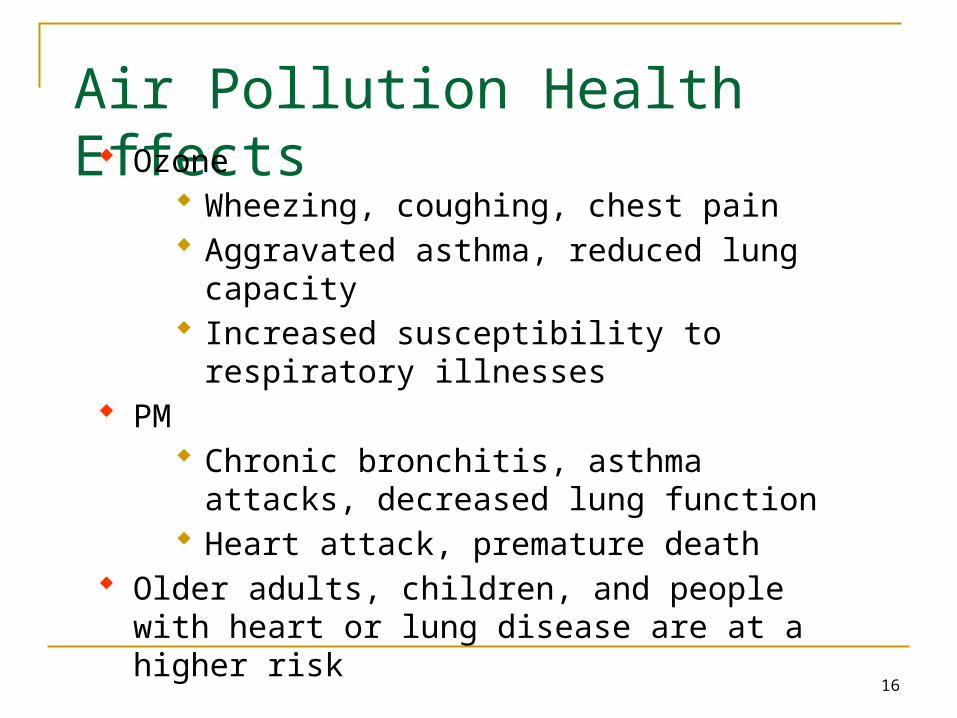
Air Pollution Health Effects Ozone
Wheezing, coughing, chest pain Aggravated asthma, reduced lung capacity Increased susceptibility to respiratory illnesses
PM Chronic bronchitis, asthma attacks, decreased
lung function Heart attack, premature death
Older adults, children, and people with heart or lung disease are at a higher risk
17
Air Pollution Health Effects CO
High levels lead to vision problems, reduced ability to work or learn, reduced manual dexterity, difficulty performing complex tasks
At extremely high levels, CO is poisonous and can cause death
18
Air Quality Planning
19
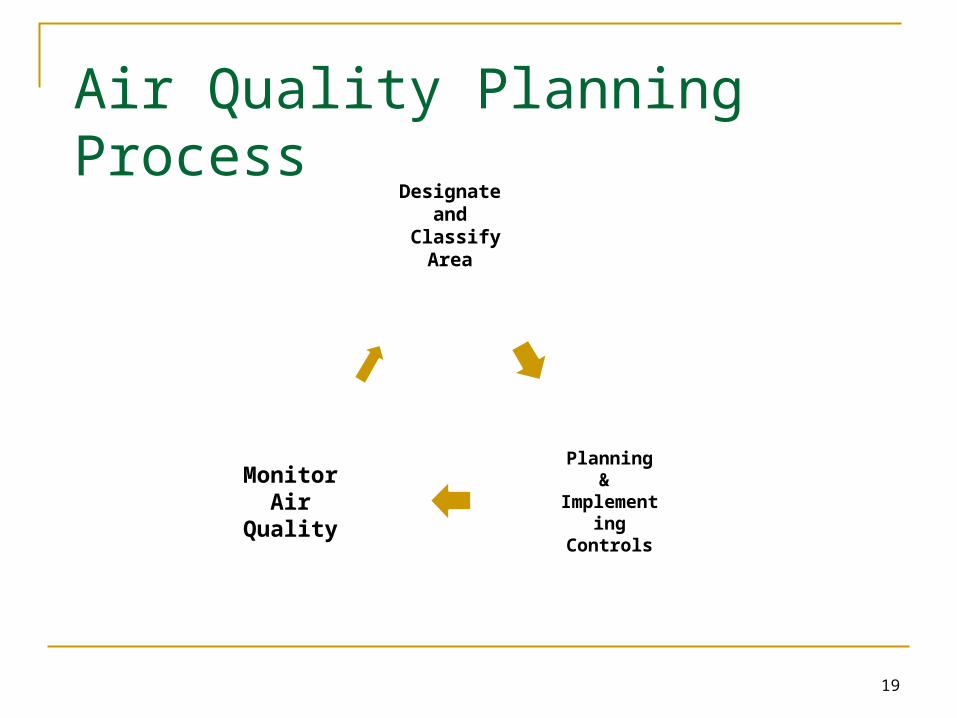
Air Quality Planning Process
Designate and
Classify Area
Planning & Implementing Controls
MonitorAir
Quality
20
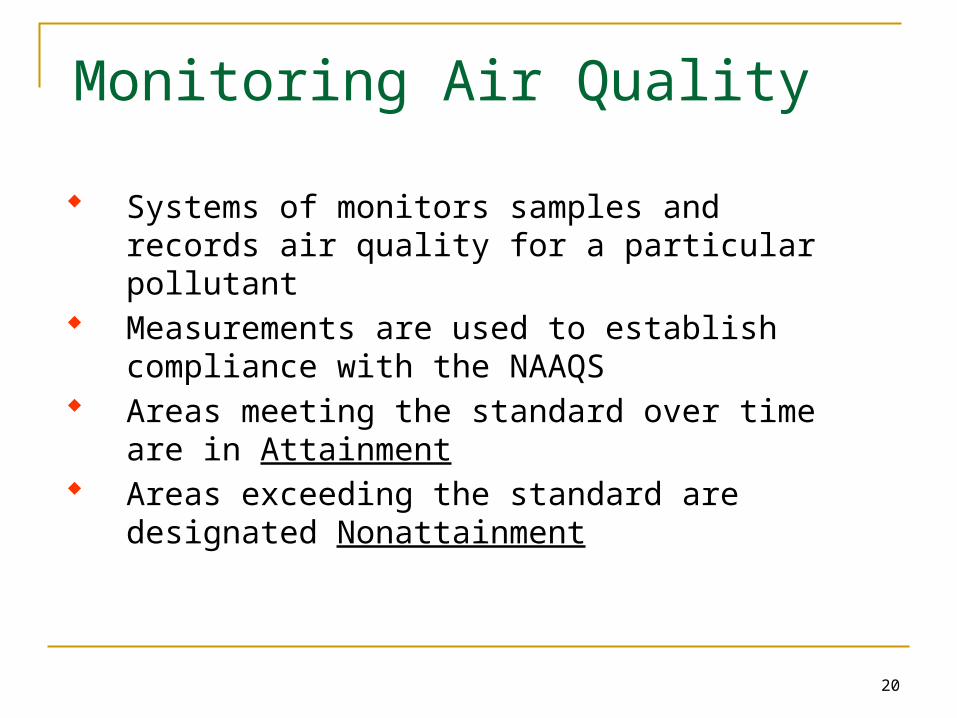
Monitoring Air Quality
Systems of monitors samples and records air quality for a particular pollutant
Measurements are used to establish compliance with the NAAQS
Areas meeting the standard over time are in Attainment
Areas exceeding the standard are designated Nonattainment
21
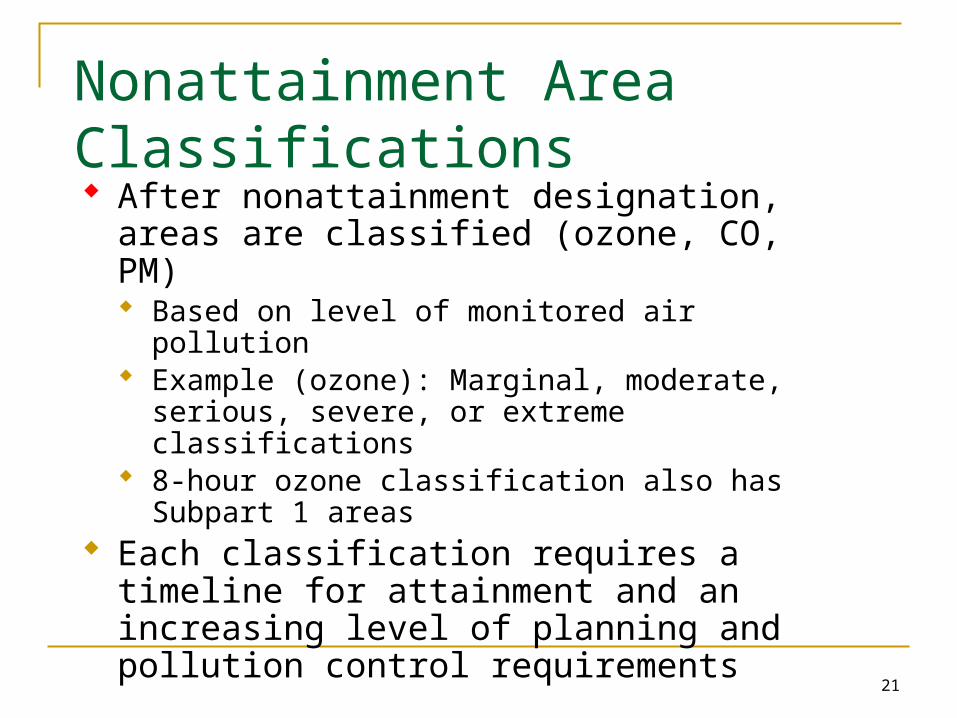
Nonattainment Area Classifications After nonattainment designation, areas are
classified (ozone, CO, PM) Based on level of monitored air pollution Example (ozone): Marginal, moderate, serious,
severe, or extreme classifications 8-hour ozone classification also has Subpart 1 areas
Each classification requires a timeline for attainment and an increasing level of planning and pollution control requirements
22
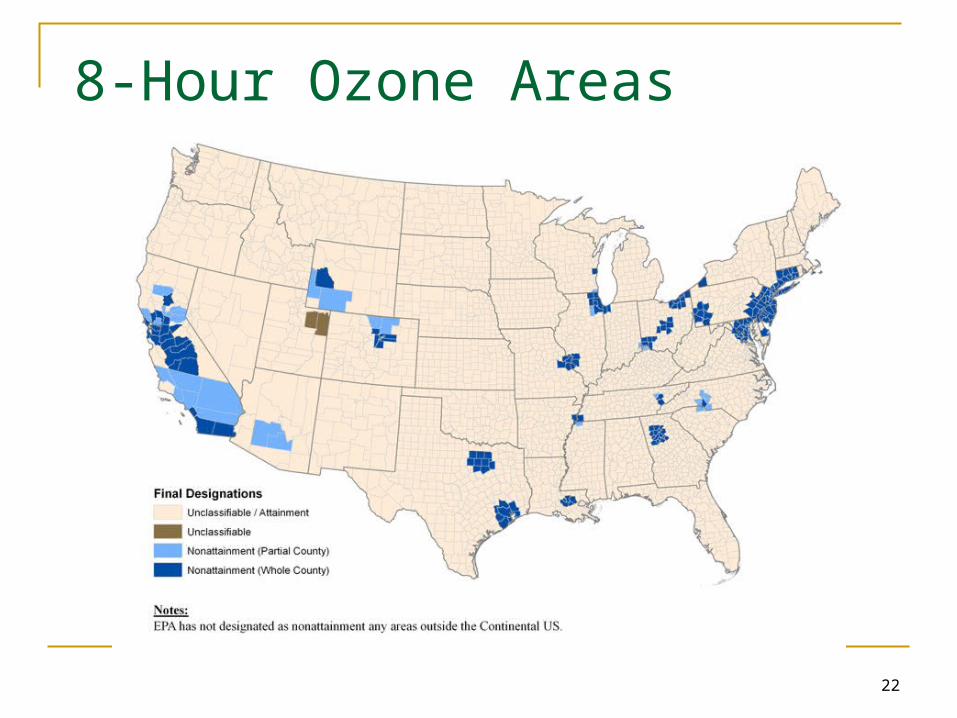
8-Hour Ozone Areas
23
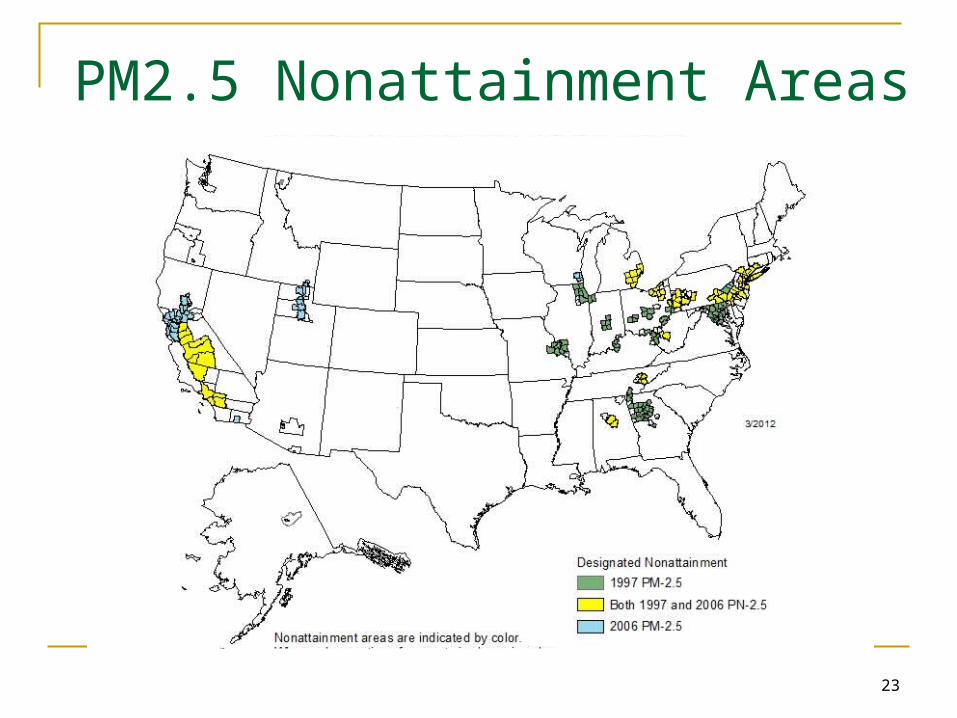
PM2.5 Nonattainment Areas
24
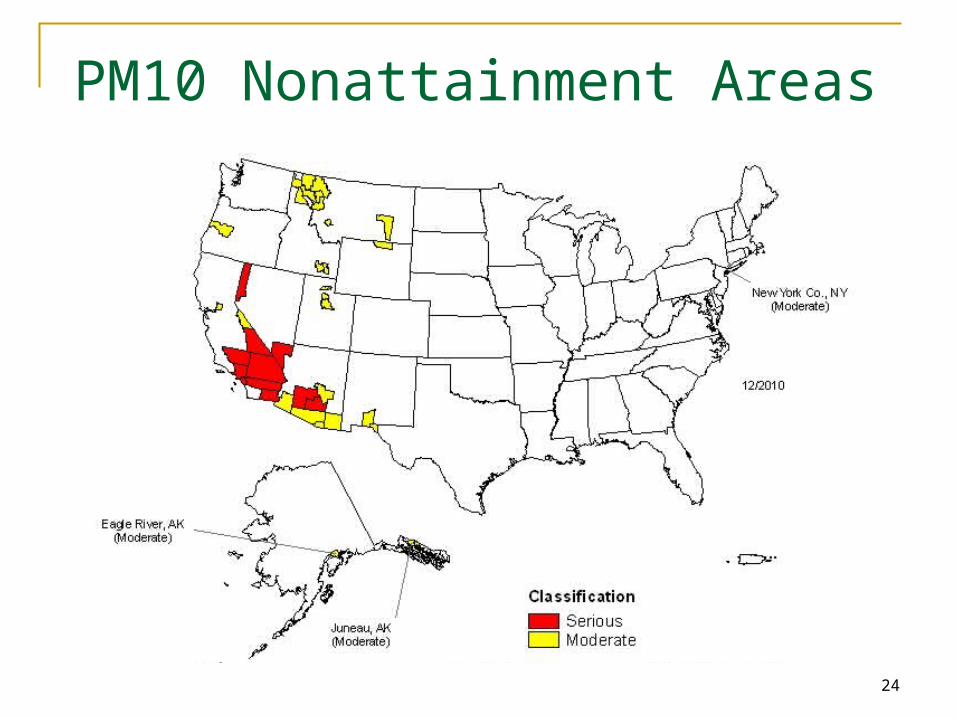
PM10 Nonattainment Areas
25
What happens after designation?
26
State Implementation Plan (SIP) How to meet the standard by the
attainment deadline
Collection of documents – planning, regulatory, and procedural
27
SIP Description
How the state will monitor, control, and enforce the standards
Addresses all emissions sources For transportation, sets the limit on emissions for
on-road vehicles Addresses the time period up until attainment
date (e.g., 2018)
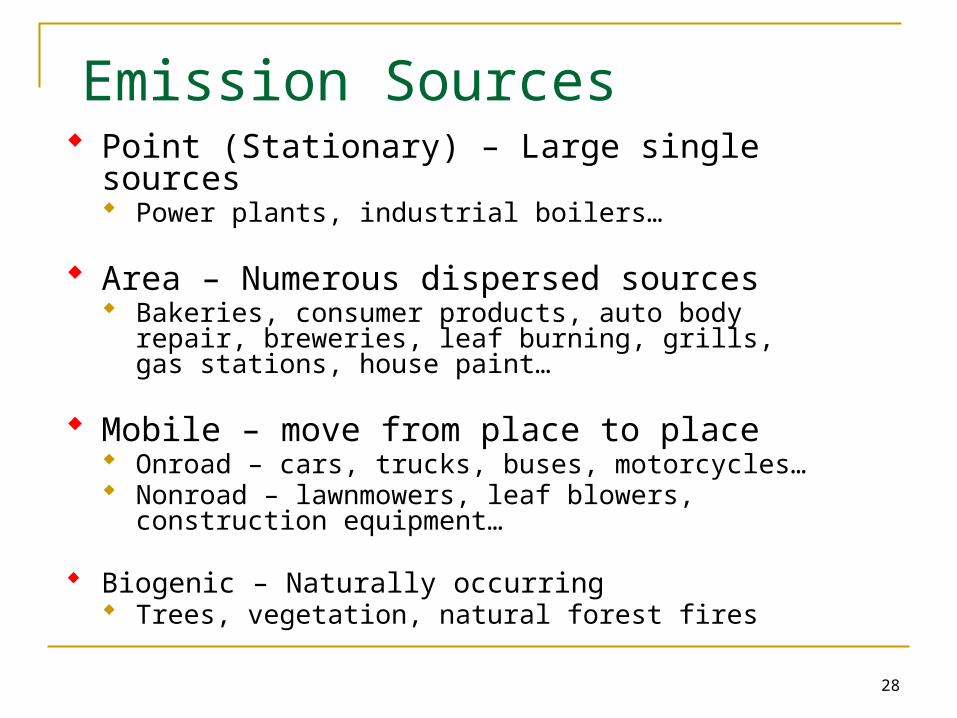
28
Emission Sources Point (Stationary) – Large single sources
Power plants, industrial boilers…
Area – Numerous dispersed sources Bakeries, consumer products, auto body repair, breweries,
leaf burning, grills, gas stations, house paint…
Mobile – move from place to place Onroad – cars, trucks, buses, motorcycles… Nonroad – lawnmowers, leaf blowers, construction
equipment…
Biogenic – Naturally occurring Trees, vegetation, natural forest fires
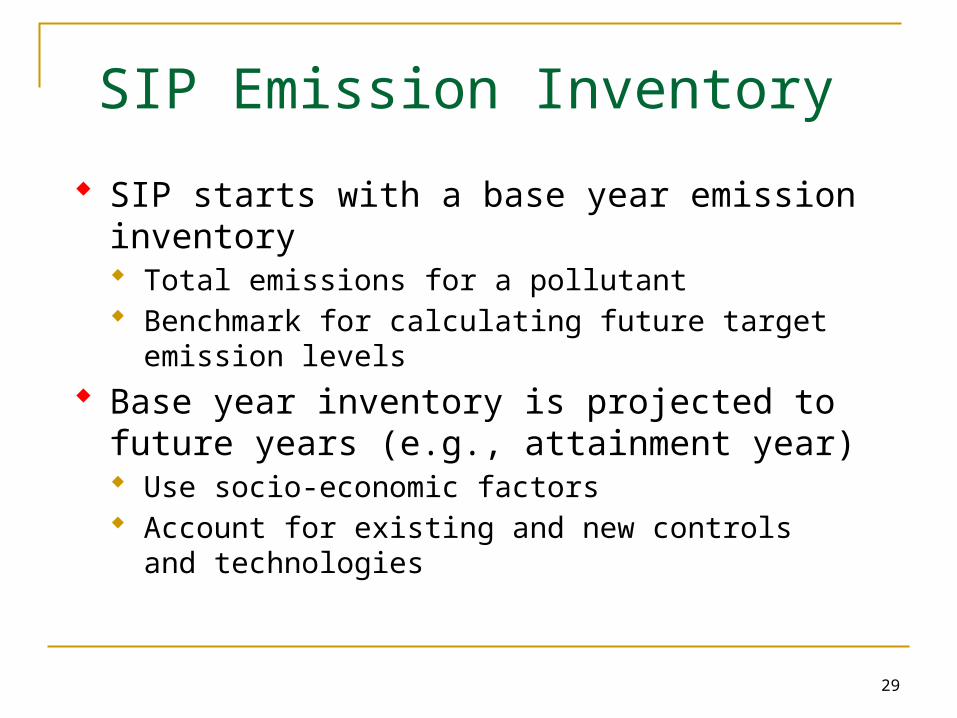
29
SIP Emission Inventory
SIP starts with a base year emission inventory Total emissions for a pollutant Benchmark for calculating future target emission levels
Base year inventory is projected to future years (e.g., attainment year) Use socio-economic factors Account for existing and new controls and technologies
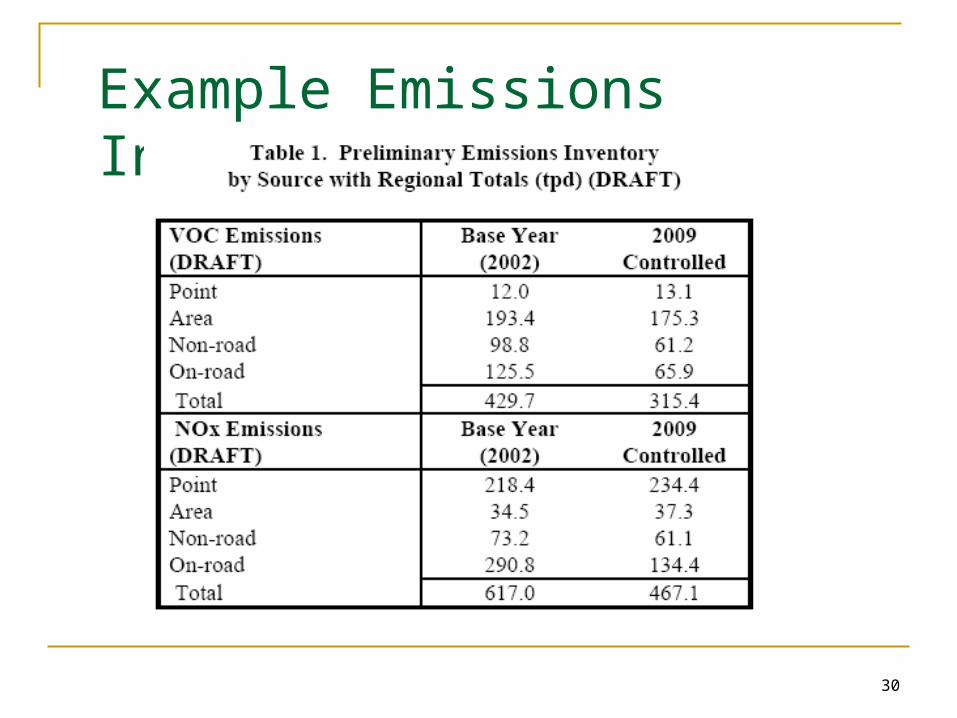
30
Example Emissions Inventory
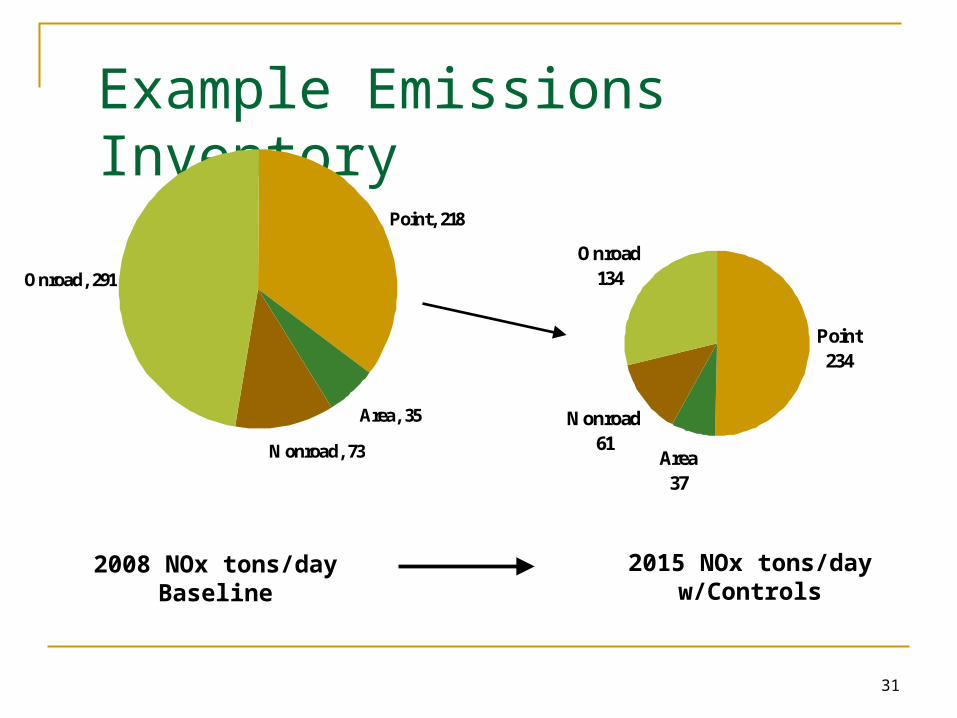
31
Example Emissions Inventory
Point, 218
Area, 35
Nonroad, 73
Onroad, 291
Point234
Area37
Onroad134
Nonroad61
2008 NOx tons/day Baseline
2015 NOx tons/day w/Controls
32
How is Transportation Planning Linked to Air Quality? In nonattainment and maintenance
areas, transportation plans, TIPs, and projects must be in Conformity with the SIP
33
Transportation Conformity
34
How are Transportation Plans and TIPS Linked to the SIP? The SIP establishes a Motor Vehicle Emissions
Budget (MVEB) for on-road vehicles Ceiling on emissions from highway and transit vehicles
Emissions resulting from implementation of TIP orPlan must “Conform” to the SIP: Transportation projects will not:
Cause or contribute to any new violation of a standard or delay timely attainment;
35
Who does conformity?
MPOs, or DOTs outside of metro areas State air agencies are usually involved FHWA and FTA approve the conformity
determination EPA has a consultation role on conformity
determinations and determines if SIP budgets are “adequate”
36
What transportation actions are subject to conformity? Long Range Transportation Plans
Transportation Improvement Programs
“Federal” projects projects receiving federal funding projects receiving FHWA/FTA approval
Regionally significant non-Federal projects are partially affected
37
Key Elements of a Conformity Determination
Regional emissions analysis Transportation modeling Latest planning assumptions and
emissions model Interagency consultation Public participation
38
Conducting a Regional Emissions Analysis
Determine which conformity emissions test(s) apply Determine analysis years for evaluation (as specified
by conformity rule) Model/estimate VMT Calculate emissions from this VMT Compare emissions in each analysis year to the
applicable emission test
39
Estimating Travel Demand (VMT) VMT is estimated using either
a network travel demand model appropriate methods that account for VMT growth
Some areas are required to have a network travel model for conformity
All other areas use best professional practice
40
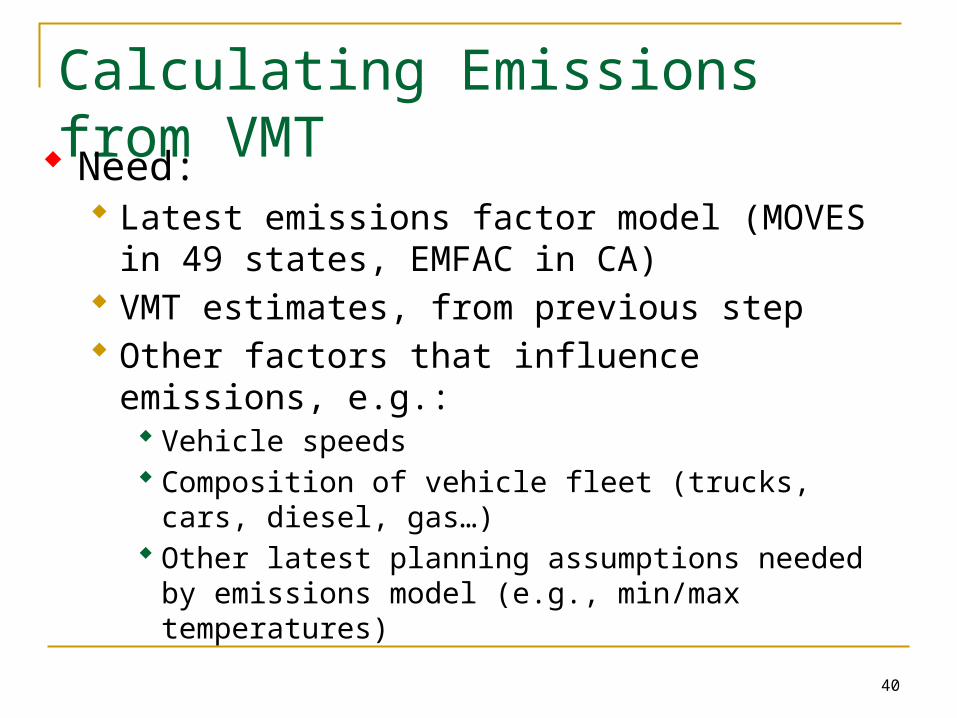
Calculating Emissions from VMT Need:
Latest emissions factor model (MOVES in 49 states, EMFAC in CA)
VMT estimates, from previous step Other factors that influence emissions, e.g.:
Vehicle speeds Composition of vehicle fleet (trucks, cars, diesel, gas…) Other latest planning assumptions needed by emissions
model (e.g., min/max temperatures)
41
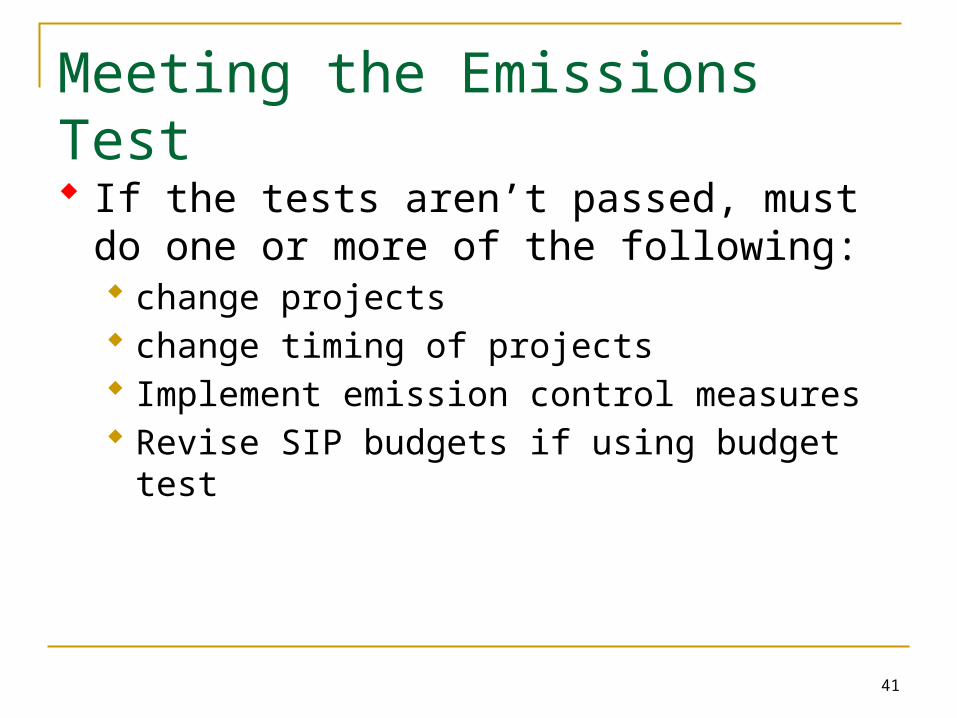
Meeting the Emissions Test
If the tests aren’t passed, must do one or more of the following: change projects change timing of projects Implement emission control measures Revise SIP budgets if using budget test
42
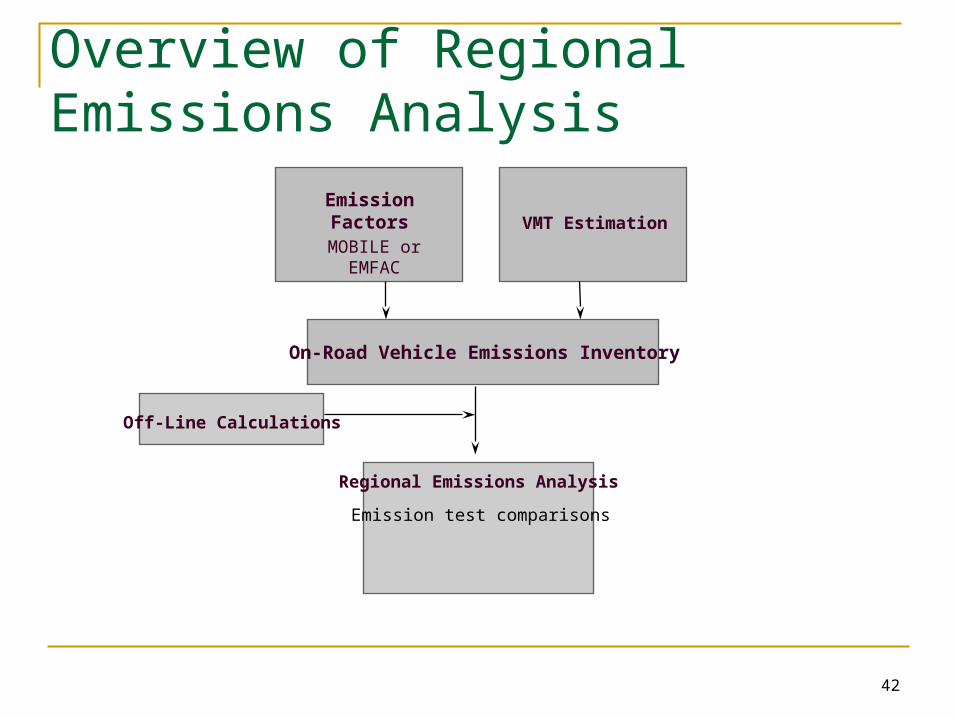
Overview of Regional Emissions Analysis
On-Road Vehicle Emissions Inventory
Regional Emissions Analysis
Emission test comparisons
Off-Line Calculations
EmissionFactors
MOBILE or EMFAC
VMT Estimation
43
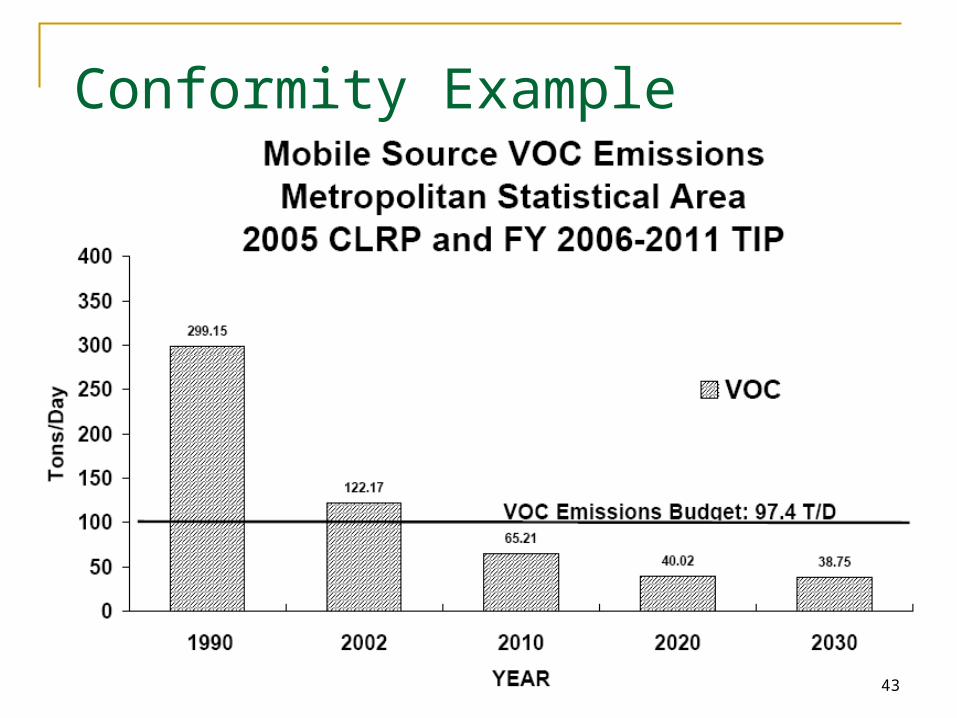
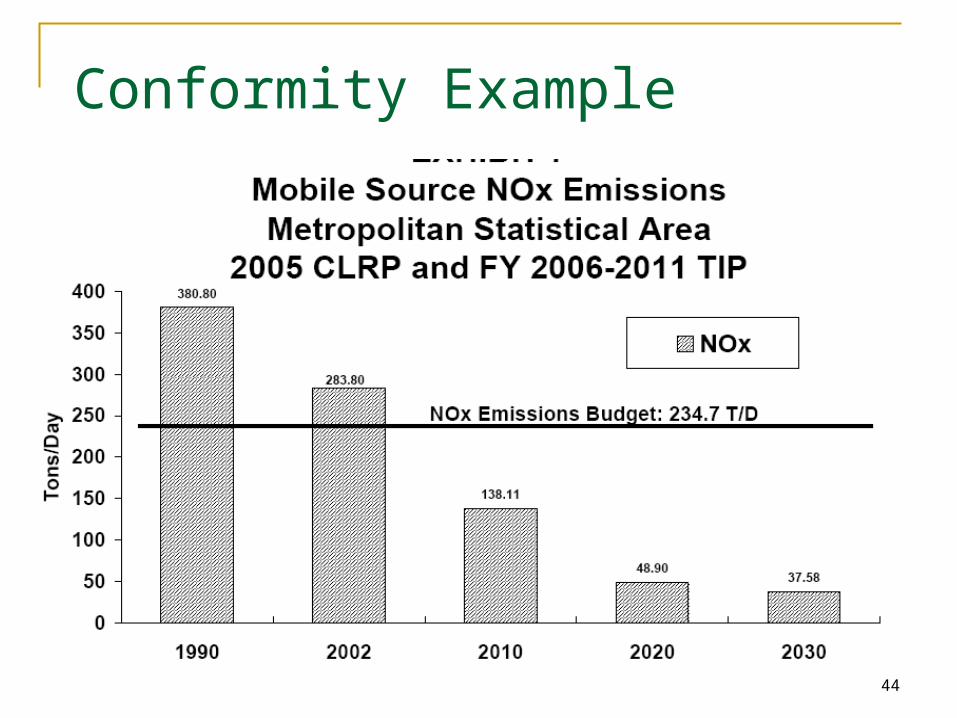
Conformity Example
44
Conformity Example
45
What happens if conformity is not demonstrated?
If the transportation plan or TIP do not demonstrate conformity by the established time frames, the area will lapse...
No new plans, TIPs or projects can be adopted or approved until: the plan and TIP are changed; or the SIP is changed
46
What projects move forward during a lapse?
Exempt projects Federal project phases that received final
approval before the lapse (e.g., right of way) Regionally significant non-federal projects that
received all final state and local approvals before lapse
Traffic signal synchronization projects TCMs in approved SIPs Non-regionally significant non-federal projects

47
When must conformity be done?
48
Plans and TIPs: Conformity TriggersCAA and conformity regulations require:
New plan/TIP conformity at least every 4 years in nonattainment and maintenance areas
Conformity analysis on TIP and Plan required within one year of nonattainment designation
49
Plan and TIP Revisions
A plan/TIP revision and a conformity determination is needed when: adding years to plan/TIP adding projects to plan/TIP significantly changing project(s) in plan/TIP shifting timing of projects, e.g., moving project
from a later year to an earlier year Exception: projects in the first 3 years of TIP can be
shifted within the first 3 years without a new conformity determination

50
Other Topics
51
Interagency Consultation Each area must establish procedures for
consultation between involved parties: MPOs State and local air agencies State and local transportation agencies EPA FHWA/FTA
Consult on development of SIP, plan, TIP, and conformity determinations
52
Public Participation
Conformity rule relies on public participation Requires all information for conformity
determination to be available at the beginning of the comment period
53
Conformity Resources
USDOT http://www.fhwa.dot.gov/environment/air_quality/conformity/
USEPA http://www.epa.gov/oms/stateresources/transconf/index.htm
National Transit Institute (www.ntionline.com) Introduction to Transportation/Air Quality Conformity
AMPO: Rich [email protected]

54
Questions?