Embed Size (px)
Citation preview
TRENDS IN INCOME INEQUALITY AND STRATEGIES
FOR MORE EQUITABLE GROWTH BY
DR SULOCHANA NAIR
2
OUTLINE
• INTRODUCTION
• WHY IS IT IMPORTANT TO TALK ABOUT INEQUALITY
• TRENDS IN INCOME INEQUALITY
• CAUSES FOR CONCERN
• STRATEGIES FOR MORE EQUITABLE GROWTH
3
Introduction : Key issues concerning income distribution
• a) Distribution of what –distribution of current monetary (private) income-normally pre tax sometimes post tax and subsidy
• b) Distribution among whom –household vs individual gender implications
• c) Distribution within which unit-society or nation
4
Need to Widen Dimensions of Inequality
• Intra household income distribution-gender implications
• Post tax income
• Impact of state transfers
• Include social incomes (ie goods and services provided by the state
5
Need to Widen Dimensions of Inequality
• Need to include future incomes by adding current asset distributions
• Distribution of capabilities or functioning of basic needs goods and services or of human achievements
• Examine distribution of more direct measures of well being –health nutrition and happiness
6
Need to Widen Dimensions of Income Inequality
• A broader approach to distribution is needed-eg access to education –is a major influence on future household incomes may also affect the rate of growth
7
Need to Widen Dimensions of Income Inequality
• Inequality to health services can be more important than inequality in incomes as life may depend on it
• Also Question of functional income –ie distribution between profits wages rents
8
• Distribution among whom Individuals –Households groups
• Relevant distribution is that among groups not individuals such as the distribution between groups of different ethnicities, religions, regions or races-
• Vertical inequality as opposed to Horizontal Inequality -Frances Stewart .
9
• Vertical Inequality – measures of distribution among households or individuals
• Horizontal Inequality –between culturally defined groups. –causes of conflict , multi dimensional with political social and economic elements –affects individual well being and social stability
10
Income distribution Concerns in Malaysia
• Malaysian development strategy of the 70s emphasized growth with distribution
• Recognized that equitable growth between races was necessary for social stability and participation of poor in the process of development a key element of the NEP
11
Income distribution Concerns in Malaysia
• Policy efforts geared to reduce poverty and economic differences between the Malays and Chinese
• Income distribution as policy concern first mentioned in the 4th Malaysia Plan in 1981
12
Income distribution Concerns in Malaysia
• Malaysia's efforts to reduce poverty and ethnic differentials have had an positive impact on income inequality
• Poverty reduction strategies which emphasized increasing income levels of the poor at a faster rate than rest of the population contributed significantly to reducing inter ethnic income inequalities
13
Income Distribution and Development
• Income distribution is important for development as – it influences cohesion of society– determines the extent of poverty for any given
average per capita income – affects the poverty reducing effects of growth– Impacts people’s health
14
Why important to talk about income inequality
• Income Inequality has remerged a a policy concern in developing countries in the nineties a with greater attention being paid to causes of inequality a
• The relationship between poverty and inequality
15
Why important to talk about income inequality
• Long term objective of poverty eradication contingent upon reducing income inequalities
• Positive correlation between high income inequality and poverty levels
• Higher income inequality may reduce growth rates and make it more difficult to reduce poverty
16
Why important to talk about income inequality
• Sensitivity of poverty to growth is depends on a country’s income distribution
• Distribution of income has a significant impact on rates of growth with more equal societies growing faster than less equal ones
• Even if benefits of growth are spread in society higher income inequality would result in the poor having a smaller share of the benefits thus slowing down poverty reduction.
17
Why important to talk about income inequality
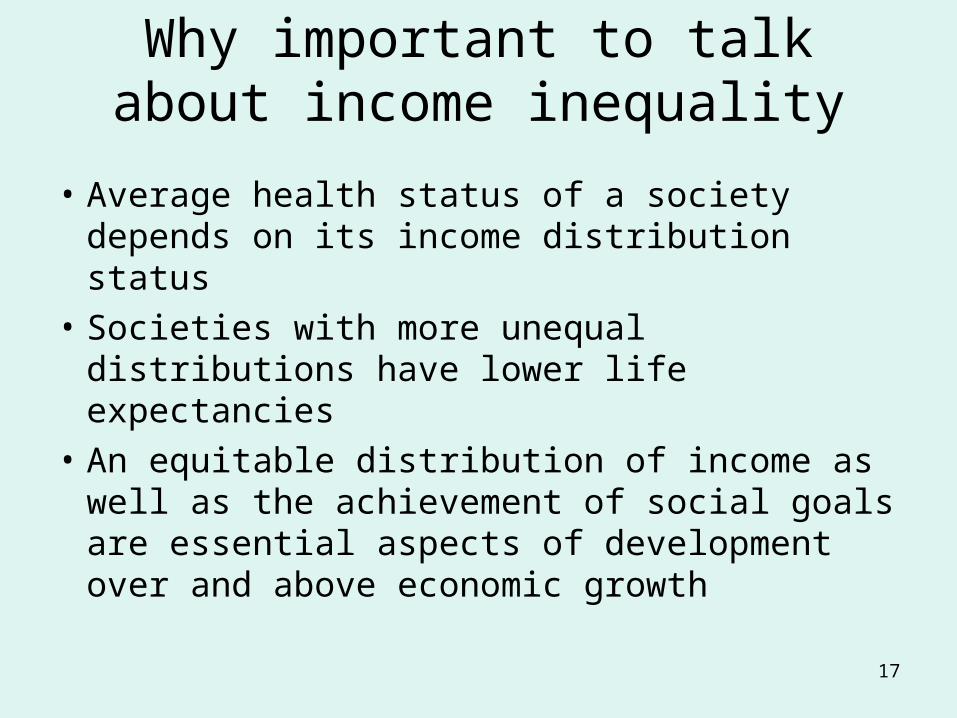
• Average health status of a society depends on its income distribution status
• Societies with more unequal distributions have lower life expectancies
• An equitable distribution of income as well as the achievement of social goals are essential aspects of development over and above economic growth
18
Why important to talk about income inequality
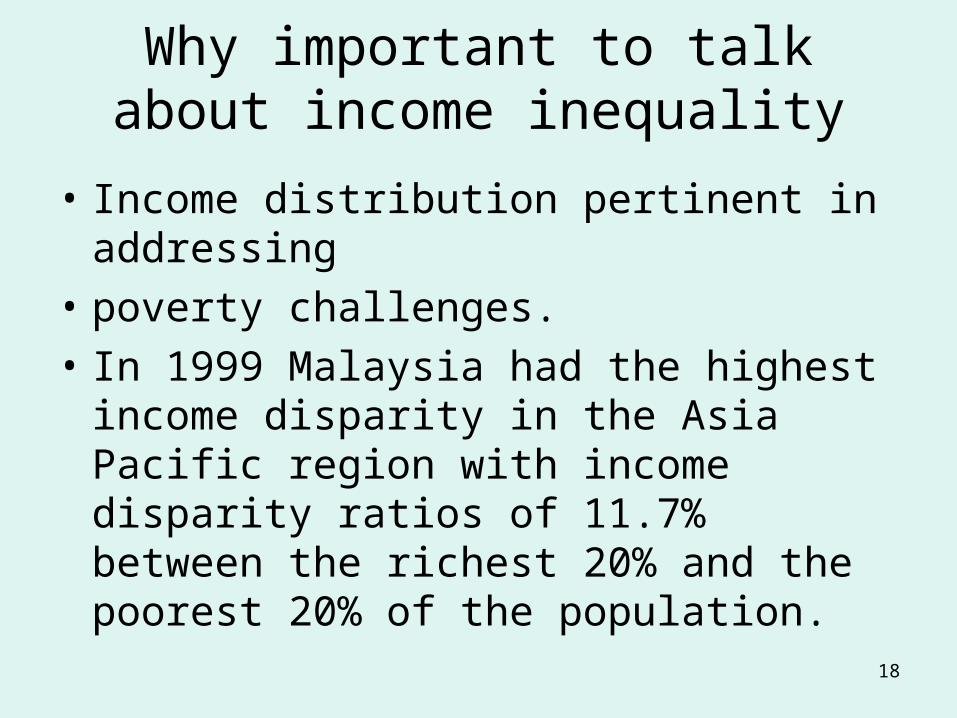
• Income distribution pertinent in addressing
• poverty challenges.
• In 1999 Malaysia had the highest income disparity in the Asia Pacific region with income disparity ratios of 11.7% between the richest 20% and the poorest 20% of the population.
19
Incidence Of Poverty by State(%)
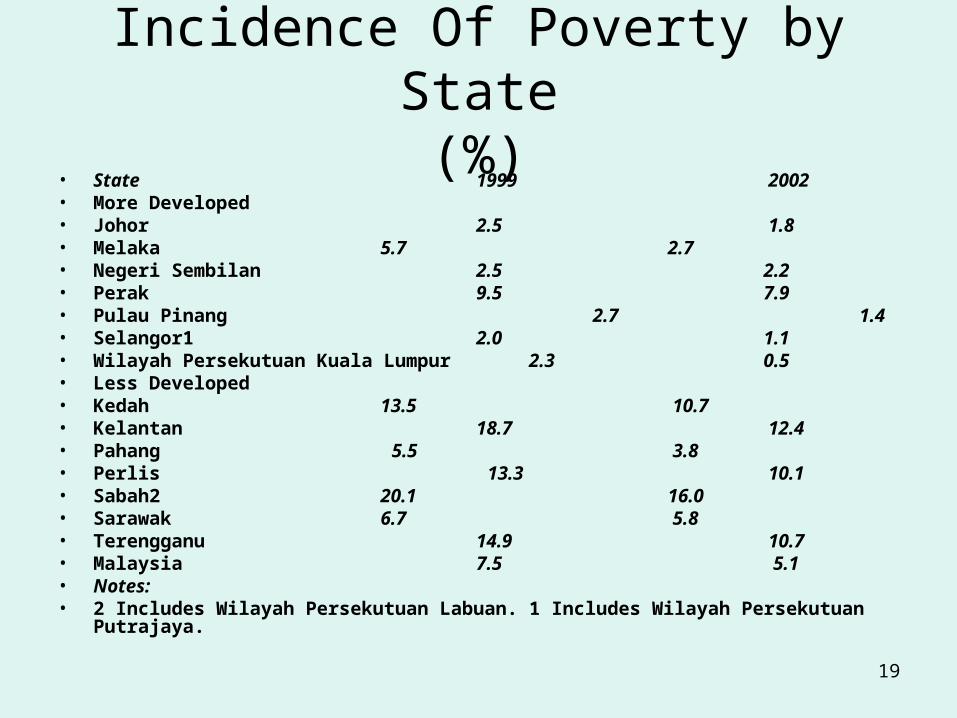
• State 1999 2002• More Developed• Johor 2.5 1.8• Melaka 5.7 2.7• Negeri Sembilan 2.5 2.2• Perak 9.5 7.9• Pulau Pinang 2.7 1.4• Selangor1 2.0 1.1• Wilayah Persekutuan Kuala Lumpur 2.3 0.5• Less Developed• Kedah 13.5 10.7• Kelantan 18.7 12.4• Pahang 5.5 3.8• Perlis 13.3 10.1• Sabah2 20.1 16.0• Sarawak 6.7 5.8• Terengganu 14.9 10.7• Malaysia 7.5 5.1• Notes:• 2 Includes Wilayah Persekutuan Labuan. 1 Includes Wilayah Persekutuan Putrajaya.
20
Incidence of Poverty (%)
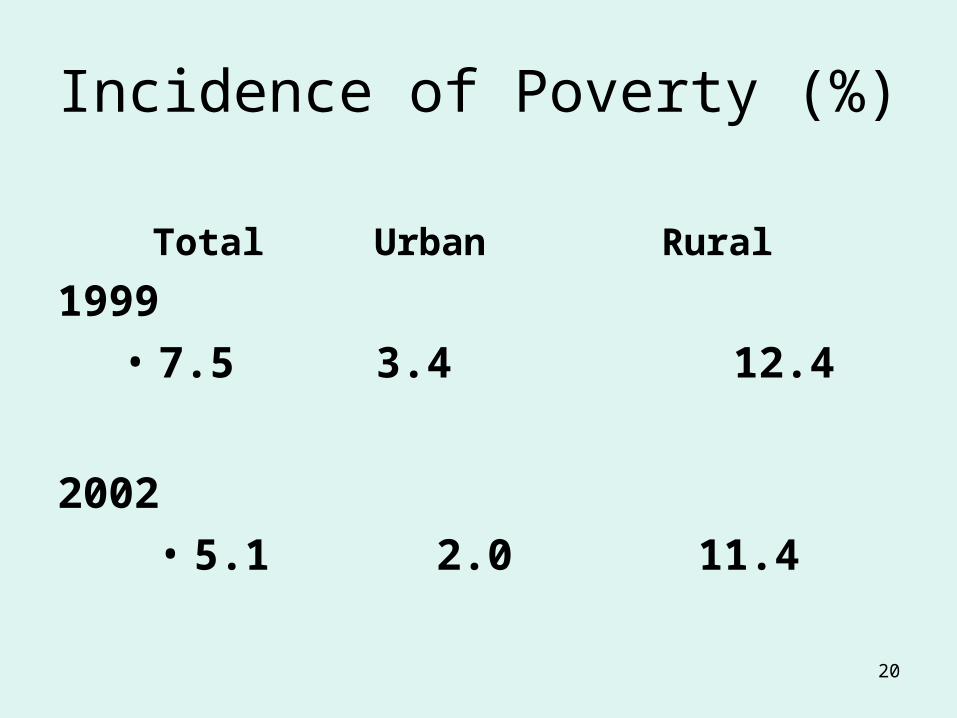
Total Urban Rural
1999
• 7.5 3.4 12.4
2002
• 5.1 2.0 11.4
21
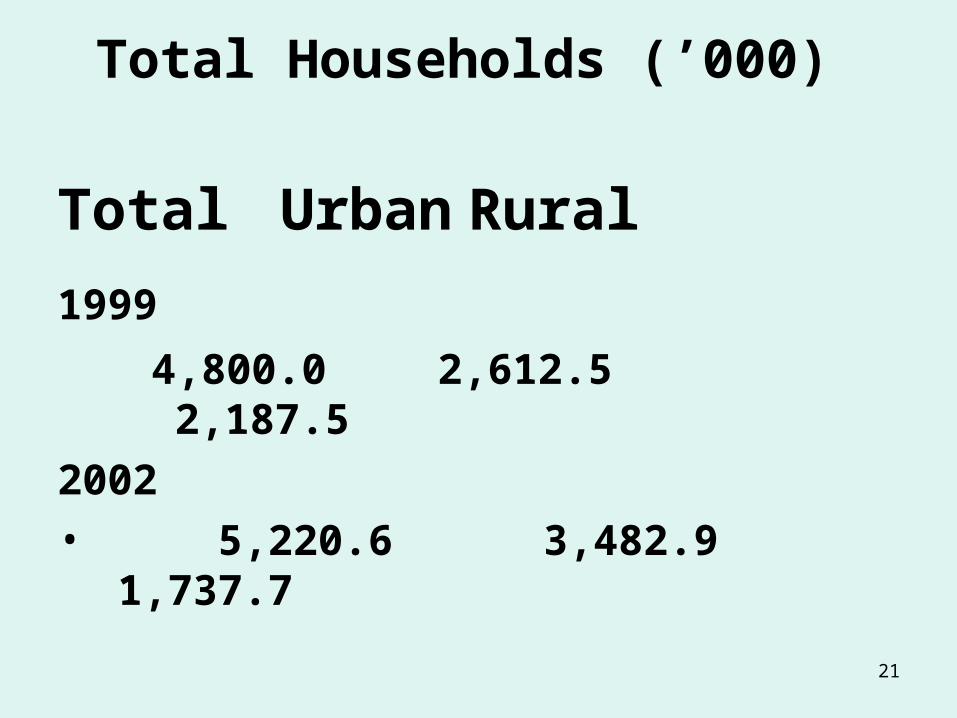
Total Households (’000)
Total UrbanRural
1999
4,800.0 2,612.5 2,187.5
2002
• 5,220.6 3,482.9 1,737.7
22
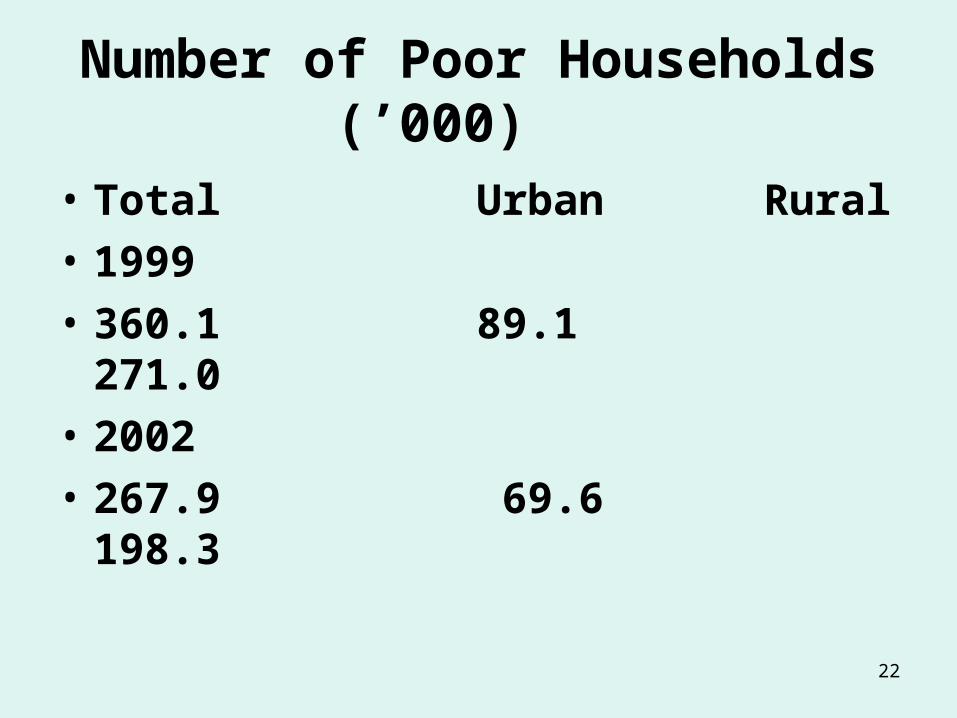
Number of Poor Households (’000)
• Total Urban Rural
• 1999
• 360.1 89.1 271.0
• 2002
• 267.9 69.6 198.3
23
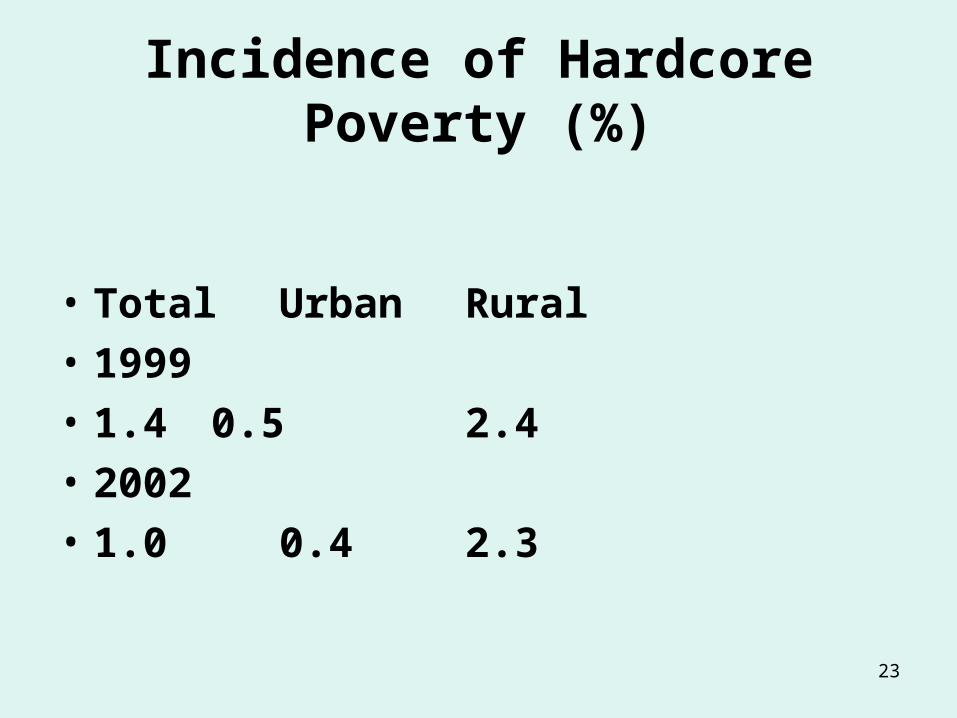
Incidence of Hardcore Poverty (%)
• Total Urban Rural
• 1999• 1.4 0.5 2.4• 2002• 1.0 0.4 2.3
24
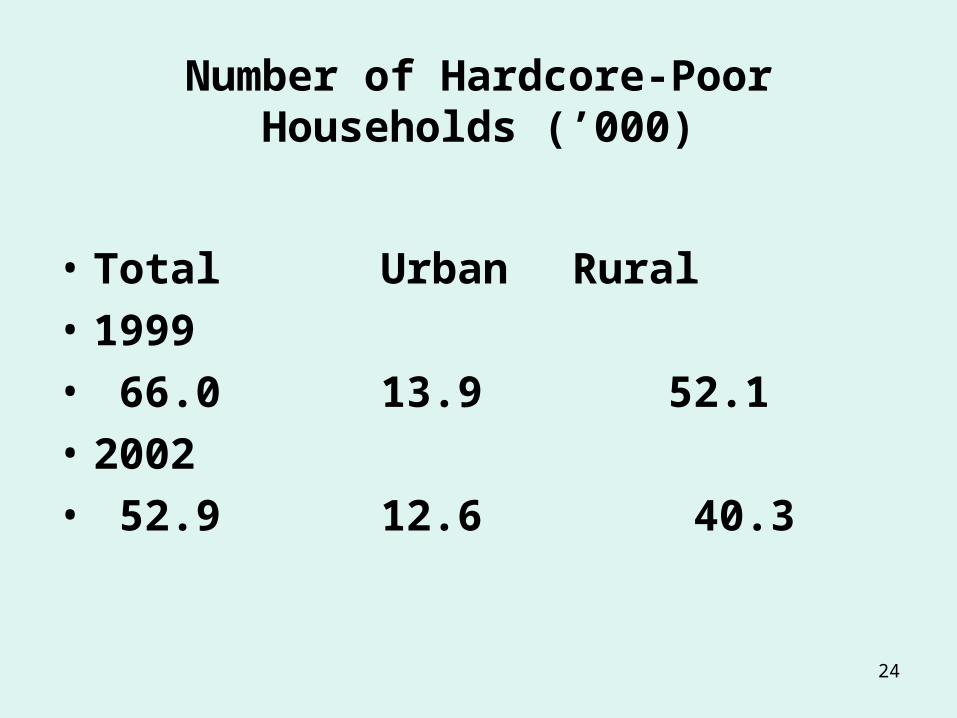
Number of Hardcore-Poor Households (’000)
• Total Urban Rural
• 1999
• 66.0 13.9 52.1
• 2002
• 52.9 12.6 40.3
25
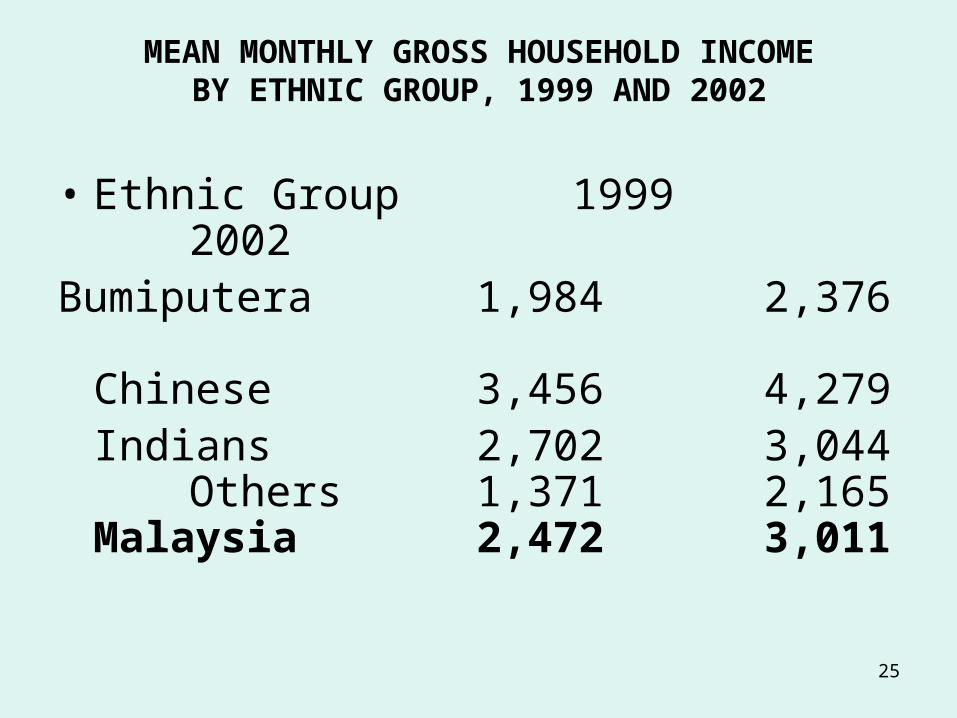
MEAN MONTHLY GROSS HOUSEHOLD INCOMEBY ETHNIC GROUP, 1999 AND 2002
• Ethnic Group 1999 2002
Bumiputera 1,984 2,376
Chinese 3,456 4,279 Indians 2,702 3,044
Others 1,371 2,165 Malaysia 2,472 3,011
26
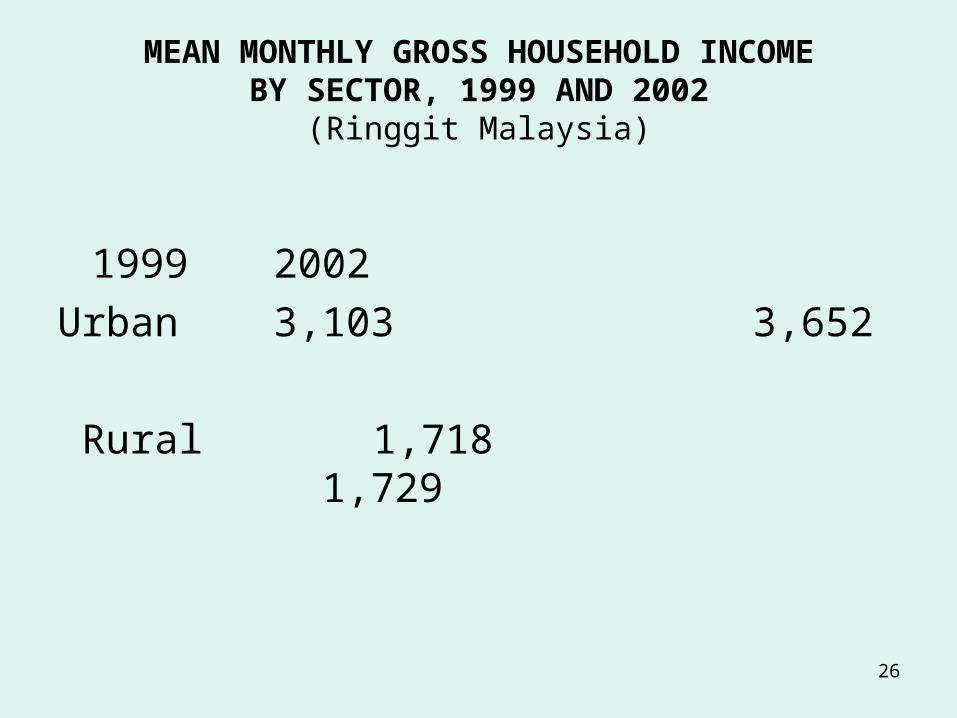
MEAN MONTHLY GROSS HOUSEHOLD INCOMEBY SECTOR, 1999 AND 2002
(Ringgit Malaysia)
1999 2002
Urban 3,103 3,652
Rural 1,718 1,729
27
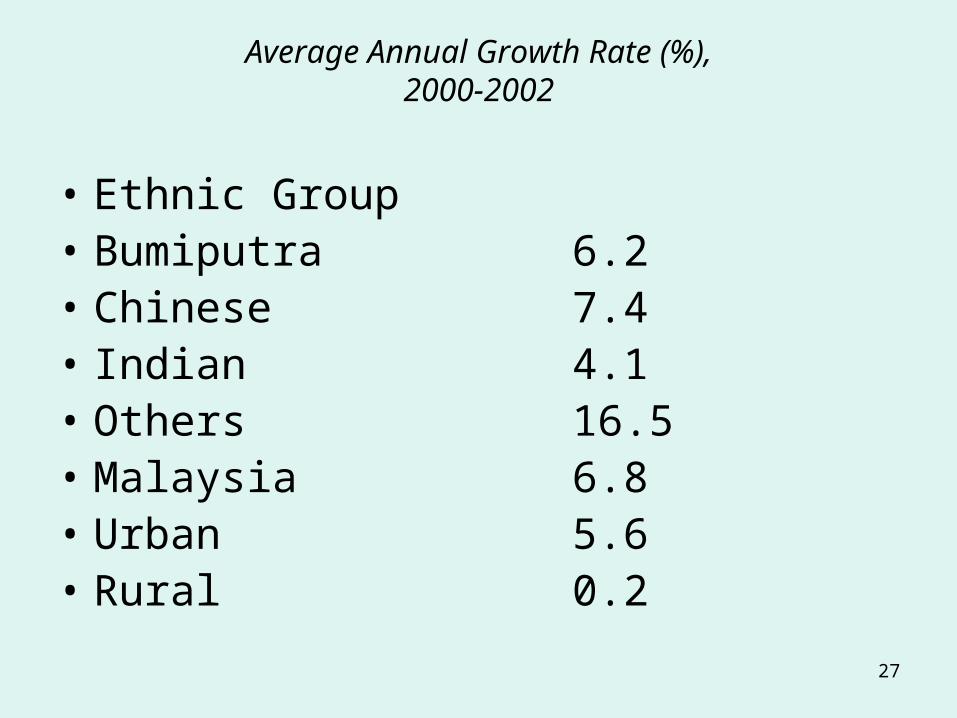
Average Annual Growth Rate (%),2000-2002
• Ethnic Group• Bumiputra 6.2• Chinese 7.4• Indian 4.1• Others 16.5• Malaysia 6.8• Urban 5.6• Rural 0.2
28
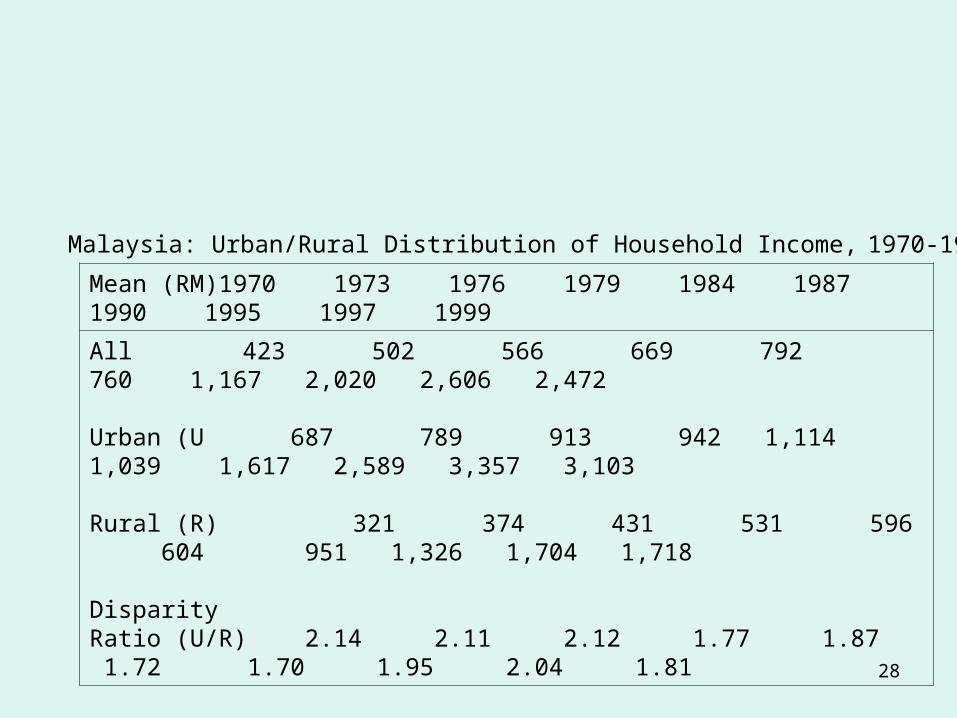
Malaysia: Urban/Rural Distribution of Household Income, 1970-1999
Mean (RM)1970 1973 1976 1979 1984 1987 1990 1995 1997 1999
All 423 502 566 669 792 760 1,167 2,020 2,606 2,472
Urban (U 687 789 913 942 1,114 1,039 1,617 2,589 3,357 3,103
Rural (R) 321 374 431 531 596 604 951 1,326 1,704 1,718 Disparity Ratio (U/R) 2.14 2.11 2.12 1.77 1.87 1.72 1.70 1.95 2.04 1.81
29
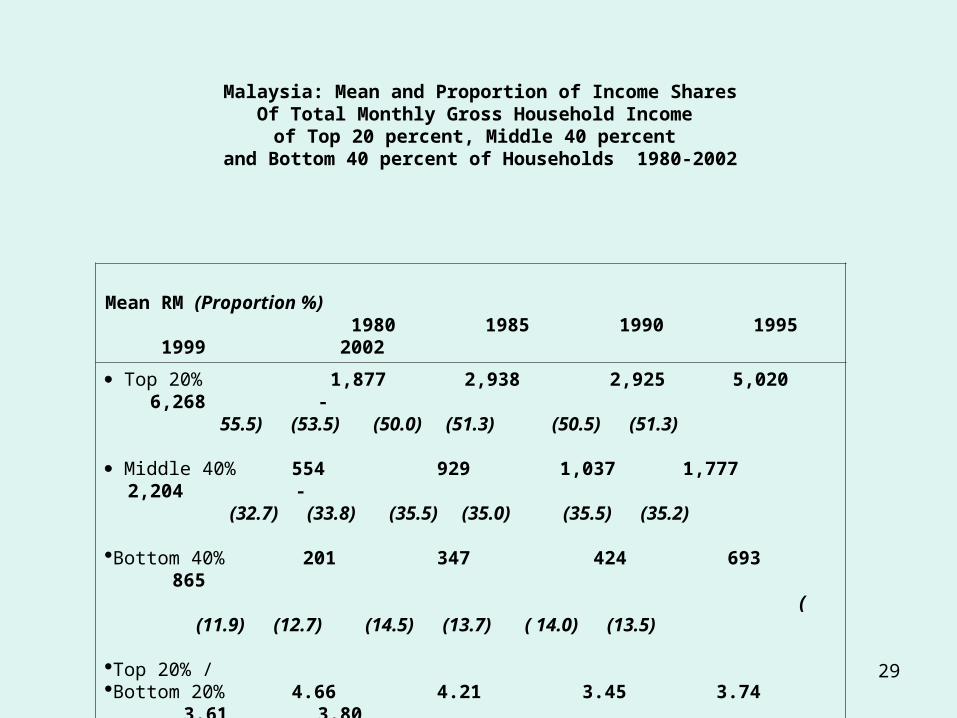
Malaysia: Mean and Proportion of Income Shares Of Total Monthly Gross Household Income
of Top 20 percent, Middle 40 percent and Bottom 40 percent of Households 1980-2002
Mean RM (Proportion %) 1980 1985 1990 1995 1999 2002
Top 20% 1,877 2,938 2,925 5,020 6,268 - 55.5) (53.5) (50.0) (51.3) (50.5) (51.3)
Middle 40% 554 929 1,037 1,777 2,204 - (32.7) (33.8) (35.5) (35.0) (35.5) (35.2)
Bottom 40% 201 347 424 693 865 ( (11.9) (12.7) (14.5) (13.7) ( 14.0) (13.5)
Top 20% / Bottom 20% 4.66 4.21 3.45 3.74 3.61 3.80
30
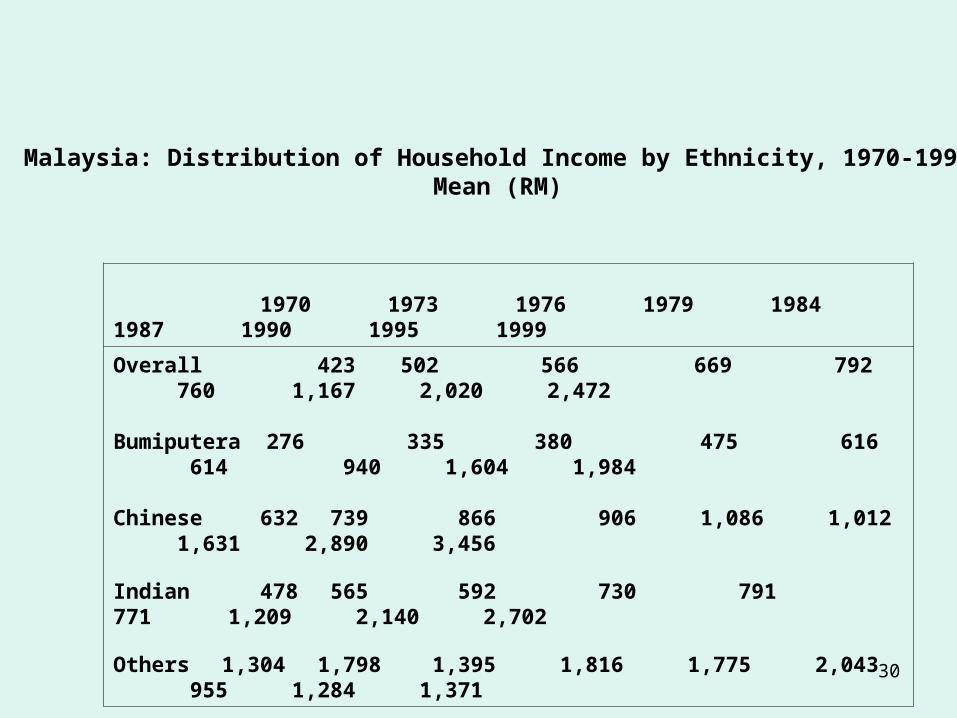
Malaysia: Distribution of Household Income by Ethnicity, 1970-1999Mean (RM)
1970 1973 1976 1979 1984 1987 1990 1995 1999
Overall 423 502 566 669 792 760 1,167 2,020 2,472
Bumiputera 276 335 380 475 616 614 940 1,604 1,984
Chinese 632 739 866 906 1,086 1,012 1,631 2,890 3,456
Indian 478 565 592 730 791 771 1,209 2,140 2,702
Others 1,304 1,798 1,395 1,816 1,775 2,043 955 1,284 1,371
31
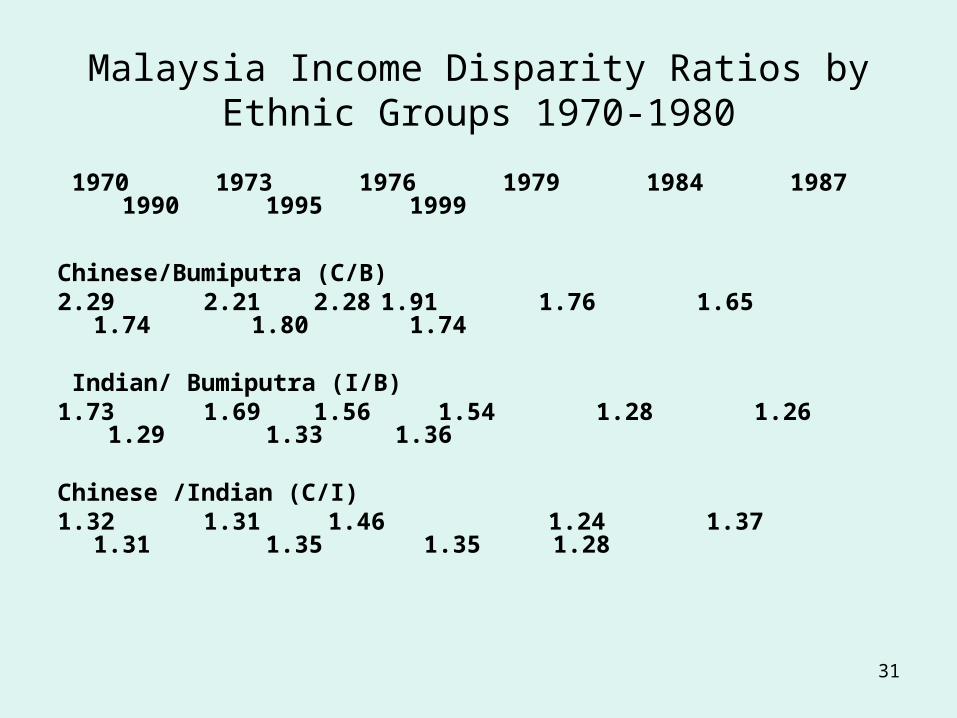
Malaysia Income Disparity Ratios by Ethnic Groups 1970-1980
1970 1973 1976 1979 1984 1987 1990 1995 1999
Chinese/Bumiputra (C/B) 2.29 2.21 2.28 1.91 1.76 1.65 1.74 1.80
1.74
Indian/ Bumiputra (I/B) 1.73 1.69 1.56 1.54 1.28 1.26 1.29 1.33
1.36
Chinese /Indian (C/I) 1.32 1.31 1.46 1.24 1.37 1.31 1.35 1.35
1.28
32
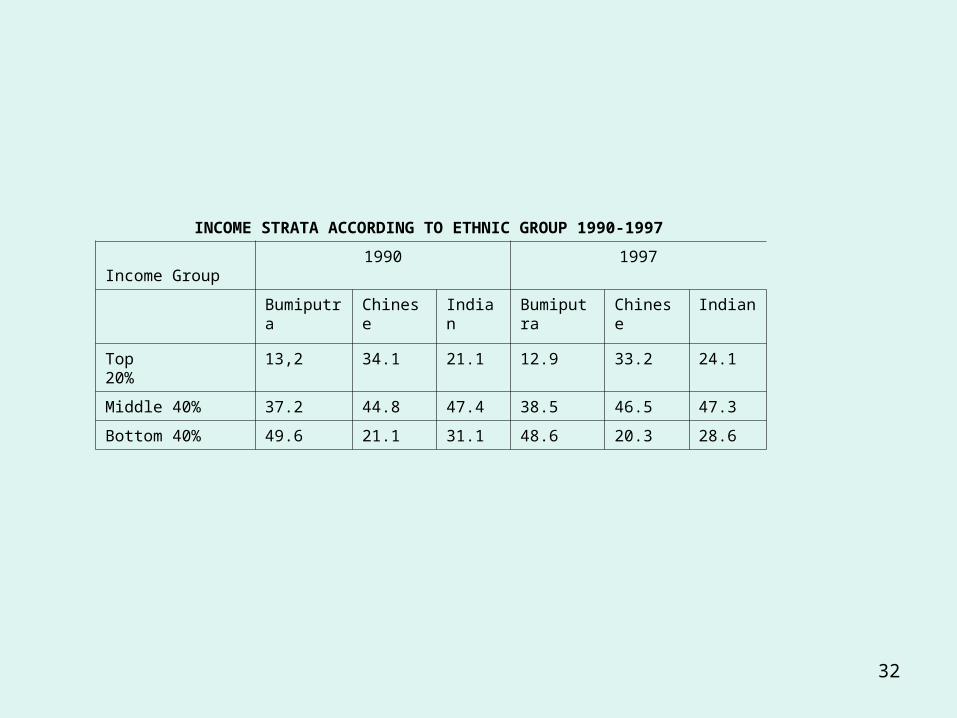
INCOME STRATA ACCORDING TO ETHNIC GROUP 1990-1997
Income Group1990 1997
Bumiputra Chinese Indian Bumiputra Chinese Indian
Top20%
13,2 34.1 21.1 12.9 33.2 24.1
Middle 40% 37.2 44.8 47.4 38.5 46.5 47.3
Bottom 40% 49.6 21.1 31.1 48.6 20.3 28.6
33
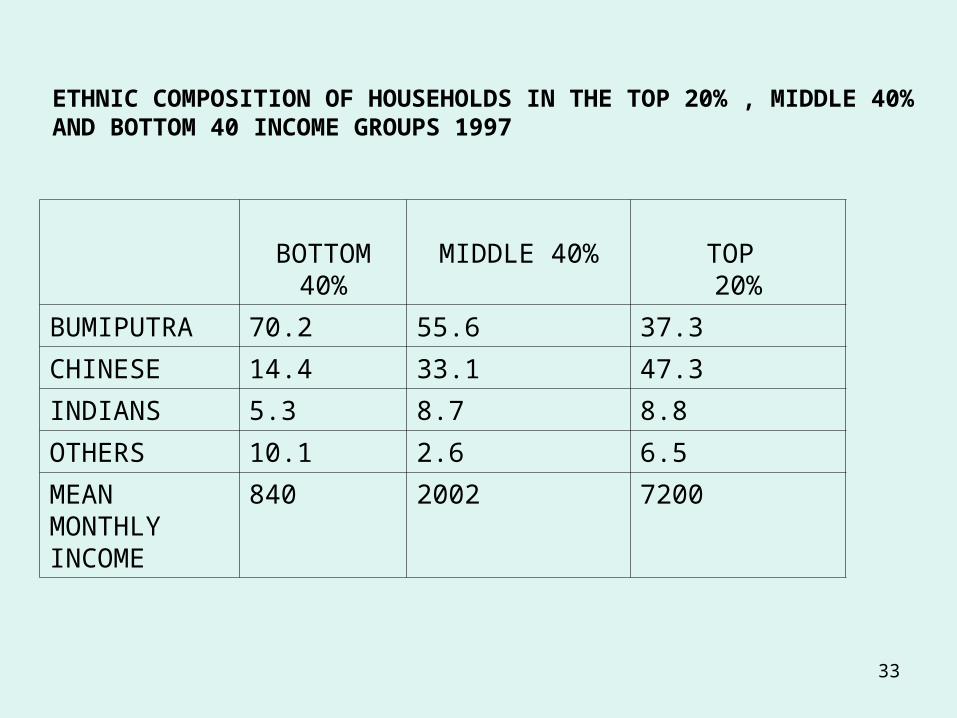
ETHNIC COMPOSITION OF HOUSEHOLDS IN THE TOP 20% , MIDDLE 40% AND BOTTOM 40 INCOME GROUPS 1997
BOTTOM 40%
MIDDLE 40% TOP 20%
BUMIPUTRA 70.2 55.6 37.3
CHINESE 14.4 33.1 47.3
INDIANS 5.3 8.7 8.8
OTHERS 10.1 2.6 6.5
MEAN MONTHLY INCOME
840 2002 7200
34
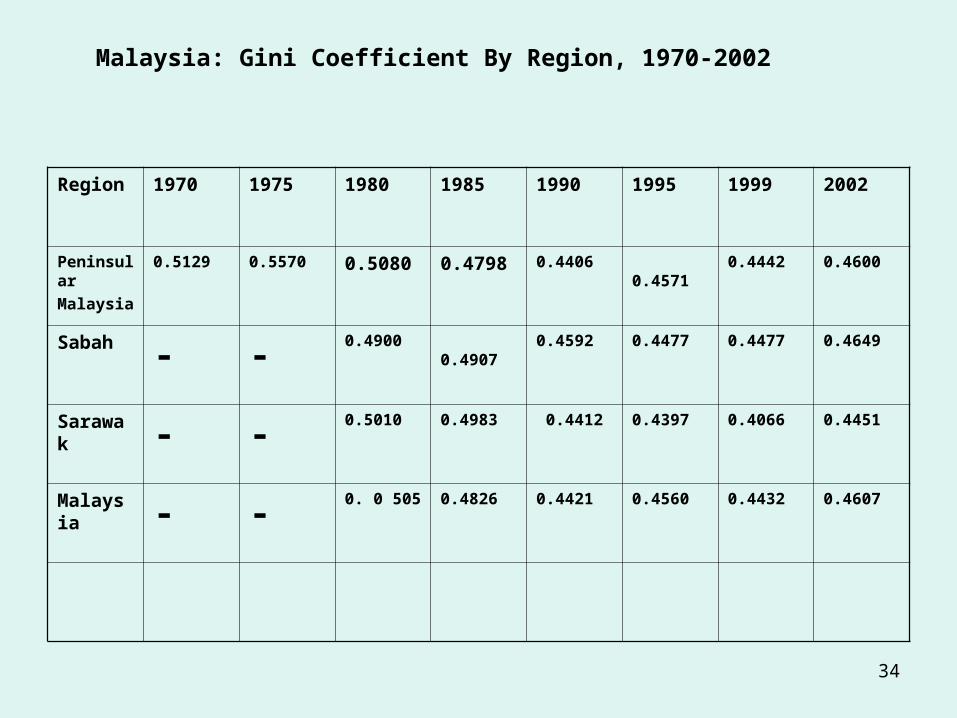
Malaysia: Gini Coefficient By Region, 1970-2002
Region 1970 1975 1980 1985 1990 1995 1999 2002
Peninsular
Malaysia
0.5129 0.5570 0.5080 0.4798 0.4406 0.4571 0.4442
0.4600
Sabah - -0.4900 0.4907 0.4592 0.4477 0.4477 0.4649
Sarawak - -0.5010 0.4983 0.4412 0.4397 0.4066 0.4451
Malaysia - -
0. 0 505 0.4826 0.4421 0.4560 0.4432 0.4607