Embed Size (px)
Citation preview
Linköpings Universitet
Instutitionen för datavetenskap
Avancerad Trafiktjänst Examensarbete
utfört för Triona AB, Borlänge av
Peter Löfås
Reg nr: LiTH-IDA-EX--05/011—SE
Linköping 2005
Handledare: Per-Olof Svensk
Examinator: Erik Berglund
Linköpings Universitet
Instutitionen för datavetenskap
Abstract
More and more travellers use navigation-aid software to find the way while driving. Most
of todays systems use static maps with little or no information at all about currently
yeilding roads conditions and disturbances in the network. It is desirable for such services
in the future to include information about road works, accidents, surface conditions and
other types of events that affects what route is currently the best.
It is also desirable to notify users about changes in the prerequisites of the chosen route
after they have started their trip.
This thesis investigates methods to include dynamic traffic information in route
calculations and notifying users when the characteristics change for their chosen route.
The thesis utilizes dynamic traffic information from The Swedish Road Agencys
(Vägverket) central database for traffic information, TRISS and calculates affected
clients with help of positioning through the GSM network.
Keywords: Dynamic Traffic Information, TRISS, Navigation Aid Systems, GSM
Positioning, CGI-TA, Optimal Route Calculation.

Linköpings Universitet
Instutitionen för datavetenskap
Acronyms
3G 3rd Generation mobile phone network API Application Programming Interface
CGI Cell Global Identity
CGI-TA Cell Global Identity and Timing Advance
CPU Central Processing Unit
DHTML Dynamic HyperText Markup Language
DOM Document Object Model
FCD Floating Car Data
GIS Geographic Information System
GPS Global Positioning System
GSM Global System for Mobile Communications
GMPC Gateway Mobile Positioning Centre
GPRS General Packet Radio Services
HTML HyperText Markup Language
ITS Intelligent Transport Systems and Services
LBS Location Based Services
MPS Mobile Positioning System
OS Operating System
PDA Personal Digital Assistant
RDS Radio Data Services
TA Timing Advance TMC Traffic Message Channel
TNE Traffic Network Engine
TRISS Trafikinformationsstödsystem (Traffic information support system)
Smartphone Mobile phone with operating system able to run applications
SMPC Serving Mobile Positioning Centre

Linköpings Universitet
Instutitionen för datavetenskap
Acknowledgements
This master thesis has been written within the Applied Physics program at Linköping
University. It comprises 20 credits, which is equivalent to one semester of full-time
study. The project was initiated and funded by Triona AB, Borlänge, Sweden. Triona AB
is one of Scandinavia’s leading companies within IT solutions for road and
transportation.
I would like to thank all people at Triona that have contributed to this work by answering
my questions and being supportive in all situations.
Special thanks to
... my supervisor Peo Svensk at Triona for his ideas and suggestions about the thesis.
... Alistair Landels at Triona for proofreading and commenting the report.
... Lars Nordvall at Triona giving me an introduction to the ESRI software
Thank you
Linköpings Universitet
Instutitionen för datavetenskap
Contents
1. INTRODUCTION 1
1.1. BACKGROUND AND PREREQUISITES 1 1.2. PURPOSE AND TARGET 1 1.3. LIMITATIONS 2
2. PROBLEM AND REQUIREMENTS ANALYSIS 3
2.1. FINDING OPTIMAL ROUTES 3 2.2. DRAWING MAPS WITH DYNAMIC INFORMATION 3 2.3. FINDING AND NOTIFYING AFFECTED CLIENTS 4 2.4. POSITIONING CLIENTS 4
3. EXISTING TRAFFIC SERVICES 5
3.1. ON BOARD SYSTEMS 5 3.2. OFF BOARD SYSTEMS 5 3.3. OTHER TYPES OF SERVICES 8 3.4. SUMMARY OF EXISTING SERVICES 8
4. TRAFFIC SERVICE FUNCTIONALITY 10
4.1. CALCULATING OPTIMAL ROUTES 10 4.1.1 USING TNE ROUTING 10 4.1.2 USING RUTTGER 11 4.1.3 USAGE OF DYNAMIC INFORMATION WHEN CALCULATING WITH RUTTGER 11 4.2. PUSH INFORMATION USING HTML 12 4.3. STORING USER INFORMATION AND ROUTE DATA 13 4.4. FINDING AFFECTED CLIENTS 13 4.4.1 DIFFERENT TYPES OF INFORMATION REQUIRE DIFFERENT SELECTION ALGORITHMS 14 4.4.2 POSITIONING CAN ELIMINATE THOSE WHO HAVE ALREADY PASSED 14 4.4.3 POSITIONING CONSUMES NETWORK BANDWIDTH 14 4.4.4 CONTINUOUS POSITIONING 16 4.4.5 POSITIONING WHEN AN EVENT OCCURS 17 4.4.6 CAPACITY IN THE SYSTEM 19 4.4.7 ESTIMATION OF COSTS USING THE SERVICE FOR USERS 20 4.5. SUMMARY 21
5. ARCHITECTURE 22
5.1. SYSTEM OVERVIEW 22
Linköpings Universitet
Instutitionen för datavetenskap
5.2. USER SESSION INFORMATION FLOW 23 5.3. REFERENCE SYSTEMS 23 5.3.1 PRIMARY REFERENCE SYSTEMS 23 5.3.2 SECONDARY REFERENCE SYSTEM 23 5.4. INFORMATION FLOW AND ACTORS 25 5.5. SUMMARY 25
6. DATA SUPPLY 26
6.1. REQUIREMENTS ON THE AVAILABLE DATA 26 6.2. DATA SOURCES 27 6.2.1 NVDB 27 6.2.2 TRISS 27 6.2.3 TELIA SERVICE INTEGRATOR 27 6.2.4 COMBINING STATIC DATA FROM MANY SOURCES 27 6.3. DYNAMIC DATA IN ROUTE-CHOICE ALGORITHMS 29
7. SERVER SOLUTION 30
IN THIS CHAPTER THE SERVICES RUNNING ON THE CENTRAL SERVER IS DESCRIBED MORE
CLOSELY. 30 7.1. GENERAL DEMANDS 30 7.2. STANDARDS 30 7.3. WEB APPLICATION 30 7.4. SERVER SOFTWARE, TRISS-MONITOR 31 7.5. THE USER DATABASE 32
8. MOBILE UNIT/CLIENT 34
8.1. GENERAL REQUIREMENTS 34 8.1.1 APPLICATION LIMITATIONS WHEN CHOOSING DUMB CLIENTS 34 8.2. STANDARDS 34 8.3. CLIENT REQUIREMENTS 35 8.3.1 CLIENTS WEB BROWSER REQUIREMENTS 35 8.3.2 COMMUNICATION CHANNEL REQUIREMENTS 35
9. SIMULATIONS 36
10. SUMMARY 38
10.1. MINIMIZING DATA TRANSFER BETWEEN SERVER AND CLIENT 38 10.2. MINIMIZING THE NUMBER OF POSITIONING REQUESTS 38 10.3. KNOWN LIMITATIONS IN THE SYSTEM 39 10.4. USING DYNAMIC DATA WHEN CALCULATING ROUTES 39 10.5. CONCLUSION AND RECOMMENDATIONS 39 10.6. FUTURE WORK 40

Linköpings Universitet
Instutitionen för datavetenskap
APPENDIX A. POSITIONING METHODS 41
APPENDIX B. COORDINATE SYSTEMS 44
REFERENCES 48
Linköpings Universitet
Instutitionen för datavetenskap
Page 1 of 57
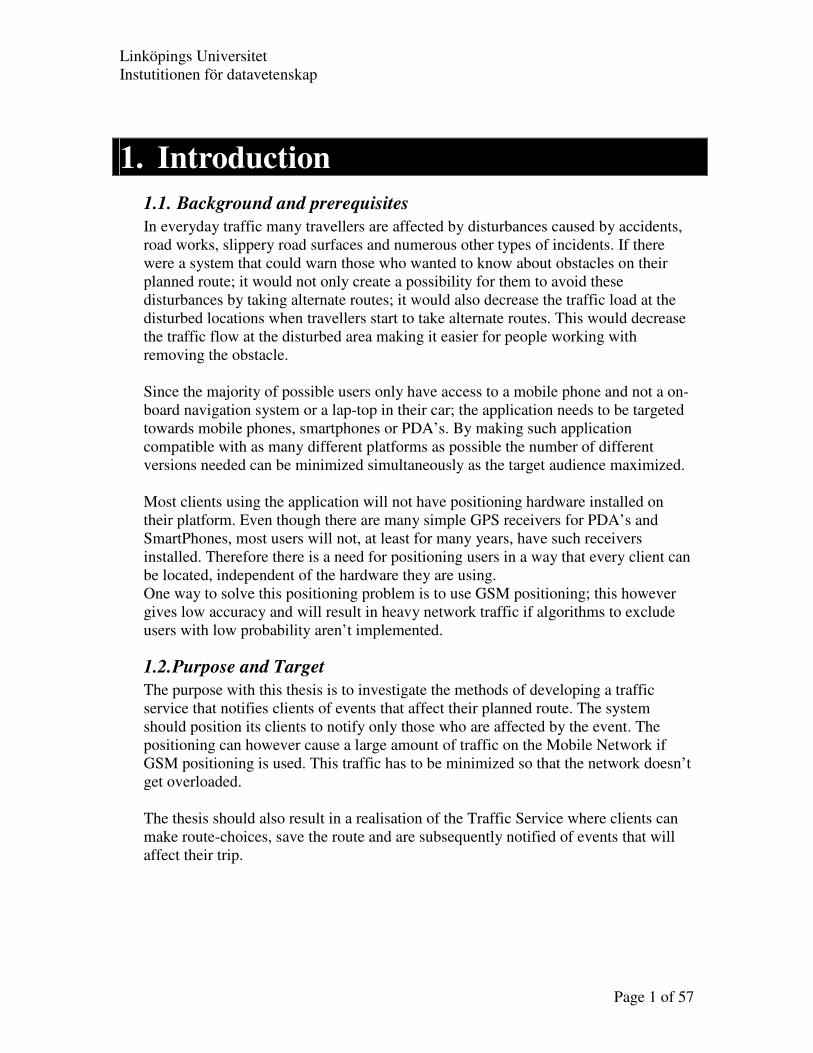
1. Introduction
1.1. Background and prerequisites
In everyday traffic many travellers are affected by disturbances caused by accidents,
road works, slippery road surfaces and numerous other types of incidents. If there
were a system that could warn those who wanted to know about obstacles on their
planned route; it would not only create a possibility for them to avoid these
disturbances by taking alternate routes; it would also decrease the traffic load at the
disturbed locations when travellers start to take alternate routes. This would decrease
the traffic flow at the disturbed area making it easier for people working with
removing the obstacle.
Since the majority of possible users only have access to a mobile phone and not a on-
board navigation system or a lap-top in their car; the application needs to be targeted
towards mobile phones, smartphones or PDA’s. By making such application
compatible with as many different platforms as possible the number of different
versions needed can be minimized simultaneously as the target audience maximized.
Most clients using the application will not have positioning hardware installed on
their platform. Even though there are many simple GPS receivers for PDA’s and
SmartPhones, most users will not, at least for many years, have such receivers
installed. Therefore there is a need for positioning users in a way that every client can
be located, independent of the hardware they are using.
One way to solve this positioning problem is to use GSM positioning; this however
gives low accuracy and will result in heavy network traffic if algorithms to exclude
users with low probability aren’t implemented.
1.2. Purpose and Target
The purpose with this thesis is to investigate the methods of developing a traffic
service that notifies clients of events that affect their planned route. The system
should position its clients to notify only those who are affected by the event. The
positioning can however cause a large amount of traffic on the Mobile Network if
GSM positioning is used. This traffic has to be minimized so that the network doesn’t
get overloaded.
The thesis should also result in a realisation of the Traffic Service where clients can
make route-choices, save the route and are subsequently notified of events that will
affect their trip.

Linköpings Universitet
Instutitionen för datavetenskap
Page 2 of 50
1.3. Limitations
It will be almost impossible to load-test the system. The system will only be tested
with a small number of simultaneous clients and afterwards the expected behaviour of
the system under full load will be calculated.
Linköpings Universitet
Instutitionen för datavetenskap
Page 3 of 50
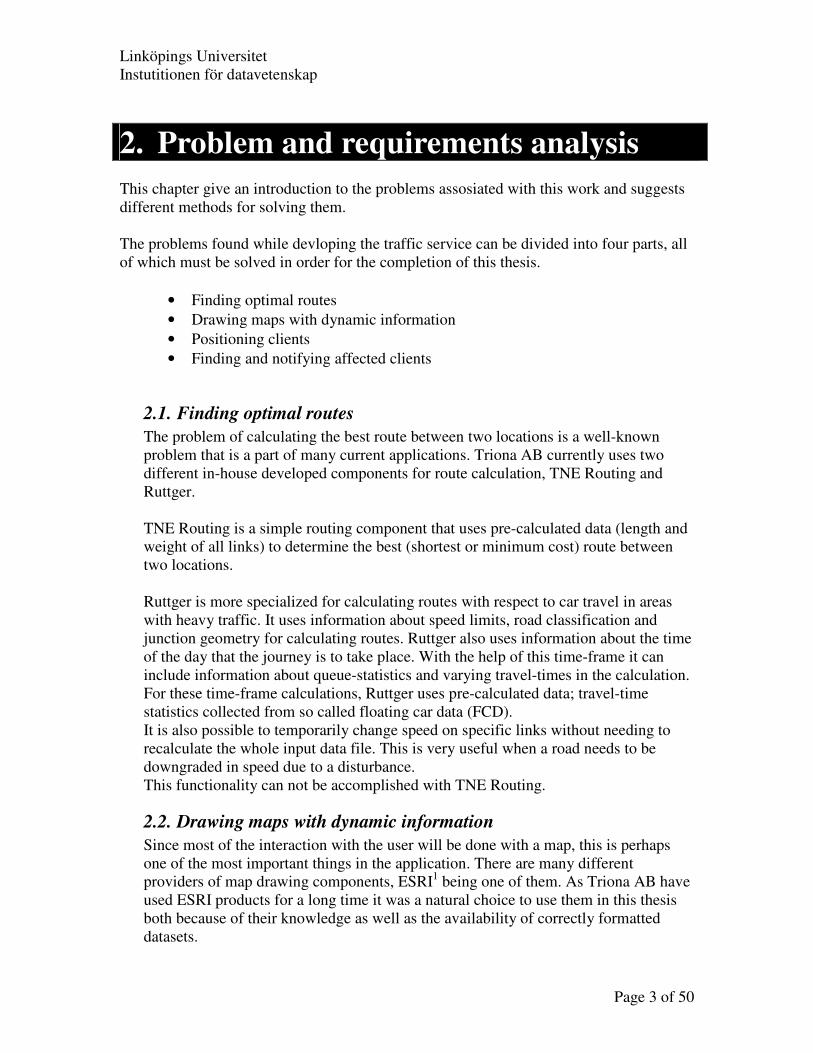
This chapter give an introduction to the problems assosiated with this work and suggests
different methods for solving them.
The problems found while devloping the traffic service can be divided into four parts, all
of which must be solved in order for the completion of this thesis.
• Finding optimal routes
• Drawing maps with dynamic information
• Positioning clients
• Finding and notifying affected clients
2.1. Finding optimal routes
The problem of calculating the best route between two locations is a well-known
problem that is a part of many current applications. Triona AB currently uses two
different in-house developed components for route calculation, TNE Routing and
Ruttger.
TNE Routing is a simple routing component that uses pre-calculated data (length and
weight of all links) to determine the best (shortest or minimum cost) route between
two locations.
Ruttger is more specialized for calculating routes with respect to car travel in areas
with heavy traffic. It uses information about speed limits, road classification and
junction geometry for calculating routes. Ruttger also uses information about the time
of the day that the journey is to take place. With the help of this time-frame it can
include information about queue-statistics and varying travel-times in the calculation.
For these time-frame calculations, Ruttger uses pre-calculated data; travel-time
statistics collected from so called floating car data (FCD).
It is also possible to temporarily change speed on specific links without needing to
recalculate the whole input data file. This is very useful when a road needs to be
downgraded in speed due to a disturbance.
This functionality can not be accomplished with TNE Routing.
2.2. Drawing maps with dynamic information
Since most of the interaction with the user will be done with a map, this is perhaps
one of the most important things in the application. There are many different
providers of map drawing components, ESRI1 being one of them. As Triona AB have
used ESRI products for a long time it was a natural choice to use them in this thesis
both because of their knowledge as well as the availability of correctly formatted
datasets.
2. Problem and requirements analysis
Linköpings Universitet
Instutitionen för datavetenskap
Page 4 of 50
There is a fundamental requirement to access the application over the internet since
this will be almost the only way for a client to communicate with the server while
travelling. The map-drawing component thereby needs to be internet-compatible.
With ArcGis Server 9 from ESRI there is an application programming interface (API)
for developing internet applications with GIS functionality in the Microsoft.NET
environment. This has proven to be a good solution for map production and since the
API offers possibilities to programmatically change the appearance of the map there
should be no problem displaying dynamic information.
2.3. Finding and notifying affected clients
One of the goals with this thesis is to determine how it is possible to notify only those
who are affected by an event. It is necessary to find algorithms able to assess with a
high probability if a client has already passed an incident and therefore does not need
to be notified of it. It is also important to never exclude clients from notification that
have not passed since they would thereby loose faith in the service.
Since it is preferable that the system handle a large number of concurrent users it is
necessary that many of the clients not affected by an incident can be excluded from
notification without the need to first be located with positioning; thereby reducing
network traffic and increasing the responsiveness in the system since every
positioning request consumes time.
2.4. Positioning clients
Positioning can be done either by using a client side positioning method like GPS* or
by using a server side method like GSM (CGI-TA*).
The use of a client side positioning method like GPS would heavily decrease the
number of possible users since it would require the users to have special hardware
installed on their PDAs or Mobile Phones. As one aim for the application to target as
many clients as possible, it would be better to use a server based method such as
positioning through the GSM network which would allow positioning of all users that
have a mobile phone. Telia offers positioning of people that use their network with
their service Telia Service Integrator2.
The traffic service developed is however independent of the positioning method used,
it will be developed for use with GSM positioning but could easily be adapted for use
with GPS or any other client side positioning method if higher is required.
* See Appendix A
Linköpings Universitet
Instutitionen för datavetenskap
Page 5 of 50
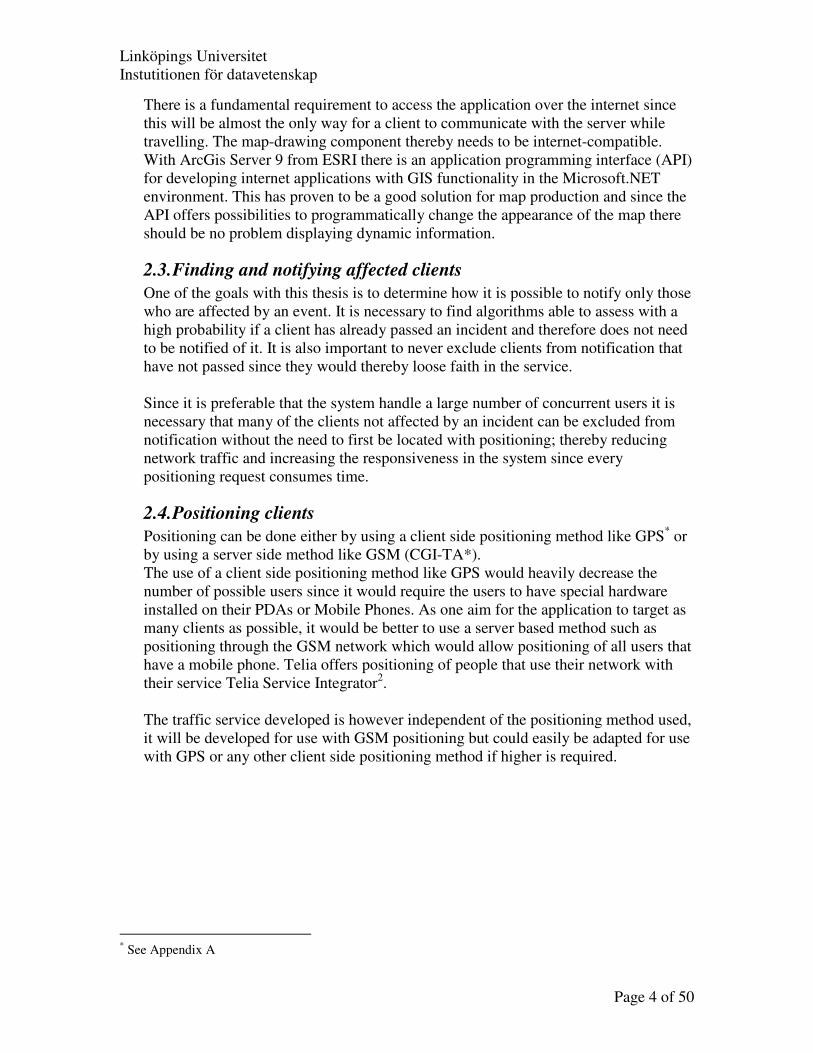
Figure 3.1: The TomTom Go system is a compact client with built-in map data.
3. Existing Traffic Services
One part of the thesis was to investigate existing traffic-services and try to understand
how they work. This has been done both for services announced in advertisements and
services found searching the internet.
There are different types of navigation-aid services currently
on the market which we can categorize in two main
categories
• On board systems
• Off board systems
3.1. On board systems
There are many service providers currently on the market that offer complete systems
for positioning and navigation. These systems often utilize a static map that is built
into the application; this means that the map has few possibilities to adapt to the
current situation on the road.
Examples of such systems are:
• TomTom GO3
• Navigon4
• GSat5
Many car-manufactures also offer their own navigation application that can be built-
in directly to the cars dashboard. These applications also commonly use static map-
data to calculate routes.
Some of the systems with built-in static maps use traffic information broadcasted
through RDS-TMC for showing the current road situation on the map. One example of
such an application is NAVIGON4.
What’s common for most of the on board systems is that they:
• Use a static map which does not always contain the latest information
• Often does not take notice of current conditions when calculating routes
• Does not use dynamic data and hence has few capabilities to warn when the
prerequisites for the planned route change
3.2. Off board systems
More interesting for the user of a navigation application is if it can be notified about
road works and other road incidents; thus giving the users the possibility to avoid
them if they choose to. These applications have a fundamental need of
communication with a central server to retrieve updated information about the road
network and events attached to it; therefore some kind of network connection for the
Linköpings Universitet
Instutitionen för datavetenskap
Page 6 of 50
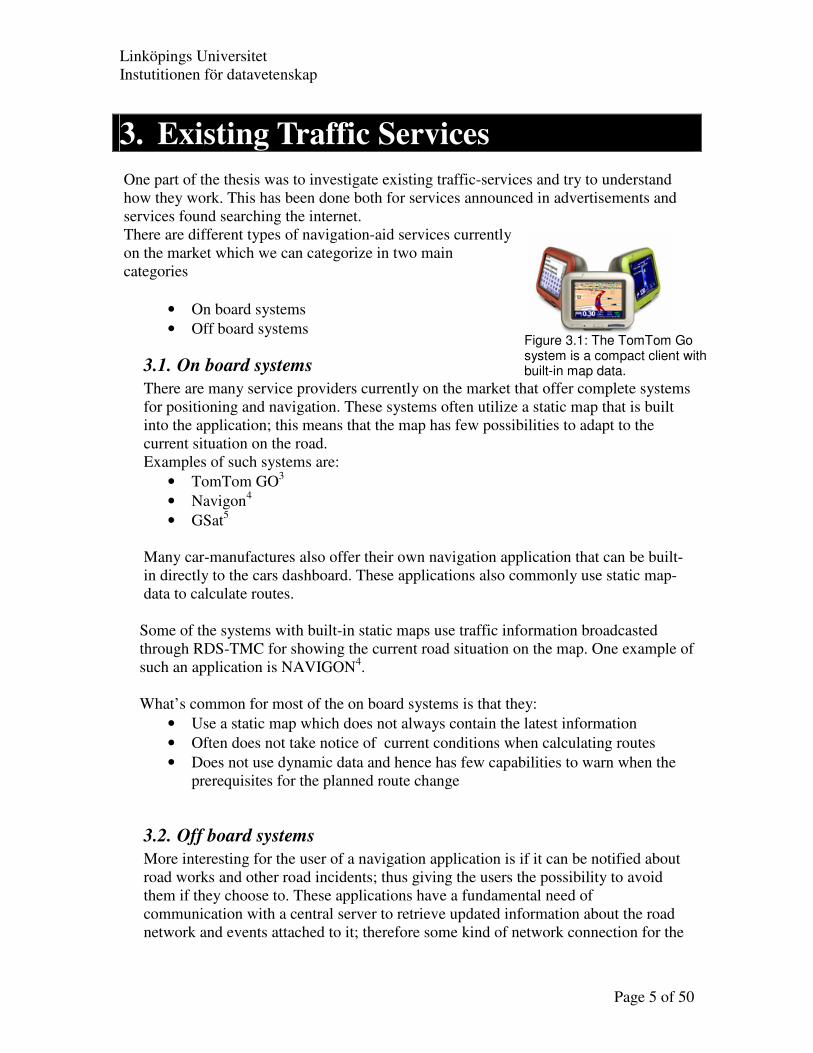
Figure 3.2: Wayfinder runs directly on mobile phones that use Symbian OS
client is required. Such system of today commonly runs directly on mobile phones
that have support for running applications, or on a PDA; which uses a mobile phone
as the network connection.
Wayfinder6 Wayfinder is the currently most developed application among these. It runs directly on
a mobile phone running Symbian as its operating system (most of Sony-Ericssons and
Nokias new phones use Symbian). To obtain the actual location of the client, the
system communicates with a GPS-receiver over a Bluetooth channel.
The Wayfinder system uses a server-based map where map data either can be
downloaded before the beginning of the journey; where the user in general have
access to a much better network connection than when travelling; or map information
can be downloaded when required by the application. The “when needed” alternative
seems to work as grid-based map retrieval which means that the map is divided into
small grids where the application; when entering a new square in the grid; requests
data for that square if that data has not already been downloaded. If the data already
has been downloaded, the application just asks the map-server for changes in the data
between the actual and the locally cached versions.
This map-retrieval technique is one of the most efficient for
requesting data over limited channels since only the data really
needed is transferred. If this is combined with preloading of the
grid-squares that the route passes before beginning the trip, the
performance of the application will be very good since very
little data needs to be transferred.
The Wayfinder system can include known obstructions when
calculating the optimal route; such obstructions include road
works, traffic jams and accidents. The system does not however
send a notification to the users about new obstructions that
occur and how it may affect the planned route for a client.
Polaris Telmap7 Polaris Telmap runs on JAVA-enabled mobile phones, it uses a
Bluetooth GPS just like Wayfinder for positioning. Telmap
however stores all map data locally on the phone but uses a
network connection, most often GPRS, for fetching other
spatial information like road data and points of interest (POI) that are to be displayed
on the map.
Telmap does not include any information about obstructions or other traffic events
when calculating optimal routes.
Linköpings Universitet
Instutitionen för datavetenskap
Page 7 of 50
Telmap is not limited to just car travelling. When calculating a route there is an option
to specify what kind of trip is to be calculated: by car, bike or foot. The application
then calculates the optimal route with respect to those prerequisites.
CoPilot8 CoPilot is a navigation-aid system that runs on PDAs, smartphones or laptops.
It is not specified whether the system uses server based or built-in maps.
It does not include information about obstructions in the network when calculating
optimal routes. The user can however recalculate the route when he reach an
obstruction during the journey.
Together with the CoPilot system you can use CoPilot Live which is a server add-on
for the system. With CoPilot Live your current position is continuously transmitted to
a central server and is viewable via the internet for those who have access to a
tracking-id and password. This is a way for companies to keep track of its entire fleet
of cars of all time. Via CoPilot Live it’s also possible to send messages and new
driving directions to a client using the internet.
Webraska Smartzone9 Webraska Smartzone runs on PDAs and mobile phones with Symbian OS. Maps are
stored on a central server and fetched upon need through a network connection, most
commonly GPRS.
Optimal route calculations are performed by the central server and the route is then
downloaded to the mobile client.
Although the initial optimal route calculation is made by the central server the client
can calculate new alternative routes by itself during the trip; this calculation can be
accomplished without needing to download new data. The client can also enlarge the
map to an arbitrary scale without needing to retrieve new data from the server. These
two features indicate that the map data sent from the server to the client is in a
vectorized form.
Webraska uses information about current accidents, road works and traffic jams when
calculating the optimal route. No detection about new accidents or other obstructions
is however made during the client’s trip.
LiveAnywhere Traffic10 LiveAnywhere runs on PDAs, SmartPhones, mobile phones and ordinary computers.
It combines map data with current traffic status by analyzing information collected
from traffic cameras and road censors. The client can view the current traffic status
directly on the map or play it as an animation. The user can also connect directly to
the traffic cameras and look at streamed video from them.
Route Choices can be made with respect to the current traffic situation and the current
average speed on the roads. Alternate routes can also be computed during the trip to
find if there are routes with better traffic flow than the current route.
Linköpings Universitet
Instutitionen för datavetenskap
Page 8 of 50
The users can also be alerted about new traffic jams, those alerts are however not
linked to the users’ routes which mean that users will receive alerts about events that
don’t concern them.
Appello11 Appello is one of the newer Swedish service providers of mobile navigation systems.
Their product WISEPILOT offers navigation possibilites with a Bluetooth GPS and
NAVTEQ mapdata combined with real-time traffic information.
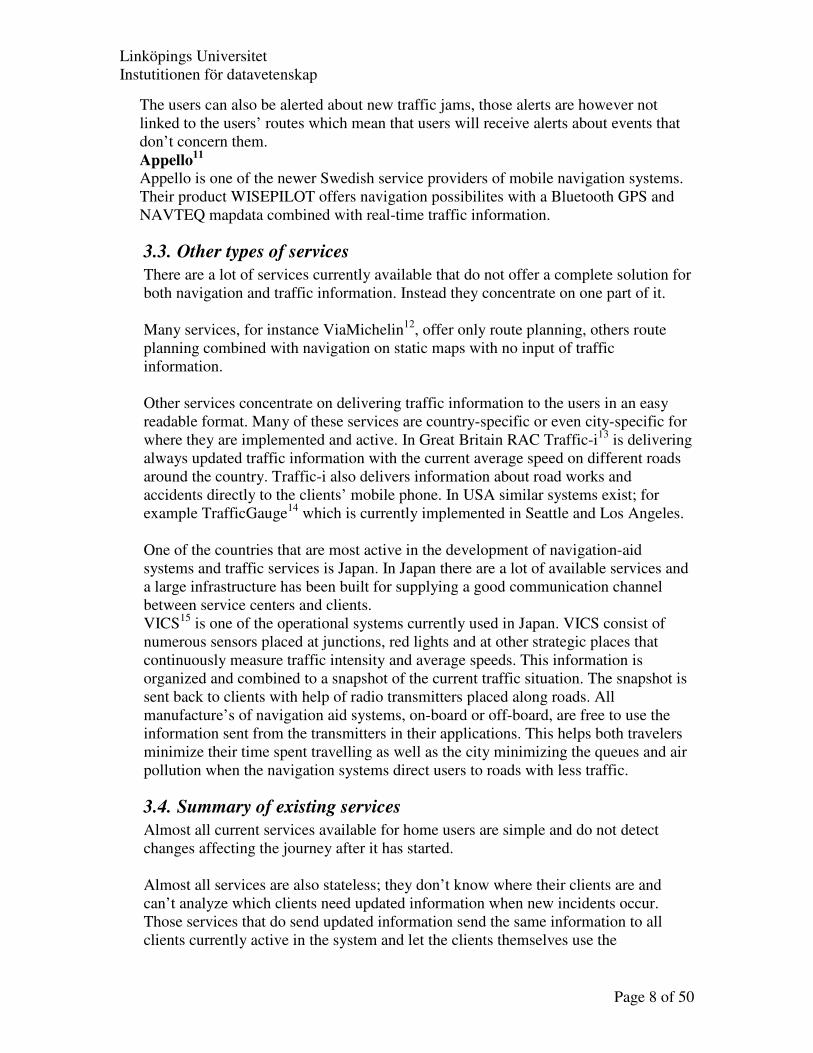
3.3. Other types of services
There are a lot of services currently available that do not offer a complete solution for
both navigation and traffic information. Instead they concentrate on one part of it.
Many services, for instance ViaMichelin12
, offer only route planning, others route
planning combined with navigation on static maps with no input of traffic
information.
Other services concentrate on delivering traffic information to the users in an easy
readable format. Many of these services are country-specific or even city-specific for
where they are implemented and active. In Great Britain RAC Traffic-i13
is delivering
always updated traffic information with the current average speed on different roads
around the country. Traffic-i also delivers information about road works and
accidents directly to the clients’ mobile phone. In USA similar systems exist; for
example TrafficGauge14
which is currently implemented in Seattle and Los Angeles.
One of the countries that are most active in the development of navigation-aid
systems and traffic services is Japan. In Japan there are a lot of available services and
a large infrastructure has been built for supplying a good communication channel
between service centers and clients.
VICS15
is one of the operational systems currently used in Japan. VICS consist of
numerous sensors placed at junctions, red lights and at other strategic places that
continuously measure traffic intensity and average speeds. This information is
organized and combined to a snapshot of the current traffic situation. The snapshot is
sent back to clients with help of radio transmitters placed along roads. All
manufacture’s of navigation aid systems, on-board or off-board, are free to use the
information sent from the transmitters in their applications. This helps both travelers
minimize their time spent travelling as well as the city minimizing the queues and air
pollution when the navigation systems direct users to roads with less traffic.
3.4. Summary of existing services
Almost all current services available for home users are simple and do not detect
changes affecting the journey after it has started.
Almost all services are also stateless; they don’t know where their clients are and
can’t analyze which clients need updated information when new incidents occur.
Those services that do send updated information send the same information to all
clients currently active in the system and let the clients themselves use the

Linköpings Universitet
Instutitionen för datavetenskap
Page 9 of 50
information they want. This means that a lot of bandwidth is used for sending
unnecessary information that is resulting in a direct cost for the users.
The lack of systems delivering targeted information to their users could be explained
with the fact that navigation aid systems and traffic services are new to the public
users. Therefore most applications today are in an early stage of the development and
it can be assumed that when the market grows bigger and stronger these services will
surely adapt to the consumers needs.
Linköpings Universitet
Instutitionen för datavetenskap
Page 10 of 50
4. Traffic Service functionality This chapter explain the problems encontered while developing the service. The
method used for solving them will also be explained and where there are alternate
methods or where the used method will not always be perfect, this will be noted.
4.1. Calculating optimal routes
When the user connects to the service, we need to know what route the user is
planning to take in order for the service to send valid notifications. Instead of letting
the user manually specify the complete route we let him choose a from- and a to-city.
The service then calculates the optimal route between these cities and displays the
suggested route to the user; who now will have the possibility to specify an unlimited
number of “go via” cities and thereby be able to slightly modify the original route
suggestion.
4.1.1 Using TNE Routing
TNE Routing16
, a route choice component developed by Triona AB, can be used
for finding optimal routes. It utilizes Djikstra’s double bucket method17 18
for
calculating the optimal path of a set of weighted links. TNE Routing needs
structured input data with nodes, links, length of links and a weight of the links
where the weight can be anything that is transferable to integers. If the application
for example need to calculate the fastest route between two nodes the theoretical
travel-time of the links is assigned as their weights.
In the implemented applications, the optimal path should be the one with the
shortest travel time. This is a big generalisation since drivers on many roads
convey their vehicles at speeds other than the given speed limit. This will be
noticeable when two alternate routes which are almost equally long have the same
speed limit but in the real world offer different conditions such as curvature, road
surfaces, amongst other things that make the drivers more likely to choose the
longer route instead of the one that’s theoretically fastest.
While testing the application developed in this thesis it was found that these
problems rarely occur and most times the application make the same route choice
as I believe to be the best. When the problem does occur it is easily fixed by
adding “go via” cities/villages to get the route desired.
One big drawback with TNE Routing is that it does not naturally support dynamic
data changes other than by updating the input data and recalculating routing-data
for the whole network. Since generation and calculation of the routing-data is a
CPU intensive process that can take several hours to complete if the road network
is large, one tries to avoid doing this frequently.
Some other changes will also have to be made in TNE Routing before it will work
optimally with this Traffic Service. It will need to be able to calculate routes with
Linköpings Universitet
Instutitionen för datavetenskap
Page 11 of 50
specifications like “go not via”; without that type of specifications it’s hard for the
service to calculate routes that avoid blocked roads.
4.1.2 Using Ruttger
There has been a wish from Triona that an alternate route-planner should be
implemented using the service, Ruttger. Ruttger has been developed and used for
making route choices in central Gothenburg and Triona has been interested to see
whether it is also suitable for making more large scale route choices.
Since Ruttger does support dynamic data changes, one possibility to that lack in
TNE Routing is simply to use Ruttger instead of TNE Routing, or to use Ruttger
when calculating alternate routes.
As the thesis progressed Ruttger became more and more interesting to use as the
main route planner. Finally it was fully integrated into the service as an alternative
to TNE Routing.
4.1.3 Usage of dynamic information when calculating with Ruttger
Ruttger offers the possibility to use dynamic information when calculating routes
to suggest an optimal route with respect to the currently yielding road conditions.
The problem when including dynamic information in route-calculation is
determining how the different incidents and events affect a certain road segment.
In the channel with dynamic traffic information available for the development of
this service, events are defined in a way where it’s very hard to assume which
road segments are really affected. According to the model for traffic messages the
number of affected segments should be availible in the message but this is often
missing.
For accidents and smaller incidents which affect a very small area, most often
only a single road segment, the closest road segment to the accident point can be
assumed to be the only one affected.
The big problem arises when trying to detect affected road segments for incidents
and events with a long extent; such as Road Works. There is information in the
information channel about enclosing location codes20
which could be used for
calculating the approximate extent of an event. This calculation is however not
trivial and demands that the information received on the channel is correctly
entered. Since there are no currently developed algorithms on how to interpretate
and transfer the given event-information to road segments, this thesis will only
assign events to the closest road segment of the given point of the events location.
There is another big issue when trying to make correct route choices with the help
of dynamic traffic data. With Triss; which is the system that feeds the information
channel used in this thesis with traffic information, there is no exact way to know
how much delay an incident creates. Some events are assigned properties about
temporary speed changes which could be used to update the route planner, but
often there is no information at all about how hard an event affects traffic.
Linköpings Universitet
Instutitionen för datavetenskap
Page 12 of 50
As an example the current version of Triss defines road-work as everything from
road-side grass cutting with no disturbance to traffic, to a large scale construction
work with several minutes of delay to passing cars.
These problems will not be handled more closely in this thesis as the
interpretation of dynamic traffic data from Triss is beyond its scope. It is also fair
to believe that in some future version of Triss the possibility to define situations
more precisely will be possible.
4.2. Push information using HTML
It is specified that the final service should be compatible with many different PDAs,
mobile phones and smartphones. The simplest solution to accomplish this is to use the
built in web browser and develop the service with HTML, images and Java Script.
Most recent PDAs and Smartphones support at least JavaScript 1.0 and newer clients
will certainly have better built-in web browsers as development progresses.
Since it was also specified that the service should keep the amount of data transferred
to a minimum, there is a need of; if planning to use HTML; find a way to push data
from the server to the client since the most common method where clients poll the
server for new information at certain time-intervals will generate a lot of extra data
transfer.
One must also remember that the notifications sent to clients must be shown as
quickly as possible otherwise the clients may reach the event before the system has
sent the notification about it.
By combining the HTML-poll technique with a smart server-application the wanted
push-protocol can be, if not implemented, at least imitated.
The wanted scenario is that the client opens a connection to the server; the server then
causes the client to wait for an answer by not returning any data. The server will hold
the connection open until it receives data that is to be pushed back to the client. When
there is data to push, the server sends an answer to the client who processes the
answer, extracts the data and then immediately reconnects to the server to wait for
more pushed data.
This way, the delay between when the system receives a message and when it will be
shown to the client can be kept at its minimum. In fact, it will be as low as a couple of
seconds instead of up to minutes if the clients poll for information with certain
predefined intervals that are not short.
The performance of the system is dependent on the software used on the server. If
Internet Information Server (IIS) is used; which is shipped with most Windows server
installations; there will be a limitation on the maximum concurrent connections to the
server. Since the wish is that the server can handle many simultaneous sleeping
connections there may be problems using IIS as the web server. However, since the
server applications are built in ASP.net, the usage of IIS is almost forced since there
Linköpings Universitet
Instutitionen för datavetenskap
Page 13 of 50
are currently few other web servers apart from IIS that supports ASP.Net
applications.
Since the service uses frames; one for displaying maps and handling interactivity with
the user and another hidden frame for the fake HTML-push of events; there is no
limitation for the use of only one web server. The HTML-push frame could be
developed for connecting to a specially designed server application that does not run
in a web server, thereby having the possibility of maintaining almost an unlimited
number of simultaneous connections.
4.3. Storing user information and route data
Since there is a need of keeping track of the currently active users state (position and
wanted route), the need of storing information about every user in the system is
obvious. Users can be identified by the session id uniquely assigned by the web
server to everyone connecting to it.
There is a requirement for finding a way to detect users that have left the service and
should thus no longer receive notifications. Since session id’s assigned by the web
server are used to identify users one must make sure that their session never times
out. If the session time-out limit is set high and the users’ push window is refreshed
more often than that timeout period (even if no notification has to be sent, the session
should never be able to time out).
Refreshing the users HTML-push window means that an empty message is sent to the
user which makes the user to initiate a new request to the server and thereby keeping
the session alive.
The alternative to reload even if no situations occur can also be used for updating a
flag in the database that contains the last interaction between the user and the server.
For users where the time since last interaction is larger then a specified time frame
(e.g.: 20 minutes) it can be assumed that they no longer are active, or that they are
using the service with a new session id.
If this application is released in an commersial way, there will be a need of
maintaining a login interface to be able to register and charge users for their usage of
the service. This can be utilized for also maintaining memory of settings between
sessions for the same user. Since the users’ session may be timed out or disconnected
during a trip due to bad GSM coverade the usage of user-login to the service can be
used to resume an interupted session without special interaction from the user.
4.4. Finding affected clients
If all clients currently using the system would be notified of every event the system
receives, there would be a lot of unnecessary data traffic in the network and a lot of
clients would be notified of events that do not concern them. Because of this, there is
a requirement to detect which clients are to be notified of the event.
Linköpings Universitet
Instutitionen för datavetenskap
Page 14 of 50
4.4.1 Different Types of Information Require Different Selection Algorithms
Road Works and Accidents
Most of the information that the system handles is road works and traffic
accidents that affect a certain road. This information is only interesting for
clients that pass the specific road segment and no other clients should be
notified about it.
Weather and Road Conditions
For more general traffic information; such as weather conditions and road
status which apply to an area rather than to a specific road, all clients that
pass within a radius (e.g.: hundreds of kilometres) of the event’s centre could
be affected and should be warned.
4.4.2 Positioning can eliminate those who have already passed
If all clients have routes that intersect with the area / road that are affected by an
event should be notified, there would be a great possibility that many of these
clients have already passed the affected area and thus receive a notification with
information that they do not need. This will both lead to both unnecessary traffic
in the mobile network and disinformation to the clients.
By using a positioning technique (e.g.: GPS or GSM) one could, depending on the
accuracy of the positioning method used, calculate a more or less exact current
position of each client. With the help of this current position, only clients that
aren’t guaranteed to have passed the affected area should be sent notifications.
Thereby the total number of clients receiving notifications is reduced to include
only those with a position before the affected area and those within a specified
radius of the event’s centre.
4.4.3 Positioning Consumes Network Bandwidth
Server-based positioning methods
For server-based positioning methods such as GSM-positioning every
positioning request needs a certain amount of network bandwidth to
calculate the client position. Since network bandwidth is not unlimited there
is a ceiling of how many positioning request per second the network can
handle.
Client-based positioning methods
When using a client-based positioning method, for instance GPS, it is the
client that takes responsibility for calculating its own current position.
However, since the server needs access to the client’s last known position
the client has to transfer all calculated positions to the server. This can be
Linköpings Universitet
Instutitionen för datavetenskap
Page 15 of 50
optimized but there will always be a need on bandwidth to accomplish the
transfer.
In both the client and the server case, the need of not positioning too often is
an obvious design constraint for keeping the bandwidth need to a minimum.
Unnecessary to position too often if accuracy is low A measured position will always contain some inaccuracy. Positioning
every 10th
second with accuracy with an order of magnitude something as
large as kilometres; which is the case when using GSM-positioning19
; the
value of the information acquired by each new measured position is low.
Too frequent positioning will also lead to, if no filtering technique is
applied, a great possibility of disinformation when the client’s position
could appear to jump forward and backwards along the road.
When positioning with low accuracy, one could take notice of that its
unnecessary to measure a new position when it’s not likely that the new
position gives any new information of the client’s position.
For example, the interval between two consecutive positioning requests
should be big enough for the client to travel at least twice as far as the
margin of error in the yielding positioning system, for GSM-positioning that
corresponds to a positioning interval of approximately 2-4 minutes for a
vehicle travelling at 70km/h.
Unnecessary to position if it’s not detectable on the map For GPS-positioning the similar interval will be approximately 1 second.
There are other aspects that must be considered when using a positioning
system that has good accuracy. The map that the user sees has a specified
scale. If this scale is too small, position differences of meters may not be
detectable on the map and should therefore never be sent if bandwidth use is
to be minimized.
A general rule could be that a new position should not be calculated more
often than that the time that the vehicle has had to travel at least half the size
of the marker on the map used to pinpoint the clients’ locations to them.
Example: Assume we have a screen size of 200x300 pixels which shows a
map area of 10x15 km and a position marker of 10x10 pixels.
Then we should not position more often than that the vehicle have had time
to travel at least 10000/(200/10) = 500meters which correspond to a time
interval of approximately 25 seconds when traveling at 70 km/h.
Both of these considerations of how often one should position can be
combined into a rule for how long the minimum time-interval should be:
Minimum time-interval = )2,1max( tt
Linköpings Universitet
Instutitionen för datavetenskap
Page 16 of 50
][
][ker
][tan
][
]/[
[sec]6,3/*)/(
2
[sec]6,3/
21
pxpixelsinMapwidthW
pxwidthrPositionmaW
mcedisrealinMapwidthW
mgmethodpositionininInaccuracyX
hkmspeedAveragev
vWW
Wt
v
Xt
M
P
W
MP
W
=
=
=
=
=
=
=
In the service developed within this thesis some adjustments will have to be
made to the above rule. Since positioning repeatedly at the minimum time-
interval given above will result in a heavy load of positioning requests when
the service get crowded with users, there is a need to position each client not
more often than is absolutely necessary.
The positioning requirements when an event occurs can be summarized as
• Those clients that have a last known position that is after the event-
area can be dismissed without notifying nor positioning
• Those that can be assumed with high probability not have passed can
be notified directly without first measuring their position.
• The remaining clients with intersecting routes need to be queried for
their current position in order for the service to make a correct
decision for them.
This problem needs to be minimized with respect to the total number of
position-requests the system has to process?
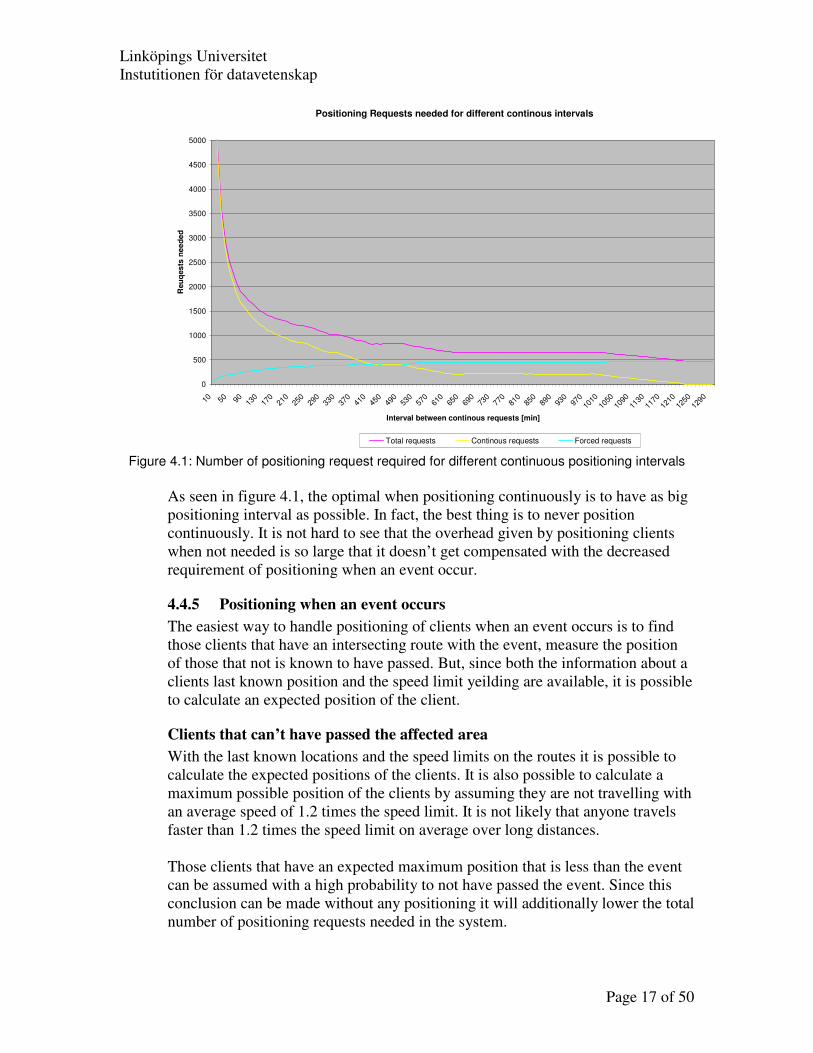
4.4.4 Continuous positioning
One idea is to continuously position all active users with a specified interval. This
makes all the clients having a more recent last known location all the time and it’s
also likely that decisions for more clients can be made without positioning when
an event occur. However, it will also result in many unnecessary positioning
requests. The pros and cons for this method will be investigated here.
To calculate the optimal interval between two consecutive interval requests a
scenario was simulated with 1000 clients starting at minute intervals and
travelling along a 100km long road at a speed of 70km/h.
Linköpings Universitet
Instutitionen för datavetenskap
Page 17 of 50
Positioning Requests needed for different continous intervals
0
500
1000
1500
2000
2500
3000
3500
4000
4500
5000
10 50 90 130
170
210
250
290
330
370
410
450
490
530
570
610
650
690
730
770
810
850
890
930
970
1010
1050
1090
1130
1170
1210
1250
1290
Interval between continous requests [min]
Reu
qes
ts n
ee
de
d
Total requests Continous requests Forced requests
Figure 4.1: Number of positioning request required for different continuous positioning intervals
As seen in figure 4.1, the optimal when positioning continuously is to have as big
positioning interval as possible. In fact, the best thing is to never position
continuously. It is not hard to see that the overhead given by positioning clients
when not needed is so large that it doesn’t get compensated with the decreased
requirement of positioning when an event occur.
4.4.5 Positioning when an event occurs
The easiest way to handle positioning of clients when an event occurs is to find
those clients that have an intersecting route with the event, measure the position
of those that not is known to have passed. But, since both the information about a
clients last known position and the speed limit yeilding are available, it is possible
to calculate an expected position of the client.
Clients that can’t have passed the affected area
With the last known locations and the speed limits on the routes it is possible to
calculate the expected positions of the clients. It is also possible to calculate a
maximum possible position of the clients by assuming they are not travelling with
an average speed of 1.2 times the speed limit. It is not likely that anyone travels
faster than 1.2 times the speed limit on average over long distances.
Those clients that have an expected maximum position that is less than the event
can be assumed with a high probability to not have passed the event. Since this
conclusion can be made without any positioning it will additionally lower the total
number of positioning requests needed in the system.
Linköpings Universitet
Instutitionen för datavetenskap
Page 18 of 50
If these assumptions erroneously send a notification to a client that already has
passed the accident, it will not cause any damage more than maybe some irritation
for the user.
It is more important to never miss sending a notification then to send too many.
Clients that are likely to already have passed the affected area
In the same way as for finding those likely to not have passed, it’s possible to try
finding those that are most likely to have already passed. When finding those who
have passed, one must consider that the speed on the road in average often tends
to be less than the specified speed limit; because of red lights, bad weather and
numerous of other factors. There is always the possibility that the client has
stopped for a break, which must also be considered.
An assumption could be that a client on average travels at a speed of at least 1/3
of the current limit. This will give satisfactory results over long distances but
could cause some erroneous decisions in the cases where clients take long breaks
during short trips, but since it is not likely that a user takes a break on a short trip
it is safe to ignore these cases.
By using the calculated minimum position of the clients, it is safe to assume that
if that position is beyond the affected area the client is likely to have passed the
event and doesn’t need to be positioned nor notified.
There is a small likelihood of missing notifications to users when making these
assumptions. One example could be when clients get caught in queues due to
accidents and the system has assumed they are travelling at at least 1/3 of the
speed limit. But since those users are already at the accident the problem with
them not getting any notification is relatively small and if they got the
notification, they would probably have had few possibilities to choose an alternate
route.
If the system is set to never exclude users from notification that could be affected
the calculation of those likely to have passed can be omitted from the algorithm
with a slight increase of the positioning required for the system as result.
Delays in the system
There is a significant delay between the time when an event occurs and when it
enters the system. This delay will vary a lot and is not easy to compensate for in
the algorithms. From the time when an event (for example: an accident) occurs it
will take some time before anyone reports the event (for accidents to SOS 112).
From when the event is reported there is another delay before the event is
manually added to the Triss system, this delay is said to be less than 5 minutes
from when the event is reported.
Linköpings Universitet
Instutitionen för datavetenskap
Page 19 of 50
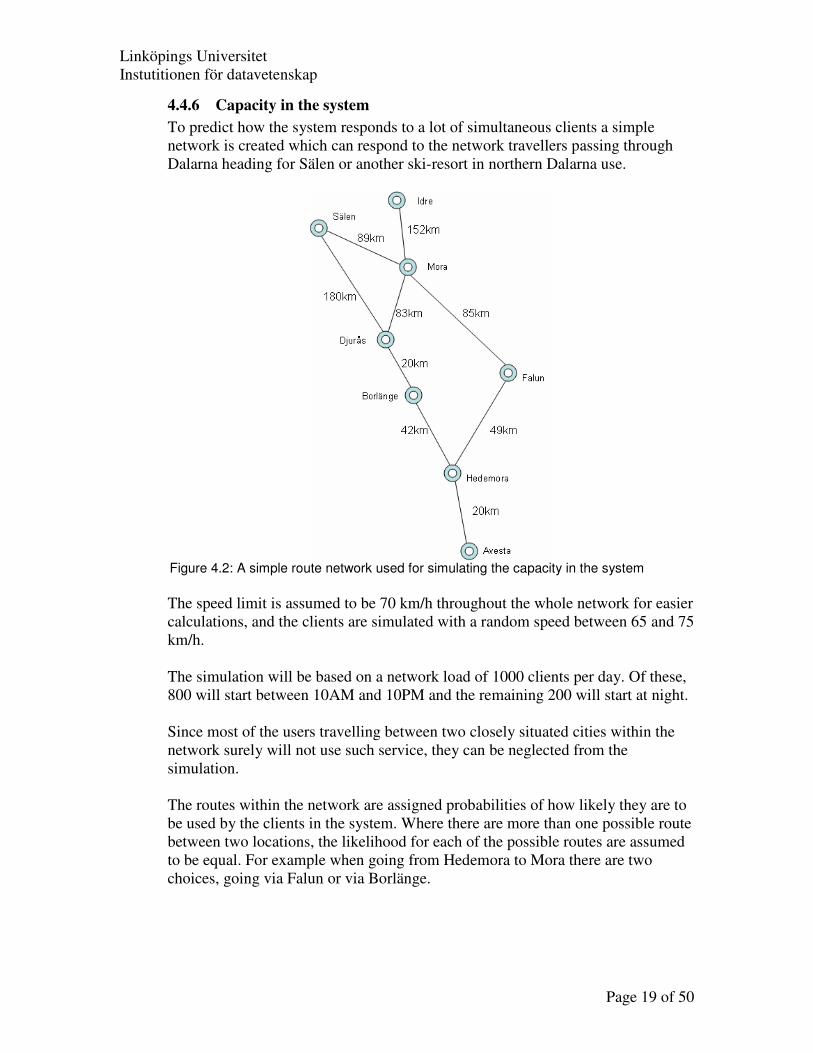
4.4.6 Capacity in the system
To predict how the system responds to a lot of simultaneous clients a simple
network is created which can respond to the network travellers passing through
Dalarna heading for Sälen or another ski-resort in northern Dalarna use.
Figure 4.2: A simple route network used for simulating the capacity in the system
The speed limit is assumed to be 70 km/h throughout the whole network for easier
calculations, and the clients are simulated with a random speed between 65 and 75
km/h.
The simulation will be based on a network load of 1000 clients per day. Of these,
800 will start between 10AM and 10PM and the remaining 200 will start at night.
Since most of the users travelling between two closely situated cities within the
network surely will not use such service, they can be neglected from the
simulation.
The routes within the network are assigned probabilities of how likely they are to
be used by the clients in the system. Where there are more than one possible route
between two locations, the likelihood for each of the possible routes are assumed
to be equal. For example when going from Hedemora to Mora there are two
choices, going via Falun or via Borlänge.
Linköpings Universitet
Instutitionen för datavetenskap
Page 20 of 50
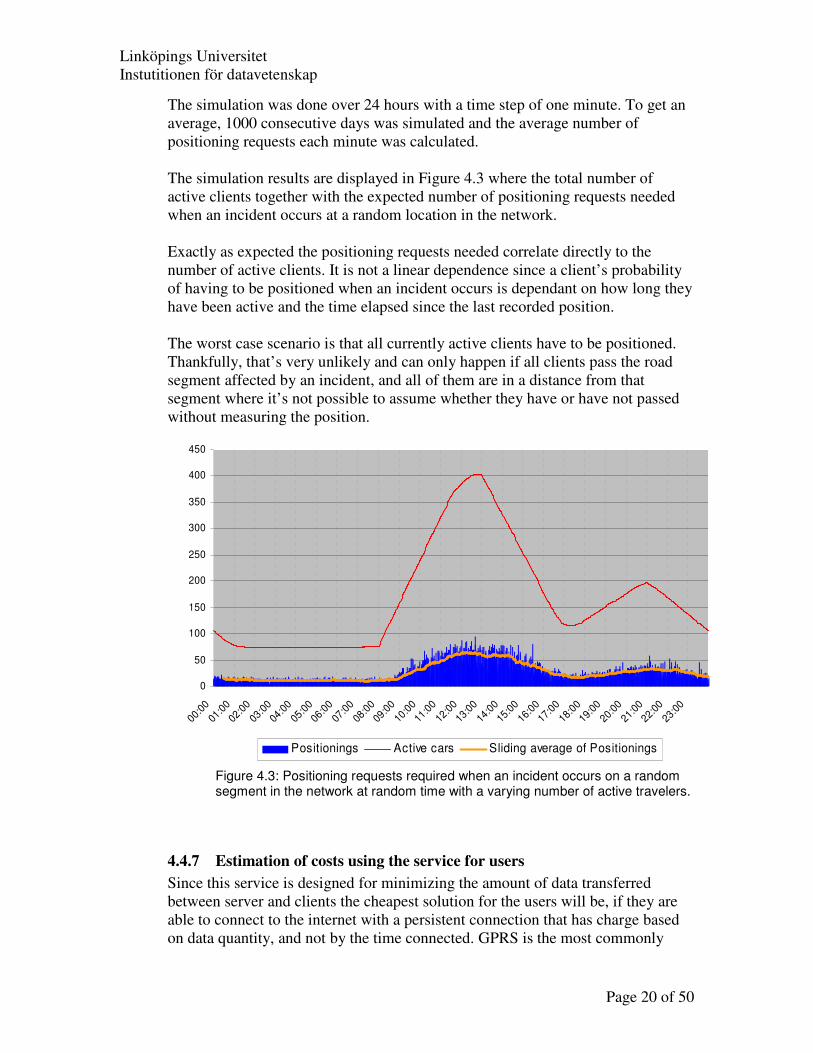
The simulation was done over 24 hours with a time step of one minute. To get an
average, 1000 consecutive days was simulated and the average number of
positioning requests each minute was calculated.
The simulation results are displayed in Figure 4.3 where the total number of
active clients together with the expected number of positioning requests needed
when an incident occurs at a random location in the network.
Exactly as expected the positioning requests needed correlate directly to the
number of active clients. It is not a linear dependence since a client’s probability
of having to be positioned when an incident occurs is dependant on how long they
have been active and the time elapsed since the last recorded position.
The worst case scenario is that all currently active clients have to be positioned.
Thankfully, that’s very unlikely and can only happen if all clients pass the road
segment affected by an incident, and all of them are in a distance from that
segment where it’s not possible to assume whether they have or have not passed
without measuring the position.
0
50
100
150
200
250
300
350
400
450
00:00
01:0
0
02:0
0
03:0
0
04:0
0
05:0
0
06:0
0
07:0
0
08:0
0
09:0
0
10:0
0
11:0
0
12:0
0
13:0
0
14:0
0
15:0
0
16:00
17:00
18:00
19:00
20:00
21:00
22:00
23:00
Positionings Active cars Sliding average of Positionings
Figure 4.3: Positioning requests required when an incident occurs on a random segment in the network at random time with a varying number of active travelers.
4.4.7 Estimation of costs using the service for users
Since this service is designed for minimizing the amount of data transferred
between server and clients the cheapest solution for the users will be, if they are
able to connect to the internet with a persistent connection that has charge based
on data quantity, and not by the time connected. GPRS is the most commonly

Linköpings Universitet
Instutitionen för datavetenskap
Page 21 of 50
used connection of such kind. Almost every current mobile operator offers
subscriptions with GPRS possibilities. There are other types of persistent
subscriptions available (3G-WCDMA and EDGE for example) but this thesis will
use GPRS as the reference service.
The pricing for GPRS data varies between different operators, Telia as an
example, charges† approximately 10 SEK/MB for transferred data above
3MB/month.
The bandwidth consumation for continuous usage is approximately 2 Kbytes per
5 minutes‡ (24 Kbytes per hour). When the map reloads, either forced by the user
or because of an event notification, an additional ~14 Kbytes has to be transferred
from the server to the client.
On average, a user traveling for approximately 3 hours having to be notified of 2
accidents will have a total bandwidth usage of approximately100 Kbytes. Using
Telias pricing from above this would imply a direct cost for the user of 1 SEK.
The positioning costs are not included in that and have to be added. As an
example of that, Telia charge 1.20 SEK / positioning request§ (this can vary
depending on what type of subscription used).
During the simulation in 4.4.6 the average number of positioning requests per
client was measured. It was found that this average was as low as 0.27 positioning
requests during a trip lasting for approximately 2 hours.
If the running costs and the positioning costs are combined, the total cost for a
user of the system can be approximated to be in average about 0.42 SEK per hour.
However, this is an average and for a single user the cost could be much higher if
they need to be positioned more often.
4.5. Summary
It is important to try to eliminate as many clients as possible as not beeing affected
before positioning since every positining request consumes network bandwith and
results in a direct cost for the client. This elimination can be done i several steps by
looking at the last known location of each client and calculating expected current
positions.
By doing this, the running cost for using the service can be held very low (i.e. about
0.42 SEK per hour using the service).
† According to www.telia.se 2005-02-10
‡ Measured during simulation
§ http://www.teliamobile.se/articles/00/00/5f/44/01/P-blad%20Service%20Integrator.pdf 2005-02-10
Linköpings Universitet
Instutitionen för datavetenskap
Page 22 of 50
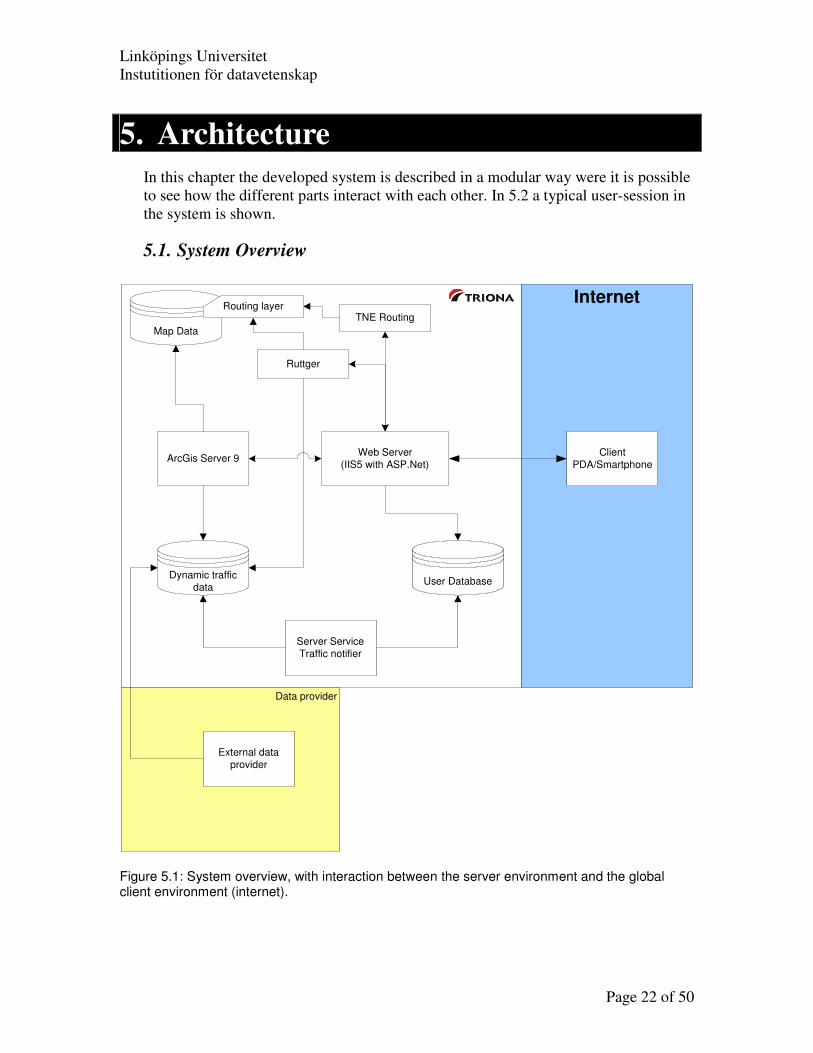
5. Architecture In this chapter the developed system is described in a modular way were it is possible
to see how the different parts interact with each other. In 5.2 a typical user-session in
the system is shown.
5.1. System Overview
Internet
Client
PDA/Smartphone
Web Server
(IIS5 with ASP.Net)
TNE Routing
ArcGis Server 9
Server Service
Traffic notifier
Map Data
Dynamic traffic
dataUser Database
Ruttger
Data provider
External data
provider
Routing layer
Figure 5.1: System overview, with interaction between the server environment and the global client environment (internet).
Linköpings Universitet
Instutitionen för datavetenskap
Page 23 of 50
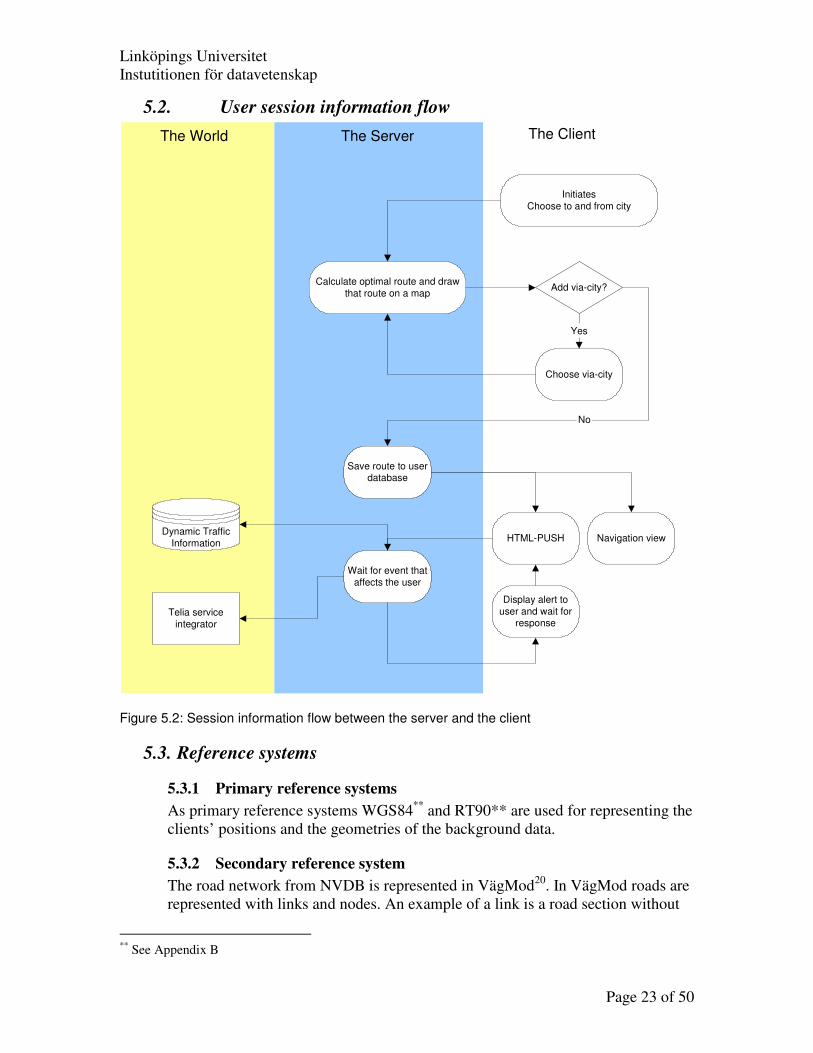
5.2. User session information flow
Initiates
Choose to and from city
Calculate optimal route and draw
that route on a mapAdd via-city?
Choose via-city
Yes
Save route to userdatabase
No
Navigation view
Wait for event that
affects the user
Dynamic Traffic
Information
Telia service
integrator
HTML-PUSH
Display alert to
user and wait forresponse
The ClientThe ServerThe World
Figure 5.2: Session information flow between the server and the client
5.3. Reference systems
5.3.1 Primary reference systems
As primary reference systems WGS84**
and RT90** are used for representing the
clients’ positions and the geometries of the background data.
5.3.2 Secondary reference system
The road network from NVDB is represented in VägMod20
. In VägMod roads are
represented with links and nodes. An example of a link is a road section without
**
See Appendix B
Linköpings Universitet
Instutitionen för datavetenskap
Page 24 of 50
branches that is open for traffic. The nodes are used to connect links together and
can for example be a junction or a crossing. The links and nodes can be translated
to RT90 or WGS84 by using its stored geometry.
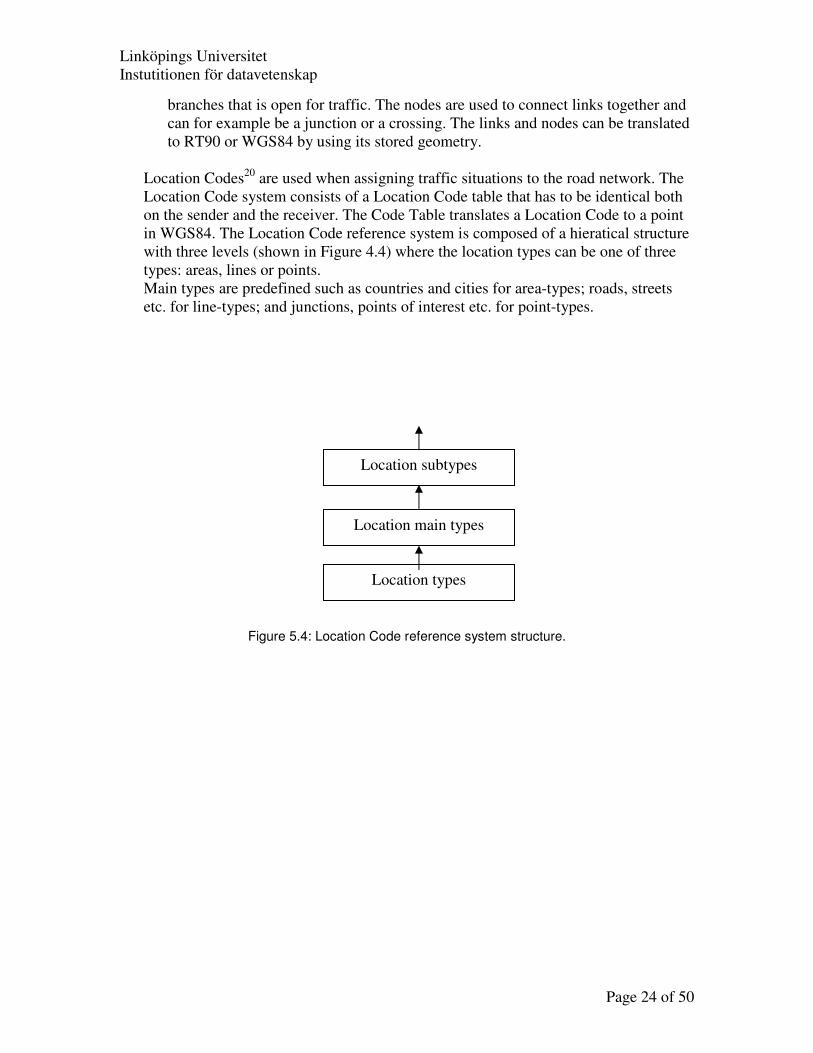
Location Codes20
are used when assigning traffic situations to the road network. The
Location Code system consists of a Location Code table that has to be identical both
on the sender and the receiver. The Code Table translates a Location Code to a point
in WGS84. The Location Code reference system is composed of a hieratical structure
with three levels (shown in Figure 4.4) where the location types can be one of three
types: areas, lines or points.
Main types are predefined such as countries and cities for area-types; roads, streets
etc. for line-types; and junctions, points of interest etc. for point-types.
Figure 5.4: Location Code reference system structure.
Location types
Location main types
Location subtypes
Linköpings Universitet
Instutitionen för datavetenskap
Page 25 of 50
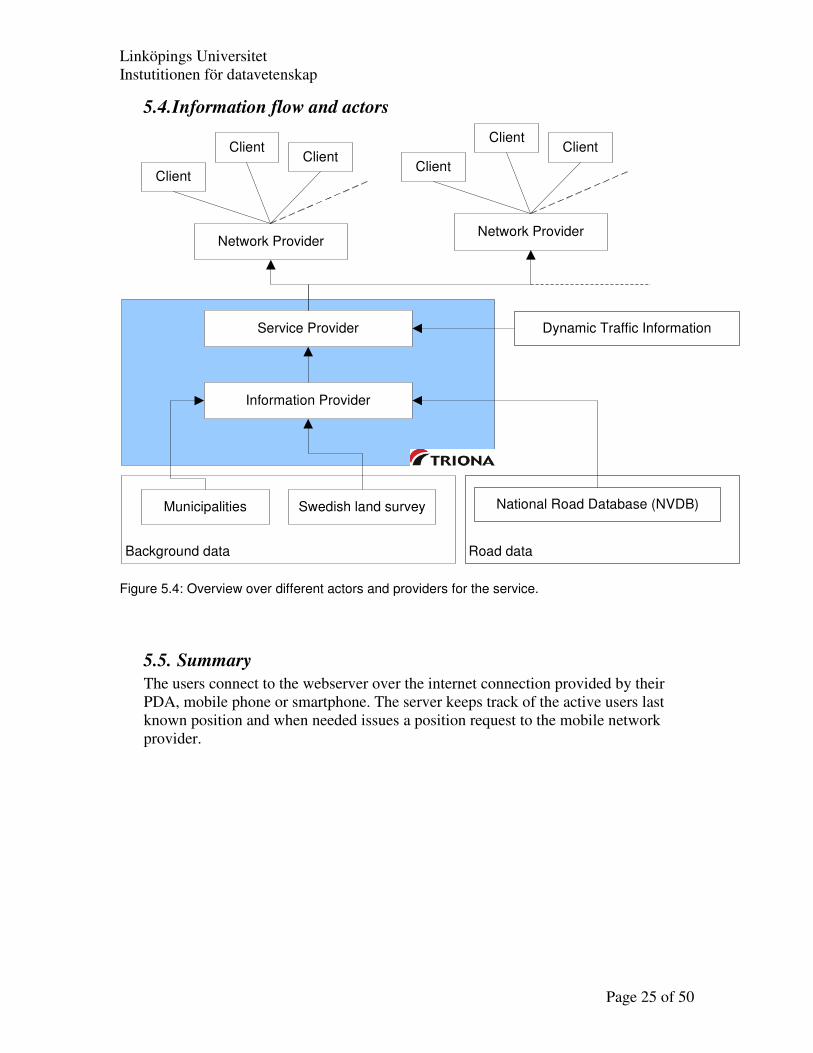
5.4. Information flow and actors
Road dataBackground data
Information Provider
Service Provider
Municipalities Swedish land survey National Road Database (NVDB)
Dynamic Traffic Information
Network ProviderNetwork Provider
Client
ClientClient
Client
ClientClient
Figure 5.4: Overview over different actors and providers for the service.
5.5. Summary
The users connect to the webserver over the internet connection provided by their
PDA, mobile phone or smartphone. The server keeps track of the active users last
known position and when needed issues a position request to the mobile network
provider.
Linköpings Universitet
Instutitionen för datavetenskap
Page 26 of 50
6. Data supply For the developed application to work properly is is important that the system is
continously fed with accurate data since this is what route choices and traffic
notifications are calculated and based on. This chapter analyses the requirements this
data has to meet and suggest possible data sources to use.
6.1. Requirements on the available data
Content Since the service will not, at least in this version, give any driving directions apart
from displaying a map with the selected route marked, the need for highly accurate
road network and Traffic restrictions is not so crucial.
More important is that the road network used matches the one used when generating
event-messages to the Triss-system, otherwise there will be problems projecting those
messages to the correct road segment.
Actuality There is a great need for the actuality of the data since it will be the interface for the
client. The data used in the service can be divided into three categories where each
category has different requirements for how up to date it is.
• Background data (lakes, rivers, cities and other almost static data)
• Navigation data (roads, traffic restrictions, speed limits and other data
used by the navigation service)
• Dynamic data (accidents, road works, closed Roads and other dynamic
road data)
The need for actuality in the background data is low since it is only used for feeding
the client with extra information. This is also data that almost never changes and it
can be updated manually when big changes are made to it.
The need of actuality in the navigation data and dynamic data is far more important
than for the background data. If there is an error, or outdated information, in this data
the application can suggest wrongfully optimal routes or even suggest a route that no
longer exists. For this data to remain updated it’s important that data suppliers have
some way of updating the data in the system continuously with new information. It is
also desirable for this updating to be done in an incremental way since the system
holds a significant large amount of data and updating all data every time would result
in a lot of unnecessary processing.
Data Quality The quality of the data is very important since the clients can get themselves into
undesirable situations (dead ends, closed routes etc.) If they rely on the information
given by the application and the application bases its decisions on erroneous data it
Linköpings Universitet
Instutitionen för datavetenskap
Page 27 of 50
could lead rather dissatisfied customers. The data suppliers must guarantee in a
trustworthy way that the data delivered to the system holds a certain level of quality.
6.2. Data Sources
6.2.1 NVDB
NVDB is a national road data-source developed and maintained by the Swedish
National Road Administration on commission by the Swedish Government.
NVDB contains the national road network (current as well as historic data)
together with attribute tables for road data (e.g.: speed limits, road classifications
and road names amongst others).
6.2.2 Triss
The Swedish Road Administration’s traffic information centres are today all using
the same database, Triss (Traffic Information Support System), to register,
distribute and view traffic information. Triss contains actual traffic information
for the Swedish road network such as accidents, road works and road conditions.
Measurments of weather and road conditions are received from the VVIS system
(Road Weather Information System) which continuously collects data from
approximately 600 stations placed all over Sweden.
Incidents that are estimated to last at least 20 minutes from the notification from
SOS 112 are registered in Triss within 5 minutes after the reception of the
message. Incidents are registered with location, duration, influence, restrictions
and cause.
One big problem with the information in Triss is that it’s almost completely added
manually. This results in a heavy delay in the registration process if there are
many coinciding incidents. With this manual registration process there is also a
large risk of erroneous data registration - for example misspelled names.
6.2.3 Telia Service Integrator
Telia Service Integrator is a service maintained by TeliaSonera as a way to
position users in their mobile network. The positioning is initiated by an
application server that sends a standard http request with the mobile number as an
argument. The Service Integrator processes the request and calculates the phone’s
expected position with CGI (Cell Global Identify; in which cell the phone
currently resides) and TA (Timing Advance; calculates the distance from base
stations with help of the time it takes for the signal to travel from the station to the
phone and back).
6.2.4 Combining static data from many sources
As specified by The Smartic Report21
there are two main ways of getting access to
static data.
Linköpings Universitet
Instutitionen för datavetenskap
Page 28 of 50
• Buying map material from one of the commercial operators in
Sweden, NAVTEQ or Tele Atlas.
• Get the base information, mainly the road network with attributes,
from NVDB and then extend it further with information from Swedish
municipalities.
None of these solutions can fully satisfy the final solution requirements itself but
need to be extended with more information. Data from different sources are not
always available in a format that is easily combined with each other. The main
difference between different data sources tends to be the coordinate system††
used
to represent the data. National data-providers, such as NVDB, NavTeq and Tele
Atlas use mainly RT90 and / or WGS84 for geometry representation while
municipalities often use their own coordinate system, optimized to give the best
accuracy for the area where they reside.
This means that combining different data sources together requires a certain
amount of manual work. This hopefully has to be done just once for each data
source.
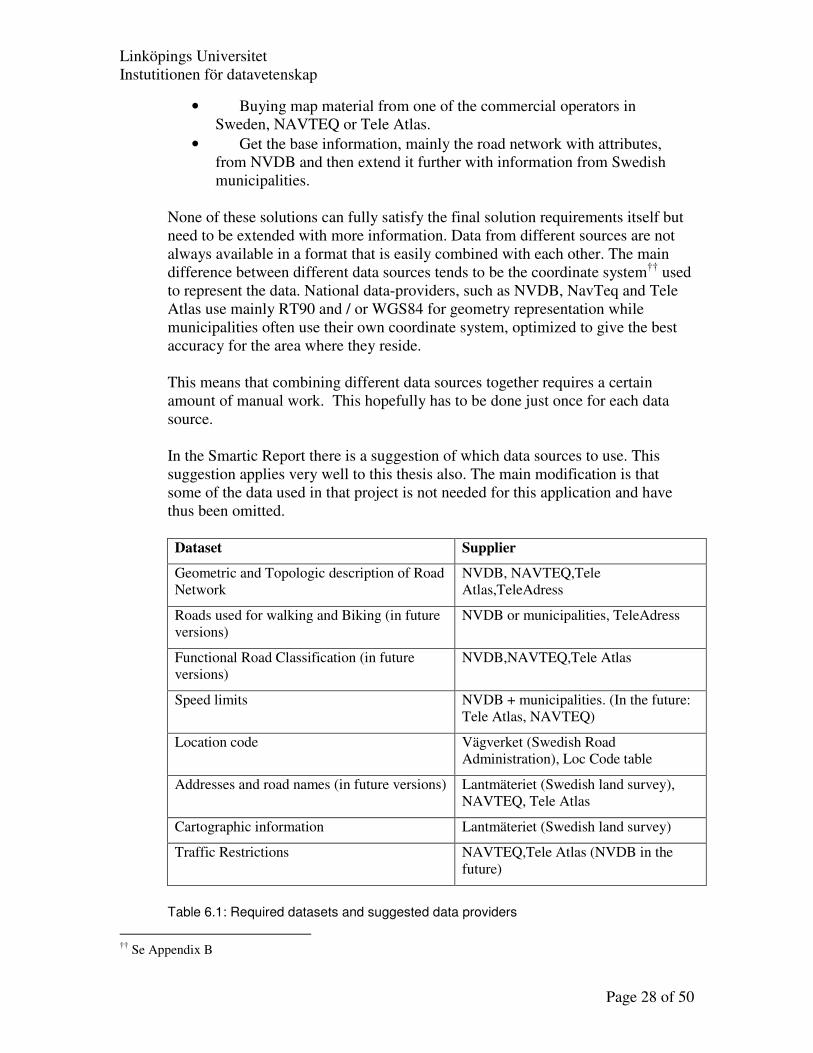
In the Smartic Report there is a suggestion of which data sources to use. This
suggestion applies very well to this thesis also. The main modification is that
some of the data used in that project is not needed for this application and have
thus been omitted.
Dataset Supplier
Geometric and Topologic description of Road
Network
NVDB, NAVTEQ,Tele
Atlas,TeleAdress
Roads used for walking and Biking (in future
versions)
NVDB or municipalities, TeleAdress
Functional Road Classification (in future
versions)
NVDB,NAVTEQ,Tele Atlas
Speed limits NVDB + municipalities. (In the future:
Tele Atlas, NAVTEQ)
Location code Vägverket (Swedish Road
Administration), Loc Code table
Addresses and road names (in future versions) Lantmäteriet (Swedish land survey),
NAVTEQ, Tele Atlas
Cartographic information Lantmäteriet (Swedish land survey)
Traffic Restrictions NAVTEQ,Tele Atlas (NVDB in the
future)
Table 6.1: Required datasets and suggested data providers
††
Se Appendix B
Linköpings Universitet
Instutitionen för datavetenskap
Page 29 of 50
6.3. Dynamic data in Route-Choice algorithms
TNE Routing does not support any type of dynamic data when calculating optimal
routes. When using TNE Routing the whole network has to be recalculated as soon as
any data has changed. This is not practical since this generation will demand a
significant amount of time and CPU to perform for large road networks.
When using Ruttger for route-calculation there are ways to make it take notice of
temporary changes in the data without needing to regenerate the whole network
again. However, this method of inputting temporary data to Ruttger is not currently
perfect since there are some annoying workarounds that have to be performed for this
to work. The biggest problem is that the Ruttger executable locks the file where
temporary changes are added while running which means that Ruttger has to be
exited and then restarted for changes to be added.
Linköpings Universitet
Instutitionen för datavetenskap
Page 30 of 50
7. Server solution In this chapter the services running on the central server is described more closely.
7.1. General demands
The server solution must fulfil the following requirements
• It must be able to handle dynamic data that changes rapidly
• It must be able to handle static and semi-static data and be able to
update that data in an incremental way
• It must be able to handle many concurrent users
• It must be able to keep track of its current users and store their planned
routes
• It must be able to detect changes in the dynamic data, process the data
and notify the affected users of the changes
7.2. Standards
Since it was decided to use dumb clients that only use web page interfaces, a Web
server must be used for hosting on the server-side. The web server will be used for
tracking users and serving them with their requested information.
Map generation and analysis is to be performed with an ArcGis Server 9.0 from
ESRI22
. An API for developing applications with ArcGis Server using Microsoft.NET
is available. Since communication with the ArcGis server will be made through .NET
classes, the web server must be able to host such applications.
There is a requirement to store information about active users, their routes and last
known positions for instance. MySQL‡‡
, which supports spatial queries since version
4.1, is considered to be the most interesting alternative for storing user data.
With the support for spatial queries, it will be very easy to quickly find users that are
near a specific area if their routes are stored as spatial information.
7.3. Web application
The server-side web application will act as the interface between the server’s
functionality and the user.
When users connect to the service they will be able to plan their route, save it and
change to a navigation view which together with their selected route displays actual
traffic information which gets updated when incidents occur.
When the web application receives a notification from the server software that a
particular user should be notified of an event, it sends an alert to that user whom can
thus decide what action to take.
‡‡
MySQL is a fast open source database engine that is commonly used for web applications because of its
simplicity. http://www.mysql.com

Linköpings Universitet
Instutitionen för datavetenskap
Page 31 of 50
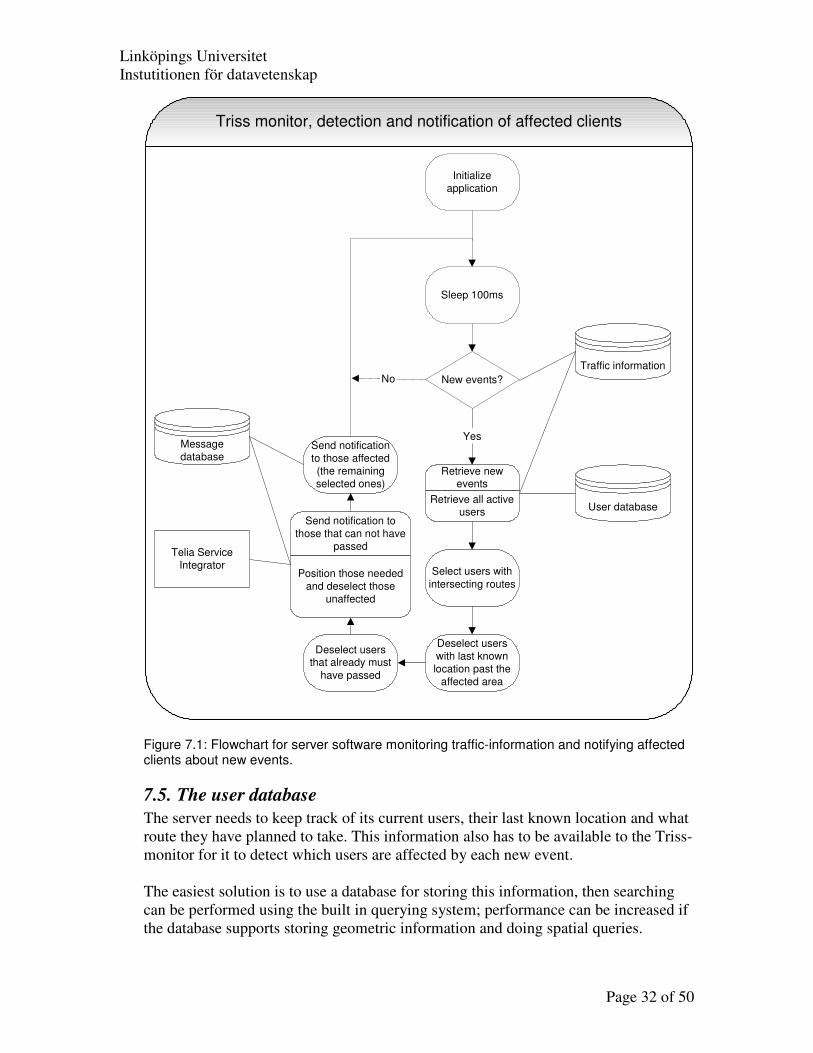
7.4. Server Software, Triss-monitor
Since the web application will handle all communication between the clients and the
server, every thread, on a per user basis, will have few capabilities to access
information about what the other threads are doing.
If all user threads were to monitor the Triss database for new events, there would be a
lot of extra processing required since the probability of accidents affecting a single
user is small. Instead a new application was developed that monitors the Triss
database and calculates which clients need to be notified when an event occurs
thereby separating all spatial analysis from user communication.
The Triss-monitoring application will be working with both the Triss-database and
the database with user information.
When a new event is added to the Triss database, the monitor application uses the
detection algorithm discussed in section 4.3 and notifies the web application of which
clients need notification of the event.
If the monitoring application can’t decide whether a user is affected or not without
measuring its position it will send a request to the positioning system anyway.
Linköpings Universitet
Instutitionen för datavetenskap
Page 32 of 50
Traffic information
New events?
User database
Yes
No
Sleep 100ms
Select users with
intersecting routes
Deselect users
with last known
location past the
affected area
Retrieve newevents
Retrieve all activeusers
Deselect usersthat already must
have passed
Send notification to
those that can not have
passed
Position those needed
and deselect those
unaffected
Send notification
to those affected
(the remaining
selected ones)
Message
database
Telia Service
Integrator
Triss monitor, detection and notification of affected clients
Initialize
application
Figure 7.1: Flowchart for server software monitoring traffic-information and notifying affected clients about new events.
7.5. The user database
The server needs to keep track of its current users, their last known location and what
route they have planned to take. This information also has to be available to the Triss-
monitor for it to detect which users are affected by each new event.
The easiest solution is to use a database for storing this information, then searching
can be performed using the built in querying system; performance can be increased if
the database supports storing geometric information and doing spatial queries.
Linköpings Universitet
Instutitionen för datavetenskap
Page 33 of 50
The lastest version of the popular open source database MySQL§§
supports both these
features and will be used as the database engine in this thesis. However, any database
that supports spatial information could be used.
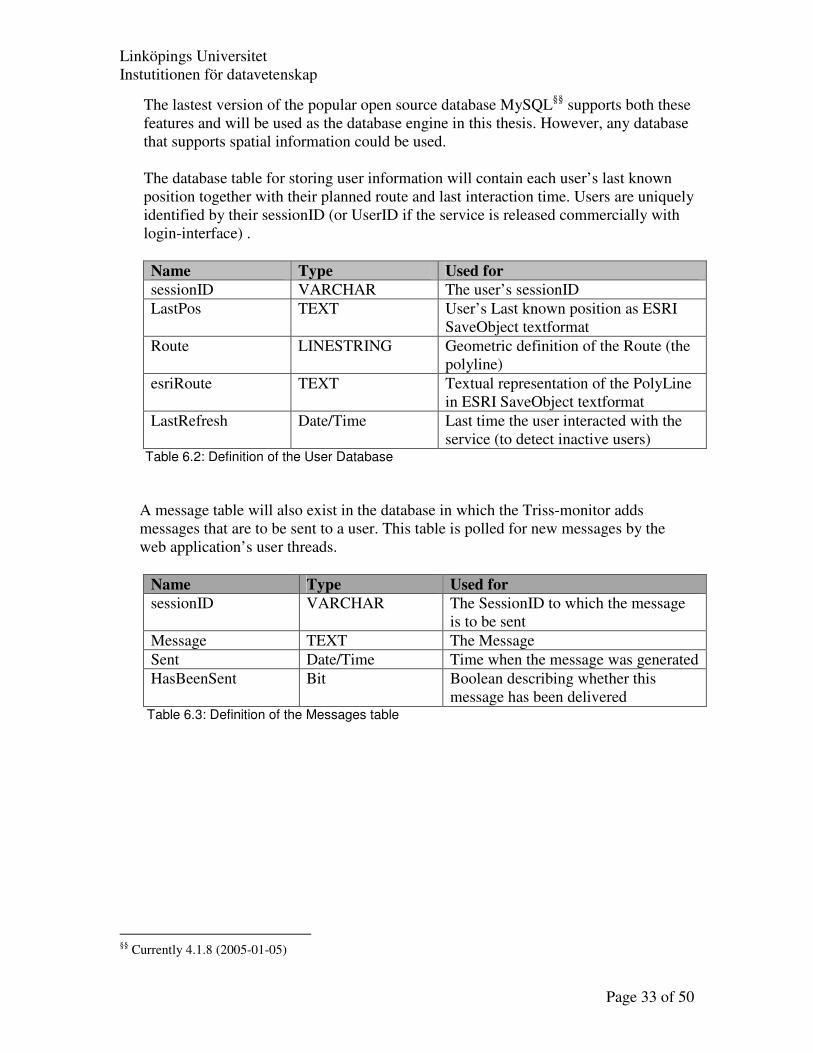
The database table for storing user information will contain each user’s last known
position together with their planned route and last interaction time. Users are uniquely
identified by their sessionID (or UserID if the service is released commercially with
login-interface) .
Name Type Used for sessionID VARCHAR The user’s sessionID
LastPos TEXT User’s Last known position as ESRI
SaveObject textformat
Route LINESTRING Geometric definition of the Route (the
polyline)
esriRoute TEXT Textual representation of the PolyLine
in ESRI SaveObject textformat
LastRefresh Date/Time Last time the user interacted with the
service (to detect inactive users) Table 6.2: Definition of the User Database
A message table will also exist in the database in which the Triss-monitor adds
messages that are to be sent to a user. This table is polled for new messages by the
web application’s user threads.
Name Type Used for sessionID VARCHAR The SessionID to which the message
is to be sent
Message TEXT The Message
Sent Date/Time Time when the message was generated
HasBeenSent Bit Boolean describing whether this
message has been delivered Table 6.3: Definition of the Messages table
§§
Currently 4.1.8 (2005-01-05)
Linköpings Universitet
Instutitionen för datavetenskap
Page 34 of 50
8. Mobile Unit/Client Since the service uses clients with small CPUs and without need of installing
software before usage, the requirements on the client used are low. However, since
some interaction is needed through the clients webbrowser, the webbrowser has to
satisfy certain basic demands. These demands are listed in this chapter.
8.1. General requirements
There are two ways to develop the client application:
• Letting the server do all processing and using a dumb client that only
displays the information calculated by the server
• Using smart clients that share the processing of information with the
server
The main benefit of using dumb clients is that it’s possible to build applications that
are compatible with a large number of client platforms. On the other hand, choosing
this type of application will greatly increase the workload on the server, since it will
have to do all the data processing for all clients.
One requirement for this project was that it should support as many client platforms
as possible which consequently corresponds to using dumb clients along with smart
servers.
8.1.1 Application limitations when choosing dumb clients
When choosing a dumb client solution, it will contain some limitations compared
to other techniques. GPS positioning for example, will not be possible to
implement since it requires the client to communicate with a GPS receiver.
Instead the only solution for locating clients will be by using server based
positioning methods.
One other limitation that occurs is that the possibilities for storing data locally on
the client will be almost impossible to accomplish. As a result of this, the same
information will sometimes be transferred more than once from the server to the
client. This does not comply with the requirement that the service should try to
minimize the amount of data transferred, but since dumb clients are the only
option for cross-compatible applications, there are no alternatives for remedying
this.
Both of these features would be available if the service was instead designed for
smart clients.
8.2. Standards
One of the application’s desired abilities is that it should be compatible with a large
number of different platforms. Due to this requirement, instead of using specially
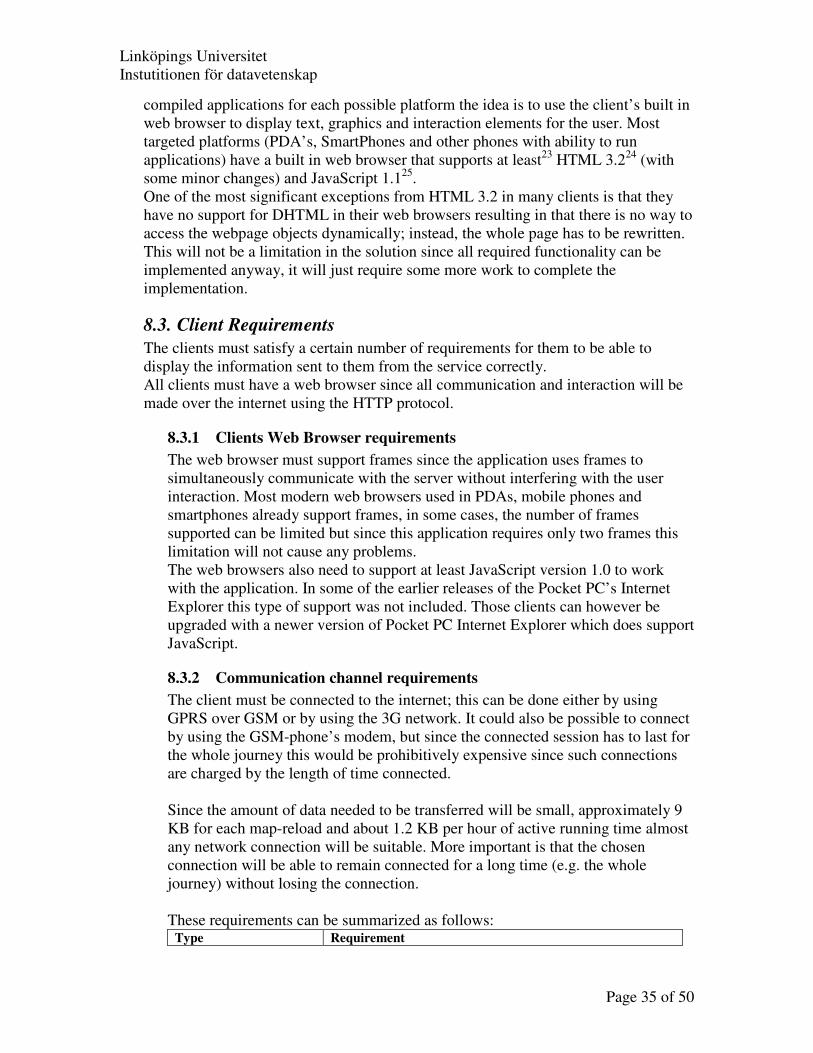
Linköpings Universitet
Instutitionen för datavetenskap
Page 35 of 50
compiled applications for each possible platform the idea is to use the client’s built in
web browser to display text, graphics and interaction elements for the user. Most
targeted platforms (PDA’s, SmartPhones and other phones with ability to run
applications) have a built in web browser that supports at least23
HTML 3.224
(with
some minor changes) and JavaScript 1.125
.
One of the most significant exceptions from HTML 3.2 in many clients is that they
have no support for DHTML in their web browsers resulting in that there is no way to
access the webpage objects dynamically; instead, the whole page has to be rewritten.
This will not be a limitation in the solution since all required functionality can be
implemented anyway, it will just require some more work to complete the
implementation.
8.3. Client Requirements
The clients must satisfy a certain number of requirements for them to be able to
display the information sent to them from the service correctly.
All clients must have a web browser since all communication and interaction will be
made over the internet using the HTTP protocol.
8.3.1 Clients Web Browser requirements
The web browser must support frames since the application uses frames to
simultaneously communicate with the server without interfering with the user
interaction. Most modern web browsers used in PDAs, mobile phones and
smartphones already support frames, in some cases, the number of frames
supported can be limited but since this application requires only two frames this
limitation will not cause any problems.
The web browsers also need to support at least JavaScript version 1.0 to work
with the application. In some of the earlier releases of the Pocket PC’s Internet
Explorer this type of support was not included. Those clients can however be
upgraded with a newer version of Pocket PC Internet Explorer which does support
JavaScript.
8.3.2 Communication channel requirements
The client must be connected to the internet; this can be done either by using
GPRS over GSM or by using the 3G network. It could also be possible to connect
by using the GSM-phone’s modem, but since the connected session has to last for
the whole journey this would be prohibitively expensive since such connections
are charged by the length of time connected.
Since the amount of data needed to be transferred will be small, approximately 9
KB for each map-reload and about 1.2 KB per hour of active running time almost
any network connection will be suitable. More important is that the chosen
connection will be able to remain connected for a long time (e.g. the whole
journey) without losing the connection.
These requirements can be summarized as follows: Type Requirement
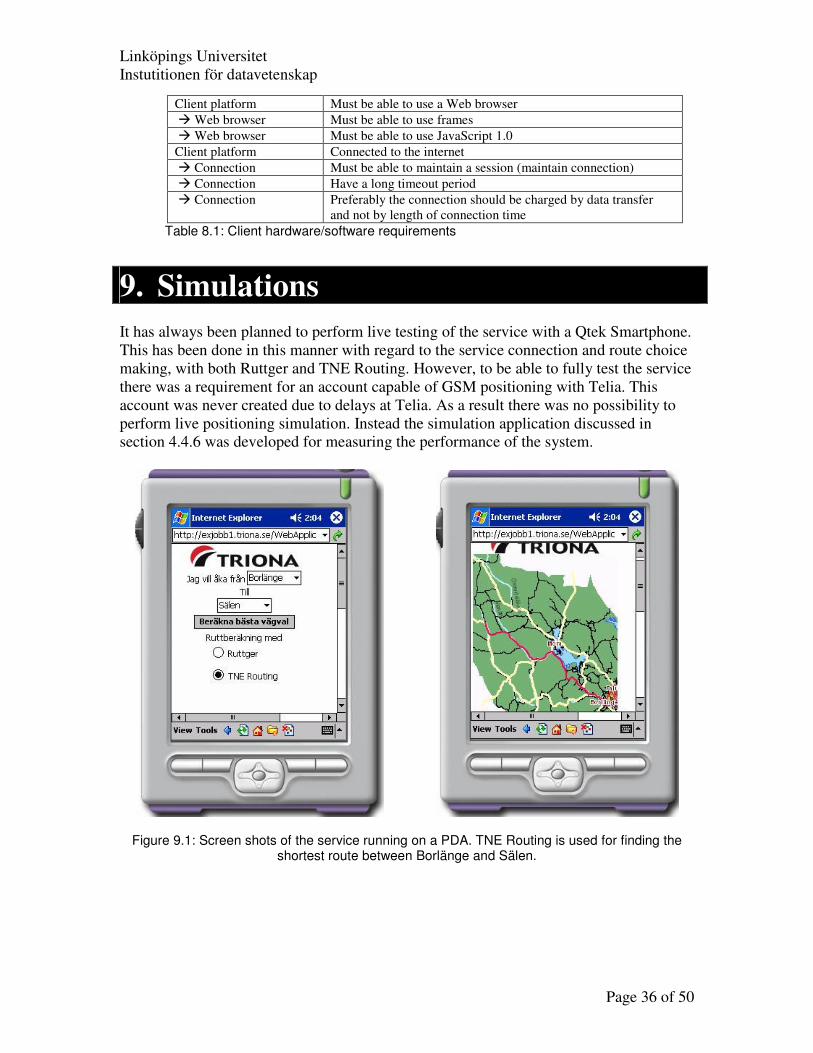
Linköpings Universitet
Instutitionen för datavetenskap
Page 36 of 50
Client platform Must be able to use a Web browser
� Web browser Must be able to use frames
� Web browser Must be able to use JavaScript 1.0
Client platform Connected to the internet
� Connection Must be able to maintain a session (maintain connection)
� Connection Have a long timeout period
� Connection Preferably the connection should be charged by data transfer
and not by length of connection time
Table 8.1: Client hardware/software requirements
It has always been planned to perform live testing of the service with a Qtek Smartphone.
This has been done in this manner with regard to the service connection and route choice
making, with both Ruttger and TNE Routing. However, to be able to fully test the service
there was a requirement for an account capable of GSM positioning with Telia. This
account was never created due to delays at Telia. As a result there was no possibility to
perform live positioning simulation. Instead the simulation application discussed in
section 4.4.6 was developed for measuring the performance of the system.
Figure 9.1: Screen shots of the service running on a PDA. TNE Routing is used for finding the shortest route between Borlänge and Sälen.
9. Simulations
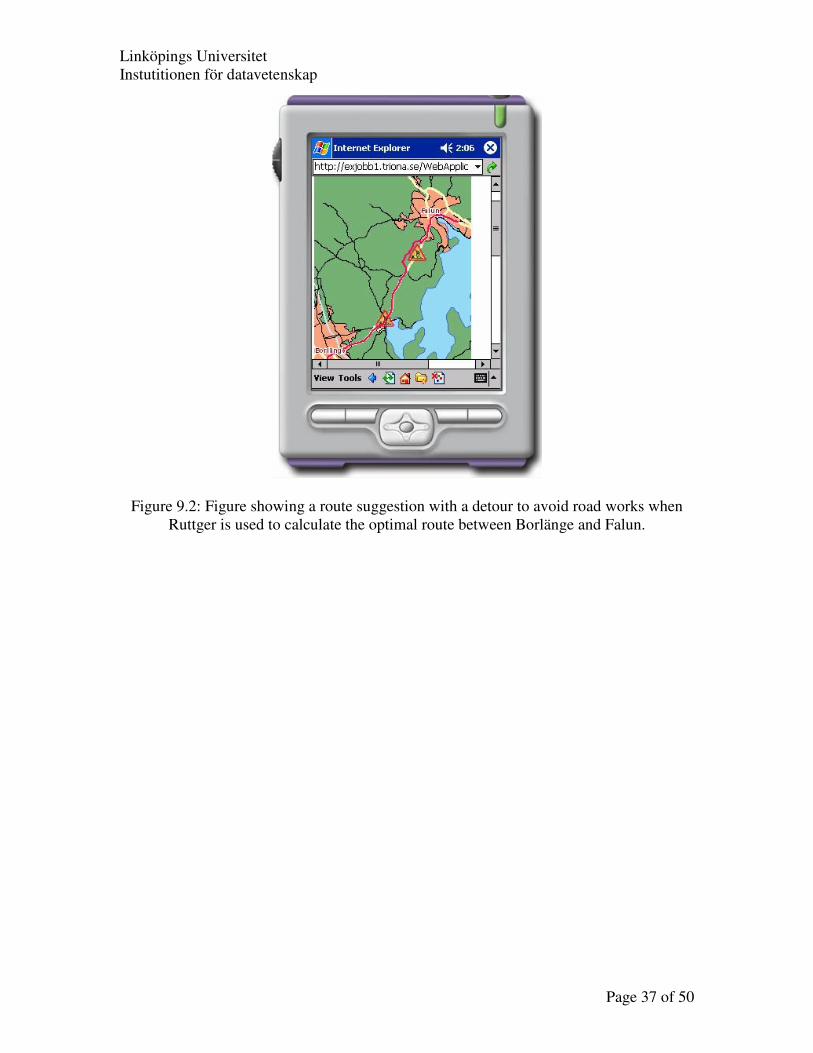
Linköpings Universitet
Instutitionen för datavetenskap
Page 37 of 50
Figure 9.2: Figure showing a route suggestion with a detour to avoid road works when
Ruttger is used to calculate the optimal route between Borlänge and Falun.
Linköpings Universitet
Instutitionen för datavetenskap
Page 38 of 50
To minimize the amount of traffic in the cellular-network when implementing a traffic-
service that position its client via the GSM network, there are two parts that need to be
optimized.
1. Minimizing the data transfer between server and clients
2. Minimizing the number of positioning requests for GSM-positioning
10.1. Minimizing data transfer between Server and Client
To minimize the data transferred between the client and the server the most gain can
be achieved by ensuring that the clients screen does not get updated except when
needed. Because of that, information should be pushed from the server to the client,
this way the client does not consume any extra bytes of the channels bandwidth by
polling the server for new information when there isn’t any.
If the client uses an application that supports using sockets, it is very easy to
accomplish this. However, in the service discussed in this thesis the client runs the
service via its internal web browser which does not automatically support push
methods. A solution to this was discussed in 4.2 where a method for semi-push of
information with plain html was introduced.
10.2. Minimizing the number of positioning requests
Since every request made to an operator to measure a client’s position consumes
bandwidth in the cellular network and results in a direct cost for the client, there is a
need to minimize the number of these requests and only locate those that are really
needed.
By always storing the positioning history, calculation of an approximate position for
the client is fairly easy to do. As discussed in 4.4, this expected position can be used
together with the location of the incident to lower the number of clients needed to be
positioned in order to make correct decisions.
This excluding algorithm consist of a couple of stages that each eliminate a subset of
the active users.
When an event occurs the clients that need to be notified about it are selected through
a number of steps.
Starting with all active clients, first those that do not have a route that intersect the
affected area can be eliminated from the subset who are affected.
Further, those that have last known location that is past the affected location can be
marked as not affected.
10. Summary
Linköpings Universitet
Instutitionen för datavetenskap
Page 39 of 50
For those remaining, there is a requirement to measure their current position to be
able to make correct decisions about whether they should be notified or not. Since the
number of measurements done via the GSM network is to be minimized, the stored
last known location can be used to calculate an expected position for the users which,
if outside a critical distance from the event location can excluded without measuring
needing to measure a new position via GSM.
10.3. Known limitations in the system
For most Mobile Phones there are currently no possibility to make a call at the same
time as beeing connected with GPRS. Because of that the service will be
disconnected and the users session lost if he either initiates or receives a call while
using the service.
The same problem occurs if the users enters an area with bad GSM coverage and the
GPRS connection disconnects due to this.
Both of these issues are specific for the identification method used in the service for
identifying users based on their session id. If this service is released commercially
there will be a need of a login interface where users login in before using the service
in order to be able to charge the users for their usage.
If identifying the users by their login rather than by their session id it will be possible
to resuming interupted sessions without interaction from the user and thereby both of
the limitations above could be solved.
10.4. Using dynamic data when calculating routes
To get the most optimal route, the selection algorithm must include current conditions
and interferences in the network when performing the calculations. The route-planner
Ruttger discussed in 4.1.2 can use such dynamic information in its route selection
algorithm. One problem however is that it’s not trivial to decide which route-parts are
affected by an event and how much delay is expected when passing the affected part.
In the service developed in this thesis, dynamic traffic data is collected from the Triss
system. With the current version of Triss there is no way to calculate exactly how
much delay an incident causes both because of the complexity of delays caused by an
incident and also, because of the high generalisation of incident-types in Triss.
Both of these issues, how to detect affected segments and how to calculate the impact
level have to be solved before a service such as this can make optimal route choices
when the dynamic input data to the route-planner is not entered manually.
10.5. Conclusion and recommendations
The best performance, both for interactivity with the user and communication
between the users and the server would be achieved if the traffic service is executed
as a compiled application on the client platform. This would not only increase the
possibility of maintaining a direct communication channel open at all time, it would
also heavily increase the possibility of including more intelligent information about
events to users.
Linköpings Universitet
Instutitionen för datavetenskap
Page 40 of 50
If the client program is developed as an executable application it would also open it
up for usage with a GPS receiver which would give both better accuracy in the
measured positions and enable the possibility of including driving directions in the
service.
Using ESRI software and APIs for map generation and analysis requires a certain
level of understanding before the developer can develop applications without running
into problems. However, when this level is achieved, the APIs offer good possibilities
of creating dynamic maps on the fly.
The service developed within this thesis uses three different database engines for
different purposes, SQL Server, MySQL and Oracle. During the project MySQL
tended to prove more and more interesting, both for geometry storage capabilities and
its fast executing of spatial queries. Oracle is also able to execute such queries,
however, MySQL tends to outperform Oracle on similar tasks.
When positioning clients with a server based positioning method such as GSM (CGI-
TA) its important to try minimizing the number of users that need to be positioned,
both because of the risk of overloading the network if many users are to be
positioned, but mainly because of the fact that every request for a clients location will
result in direct costs for the users of the system.
This minimizing can for example be done in such a way that the users expected
positions are calculated based on stored information. Those expected positions can
then be used to make decisions for users who are not within a critical area, without
needing to position them.
A lot of development has to be done when analysing traffic events, mainly by
developing algorithms for how to find what road segments are affected by an event
and how much delay is to be expected for a passing traveller affected by a
disturbance. The difficulty in this depends on how well events are specified in their
event report but for most events this will not be trivial to calculate irrespective of how
well it is specified.
10.6. Future work
The task of developing an intelligent traffic service which notifies its users about
changes in the prerequisites in their route is interesting. Since this type of service
currently does not exist for commercial use, it is a new field for both the users and the
service providers.
A lot of work has to be performed in event analysis and event modelling for dynamic
routing to be achieved successfully.
Many existing traffic services could easily be upgraded to support event notification.
The main changes for them to support such tasks are to let the clients update the
central server about their routes and current positions. Dynamic traffic information
could easily be accessed either directly from the provider of such information or by
using the information sent by the RDS-TMC channel.
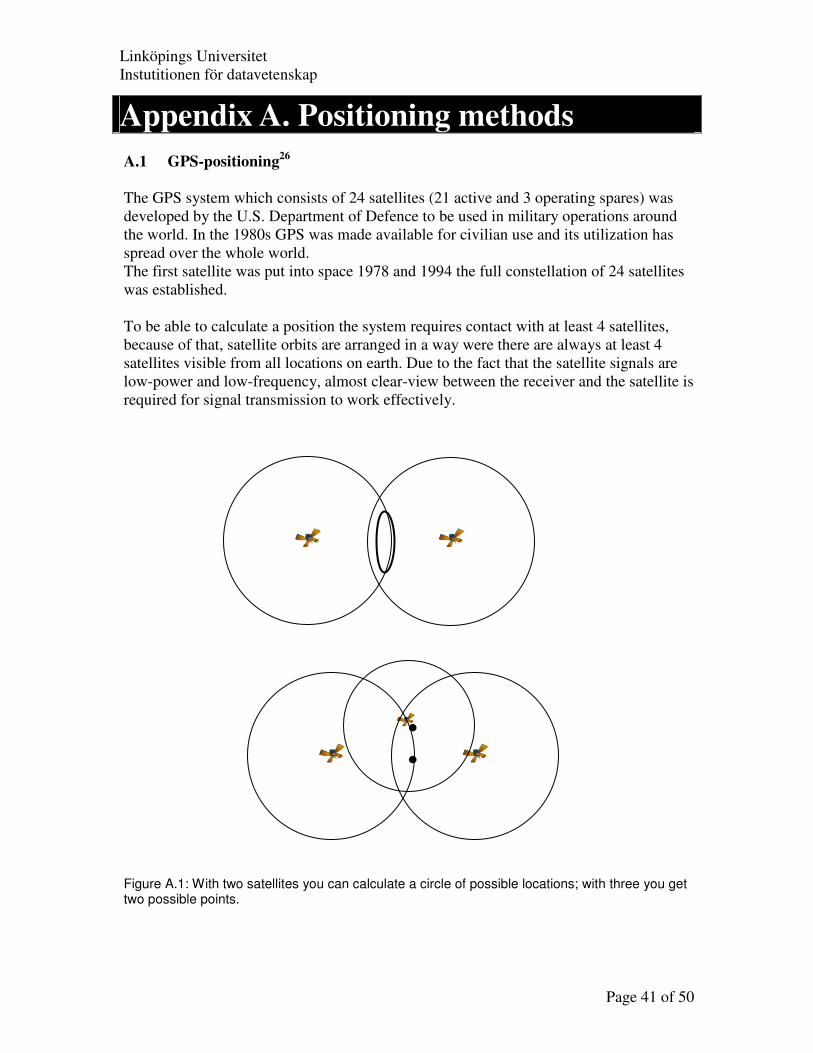
Linköpings Universitet
Instutitionen för datavetenskap
Page 41 of 50
Appendix A. Positioning methods
A.1 GPS-positioning26 The GPS system which consists of 24 satellites (21 active and 3 operating spares) was
developed by the U.S. Department of Defence to be used in military operations around
the world. In the 1980s GPS was made available for civilian use and its utilization has
spread over the whole world.
The first satellite was put into space 1978 and 1994 the full constellation of 24 satellites
was established.
To be able to calculate a position the system requires contact with at least 4 satellites,
because of that, satellite orbits are arranged in a way were there are always at least 4
satellites visible from all locations on earth. Due to the fact that the satellite signals are
low-power and low-frequency, almost clear-view between the receiver and the satellite is
required for signal transmission to work effectively.
Figure A.1: With two satellites you can calculate a circle of possible locations; with three you get two possible points.
Linköpings Universitet
Instutitionen för datavetenskap
Page 42 of 50
For each visible satellite, the client determines the distance to the satellite and looks up
its exact position from a table. This gives a sphere of possible locations and by
combining all calculated spheres, the clients position is defined by the intersection of
those spheres.
With two spheres you get a circle of possible locations. Already with three visible
satellites the clients possible locations consist of two possible points. With four or more
satellites visible to the client, the position can be calculated as one point.
GPS-positioning requires the client to have support for such positioning in their
hardware configuration.
A.2 GSM-positioning Instead, by using a server-based positioning system where the hardware on the client has
no importance if the position can be measured or not is easier to use for a service with a
lot of clients when high accuracy in the measured positions is not important.
Many cellular network operators offer some type of server-based positioning method for
positioning mobile phones in their network. The method for how the position is
calculated varies between different operators depending on the hardware they use in their
base stations.
As an example, GSM-positioning for networks with Ericsson hardware is presented here.
Ericssons GSM-positioning method19
is called Mobile Positioning System (MPS), it
support three types of positioning methods; Cell Global Identity Timing Advance
(CGI+TA) and Any Time Interrogation (ATI) which both measures positions with low
accuracy; while the last method: Assisted Global Positioning System (A-GPS) results in
a highly accurate (~10 m) position.
Since A-GPS require hardware support on the client like ordinary GPS, it will not be
discussed further; instead CGI-TA, which gives better accuracy than ATI; will be
described more closely.
CGI-TA27
first uses the cell identity of the cell the phone currently is active in. This
gives an approximate area which is the same size as the cell with possible user locations.
That area can be decreased further by measuring the time it takes for the signal to travel
from the station to the phone and back again. This is called Timing Advance (TA). The
TA can be used to calculate an approximate distance for how far from the base station
the user is currently situated. Since Network Cells are often 120º wide the possible
locations will be circular segment whose size depend on how far from the base station
the user is (see Figure A2).
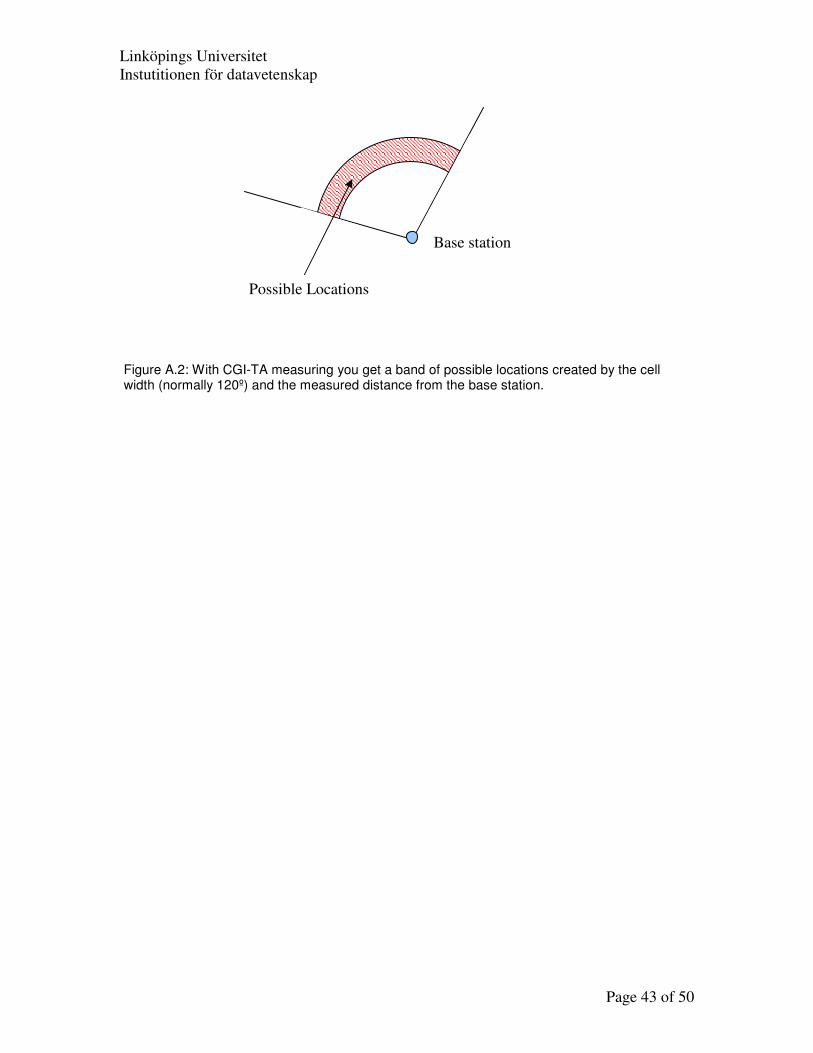
Linköpings Universitet
Instutitionen för datavetenskap
Page 43 of 50
Figure A.2: With CGI-TA measuring you get a band of possible locations created by the cell width (normally 120º) and the measured distance from the base station.
Base station
Possible Locations

Linköpings Universitet
Instutitionen för datavetenskap
Page 44 of 50
Appendix B. Coordinate Systems
To be able to use a map when navigating, three dimensional points in the real world have
to be assigned a two dimensional position on a map.
This mapping of points is done in several steps. First, a model of the earth’s surface is
created. This model is a mathematical representation of the surface and is often created as
a sphere or an ellipsoid.
The mathematical model of the earth used is dependent on what type of map is to be
created. For world maps, where the scale is very large it’s enough to use a spheroid as
model since it gives easier calculations but with less accuracy as consequence. However,
since the scale is large low accuracy will not be noticeable in the final map.
More detailed maps at a smaller scale; maps for hiking, car travel, route planning
amongst other things; are required to use an elliptical earth model since the accuracy of
the created map needs to be higher.
When the model is created, features in the real world have to be georeferenced where the
location in three dimensions is projected to a location in two dimensions on the
mathematical model.
For representation of the georeferenced position on the spheroid, a datum is used.
The datum consists of a base point, a direction and a distance from the base point. With
these three parameters (where the base point is defined for the spheroid) every location
on the sphere can be referenced by calculating the distance and angle to it from the base
point.
The next step in map creation is to find a projection where every point on the sphere-like
surface is assigned a location in a plane. This 3D to 2D projection varies depending on
the mathematical model and the type of map to be produced.
For Swedish maps, a projection called Gauss-Krüger / Transversal Mercator is commonly
used. This projection is also the projection used in the Swedish official coordinate system
RT90. The Gauss-Krüger projection uses a mathematical model of the earth’s surface
called Bessel 1841.
Gauss-Krüger is a conformal projection which means that an infinitesimal shape in the
source geometry will be projected to the plane without any change in its shape. This is a
very important feature when drawing maps since the desire of a map is that it should
present a picture of what the real world looks like.
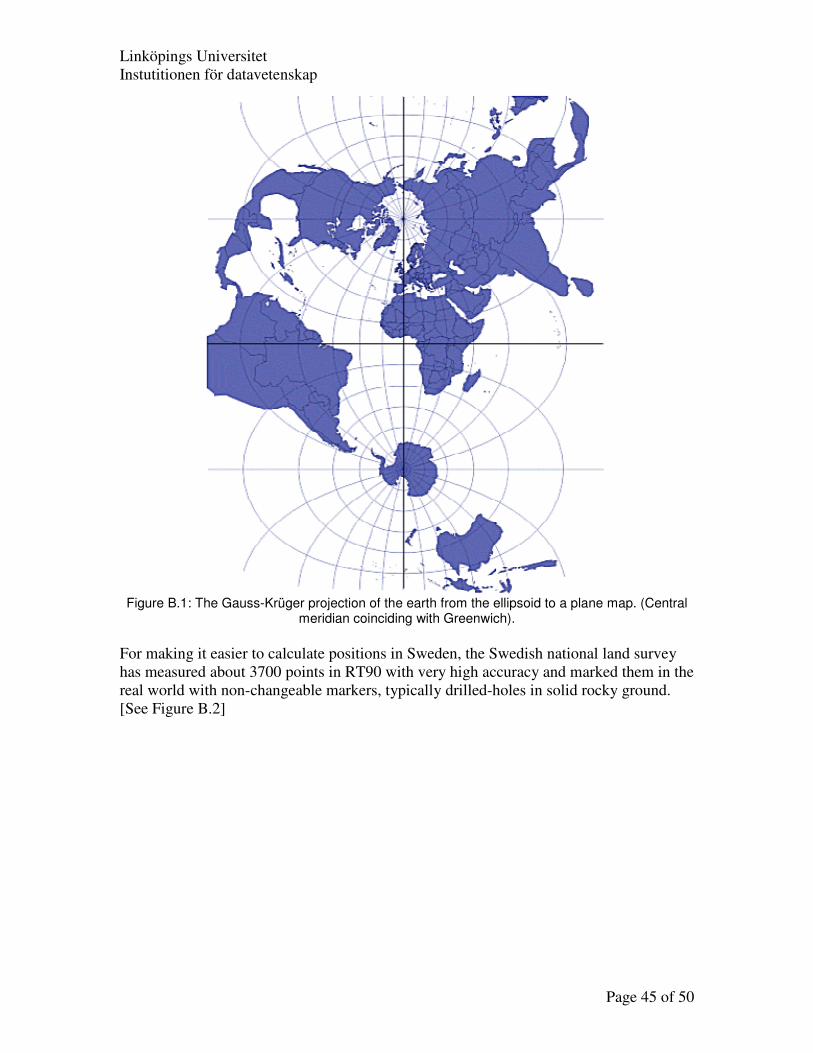
Linköpings Universitet
Instutitionen för datavetenskap
Page 45 of 50
Figure B.1: The Gauss-Krüger projection of the earth from the ellipsoid to a plane map. (Central
meridian coinciding with Greenwich).
For making it easier to calculate positions in Sweden, the Swedish national land survey
has measured about 3700 points in RT90 with very high accuracy and marked them in the
real world with non-changeable markers, typically drilled-holes in solid rocky ground.
[See Figure B.2]
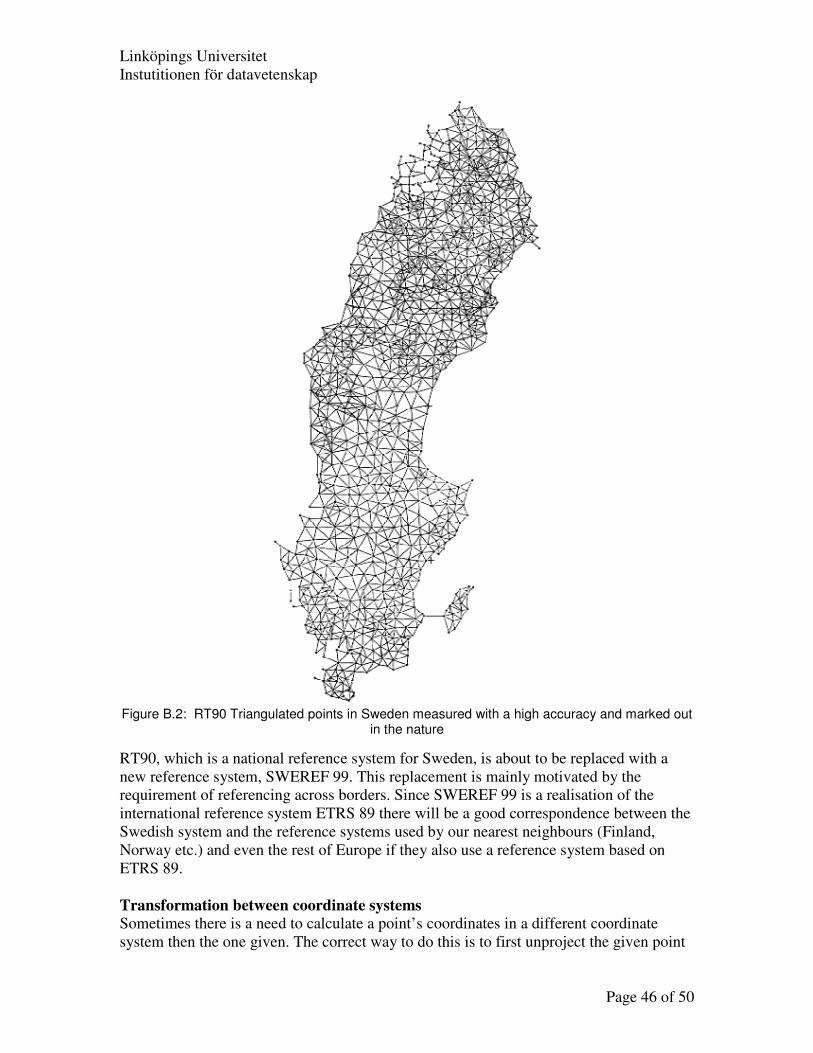
Linköpings Universitet
Instutitionen för datavetenskap
Page 46 of 50
Figure B.2: RT90 Triangulated points in Sweden measured with a high accuracy and marked out
in the nature
RT90, which is a national reference system for Sweden, is about to be replaced with a
new reference system, SWEREF 99. This replacement is mainly motivated by the
requirement of referencing across borders. Since SWEREF 99 is a realisation of the
international reference system ETRS 89 there will be a good correspondence between the
Swedish system and the reference systems used by our nearest neighbours (Finland,
Norway etc.) and even the rest of Europe if they also use a reference system based on
ETRS 89.
Transformation between coordinate systems Sometimes there is a need to calculate a point’s coordinates in a different coordinate
system then the one given. The correct way to do this is to first unproject the given point
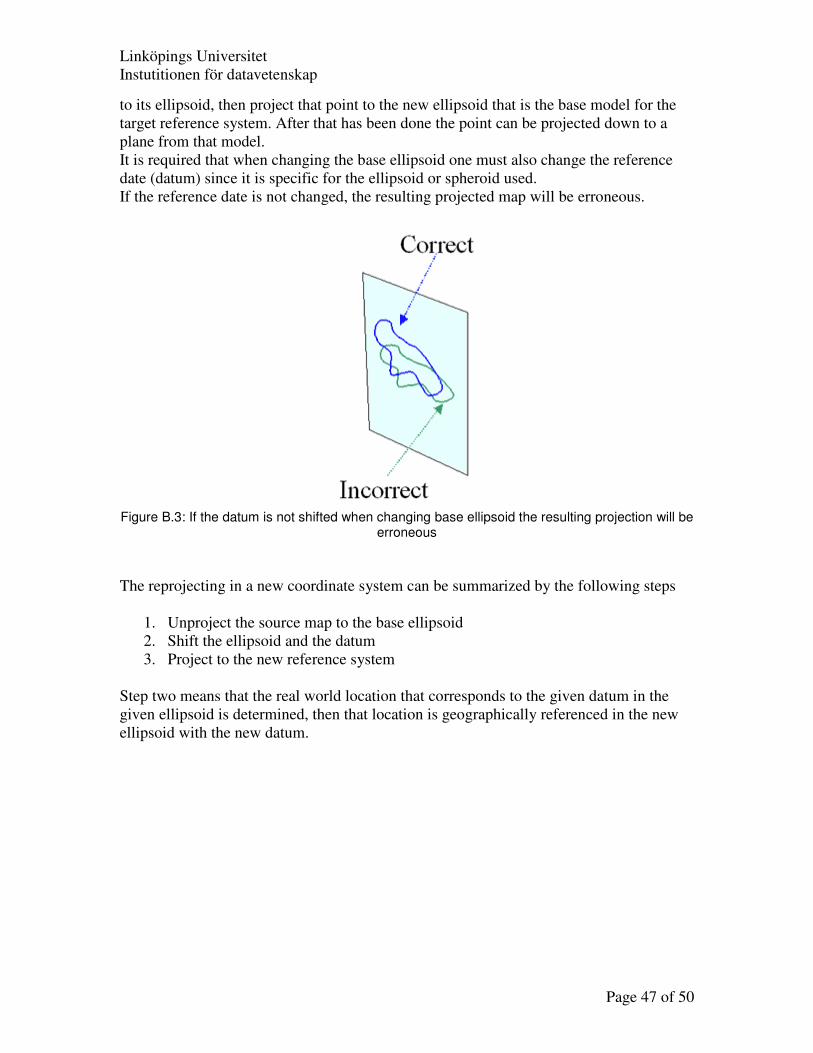
Linköpings Universitet
Instutitionen för datavetenskap
Page 47 of 50
to its ellipsoid, then project that point to the new ellipsoid that is the base model for the
target reference system. After that has been done the point can be projected down to a
plane from that model.
It is required that when changing the base ellipsoid one must also change the reference
date (datum) since it is specific for the ellipsoid or spheroid used.
If the reference date is not changed, the resulting projected map will be erroneous.
Figure B.3: If the datum is not shifted when changing base ellipsoid the resulting projection will be
erroneous
The reprojecting in a new coordinate system can be summarized by the following steps
1. Unproject the source map to the base ellipsoid
2. Shift the ellipsoid and the datum
3. Project to the new reference system
Step two means that the real world location that corresponds to the given datum in the
given ellipsoid is determined, then that location is geographically referenced in the new
ellipsoid with the new datum.
Linköpings Universitet
Instutitionen för datavetenskap
Page 48 of 50
References
1 Title: ESRI
URL: http://www.esri.com
Last visited: 2005-02-01
2 Title: Telia Service Integrator
Author: Telia
URL: http://www.teliamobile.se/articles/00/00/5f/44/01/P-blad%20Service%20Integrator.pdf
Last visited: 2004-02-21
3 Title: TomTom GO
Author: TomTom BV
URL: http://www.tomtom.com/products/product.php?ID=0&Language=1
Last visited: 2004-12-06 11:22
4 Title: Navigon
Author: Navigon, Mobile Navigation
URL: http://www.navigon.de/uk/consumer_products/
Last visited: 2004-12-01 11:22
5 Title: G-Sat Europe
Author: G-Sat Europe
URL: http://www.gsateurope.com/shop/index.php?cPath=21_22_28
Last visited: 2004-12-01 12:01
6 Title: Wayfinder systems
Author: Wayfinder Systems AB
URL: http://www.wayfinder.se
Last visited: 2004-11-12 10:23
7 Title: Telmap
Author: Telmap Ltd
URL: http://www.telmap.com/frameset.asp?page=asp/products.asp?ToSelect=Polaris2
Last visited: 2004-11-23 09:23
8 Title: Copilot
Author: Alc Technologies inc
URL: http://www.alk.com/products/consumer/index.asp
Last visited: 2004-12-01 10:01
9 Title: Smartzone navigation suite
Author: Webraska Mobile Technologies
URL: http://www.webraska.com/Products/SmartZoneNavigation/Smartphones
Last visited: 2004-12-06 15:38
10
Title: LiveAnywhere Traffic
Author: YDREAMS
URL: http://www.ydreams.com/solutions.php?sec=2&s_sec=1&s_s_sec=2
Last visited: 2004-12-06 16:29
Linköpings Universitet
Instutitionen för datavetenskap
Page 49 of 50
11
Title: Appello
Author: Appello
URL: http://www.appello.se
Last visited: 2005-01-27
12
Title: ViaMichelin
Author: Michelin
URL: http://www.viamichelin.com/
Last visited: 2004-12-07 10:23
13
Title: RAC Traffic-i
Author: RAC plc
URL: http://www.rac.co.uk/travelservices/traffic/traffic-i
Last visited: 2004-12-07 10:30
14
Title: TrafficGauge, Mobile Traffic Map
Author: TrafficGauge, Inc.
URL: http://www.trafficgauge.com/
Last visited: 2004-12-07 10:35
15
Title: VICS HOME PAGE
Author: VICS
URL: http://www.vics.or.jp
Last visited: 2005-01-26
16
Triona internal document
Title: TNE Routings Com-gränssnitt, IShortestPathCore
Author: Klas Hallberg
Published: 2004-08-10
17
Title: Three Fastest Shortest Path Algorithms on Real Road Networks: Data Structures and
Procedures Author: F. Benjamin Zhan
URL: http://publish.uwo.ca/~jmalczew/gida_1/Zhan/Zhan.htm
Last visited: 2004-11-30 14:02
18
Title: A Dynamic Multi-source Dijkstra’s Algorithm for Vehicle Routing
Author: Peter W. Eklund, Steve Kirkby, Simon Pollitt
URL: http://www.kvocentral.com/kvopapers/pollitt.pdf
Last visited: 2005-02-09
19
Title: System overview MPS
Author: Telefonaktiebolaget LM Ericsson
URL: http://www.ericsson.com/mobilityworld/sub/open/technologies/mobile_positioning/about/mps_sys
tem_overview
Last visited: 2004-11-30 10:38
20
Title: Lägesbundna referenssystem
Author: Vägverket, Vtg, Tommy Andersson
URL: http://www.vv.se/filer/publikationer/Lagesbundna_%20referenssystem.pdf
Last visited: 2005-01-27 14:51
21
Triona internal document
Title: Smartic – Teknisk Plattform, Rapport
Linköpings Universitet
Instutitionen för datavetenskap
Page 50 of 50
Author: Per-Olof Svensk
Published: 2003-06-05
22
Title: ESRI
Author: ESRI
URL: http://www.esri.com
Last visited: 2005-01-30 11:00
23
Title: Designing Web Sites for the Internet Explorer for Pocket PC
Author: Microsoft Corporation URL: http://msdn.microsoft.com/library/en-us/dnppc2k/html/ppc_dev.asp?frame=true
Last visited: 2004-12-15 10:50
24
Title: HTML 3.2 Reference Specification
Author: Dave Raggett
URL: http://www.w3.org/TR/REC-html32
Last visited: 2005-01-30 11:10
25
Title: Javascript 1.1 Developer's Guide
Author: Arman Danesh, Wes Tatters
ISBN: 1575210843
26
Title: GPS Guide for beginners
Author: GARMIN Corporation
Part number: 190-00224-00 Rev. A
URL: http://www.garmin.com/manuals/GPSGuideforBeginners_Manual.pdf
Last visited: 2004-11-29 16:39
27
Title: Mobile Positioning - Where You Want To Be! Author: Christoffer Andersson URL: http://www.wirelessdevnet.com/channels/lbs/features/mobilepositioning.html
Last visited: 2004-11-30 11:23