Embed Size (px)
Citation preview
INOM EXAMENSARBETE TEKNIK,GRUNDNIVÅ, 15 HP
, STOCKHOLM SVERIGE 2017
Troll detection with sentiment analysis and nearest neighbour search
FILIP JANSSON
OSKAR CASSELRYD
KTHSKOLAN FÖR DATAVETENSKAP OCH KOMMUNIKATION
Troll detection with sentimentanalysis and nearest neighbour
search
DD142X
Oskar Casselryd, Filip Jansson
Version 1.0Final version
June 5, 2017
2
Abstract
Internet trolls are gaining more influence in society due to the rapidgrowth of social media. A troll farm is a group of Internet trolls thatget paid to spread certain opinions or information online. Identifyinga troll farm can be difficult, since the trolls try to stay hidden. Thisstudy examines if it is possible to identify troll farms on Twitter byconducting a sentiment analysis on user tweets and modeling it as anearest neighbor problem. The experiment was done with 4 simulatedtrolls and 150 normal twitter users. The users were modeled into datapoints based on the sentiment, frequency and time of their tweets.The result of the nearest neighbor search could not show a clear linkbetween the trolls as their behaviour was not similar enough.
Identifiering av troll med sentiment analys och nearest neigh-bour search.
Sammanfattning
Internet-troll har de senaste aren fatt okat inflytande i och medokat anvandande av sociala medier. En trollfarm ar en grupp trollsom far betalt for att sprida specifika asikter eller information online.Det kan vara svart att urskilja anvandarna i en trollfarm fran vanligaanvandare da de standigt forsoker undvika upptackt. I denna studieundersoks hurvida man kan finna en trollfarm pa Twitter genom attutfora en sentimentanalys pa anvandares tweets och sedan modeleradet som ett nearest neighbor problem. Experimentet utfordes med 4simulerade troll och 150 vanliga twitteranvandare. Anvandarna mo-delerades efter tid, frekvens och sentiment pa deras tweets. Resultatetfran modeleringen kunde inte pavisa ett samband mellan trollen daderas beteendemonster skiljde sig at allt for mycket.
CONTENTS
Contents
1 Introduction 11.1 Problem statement . . . . . . . . . . . . . . . . . 21.2 Scope . . . . . . . . . . . . . . . . . . . . . . . . 2
2 Background 32.1 Twitter . . . . . . . . . . . . . . . . . . . . . . . 32.2 Twitter API , limitations and policies . . . . . . . 32.3 Troll farm . . . . . . . . . . . . . . . . . . . . . . 4
2.3.1 Troll distinction . . . . . . . . . . . . . . . 42.3.2 Farm . . . . . . . . . . . . . . . . . . . . . 4
2.4 Sentiment Analysis . . . . . . . . . . . . . . . . . 52.4.1 Levels of investigation . . . . . . . . . . . 52.4.2 Sentiment analysis on tweets . . . . . . . . 62.4.3 Stanford coreNLP . . . . . . . . . . . . . . 6
2.5 Distance metrics . . . . . . . . . . . . . . . . . . 62.5.1 Euclidean metric . . . . . . . . . . . . . . 6
2.6 Hamming metric . . . . . . . . . . . . . . . . . . 72.7 Nearest neighbour search . . . . . . . . . . . . . . 7
2.7.1 Exact NNS, variations and problems . . . 72.7.2 Approximations . . . . . . . . . . . . . . . 82.7.3 Locality-Sensitive Hashing . . . . . . . . . 8
3 Method 103.1 Data set . . . . . . . . . . . . . . . . . . . . . . . 103.2 Choosing parameters . . . . . . . . . . . . . . . . 113.3 Sentiment tools . . . . . . . . . . . . . . . . . . . 123.4 Nearest neighbour implementation . . . . . . . . . 13
4 Results 144.1 Troll data . . . . . . . . . . . . . . . . . . . . . . 144.2 Troll relative closeness . . . . . . . . . . . . . . . 154.3 Comparison trolls and normal users . . . . . . . . 15
CONTENTS
5 Discussion 205.1 Results . . . . . . . . . . . . . . . . . . . . . . . . 205.2 Method . . . . . . . . . . . . . . . . . . . . . . . 21
6 Conclusion 22
1 INTRODUCTION
1 Introduction
Large quantities of opinions and diverse thoughts flow throughsocial media every day. It serves as a platform for people to sharethoughts on hot topics and conduct public debate. The generalsentiment on social media can affect many peoples opinion andcomprehension of different topics. Twitter has over 300 millionmonthly users [12], and with the growing user base a number ofprofessional ”trolls” have been revealed on the platform [1]. Ithas become increasingly more important to identify these usersas they often represent imaginary people with made up opinions,thus affecting the debate by giving an impression of a wider sup-port or opposition for selected topics. There are many differentdefinitions and uses of the word ”troll”. In a modern contextit often refers to someone sitting at home spewing hatred ordisinformation through different forums, often anonymously[3].
A new phenomenon are so called ”troll farms”. It refers toa professional setting where people get paid to troll on accountof their employer. Just like a normal business they work shiftsbehind a screen in their cubicles. Many popular platforms takeactions against serious trolls, much like they do against botsspamming the network. To avoid detection the people at trollfarms often operate from several different accounts and use soft-ware that keeps their location hidden. This activity has similar-ities with opinion spamming, which often is done by bots withthe intention of drowning feeds with useless information. Thusmaking it hard to find relevant information. The difference be-tween trolling and opinion spamming is that trolls try to give ahigher sense of relevance in their text.
There are many ways to detect users with similar behaviouralpatterns, but they are often expensive and therefore not realis-tic to implement. Most methods depend on modelling users asvectors or points in a coordinate system. This makes it easier to
1
1 INTRODUCTION
compare similarities. Ways of obtaining data for these modelsvary. Information such as time and location can often be ex-tracted from the users social media profile. The data can thenbe used directly in the model or put through an analytic processto convert it to a more appropriate format.
The field of analyzing human-written text with computa-tional means is called Natural Language Processing. It has manysub-fields, one of them being sentiment analysis. There are vari-ations in how sentiment analysis is conducted but the goal isusually to quantify the sentiment of a text. The output of sucha process could be single number.
1.1 Problem statement
This study aims to answer the following question: Is it possibleto identify troll farms on Twitter by conducting a sentimentanalysis on user tweets and modeling it as a nearest neighbourproblem?
1.2 Scope
The study was conducted on a set of tweets from 150 randomlyselected Twitter profiles together with 4 simulated trolls over atime period of 4 days. This report focuses on the data gatheredfrom the tweets rather than the users. This decision was madeto keep the focus of the report on sentiment analysis. A moredetailed account of the experiments can be found in chapter 3.
2
2 BACKGROUND
2 Background
This chapter provides a brief background to the methods, tools,platform and concepts central to the study.
2.1 Twitter
Being one of the most popular micro blogs in the world, twitterallow users to post messages up 140 characters long, referred toas ”tweets”. Additional links and ”hash tags” can be attachedto the tweets. Hash tags are labels that can be used to findmessages concerning certain topics.
2.2 Twitter API , limitations and policies
The twitter-API give developers a way to interact and use thedata available on the site. The API provides a powerful searchtool with many parameters for writing queries. It also presentsa time-line tool that can be used to generate the most recenttweets from a certain user. It has a rate limit of 100 calls perfifteen minutes. This makes tweet extraction of larger sets oftweets time consuming.
The different API tools have some built-in constraints put inplace to protect the privacy of twitter users. The search devicehas a time-based restriction, only returning tweets that werepublished within seven days of the API call. In contrast to thatthe time line tool exists. It is only limited by rate, returning amaximum of two hundred tweets.
Twitter does not allow third party hosting of publicly avail-able databases containing tweets. This means that every set oftweets gathered by a third party only contains unique tweet-IDs.These IDs can be used to extract additional information aboutsaid tweets through the official API. The intent of this policy is
3
2 BACKGROUND
to preserve the users right to delete tweets, and for twitter toremain in control of the data. [13]
The process of extracting tweets from public data sets ofIDs is referred to as ”hydrating”. Several unofficial, but reli-able, tools for this purpose are available. The hydration is donethrough GET requests to the twitter API’s, returning a JSONobject with the all twitter data regarding the object.
2.3 Troll farm
In order to understand what a troll farm is, the concept of a”troll” must first be specified.
2.3.1 Troll distinction
The word troll has many different meanings and nuances. Inmodern times it usually refers to an internet troll. The officialdefinition of and internet troll is ”someone who leaves an in-tentionally annoying message on the internet, in order to getattention or cause trouble”[3]. However, the term is sometimesused in a broader sense to describe people with the intention todeceive or spread misinformation online. [1]
2.3.2 Farm
The term ”troll farm” refers to a group of professional trolls.Being professional means they get paid to spread disinformationin favour of their employer. The goal of troll farms is to influencethe public opinion and give an illusion of a broader support infavour of their employers interests. For example there have beenreports about troll farms being linked to the state-sponsoredRussian web brigade, which is tasked to spread pro-Russian andpro-Putin propaganda on different web-based platforms[6].
4
2 BACKGROUND
The employees at a troll farm are often divided into smallergroups of five to six people. The groups receive tasks each dayrelating to different topics that they are to influence. They thenspread opinions corresponding to instructions about said topic.The employees almost always work under several different onlinealiases. This is partly to avoid detection but it also serves thegoal of giving a sense of more people supporting their cause [1].
2.4 Sentiment Analysis
Also known as ”opinion mining”, sentiment analysis aims to de-termine whether a piece of text expresses positive, negative orneutral sentiment. It is a subfield of Natural Language Process-ing (NLP) which is based around problems concerning compu-tational interpretation of human languages [2].
2.4.1 Levels of investigation
Sentiment analysis can be divided into three levels of investiga-tion. Namely document level analysis, with the goal of gettingan overall sentiment on an entire document. Sentence level anal-ysis, which has the same purpose, but only for a single sentence.Lastly entity and aspect level analysis, where the goal is to de-tect not only the sentiment, but the object it is directed at [2].This study uses tools that can handle all three levels [10], butwill focus on sentence level analysis as Tweets are usually notmore than one sentence or two due to the limitations on mes-sage length. It is not relevant what entity it is directed towardseither, as that would introduce problems when choosing appro-priate data samples.
5
2 BACKGROUND
2.4.2 Sentiment analysis on tweets
Since tweets are short and usually does not contain many dif-ferent opinions, sentiment analysis is simpler than it would havebeen on news articles or other longer pieces of text. On the otherhand tweets often contain abbreviations, slang and misspellingswhich could yield misleading results when conducting the analy-sis. The difficulty often varies a lot with different topics. Tweetsconcerning social and political discussions often contain complexexpressions with sarcasm and irony, while opinions about prod-ucts and services usually are pretty straight forward and easierto analyse [2].
2.4.3 Stanford coreNLP
One of the currently most prominent open source toolkits forNatural Language Processing is the Stanford coreNLP. It con-tains a widespread range of tools that can be used in differenttypes of analyses [10]. One of them is the tool for sentimentanalysis.
2.5 Distance metrics
Studying similarity between different data points requires a met-ric and a metric space to describe the relation between points.
2.5.1 Euclidean metric
The Euclidean metric, also know as pythagorian distance is themost common metric used. Given a space with n dimensionsthe euclidean metric is defined as
‖x− y‖2 =√
(x1 − y1)2 + ...+ (xn − yn)2 (1)
where x and y are vectors in the n dimentional space [8].
6
2 BACKGROUND
2.6 Hamming metric
The hamming metric is used when comparing strings or vectorsof equal length. The hamming distance between p and q can bedefined as the minimum number of operations needed to trans-form p into q. This metric is often used when comparing wordsor binary vectors. The term ’hamming cube’ has come to referto the hamming space of binary vectors. It is possible to repre-sent every binary vector of length d within the hamming cubeof dimension d. [7]
2.7 Nearest neighbour search
The nearest neighbor search (NNS) is a commonly used tech-nique for pattern recognition and other type of problems. Thereare many different variants of the algorithm that are effective indifferent areas. The core problem is defined as follows:
”Given a set P of points in a d -dimensional space, constructa data structure which given any query point q finds the point inP with the smallest distance to q”.[5]
The following sections will describe variations of the NNS withtheir up- and downsides.
2.7.1 Exact NNS, variations and problems
The NNS can give more information than just the closest neigh-bour of each data point. The ε - Nearest neighbor search findsall points within a fixed distance from the query point. The k -Nearest neighbour search finds the k nearest neighbour to thequery point, this can be used to find which k points have thestrongest relation to the query point.
The ”straight forward” implementation of the NNS is a linear
7
2 BACKGROUND
exhaustive search through the set of points finding the closestpoint. This method yields a time complexity of O(dn), where nis the amount of data points. It works well on smaller sets witha low number of dimensions, but scales poorly with the size anddimension of the set.
The query time of the algorithm can be improved if the datapoints are preprocessed. A popular solution to this is called kd-trees. This method splits the data set in to d binary trees basedon the points position in each dimension. The data structureallows the average query time to be sub-linear. It does how-ever suffer the ”Curse of dimensionality”, meaning it encounterproblems in higher dimensions, e.g. poor scaling. Studies haveshow that a linear search can be more effective than the kd-treemethod when approaching 10-20 dimensions[4]. There is cur-rently no exact algorithm for the Nearest neighbour problemthat does not struggle in high dimensions.
2.7.2 Approximations
Due to the Curse of dimensionality, alternative methods are gen-erally used over the standard implementation. An approximatedversion of the algorithm is often used when working in higher di-mensions, since it allows querying within polynomial time. Thedrawback is naturally that the result may not always be precise.
2.7.3 Locality-Sensitive Hashing
Locality-Sensitive Hashing (LSH) is an approximate method fora nearest neighbour search. This algorithm maps each point ofthe data set to buckets, where similar data points (using theeuclidean metric) have a high probability to end up in the samebuckets.
The algorithm uses two kinds of hash functions with oppositepurposes. First and foremost we have the locality-sensitive hash
8
2 BACKGROUND
functions. The purpose of these functions is to have similarpoints collide, which places them in the same bucket. Each hashfunction does this by projecting the selected data point on to arandom set of coordinates. In practice this is done by convertingthe coordinates to a hamming cube with dimension d*C, whereC is the value of the largest coordinate in the system, and thereafter projecting the point in hamming space on to the coordinateset.
The effectiveness of this algorithm depends on two parame-ters:
• l - The number of local-sensitive hashfunction used.
• k - Number of coordinatesets used within each hashfunction
The choice of the values k and l are essential for having mini-mal margin of error as well as sub-linear query time. An optimalvalue of k creates a large number of hash collisions between ”sim-ilar” points but also have a low chance of collision from pointsthat are ”different” to the metric used.
The second hash function used is to assign the points in to acertain bucket based on the result from the first hash function.The purpose of this hashing is to avoid collision, therefore amore standard hash function is often used.
Querying on this data-structure is done by running the locality-sensitive hash functions on the query points and collecting allpoints that we have stored in those buckets. The set of datapoint we get from this are of a smaller size,therefore we canperform a linear search on that subset.
9
3 METHOD
3 Method
The following chapter will present the process behind the study.This topic is divided into four parts: data set, choice of param-eters and NNS implementation. The purpose of this chapter isto make the project repeatable. It will therefore give the readera precise description of the methodology and try to explain thethought process behind certain decisions.
3.1 Data set
The study requires a data set with tweets from both trolls andnormal users. Proper selection of normal users is importantin order to recreate a realistic environment in which the trollsoperate. Finding a real up-and-running troll farm would be idealfor this study but is a very difficult task.
Instead a troll farm was simulated using four volunteers andnewly created twitter accounts. Every person was handed anaccount. They used the account to publish tweets under certainrules in order to mimic a troll farms behavior. It was conductedduring a time period of four days. The rules for every userduring the simulation were as following:
• Tweet during working hours (8-17)
• 6-10 tweets per day
• Every day the user gets a different topic to tweet about
• The users were told to be opinionated according to instruc-tions.
• All tweets must to be in English
These users were meant to represent a small scale troll farm.
10
3 METHOD
When choosing normal users a fully random selection is notoptimal. Some users could be inactive or write in different lan-guages that our sentiment analysis tool cannot handle. Theusers where selected at random from a group that fulfilled pre-determined requirements. The requirements were that everyuser must
• tweet in English
• be active on the platform (limited at 20 tweets per day toavoid extreme users with low relevance to our study)
• be located in a timezone close to Sweden.
In order to fulfill the requirements, the users were generatedfrom a pool of users that wrote English tweets in the proximityof London.
Once the users were selected their tweets where acquiredthrough the twitter API.
3.2 Choosing parameters
Appropriate parameters where extracted from the data set us-ing tools developed from scratch for this specific purpose. Thesewere used as coordinates for the different dimensions in the near-est neighbour search later on. Parameters were chosen withhopes of being able to differentiate the troll users from normalusers. They were also chosen with respect to difficulty of falsify-ing the information. Things like location were therefore omitted.The parameters were:
• Average amount of tweets per day.
• Average time of day for tweets.
• Average sentiment of tweets.
11
3 METHOD
• Standard deviation of sentiment in tweets.
Sentiment analysis was applied with a hypothesis that trollsexpress stronger opinions than normal users. Largely becausethey are told explicitly to have opinions. Normal users can alsotweet facts or questions which often are deemed neutral in theanalysis. Trolls should therefore have a larger variation of sen-timent in their tweets. A sentiment score for each tweet wasobtained using the Stanford coreNLP toolkit[10]. For more in-formation see subsection 3.3 Sentient tools. Time of day for thetweets was handled in the form of minutes after midnight.
The majority of parameters ended up as decimal points. Thatis problematic when enforcing the locality-sensitive hashing whichrequire integers. Another problem that arises is the differentmagnitudes of the parameters. It has a great effect on the eu-clidean distance. To solve the first problem and compensate forthe second one all parameters where scaled with an appropri-ate factor and then rounded to the nearest integer. This waya higher rate of accuracy was maintained than if the numberswere to be rounded in their original state.
3.3 Sentiment tools
Two different approaches were taken when determining the sen-timent of tweets. The tool used allowed for easy quantifiablesentiment analysis on a single sentence. When applied to a sen-tence it would give a sentiment score as an integer between 0 and4. A high value meant the sentence was perceived as positive.A low value meant it was perceived as negative. Sentences withsentiment score 2 were considered neutral. At first the tool wasonly applied to the longest sentence in the tweet. That sentencewould then determine the entire tweets sentiment score. Thiswas because the longest sentence is most likely to hold the mainpoints of the tweet. In a second try, the tool was used on all
12
3 METHOD
sentences in a tweet and the mean of their sentiment score deter-mined the tweets score. Result from both methods are presentedin chapter 4.
3.4 Nearest neighbour implementation
Similarity between points was compared with a k-nearest neigh-bour search. It is a suitable algorithm for detecting a set amountof users with strong relations to the query point. Accordinglyit can show whether the trolls are grouped closer to each otherthan to other users with the given parameters. A positive resultwould show that this method is successful over the data set.
There are many varieties of NNS that would have been suf-ficient for this study. In the end the LSH was chosen and im-plemented. The drawbacks of the algorithm are few with theright settings and it allows for both increased sample size andnumber of dimensions in case it would become relevant.
Another approach that could have been used is kd-trees. Itequals LSH in speed with the current number of dimensions andhas no margin of error. It is however possible to get a veryprecise approximation with LSH if appropriate values l and kare chosen [4].
13
4 RESULTS
4 Results
This section is dedicated to presenting the results from the study.
4.1 Troll data
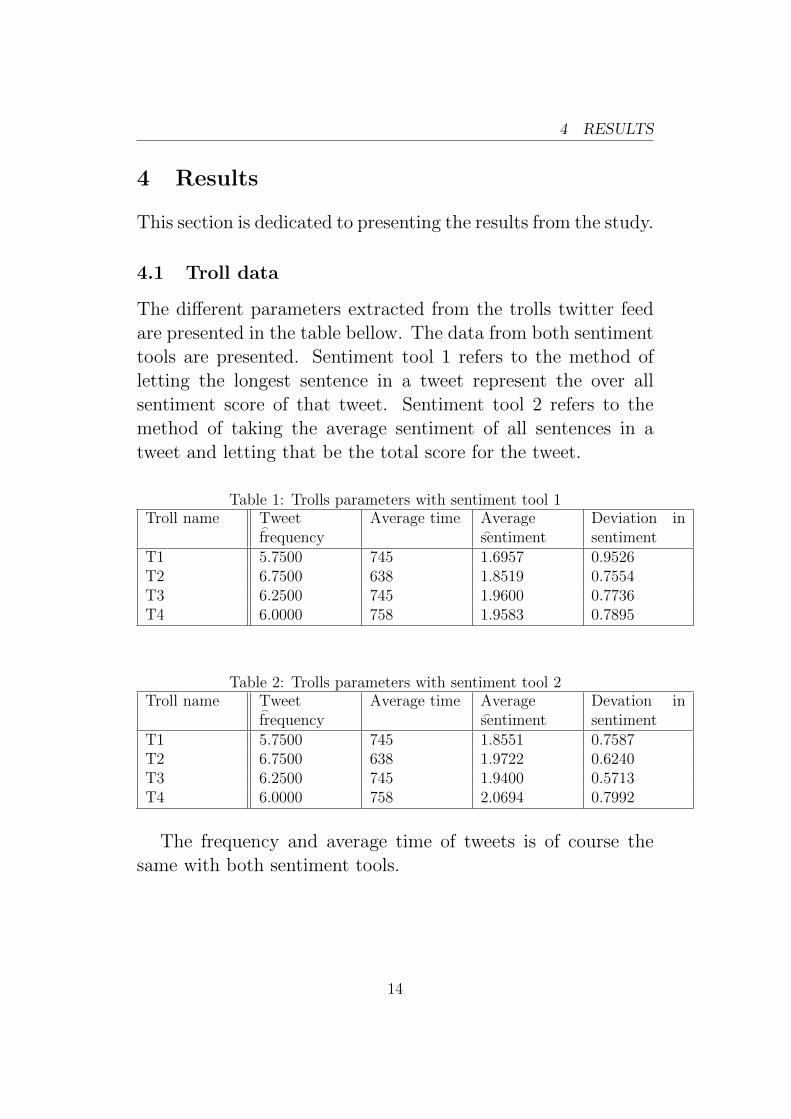
The different parameters extracted from the trolls twitter feedare presented in the table bellow. The data from both sentimenttools are presented. Sentiment tool 1 refers to the method ofletting the longest sentence in a tweet represent the over allsentiment score of that tweet. Sentiment tool 2 refers to themethod of taking the average sentiment of all sentences in atweet and letting that be the total score for the tweet.
Table 1: Trolls parameters with sentiment tool 1Troll name Tweet
�frequencyAverage time Average
�sentimentDeviation insentiment
T1 5.7500 745 1.6957 0.9526T2 6.7500 638 1.8519 0.7554T3 6.2500 745 1.9600 0.7736T4 6.0000 758 1.9583 0.7895
Table 2: Trolls parameters with sentiment tool 2Troll name Tweet
�frequencyAverage time Average
�sentimentDevation insentiment
T1 5.7500 745 1.8551 0.7587T2 6.7500 638 1.9722 0.6240T3 6.2500 745 1.9400 0.5713T4 6.0000 758 2.0694 0.7992
The frequency and average time of tweets is of course thesame with both sentiment tools.
14
4 RESULTS
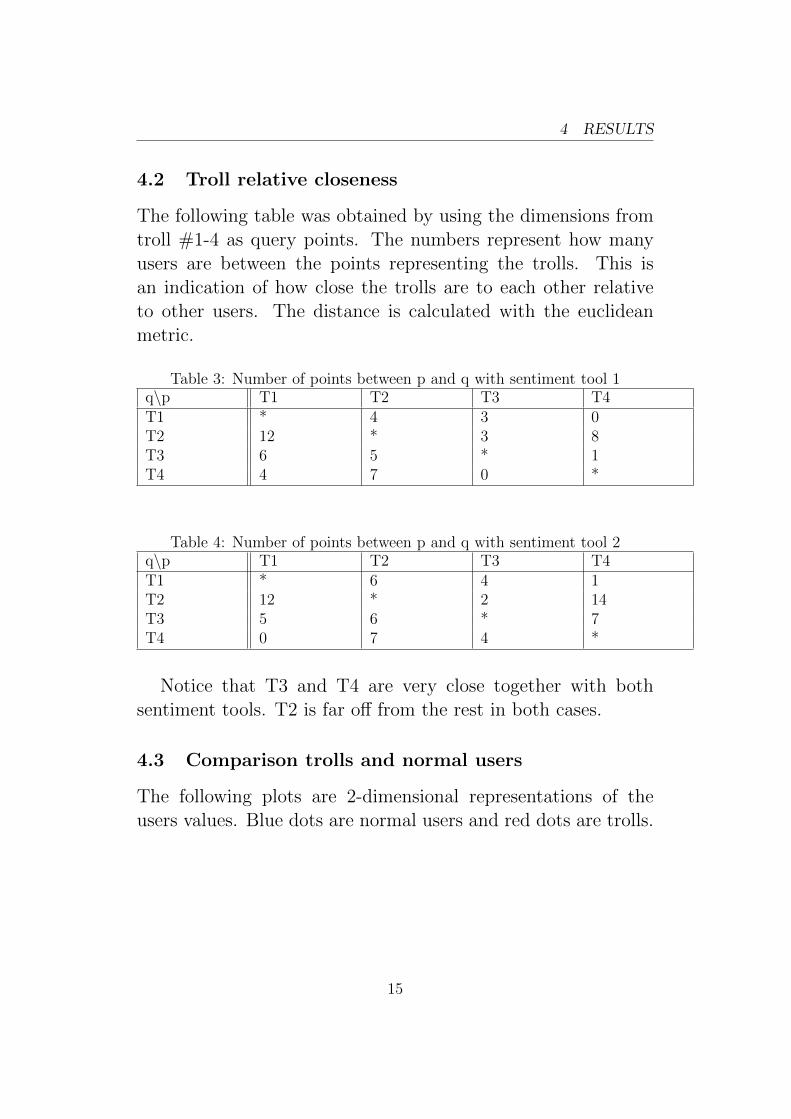
4.2 Troll relative closeness
The following table was obtained by using the dimensions fromtroll #1-4 as query points. The numbers represent how manyusers are between the points representing the trolls. This isan indication of how close the trolls are to each other relativeto other users. The distance is calculated with the euclideanmetric.
Table 3: Number of points between p and q with sentiment tool 1q\p T1 T2 T3 T4T1 * 4 3 0T2 12 * 3 8T3 6 5 * 1T4 4 7 0 *
Table 4: Number of points between p and q with sentiment tool 2q\p T1 T2 T3 T4T1 * 6 4 1T2 12 * 2 14T3 5 6 * 7T4 0 7 4 *
Notice that T3 and T4 are very close together with bothsentiment tools. T2 is far off from the rest in both cases.
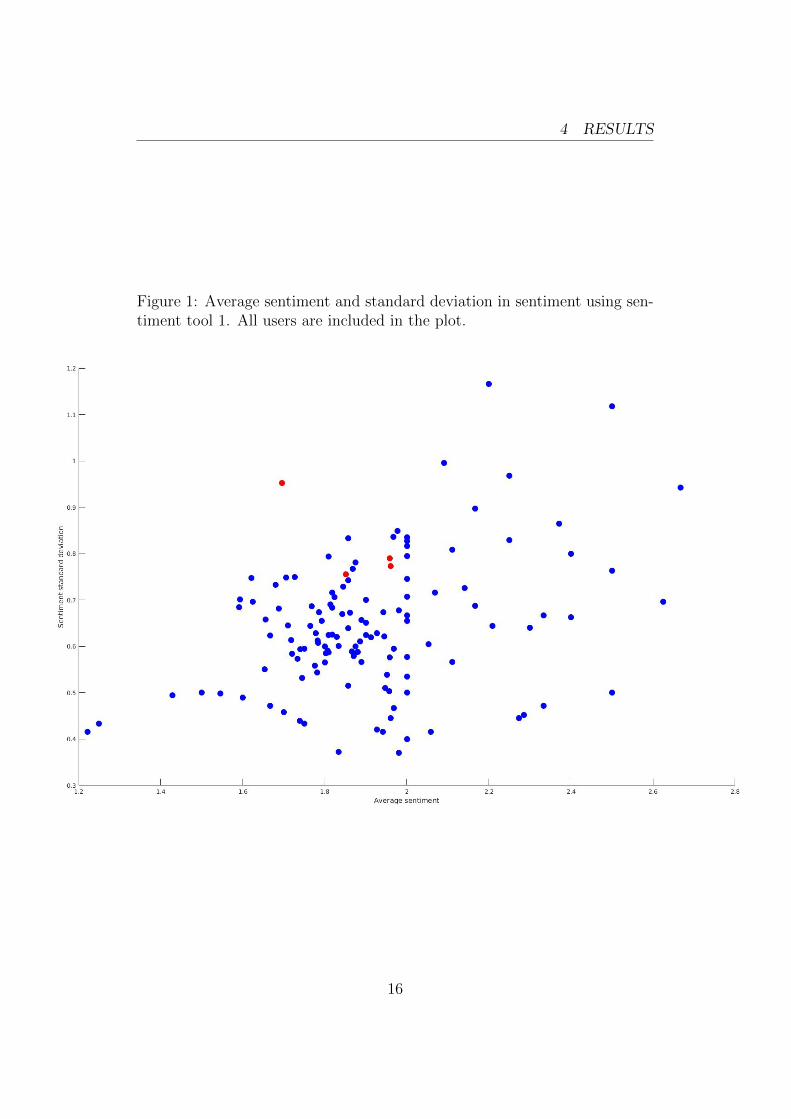
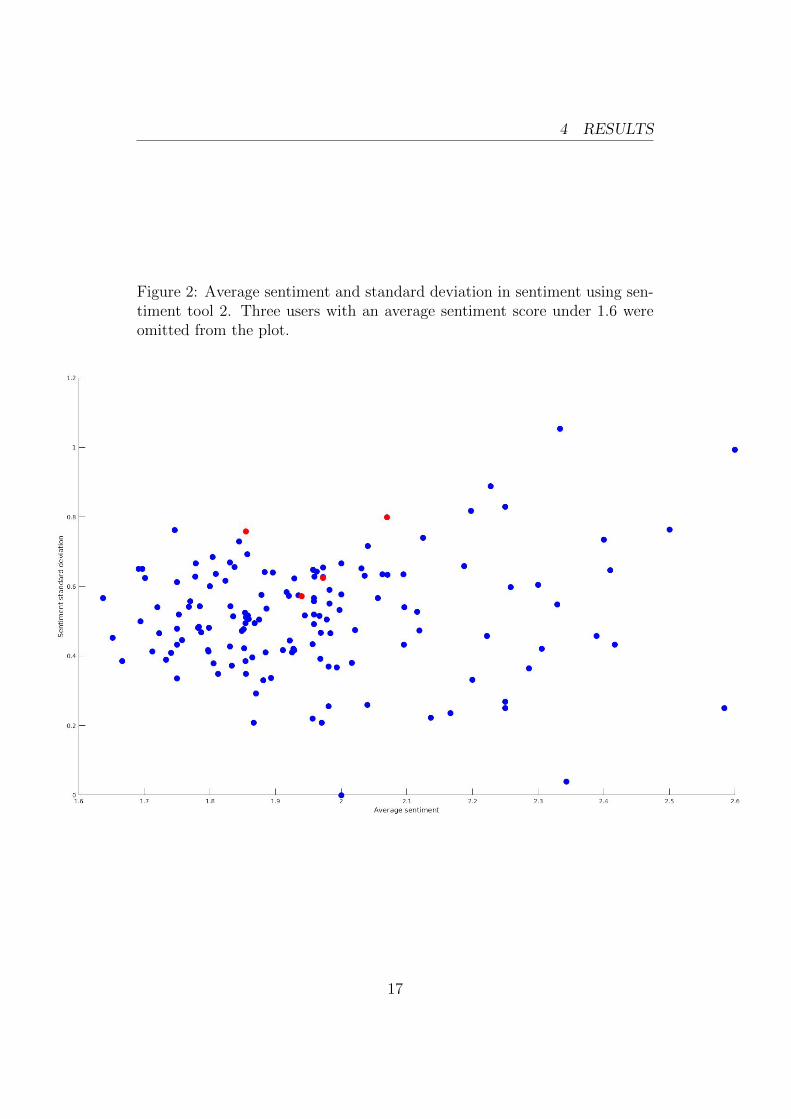
4.3 Comparison trolls and normal users
The following plots are 2-dimensional representations of theusers values. Blue dots are normal users and red dots are trolls.
15
4 RESULTS
Figure 1: Average sentiment and standard deviation in sentiment using sen-timent tool 1. All users are included in the plot.
16
4 RESULTS
Figure 2: Average sentiment and standard deviation in sentiment using sen-timent tool 2. Three users with an average sentiment score under 1.6 wereomitted from the plot.
17
4 RESULTS
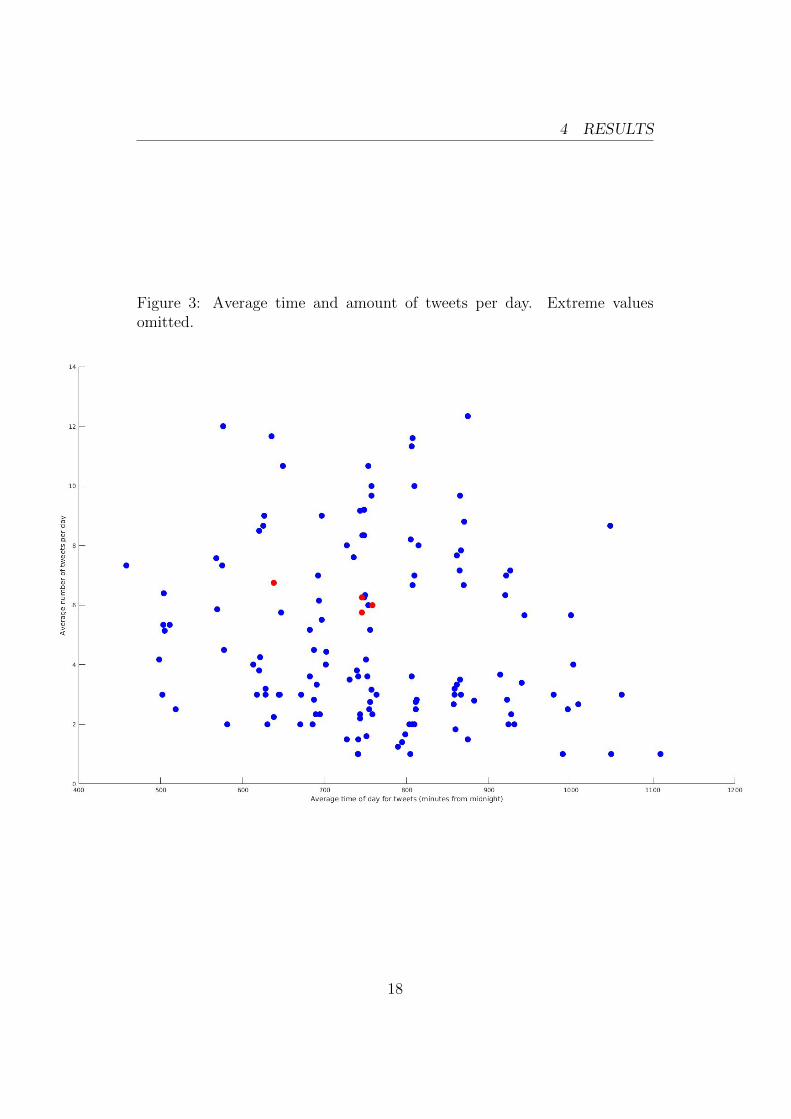
Figure 3: Average time and amount of tweets per day. Extreme valuesomitted.
18
4 RESULTS
Users that average over 14 tweets per day are not showed infigure 3 as they are not very relevant to the study. A total of 10users are outside the scope of the plot.
Worth noting is that three of the trolls are relatively close toeach other in both graphs. Average number of tweets per dayand sentiment deviation seems to be the parameters where thetrolls are most similar.
19
5 DISCUSSION
5 Discussion
In this section a discussion is held concerning the method, resultand other things related to the study.
5.1 Results
The data gathered from this study was not enough to find atroll farm. Sentiment tool 1 seems to have distinguished thetrolls more than sentiment tool 2. Even with tool 1 the relationbetween the trolls relative to other twitter users were ratherweak, as shown in table 3. Only troll 3 and 4 where each othersnearest neighbour. Troll 1 and especially Troll 2 didn’t have avery strong relation to the other trolls. The abnormal parame-ter of troll number 2 was the average time, being much earlierin the day than the other trolls. This is possibly something thatcould have been prevented with stricter rules for tweet publi-cations. Another observation that we can make from Figure 1is that the trolls does not differentiate themselves very stronglyfrom the normal users in the sentiment aspect. They do seemto have a slightly higher deviation in sentiment than the nor-mal users. It was however not strong enough to single-handedlydistinguish them. The trolls standard deviation in sentimentwas surprisingly low considering that they were instructed totweet opinionated and all had a relative neutral average senti-ment score. This means that some of the opinionated tweetsfrom the simulated trolls were classified as neutral by the senti-ment tools, which indicates the tool had trouble with identifyingthe sentiment of the tweets. Whether this problem was causedby unclear tweets from the users or poor sentiment analysis ishard to determine, it is most likely a bit of both.
20
5 DISCUSSION
5.2 Method
The troll simulation was not ideal and we can attribute most ofthat to a lack of resources. If the participants were on the studyfull time a more accurate simulation would almost be guaran-teed. It would also generate more data for the study. Howeverthere are a few things that could have been done to possiblyimprove the quality of the study without improved resources.The rules could have been stricter to make sure all trolls did thesame thing. Since they have no training and lacking experiencein the field the risk of them deviating from the original task ismore present. Although three of the trolls were similar in theirbehaviour patterns, one went a different route and did not endup close to the others. Another thing that could be done to pos-sibly improve results is to make the trolls sit in the same room.This is obviously closer to how a real troll farm works and thetrolls may affect each other in some way.
21
6 CONCLUSION
6 Conclusion
It is not possible to detect the troll farm in this study usingsentiment analysis and nearest neighbour search. With anotherdata set or different tools the result could be different. Moreresources may have yielded a better foundation for the studyand resulted in more analytic conclusions. This study can serveas reference when structuring future experiments in the samefield.
22
REFERENCES
References
[1] A. Chen. The Agency. The New York Times. 15-06-02.https://www.nytimes.com/2015/06/07/magazine/the-
agency.html (Accessed 2017-03-13)
[2] B. Liu. Sentiment analysis and opinion mining. Toronto:Morgan & Claypool Publishers, 2012
[3] Cambridge dictionary: Meaning of “troll” in theEnglish Dictionary. http://dictionary.cambridge.org/dictionary/english/troll (Accessed 2017-03-25)
[4] G. Aristides, I. Piotr, M. Rajeev. Similarity Search in HighDimensions via Hashing. Department of Computer Science,Stanford University, 1999.
[5] G. Shakhnarovich, T. Darrell, P. Indyk Nearest-NeighborMethods in Learning and Vision Theory and Practice Cam-bridge : MIT Press 2006
[6] Independant: Revealed: Putin’s army of pro-Kremlinbloggers. http://www.independent.co.uk/news/world/
europe/revealed-putins-army-of-pro-kremlin-
bloggers-10138893.html (Accessed 2016-03-25)
[7] M. Deza, E. Deza Encyclopedia of Distances p.51,93
[8] M. Deza, E. Deza Encyclopedia of Distances p.103
[9] S.Skiena The Algorithm Design Manual, 2nd Edition De-partment of Computer Science, State Universty of NewYork 2008
[10] Manning, Christopher D., Mihai Surdeanu, John Bauer,Jenny Finkel, Steven J. Bethard, and David McClosky.2014. The Stanford CoreNLP Natural Language Processing
23
REFERENCES
Toolkit In Proceedings of the 52nd Annual Meeting of theAssociation for Computational Linguistics: System Demon-strations, pp. 55-60.
[11] Twarc: A command line tool (and Python library) forarchiving Twitter JSON https://github.com/DocNow/
twarc (Accessed 2017-03-01)
[12] Twitter: Usage/Company facts. https://about.twitter.com/company (Accessed 2017-03-13)
[13] Twitter: Twitter-developers https://dev.twitter.com/
rest/public (Accessed 2017-04-02)
24