Embed Size (px)
Citation preview
8/2/2019 Tsc 17 3 Duncan
http://slidepdf.com/reader/full/tsc-17-3-duncan 1/11
141
SPRING 2007 THE SOCIAL CONTRACT
B Y RICHARD C. DUNCAN, PHD
Abstract
The highpoint of industrial civilization
followed by its terminal decline will be a
atershed of human history. Ackerman’s
aw defines it. The goal of this essay is to
predict the highpoint and the initial decline.
nergy production and population data
from 1850 to 2005 are the foundation of theforecast. To these are added estimates of the
arth’s carrying capacity, the attractiveness
principle, and 2007 as our forecast for peak
oil. Further, the energy and population
istory of the U.S. is shown to be an
invaluable guide to forecast the energy and
population future of the world. Specifically:
.S. energy production per capita has gone
from growth, through stagnation, and now
into terminal decline. The world has gone
from growth and now into stagnation. Theerminal decline of industrial civilization—
according to these calculations—is
imminent. The life expectancy of industrial
civilization is about 100 years.
[Key Words: nergy; population; carrying
apacity; attractiveness; peak oil; fuel
stages; energy intervals; regress to coal;
edia taboo; collapse.
Background
As we go from this happy hydrocarbon
bubble we have reached now to a renewable
energy resource economy, which we do this
century, will the “civil” part of civilization
survive? As we both know there is NO WAY
that alternative energy sources can supply the
amount of per capita energy we enjoy now
much less for the 9 billion expected by year
2050. And energy is what keeps this whole
game going. We are currently involved in a
Faustian bargain – selling our economic souls
for the luxurious life of the moment, but sooner
or later the price has to be paid in some way.
—Walter Youngquist
(Letter, 3/22/06)
T
he Olduvai theory states that the life
expectancy of industrial civilization
is approximately 100 years.1 World
energy production per capita (e)defines it. The duration of industrial
civilization begins when e reaches 30 percent of its
plateau value’ and it ends the year that e falls back
o that value.2 Historic energy and population data,
multitude estimates of the Earth’s carrying capacity,
he attractiveness principle, our ten forecasts of
peak oil, the regress to coal, and the U.S. analogue
– taken together – betoken that the terminal decline
of industrial civilization is imminent.
The theory has five postulates:
1. The exponential growth of world energy
production ended in 1970.
2. U.S. intervals anticipate Olduvai
intervals: (1) growth, (2) stagnation, and (3) terminal
decline.
3. The terminal decline of industrial civilization
will begin circa 2008-2012.
The Olduvai Theory
Terminal Decline Imminent
Richard C. Duncan , P .D., an e ectrica engineer,
is Director o t e Institute on Energy an Man
an a requent writer on t e topic o “pea
il.” He can be reached at the Institute: 1526
44th Avenue SW, Suite 204 Seatt e, WA 98116;
uncanric ar c msn.com.
8/2/2019 Tsc 17 3 Duncan
http://slidepdf.com/reader/full/tsc-17-3-duncan 2/11
SPRING 2007 HE SOCIAL CONTRACT
142
. Brownouts and blackouts are reliable leading
indicators of terminal decline.
5. World population will decline proximate
with e.
British astronomer first brought the subject
of overshoot and collapse to my attention in 1964.
discussed the Olduvai theory with a U.S. Senator in Albuquerque, New Mexico in 1979. Ten years
later I presented it to a receptive audience in New
York. (Duncan, 1989) Data show that the theory
sketched out on those occasions has held up
remarkably well.
xplaining, refining, and testing the Olduvai
theory continues. To wit: My energy and population
database for testing the theory runs from 1850 to
yearend 2005. A scenario extends from 2005 to
2030. The 155 years of rigorous data are the basisfor the 25-year scenario.3
he Earth’s Carrying Capacity
The cheap oil age created an artificial
bubble of plentitude for a period not much
longer than a human lifetime, a hundred
ears. … So, I hazard to assert that as
oil ceases to be cheap and the world
eserves are toward depletion, we will
indeed suddenly be left with an enormoussurplus population … that the ecology of
he earth will not support. No political
program of birth control will avail. The
people are already here. The journey back
o non-oil population homeostasis will
ot be pretty. We will discover the hard
ay that population hypergrowth was
simply a side effect of the oil age. It was a
condition, not a problem with a solution.
That is what happened and we are stuck
ith it.ames Howard Kunstler
(2005, pp. 7-8)
n my previous essay I quoted five sources that
put the earth’s long-term carrying capacity between
0.5 to 2.0 billion people (Duncan, 2005-2006).
Since then I’ve added the following five references
for this vital—but media taboo—subject:
• rofessor Howard C. Hayden (2004, pp.
30-31), author of e So ar Frau : W y So ar
Energy Won’t Run T e Wor worked out the details,
The earth’s population has long since exceeded the
numbers that could be supported by those [solar]
energy sources. As well, the agricultural technology
existing a mere century ago could not possibly feedhe world’s billions. For those who long for the good
old days of a sub-billion population, it is useful to
note that the only path to that end is for many billion
people now alive to become dead, even if not one
baby were to be born in the next thirty years.”
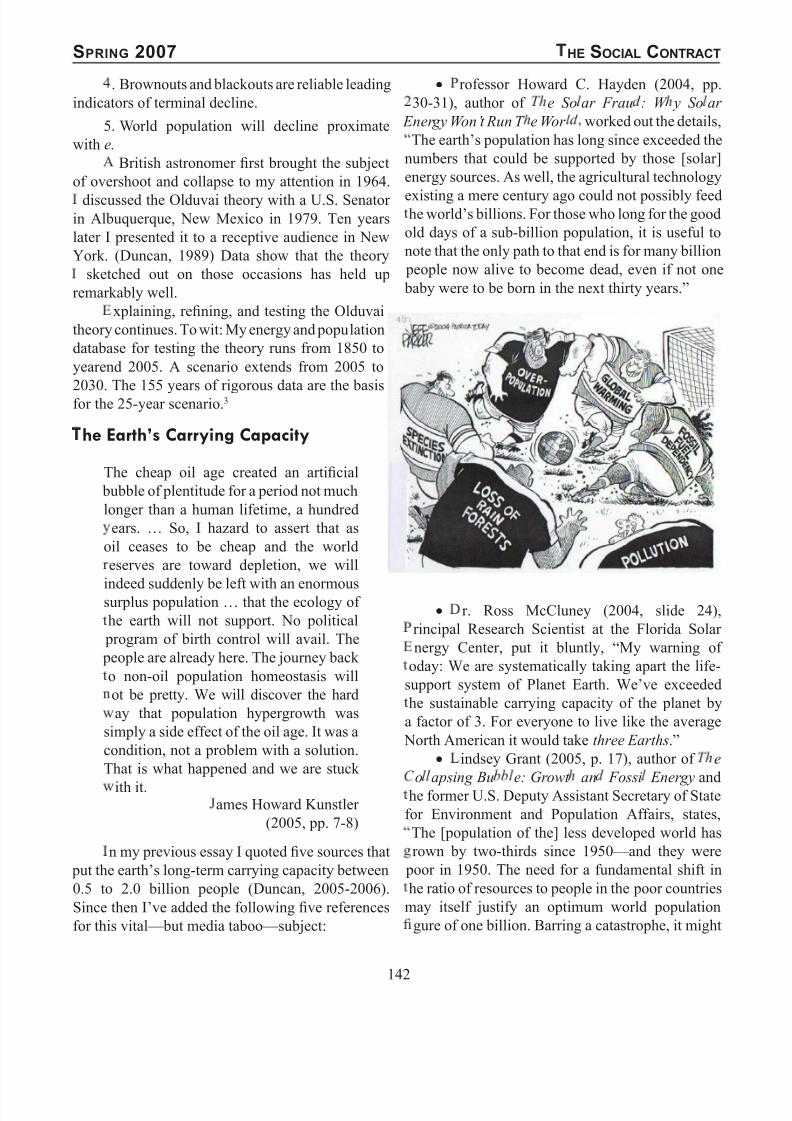
• r. Ross McCluney (2004, slide 24),
rincipal Research Scientist at the Florida Solar
nergy Center, put it bluntly, “My warning of
oday: We are systematically taking apart the life-
support system of Planet Earth. We’ve exceeded
he sustainable carrying capacity of the planet by
a factor of 3. For everyone to live like the average
North American it would take three Earths.”
• indsey Grant (2005, p. 17), author of e
o apsing Bu e: Growt an Fossi Energy and
he former U.S. Deputy Assistant Secretary of State
for Environment and Population Affairs, states,
The [population of the] less developed world has
rown by two-thirds since 1950—and they were
poor in 1950. The need for a fundamental shift in
he ratio of resources to people in the poor countries
may itself justify an optimum world population
gure of one billion. Barring a catastrophe, it might
8/2/2019 Tsc 17 3 Duncan
http://slidepdf.com/reader/full/tsc-17-3-duncan 3/11
143
SPRING 2007 THE SOCIAL CONTRACT
take centuries to reach such figures, even with a
determined worldwide effort.”
• Dale Allen Pfeiffer (2006, p. 1), author of
Eating Fossil Fuels: Oil, Food and the Coming
Crisis in Agricu ture, writes, “Studies suggest
that without fossil fuel based agriculture, the U.S.
could only sustain about two thirds of its present population. For the planet as a whole, the sustainable
number is estimated to be about two billion.”
• Paul Thompson (2006, p. 6), author of e
Twi ig t o t e Mo ern Wor : T e Four Stages o
t e Post-Oi Brea own, describes the final stages
of collapse, “Sooner or later, all the remains of our
existing society will have gone, to become weed-clad
ruins to rival those of the Aztecs and Mayans. By now,
everybody who is unable to convert to a sustainable,
self-sufficient lifestyle would have died off, leaving
only those living in independent communities to
continue human history. The world population may
have fallen to as few as a thousand million, scattered
in oases of agricultural land amongst deserts of
buildings, rusting vehicles and forests.”
Colin J. Campbell (2005, p. 315) gently but
firmly sums it up: “We will have to change the way
we live as [oil] production declines toward eventual
exhaustion. I stress that it is the onset of terminal
decline that is more relevant than the end of oil
itself. It is not too soon to start thinking about whatthat may entail.”
he Attractiveness Principle
ien Venidos A Oregon4
elcome to Oregon. And they are sure
coming! ! ! ! !
ails, medical facilities, schools, and
elfare agencies overwhelmed. We are
etting buried. But somehow people
don’t catch on that the last thing we needis more people.
hen I came to Eugene in 1957—
population 33,000—now 144,000 and no
end in sight. Crime, traffic jams, the most
fertile land in Oregon paved over.
e are surely the frog-in-the-kettle with
it slowly coming to the boil. I think we are
already cooked. But, as you can see from
this ad, there is no grasp of that situation
here.…
I am going to say my piece, get out of
the front line trenches, and watch the
coming debacle from as safe a distance as
possible—but really no safe distance as
we are all caught in the coming tide, andthe system as it begins to break down.
alter Youngquist
(Letter, 11/24/05)
Jay W. Forrester in the 1950’s invented system
dynamics to model the behavior of complex social
systems. In 1956 he started the System Dynamics
Group at the Sloan School of Management at MIT. In
1970 he described his research in urban dynamics at
he U.S. House of Representatives. “Why can public
services not get ahead of demands? Why do the best
of intentions for improving a city lead, instead, to
reater social pressures, more commuting delays,
increased drug addiction, higher crime rates, and
reater welfare loads? The answer lies in what we
have come to call the ‘attractiveness principle’.”
The attractiveness principle states that,
to any particular population class, all
geographical areas tend to become
equally attractive. Or perhaps more
realistically stated, all areas tend to become equally unattractive. Why do all
areas tend toward equal attractiveness? I
use “attractiveness” to encompass every
aspect of a city that contributes to its
desirability or undesirability. Population
movement is an equalizing process. As
people move toward a more attractive
area, they drive up prices and overload
the job opportunities, the environmental
capacity, the available housing, and thegovernmental services. In other words,
rising population drives down all of the
characteristics of an area that made it
initially attractive (Forrester, 1975, pp.
275-76).
While running Forrester’s Wor Dynamics
model—I found that his natural resource use per
capita variable (nr/pop) and his material standard
8/2/2019 Tsc 17 3 Duncan
http://slidepdf.com/reader/full/tsc-17-3-duncan 4/11
SPRING 2007 HE SOCIAL CONTRACT
144
of living per capita variable (MSL) are nearly equal
over the 400-year time span from 1900 to 2300.
Further, the SL variable in Wor Dynamics is a
surrogate for e in the Olduvai theory.Attraction (A)
is a difference between MSL values. In this manner
Forrester’s attractiveness principle can be applied
to the U.S. and the rest of the world (RoW) as in thefollowing example.
n 2005 the U.S. population was 297 million
(4.6 percent of the world total) and that of the rest of
the world (RoW) was 6,154 million (95.4 percent).
The MSL for the U.S. was the 57.7 boe/c. The
MSL for the RoW was 9.8 boe/c. It follows that the
attraction (A) from the RoW to the U.S. in 2005 was
47.9 boe/c. The attractiveness principle anticipates
that vast numbers of
illegal immigrants will
continue to enter and
settle in the U.S. until
the MSL of the U.S. falls
to that of the RoW—
or—until existing U.S.
laws are enforced.
e’ll approximate
the magnitude of the
problem by assuming
that: [1] all population
numbers (Pop) remainat their 2005 levels through 2030, [2] the MSL of
the U.S. remains at 57.7 boe/c, and [3] the MSL of
the RoW begins at 9.8 boe/c in 2005. Then we’ll
compute to see if it’s possible to increase the MSL
of the RoW in year 2030 by a stated amount in each
of the following cases:
• To raise the MSL of the RoW from 9.8 in
2005 to 57.7 boe/c in 2030 would require world
energy production to increase by a factor of 4.8:
Impossi e.
• To raise the MSL of the RoW to 28.8 (50 percent of 57.7) in 2030 would require world
energy production to increase by a factor of 2.5:
Impossi e.
• To raise the MSL of the RoW to 14.4 (25
percent of 57.7) in 2030 would require world
energy production to increase by a factor of 1.4:
Impro a e.
Paul Thompson’s website (2006) is forthright.
People in Third World countries, like Mexico, will
do the only human thing, the thing we all would do
in their circumstances—try to get into countries they
perceive have wealth and jobs. The army, without
oil will be unable to defend the borders. The sight
of poor desperate people being shot in order to keephem out will not be pretty.”
eak Oil
Ask anyone who remembers the 1980
crisis…. In 1980 it was a problem in
distribution; the oil was there, but it wasn’t
getting to the corner gas station. In 2008,
the oil won’t be there. The psychological
realization that the change is permanent
may be as devastating as the shortageitself.
Kenneth S. Deffeyes
(2003, p. 186)
Geologist Walter Youngquist and I have made a
series of ten forecasts of world oil production—one
per year over 10 years. One of the forecasts put the
world peak at 2005; two put it at 2006, six at 2007,
and one at 2008. System dynamics software was
used. We call our approach “encircling the peak of
world oil production” because—right or wrong— our forecasts for the world oil peak kept converging
on 2007. Hence we can now look back to see if the
oil production data support our forecasts.
Worldwide crude oil and condensate production
averaged 72.5 million barrels per day in 2006
compared to 72.4 in 2005. (Radler, 2006) The result
was an increase of 0.17 percent in 2006 over 2005.
The importance of that minute increase becomes
clear when we put it into context, as follows.
From 2003 to 2004 world oil production
increased by 4.0 percent. Next from 2004 to 2005 it
increased by 1.1 percent. (BP, 2006) And from 2005
o 2006 it increased by a mere 0.17 percent. (Radler,
ibid) Thus in recent years the oil production rates
have gone from strong growth to near zero growth.
This rapid necking down of world oil production
suggests that the peak is likely to occur in 2006,
007 or 2008.
8/2/2019 Tsc 17 3 Duncan
http://slidepdf.com/reader/full/tsc-17-3-duncan 5/11
145
SPRING 2007 THE SOCIAL CONTRACT
. S. Deffeyes (2003, p. 158) highlights:
There is nothing plausible that could postpone the
peak until 2009. Get used to it.”
eremy K. Leggett (2005, cover) foresees an
unprecedented crisis:
The oil topping point—the day half of
all the world’s oil is used up—will be
eached, by many calculations, sometime
soon. In fact, it may already be upon
us. When the financial markets realize
hat’s happening, an economic crash
and soaring energy prices will result. The
entire global market place we all inhabit
ill crack and crumble.
.S. Fuel Stages Anticipate
World Fuel Stages
Before taking on [oil] data for the whole
world, let’s begin with the United States.
The purpose is to gain some perspective
by looking at a mature area. Validating the
method in a well-explored area gives us
some confidence when approaching the less
mature world picture.7
enneth S. Deffeyes
(2003, pp. 139-140)
ominant ue stage is said to occur when
the production of one kind of fuel is significantly
reater than that of another kind of fuel. Take coal
and oil for example. When coal production exceeds
oil production—then coal is said to be the dominant
fuel: i.e., “a coal stage”. But when oil production of
exceeds coal production—then the opposite is true:
an oil stage”.
f the sequence of fuel stages of one nation
(1) is the same as that of another nation, and (2)
each stage of the first nation precedes the respec-tive stage of the second nation—then the dominant
stages of the first nation can be used to help forecast
the dominant stages of the second nation. Extend-
ing this idea: The istoric fuel stages of the U.S. are
an invaluable guide to forecast the future fuel stages
of the world.
Dominant Fue Stages o t e U.S.: Wood (bio-
mass) was the dominant U.S. fuel up until 1886
(stage 1). Next coal production dominated from
1886 to 1951 (stage 2, 65 years). Then oil domi-
nated from 1951 to 1986 (stage 3, 35 years). Subse-
quently the U.S. has gone back to coal as its domi-
nant fuel (stage 4, ongoing). Moreover, U.S. coal
production is increasing while U.S. oil productionis decreasing.
Dominant Fuel Stages of the World: Wood
(biomass) was the dominant world fuel up until
about 1900 (stage 1). Then coal dominated from
1900 to 1963 (stage 2, 63 years). Next oil domi-
nated from 1963 to end 2005 (stage 3, ongoing but
decelerating—as discussed above).
T e ar coa acts: (1) China burned 36.1 per-cent of the coal that was consumed in 2005, (2) the
U.S. burned 19.6 percent, and (3) India 7.3 percent.
urther: (4) the world’s coal reserves are nearly 3
imes its oil reserves, and (5) world coal produc-
ion from 2000 to end 2005 grew at an average of
.8 percent/y compared to oil’s 1.6 percent/y. (BP,
006) All this suggests that the world will regress to
coal as its dominant fuel in the near future.
K. Bradsher and D. Barboza (2006) report that
very fine coal dust originating in China, containing
arsenic and other toxic elements, is now detecteddrifting around the globe in increasing amounts.
K. S. Deffeyes (2003, p. 173) cautions: “Coal
is the worst possible fossil fuel. Most of the fuel
value comes from carbon, with the carbon dioxide
added to the atmosphere. Sulfur and mercury are
difficult to remove from coal; they are released to
he air in ordinary burning.”
8/2/2019 Tsc 17 3 Duncan
http://slidepdf.com/reader/full/tsc-17-3-duncan 6/11
SPRING 2007 HE SOCIAL CONTRACT
146
. K. Leggett (2005, pp. x-xi) writes: “Richer
humans dispatched poorer humans underground to
hack out the coal.... Many died as rock faces col-
lapsed, water flooded into mines, or invisible and
odorless methane gas built up and exploded. If they
survived their job, many would spend what re-
mained of their short lives fighting for each breath,their lungs clogged with [coal] dust.”
.S. e Intervals Anticipate
Olduvai e Intervals
s the British historian,
Toynbee, wrote “The U.S.
ill set a record in the rate of
ise—and a of an empire.”
etween wide open bordersand fall of the dollar and
rowing population against a
declining resource base, the
nited States will be defeated
from within. Mobs will rule
he streets in the nation that
is now the third largest in the
orld—right behind China
and India—and unable to
support its population except
by taking resources fromother countries.
alter Youngquist
(Letter, 3/20/06)
. Peter W. Winteringham (1992, p. 6) confirms,
In the so-called developed and industrialized
nations, energy is used for almost every aspect of
human activity: heating, lighting, refrigeration,
transport, and every kind of industry, including
agriculture, forestry, fisheries, manufacturing,communications, and construction.... Energy use
per capita] is probably the simplest and most
reliable indicator of the level of development of
technology-based society.”
nergy production is expressed in calorific
equivalents, so-named “barrels of oil equivalent per
year” (boe/y). Thus industrial development (social
change, cultural evolution) can be quantified as
he ratio of energy production and population as e
changes over time: e = Energy/Popu ation 8
The U.S. e equals the ratio of U.S. indigenous
energy production and U.S. population. The Olduvai
e equals the ratio of world energy production and
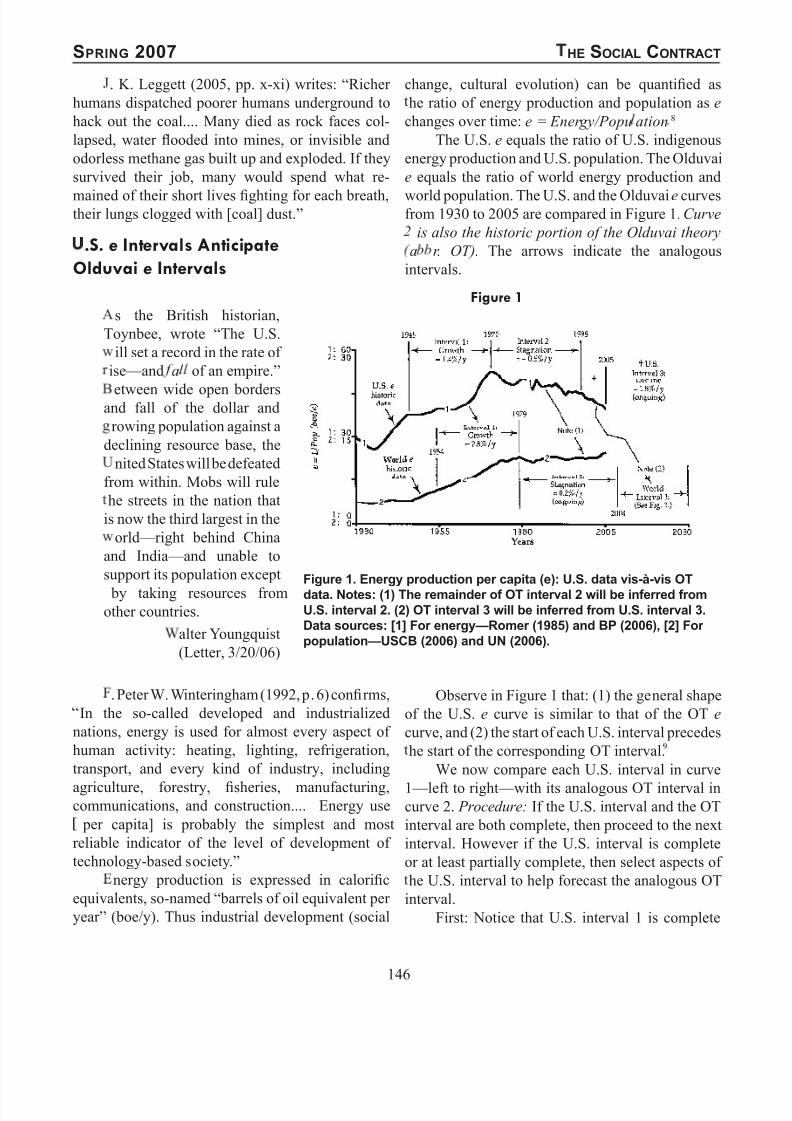
world population. The U.S. and the Olduvai e curvesfrom 1930 to 2005 are compared in Figure 1. Curve
is also the historic portion of the Olduvai theory
a r. OT). The arrows indicate the analogous
intervals.
Observe in Figure 1 that: (1) the general shape
of the U.S. e curve is similar to that of the OT e
curve, and (2) the start of each U.S. interval precedes
he start of the corresponding OT interval.
We now compare each U.S. interval in curve
1—left to right—with its analogous OT interval incurve 2. Procedure: If the U.S. interval and the OT
interval are both complete, then proceed to the next
interval. However if the U.S. interval is complete
or at least partially complete, then select aspects of
he U.S. interval to help forecast the analogous OT
interval.
First: Notice that U.S. interval 1 is complete
Figure 1. Energy production per capita (e): U.S. data vis-à-vis OT
data. Notes: (1) The remainder of OT interval 2 will be inferred from
U.S. interval 2. (2) OT interval 3 will be inferred from U.S. interval 3.
Data sources: [1] For energy—Romer (1985) and BP (2006), [2] For
population—USCB (2006) and UN (2006).
Figure 1
8/2/2019 Tsc 17 3 Duncan
http://slidepdf.com/reader/full/tsc-17-3-duncan 7/11
147
SPRING 2007 THE SOCIAL CONTRACT
and it preceded OT interval 1 that is also complete.
Hence proceed to the next interval.
econd: Observe that U.S. interval 2 is
complete and it began 9 years before OT interval
2. As a result we will use U.S. interval 2 to help
forecast the missing portion of OT interval 2. This
will be done later.Third: Notice that U.S. interval 3 began in
1998, but OT interval 3 has not yet begun—so we
will use the existing 7-year portion of U.S. interval
3—and other information—to forecast OT interval
3. This too will be done later.
mportant comparisons of the U.S. and OT
intervals in Figure 1:
• nterval 1 (growth): U.S. interval 1 and OT
interval 1 are both complete and show solid growth
(U.S. growth was 1.4 percent/y and OT growth was
2.8 percent/y).• nterval 2 (stagnation): The U.S. interval
2 and the OT interval 2 both show stagnation (the
U.S. stagnated at a negative 0.6 percent/y and the
OT stagnated at a positive 0.2 percent/y). Further,
the U.S. interval 2 is complete at 28 years, while
OT interval 2 (the “plateau”) is still ongoing after
26 years.
• nterval 3 (terminal decline): The U.S.
decline began in 1998 and shows a decrease of 1.8
percent/y for 7 years. The OT decline has not yet
begun.
Looking ahead: The historic data, the two
analogies, and all of the other information discussed
above are the basis to forecast the remainder of OTinterval 2 and all of OT interval 3, as shown and
explained below.
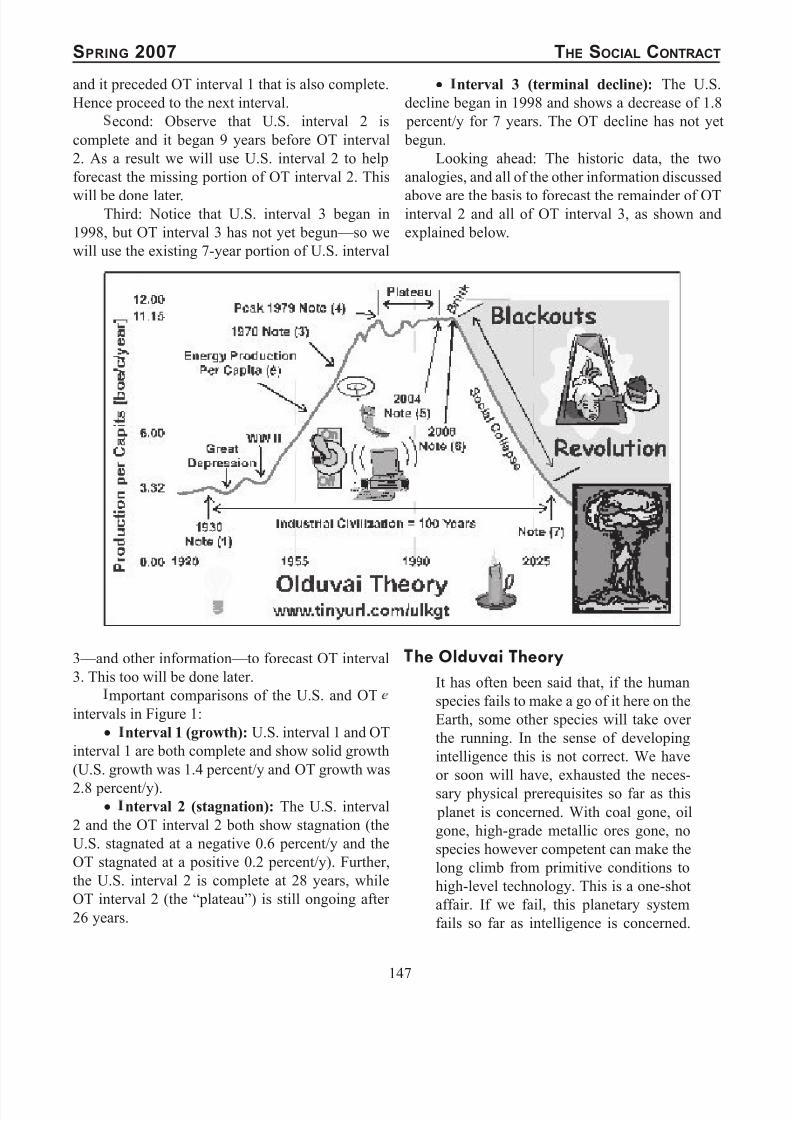
he Olduvai Theory
It has often been said that, if the human
species fails to make a go of it here on the
Earth, some other species will take over
the running. In the sense of developing
intelligence this is not correct. We have
or soon will have, exhausted the neces-
sary physical prerequisites so far as this
planet is concerned. With coal gone, oil
gone, high-grade metallic ores gone, no
species however competent can make the
long climb from primitive conditions to
high-level technology. This is a one-shot
affair. If we fail, this planetary system
fails so far as intelligence is concerned.
8/2/2019 Tsc 17 3 Duncan
http://slidepdf.com/reader/full/tsc-17-3-duncan 8/11
SPRING 2007 HE SOCIAL CONTRACT
148
The same will be true of other planetary
systems. On each of them there will be
one chance, and one chance only.
Sir Fred Hoyle
(1964, page 64)
The idea that high civilization is likely to over-shoot and collapse has a fascinating history dating
back at least to the Greek lyric poet Pindar (c. 500
BCE) and continuing right up to the present (Dun-
can, 2001).
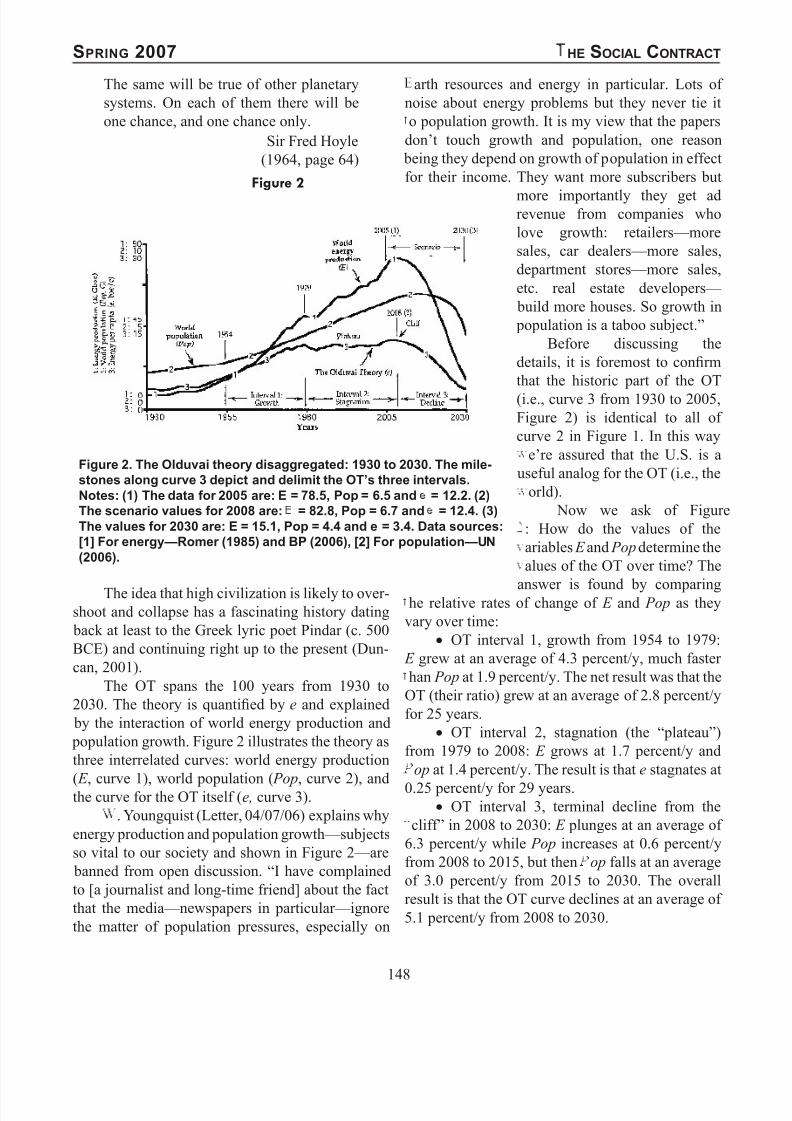
The OT spans the 100 years from 1930 to
2030. The theory is quantified by e and explained
by the interaction of world energy production and
population growth. Figure 2 illustrates the theory as
three interrelated curves: world energy production
( E , curve 1), world population ( Pop, curve 2), andthe curve for the OT itself (e, curve 3).
. Youngquist (Letter, 04/07/06) explains why
energy production and population growth—subjects
so vital to our society and shown in Figure 2—are
banned from open discussion. “I have complained
to [a journalist and long-time friend] about the fact
that the media—newspapers in particular—ignore
the matter of population pressures, especially on
arth resources and energy in particular. Lots of
noise about energy problems but they never tie it
o population growth. It is my view that the papers
don’t touch growth and population, one reason
being they depend on growth of population in effect
for their income. They want more subscribers but
more importantly they get adrevenue from companies who
love growth: retailers—more
sales, car dealers—more sales,
department stores—more sales,
etc. real estate developers—
build more houses. So growth in
population is a taboo subject.”
Before discussing the
details, it is foremost to confirm
that the historic part of the OT
(i.e., curve 3 from 1930 to 2005,
Figure 2) is identical to all of
curve 2 in Figure 1. In this way
e’re assured that the U.S. is a
useful analog for the OT (i.e., the
orld).
Now we ask of Figure
: How do the values of the
ariables E and Pop determine the
alues of the OT over time? The
answer is found by comparinghe relative rates of change of E and Pop as they
vary over time:
• OT interval 1, growth from 1954 to 1979:
E grew at an average of 4.3 percent/y, much faster
han Pop at 1.9 percent/y. The net result was that the
OT (their ratio) grew at an average of 2.8 percent/y
for 25 years.
• OT interval 2, stagnation (the “plateau”)
from 1979 to 2008: E grows at 1.7 percent/y and
op at 1.4 percent/y. The result is that e stagnates at
0.25 percent/y for 29 years.• OT interval 3, terminal decline from the
cliff” in 2008 to 2030: E plunges at an average of
6.3 percent/y while Pop increases at 0.6 percent/y
from 2008 to 2015, but then op falls at an average
of 3.0 percent/y from 2015 to 2030. The overall
result is that the OT curve declines at an average of
5.1 percent/y from 2008 to 2030.
Figure 2
Figure 2. The Olduvai theory disaggregated: 1930 to 2030. The mile-
stones along curve 3 depict and delimit the OT’s three intervals.
Notes: (1) The data for 2005 are: E = 78.5, Pop = 6.5 and = 12.2. (2)
The scenario values for 2008 are: = 82.8, Pop = 6.7 and = 12.4. (3)
The values for 2030 are: E = 15.1, Pop = 4.4 and e = 3.4. Data sources:
[1] For energy—Romer (1985) and BP (2006), [2] For population—UN
(2006).
8/2/2019 Tsc 17 3 Duncan
http://slidepdf.com/reader/full/tsc-17-3-duncan 9/11
149
SPRING 2007 THE SOCIAL CONTRACT
y reviewing Figures 1 and 2 and relevant
parts of the text we can distinguish: First, what we
know from historic data, second from what we infer
from that data, and third from what is hypothetical.
irst, we now from historic data that: [1]
world oil production decelerated from 2003 to end
2006, [2] meanwhile world population grew at 1.2 percent/y, [3] the three most populous nations in the
world were also the top coal burners, and [4] world
coal production from 2000 to 2005 grew 3 times
faster than world oil production. We also know that:
5] OT interval 2 (stagnation) grew at a scant 0.21
percent/y from 1979 to 2005. Finally we know that:
6] the U.S. interval 3 (terminal decline) decreased
at an average of 1.8 percent/y from 1998 to 2005.
econd, we in er from our oil forecasts and
from the recent trends that: [1] world oil production
is likely to peak before 2009. We infer from
the world’s coal reserves that: [2] world energy
consumption will soon be dominated by coal.
Further we infer from the U.S. interval 3 that: [3]
the OT interval 3 (terminal decline) is imminent,
and [4] it will be much steeper than was the U.S.
decline.10
Third, the OT scenario is ypot etica
Of course an infinite number of scenarios
are possible, but each is constrained by three
conditions. [1] The curves for each scenario mustmeld with their respective data curves at 2005. [2]
The OT requires that—sooner or later—the world
population will decline to a sustainable 0.5 to 2.0
billion. [3] The value of e for the OT will approach
3.4 boe/c in 2030—the same value that it had in
1930.
rinkmanship—sad to say—is our de facto
policy
The OT is widely discussed and debated. Search
the web for “olduvai theory” to access various web
sites and newsgroups.igorous tests of the theory are most welcome.
Conclusions
The OlduvaI theory states that the life
expectancy of industrial civilization is approximately
100 years: c. 1930 to 2030. Ackerman’s law defines
it: e = Energy/Population. Its duration is starts the
year e reaches 30 percent of its average plateau
value and ends the year e falls back to that value.
Five postulates follow:
1. The exponential growth of world energy
production ended in 1970.
2. U.S. intervals anticipate Olduvaiintervals: (1) growth, (2) stagnation, and
(3) terminal decline.
3. The terminal decline of industrial
civilization will begin circa 2008-2012.
4. Brownouts and blackouts are reliable
leading indicators of terminal decline.
5. World population will decline proximate
with e.
Postu ate 1 as een verifie .(Duncan, 2005-
006, pp. 138-139.)All of the U.S. e intervals precede the Olduvai
e intervals and are analogous to them. Postu ate 2
is verifie or O uvai interva 1 an or 26 years o
O uvai interva 2.
The beginning of Olduvai interval 3 (terminal
decline) was inferred from: [1] U.S. e interval
3, [2] our series of forecasts of peak oil, [3] the
recent deceleration of world oil production, and
4] the rapid acceleration of world coal production.
Postulate 3 can be tested within about 8 years.
Postu ate 4: Increasing brownouts and
blackouts were predicted in my previous essays
(see Duncan, 2000, 2001, 2005-2006). Readers can
study this ominous trend by searching the web for
blackouts” + “electricity”.
Postu ate 5 waits testing.
rap up: It took Homo sapiens over 200 years
o accept the Copernican theory and the species
has yet to accommodate the Darwinian theory.
Consequently I see little chance that it will face the
looming decline of industrial civilization in time tochange course. ■
Acknowledgments
Walter Youngquist’s knowledge, wisdom, and
good humor have helped me over many an impasse.
eith Wilde, Virginia Abernethy, David Burghardt,
ark Lindley, David Pimentel, Robert Hickerson, Lee
ohnson, and Roy DeBritz have helped in many ways.
8/2/2019 Tsc 17 3 Duncan
http://slidepdf.com/reader/full/tsc-17-3-duncan 10/11
SPRING 2007 HE SOCIAL CONTRACT
150
Richard Pelto and Patrick McNally provided important
suggestions. Joe McMullen and Gerald Sehlke affirmed
the importance of the system dynamics approach. Brian
Bloom, Eugene Marner, and Hiroaki Wakabayashi
helped answer (their own) tough questions. The web sites
of Jay Hanson, Tom Robertson, Ron Swenson, and Paul
Thompson have brought forth a wealth of comments and
suggestions.
nd Notes
1. The Olduvai Gorge is located in northern Tanzania
and commonly called “The Cradle of Mankind”. It is a
very steep sided ravine (a k a “the cliff”) some 30 miles
long and 300 feet deep. Exposed deposits show rich fossil
fauna, many hominid remains and items belonging to
one of the oldest stone tool industries, called Olduwan.
I visited there in 1989 and chose the name as the theme
for the theory.2. The standard definition of a pulse calls for “30
percent of the peak.” However the world e has not gone
into a peak, but rather a “broad plateau” wherein its
average value is 11.4 boe/c. Then 30 percent of 11.4 is
3.4. Thus we arrive at 3.4 boe/c as the beginning and
ending values of e for industrial civilization, a k a “the
Olduvai theory.”
3. For completeness I’ve estimated energy
production back to its beginnings: Coal was first
burned in England in the eleventh century and it was
the first hydrocarbon used for doing mechanical work
in about 1700. Natural gas was used for street lightingin Fredonia, New York in 1821. Oil was produced from
shovel-dug pits in the Chechen Republic before 1833.
Oil was first produced from a drilled well near Titusville,
Pennsylvania in 1859. Hydroelectricity lit Niagara Falls
Village in 1881. Nuclear electricity from an experimental
breeder reactor lit several buildings near Arco, Idaho in
1951. Nuclear electricity fed a power grid in the USSR
in 1954, in England in 1955, and in the U.S. in 1956.
. “Bien Venidos A Oregon” is the headline in an
advertisement by station KEZI 9 and published in the
Eugene Register-Guard (11/23/05) that reads, “LaneCounty’s population is growing rapidly. Latino families
make up the largest portion of this new growth. Discover
the challenges our new neighbors face. Tonight @ 6pm
& 11pm.”
5. Energy consumption per capita must be used to
calculate the material standard of living of a nation (i.e.,
indigenous energy production plus imports).
6. Population migrations, of course, are also caused
by sporadic events such as war, famine, and ethnic
violence. However the attractiveness principle operates
incessantly—day-after-day and year-after-year.
7. Similar statements apply to natural gas, coal,
nuclear electricity, and hydroelectricity.
8. Frederick Ackerman in 1932 was first to discover
he importance of e and Leslie White independently
discovered it in 1943. (Duncan, 2005-2006.)
9. In the vernacular, “As goes the U.S.—so goes
he world.”
10. The Olduvai interval 3 (terminal decline)
is expected to be much steeper than the U.S. decline
because it won’t be moderated by energy imports.
Definitions
“Analogue” means the likening of one thing to
another on the basis of some similarity between the two.
Scenario” means an outline for any projected series of
events, real or imagined. “Imminent” means within about
6 years. “Brinkmanship” means the policy of pursuing a
hazardous course of action to the brink of catastrophe.
Energy” (E) means the combined production of oil,
natural gas, coal, nuclear electricity and hydroelectricity.
Pop” means population. “e” means energy production
per capita. ”G” means billion. “Gb” means billion barrels
of oil. “Gboe” means billion barrels of oil equivalent
(in joules). “RoW” means rest of world (e.g., the world
minus the U.S.). “Cliff” means the year that industrial
civilization goes into terminal decline. “Brink” and
cliff” are synonymous. All equations and variable
names are italicized.
References
BP (2006). British Petroleum statistical review of
world energy June 2006. www.bp.com.
Bradsher, K. and Barboza, D. (2006). Pollution
from Chinese coal casts shadow around globe. www.
nytimes.com, June 11.
Campbell, C. J. (2005). Oil Crisis. Essex, UK:
ulti-Science Publishing Co.
Deffeyes, K. S. (2001, 2003). Hubbert’s Peak: The
mpending World Oil Shortage. Princeton, NJ: PrincetonUniversity Press.
Duncan, R. C. (1989). Evolution, technology, and
he natural environment: A unified theory of human
history. Proceedings of the American Society for
ngineering Education: Science, Technology, & Society,
14B1-11 to 14B1-20.
Duncan, R. C. (2000). The peak of world oil
production and the road to the Olduvai Gorge. Geological
Society of America Summit 2000, Pardee Keynote
8/2/2019 Tsc 17 3 Duncan
http://slidepdf.com/reader/full/tsc-17-3-duncan 11/11
151
SPRING 2007 THE SOCIAL CONTRACT
Symposia, Reno, NV, Nov. 13, 13 p.
Duncan, R. C. (2001). World energy production,
population growth, and the road to the Olduvai Gorge.
Population and Environment, 22 (5), May, 503-522.
Duncan, R. C. (2005-2006). The Olduvai theory:
Energy, population, and industrial civilization. The
Social Contract, Winter, XVI (2), 134-144.
Duncan, R. C. and Youngquist, W. (1999).
Encircling the peak of world oil production. Natural
Resources Research, 8 (3), 219-232.
orrester, J. W. (1971, 1973). World Dynamics.
Cambridge, MA: Wright Allen Press.
orrester, J. W. (1975). Collected Papers of Jay W.
Forrester. Cambridge, MA: Wright-Allen Press.
Grant, L. (2005). The Collapsing Bubble: Growth
and Fossil Energy. Santa Anna, CA: Seven Locks Press.
ayden, H. C. (2004). The Solar Fraud: Why Solar
Energy Won’t Run The World. Pueblo West, CO: Vales
Lake Publishing.unstler, J. H. (2005). The Long Emergency:
Surviving the Converging Catastrophes of the Twenty-
First Century. New York: Atlantic Monthly Press.
eggett, J. K. (2005). The Empty Tank: Oil, Gas,
Hot Air, and the Coming Global Financial Catastrophe.
New York: Random House.
McCluney, R. (2004). The Fate of Humanity, slide
24. www.futureofhumanity.org.
Pfeiffer, D. A. (2006). Eating Fossil Fuels: Oil,
ood and the Coming Crisis in Agriculture. www.
newsociety.com/.
Radler, M. (2006). Oil production, reserves
increase slightly in 2006. Oil & Gas Journal, 104 (47),
Dec. 18, 20-23.
Romer, R. H. (1985). Energy Facts and Figures.
Amherst, MA: Spring Street Press.
System Dynamics (2006). http://sysdyn.
clexchange.org/people/jay-forrester.html
Thompson, P. (2006). The twilight of the modern
world: The four stages of the post-oil breakdown. www.
wolfatthedoor.org.uk.
UN (2006). World Population to 2300. United
Nations. www.un.org.
USCB (2006). Total Midyear Population. U.S.Census Bureau. www.census.gov.
Winteringham, F. P. W. (1992). Energy Use and the
nvironment. London: Lewis Publishers.
Youngquist, W. (2005-2006). Letters to R. C.
Duncan.
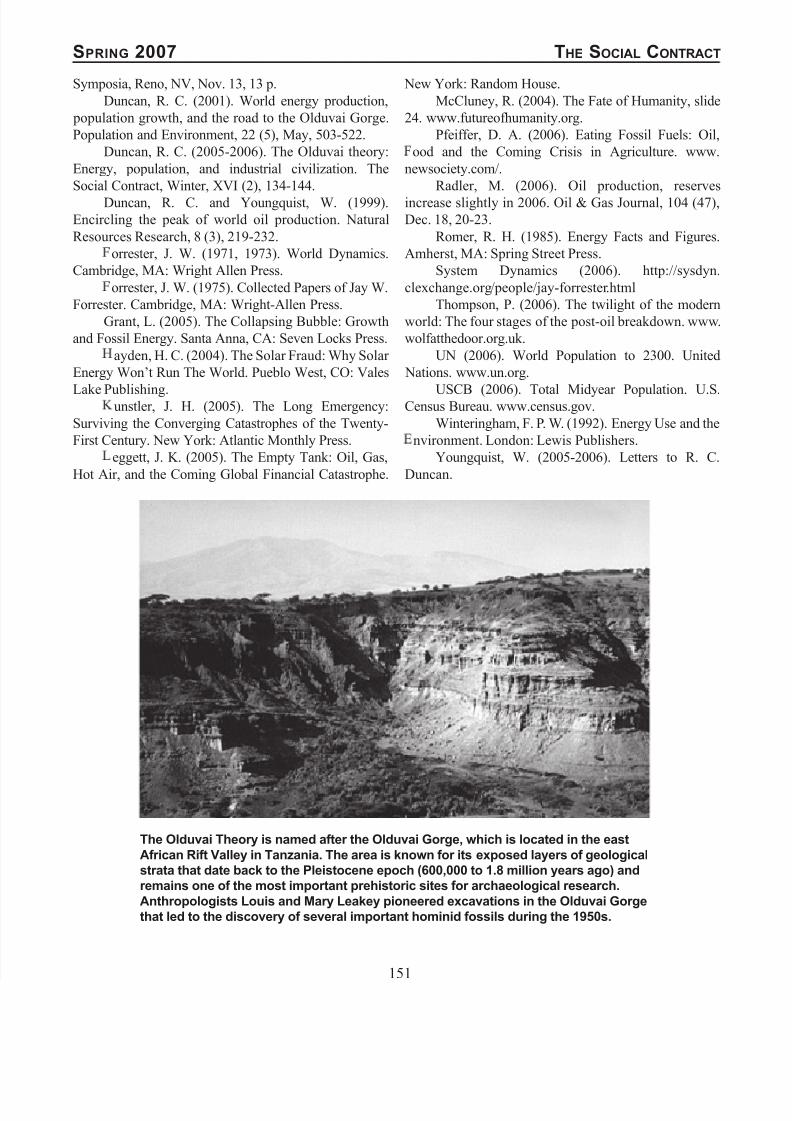
The Olduvai Theory is named after the Olduvai Gorge, which is located in the east
African Rift Valley in Tanzania. The area is known for its exposed layers of geological
strata that date back to the Pleistocene epoch (600,000 to 1.8 million years ago) and
remains one of the most important prehistoric sites for archaeological research.
Anthropologists Louis and Mary Leakey pioneered excavations in the Olduvai Gorge
that led to the discovery of several important hominid fossils during the 1950s.