Embed Size (px)
Citation preview
TSUBAME 2.0 から TSUBAME 2.5、3.0、更にはエクサへの進化
TSUBAME2.0 to 2.5, Towards 3.0
and Exascale
松岡聡・東京工業大学 Satoshi Matsuoka
Tokyo Institute of Technology
TSUBAME2.0
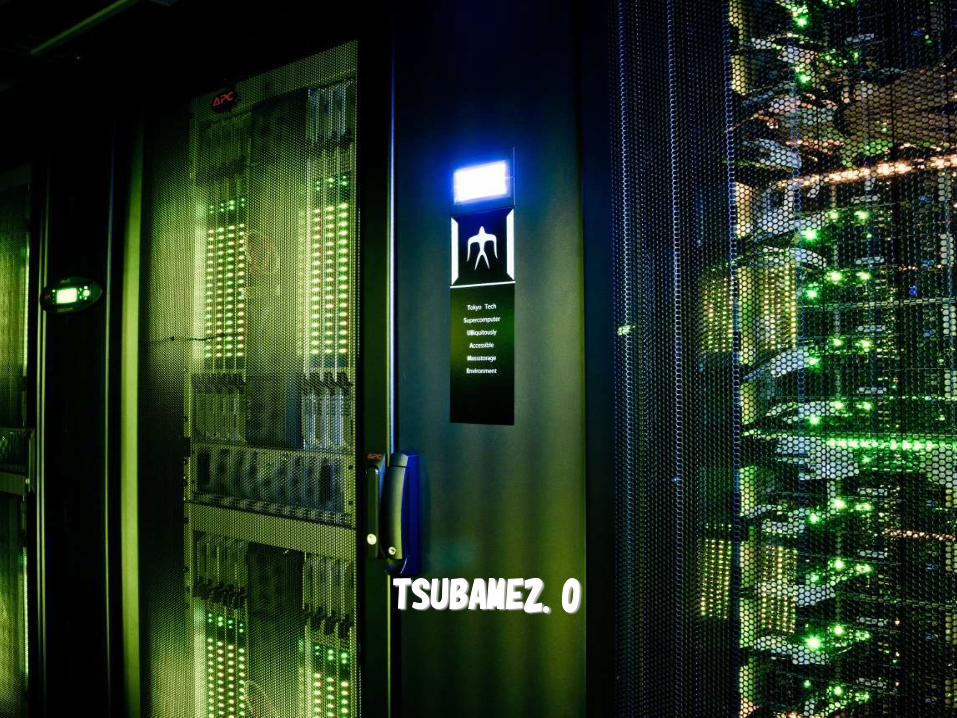
2006: TSUBAME1.0
as No.1 in Japan
>
All University Centers COMBINED 45 TeraFlops
Total 85 TeraFlops,
#7 Top500 June 2006
Earth Simulator
40TeraFlops #1 2002~2004
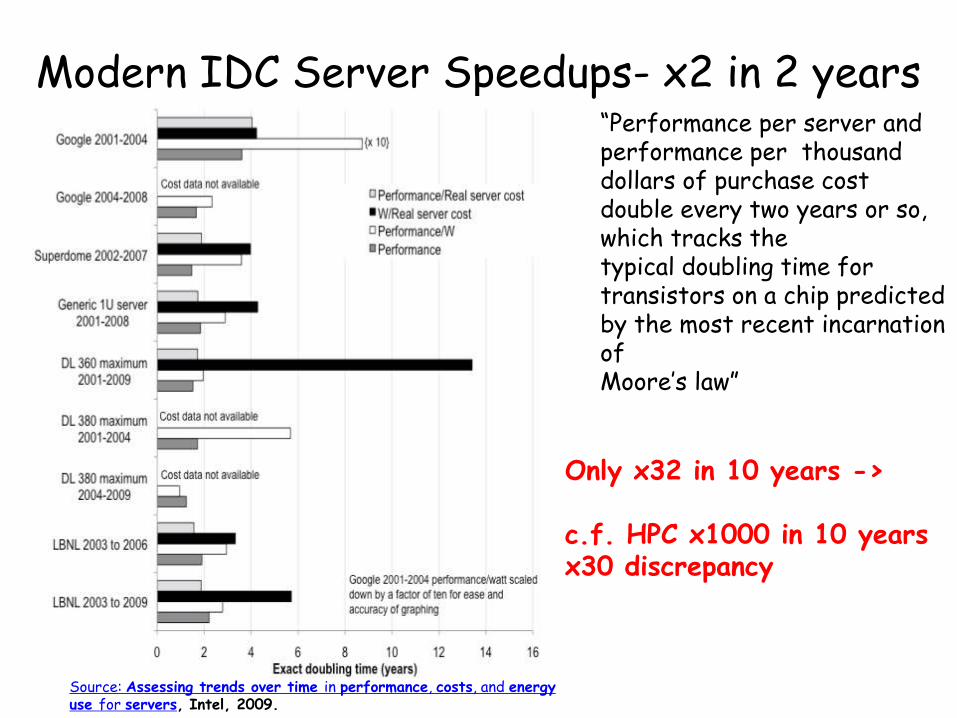
Modern IDC Server Speedups- x2 in 2 years
“Performance per server and performance per thousand dollars of purchase cost double every two years or so, which tracks the typical doubling time for transistors on a chip predicted by the most recent incarnation of Moore’s law”
Only x32 in 10 years -> c.f. HPC x1000 in 10 years x30 discrepancy
Source: Assessing trends over time in performance, costs, and energy use for servers, Intel, 2009.
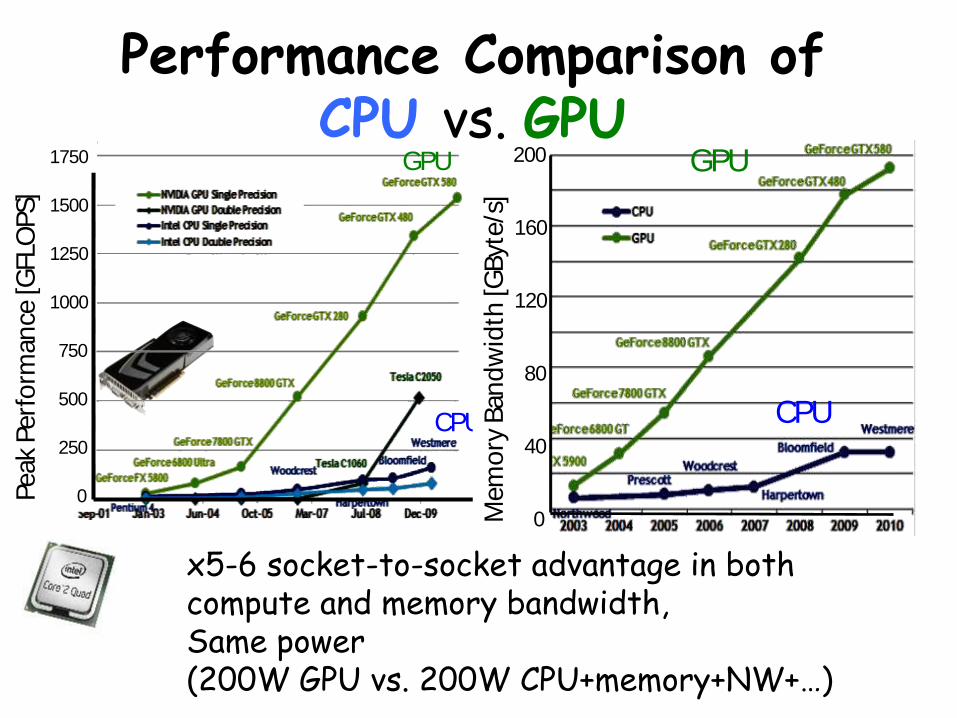
Performance Comparison of CPU vs. GPU
GPU
Pe
ak P
erf
orm
ance
[GFL
OP
S]
1250
1000
750
500
250
0
1500
CPU
1750 GPU
CPU
160
120
200
40
0
80
Me
mo
ry B
and
wid
th [G
Byt
e/s
]
x5-6 socket-to-socket advantage in both compute and memory bandwidth, Same power (200W GPU vs. 200W CPU+memory+NW+…)
NEC Confidential
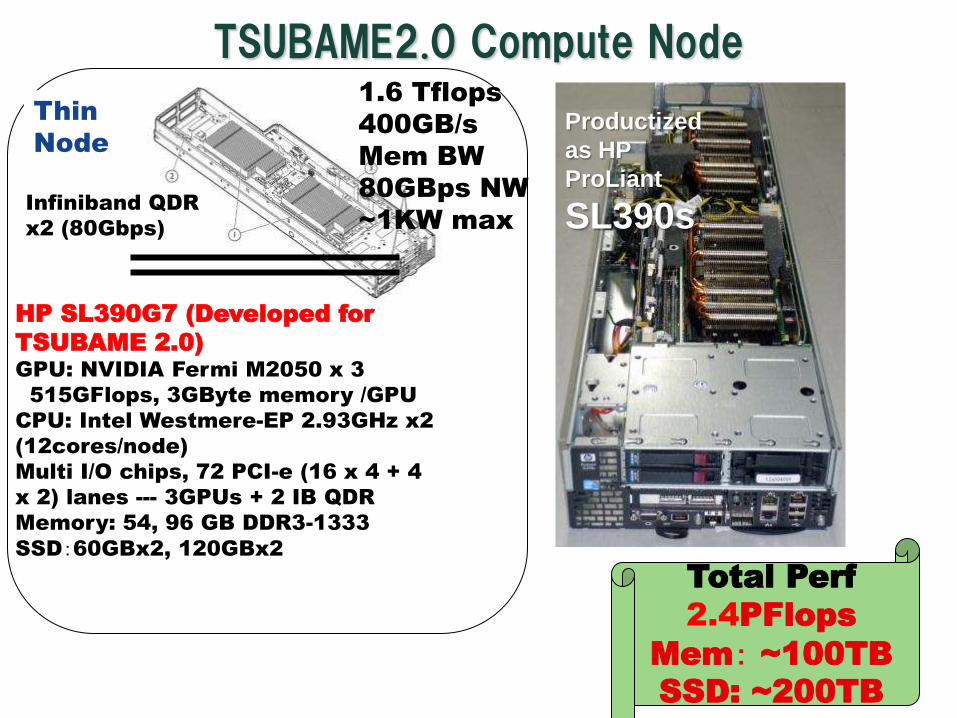
TSUBAME2.0 Compute Node
Total Perf
2.4PFlops
Mem: ~100TB
SSD: ~200TB
HP SL390G7 (Developed for
TSUBAME 2.0)
GPU: NVIDIA Fermi M2050 x 3
515GFlops, 3GByte memory /GPU
CPU: Intel Westmere-EP 2.93GHz x2
(12cores/node)
Multi I/O chips, 72 PCI-e (16 x 4 + 4
x 2) lanes --- 3GPUs + 2 IB QDR
Memory: 54, 96 GB DDR3-1333
SSD:60GBx2, 120GBx2
Thin
Node
Infiniband QDR
x2 (80Gbps)
Productized
as HP
ProLiant
SL390s
1.6 Tflops
400GB/s
Mem BW
80GBps NW
~1KW max
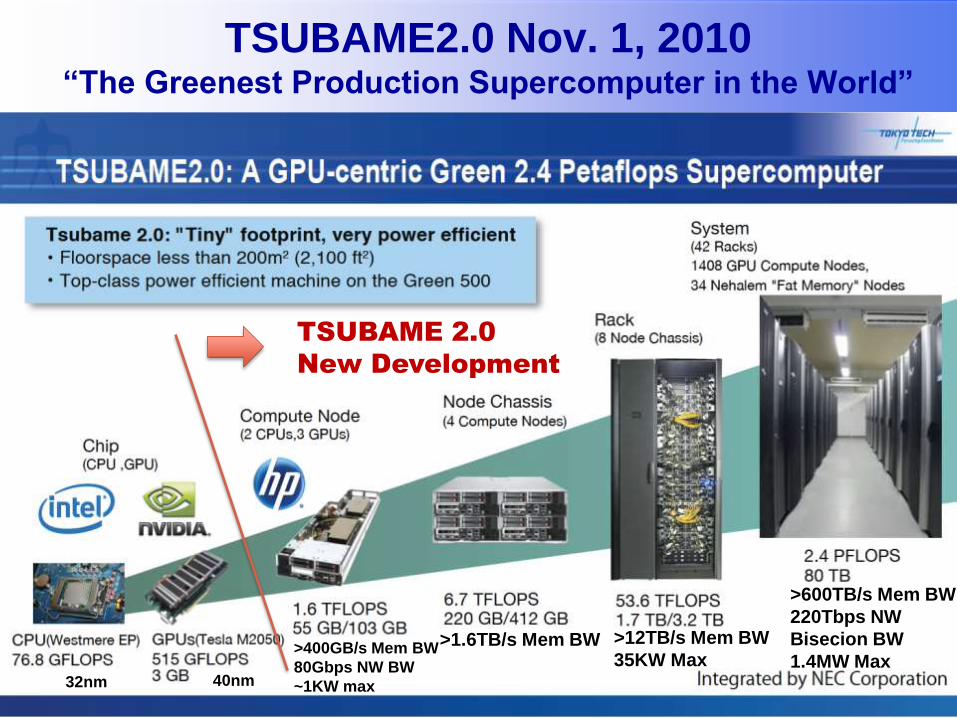
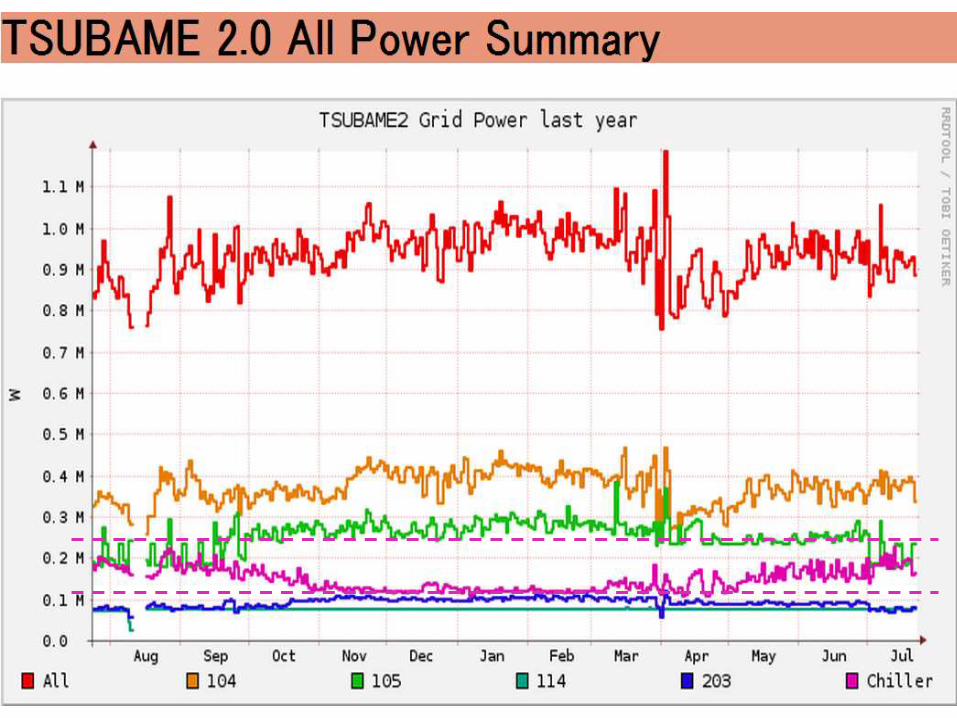
TSUBAME2.0 Nov. 1, 2010 “The Greenest Production Supercomputer in the World”
7
TSUBAME 2.0
New Development
32nm 40nm
>400GB/s Mem BW
80Gbps NW BW
~1KW max
>1.6TB/s Mem BW
>12TB/s Mem BW
35KW Max
>600TB/s Mem BW
220Tbps NW
Bisecion BW
1.4MW Max
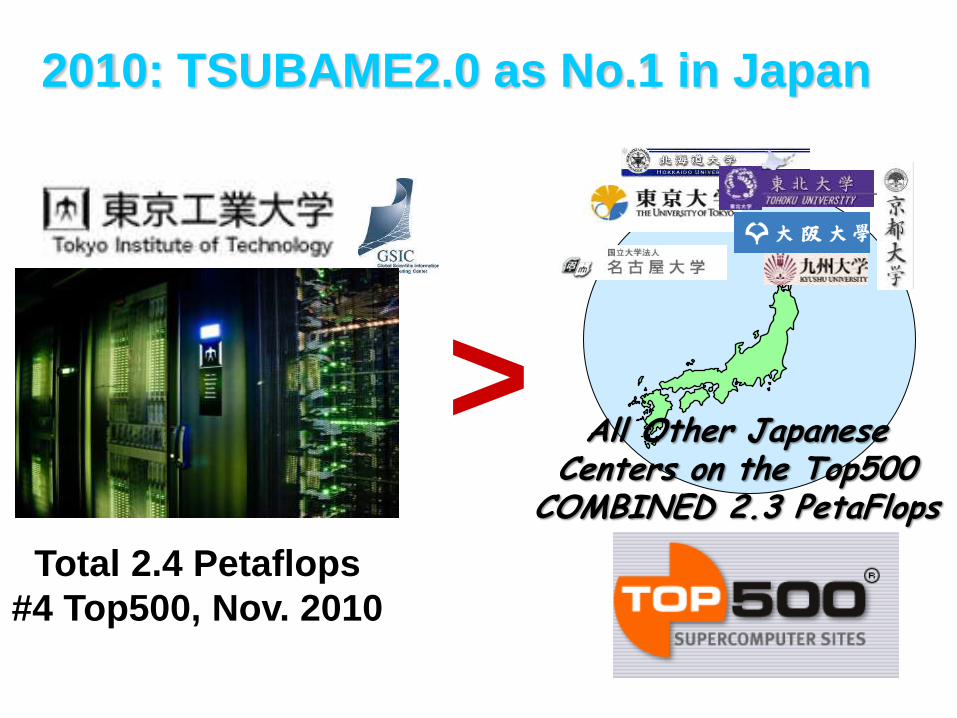
2010: TSUBAME2.0 as No.1 in Japan
> All Other Japanese Centers on the Top500
COMBINED 2.3 PetaFlops
Total 2.4 Petaflops
#4 Top500, Nov. 2010
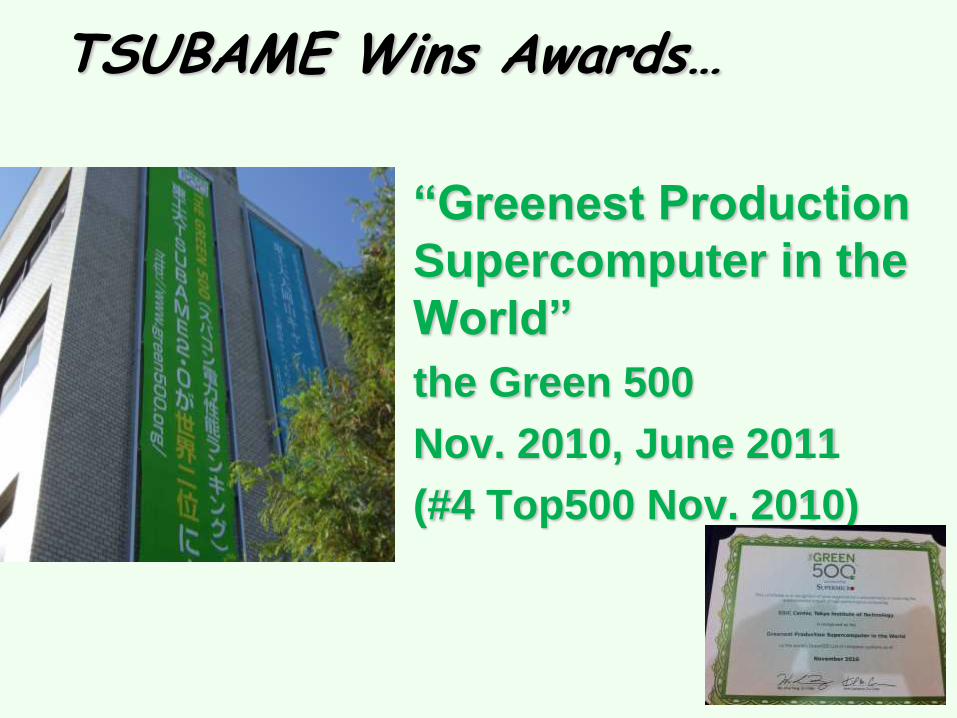
“Greenest Production
Supercomputer in the
World”
the Green 500
Nov. 2010, June 2011
(#4 Top500 Nov. 2010)
TSUBAME Wins Awards…
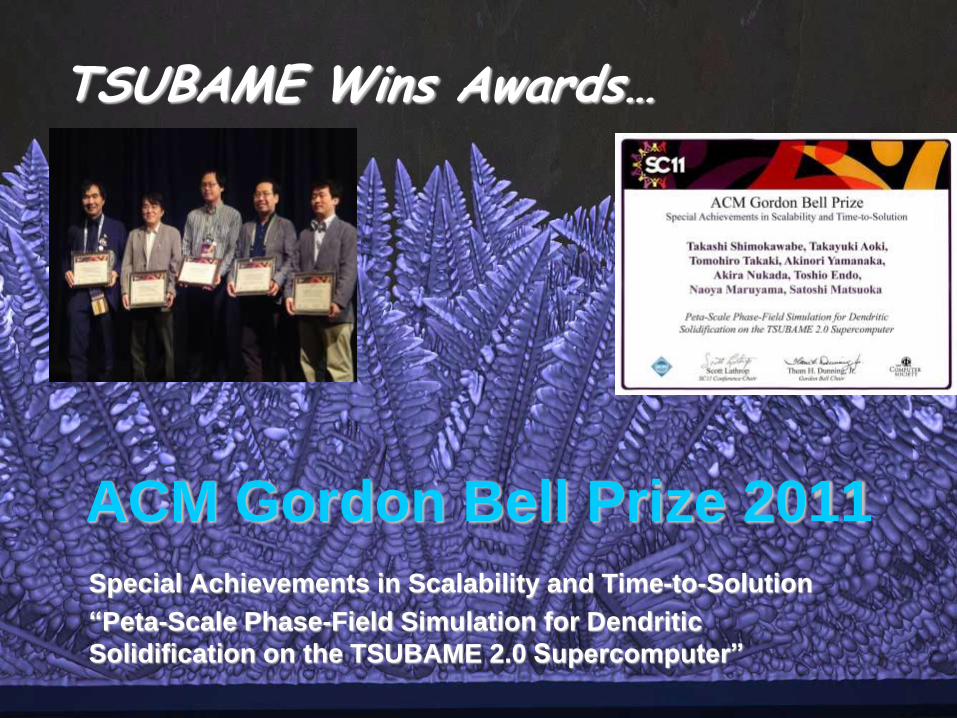
ACM Gordon Bell Prize 2011
TSUBAME Wins Awards…
Special Achievements in Scalability and Time-to-Solution
“Peta-Scale Phase-Field Simulation for Dendritic
Solidification on the TSUBAME 2.0 Supercomputer”

Commendation for Sci &Tech by
Ministry of Education 2012 (文部科学大臣表彰)
Prize for Sci & Tech, Development Category
Development of Greenest Production Peta-scale Supercomputer
Satoshi Matsuoka, Toshio Endo, Takayuki Aoki
TSUBAME Wins Awards…
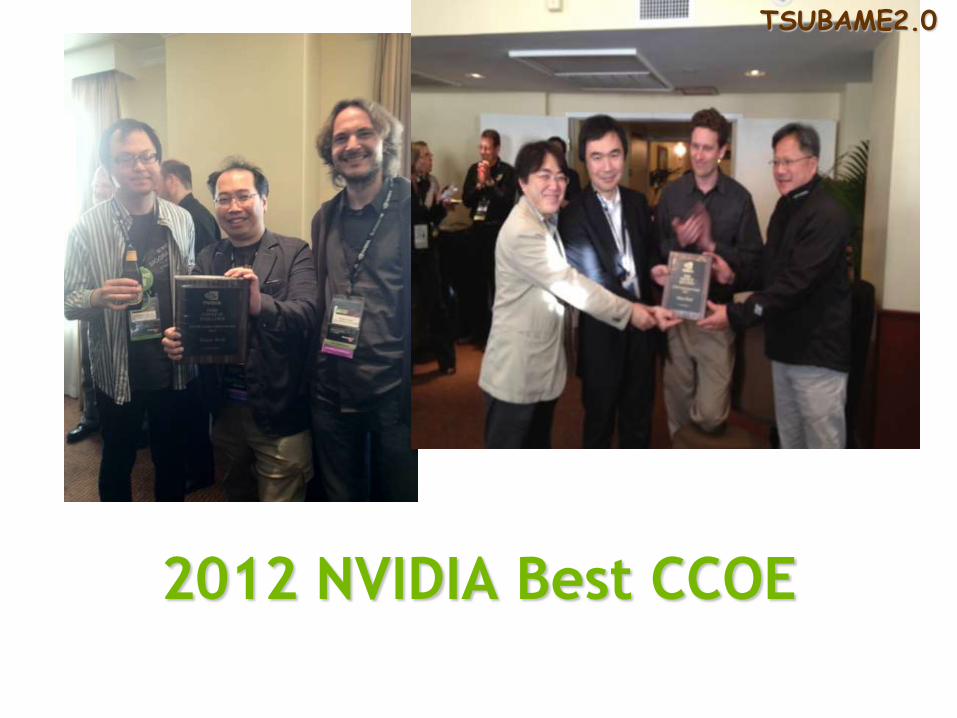
2012 NVIDIA Best CCOE
May 2012
TSUBAME2.0
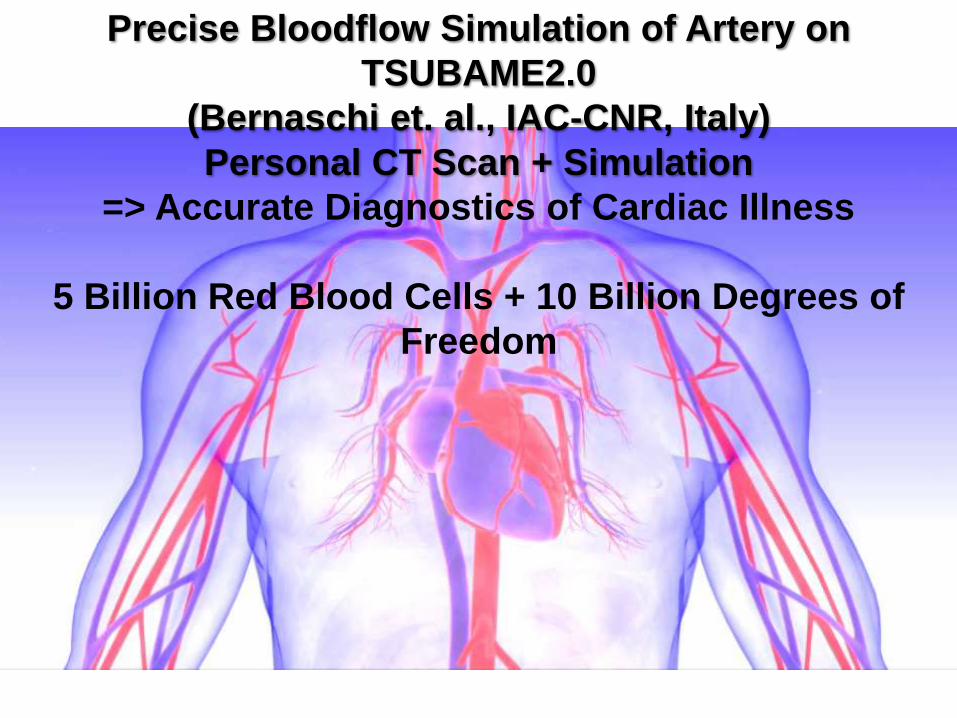
Precise Bloodflow Simulation of Artery on
TSUBAME2.0
(Bernaschi et. al., IAC-CNR, Italy)
Personal CT Scan + Simulation
=> Accurate Diagnostics of Cardiac Illness
5 Billion Red Blood Cells + 10 Billion Degrees of
Freedom
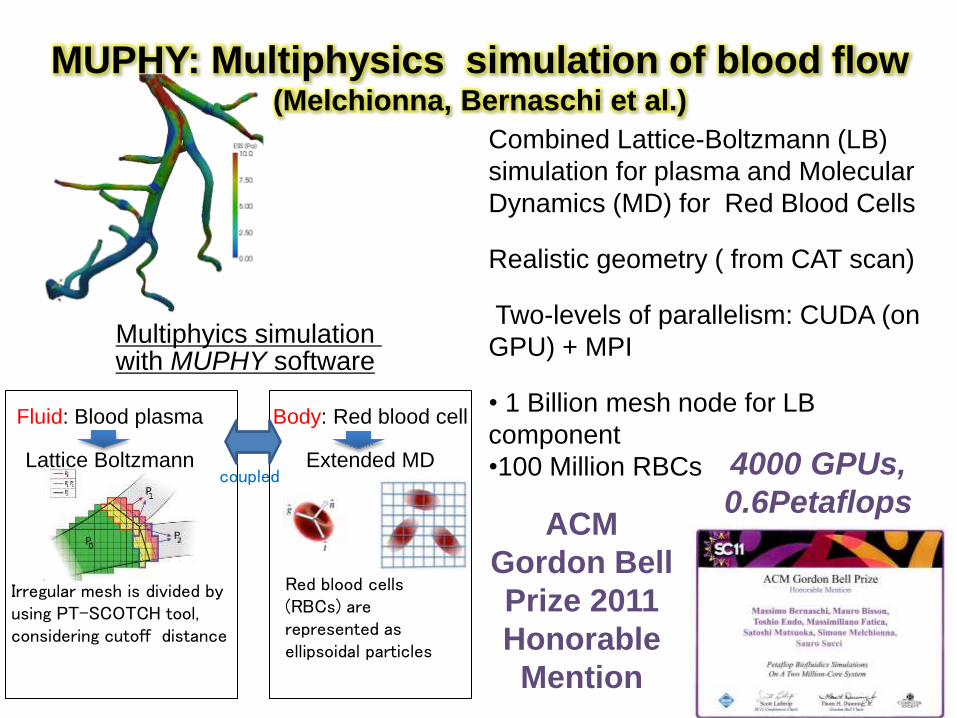
MUPHY: Multiphysics simulation of blood flow (Melchionna, Bernaschi et al.)
Combined Lattice-Boltzmann (LB)
simulation for plasma and Molecular
Dynamics (MD) for Red Blood Cells
Realistic geometry ( from CAT scan)
Two-levels of parallelism: CUDA (on
GPU) + MPI
• 1 Billion mesh node for LB
component
•100 Million RBCs
Red blood cells (RBCs) are represented as ellipsoidal particles
Fluid: Blood plasma
Lattice Boltzmann
Multiphyics simulation with MUPHY software
Body: Red blood cell
Extended MD
Irregular mesh is divided by using PT-SCOTCH tool, considering cutoff distance
coupled
ACM
Gordon Bell
Prize 2011
Honorable
Mention
4000 GPUs,
0.6Petaflops
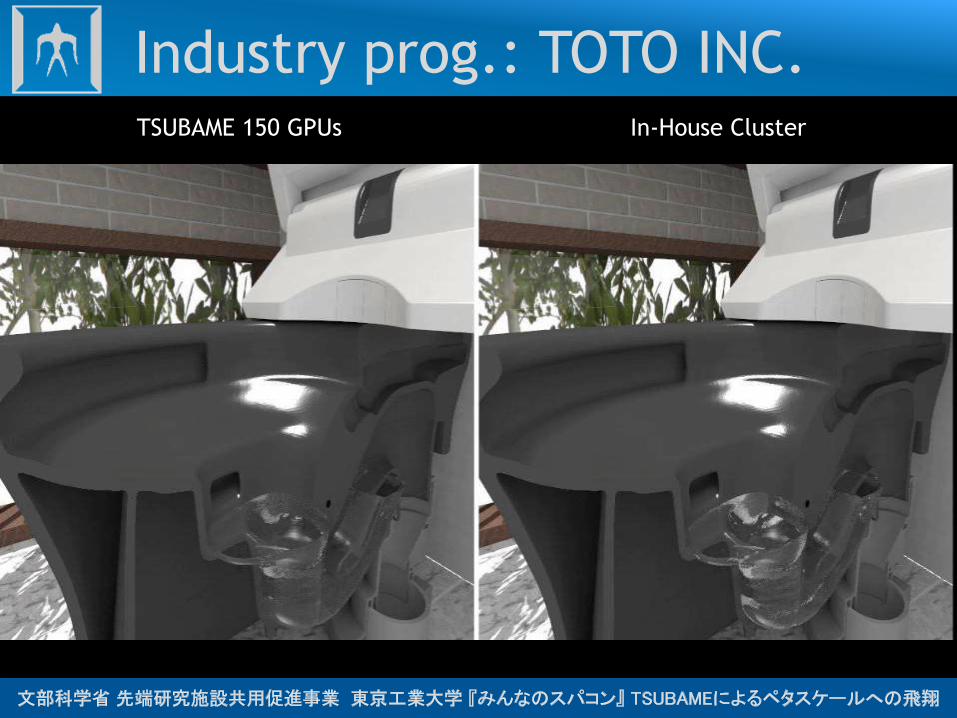
Industry prog.: TOTO INC. TSUBAME 150 GPUs In-House Cluster
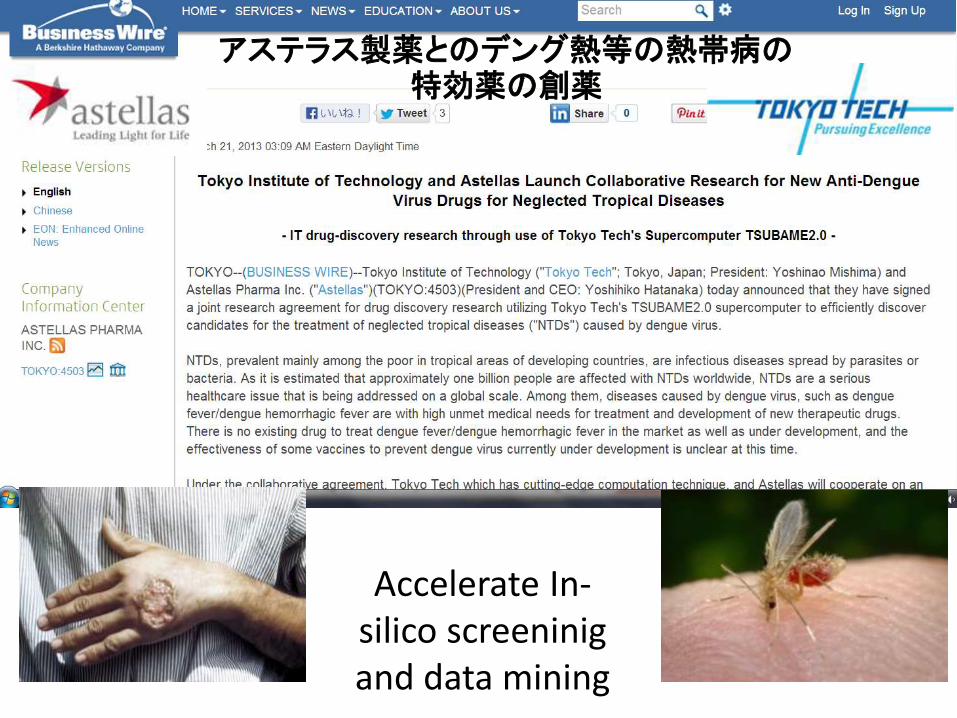
Accelerate In-silico screeninig and data mining
アステラス製薬とのデング熱等の熱帯病の特効薬の創薬
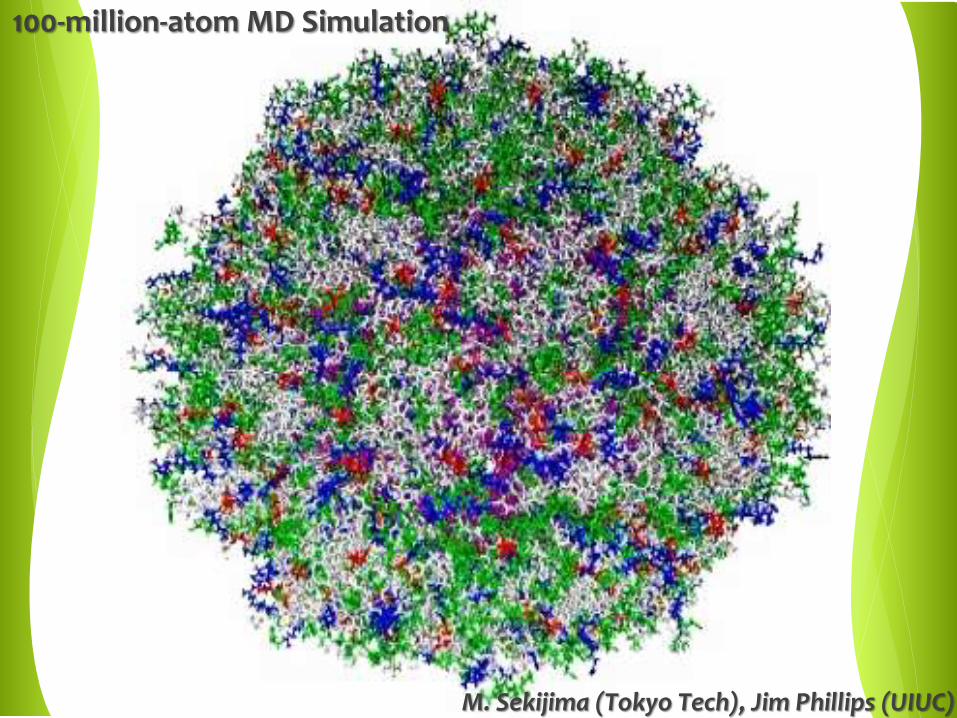
100-million-atom MD Simulation
M. Sekijima (Tokyo Tech), Jim Phillips (UIUC)
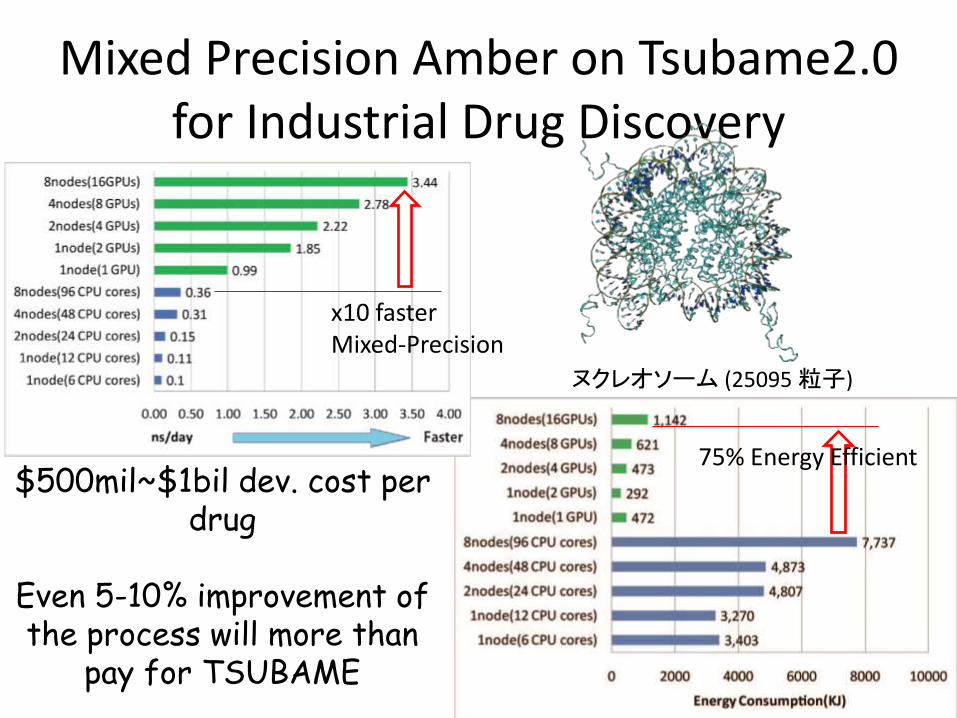
Mixed Precision Amber on Tsubame2.0 for Industrial Drug Discovery
75% Energy Efficient
ヌクレオソーム (25095 粒子)
x10 faster Mixed-Precision
$500mil~$1bil dev. cost per drug
Even 5-10% improvement of the process will more than
pay for TSUBAME
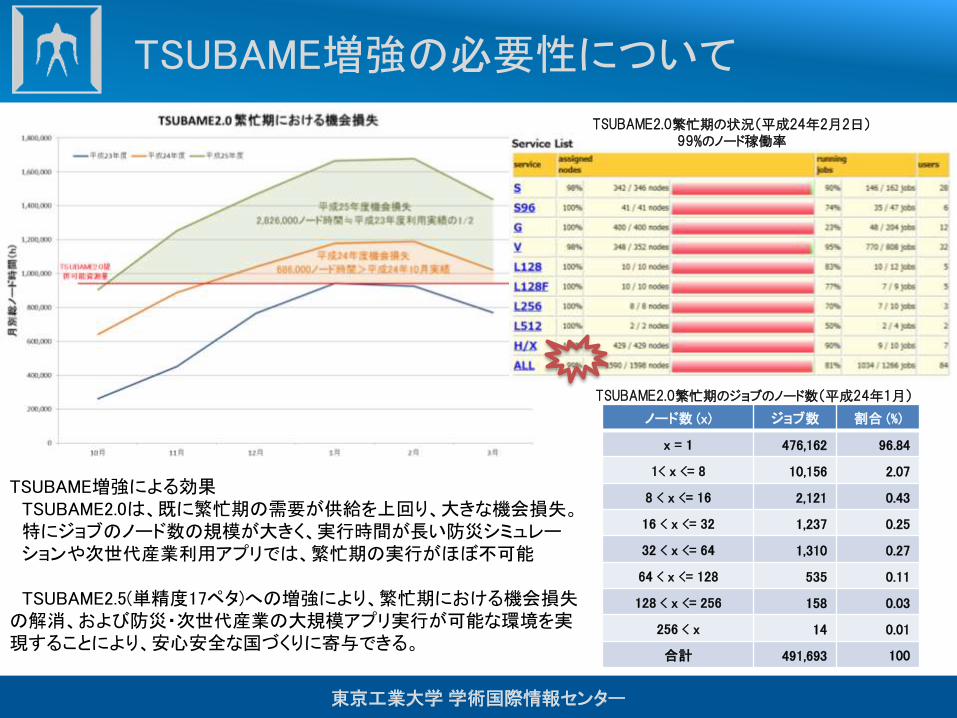
TSUBAME増強の必要性について
ノード数 (x) ジョブ数 割合 (%)
x = 1 476,162 96.84
1< x <= 8 10,156 2.07
8 < x <= 16 2,121 0.43
16 < x <= 32 1,237 0.25
32 < x <= 64 1,310 0.27
64 < x <= 128 535 0.11
128 < x <= 256 158 0.03
256 < x 14 0.01
合計 491,693 100
TSUBAME2.0繁忙期のジョブのノード数(平成24年1月)
TSUBAME増強による効果 TSUBAME2.0は、既に繁忙期の需要が供給を上回り、大きな機会損失。 特にジョブのノード数の規模が大きく、実行時間が長い防災シミュレー ションや次世代産業利用アプリでは、繁忙期の実行がほぼ不可能 TSUBAME2.5(単精度17ペタ)への増強により、繁忙期における機会損失の解消、および防災・次世代産業の大規模アプリ実行が可能な環境を実現することにより、安心安全な国づくりに寄与できる。
TSUBAME2.0繁忙期の状況(平成24年2月2日) 99%のノード稼働率
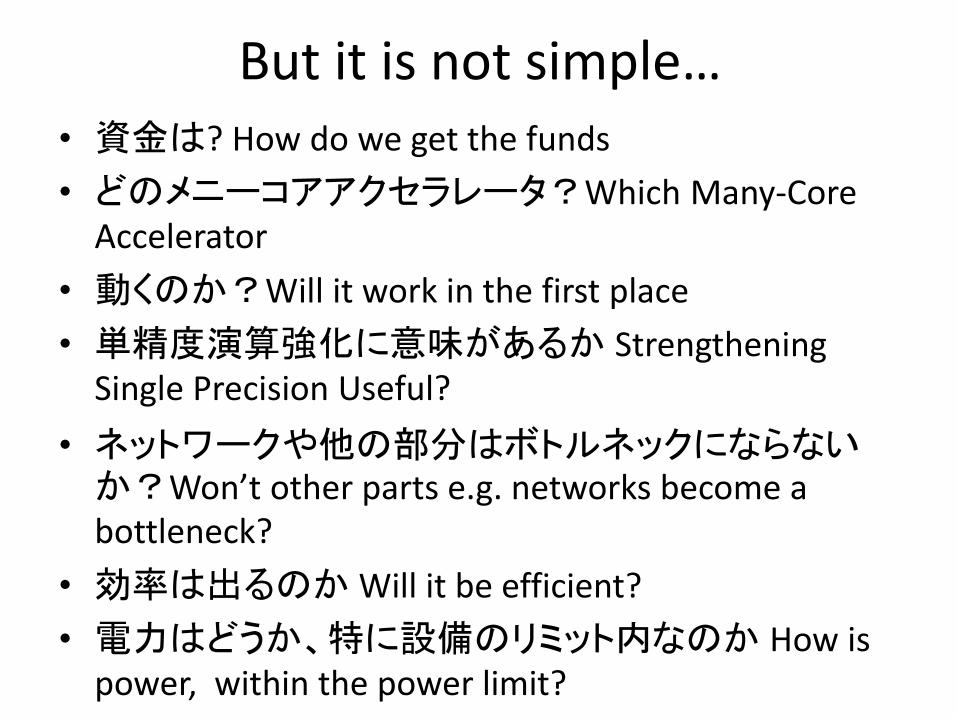
But it is not simple… • 資金は? How do we get the funds
• どのメニーコアアクセラレータ?Which Many-Core Accelerator
• 動くのか?Will it work in the first place
• 単精度演算強化に意味があるか Strengthening Single Precision Useful?
• ネットワークや他の部分はボトルネックにならないか?Won’t other parts e.g. networks become a bottleneck?
• 効率は出るのか Will it be efficient?
• 電力はどうか、特に設備のリミット内なのか How is power, within the power limit?
TSUBAME2.0 As of Dec. 20, 2011
つまり、パンク寸前
0
100,000
200,000
300,000
400,000
500,000
600,000
700,000
800,000
900,000
11 12 1 2 3 4 5 6 7 8 9 10 11 12 1 2
2010年 2011年 2012年
月別
総ノ
ード
時間
(h)
TSUBAME2.0における利用者種別による使用時間の集計(2012/02末時点)
学内利用
共同-学術
共同-公開
共同-非公開
共用促進
情報基盤拠点
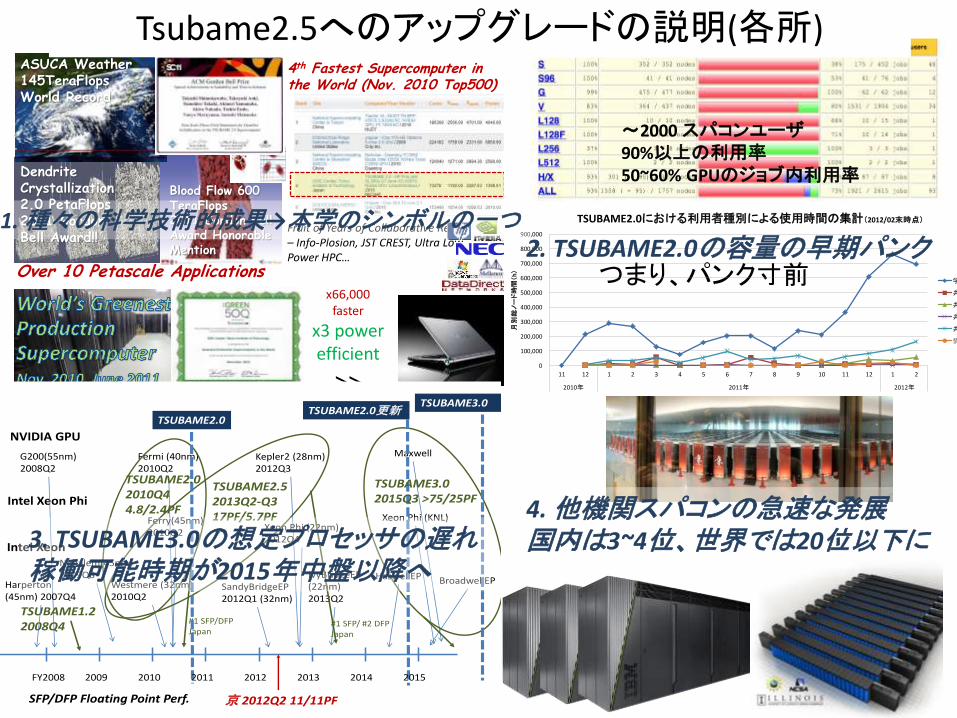
~2000 スパコンユーザ90%以上の利用率50~60% GPUのジョブ内利用率
2. TSUBAME2.0の容量の早期パンク
Tsubame 2.0’s AchievementsASUCA Weather145TeraFlopsWorld Record
Dendrite Crystallization2.0 PetaFlops2011 Gordon Bell Award!!
Blood Flow 600 TeraFlops2011 Gordon Bell Award Honorable Mention
Over 10 Petascale Applications
4th Fastest Supercomputer in the World (Nov. 2010 Top500)
x66,000 faster
x3 power efficient
>>
Fruit of Years of Collaborative Research – Info-Plosion, JST CREST, Ultra Low Power HPC…
Tsubame2.5へのアップグレードの説明(各所)
Intel Xeon Phi
NVIDIA GPU
Intel Xeon
G200(55nm)2008Q2
Fermi (40nm)2010Q2
Kepler2 (28nm)2012Q3
Maxwell
Ferry(45nm)2010Q2
Xeon Phi (22nm)2012Q4
Xeon Phi (KNL)
Westmere (32nm)2010Q2
SandyBridgeEP2012Q1 (32nm)
IvyBridgeEP(22nm)2013Q2
HaswellEP BroadwellEP
TSUBAME1.22008Q4
Harperton (45nm) 2007Q4
Nehalem(45nm)2009Q3
TSUBAME2.52013Q2-Q317PF/5.7PF
京 2012Q2 11/11PFSFP/DFP Floating Point Perf.
#1 SFP/DFPJapan
#1 SFP/ #2 DFPJapan
TSUBAME2.0TSUBAME2.0更新
TSUBAME3.0
TSUBAME3.02015Q3 >75/25PF
TSUBAME2.02010Q44.8/2.4PF
FY2008 2009 2010 2011 2012 2013 2014 2015
3. TSUBAME3.0の想定プロセッサの遅れ 稼働可能時期が2015年中盤以降へ
1. 種々の科学技術的成果→本学のシンボルの一つ
4. 他機関スパコンの急速な発展 国内は3~4位、世界では20位以下に
どのようにアップグレード? How do we upgrade?
どのメニーコア? Which Many Core Processor?
25
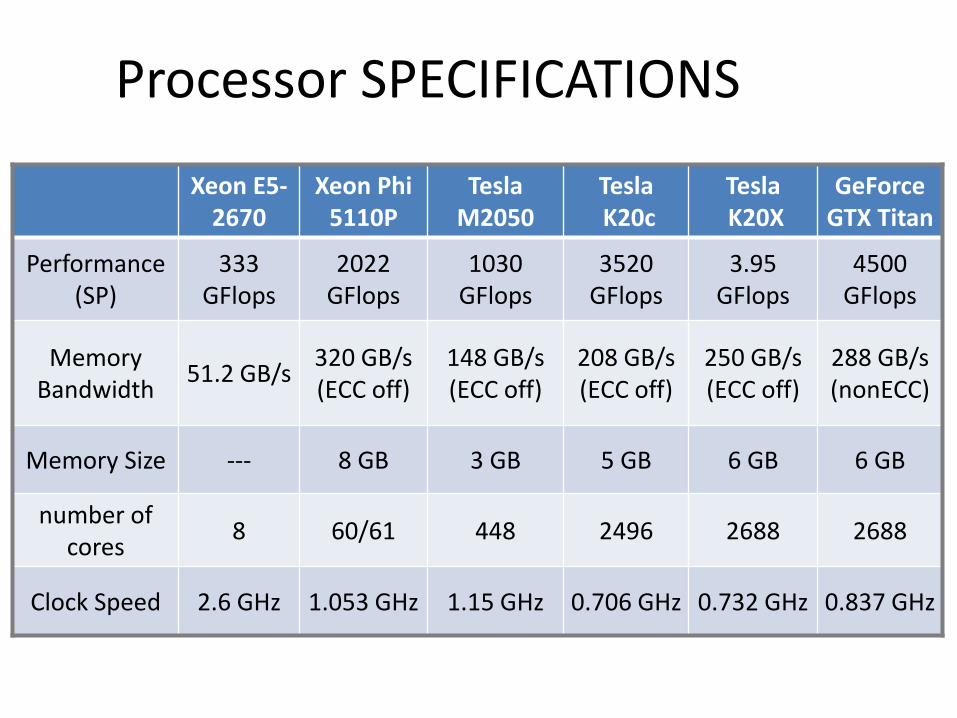
Processor SPECIFICATIONS
Xeon E5-2670
Xeon Phi 5110P
Tesla M2050
Tesla K20c
Tesla K20X
GeForce GTX Titan
Performance (SP)
333 GFlops
2022 GFlops
1030 GFlops
3520 GFlops
3.95 GFlops
4500 GFlops
Memory Bandwidth
51.2 GB/s 320 GB/s (ECC off)
148 GB/s (ECC off)
208 GB/s (ECC off)
250 GB/s (ECC off)
288 GB/s (nonECC)
Memory Size --- 8 GB 3 GB 5 GB 6 GB 6 GB
number of cores
8 60/61 448 2496 2688 2688
Clock Speed 2.6 GHz 1.053 GHz 1.15 GHz 0.706 GHz 0.732 GHz 0.837 GHz
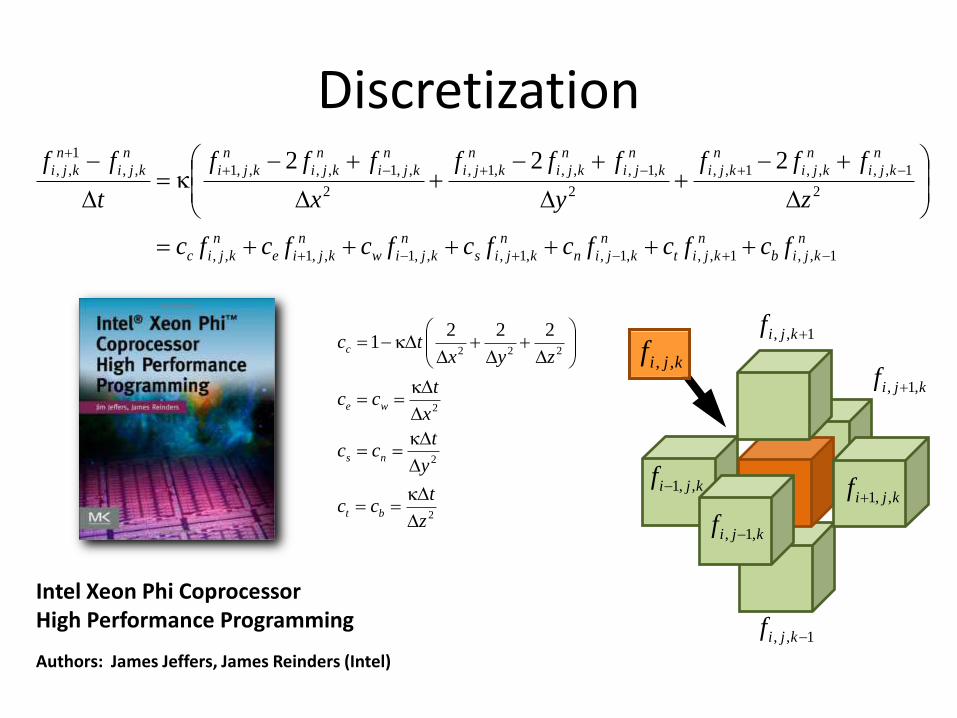
Intel Xeon Phi Coprocessor High Performance Programming
Authors: James Jeffers, James Reinders (Intel)
n
kjib
n
kjit
n
kjin
n
kjis
n
kjiw
n
kjie
n
kjic
n
kji
n
kji
n
kji
n
kji
n
kji
n
kji
n
kji
n
kji
n
kji
n
kji
n
kji
fcfcfcfcfcfcfc
z
fff
y
fff
x
fff
t
ff
1,,1,,,1,,1,,,1,,1,,
2
1,,,,1,,
2
,1,,,,1,
2
,,1,,,,1,,
1
,, 222
Discretization
\
1,, kjif
1,, kjif
kjif ,,1kjif ,,1
kjif ,1,
kjif ,1,
kjif ,,
2
2
2
222
2221
z
tcc
y
tcc
x
tcc
zyxtc
bt
ns
we
c
27
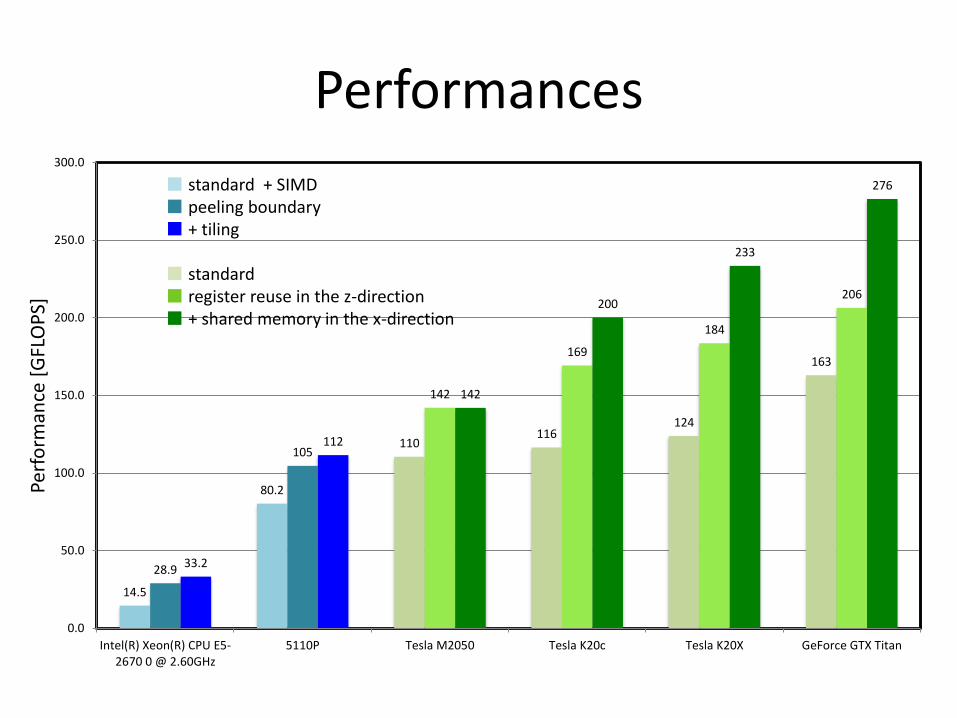
Performances
14.5
80.2
110 116
124
163
28.9
105
142
169
184
206
33.2
112
142
200
233
276
0.0
50.0
100.0
150.0
200.0
250.0
300.0
Intel(R) Xeon(R) CPU E5-2670 0 @ 2.60GHz
5110P Tesla M2050 Tesla K20c Tesla K20X GeForce GTX Titan
Perf
orm
ance
[G
FLO
PS]
■ standard + SIMD ■ peeling boundary ■ + tiling ■ standard ■ register reuse in the z-direction ■ + shared memory in the x-direction

CPU, MIC, GPU Performances
53.6 59.5 57.1
457
866
958
1218
0
200
400
600
800
1,000
1,200
1,400
Perf
orm
an
ce[G
Flo
ps
]
Xeon E5-2600
Xeon Phi 3110P
Xeon Phi 5110P
Tesla M2050
Tesla K20C
Tesla K20X
GeForce GTX Titan
Shared Memory Use in the x-directional kernel. Super function unit Loop unrolling Variable reuse in the y- and z- loops Reduction of branch diverges
Kepler GPU Tuning
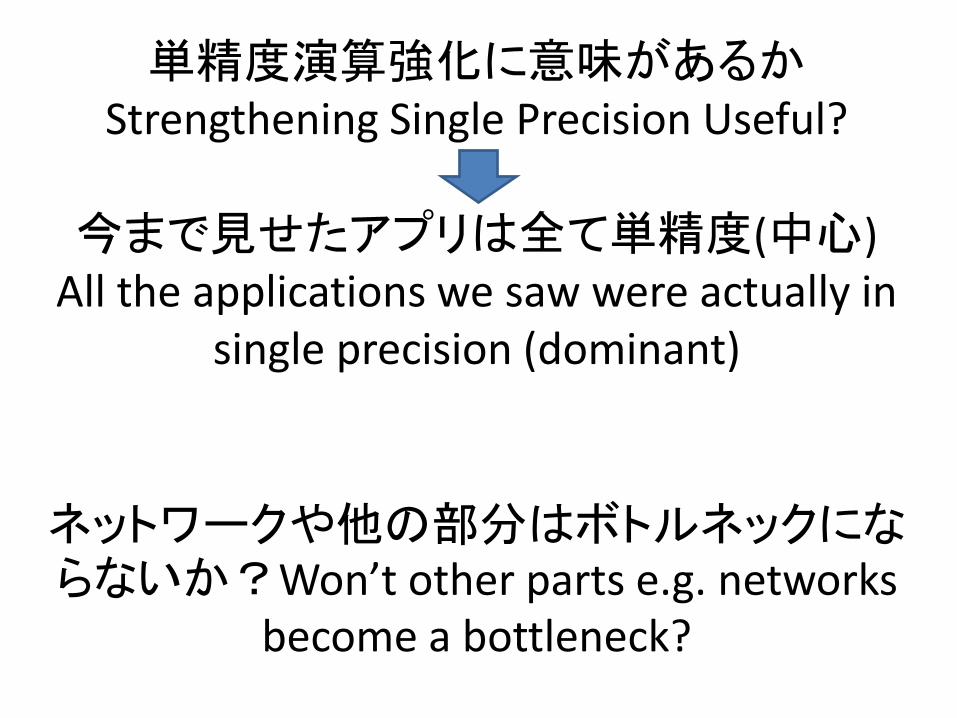
単精度演算強化に意味があるか Strengthening Single Precision Useful?
今まで見せたアプリは全て単精度(中心)
All the applications we saw were actually in single precision (dominant)
ネットワークや他の部分はボトルネックにならないか?Won’t other parts e.g. networks
become a bottleneck?
© Copyright 2012 Hewlett-Packard Development Company, L.P. The information contained herein is subject to change without notice. 30
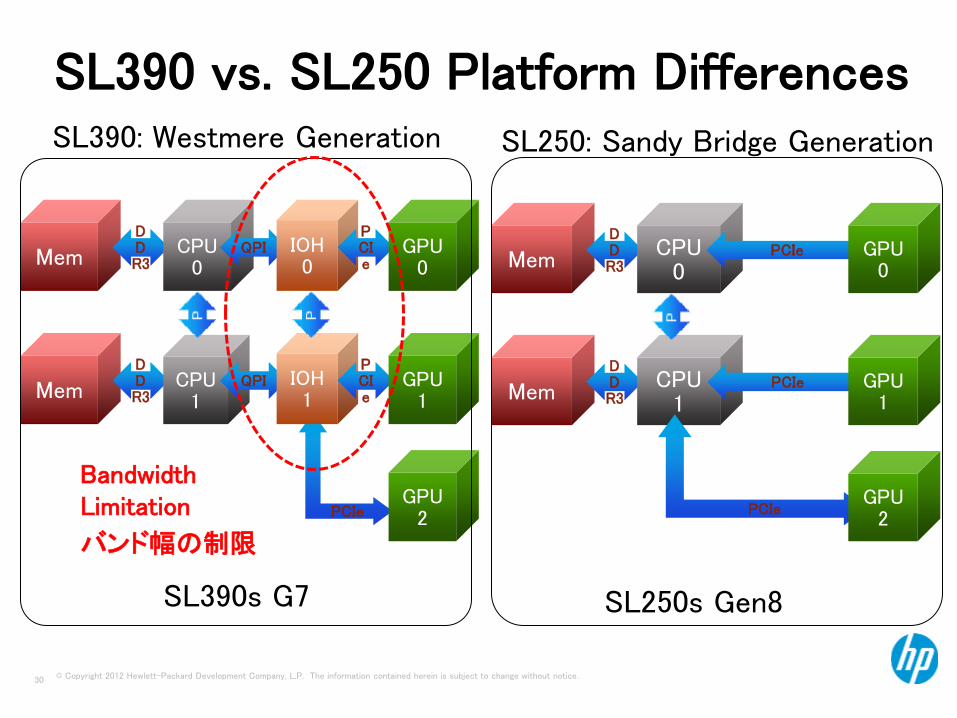
SL390 vs. SL250 Platform Differences
Mem DDR3
Mem
CPU 1
DDR3
QPI
CPU 0
PCIe
IOH 1
QPI IOH 0
PCIe
GPU 0
PCIe
GPU 1
GPU 2
Mem DDR3
Mem
CPU 1
DDR3
CPU 0
PCIe
PCIe GPU 0
PCIe GPU 1
GPU 2
SL390s G7 SL250s Gen8
Bandwidth Limitation
バンド幅の制限
SL390: Westmere Generation SL250: Sandy Bridge Generation
© Copyright 2012 Hewlett-Packard Development Company, L.P. The information contained herein is subject to change without notice. 31
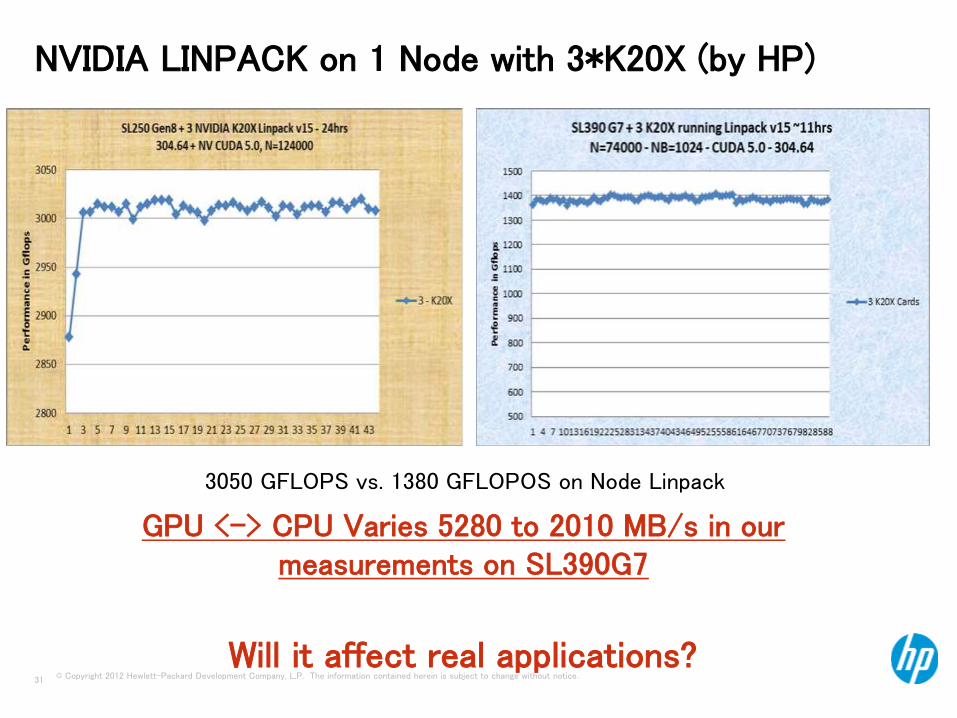
NVIDIA LINPACK on 1 Node with 3*K20X (by HP)
3050 GFLOPS vs. 1380 GFLOPOS on Node Linpack
GPU <-> CPU Varies 5280 to 2010 MB/s in our measurements on SL390G7
Will it affect real applications?
NEC Confidential
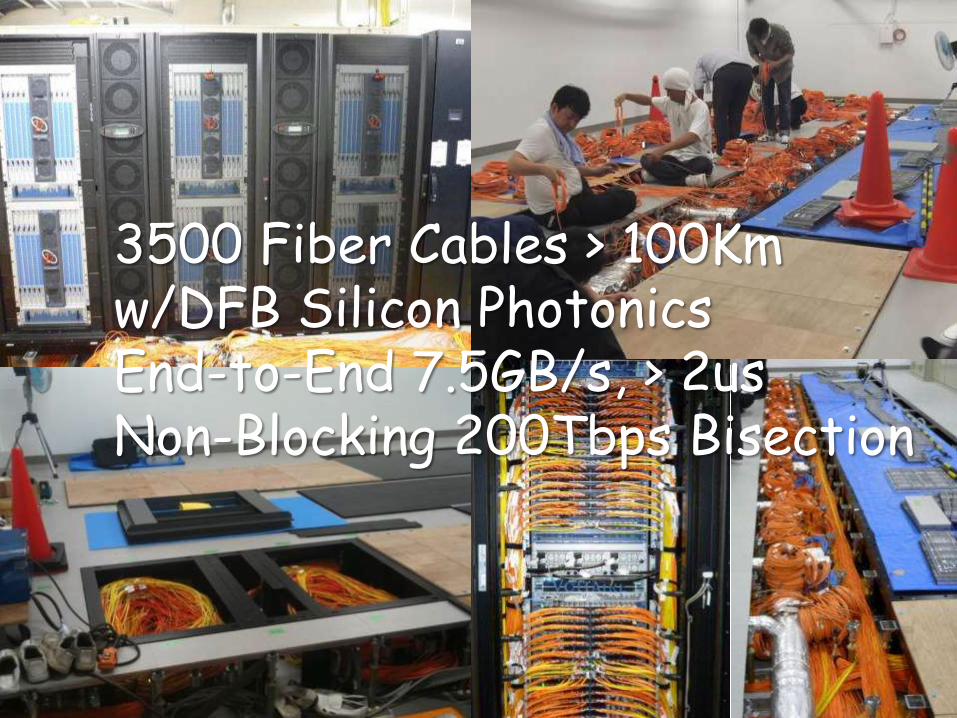
3500 Fiber Cables > 100Km w/DFB Silicon Photonics End-to-End 7.5GB/s, > 2us Non-Blocking 200Tbps Bisection
NEC Confidential
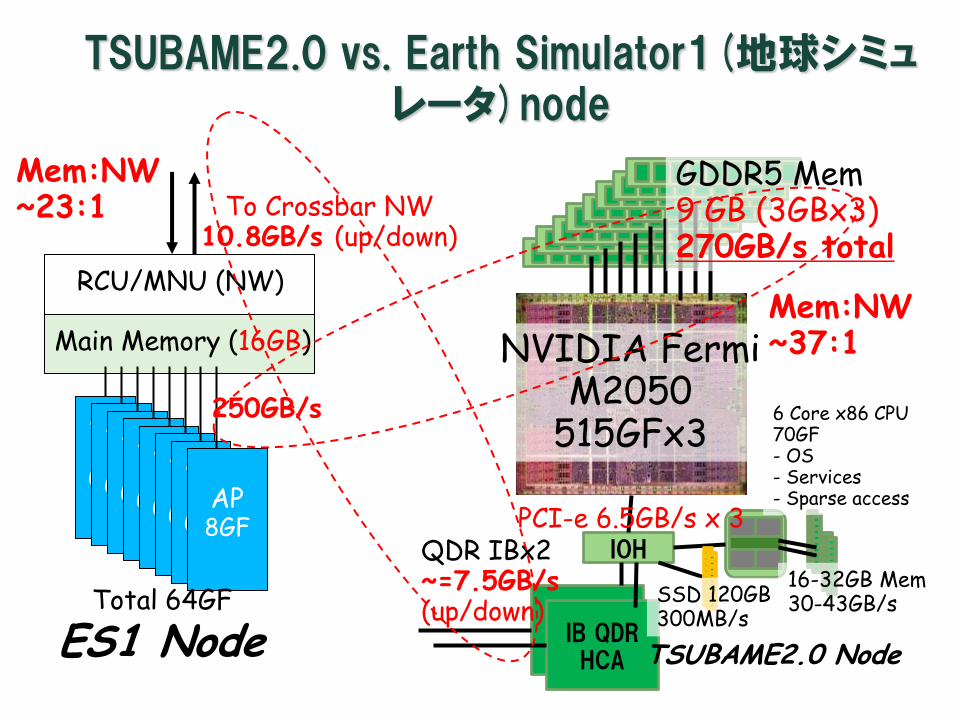
TSUBAME2.0 vs. Earth Simulator1(地球シミュレータ)node
GDDR5 Mem 9 GB (3GBx3) 270GB/s total
IOH
IB QDR HCA
QDR IBx2 ~=7.5GB/s (up/down)
IB QDR HCA
SSD 120GB 300MB/s
NVIDIA Fermi M2050
515GFx3 6 Core x86 CPU 70GF - OS - Services - Sparse access
16-32GB Mem 30-43GB/s
PCI-e 6.5GB/s x 3
Main Memory (16GB)
RCU/MNU (NW)
AP 8
GF
AP 8
GF
AP 8
GF
AP 8
GF
AP 8
GF
AP 8
GF
AP 8
GF
AP 8GF
250GB/s
Total 64GF
To Crossbar NW 10.8GB/s (up/down)
ES1 Node TSUBAME2.0 Node
Mem:NW ~23:1
Mem:NW ~37:1
NEC Confidential
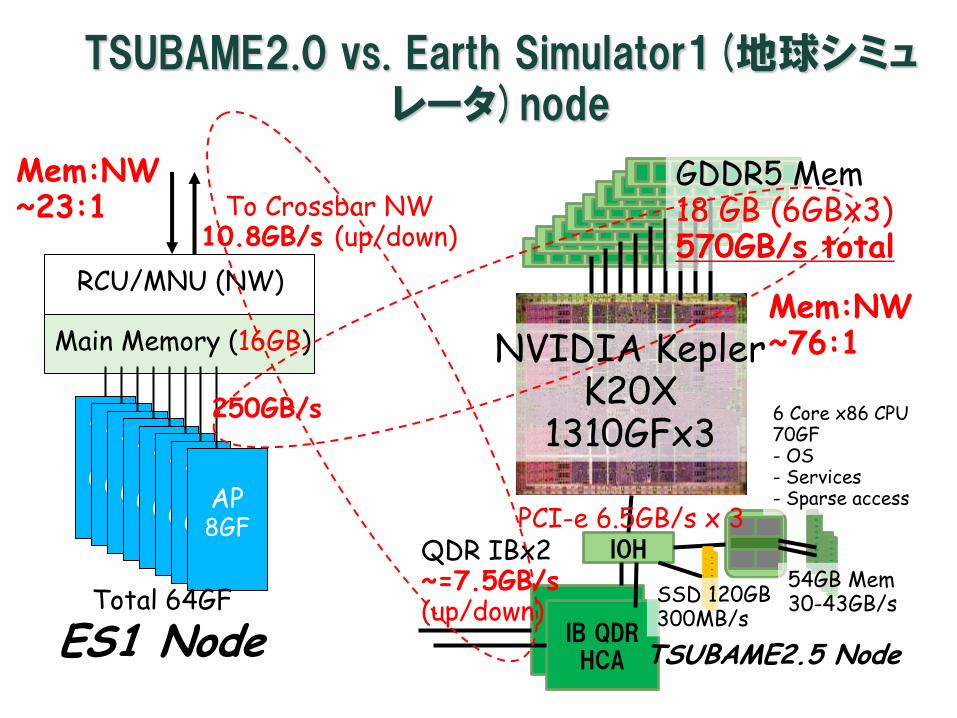
TSUBAME2.0 vs. Earth Simulator1(地球シミュレータ)node
GDDR5 Mem 18 GB (6GBx3) 570GB/s total
IOH
IB QDR HCA
QDR IBx2 ~=7.5GB/s (up/down)
IB QDR HCA
SSD 120GB 300MB/s
NVIDIA Kepler K20X
1310GFx3 6 Core x86 CPU 70GF - OS - Services - Sparse access
54GB Mem 30-43GB/s
PCI-e 6.5GB/s x 3
Main Memory (16GB)
RCU/MNU (NW)
AP 8
GF
AP 8
GF
AP 8
GF
AP 8
GF
AP 8
GF
AP 8
GF
AP 8
GF
AP 8GF
250GB/s
Total 64GF
To Crossbar NW 10.8GB/s (up/down)
ES1 Node TSUBAME2.5 Node
Mem:NW ~23:1
Mem:NW ~76:1
http://www.nikkeibp.co.jp/sj/2/column/z/33/
http://trendy.nikkeibp.co.jp/lc/photorepo/080916_photo/
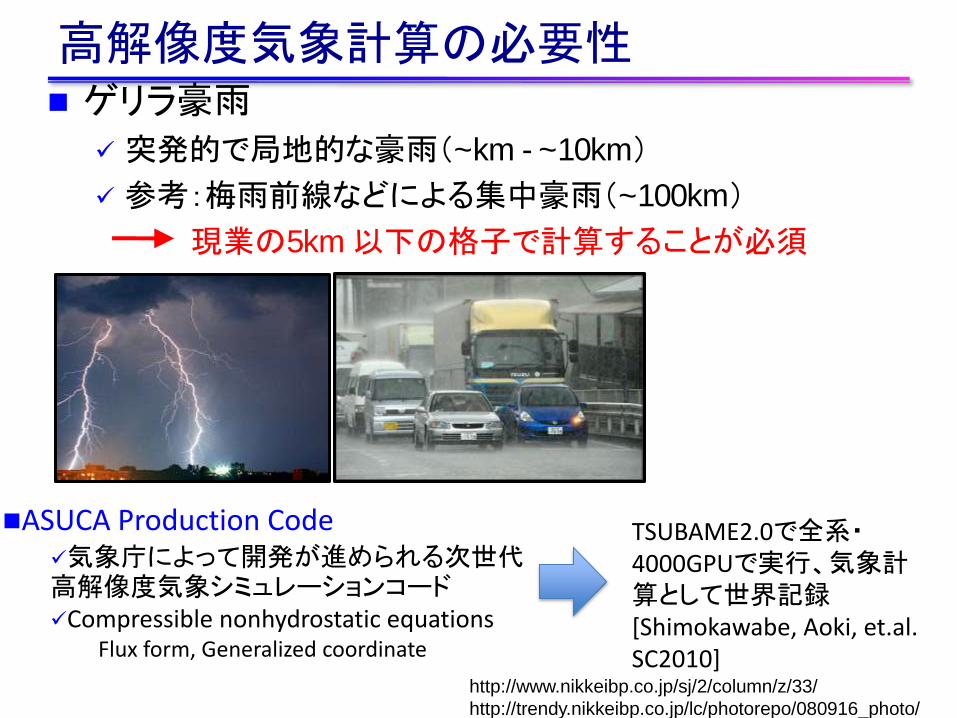
高解像度気象計算の必要性 ゲリラ豪雨
突発的で局地的な豪雨(~km - ~10km)
参考:梅雨前線などによる集中豪雨(~100km)
現業の5km 以下の格子で計算することが必須
ASUCA Production Code 気象庁によって開発が進められる次世代高解像度気象シミュレーションコード Compressible nonhydrostatic equations
Flux form, Generalized coordinate
TSUBAME2.0で全系・4000GPUで実行、気象計算として世界記録 [Shimokawabe, Aoki, et.al. SC2010]
36
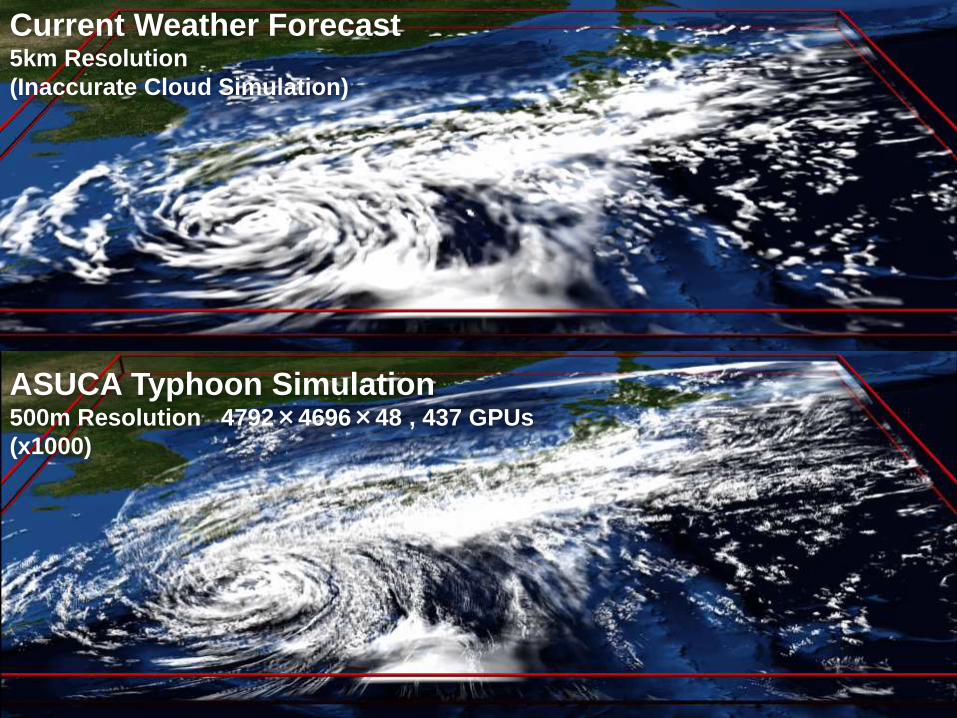
ASUCA Typhoon Simulation 500m Resolution 4792×4696×48 , 437 GPUs
(x1000)
Current Weather Forecast 5km Resolution
(Inaccurate Cloud Simulation)
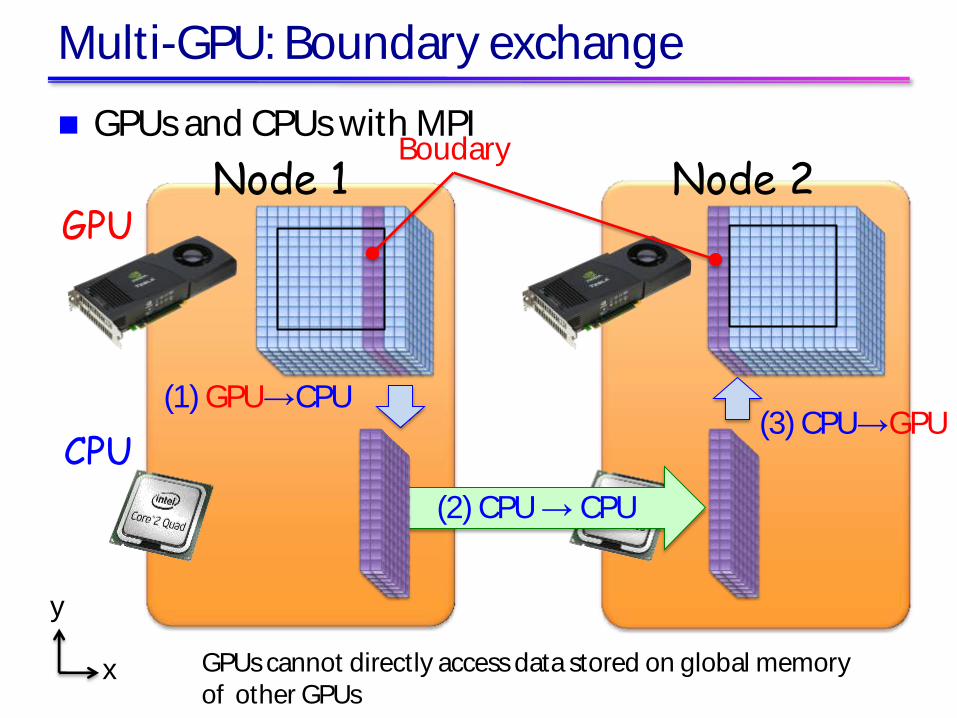
Multi-GPU: Boundary exchange
GPUs and CPUs with MPI
y
x
Node 1 GPU
Node 2
CPU
(2) CPU → CPU
(1) GPU→CPU (3) CPU→GPU
GPUs cannot directly access data stored on global memory of other GPUs
Boudary
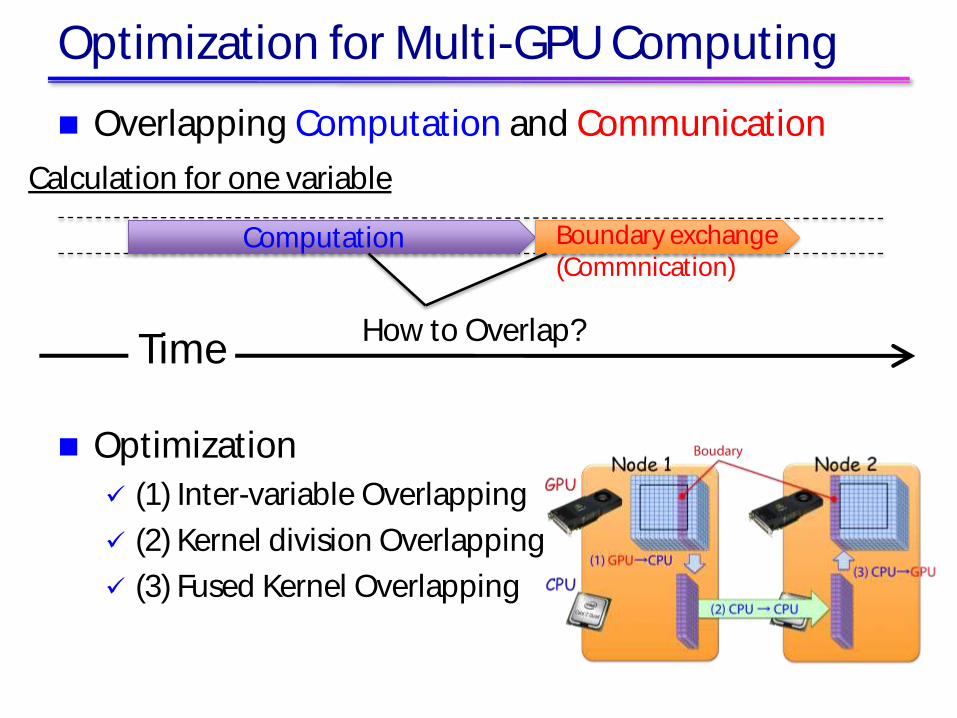
Optimization for Multi-GPU Computing
Calculation for one variable
Overlapping Computation and Communication
Optimization
(1) Inter-variable Overlapping
(2) Kernel division Overlapping
(3) Fused Kernel Overlapping
Computation Boundary exchange (Commnication)
How to Overlap? Time
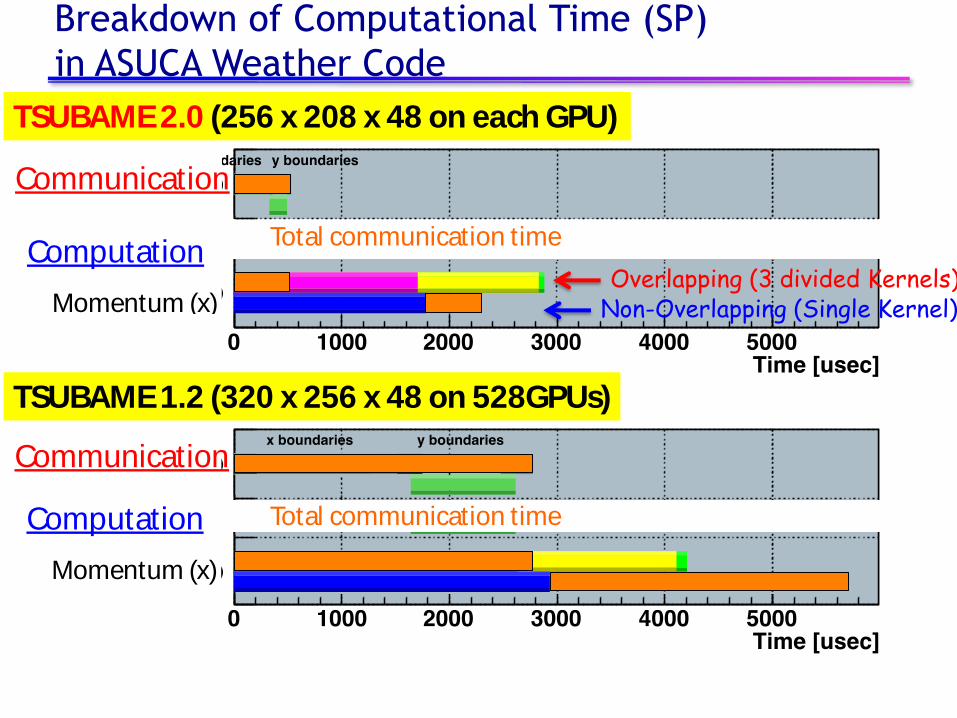
Breakdown of Computational Time (SP)
in ASUCA Weather Code
Communication
Computation
Momentum (x)
Total communication time
Overlapping (3 divided Kernels) Non-Overlapping (Single Kernel)
TSUBAME 2.0 (256 x 208 x 48 on each GPU)
TSUBAME 1.2 (320 x 256 x 48 on 528GPUs)
Total communication time
Communication
Computation
Momentum (x)
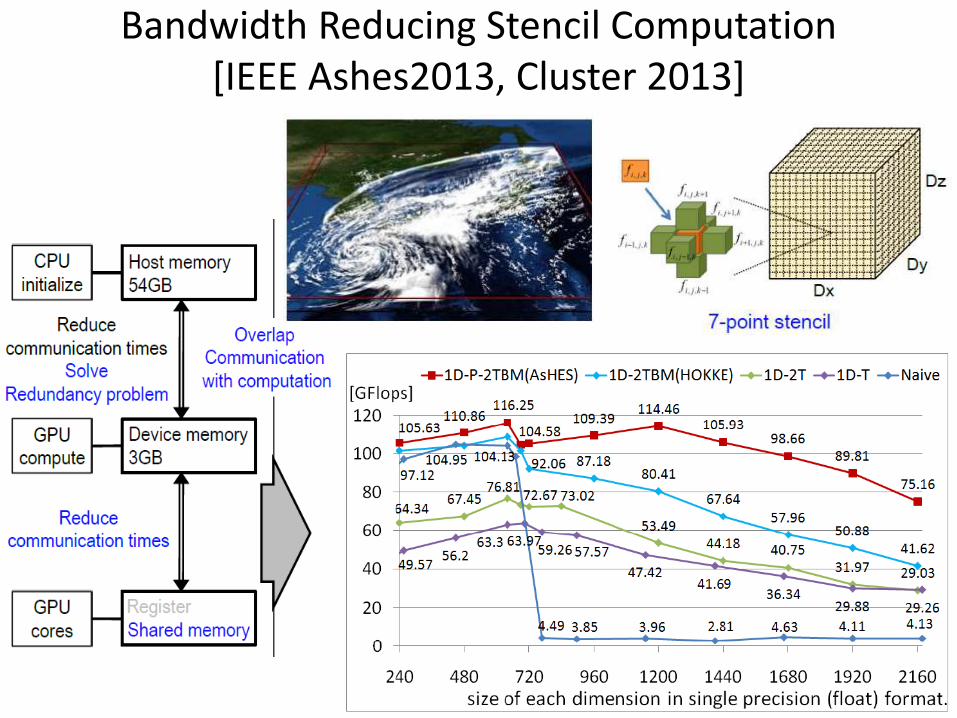
Bandwidth Reducing Stencil Computation [IEEE Ashes2013, Cluster 2013]
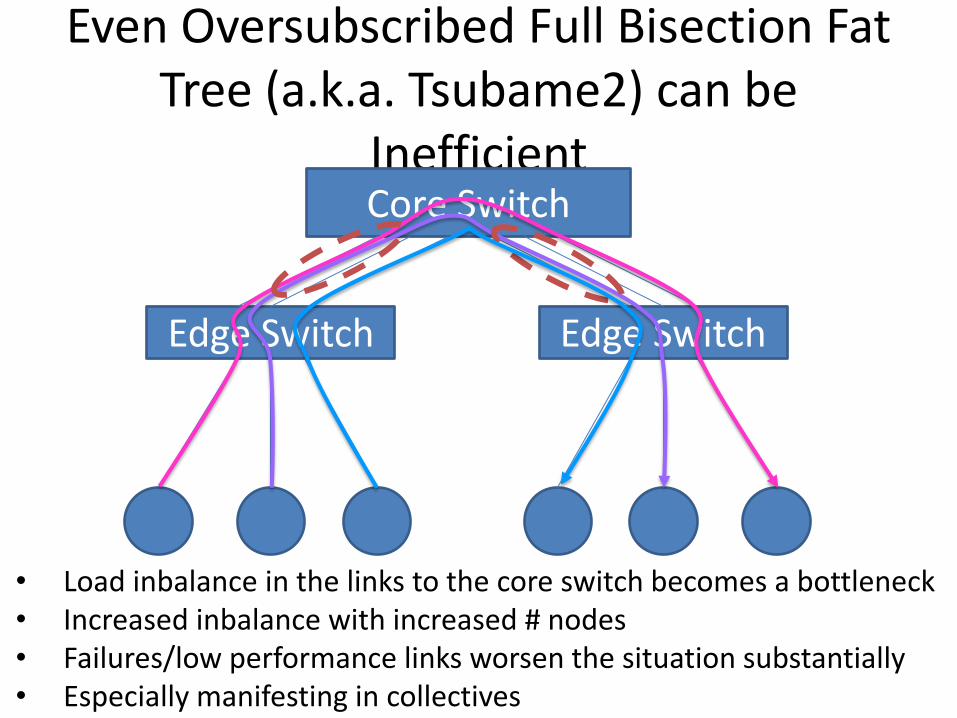
Even Oversubscribed Full Bisection Fat Tree (a.k.a. Tsubame2) can be
Inefficient Core Switch
Edge Switch Edge Switch
• Load inbalance in the links to the core switch becomes a bottleneck • Increased inbalance with increased # nodes • Failures/low performance links worsen the situation substantially • Especially manifesting in collectives
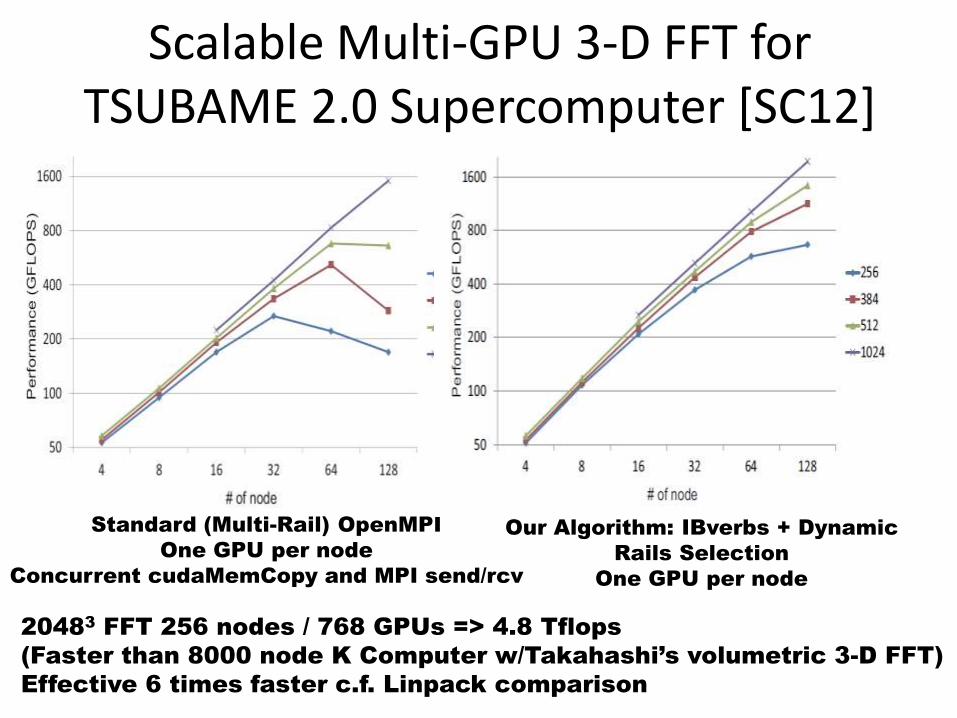
Scalable Multi-GPU 3-D FFT for TSUBAME 2.0 Supercomputer [SC12]
Standard (Multi-Rail) OpenMPI
One GPU per node
Concurrent cudaMemCopy and MPI send/rcv
Our Algorithm: IBverbs + Dynamic
Rails Selection
One GPU per node
20483 FFT 256 nodes / 768 GPUs => 4.8 Tflops
(Faster than 8000 node K Computer w/Takahashi’s volumetric 3-D FFT)
Effective 6 times faster c.f. Linpack comparison
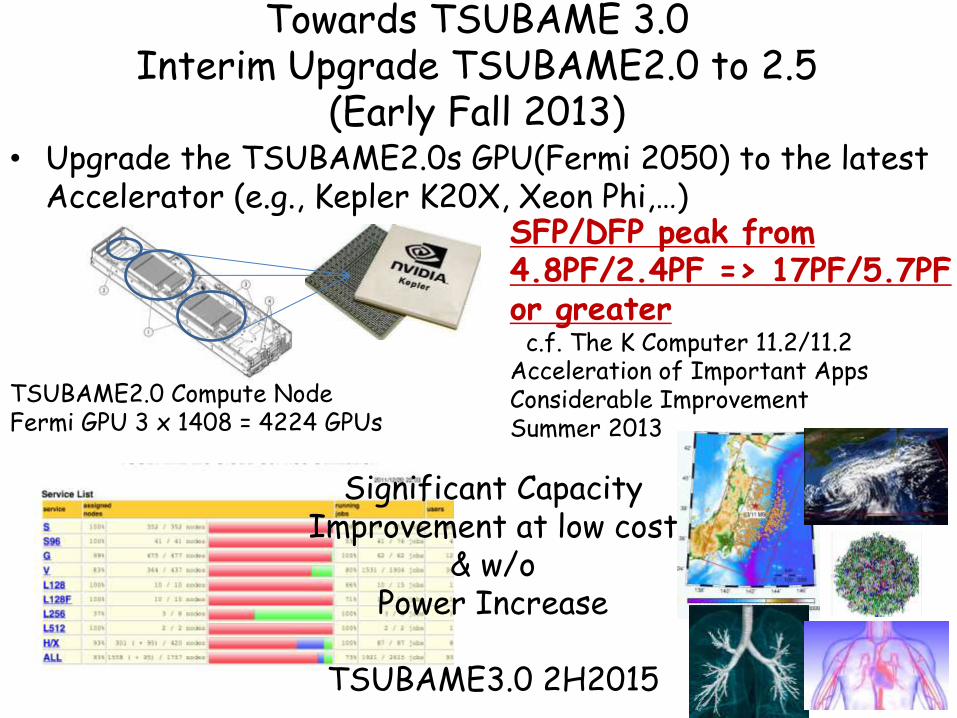
Towards TSUBAME 3.0 Interim Upgrade TSUBAME2.0 to 2.5
(Early Fall 2013) • Upgrade the TSUBAME2.0s GPU(Fermi 2050) to the latest
Accelerator (e.g., Kepler K20X, Xeon Phi,…)
SFP/DFP peak from 4.8PF/2.4PF => 17PF/5.7PF or greater c.f. The K Computer 11.2/11.2 Acceleration of Important Apps Considerable Improvement Summer 2013
TSUBAME2.0 Compute Node Fermi GPU 3 x 1408 = 4224 GPUs
Significant Capacity Improvement at low cost
& w/o Power Increase
TSUBAME3.0 2H2015
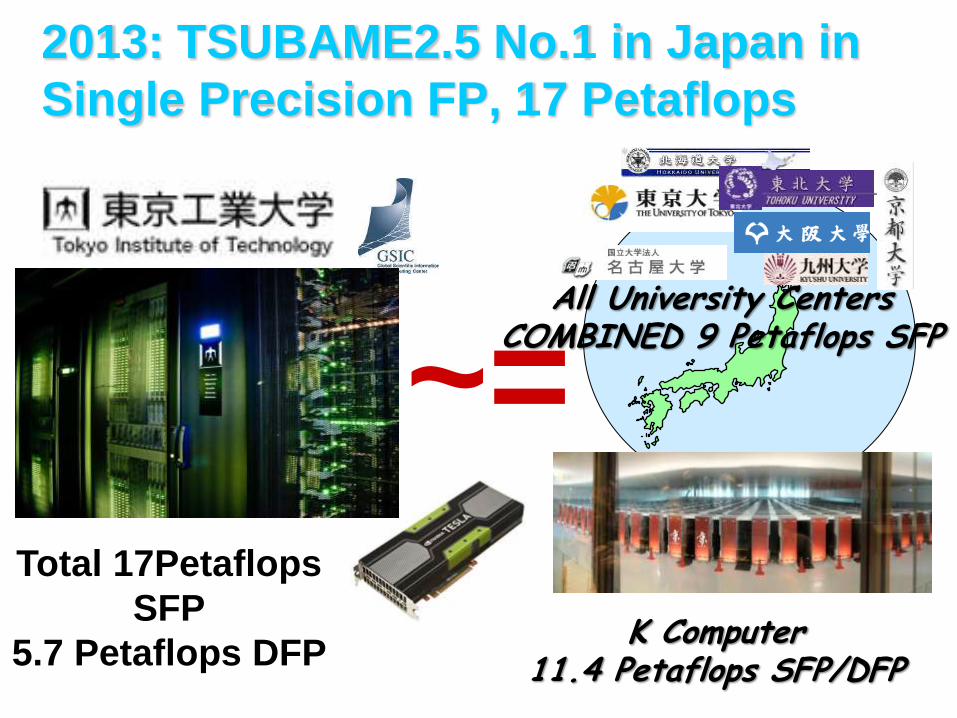
2013: TSUBAME2.5 No.1 in Japan in
Single Precision FP, 17 Petaflops
~=
K Computer 11.4 Petaflops SFP/DFP
Total 17Petaflops
SFP
5.7 Petaflops DFP
All University Centers COMBINED 9 Petaflops SFP
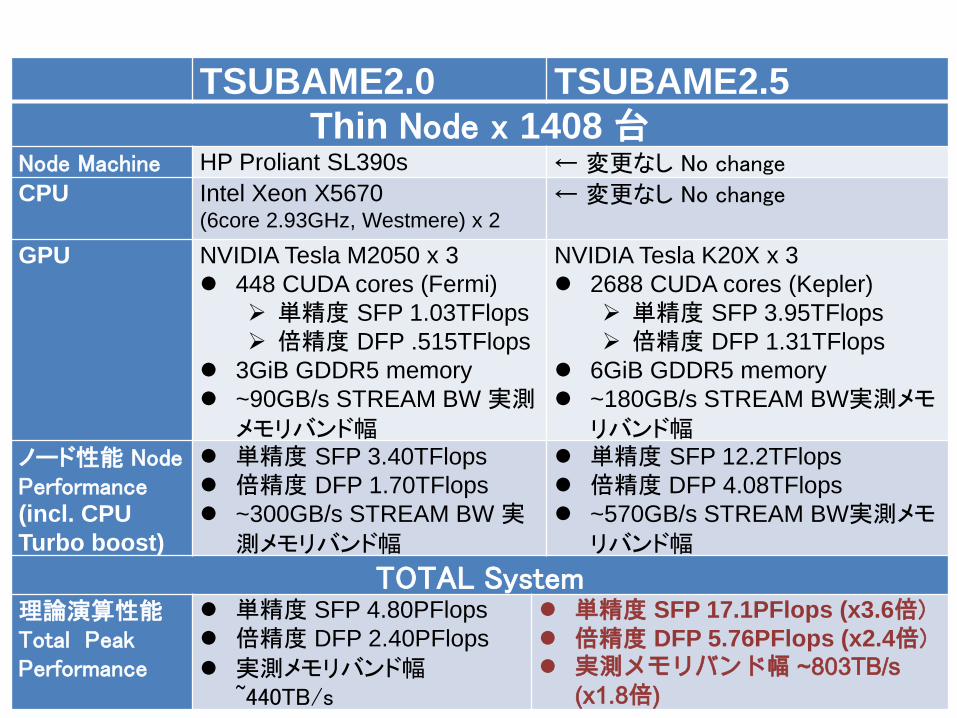
TSUBAME2.0 TSUBAME2.5 Thin Node x 1408 台
Node Machine HP Proliant SL390s ← 変更なし No change CPU Intel Xeon X5670
(6core 2.93GHz, Westmere) x 2 ← 変更なし No change
GPU NVIDIA Tesla M2050 x 3 448 CUDA cores (Fermi)
単精度 SFP 1.03TFlops 倍精度 DFP .515TFlops
3GiB GDDR5 memory ~90GB/s STREAM BW 実測
メモリバンド幅
NVIDIA Tesla K20X x 3 2688 CUDA cores (Kepler)
単精度 SFP 3.95TFlops 倍精度 DFP 1.31TFlops
6GiB GDDR5 memory ~180GB/s STREAM BW実測メモ
リバンド幅 ノード性能 Node Performance (incl. CPU
Turbo boost)
単精度 SFP 3.40TFlops 倍精度 DFP 1.70TFlops ~300GB/s STREAM BW 実
測メモリバンド幅
単精度 SFP 12.2TFlops 倍精度 DFP 4.08TFlops ~570GB/s STREAM BW実測メモ
リバンド幅
TOTAL System 理論演算性能 Total Peak Performance
単精度 SFP 4.80PFlops 倍精度 DFP 2.40PFlops
実測メモリバンド幅 ~440TB/s
単精度 SFP 17.1PFlops (x3.6倍) 倍精度 DFP 5.76PFlops (x2.4倍) 実測メモリバンド幅 ~803TB/s
(x1.8倍)
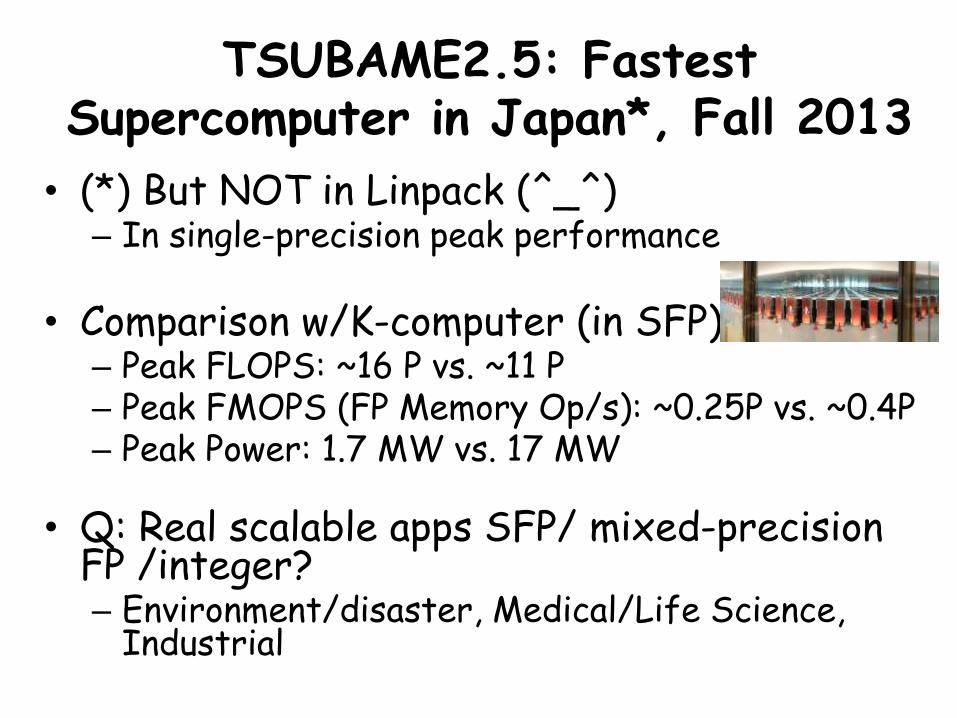
TSUBAME2.5: Fastest Supercomputer in Japan*, Fall 2013
• (*) But NOT in Linpack (^_^) – In single-precision peak performance
• Comparison w/K-computer (in SFP)
– Peak FLOPS: ~16 P vs. ~11 P – Peak FMOPS (FP Memory Op/s): ~0.25P vs. ~0.4P – Peak Power: 1.7 MW vs. 17 MW
• Q: Real scalable apps SFP/ mixed-precision
FP /integer? – Environment/disaster, Medical/Life Science,
Industrial
Copyright © Takayuki Aoki / Global Scientific Information and Computing Center, Tokyo Institute of Technology
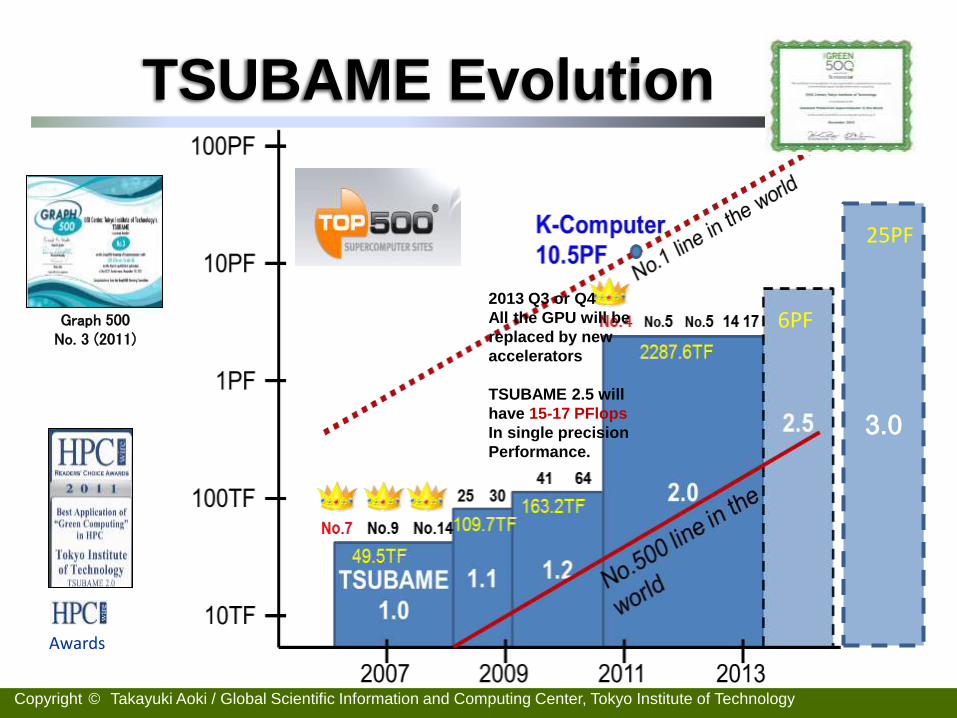
TSUBAME Evolution
Graph 500 No. 3 (2011)
Awards
2013 Q3 or Q4
All the GPU will be
replaced by new
accelerators
TSUBAME 2.5 will
have 15-17 PFlops
In single precision
Performance.
3.0
6PF
25PF
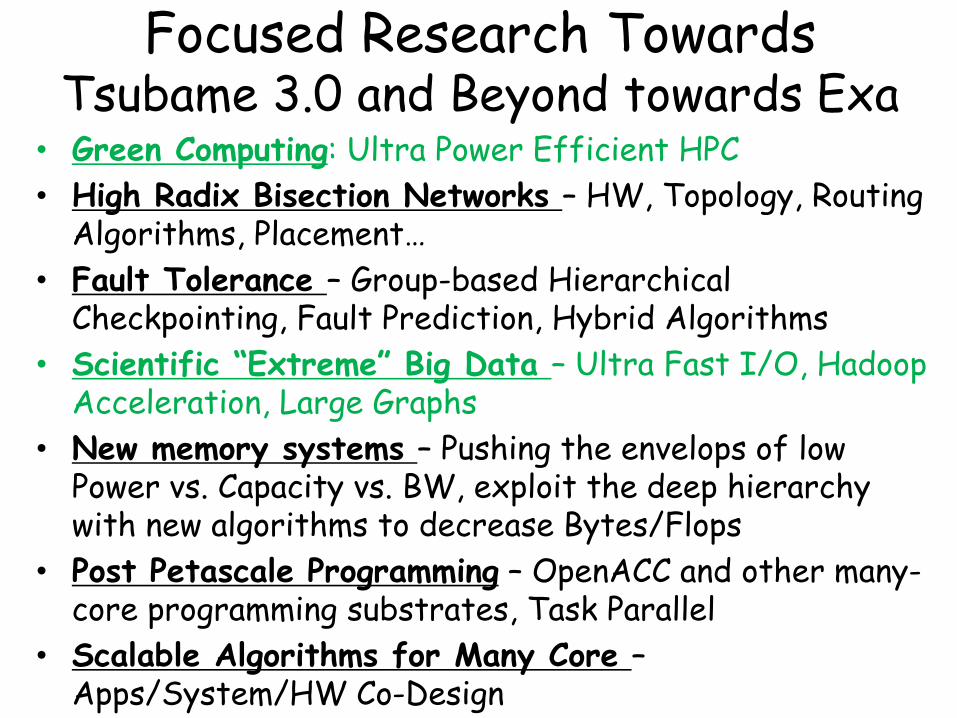
Focused Research Towards Tsubame 3.0 and Beyond towards Exa
• Green Computing: Ultra Power Efficient HPC
• High Radix Bisection Networks – HW, Topology, Routing Algorithms, Placement…
• Fault Tolerance – Group-based Hierarchical Checkpointing, Fault Prediction, Hybrid Algorithms
• Scientific “Extreme” Big Data – Ultra Fast I/O, Hadoop Acceleration, Large Graphs
• New memory systems – Pushing the envelops of low Power vs. Capacity vs. BW, exploit the deep hierarchy with new algorithms to decrease Bytes/Flops
• Post Petascale Programming – OpenACC and other many-core programming substrates, Task Parallel
• Scalable Algorithms for Many Core – Apps/System/HW Co-Design
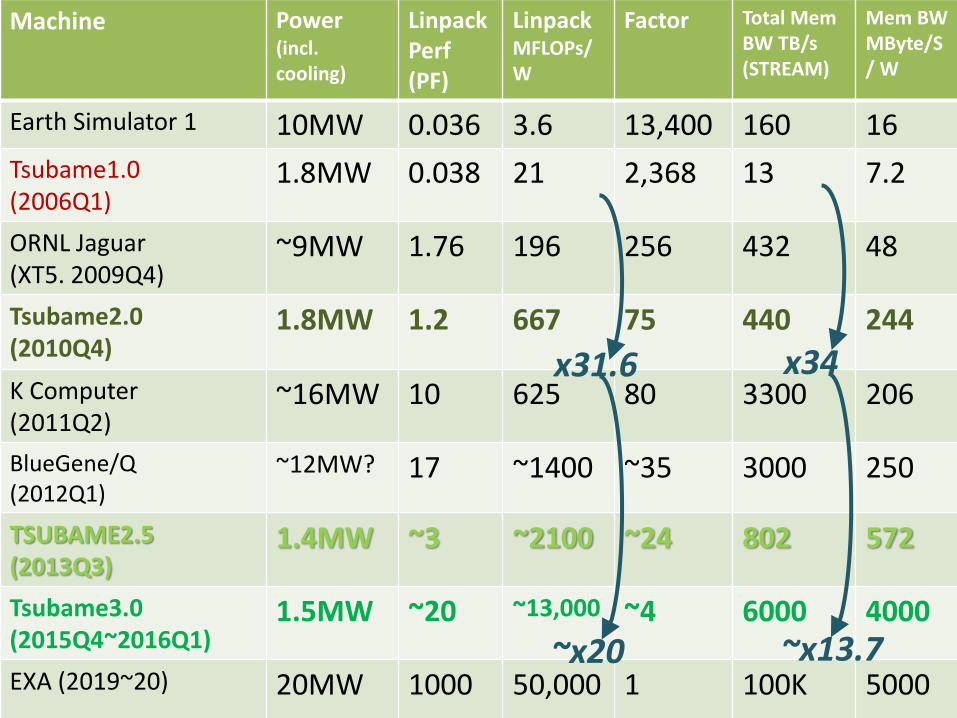
Machine Power (incl. cooling)
Linpack Perf (PF)
Linpack MFLOPs/W
Factor Total Mem BW TB/s (STREAM)
Mem BW MByte/S / W
Factor
Earth Simulator 1 10MW 0.036 3.6 13,400 160 16 312
Tsubame1.0 (2006Q1)
1.8MW 0.038 21 2,368 13 7.2 692
ORNL Jaguar (XT5. 2009Q4)
~9MW 1.76 196 256 432 48 104
Tsubame2.0 (2010Q4)
1.8MW 1.2 667 75 440 244 20
K Computer (2011Q2)
~16MW 10 625 80 3300 206 24
BlueGene/Q (2012Q1)
~12MW? 17 ~1400 ~35 3000 250 20
TSUBAME2.5 (2013Q3)
1.4MW ~3 ~2100 ~24 802 572 8.7
Tsubame3.0 (2015Q4~2016Q1)
1.5MW ~20 ~13,000 ~4 6000 4000 1.25
EXA (2019~20) 20MW 1000 50,000 1 100K 5000 1
x31.6
~x20
x34
~x13.7
モデルと実測の Bayes 的融合
• Bayes モデルと事前分布
• n 回実測後の事後予測分布
),(-Inv~
)/,(~,|
),(~
2
00
22
0
22
2
v
xN
Ny
i
i
T
iii
iii
n
T
iiimnn
ni
T
innn
nninininiii
xynyy
ynxnn
tyyyyn
/)()(
/)(,,
)/,(~),,,(|
2
0
22
00
2
000
1
2
21
モデルによる所要時間の推定
所要時間の実測データ
imi yn
y1
!ABCLib$ static select region start
!ABCLib$ parameter (in CacheS, in NB, in NPrc)
!ABCLib$ select sub region start
!ABCLib$ according estimated
!ABCLib$ (2.0d0*CacheS*NB)/(3.0d0*NPrc)
対象1(アルゴリズム1)
!ABCLib$ select sub region end
!ABCLib$ select sub region start
!ABCLib$ according estimated
!ABCLib$ (4.0d0*ChcheS*dlog(NB))/(2.0d0*NPrc)
対象2(アルゴリズム2)
!ABCLib$ select sub region end
!ABCLib$ static select region end1
実行起動前自動チューニング指定、アルゴリズム選択処理の指定
コスト定義関数で使われる入力変数
コスト定義関数
対象領域1、2
ABCLibScript: アルゴリズム選択
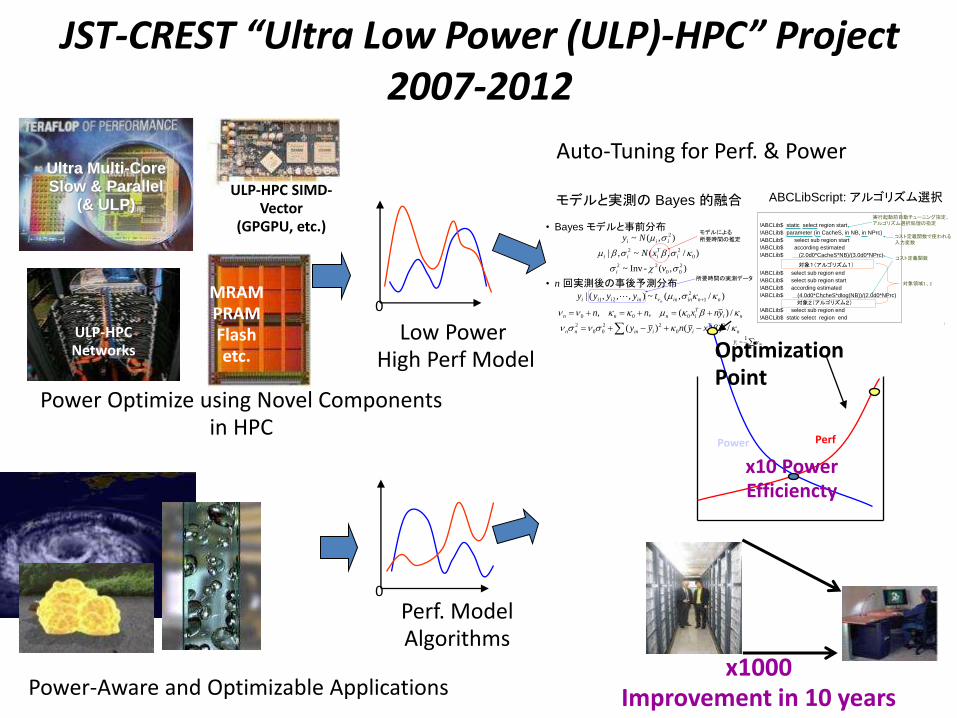
JST-CREST “Ultra Low Power (ULP)-HPC” Project 2007-2012
MRAM PRAM Flash etc.
Ultra Multi-Core Slow & Parallel
(& ULP)
ULP-HPC SIMD-Vector
(GPGPU, etc.)
ULP-HPC Networks
Power Optimize using Novel Components in HPC
Power-Aware and Optimizable Applications
Perf. Model Algorithms
0
Low Power High Perf Model
0
x10 Power Efficiencty
Optimization Point
Power Perf
x1000 Improvement in 10 years
Auto-Tuning for Perf. & Power
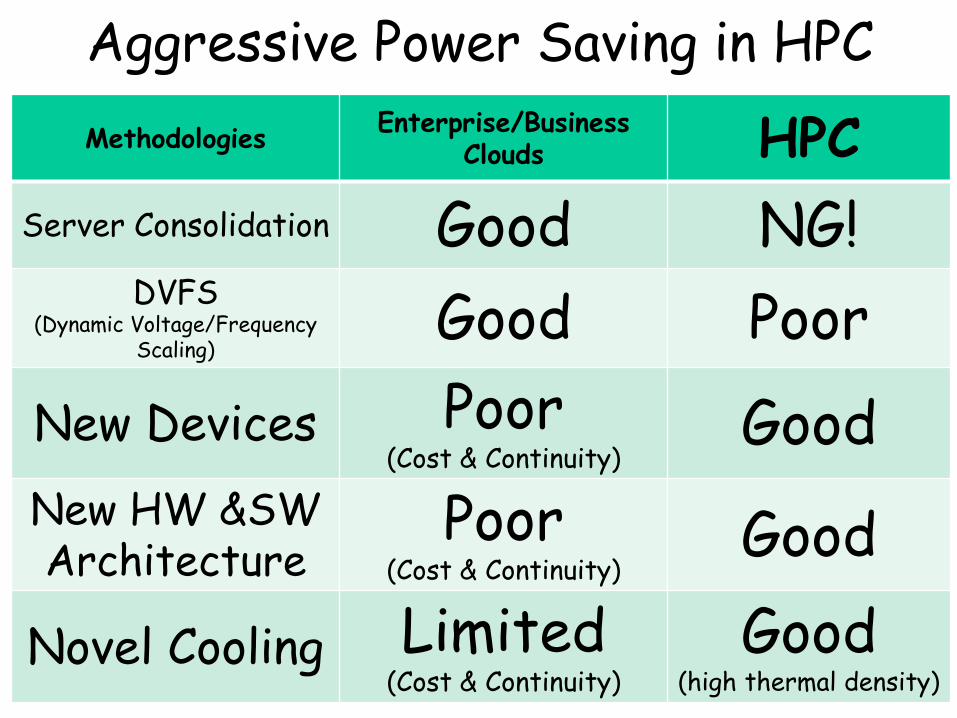
Aggressive Power Saving in HPC
Methodologies Enterprise/Business
Clouds HPC
Server Consolidation Good NG! DVFS
(Dynamic Voltage/Frequency Scaling)
Good Poor
New Devices Poor (Cost & Continuity)
Good
New HW &SW Architecture
Poor (Cost & Continuity)
Good
Novel Cooling Limited (Cost & Continuity)
Good (high thermal density)
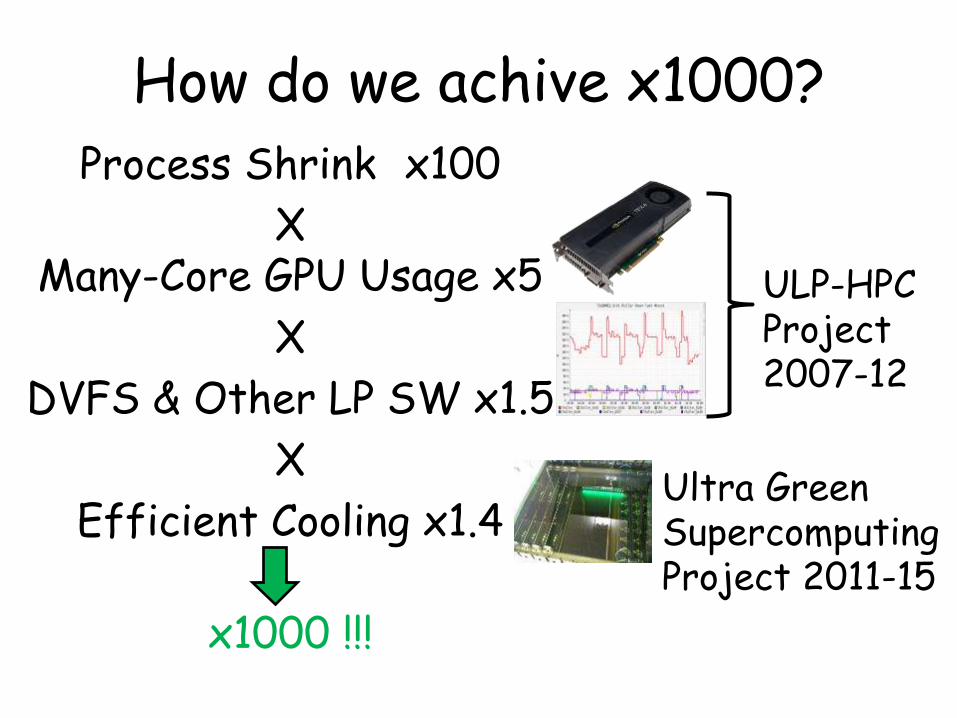
How do we achive x1000? Process Shrink x100
X Many-Core GPU Usage x5
X
DVFS & Other LP SW x1.5
X
Efficient Cooling x1.4
x1000 !!!
ULP-HPC Project 2007-12
Ultra Green Supercomputing Project 2011-15
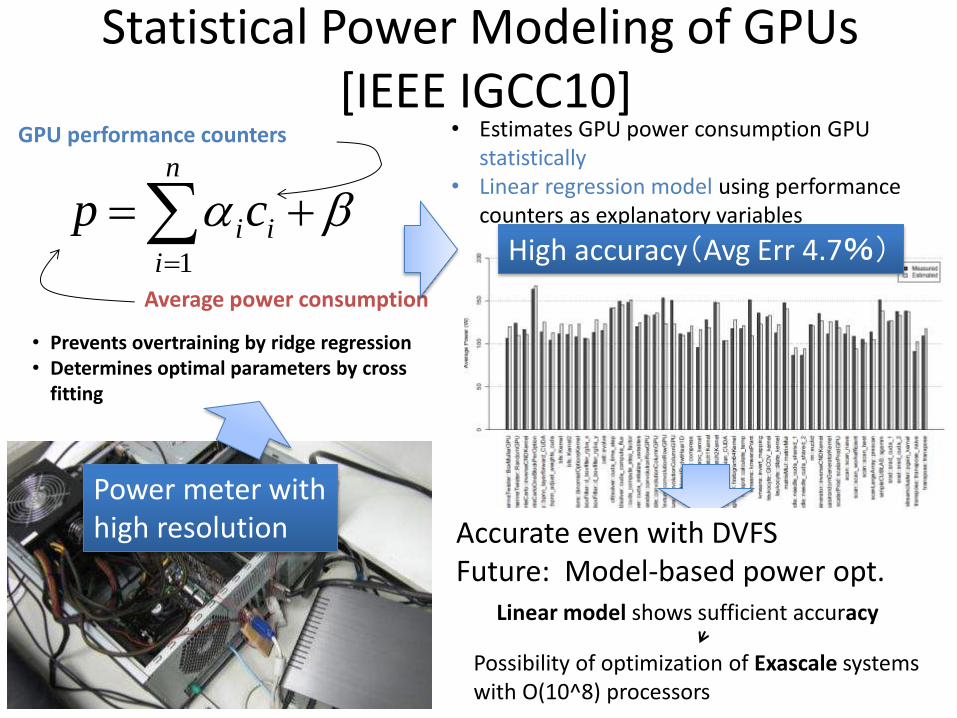
Statistical Power Modeling of GPUs [IEEE IGCC10]
i
n
i
icp1
• Prevents overtraining by ridge regression • Determines optimal parameters by cross
fitting
Average power consumption
GPU performance counters • Estimates GPU power consumption GPU statistically
• Linear regression model using performance counters as explanatory variables
Power meter with high resolution
High accuracy(Avg Err 4.7%)
Accurate even with DVFS Future: Model-based power opt.
Linear model shows sufficient accuracy
Possibility of optimization of Exascale systems with O(10^8) processors
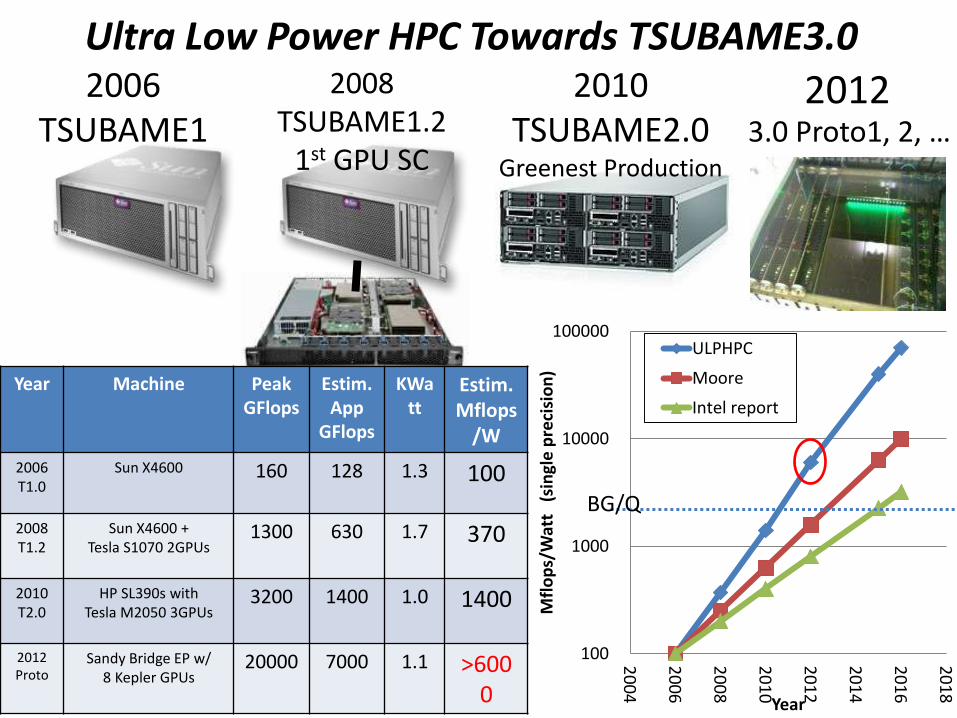
2006 TSUBAME1
2012 3.0 Proto1, 2, …
Ultra Low Power HPC Towards TSUBAME3.0 2010
TSUBAME2.0 Greenest Production
2008 TSUBAME1.2
1st GPU SC
100
1000
10000
1000002
00
4
20
06
20
08
20
10
20
12
20
14
20
16
20
18
Mfl
op
s/W
att
(sin
gle
pre
cisi
on
)
Year
ULPHPC
Moore
Intel reportYear Machine Peak
GFlops Estim. App
GFlops
KWatt
Estim. Mflops
/W
2006 T1.0
Sun X4600 160 128 1.3 100
2008 T1.2
Sun X4600 + Tesla S1070 2GPUs
1300 630 1.7 370
2010 T2.0
HP SL390s with Tesla M2050 3GPUs
3200 1400 1.0 1400
2012 Proto
Sandy Bridge EP w/ 8 Kepler GPUs
20000 7000 1.1 >6000
BG/Q
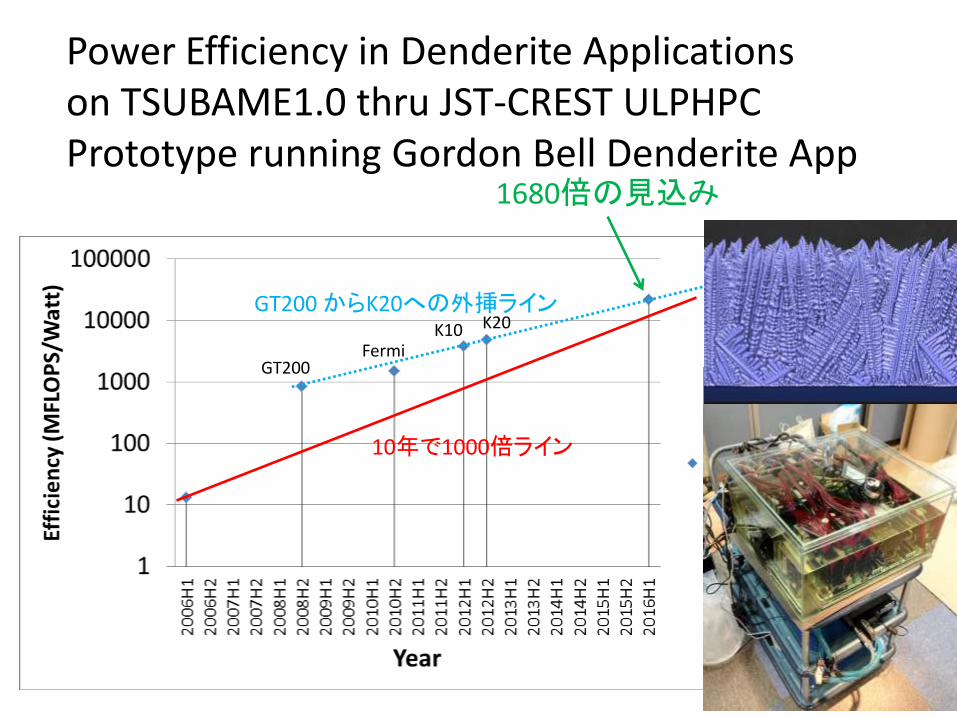
Power Efficiency in Denderite Applications on TSUBAME1.0 thru JST-CREST ULPHPC Prototype running Gordon Bell Denderite App
10年で1000倍ライン
GT200 からK20への外挿ライン
1680倍の見込み
FermiGT200
K10 K20
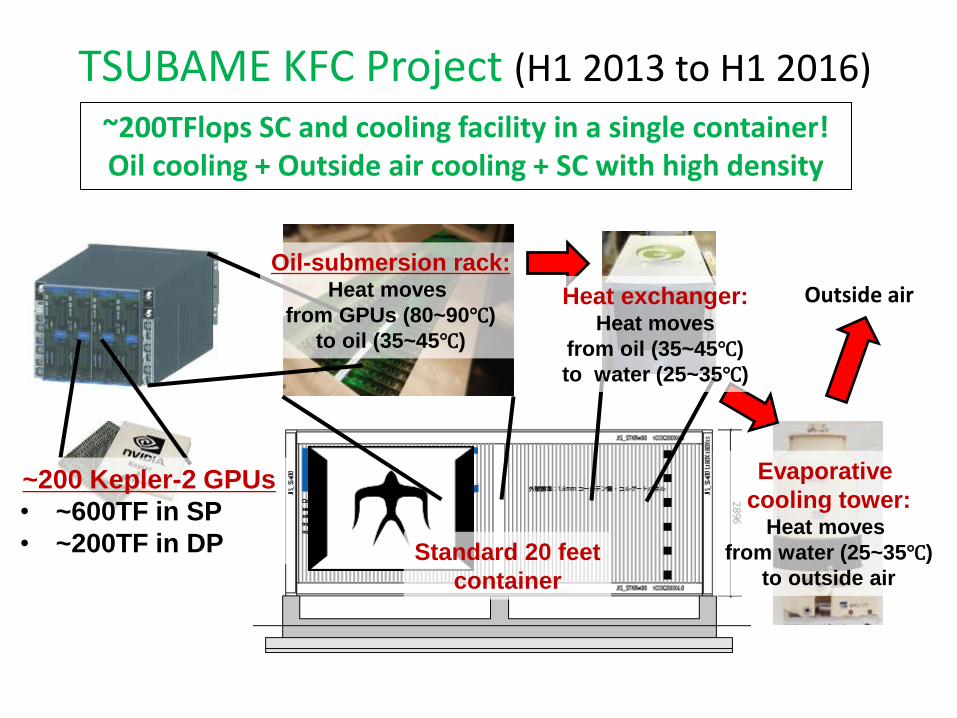
TSUBAME KFC Project (H1 2013 to H1 2016)
Evaporative
cooling tower: Heat moves
from water (25~35℃)
to outside air
Outside air
~200TFlops SC and cooling facility in a single container! Oil cooling + Outside air cooling + SC with high density
Oil-submersion rack: Heat moves
from GPUs (80~90℃)
to oil (35~45℃)
~200 Kepler-2 GPUs
• ~600TF in SP
• ~200TF in DP Standard 20 feet
container
Heat exchanger: Heat moves
from oil (35~45℃)
to water (25~35℃)
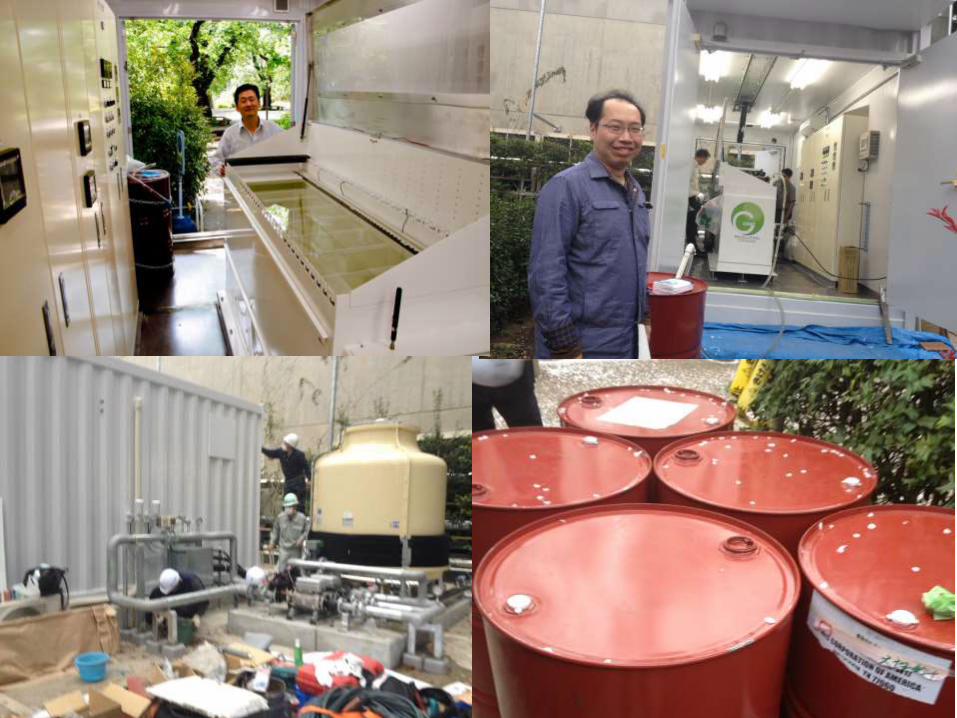
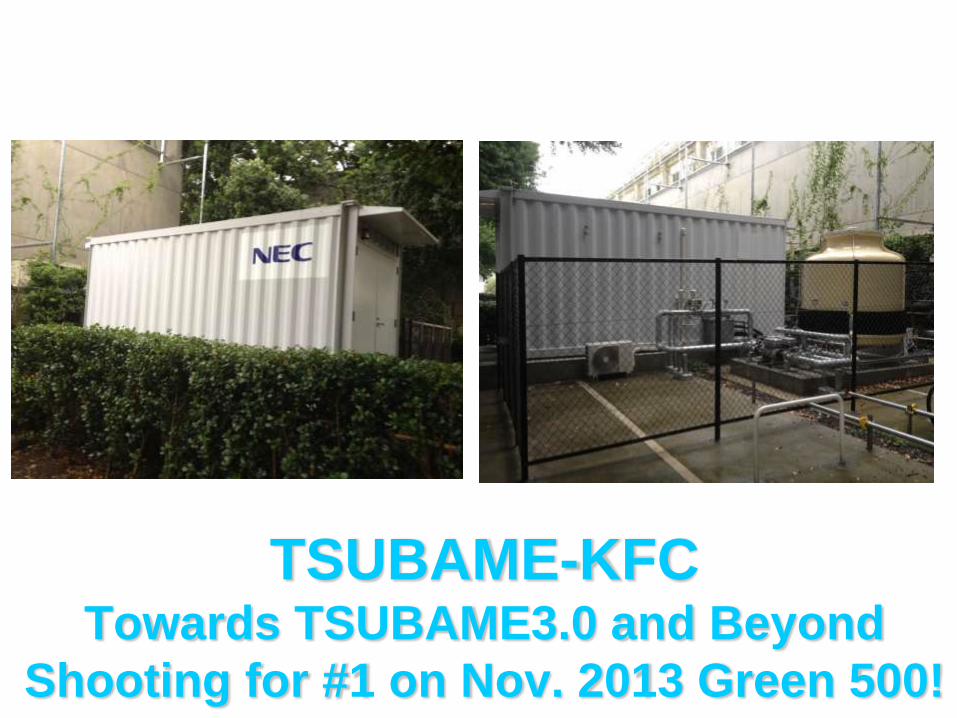
TSUBAME-KFC Towards TSUBAME3.0 and Beyond
Shooting for #1 on Nov. 2013 Green 500!
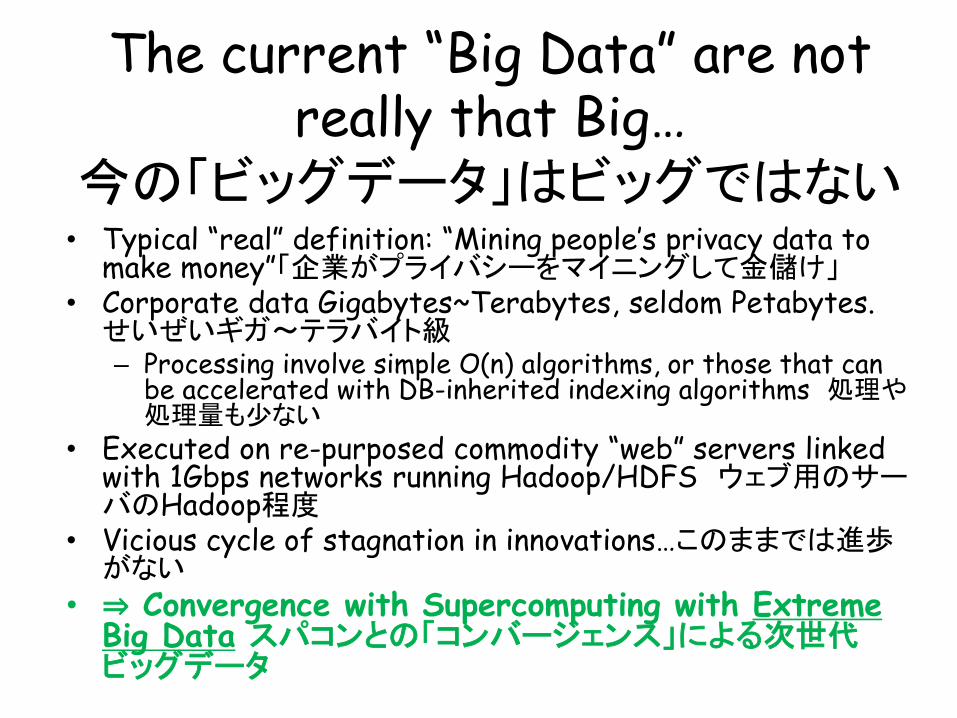
The current “Big Data” are not really that Big…
今の「ビッグデータ」はビッグではない • Typical “real” definition: “Mining people’s privacy data to
make money”「企業がプライバシーをマイニングして金儲け」 • Corporate data Gigabytes~Terabytes, seldom Petabytes.
せいぜいギガ~テラバイト級 – Processing involve simple O(n) algorithms, or those that can
be accelerated with DB-inherited indexing algorithms 処理や処理量も少ない
• Executed on re-purposed commodity “web” servers linked with 1Gbps networks running Hadoop/HDFS ウェブ用のサーバのHadoop程度
• Vicious cycle of stagnation in innovations…このままでは進歩がない
• ⇒ Convergence with Supercomputing with Extreme Big Data スパコンとの「コンバージェンス」による次世代ビッグデータ
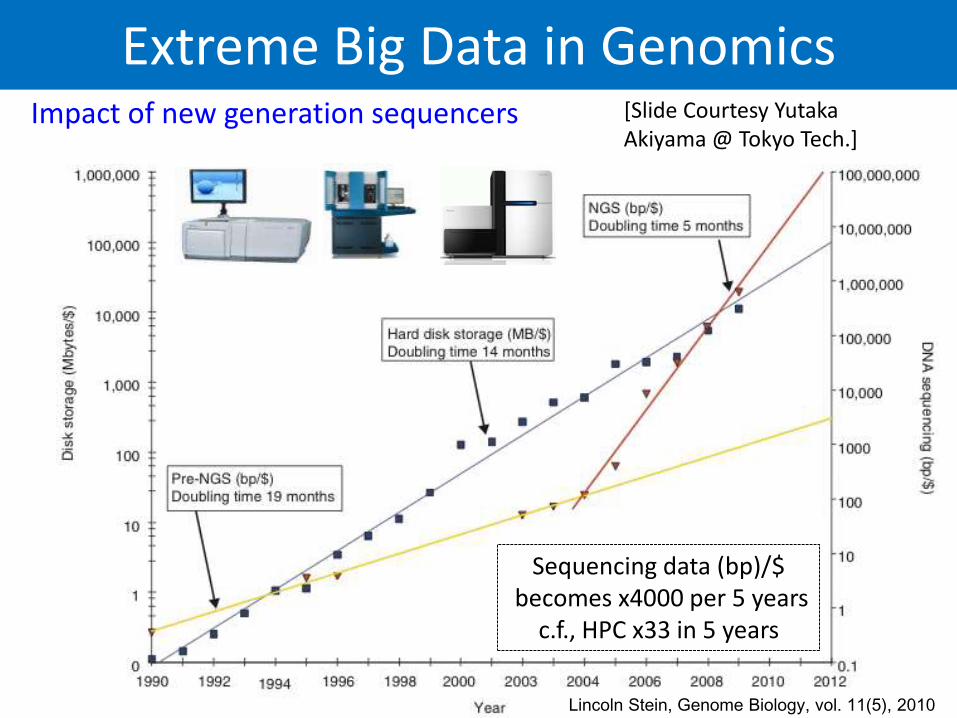
Extreme Big Data in Genomics
Lincoln Stein, Genome Biology, vol. 11(5), 2010
Sequencing data (bp)/$ becomes x4000 per 5 years
c.f., HPC x33 in 5 years
Impact of new generation sequencers [Slide Courtesy Yutaka Akiyama @ Tokyo Tech.]
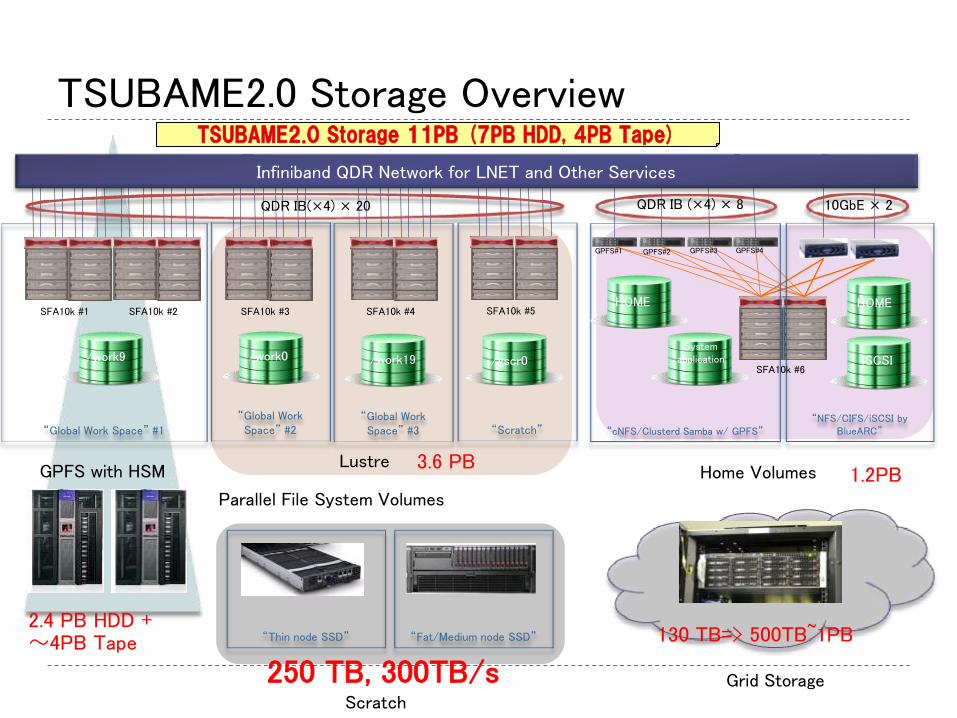
TSUBAME2.0 Storage Overview
“Global Work Space” #1
SFA10k #5
“Global Work Space” #2
“Global Work Space” #3 “Scratch”
SFA10k #4 SFA10k #3 SFA10k #2 SFA10k #1
/work9 /work0 /work19 /gscr0
“cNFS/Clusterd Samba w/ GPFS”
HOME
System application
“NFS/CIFS/iSCSI by BlueARC”
HOME
iSCSI
Infiniband QDR Network for LNET and Other Services
SFA10k #6
GPFS#1 GPFS#2 GPFS#3 GPFS#4
Parallel File System Volumes
Home Volumes
QDR IB(×4) × 20 10GbE × 2 QDR IB (×4) × 8
Lustre GPFS with HSM
“Thin node SSD” “Fat/Medium node SSD”
Scratch Grid Storage
1.2PB
2.4 PB HDD + 〜4PB Tape
3.6 PB
TSUBAME2.0 Storage 11PB (7PB HDD, 4PB Tape)
130 TB=> 500TB~1PB
250 TB, 300TB/s
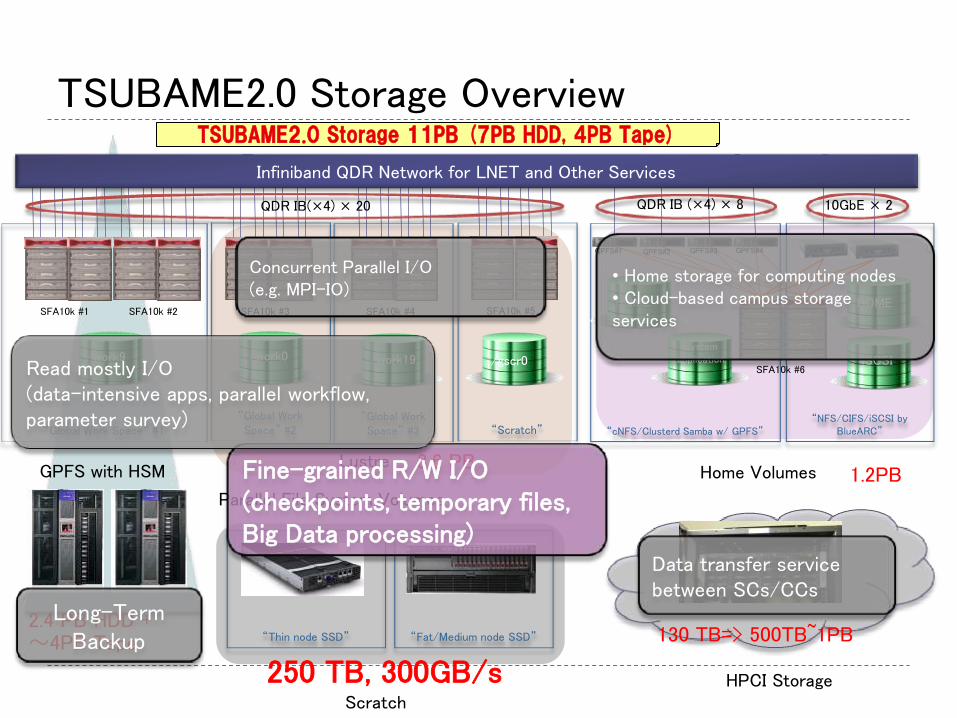
TSUBAME2.0 Storage Overview
“Global Work Space” #1
SFA10k #5
“Global Work Space” #2
“Global Work Space” #3 “Scratch”
SFA10k #4 SFA10k #3 SFA10k #2 SFA10k #1
/work9 /work0 /work19 /gscr0
“cNFS/Clusterd Samba w/ GPFS”
HOME
System application
“NFS/CIFS/iSCSI by BlueARC”
HOME
iSCSI
Infiniband QDR Network for LNET and Other Services
SFA10k #6
GPFS#1 GPFS#2 GPFS#3 GPFS#4
Parallel File System Volumes
Home Volumes
QDR IB(×4) × 20 10GbE × 2 QDR IB (×4) × 8
Lustre GPFS with HSM
“Thin node SSD” “Fat/Medium node SSD”
Scratch HPCI Storage
1.2PB
2.4 PB HDD + 〜4PB Tape
3.6 PB
130 TB=> 500TB~1PB
250 TB, 300GB/s
• Home storage for computing nodes • Cloud-based campus storage services
Concurrent Parallel I/O (e.g. MPI-IO)
Fine-grained R/W I/O (checkpoints, temporary files, Big Data processing)
Data transfer service between SCs/CCs
Read mostly I/O (data-intensive apps, parallel workflow, parameter survey)
Long-Term Backup
TSUBAME2.0 Storage 11PB (7PB HDD, 4PB Tape)
NEC Confidential
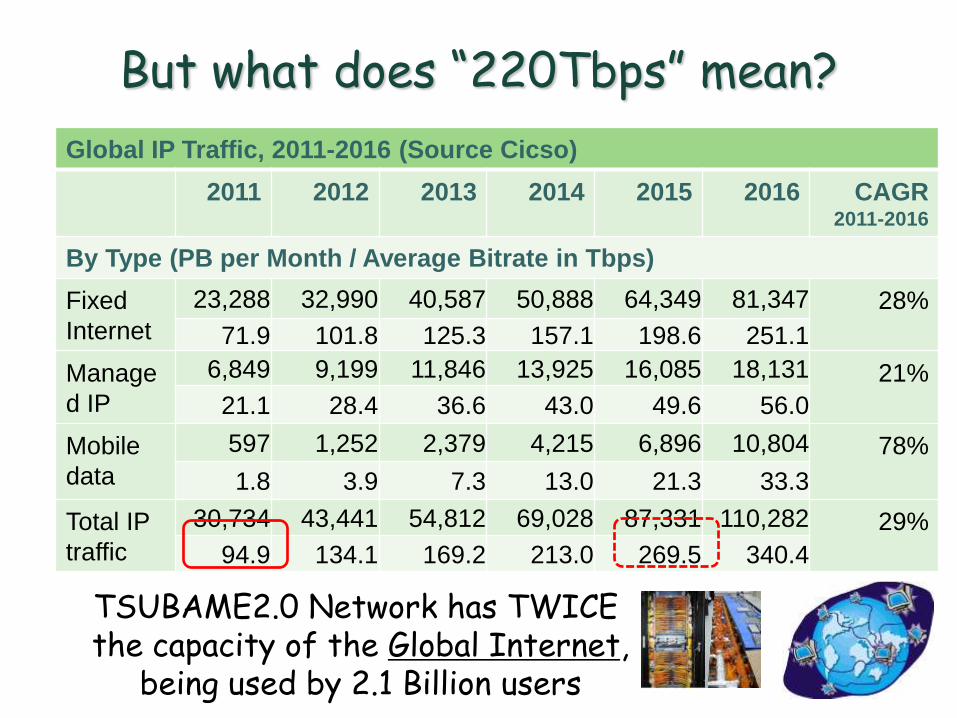
But what does “220Tbps” mean?
Global IP Traffic, 2011-2016 (Source Cicso)
2011 2012 2013 2014 2015 2016 CAGR 2011-2016
By Type (PB per Month / Average Bitrate in Tbps)
Fixed
Internet
23,288 32,990 40,587 50,888 64,349 81,347 28%
71.9 101.8 125.3 157.1 198.6 251.1
Manage
d IP
6,849 9,199 11,846 13,925 16,085 18,131 21%
21.1 28.4 36.6 43.0 49.6 56.0
Mobile
data
597 1,252 2,379 4,215 6,896 10,804 78%
1.8 3.9 7.3 13.0 21.3 33.3
Total IP
traffic
30,734 43,441 54,812 69,028 87,331 110,282 29%
94.9 134.1 169.2 213.0 269.5 340.4
TSUBAME2.0 Network has TWICE the capacity of the Global Internet,
being used by 2.1 Billion users
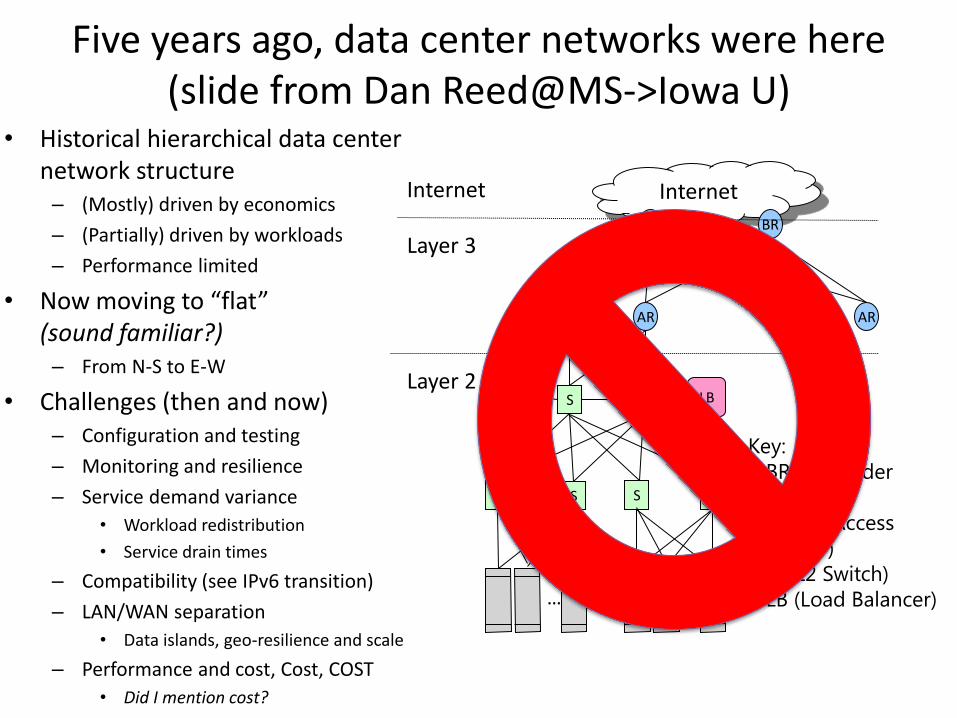
• Historical hierarchical data center network structure – (Mostly) driven by economics
– (Partially) driven by workloads
– Performance limited
• Now moving to “flat” (sound familiar?) – From N-S to E-W
• Challenges (then and now) – Configuration and testing
– Monitoring and resilience
– Service demand variance
• Workload redistribution
• Service drain times
– Compatibility (see IPv6 transition)
– LAN/WAN separation
• Data islands, geo-resilience and scale
– Performance and cost, Cost, COST
• Did I mention cost?
Five years ago, data center networks were here (slide from Dan Reed@MS->Iowa U)
Internet
BR BR
AR AR AR AR …
S S LB LB
Layer 3
Internet
S S
…
S S
…
…
Layer 2
Key:
• BR (L3 Border
Router)
• AR (L3 Access
Router)
• S (L2 Switch)
• LB (Load Balancer)
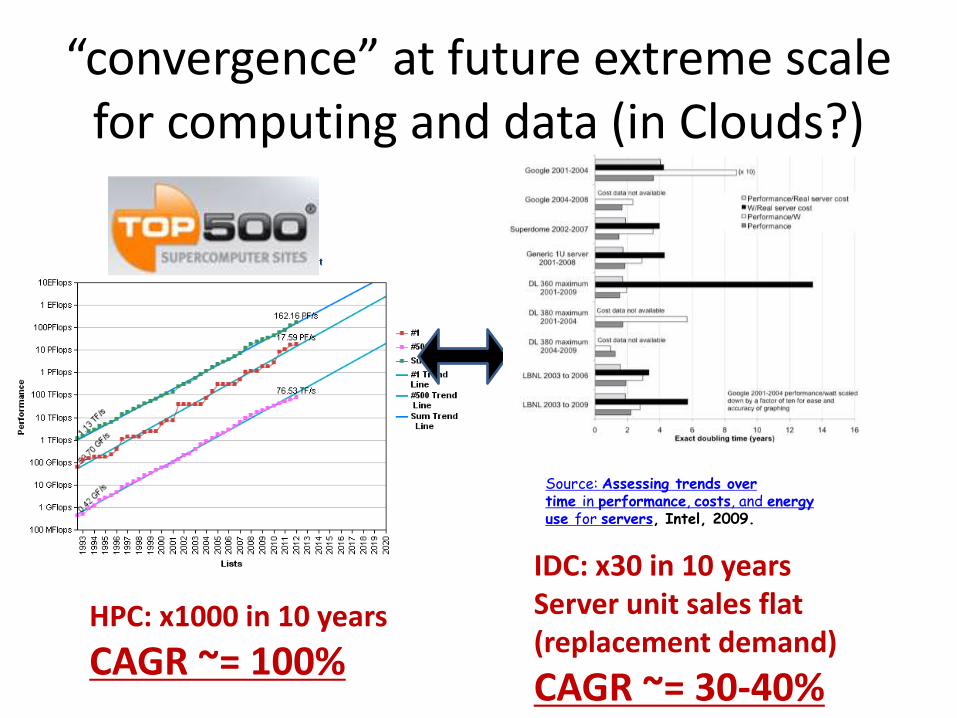
“convergence” at future extreme scale for computing and data (in Clouds?)
HPC: x1000 in 10 years
CAGR ~= 100%
Source: Assessing trends over time in performance, costs, and energy use for servers, Intel, 2009.
IDC: x30 in 10 years Server unit sales flat (replacement demand)
CAGR ~= 30-40%
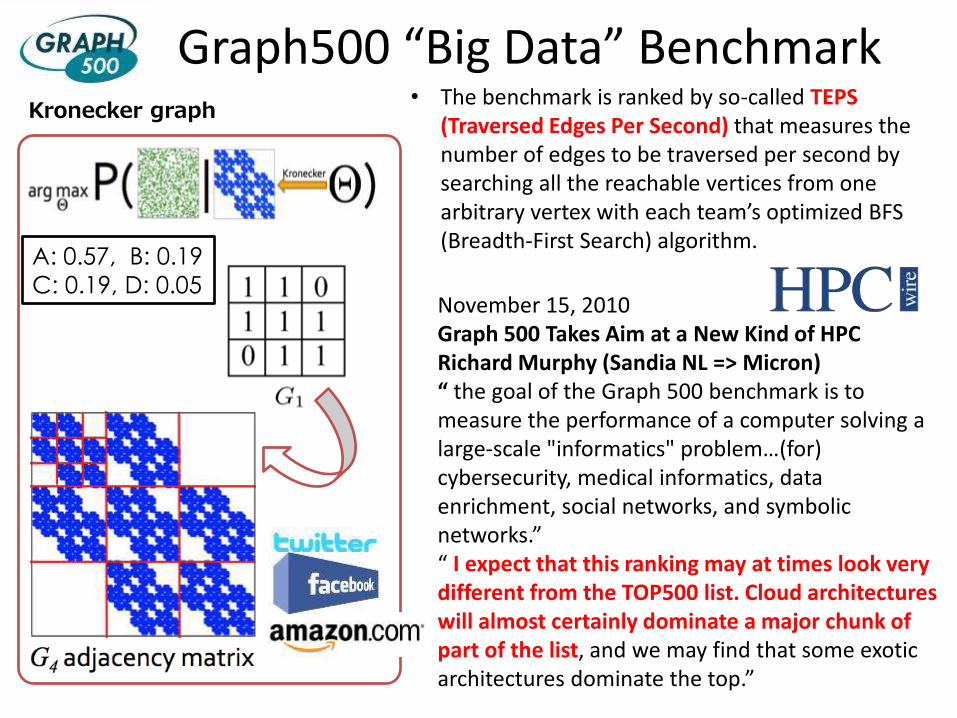
Graph500 “Big Data” Benchmark Kronecker graph
A: 0.57, B: 0.19
C: 0.19, D: 0.05
• The benchmark is ranked by so-called TEPS (Traversed Edges Per Second) that measures the number of edges to be traversed per second by searching all the reachable vertices from one arbitrary vertex with each team’s optimized BFS (Breadth-First Search) algorithm.
November 15, 2010 Graph 500 Takes Aim at a New Kind of HPC Richard Murphy (Sandia NL => Micron) “ the goal of the Graph 500 benchmark is to measure the performance of a computer solving a large-scale "informatics" problem…(for) cybersecurity, medical informatics, data enrichment, social networks, and symbolic networks.” “ I expect that this ranking may at times look very different from the TOP500 list. Cloud architectures will almost certainly dominate a major chunk of part of the list, and we may find that some exotic architectures dominate the top.”
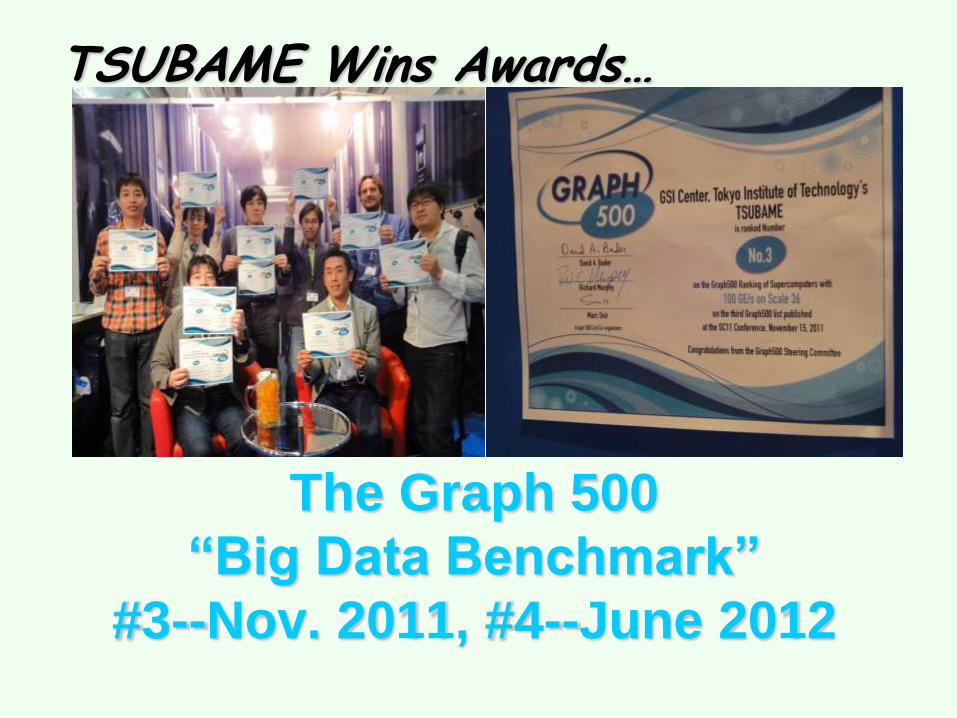
The Graph 500
“Big Data Benchmark”
#3--Nov. 2011, #4--June 2012
TSUBAME Wins Awards…
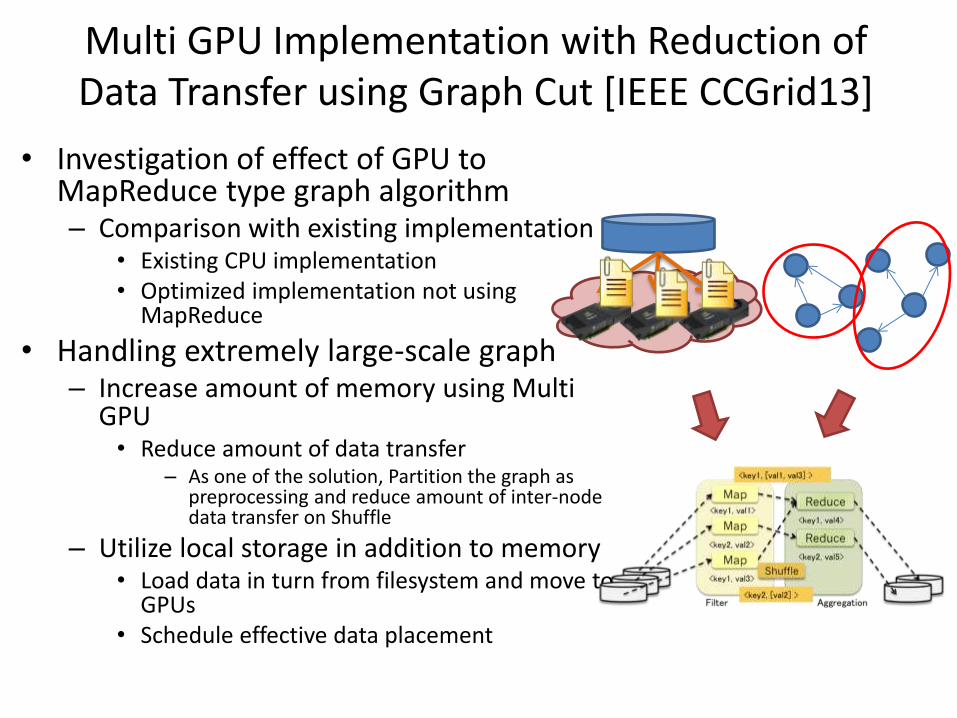
Multi GPU Implementation with Reduction of Data Transfer using Graph Cut [IEEE CCGrid13]
• Investigation of effect of GPU to MapReduce type graph algorithm – Comparison with existing implementation
• Existing CPU implementation • Optimized implementation not using
MapReduce
• Handling extremely large-scale graph – Increase amount of memory using Multi
GPU • Reduce amount of data transfer
– As one of the solution, Partition the graph as preprocessing and reduce amount of inter-node data transfer on Shuffle
– Utilize local storage in addition to memory • Load data in turn from filesystem and move to
GPUs • Schedule effective data placement
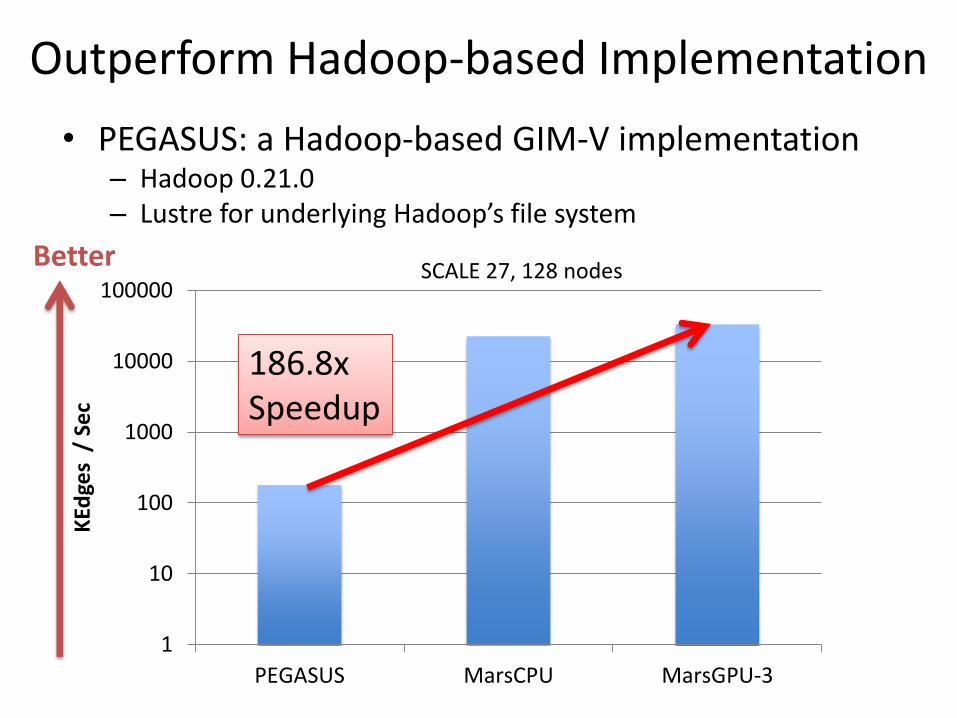
1
10
100
1000
10000
100000
PEGASUS MarsCPU MarsGPU-3
KEd
ges
/ S
ec
Outperform Hadoop-based Implementation
• PEGASUS: a Hadoop-based GIM-V implementation – Hadoop 0.21.0 – Lustre for underlying Hadoop’s file system
186.8x Speedup
SCALE 27, 128 nodes Better
71
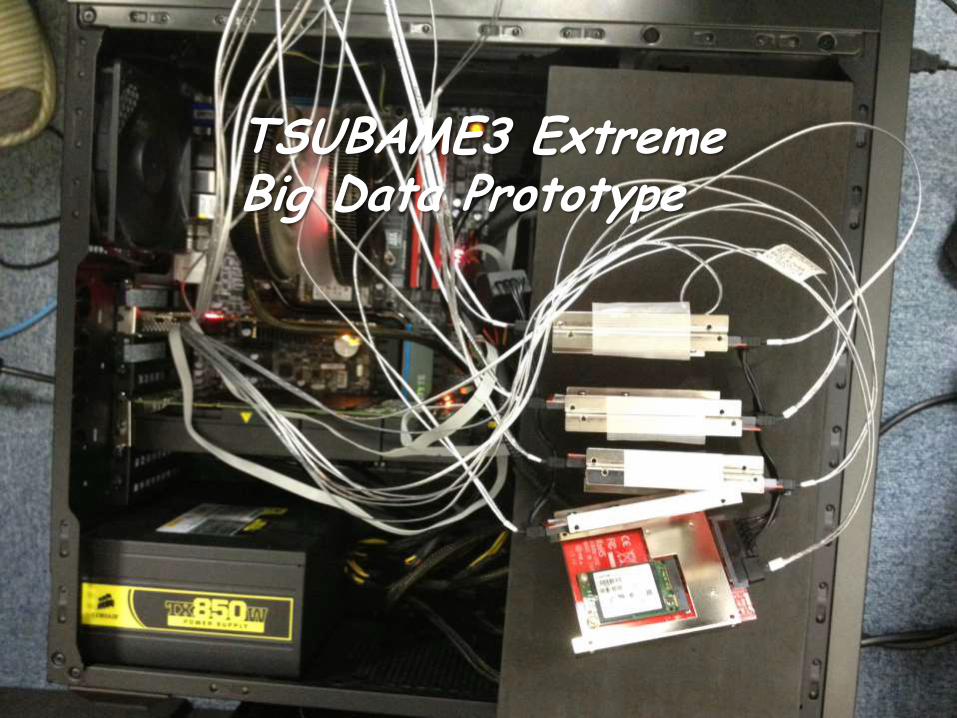
TSUBAME3 Extreme Big Data Prototype
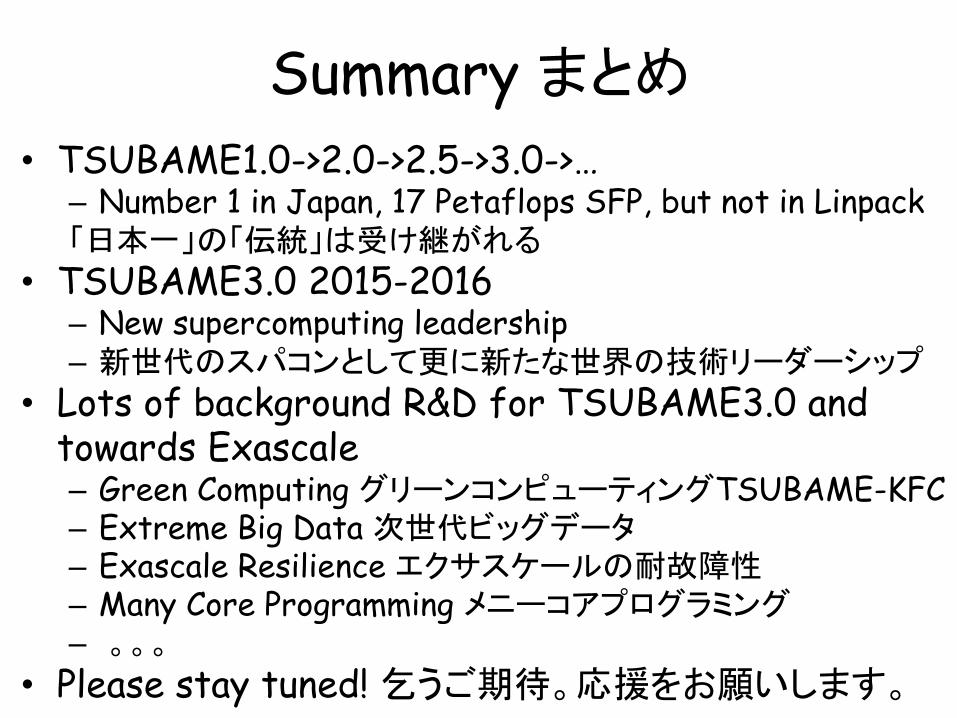
Summary まとめ • TSUBAME1.0->2.0->2.5->3.0->…
– Number 1 in Japan, 17 Petaflops SFP, but not in Linpack 「日本一」の「伝統」は受け継がれる
• TSUBAME3.0 2015-2016 – New supercomputing leadership – 新世代のスパコンとして更に新たな世界の技術リーダーシップ
• Lots of background R&D for TSUBAME3.0 and towards Exascale – Green Computing グリーンコンピューティングTSUBAME-KFC – Extreme Big Data 次世代ビッグデータ – Exascale Resilience エクサスケールの耐故障性 – Many Core Programming メニーコアプログラミング – 。。。
• Please stay tuned! 乞うご期待。応援をお願いします。