Embed Size (px)
Citation preview
Tutorial
Session 2b: 0Day and Undiscovered Vulnerabilities
Miles McQueen1, MS and Sean McBride2, MA1University of Idaho and Idaho National Laboratory
2Critical Intelligence
August 11, 2009Idaho Falls, Idaho
2
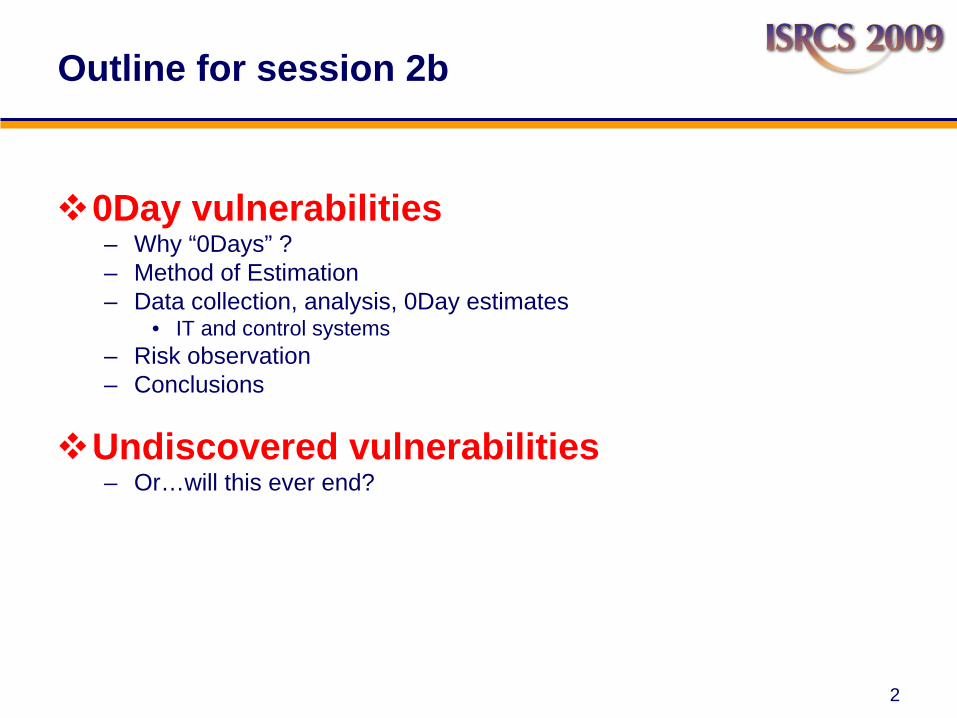
Outline for session 2b
0Day vulnerabilities– Why “0Days” ?– Method of Estimation– Data collection, analysis, 0Day estimates
• IT and control systems– Risk observation– Conclusions
Undiscovered vulnerabilities– Or…will this ever end?
3
0Day vulnerability
Definition:
A 0Day vulnerability is any vulnerability, in deployed software, that has been discovered by at least one person but has not yet been publicly announced or patched.
4
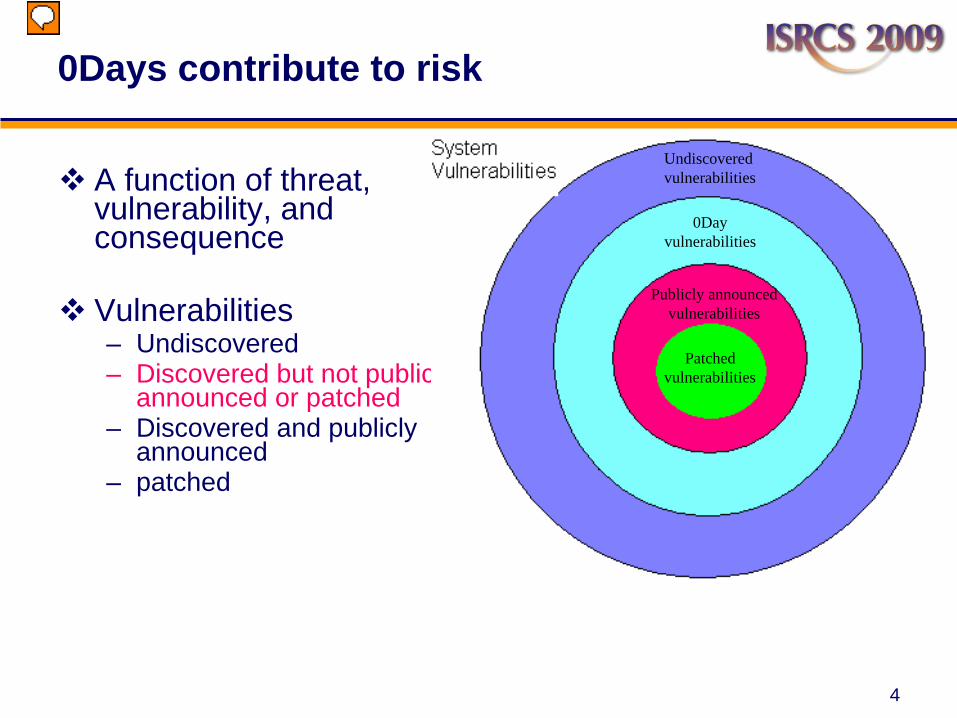
0Days contribute to risk
A function of threat, vulnerability, and consequence
Vulnerabilities– Undiscovered– Discovered but not publicly
announced or patched– Discovered and publicly
announced– patched
Patchedvulnerabilities
Publicly announced vulnerabilities
0Day vulnerabilities
Undiscovered vulnerabilities
5
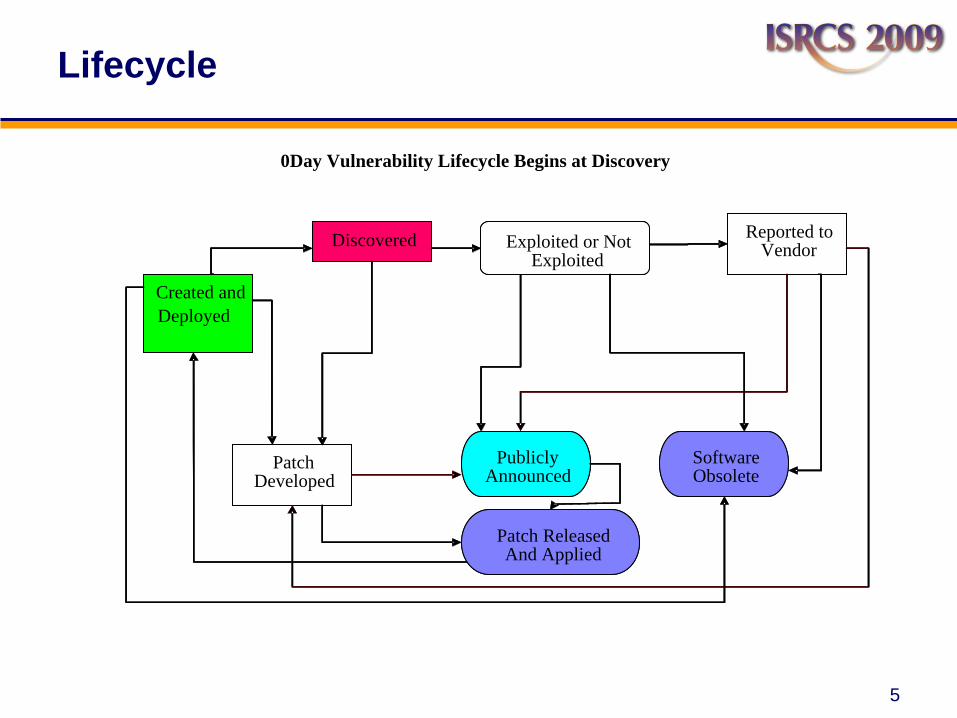
Lifecycle
0Day Vulnerability Lifecycle Begins at Discovery
Created and Deployed
Discovered
Patch Developed
Reported to VendorExploited or Not
Exploited
Patch ReleasedAnd Applied
Publicly Announced
Software Obsolete
0Day Vulnerability Lifecycle Begins at Discovery
Created and Deployed
Discovered
Patch Developed
Reported to VendorExploited or Not
Exploited
Patch ReleasedAnd Applied
Publicly Announced
Software Obsolete
6
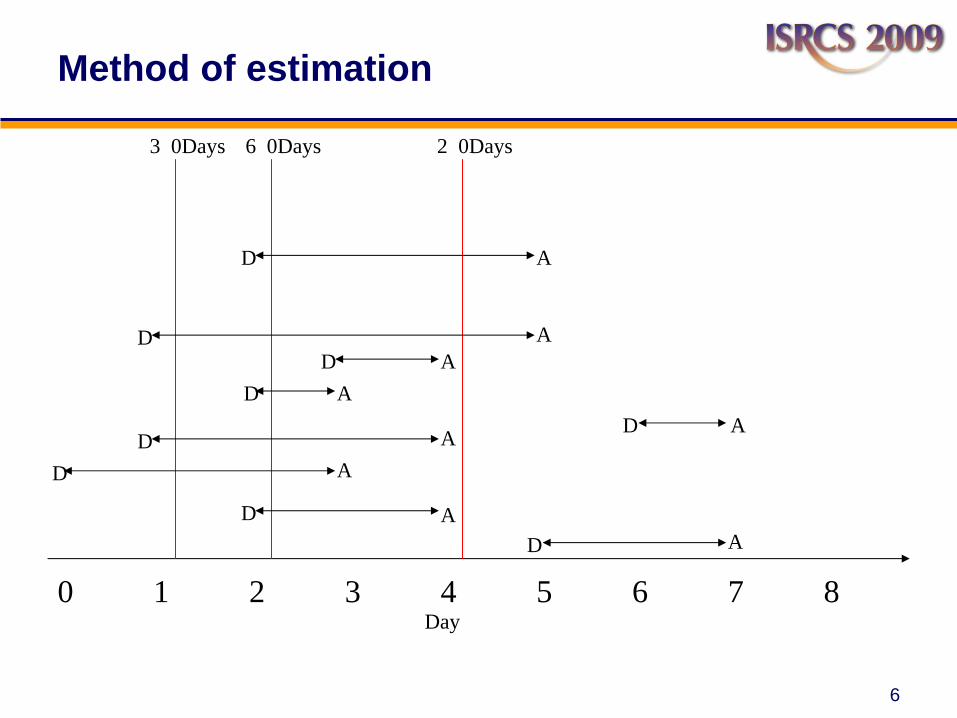
Method of estimation
Day0 1 2 3 4 5 6 7 8
3 0Days 6 0Days 2 0Days
A
A
D
D
A
A
AD
D
D
A
AD
D
A
AD
D
7
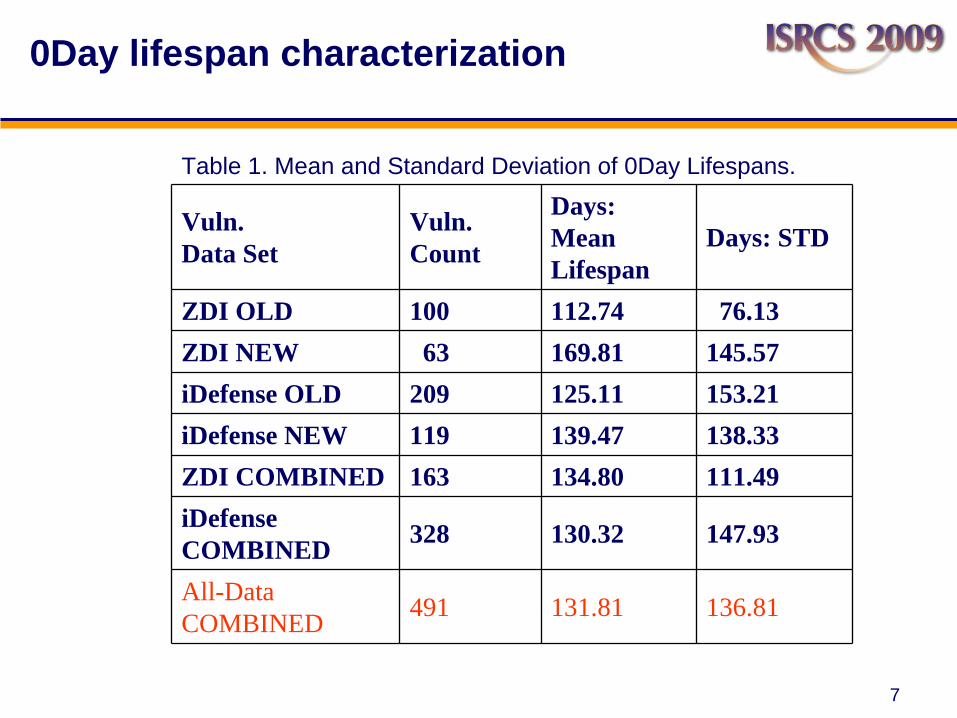
0Day lifespan characterization
Table 1. Mean and Standard Deviation of 0Day Lifespans.
Vuln. Data Set
Vuln.Count
Days: Mean Lifespan
Days: STD
ZDI OLD 100 112.74 76.13ZDI NEW 63 169.81 145.57iDefense OLD 209 125.11 153.21iDefense NEW 119 139.47 138.33ZDI COMBINED 163 134.80 111.49iDefense COMBINED 328 130.32 147.93
All-Data COMBINED 491 131.81 136.81
8
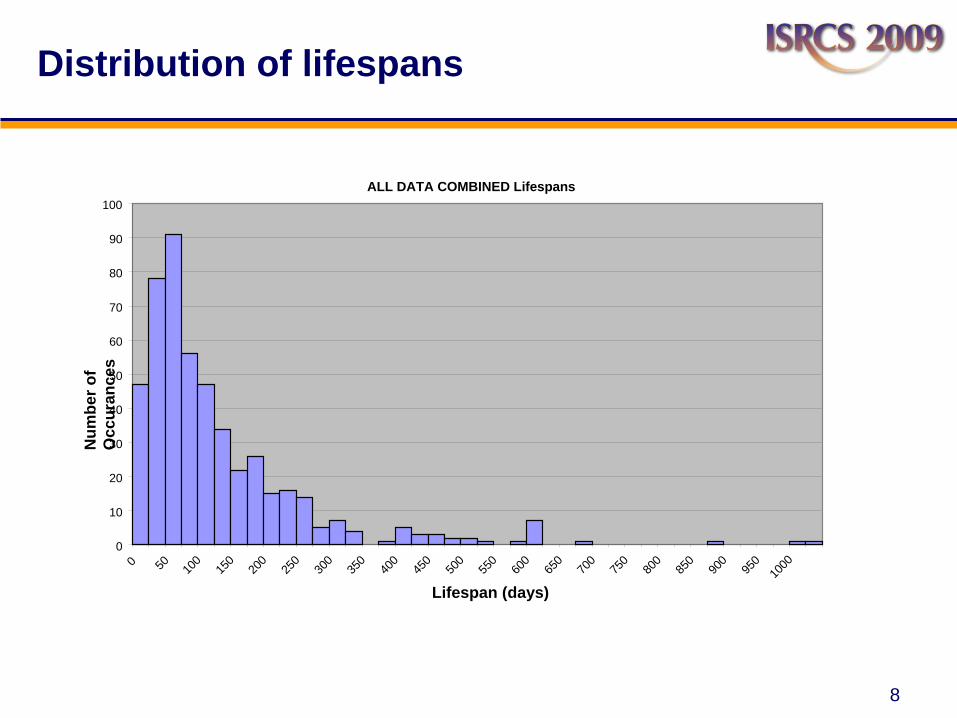
Distribution of lifespans
ALL DATA COMBINED Lifespans
0
10
20
30
40
50
60
70
80
90
100
0 50 100
150
200
250
300
350
400
450
500
550
600
650
700
750
800
850
900
950
1000
Lifespan (days)
Num
ber o
f O
ccur
ance
s
9
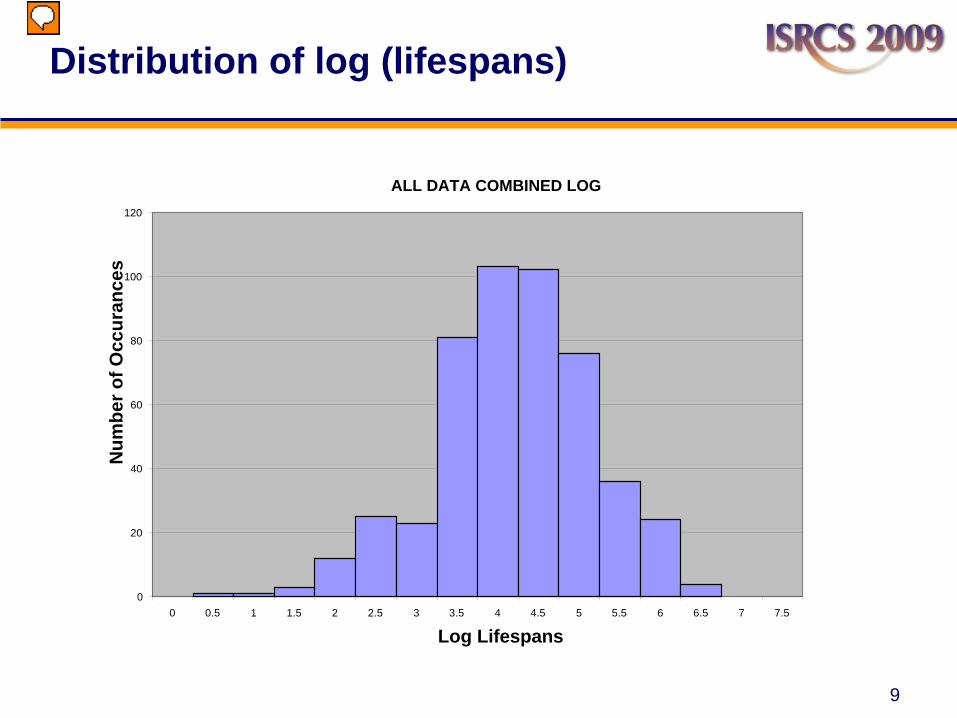
Distribution of log (lifespans)
ALL DATA COMBINED LOG
0
20
40
60
80
100
120
0 0.5 1 1.5 2 2.5 3 3.5 4 4.5 5 5.5 6 6.5 7 7.5
Log Lifespans
Num
ber o
f Occ
uran
ces
10
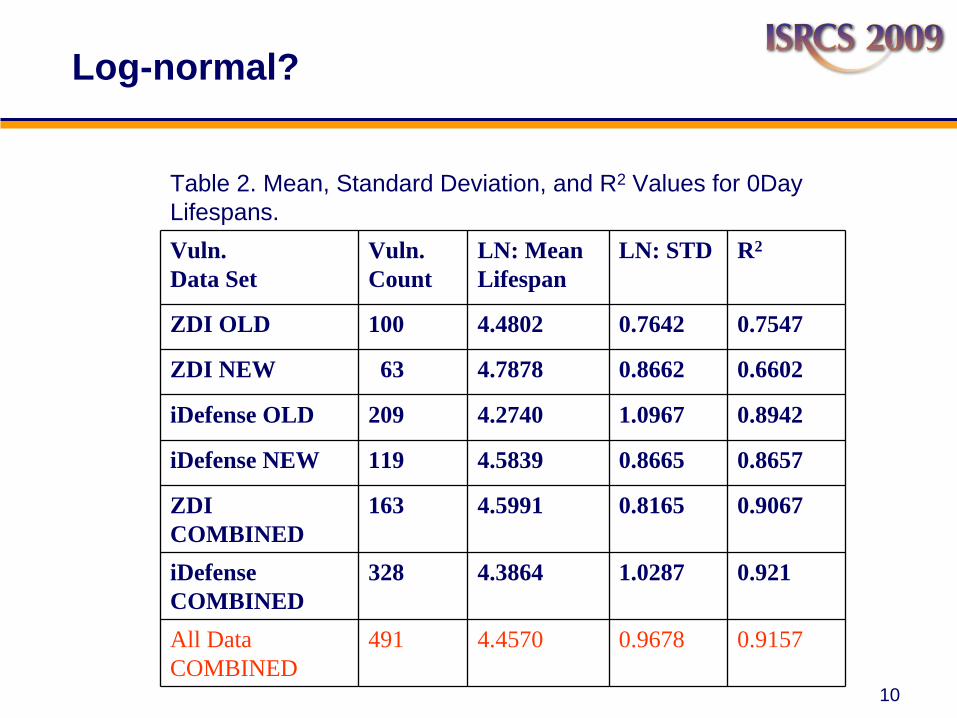
Log-normal?
Table 2. Mean, Standard Deviation, and R2 Values for 0Day Lifespans.Vuln. Data Set
Vuln.Count
LN: Mean Lifespan
LN: STD R2
ZDI OLD 100 4.4802 0.7642 0.7547
ZDI NEW 63 4.7878 0.8662 0.6602
iDefense OLD 209 4.2740 1.0967 0.8942
iDefense NEW 119 4.5839 0.8665 0.8657
ZDI COMBINED
163 4.5991 0.8165 0.9067
iDefense COMBINED
328 4.3864 1.0287 0.921
All DataCOMBINED
491 4.4570 0.9678 0.9157
11
Subset of NVD Vulnerabilities applicable to control systems identified.
Third party software listed on Vendor websites matches NVD “Product”.Manual review of vulnerabilities published since April 2006.
About 12% of all NVD entries applicable.101 of 491 ZDI-iDefense lifespans apply to control systems.
Control System Vulnerabilities
12
0
5
1 0
1 5
2 0
2 5
0 1 2 3 4 5 6 7
L o g L ife s p a n s
Num
ber
of O
ccu
ranc
es
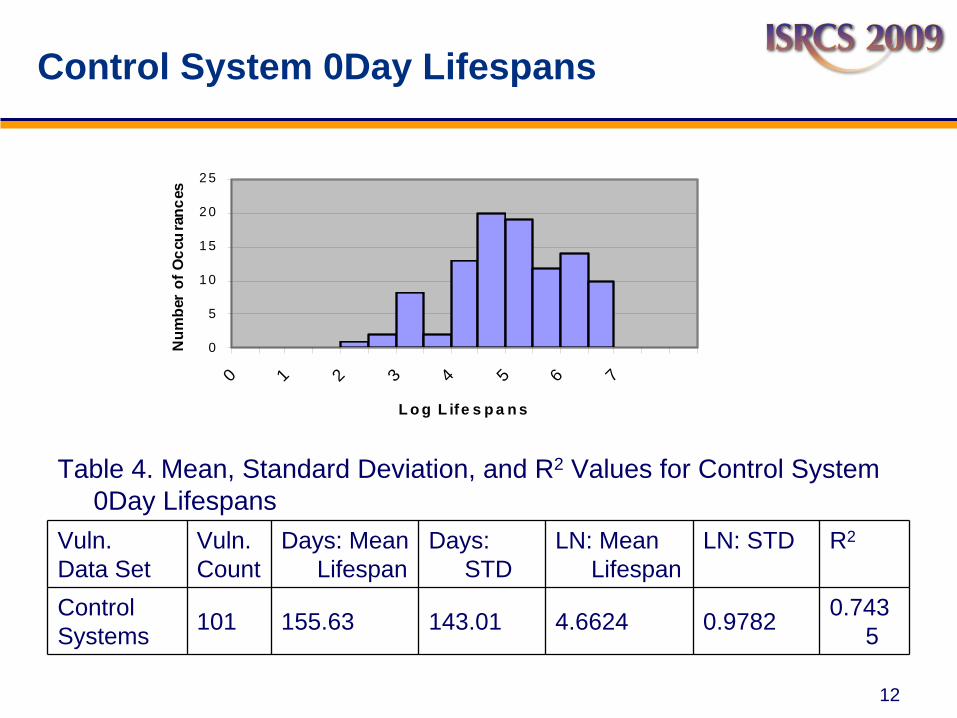
Table 4. Mean, Standard Deviation, and R2 Values for Control System 0Day Lifespans
Vuln. Data Set
Vuln.Count
Days: Mean Lifespan
Days: STD
LN: Mean Lifespan
LN: STD R2
ControlSystems 101 155.63 143.01 4.6624 0.9782 0.743
5
Control System 0Day Lifespans
13
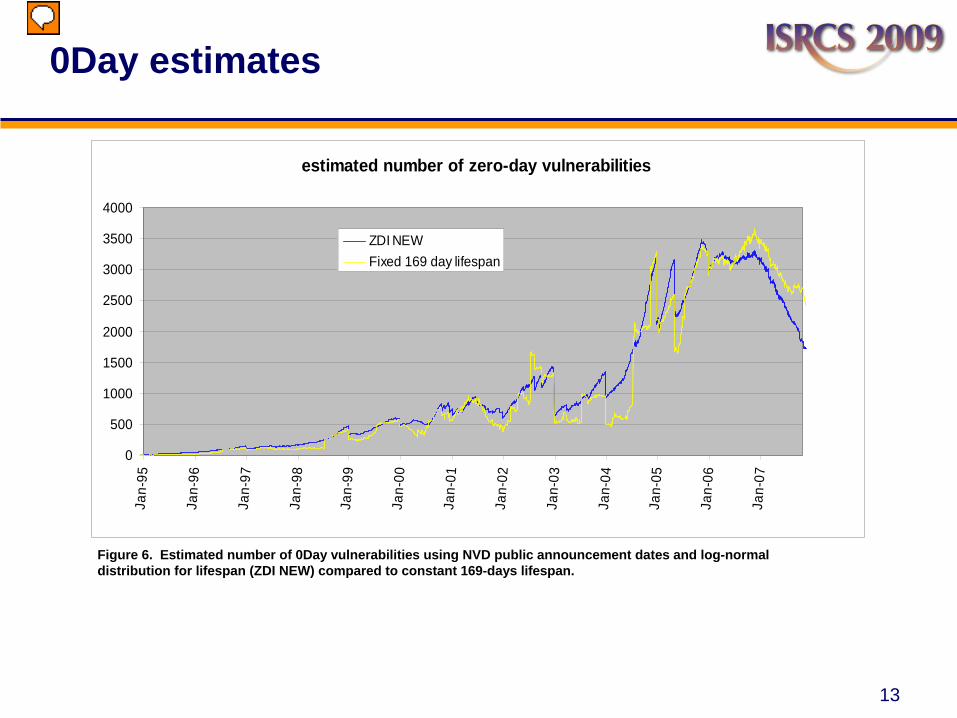
Figure 6. Estimated number of 0Day vulnerabilities using NVD public announcement dates and log-normal distribution for lifespan (ZDI NEW) compared to constant 169-days lifespan.
estimated number of zero-day vulnerabilities
0
500
1000
1500
2000
2500
3000
3500
4000
Jan-
95
Jan-
96
Jan-
97
Jan-
98
Jan-
99
Jan-
00
Jan-
01
Jan-
02
Jan-
03
Jan-
04
Jan-
05
Jan-
06
Jan-
07
ZDI NEWFixed 169 day lifespan
0Day estimates
14
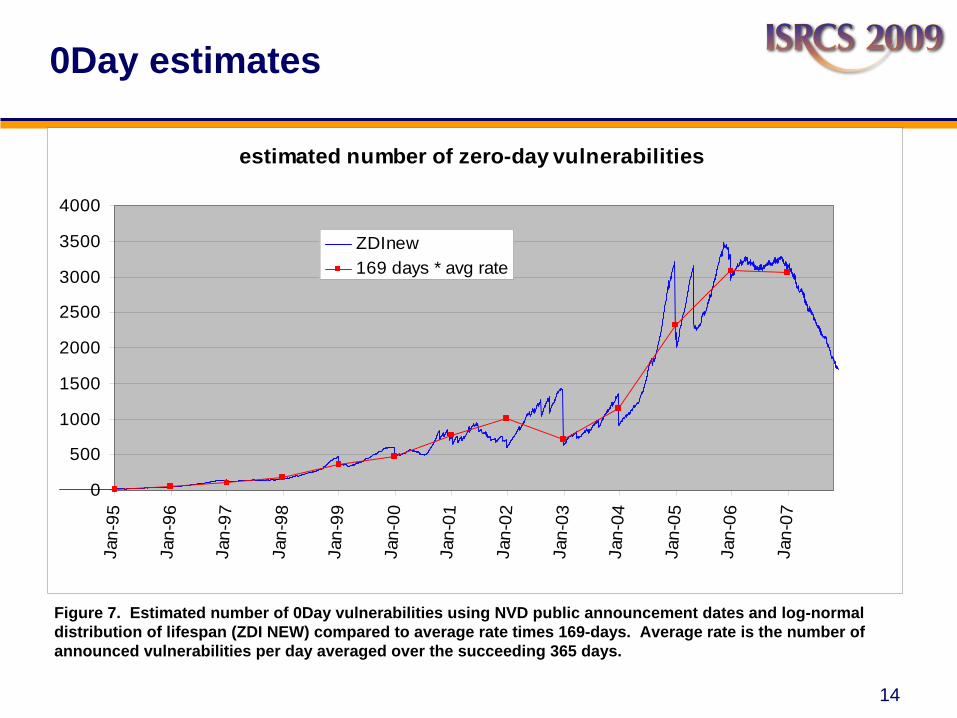
Figure 7. Estimated number of 0Day vulnerabilities using NVD public announcement dates and log-normal distribution of lifespan (ZDI NEW) compared to average rate times 169-days. Average rate is the number of announced vulnerabilities per day averaged over the succeeding 365 days.
estimated number of zero-day vulnerabilities
0
500
1000
1500
2000
2500
3000
3500
4000
Jan-
95
Jan-
96
Jan-
97
Jan-
98
Jan-
99
Jan-
00
Jan-
01
Jan-
02
Jan-
03
Jan-
04
Jan-
05
Jan-
06
Jan-
07
ZDInew169 days * avg rate
0Day estimates
15
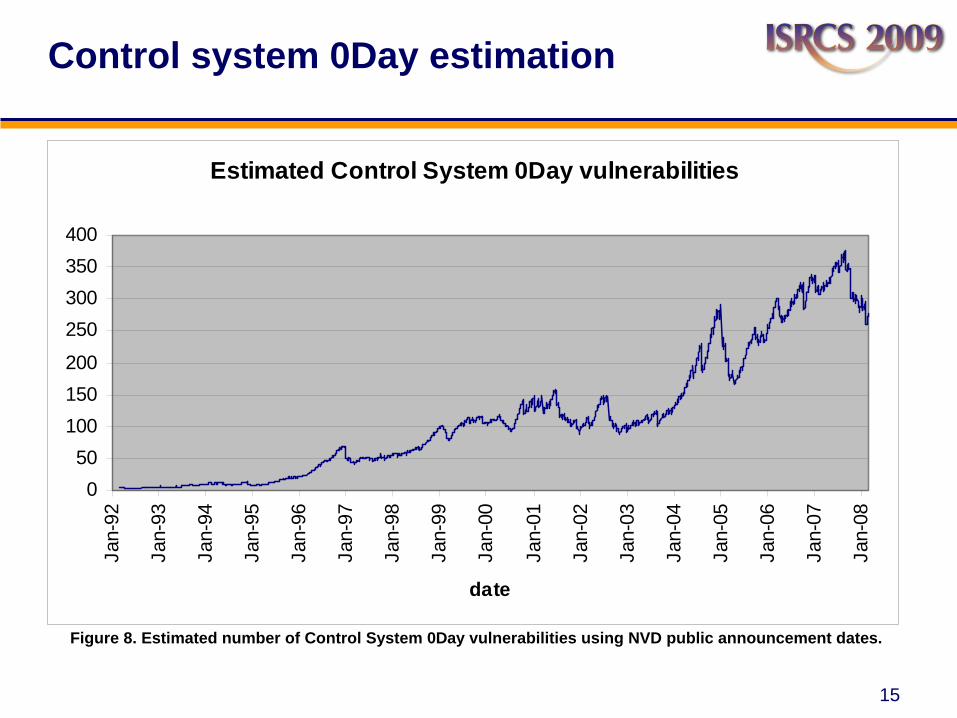
Control system 0Day estimation
Figure 8. Estimated number of Control System 0Day vulnerabilities using NVD public announcement dates.
Estimated Control System 0Day vulnerabilities
050
100150200
250300350400
Jan-
92
Jan-
93
Jan-
94
Jan-
95
Jan-
96
Jan-
97
Jan-
98
Jan-
99
Jan-
00
Jan-
01
Jan-
02
Jan-
03
Jan-
04
Jan-
05
Jan-
06
Jan-
07
Jan-
08
date
16
Discovery to announcement lifespans
15 vulnerabilities from a research groupLifespans are from discovery to disclosureAverage Lifespan larger than previous dataEstimation of number 0Day’s by uniform random selection from the 15 lifespans
17
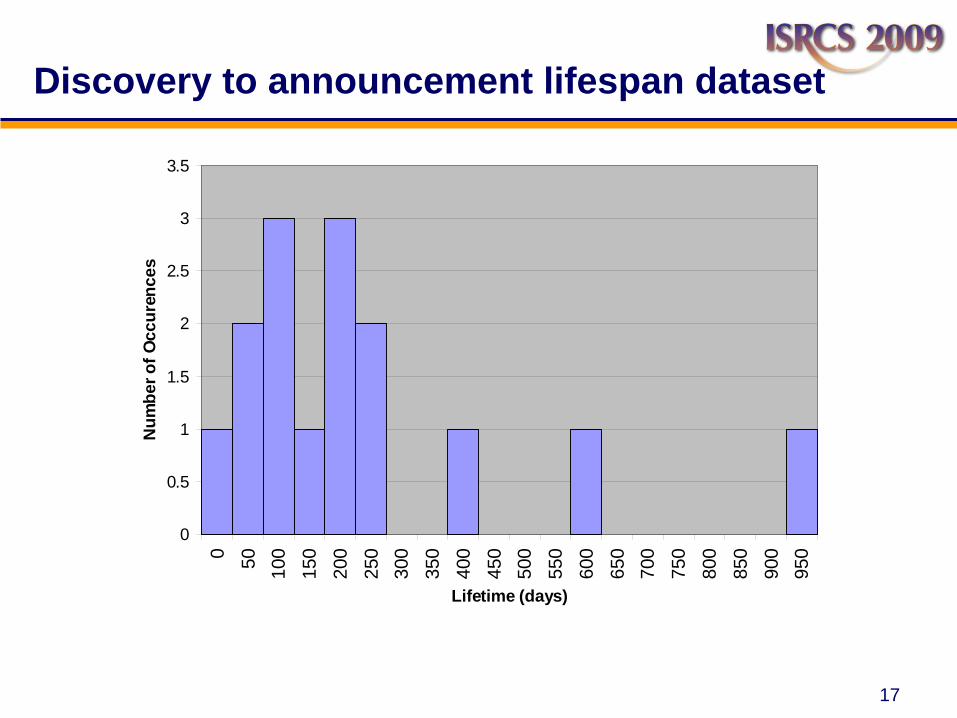
Discovery to announcement lifespan dataset
0
0.5
1
1.5
2
2.5
3
3.5
0 50 100
150
200
250
300
350
400
450
500
550
600
650
700
750
800
850
900
950
Lifetime (days)
Num
ber o
f Occ
uren
ces
18
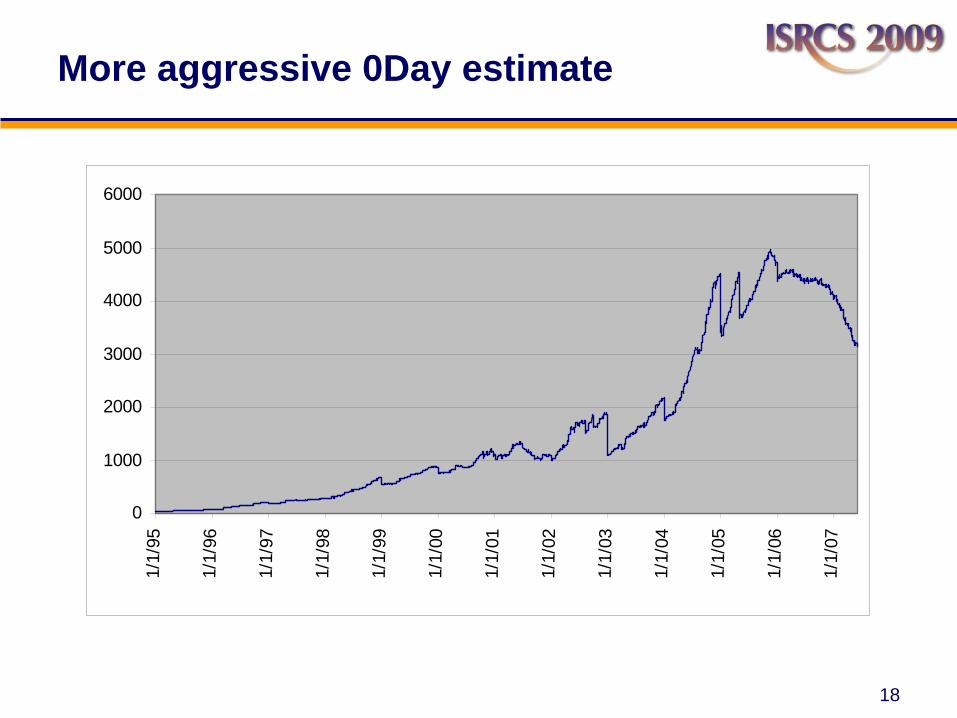
More aggressive 0Day estimate
0
1000
2000
3000
4000
5000
6000
1/1/
95
1/1/
96
1/1/
97
1/1/
98
1/1/
99
1/1 /
00
1/1 /
01
1/1 /
02
1/1/
03
1/1/
04
1/1/
05
1 /1/
06
1 /1/
07
19
Control system specific vulnerabilities
Vulnerabilities in software designed specifically for control systemsWe are aware of many reported to vendorLack of a public disclosure process
Very little historical dataUncertainty about deployment of patches
We collected data on 45 vulnerabilities: Publicly disclosed or reported to CERT/CC.
20
Control system specific vulnerabilities
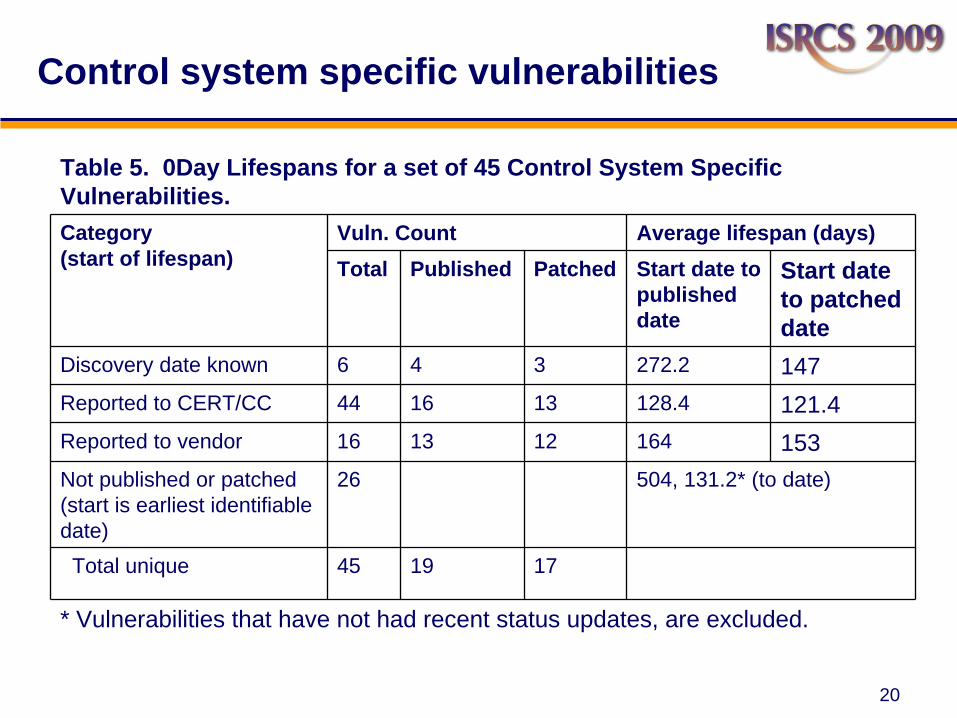
Table 5. 0Day Lifespans for a set of 45 Control System Specific Vulnerabilities.Category (start of lifespan)
Vuln. Count Average lifespan (days)Total Published Patched Start date to
published date
Start date to patched date
Discovery date known 6 4 3 272.2 147Reported to CERT/CC 44 16 13 128.4 121.4Reported to vendor 16 13 12 164 153Not published or patched (start is earliest identifiable date)
26 504, 131.2* (to date)
Total unique 45 19 17
* Vulnerabilities that have not had recent status updates, are excluded.
21
Extrapolate from previous test results0Day market studySoftware Engineering fault density estimationStudy of Vendor patch deployment practices
Potential 0Day estimation methods
Control system specific vulnerabilities
22
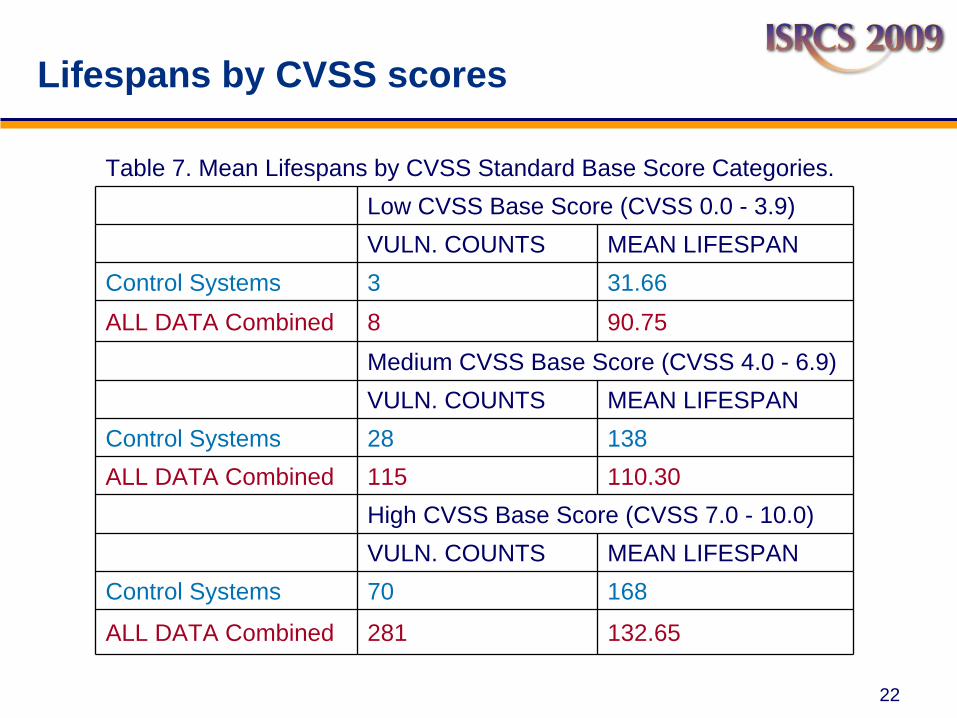
Table 7. Mean Lifespans by CVSS Standard Base Score Categories.Low CVSS Base Score (CVSS 0.0 - 3.9)VULN. COUNTS MEAN LIFESPAN
Control Systems 3 31.66ALL DATA Combined 8 90.75
Medium CVSS Base Score (CVSS 4.0 - 6.9)VULN. COUNTS MEAN LIFESPAN
Control Systems 28 138ALL DATA Combined 115 110.30
High CVSS Base Score (CVSS 7.0 - 10.0)VULN. COUNTS MEAN LIFESPAN
Control Systems 70 168
ALL DATA Combined 281 132.65
Lifespans by CVSS scores
23
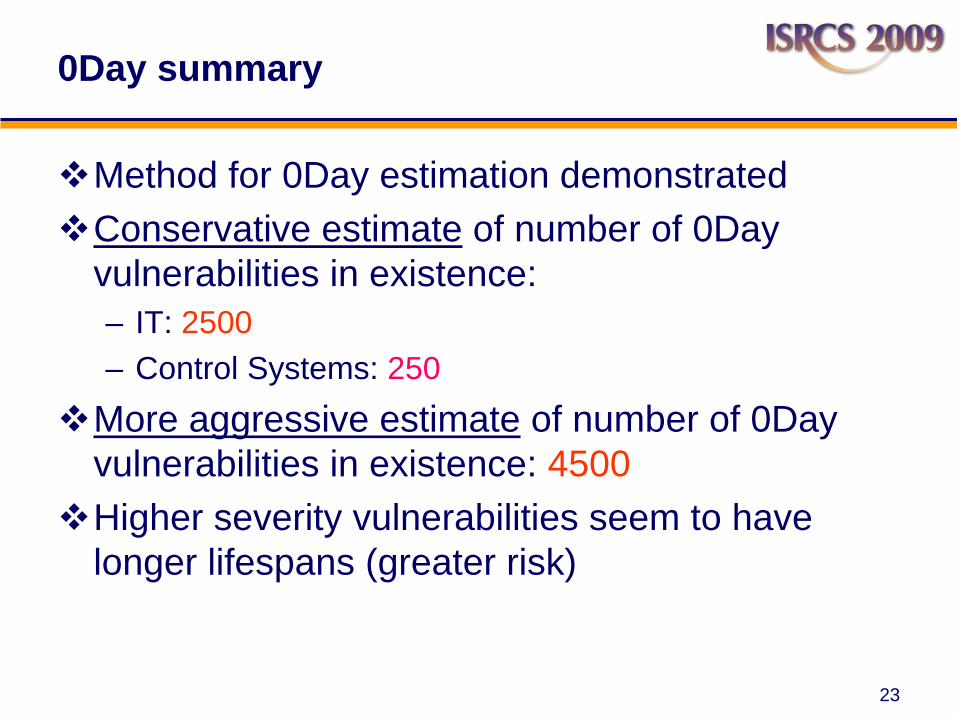
0Day summary
Method for 0Day estimation demonstratedConservative estimate of number of 0Day vulnerabilities in existence: – IT: 2500– Control Systems: 250
More aggressive estimate of number of 0Day vulnerabilities in existence: 4500Higher severity vulnerabilities seem to have longer lifespans (greater risk)
24
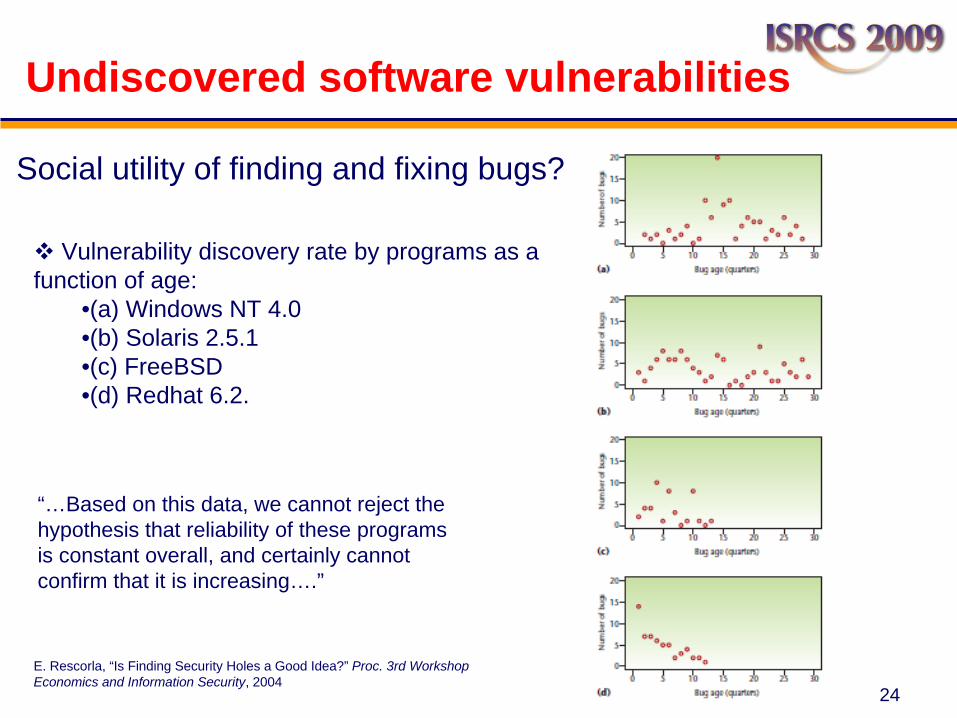
Undiscovered software vulnerabilities
“…Based on this data, we cannot reject the hypothesis that reliability of these programs is constant overall, and certainly cannot confirm that it is increasing….”
Social utility of finding and fixing bugs?
E. Rescorla, “Is Finding Security Holes a Good Idea?” Proc. 3rd Workshop Economics and Information Security, 2004
Vulnerability discovery rate by programs as a function of age:
•(a) Windows NT 4.0 •(b) Solaris 2.5.1 •(c) FreeBSD•(d) Redhat 6.2.
25
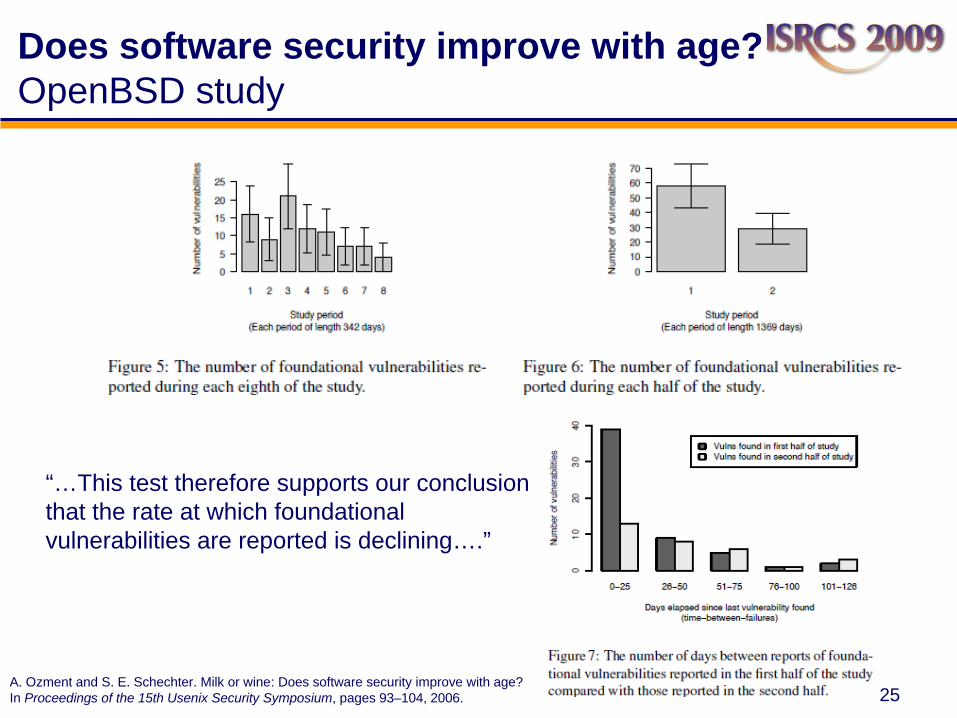
Does software security improve with age? OpenBSD study
“…This test therefore supports our conclusion that the rate at which foundational vulnerabilities are reported is declining….”
A. Ozment and S. E. Schechter. Milk or wine: Does software security improve with age? In Proceedings of the 15th Usenix Security Symposium, pages 93–104, 2006.
26
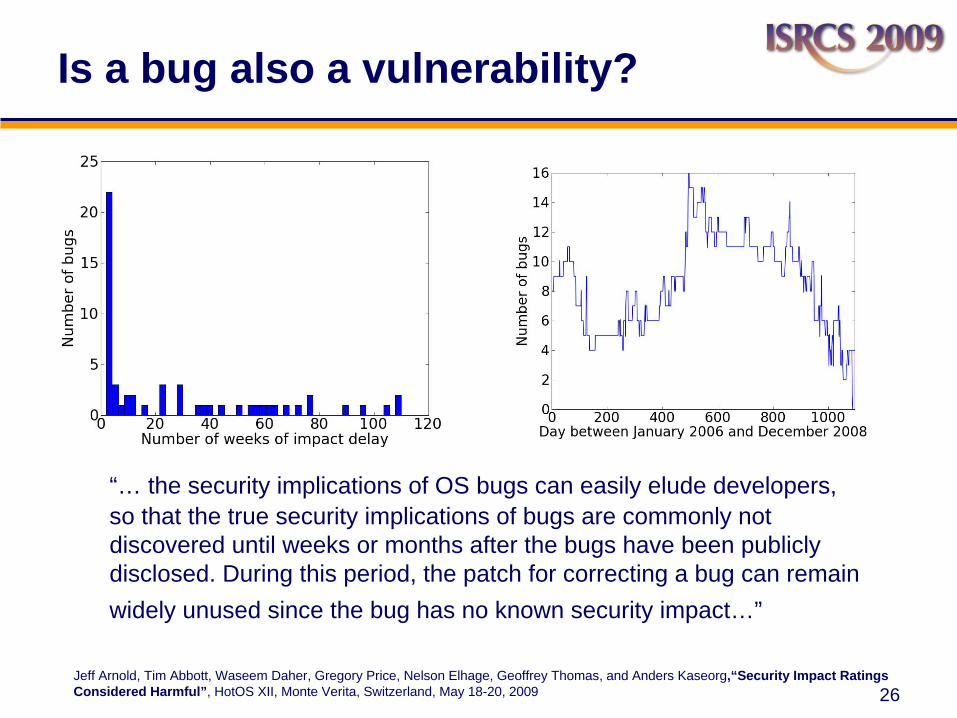
Is a bug also a vulnerability?
“… the security implications of OS bugs can easily elude developers, so that the true security implications of bugs are commonly not discovered until weeks or months after the bugs have been publicly disclosed. During this period, the patch for correcting a bug can remain widely unused since the bug has no known security impact…”
Jeff Arnold, Tim Abbott, Waseem Daher, Gregory Price, Nelson Elhage, Geoffrey Thomas, and Anders Kaseorg,“Security Impact Ratings Considered Harmful”, HotOS XII, Monte Verita, Switzerland, May 18-20, 2009
27
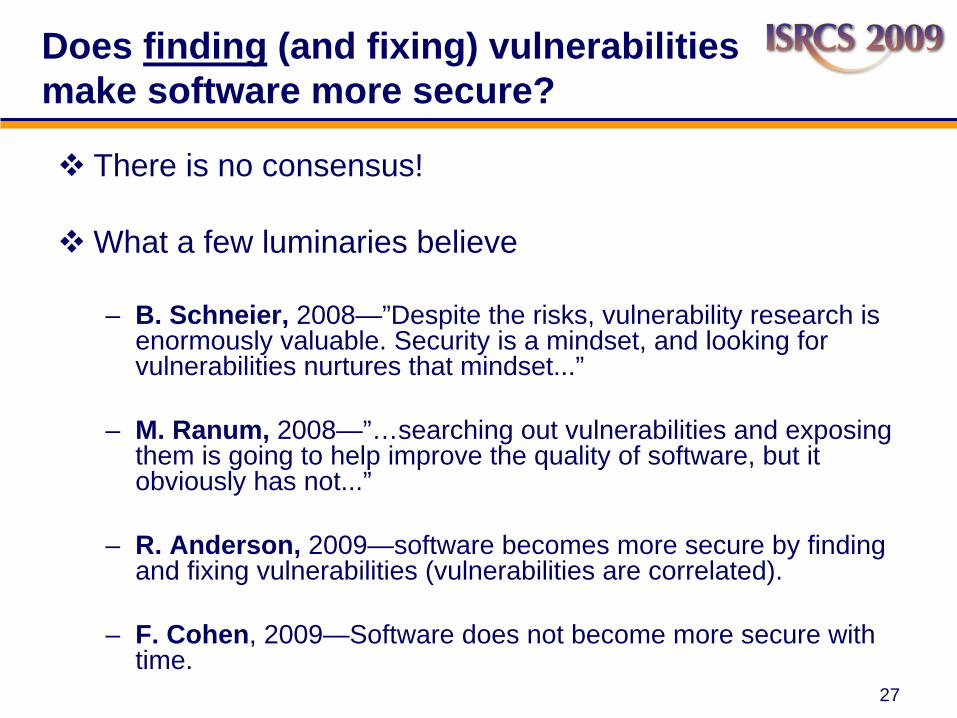
Does finding (and fixing) vulnerabilities make software more secure?
There is no consensus!
What a few luminaries believe
– B. Schneier, 2008—”Despite the risks, vulnerability research is enormously valuable. Security is a mindset, and looking for vulnerabilities nurtures that mindset...”
– M. Ranum, 2008—”…searching out vulnerabilities and exposing them is going to help improve the quality of software, but it obviously has not...”
– R. Anderson, 2009—software becomes more secure by finding and fixing vulnerabilities (vulnerabilities are correlated).
– F. Cohen, 2009—Software does not become more secure with time.
28
Should security resources be used to discover vulnerabilities in deployed software?
Not pervasive– Relatively little attention paid by security community
Battle of perceived risk– Empirical estimates– What does the future hold– Threat specification
How should the government focus their efforts for improving security and resilience?How should academic researchers? How should industry?
29
Discussion?
Session 2c: Known ICS Vulnerabilities
Contact Information
Sean McBride Sean.McBride@criti cal-intelligence.com
(208)-965-2114
Miles McQueen Miles.McQueen@inl .gov
(208)-526-5872