Embed Size (px)
Citation preview
Page 1 of 23
Publicado en 2013 Soil Science Society of America Journal 77(2): 653-663. DOI:10.2136/sssaj12.0014.
Two microenvironments at the soil surface of saline wetlands in Monegros, Spain
M. Domínguez-Beisiegel, C. Castañeda,* and J. Herrero
ABSTRACT
Non-trodden soils free of human and livestock pedestrian activity occur on the floors of hypersaline playa-lakes in the Monegros’ inland wetlands in Spain. A soil surface vesicular crust (herein designed as A1v horizon) organized in decimetric polygonal plates is the main observable feature of these rare soils inhabited by the perennial halophyte shrub Arthrocnemum macrostachyum (Moric.) Moris (A.m.). The vesicular organization of the A1v, together with its discontinuity with the soil underneath, suggests the existence of two contrasting soil microenvironments. Thirty-three sites of seven wetlands inhabited by A.m. were sampled: the A horizon from 0 to 15 cm, that is, including A1v; and separately the A1v and the underneath A2 horizon up to 15-cm depth. Measurements included Munsell color, moisture, and salinity at different soil/water ratios, during both the dry and wet seasons along with determinations of gypsum content, calcium carbonate equivalent, and organic matter. Evidence of the mulching effect of A1v and its contrasting conditions against the underlying A2 is supported by the significant differences in 1:5 soil/water extracts electrical conductivity, with a July mean EC1:5 of 22.3 dSm–1 in A1v vs. 14.0 dSm–1 in A2, and by similar significant differences in all major ions, except Ca. In July, total dryness (0%) can be achieved by A1v whereas A2 retained some moisture (5% minimum). Significant moisture differences were found for A1v and A2 in December together with a homogenizing effect. These are significant traits to be considered both in halophyte germination and establishment studies, and in ecological and restoration plans.
M. Domínguez-Beisiegel, Soils and Irrigation Department (EEAD-CSIC Associated Unit), Agrifood Research & Technology Center of Aragon, Av. Montañana 930, 50059 Zaragoza, Spain. C. Castañeda and J. Herrero, Estación Experimental de Aula Dei, CSIC, P.O. Box 13034, 50080 Zaragoza, Spain. *Corresponding author ([email protected]). Received 9 Jan. 2012.
Abbreviations: A.m., Arthrocnemum macrostachyum; CCE, calcium carbonate equivalent;OM, organic matter.
Previous works on the saline playa-lakes of Monegros, Spain, reported that the soil under A.m. and in conterminous areas shows a polygonal pattern of cracks affecting the few upper centimeters (Herrero, 1982, 2008). This results in porous and friable polygonal plates of a vesicular crust, easily detachable through the structural discontinuity with the underlying soil material. The polygonal pattern can persist even after small rain showers (Fig. 1a and 1b). After drying, the salt accumulation can fill in cracks, reaching the surface of the plates (Fig. 1b, 1c). The plates can last for years, resulting the polygonal pattern as an outstanding feature of these soils (Fig. 1d).
Turk and Graham (2011) described the vesicular horizon as “a common feature of soils in arid and semiarid lands” and stressed its role in controlling the surface hydrology. Vesicular horizon, considered ubiquitous in undisturbed desert soils by McFadden et al. (1998), was known years ago with different settings, for example, produced by repeated irrigations (Miller, 1971), or occurring under a laminated surface layer in saline areas (Joeckel and Clement, 1999), or as subpavement vesicular horizon in many deserts, better developed under clasts (Springer, 1958; Laity, 2011). As reviewed by Turk and Graham (2011) the genesis of vesicular horizons have been frequently associated with rough soil
Page 2 of 23
surfaces or with stone pavements (Bouza et al., 1993), which is not the case in the Monegros playa-lakes where coarse fragments are rare. The vesicular horizon and the lack of stones also occur in other saline flats, as noted by Joeckel and Clement (1999) for eastern Nebraska, by Mees and Singer (2006) for the Aral Sea or by Buck et al. (2011) for the Salton Sea in California.
On the other hand, the trapping of seeds or other propagules dispersed by tides (Wolters et al., 2004) or by wind is a key factor for plant establishment on flat surfaces, as are the floors of playa-lakes. The biological importance of the soil cracks as seed traps has been stressed by Burmeier et al. (2010) and by Espinar and Clemente (2007) as determining how diaspores are distributed within soils. However, there are few studies about the vesicular “segregated horizon” of playa-lakes, whose shallow cracks can trap propagules and act as a special microenvironment for plant establishment.
The stem-succulent halophyte A.m. is the most salt-resistant perennial vascular plant living under hypersaline conditions within the playa-lakes in Monegros (Braun-Blanquet and Bolòs, 1957; Herrero, 1982; Blanché and Molero, 1986; Conesa et al., 2011). This perennial Chenopodioideae, distributed at the interface between dominantly inundated vs. dominantly dry areas is protected under the Habitats Directive 92/43/EEC of the European Union. Their habitats are muddy and saline soils seasonally flooded with brines that can reach several times the seawater salt content (Samper-Calvete and García-Vera, 1998). Herrero (2008) reported temporal oscillations in the soil electrical conductivity in the saturated paste extract under A.m. ranging from 30 to 80 dS m–1 for the upper 20 cm of the soil.
The adaptations of this plant to salinity and other stress factors (Gul and Khan, 2008), as well as its role in soil formation through organic matter production, dust-trapping, rooting, and providing conditions for the life of other organisms, are not well known. Due to the close connection of A.m. with water ponds, the new on-farm irrigation developments in the vicinity of the playa-lakes (Castañeda and Herrero, 2008; Domínguez-Beisiegel et al., 2013) threaten the A.m. habitats by producing more frequent flooding. Irrigation flows will change the hydrological regime and the ionic composition of ground water and soil.
Many studies have been conducted on the physiology of salt-tolerant plants of agricultural interest and on plant-soil relationships (Pessarakli, 1999), considering several of the various plant-stressing factors and the concept of non-uniform salinity in the root zone (Bazihizina et al., 2009). Fewer reports are available on highly salt-tolerant plants, which often have few if any commercial uses, like A.m. We studied the soil habitat of A.m. in Monegros, Spain, hypothesizing that the polygonal nature of the vesicular crust (or A1v horizon) is a relevant trait for A.m. development in early stages. Our objective was to depict the physical and chemical characteristics of A.m. soils focusing on the differences between the vesicular crust (A1v) and the underneath non-vesicular A2 horizon, as providing two different microenvironments for A.m. germination and plantlets survival. This knowledge is essential to understand future changes in soil characteristics and to relate it to plant distribution.
Page 3 of 23
STUDY AREA
Our research was conducted in seven of the saline playa-lakes, or saladas, located in southern Monegros, Northeast Spain (Fig. 2), one of the most arid regions in Europe (Herrero and Snyder, 1997). The mean annual precipitation is 350 mm for the last 20 yr and the mean annual reference evapotranspiration (ET0) is 1225 mm (Faci and Martínez-Cob, 1991) resulting in a high mean annual water deficit.
The saline wetlands occur in karstic depressions formed mainly by dissolution of Miocene horizontal strata of alternating limestone, gypsum, and lutites (Salvany et al., 1996). The floors of the depressions are unconsolidated Holocene evaporitic and detrital sediments several meters thick and continuously reworked by the interstitial brines. Soils are Gypsic Aquisalids according to Soil Survey Staff (2010). A sequence of three lithological units was recognized for nearly all basins by Mees et al. (2011), with a correlatable subsurface unit of typically magnesite-bearing gypsiferous deposits.
These gypseous soils have a hypersaline shallow water table and temporary ponding with seasonally variable salinities up to 200 g L–1 (Samper-Calvete and García-Vera, 1998). During the dry periods, capillary rise is responsible for the high salinities in the soil and for surface efflorescences. Halophytes cover the floor of many saladas, limited to the fringes which are not subjected to long periods of inundation. Few halophytes can live in these harsh conditions, A.m. being the only perennial plant at the wetland fringes closest to the intermittently flooded bottoms.
MATERIALS AND METHODS
Field Sampling
Soil sampling sites were selected based on maps of vascular vegetation at scales ranging from 1:2000 to 1:6000 (Conesa et al., 2011). The A.m. occurred in 11 saladas as the dominant species of the European Commission habitat 1420, that is, “Mediterranean and thermo-Atlantic halophilous scrubs” (European Commission, 2007). We studied seven saladas with >1 ha of A.m. cover (Fig. 2) and sampled three to eight sites in each salada, totaling 33 sites. The cover density of A.m. at 27 sampling sites ranged from 10 to 90%, and one site had residual A.m. Bare soil was sampled at five sites close to A.m.
Two sampling campaigns were conducted, summer (24–28 July 2006) and winter (12–14 Dec. 2006). At each selected site we sampled the top superficial vesicular crust (A1v) naturally separated as loose polygonal “floor tiles” from the underlying soil, and the non-vesicular A2 horizon to a maximum depth of 15 cm. The A horizon was also sampled from 0- to 15-cm depth, within 0.5 m of the A1v and A2 samples, to compare the composition of the two layers (A1v and A2) between them and with that of A, that is, the A horizon as would be sampled for routine auger surveys of soil salinity. The A2 and A samples were taken with an Eijkelkamp auger, whereas A1v was sampled by hand or a knife. A total of 99 soil samples were taken during each sampling campaign.
Soil temperature and A1v thickness was measured in the field in July and December. Soil temperature was measured with a probe connected to a thermocouple (Selvise T210, Jules Richard Instruments, Argenteuil, France), at a depth of 15 cm because evaporation is controlled by soil temperature and moisture.
Page 4 of 23
Laboratory Methods
The determinations performed in the July sampling were complemented in December as shown in Table 1. Gravimetric soil moisture was measured avoiding the loss of constitutional water of gypsum (Herrero et al., 2009). The samples were air-dried at room temperature for 1 wk and dried in an oven for 2 wk at <40°C. The color of both the air-dried and the wet soil samples was determined in the lab (Munsell Color, 1988). Soil pH was determined by pH meter from an aqueous 1:2.5 soil/water dilution (Peech, 1965).
The electrical conductivity, expressed in dS m–1 at 25°C, was measured from extracts with soil/water ratios in weight of 1:5 (EC1:5) and 1:10 (EC1:10). The soil salinity appraisal using saturated paste extracts was devised by the U.S. Salinity Laboratory Staff (1954) for soils with salt contents well under the EC attained in the salada bottoms, and does not give results representative of the conditions of these soils, which are often flooded with brine. Moreover, as saturation extracts produce neutral ionic pairs, the EC in these extracts is a weak estimator of ionic content. We considered the 1:5 extracts as a standard ratio that would allow comparisons with the results of other authors. We checked the quality of the EC measurements and the occurrence of neutral ionic pairs, a major concern with extracts of highly saline soils, by regressing EC1:5 on EC1:10 for the 198 soil samples.
The ionic contents (Ca, Mg, Na, K, Cl, and SO4) were determined for the 1:10 soil/water ratio extracts from the July samples to avoid extra dilutions of the 1:5 extracts. Calcium and Mg were determined by atomic absorption spectrophotometry, and Na and K by flame absorption photometry, with a PerkinElmer 2380 spectrophotometer. Chloride was determined with an electrode connected to an ORION EA-920 ion analyzer (Thermo Electron Corp., Beverly, MA). Sulfate was determined by molecular absorption spectrophotometry according to Nemeth’s method, using a SP6-200 PYE UNICAM spectrophotometer (Pye-Unicam, Cambridge, UK).
The organic matter content was determined with a Spectronic 20 colorimeter by oxidation of the organic C with potassium dichromate in a sulfuric environment using AgNO3 to avoid the interference of Cl. Total N was determined by the Kjeldahl method, and calcium carbonate equivalent (CCE) with a Bernard calcimeter. The gypsum content was determined by thermogravimetry following the method of Artieda et al. (2006).
Munsell color, gravimetric moisture, electrical conductivity (EC1:5 and EC1:10), and main ions were determined for the A1v, A2, and A horizon samples. Calcium carbonate equivalent, gypsum, total N, and organic matter, were determined for A horizon samples; moreover gypsum was determined for A1v and A2 samples to check for accumulation or depletion of gypsum. Moisture and electrical conductivity were also determined on the December samples.
DATA TREATMENT
The data were managed with spreadsheets and the statistical packages MINITAB and SSPS. The distributions are represented by boxplots, following Chambers et al. (1983). Smoothing via a locally-weighted scatter plot smoother (Cleveland and Devlin, 1988), or “LOWESS lines”, was used to graphically summarize the relationship between gypsum content of A1v against A2, without fitting a specific model. We used the central and
Page 5 of 23
dispersion measures of salinity, soil moisture, major ion concentrations, organic matter, and gypsum content. The ion contents of soil extracts were studied with Schoeller–Berkaloff diagrams.
RESULTS
Soil Surface Organization
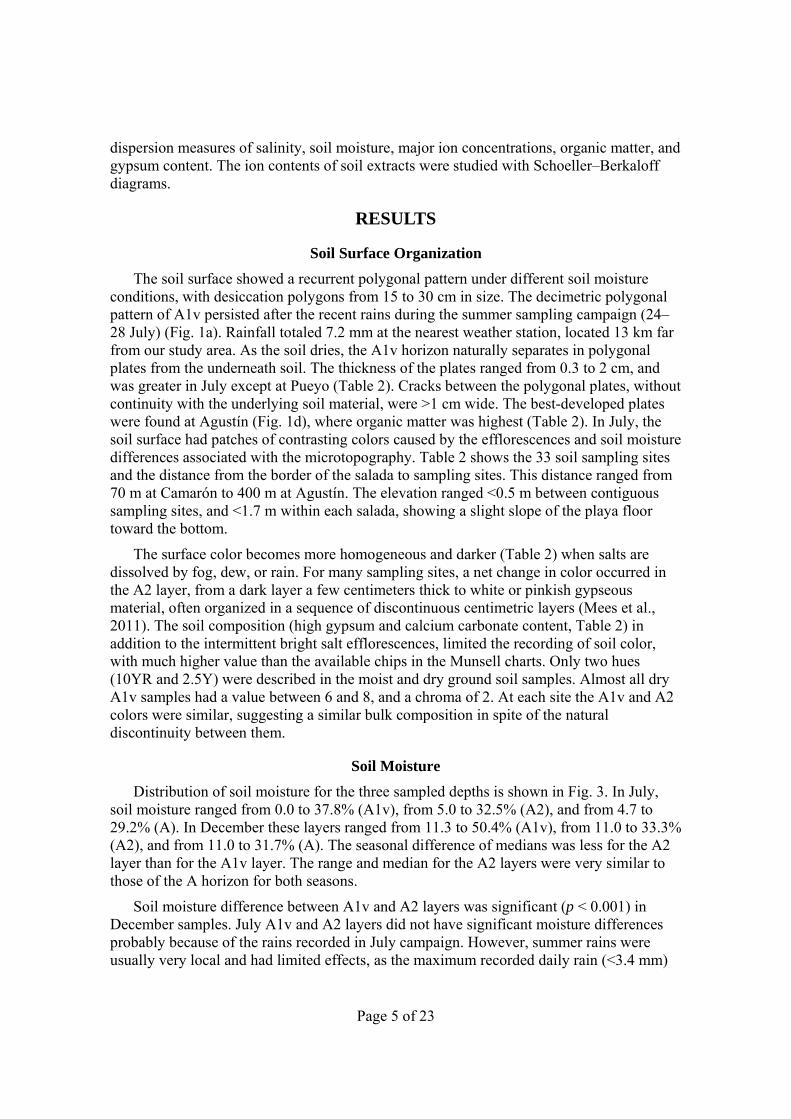
The soil surface showed a recurrent polygonal pattern under different soil moisture conditions, with desiccation polygons from 15 to 30 cm in size. The decimetric polygonal pattern of A1v persisted after the recent rains during the summer sampling campaign (24–28 July) (Fig. 1a). Rainfall totaled 7.2 mm at the nearest weather station, located 13 km far from our study area. As the soil dries, the A1v horizon naturally separates in polygonal plates from the underneath soil. The thickness of the plates ranged from 0.3 to 2 cm, and was greater in July except at Pueyo (Table 2). Cracks between the polygonal plates, without continuity with the underlying soil material, were >1 cm wide. The best-developed plates were found at Agustín (Fig. 1d), where organic matter was highest (Table 2). In July, the soil surface had patches of contrasting colors caused by the efflorescences and soil moisture differences associated with the microtopography. Table 2 shows the 33 soil sampling sites and the distance from the border of the salada to sampling sites. This distance ranged from 70 m at Camarón to 400 m at Agustín. The elevation ranged <0.5 m between contiguous sampling sites, and <1.7 m within each salada, showing a slight slope of the playa floor toward the bottom.
The surface color becomes more homogeneous and darker (Table 2) when salts are dissolved by fog, dew, or rain. For many sampling sites, a net change in color occurred in the A2 layer, from a dark layer a few centimeters thick to white or pinkish gypseous material, often organized in a sequence of discontinuous centimetric layers (Mees et al., 2011). The soil composition (high gypsum and calcium carbonate content, Table 2) in addition to the intermittent bright salt efflorescences, limited the recording of soil color, with much higher value than the available chips in the Munsell charts. Only two hues (10YR and 2.5Y) were described in the moist and dry ground soil samples. Almost all dry A1v samples had a value between 6 and 8, and a chroma of 2. At each site the A1v and A2 colors were similar, suggesting a similar bulk composition in spite of the natural discontinuity between them.
Soil Moisture
Distribution of soil moisture for the three sampled depths is shown in Fig. 3. In July, soil moisture ranged from 0.0 to 37.8% (A1v), from 5.0 to 32.5% (A2), and from 4.7 to 29.2% (A). In December these layers ranged from 11.3 to 50.4% (A1v), from 11.0 to 33.3% (A2), and from 11.0 to 31.7% (A). The seasonal difference of medians was less for the A2 layer than for the A1v layer. The range and median for the A2 layers were very similar to those of the A horizon for both seasons.
Soil moisture difference between A1v and A2 layers was significant (p < 0.001) in December samples. July A1v and A2 layers did not have significant moisture differences probably because of the rains recorded in July campaign. However, summer rains were usually very local and had limited effects, as the maximum recorded daily rain (<3.4 mm)
Page 6 of 23
was much less than daily reference evaporation. During July, moisture differences between A1v and A2 were the following: (i) A1v attained total dryness (0%) while the A2 still retained some moisture (~5%), (ii) the moisture range of A1v is 10% more than A2, and (iii) the maximum moisture content recorded was 38% for A1v, and 27% for A2. In December, A1v water contents also varied widely, ranging from 11% to >50%, even though no rain was recorded for the area, contrasting with the smaller range of the moisture content of A2 (from 11 to 33%). The moisture variability of A2 in July indicates a noticeable influence of summer evaporation, whereas a homogenizing effect in winter is observed (Fig. 3). No commonalities in soil composition were observed between the sites with no seasonal moisture variation. Overall, December moisture of A1v was more than 10% higher than in July. Only three sites (in Rollico) had higher moisture content in July compared to December though only one site retained this difference in A2, with no apparent relation with elevation or distance to the salada border.
Soil temperature, recorded from 0800 to 1600 h, show large variations ranging from 21.6 to 35.7°C (mean = 28.8°C) in July, and from 5.6 to 9°C (mean = 7.3°C) in December.
Soil Salinity and Chemical Characteristics
A strong and significant relationship was found between EC1:5 and EC1:10 for the 198 soil samples (R2 = 99.5%, p < 0.001) as well as for each of the sampling times and depths (R2 ranging from 98.8–99.6%). The coherence of the EC relationships indicated the absence of neutral ionic pairs in the 1:5 and 1:10 soil/water ratio extracts of our soils. Full ionic dissociation was confirmed by the R2 values (from 99.0 to 82.4%) found in each layer between the 1:10 extracts anion or cation sums, and EC for both extracts. The Cl and Na ions showed a high correlation with EC1:5, with r equal to 0.97 and 0.98, respectively, suggesting a way to save lab workload in future studies. In contrast, Mg had the lower correlation (r = 0.68). The scatter plot of EC1:5 measurements for the A1v and A2 (Fig. 4) showed the major salinity trends. Most A1v samples had greater EC1:5 than A2 both in July and December. The points under the 1 = 1 line correspond to 14 sites with opposite behavior; that is, A1v had less salt than A2 in July and in December. Of these 14 sites, five were located in less prone to ponding sites (at Agustín and Pueyo), and maintained this behavior in both seasons.
Differences between EC1:5 of the sampled layers (Fig. 5) were significant in July (p = 0.001) and December (p = 0.002) according to the Wilcoxon’s signed rank test. Differences in salinity of A1v and A2 are the following: (i) the maximum EC1:5 attained at the A1v during July (46.6 dS m–1) was more than twice that of A2 (19.5 dS m–1), (ii) the salinity ranges for A2 were shorter than those for A1v, and (iii) during December, A1v and A2 had a similar salinity range, and also similar to A2 during July. The A horizon boxplots (Fig. 5) showed somewhat intermediate values in comparison with the two other depths sampled.
The greatest differences of EC1:5 between July and December, from 15 to 30 dS m–1 were recorded at La Playa wetland. The smallest differences of EC1:5 between July and December occurred at Agustín. This seasonal variation of EC1:5 can be related to the inundation frequency, a 50% for La Playa and a 27% for Agustín, after Castañeda and Herrero (2008). Four sites (AGU2, CMR1, LPL6, and PYO1) had higher December EC1:5 values for the three sampling depths, and any relation to the site location or relative elevation was not found.
Page 7 of 23
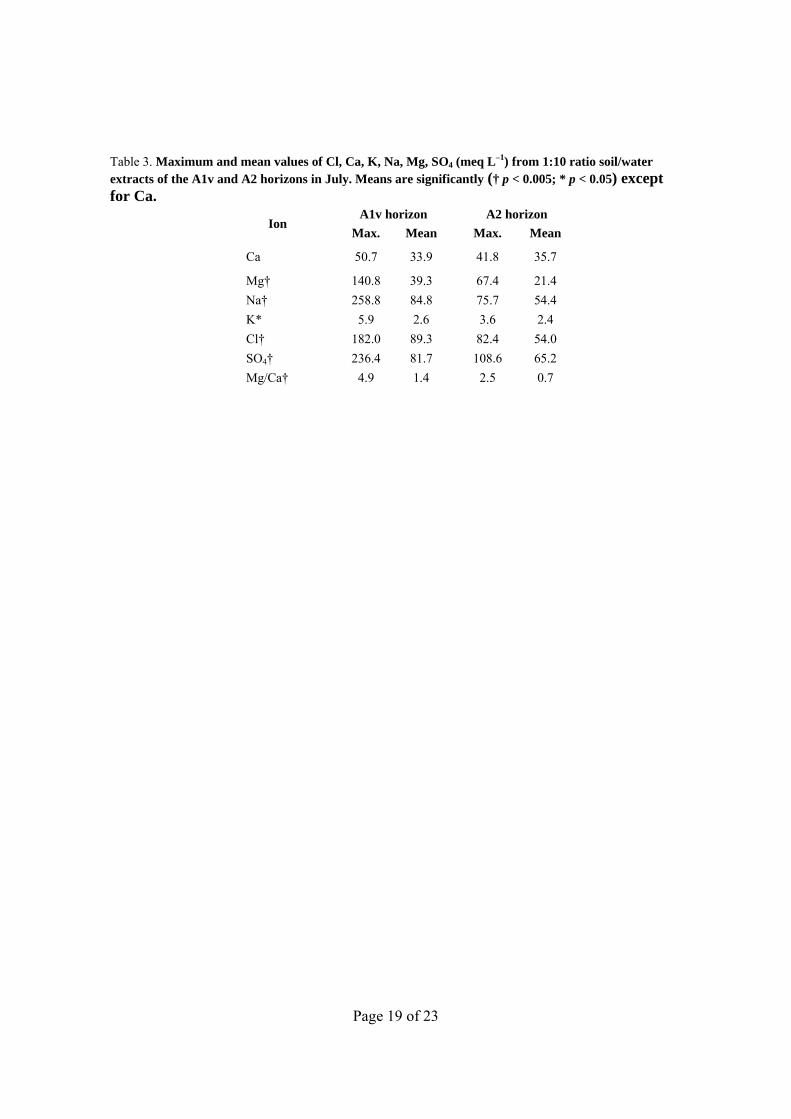
The mean values of major ions (Table 3) showed the dominance of SO4 against Cl. The mean Mg/Ca ratio for A1v (1.4) doubled that of A2 (0.7). Significant differences (p < 0.05) in mean ion content between A1v and A2 for most ions and Mg/Ca ratio were confirmed by Wilcoxon’s signed rank test. Differences were not found for Ca (p = 0.257), as Ca concentration was similar in both layers because of the dominance of calcite and gypsum in these soils. For the most harmful ions for plants, Cl, Na, and Mg, the mean ion content in A1v layers was 1.1 to 1.8 times that of A2 (Table 3). These ions, plus sulfate, were the constituents of the occasional efflorescences in A1v layers. Potassium content was irrelevant compared to the other ions, with similar means (~ 2.5 meq L–1) for A1v and A2. Sulfate is ubiquitous; Cl, Na, and Mg ions are very soluble and easily mobilized. In wet periods, while the soil moisture still allows capillary contact of A1v with A2, the concentration of major ions increases in the plates due to the evapo-concentration. Most samples (20 from 33) had pH values between 8.7 and 8.9. All, except three of these samples, are strongly alkaline according to Soil Survey Staff (1996, p. 618–632). Three are moderately alkaline. The pH of the A horizon ranged from 7.9 to 9.0, therefore an inadequate availability of several elements for plants can be surmised. This pH value can increase the stress on plants and other organisms.
The gypsum content (Fig. 6) in the A1v horizon ranged from 4 to 72% with a mean of 30%. A2 gypsum content ranged from 6 to 95%, with a mean of 39%, showing a high correlation (R2 = 92.7%) with A horizon gypsum content. The CCE ranged from 12 to 45% except at two sites with CCE <5%, both of which were from gypseous soils. The sum of CCE and gypsum ranged from 30 to 95%, with a mean of 58%. Organic matter (OM) content ranged from 0.3 to 2.8%. The highest OM values occurred in Agustín, La Playa, and Rollico wetlands. A close relationship was found between OM and N content (R2 = 94.0%), with a C/N ratio of 6.8, which indicates advanced humification (Duchaufour, 1970).
The Schoeller–Berkaloff diagram (Fig. 7) illustrates the similarities and differences between A.m. sites based on the ion content of 1:10 soil extracts for July. For the T layer, almost all of the sampled soils can be grouped into the upper part of the diagram, with a similar range for the logarithms of the analyzed ions. Seven sites detached by their ion contents, lower than the others by orders of magnitude. A similar pattern occurred in A2, even though salt content variability was lower. Roughly the same sites that differed in the composition of A1v also differ in A2, though these divergences of composition are less marked. The A1v layers at La Playa, including the bare soil sampled, had the highest salt content of all sites. In general, Agustín sites (AGU) differ from the rest, in one layer or in both A1v and A2. Sites PYO1, PTO4, CMR1 stand out for their low salinity (with less variability for A2), together with high gypsum content and low moisture.
No relationship was found between A.m. coverage and relative elevation, soil moisture, and composition.
DISCUSSION
Soil Microenvironments
Our research is focused on the ecological consequences of the setting of vesicular polygonal plates (A1v horizon) separated from each other by a network of crust-related
Page 8 of 23
cracks, and acquiring a physical discontinuity with the underlying A2 horizon during desiccation. Polygonal cracks associated with vesicular horizons have been described in most of the articles cited in the Introduction section. Moreover, the cracks in the A1v horizon of the saladas showed some resemblance with the halite crusts mentioned by Nash (2011), and can be described as crust-related cracks (Schoeneberger et al., 2011). These cracks cannot be considered as diagnostic or as permanent cracks (Soil Survey Staff, 2010) because they do not meet the thickness requirements. The references mentioned in this article provide detailed morphological descriptions and sound genetical hypotheses about the vesicular crust, even based on experiments.
The lack of internal movements distinguishes the soils in the saladas from Vertisols in salt marshes (Espinar et al., 2005b), under higher coastal energy, where horizons with cracks are subjected to redistribution of materials affecting the redistribution of propagules. Some authors have demonstrated the influence of deep cracks on seed bank formation (Espinar and Clemente, 2007) although the role of segregated horizons on germination and plant development has not been reported.
Persistence of polygonal cracking was found by Burmeier et al. (2010) in clay-rich soils. The clay mineral content was low in all our saladas, as the average of gypsum plus calcium carbonate equivalent was about 60% and maximum was 95%. In these gypsic horizons, however, the pattern of cracks and plates can also survive waterlogging and drying. Besides, these soils are not disturbed by human or livestock activity, thus the long-term persistent self-organization, a common characteristic for vesicular horizons, is easily observed.
The differences in salinity and composition between the Av1 and A2 horizons, evidenced in this study, have not been previously studied in these unique habitats. The best-developed plates rest in partial or total discontinuity with A2, as sketched in Fig. 8. Such recurrent discontinuity, plus the vesicular organization, makes capillary rise into the plates difficult or impossible. The sharp changes in soil surface due to the intermittent occurrence of water logging, efflorescences, crust-related cracks development, and cracks filling with salt, affect the water and salt distribution at a centimetric scale and thus the survival of A.m. propagules.
In contrast with the desiccation cracks in clay-rich soils, the cracks in our saline and gypsum-rich soils were shallow. The desiccation cracks in clay-rich soils may translocate seeds to depths from which they are not able to emerge (Burmeier et al., 2010) while the shallow cracks in the soils we studied seem advantageous by providing different conditions for germination and early development of the plant. The plates can be a more suitable environment after the loss of capillary contact with the underlying soil (Fig. 8a). Conversely, with no salt accumulation (descending water flow after rain), seed germination and the establishment of plantlets might be easier in the cracks, under less saline, temperate, and moist conditions than on the plates (Fig. 8b). Even light showers might feed cracks, due to the low infiltration on plates that can be surmised from their vesicular porosity according to Young et al. (2004) or Yonovitz and Drohan (2009). In the soil surface, vesicular pores appear first (Fig. 8c), then a polygonal pattern marked by salt crystals develops (Fig. 8d), leading to isolated vesicular plates (Fig. 8e).
Page 9 of 23
Even if our temperature data (recorded at 15-cm depth) do not include the winter or summer extremes, they suggest the role of water as a buffer for soil temperature, and points to the harsh conditions for plant life, especially in A1v where more extreme temperatures must occur. On the other hand, due to the soil moisture of A2 (up to 33%), the summer temperature (21.6–35.7°C) produces an intense evaporation of the interstitial saline water. This evaporation is addressed to the cracks of the A1v because of the mulching effect of the vesicular porosity of A1v layer, whose role in the control of the surface hydrology has been stressed by Turk and Graham (2011). In the studied playa-lakes, the saline water table feeds the capillary ascent throughout the A2 horizon even in dry periods. Evaporation is addressed to the vertical crust-related cracks favoring the crystallization of soluble salts, and this effect is enhanced if the discontinuity between A1v and A2 has developed.
The overall difference in soil moisture between the July and December samplings was greater for A1v and much smaller for A2 illustrating the mulching effect of A1v. Sites with higher moisture in July than in December were probably related to the recent rains or to the local occurrence of ground water discharge. The overall salinity of A2 was very similar for July and December, because of the continuous capillary rise of salty ground water. The intermediate results for the A horizon illustrated the loss of information incurred if soil salinity or moisture is reported from samples routinely taken with an auger, as with salinity studies focused on the stock of salts within the soil. Our results stress the need to sample the A1v horizon separately to study the soil conditions for plant growth.
Gypsum, ubiquitous in the landscape, is mobilized in the profile and concentrates in A2 (Fig. 6). Other salts were distributed inversely (Fig. 5) in accordance with their much higher solubility than gypsum. The higher salinity in July samples brought salts to the surface by the strong capillary rise. These salts can reach the vesicular crust or concentrate in the cracks, depending on the development attained by the discontinuity between A1v and A2. Significant differences in ion content (Table 3) between A1v and A2 in July confirm the effect of the discontinuity between the two horizons, suggesting a different suitability for germination. The A1v ion content includes efflorescence, but the crystals of the efflorescence do not contribute to the actual salinity of the soil solution stressing the plants, except if it rains. The contrasting salinity ranges of A1v and A2 would not be detected by routine sampling of the A horizon.
The magnitude of the seasonal differences in soil salinity seemed to be linked with the saladas flooding frequency, showing the effects of the brine. At a metric and decametric scale, similar variability of vertical salinity stratification has been related to the dissolution of gypsum and more soluble salts occurring in the sediments together with the differences in permeability and hydraulic conductivity derived from hydrodynamic (pumping) tests performed in boreholes (Samper-Calvete and García-Vera, 1998). The variable soil composition in sampling sites is comparable to the variability of playa-lake brines for major and minor elements (Pueyo-Mur, 1978) and with the mineralogical variability of playa-lake sediments within the pedons and between them (Mees et al., 2011; 2012). Variation in the physical and chemical characteristics of ground water over short distances was also reported by Samper-Calvete and García-Vera (1998). Moreover, as calcium carbonate and gypsum are major components of these soils, the capacity for ion retention is very low, which allows for quick changes in soil solution composition by brine inundation or by rain.

Page 10 of 23
This may explain why bare soil sites did not show physical or chemical characteristics that were either unsuitable for A.m. growth or different from A.m. soils.
Our soil sampling was restricted to the trafficable areas as the muddy conditions hampered our entering the salada. This fact draws attention to a possible bias in the data from soil sampling by means of pits or augering when these methods do not work in muddy or flooded conditions (Herrero, 2008, p. 101).
Arthrocnemum macrostachyum Occurrence
Flooding and salinity are known factors conditioning the growth of salt-tolerant plants (Zedler et al., 2003; Engels et al., 2011), especially demonstrated through lab experiments on seed and germination (Chang et al., 2005; Espinar et al., 2005a). Under field conditions (inland hypersaline environments), A.m. development can be conditioned by other sources of variability superimposed on the main gradient of flooding salinity. In this sense, the high Ca content of our gypseous soils (CaSO4·2H2O) is approximately 200 times more soluble than calcium carbonate) can be related to the high tolerance of A.m. to soil salinity, as confirmed in laboratory by Gul and Khan (2008) for this plant. The physiological effects of soil salinity should take into account the antagonism between Mg and Na (Feigin, 1985) regardless of the salinity level (Navarro et al., 2000). On the other hand, the high gypsum content seems to have the opposite effect (Table 1) confirming the constraints of gypseous soils for plant support due to the low water and nutrient retention capacity and the hampering of root growth (FAO, 1990; Herrero et al., 2009). The maximum Mg/Ca ratio of our A.m. soils (4.94) was higher than that reported for Mediterranean coastal salt marshes (~ 2.5) by Álvarez-Rogel et al. (2001).
In the studied soils, A.m. plants develop in soil with EC1:5 ranging from 46.6 to 0.6 dS m–1 although germination conditions in the field are unknown. According to lab experiments, A.m. germination gradually decreases with increasing salt concentration (Pujol et al., 2000; Rubio-Casal et al., 2003; Herranz et al., 2004; Khan et al., 2006; Vicente et al., 2007; Khan and Gul, 2008). Herranz et al. (2004) reported positive effects following the subjection of A.m. seeds to hypersaline solutions. This salt stimulation (Woodell, 1985) is an adaptation of plants to the dryness and waterlogging episodic successions in our saladas. Also, several authors reviewed by Khan and Gul (1998) have stressed the occurrence of polymorphism in seeds of a number of halophytic species and mentioned the hypothesis of selection by different salinity levels at the sites where these plants grow. This also may apply in the two different substrates provided by the polygonal cracking, that is, A1v and A2 horizons.
The above two paragraphs discuss some factors influencing plant early stage viability and development on the saline playa-lake floors. Soil characteristics that change temporally (daily, seasonally) may also play a role for germination and continued viability of mature plants. King et al. (2011), however, reported for the Salton Sea in California, that variability among sites was significantly greater than variability from one season to the other at the same site. Similar results were obtained by Herrero (2008) at salada Agustín in Spain. Actually, most soil salinity measurements on the floors of playa-lakes are conducted when the ground is trafficable. This procedure does not record the soil salinity during flooding periods. Moreover, flooding is often produced by brine or other hypersaline water, so the effects on plant physiology of the neutral ion-pairs or of the freezing-point
Page 11 of 23
depression should be taken into account. Continual recordings would be needed to fill this gap. Instantaneous data give an incomplete picture of the conditions endured by the plants.
CONCLUSIONS
The persistent polygonal cracking in the gypsum- and calcium carbonate-rich soils of the Monegros playa-lakes provides two different microenvironments for A.m. growth. The mulching effect of the polygonal A1v horizon stresses the importance of sampling this horizon separately and to observe the differences in salt content between the two available substrates for germination and plant development. The considerations of Young et al. (2004) about the fragility of the surfaces and the hydrological impact of their disruption apply to our playa-lakes and can be extended to the seed germination and plantlet viability.
The described natural setting should suggest field or pot trials or other lab experiments mirroring the contrasting conditions at the surface of the soils where A.m. occurs. The soil surface traits studied showed A.m. occurs in soils with a wide range of salinity, moisture, and mineral composition. These variations point out the complexity of the soils in the playa-lake floors. The electrical conductivity of 1:5 soil-to-water extracts was a good predictor of the major ions content at the upper soil horizon of the studied playa-lakes.
ACKNOWLEDGMENTS
The first author was granted by INIA (Spanish Government). The article is a result of the Spanish projects AGL2009-08931, 2012GALC036, and PI200840I246. The comments from M.M. Alcubilla and her help with chemical determinations are gratefully recognized.
REFERENCES
Ajmal Khan, M.A., A.Z. Ahmed, and A. Hameed. 2006. Effects of sea salt and L-ascorbic acid on the seed germination of halophytes. J. Arid Environ. 67:535–540.
Álvarez-Rogel, J., R. Ortiz, and F. Alcaraz. 2001. Edaphic characterization and soil ionic composition influencing plant zonation in a semiarid Mediterranean salt marsh. Geoderma 99:81–91.
Artieda, O., J. Herrero, and P.J. Drohan. 2006. A refinement of the differential water loss method for gypsum determination in soils. Soil Sci. Soc. Am. J. 70:1932–1935.
Bazihizina, N., T.D. Colmer, and E.G. Barrett-Lennard. 2009. Response to non-uniform salinity in the root zone of the halophyte Atriplex nummularia: Growth, photosynthesis, water relations and tissue ion concentrations. Ann. Bot. (London) 104:737–745.
Blanché, C., and J. Molero. 1986. Las cubetas arreicas al sur de Bujaraloz (Valle del Ebro). Contribución a su estudio fitocenológico. Lazaroa 9:277–299.
Bouza, P., H.F. Del Valle, and P.A. Imbellone. 1993. Micromorphological, physical, and chemical characteristics of soil crust types of the central Patagonia region, Argentina. Arid Soil Res. Rehabil. 7:355–368.
Braun-Blanquet, J., and O. Bolòs. 1957. Les groupements végétaux du bassin moyen de l’Ebre et leur dynamisme. An. Estac. Exp. Aula Dei 5:1–266.
Page 12 of 23
Buck, B.J., J. King, and V. Etyemezian. 2011. Effects of salt mineralogy on dust emissions, Salton Sea, California. Soil Sci. Soc. Am. J. 75:1971–1985.
Burmeier, S., R.L. Eckstein, A. Otte, and T.W. Donath. 2010. Desiccation cracks act as natural seed traps in flood-meadow systems. Plant Soil 333:351–364.
Castañeda, C., and J. Herrero. 2008. Measuring the condition of saline wetlands threatened by agricultural intensification. Pedosphere 18:11–23.
Chambers, J.M., W.S. Cleveland, B. Kleiner, and P.A. Tukey. 1983 Graphical methods for data analysis. Chapman and Hall, New York.
Chang, E.R., E.L. Zozaya, D.P.J. Kuijper, and J.P. Bakker. 2005. Seed dispersal by small herbivores and tidal water: Are they important filters in the assembly of salt-marsh communities? Funct. Ecol. 19:665–673.
Cleveland, W.S., and S.J. Devlin. 1988. Locally weighted regression: An approach to regression analysis by local fitting. J. Am. Stat. Assoc. 83:596–610.
Conesa, J.A., C. Castañeda, and J. Pedrol. 2011. Las saladas de Monegros y su entorno. Hábitats y paisaje vegetal. Consejo de Protección de la Naturaleza, Zaragoza, Spain.
Domínguez-Beisiegel, M., J. Herrero, and C. Castañeda. 2013. Saline wetlands fate in inland deserts: An example of eighty years decline from Monegros, Spain. Land Degradation & Development 24: 250-265.
Duchaufour, P. 1970. Précis de Pédologie. 3rd ed. Masson, Paris.
Engels, J.G., F. Rink, and K. Jensen. 2011. Stress tolerance and biotic interactions determine plant zonation patterns in estuarine marshes during seedling emergence and early establishment. J. Ecol. 99:277–287.
Espinar, J.L., and L. Clemente. 2007. The impact of vertic soil cracks on submerged macrophyte diaspore bank depth distribution in Mediterranean temporary ponds. Aquat. Bot. 87:325–328.
Espinar, J.L., L.V. García, and L. Clemente. 2005a. Seed storage conditions change the germination pattern of clonal growth plants in Mediterranean salt marshes. Am. J. Bot. 92:1094–1101.
Espinar, J.L., K. Thompson, and L.V. García. 2005b. Timing of seed dispersal generates a bimodal seed bank depth distribution. Am. J. Bot. 92:1759–1763.
European Commission. 2007. Interpretation manual of European Union habitats. EUR27. D.G. Environment, Nature and Biodiversity, Brussels, Belgium.
Faci, J.M., and A. Martínez-Cob. 1991. Cálculo de la evapotranspiración de referencia en Aragón. Diputación General, Zaragoza, Spain.
FAO. 1990. Management of gypsiferous soils. FAO Soils Bull. 62. FAO, Rome.
Feigin, A. 1985. Fertilization management of crops irrigated with saline water. Plant Soil 89:285–299
Page 13 of 23
Gul, B., and M.A. Khan. 2008. Role of calcium in alleviating salinity effects in coastal halophytes. In: M.A. Khan, and D.J. Weber, editors, Ecophysiology of high salinity tolerant plants. Springer, Dordrecht, the Netherlands. p. 107–114.
Herranz, J.M., P. Ferrandis, and M.A. Copete. 2004. Germinación de tres halófitos amenazados en Castilla-La Mancha en condiciones de estrés salino. Investigación agraria. Invest. Agrar.: Sist. Recur. For. 13:357–368.
Herrero, J. 1982. Salinidad del suelo en salobrares de Monegros y Somontano oscense como condicionante de la vegetación. Institución Fernando el Católico, Zaragoza, Spain
Herrero, J. 2008. Salinidad edáfica en varios salobrares de Aragón. Real Sociedad Española de Historia Natural. Tomo IV, Madrid, Spain.
Herrero, J., O. Artieda, and W.H. Hudnall. 2009. Gypsum, a tricky material. Soil Sci. Soc. Am. J. 73:1757–1763.
Herrero, J., and R.L. Snyder. 1997. Irrigation and aridity in Aragon, Spain. J. Arid Environ. 35:535–547.
Joeckel, R.M., and B.A. Clement. 1999. Surface features of the Salt Basin of Lancaster County, Nebraska. Catena 34:243–275.
Khan, M.A., and B. Gul. 1998. High salt tolerance in germinating dimorphic seeds of Arthrocnemum indicum. Int. J. Plant Sci. 159:826–832.
Khan, M.A., and B. Gul. 2008. Halophyte seed germination. In: M.A. Khan and D.J. Weber, editors, Eco-physiology of high salinity tolerant plants Springer, Dordrecht, the Netherlands. p. 11–30.
King, J., V. Etyemezian, M. Sweeney, B.J. Buck, and G. Nikolich. 2011. Dust emission variability at the Salton Sea, California, USA. Aeolian Res. 3:67–79.
Laity, J.E. 2011. Pavements and stone mantles. In: D.S.G. Thomas, editor, Arid zone geomorphology: Process, form and change in drylands. 3rd ed. John Wiley & Sons, Chichester, West Sussex, UK p. 181–207, Chapter 9.
McFadden, L.D., E.V. McDonald, S.G. Wells, K. Anderson, J. Quade, and S.L. Forman. 1998. The vesicular layer and carbonate collars of desert soils and pavements: Formation, age and relation to climate change. Geomorphology 24:101–145.
Mees, F., C. Castañeda, J. Herrero, and E. van Ranst. 2012. The nature and significance of variations in gypsum crystal morphology in dry lake basins. J. Sediment. Res. 82:37-52.
Mees, F., C. Castañeda, and E. van Ranst. 2011. Sedimentary and diagenetic features in saline lake deposits of the Monegros region, northern Spain. Catena 85:245–252.
Mees, F., and A. Singer. 2006. Surface crusts on soils/sediments of the Southern Aral Basin, Uzbekistan. Geoderma 136:152–159.
Miller, D.E. 1971. Formation of vesicular structure in soil. Soil Sci. Soc. Am. Proc. 35:635–637.
Munsell Color. 1988. Munsell soil color charts. Kollmorgen Instruments Corp., Baltimore, MD.
Page 14 of 23
Nash, D.J. 2011. Desert crusts and rock coatings. In: D.S.G. Thomas, editor, Arid zone geomorphology: Process, form and change in drylands. 3rd ed. John Wiley & Sons, Chichester, West Sussex, UK. p. 132–180.
Navarro, J.M., M.A. Botella, A. Cerdá, and V. Martínez. 2000. Effect of salinity × calcium interaction on cation balance in melon plants grown under two regimes of orthophosphate. J. Plant Nutr. 23:991–1006.
Peech, M. 1965. Hydrogen-ion activity. In: C.A. Black, editor, Methods of soil analysis: Part 2. Chemical and microbiological properties. ASA and SSSA, Madison, WI. p. 914–962.
Pessarakli, M. (editor). 1999. Handbook of plant and crop stress. 2nd ed. CRC Press, Boca Raton, FL.
Pueyo-Mur, J.J. 1978. La precipitación evaporitica actual en las lagunas saladas del área Bujaraloz, Sástago, Caspe, Alcañiz y Calanda. Revista del Instituto de Investigaciones Geológicas de la Diputaciόn de Barcelona 33:5–56.
Pujol, J.A., J.F. Calvo, and L. Ramírez. 2000. Recovery of germination from different osmotic conditions by four halophytes from Southeastern Spain. Ann. Bot. (London) 85:279–286
Rubio-Casal, A.E., J.M. Castillo, C.J. Luque, and M.E. Figueroa. 2003. Influence of salinity on germination and seeds viability of two primary colonizers of Mediterranean salt pans. J. Arid Environ. 53:145–154.
Salvany, J.M., M.A. García-Vera, and J. Samper. 1996. Geología e hidrogeología de la zona endorreica de Bujaraloz-Sástago. Acta Geologica Hispanica 30:31–50.
Samper-Calvete, F.J., and M.A. García-Vera. 1998. Inverse modelling of groundwater flow in the semiarid evaporitic closed basin of Monegros, Spain. Hydrogeol. J. 6:33–49.
Schoeneberger, P.J., D.A. Wysocki, and E.C. Benham (editors). 2011. Field book for describing and sampling soils, Version 3.0. Natural Resources Conserv. Serv., Natl. Soil Survey Ctr., Lincoln, NE.
Soil Survey Staff. 1996. National soil survey handbook. USDA, Natural Resources Conserv. Serv.,U.S. Gov. Print. Office, Washington, DC.
Soil Survey Staff. 2010. Keys to soil taxonomy. 11th ed. USDA, Natural Resources Conserv. Serv., Washington, DC.
Springer, M.E. 1958. Desert pavement and vesicular layer of some soils of the desert of the Lahontan Basin, Nevada. Soil Sci. Soc. Am. Proc. 22:63–66.
Turk, J.K., and R.C. Graham. 2011. Distribution and properties of vesicular horizons in the Western United States. Soil Sci. Soc. Am. J. 75:1449–1461.
U.S. Salinity Laboratory Staff. 1954. Diagnosis and improvement of saline and alkali soils. Agric. Handb. 60. U.S. Gov. Print. Office, Washington, DC.
Vicente, M.J., E. Conesa, J. Álvarez-Rogel, J.A. Franco, and J.J. Martínez-Sánchez. 2007. Effects of various salts on the germination of three perennial salt marsh species. Aquat. Bot. 87:167–170.
Wolters, M., J. Geertsema, E.R. Chang, R.M. Veeneklaas, P.D. Carey, and J.P. Bakker. 2004. Astroturf seed traps for studying hydrochory. Funct. Ecol. 18:141–147.
Page 15 of 23
Woodell, S.R.J. 1985. Salinity and seed germination patterns in coastal plants. Vegetatio 61:223–229.
Yonovitz, M., and P.J. Drohan. 2009. Pore morphology characteristics of vesicular horizons in undisturbed and disturbed arid soils; implications for arid land management. Soil Use Manage. 25:293–302.
Young, M.H., E.V. McDonald, T.G. Caldwell, S.G. Benner, and D.G. Meadows. 2004. Hydraulic properties of a desert soil chronosequence in the Mojave Desert, USA. Vadose Zone J. 3:956–963.
Zedler, J.B., H. Morzaria-Luna, and K. Ward. 2003. The challenge of restoring vegetation on tidal, hypersaline substrates. Plant Soil 253:259–273.
Fig. 1. Views of the soil surface in the saladas. All show the polygonal pattern with different development of plates of A1v horizon. In (a) the pattern survives inundation, in (b) and (c) salts concentrate in cracks, in (d) curled desiccation plates, easily separable from the A2 horizon, form discontinuous mulch in Agustín (AGU3 site).
Fig. 2. Location of the main saline wetlands or “saladas” in the Monegros region, south of Bujaraloz, Spain. The sampled saladas are shaded in gray.
Fig. 3. Boxplots of gravimetric moisture measured in July and December for A1v and A2 horizons, and A horizon.
Fig. 4. Scatter plot of EC1:5 in A1v against A2 at each sampling site. Circles are for July, and crosses for December. Dashed line is x = y.
Fig. 5. Boxplots of EC1:5 in July and December for all samples, for the A1v and A2 horizons, and the A horizon. Circles are the means, horizontal lines are the medians, small boxes are the confidence intervals for the median at p < 0.05).
Fig. 6. Gypsum content in July at each A.m. site for A1v horizon (circles), and A2 horizon (crosses). The curved lines are for the smoothed distributions of A1v (dashed) and A2 (solid).
Fig. 7. Schoeller–Berkaloff diagrams of each sampling site for A1v and A2. Only sites with divergent composition are labeled.
Fig. 8. Schematic profile of the soil surface at the bottom of the saladas, showing different degrees of discontinuity between A1v and A2. Arrows indicate capillary flow of water rich in salts (curved) and water evaporation (undulating). In (a) salt content increases more in A2 than in A1v, whereas in (b) the opposite happens; (c) formation of vesicular pores in progress, before of the development of cracks and plates; (d) beginning of crack pattern formation marked by salt crystals; (e) polygonal shallow cracks in the vesicular horizon and isolated plates.
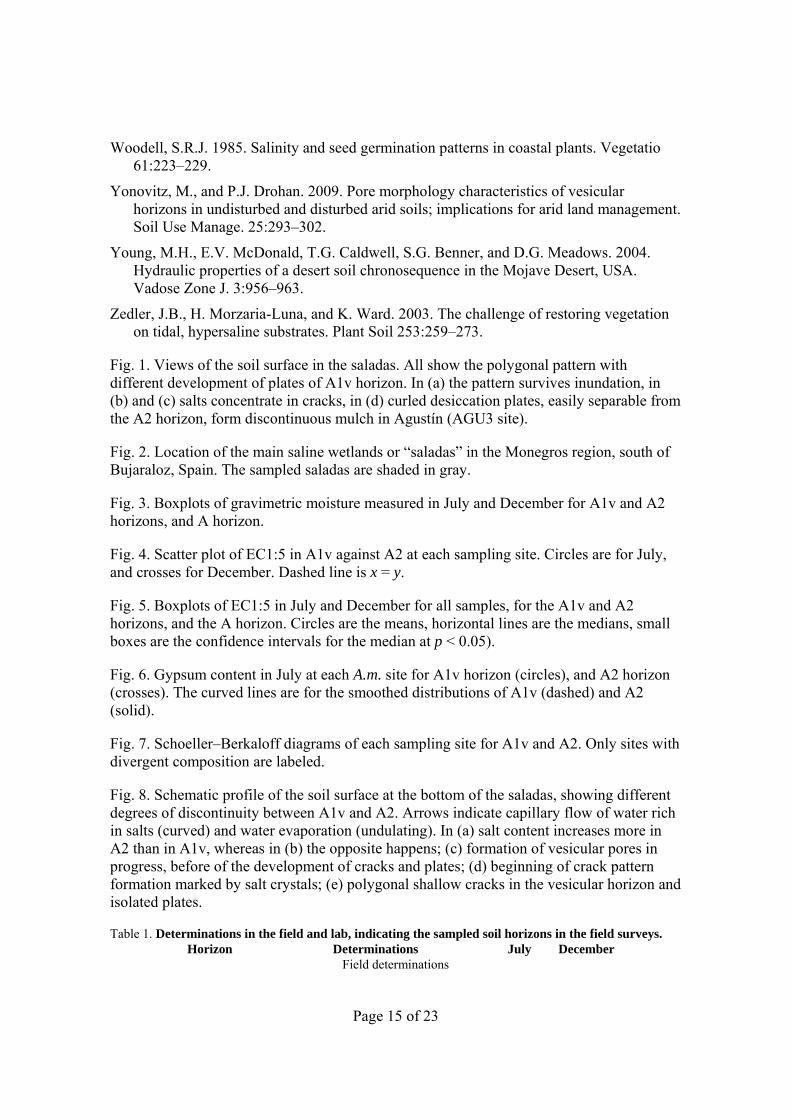
Table 1. Determinations in the field and lab, indicating the sampled soil horizons in the field surveys. Horizon Determinations July December
Field determinations

Page 16 of 23
A Soil temperature x x
Thickness of the T layer x x Lab determinations
A1v Gravimetric moisture
x x A2 x x A x x A1v
CE1:5 and CE1:10 x x
A2 x x A x x A1v
Munsell color x
A2 x A x A1v
SO4, Cl, Ca, Mg, Na, K†, Gypsum x
A2 x A x
A Calcium carbonate equivalent, organic
matter, pH, total N x
† Only for A horizon samples.
Page 17 of 23
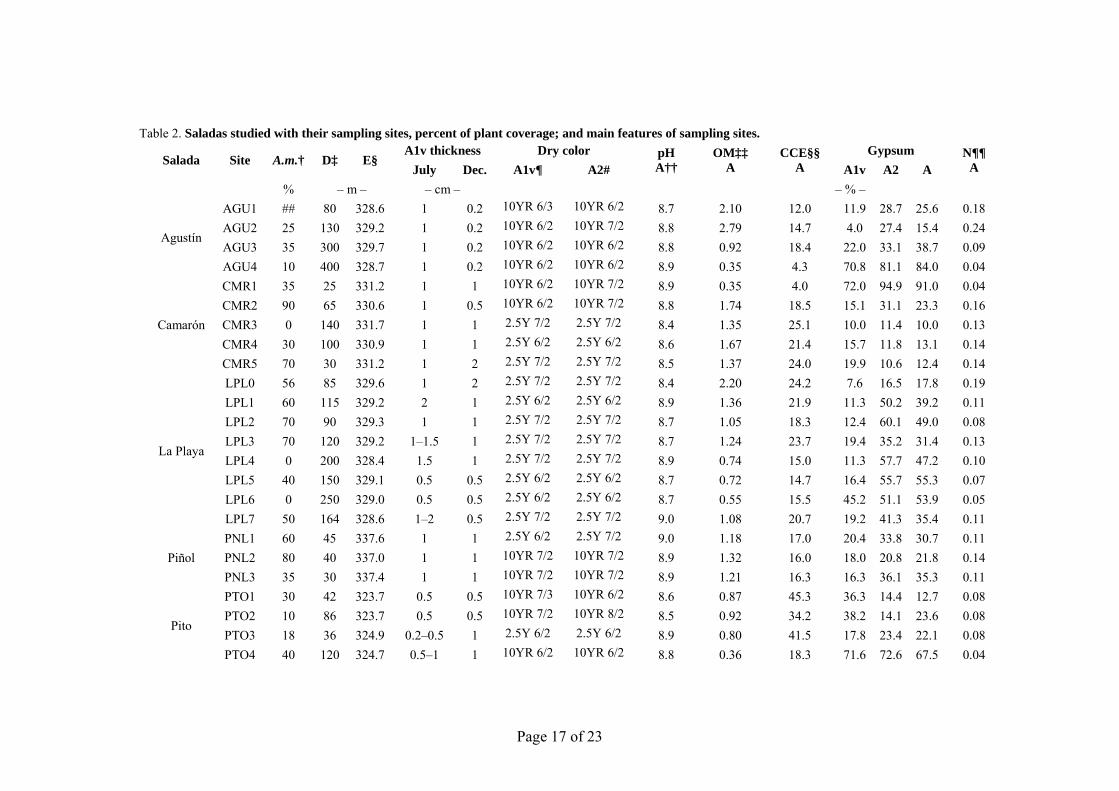
Table 2. Saladas studied with their sampling sites, percent of plant coverage; and main features of sampling sites.
Salada Site A.m.† D‡ E§ A1v thickness Dry color pH
A†† OM‡‡
A CCE§§
A Gypsum N¶¶
A July Dec. A1v¶ A2# A1v A2 A % – m – – cm – – % –
Agustín
AGU1 ## 80 328.6 1 0.2 10YR 6/3 10YR 6/2 8.7 2.10 12.0 11.9 28.7 25.6 0.18 AGU2 25 130 329.2 1 0.2 10YR 6/2 10YR 7/2 8.8 2.79 14.7 4.0 27.4 15.4 0.24 AGU3 35 300 329.7 1 0.2 10YR 6/2 10YR 6/2 8.8 0.92 18.4 22.0 33.1 38.7 0.09 AGU4 10 400 328.7 1 0.2 10YR 6/2 10YR 6/2 8.9 0.35 4.3 70.8 81.1 84.0 0.04
Camarón
CMR1 35 25 331.2 1 1 10YR 6/2 10YR 7/2 8.9 0.35 4.0 72.0 94.9 91.0 0.04 CMR2 90 65 330.6 1 0.5 10YR 6/2 10YR 7/2 8.8 1.74 18.5 15.1 31.1 23.3 0.16 CMR3 0 140 331.7 1 1 2.5Y 7/2 2.5Y 7/2 8.4 1.35 25.1 10.0 11.4 10.0 0.13 CMR4 30 100 330.9 1 1 2.5Y 6/2 2.5Y 6/2 8.6 1.67 21.4 15.7 11.8 13.1 0.14 CMR5 70 30 331.2 1 2 2.5Y 7/2 2.5Y 7/2 8.5 1.37 24.0 19.9 10.6 12.4 0.14
La Playa
LPL0 56 85 329.6 1 2 2.5Y 7/2 2.5Y 7/2 8.4 2.20 24.2 7.6 16.5 17.8 0.19 LPL1 60 115 329.2 2 1 2.5Y 6/2 2.5Y 6/2 8.9 1.36 21.9 11.3 50.2 39.2 0.11 LPL2 70 90 329.3 1 1 2.5Y 7/2 2.5Y 7/2 8.7 1.05 18.3 12.4 60.1 49.0 0.08 LPL3 70 120 329.2 1–1.5 1 2.5Y 7/2 2.5Y 7/2 8.7 1.24 23.7 19.4 35.2 31.4 0.13 LPL4 0 200 328.4 1.5 1 2.5Y 7/2 2.5Y 7/2 8.9 0.74 15.0 11.3 57.7 47.2 0.10 LPL5 40 150 329.1 0.5 0.5 2.5Y 6/2 2.5Y 6/2 8.7 0.72 14.7 16.4 55.7 55.3 0.07 LPL6 0 250 329.0 0.5 0.5 2.5Y 6/2 2.5Y 6/2 8.7 0.55 15.5 45.2 51.1 53.9 0.05 LPL7 50 164 328.6 1–2 0.5 2.5Y 7/2 2.5Y 7/2 9.0 1.08 20.7 19.2 41.3 35.4 0.11
Piñol PNL1 60 45 337.6 1 1 2.5Y 6/2 2.5Y 7/2 9.0 1.18 17.0 20.4 33.8 30.7 0.11 PNL2 80 40 337.0 1 1 10YR 7/2 10YR 7/2 8.9 1.32 16.0 18.0 20.8 21.8 0.14 PNL3 35 30 337.4 1 1 10YR 7/2 10YR 7/2 8.9 1.21 16.3 16.3 36.1 35.3 0.11
Pito
PTO1 30 42 323.7 0.5 0.5 10YR 7/3 10YR 6/2 8.6 0.87 45.3 36.3 14.4 12.7 0.08 PTO2 10 86 323.7 0.5 0.5 10YR 7/2 10YR 8/2 8.5 0.92 34.2 38.2 14.1 23.6 0.08 PTO3 18 36 324.9 0.2–0.5 1 2.5Y 6/2 2.5Y 6/2 8.9 0.80 41.5 17.8 23.4 22.1 0.08 PTO4 40 120 324.7 0.5–1 1 10YR 6/2 10YR 6/2 8.8 0.36 18.3 71.6 72.6 67.5 0.04
Page 18 of 23
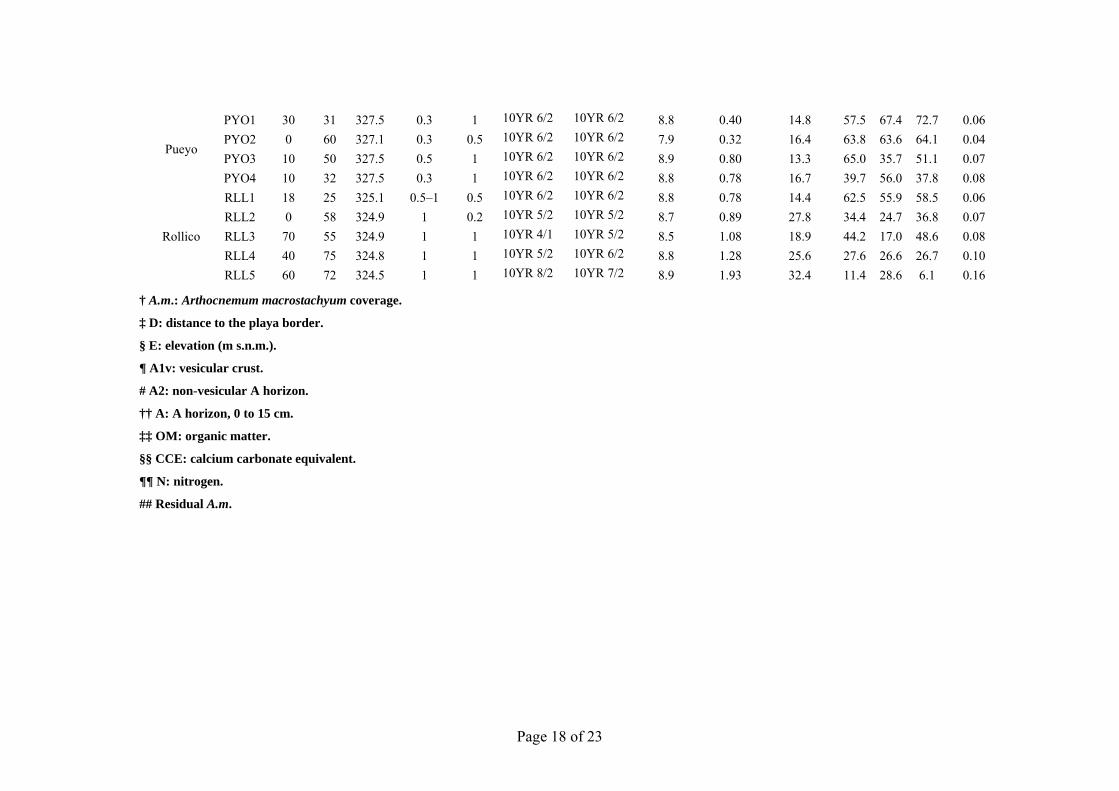
Pueyo
PYO1 30 31 327.5 0.3 1 10YR 6/2 10YR 6/2 8.8 0.40 14.8 57.5 67.4 72.7 0.06 PYO2 0 60 327.1 0.3 0.5 10YR 6/2 10YR 6/2 7.9 0.32 16.4 63.8 63.6 64.1 0.04 PYO3 10 50 327.5 0.5 1 10YR 6/2 10YR 6/2 8.9 0.80 13.3 65.0 35.7 51.1 0.07 PYO4 10 32 327.5 0.3 1 10YR 6/2 10YR 6/2 8.8 0.78 16.7 39.7 56.0 37.8 0.08
Rollico
RLL1 18 25 325.1 0.5–1 0.5 10YR 6/2 10YR 6/2 8.8 0.78 14.4 62.5 55.9 58.5 0.06 RLL2 0 58 324.9 1 0.2 10YR 5/2 10YR 5/2 8.7 0.89 27.8 34.4 24.7 36.8 0.07 RLL3 70 55 324.9 1 1 10YR 4/1 10YR 5/2 8.5 1.08 18.9 44.2 17.0 48.6 0.08 RLL4 40 75 324.8 1 1 10YR 5/2 10YR 6/2 8.8 1.28 25.6 27.6 26.6 26.7 0.10 RLL5 60 72 324.5 1 1 10YR 8/2 10YR 7/2 8.9 1.93 32.4 11.4 28.6 6.1 0.16
† A.m.: Arthocnemum macrostachyum coverage.
‡ D: distance to the playa border.
§ E: elevation (m s.n.m.).
¶ A1v: vesicular crust.
# A2: non-vesicular A horizon.
†† A: A horizon, 0 to 15 cm.
‡‡ OM: organic matter.
§§ CCE: calcium carbonate equivalent.
¶¶ N: nitrogen.
## Residual A.m.
Page 19 of 23
Table 3. Maximum and mean values of Cl, Ca, K, Na, Mg, SO4 (meq L–1) from 1:10 ratio soil/water extracts of the A1v and A2 horizons in July. Means are significantly († p < 0.005; * p < 0.05) except for Ca.
Ion A1v horizon A2 horizon
Max. Mean Max. Mean
Ca 50.7 33.9 41.8 35.7
Mg† 140.8 39.3 67.4 21.4
Na† 258.8 84.8 75.7 54.4
K* 5.9 2.6 3.6 2.4
Cl† 182.0 89.3 82.4 54.0
SO4† 236.4 81.7 108.6 65.2
Mg/Ca† 4.9 1.4 2.5 0.7
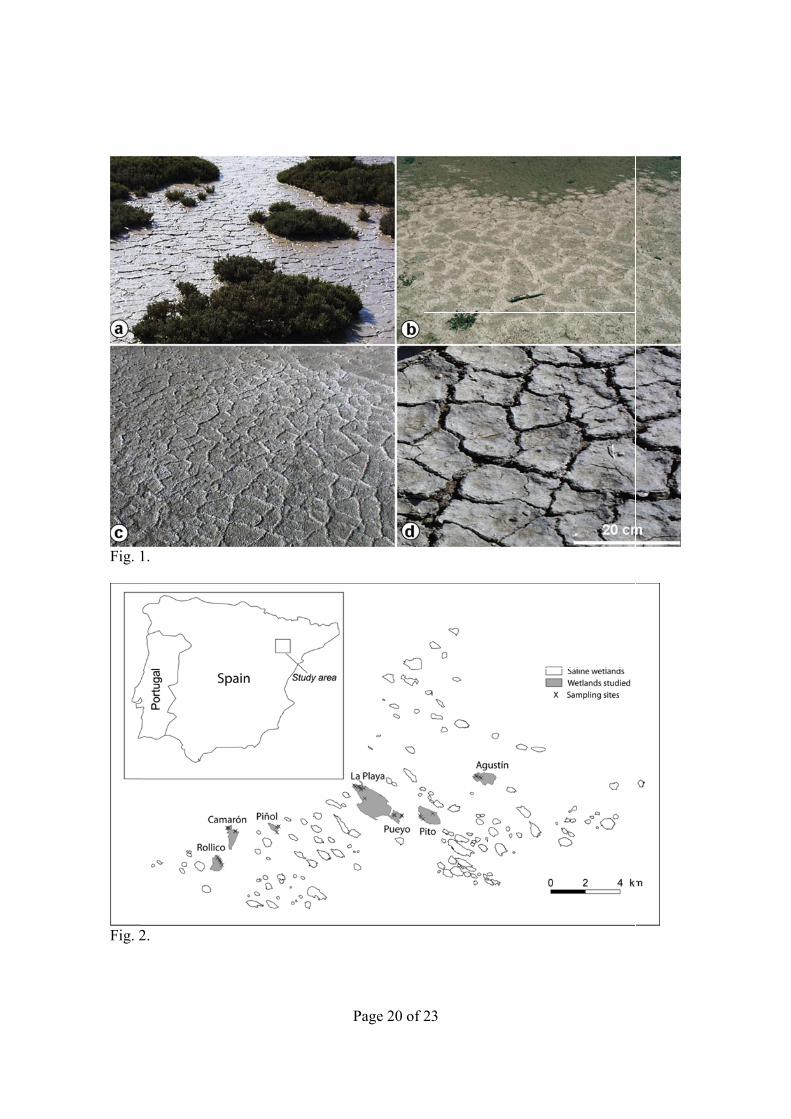
Fig. 1
Fig. 2
1.
2.
Page 20 of 223
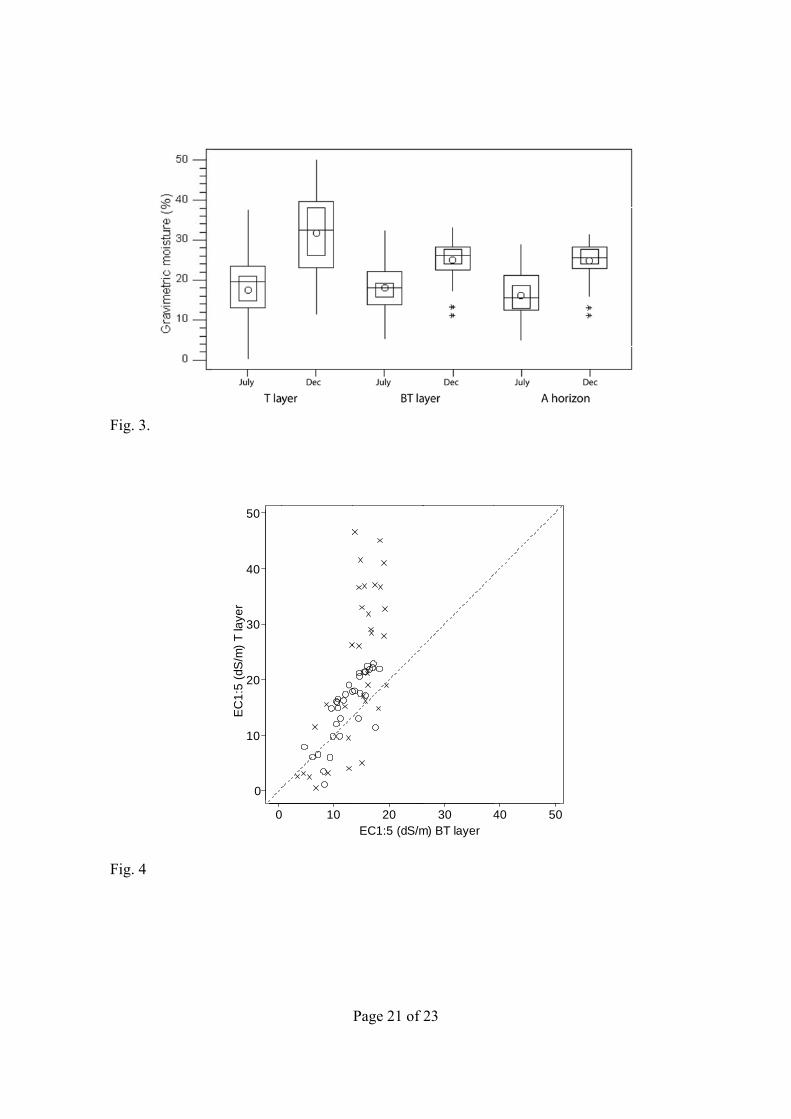
Fig. 3
Fig. 4
3.
4
0
0
10
20
30
40
50
EC
1:5
(dS
/m)
T la
yer
10
Page 21 of 2
20EC1:5 (dS/m
23
30 4m) BT layer
40 50
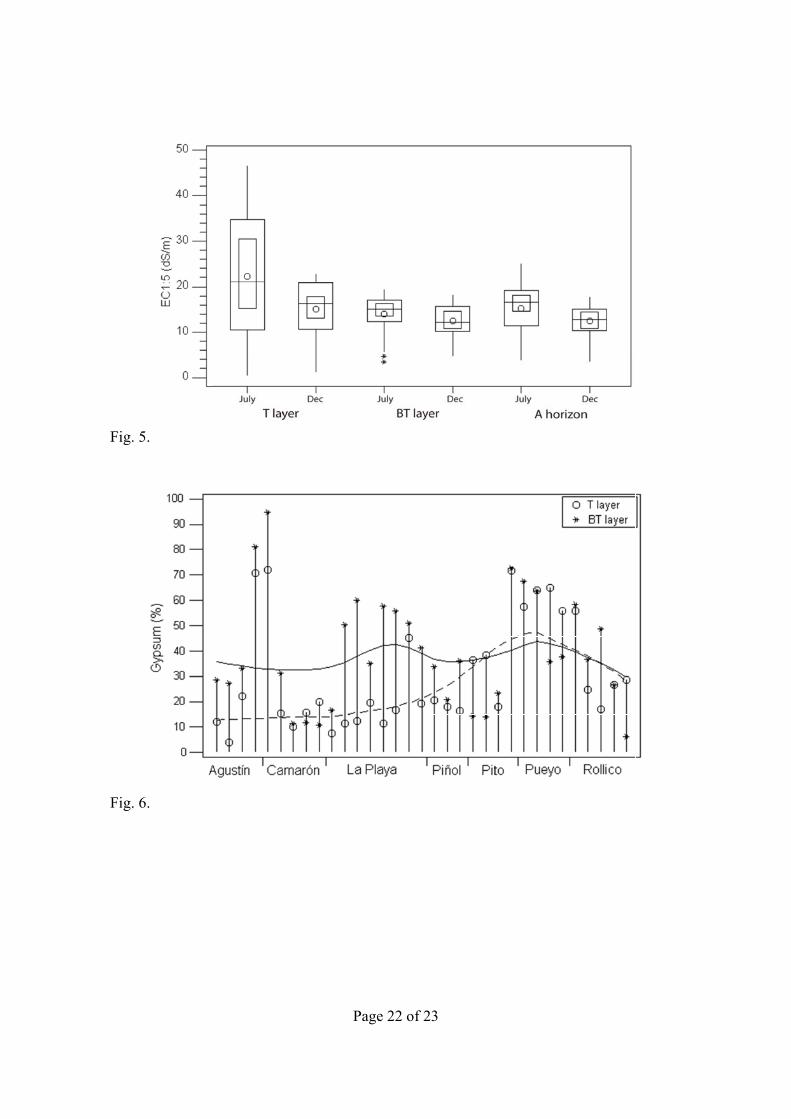
Fig. 5
Fig. 6
5.
6.
Page 22 of 2
23
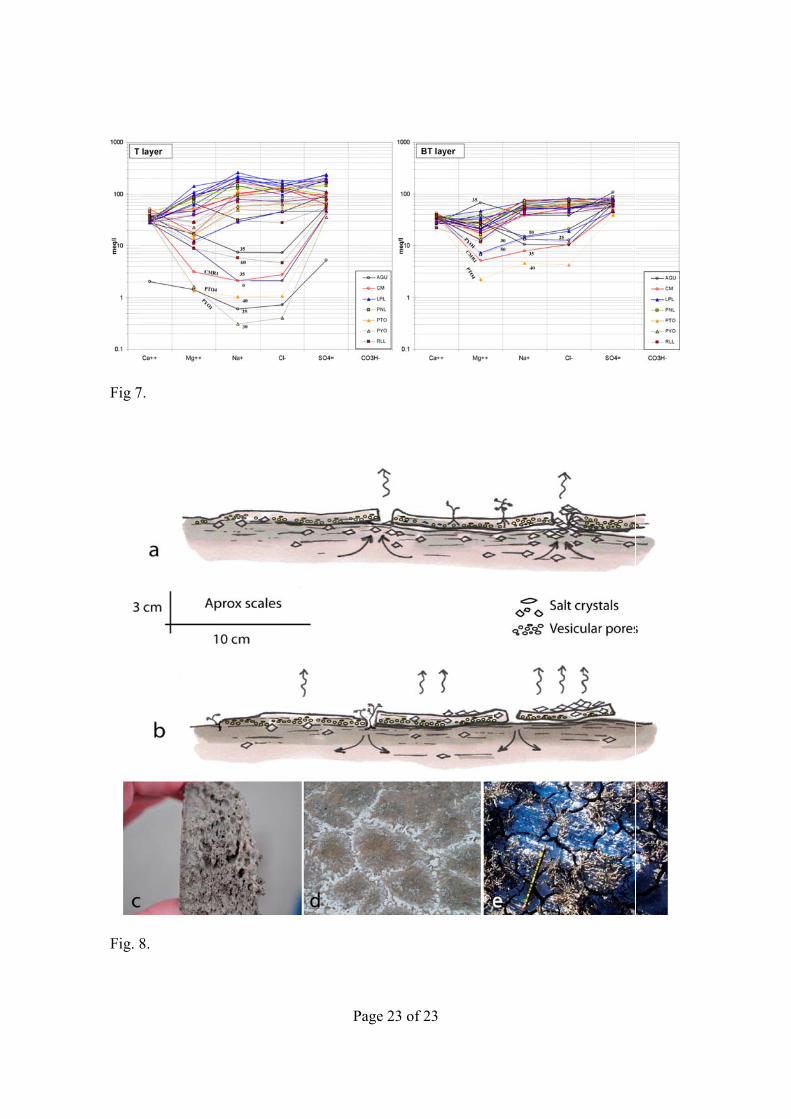
Fig 7
Fig. 8
7.
8.
Page 23 of 223