Embed Size (px)
Citation preview

TWO-PHASE REACTIVE TRANSPORT
OF AN OIL-SOLUBLE CHEMICAL
an NMR study

TWO-PHASE REACTIVE TRANSPORT
OF AN OIL-SOLUBLE CHEMICAL
an NMR study
Proefschrift
ter verkrijging van de graad van doctoraan de Technische Universiteit Delft,
op gezag van de Rector Magnificus prof.dr.ir. J. T. Fokkema,voorzitter van het College voor Promoties,
in het openbaar te verdedigen op dinsdag 25 september 2007 om 12.30 uur
door
Henricus Jozef CASTELIJNS
natuurkundig ingenieur
geboren te Eindhoven
Dit proefschrift is goedgekeurd door de promotoren:
Prof.dr. P. K. CurrieenProf.dr. S. M. LuthienProf.dr. P. L. J. Zitha
Samenstelling promotiecommissie:
Rector Magnificus voorzitterProf.dr. P. K. Currie Technische Universiteit Delft, promotorProf.dr. S. M. Luthi Technische Universiteit Delft, promotorProf.dr. P. L. J. Zitha Technische Universiteit Delft, promotorProf.dr. W. R. Rossen Technische Universiteit DelftProf.dr.ir. K. Kopinga Technische Universiteit EindhovenProf.dr. M. Golombok Technische Universiteit EindhovenDr. M. Hurlimann Schlumberger-Doll ResearchProf.dr. J. Bruining Technische Universiteit Delft, reservelid
The work described in this thesis has been carried out in the group Petroleum Engineeringat the Delft University of Technology, Department of Civil Engineering and Geosciencesand in the group Transport in Permeable Media at the Eindhoven University of Technol-ogy, Department of Applied Physics.
This research was financially supported by the Dutch Technology Foundation STW (DAR5756) and by a consortium of the following companies: Shell, INA Naftaplin, Chevron,Statoil, Conoco-Philips, and Gaz de France. A travel grant was provided by the Nether-lands Organisation for Scientific Research (NWO).
Copyright c© 2007 H. J. CastelijnsISBN 978-90-9022199-1Printed by Gildeprint B.V., EnschedeCover design by Paul Verspaget (images by Hein Castelijns)
Contents
1. Introduction . . . . . . . . . . . . . . . . . . . . . . . . . . . . . . . . . . . . . 11.1 Water control using gels . . . . . . . . . . . . . . . . . . . . . . . . . . . . 11.2 Oil-Soluble Chemicals . . . . . . . . . . . . . . . . . . . . . . . . . . . . . 31.3 Scope of thesis . . . . . . . . . . . . . . . . . . . . . . . . . . . . . . . . . 41.4 Outline of thesis . . . . . . . . . . . . . . . . . . . . . . . . . . . . . . . . . 5
Part I. Two-phase bulk systems . . . . . . . . . . . . . . . . . . . . . . . . . . 7
2. Coupled mass transfer and sol-gel reaction in a two-phase bulk system 92.1 Introduction . . . . . . . . . . . . . . . . . . . . . . . . . . . . . . . . . . . 92.2 Principle of nuclear magnetic relaxation in liquids . . . . . . . . . . . . . . 11
2.2.1 Pure liquids . . . . . . . . . . . . . . . . . . . . . . . . . . . . . . . 112.2.2 Correlation of relaxation times with viscosity in pure liquids . . . . 122.2.3 Binary mixtures . . . . . . . . . . . . . . . . . . . . . . . . . . . . . 132.2.4 Correlation of relaxation times with viscosity in binary mixtures . . 14
2.3 Experimental section . . . . . . . . . . . . . . . . . . . . . . . . . . . . . . 142.3.1 Chemicals and preparation . . . . . . . . . . . . . . . . . . . . . . . 142.3.2 NMR apparatus and sequences . . . . . . . . . . . . . . . . . . . . 142.3.3 Bulk experiments . . . . . . . . . . . . . . . . . . . . . . . . . . . . 16
2.4 Results and discussion . . . . . . . . . . . . . . . . . . . . . . . . . . . . . 182.4.1 Calibration results . . . . . . . . . . . . . . . . . . . . . . . . . . . 182.4.2 Two-phase bulk systems . . . . . . . . . . . . . . . . . . . . . . . . 25
2.5 Conclusion . . . . . . . . . . . . . . . . . . . . . . . . . . . . . . . . . . . . 30
3. Interfacial effects during reactive transport . . . . . . . . . . . . . . . . . 313.1 Introduction . . . . . . . . . . . . . . . . . . . . . . . . . . . . . . . . . . . 313.2 Physical model . . . . . . . . . . . . . . . . . . . . . . . . . . . . . . . . . 32
3.2.1 Mass transfer and chemical reactions . . . . . . . . . . . . . . . . . 323.2.2 Interface description . . . . . . . . . . . . . . . . . . . . . . . . . . 343.2.3 Image analysis . . . . . . . . . . . . . . . . . . . . . . . . . . . . . . 353.2.4 Optimization procedure . . . . . . . . . . . . . . . . . . . . . . . . 35
3.3 Experimental section . . . . . . . . . . . . . . . . . . . . . . . . . . . . . . 353.3.1 Materials . . . . . . . . . . . . . . . . . . . . . . . . . . . . . . . . 353.3.2 MRI experiments . . . . . . . . . . . . . . . . . . . . . . . . . . . . 363.3.3 Tensiometer . . . . . . . . . . . . . . . . . . . . . . . . . . . . . . . 36
3.4 Results and discussion . . . . . . . . . . . . . . . . . . . . . . . . . . . . . 373.4.1 MRI analysis and optimization . . . . . . . . . . . . . . . . . . . . 373.4.2 IFT from the tensiometer . . . . . . . . . . . . . . . . . . . . . . . 403.4.3 Discussion . . . . . . . . . . . . . . . . . . . . . . . . . . . . . . . . 41
3.5 Conclusion . . . . . . . . . . . . . . . . . . . . . . . . . . . . . . . . . . . . 42
i
4. The effect of pH on mass transfer and gelation . . . . . . . . . . . . . . . 434.1 Introduction . . . . . . . . . . . . . . . . . . . . . . . . . . . . . . . . . . . 434.2 Theoretical background . . . . . . . . . . . . . . . . . . . . . . . . . . . . . 44
4.2.1 Mass transfer and hydrolysis . . . . . . . . . . . . . . . . . . . . . . 444.2.2 NMR relaxation of deuterium in sol-gel . . . . . . . . . . . . . . . . 45
4.3 Experimental section . . . . . . . . . . . . . . . . . . . . . . . . . . . . . . 474.3.1 Materials . . . . . . . . . . . . . . . . . . . . . . . . . . . . . . . . 474.3.2 NMR measurements . . . . . . . . . . . . . . . . . . . . . . . . . . 48
4.4 Results and discussion . . . . . . . . . . . . . . . . . . . . . . . . . . . . . 484.4.1 Calibration experiments . . . . . . . . . . . . . . . . . . . . . . . . 484.4.2 Two-phase bulk experiments . . . . . . . . . . . . . . . . . . . . . . 50
4.5 Conclusion . . . . . . . . . . . . . . . . . . . . . . . . . . . . . . . . . . . . 55
5. Cross-linking of silica with a time-dependent monomer source . . . . . 575.1 Introduction . . . . . . . . . . . . . . . . . . . . . . . . . . . . . . . . . . . 575.2 Theory . . . . . . . . . . . . . . . . . . . . . . . . . . . . . . . . . . . . . . 58
5.2.1 Mass transfer and hydrolysis . . . . . . . . . . . . . . . . . . . . . . 585.2.2 Population balance model . . . . . . . . . . . . . . . . . . . . . . . 595.2.3 Gelation and percolation . . . . . . . . . . . . . . . . . . . . . . . . 615.2.4 Nuclear magnetic relaxation of deuterium in gel . . . . . . . . . . . 64
5.3 Results and discussion . . . . . . . . . . . . . . . . . . . . . . . . . . . . . 655.3.1 Experimental observations . . . . . . . . . . . . . . . . . . . . . . . 655.3.2 Model calculations . . . . . . . . . . . . . . . . . . . . . . . . . . . 67
5.4 Conclusion . . . . . . . . . . . . . . . . . . . . . . . . . . . . . . . . . . . . 73
Part II. Gel placement in porous materials . . . . . . . . . . . . . . . . . . . 75
6. Coupled mass transfer and gelation of TMOS in porous materials . . . 776.1 Introduction . . . . . . . . . . . . . . . . . . . . . . . . . . . . . . . . . . . 776.2 Experimental section . . . . . . . . . . . . . . . . . . . . . . . . . . . . . . 79
6.2.1 Materials and methods . . . . . . . . . . . . . . . . . . . . . . . . . 796.2.2 Core holder and fluid injection system . . . . . . . . . . . . . . . . 816.2.3 NMR apparatus and methods . . . . . . . . . . . . . . . . . . . . . 816.2.4 Experimental procedure . . . . . . . . . . . . . . . . . . . . . . . . 82
6.3 Results and discussion . . . . . . . . . . . . . . . . . . . . . . . . . . . . . 836.3.1 NMR relaxation times of fluids and gels in bulk . . . . . . . . . . . 836.3.2 NMR relaxation times of fluids in sandstone . . . . . . . . . . . . . 856.3.3 Mass transfer of TMOS . . . . . . . . . . . . . . . . . . . . . . . . 876.3.4 Gelation . . . . . . . . . . . . . . . . . . . . . . . . . . . . . . . . . 926.3.5 Effect of treatment on permeability . . . . . . . . . . . . . . . . . . 94
6.4 Conclusion . . . . . . . . . . . . . . . . . . . . . . . . . . . . . . . . . . . . 95
7. Permeability reduction in porous materials by in situ formed silica gel 977.1 Introduction . . . . . . . . . . . . . . . . . . . . . . . . . . . . . . . . . . . 977.2 Theoretical background . . . . . . . . . . . . . . . . . . . . . . . . . . . . . 987.3 Experimental section . . . . . . . . . . . . . . . . . . . . . . . . . . . . . . 99
7.3.1 Materials . . . . . . . . . . . . . . . . . . . . . . . . . . . . . . . . 997.3.2 Preparation of gels and rock samples . . . . . . . . . . . . . . . . . 1007.3.3 Beam bending setup . . . . . . . . . . . . . . . . . . . . . . . . . . 101
ii
7.4 Results and discussion . . . . . . . . . . . . . . . . . . . . . . . . . . . . . 1027.4.1 Gels . . . . . . . . . . . . . . . . . . . . . . . . . . . . . . . . . . . 1027.4.2 Sandstone slabs . . . . . . . . . . . . . . . . . . . . . . . . . . . . . 106
7.5 Conclusion . . . . . . . . . . . . . . . . . . . . . . . . . . . . . . . . . . . . 112
8. Model of reactive transport of an oil-soluble chemical in porous media 1138.1 Introduction . . . . . . . . . . . . . . . . . . . . . . . . . . . . . . . . . . . 1138.2 Theoretical background . . . . . . . . . . . . . . . . . . . . . . . . . . . . . 114
8.2.1 Problem statement . . . . . . . . . . . . . . . . . . . . . . . . . . . 1148.2.2 Material balance equation . . . . . . . . . . . . . . . . . . . . . . . 1158.2.3 Initial and boundary conditions . . . . . . . . . . . . . . . . . . . . 1168.2.4 Mass transfer . . . . . . . . . . . . . . . . . . . . . . . . . . . . . . 1168.2.5 Reaction terms . . . . . . . . . . . . . . . . . . . . . . . . . . . . . 117
8.3 Method of solution . . . . . . . . . . . . . . . . . . . . . . . . . . . . . . . 1188.3.1 General equation . . . . . . . . . . . . . . . . . . . . . . . . . . . . 1188.3.2 Numerical solution . . . . . . . . . . . . . . . . . . . . . . . . . . . 119
8.4 Results and discussion . . . . . . . . . . . . . . . . . . . . . . . . . . . . . 1198.4.1 Choice of parameters . . . . . . . . . . . . . . . . . . . . . . . . . . 1198.4.2 Case A. Batch injection: example . . . . . . . . . . . . . . . . . . . 1228.4.3 Case A. Batch injection: effect of main parameters . . . . . . . . . 1258.4.4 Case B. Continuous injection: example . . . . . . . . . . . . . . . . 1268.4.5 Case B. Continuous injection: effect of main parameters . . . . . . 127
8.5 Conclusion . . . . . . . . . . . . . . . . . . . . . . . . . . . . . . . . . . . . 128
9. Concluding remarks and outlook . . . . . . . . . . . . . . . . . . . . . . . . 1319.1 Coupled mass transfer and gel reaction . . . . . . . . . . . . . . . . . . . . 1319.2 Permeability modification . . . . . . . . . . . . . . . . . . . . . . . . . . . 1329.3 Water shut-off treatments . . . . . . . . . . . . . . . . . . . . . . . . . . . 1339.4 Outlook . . . . . . . . . . . . . . . . . . . . . . . . . . . . . . . . . . . . . 133
9.4.1 Extended physical-chemical survey . . . . . . . . . . . . . . . . . . 1339.4.2 Fine-tuning of core injection experiments . . . . . . . . . . . . . . . 1349.4.3 Employing chemical shift . . . . . . . . . . . . . . . . . . . . . . . . 1359.4.4 Pore scale effects . . . . . . . . . . . . . . . . . . . . . . . . . . . . 1369.4.5 Modeling . . . . . . . . . . . . . . . . . . . . . . . . . . . . . . . . 136
Appendix A. Nuclear Magnetic Resonance principles and set-up . . . . . . 141A.1 Semi-classical theory of NMR . . . . . . . . . . . . . . . . . . . . . . . . . 141A.2 NMR set-up . . . . . . . . . . . . . . . . . . . . . . . . . . . . . . . . . . . 144
Appendix B. Derivation of partitioning equation . . . . . . . . . . . . . . . . 147
Appendix C. Effect of slip on bending experiment . . . . . . . . . . . . . . . 149
Appendix D. Phase density approximation . . . . . . . . . . . . . . . . . . . 153
Appendix E. Numerical discretization of model . . . . . . . . . . . . . . . . 155
Bibliography . . . . . . . . . . . . . . . . . . . . . . . . . . . . . . . . . . . . . . 159
Summary . . . . . . . . . . . . . . . . . . . . . . . . . . . . . . . . . . . . . . . . 171
iii

Samenvatting . . . . . . . . . . . . . . . . . . . . . . . . . . . . . . . . . . . . . . 173
List of publications . . . . . . . . . . . . . . . . . . . . . . . . . . . . . . . . . . 175
Dankwoord . . . . . . . . . . . . . . . . . . . . . . . . . . . . . . . . . . . . . . . 177
About the author . . . . . . . . . . . . . . . . . . . . . . . . . . . . . . . . . . . 179
iv
Chapter 1
Introduction
The subject of the thesis is reactive transport of an Oil-Soluble Chemical (OSC) intwo-phase systems. It was inspired by the need for new high-performance chemicalsto reduce water production in oil and gas production wells. The context or backgroundis discussed first, followed by a short description of the concept of OSCs for watercontrol. Related studies are briefly reviewed. Finally, the scope and outline of thethesis are discussed.
1.1 Water control using gels
Each year many billions of barrels of water are produced world-wide, especially in thematuring oil fields. The produced water can stem from natural waterdrive or waterfloodthrough the mechanisms of coning, casing leaks or channeling [1]. The produced watercompromises the oil recovery and is expensive to dispose of. It was estimated that thecost-savings for the oil industry amount to about 100 million USD per year for each 1%reduction in produced water [1].
Water control or water shut-off can be accomplished by several methods. The tradi-tional method is to squeeze a cement in the near-wellbore formation which hardens oncein place [2]. However, some problems are associated with cement squeeze [3]. First, theslurry is very viscous, so that a very low injection rate needs to be applied in order toremain under the critical fracturing pressure. Secondly, due to the brittle nature of ce-ments the blocking capacity may be temporary. Furthermore, since the cement slurry isa dispersion of solids the risk exists that the permeability of the oil-producing zones isdamaged.
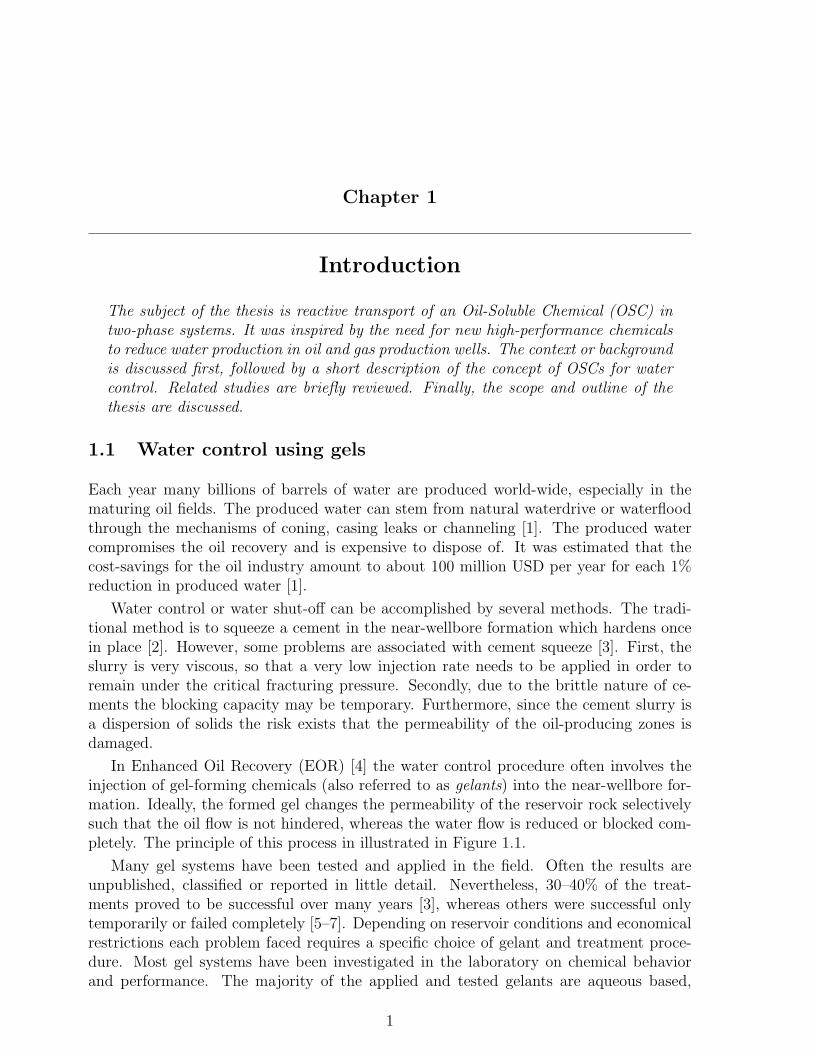
In Enhanced Oil Recovery (EOR) [4] the water control procedure often involves theinjection of gel-forming chemicals (also referred to as gelants) into the near-wellbore for-mation. Ideally, the formed gel changes the permeability of the reservoir rock selectivelysuch that the oil flow is not hindered, whereas the water flow is reduced or blocked com-pletely. The principle of this process in illustrated in Figure 1.1.
Many gel systems have been tested and applied in the field. Often the results areunpublished, classified or reported in little detail. Nevertheless, 30–40% of the treat-ments proved to be successful over many years [3], whereas others were successful onlytemporarily or failed completely [5–7]. Depending on reservoir conditions and economicalrestrictions each problem faced requires a specific choice of gelant and treatment proce-dure. Most gel systems have been investigated in the laboratory on chemical behaviorand performance. The majority of the applied and tested gelants are aqueous based,
1
2 1. Introduction
pro
du
cer
gel
3a) production after treatment
with traditional gelant
pro
du
cer
low k
(oil)
high k
(water)
barrier
pro
du
cer
gelant
1) production before treatment 2) gel treatment
pro
du
cer
gel
3b) production after treatment
with Oil-Soluble-Chemical
oil oil
water water
gel
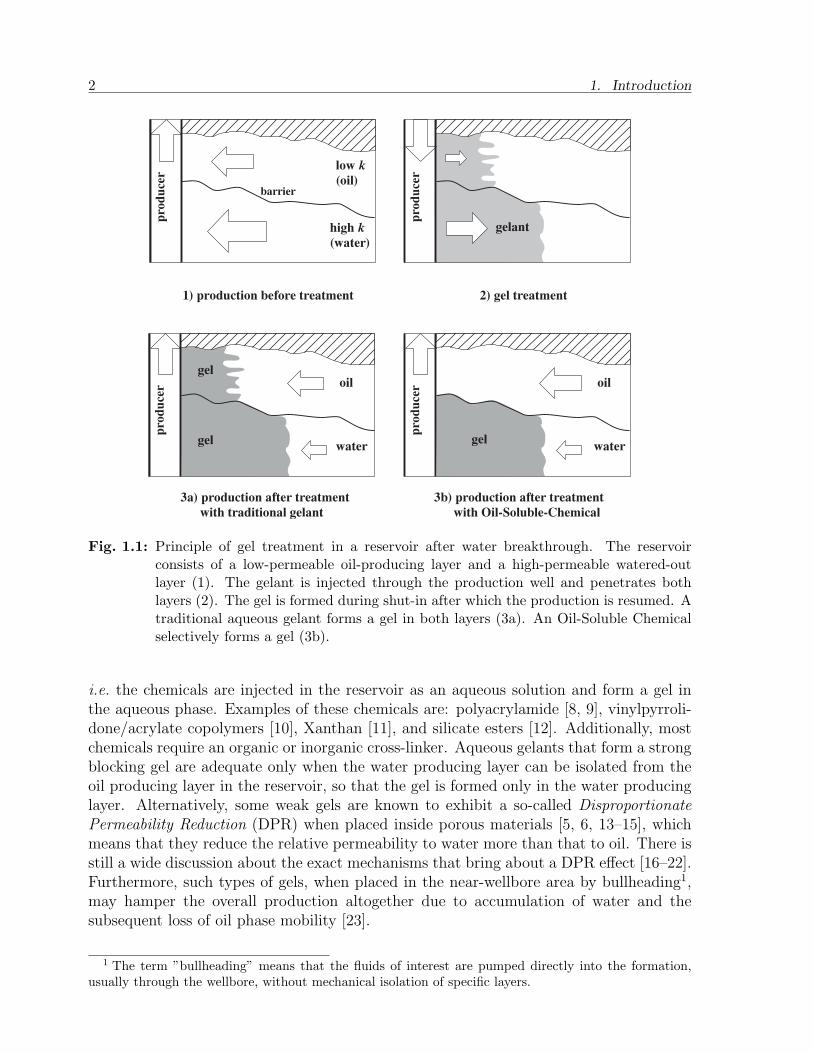
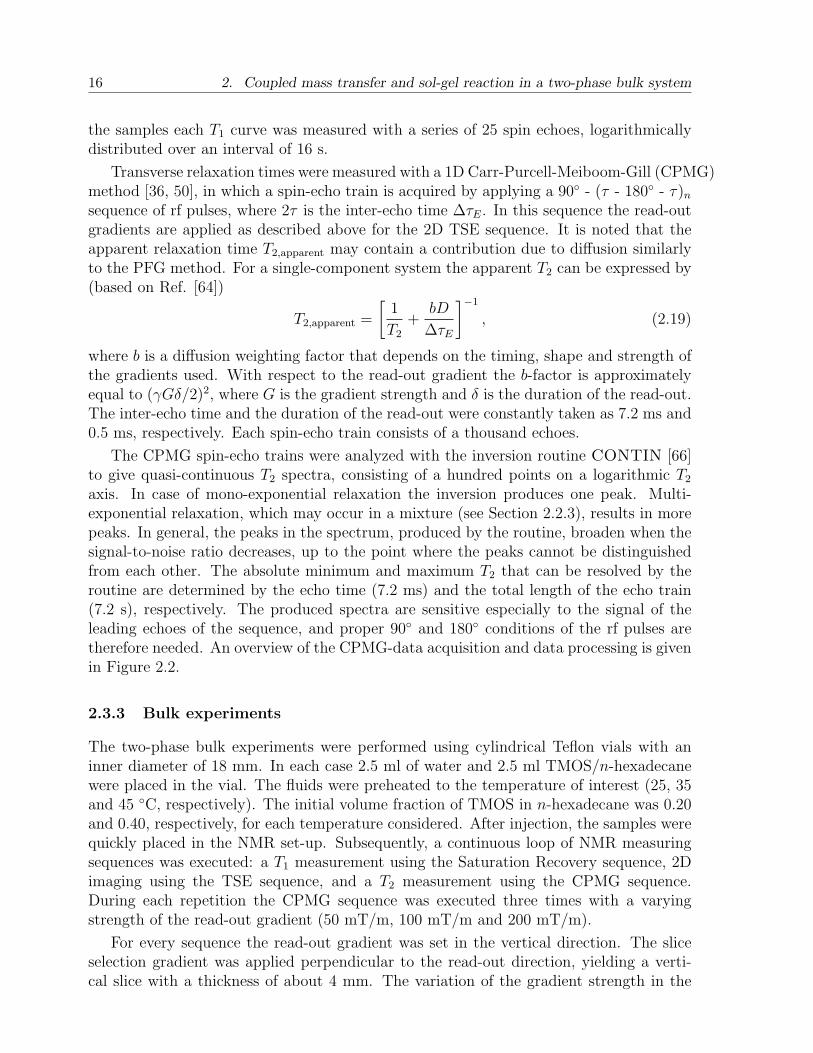
Fig. 1.1: Principle of gel treatment in a reservoir after water breakthrough. The reservoirconsists of a low-permeable oil-producing layer and a high-permeable watered-outlayer (1). The gelant is injected through the production well and penetrates bothlayers (2). The gel is formed during shut-in after which the production is resumed. Atraditional aqueous gelant forms a gel in both layers (3a). An Oil-Soluble Chemicalselectively forms a gel (3b).
i.e. the chemicals are injected in the reservoir as an aqueous solution and form a gel inthe aqueous phase. Examples of these chemicals are: polyacrylamide [8, 9], vinylpyrroli-done/acrylate copolymers [10], Xanthan [11], and silicate esters [12]. Additionally, mostchemicals require an organic or inorganic cross-linker. Aqueous gelants that form a strongblocking gel are adequate only when the water producing layer can be isolated from theoil producing layer in the reservoir, so that the gel is formed only in the water producinglayer. Alternatively, some weak gels are known to exhibit a so-called DisproportionatePermeability Reduction (DPR) when placed inside porous materials [5, 6, 13–15], whichmeans that they reduce the relative permeability to water more than that to oil. There isstill a wide discussion about the exact mechanisms that bring about a DPR effect [16–22].Furthermore, such types of gels, when placed in the near-wellbore area by bullheading1,may hamper the overall production altogether due to accumulation of water and thesubsequent loss of oil phase mobility [23].
1 The term ”bullheading” means that the fluids of interest are pumped directly into the formation,usually through the wellbore, without mechanical isolation of specific layers.
1.2. Oil-Soluble Chemicals 3
1.2 Oil-Soluble Chemicals
A novel concept in water shut-off is the application of an Oil-Soluble Chemical (OSC)which is soluble and chemically stable in oil but reacts with water to form a gel. By usingan OSC the gelant will selectively form a gel in the reservoir without blocking the oilproducing layers.
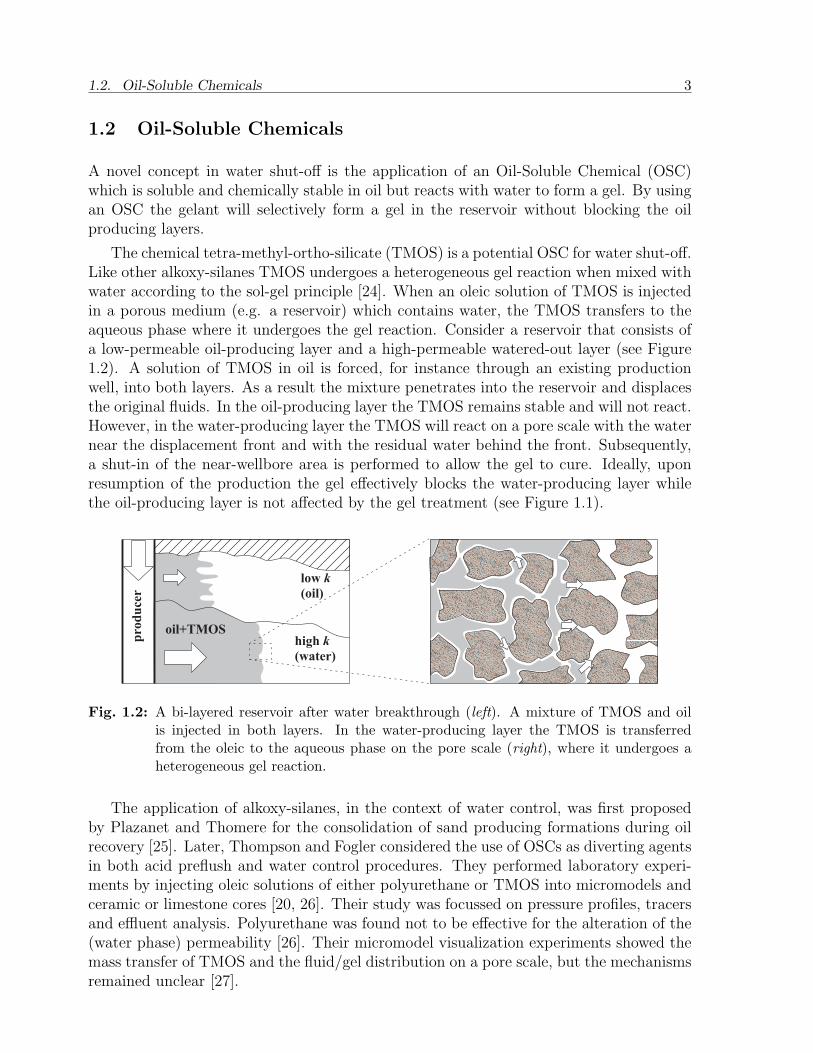
The chemical tetra-methyl-ortho-silicate (TMOS) is a potential OSC for water shut-off.Like other alkoxy-silanes TMOS undergoes a heterogeneous gel reaction when mixed withwater according to the sol-gel principle [24]. When an oleic solution of TMOS is injectedin a porous medium (e.g. a reservoir) which contains water, the TMOS transfers to theaqueous phase where it undergoes the gel reaction. Consider a reservoir that consists ofa low-permeable oil-producing layer and a high-permeable watered-out layer (see Figure1.2). A solution of TMOS in oil is forced, for instance through an existing productionwell, into both layers. As a result the mixture penetrates into the reservoir and displacesthe original fluids. In the oil-producing layer the TMOS remains stable and will not react.However, in the water-producing layer the TMOS will react on a pore scale with the waternear the displacement front and with the residual water behind the front. Subsequently,a shut-in of the near-wellbore area is performed to allow the gel to cure. Ideally, uponresumption of the production the gel effectively blocks the water-producing layer whilethe oil-producing layer is not affected by the gel treatment (see Figure 1.1).
l o w k( o i l )
h i g h k( w a t e r )
prod
ucer
o i l + T M O S
Fig. 1.2: A bi-layered reservoir after water breakthrough (left). A mixture of TMOS and oilis injected in both layers. In the water-producing layer the TMOS is transferredfrom the oleic to the aqueous phase on the pore scale (right), where it undergoes aheterogeneous gel reaction.
The application of alkoxy-silanes, in the context of water control, was first proposedby Plazanet and Thomere for the consolidation of sand producing formations during oilrecovery [25]. Later, Thompson and Fogler considered the use of OSCs as diverting agentsin both acid preflush and water control procedures. They performed laboratory experi-ments by injecting oleic solutions of either polyurethane or TMOS into micromodels andceramic or limestone cores [20, 26]. Their study was focussed on pressure profiles, tracersand effluent analysis. Polyurethane was found not to be effective for the alteration of the(water phase) permeability [26]. Their micromodel visualization experiments showed themass transfer of TMOS and the fluid/gel distribution on a pore scale, but the mechanismsremained unclear [27].
4 1. Introduction
Two inter-European cooperation projects devoted considerable effort to evaluate thepotential of TMOS as a bullhead water control agent [3]. The micromodel and coreinjection studies, conducted in these projects, were reported by Grattoni et al. [28, 29]and Bartosek et al. [30]. The effect of aging of TMOS-based gels was analyzed as wellas the mechanisms of permeability modification. Recently, Elewaut et al. and Elewautand Zitha reported experimental studies of TMOS gel treatments in sandstone cores,using pressure data [31] and X-Ray computed tomography (CT) imaging [32]. The masstransfer of the flowing gelant in the initial stages of the gel treatment was interpretedin a macroscopic sense. Other (potential) types of OSCs for water shut-off have notbeen reported sofar, except for tetra-ethyl-ortho-silicate (TEOS) [30], which is related toTMOS. However, the reaction of TEOS with water is much slower than the reaction ofTMOS with water [24].
1.3 Scope of thesis
The aim of the research was to investigate, on a fundamental level, the reactive transportof an oil-soluble gelant in two-phase systems, in bulk and within porous materials.
A clear understanding of the physical-chemical mechanisms is lacking in literature.TMOS was chosen as a model chemical. The choice is inspired by the potential useof TMOS for water shut-off in hydrocarbon reservoirs. The effect of physical-chemicalparameters, such as temperature, pH and concentration on the reactive transport wasinvestigated, since the gel reaction is known to be sensitive to these parameters [24, 33–35]. The results described in the thesis form a framework for the reactive transport ofoil-soluble gelants in general, as well as a framework for the experimental techniquesneeded in the analysis.
5 m m
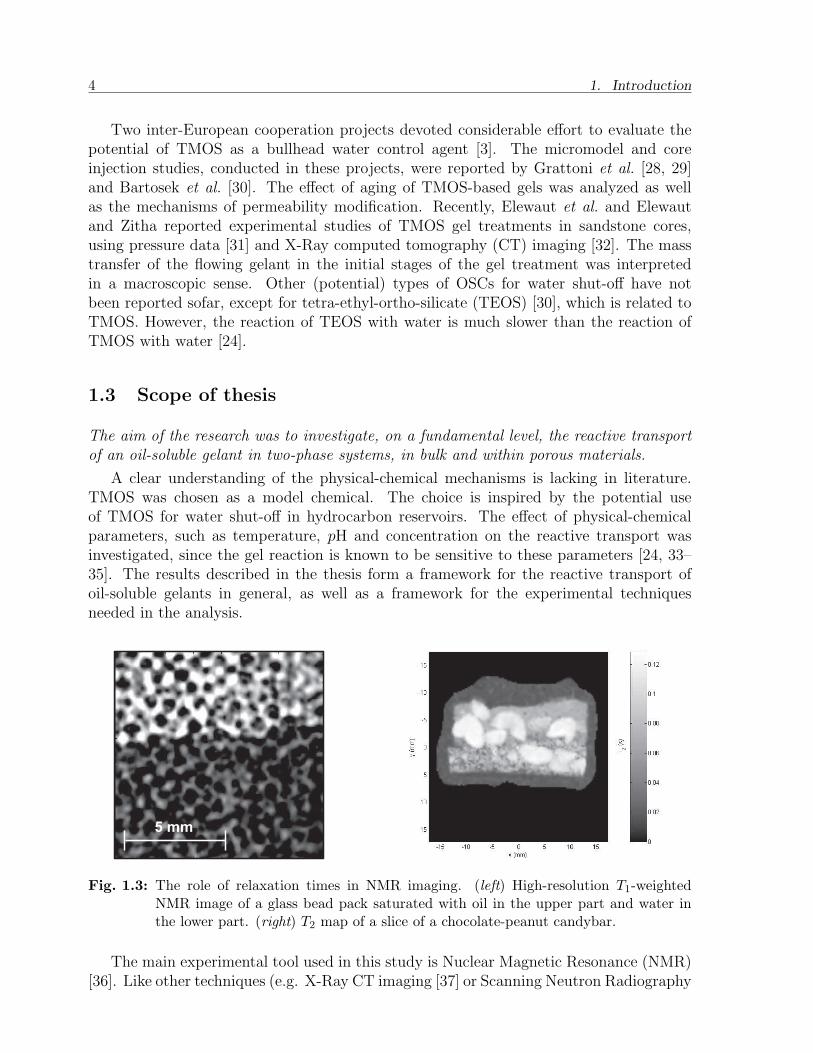
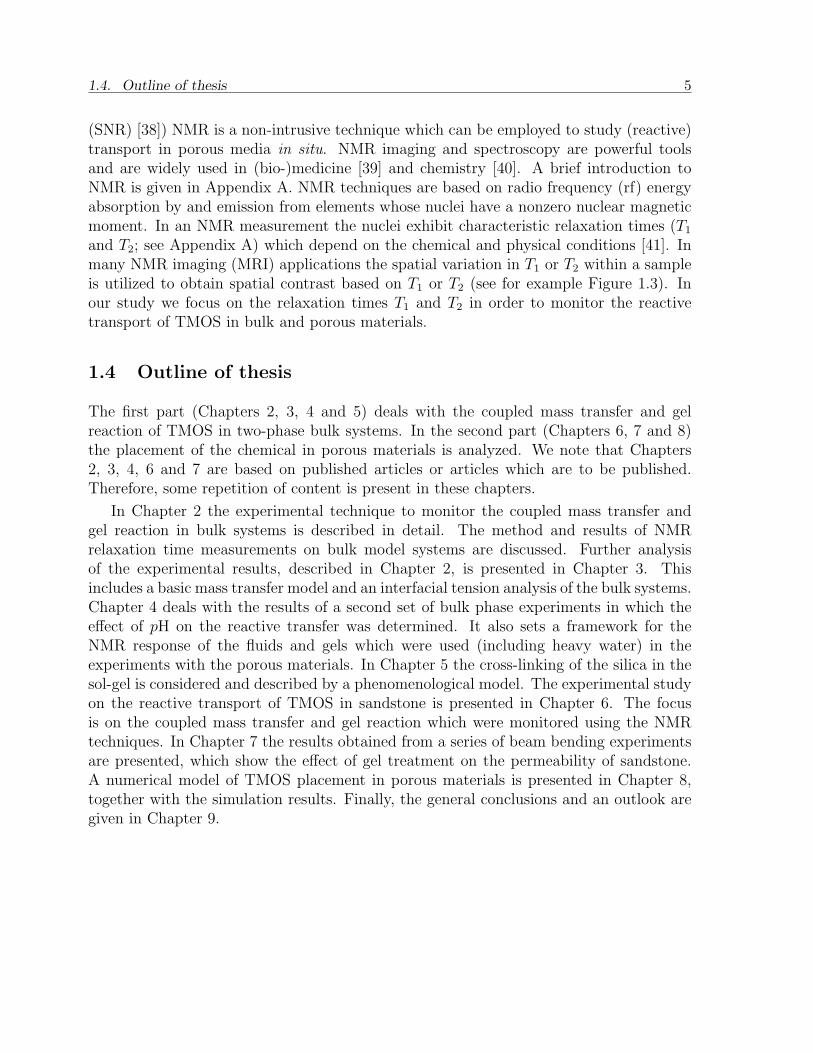
Fig. 1.3: The role of relaxation times in NMR imaging. (left) High-resolution T1-weightedNMR image of a glass bead pack saturated with oil in the upper part and water inthe lower part. (right) T2 map of a slice of a chocolate-peanut candybar.
The main experimental tool used in this study is Nuclear Magnetic Resonance (NMR)[36]. Like other techniques (e.g. X-Ray CT imaging [37] or Scanning Neutron Radiography
1.4. Outline of thesis 5
(SNR) [38]) NMR is a non-intrusive technique which can be employed to study (reactive)transport in porous media in situ. NMR imaging and spectroscopy are powerful toolsand are widely used in (bio-)medicine [39] and chemistry [40]. A brief introduction toNMR is given in Appendix A. NMR techniques are based on radio frequency (rf) energyabsorption by and emission from elements whose nuclei have a nonzero nuclear magneticmoment. In an NMR measurement the nuclei exhibit characteristic relaxation times (T1
and T2; see Appendix A) which depend on the chemical and physical conditions [41]. Inmany NMR imaging (MRI) applications the spatial variation in T1 or T2 within a sampleis utilized to obtain spatial contrast based on T1 or T2 (see for example Figure 1.3). Inour study we focus on the relaxation times T1 and T2 in order to monitor the reactivetransport of TMOS in bulk and porous materials.
1.4 Outline of thesis
The first part (Chapters 2, 3, 4 and 5) deals with the coupled mass transfer and gelreaction of TMOS in two-phase bulk systems. In the second part (Chapters 6, 7 and 8)the placement of the chemical in porous materials is analyzed. We note that Chapters2, 3, 4, 6 and 7 are based on published articles or articles which are to be published.Therefore, some repetition of content is present in these chapters.
In Chapter 2 the experimental technique to monitor the coupled mass transfer andgel reaction in bulk systems is described in detail. The method and results of NMRrelaxation time measurements on bulk model systems are discussed. Further analysisof the experimental results, described in Chapter 2, is presented in Chapter 3. Thisincludes a basic mass transfer model and an interfacial tension analysis of the bulk systems.Chapter 4 deals with the results of a second set of bulk phase experiments in which theeffect of pH on the reactive transfer was determined. It also sets a framework for theNMR response of the fluids and gels which were used (including heavy water) in theexperiments with the porous materials. In Chapter 5 the cross-linking of the silica in thesol-gel is considered and described by a phenomenological model. The experimental studyon the reactive transport of TMOS in sandstone is presented in Chapter 6. The focusis on the coupled mass transfer and gel reaction which were monitored using the NMRtechniques. In Chapter 7 the results obtained from a series of beam bending experimentsare presented, which show the effect of gel treatment on the permeability of sandstone.A numerical model of TMOS placement in porous materials is presented in Chapter 8,together with the simulation results. Finally, the general conclusions and an outlook aregiven in Chapter 9.

6
Part I
Two-phase bulk systems
7

8
Chapter 2
Coupled mass transfer and sol-gel reaction in a
two-phase bulk system∗
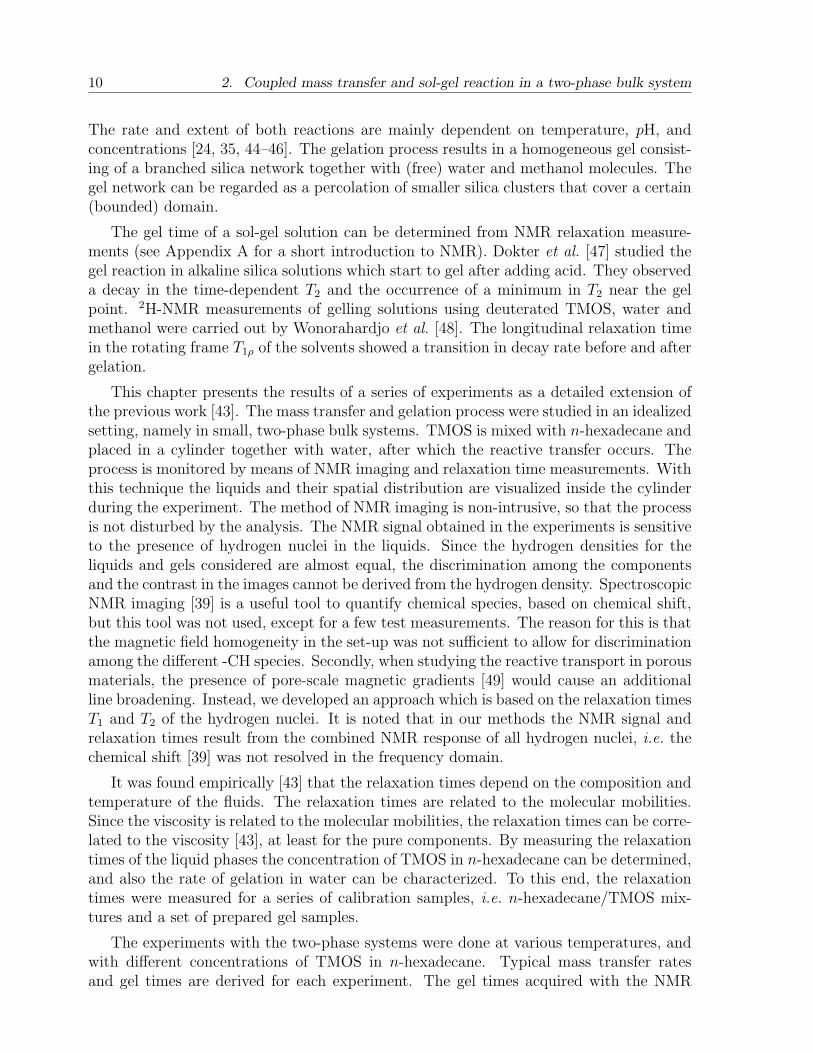
NMR imaging and relaxation time measurements were employed to monitor the masstransfer of TMOS from the oleic to the aqueous phase in a two-phase bulk system.The longitudinal relaxation time (T1) was calibrated and used to determine the con-centration of TMOS in n-hexadecane during the transfer. In the aqueous phase asharp decrease in the transverse relaxation time (T2) is observed which is attributedto the gel reaction. The point at which a minimum (or plateau) in T2 is found,indicates the gelation point.
2.1 Introduction
A method to form silica gels commonly applied is the reaction of alkoxy-silanes withwater according to the sol-gel principle [24]. A recent development is the use of these gel-forming compounds in two-phase systems, where the alkoxy-silane is initially mixed witha hydrocarbon phase. The gelation process involves the transfer of the chemical out of theoleic phase into an aqueous phase. Coupled to the mass transfer a heterogeneous reactiontakes place, resulting in gelation of the aqueous phase. An application of this processwas first proposed by Plazanet and Thomere for the consolidation of sand producingformations during oil recovery [25]. The placement and gelation of the chemical in modelporous systems was analyzed by Thompson and Fogler [20, 42]. In a previous workwe presented a Nuclear Magnetic Resonance (NMR) study of the mass transfer and gelreaction of TMOS in two-phase bulk systems and glass bead packs [43].
The gelation process of tetra-methyl-ortho-silicate (TMOS) with water can be de-scribed as follows. Initially, the TMOS hardly mixes with water because of its poorsolubility [24, 34], but when TMOS molecules come in contact with water the followinghydrolysis reaction takes place
Si(OCH3)4 + 4H2O Si(OH)4 + 4CH3OH. (2.1)
The reaction products, silicic acid and methanol, are easily miscible with water and thepresence of methanol results in an enhanced solubility of TMOS in water. The secondstep is the polymerization or condensation of silicic acid:
≡ Si - OH + HO - Si ≡≡ Si - O - Si ≡ + H2O. (2.2)
* Adapted from Castelijns et al. , J. Appl. Phys. 100, 024961 (2006)
9
10 2. Coupled mass transfer and sol-gel reaction in a two-phase bulk system
The rate and extent of both reactions are mainly dependent on temperature, pH, andconcentrations [24, 35, 44–46]. The gelation process results in a homogeneous gel consist-ing of a branched silica network together with (free) water and methanol molecules. Thegel network can be regarded as a percolation of smaller silica clusters that cover a certain(bounded) domain.
The gel time of a sol-gel solution can be determined from NMR relaxation measure-ments (see Appendix A for a short introduction to NMR). Dokter et al. [47] studied thegel reaction in alkaline silica solutions which start to gel after adding acid. They observeda decay in the time-dependent T2 and the occurrence of a minimum in T2 near the gelpoint. 2H-NMR measurements of gelling solutions using deuterated TMOS, water andmethanol were carried out by Wonorahardjo et al. [48]. The longitudinal relaxation timein the rotating frame T1ρ of the solvents showed a transition in decay rate before and aftergelation.
This chapter presents the results of a series of experiments as a detailed extension ofthe previous work [43]. The mass transfer and gelation process were studied in an idealizedsetting, namely in small, two-phase bulk systems. TMOS is mixed with n-hexadecane andplaced in a cylinder together with water, after which the reactive transfer occurs. Theprocess is monitored by means of NMR imaging and relaxation time measurements. Withthis technique the liquids and their spatial distribution are visualized inside the cylinderduring the experiment. The method of NMR imaging is non-intrusive, so that the processis not disturbed by the analysis. The NMR signal obtained in the experiments is sensitiveto the presence of hydrogen nuclei in the liquids. Since the hydrogen densities for theliquids and gels considered are almost equal, the discrimination among the componentsand the contrast in the images cannot be derived from the hydrogen density. SpectroscopicNMR imaging [39] is a useful tool to quantify chemical species, based on chemical shift,but this tool was not used, except for a few test measurements. The reason for this is thatthe magnetic field homogeneity in the set-up was not sufficient to allow for discriminationamong the different -CH species. Secondly, when studying the reactive transport in porousmaterials, the presence of pore-scale magnetic gradients [49] would cause an additionalline broadening. Instead, we developed an approach which is based on the relaxation timesT1 and T2 of the hydrogen nuclei. It is noted that in our methods the NMR signal andrelaxation times result from the combined NMR response of all hydrogen nuclei, i.e. thechemical shift [39] was not resolved in the frequency domain.
It was found empirically [43] that the relaxation times depend on the composition andtemperature of the fluids. The relaxation times are related to the molecular mobilities.Since the viscosity is related to the molecular mobilities, the relaxation times can be corre-lated to the viscosity [43], at least for the pure components. By measuring the relaxationtimes of the liquid phases the concentration of TMOS in n-hexadecane can be determined,and also the rate of gelation in water can be characterized. To this end, the relaxationtimes were measured for a series of calibration samples, i.e. n-hexadecane/TMOS mix-tures and a set of prepared gel samples.
The experiments with the two-phase systems were done at various temperatures, andwith different concentrations of TMOS in n-hexadecane. Typical mass transfer ratesand gel times are derived for each experiment. The gel times acquired with the NMR
2.2. Principle of nuclear magnetic relaxation in liquids 11
measurements are based on the aqueous phase T2. During the gel reaction T2 decreasesand levels off after several hours. The results are in agreement with the gel times obtainedfrom tilting test tube experiments. Our analysis discusses the hydrogen T2 spectra of theaqueous phase in detail and particularly the role of methanol in the solution.
In the following section we discuss a model that describes the relaxation in pure liquids.It also adequately describes the temperature and concentration dependency of T1 for thebinary TMOS-oil mixtures. The model shows that multi-exponential relaxation behavioris expected in liquid mixtures. Furthermore, it will show that for different fluids, havingdifferent viscosities, differences in relaxation times are expected.
2.2 Principle of nuclear magnetic relaxation in liquids
This section summarizes briefly the main mechanisms of nuclear spin relaxation for hy-drogen nuclei in pure liquids and simple binary mixtures.
2.2.1 Pure liquids
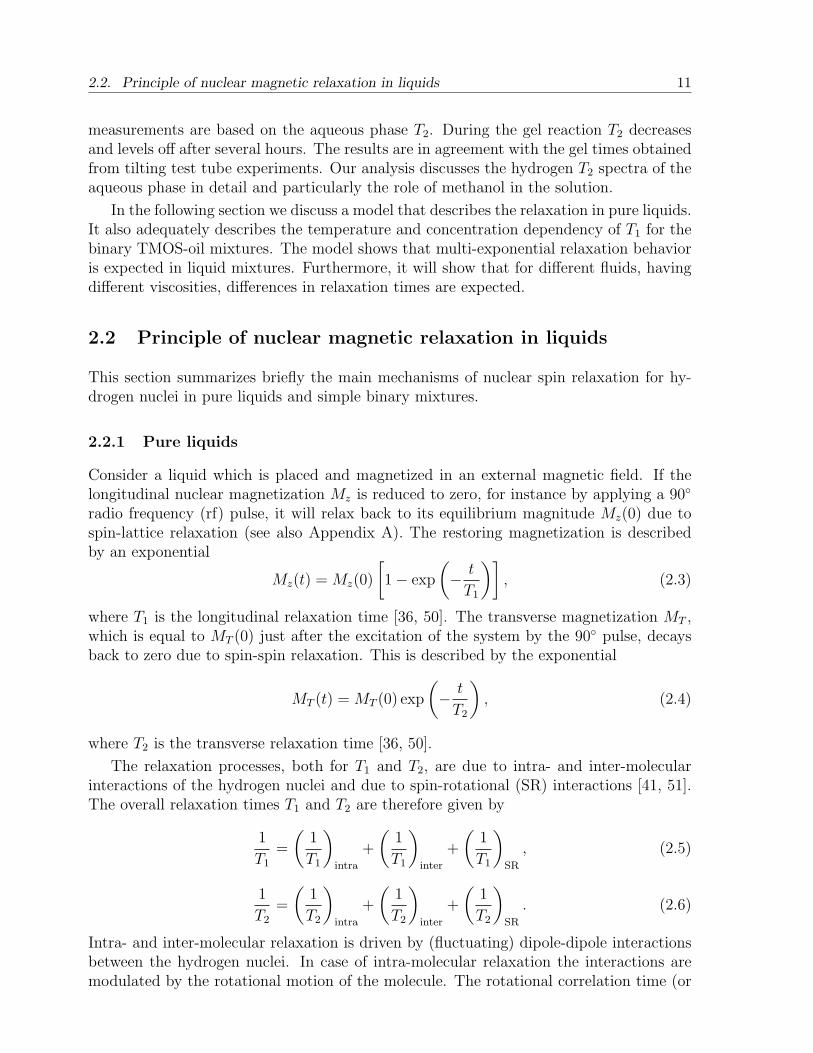
Consider a liquid which is placed and magnetized in an external magnetic field. If thelongitudinal nuclear magnetization Mz is reduced to zero, for instance by applying a 90
radio frequency (rf) pulse, it will relax back to its equilibrium magnitude Mz(0) due tospin-lattice relaxation (see also Appendix A). The restoring magnetization is describedby an exponential
Mz(t) = Mz(0)
[1− exp
(− t
T1
)], (2.3)
where T1 is the longitudinal relaxation time [36, 50]. The transverse magnetization MT ,which is equal to MT (0) just after the excitation of the system by the 90 pulse, decaysback to zero due to spin-spin relaxation. This is described by the exponential
MT (t) = MT (0) exp
(− t
T2
), (2.4)
where T2 is the transverse relaxation time [36, 50].
The relaxation processes, both for T1 and T2, are due to intra- and inter-molecularinteractions of the hydrogen nuclei and due to spin-rotational (SR) interactions [41, 51].The overall relaxation times T1 and T2 are therefore given by
1
T1
=
(1
T1
)intra
+
(1
T1
)inter
+
(1
T1
)SR
, (2.5)
1
T2
=
(1
T2
)intra
+
(1
T2
)inter
+
(1
T2
)SR
. (2.6)
Intra- and inter-molecular relaxation is driven by (fluctuating) dipole-dipole interactionsbetween the hydrogen nuclei. In case of intra-molecular relaxation the interactions aremodulated by the rotational motion of the molecule. The rotational correlation time (or
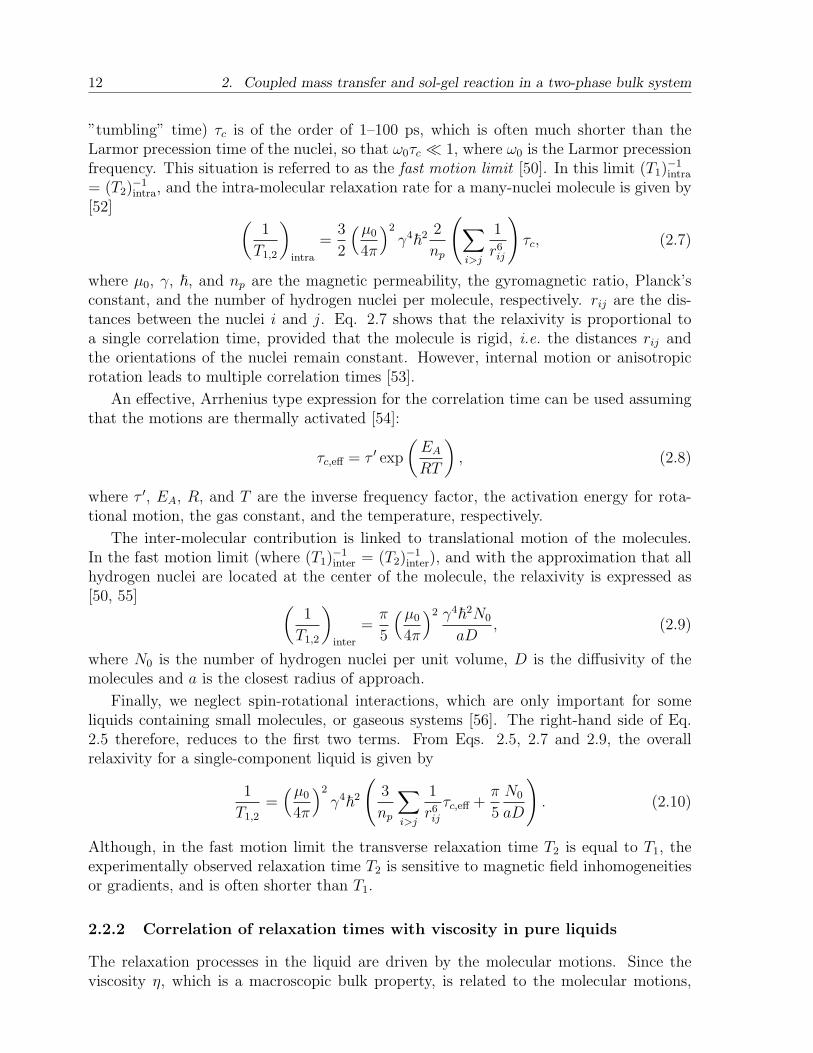
12 2. Coupled mass transfer and sol-gel reaction in a two-phase bulk system
”tumbling” time) τc is of the order of 1–100 ps, which is often much shorter than theLarmor precession time of the nuclei, so that ω0τc 1, where ω0 is the Larmor precessionfrequency. This situation is referred to as the fast motion limit [50]. In this limit (T1)
−1intra
= (T2)−1intra, and the intra-molecular relaxation rate for a many-nuclei molecule is given by
[52] (1
T1,2
)intra
=3
2
(µ0
4π
)2
γ4~2 2
np
(∑i>j
1
r6ij
)τc, (2.7)
where µ0, γ, ~, and np are the magnetic permeability, the gyromagnetic ratio, Planck’sconstant, and the number of hydrogen nuclei per molecule, respectively. rij are the dis-tances between the nuclei i and j. Eq. 2.7 shows that the relaxivity is proportional toa single correlation time, provided that the molecule is rigid, i.e. the distances rij andthe orientations of the nuclei remain constant. However, internal motion or anisotropicrotation leads to multiple correlation times [53].
An effective, Arrhenius type expression for the correlation time can be used assumingthat the motions are thermally activated [54]:
τc,eff = τ ′ exp
(EA
RT
), (2.8)
where τ ′, EA, R, and T are the inverse frequency factor, the activation energy for rota-tional motion, the gas constant, and the temperature, respectively.
The inter-molecular contribution is linked to translational motion of the molecules.In the fast motion limit (where (T1)
−1inter = (T2)
−1inter), and with the approximation that all
hydrogen nuclei are located at the center of the molecule, the relaxivity is expressed as[50, 55] (
1
T1,2
)inter
=π
5
(µ0
4π
)2 γ4~2N0
aD, (2.9)
where N0 is the number of hydrogen nuclei per unit volume, D is the diffusivity of themolecules and a is the closest radius of approach.
Finally, we neglect spin-rotational interactions, which are only important for someliquids containing small molecules, or gaseous systems [56]. The right-hand side of Eq.2.5 therefore, reduces to the first two terms. From Eqs. 2.5, 2.7 and 2.9, the overallrelaxivity for a single-component liquid is given by
1
T1,2
=(µ0
4π
)2
γ4~2
(3
np
∑i>j
1
r6ij
τc,eff +π
5
N0
aD
). (2.10)
Although, in the fast motion limit the transverse relaxation time T2 is equal to T1, theexperimentally observed relaxation time T2 is sensitive to magnetic field inhomogeneitiesor gradients, and is often shorter than T1.
2.2.2 Correlation of relaxation times with viscosity in pure liquids
The relaxation processes in the liquid are driven by the molecular motions. Since theviscosity η, which is a macroscopic bulk property, is related to the molecular motions,
2.2. Principle of nuclear magnetic relaxation in liquids 13
the relaxation times can be correlated with η. Instead of using the Arrhenius expression(Eq. 2.8) for the effective correlation time τc,eff, we can link the time to the rotationaldiffusion coefficient DR of the molecules [50]. This diffusion coefficient follows from aStokes-Einstein equation, so that [50, 51, 57]
τc,eff =1
6DR
' 4πηa3
3kBT, (2.11)
where kB is the Boltzmann constant. Likewise, the diffusion coefficient D in Eq. 2.9 canbe related to the viscosity η by
D =kBT
Caη, (2.12)
where C is a coefficient which is related to the molecular shape, amongst others [58].Hence, it follows from Eq. 2.10 that
1
T1,2
∝ η
T. (2.13)
Zega et al. [59] showed that, for a series of alkanes, the values of 1/T1 against η/T can beplotted approximately on a single curve.
2.2.3 Binary mixtures
In a mixture of liquids A and B, there is an additional inter-molecular contribution dueto interaction between hydrogen nuclei of A and B. The individual relaxation times TA
1,2
and TB1,2 in the mixture are defined as an extension to Eq. 2.10 by
1
TA1,2
=(µ0
4π
)2
γ4~2
[cAτc,eff,A +
π
5aA
(N0A
DAA
+N0B
DAB
)], (2.14)
1
TB1,2
=(µ0
4π
)2
γ4~2
[cBτc,eff,B +
π
5aB
(N0A
DBA
+N0B
DBB
)], (2.15)
where cA and cB are constants related to the molecular structures, and Dij are the mutualdiffusion coefficients. Suppose the longitudinal magnetization of the mixture in equilib-rium with an external magnetic field is brought to zero by a 90 rf pulse. Subsequently,based on superposition of the magnetic moments, the total magnetization shows a bi-exponential relaxation behavior as described by
Mz(t) = Mz(0)
[1− f exp
(− t
TA1
)− (1− f) exp
(− t
TB1
)], (2.16)
where f is the proton density fraction of A. Thus, the proton fraction and the relaxationtimes are functions of composition. If TA
1 is equal or almost equal to TB1 or in case f is
close to zero or close to one Mz relaxes according to a single exponential as defined byEq. 2.3. Similarly, the transverse magnetization of the mixture relaxes back to zero afterapplication of the 90 pulse according to the bi-exponential function
MT (t) = MT (0)
[f exp
(− t
TA2
)+ (1− f) exp
(− t
TB2
)]. (2.17)
Eq. 2.16 and Eq. 2.17 can be extended to describe the multi-exponential relaxation inmulti-component mixtures.
14 2. Coupled mass transfer and sol-gel reaction in a two-phase bulk system
2.2.4 Correlation of relaxation times with viscosity in binary mixtures
In (simple) binary liquid mixtures the effective viscosity often depends on the composition,provided that the viscosities of the pure components, ηA and ηB, are not equal to eachother. Several mixture laws exist [60]. For example, the following mixture law wasintroduced by Grunberg and Nissan [61]:
ln ηmix = x ln ηA + (1− x) ln ηB + Gx(1− x), (2.18)
where ηmix is the effective viscosity of the mixture, x is the mole fraction of componentA, and G is an interaction parameter.
The relaxation times will be a function of composition (through the proton fractionsbelonging to the components A and B) as long as TA
1,2 is higher or lower than TB1,2. If, in
addition, ηA is different from ηB, the relaxation times can be correlated with the effectiveviscosity via the composition dependence. On a molecular level, one can expect, in caseηA 6= ηB, the diffusivities of the molecules to be a function of the composition. The higherthe viscosity, the lower are the diffusivities. This will affect the inter-molecular relaxation(see Eq. 2.9). As for intra-molecular relaxation, the effective correlation times of thespecies may depend on ηmix as indicated by Eq. 2.11, but this is not always the case [62].
2.3 Experimental section
2.3.1 Chemicals and preparation
Tetra-methyl-ortho-silicate, Si(OCH3)4, was obtained from Aldrich (>99% pure). Forthe oleic phase, n-hexadecane, or n-C16H34 (obtained from Merck, >99% pure) was usedas a clean and well-defined hydrocarbon liquid which has a significant difference in T1
compared to water and TMOS. The viscosities of TMOS, n-hexadecane and mixtures ofTMOS and n-hexadecane were measured at 25 C with a rheometer (Contraves LS40).For the aqueous phase we used double-demineralized water.
Several gel samples were prepared at ambient conditions with demineralized water andTMOS in different volume ratios. The initial volume fraction φg
T (hence, also the molefraction) of TMOS in the mixture was chosen to be a measure to characterize the final gelstate. It was found that for 2.5 vol% (or 0.31 mol%) of TMOS in water no gel was formed,even after several months. For 5.0 vol% and more (tested up to 50 vol%) a homogeneousgel formed. It was observed that after several weeks the high-concentration gels showed asmall degree of syneresis. Calibration solutions of methanol in demineralized water wereprepared as well.
2.3.2 NMR apparatus and sequences
Relaxation times and T1-weighted images of the samples were recorded with a 4.7 TeslaNMR spectrometer operating at a frequency of 200 MHz for 1H. The setup consists ofa super-conducting magnet (Oxford Instruments, Oxon, UK) with a vertical, narrow-bore insert (Doty, Columbia, USA) with an inner diameter of 40 mm. The insert has
2.3. Experimental section 15
R F
s l i c e
f r e q u e n c y
p h a s e
9 0 ° 1 8 0 ° 1 8 0 °
e c h o
t i m et E
s i g n a lt E
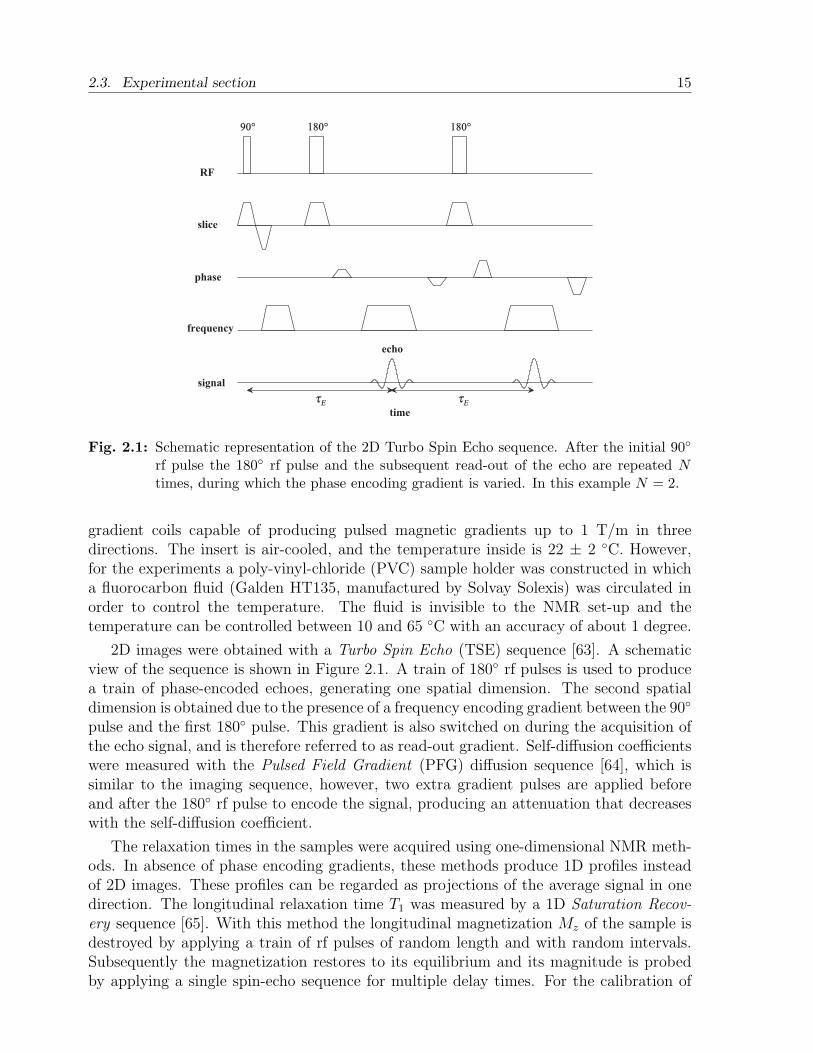
Fig. 2.1: Schematic representation of the 2D Turbo Spin Echo sequence. After the initial 90
rf pulse the 180 rf pulse and the subsequent read-out of the echo are repeated Ntimes, during which the phase encoding gradient is varied. In this example N = 2.
gradient coils capable of producing pulsed magnetic gradients up to 1 T/m in threedirections. The insert is air-cooled, and the temperature inside is 22 ± 2 C. However,for the experiments a poly-vinyl-chloride (PVC) sample holder was constructed in whicha fluorocarbon fluid (Galden HT135, manufactured by Solvay Solexis) was circulated inorder to control the temperature. The fluid is invisible to the NMR set-up and thetemperature can be controlled between 10 and 65 C with an accuracy of about 1 degree.
2D images were obtained with a Turbo Spin Echo (TSE) sequence [63]. A schematicview of the sequence is shown in Figure 2.1. A train of 180 rf pulses is used to producea train of phase-encoded echoes, generating one spatial dimension. The second spatialdimension is obtained due to the presence of a frequency encoding gradient between the 90
pulse and the first 180 pulse. This gradient is also switched on during the acquisition ofthe echo signal, and is therefore referred to as read-out gradient. Self-diffusion coefficientswere measured with the Pulsed Field Gradient (PFG) diffusion sequence [64], which issimilar to the imaging sequence, however, two extra gradient pulses are applied beforeand after the 180 rf pulse to encode the signal, producing an attenuation that decreaseswith the self-diffusion coefficient.
The relaxation times in the samples were acquired using one-dimensional NMR meth-ods. In absence of phase encoding gradients, these methods produce 1D profiles insteadof 2D images. These profiles can be regarded as projections of the average signal in onedirection. The longitudinal relaxation time T1 was measured by a 1D Saturation Recov-ery sequence [65]. With this method the longitudinal magnetization Mz of the sample isdestroyed by applying a train of rf pulses of random length and with random intervals.Subsequently the magnetization restores to its equilibrium and its magnitude is probedby applying a single spin-echo sequence for multiple delay times. For the calibration of
16 2. Coupled mass transfer and sol-gel reaction in a two-phase bulk system
the samples each T1 curve was measured with a series of 25 spin echoes, logarithmicallydistributed over an interval of 16 s.
Transverse relaxation times were measured with a 1D Carr-Purcell-Meiboom-Gill (CPMG)method [36, 50], in which a spin-echo train is acquired by applying a 90 - (τ - 180 - τ)n
sequence of rf pulses, where 2τ is the inter-echo time ∆τE. In this sequence the read-outgradients are applied as described above for the 2D TSE sequence. It is noted that theapparent relaxation time T2,apparent may contain a contribution due to diffusion similarlyto the PFG method. For a single-component system the apparent T2 can be expressed by(based on Ref. [64])
T2,apparent =
[1
T2
+bD
∆τE
]−1
, (2.19)
where b is a diffusion weighting factor that depends on the timing, shape and strength ofthe gradients used. With respect to the read-out gradient the b-factor is approximatelyequal to (γGδ/2)2, where G is the gradient strength and δ is the duration of the read-out.The inter-echo time and the duration of the read-out were constantly taken as 7.2 ms and0.5 ms, respectively. Each spin-echo train consists of a thousand echoes.
The CPMG spin-echo trains were analyzed with the inversion routine CONTIN [66]to give quasi-continuous T2 spectra, consisting of a hundred points on a logarithmic T2
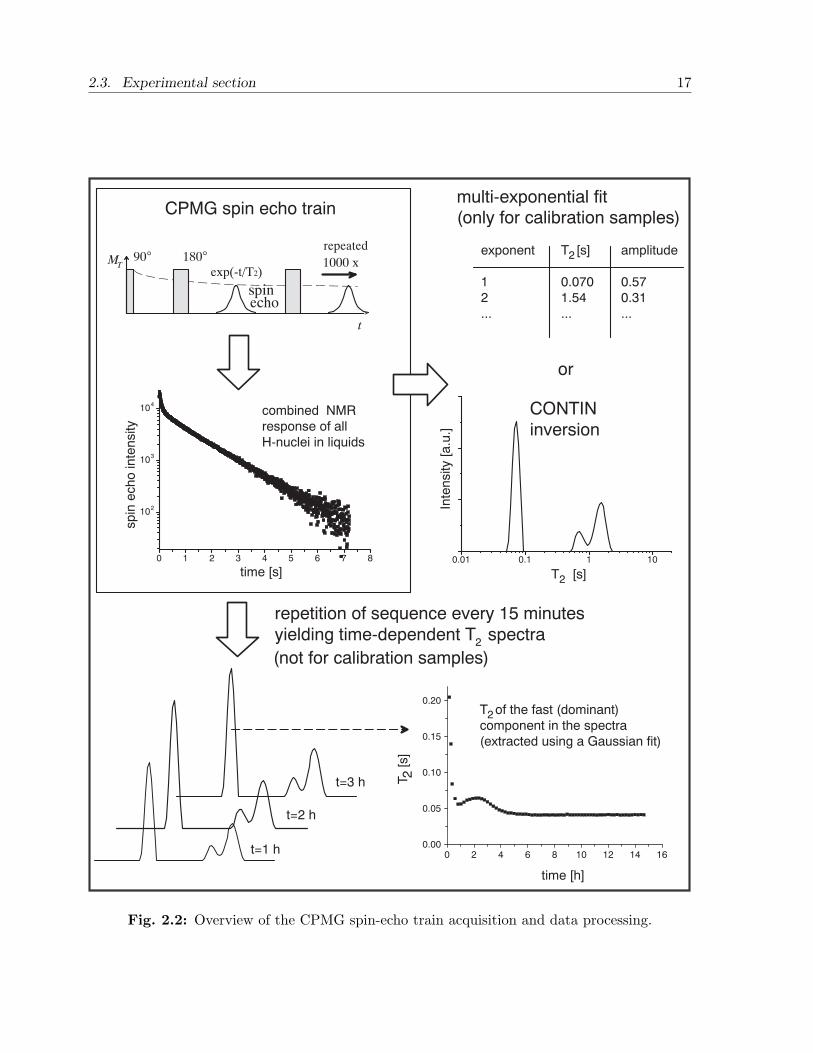
axis. In case of mono-exponential relaxation the inversion produces one peak. Multi-exponential relaxation, which may occur in a mixture (see Section 2.2.3), results in morepeaks. In general, the peaks in the spectrum, produced by the routine, broaden when thesignal-to-noise ratio decreases, up to the point where the peaks cannot be distinguishedfrom each other. The absolute minimum and maximum T2 that can be resolved by theroutine are determined by the echo time (7.2 ms) and the total length of the echo train(7.2 s), respectively. The produced spectra are sensitive especially to the signal of theleading echoes of the sequence, and proper 90 and 180 conditions of the rf pulses aretherefore needed. An overview of the CPMG-data acquisition and data processing is givenin Figure 2.2.
2.3.3 Bulk experiments
The two-phase bulk experiments were performed using cylindrical Teflon vials with aninner diameter of 18 mm. In each case 2.5 ml of water and 2.5 ml TMOS/n-hexadecanewere placed in the vial. The fluids were preheated to the temperature of interest (25, 35and 45 C, respectively). The initial volume fraction of TMOS in n-hexadecane was 0.20and 0.40, respectively, for each temperature considered. After injection, the samples werequickly placed in the NMR set-up. Subsequently, a continuous loop of NMR measuringsequences was executed: a T1 measurement using the Saturation Recovery sequence, 2Dimaging using the TSE sequence, and a T2 measurement using the CPMG sequence.During each repetition the CPMG sequence was executed three times with a varyingstrength of the read-out gradient (50 mT/m, 100 mT/m and 200 mT/m).
For every sequence the read-out gradient was set in the vertical direction. The sliceselection gradient was applied perpendicular to the read-out direction, yielding a verti-cal slice with a thickness of about 4 mm. The variation of the gradient strength in the
2.3. Experimental section 17
0.01 0.1 1 10
Inte
nsity [a.u
.]
T2 [s]
0 1 2 3 4 5 6 7 8
102
103
104
spin
echo inte
nsity
time [s]
t
90° 180°exp(-t/T2)
spinecho
MT
repeated
1000 x
CPMG spin echo train
combined NMR
response of all
H-nuclei in liquids
CONTIN
inversion
multi-exponential fit(only for calibration samples)
or
exponent
1
2
...
T2 [s]
0.070
1.54
...
amplitude
0.57
0.31
...
repetition of sequence every 15 minutes
yielding time-dependent T 2 spectra
t=1 h
t=2 h
t=3 h
T2 of the fast (dominant)
component in the spectra
(extracted using a Gaussian fit)
0 2 4 6 8 10 12 14 160.00
0.05
0.10
0.15
0.20
T 2 [s
]
time [h]
(not for calibration samples)
Fig. 2.2: Overview of the CPMG spin-echo train acquisition and data processing.
18 2. Coupled mass transfer and sol-gel reaction in a two-phase bulk system
CPMG measurements and the constant read-out duration result in a varying resolutionof the 1D profiles. Nevertheless, the liquid phases are easily reconstructed and identifiedfrom the profiles. The magnetic susceptibility of water and n-hexadecane is −9.0×10⁻⁶,respectively, −8.0×10⁻⁶ [67]. At 4.7 Tesla the resulting frequency mismatch is about 200Hz. With respect to the applied read-out gradient of at least 2.6 kHz mm−1, susceptibilityartifacts at the interface between n-hexadecane and water are insignificant. The acquisi-tion time for each sequence is between 2 and 3 minutes, so that the loop time is about15 minutes (given one Saturation Recovery, one 2D TSE and three CPMG measurementsper loop).
In order to measure the gel time of the aqueous phase similar experiments were per-formed inside glass vials with equal dimensions as the Teflon vials. The vials were placedin a water bath at specific temperatures. By gently tilting the vials at times near the pre-dicted gel time with intervals of 5 minutes, the gel time could be determined by checkingwhether the oil-water interface is still able to follow the tilting motion. The reproducibil-ity was checked by using multiple glass vials, and the accuracy of the gel time is about30 minutes.
2.4 Results and discussion
2.4.1 Calibration results
Viscosity measurements
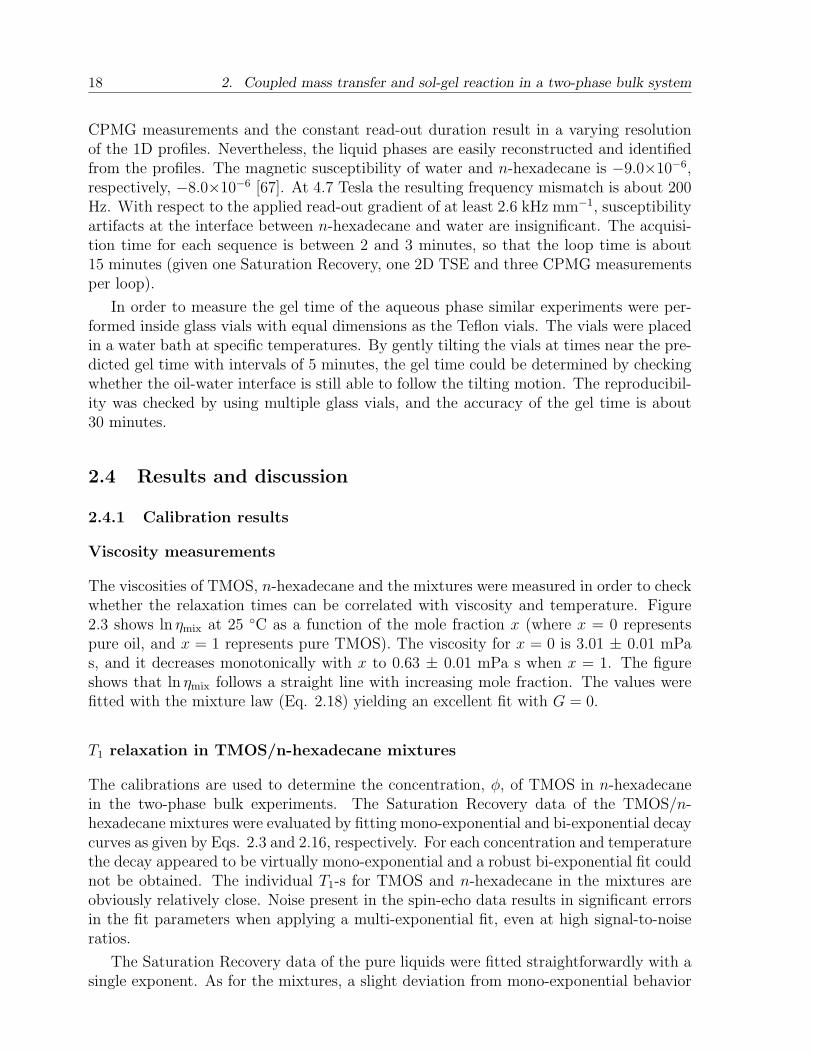
The viscosities of TMOS, n-hexadecane and the mixtures were measured in order to checkwhether the relaxation times can be correlated with viscosity and temperature. Figure2.3 shows ln ηmix at 25 C as a function of the mole fraction x (where x = 0 representspure oil, and x = 1 represents pure TMOS). The viscosity for x = 0 is 3.01 ± 0.01 mPas, and it decreases monotonically with x to 0.63 ± 0.01 mPa s when x = 1. The figureshows that ln ηmix follows a straight line with increasing mole fraction. The values werefitted with the mixture law (Eq. 2.18) yielding an excellent fit with G = 0.
T1 relaxation in TMOS/n-hexadecane mixtures
The calibrations are used to determine the concentration, φ, of TMOS in n-hexadecanein the two-phase bulk experiments. The Saturation Recovery data of the TMOS/n-hexadecane mixtures were evaluated by fitting mono-exponential and bi-exponential decaycurves as given by Eqs. 2.3 and 2.16, respectively. For each concentration and temperaturethe decay appeared to be virtually mono-exponential and a robust bi-exponential fit couldnot be obtained. The individual T1-s for TMOS and n-hexadecane in the mixtures areobviously relatively close. Noise present in the spin-echo data results in significant errorsin the fit parameters when applying a multi-exponential fit, even at high signal-to-noiseratios.
The Saturation Recovery data of the pure liquids were fitted straightforwardly with asingle exponent. As for the mixtures, a slight deviation from mono-exponential behavior
2.4. Results and discussion 19
0.0 0.2 0.4 0.6 0.8 1.0-1.0
-0.5
0.0
0.5
1.0
1.5
ln (
ηm
ix 1
03 P
a-1 s
-1)
x
Fig. 2.3: Viscosity of the TMOS/n-hexadecane mixtures as a function of the mole fraction xof TMOS. The solid curve represents the fit using the Grunberg-Nissan mixture law.
0 10 20 30 40 50 60 700
1
2
3
4
5
TMOS
n-hexadecane
0 vol%
20 vol%
40 vol%
60 vol%
80 vol%
100 vol%
T1 [s]
T [OC]
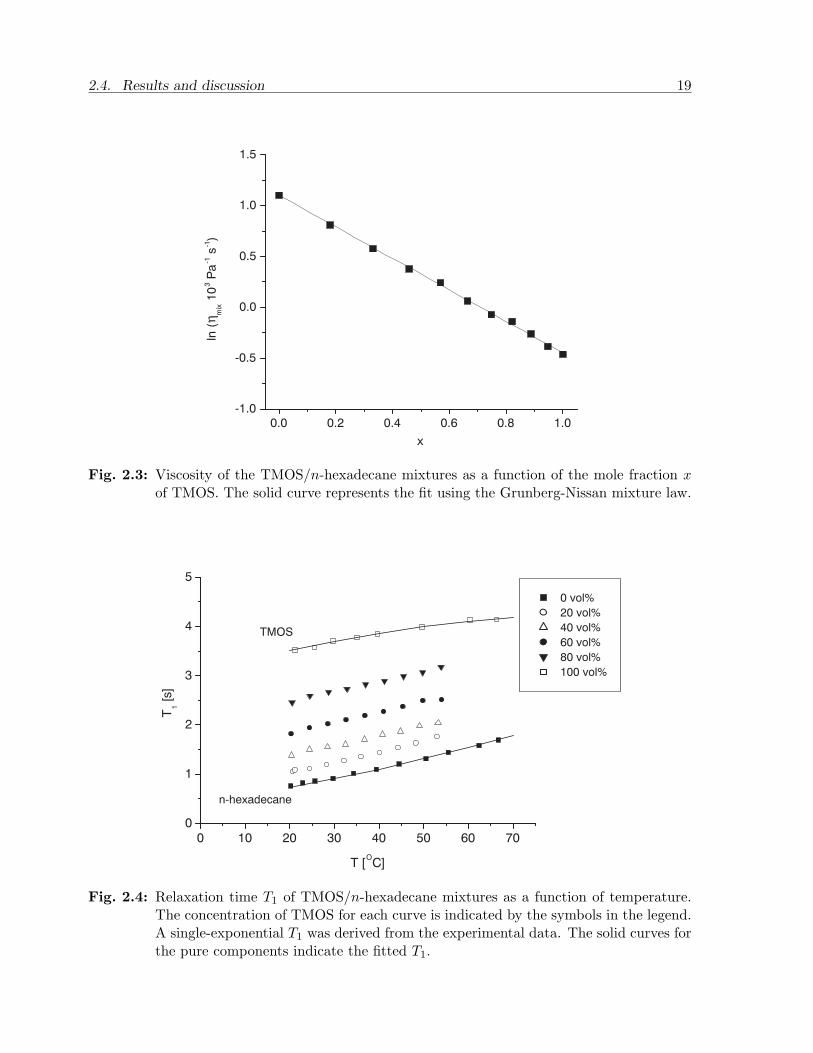
Fig. 2.4: Relaxation time T1 of TMOS/n-hexadecane mixtures as a function of temperature.The concentration of TMOS for each curve is indicated by the symbols in the legend.A single-exponential T1 was derived from the experimental data. The solid curves forthe pure components indicate the fitted T1.
20 2. Coupled mass transfer and sol-gel reaction in a two-phase bulk system
2.0x10⁻⁶
4.0x10⁻⁶
6.0x10⁻⁶
8.0x10⁻⁶
1.0x10⁻⁵
1.2x10⁻⁵
0.0
0.2
0.4
0.6
0.8
1.0
1.2
1.4
1/T
1 [
s-1]
/ T [Pa s K-1]η
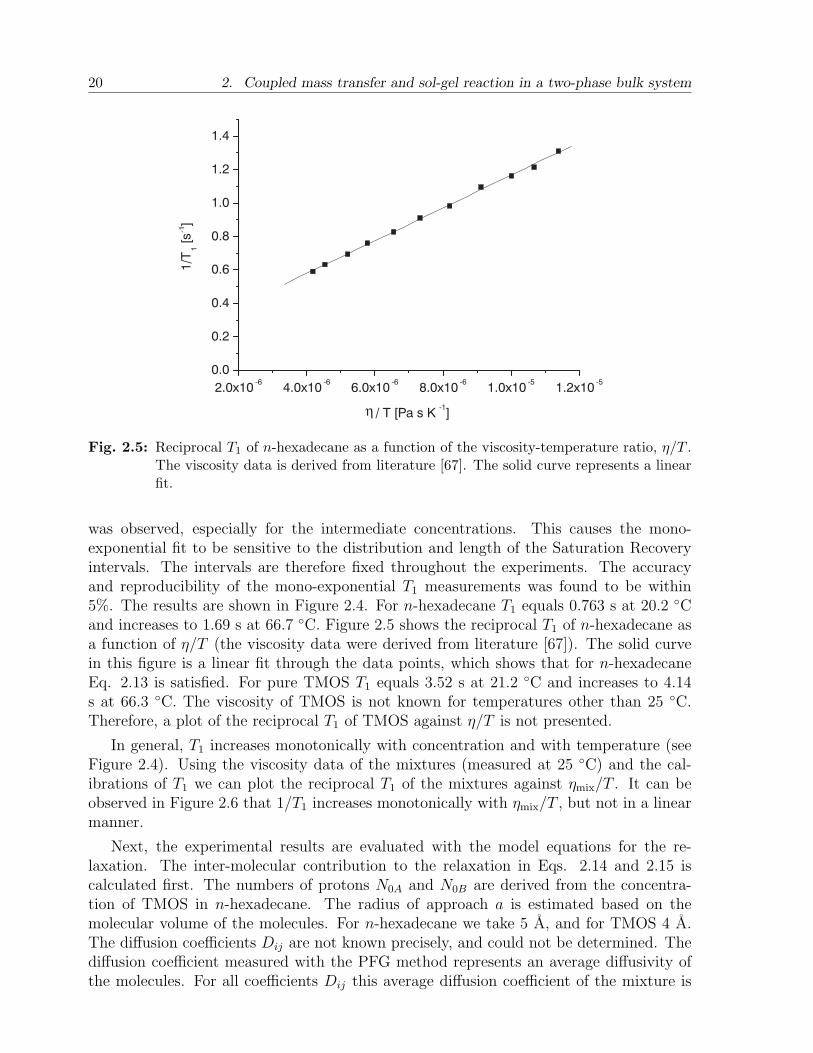
Fig. 2.5: Reciprocal T1 of n-hexadecane as a function of the viscosity-temperature ratio, η/T .The viscosity data is derived from literature [67]. The solid curve represents a linearfit.
was observed, especially for the intermediate concentrations. This causes the mono-exponential fit to be sensitive to the distribution and length of the Saturation Recoveryintervals. The intervals are therefore fixed throughout the experiments. The accuracyand reproducibility of the mono-exponential T1 measurements was found to be within5%. The results are shown in Figure 2.4. For n-hexadecane T1 equals 0.763 s at 20.2 Cand increases to 1.69 s at 66.7 C. Figure 2.5 shows the reciprocal T1 of n-hexadecane asa function of η/T (the viscosity data were derived from literature [67]). The solid curvein this figure is a linear fit through the data points, which shows that for n-hexadecaneEq. 2.13 is satisfied. For pure TMOS T1 equals 3.52 s at 21.2 C and increases to 4.14s at 66.3 C. The viscosity of TMOS is not known for temperatures other than 25 C.Therefore, a plot of the reciprocal T1 of TMOS against η/T is not presented.
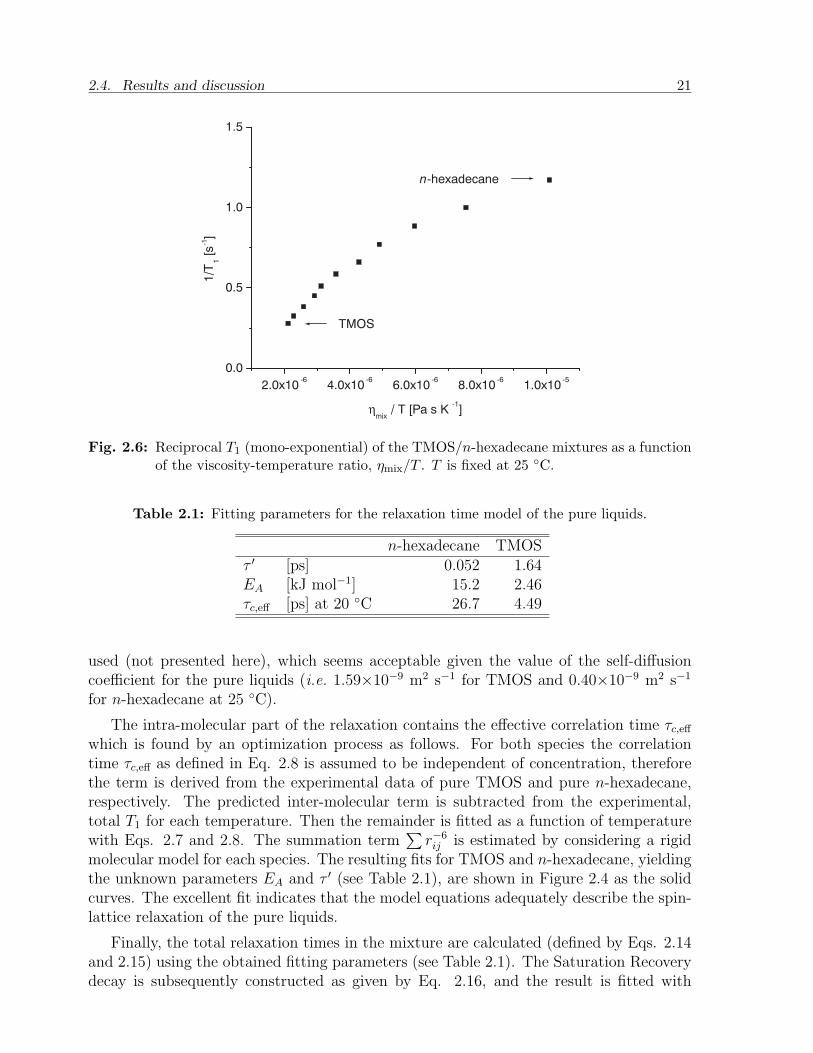
In general, T1 increases monotonically with concentration and with temperature (seeFigure 2.4). Using the viscosity data of the mixtures (measured at 25 C) and the cal-ibrations of T1 we can plot the reciprocal T1 of the mixtures against ηmix/T . It can beobserved in Figure 2.6 that 1/T1 increases monotonically with ηmix/T , but not in a linearmanner.
Next, the experimental results are evaluated with the model equations for the re-laxation. The inter-molecular contribution to the relaxation in Eqs. 2.14 and 2.15 iscalculated first. The numbers of protons N0A and N0B are derived from the concentra-tion of TMOS in n-hexadecane. The radius of approach a is estimated based on themolecular volume of the molecules. For n-hexadecane we take 5 A, and for TMOS 4 A.The diffusion coefficients Dij are not known precisely, and could not be determined. Thediffusion coefficient measured with the PFG method represents an average diffusivity ofthe molecules. For all coefficients Dij this average diffusion coefficient of the mixture is
2.4. Results and discussion 21
2.0x10⁻⁶
4.0x10⁻⁶
6.0x10⁻⁶
8.0x10⁻⁶
1.0x10⁻⁵
0.0
0.5
1.0
1.5
n-hexadecane
TMOS
1/T
1 [
s-1]
η mix
/ T [Pa s K-1]
Fig. 2.6: Reciprocal T1 (mono-exponential) of the TMOS/n-hexadecane mixtures as a functionof the viscosity-temperature ratio, ηmix/T . T is fixed at 25 C.
Table 2.1: Fitting parameters for the relaxation time model of the pure liquids.
n-hexadecane TMOSτ ′ [ps] 0.052 1.64EA [kJ mol−1] 15.2 2.46τc,eff [ps] at 20 C 26.7 4.49
used (not presented here), which seems acceptable given the value of the self-diffusioncoefficient for the pure liquids (i.e. 1.59×10⁻⁹ m2 s−1 for TMOS and 0.40×10⁻⁹ m2 s−1
for n-hexadecane at 25 C).
The intra-molecular part of the relaxation contains the effective correlation time τc,eff
which is found by an optimization process as follows. For both species the correlationtime τc,eff as defined in Eq. 2.8 is assumed to be independent of concentration, thereforethe term is derived from the experimental data of pure TMOS and pure n-hexadecane,respectively. The predicted inter-molecular term is subtracted from the experimental,total T1 for each temperature. Then the remainder is fitted as a function of temperaturewith Eqs. 2.7 and 2.8. The summation term
∑r−6ij is estimated by considering a rigid
molecular model for each species. The resulting fits for TMOS and n-hexadecane, yieldingthe unknown parameters EA and τ ′ (see Table 2.1), are shown in Figure 2.4 as the solidcurves. The excellent fit indicates that the model equations adequately describe the spin-lattice relaxation of the pure liquids.
Finally, the total relaxation times in the mixture are calculated (defined by Eqs. 2.14and 2.15) using the obtained fitting parameters (see Table 2.1). The Saturation Recoverydecay is subsequently constructed as given by Eq. 2.16, and the result is fitted with
22 2. Coupled mass transfer and sol-gel reaction in a two-phase bulk system
0 0.2 0.4 0.6 0.8 10
0.5
1
1.5
2
2.5
3
3.5
4
φ
T1 [s]
experiment T = 20 oC
experiment T = 40 oC
model T = 20 oC
model T = 40 oC
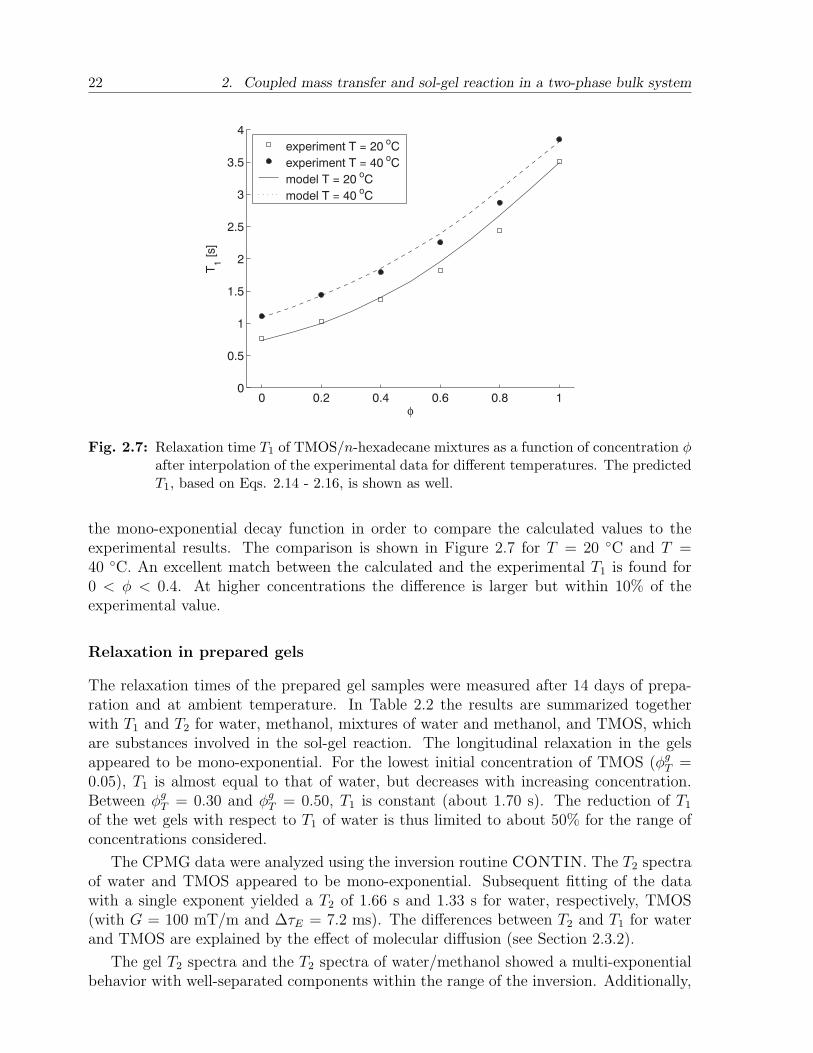
Fig. 2.7: Relaxation time T1 of TMOS/n-hexadecane mixtures as a function of concentration φafter interpolation of the experimental data for different temperatures. The predictedT1, based on Eqs. 2.14 - 2.16, is shown as well.
the mono-exponential decay function in order to compare the calculated values to theexperimental results. The comparison is shown in Figure 2.7 for T = 20 C and T =40 C. An excellent match between the calculated and the experimental T1 is found for0 < φ < 0.4. At higher concentrations the difference is larger but within 10% of theexperimental value.
Relaxation in prepared gels
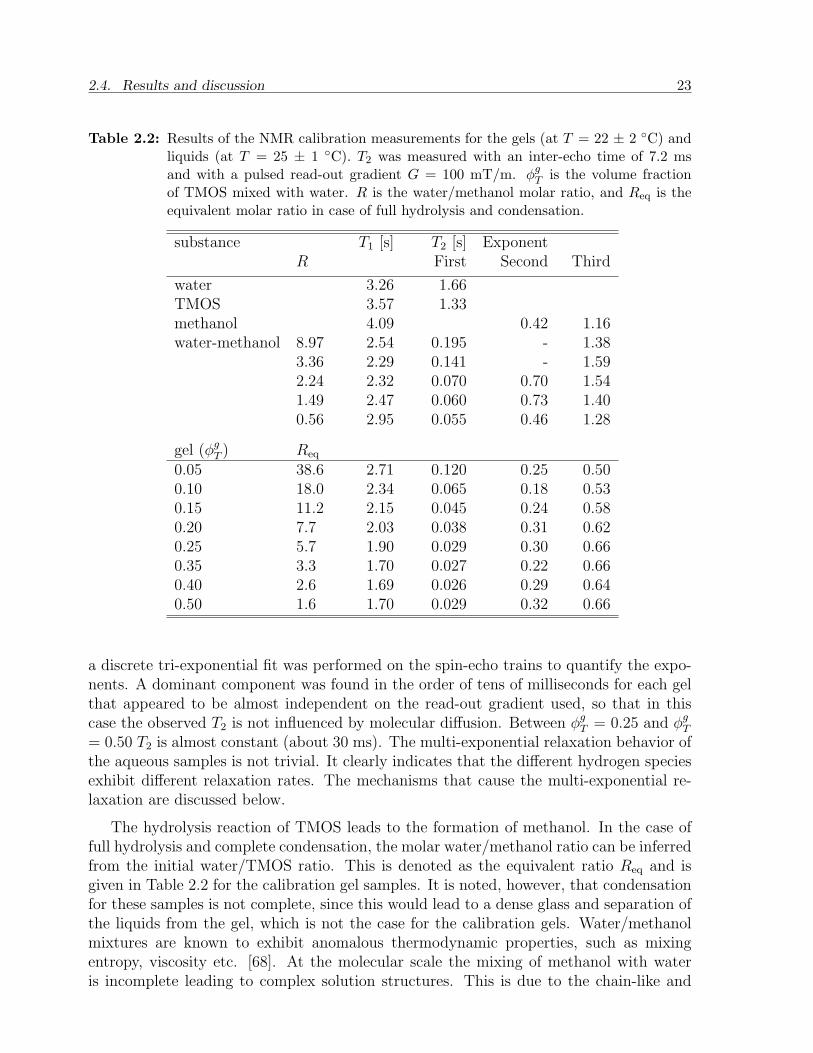
The relaxation times of the prepared gel samples were measured after 14 days of prepa-ration and at ambient temperature. In Table 2.2 the results are summarized togetherwith T1 and T2 for water, methanol, mixtures of water and methanol, and TMOS, whichare substances involved in the sol-gel reaction. The longitudinal relaxation in the gelsappeared to be mono-exponential. For the lowest initial concentration of TMOS (φg
T =0.05), T1 is almost equal to that of water, but decreases with increasing concentration.Between φg
T = 0.30 and φgT = 0.50, T1 is constant (about 1.70 s). The reduction of T1
of the wet gels with respect to T1 of water is thus limited to about 50% for the range ofconcentrations considered.
The CPMG data were analyzed using the inversion routine CONTIN. The T2 spectraof water and TMOS appeared to be mono-exponential. Subsequent fitting of the datawith a single exponent yielded a T2 of 1.66 s and 1.33 s for water, respectively, TMOS(with G = 100 mT/m and ∆τE = 7.2 ms). The differences between T2 and T1 for waterand TMOS are explained by the effect of molecular diffusion (see Section 2.3.2).
The gel T2 spectra and the T2 spectra of water/methanol showed a multi-exponentialbehavior with well-separated components within the range of the inversion. Additionally,
2.4. Results and discussion 23
Table 2.2: Results of the NMR calibration measurements for the gels (at T = 22 ± 2 C) andliquids (at T = 25 ± 1 C). T2 was measured with an inter-echo time of 7.2 msand with a pulsed read-out gradient G = 100 mT/m. φg
T is the volume fractionof TMOS mixed with water. R is the water/methanol molar ratio, and Req is theequivalent molar ratio in case of full hydrolysis and condensation.
substance T1 [s] T2 [s] ExponentR First Second Third
water 3.26 1.66TMOS 3.57 1.33methanol 4.09 0.42 1.16water-methanol 8.97 2.54 0.195 - 1.38
3.36 2.29 0.141 - 1.592.24 2.32 0.070 0.70 1.541.49 2.47 0.060 0.73 1.400.56 2.95 0.055 0.46 1.28
gel (φgT ) Req
0.05 38.6 2.71 0.120 0.25 0.500.10 18.0 2.34 0.065 0.18 0.530.15 11.2 2.15 0.045 0.24 0.580.20 7.7 2.03 0.038 0.31 0.620.25 5.7 1.90 0.029 0.30 0.660.35 3.3 1.70 0.027 0.22 0.660.40 2.6 1.69 0.026 0.29 0.640.50 1.6 1.70 0.029 0.32 0.66
a discrete tri-exponential fit was performed on the spin-echo trains to quantify the expo-nents. A dominant component was found in the order of tens of milliseconds for each gelthat appeared to be almost independent on the read-out gradient used, so that in thiscase the observed T2 is not influenced by molecular diffusion. Between φg
T = 0.25 and φgT
= 0.50 T2 is almost constant (about 30 ms). The multi-exponential relaxation behavior ofthe aqueous samples is not trivial. It clearly indicates that the different hydrogen speciesexhibit different relaxation rates. The mechanisms that cause the multi-exponential re-laxation are discussed below.
The hydrolysis reaction of TMOS leads to the formation of methanol. In the case offull hydrolysis and complete condensation, the molar water/methanol ratio can be inferredfrom the initial water/TMOS ratio. This is denoted as the equivalent ratio Req and isgiven in Table 2.2 for the calibration gel samples. It is noted, however, that condensationfor these samples is not complete, since this would lead to a dense glass and separation ofthe liquids from the gel, which is not the case for the calibration gels. Water/methanolmixtures are known to exhibit anomalous thermodynamic properties, such as mixingentropy, viscosity etc. [68]. At the molecular scale the mixing of methanol with wateris incomplete leading to complex solution structures. This is due to the chain-like and
24 2. Coupled mass transfer and sol-gel reaction in a two-phase bulk system
0 . 0 1 0 . 1 1 1 00 . 0 0
0 . 0 5
0 . 1 0
0 . 1 5
0 . 2 0
Inten
sity [
a.u.]
T 2 [ s ]
H 2 O H 2 O + C H 3 O H C H 3 O H
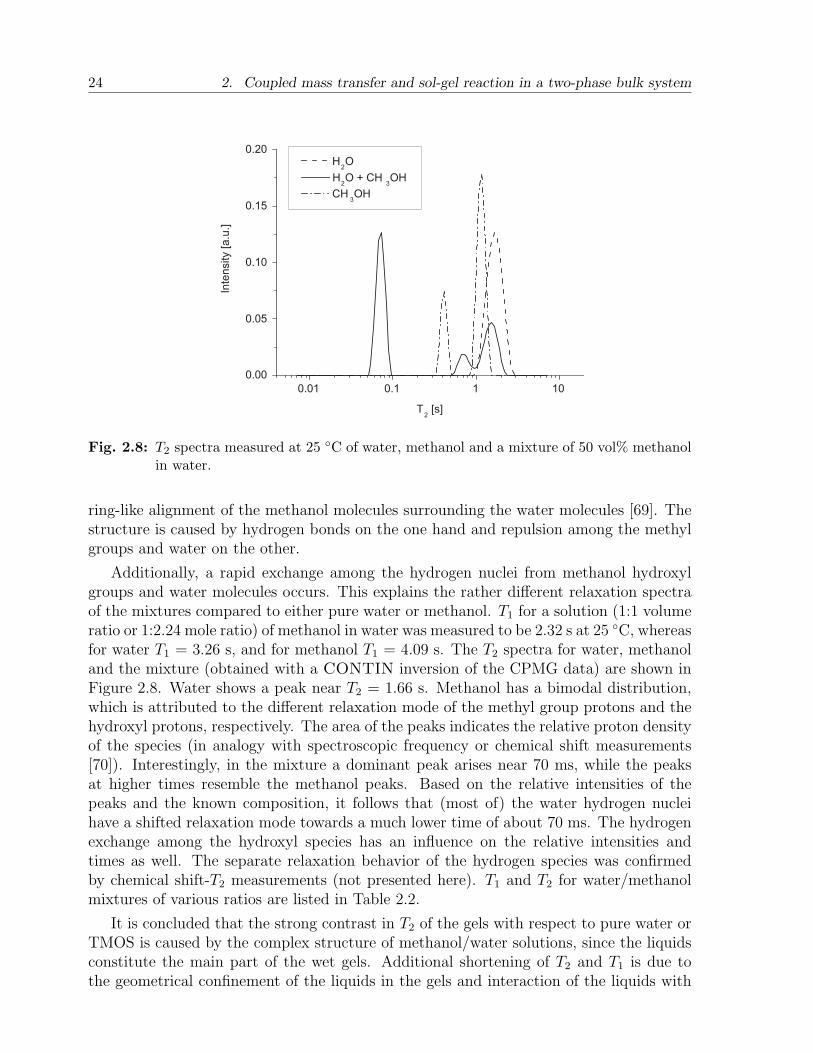
Fig. 2.8: T2 spectra measured at 25 C of water, methanol and a mixture of 50 vol% methanolin water.
ring-like alignment of the methanol molecules surrounding the water molecules [69]. Thestructure is caused by hydrogen bonds on the one hand and repulsion among the methylgroups and water on the other.
Additionally, a rapid exchange among the hydrogen nuclei from methanol hydroxylgroups and water molecules occurs. This explains the rather different relaxation spectraof the mixtures compared to either pure water or methanol. T1 for a solution (1:1 volumeratio or 1:2.24 mole ratio) of methanol in water was measured to be 2.32 s at 25 C, whereasfor water T1 = 3.26 s, and for methanol T1 = 4.09 s. The T2 spectra for water, methanoland the mixture (obtained with a CONTIN inversion of the CPMG data) are shown inFigure 2.8. Water shows a peak near T2 = 1.66 s. Methanol has a bimodal distribution,which is attributed to the different relaxation mode of the methyl group protons and thehydroxyl protons, respectively. The area of the peaks indicates the relative proton densityof the species (in analogy with spectroscopic frequency or chemical shift measurements[70]). Interestingly, in the mixture a dominant peak arises near 70 ms, while the peaksat higher times resemble the methanol peaks. Based on the relative intensities of thepeaks and the known composition, it follows that (most of) the water hydrogen nucleihave a shifted relaxation mode towards a much lower time of about 70 ms. The hydrogenexchange among the hydroxyl species has an influence on the relative intensities andtimes as well. The separate relaxation behavior of the hydrogen species was confirmedby chemical shift-T2 measurements (not presented here). T1 and T2 for water/methanolmixtures of various ratios are listed in Table 2.2.
It is concluded that the strong contrast in T2 of the gels with respect to pure water orTMOS is caused by the complex structure of methanol/water solutions, since the liquidsconstitute the main part of the wet gels. Additional shortening of T2 and T1 is due tothe geometrical confinement of the liquids in the gels and interaction of the liquids with
2.4. Results and discussion 25
the silica structure [71, 72], respectively. The dominant component in the T2-spectra isattributed to the water molecules. In the two-phase bulk experiments the focus will beon this component when analyzing the relaxation behavior of the aqueous phase.
2.4.2 Two-phase bulk systems
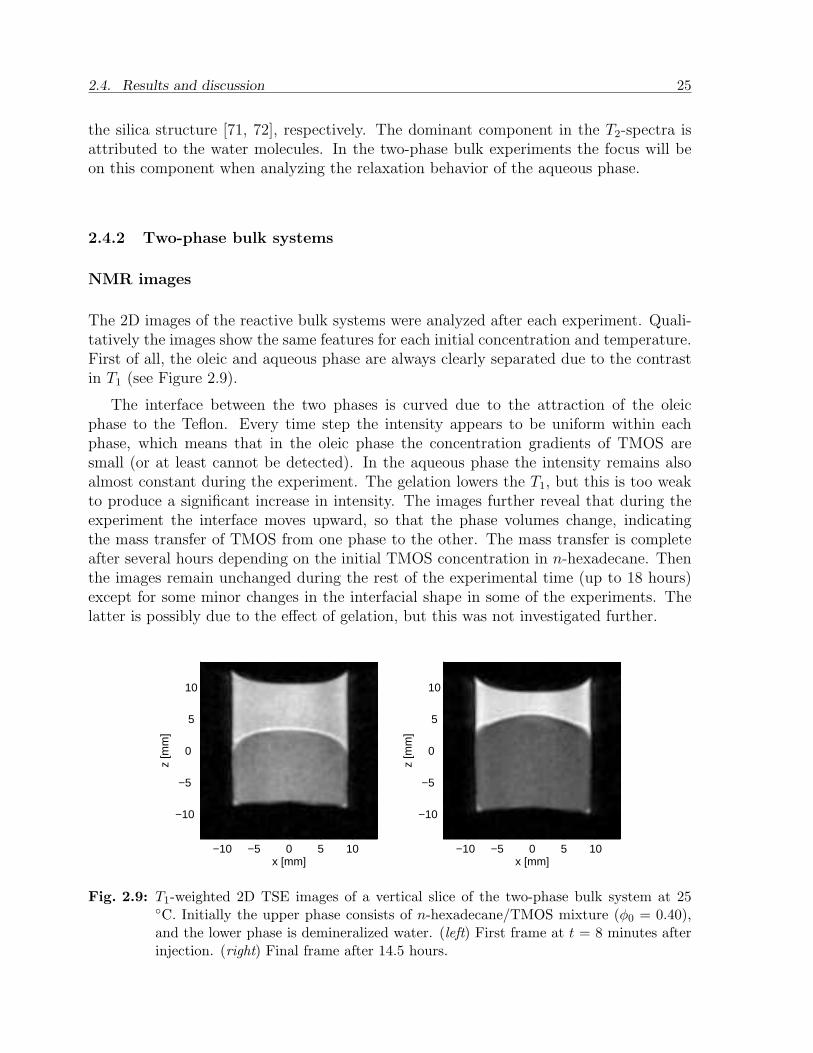
NMR images
The 2D images of the reactive bulk systems were analyzed after each experiment. Quali-tatively the images show the same features for each initial concentration and temperature.First of all, the oleic and aqueous phase are always clearly separated due to the contrastin T1 (see Figure 2.9).
The interface between the two phases is curved due to the attraction of the oleicphase to the Teflon. Every time step the intensity appears to be uniform within eachphase, which means that in the oleic phase the concentration gradients of TMOS aresmall (or at least cannot be detected). In the aqueous phase the intensity remains alsoalmost constant during the experiment. The gelation lowers the T1, but this is too weakto produce a significant increase in intensity. The images further reveal that during theexperiment the interface moves upward, so that the phase volumes change, indicatingthe mass transfer of TMOS from one phase to the other. The mass transfer is completeafter several hours depending on the initial TMOS concentration in n-hexadecane. Thenthe images remain unchanged during the rest of the experimental time (up to 18 hours)except for some minor changes in the interfacial shape in some of the experiments. Thelatter is possibly due to the effect of gelation, but this was not investigated further.
−10 −5 0 5 10
10
5
0
−5
−10
x [mm]
z [m
m]
−10 −5 0 5 10
10
5
0
−5
−10
x [mm]
z [m
m]
Fig. 2.9: T1-weighted 2D TSE images of a vertical slice of the two-phase bulk system at 25C. Initially the upper phase consists of n-hexadecane/TMOS mixture (φ0 = 0.40),and the lower phase is demineralized water. (left) First frame at t = 8 minutes afterinjection. (right) Final frame after 14.5 hours.
26 2. Coupled mass transfer and sol-gel reaction in a two-phase bulk system
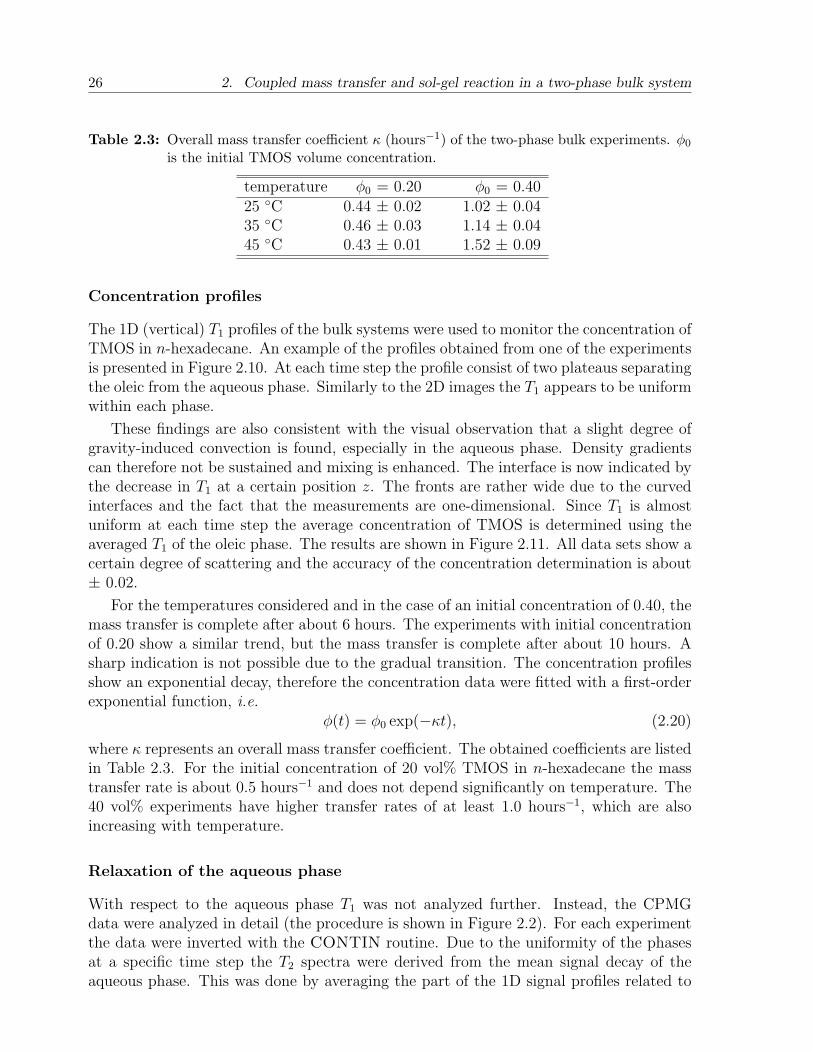
Table 2.3: Overall mass transfer coefficient κ (hours−1) of the two-phase bulk experiments. φ0
is the initial TMOS volume concentration.
temperature φ0 = 0.20 φ0 = 0.4025 C 0.44 ± 0.02 1.02 ± 0.0435 C 0.46 ± 0.03 1.14 ± 0.0445 C 0.43 ± 0.01 1.52 ± 0.09
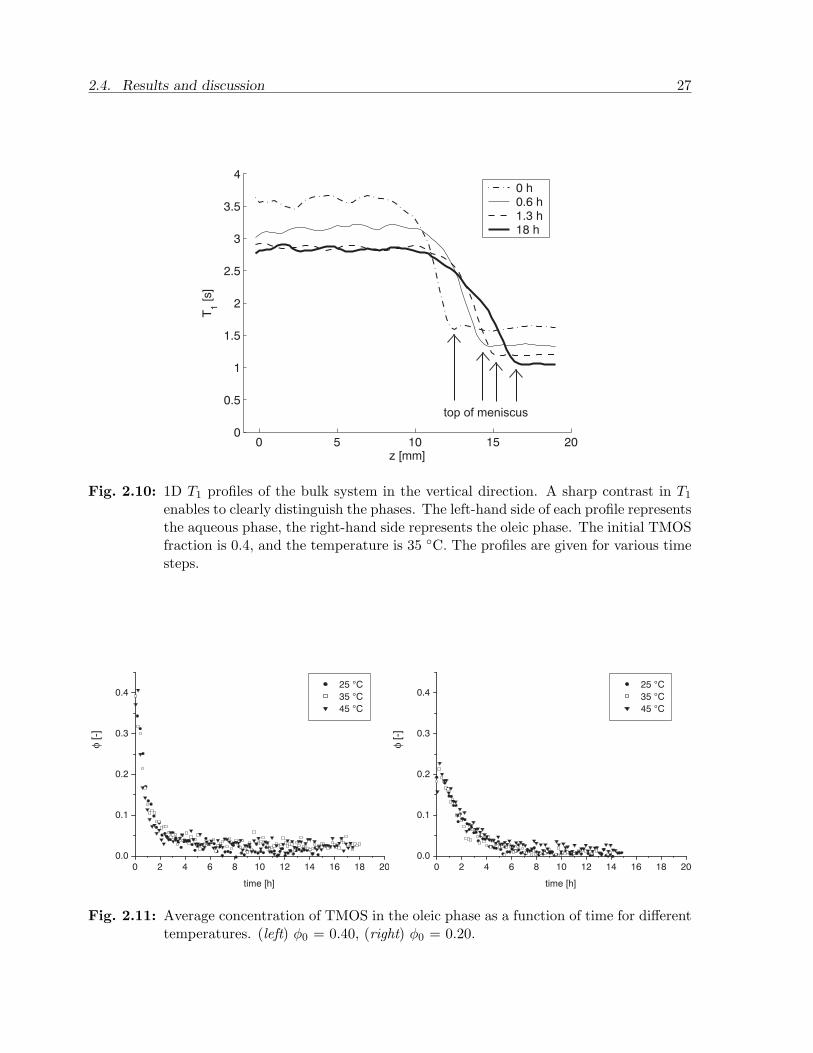
Concentration profiles
The 1D (vertical) T1 profiles of the bulk systems were used to monitor the concentration ofTMOS in n-hexadecane. An example of the profiles obtained from one of the experimentsis presented in Figure 2.10. At each time step the profile consist of two plateaus separatingthe oleic from the aqueous phase. Similarly to the 2D images the T1 appears to be uniformwithin each phase.
These findings are also consistent with the visual observation that a slight degree ofgravity-induced convection is found, especially in the aqueous phase. Density gradientscan therefore not be sustained and mixing is enhanced. The interface is now indicated bythe decrease in T1 at a certain position z. The fronts are rather wide due to the curvedinterfaces and the fact that the measurements are one-dimensional. Since T1 is almostuniform at each time step the average concentration of TMOS is determined using theaveraged T1 of the oleic phase. The results are shown in Figure 2.11. All data sets show acertain degree of scattering and the accuracy of the concentration determination is about± 0.02.
For the temperatures considered and in the case of an initial concentration of 0.40, themass transfer is complete after about 6 hours. The experiments with initial concentrationof 0.20 show a similar trend, but the mass transfer is complete after about 10 hours. Asharp indication is not possible due to the gradual transition. The concentration profilesshow an exponential decay, therefore the concentration data were fitted with a first-orderexponential function, i.e.
φ(t) = φ0 exp(−κt), (2.20)
where κ represents an overall mass transfer coefficient. The obtained coefficients are listedin Table 2.3. For the initial concentration of 20 vol% TMOS in n-hexadecane the masstransfer rate is about 0.5 hours−1 and does not depend significantly on temperature. The40 vol% experiments have higher transfer rates of at least 1.0 hours−1, which are alsoincreasing with temperature.
Relaxation of the aqueous phase
With respect to the aqueous phase T1 was not analyzed further. Instead, the CPMGdata were analyzed in detail (the procedure is shown in Figure 2.2). For each experimentthe data were inverted with the CONTIN routine. Due to the uniformity of the phasesat a specific time step the T2 spectra were derived from the mean signal decay of theaqueous phase. This was done by averaging the part of the 1D signal profiles related to
2.4. Results and discussion 27
0 5 10 15 200
0.5
1
1.5
2
2.5
3
3.5
4
z [mm]
T1 [s]
0 h0.6 h1.3 h18 h
top of meniscus
Fig. 2.10: 1D T1 profiles of the bulk system in the vertical direction. A sharp contrast in T1
enables to clearly distinguish the phases. The left-hand side of each profile representsthe aqueous phase, the right-hand side represents the oleic phase. The initial TMOSfraction is 0.4, and the temperature is 35 C. The profiles are given for various timesteps.
0 2 4 6 8 10 12 14 16 18 200.0
0.1
0.2
0.3
0.4 25 °C
35 °C
45 °C
φ [-]
time [h]
0 2 4 6 8 10 12 14 16 18 200.0
0.1
0.2
0.3
0.4 25 °C
35 °C
45 °C
φ [-]
time [h]
Fig. 2.11: Average concentration of TMOS in the oleic phase as a function of time for differenttemperatures. (left) φ0 = 0.40, (right) φ0 = 0.20.
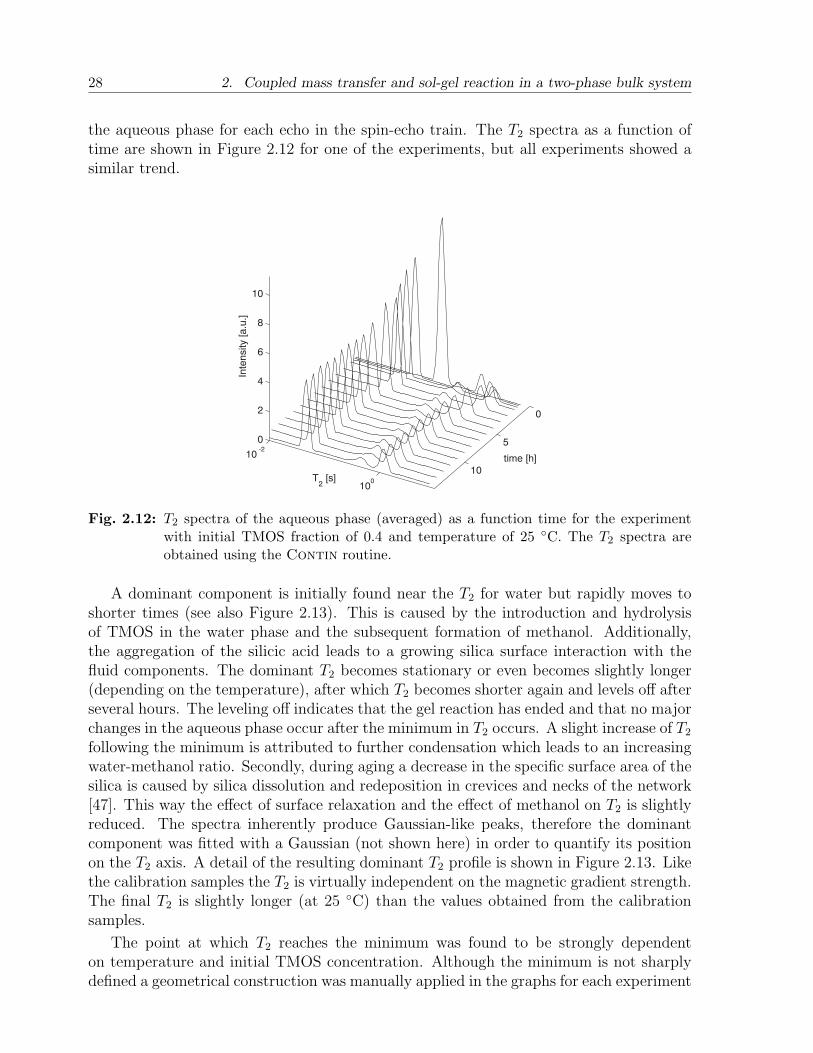
28 2. Coupled mass transfer and sol-gel reaction in a two-phase bulk system
the aqueous phase for each echo in the spin-echo train. The T2 spectra as a function oftime are shown in Figure 2.12 for one of the experiments, but all experiments showed asimilar trend.
0
5
10
10 -2
100
0
2
4
6
8
10
time [h]
T2 [s]
Inte
nsity [
a.u
.]
Fig. 2.12: T2 spectra of the aqueous phase (averaged) as a function time for the experimentwith initial TMOS fraction of 0.4 and temperature of 25 C. The T2 spectra areobtained using the Contin routine.
A dominant component is initially found near the T2 for water but rapidly moves toshorter times (see also Figure 2.13). This is caused by the introduction and hydrolysisof TMOS in the water phase and the subsequent formation of methanol. Additionally,the aggregation of the silicic acid leads to a growing silica surface interaction with thefluid components. The dominant T2 becomes stationary or even becomes slightly longer(depending on the temperature), after which T2 becomes shorter again and levels off afterseveral hours. The leveling off indicates that the gel reaction has ended and that no majorchanges in the aqueous phase occur after the minimum in T2 occurs. A slight increase of T2
following the minimum is attributed to further condensation which leads to an increasingwater-methanol ratio. Secondly, during aging a decrease in the specific surface area of thesilica is caused by silica dissolution and redeposition in crevices and necks of the network[47]. This way the effect of surface relaxation and the effect of methanol on T2 is slightlyreduced. The spectra inherently produce Gaussian-like peaks, therefore the dominantcomponent was fitted with a Gaussian (not shown here) in order to quantify its positionon the T2 axis. A detail of the resulting dominant T2 profile is shown in Figure 2.13. Likethe calibration samples the T2 is virtually independent on the magnetic gradient strength.The final T2 is slightly longer (at 25 C) than the values obtained from the calibrationsamples.
The point at which T2 reaches the minimum was found to be strongly dependenton temperature and initial TMOS concentration. Although the minimum is not sharplydefined a geometrical construction was manually applied in the graphs for each experiment
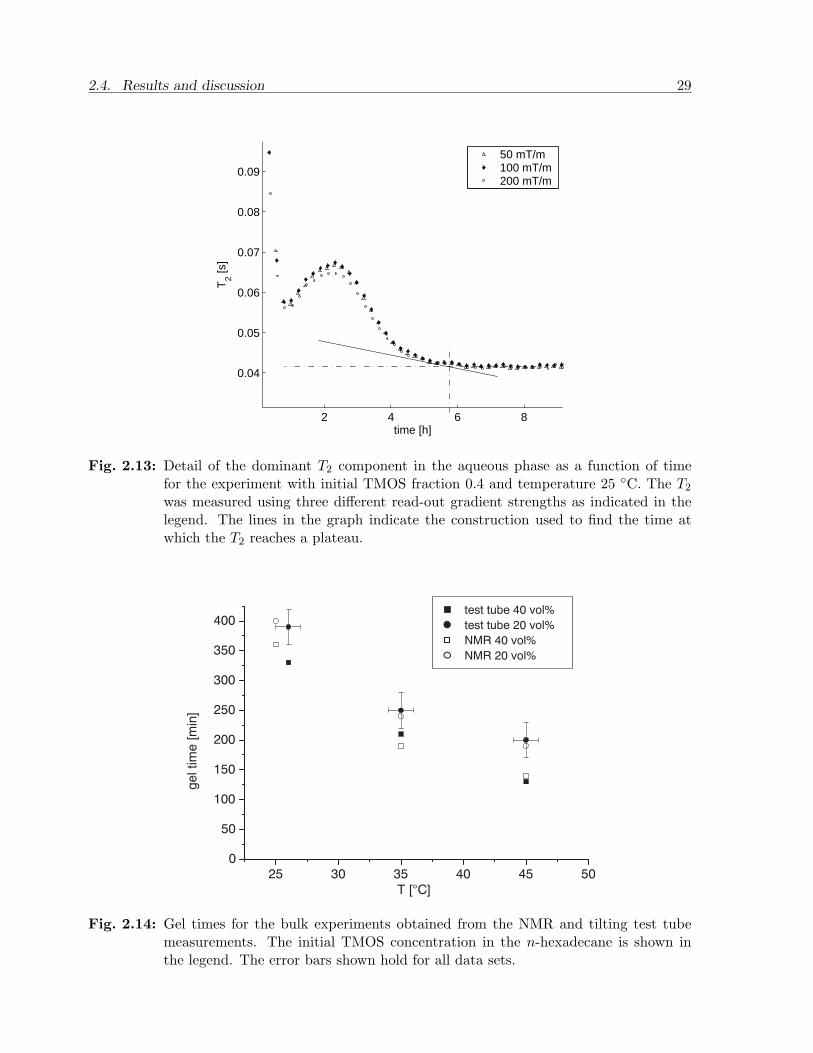
2.4. Results and discussion 29
2 4 6 8
0.04
0.05
0.06
0.07
0.08
0.09
time [h]
T2 [s
]
50 mT/m100 mT/m200 mT/m
Fig. 2.13: Detail of the dominant T2 component in the aqueous phase as a function of timefor the experiment with initial TMOS fraction 0.4 and temperature 25 C. The T2
was measured using three different read-out gradient strengths as indicated in thelegend. The lines in the graph indicate the construction used to find the time atwhich the T2 reaches a plateau.
25 30 35 40 45 500
50
100
150
200
250
300
350
400
gel tim
e [m
in]
T [°C]
test tube 40 vol%
test tube 20 vol%
NMR 40 vol%
NMR 20 vol%
Fig. 2.14: Gel times for the bulk experiments obtained from the NMR and tilting test tubemeasurements. The initial TMOS concentration in the n-hexadecane is shown inthe legend. The error bars shown hold for all data sets.
30 2. Coupled mass transfer and sol-gel reaction in a two-phase bulk system
to find the points at which the minima occur. The resulting transition time (with anaccuracy of about 30 minutes) was subsequently compared to the gel times obtained fromthe tilting test tube experiments (as demonstrated in Figure 2.14). A good agreement isfound between the gel times and the times at which the minimum T2 (or plateau) occurs.The leveling-off time in T2 therefore appears to be an adequate indication for the geltransition time in these experiments.
2.5 Conclusion
In binary mixtures of TMOS and n-hexadecane the longitudinal relaxation time T1 in-creases monotonically with the concentration of TMOS and with temperature. The mea-surement of T1 proves to be a robust method to determine concentrations in a non-intrusivemanner. The prepared gels showed a significant decrease in the transverse relaxation timeT2 compared to either water, TMOS or methanol. The short T2 component is related tothe water hydrogen nuclei, whereas the longer components can be attributed to methanol.The shortening of the water T2 component is due to the interaction of water with methanol.An additional decrease of the relaxation times is caused by the geometrical confinementin the gel structure, and the interaction of the fluid with the silica surface.
Through the measurement of T1 the concentration of TMOS in n-hexadecane wasdetermined dynamically during the experiments with an accuracy of about 2 vol%. Boththe T1-weighed 2D images as the T1 profiles revealed that the oleic and the aqueousphase were uniform in terms of T1 at each time step measured during the reactive masstransfer. Significant concentration gradients were therefore not observed, which meansthat the mass transfer within each phase is enhanced by convective mixing, and is notdue to diffusion only. After the phases are brought in contact the average concentrationof TMOS in the oleic phase decreases exponentially. The rate is rather insensitive totemperature (within the range of 25–45 C), but is sensitive to the initial concentrationof TMOS. In case of an initial concentration of TMOS of 40 vol% the rate is at leasttwo times higher compared to the lower initial concentration of 20 vol%. The gel pointof the aqueous phase is indicated by the minimum (or plateau) in T2, which appearsafter several hours when the fluids are brought in contact. The gel time decreases withincreasing temperature and with increasing initial TMOS concentration.
Chapter 3
Interfacial effects during reactive transport∗
The mass transfer coupled with hydrolysis and gelation in the aqueous phase givesrise to an intriguing motion of the interface between both phases. This phenom-enon was analyzed in detail both theoretically and experimentally. The theory wasdeveloped assuming quasi-static conditions and provides a non-linear second orderboundary value problem, which was treated numerically. Magnetic Resonance Imag-ing (MRI) experiments are used to quantify the fluids in the oil and water phasesand capture the interface profiles between the oil and the water phases at differenttime intervals. An excellent fit of the theoretical interface profiles to the experimentalones at various times reveals that the interfacial tension increases gradually duringthe extent of the mass transfer.
3.1 Introduction
The coupled mass transfer and gel reaction of TMOS in two-phase bulk systems werestudied using Magnetic Resonance Imaging (MRI). Nuclear magnetic relaxation times(T1 and T2) were used to determine the concentration of TMOS in oil and to monitorthe progress of gelation (see Chapter 2). The images revealed that the reactive masstransfer in these systems gives rise to an intriguing motion of the interface between theoleic and the aqueous phases. Figure 2.9 shows two MRI images of a two-phase bulksystem within a small Teflon vial. Initially, the oleic phase, consisting of n-hexadecane,is mixed with TMOS at a concentration of 40 vol%. During the experiment the TMOSgradually transfers to the aqueous phase, while the volumes of the phases change and,as a result, the interface moves upwards. In addition, the shape of the curved interfaceand the contact angles at the vial material show subtle changes during the reactive masstransfer, suggesting gradual changes in interfacial tension (IFT). The main question iswhether the IFT increases or decreases during the process. This is also of interest in lightof the application of the chemical. For example, when a mixture of TMOS and oil isinjected in a water-saturated porous material the IFT determines the capillary forces andhence the displacement and distribution of the fluids.
Interfacial tension between organic liquids and water has been extensively studied inthe past, both experimentally and theoretically [73–77]. Also, the IFT between mixturesof organic compounds and water has been investigated [78]. Common methods to measuresurface or interfacial tension are either based on a force balance, using a Wilhelmy plate[79] or a du Nouy ring [80], or on visualization of droplet surfaces, such as the pendant
* Adapted from Castelijns et al. , Colloid Surf. A, in press (2007)
31
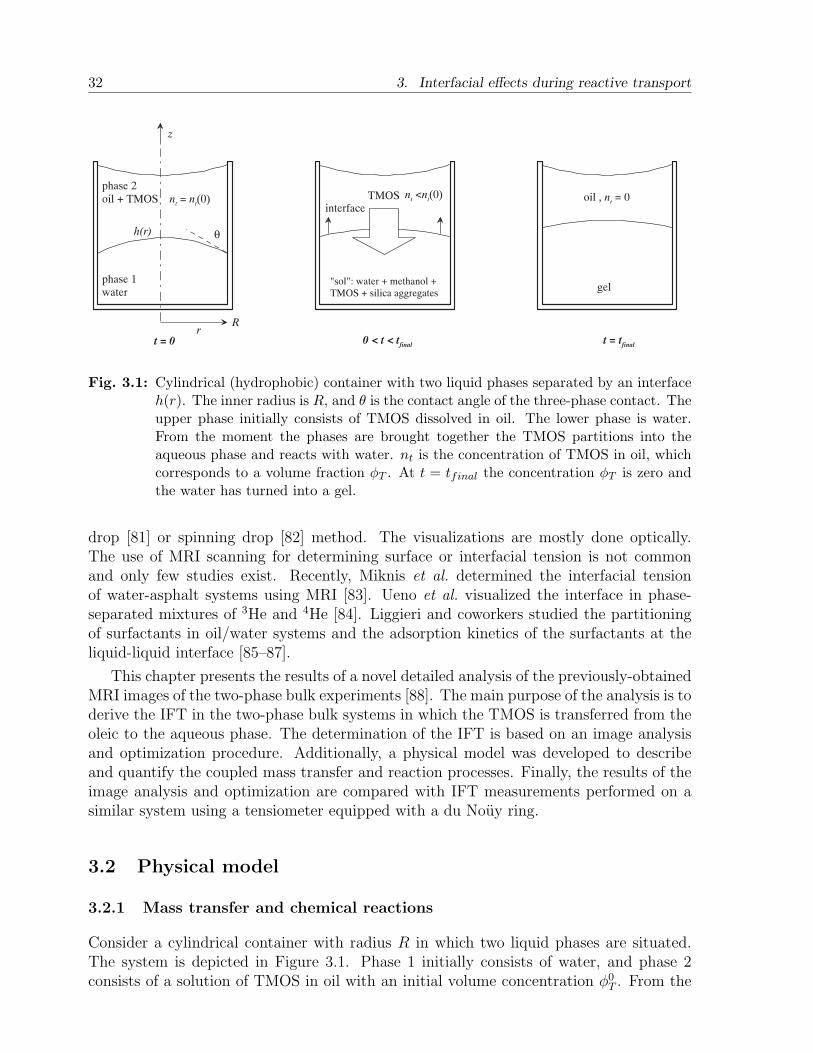
32 3. Interfacial effects during reactive transport
phase 1water
"sol": water + methanol +TMOS + silica aggregates
gel
oil , nt = 0
interfaceTMOS
t = 0 0 < t < tfinal
t = tfinal
nt <n
t(0)
phase 2oil + TMOS n
t = n
t(0)
Rr
θ
z
h(r)
Fig. 3.1: Cylindrical (hydrophobic) container with two liquid phases separated by an interfaceh(r). The inner radius is R, and θ is the contact angle of the three-phase contact. Theupper phase initially consists of TMOS dissolved in oil. The lower phase is water.From the moment the phases are brought together the TMOS partitions into theaqueous phase and reacts with water. nt is the concentration of TMOS in oil, whichcorresponds to a volume fraction φT . At t = tfinal the concentration φT is zero andthe water has turned into a gel.
drop [81] or spinning drop [82] method. The visualizations are mostly done optically.The use of MRI scanning for determining surface or interfacial tension is not commonand only few studies exist. Recently, Miknis et al. determined the interfacial tensionof water-asphalt systems using MRI [83]. Ueno et al. visualized the interface in phase-separated mixtures of 3He and 4He [84]. Liggieri and coworkers studied the partitioningof surfactants in oil/water systems and the adsorption kinetics of the surfactants at theliquid-liquid interface [85–87].
This chapter presents the results of a novel detailed analysis of the previously-obtainedMRI images of the two-phase bulk experiments [88]. The main purpose of the analysis is toderive the IFT in the two-phase bulk systems in which the TMOS is transferred from theoleic to the aqueous phase. The determination of the IFT is based on an image analysisand optimization procedure. Additionally, a physical model was developed to describeand quantify the coupled mass transfer and reaction processes. Finally, the results of theimage analysis and optimization are compared with IFT measurements performed on asimilar system using a tensiometer equipped with a du Nouy ring.
3.2 Physical model
3.2.1 Mass transfer and chemical reactions
Consider a cylindrical container with radius R in which two liquid phases are situated.The system is depicted in Figure 3.1. Phase 1 initially consists of water, and phase 2consists of a solution of TMOS in oil with an initial volume concentration φ0
T . From the
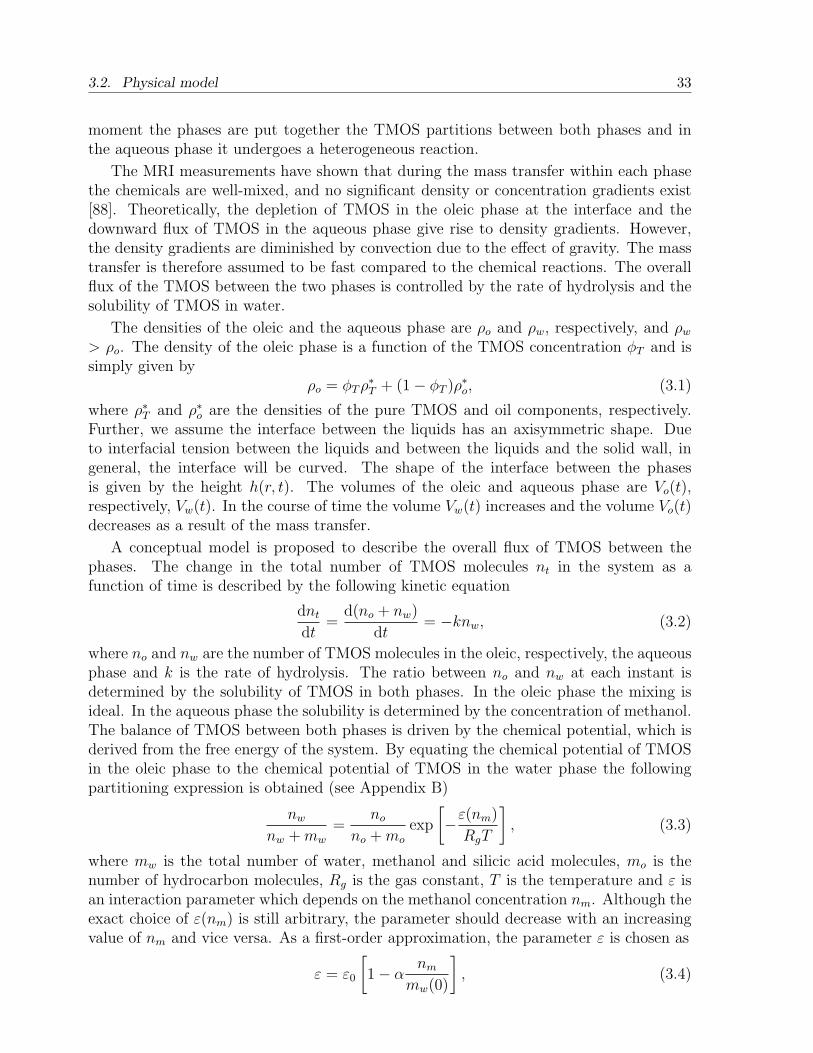
3.2. Physical model 33
moment the phases are put together the TMOS partitions between both phases and inthe aqueous phase it undergoes a heterogeneous reaction.
The MRI measurements have shown that during the mass transfer within each phasethe chemicals are well-mixed, and no significant density or concentration gradients exist[88]. Theoretically, the depletion of TMOS in the oleic phase at the interface and thedownward flux of TMOS in the aqueous phase give rise to density gradients. However,the density gradients are diminished by convection due to the effect of gravity. The masstransfer is therefore assumed to be fast compared to the chemical reactions. The overallflux of the TMOS between the two phases is controlled by the rate of hydrolysis and thesolubility of TMOS in water.
The densities of the oleic and the aqueous phase are ρo and ρw, respectively, and ρw
> ρo. The density of the oleic phase is a function of the TMOS concentration φT and issimply given by
ρo = φT ρ∗T + (1− φT )ρ∗o, (3.1)
where ρ∗T and ρ∗o are the densities of the pure TMOS and oil components, respectively.Further, we assume the interface between the liquids has an axisymmetric shape. Dueto interfacial tension between the liquids and between the liquids and the solid wall, ingeneral, the interface will be curved. The shape of the interface between the phasesis given by the height h(r, t). The volumes of the oleic and aqueous phase are Vo(t),respectively, Vw(t). In the course of time the volume Vw(t) increases and the volume Vo(t)decreases as a result of the mass transfer.
A conceptual model is proposed to describe the overall flux of TMOS between thephases. The change in the total number of TMOS molecules nt in the system as afunction of time is described by the following kinetic equation
dnt
dt=
d(no + nw)
dt= −knw, (3.2)
where no and nw are the number of TMOS molecules in the oleic, respectively, the aqueousphase and k is the rate of hydrolysis. The ratio between no and nw at each instant isdetermined by the solubility of TMOS in both phases. In the oleic phase the mixing isideal. In the aqueous phase the solubility is determined by the concentration of methanol.The balance of TMOS between both phases is driven by the chemical potential, which isderived from the free energy of the system. By equating the chemical potential of TMOSin the oleic phase to the chemical potential of TMOS in the water phase the followingpartitioning expression is obtained (see Appendix B)
nw
nw + mw
=no
no + mo
exp
[−ε(nm)
RgT
], (3.3)
where mw is the total number of water, methanol and silicic acid molecules, mo is thenumber of hydrocarbon molecules, Rg is the gas constant, T is the temperature and ε isan interaction parameter which depends on the methanol concentration nm. Although theexact choice of ε(nm) is still arbitrary, the parameter should decrease with an increasingvalue of nm and vice versa. As a first-order approximation, the parameter ε is chosen as
ε = ε0
[1− α
nm
mw(0)
], (3.4)
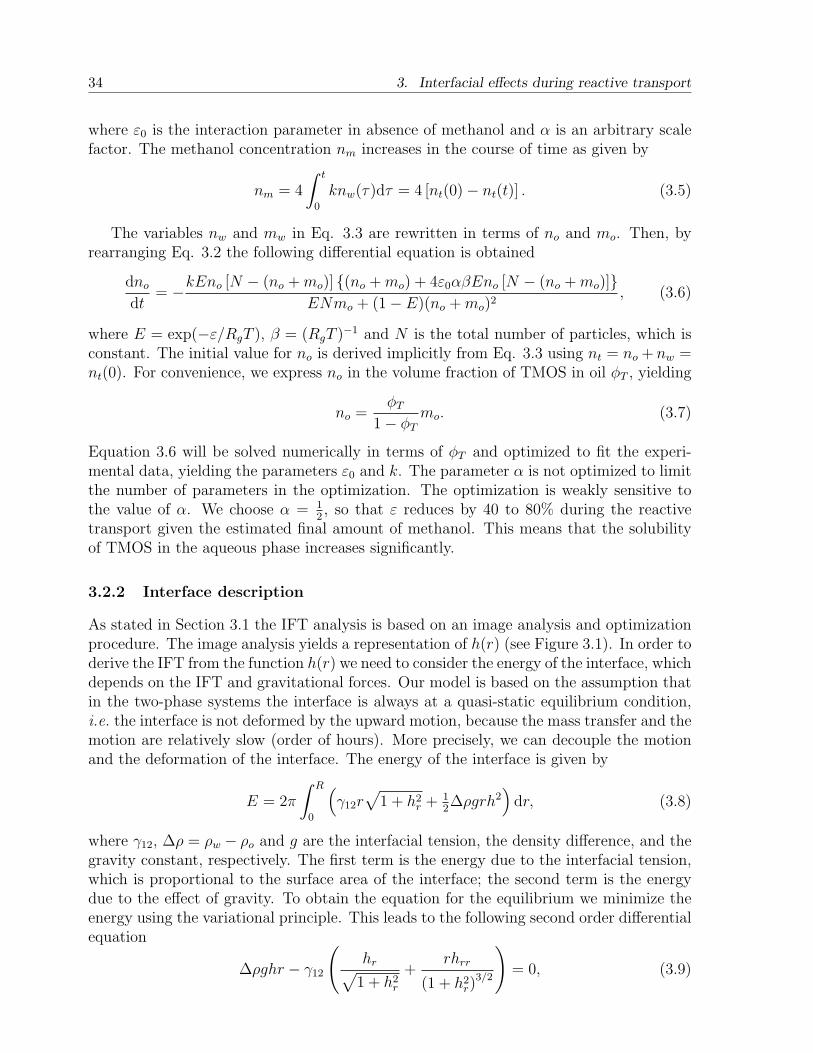
34 3. Interfacial effects during reactive transport
where ε0 is the interaction parameter in absence of methanol and α is an arbitrary scalefactor. The methanol concentration nm increases in the course of time as given by
nm = 4
∫ t
0
knw(τ)dτ = 4 [nt(0)− nt(t)] . (3.5)
The variables nw and mw in Eq. 3.3 are rewritten in terms of no and mo. Then, byrearranging Eq. 3.2 the following differential equation is obtained
dno
dt= −kEno [N − (no + mo)] (no + mo) + 4ε0αβEno [N − (no + mo)]
ENmo + (1− E)(no + mo)2, (3.6)
where E = exp(−ε/RgT ), β = (RgT )−1 and N is the total number of particles, which isconstant. The initial value for no is derived implicitly from Eq. 3.3 using nt = no + nw =nt(0). For convenience, we express no in the volume fraction of TMOS in oil φT , yielding
no =φT
1− φT
mo. (3.7)
Equation 3.6 will be solved numerically in terms of φT and optimized to fit the experi-mental data, yielding the parameters ε0 and k. The parameter α is not optimized to limitthe number of parameters in the optimization. The optimization is weakly sensitive tothe value of α. We choose α = 1
2, so that ε reduces by 40 to 80% during the reactive
transport given the estimated final amount of methanol. This means that the solubilityof TMOS in the aqueous phase increases significantly.
3.2.2 Interface description
As stated in Section 3.1 the IFT analysis is based on an image analysis and optimizationprocedure. The image analysis yields a representation of h(r) (see Figure 3.1). In order toderive the IFT from the function h(r) we need to consider the energy of the interface, whichdepends on the IFT and gravitational forces. Our model is based on the assumption thatin the two-phase systems the interface is always at a quasi-static equilibrium condition,i.e. the interface is not deformed by the upward motion, because the mass transfer and themotion are relatively slow (order of hours). More precisely, we can decouple the motionand the deformation of the interface. The energy of the interface is given by
E = 2π
∫ R
0
(γ12r
√1 + h2
r + 12∆ρgrh2
)dr, (3.8)
where γ12, ∆ρ = ρw − ρo and g are the interfacial tension, the density difference, and thegravity constant, respectively. The first term is the energy due to the interfacial tension,which is proportional to the surface area of the interface; the second term is the energydue to the effect of gravity. To obtain the equation for the equilibrium we minimize theenergy using the variational principle. This leads to the following second order differentialequation
∆ρghr − γ12
(hr√
1 + h2r
+rhrr
(1 + h2r)
3/2
)= 0, (3.9)
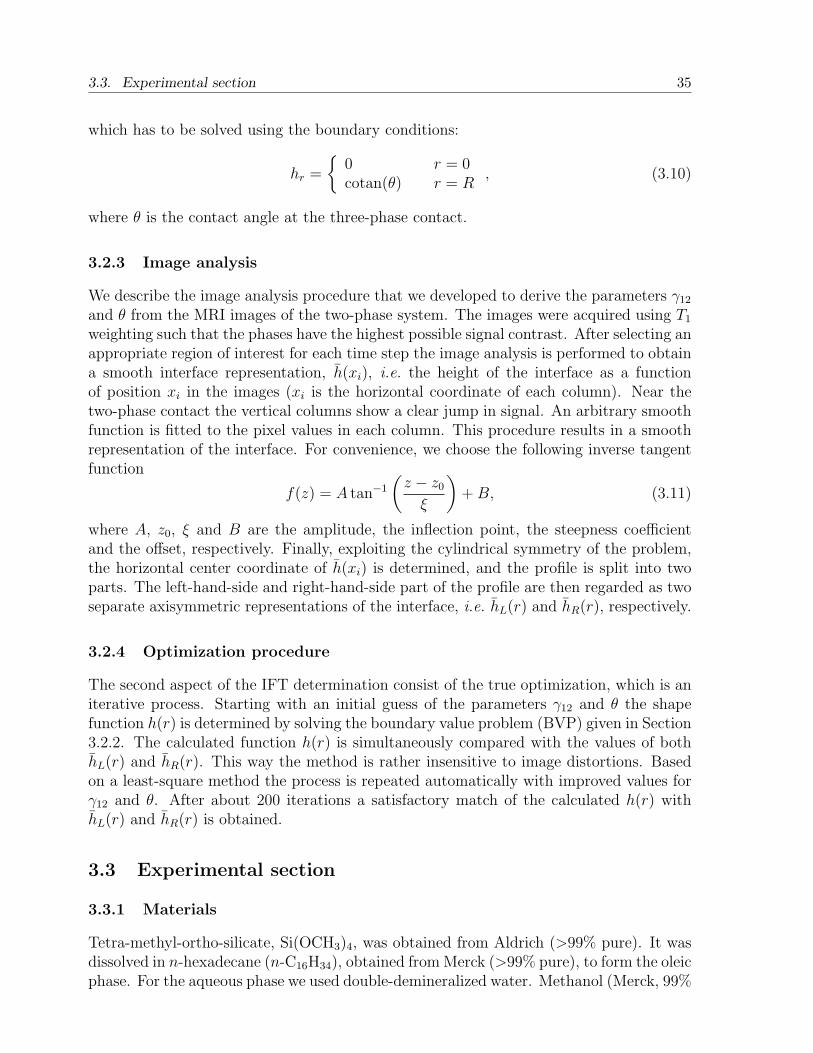
3.3. Experimental section 35
which has to be solved using the boundary conditions:
hr =
0 r = 0cotan(θ) r = R
, (3.10)
where θ is the contact angle at the three-phase contact.
3.2.3 Image analysis
We describe the image analysis procedure that we developed to derive the parameters γ12
and θ from the MRI images of the two-phase system. The images were acquired using T1
weighting such that the phases have the highest possible signal contrast. After selecting anappropriate region of interest for each time step the image analysis is performed to obtaina smooth interface representation, h(xi), i.e. the height of the interface as a functionof position xi in the images (xi is the horizontal coordinate of each column). Near thetwo-phase contact the vertical columns show a clear jump in signal. An arbitrary smoothfunction is fitted to the pixel values in each column. This procedure results in a smoothrepresentation of the interface. For convenience, we choose the following inverse tangentfunction
f(z) = A tan−1
(z − z0
ξ
)+ B, (3.11)
where A, z0, ξ and B are the amplitude, the inflection point, the steepness coefficientand the offset, respectively. Finally, exploiting the cylindrical symmetry of the problem,the horizontal center coordinate of h(xi) is determined, and the profile is split into twoparts. The left-hand-side and right-hand-side part of the profile are then regarded as twoseparate axisymmetric representations of the interface, i.e. hL(r) and hR(r), respectively.
3.2.4 Optimization procedure
The second aspect of the IFT determination consist of the true optimization, which is aniterative process. Starting with an initial guess of the parameters γ12 and θ the shapefunction h(r) is determined by solving the boundary value problem (BVP) given in Section3.2.2. The calculated function h(r) is simultaneously compared with the values of bothhL(r) and hR(r). This way the method is rather insensitive to image distortions. Basedon a least-square method the process is repeated automatically with improved values forγ12 and θ. After about 200 iterations a satisfactory match of the calculated h(r) withhL(r) and hR(r) is obtained.
3.3 Experimental section
3.3.1 Materials
Tetra-methyl-ortho-silicate, Si(OCH3)4, was obtained from Aldrich (>99% pure). It wasdissolved in n-hexadecane (n-C16H34), obtained from Merck (>99% pure), to form the oleicphase. For the aqueous phase we used double-demineralized water. Methanol (Merck, 99%
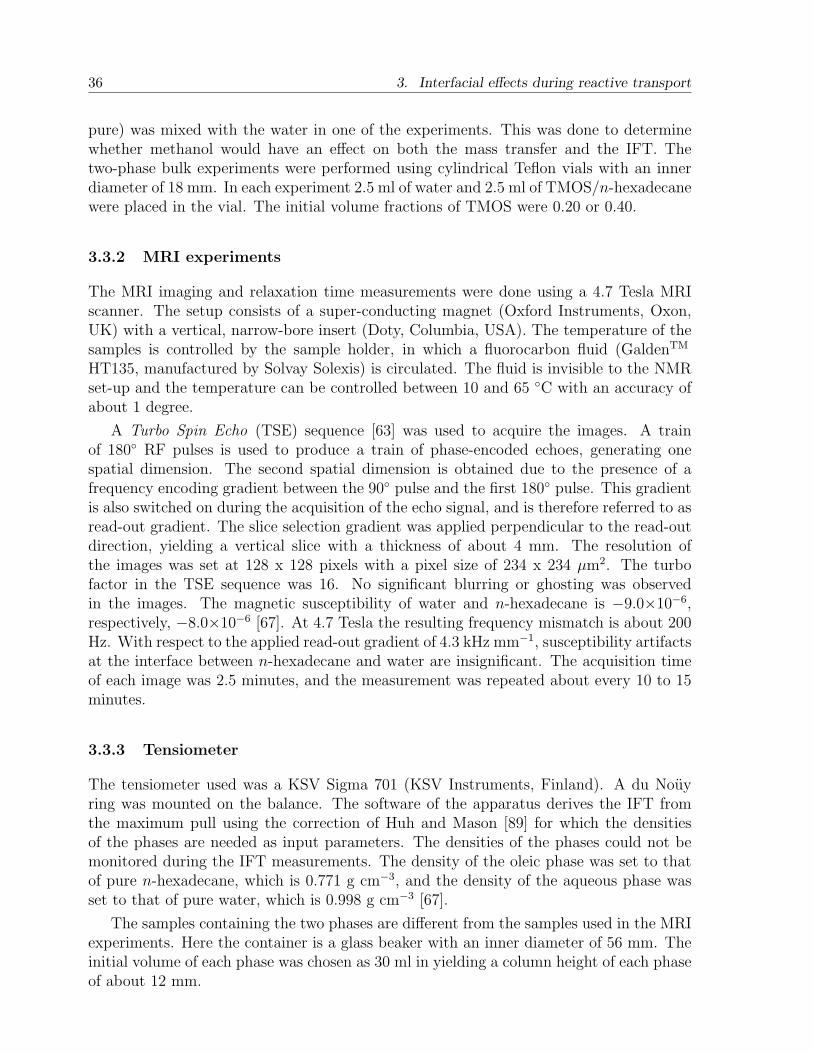
36 3. Interfacial effects during reactive transport
pure) was mixed with the water in one of the experiments. This was done to determinewhether methanol would have an effect on both the mass transfer and the IFT. Thetwo-phase bulk experiments were performed using cylindrical Teflon vials with an innerdiameter of 18 mm. In each experiment 2.5 ml of water and 2.5 ml of TMOS/n-hexadecanewere placed in the vial. The initial volume fractions of TMOS were 0.20 or 0.40.
3.3.2 MRI experiments
The MRI imaging and relaxation time measurements were done using a 4.7 Tesla MRIscanner. The setup consists of a super-conducting magnet (Oxford Instruments, Oxon,UK) with a vertical, narrow-bore insert (Doty, Columbia, USA). The temperature of thesamples is controlled by the sample holder, in which a fluorocarbon fluid (GaldenTM
HT135, manufactured by Solvay Solexis) is circulated. The fluid is invisible to the NMRset-up and the temperature can be controlled between 10 and 65 C with an accuracy ofabout 1 degree.
A Turbo Spin Echo (TSE) sequence [63] was used to acquire the images. A trainof 180 RF pulses is used to produce a train of phase-encoded echoes, generating onespatial dimension. The second spatial dimension is obtained due to the presence of afrequency encoding gradient between the 90 pulse and the first 180 pulse. This gradientis also switched on during the acquisition of the echo signal, and is therefore referred to asread-out gradient. The slice selection gradient was applied perpendicular to the read-outdirection, yielding a vertical slice with a thickness of about 4 mm. The resolution ofthe images was set at 128 x 128 pixels with a pixel size of 234 x 234 µm2. The turbofactor in the TSE sequence was 16. No significant blurring or ghosting was observedin the images. The magnetic susceptibility of water and n-hexadecane is −9.0×10⁻⁶,respectively, −8.0×10⁻⁶ [67]. At 4.7 Tesla the resulting frequency mismatch is about 200Hz. With respect to the applied read-out gradient of 4.3 kHz mm−1, susceptibility artifactsat the interface between n-hexadecane and water are insignificant. The acquisition timeof each image was 2.5 minutes, and the measurement was repeated about every 10 to 15minutes.
3.3.3 Tensiometer
The tensiometer used was a KSV Sigma 701 (KSV Instruments, Finland). A du Nouyring was mounted on the balance. The software of the apparatus derives the IFT fromthe maximum pull using the correction of Huh and Mason [89] for which the densitiesof the phases are needed as input parameters. The densities of the phases could not bemonitored during the IFT measurements. The density of the oleic phase was set to thatof pure n-hexadecane, which is 0.771 g cm−3, and the density of the aqueous phase wasset to that of pure water, which is 0.998 g cm−3 [67].
The samples containing the two phases are different from the samples used in the MRIexperiments. Here the container is a glass beaker with an inner diameter of 56 mm. Theinitial volume of each phase was chosen as 30 ml in yielding a column height of each phaseof about 12 mm.
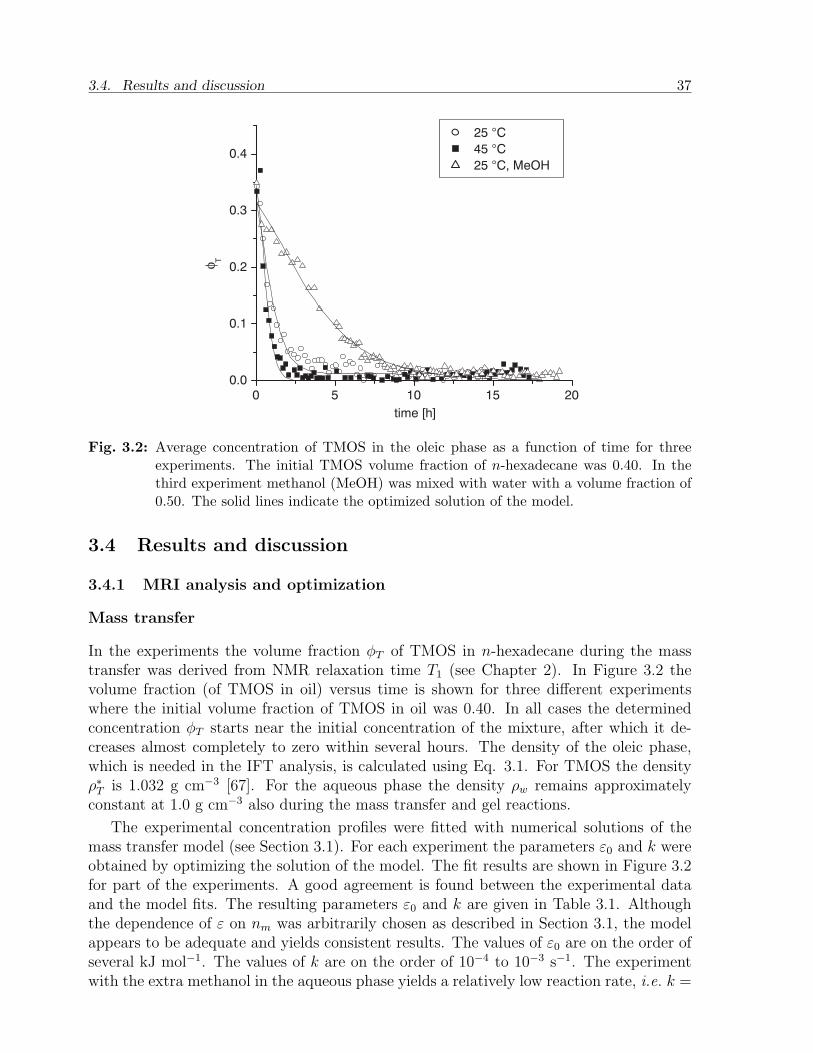
3.4. Results and discussion 37
0 5 10 15 200.0
0.1
0.2
0.3
0.4
φT
time [h]
25 °C
45 °C
25 °C, MeOH
Fig. 3.2: Average concentration of TMOS in the oleic phase as a function of time for threeexperiments. The initial TMOS volume fraction of n-hexadecane was 0.40. In thethird experiment methanol (MeOH) was mixed with water with a volume fraction of0.50. The solid lines indicate the optimized solution of the model.
3.4 Results and discussion
3.4.1 MRI analysis and optimization
Mass transfer
In the experiments the volume fraction φT of TMOS in n-hexadecane during the masstransfer was derived from NMR relaxation time T1 (see Chapter 2). In Figure 3.2 thevolume fraction (of TMOS in oil) versus time is shown for three different experimentswhere the initial volume fraction of TMOS in oil was 0.40. In all cases the determinedconcentration φT starts near the initial concentration of the mixture, after which it de-creases almost completely to zero within several hours. The density of the oleic phase,which is needed in the IFT analysis, is calculated using Eq. 3.1. For TMOS the densityρ∗T is 1.032 g cm−3 [67]. For the aqueous phase the density ρw remains approximatelyconstant at 1.0 g cm−3 also during the mass transfer and gel reactions.
The experimental concentration profiles were fitted with numerical solutions of themass transfer model (see Section 3.1). For each experiment the parameters ε0 and k wereobtained by optimizing the solution of the model. The fit results are shown in Figure 3.2for part of the experiments. A good agreement is found between the experimental dataand the model fits. The resulting parameters ε0 and k are given in Table 3.1. Althoughthe dependence of ε on nm was arbitrarily chosen as described in Section 3.1, the modelappears to be adequate and yields consistent results. The values of ε0 are on the order ofseveral kJ mol−1. The values of k are on the order of 10−4 to 10−3 s−1. The experimentwith the extra methanol in the aqueous phase yields a relatively low reaction rate, i.e. k =
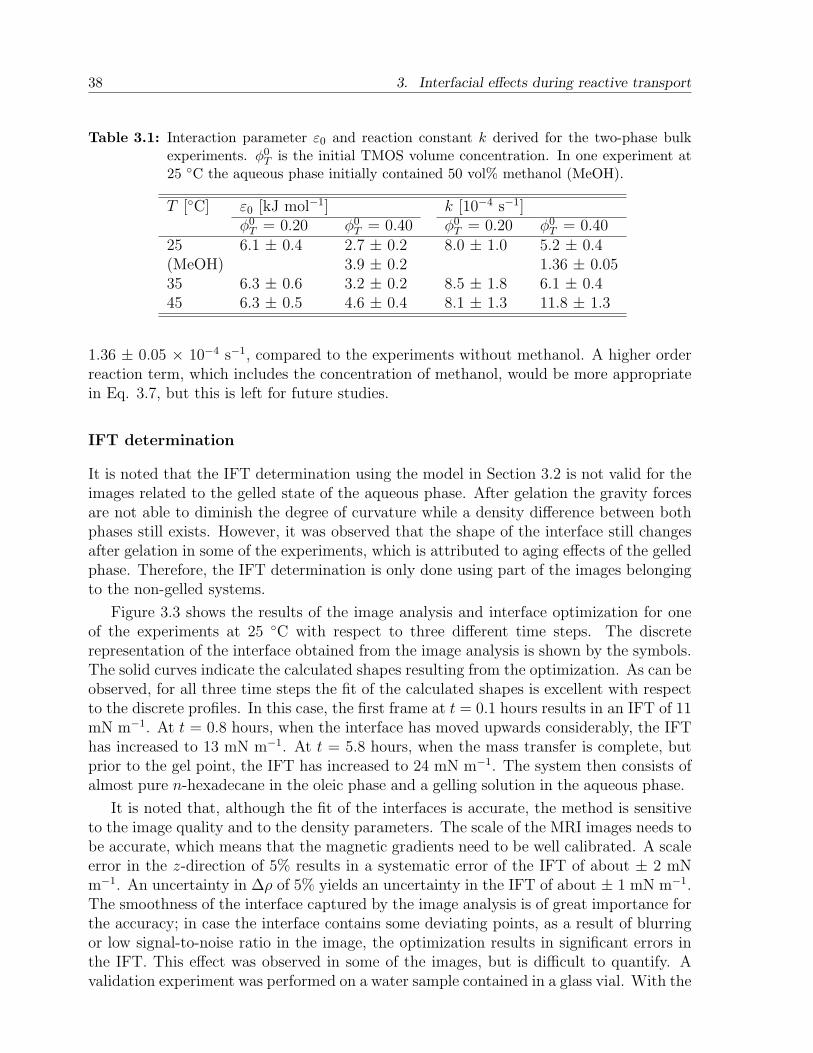
38 3. Interfacial effects during reactive transport
Table 3.1: Interaction parameter ε0 and reaction constant k derived for the two-phase bulkexperiments. φ0
T is the initial TMOS volume concentration. In one experiment at25 C the aqueous phase initially contained 50 vol% methanol (MeOH).
T [C] ε0 [kJ mol−1] k [10−4 s−1]φ0
T = 0.20 φ0T = 0.40 φ0
T = 0.20 φ0T = 0.40
25 6.1 ± 0.4 2.7 ± 0.2 8.0 ± 1.0 5.2 ± 0.4(MeOH) 3.9 ± 0.2 1.36 ± 0.0535 6.3 ± 0.6 3.2 ± 0.2 8.5 ± 1.8 6.1 ± 0.445 6.3 ± 0.5 4.6 ± 0.4 8.1 ± 1.3 11.8 ± 1.3
1.36 ± 0.05 × 10⁻⁴ s−1, compared to the experiments without methanol. A higher orderreaction term, which includes the concentration of methanol, would be more appropriatein Eq. 3.7, but this is left for future studies.
IFT determination
It is noted that the IFT determination using the model in Section 3.2 is not valid for theimages related to the gelled state of the aqueous phase. After gelation the gravity forcesare not able to diminish the degree of curvature while a density difference between bothphases still exists. However, it was observed that the shape of the interface still changesafter gelation in some of the experiments, which is attributed to aging effects of the gelledphase. Therefore, the IFT determination is only done using part of the images belongingto the non-gelled systems.
Figure 3.3 shows the results of the image analysis and interface optimization for oneof the experiments at 25 C with respect to three different time steps. The discreterepresentation of the interface obtained from the image analysis is shown by the symbols.The solid curves indicate the calculated shapes resulting from the optimization. As can beobserved, for all three time steps the fit of the calculated shapes is excellent with respectto the discrete profiles. In this case, the first frame at t = 0.1 hours results in an IFT of 11mN m−1. At t = 0.8 hours, when the interface has moved upwards considerably, the IFThas increased to 13 mN m−1. At t = 5.8 hours, when the mass transfer is complete, butprior to the gel point, the IFT has increased to 24 mN m−1. The system then consists ofalmost pure n-hexadecane in the oleic phase and a gelling solution in the aqueous phase.
It is noted that, although the fit of the interfaces is accurate, the method is sensitiveto the image quality and to the density parameters. The scale of the MRI images needs tobe accurate, which means that the magnetic gradients need to be well calibrated. A scaleerror in the z-direction of 5% results in a systematic error of the IFT of about ± 2 mNm−1. An uncertainty in ∆ρ of 5% yields an uncertainty in the IFT of about ± 1 mN m−1.The smoothness of the interface captured by the image analysis is of great importance forthe accuracy; in case the interface contains some deviating points, as a result of blurringor low signal-to-noise ratio in the image, the optimization results in significant errors inthe IFT. This effect was observed in some of the images, but is difficult to quantify. Avalidation experiment was performed on a water sample contained in a glass vial. With the
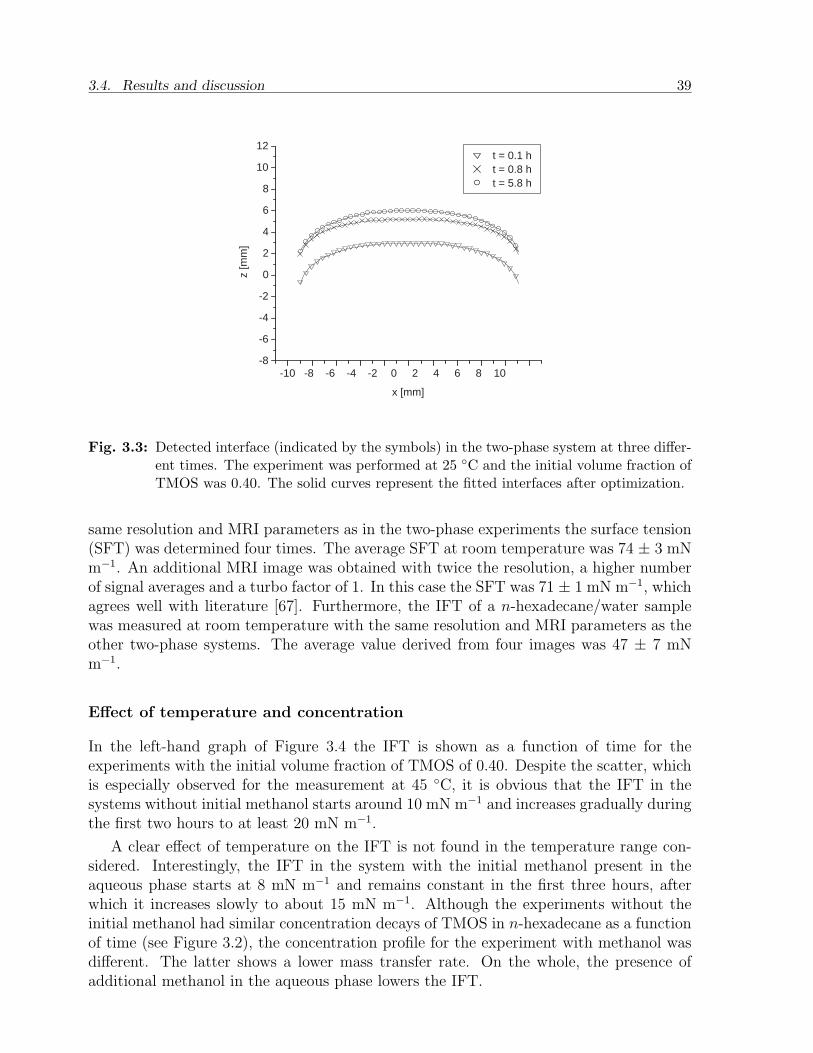
3.4. Results and discussion 39
-10 -8 -6 -4 -2 0 2 4 6 8 10 -8
-6
-4
-2
0
2
4
6
8
10
12
z [m
m]
x [mm]
t = 0.1 h t = 0.8 h t = 5.8 h
Fig. 3.3: Detected interface (indicated by the symbols) in the two-phase system at three differ-ent times. The experiment was performed at 25 C and the initial volume fraction ofTMOS was 0.40. The solid curves represent the fitted interfaces after optimization.
same resolution and MRI parameters as in the two-phase experiments the surface tension(SFT) was determined four times. The average SFT at room temperature was 74 ± 3 mNm−1. An additional MRI image was obtained with twice the resolution, a higher numberof signal averages and a turbo factor of 1. In this case the SFT was 71 ± 1 mN m−1, whichagrees well with literature [67]. Furthermore, the IFT of a n-hexadecane/water samplewas measured at room temperature with the same resolution and MRI parameters as theother two-phase systems. The average value derived from four images was 47 ± 7 mNm−1.
Effect of temperature and concentration
In the left-hand graph of Figure 3.4 the IFT is shown as a function of time for theexperiments with the initial volume fraction of TMOS of 0.40. Despite the scatter, whichis especially observed for the measurement at 45 C, it is obvious that the IFT in thesystems without initial methanol starts around 10 mN m−1 and increases gradually duringthe first two hours to at least 20 mN m−1.
A clear effect of temperature on the IFT is not found in the temperature range con-sidered. Interestingly, the IFT in the system with the initial methanol present in theaqueous phase starts at 8 mN m−1 and remains constant in the first three hours, afterwhich it increases slowly to about 15 mN m−1. Although the experiments without theinitial methanol had similar concentration decays of TMOS in n-hexadecane as a functionof time (see Figure 3.2), the concentration profile for the experiment with methanol wasdifferent. The latter shows a lower mass transfer rate. On the whole, the presence ofadditional methanol in the aqueous phase lowers the IFT.
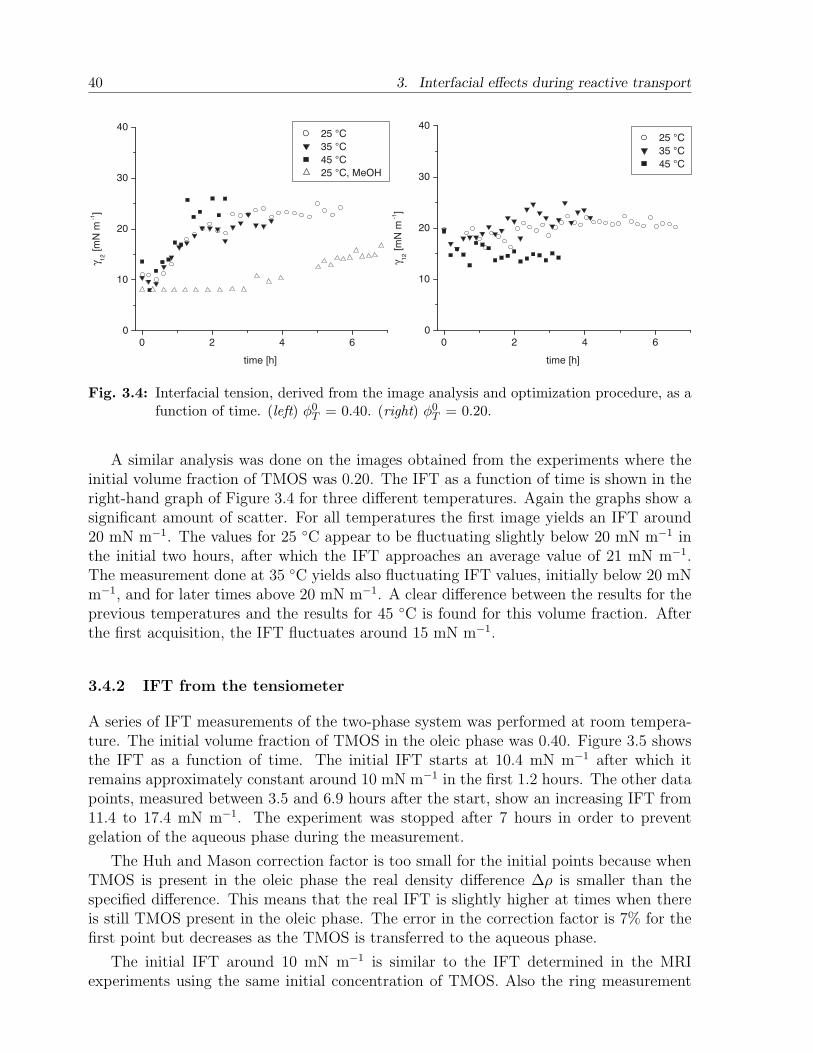
40 3. Interfacial effects during reactive transport
0 2 4 60
10
20
30
40
γ 12 [m
N m
-1]
time [h]
25 °C
35 °C
45 °C
25 °C, MeOH
0 2 4 60
10
20
30
40
γ 12 [
mN
m-1]
time [h]
25 °C
35 °C
45 °C
Fig. 3.4: Interfacial tension, derived from the image analysis and optimization procedure, as afunction of time. (left) φ0
T = 0.40. (right) φ0T = 0.20.
A similar analysis was done on the images obtained from the experiments where theinitial volume fraction of TMOS was 0.20. The IFT as a function of time is shown in theright-hand graph of Figure 3.4 for three different temperatures. Again the graphs show asignificant amount of scatter. For all temperatures the first image yields an IFT around20 mN m−1. The values for 25 C appear to be fluctuating slightly below 20 mN m−1 inthe initial two hours, after which the IFT approaches an average value of 21 mN m−1.The measurement done at 35 C yields also fluctuating IFT values, initially below 20 mNm−1, and for later times above 20 mN m−1. A clear difference between the results for theprevious temperatures and the results for 45 C is found for this volume fraction. Afterthe first acquisition, the IFT fluctuates around 15 mN m−1.
3.4.2 IFT from the tensiometer
A series of IFT measurements of the two-phase system was performed at room tempera-ture. The initial volume fraction of TMOS in the oleic phase was 0.40. Figure 3.5 showsthe IFT as a function of time. The initial IFT starts at 10.4 mN m−1 after which itremains approximately constant around 10 mN m−1 in the first 1.2 hours. The other datapoints, measured between 3.5 and 6.9 hours after the start, show an increasing IFT from11.4 to 17.4 mN m−1. The experiment was stopped after 7 hours in order to preventgelation of the aqueous phase during the measurement.
The Huh and Mason correction factor is too small for the initial points because whenTMOS is present in the oleic phase the real density difference ∆ρ is smaller than thespecified difference. This means that the real IFT is slightly higher at times when thereis still TMOS present in the oleic phase. The error in the correction factor is 7% for thefirst point but decreases as the TMOS is transferred to the aqueous phase.
The initial IFT around 10 mN m−1 is similar to the IFT determined in the MRIexperiments using the same initial concentration of TMOS. Also the ring measurement
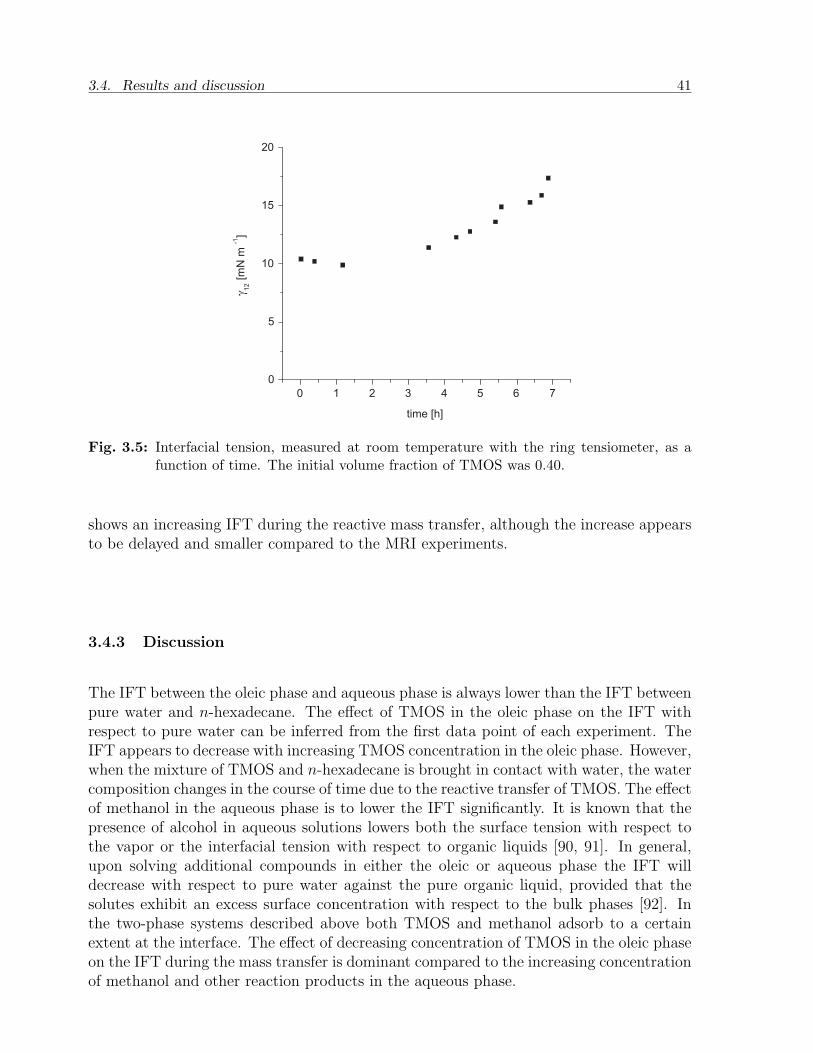
3.4. Results and discussion 41
0 1 2 3 4 5 6 70
5
1 0
1 5
2 0
g 12 [m
N m
-1 ]
t i m e [ h ]
Fig. 3.5: Interfacial tension, measured at room temperature with the ring tensiometer, as afunction of time. The initial volume fraction of TMOS was 0.40.
shows an increasing IFT during the reactive mass transfer, although the increase appearsto be delayed and smaller compared to the MRI experiments.
3.4.3 Discussion
The IFT between the oleic phase and aqueous phase is always lower than the IFT betweenpure water and n-hexadecane. The effect of TMOS in the oleic phase on the IFT withrespect to pure water can be inferred from the first data point of each experiment. TheIFT appears to decrease with increasing TMOS concentration in the oleic phase. However,when the mixture of TMOS and n-hexadecane is brought in contact with water, the watercomposition changes in the course of time due to the reactive transfer of TMOS. The effectof methanol in the aqueous phase is to lower the IFT significantly. It is known that thepresence of alcohol in aqueous solutions lowers both the surface tension with respect tothe vapor or the interfacial tension with respect to organic liquids [90, 91]. In general,upon solving additional compounds in either the oleic or aqueous phase the IFT willdecrease with respect to pure water against the pure organic liquid, provided that thesolutes exhibit an excess surface concentration with respect to the bulk phases [92]. Inthe two-phase systems described above both TMOS and methanol adsorb to a certainextent at the interface. The effect of decreasing concentration of TMOS in the oleic phaseon the IFT during the mass transfer is dominant compared to the increasing concentrationof methanol and other reaction products in the aqueous phase.
42 3. Interfacial effects during reactive transport
3.5 Conclusion
The mass transfer of TMOS in a two-phase bulk system, from the oleic to the aqueousphase, gives rise to a moving interface between the phases. Experiments were previouslydone using MRI to characterize the mass transfer and gel reactions. In this chapter, theMRI images were analyzed in detail. In each image the interface was identified through animage analysis procedure. By optimizing and matching the solution of a calculated modelinterface, assuming quasi-static conditions, the interfacial tension was determined. Theinterfacial tension in the two-phase system increases during the reactive mass transfer,which is clearly observed in the experiments with the high initial TMOS fraction of 0.40.The change in IFT is less pronounced in the experiments with the lower initial TMOSfraction of 0.20. A verification experiment was done, with an initial TMOS concentrationof 0.40, using a ring tensiometer. The trend of increasing IFT during the mass transferwas found with both methods.
Chapter 4
The effect of pH on mass transfer and gelation∗
In the experiments, described in this chapter, TMOS was dissolved in a mineraloil and placed together with heavy water (D2O) in small cylinders. The transferof TMOS from the oleic phase to the aqueous phase was monitored through NMRrelaxation time measurements of hydrogen in the oleic phase, while the rate of gela-tion was measured through NMR relaxation time measurements of deuterium in theaqueous phase. The temperature, the initial concentration of TMOS and the type ofbuffer in the aqueous phase were varied in the experiments. The mass transfer isdriven by the rate of hydrolysis, which increases with temperature. The hydrolysisrate is the lowest at a neutral pH and is the highest at a low pH. In the aqueous phasea sharp decrease in the transverse relaxation time (T2) of 2H is observed which isattributed to the gel reaction. The plateau in T2 indicates the gel transition point.The gel rates increase with increasing temperature and increasing concentration, andare the highest at a neutral pH.
4.1 Introduction
As described in Chapters 2 and 3, the mechanisms of the coupled mass transfer andgelation process of TMOS were analyzed in two-phase bulk systems using dedicated NMRtechniques. TMOS was dissolved in n-hexadecane and placed together with demineralizedwater (H2O) in small cylinders. The concentration of TMOS and the temperature werevaried, and their effect on the mass transfer rate and gelation time was determined.
This chapter describes the results of a second series of bulk phase experiments. Theaim is to further analyse the effect of temperature, concentration, and pH on the reactionand mass transfer rates, which were not captured in the previous experiments. Since thesolubility of TMOS in water plays an important role for the partitioning behavior, theformation of methanol due to hydrolysis is expected to affect the mass transfer process.The rate of both the hydrolysis and the condensation reaction is sensitive to temperature,concentration and pH (see Figure 4.1).
TMOS was dissolved in a mineral oil and placed in small cylinders together with heavywater (D2O) with or without buffer. The transfer of TMOS from the oleic phase to theaqueous phase was monitored through NMR relaxation time measurements of hydrogenin the oleic phase, while the rate of gelation was measured through NMR relaxation timemeasurements of deuterium in the aqueous phase. The bi-nuclear NMR technique consti-tutes an excellent method to characterize both phases independently, and has not been
* Adapted from Castelijns et al. , J. Phys. Chem. B, accepted (2007)
43
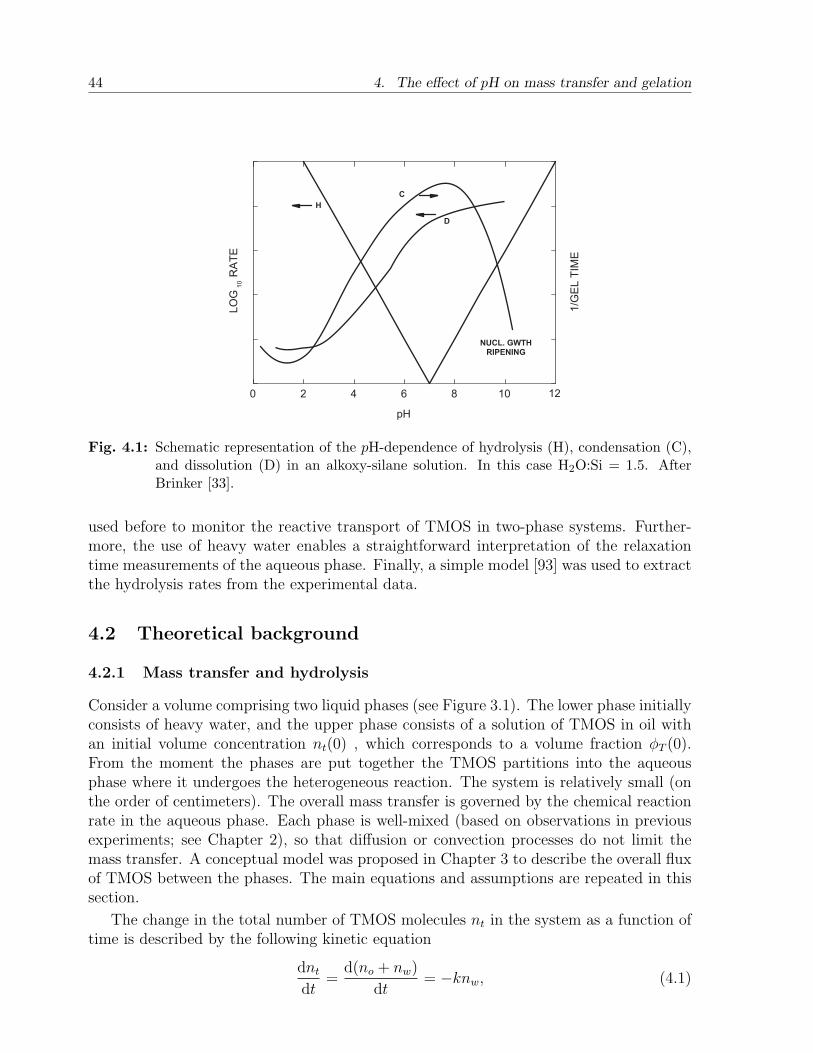
44 4. The effect of pH on mass transfer and gelation
0 2 4 6 8 1 0
LO
G10 RAT
E
1/GE
L TIM
E
p H
N U C L . G W T HR I P E N I N G
HC
D
1 2
Fig. 4.1: Schematic representation of the pH-dependence of hydrolysis (H), condensation (C),and dissolution (D) in an alkoxy-silane solution. In this case H2O:Si = 1.5. AfterBrinker [33].
used before to monitor the reactive transport of TMOS in two-phase systems. Further-more, the use of heavy water enables a straightforward interpretation of the relaxationtime measurements of the aqueous phase. Finally, a simple model [93] was used to extractthe hydrolysis rates from the experimental data.
4.2 Theoretical background
4.2.1 Mass transfer and hydrolysis
Consider a volume comprising two liquid phases (see Figure 3.1). The lower phase initiallyconsists of heavy water, and the upper phase consists of a solution of TMOS in oil withan initial volume concentration nt(0) , which corresponds to a volume fraction φT (0).From the moment the phases are put together the TMOS partitions into the aqueousphase where it undergoes the heterogeneous reaction. The system is relatively small (onthe order of centimeters). The overall mass transfer is governed by the chemical reactionrate in the aqueous phase. Each phase is well-mixed (based on observations in previousexperiments; see Chapter 2), so that diffusion or convection processes do not limit themass transfer. A conceptual model was proposed in Chapter 3 to describe the overall fluxof TMOS between the phases. The main equations and assumptions are repeated in thissection.
The change in the total number of TMOS molecules nt in the system as a function oftime is described by the following kinetic equation
dnt
dt=
d(no + nw)
dt= −knw, (4.1)
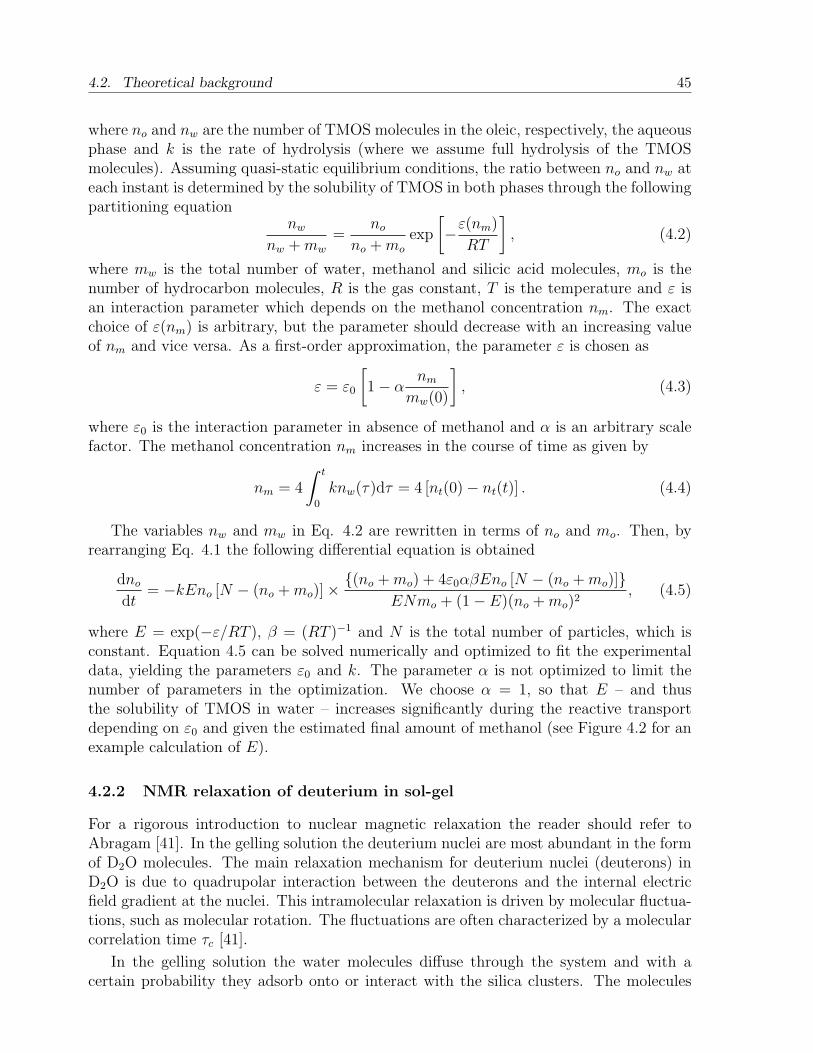
4.2. Theoretical background 45
where no and nw are the number of TMOS molecules in the oleic, respectively, the aqueousphase and k is the rate of hydrolysis (where we assume full hydrolysis of the TMOSmolecules). Assuming quasi-static equilibrium conditions, the ratio between no and nw ateach instant is determined by the solubility of TMOS in both phases through the followingpartitioning equation
nw
nw + mw
=no
no + mo
exp
[−ε(nm)
RT
], (4.2)
where mw is the total number of water, methanol and silicic acid molecules, mo is thenumber of hydrocarbon molecules, R is the gas constant, T is the temperature and ε isan interaction parameter which depends on the methanol concentration nm. The exactchoice of ε(nm) is arbitrary, but the parameter should decrease with an increasing valueof nm and vice versa. As a first-order approximation, the parameter ε is chosen as
ε = ε0
[1− α
nm
mw(0)
], (4.3)
where ε0 is the interaction parameter in absence of methanol and α is an arbitrary scalefactor. The methanol concentration nm increases in the course of time as given by
nm = 4
∫ t
0
knw(τ)dτ = 4 [nt(0)− nt(t)] . (4.4)
The variables nw and mw in Eq. 4.2 are rewritten in terms of no and mo. Then, byrearranging Eq. 4.1 the following differential equation is obtained
dno
dt= −kEno [N − (no + mo)]×
(no + mo) + 4ε0αβEno [N − (no + mo)]ENmo + (1− E)(no + mo)2
, (4.5)
where E = exp(−ε/RT ), β = (RT )−1 and N is the total number of particles, which isconstant. Equation 4.5 can be solved numerically and optimized to fit the experimentaldata, yielding the parameters ε0 and k. The parameter α is not optimized to limit thenumber of parameters in the optimization. We choose α = 1, so that E – and thusthe solubility of TMOS in water – increases significantly during the reactive transportdepending on ε0 and given the estimated final amount of methanol (see Figure 4.2 for anexample calculation of E).
4.2.2 NMR relaxation of deuterium in sol-gel
For a rigorous introduction to nuclear magnetic relaxation the reader should refer toAbragam [41]. In the gelling solution the deuterium nuclei are most abundant in the formof D2O molecules. The main relaxation mechanism for deuterium nuclei (deuterons) inD2O is due to quadrupolar interaction between the deuterons and the internal electricfield gradient at the nuclei. This intramolecular relaxation is driven by molecular fluctua-tions, such as molecular rotation. The fluctuations are often characterized by a molecularcorrelation time τc [41].
In the gelling solution the water molecules diffuse through the system and with acertain probability they adsorb onto or interact with the silica clusters. The molecules
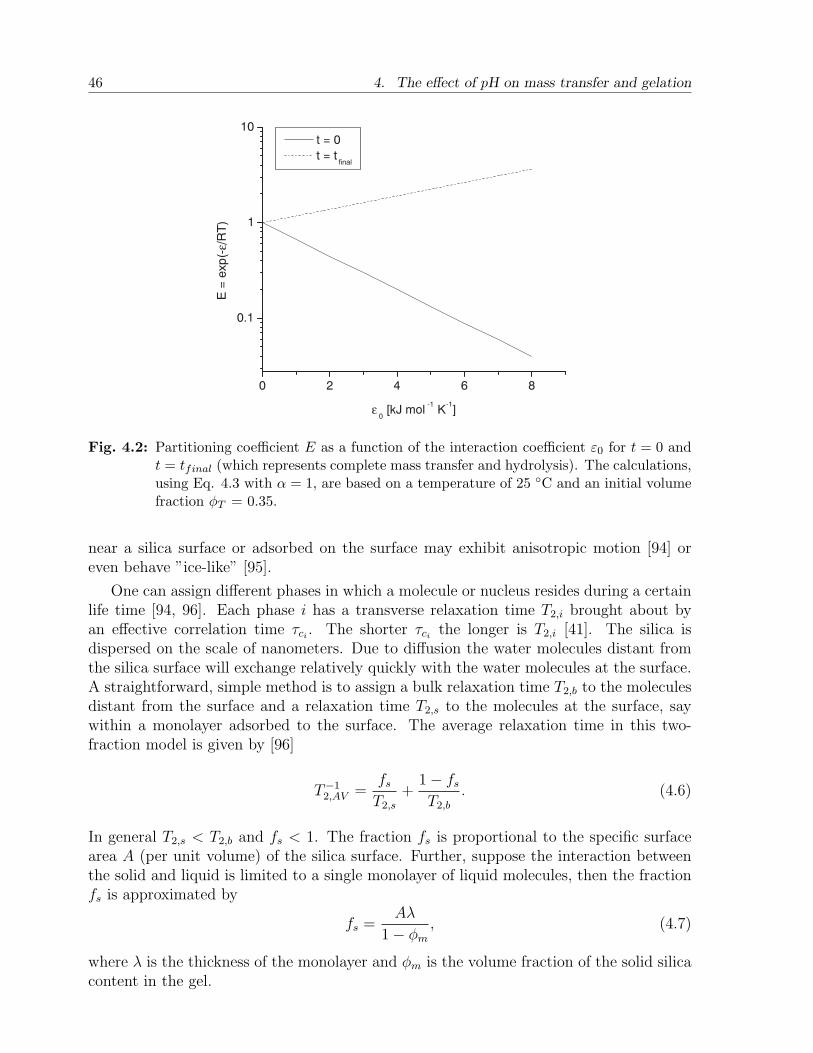
46 4. The effect of pH on mass transfer and gelation
0 2 4 6 8
0.1
1
10 t = 0
t = tfinal
E =
exp
(-ε/R
T)
ε0 [kJ mol
-1 K
-1]
Fig. 4.2: Partitioning coefficient E as a function of the interaction coefficient ε0 for t = 0 andt = tfinal (which represents complete mass transfer and hydrolysis). The calculations,using Eq. 4.3 with α = 1, are based on a temperature of 25 C and an initial volumefraction φT = 0.35.
near a silica surface or adsorbed on the surface may exhibit anisotropic motion [94] oreven behave ”ice-like” [95].
One can assign different phases in which a molecule or nucleus resides during a certainlife time [94, 96]. Each phase i has a transverse relaxation time T2,i brought about byan effective correlation time τci
. The shorter τcithe longer is T2,i [41]. The silica is
dispersed on the scale of nanometers. Due to diffusion the water molecules distant fromthe silica surface will exchange relatively quickly with the water molecules at the surface.A straightforward, simple method is to assign a bulk relaxation time T2,b to the moleculesdistant from the surface and a relaxation time T2,s to the molecules at the surface, saywithin a monolayer adsorbed to the surface. The average relaxation time in this two-fraction model is given by [96]
T−12,AV =
fs
T2,s
+1− fs
T2,b
. (4.6)
In general T2,s < T2,b and fs < 1. The fraction fs is proportional to the specific surfacearea A (per unit volume) of the silica surface. Further, suppose the interaction betweenthe solid and liquid is limited to a single monolayer of liquid molecules, then the fractionfs is approximated by
fs =Aλ
1− φm
, (4.7)
where λ is the thickness of the monolayer and φm is the volume fraction of the solid silicacontent in the gel.
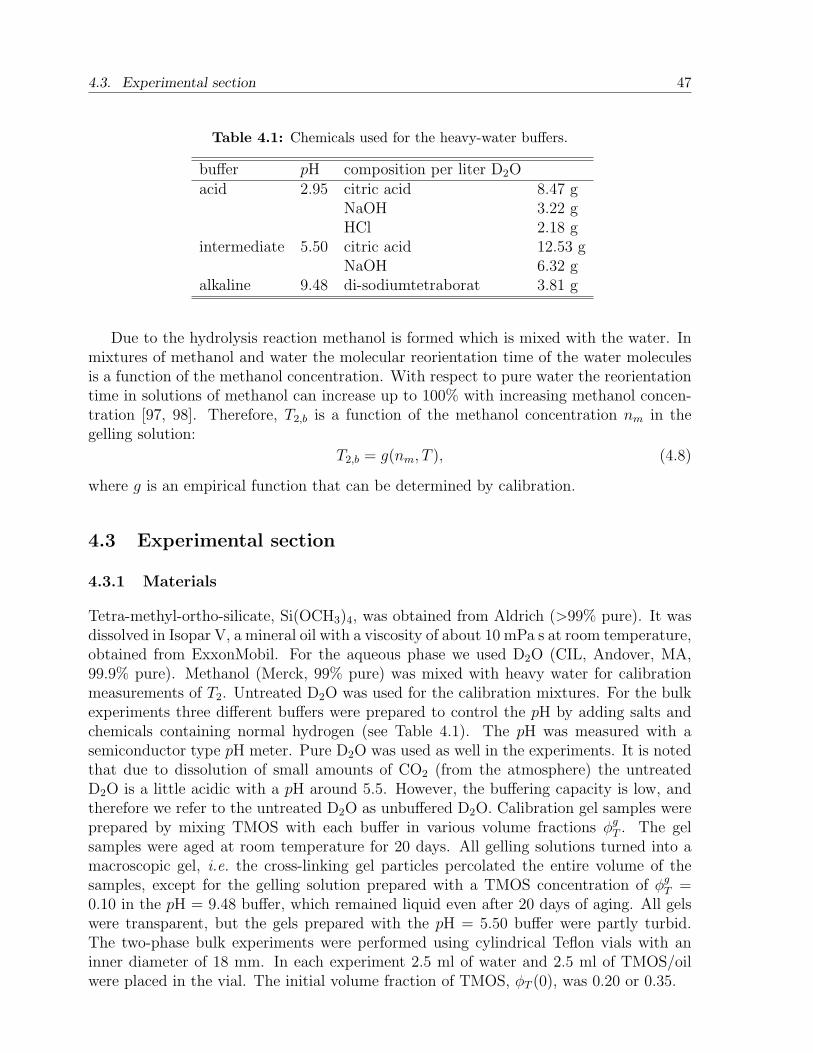
4.3. Experimental section 47
Table 4.1: Chemicals used for the heavy-water buffers.
buffer pH composition per liter D2Oacid 2.95 citric acid 8.47 g
NaOH 3.22 gHCl 2.18 g
intermediate 5.50 citric acid 12.53 gNaOH 6.32 g
alkaline 9.48 di-sodiumtetraborat 3.81 g
Due to the hydrolysis reaction methanol is formed which is mixed with the water. Inmixtures of methanol and water the molecular reorientation time of the water moleculesis a function of the methanol concentration. With respect to pure water the reorientationtime in solutions of methanol can increase up to 100% with increasing methanol concen-tration [97, 98]. Therefore, T2,b is a function of the methanol concentration nm in thegelling solution:
T2,b = g(nm, T ), (4.8)
where g is an empirical function that can be determined by calibration.
4.3 Experimental section
4.3.1 Materials
Tetra-methyl-ortho-silicate, Si(OCH3)4, was obtained from Aldrich (>99% pure). It wasdissolved in Isopar V, a mineral oil with a viscosity of about 10 mPa s at room temperature,obtained from ExxonMobil. For the aqueous phase we used D2O (CIL, Andover, MA,99.9% pure). Methanol (Merck, 99% pure) was mixed with heavy water for calibrationmeasurements of T2. Untreated D2O was used for the calibration mixtures. For the bulkexperiments three different buffers were prepared to control the pH by adding salts andchemicals containing normal hydrogen (see Table 4.1). The pH was measured with asemiconductor type pH meter. Pure D2O was used as well in the experiments. It is notedthat due to dissolution of small amounts of CO2 (from the atmosphere) the untreatedD2O is a little acidic with a pH around 5.5. However, the buffering capacity is low, andtherefore we refer to the untreated D2O as unbuffered D2O. Calibration gel samples wereprepared by mixing TMOS with each buffer in various volume fractions φg
T . The gelsamples were aged at room temperature for 20 days. All gelling solutions turned into amacroscopic gel, i.e. the cross-linking gel particles percolated the entire volume of thesamples, except for the gelling solution prepared with a TMOS concentration of φg
T =0.10 in the pH = 9.48 buffer, which remained liquid even after 20 days of aging. All gelswere transparent, but the gels prepared with the pH = 5.50 buffer were partly turbid.The two-phase bulk experiments were performed using cylindrical Teflon vials with aninner diameter of 18 mm. In each experiment 2.5 ml of water and 2.5 ml of TMOS/oilwere placed in the vial. The initial volume fraction of TMOS, φT (0), was 0.20 or 0.35.
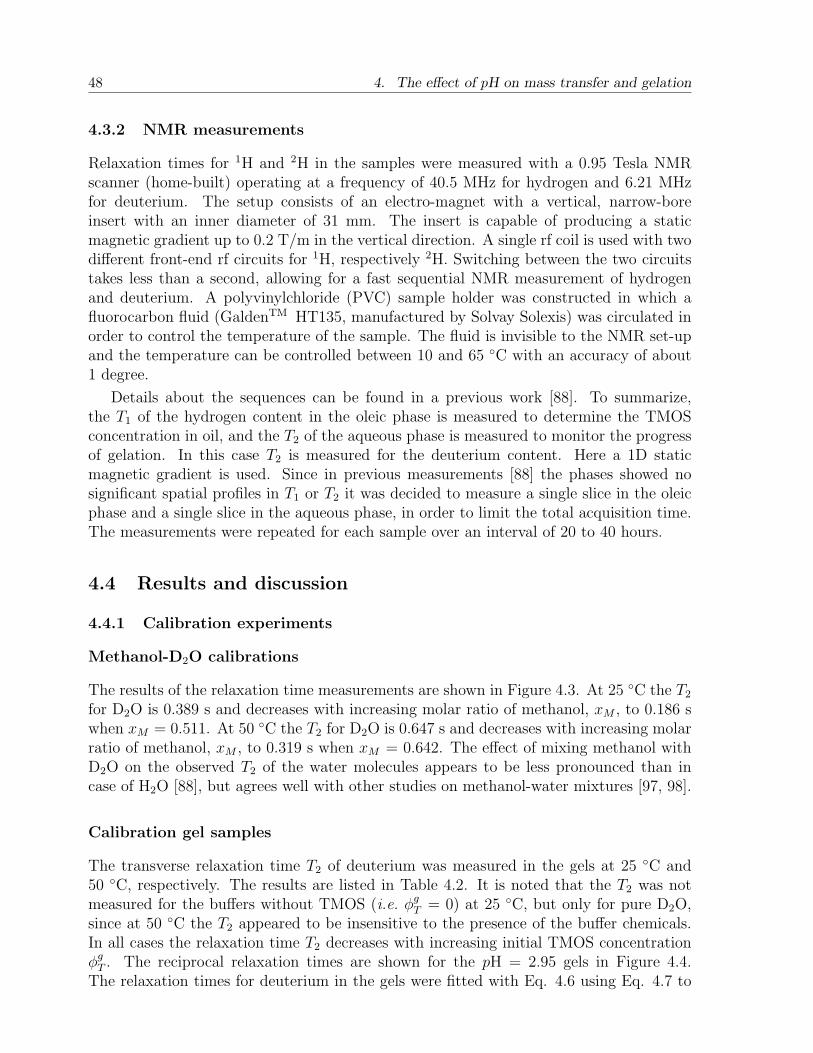
48 4. The effect of pH on mass transfer and gelation
4.3.2 NMR measurements
Relaxation times for 1H and 2H in the samples were measured with a 0.95 Tesla NMRscanner (home-built) operating at a frequency of 40.5 MHz for hydrogen and 6.21 MHzfor deuterium. The setup consists of an electro-magnet with a vertical, narrow-boreinsert with an inner diameter of 31 mm. The insert is capable of producing a staticmagnetic gradient up to 0.2 T/m in the vertical direction. A single rf coil is used with twodifferent front-end rf circuits for 1H, respectively 2H. Switching between the two circuitstakes less than a second, allowing for a fast sequential NMR measurement of hydrogenand deuterium. A polyvinylchloride (PVC) sample holder was constructed in which afluorocarbon fluid (GaldenTM HT135, manufactured by Solvay Solexis) was circulated inorder to control the temperature of the sample. The fluid is invisible to the NMR set-upand the temperature can be controlled between 10 and 65 C with an accuracy of about1 degree.
Details about the sequences can be found in a previous work [88]. To summarize,the T1 of the hydrogen content in the oleic phase is measured to determine the TMOSconcentration in oil, and the T2 of the aqueous phase is measured to monitor the progressof gelation. In this case T2 is measured for the deuterium content. Here a 1D staticmagnetic gradient is used. Since in previous measurements [88] the phases showed nosignificant spatial profiles in T1 or T2 it was decided to measure a single slice in the oleicphase and a single slice in the aqueous phase, in order to limit the total acquisition time.The measurements were repeated for each sample over an interval of 20 to 40 hours.
4.4 Results and discussion
4.4.1 Calibration experiments
Methanol-D2O calibrations
The results of the relaxation time measurements are shown in Figure 4.3. At 25 C the T2
for D2O is 0.389 s and decreases with increasing molar ratio of methanol, xM , to 0.186 swhen xM = 0.511. At 50 C the T2 for D2O is 0.647 s and decreases with increasing molarratio of methanol, xM , to 0.319 s when xM = 0.642. The effect of mixing methanol withD2O on the observed T2 of the water molecules appears to be less pronounced than incase of H2O [88], but agrees well with other studies on methanol-water mixtures [97, 98].
Calibration gel samples
The transverse relaxation time T2 of deuterium was measured in the gels at 25 C and50 C, respectively. The results are listed in Table 4.2. It is noted that the T2 was notmeasured for the buffers without TMOS (i.e. φg
T = 0) at 25 C, but only for pure D2O,since at 50 C the T2 appeared to be insensitive to the presence of the buffer chemicals.In all cases the relaxation time T2 decreases with increasing initial TMOS concentrationφg
T . The reciprocal relaxation times are shown for the pH = 2.95 gels in Figure 4.4.The relaxation times for deuterium in the gels were fitted with Eq. 4.6 using Eq. 4.7 to
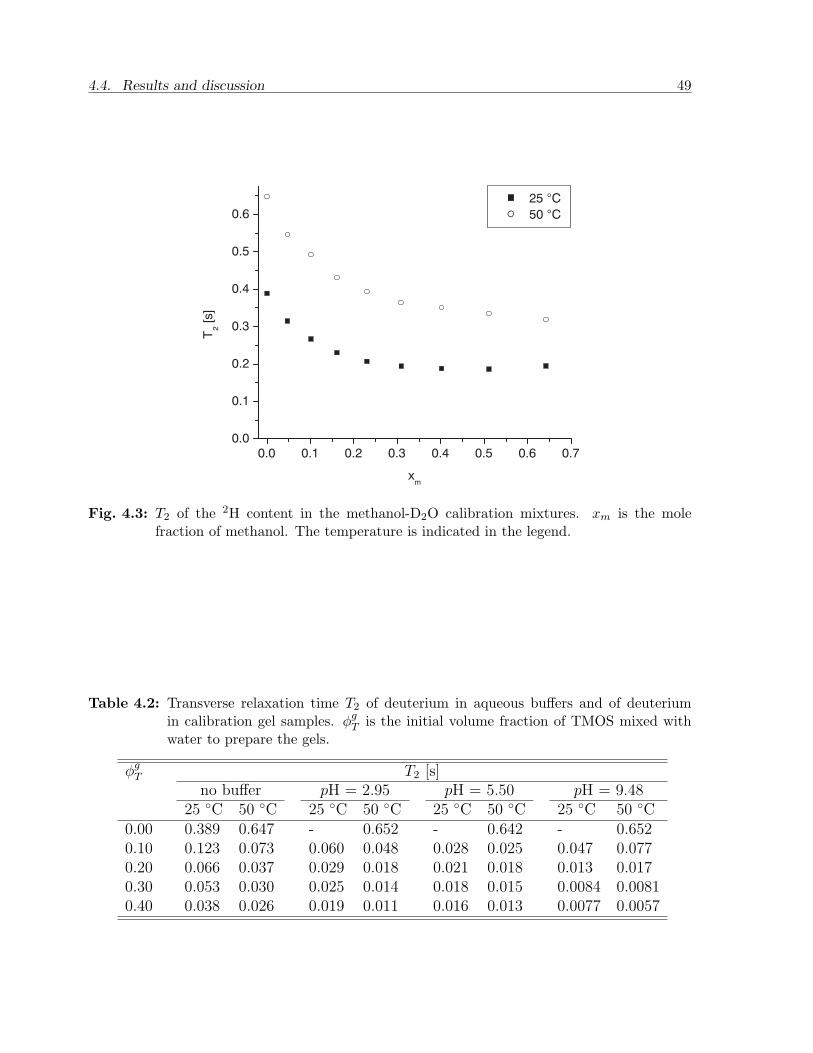
4.4. Results and discussion 49
0.0 0.1 0.2 0.3 0.4 0.5 0.6 0.70.0
0.1
0.2
0.3
0.4
0.5
0.6
25 °C
50 °CT
2 [s]
xm
Fig. 4.3: T2 of the 2H content in the methanol-D2O calibration mixtures. xm is the molefraction of methanol. The temperature is indicated in the legend.
Table 4.2: Transverse relaxation time T2 of deuterium in aqueous buffers and of deuteriumin calibration gel samples. φg
T is the initial volume fraction of TMOS mixed withwater to prepare the gels.
φgT T2 [s]
no buffer pH = 2.95 pH = 5.50 pH = 9.4825 C 50 C 25 C 50 C 25 C 50 C 25 C 50 C
0.00 0.389 0.647 - 0.652 - 0.642 - 0.6520.10 0.123 0.073 0.060 0.048 0.028 0.025 0.047 0.0770.20 0.066 0.037 0.029 0.018 0.021 0.018 0.013 0.0170.30 0.053 0.030 0.025 0.014 0.018 0.015 0.0084 0.00810.40 0.038 0.026 0.019 0.011 0.016 0.013 0.0077 0.0057
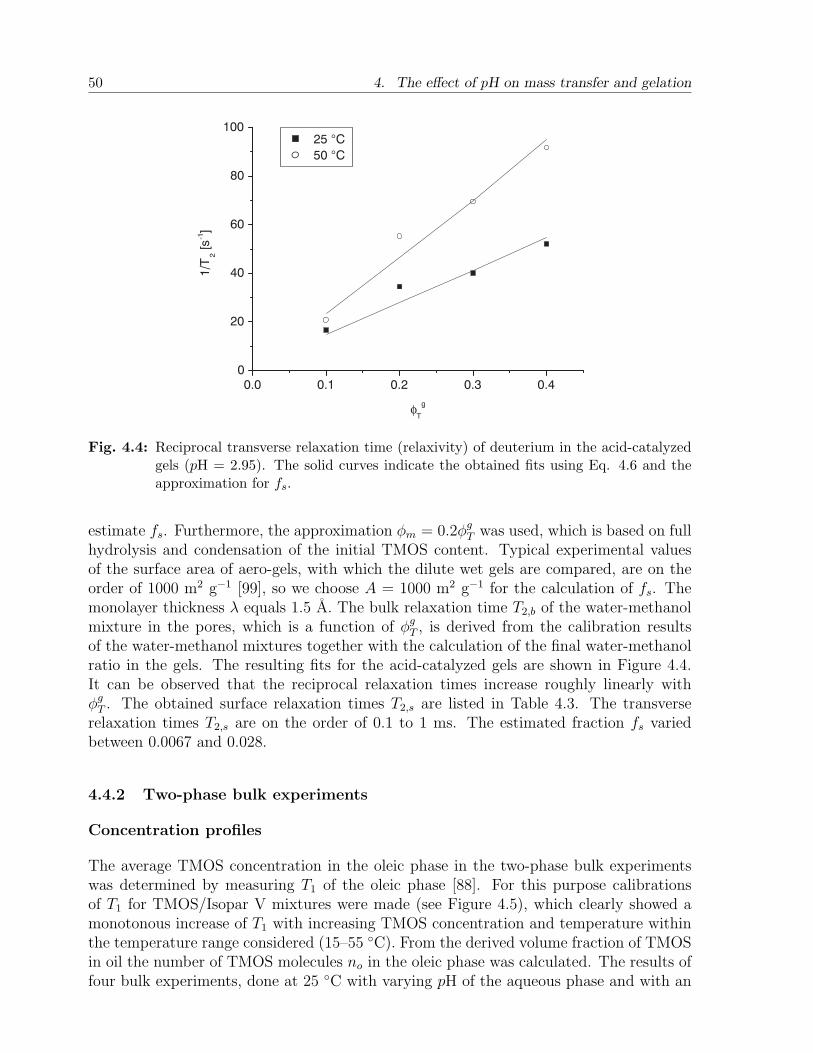
50 4. The effect of pH on mass transfer and gelation
0.0 0.1 0.2 0.3 0.40
20
40
60
80
100
1/T
2 [s
-1]
φT
g
25 °C
50 °C
Fig. 4.4: Reciprocal transverse relaxation time (relaxivity) of deuterium in the acid-catalyzedgels (pH = 2.95). The solid curves indicate the obtained fits using Eq. 4.6 and theapproximation for fs.
estimate fs. Furthermore, the approximation φm = 0.2φgT was used, which is based on full
hydrolysis and condensation of the initial TMOS content. Typical experimental valuesof the surface area of aero-gels, with which the dilute wet gels are compared, are on theorder of 1000 m2 g−1 [99], so we choose A = 1000 m2 g−1 for the calculation of fs. Themonolayer thickness λ equals 1.5 A. The bulk relaxation time T2,b of the water-methanolmixture in the pores, which is a function of φg
T , is derived from the calibration resultsof the water-methanol mixtures together with the calculation of the final water-methanolratio in the gels. The resulting fits for the acid-catalyzed gels are shown in Figure 4.4.It can be observed that the reciprocal relaxation times increase roughly linearly withφg
T . The obtained surface relaxation times T2,s are listed in Table 4.3. The transverserelaxation times T2,s are on the order of 0.1 to 1 ms. The estimated fraction fs variedbetween 0.0067 and 0.028.
4.4.2 Two-phase bulk experiments
Concentration profiles
The average TMOS concentration in the oleic phase in the two-phase bulk experimentswas determined by measuring T1 of the oleic phase [88]. For this purpose calibrationsof T1 for TMOS/Isopar V mixtures were made (see Figure 4.5), which clearly showed amonotonous increase of T1 with increasing TMOS concentration and temperature withinthe temperature range considered (15–55 C). From the derived volume fraction of TMOSin oil the number of TMOS molecules no in the oleic phase was calculated. The results offour bulk experiments, done at 25 C with varying pH of the aqueous phase and with an
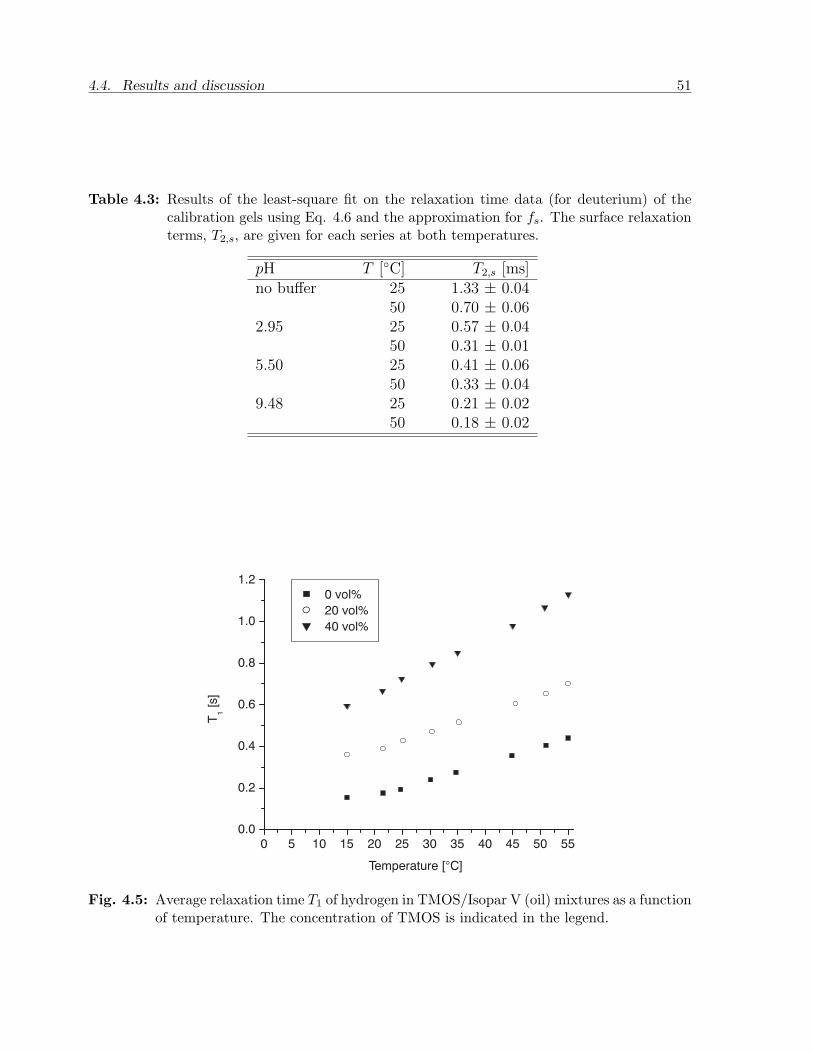
4.4. Results and discussion 51
Table 4.3: Results of the least-square fit on the relaxation time data (for deuterium) of thecalibration gels using Eq. 4.6 and the approximation for fs. The surface relaxationterms, T2,s, are given for each series at both temperatures.
pH T [C] T2,s [ms]no buffer 25 1.33 ± 0.04
50 0.70 ± 0.062.95 25 0.57 ± 0.04
50 0.31 ± 0.015.50 25 0.41 ± 0.06
50 0.33 ± 0.049.48 25 0.21 ± 0.02
50 0.18 ± 0.02
0 5 10 15 20 25 30 35 40 45 50 550.0
0.2
0.4
0.6
0.8
1.0
1.2
0 vol%
20 vol%
40 vol%
T1 [s]
Temperature [°C]
Fig. 4.5: Average relaxation time T1 of hydrogen in TMOS/Isopar V (oil) mixtures as a functionof temperature. The concentration of TMOS is indicated in the legend.
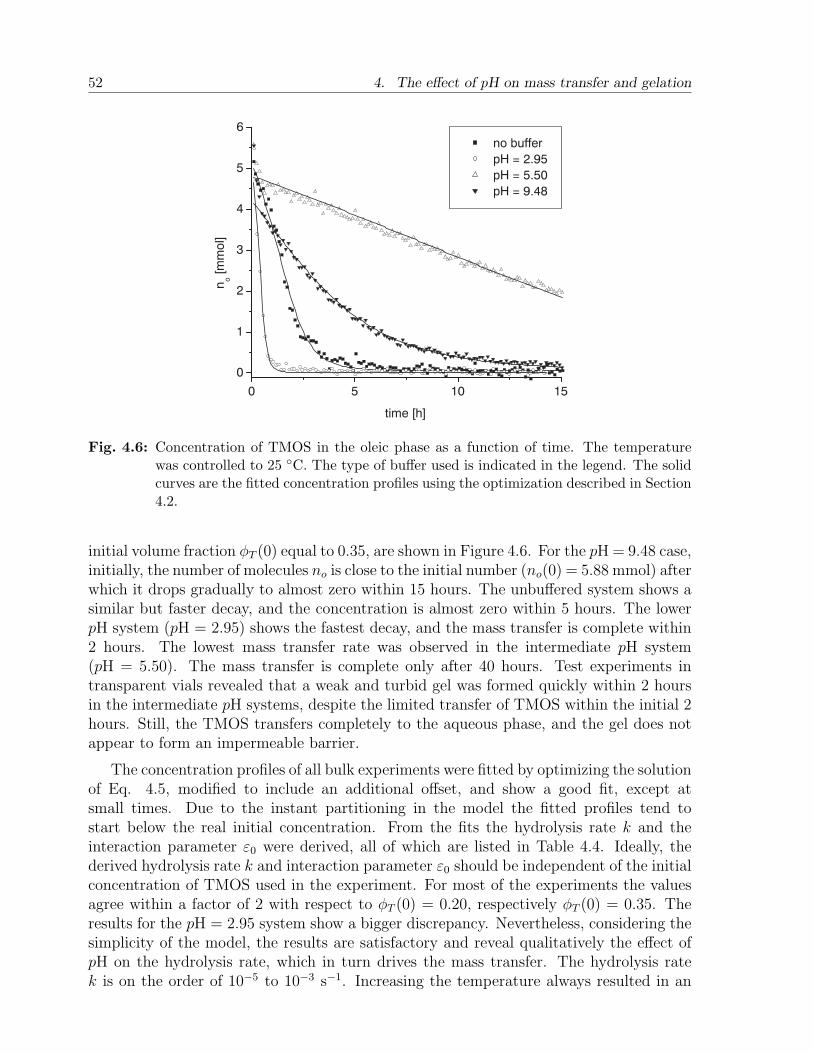
52 4. The effect of pH on mass transfer and gelation
0 5 10 15
0
1
2
3
4
5
6
no buffer
pH = 2.95
pH = 5.50
pH = 9.48
no [m
mol]
time [h]
Fig. 4.6: Concentration of TMOS in the oleic phase as a function of time. The temperaturewas controlled to 25 C. The type of buffer used is indicated in the legend. The solidcurves are the fitted concentration profiles using the optimization described in Section4.2.
initial volume fraction φT (0) equal to 0.35, are shown in Figure 4.6. For the pH = 9.48 case,initially, the number of molecules no is close to the initial number (no(0) = 5.88 mmol) afterwhich it drops gradually to almost zero within 15 hours. The unbuffered system shows asimilar but faster decay, and the concentration is almost zero within 5 hours. The lowerpH system (pH = 2.95) shows the fastest decay, and the mass transfer is complete within2 hours. The lowest mass transfer rate was observed in the intermediate pH system(pH = 5.50). The mass transfer is complete only after 40 hours. Test experiments intransparent vials revealed that a weak and turbid gel was formed quickly within 2 hoursin the intermediate pH systems, despite the limited transfer of TMOS within the initial 2hours. Still, the TMOS transfers completely to the aqueous phase, and the gel does notappear to form an impermeable barrier.
The concentration profiles of all bulk experiments were fitted by optimizing the solutionof Eq. 4.5, modified to include an additional offset, and show a good fit, except atsmall times. Due to the instant partitioning in the model the fitted profiles tend tostart below the real initial concentration. From the fits the hydrolysis rate k and theinteraction parameter ε0 were derived, all of which are listed in Table 4.4. Ideally, thederived hydrolysis rate k and interaction parameter ε0 should be independent of the initialconcentration of TMOS used in the experiment. For most of the experiments the valuesagree within a factor of 2 with respect to φT (0) = 0.20, respectively φT (0) = 0.35. Theresults for the pH = 2.95 system show a bigger discrepancy. Nevertheless, considering thesimplicity of the model, the results are satisfactory and reveal qualitatively the effect ofpH on the hydrolysis rate, which in turn drives the mass transfer. The hydrolysis ratek is on the order of 10−5 to 10−3 s−1. Increasing the temperature always resulted in an
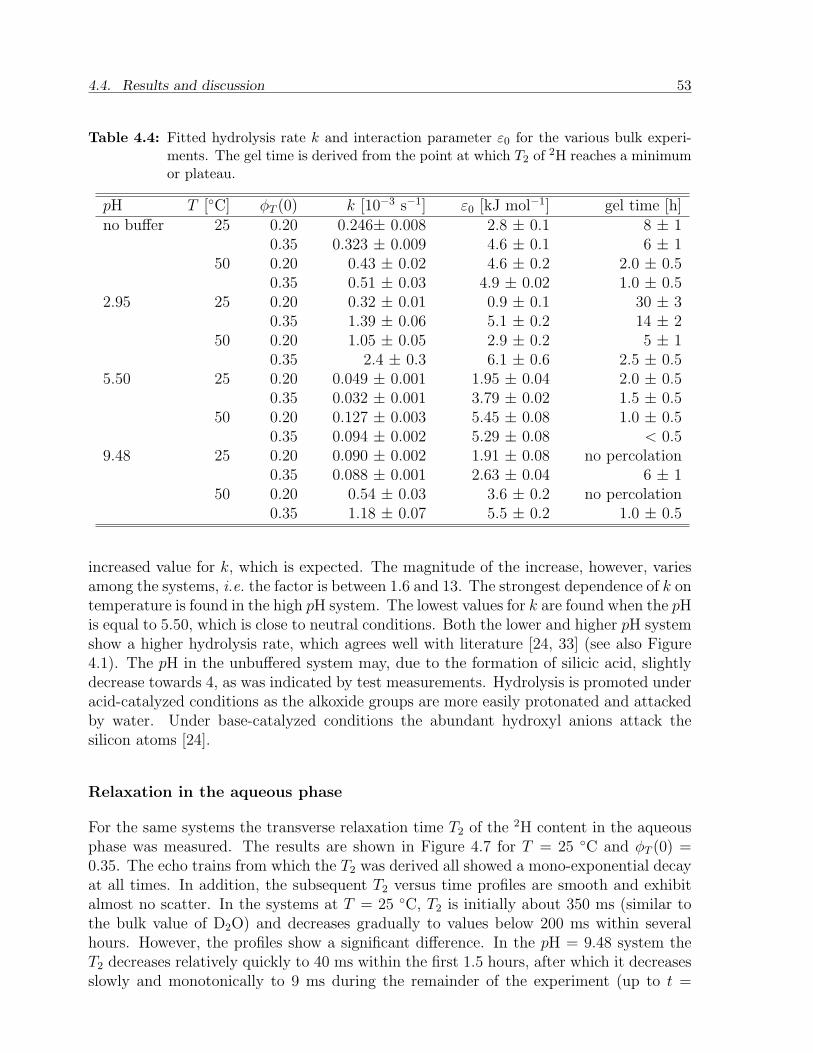
4.4. Results and discussion 53
Table 4.4: Fitted hydrolysis rate k and interaction parameter ε0 for the various bulk experi-ments. The gel time is derived from the point at which T2 of 2H reaches a minimumor plateau.
pH T [C] φT (0) k [10−3 s−1] ε0 [kJ mol−1] gel time [h]no buffer 25 0.20 0.246± 0.008 2.8 ± 0.1 8 ± 1
0.35 0.323 ± 0.009 4.6 ± 0.1 6 ± 150 0.20 0.43 ± 0.02 4.6 ± 0.2 2.0 ± 0.5
0.35 0.51 ± 0.03 4.9 ± 0.02 1.0 ± 0.52.95 25 0.20 0.32 ± 0.01 0.9 ± 0.1 30 ± 3
0.35 1.39 ± 0.06 5.1 ± 0.2 14 ± 250 0.20 1.05 ± 0.05 2.9 ± 0.2 5 ± 1
0.35 2.4 ± 0.3 6.1 ± 0.6 2.5 ± 0.55.50 25 0.20 0.049 ± 0.001 1.95 ± 0.04 2.0 ± 0.5
0.35 0.032 ± 0.001 3.79 ± 0.02 1.5 ± 0.550 0.20 0.127 ± 0.003 5.45 ± 0.08 1.0 ± 0.5
0.35 0.094 ± 0.002 5.29 ± 0.08 < 0.59.48 25 0.20 0.090 ± 0.002 1.91 ± 0.08 no percolation
0.35 0.088 ± 0.001 2.63 ± 0.04 6 ± 150 0.20 0.54 ± 0.03 3.6 ± 0.2 no percolation
0.35 1.18 ± 0.07 5.5 ± 0.2 1.0 ± 0.5
increased value for k, which is expected. The magnitude of the increase, however, variesamong the systems, i.e. the factor is between 1.6 and 13. The strongest dependence of k ontemperature is found in the high pH system. The lowest values for k are found when the pHis equal to 5.50, which is close to neutral conditions. Both the lower and higher pH systemshow a higher hydrolysis rate, which agrees well with literature [24, 33] (see also Figure4.1). The pH in the unbuffered system may, due to the formation of silicic acid, slightlydecrease towards 4, as was indicated by test measurements. Hydrolysis is promoted underacid-catalyzed conditions as the alkoxide groups are more easily protonated and attackedby water. Under base-catalyzed conditions the abundant hydroxyl anions attack thesilicon atoms [24].
Relaxation in the aqueous phase
For the same systems the transverse relaxation time T2 of the 2H content in the aqueousphase was measured. The results are shown in Figure 4.7 for T = 25 C and φT (0) =0.35. The echo trains from which the T2 was derived all showed a mono-exponential decayat all times. In addition, the subsequent T2 versus time profiles are smooth and exhibitalmost no scatter. In the systems at T = 25 C, T2 is initially about 350 ms (similar tothe bulk value of D2O) and decreases gradually to values below 200 ms within severalhours. However, the profiles show a significant difference. In the pH = 9.48 system theT2 decreases relatively quickly to 40 ms within the first 1.5 hours, after which it decreasesslowly and monotonically to 9 ms during the remainder of the experiment (up to t =
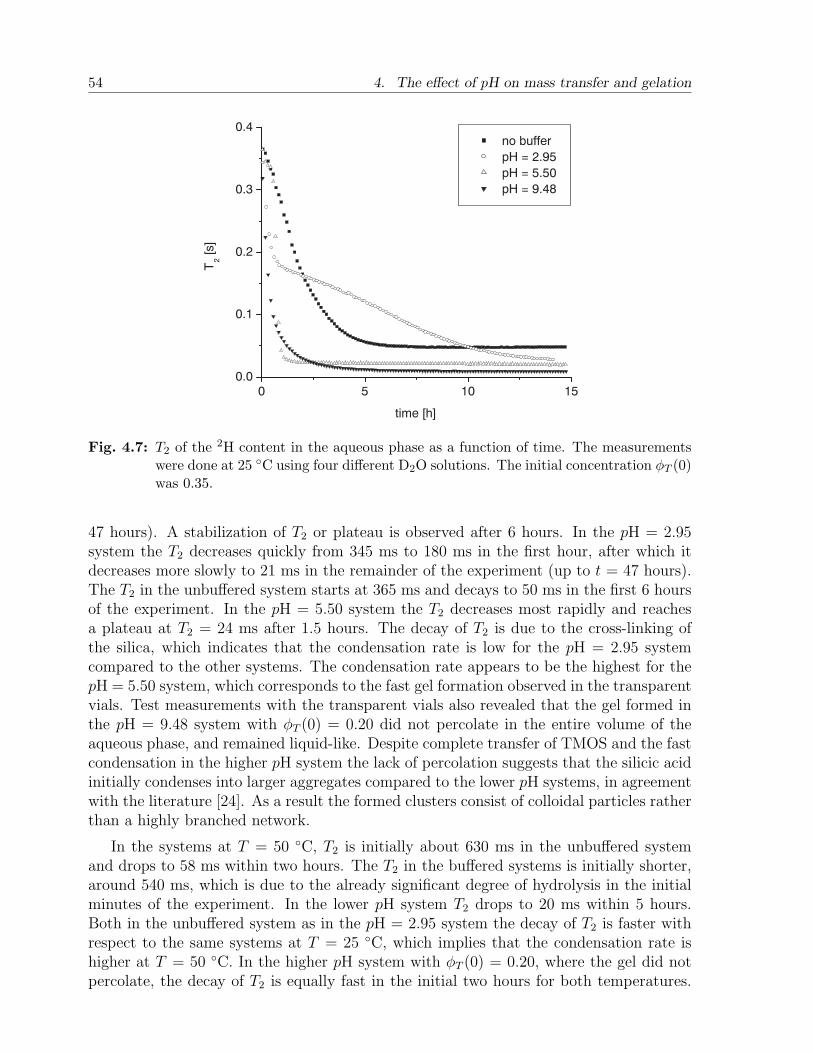
54 4. The effect of pH on mass transfer and gelation
0 5 10 150.0
0.1
0.2
0.3
0.4 no buffer
pH = 2.95
pH = 5.50
pH = 9.48
T2 [
s]
time [h]
Fig. 4.7: T2 of the 2H content in the aqueous phase as a function of time. The measurementswere done at 25 C using four different D2O solutions. The initial concentration φT (0)was 0.35.
47 hours). A stabilization of T2 or plateau is observed after 6 hours. In the pH = 2.95system the T2 decreases quickly from 345 ms to 180 ms in the first hour, after which itdecreases more slowly to 21 ms in the remainder of the experiment (up to t = 47 hours).The T2 in the unbuffered system starts at 365 ms and decays to 50 ms in the first 6 hoursof the experiment. In the pH = 5.50 system the T2 decreases most rapidly and reachesa plateau at T2 = 24 ms after 1.5 hours. The decay of T2 is due to the cross-linking ofthe silica, which indicates that the condensation rate is low for the pH = 2.95 systemcompared to the other systems. The condensation rate appears to be the highest for thepH = 5.50 system, which corresponds to the fast gel formation observed in the transparentvials. Test measurements with the transparent vials also revealed that the gel formed inthe pH = 9.48 system with φT (0) = 0.20 did not percolate in the entire volume of theaqueous phase, and remained liquid-like. Despite complete transfer of TMOS and the fastcondensation in the higher pH system the lack of percolation suggests that the silicic acidinitially condenses into larger aggregates compared to the lower pH systems, in agreementwith the literature [24]. As a result the formed clusters consist of colloidal particles ratherthan a highly branched network.
In the systems at T = 50 C, T2 is initially about 630 ms in the unbuffered systemand drops to 58 ms within two hours. The T2 in the buffered systems is initially shorter,around 540 ms, which is due to the already significant degree of hydrolysis in the initialminutes of the experiment. In the lower pH system T2 drops to 20 ms within 5 hours.Both in the unbuffered system as in the pH = 2.95 system the decay of T2 is faster withrespect to the same systems at T = 25 C, which implies that the condensation rate ishigher at T = 50 C. In the higher pH system with φT (0) = 0.20, where the gel did notpercolate, the decay of T2 is equally fast in the initial two hours for both temperatures.
4.5. Conclusion 55
However, the final value of T2 is much higher at T = 50 C, which indicates that therelaxation behavior is similar to that of a normal liquid. Although the calibration gelswere aged for 20 days, the final values of T2 in the bulk experiments agree well with thoseof the calibration gels, and show a similar dependence of T2 on pH and temperature.
It was found in a previous work [88] that a minimum (plateau) in T2, for 1H in H2Oin that case, corresponded with macroscopic gelation of the aqueous phase as determinedby tilting test tube experiments [88]. Similar experiments using systems of equivalentdimensions were done here at 35 C to confirm the relation between the gel transition andthe minimum (plateau) in T2 for 2H. Again, a good agreement was found and thereforethe point at which the minimum or plateau in T2 is found is used to derive the gel time.The results are listed in Table 4.4. The gel time varies between 0.5 and 30 hours. Theshortest gel times are found for the pH = 5.50 system followed by the unbuffered systemand the pH = 9.48 system. The longest gel times are found for the pH = 2.95 system.Slow condensation rates are expected when the pH is close to 2.5, which corresponds tothe isoelectric point of silica [24, 33]. The gel time decreases roughly by a factor two whenφT (0) = 0.35 compared to the case when φT (0) = 0.20. Increasing the temperature from25 to 50 C results in a reduction of the gel time of at least 50%. The effect of pH onthe reaction rates was only determined for a limited set of buffers (chemicals). Preparingthe buffers with other chemicals or concentrations is likely to quantitatively influence theresults [33].
4.5 Conclusion
The mechanisms of coupled mass transfer and gel reaction of TMOS in the two phasesystems were revealed using a combined 1H and 2H NMR technique. The pH of theaqueous phase is the main parameter that affects the mass transfer and the gelationrates. The mass transfer of TMOS is driven by the rate of hydrolysis. Around pH = 6the rate is minimum, whereas the hydrolysis rates, and thus the mass transfer rates, areincreased in the acid- and base-catalyzed systems (due to enhanced protonation of TMOSunder acid conditions, respectively, enhanced attack by hydroxyl anions under alkalineconditions). At a temperature of 50 C the rates are increased by a factor between 1.6and 13 with respect to a temperature of 25 C, depending on the pH used. The T2 of thecalibration gels decreases with increasing initial TMOS content in the gelling solutions.The differences in T2 for a given concentration among the various series, prepared with thedifferent buffers, can be explained by the pH, which influences the microscopic structure ofthe silica gel. The gel transition times, derived from the T2 versus time profiles revealedthat the gelation rates were the highest for the pH = 5.50 systems (gel time on theorder of 1 hour), and the lowest for the pH = 2.95 systems (gel time up to 30 hours).Slow condensation rates are expected when the pH is close to 2.5, which corresponds tothe isoelectric point of silica. Increasing the temperature from 25 to 50 C results in areduction of the gel time of at least 50%.

56 4. The effect of pH on mass transfer and gelation
Chapter 5
Cross-linking of silica with a time-dependent
monomer source
In this chapter the cross-linking of the hydrolyzed TMOS molecules is consideredand described using a simple population balance model. The mass transfer of themolecules from the oleic to the aqueous phase and the hydrolysis step were includedin the form of a time-dependent monomer source. Gel transition times were predictedbased on the critical behavior of the weight-average molecular weight of the species.Average structural properties of the silica aggregates in the gelling stage were derived.The results were used to predict the transverse relaxation time T2 of the aqueousphase, which is typically measured in the NMR experiments.
5.1 Introduction
In sol-gel processing a solution of reactive monomers or colloids changes into a gel due toaggregation of the particles into larger clusters and networks. Macroscopically, the sol-geltransition occurs when the network percolates to span the entire volume of the system[100]. This transition is generally manifested by a sharp change in rheological properties,i.e. the bulk viscosity increases over several orders of magnitude [101, 102].
The aggregation of particles into clusters and fractal structures has been studied anddescribed extensively [24]. Numerical models typically comprise the simulation of trajecto-ries and aggregation of diffusing particles in two or three dimensions. In diffusion limitedcluster-cluster aggregation models (DLCCA) the particles or clusters combine directlyupon contact [103, 104]. Reaction limited cluster-cluster aggregation models (RLCCA)are similar, except that the particles only combine with a finite probability [103]. Thefluctuating bond aggregation (FBA) model, which is an extension to the DLCCA model,incorporates the flexibility of the formed clusters [105]. The flexibility depends on thetype of catalyst present in the sol-gel [106]. The numerical models mentioned typicallyyield the fractal dimension, the correlation lengths, percolation time, etc.
Population balance models describe the evolution of a molecular-weight distributionthat characterizes a system of cross-linking particles. For a discrete distribution theevolution of the number of each species with a particular weight can be calculated usinga kinetic equation such as the Smoluchowski equation [107, 108]. Li and McCoy proposedan elaborate model for the cross-linking of reactive species which includes the degree ofcross-linking in addition to the molecular-weight balance [109].
In this chapter the aim is to describe the aggregation of hydrolyzed TMOS monomersand the evolution of the aggregates and clusters in the aqueous phase as the precursor
57
58 5. Cross-linking of silica with a time-dependent monomer source
monomers are transferred from the oleic to the aqueous phase. We develop an algebraicmodel based on a population balance of polymeric species [110, 111]. The mass transfer ofthe molecules from the oleic to the aqueous phase and the hydrolysis step are included inthe form of a time-dependent monomer source. A concise set of equations is obtained thatcan be solved analytically only for a limited set of parameters, but in many cases needs tobe solved numerically. The evolution in the population balance is used to predict certaincharacteristics of the gelling solution, like effective surface area, and cluster mobility. Inaddition, the gel transition times are obtained for a set of representative systems. Finally,the transverse relaxation time (T2) of the water molecules present in the gel, which istypically measured in experiments involving NMR (see Chapter 4), is considered. A simplemodel is proposed to predict the average transverse relaxation time T2 of the deuteriumnuclei of the water molecules due to their interaction with the gelling silica content. Theaverage T2 decays in time due to the increasing silica content and increasing cluster size.The effect of pH and temperature on the reaction rates, and hence on the T2 profiles, wasmodeled. The results agree qualitatively with previously obtained experimental results.
5.2 Theory
5.2.1 Mass transfer and hydrolysis
We consider again a volume consisting of two liquid phases which are in contact butseparated by an interface (see also Section 3.2.1). Phase 1 initially consists of (heavy)water, and phase 2 consists of a solution of TMOS in oil with an initial concentrationnt(0) = n0. The system is shown in Figure 3.1. As the phases are put together the TMOSpartitions into the aqueous phase in which it undergoes a heterogeneous sol-gel reaction.The overall mass transfer is governed by the hydrolysis rate in the aqueous phase. Eachphase is well-mixed and diffusion or convection processes do not limit the mass transfer.
The total number of TMOS molecules nt in the system decreases in the course of timedue to the hydrolysis reaction. The change is described by the following kinetic equation
dnt
dt=
d(no + nw)
dt= −knw, (5.1)
where no and nw are the number of TMOS molecules in the oleic, respectively, the aqueousphase and k is the rate of hydrolysis (where we assume full hydrolysis of the TMOSmolecules). The methanol concentration nm increases in the course of time as given by
nm(t) = 4
∫ t
0
knw(τ)dτ = 4 [nt(0)− nt(t)] . (5.2)
Here we are only concerned with the typical profiles for nw and nm in the aqueous phase.The TMOS concentration in oil, no, is modeled as a simple empirical function. Theexperiments showed (see Chapter 2) that the concentration no(t) can be adequately ap-proximated by an exponential decay function
no(t) = nt(0) exp(−αT t), (5.3)
5.2. Theory 59
where αT is a coefficient indicating the rate of transfer. Since the mass transfer rate iscontrolled by the solubility of TMOS in water, and therefore by the formation of methanolin water, the coefficient αT should increase with increasing k and vice versa. From Eqs.5.1, 5.2 and 5.3 it follows that
nw(t) = nt(0)αT
k − αT
[exp(−αT t)− exp(−kt)] , (5.4)
nm(t) = 4nt(0)
1− αT
k − αT
[(1 +
k − αT
αT
)exp(−αT t)− exp(−kt)
]. (5.5)
It is noted that Eqs. 5.4 and 5.5 do not diverge when αT = k. For any nonzero αT
and k the profile of nw(t) resembles that of a distorted bell-shaped curve, and nm is amonotonically increasing function of t. In the following the formed amount of silicic aciddue to hydrolysis is represented by ns. The consumption of silicic acid due to condensationis not reflected in ns, so that
ns(t) = 4nm(t). (5.6)
5.2.2 Population balance model
General equations
Let P (x) denote a continuous distribution of molecules with weight x at a certain instant.In case of irreversible aggregation the reaction between two aggregates or larger clusters(see Figure 5.1) is represented by
P (x) + P (x′)kp−→ P (x + x′), (5.7)
where the reaction rate kp should be an increasing function of the molecular sizes orweights. A general rate kernel is defined as [111]
kp(x, x′) = κ(xx′)ν , (5.8)
where κ is a constant and ν is a value between 0 and 1. Next, let p(x, t)dx be theconcentration of molecules at time t with molecular weight in the range (x, x + dx). Thepopulation balance equation can be written as (based on Ref. [111])
∂p(x, t)
∂t= −2κxνp(x)p[ν] + κ
∫ x
0
(x′)ν(x− x′)νp(x− x′)p(x′)dx′ + S, (5.9)
where the bulk moment p[n] is defined as
p[n] =
∫ ∞
0
xnp(x)dx, (5.10)
and the source term S is due to the hydrolysis of TMOS into silicic acid monomers, givenby
S = knw(t)δ(x− xm), (5.11)
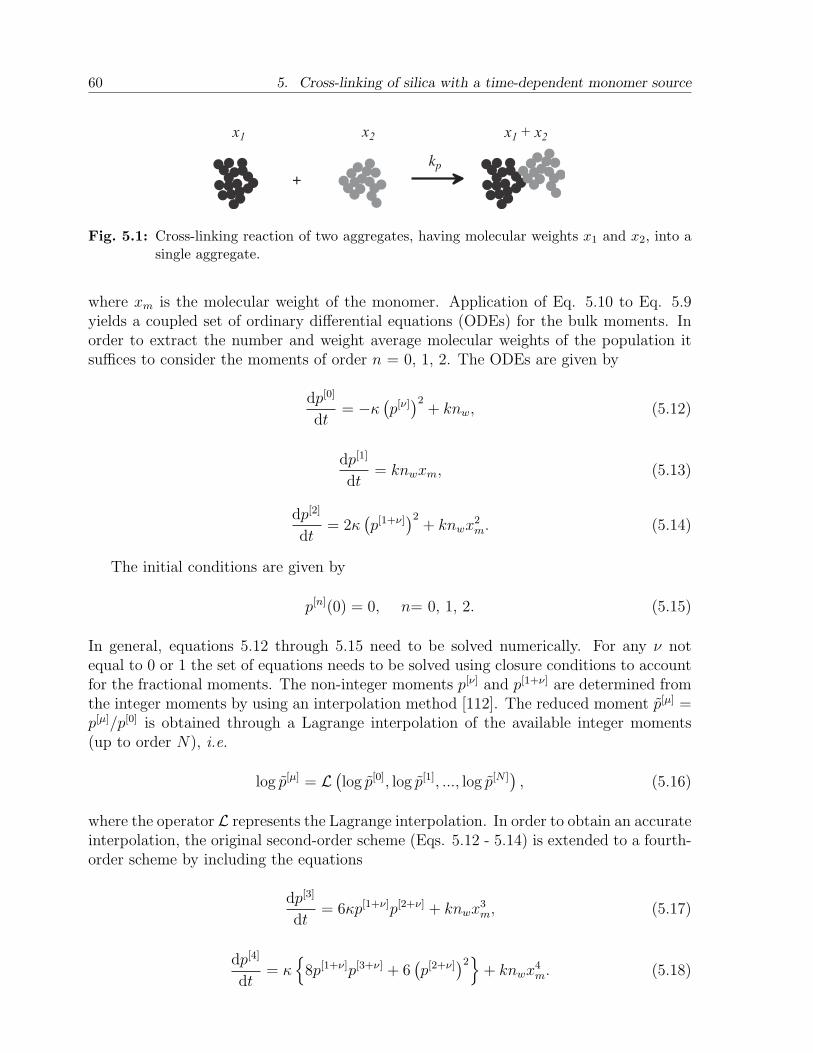
60 5. Cross-linking of silica with a time-dependent monomer source
+
kp
Fig. 5.1: Cross-linking reaction of two aggregates, having molecular weights x1 and x2, into asingle aggregate.
where xm is the molecular weight of the monomer. Application of Eq. 5.10 to Eq. 5.9yields a coupled set of ordinary differential equations (ODEs) for the bulk moments. Inorder to extract the number and weight average molecular weights of the population itsuffices to consider the moments of order n = 0, 1, 2. The ODEs are given by
dp[0]
dt= −κ
(p[ν])2
+ knw, (5.12)
dp[1]
dt= knwxm, (5.13)
dp[2]
dt= 2κ
(p[1+ν]
)2+ knwx2
m. (5.14)
The initial conditions are given by
p[n](0) = 0, n= 0, 1, 2. (5.15)
In general, equations 5.12 through 5.15 need to be solved numerically. For any ν notequal to 0 or 1 the set of equations needs to be solved using closure conditions to accountfor the fractional moments. The non-integer moments p[ν] and p[1+ν] are determined fromthe integer moments by using an interpolation method [112]. The reduced moment p[µ] =p[µ]/p[0] is obtained through a Lagrange interpolation of the available integer moments(up to order N), i.e.
log p[µ] = L(log p[0], log p[1], ..., log p[N ]
), (5.16)
where the operator L represents the Lagrange interpolation. In order to obtain an accurateinterpolation, the original second-order scheme (Eqs. 5.12 - 5.14) is extended to a fourth-order scheme by including the equations
dp[3]
dt= 6κp[1+ν]p[2+ν] + knwx3
m, (5.17)
dp[4]
dt= κ
8p[1+ν]p[3+ν] + 6
(p[2+ν]
)2+ knwx4
m. (5.18)
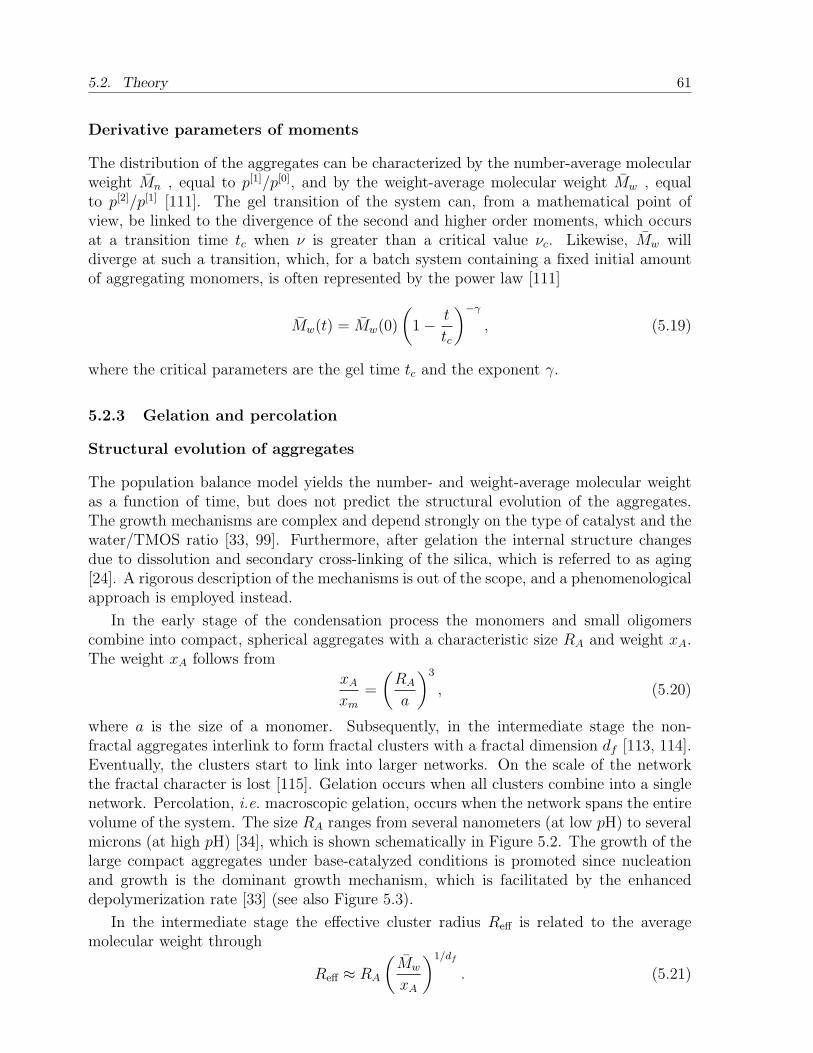
5.2. Theory 61
Derivative parameters of moments
The distribution of the aggregates can be characterized by the number-average molecularweight Mn , equal to p[1]/p[0], and by the weight-average molecular weight Mw , equalto p[2]/p[1] [111]. The gel transition of the system can, from a mathematical point ofview, be linked to the divergence of the second and higher order moments, which occursat a transition time tc when ν is greater than a critical value νc. Likewise, Mw willdiverge at such a transition, which, for a batch system containing a fixed initial amountof aggregating monomers, is often represented by the power law [111]
Mw(t) = Mw(0)
(1− t
tc
)−γ
, (5.19)
where the critical parameters are the gel time tc and the exponent γ.
5.2.3 Gelation and percolation
Structural evolution of aggregates
The population balance model yields the number- and weight-average molecular weightas a function of time, but does not predict the structural evolution of the aggregates.The growth mechanisms are complex and depend strongly on the type of catalyst and thewater/TMOS ratio [33, 99]. Furthermore, after gelation the internal structure changesdue to dissolution and secondary cross-linking of the silica, which is referred to as aging[24]. A rigorous description of the mechanisms is out of the scope, and a phenomenologicalapproach is employed instead.
In the early stage of the condensation process the monomers and small oligomerscombine into compact, spherical aggregates with a characteristic size RA and weight xA.The weight xA follows from
xA
xm
=
(RA
a
)3
, (5.20)
where a is the size of a monomer. Subsequently, in the intermediate stage the non-fractal aggregates interlink to form fractal clusters with a fractal dimension df [113, 114].Eventually, the clusters start to link into larger networks. On the scale of the networkthe fractal character is lost [115]. Gelation occurs when all clusters combine into a singlenetwork. Percolation, i.e. macroscopic gelation, occurs when the network spans the entirevolume of the system. The size RA ranges from several nanometers (at low pH) to severalmicrons (at high pH) [34], which is shown schematically in Figure 5.2. The growth of thelarge compact aggregates under base-catalyzed conditions is promoted since nucleationand growth is the dominant growth mechanism, which is facilitated by the enhanceddepolymerization rate [33] (see also Figure 5.3).
In the intermediate stage the effective cluster radius Reff is related to the averagemolecular weight through
Reff ≈ RA
(Mw
xA
)1/df
. (5.21)
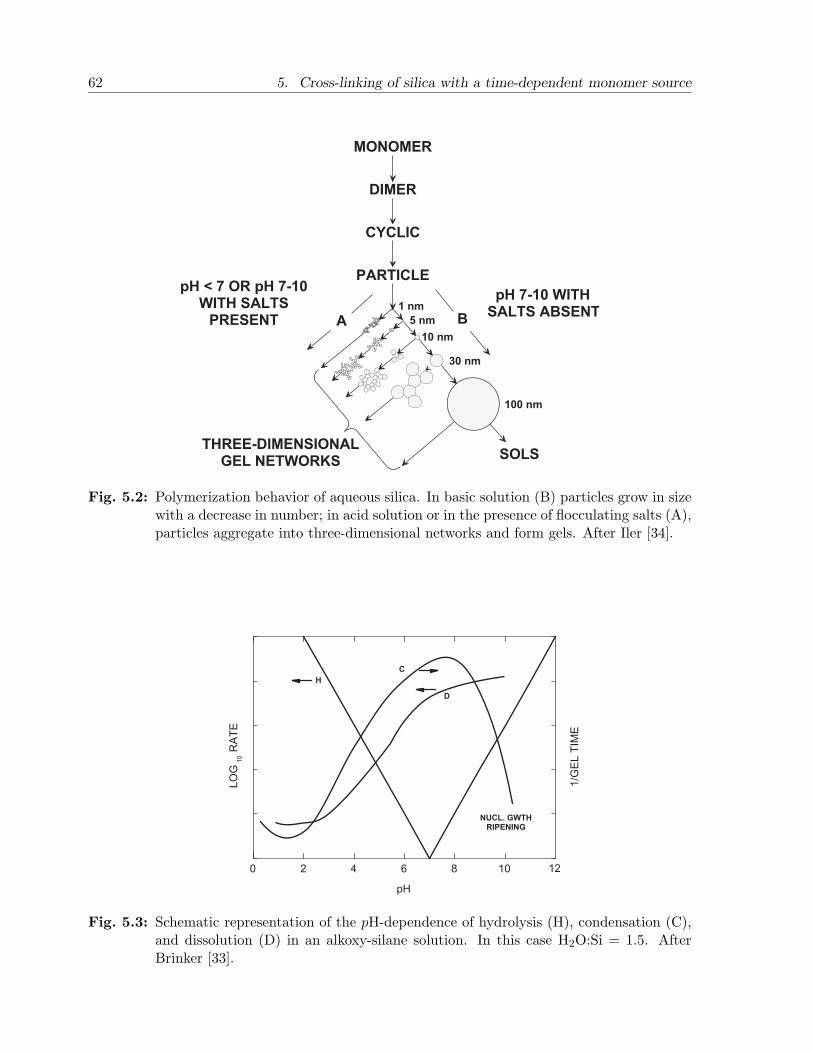
62 5. Cross-linking of silica with a time-dependent monomer source
M O N O M E R
D I M E R
C Y C L I C
P A R T I C L E p H 7 - 1 0 W I T HS A L T S A B S E N T
p H < 7 O R p H 7 - 1 0W I T H S A L T S P R E S E N T
T H R E E - D I M E N S I O N A LG E L N E T W O R K S S O L S
1 n m5 n m
1 0 n m
3 0 n m
1 0 0 n m
A B
Fig. 5.2: Polymerization behavior of aqueous silica. In basic solution (B) particles grow in sizewith a decrease in number; in acid solution or in the presence of flocculating salts (A),particles aggregate into three-dimensional networks and form gels. After Iler [34].
0 2 4 6 8 1 0
LO
G10 RAT
E
1/GE
L TIM
E
p H
N U C L . G W T HR I P E N I N G
HC
D
1 2
Fig. 5.3: Schematic representation of the pH-dependence of hydrolysis (H), condensation (C),and dissolution (D) in an alkoxy-silane solution. In this case H2O:Si = 1.5. AfterBrinker [33].
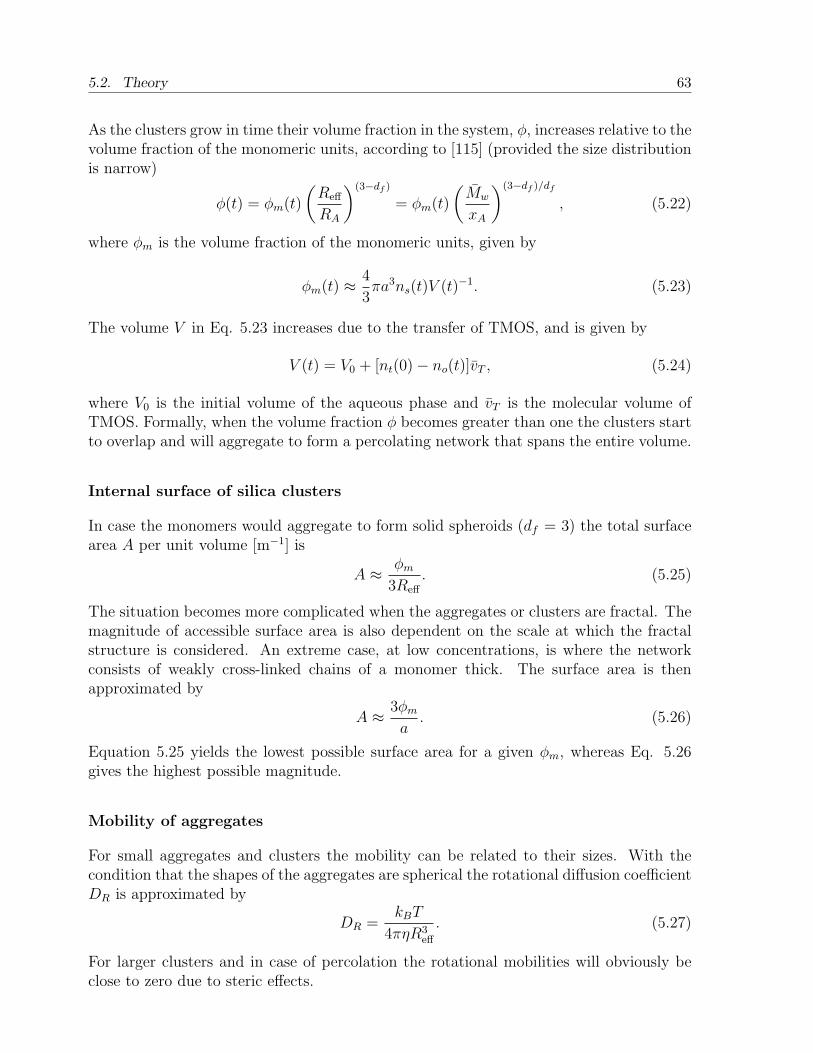
5.2. Theory 63
As the clusters grow in time their volume fraction in the system, φ, increases relative to thevolume fraction of the monomeric units, according to [115] (provided the size distributionis narrow)
φ(t) = φm(t)
(Reff
RA
)(3−df )
= φm(t)
(Mw
xA
)(3−df )/df
, (5.22)
where φm is the volume fraction of the monomeric units, given by
φm(t) ≈ 4
3πa3ns(t)V (t)−1. (5.23)
The volume V in Eq. 5.23 increases due to the transfer of TMOS, and is given by
V (t) = V0 + [nt(0)− no(t)]vT , (5.24)
where V0 is the initial volume of the aqueous phase and vT is the molecular volume ofTMOS. Formally, when the volume fraction φ becomes greater than one the clusters startto overlap and will aggregate to form a percolating network that spans the entire volume.
Internal surface of silica clusters
In case the monomers would aggregate to form solid spheroids (df = 3) the total surfacearea A per unit volume [m−1] is
A ≈ φm
3Reff
. (5.25)
The situation becomes more complicated when the aggregates or clusters are fractal. Themagnitude of accessible surface area is also dependent on the scale at which the fractalstructure is considered. An extreme case, at low concentrations, is where the networkconsists of weakly cross-linked chains of a monomer thick. The surface area is thenapproximated by
A ≈ 3φm
a. (5.26)
Equation 5.25 yields the lowest possible surface area for a given φm, whereas Eq. 5.26gives the highest possible magnitude.
Mobility of aggregates
For small aggregates and clusters the mobility can be related to their sizes. With thecondition that the shapes of the aggregates are spherical the rotational diffusion coefficientDR is approximated by
DR =kBT
4πηR3eff
. (5.27)
For larger clusters and in case of percolation the rotational mobilities will obviously beclose to zero due to steric effects.
64 5. Cross-linking of silica with a time-dependent monomer source
5.2.4 Nuclear magnetic relaxation of deuterium in gel
The discussion of the relaxation of deuterium is focussed on the T2 of the D2O moleculesin the gelling solutions. The transverse relaxation time T2 is given by [41]
1
T2
=1
160
(1 +
η2A
3
)Q2
cc 9J(0) + 15J(ω0) + 6J(2ω0) , (5.28)
where ηA is an asymmetry parameter (close to zero), Qcc is the quadrupolar couplingcoefficient (about 1.38×10⁶ rad s−1) and ω0 is the Larmor frequency. The function Jin Eq. 5.28 describes the effect of molecular fluctuations on the relaxation times at agiven resonance frequency. The only molecular fluctuation of importance is the molecularrotation. When the rotational motion is assumed to be random and characterized by atypical ”tumbling” or correlation time τc then a Lorentzian function is used for J , givenby
J(ω) =2τc
1 + ω2τ 2c
. (5.29)
Eq. 5.29 reduces to J = 2τc in the so-called fast motion limit, where ω20τ
2c 1.
As the water molecules diffuse through the system they adsorb onto or interact withthe growing silica clusters, with a finite probability. An important interaction mecha-nism between the water and the silica is due to hydrogen (deuterium) bonding with theabundant silanol groups.
From a macroscopic point of view, the relaxation behavior can be modeled by assigningdifferent phases in which a nucleus resides during a certain life time [94, 96, 116]. Eachphase i corresponds to a relaxation time T2,i brought about by an effective correlation timeτci
. In the sol-gel the silica is dispersed on the scale of nanometers. Therefore the averagerelaxation is described by a fast-exchange model. A bulk relaxation time T2,b is definedfor the molecules distant from the surface and a surface relaxation time T2,s is defined forthe molecules near the surface. The average relaxation time in this two-fraction model isgiven by [96]
T−12,AV =
fs
T2,s
+1− fs
T2,b
, (5.30)
where fs is the fraction of nuclei in the surface phase. In general T2,s < T2,b and fs <1. The fraction fs is proportional to the specific surface area A of the silica surface. Incase the interaction between solid and liquid is limited to a single monolayer of liquidmolecules the fraction fs would be approximated by
fs =Aλ
1− φm
, (5.31)
where λ is the thickness of the monolayer.
The molecular reorientation times of the water molecules govern the surface relaxationtimes T2,s. Generally, the correlation times of the D2O molecules near the surface willincrease compared to those of bulk water. The relaxation time T2,b is a function of themethanol concentration in solution [97, 98] and is obtained from calibration.
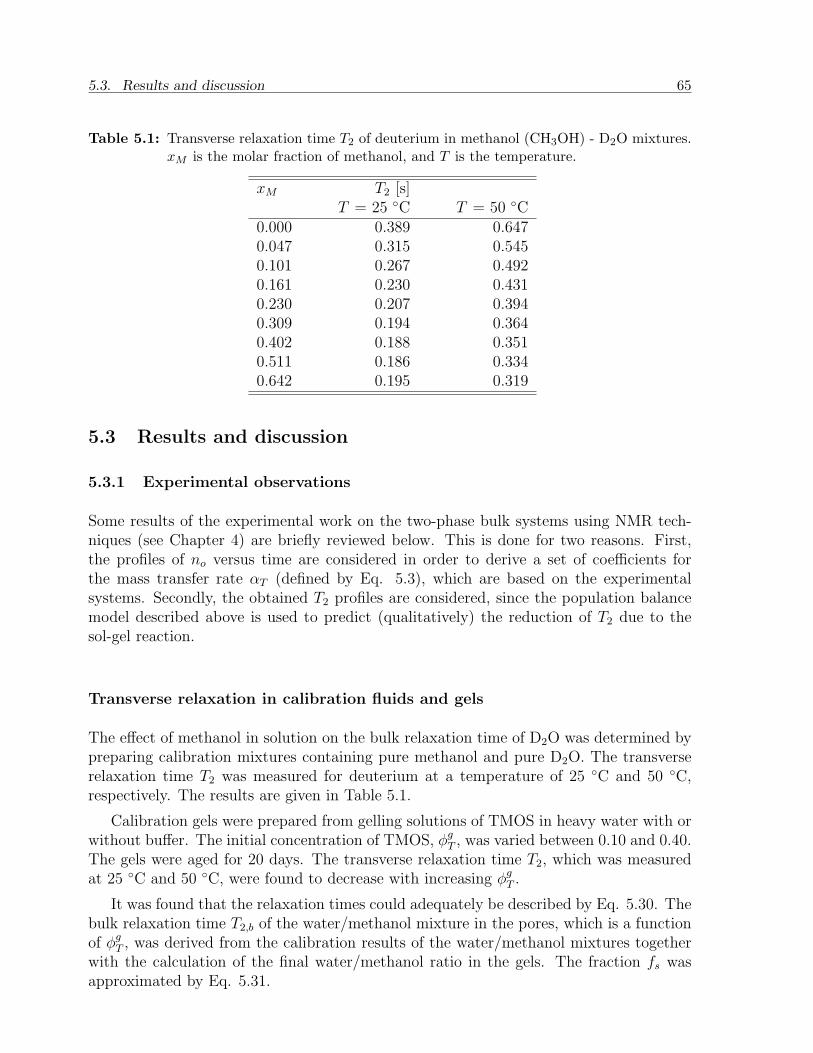
5.3. Results and discussion 65
Table 5.1: Transverse relaxation time T2 of deuterium in methanol (CH3OH) - D2O mixtures.xM is the molar fraction of methanol, and T is the temperature.
xM T2 [s]T = 25 C T = 50 C
0.000 0.389 0.6470.047 0.315 0.5450.101 0.267 0.4920.161 0.230 0.4310.230 0.207 0.3940.309 0.194 0.3640.402 0.188 0.3510.511 0.186 0.3340.642 0.195 0.319
5.3 Results and discussion
5.3.1 Experimental observations
Some results of the experimental work on the two-phase bulk systems using NMR tech-niques (see Chapter 4) are briefly reviewed below. This is done for two reasons. First,the profiles of no versus time are considered in order to derive a set of coefficients forthe mass transfer rate αT (defined by Eq. 5.3), which are based on the experimentalsystems. Secondly, the obtained T2 profiles are considered, since the population balancemodel described above is used to predict (qualitatively) the reduction of T2 due to thesol-gel reaction.
Transverse relaxation in calibration fluids and gels
The effect of methanol in solution on the bulk relaxation time of D2O was determined bypreparing calibration mixtures containing pure methanol and pure D2O. The transverserelaxation time T2 was measured for deuterium at a temperature of 25 C and 50 C,respectively. The results are given in Table 5.1.
Calibration gels were prepared from gelling solutions of TMOS in heavy water with orwithout buffer. The initial concentration of TMOS, φg
T , was varied between 0.10 and 0.40.The gels were aged for 20 days. The transverse relaxation time T2, which was measuredat 25 C and 50 C, were found to decrease with increasing φg
T .
It was found that the relaxation times could adequately be described by Eq. 5.30. Thebulk relaxation time T2,b of the water/methanol mixture in the pores, which is a functionof φg
T , was derived from the calibration results of the water/methanol mixtures togetherwith the calculation of the final water/methanol ratio in the gels. The fraction fs wasapproximated by Eq. 5.31.
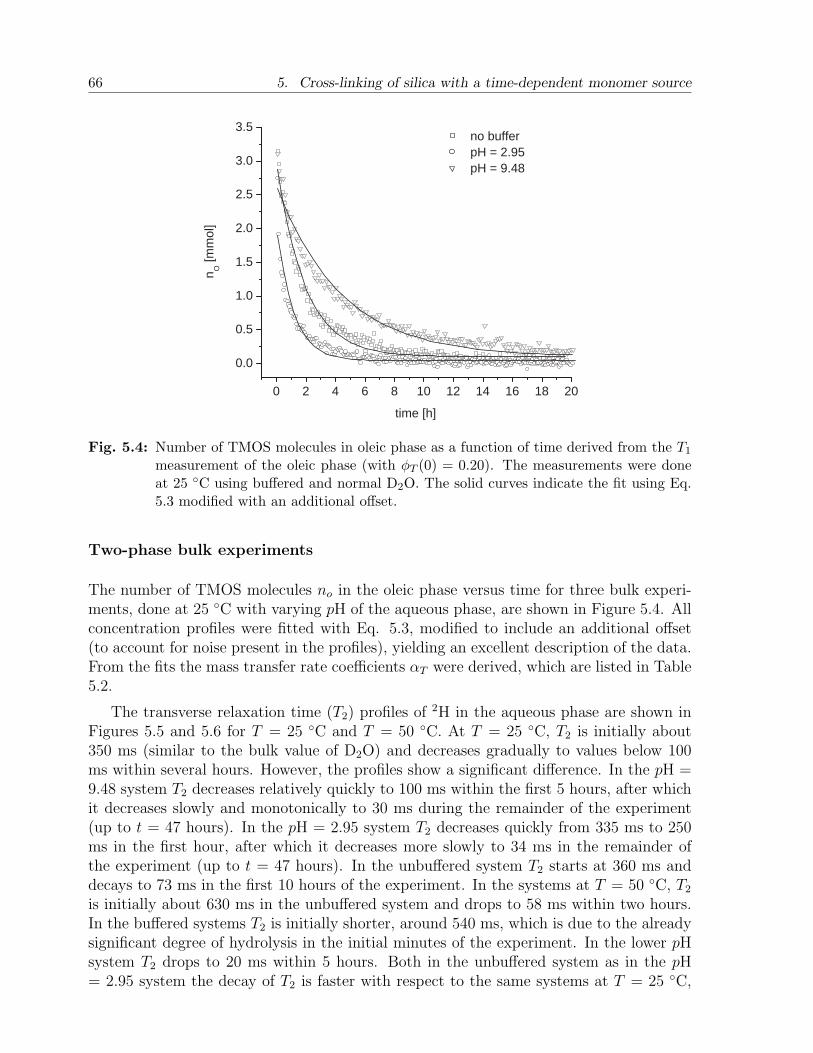
66 5. Cross-linking of silica with a time-dependent monomer source
0 2 4 6 8 10 12 14 16 18 20
0.0
0.5
1.0
1.5
2.0
2.5
3.0
3.5 no buffer pH = 2.95 pH = 9.48
n O [m
mol
]
time [h]
Fig. 5.4: Number of TMOS molecules in oleic phase as a function of time derived from the T1
measurement of the oleic phase (with φT (0) = 0.20). The measurements were doneat 25 C using buffered and normal D2O. The solid curves indicate the fit using Eq.5.3 modified with an additional offset.
Two-phase bulk experiments
The number of TMOS molecules no in the oleic phase versus time for three bulk experi-ments, done at 25 C with varying pH of the aqueous phase, are shown in Figure 5.4. Allconcentration profiles were fitted with Eq. 5.3, modified to include an additional offset(to account for noise present in the profiles), yielding an excellent description of the data.From the fits the mass transfer rate coefficients αT were derived, which are listed in Table5.2.
The transverse relaxation time (T2) profiles of 2H in the aqueous phase are shown inFigures 5.5 and 5.6 for T = 25 C and T = 50 C. At T = 25 C, T2 is initially about350 ms (similar to the bulk value of D2O) and decreases gradually to values below 100ms within several hours. However, the profiles show a significant difference. In the pH =9.48 system T2 decreases relatively quickly to 100 ms within the first 5 hours, after whichit decreases slowly and monotonically to 30 ms during the remainder of the experiment(up to t = 47 hours). In the pH = 2.95 system T2 decreases quickly from 335 ms to 250ms in the first hour, after which it decreases more slowly to 34 ms in the remainder ofthe experiment (up to t = 47 hours). In the unbuffered system T2 starts at 360 ms anddecays to 73 ms in the first 10 hours of the experiment. In the systems at T = 50 C, T2
is initially about 630 ms in the unbuffered system and drops to 58 ms within two hours.In the buffered systems T2 is initially shorter, around 540 ms, which is due to the alreadysignificant degree of hydrolysis in the initial minutes of the experiment. In the lower pHsystem T2 drops to 20 ms within 5 hours. Both in the unbuffered system as in the pH= 2.95 system the decay of T2 is faster with respect to the same systems at T = 25 C,
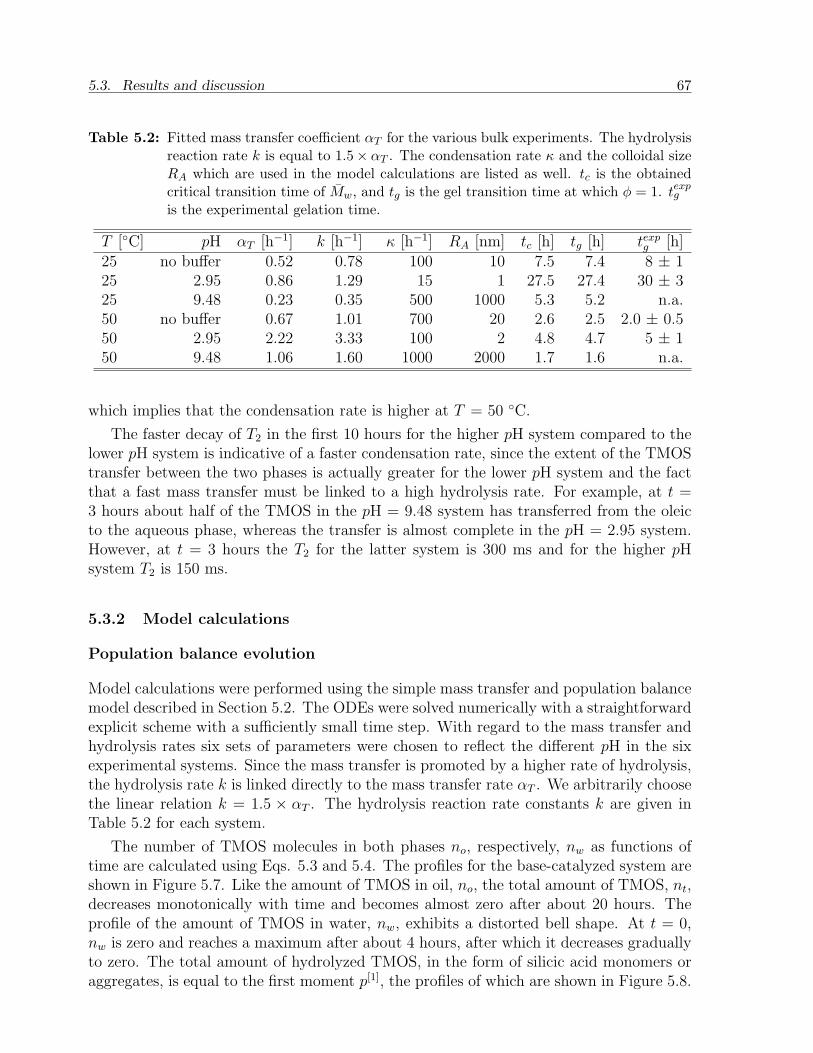
5.3. Results and discussion 67
Table 5.2: Fitted mass transfer coefficient αT for the various bulk experiments. The hydrolysisreaction rate k is equal to 1.5× αT . The condensation rate κ and the colloidal sizeRA which are used in the model calculations are listed as well. tc is the obtainedcritical transition time of Mw, and tg is the gel transition time at which φ = 1. texp
g
is the experimental gelation time.
T [C] pH αT [h−1] k [h−1] κ [h−1] RA [nm] tc [h] tg [h] texpg [h]
25 no buffer 0.52 0.78 100 10 7.5 7.4 8 ± 125 2.95 0.86 1.29 15 1 27.5 27.4 30 ± 325 9.48 0.23 0.35 500 1000 5.3 5.2 n.a.50 no buffer 0.67 1.01 700 20 2.6 2.5 2.0 ± 0.550 2.95 2.22 3.33 100 2 4.8 4.7 5 ± 150 9.48 1.06 1.60 1000 2000 1.7 1.6 n.a.
which implies that the condensation rate is higher at T = 50 C.
The faster decay of T2 in the first 10 hours for the higher pH system compared to thelower pH system is indicative of a faster condensation rate, since the extent of the TMOStransfer between the two phases is actually greater for the lower pH system and the factthat a fast mass transfer must be linked to a high hydrolysis rate. For example, at t =3 hours about half of the TMOS in the pH = 9.48 system has transferred from the oleicto the aqueous phase, whereas the transfer is almost complete in the pH = 2.95 system.However, at t = 3 hours the T2 for the latter system is 300 ms and for the higher pHsystem T2 is 150 ms.
5.3.2 Model calculations
Population balance evolution
Model calculations were performed using the simple mass transfer and population balancemodel described in Section 5.2. The ODEs were solved numerically with a straightforwardexplicit scheme with a sufficiently small time step. With regard to the mass transfer andhydrolysis rates six sets of parameters were chosen to reflect the different pH in the sixexperimental systems. Since the mass transfer is promoted by a higher rate of hydrolysis,the hydrolysis rate k is linked directly to the mass transfer rate αT . We arbitrarily choosethe linear relation k = 1.5 × αT . The hydrolysis reaction rate constants k are given inTable 5.2 for each system.
The number of TMOS molecules in both phases no, respectively, nw as functions oftime are calculated using Eqs. 5.3 and 5.4. The profiles for the base-catalyzed system areshown in Figure 5.7. Like the amount of TMOS in oil, no, the total amount of TMOS, nt,decreases monotonically with time and becomes almost zero after about 20 hours. Theprofile of the amount of TMOS in water, nw, exhibits a distorted bell shape. At t = 0,nw is zero and reaches a maximum after about 4 hours, after which it decreases graduallyto zero. The total amount of hydrolyzed TMOS, in the form of silicic acid monomers oraggregates, is equal to the first moment p[1], the profiles of which are shown in Figure 5.8.
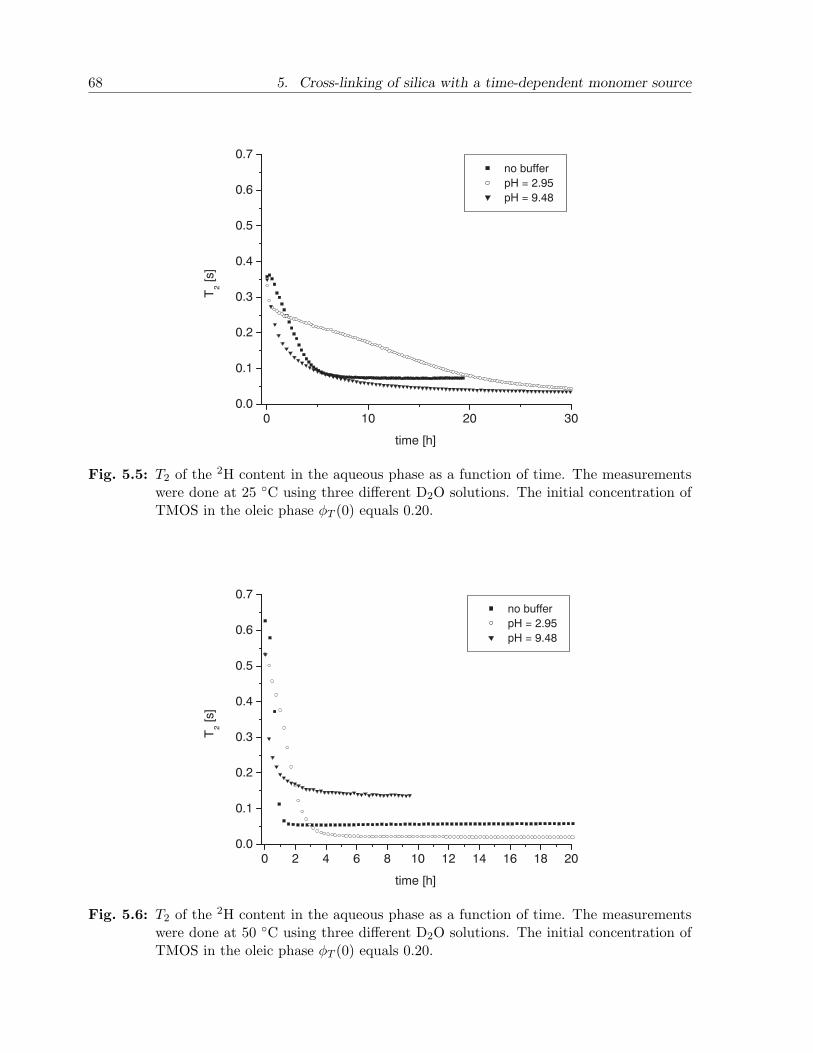
68 5. Cross-linking of silica with a time-dependent monomer source
0 10 20 300.0
0.1
0.2
0.3
0.4
0.5
0.6
0.7 no buffer
pH = 2.95
pH = 9.48T
2 [
s]
time [h]
Fig. 5.5: T2 of the 2H content in the aqueous phase as a function of time. The measurementswere done at 25 C using three different D2O solutions. The initial concentration ofTMOS in the oleic phase φT (0) equals 0.20.
0 2 4 6 8 10 12 14 16 18 200.0
0.1
0.2
0.3
0.4
0.5
0.6
0.7 no buffer
pH = 2.95
pH = 9.48
T2 [
s]
time [h]
Fig. 5.6: T2 of the 2H content in the aqueous phase as a function of time. The measurementswere done at 50 C using three different D2O solutions. The initial concentration ofTMOS in the oleic phase φT (0) equals 0.20.
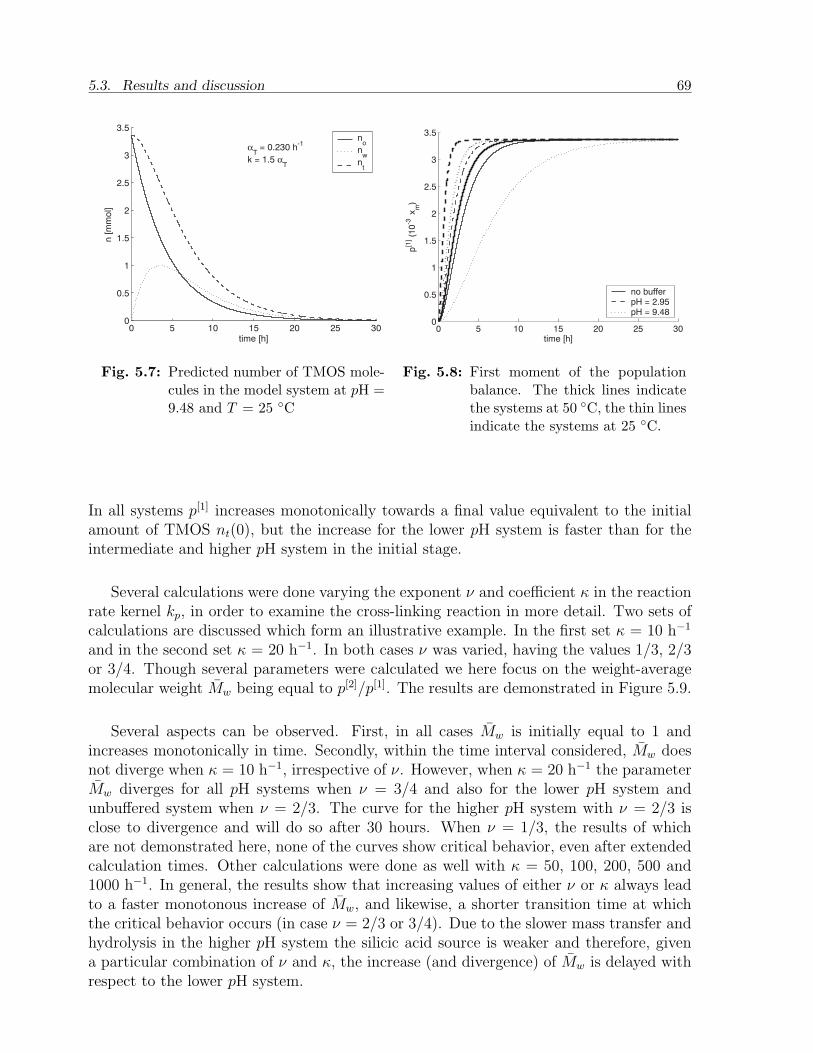
5.3. Results and discussion 69
0 5 10 15 20 25 300
0.5
1
1.5
2
2.5
3
3.5
time [h]
n [m
mol]
no
nw
nt
αT = 0.230 h
-1
k = 1.5 αT
Fig. 5.7: Predicted number of TMOS mole-cules in the model system at pH =9.48 and T = 25 C
0 5 10 15 20 25 300
0.5
1
1.5
2
2.5
3
3.5
time [h]
p[1
] (1
0-3
xm
)
no bufferpH = 2.95pH = 9.48
Fig. 5.8: First moment of the populationbalance. The thick lines indicatethe systems at 50 C, the thin linesindicate the systems at 25 C.
In all systems p[1] increases monotonically towards a final value equivalent to the initialamount of TMOS nt(0), but the increase for the lower pH system is faster than for theintermediate and higher pH system in the initial stage.
Several calculations were done varying the exponent ν and coefficient κ in the reactionrate kernel kp, in order to examine the cross-linking reaction in more detail. Two sets ofcalculations are discussed which form an illustrative example. In the first set κ = 10 h−1
and in the second set κ = 20 h−1. In both cases ν was varied, having the values 1/3, 2/3or 3/4. Though several parameters were calculated we here focus on the weight-averagemolecular weight Mw being equal to p[2]/p[1]. The results are demonstrated in Figure 5.9.
Several aspects can be observed. First, in all cases Mw is initially equal to 1 andincreases monotonically in time. Secondly, within the time interval considered, Mw doesnot diverge when κ = 10 h−1, irrespective of ν. However, when κ = 20 h−1 the parameterMw diverges for all pH systems when ν = 3/4 and also for the lower pH system andunbuffered system when ν = 2/3. The curve for the higher pH system with ν = 2/3 isclose to divergence and will do so after 30 hours. When ν = 1/3, the results of whichare not demonstrated here, none of the curves show critical behavior, even after extendedcalculation times. Other calculations were done as well with κ = 50, 100, 200, 500 and1000 h−1. In general, the results show that increasing values of either ν or κ always leadto a faster monotonous increase of Mw, and likewise, a shorter transition time at whichthe critical behavior occurs (in case ν = 2/3 or 3/4). Due to the slower mass transfer andhydrolysis in the higher pH system the silicic acid source is weaker and therefore, givena particular combination of ν and κ, the increase (and divergence) of Mw is delayed withrespect to the lower pH system.
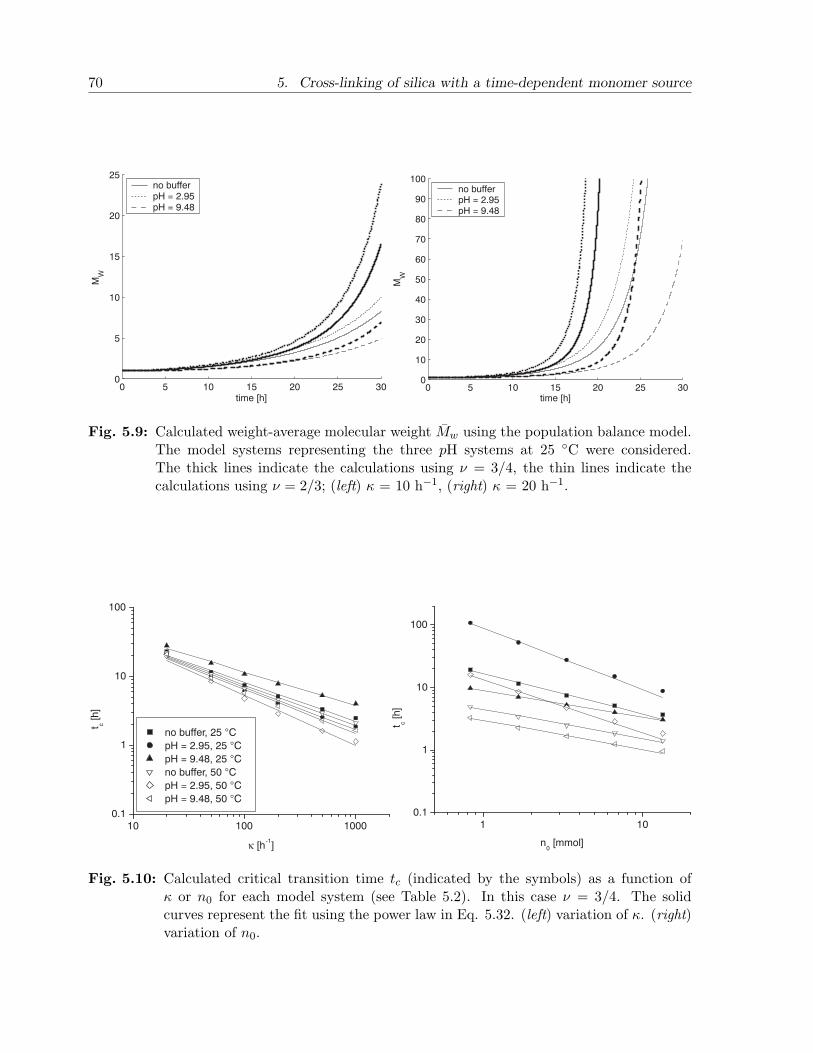
70 5. Cross-linking of silica with a time-dependent monomer source
0 5 10 15 20 25 300
5
10
15
20
25
time [h]
MW
no bufferpH = 2.95pH = 9.48
0 5 10 15 20 25 300
10
20
30
40
50
60
70
80
90
100
time [h]M
W
no bufferpH = 2.95pH = 9.48
Fig. 5.9: Calculated weight-average molecular weight Mw using the population balance model.The model systems representing the three pH systems at 25 C were considered.The thick lines indicate the calculations using ν = 3/4, the thin lines indicate thecalculations using ν = 2/3; (left) κ = 10 h−1, (right) κ = 20 h−1.
10 100 10000.1
1
10
100
t c [
h]
κ [h-1]
no buffer, 25 °C
pH = 2.95, 25 °C
pH = 9.48, 25 °C
no buffer, 50 °C
pH = 2.95, 50 °C
pH = 9.48, 50 °C
1 100.1
1
10
100
t c [
h]
n0 [mmol]
Fig. 5.10: Calculated critical transition time tc (indicated by the symbols) as a function ofκ or n0 for each model system (see Table 5.2). In this case ν = 3/4. The solidcurves represent the fit using the power law in Eq. 5.32. (left) variation of κ. (right)variation of n0.
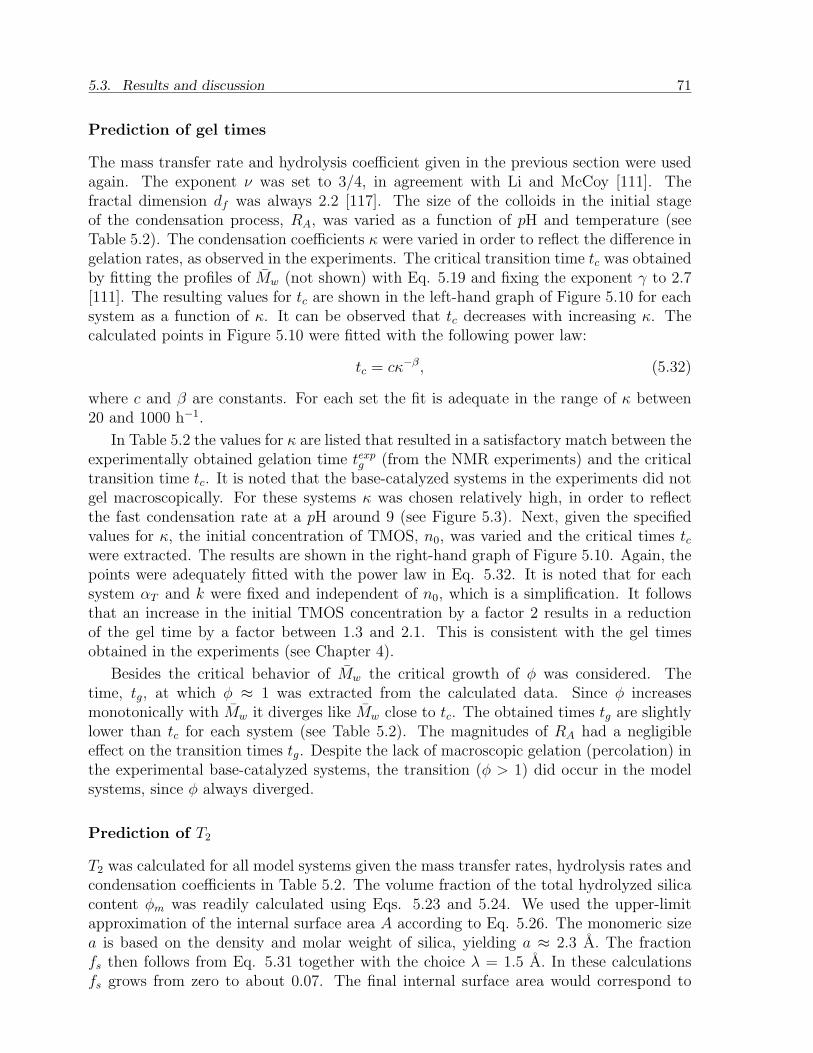
5.3. Results and discussion 71
Prediction of gel times
The mass transfer rate and hydrolysis coefficient given in the previous section were usedagain. The exponent ν was set to 3/4, in agreement with Li and McCoy [111]. Thefractal dimension df was always 2.2 [117]. The size of the colloids in the initial stageof the condensation process, RA, was varied as a function of pH and temperature (seeTable 5.2). The condensation coefficients κ were varied in order to reflect the difference ingelation rates, as observed in the experiments. The critical transition time tc was obtainedby fitting the profiles of Mw (not shown) with Eq. 5.19 and fixing the exponent γ to 2.7[111]. The resulting values for tc are shown in the left-hand graph of Figure 5.10 for eachsystem as a function of κ. It can be observed that tc decreases with increasing κ. Thecalculated points in Figure 5.10 were fitted with the following power law:
tc = cκ−β, (5.32)
where c and β are constants. For each set the fit is adequate in the range of κ between20 and 1000 h−1.
In Table 5.2 the values for κ are listed that resulted in a satisfactory match between theexperimentally obtained gelation time texp
g (from the NMR experiments) and the criticaltransition time tc. It is noted that the base-catalyzed systems in the experiments did notgel macroscopically. For these systems κ was chosen relatively high, in order to reflectthe fast condensation rate at a pH around 9 (see Figure 5.3). Next, given the specifiedvalues for κ, the initial concentration of TMOS, n0, was varied and the critical times tcwere extracted. The results are shown in the right-hand graph of Figure 5.10. Again, thepoints were adequately fitted with the power law in Eq. 5.32. It is noted that for eachsystem αT and k were fixed and independent of n0, which is a simplification. It followsthat an increase in the initial TMOS concentration by a factor 2 results in a reductionof the gel time by a factor between 1.3 and 2.1. This is consistent with the gel timesobtained in the experiments (see Chapter 4).
Besides the critical behavior of Mw the critical growth of φ was considered. Thetime, tg, at which φ ≈ 1 was extracted from the calculated data. Since φ increasesmonotonically with Mw it diverges like Mw close to tc. The obtained times tg are slightlylower than tc for each system (see Table 5.2). The magnitudes of RA had a negligibleeffect on the transition times tg. Despite the lack of macroscopic gelation (percolation) inthe experimental base-catalyzed systems, the transition (φ > 1) did occur in the modelsystems, since φ always diverged.
Prediction of T2
T2 was calculated for all model systems given the mass transfer rates, hydrolysis rates andcondensation coefficients in Table 5.2. The volume fraction of the total hydrolyzed silicacontent φm was readily calculated using Eqs. 5.23 and 5.24. We used the upper-limitapproximation of the internal surface area A according to Eq. 5.26. The monomeric sizea is based on the density and molar weight of silica, yielding a ≈ 2.3 A. The fractionfs then follows from Eq. 5.31 together with the choice λ = 1.5 A. In these calculationsfs grows from zero to about 0.07. The final internal surface area would correspond to
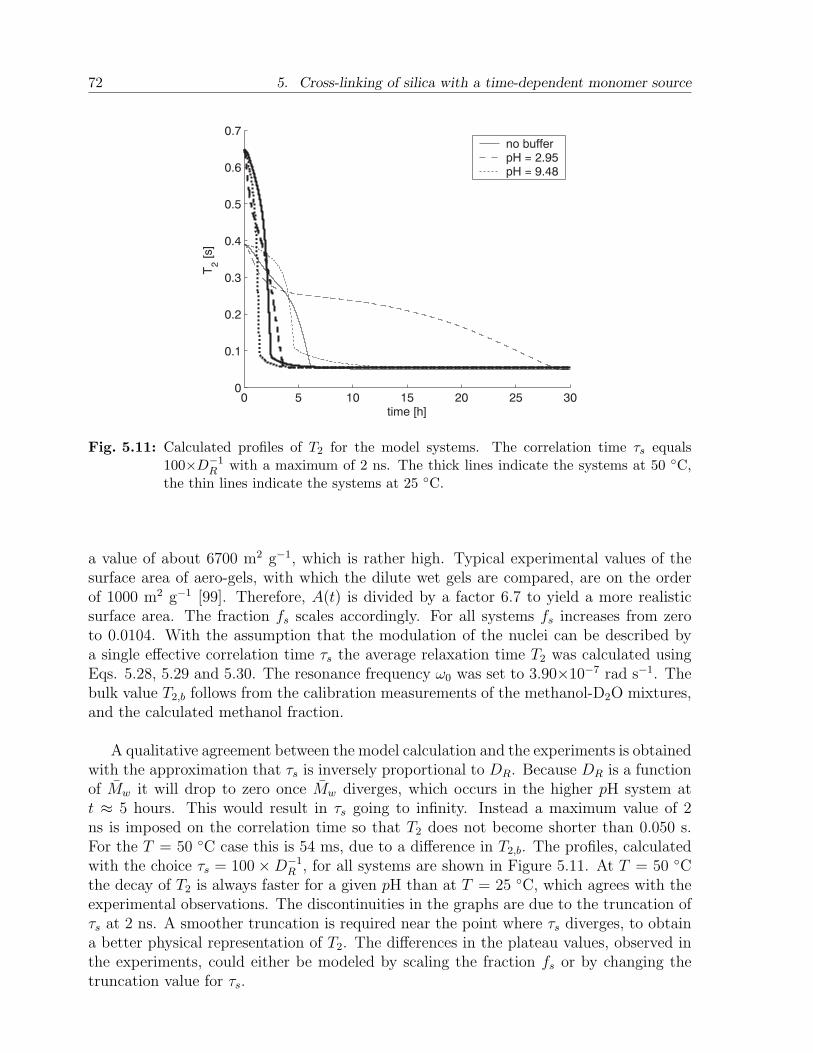
72 5. Cross-linking of silica with a time-dependent monomer source
0 5 10 15 20 25 300
0.1
0.2
0.3
0.4
0.5
0.6
0.7
time [h]
T2 [s]
no bufferpH = 2.95pH = 9.48
Fig. 5.11: Calculated profiles of T2 for the model systems. The correlation time τs equals100×D−1
R with a maximum of 2 ns. The thick lines indicate the systems at 50 C,the thin lines indicate the systems at 25 C.
a value of about 6700 m2 g−1, which is rather high. Typical experimental values of thesurface area of aero-gels, with which the dilute wet gels are compared, are on the orderof 1000 m2 g−1 [99]. Therefore, A(t) is divided by a factor 6.7 to yield a more realisticsurface area. The fraction fs scales accordingly. For all systems fs increases from zeroto 0.0104. With the assumption that the modulation of the nuclei can be described bya single effective correlation time τs the average relaxation time T2 was calculated usingEqs. 5.28, 5.29 and 5.30. The resonance frequency ω0 was set to 3.90×10⁻⁷ rad s−1. Thebulk value T2,b follows from the calibration measurements of the methanol-D2O mixtures,and the calculated methanol fraction.
A qualitative agreement between the model calculation and the experiments is obtainedwith the approximation that τs is inversely proportional to DR. Because DR is a functionof Mw it will drop to zero once Mw diverges, which occurs in the higher pH system att ≈ 5 hours. This would result in τs going to infinity. Instead a maximum value of 2ns is imposed on the correlation time so that T2 does not become shorter than 0.050 s.For the T = 50 C case this is 54 ms, due to a difference in T2,b. The profiles, calculatedwith the choice τs = 100×D−1
R , for all systems are shown in Figure 5.11. At T = 50 Cthe decay of T2 is always faster for a given pH than at T = 25 C, which agrees with theexperimental observations. The discontinuities in the graphs are due to the truncation ofτs at 2 ns. A smoother truncation is required near the point where τs diverges, to obtaina better physical representation of T2. The differences in the plateau values, observed inthe experiments, could either be modeled by scaling the fraction fs or by changing thetruncation value for τs.
5.4. Conclusion 73
5.4 Conclusion
The cross-linking of silica monomers, which are gradually formed through the hydrolysisof a precursor, was described with a population balance model including a time-dependentsource term. This way, the effect of both the hydrolysis and the condensation rate onthe population balance evolution could be modeled. Like in common population balancecalculations, which usually involve a fixed initial amount of particles, the weight-averagemolecular weight of the aggregates grows critically and diverges at the gel transitionpoint. However, besides the condensation rate, the hydrolysis rate, which is included inthe source term, influences the gel transition time. The higher the hydrolysis and thecondensation rates, the shorter is the gel time. Furthermore, increasing the initial TMOSconcentration by a factor 2 results in a reduction of the gel time by a factor between1.3 and 2.1. Finally, a qualitative agreement between the predicted profiles for T2 andthe experimental profiles was found using simple relations between the average aggregatemobility and the correlation time of the water molecules.

74
Part II
Gel placement in porous materials
75

76
Chapter 6
Coupled mass transfer and gelation of TMOS in
porous materials
In the previous chapters the coupled mass transfer and gelation of TMOS in two-phase bulk models was considered. Here we turn to the situation in which TMOS,dissolved in oil, is forced into a natural porous material containing (heavy) water.The coupled mass transfer and gel reaction were characterized and monitored byemploying bi-nuclear NMR techniques. The relaxation time T1 of hydrogen in theoleic phase was measured to determine the mass transfer rate, and the relaxationtime T2 of deuterium in the aqueous phase was measured to determine the reactionrate. It was found that, like in bulk systems, the mass transfer is predominantlydriven by the hydrolysis rate. Due to the gel treatment, for each core the relativepermeability to water was reduced more than that to oil.
6.1 Introduction
When an alkoxy-silane solution in oil is forced into a porous material containing water thechemical transfers and reacts with water on a pore scale. Silica gel is then formed, whichalters the pore space or blocks the pores. A series of experiments was done to characterizeand monitor in situ the placement and reaction of TMOS in a natural porous material.
Consider a homogeneous porous cylinder (core) with a length L, porosity ϕ and ab-solute permeability Kabs (see Figure 6.1). The core is fully saturated with an aqueousphase and an oleic phase. The water saturation is given by Sw(z, t), where z is the spa-tial coordinate along the length of the core. Consequently, the oil saturation So(z, t) isequal to 1 - Sw. The volume fraction of TMOS in the oleic phase is given by φT (z, t). Amixture of TMOS/oil, with a fraction φT = φ0, is injected with an injection rate Q atthe inlet of the core, which is located at z = −L/2, and subsequently fluids are producedat the outlet which is located at z = L/2. As the TMOS comes in contact with water,the TMOS partitions between both phases. In the aqueous phase the TMOS undergoesa heterogeneous reaction with water and forms a gel.
To our best knowledge, the coupled mass transfer and gel reaction of TMOS have sofar not been monitored in situ in natural porous materials. To do so, we developed andemployed dedicated NMR techniques to measure the mass transfer and reaction rates ofthe chemical within small sandstone cores which were prepared at either irreducible wateror residual oil conditions [118]. Discrimination between both phases was done by usingheavy water instead of normal water for the aqueous phase and by employing both 1H-NMR and 2H-NMR techniques to measure the relaxation times of the oleic phase and the
77
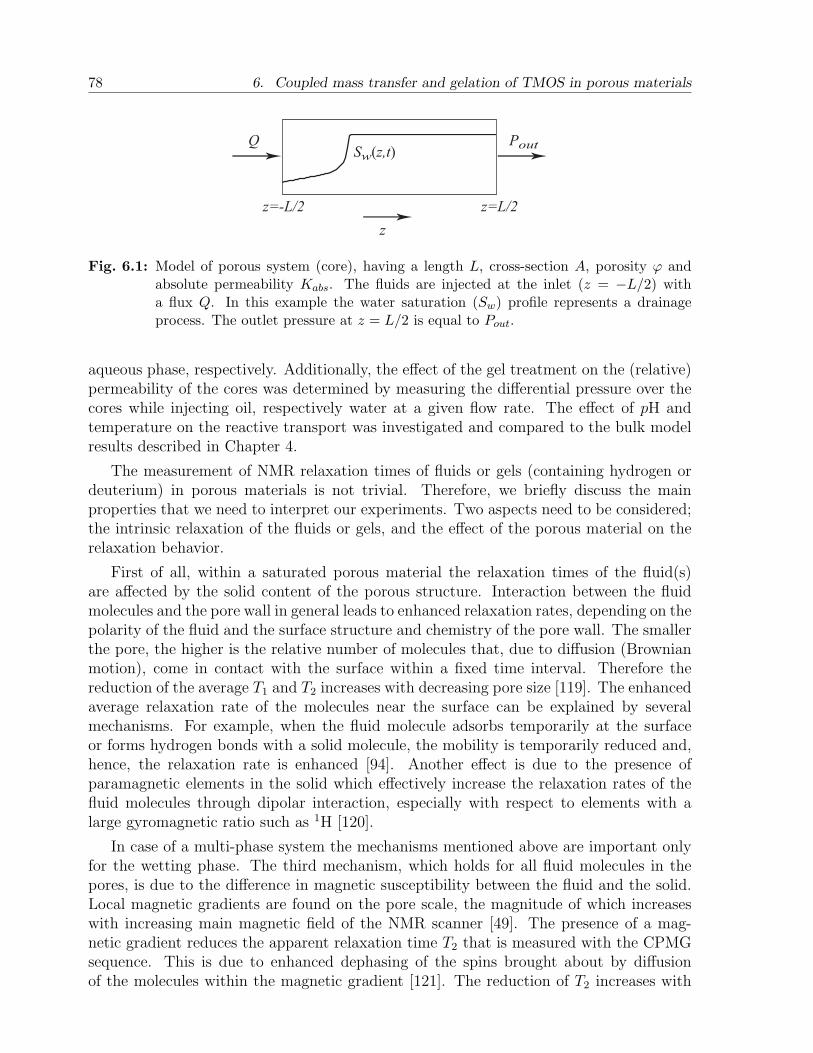
78 6. Coupled mass transfer and gelation of TMOS in porous materials
Sw(z,t)
z=-L/2 z=L/2
z
Q Pout
Fig. 6.1: Model of porous system (core), having a length L, cross-section A, porosity ϕ andabsolute permeability Kabs. The fluids are injected at the inlet (z = −L/2) witha flux Q. In this example the water saturation (Sw) profile represents a drainageprocess. The outlet pressure at z = L/2 is equal to Pout.
aqueous phase, respectively. Additionally, the effect of the gel treatment on the (relative)permeability of the cores was determined by measuring the differential pressure over thecores while injecting oil, respectively water at a given flow rate. The effect of pH andtemperature on the reactive transport was investigated and compared to the bulk modelresults described in Chapter 4.
The measurement of NMR relaxation times of fluids or gels (containing hydrogen ordeuterium) in porous materials is not trivial. Therefore, we briefly discuss the mainproperties that we need to interpret our experiments. Two aspects need to be considered;the intrinsic relaxation of the fluids or gels, and the effect of the porous material on therelaxation behavior.
First of all, within a saturated porous material the relaxation times of the fluid(s)are affected by the solid content of the porous structure. Interaction between the fluidmolecules and the pore wall in general leads to enhanced relaxation rates, depending on thepolarity of the fluid and the surface structure and chemistry of the pore wall. The smallerthe pore, the higher is the relative number of molecules that, due to diffusion (Brownianmotion), come in contact with the surface within a fixed time interval. Therefore thereduction of the average T1 and T2 increases with decreasing pore size [119]. The enhancedaverage relaxation rate of the molecules near the surface can be explained by severalmechanisms. For example, when the fluid molecule adsorbs temporarily at the surfaceor forms hydrogen bonds with a solid molecule, the mobility is temporarily reduced and,hence, the relaxation rate is enhanced [94]. Another effect is due to the presence ofparamagnetic elements in the solid which effectively increase the relaxation rates of thefluid molecules through dipolar interaction, especially with respect to elements with alarge gyromagnetic ratio such as 1H [120].
In case of a multi-phase system the mechanisms mentioned above are important onlyfor the wetting phase. The third mechanism, which holds for all fluid molecules in thepores, is due to the difference in magnetic susceptibility between the fluid and the solid.Local magnetic gradients are found on the pore scale, the magnitude of which increaseswith increasing main magnetic field of the NMR scanner [49]. The presence of a mag-netic gradient reduces the apparent relaxation time T2 that is measured with the CPMGsequence. This is due to enhanced dephasing of the spins brought about by diffusionof the molecules within the magnetic gradient [121]. The reduction of T2 increases with
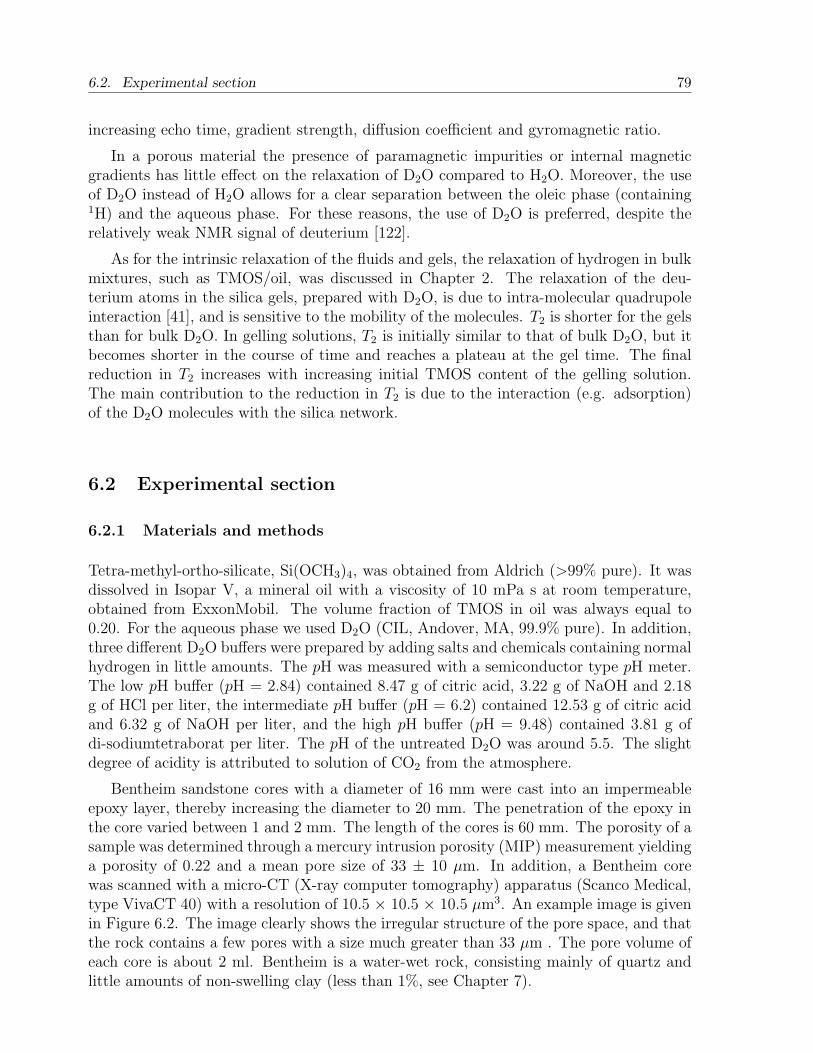
6.2. Experimental section 79
increasing echo time, gradient strength, diffusion coefficient and gyromagnetic ratio.
In a porous material the presence of paramagnetic impurities or internal magneticgradients has little effect on the relaxation of D2O compared to H2O. Moreover, the useof D2O instead of H2O allows for a clear separation between the oleic phase (containing1H) and the aqueous phase. For these reasons, the use of D2O is preferred, despite therelatively weak NMR signal of deuterium [122].
As for the intrinsic relaxation of the fluids and gels, the relaxation of hydrogen in bulkmixtures, such as TMOS/oil, was discussed in Chapter 2. The relaxation of the deu-terium atoms in the silica gels, prepared with D2O, is due to intra-molecular quadrupoleinteraction [41], and is sensitive to the mobility of the molecules. T2 is shorter for the gelsthan for bulk D2O. In gelling solutions, T2 is initially similar to that of bulk D2O, but itbecomes shorter in the course of time and reaches a plateau at the gel time. The finalreduction in T2 increases with increasing initial TMOS content of the gelling solution.The main contribution to the reduction in T2 is due to the interaction (e.g. adsorption)of the D2O molecules with the silica network.
6.2 Experimental section
6.2.1 Materials and methods
Tetra-methyl-ortho-silicate, Si(OCH3)4, was obtained from Aldrich (>99% pure). It wasdissolved in Isopar V, a mineral oil with a viscosity of 10 mPa s at room temperature,obtained from ExxonMobil. The volume fraction of TMOS in oil was always equal to0.20. For the aqueous phase we used D2O (CIL, Andover, MA, 99.9% pure). In addition,three different D2O buffers were prepared by adding salts and chemicals containing normalhydrogen in little amounts. The pH was measured with a semiconductor type pH meter.The low pH buffer (pH = 2.84) contained 8.47 g of citric acid, 3.22 g of NaOH and 2.18g of HCl per liter, the intermediate pH buffer (pH = 6.2) contained 12.53 g of citric acidand 6.32 g of NaOH per liter, and the high pH buffer (pH = 9.48) contained 3.81 g ofdi-sodiumtetraborat per liter. The pH of the untreated D2O was around 5.5. The slightdegree of acidity is attributed to solution of CO2 from the atmosphere.
Bentheim sandstone cores with a diameter of 16 mm were cast into an impermeableepoxy layer, thereby increasing the diameter to 20 mm. The penetration of the epoxy inthe core varied between 1 and 2 mm. The length of the cores is 60 mm. The porosity of asample was determined through a mercury intrusion porosity (MIP) measurement yieldinga porosity of 0.22 and a mean pore size of 33 ± 10 µm. In addition, a Bentheim corewas scanned with a micro-CT (X-ray computer tomography) apparatus (Scanco Medical,type VivaCT 40) with a resolution of 10.5 × 10.5 × 10.5 µm3. An example image is givenin Figure 6.2. The image clearly shows the irregular structure of the pore space, and thatthe rock contains a few pores with a size much greater than 33 µm . The pore volume ofeach core is about 2 ml. Bentheim is a water-wet rock, consisting mainly of quartz andlittle amounts of non-swelling clay (less than 1%, see Chapter 7).
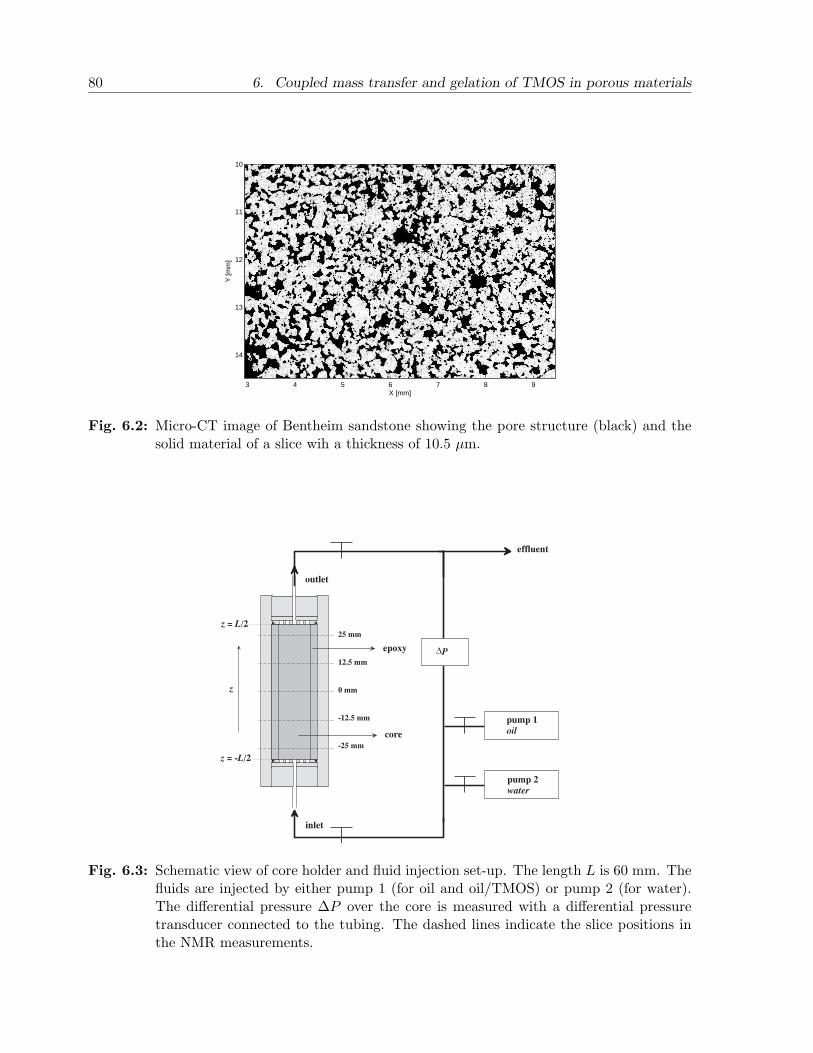
80 6. Coupled mass transfer and gelation of TMOS in porous materials
X [mm]
Y [m
m]
3 4 5 6 7 8 9
10
11
12
13
14
Fig. 6.2: Micro-CT image of Bentheim sandstone showing the pore structure (black) and thesolid material of a slice wih a thickness of 10.5 µm.
-12.5 mm
-25 mm
0 mm
12.5 mm
25 mm
z
z = L/2
z = -L/2
∆P
effluent
pump 1
oil
pump 2
water
inlet
outlet
core
epoxy
Fig. 6.3: Schematic view of core holder and fluid injection set-up. The length L is 60 mm. Thefluids are injected by either pump 1 (for oil and oil/TMOS) or pump 2 (for water).The differential pressure ∆P over the core is measured with a differential pressuretransducer connected to the tubing. The dashed lines indicate the slice positions inthe NMR measurements.
6.2. Experimental section 81
6.2.2 Core holder and fluid injection system
A custom-made core holder was designed which fitted in the insert of the NMR apparatus.The holder is made of poly-ether-ether-ketone (PEEK) and can withstand pressures up to23 bars. The temperature of the core holder was not controlled. During the experimentthe cores are oriented vertically, and the inlet is at the bottom. The fluids are injected bytwo continuous-injection pumps (P500, Amersham Bioscience) connected to a computer.The differential pressure over the core holder was monitored with a Deltabar S pressuretransducer (range: 0–1500 mbar). The tubing, between the core holder and the pressuretransducer, introduces an additional pressure loss at a given flow rate. This pressure losswas calibrated and taken into account in the permeability measurements. A schematicview of the set-up is given in Figure 6.3. For the shut-in step, during which the reactivemass transfer is monitored through the NMR measurements, the cores are taken out ofthe core holder, sealed and put in a second sample holder. In this sample holder, madeof polyvinylchloride (PVC), a fluorocarbon fluid (GaldenTM HT135, manufactured bySolvay Solexis) with a regulated temperature is circulated so that the temperature of thesample can be controlled. The fluid is invisible to the NMR set-up and the temperaturecan be controlled between 10 and 65 C with an accuracy of about 1 degree.
6.2.3 NMR apparatus and methods
A 0.95 Tesla NMR scanner was used to perform the NMR experiments. The scanner isequipped to measure both hydrogen, at a frequency of 40.5 MHz, as well as deuterium,at a frequency of 6.21 MHz. The set-up consists of an electromagnet with a vertical,narrow-bore insert with an inner diameter of 31 mm. A single rf coil is used with twodifferent front-end rf circuits for 1H, respectively 2H. Switching between the two circuits isautomated and takes less than a second, allowing for a fast sequential NMR measurementof hydrogen and deuterium. The insert is capable of producing a static magnetic gradientup to 0.2 T m−1 in the vertical direction. The position of the core holder and sampleholder is controlled by a stepper motor.
The sequences used for the experiments and details about the methods were discussedin Chapter 2. T1 of the hydrogen content in the oleic phase is measured with a saturationrecovery sequence to determine the TMOS concentration in oil, T2 of the aqueous phaseis measured with a Carr-Purcell-Meiboom-Gill (CPMG) sequence to monitor the progressof gelation. In this case T2 is measured for the deuterium content. A 1D static magneticgradient is used. Due to the relatively low signal to noise ratio for deuterium the signal isaveraged 64 times. The acquisition time for a T2 measurement in a single slice is about 4minutes. The gradient strength was 0.030 T m−1 and 0.015 T m−1 for 1H, respectively 2H.In each experiment five equally-spaced slices were considered. The slice positions alongthe vertical direction were: -25 mm, -12.5 mm, 0 mm, 12.5 mm and 25 mm with respectto the center of the cores (see Figure 6.3). The relaxation times were acquired for eachslice by using and averaging the part of the signal profile corresponding to a thickness of3.1 mm. The saturation recovery data were analyzed and fitted with mono-exponentialdecay functions yielding the relaxation times T1. The CPMG data were analyzed withthe inversion routine CONTIN [66] to give quasi-continuous T2 spectra, consisting of one
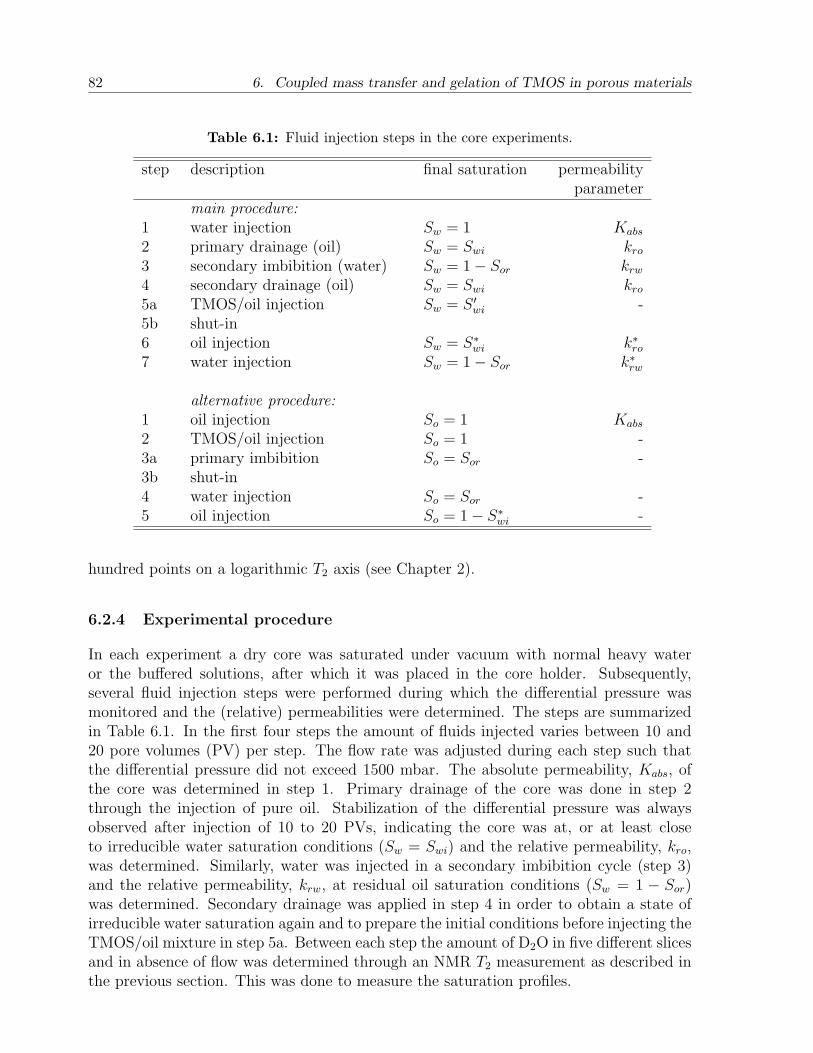
82 6. Coupled mass transfer and gelation of TMOS in porous materials
Table 6.1: Fluid injection steps in the core experiments.
step description final saturation permeabilityparameter
main procedure:1 water injection Sw = 1 Kabs
2 primary drainage (oil) Sw = Swi kro
3 secondary imbibition (water) Sw = 1− Sor krw
4 secondary drainage (oil) Sw = Swi kro
5a TMOS/oil injection Sw = S ′wi -
5b shut-in6 oil injection Sw = S∗
wi k∗ro
7 water injection Sw = 1− Sor k∗rw
alternative procedure:1 oil injection So = 1 Kabs
2 TMOS/oil injection So = 1 -3a primary imbibition So = Sor -3b shut-in4 water injection So = Sor -5 oil injection So = 1− S∗
wi -
hundred points on a logarithmic T2 axis (see Chapter 2).
6.2.4 Experimental procedure
In each experiment a dry core was saturated under vacuum with normal heavy wateror the buffered solutions, after which it was placed in the core holder. Subsequently,several fluid injection steps were performed during which the differential pressure wasmonitored and the (relative) permeabilities were determined. The steps are summarizedin Table 6.1. In the first four steps the amount of fluids injected varies between 10 and20 pore volumes (PV) per step. The flow rate was adjusted during each step such thatthe differential pressure did not exceed 1500 mbar. The absolute permeability, Kabs, ofthe core was determined in step 1. Primary drainage of the core was done in step 2through the injection of pure oil. Stabilization of the differential pressure was alwaysobserved after injection of 10 to 20 PVs, indicating the core was at, or at least closeto irreducible water saturation conditions (Sw = Swi) and the relative permeability, kro,was determined. Similarly, water was injected in a secondary imbibition cycle (step 3)and the relative permeability, krw, at residual oil saturation conditions (Sw = 1 − Sor)was determined. Secondary drainage was applied in step 4 in order to obtain a state ofirreducible water saturation again and to prepare the initial conditions before injecting theTMOS/oil mixture in step 5a. Between each step the amount of D2O in five different slicesand in absence of flow was determined through an NMR T2 measurement as described inthe previous section. This was done to measure the saturation profiles.
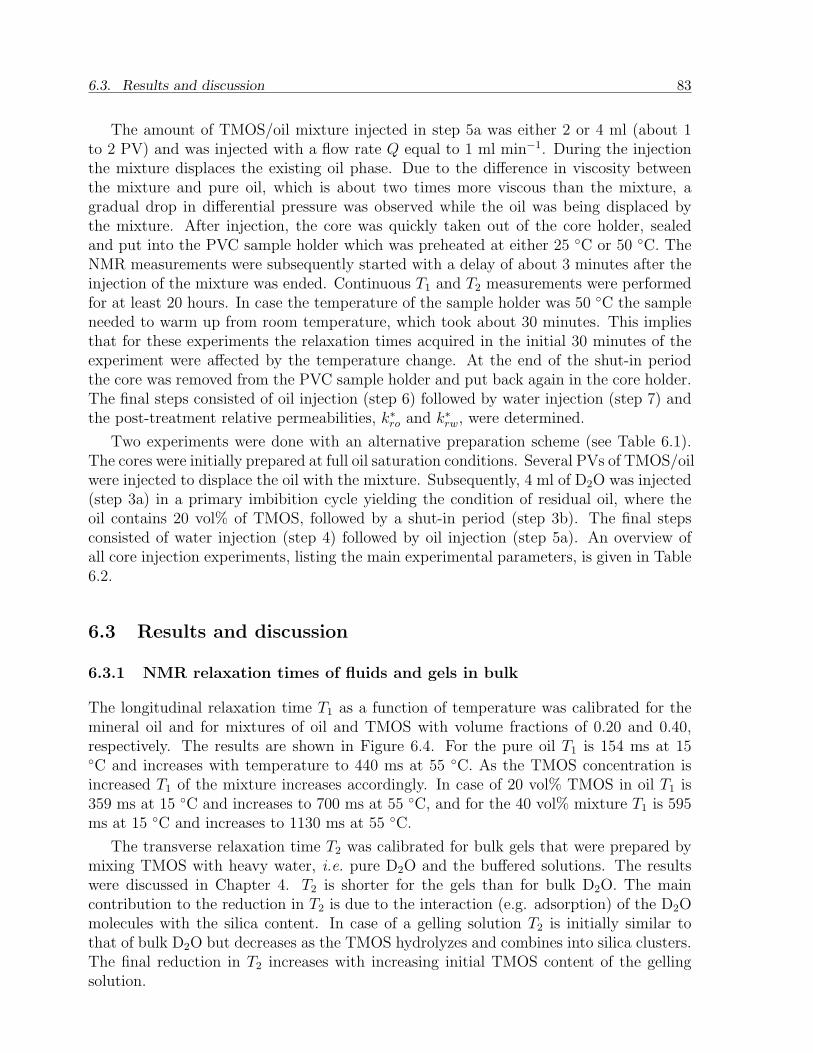
6.3. Results and discussion 83
The amount of TMOS/oil mixture injected in step 5a was either 2 or 4 ml (about 1to 2 PV) and was injected with a flow rate Q equal to 1 ml min−1. During the injectionthe mixture displaces the existing oil phase. Due to the difference in viscosity betweenthe mixture and pure oil, which is about two times more viscous than the mixture, agradual drop in differential pressure was observed while the oil was being displaced bythe mixture. After injection, the core was quickly taken out of the core holder, sealedand put into the PVC sample holder which was preheated at either 25 C or 50 C. TheNMR measurements were subsequently started with a delay of about 3 minutes after theinjection of the mixture was ended. Continuous T1 and T2 measurements were performedfor at least 20 hours. In case the temperature of the sample holder was 50 C the sampleneeded to warm up from room temperature, which took about 30 minutes. This impliesthat for these experiments the relaxation times acquired in the initial 30 minutes of theexperiment were affected by the temperature change. At the end of the shut-in periodthe core was removed from the PVC sample holder and put back again in the core holder.The final steps consisted of oil injection (step 6) followed by water injection (step 7) andthe post-treatment relative permeabilities, k∗ro and k∗rw, were determined.
Two experiments were done with an alternative preparation scheme (see Table 6.1).The cores were initially prepared at full oil saturation conditions. Several PVs of TMOS/oilwere injected to displace the oil with the mixture. Subsequently, 4 ml of D2O was injected(step 3a) in a primary imbibition cycle yielding the condition of residual oil, where theoil contains 20 vol% of TMOS, followed by a shut-in period (step 3b). The final stepsconsisted of water injection (step 4) followed by oil injection (step 5a). An overview ofall core injection experiments, listing the main experimental parameters, is given in Table6.2.
6.3 Results and discussion
6.3.1 NMR relaxation times of fluids and gels in bulk
The longitudinal relaxation time T1 as a function of temperature was calibrated for themineral oil and for mixtures of oil and TMOS with volume fractions of 0.20 and 0.40,respectively. The results are shown in Figure 6.4. For the pure oil T1 is 154 ms at 15C and increases with temperature to 440 ms at 55 C. As the TMOS concentration isincreased T1 of the mixture increases accordingly. In case of 20 vol% TMOS in oil T1 is359 ms at 15 C and increases to 700 ms at 55 C, and for the 40 vol% mixture T1 is 595ms at 15 C and increases to 1130 ms at 55 C.
The transverse relaxation time T2 was calibrated for bulk gels that were prepared bymixing TMOS with heavy water, i.e. pure D2O and the buffered solutions. The resultswere discussed in Chapter 4. T2 is shorter for the gels than for bulk D2O. The maincontribution to the reduction in T2 is due to the interaction (e.g. adsorption) of the D2Omolecules with the silica content. In case of a gelling solution T2 is initially similar tothat of bulk D2O but decreases as the TMOS hydrolyzes and combines into silica clusters.The final reduction in T2 increases with increasing initial TMOS content of the gellingsolution.
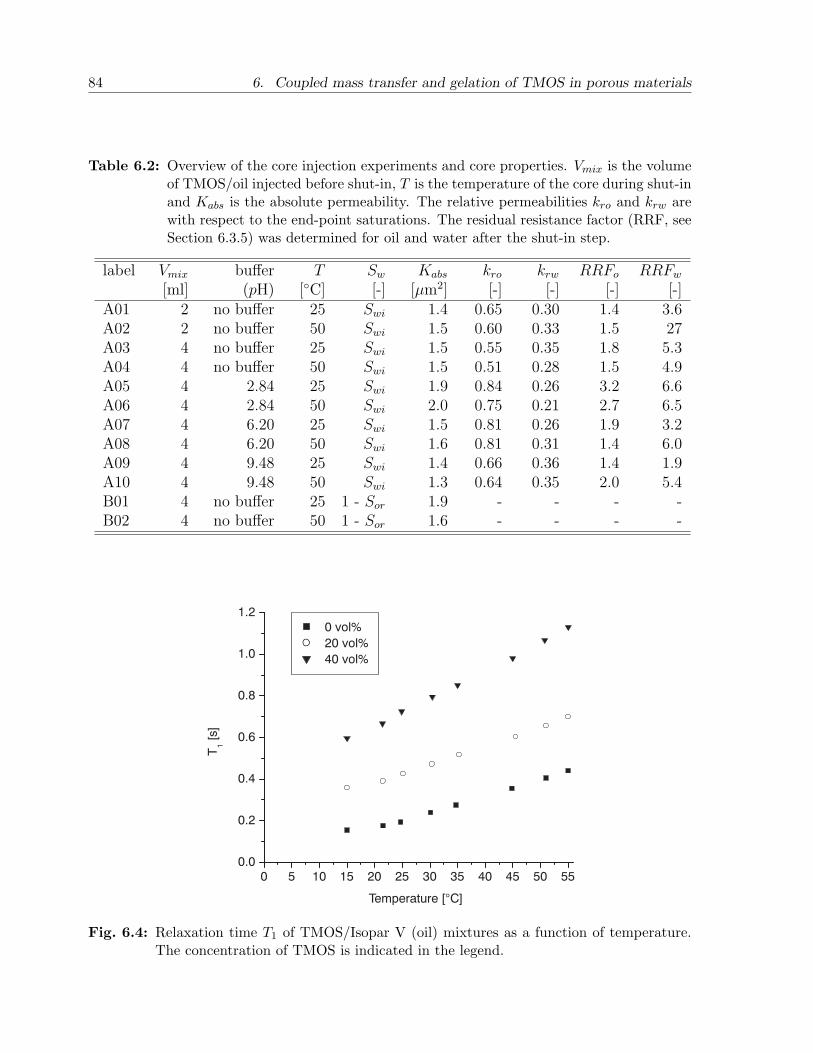
84 6. Coupled mass transfer and gelation of TMOS in porous materials
Table 6.2: Overview of the core injection experiments and core properties. Vmix is the volumeof TMOS/oil injected before shut-in, T is the temperature of the core during shut-inand Kabs is the absolute permeability. The relative permeabilities kro and krw arewith respect to the end-point saturations. The residual resistance factor (RRF, seeSection 6.3.5) was determined for oil and water after the shut-in step.
label Vmix buffer T Sw Kabs kro krw RRFo RRFw
[ml] (pH) [C] [-] [µm2] [-] [-] [-] [-]A01 2 no buffer 25 Swi 1.4 0.65 0.30 1.4 3.6A02 2 no buffer 50 Swi 1.5 0.60 0.33 1.5 27A03 4 no buffer 25 Swi 1.5 0.55 0.35 1.8 5.3A04 4 no buffer 50 Swi 1.5 0.51 0.28 1.5 4.9A05 4 2.84 25 Swi 1.9 0.84 0.26 3.2 6.6A06 4 2.84 50 Swi 2.0 0.75 0.21 2.7 6.5A07 4 6.20 25 Swi 1.5 0.81 0.26 1.9 3.2A08 4 6.20 50 Swi 1.6 0.81 0.31 1.4 6.0A09 4 9.48 25 Swi 1.4 0.66 0.36 1.4 1.9A10 4 9.48 50 Swi 1.3 0.64 0.35 2.0 5.4B01 4 no buffer 25 1 - Sor 1.9 - - - -B02 4 no buffer 50 1 - Sor 1.6 - - - -
0 5 10 15 20 25 30 35 40 45 50 550.0
0.2
0.4
0.6
0.8
1.0
1.2
0 vol%
20 vol%
40 vol%
T1 [s]
Temperature [°C]
Fig. 6.4: Relaxation time T1 of TMOS/Isopar V (oil) mixtures as a function of temperature.The concentration of TMOS is indicated in the legend.
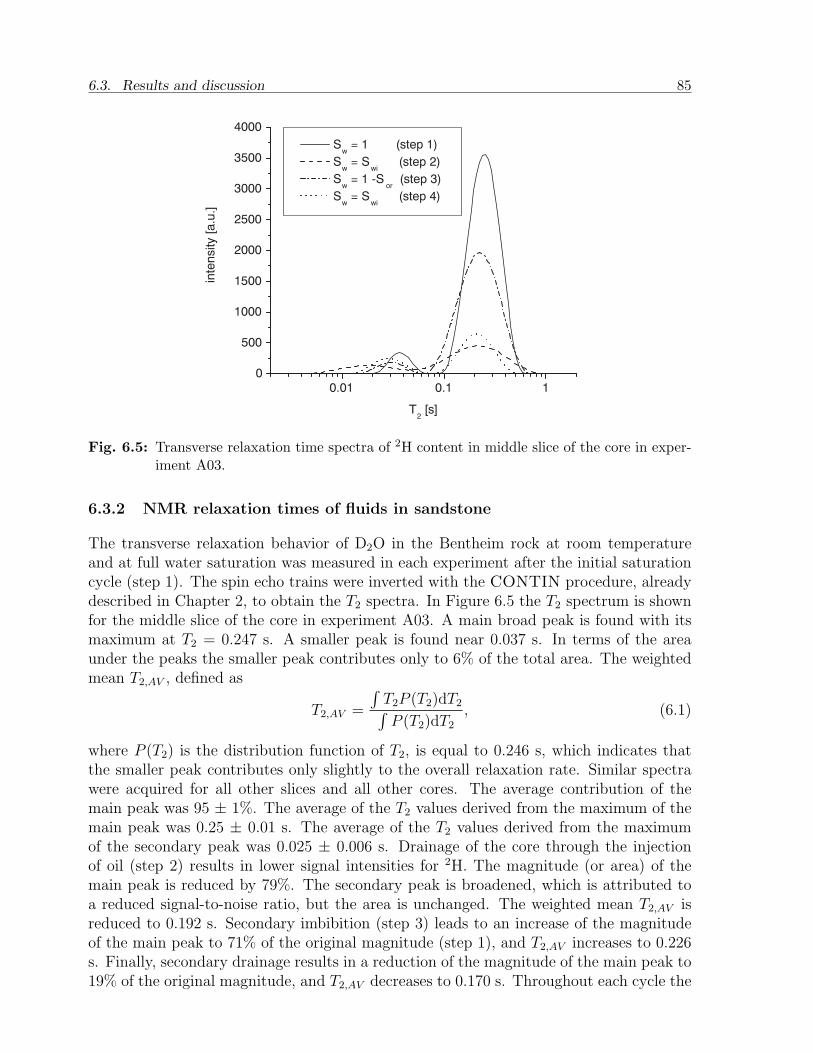
6.3. Results and discussion 85
0.01 0.1 10
500
1000
1500
2000
2500
3000
3500
4000
inte
nsity [
a.u
.]
T2 [s]
Sw = 1 (step 1)
Sw = S
wi (step 2)
Sw = 1 -S
or (step 3)
Sw = S
wi (step 4)
Fig. 6.5: Transverse relaxation time spectra of 2H content in middle slice of the core in exper-iment A03.
6.3.2 NMR relaxation times of fluids in sandstone
The transverse relaxation behavior of D2O in the Bentheim rock at room temperatureand at full water saturation was measured in each experiment after the initial saturationcycle (step 1). The spin echo trains were inverted with the CONTIN procedure, alreadydescribed in Chapter 2, to obtain the T2 spectra. In Figure 6.5 the T2 spectrum is shownfor the middle slice of the core in experiment A03. A main broad peak is found with itsmaximum at T2 = 0.247 s. A smaller peak is found near 0.037 s. In terms of the areaunder the peaks the smaller peak contributes only to 6% of the total area. The weightedmean T2,AV , defined as
T2,AV =
∫T2P (T2)dT2∫P (T2)dT2
, (6.1)
where P (T2) is the distribution function of T2, is equal to 0.246 s, which indicates thatthe smaller peak contributes only slightly to the overall relaxation rate. Similar spectrawere acquired for all other slices and all other cores. The average contribution of themain peak was 95 ± 1%. The average of the T2 values derived from the maximum of themain peak was 0.25 ± 0.01 s. The average of the T2 values derived from the maximumof the secondary peak was 0.025 ± 0.006 s. Drainage of the core through the injectionof oil (step 2) results in lower signal intensities for 2H. The magnitude (or area) of themain peak is reduced by 79%. The secondary peak is broadened, which is attributed toa reduced signal-to-noise ratio, but the area is unchanged. The weighted mean T2,AV isreduced to 0.192 s. Secondary imbibition (step 3) leads to an increase of the magnitudeof the main peak to 71% of the original magnitude (step 1), and T2,AV increases to 0.226s. Finally, secondary drainage results in a reduction of the magnitude of the main peak to19% of the original magnitude, and T2,AV decreases to 0.170 s. Throughout each cycle the
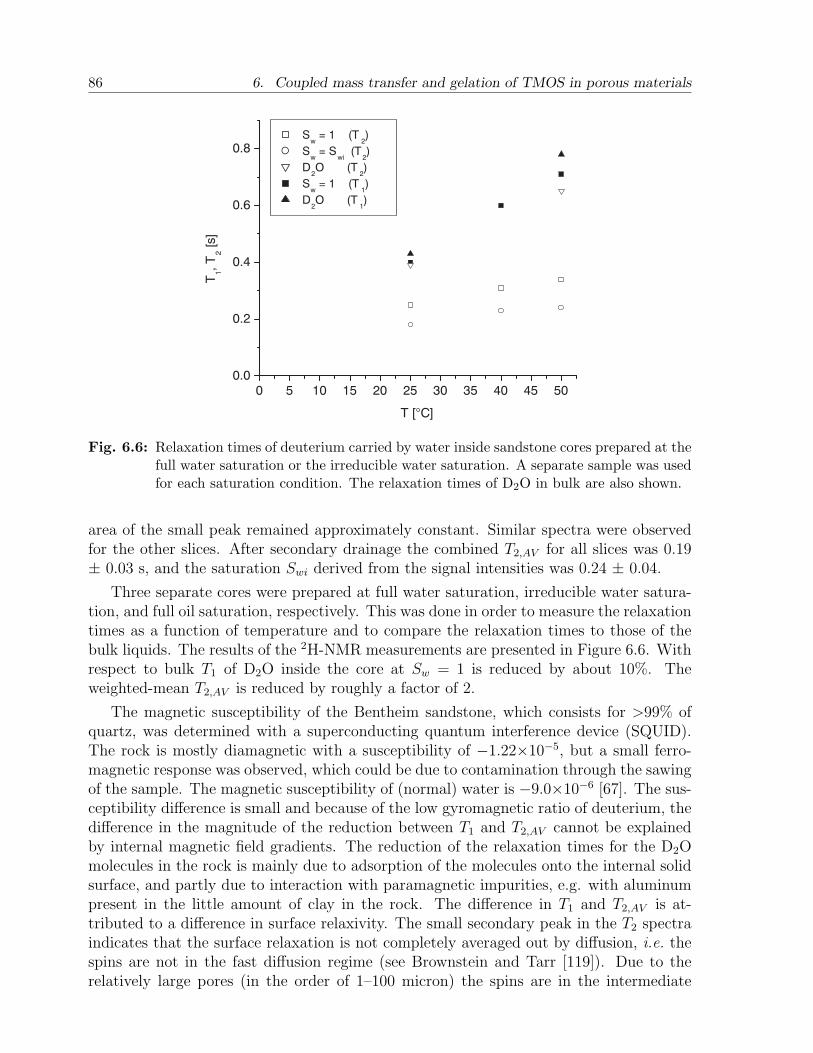
86 6. Coupled mass transfer and gelation of TMOS in porous materials
0 5 10 15 20 25 30 35 40 45 500.0
0.2
0.4
0.6
0.8
T1, T
2 [s]
T [°C]
Sw = 1 (T
2)
Sw = S
wi (T
2)
D2O (T
2)
Sw = 1 (T
1)
D2O (T
1)
Fig. 6.6: Relaxation times of deuterium carried by water inside sandstone cores prepared at thefull water saturation or the irreducible water saturation. A separate sample was usedfor each saturation condition. The relaxation times of D2O in bulk are also shown.
area of the small peak remained approximately constant. Similar spectra were observedfor the other slices. After secondary drainage the combined T2,AV for all slices was 0.19± 0.03 s, and the saturation Swi derived from the signal intensities was 0.24 ± 0.04.
Three separate cores were prepared at full water saturation, irreducible water satura-tion, and full oil saturation, respectively. This was done in order to measure the relaxationtimes as a function of temperature and to compare the relaxation times to those of thebulk liquids. The results of the 2H-NMR measurements are presented in Figure 6.6. Withrespect to bulk T1 of D2O inside the core at Sw = 1 is reduced by about 10%. Theweighted-mean T2,AV is reduced by roughly a factor of 2.
The magnetic susceptibility of the Bentheim sandstone, which consists for >99% ofquartz, was determined with a superconducting quantum interference device (SQUID).The rock is mostly diamagnetic with a susceptibility of −1.22×10⁻⁵, but a small ferro-magnetic response was observed, which could be due to contamination through the sawingof the sample. The magnetic susceptibility of (normal) water is −9.0×10⁻⁶ [67]. The sus-ceptibility difference is small and because of the low gyromagnetic ratio of deuterium, thedifference in the magnitude of the reduction between T1 and T2,AV cannot be explainedby internal magnetic field gradients. The reduction of the relaxation times for the D2Omolecules in the rock is mainly due to adsorption of the molecules onto the internal solidsurface, and partly due to interaction with paramagnetic impurities, e.g. with aluminumpresent in the little amount of clay in the rock. The difference in T1 and T2,AV is at-tributed to a difference in surface relaxivity. The small secondary peak in the T2 spectraindicates that the surface relaxation is not completely averaged out by diffusion, i.e. thespins are not in the fast diffusion regime (see Brownstein and Tarr [119]). Due to therelatively large pores (in the order of 1–100 micron) the spins are in the intermediate
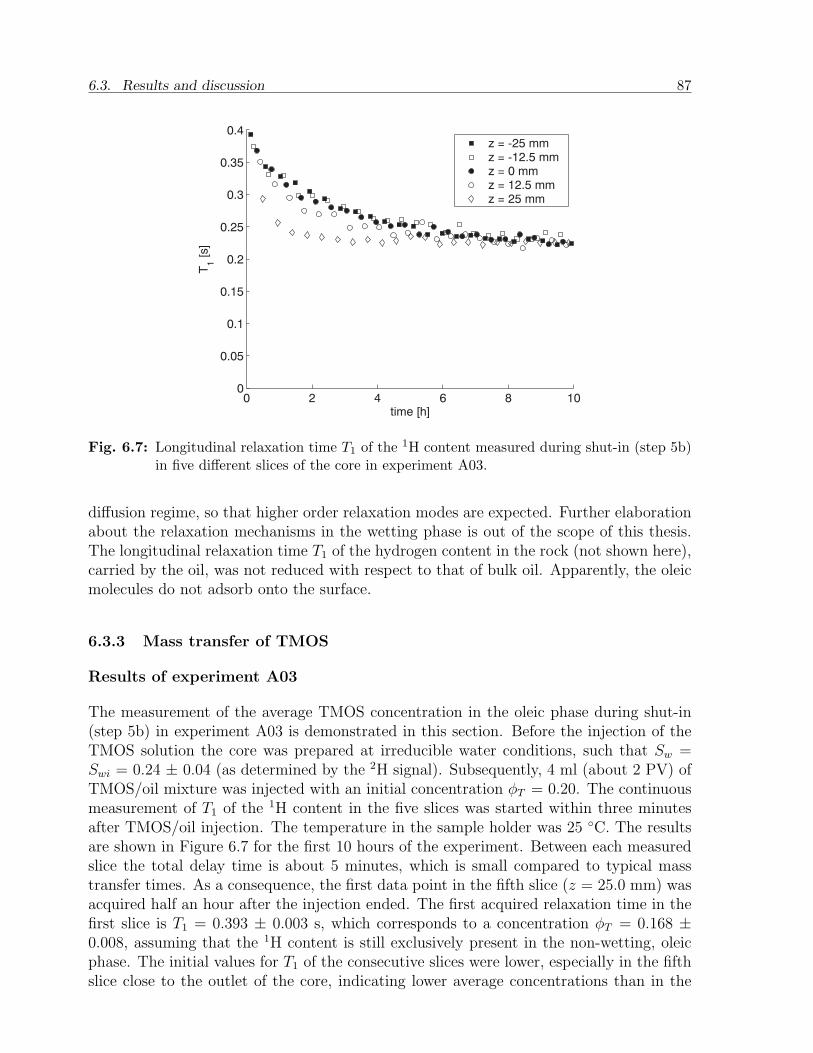
6.3. Results and discussion 87
0 2 4 6 8 100
0.05
0.1
0.15
0.2
0.25
0.3
0.35
0.4
time [h]
T1 [s]
z = -25 mmz = -12.5 mmz = 0 mmz = 12.5 mmz = 25 mm
Fig. 6.7: Longitudinal relaxation time T1 of the 1H content measured during shut-in (step 5b)in five different slices of the core in experiment A03.
diffusion regime, so that higher order relaxation modes are expected. Further elaborationabout the relaxation mechanisms in the wetting phase is out of the scope of this thesis.The longitudinal relaxation time T1 of the hydrogen content in the rock (not shown here),carried by the oil, was not reduced with respect to that of bulk oil. Apparently, the oleicmolecules do not adsorb onto the surface.
6.3.3 Mass transfer of TMOS
Results of experiment A03
The measurement of the average TMOS concentration in the oleic phase during shut-in(step 5b) in experiment A03 is demonstrated in this section. Before the injection of theTMOS solution the core was prepared at irreducible water conditions, such that Sw =Swi = 0.24 ± 0.04 (as determined by the 2H signal). Subsequently, 4 ml (about 2 PV) ofTMOS/oil mixture was injected with an initial concentration φT = 0.20. The continuousmeasurement of T1 of the 1H content in the five slices was started within three minutesafter TMOS/oil injection. The temperature in the sample holder was 25 C. The resultsare shown in Figure 6.7 for the first 10 hours of the experiment. Between each measuredslice the total delay time is about 5 minutes, which is small compared to typical masstransfer times. As a consequence, the first data point in the fifth slice (z = 25.0 mm) wasacquired half an hour after the injection ended. The first acquired relaxation time in thefirst slice is T1 = 0.393 ± 0.003 s, which corresponds to a concentration φT = 0.168 ±0.008, assuming that the 1H content is still exclusively present in the non-wetting, oleicphase. The initial values for T1 of the consecutive slices were lower, especially in the fifthslice close to the outlet of the core, indicating lower average concentrations than in the
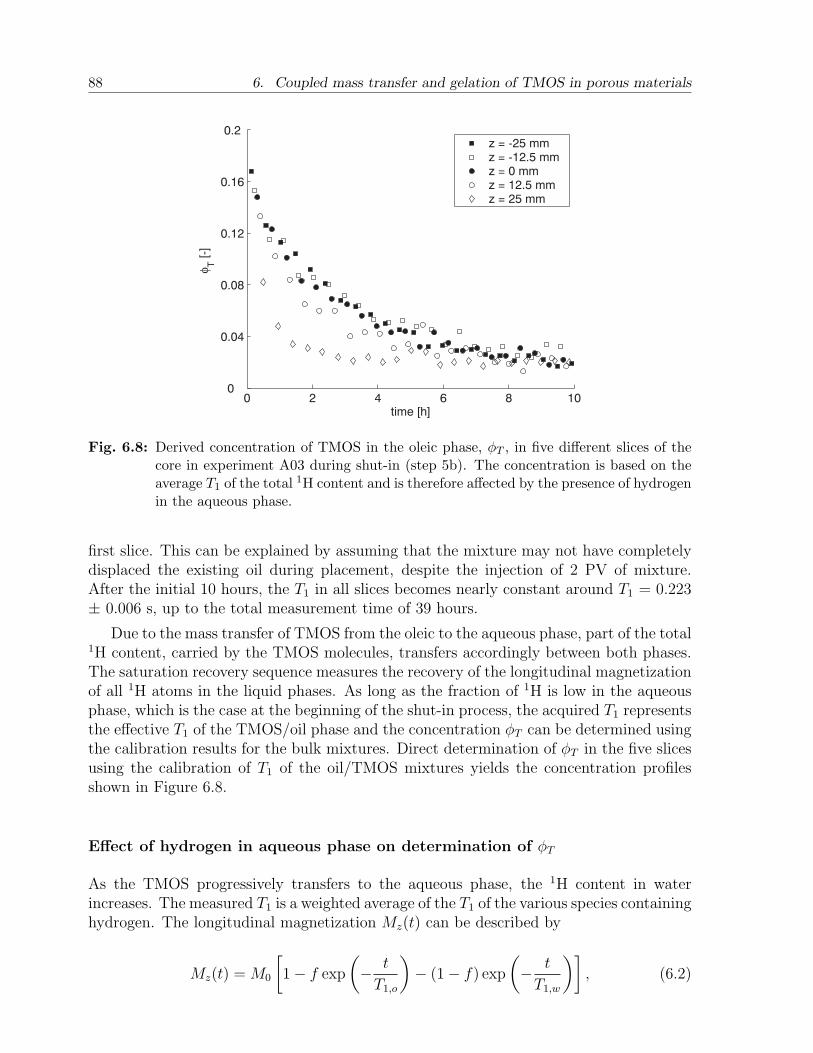
88 6. Coupled mass transfer and gelation of TMOS in porous materials
0 2 4 6 8 100
0.04
0.08
0.12
0.16
0.2
time [h]
φT [-]
z = -25 mmz = -12.5 mmz = 0 mmz = 12.5 mmz = 25 mm
Fig. 6.8: Derived concentration of TMOS in the oleic phase, φT , in five different slices of thecore in experiment A03 during shut-in (step 5b). The concentration is based on theaverage T1 of the total 1H content and is therefore affected by the presence of hydrogenin the aqueous phase.
first slice. This can be explained by assuming that the mixture may not have completelydisplaced the existing oil during placement, despite the injection of 2 PV of mixture.After the initial 10 hours, the T1 in all slices becomes nearly constant around T1 = 0.223± 0.006 s, up to the total measurement time of 39 hours.
Due to the mass transfer of TMOS from the oleic to the aqueous phase, part of the total1H content, carried by the TMOS molecules, transfers accordingly between both phases.The saturation recovery sequence measures the recovery of the longitudinal magnetizationof all 1H atoms in the liquid phases. As long as the fraction of 1H is low in the aqueousphase, which is the case at the beginning of the shut-in process, the acquired T1 representsthe effective T1 of the TMOS/oil phase and the concentration φT can be determined usingthe calibration results for the bulk mixtures. Direct determination of φT in the five slicesusing the calibration of T1 of the oil/TMOS mixtures yields the concentration profilesshown in Figure 6.8.
Effect of hydrogen in aqueous phase on determination of φT
As the TMOS progressively transfers to the aqueous phase, the 1H content in waterincreases. The measured T1 is a weighted average of the T1 of the various species containinghydrogen. The longitudinal magnetization Mz(t) can be described by
Mz(t) = M0
[1− f exp
(− t
T1,o
)− (1− f) exp
(− t
T1,w
)], (6.2)
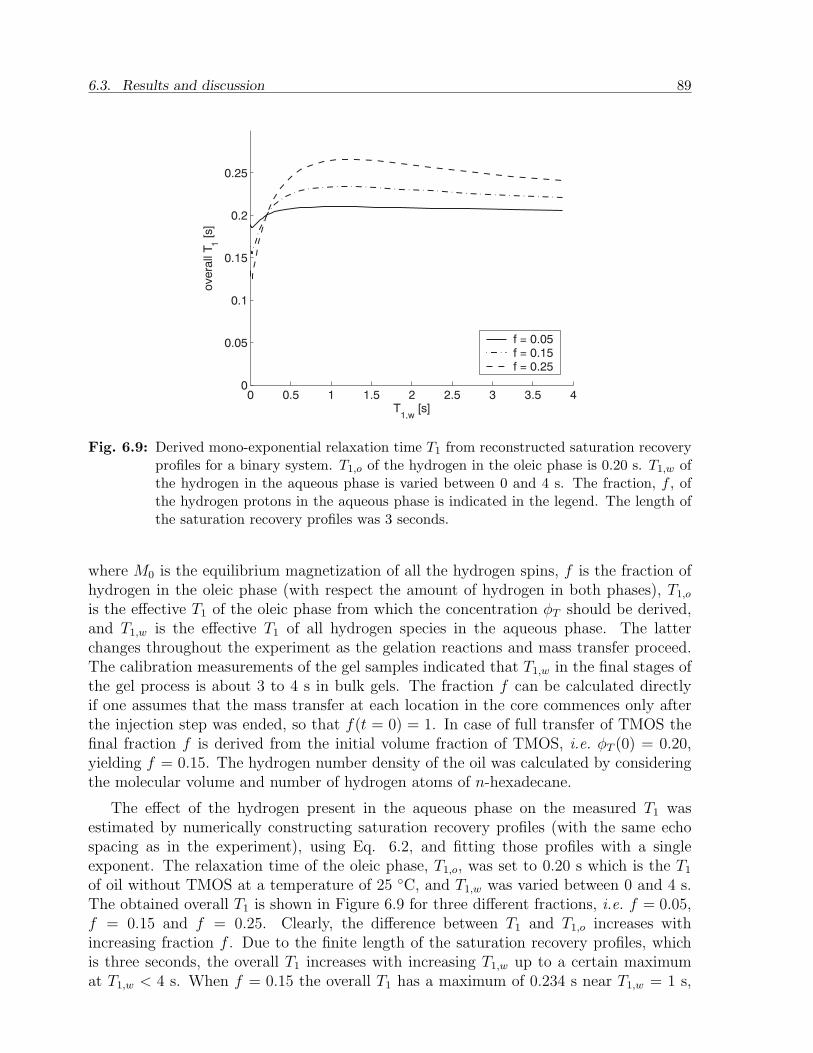
6.3. Results and discussion 89
0 0.5 1 1.5 2 2.5 3 3.5 40
0.05
0.1
0.15
0.2
0.25
T1,w
[s]
ove
rall
T1 [
s]
f = 0.05f = 0.15f = 0.25
Fig. 6.9: Derived mono-exponential relaxation time T1 from reconstructed saturation recoveryprofiles for a binary system. T1,o of the hydrogen in the oleic phase is 0.20 s. T1,w ofthe hydrogen in the aqueous phase is varied between 0 and 4 s. The fraction, f , ofthe hydrogen protons in the aqueous phase is indicated in the legend. The length ofthe saturation recovery profiles was 3 seconds.
where M0 is the equilibrium magnetization of all the hydrogen spins, f is the fraction ofhydrogen in the oleic phase (with respect the amount of hydrogen in both phases), T1,o
is the effective T1 of the oleic phase from which the concentration φT should be derived,and T1,w is the effective T1 of all hydrogen species in the aqueous phase. The latterchanges throughout the experiment as the gelation reactions and mass transfer proceed.The calibration measurements of the gel samples indicated that T1,w in the final stages ofthe gel process is about 3 to 4 s in bulk gels. The fraction f can be calculated directlyif one assumes that the mass transfer at each location in the core commences only afterthe injection step was ended, so that f(t = 0) = 1. In case of full transfer of TMOS thefinal fraction f is derived from the initial volume fraction of TMOS, i.e. φT (0) = 0.20,yielding f = 0.15. The hydrogen number density of the oil was calculated by consideringthe molecular volume and number of hydrogen atoms of n-hexadecane.
The effect of the hydrogen present in the aqueous phase on the measured T1 wasestimated by numerically constructing saturation recovery profiles (with the same echospacing as in the experiment), using Eq. 6.2, and fitting those profiles with a singleexponent. The relaxation time of the oleic phase, T1,o, was set to 0.20 s which is the T1
of oil without TMOS at a temperature of 25 C, and T1,w was varied between 0 and 4 s.The obtained overall T1 is shown in Figure 6.9 for three different fractions, i.e. f = 0.05,f = 0.15 and f = 0.25. Clearly, the difference between T1 and T1,o increases withincreasing fraction f . Due to the finite length of the saturation recovery profiles, whichis three seconds, the overall T1 increases with increasing T1,w up to a certain maximumat T1,w < 4 s. When f = 0.15 the overall T1 has a maximum of 0.234 s near T1,w = 1 s,
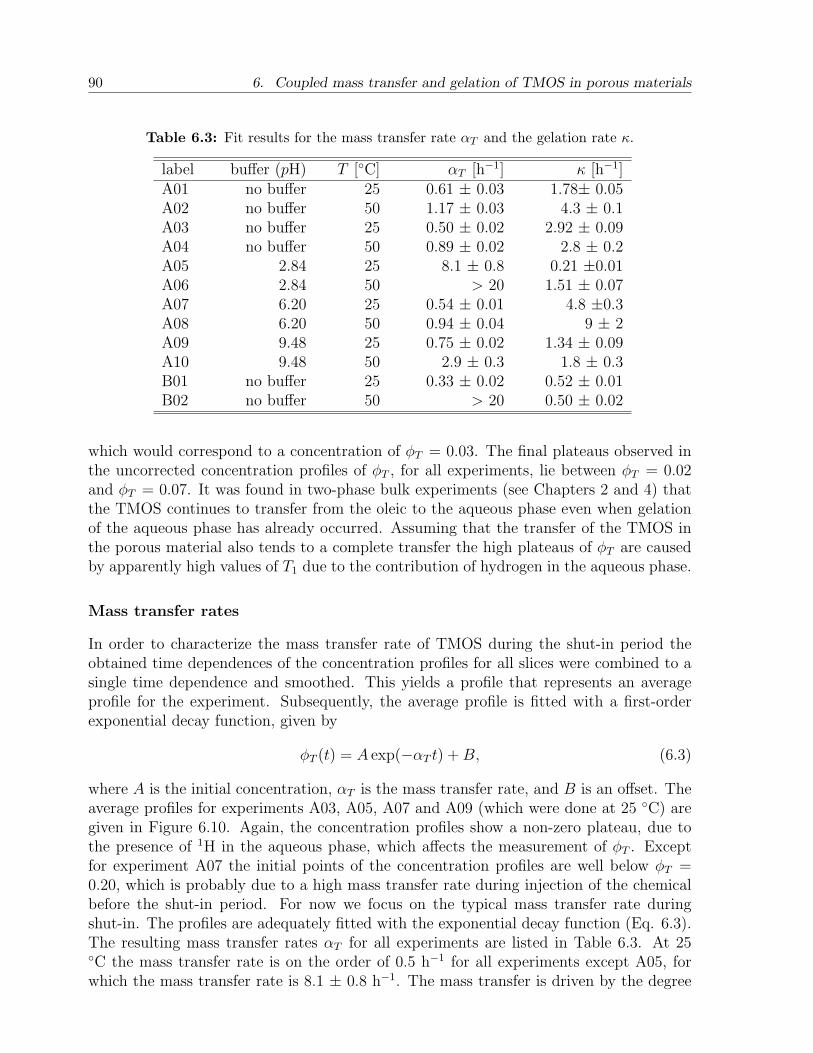
90 6. Coupled mass transfer and gelation of TMOS in porous materials
Table 6.3: Fit results for the mass transfer rate αT and the gelation rate κ.
label buffer (pH) T [C] αT [h−1] κ [h−1]A01 no buffer 25 0.61 ± 0.03 1.78± 0.05A02 no buffer 50 1.17 ± 0.03 4.3 ± 0.1A03 no buffer 25 0.50 ± 0.02 2.92 ± 0.09A04 no buffer 50 0.89 ± 0.02 2.8 ± 0.2A05 2.84 25 8.1 ± 0.8 0.21 ±0.01A06 2.84 50 > 20 1.51 ± 0.07A07 6.20 25 0.54 ± 0.01 4.8 ±0.3A08 6.20 50 0.94 ± 0.04 9 ± 2A09 9.48 25 0.75 ± 0.02 1.34 ± 0.09A10 9.48 50 2.9 ± 0.3 1.8 ± 0.3B01 no buffer 25 0.33 ± 0.02 0.52 ± 0.01B02 no buffer 50 > 20 0.50 ± 0.02
which would correspond to a concentration of φT = 0.03. The final plateaus observed inthe uncorrected concentration profiles of φT , for all experiments, lie between φT = 0.02and φT = 0.07. It was found in two-phase bulk experiments (see Chapters 2 and 4) thatthe TMOS continues to transfer from the oleic to the aqueous phase even when gelationof the aqueous phase has already occurred. Assuming that the transfer of the TMOS inthe porous material also tends to a complete transfer the high plateaus of φT are causedby apparently high values of T1 due to the contribution of hydrogen in the aqueous phase.
Mass transfer rates
In order to characterize the mass transfer rate of TMOS during the shut-in period theobtained time dependences of the concentration profiles for all slices were combined to asingle time dependence and smoothed. This yields a profile that represents an averageprofile for the experiment. Subsequently, the average profile is fitted with a first-orderexponential decay function, given by
φT (t) = A exp(−αT t) + B, (6.3)
where A is the initial concentration, αT is the mass transfer rate, and B is an offset. Theaverage profiles for experiments A03, A05, A07 and A09 (which were done at 25 C) aregiven in Figure 6.10. Again, the concentration profiles show a non-zero plateau, due tothe presence of 1H in the aqueous phase, which affects the measurement of φT . Exceptfor experiment A07 the initial points of the concentration profiles are well below φT =0.20, which is probably due to a high mass transfer rate during injection of the chemicalbefore the shut-in period. For now we focus on the typical mass transfer rate duringshut-in. The profiles are adequately fitted with the exponential decay function (Eq. 6.3).The resulting mass transfer rates αT for all experiments are listed in Table 6.3. At 25C the mass transfer rate is on the order of 0.5 h−1 for all experiments except A05, forwhich the mass transfer rate is 8.1 ± 0.8 h−1. The mass transfer is driven by the degree
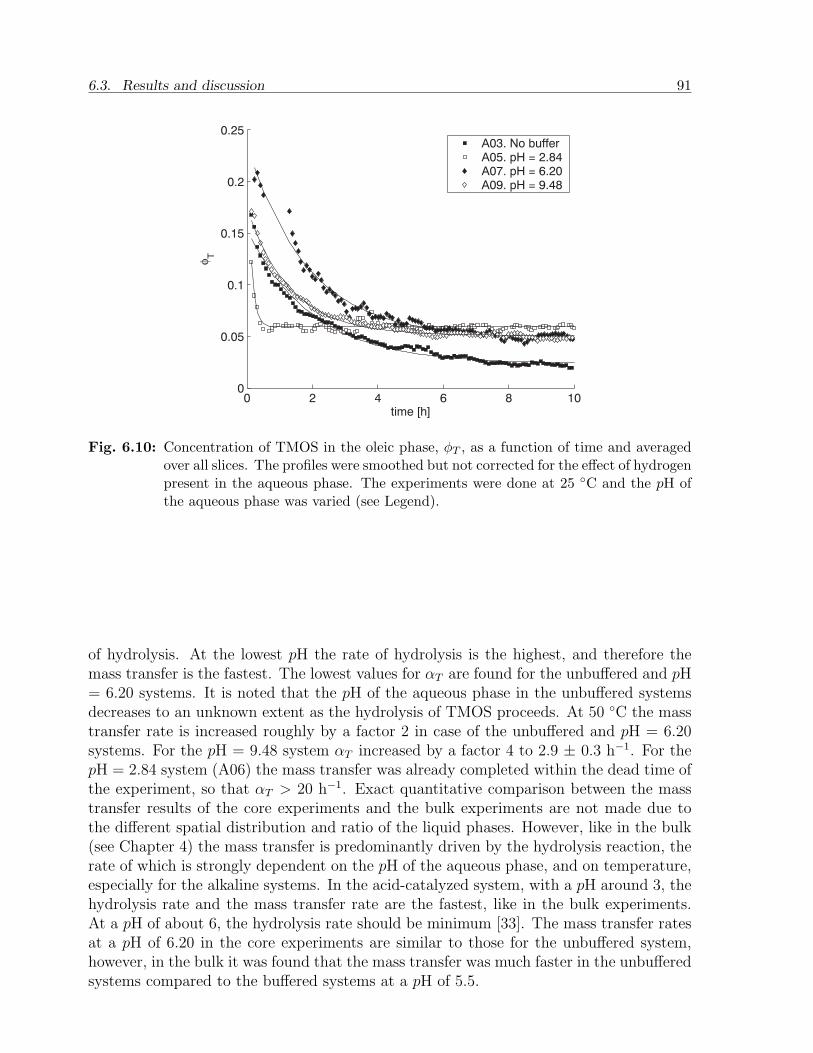
6.3. Results and discussion 91
0 2 4 6 8 100
0.05
0.1
0.15
0.2
0.25
time [h]
φT
A03. No bufferA05. pH = 2.84A07. pH = 6.20A09. pH = 9.48
Fig. 6.10: Concentration of TMOS in the oleic phase, φT , as a function of time and averagedover all slices. The profiles were smoothed but not corrected for the effect of hydrogenpresent in the aqueous phase. The experiments were done at 25 C and the pH ofthe aqueous phase was varied (see Legend).
of hydrolysis. At the lowest pH the rate of hydrolysis is the highest, and therefore themass transfer is the fastest. The lowest values for αT are found for the unbuffered and pH= 6.20 systems. It is noted that the pH of the aqueous phase in the unbuffered systemsdecreases to an unknown extent as the hydrolysis of TMOS proceeds. At 50 C the masstransfer rate is increased roughly by a factor 2 in case of the unbuffered and pH = 6.20systems. For the pH = 9.48 system αT increased by a factor 4 to 2.9 ± 0.3 h−1. For thepH = 2.84 system (A06) the mass transfer was already completed within the dead time ofthe experiment, so that αT > 20 h−1. Exact quantitative comparison between the masstransfer results of the core experiments and the bulk experiments are not made due tothe different spatial distribution and ratio of the liquid phases. However, like in the bulk(see Chapter 4) the mass transfer is predominantly driven by the hydrolysis reaction, therate of which is strongly dependent on the pH of the aqueous phase, and on temperature,especially for the alkaline systems. In the acid-catalyzed system, with a pH around 3, thehydrolysis rate and the mass transfer rate are the fastest, like in the bulk experiments.At a pH of about 6, the hydrolysis rate should be minimum [33]. The mass transfer ratesat a pH of 6.20 in the core experiments are similar to those for the unbuffered system,however, in the bulk it was found that the mass transfer was much faster in the unbufferedsystems compared to the buffered systems at a pH of 5.5.
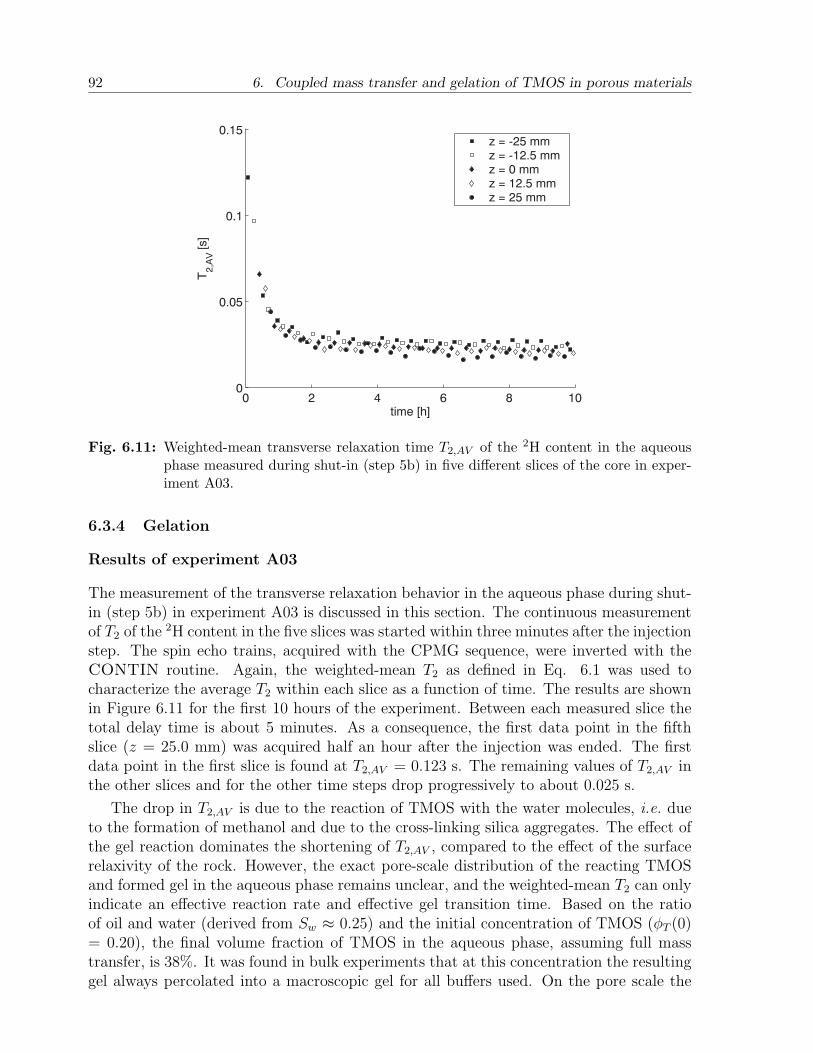
92 6. Coupled mass transfer and gelation of TMOS in porous materials
0 2 4 6 8 100
0.05
0.1
0.15
time [h]
T2,A
V [
s]
z = -25 mmz = -12.5 mmz = 0 mmz = 12.5 mmz = 25 mm
Fig. 6.11: Weighted-mean transverse relaxation time T2,AV of the 2H content in the aqueousphase measured during shut-in (step 5b) in five different slices of the core in exper-iment A03.
6.3.4 Gelation
Results of experiment A03
The measurement of the transverse relaxation behavior in the aqueous phase during shut-in (step 5b) in experiment A03 is discussed in this section. The continuous measurementof T2 of the 2H content in the five slices was started within three minutes after the injectionstep. The spin echo trains, acquired with the CPMG sequence, were inverted with theCONTIN routine. Again, the weighted-mean T2 as defined in Eq. 6.1 was used tocharacterize the average T2 within each slice as a function of time. The results are shownin Figure 6.11 for the first 10 hours of the experiment. Between each measured slice thetotal delay time is about 5 minutes. As a consequence, the first data point in the fifthslice (z = 25.0 mm) was acquired half an hour after the injection was ended. The firstdata point in the first slice is found at T2,AV = 0.123 s. The remaining values of T2,AV inthe other slices and for the other time steps drop progressively to about 0.025 s.
The drop in T2,AV is due to the reaction of TMOS with the water molecules, i.e. dueto the formation of methanol and due to the cross-linking silica aggregates. The effect ofthe gel reaction dominates the shortening of T2,AV , compared to the effect of the surfacerelaxivity of the rock. However, the exact pore-scale distribution of the reacting TMOSand formed gel in the aqueous phase remains unclear, and the weighted-mean T2 can onlyindicate an effective reaction rate and effective gel transition time. Based on the ratioof oil and water (derived from Sw ≈ 0.25) and the initial concentration of TMOS (φT (0)= 0.20), the final volume fraction of TMOS in the aqueous phase, assuming full masstransfer, is 38%. It was found in bulk experiments that at this concentration the resultinggel always percolated into a macroscopic gel for all buffers used. On the pore scale the
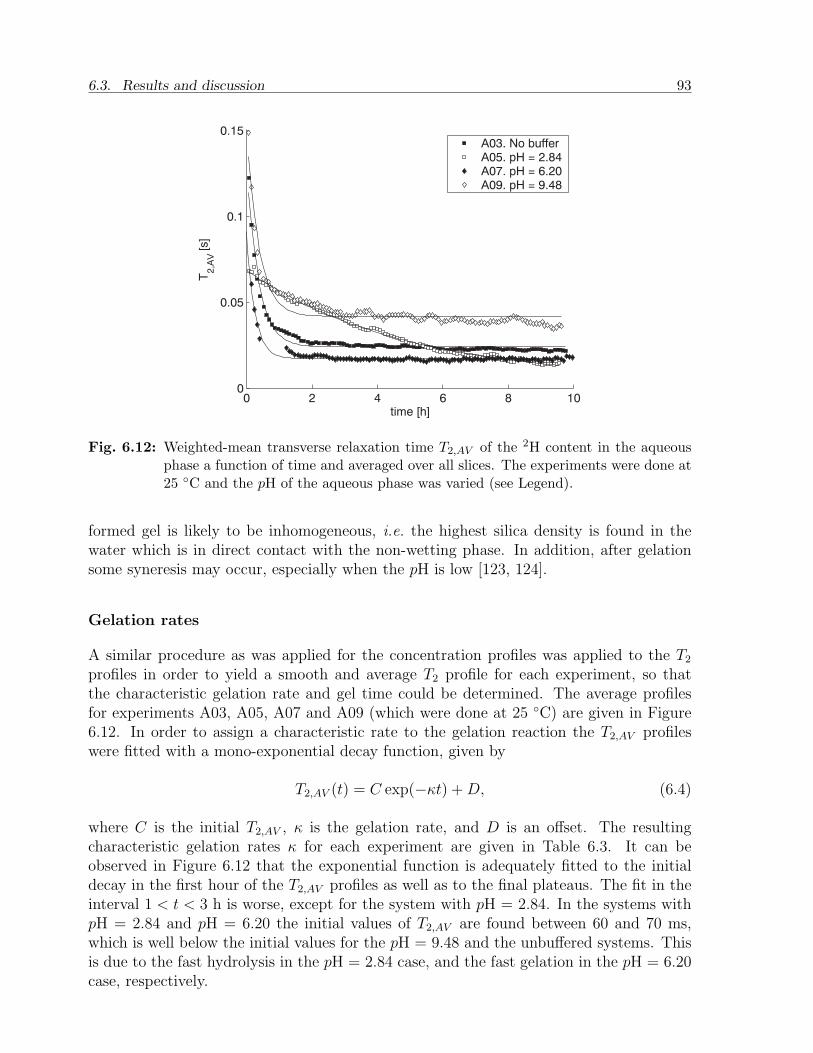
6.3. Results and discussion 93
0 2 4 6 8 100
0.05
0.1
0.15
time [h]
T2,A
V [s]
A03. No bufferA05. pH = 2.84A07. pH = 6.20A09. pH = 9.48
Fig. 6.12: Weighted-mean transverse relaxation time T2,AV of the 2H content in the aqueousphase a function of time and averaged over all slices. The experiments were done at25 C and the pH of the aqueous phase was varied (see Legend).
formed gel is likely to be inhomogeneous, i.e. the highest silica density is found in thewater which is in direct contact with the non-wetting phase. In addition, after gelationsome syneresis may occur, especially when the pH is low [123, 124].
Gelation rates
A similar procedure as was applied for the concentration profiles was applied to the T2
profiles in order to yield a smooth and average T2 profile for each experiment, so thatthe characteristic gelation rate and gel time could be determined. The average profilesfor experiments A03, A05, A07 and A09 (which were done at 25 C) are given in Figure6.12. In order to assign a characteristic rate to the gelation reaction the T2,AV profileswere fitted with a mono-exponential decay function, given by
T2,AV (t) = C exp(−κt) + D, (6.4)
where C is the initial T2,AV , κ is the gelation rate, and D is an offset. The resultingcharacteristic gelation rates κ for each experiment are given in Table 6.3. It can beobserved in Figure 6.12 that the exponential function is adequately fitted to the initialdecay in the first hour of the T2,AV profiles as well as to the final plateaus. The fit in theinterval 1 < t < 3 h is worse, except for the system with pH = 2.84. In the systems withpH = 2.84 and pH = 6.20 the initial values of T2,AV are found between 60 and 70 ms,which is well below the initial values for the pH = 9.48 and the unbuffered systems. Thisis due to the fast hydrolysis in the pH = 2.84 case, and the fast gelation in the pH = 6.20case, respectively.
94 6. Coupled mass transfer and gelation of TMOS in porous materials
In bulk systems it was found that the initial decay of T2 in the aqueous phase wasequally fast for the pH = 9.48 system and the pH ≈ 6 system. Here the relatively slowdecay of T2,AV in the pH = 9.48 case suggests that the gel reaction is slower compared to theunbuffered case and the pH = 6.20 case. However, the relaxation time T2,AV is an averageof the T2 spectrum obtained with the inversion routine. It was found that especially forthe pH = 9.48 case (experiments A09 and A10) the T2 spectra showed a relatively highcontribution of the long T2 peak (around 100 ms) throughout the measurement interval,which also explains the high plateau value of T2,AV around 50 ms. This is indicative ofa fast and inhomogeneous gelation of the water in contact with the oleic phase, so thata large amount of water in the aqueous phase has not turned into a gel. The effect wasobserved within each slice.
The fitted parameter κ (see Table 6.3) reveals that, for a consistent set of conditions(experiments A03 through A10), the decay of T2,AV is the fastest for the pH = 6.20 systemand the slowest for the acid-catalyzed system. Increasing the temperature from 25 C to50 C for most systems results in an increase of κ by roughly a factor of 2, except for theunbuffered systems, for which the inconsistent results cannot be explained at this point.The acid-catalyzed system appears to be most sensitive to temperature in terms of κ.The low values of κ of about 0.5 h−1 in the experiments B01 and B02, compared to theexperiments A01 through A04, are expected since the cores were prepared at residual oil(B01 and B02). Therefore, the ratio of water/oil is much higher and the concentration ofTMOS – which partitions between both phases – in the aqueous phase is lower than thatin the experiments A01 through A10.
6.3.5 Effect of treatment on permeability
The absolute permeability Kabs of each core is listed in Table 6.2. The permeabilityfor water at full water saturation was found to vary between 1.3 and 2.0 µm2. It isnoted that despite the use of vacuum in the initial saturation step a slight amount ofair was reintroduced in the cores when they were put in the core holder and the tubingwas connected. The presence of air bubbles, as a non-wetting phase, in the core lowersthe apparent absolute permeability. Some of the experiments showed a high relativepermeability to oil (kro ≈ 0.8) in the primary drainage cycle. Since the oil would replacethe air bubbles present, this indicates that the measured Kabs should be higher andkro lower. However, quantitative corrections cannot be made. The effect of the geltreatments is expressed in the residual resistance factor, RRF , which is the ratio ofthe relative permeability for oil or water after treatment and the relative permeabilitybefore treatment. Both of these are based on the same Kabs so that the accuracy of theabsolute value becomes less important. The relative permeability krw after the secondaryimbibition cycle (step 3) was found to vary between 0.21 and 0.36, and the relativepermeability kro after the secondary drainage cycle (step 4) was found to vary between0.51 and 0.84. The much lower water relative permeability compared to the oil relativepermeability is expected in a water-wet core [118].
In the post-treatment injection steps (step 6 and step 7) the differential pressureshowed a highly erratic behavior at a given flow rate during the initial 10 to 20 minutes.This is attributed to displacement of or damage to the gel which is formed in the pore
6.4. Conclusion 95
space by the flow of oil or water, though the flow rate was always limited to keep thepressure below 1500 mbar. Due to the mass transfer of TMOS during shut-in the volumeof the non-wetting oleic phase decreases by about 20% and the volume of the aqueousphase increases by the same amount. The injection of oil in step 6 is therefore likelyto result in a partial displacement of the gelled water. The water that is injected aftertreatment in step 7 will either displace the gel, be forced to flow between the gel and thenon-wetting phase or between the gel and the pore wall, or will channel through the gel.The intrinsic permeability of the wet gel is typically between 1 and 100 nm2 [123, 125] sothat the contribution of flow through undamaged gel can be neglected. It was observed inthe experiments that the differential pressure stabilized at a fixed flow rate after the initialperiod of 10 to 20 minutes. Subsequently, the oil and water relative permeability weredetermined in step 6, respectively step 7, by using Kabs determined in the first injectionstep. One could argue that the pore structure is modified by the formed silica gel, andthat the absolute permeability changes accordingly. Nevertheless, the original Kabs wasused in order to quantify the effect of the treatment on the relative permeabilities.
The residual resistance factors for oil (RRFo) and water (RRFw) are given in Table6.2. The gel treatment always led to a reduction of the permeability to oil. The measuredparameter RRFo varied between 1.4 and 2.0 for most of the experiments. Slightly highervalues (RRFo ≈ 3) were found when the acid buffer was used. Acid-catalyzed gels areprone to syneresis [123, 124] so that the silica density and the stiffness are increased.This may explain the relatively high resistance to flow even for the non-wetting phase.The values for RRFw are within a broad range between 1.9 and 27. The unusuallyhigh value for experiment A02 might be due to partial blocking of the outlet by thegel. Nevertheless, in each experiment RRFw was found to be 1.5 to 4 times higher thanRRFo, and therefore the gel treatment effectively results in a permeability reduction forwater without a significant reduction of the oil relative permeability. The significantvariation in RRFw suggests that the flow reduction is sensitive to parameters other thanthe conditions during the gel formation (pH and temperature). The relative permeabilitieswere not measured in experiments B01 and B02.
6.4 Conclusion
In situ characterization of the coupled mass transfer and gelation of TMOS within anatural porous material under two-phase conditions was achieved with the bi-nuclearNMR measurements on TMOS/oil and heavy water. Despite the uncertainty, for eachslice and time step, in the measured average TMOS concentration φT of about ± 0.05,the TMOS appears to transfer almost completely from the oleic to the aqueous phase ona time scale of less than an hour to more than 5 hours. Like in the bulk, the mass transferof TMOS is driven by the rate of hydrolysis. Around pH = 6 and for the unbufferedsystems the rate is the lowest, whereas the hydolysis rates, and thus the mass transferrates, are increased in the acid- and base-catalyzed systems. At a temperature of 50 Cthe rates are increased roughly by a factor 2 with respect to a temperature of 25 C. Thecharacteristic gelation times, derived from the average T2 versus time profiles, revealedthat the gelation rates were the highest for the pH = 6.20 systems (gel time on the order
96 6. Coupled mass transfer and gelation of TMOS in porous materials
of 1 hour), and the lowest for the pH = 2.95 systems (gel time up to 10 hours). However,the exact pore-scale mechanisms of gelation remain unclear and, consequently, the decayof the average T2 in water only indicates a characteristic reaction rate. It was found that,due to the gel treatment, for each sandstone core the relative permeability to water wasreduced more than that to oil. The effect of gel, which is formed under single phaseconditions, on the permeability of the rock is considered in the next chapter.
Chapter 7
Permeability reduction in porous materials by in situ
formed silica gel
The effect of in situ formed silica gel on the permeability of a porous material wasinvestigated experimentally using the method of beam bending. The permeability andYoung’s modulus of gel-treated sandstones and of gel rods were measured. The gelstructure was varied by varying the concentration of TMOS in solution and the pHof the water used. The permeability and modulus were extracted from a detailedanalysis of the load relaxation profiles obtained in the experiments. The permeabilityof the gels decreases with increasing silica content and acid-catalyzed gels exhibita significantly lower permeability than base-catalyzed gels. The permeability of thesandstone samples is reduced by a factor 104 due to the gel treatment.
7.1 Introduction
The method of beam bending [126, 127] was employed to measure the permeability ofTMOS-based silica gels and to measure the permeability of a porous material treated withgel that was formed in situ under single phase conditions. With respect to a downholegel treatment (see Chapter 1), the situation of permeability reduction due to formationof gel under single phase conditions is, for example, found in a water-bearing layer nearthe injection front of the TMOS solution.
Gelling solutions of TMOS, methanol and water were imbibed in dried sandstone platesand allowed to react and cure. Gel rods were made from the sol-gel solutions in orderto compare the intrinsic permeability of the gel with the permeability of the treated rocksamples. In the beam bending method a saturated porous material, immersed in a liquidbath, is subject to three-point bending. Upon bending of the sample a hydrodynamicpressure gradient builds up and the pore liquid flows until the pressure is equilibrated. Aconstant deflection is imposed on the sample and the load (force) required to maintainthat deflection is measured. The load relaxes with a typical decay time from which thepermeability can be derived. The beam bending technique is especially adequate forlow-permeability materials such as silica gels [126], porous glass [128] or cement paste[129]. In addition, the beam bending method concurrently yields the elastic moduli andthe degree of viscoelasticity (if any), both of which are of interest with respect to themechanical properties and performance of the gels and stones. The purpose of this workis to investigate whether the gel effectively fills the pore space and whether the reductionof the overall permeability is sensitive to parameters like pH and TMOS concentration.
97
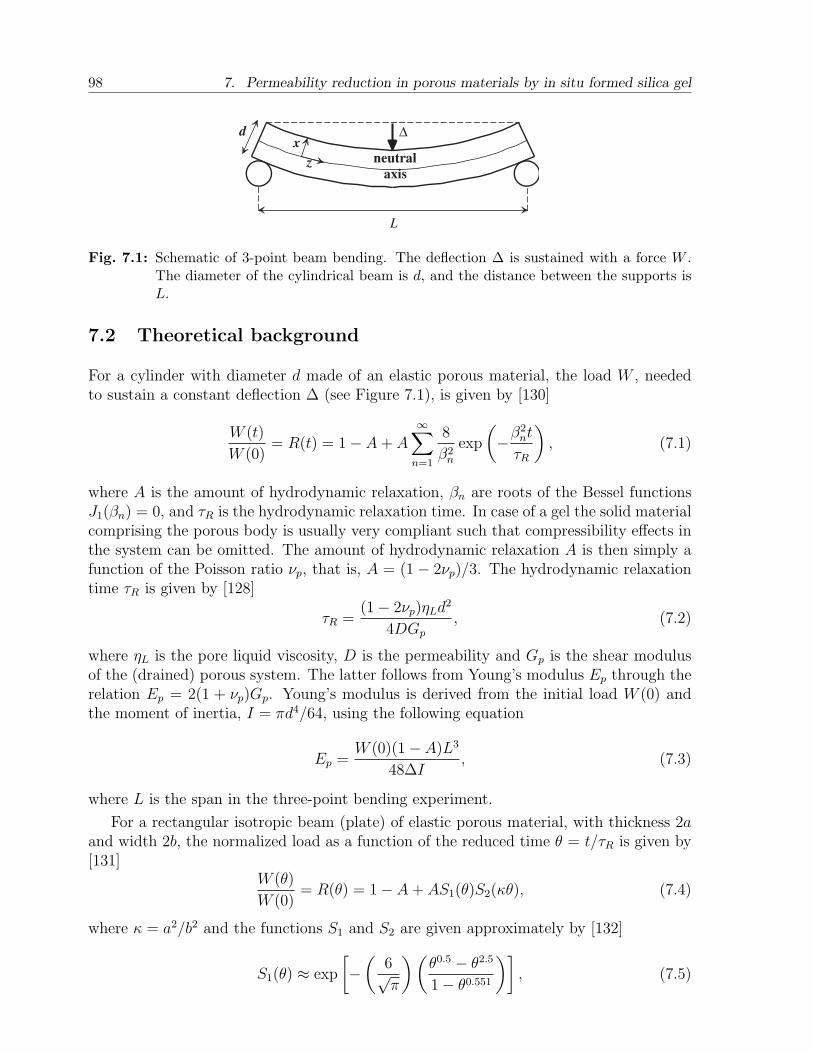
98 7. Permeability reduction in porous materials by in situ formed silica gel
L
∆x
z
d
neutral
axis
Fig. 7.1: Schematic of 3-point beam bending. The deflection ∆ is sustained with a force W .The diameter of the cylindrical beam is d, and the distance between the supports isL.
7.2 Theoretical background
For a cylinder with diameter d made of an elastic porous material, the load W , neededto sustain a constant deflection ∆ (see Figure 7.1), is given by [130]
W (t)
W (0)= R(t) = 1− A + A
∞∑n=1
8
β2n
exp
(−β2
nt
τR
), (7.1)
where A is the amount of hydrodynamic relaxation, βn are roots of the Bessel functionsJ1(βn) = 0, and τR is the hydrodynamic relaxation time. In case of a gel the solid materialcomprising the porous body is usually very compliant such that compressibility effects inthe system can be omitted. The amount of hydrodynamic relaxation A is then simply afunction of the Poisson ratio νp, that is, A = (1− 2νp)/3. The hydrodynamic relaxationtime τR is given by [128]
τR =(1− 2νp)ηLd2
4DGp
, (7.2)
where ηL is the pore liquid viscosity, D is the permeability and Gp is the shear modulusof the (drained) porous system. The latter follows from Young’s modulus Ep through therelation Ep = 2(1 + νp)Gp. Young’s modulus is derived from the initial load W (0) andthe moment of inertia, I = πd4/64, using the following equation
Ep =W (0)(1− A)L3
48∆I, (7.3)
where L is the span in the three-point bending experiment.
For a rectangular isotropic beam (plate) of elastic porous material, with thickness 2aand width 2b, the normalized load as a function of the reduced time θ = t/τR is given by[131]
W (θ)
W (0)= R(θ) = 1− A + AS1(θ)S2(κθ), (7.4)
where κ = a2/b2 and the functions S1 and S2 are given approximately by [132]
S1(θ) ≈ exp
[−(
6√π
)(θ0.5 − θ2.5
1− θ0.551
)], (7.5)
7.3. Experimental section 99
S2(θ) ≈ exp
[−(
2√π
)(θ0.5 − θ2.094
1− θ0.670
)]. (7.6)
In case the beam consists of rock, which has a much higher modulus than gel, the com-pressibility effects have to be taken into account. The parameter A is then replaced by[129]
A =
(1− 2νp
3
)(1− Kp
KS
)2
1− Kp
KS
+ (1− ρ)
(Kp
KL
− Kp
KS
) , (7.7)
in which Kp is the bulk modulus of the drained network, KS is the bulk modulus of thesolid constituting the porous network, KL is the bulk modulus of the pore fluid, and ρ isthe volume fraction of the solid content. The hydrodynamic relaxation time τR is relatedto the permeability D and the viscosity of the pore fluid ηL by [129]
τR =
2(1 + νp)
3Kp
+1− ρ
KL
+1
KS
[ρ− 4(1 + νp)
3−(
1− 2νp
3
)(Kp
KS
)](ηLa2
D
). (7.8)
The bulk modulus KL is known for most common liquids, and the bulk modulus Kp equalsEp/3(1− 2νp). The approximation Kp/KS ≈ ρ2 can be used to estimate KS [129].
Many materials, including aged gels that still contain a certain amount of water,show viscoelastic (VE) behavior. When the characteristic time of viscoelastic relaxationis at least an order of magnitude longer than the characteristic time of hydrodynamicrelaxation, the total load relaxation W (t)/W (0) is adequately represented by the productof the hydrodynamic relaxation function R(t), as described above, and an uniaxial stressrelaxation function, ΨV E: [133]
W (t)
W (0)= R(t)ΨV E(t). (7.9)
The function ΨV E is essentially an empirical function and can be inferred from experi-mental data. However, for many systems the VE relaxation can be adequately describedby a stretched exponential:
ΨV E = exp
[−(
t
τV E
)α], (7.10)
where τV E is the VE relaxation time and α is a parameter (0 ≤ α ≤ 1).
7.3 Experimental section
7.3.1 Materials
The Bentheim sandstone was obtained from a Bad-Bentheim quarry in Germany. Rec-tangular plates were sawed from a single block. The length and the width of the plateswere 160 ± 5 mm and 25.2 ± 0.4 mm, respectively. The thickness of the plates varied
100 7. Permeability reduction in porous materials by in situ formed silica gel
between 8.05 and 10.10 mm. For each plate the thickness and width were checked atseveral positions on the plate surface. The precision of the thickness and width was about0.05 mm. The sawed plates were dried at 60 C for five days.
Bentheim is a quasi-homogeneous sandstone without distinct bedding planes or otherform of anisotropy. Mercury intrusion porosimetry (MIP) on a same batch of Bentheimsandstone indicated that the sandstone has a narrow pore size distribution with an averagepore size of 33 ± 10 µm and a total porosity of about 0.22. The permeability of therock with respect to water, which was measured on several cylindrical cores using acustom-made core injection set-up, was found to be 1.6 ± 0.3 µm2. Bentheim sandstoneis quartz-rich with little clay content. To test the presence of clays, small rock slabswere soaked in water and their length was monitored in a dynamic mechanical analyzer(DMA, type Perkin Elmer DMA 7e). In addition, the rock was analyzed in a scanningelectron microscope (SEM, type FEI XL30 FEG-SEM) equipped for energy-dispersiveX-ray spectroscopy (EDX, type PGT-IMIX PTS EDX). A fractured surface was coatedwith gold. The coating is needed to prevent the accumulation of static electric fields atthe sample during imaging due to the electron irradiation. Another piece of rock wasground and analyzed using X-ray diffraction (XRD) in a Rigaku Miniflex apparatus.
TMOS was obtained from Acros Organics (99% pure). Deionized water was usedfor the hydrolysis reaction. The homogenization chemical used was methanol (FisherScientific, 99.9% pure). Ethanol (Pharmco, dehydrated, 200 Proof) was used to exchangewith the mother liquid of the gels after curing. For the beam bending measurementson the sandstone samples the pore liquid was exchanged with glycerol (Acros Organics,99+% pure).
Buffer solutions of the water were made by dissolving the following chemicals. Theacid solution (pH = 3.1) contained 8.47 g of citric acid, 3.22 g of NaOH and 2.18 g ofHCl per liter. The alkaline solution (pH = 9.25) contained 0.1 M of ammonium-hydroxideand 5.12 g per liter of ammonium-chloride (about 0.1 Molal). The latter was diluted withdeionized water (with a ratio of 1:9) to yield a second alkaline solution with a pH of 8.8.
7.3.2 Preparation of gels and rock samples
The sol-gel solutions were prepared by first mixing TMOS with methanol in various ratiosto form homogeneous mixtures. The water (acid or alkaline) was added gradually to eachmixture. The water/TMOS molar ratio was always equal to 4:1. The corresponding totalvolume fraction of TMOS in solution varied between 0.35 and 0.55. The solutions werehomogenized by stirring during one minute. The solutions were cast in cylindrical Teflonmolds with an inner diameter of 11.5 ± 0.1 mm and a length of about 13 cm. Afterseveral days of curing at room temperature the gel rods were removed from the moldsand immersed in ethanol with an excess volume of about 10 to 1 for at least one day,after which the gels were put into a second bath of fresh ethanol for several days. Thisprocedure was applied to maximize the exchange of the mother liquid in the gels withethanol, so that the viscosity of the pore liquid is known, and in order to minimize furtheraging of the gels and minimize the degree of viscoelasticity. Scherer showed that whenthe pore liquid is exchanged, using various alcohols, the measurement of the permeability
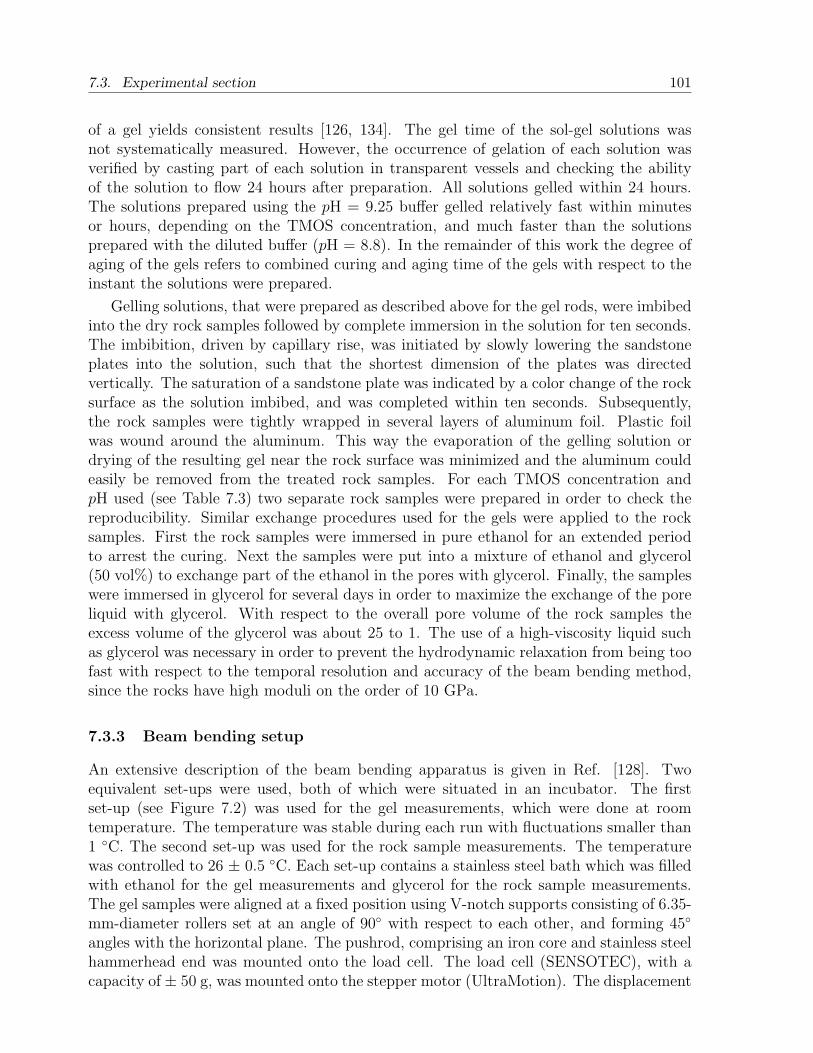
7.3. Experimental section 101
of a gel yields consistent results [126, 134]. The gel time of the sol-gel solutions wasnot systematically measured. However, the occurrence of gelation of each solution wasverified by casting part of each solution in transparent vessels and checking the abilityof the solution to flow 24 hours after preparation. All solutions gelled within 24 hours.The solutions prepared using the pH = 9.25 buffer gelled relatively fast within minutesor hours, depending on the TMOS concentration, and much faster than the solutionsprepared with the diluted buffer (pH = 8.8). In the remainder of this work the degree ofaging of the gels refers to combined curing and aging time of the gels with respect to theinstant the solutions were prepared.
Gelling solutions, that were prepared as described above for the gel rods, were imbibedinto the dry rock samples followed by complete immersion in the solution for ten seconds.The imbibition, driven by capillary rise, was initiated by slowly lowering the sandstoneplates into the solution, such that the shortest dimension of the plates was directedvertically. The saturation of a sandstone plate was indicated by a color change of the rocksurface as the solution imbibed, and was completed within ten seconds. Subsequently,the rock samples were tightly wrapped in several layers of aluminum foil. Plastic foilwas wound around the aluminum. This way the evaporation of the gelling solution ordrying of the resulting gel near the rock surface was minimized and the aluminum couldeasily be removed from the treated rock samples. For each TMOS concentration andpH used (see Table 7.3) two separate rock samples were prepared in order to check thereproducibility. Similar exchange procedures used for the gels were applied to the rocksamples. First the rock samples were immersed in pure ethanol for an extended periodto arrest the curing. Next the samples were put into a mixture of ethanol and glycerol(50 vol%) to exchange part of the ethanol in the pores with glycerol. Finally, the sampleswere immersed in glycerol for several days in order to maximize the exchange of the poreliquid with glycerol. With respect to the overall pore volume of the rock samples theexcess volume of the glycerol was about 25 to 1. The use of a high-viscosity liquid suchas glycerol was necessary in order to prevent the hydrodynamic relaxation from being toofast with respect to the temporal resolution and accuracy of the beam bending method,since the rocks have high moduli on the order of 10 GPa.
7.3.3 Beam bending setup
An extensive description of the beam bending apparatus is given in Ref. [128]. Twoequivalent set-ups were used, both of which were situated in an incubator. The firstset-up (see Figure 7.2) was used for the gel measurements, which were done at roomtemperature. The temperature was stable during each run with fluctuations smaller than1 C. The second set-up was used for the rock sample measurements. The temperaturewas controlled to 26 ± 0.5 C. Each set-up contains a stainless steel bath which was filledwith ethanol for the gel measurements and glycerol for the rock sample measurements.The gel samples were aligned at a fixed position using V-notch supports consisting of 6.35-mm-diameter rollers set at an angle of 90 with respect to each other, and forming 45
angles with the horizontal plane. The pushrod, comprising an iron core and stainless steelhammerhead end was mounted onto the load cell. The load cell (SENSOTEC), with acapacity of ± 50 g, was mounted onto the stepper motor (UltraMotion). The displacement
102 7. Permeability reduction in porous materials by in situ formed silica gel
of the pushrod was monitored through a linear-variable differential transformer (LVDT,Macrosensors). The span (L) of the supports was 110 mm. The sandstone plates weresupported by two different stainless steel supports. One consisted of a recessed ball, theother of a pivoting cylinder. This configuration was chosen to prevent torsion. The spanin this case was 150 mm. A round-tipped pushrod (diameter = 6.3 mm) was used to bendthe plates. A load cell with a capacity of ± 1000 g was mounted onto the stepper motor.In addition a 1000 g counter-weight was mounted on the pushrod.
Fig. 7.2: Photo of beam bending set-up. A rectangular beam is placed in the bath.
The rock samples and gel rods were put in the bath at least 30 minutes in advanceof the bending experiment in order to equilibrate thermally and mechanically. Duringbending deflections of about 1 or 1.5 mm were applied to the gels, whereas a deflection ofabout 35 µm was applied to the rock samples. The small deflection for the rock sampleswas chosen because of the limited load capacity of the system and in order to preventthe rock samples from cracking or breaking. Due to the small deflection with respect tothe surface roughness – the grain size of the sandstone is on the order of 50 to 500 µm– the bending measurement is sensitive to the effect of slipping of the pushrod at thesurface or slipping of the rock on the supports. Test measurements indicated that thiseffect occurred by yielding unrealistically low moduli (Ep) for some samples and scatteredresults when a sample was repeatedly measured. Therefore the samples were preloadedwith a net load of about 100 g prior to the equilibration period to promote a more stablesettling of the rock and pushrod. The total load upon deflection is on the order of 1 kg.
7.4 Results and discussion
7.4.1 Gels
Gel properties
Four series of gel rods were prepared. The TMOS concentration was varied in series Iand IV. The concentration was kept fixed in series II and III, but extra salt, in the formof sodium-chloride (NaCl), was added in various concentrations, CS, up to 80 mMolal.The effect of additional salt on the gel properties was investigated in consideration of

7.4. Results and discussion 103
application of the gel in natural reservoirs, since the water found in most reservoirs issaline. The properties of the gel rods are listed in Table 7.1.
Table 7.1: Properties of the gel rods and beam bending results. φSi is the estimated volumefraction of silica assuming full hydrolysis and condensation, and corrected for thevolume contraction of the gel. The pH listed is the pH of the water used in thehydrolysis reaction. The parameter CS represents the amount of sodium-chloride(NaCl) added to the gelling solution.
series φSi pH CS aging time Ep [MPa] D [nm2][mMolal]
I 0.113 ± 0.007 3.1 0 43 h 5.9 ± 0.2 1.04 ± 0.060.131 ± 0.008 3.1 0 43 h 12.2 ± 0.5 0.67 ± 0.030.149 ± 0.009 3.1 0 43 h 22.8 ± 0.9 0.38 ± 0.02
II 0.123 ± 0.007 3.1 0 91 h 18.6 ± 0.7 0.66 ± 0.030.123 ± 0.007 3.1 40 91 h 15.9 ± 0.6 0.72 ± 0.040.123 ± 0.007 3.1 60 91 h 15.1 ± 0.6 0.76 ± 0.050.123 ± 0.007 3.1 80 91 h 15.5 ± 0.6 0.72 ± 0.04
III 0.098 ± 0.005 9.25 0 72 h 6.9 ± 0.3 14.8 ± 0.70.098 ± 0.005 9.25 40 72 h 7.3 ± 0.3 18.2 ± 0.80.098 ± 0.005 9.25 60 72 h 7.0 ± 0.3 26 ± 2
IV 0.078 ± 0.004 8.8 0 72 h 1.4 ± 0.1 40 ± 20.092 ± 0.005 8.8 0 72 h 2.9 ± 0.1 28 ± 20.100 ± 0.005 8.8 0 72 h 4.0 ± 0.2 20 ± 1
The parameter φSi is a measure for the total silica content of the alcogels based onthe initial TMOS content and on the assumption that hydrolysis and condensation arecomplete. However, complete condensation implies the silica network would condense intonon-porous quartz, which is not the case. Neither does the estimate account for possiblewashing out of polysiloxane molecules in the exchange process. Still, this measure is usedto indicate the silica content of the gels. The values for φSi were corrected for volumecontraction effects due to syneresis. Especially the gels prepared with the acid solution(pH = 3.1) showed a significant degree of radial contraction after aging. Because thegels are prone to breaking or cracking when exposed to air or any physical contact thedimensions were not checked rigorously. Instead, the diameter was measured for one ortwo rods per series. The diameter of the acid-catalyzed gels was found to be 10.40 ± 0.10mm after aging, whereas the diameter of the molds was 11.5 ± 0.1 mm. The dimensionswere measured with a digital caliper having an accuracy of ± 10 µm. The diameter ofthe base-catalyzed gels reduced to 11.20 ± 0.10 mm (pH = 9.25), respectively, 11.15 ±0.10 mm (pH = 8.8). The higher degree of shrinkage for the low pH gels compared to thehigh pH gels was also observed by Hdach et al. [124] for similar gels. Although the lengthof the gel rods could not be checked, due to the type of molds used, it is assumed that
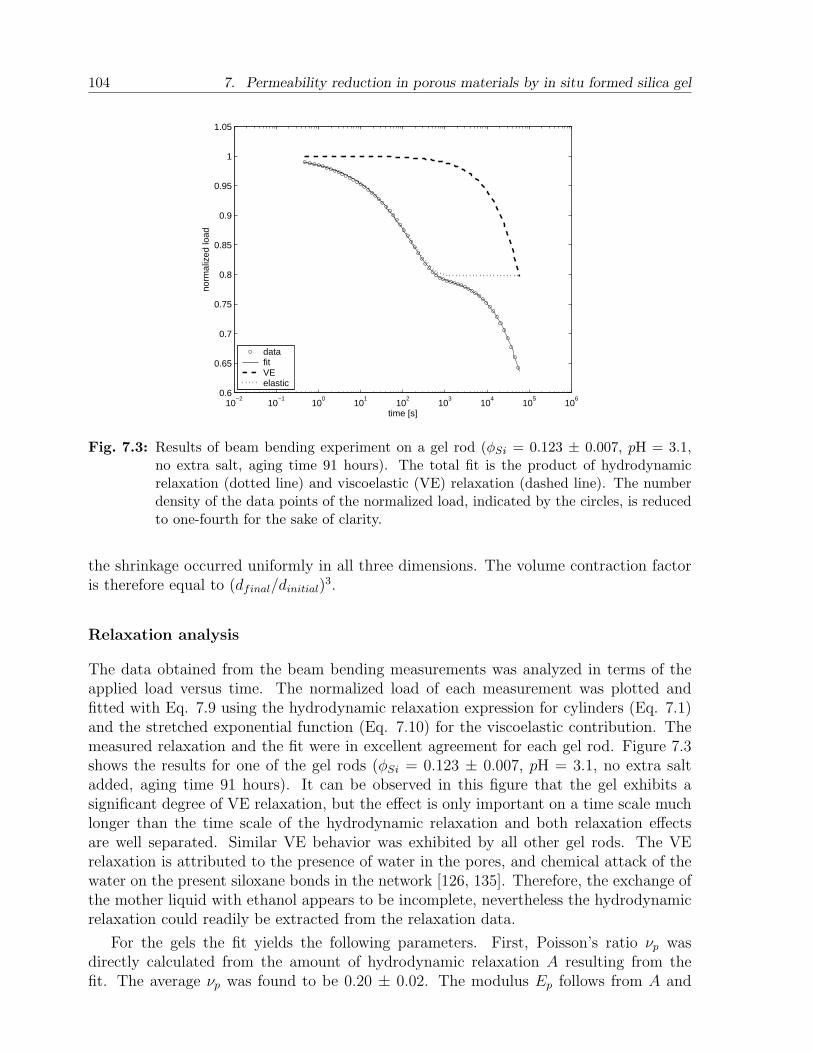
104 7. Permeability reduction in porous materials by in situ formed silica gel
10−2
10−1
100
101
102
103
104
105
106
0.6
0.65
0.7
0.75
0.8
0.85
0.9
0.95
1
1.05
time [s]
norm
aliz
ed lo
ad
datafitVEelastic
Fig. 7.3: Results of beam bending experiment on a gel rod (φSi = 0.123 ± 0.007, pH = 3.1,no extra salt, aging time 91 hours). The total fit is the product of hydrodynamicrelaxation (dotted line) and viscoelastic (VE) relaxation (dashed line). The numberdensity of the data points of the normalized load, indicated by the circles, is reducedto one-fourth for the sake of clarity.
the shrinkage occurred uniformly in all three dimensions. The volume contraction factoris therefore equal to (dfinal/dinitial)
3.
Relaxation analysis
The data obtained from the beam bending measurements was analyzed in terms of theapplied load versus time. The normalized load of each measurement was plotted andfitted with Eq. 7.9 using the hydrodynamic relaxation expression for cylinders (Eq. 7.1)and the stretched exponential function (Eq. 7.10) for the viscoelastic contribution. Themeasured relaxation and the fit were in excellent agreement for each gel rod. Figure 7.3shows the results for one of the gel rods (φSi = 0.123 ± 0.007, pH = 3.1, no extra saltadded, aging time 91 hours). It can be observed in this figure that the gel exhibits asignificant degree of VE relaxation, but the effect is only important on a time scale muchlonger than the time scale of the hydrodynamic relaxation and both relaxation effectsare well separated. Similar VE behavior was exhibited by all other gel rods. The VErelaxation is attributed to the presence of water in the pores, and chemical attack of thewater on the present siloxane bonds in the network [126, 135]. Therefore, the exchange ofthe mother liquid with ethanol appears to be incomplete, nevertheless the hydrodynamicrelaxation could readily be extracted from the relaxation data.
For the gels the fit yields the following parameters. First, Poisson’s ratio νp wasdirectly calculated from the amount of hydrodynamic relaxation A resulting from thefit. The average νp was found to be 0.20 ± 0.02. The modulus Ep follows from A and
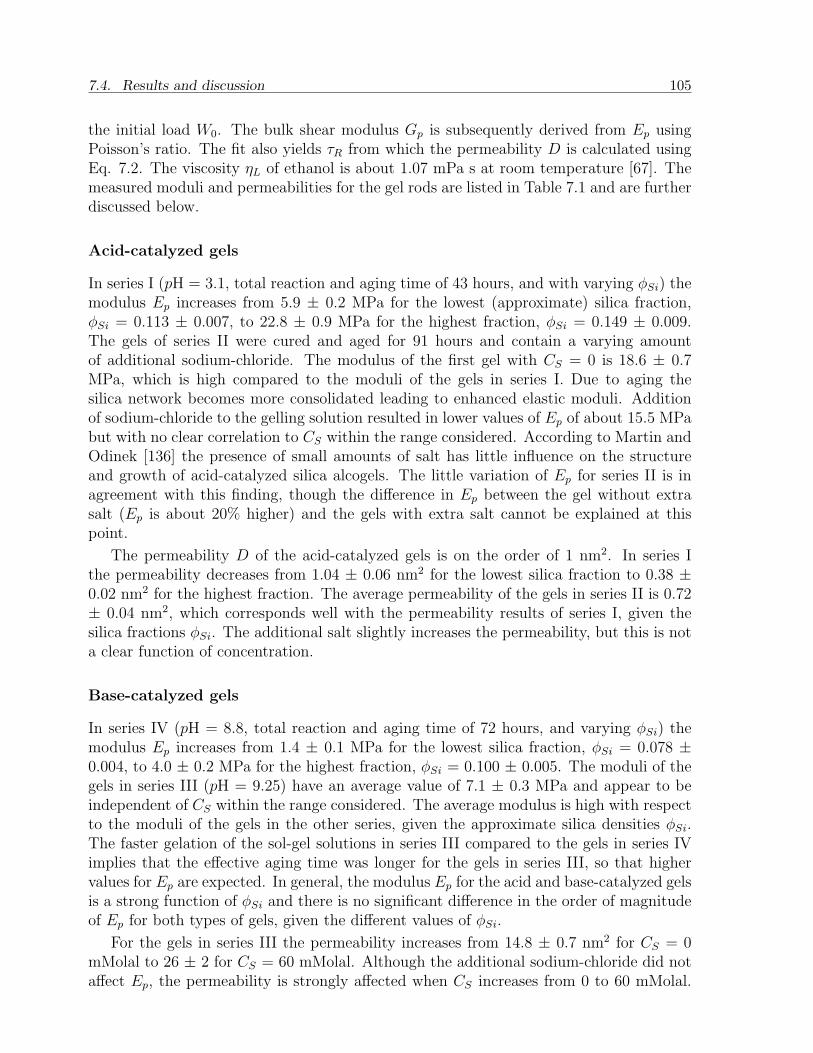
7.4. Results and discussion 105
the initial load W0. The bulk shear modulus Gp is subsequently derived from Ep usingPoisson’s ratio. The fit also yields τR from which the permeability D is calculated usingEq. 7.2. The viscosity ηL of ethanol is about 1.07 mPa s at room temperature [67]. Themeasured moduli and permeabilities for the gel rods are listed in Table 7.1 and are furtherdiscussed below.
Acid-catalyzed gels
In series I (pH = 3.1, total reaction and aging time of 43 hours, and with varying φSi) themodulus Ep increases from 5.9 ± 0.2 MPa for the lowest (approximate) silica fraction,φSi = 0.113 ± 0.007, to 22.8 ± 0.9 MPa for the highest fraction, φSi = 0.149 ± 0.009.The gels of series II were cured and aged for 91 hours and contain a varying amountof additional sodium-chloride. The modulus of the first gel with CS = 0 is 18.6 ± 0.7MPa, which is high compared to the moduli of the gels in series I. Due to aging thesilica network becomes more consolidated leading to enhanced elastic moduli. Additionof sodium-chloride to the gelling solution resulted in lower values of Ep of about 15.5 MPabut with no clear correlation to CS within the range considered. According to Martin andOdinek [136] the presence of small amounts of salt has little influence on the structureand growth of acid-catalyzed silica alcogels. The little variation of Ep for series II is inagreement with this finding, though the difference in Ep between the gel without extrasalt (Ep is about 20% higher) and the gels with extra salt cannot be explained at thispoint.
The permeability D of the acid-catalyzed gels is on the order of 1 nm2. In series Ithe permeability decreases from 1.04 ± 0.06 nm2 for the lowest silica fraction to 0.38 ±0.02 nm2 for the highest fraction. The average permeability of the gels in series II is 0.72± 0.04 nm2, which corresponds well with the permeability results of series I, given thesilica fractions φSi. The additional salt slightly increases the permeability, but this is nota clear function of concentration.
Base-catalyzed gels
In series IV (pH = 8.8, total reaction and aging time of 72 hours, and varying φSi) themodulus Ep increases from 1.4 ± 0.1 MPa for the lowest silica fraction, φSi = 0.078 ±0.004, to 4.0 ± 0.2 MPa for the highest fraction, φSi = 0.100 ± 0.005. The moduli of thegels in series III (pH = 9.25) have an average value of 7.1 ± 0.3 MPa and appear to beindependent of CS within the range considered. The average modulus is high with respectto the moduli of the gels in the other series, given the approximate silica densities φSi.The faster gelation of the sol-gel solutions in series III compared to the gels in series IVimplies that the effective aging time was longer for the gels in series III, so that highervalues for Ep are expected. In general, the modulus Ep for the acid and base-catalyzed gelsis a strong function of φSi and there is no significant difference in the order of magnitudeof Ep for both types of gels, given the different values of φSi.
For the gels in series III the permeability increases from 14.8 ± 0.7 nm2 for CS = 0mMolal to 26 ± 2 for CS = 60 mMolal. Although the additional sodium-chloride did notaffect Ep, the permeability is strongly affected when CS increases from 0 to 60 mMolal.
106 7. Permeability reduction in porous materials by in situ formed silica gel
The permeability of the gels in series IV decreases from 40 ± 2 nm2 for the lowest silicafraction to 20 ± 1 nm2 for the highest silica fraction.
The base-catalyzed gels exhibit permeabilities 10 to 100 times greater in magnitudethan the permeabilities of the acid-catalyzed gel, which cannot be explained by the dif-ference in approximate silica fraction. The higher permeability for the base-catalyzedgel is due to the different pore structure, i.e. during the sol-gel reaction the silica formsthicker branches and larger aggregates than in acid systems, resulting in bigger pores ata given total silica concentration. The permeability of silica gels can be estimated usinga Carman-Kozeny type of equation, such as [125, 128]
D =(1− φSi)r
2w
4κw(φSi), (7.11)
where rw is the mean pore radius of the gel and κw is the Kozeny constant. The lattercan be approximated by [128]
κw(φ) ≈ 1.0 + 6.05φ0.5 − 8.60φ + 6.56φ1.5. (7.12)
Given the solid fractions of the gels κw varies between 2.16 and 2.43. The experimentalvalues of D against φSi for series I and IV can adequately be fitted with Eq. 7.11, yieldingrw = 53 ± 5 nm for the base-catalyzed gels and rw = 8.9 ± 0.4 nm for the acid-catalyzedgels.
7.4.2 Sandstone slabs
Beam bending of untreated sandstone
The response of a few untreated sandstone beams upon bending was checked in order todetermine the moduli and the degree of VE behavior. The first measurement consistedof a dynamic Young modulus test on a dry rock sample. An oscillating deflection, inthe form of a sawtooth, was imposed on the sample with a frequency of 0.05 Hz and anamplitude of 10 µm, yielding Ep = 11.3 ± 0.2 GPa. Subsequently, the rock was saturatedwith acid water (pH = 3.1) and Ep dropped to 7.6 ± 0.1 GPa. Repeated measurements,performed over six days, yielded the same constant value of 7.5 ± 0.1 GPa.
A second dry, untreated rock sample was subjected to a constant deflection of about35 µm during which the load was measured. The normalized load curve is shown inFigure 7.4. The modulus of the dry rock is Ep = 11.2 ± 0.2 GPa. The normalized loadgradually relaxed to about 0.87 within 17 hours. Next, the rock sample was saturatedwith demineralized water. Again, a bending experiment was conducted yielding a reducedmodulus, i.e. Ep = 6.9 ± 0.1 GPa, and a higher degree of relaxation (see Figure 7.4).Since the hydrodynamic relaxation, due to the flow of water in the gel-free pores, occurswithin several microseconds (estimated using Eq. 7.8) the observed relaxation is due toVE effects, similarly to the case with the dry rock. Subsequently, the rock sample wasdried again at 60 C for 20 hours and a third cycle under dry conditions was performed.The modulus was partly restored, having a value of 9.7 ± 0.2 GPa. The degree of VErelaxation remained similar to that of the wet case. Finally, the bath was filled with
7.4. Results and discussion 107
10-2
10-1
100
101
102
103
104
105
106
0.6
0.65
0.7
0.75
0.8
0.85
0.9
0.95
1
1.05
time [s]
no
rma
lize
d lo
ad
1: dry stone2: water
3: dried (20 h at 60 oC)
4: ethanol
Fig. 7.4: Relaxation of normalized load on untreated sandstone in beam bending experiment.The condition of the rock sample is indicated in the legend. The absolute load var-ied among the different cycles. The solid curves indicate the fits with a stretchedexponential.
Table 7.2: Results of fit on normalized load for untreated sandstone sample using a stretchedexponential. The modulus Ep is derived from the initial load.
cycle condition τV E [106 s] α Ep [GPa]1 dry 3700 ± 400 0.177 ± 0.001 11.2 ± 0.22 water-saturated 0.25 ± 0.01 0.304 ± 0.002 6.9 ± 0.13 re-dried (20 h at 60 C) 1.3 ± 0.1 0.248 ± 0.003 9.7 ± 0.24 ethanol-saturated 4.0 ± 0.3 0.238 ± 0.002 9.2 ± 0.1
ethanol and a fourth bending test was conducted. The modulus decreased to 9.2 ± 0.1GPa. The degree of VE relaxation was comparable to that of the third cycle (see Figure7.4). The relaxation curves were fitted to the stretched exponential function (see Figure7.4). Table 7.2 contains the resulting fit parameters. A decreasing τV E and increasing αimply an increasing degree of VE relaxation within a fixed time interval.
SEM and XRD analysis on untreated rock
Similar VE behavior was observed in beam bending experiments on other types of sand-stone by Jimenez Gonzalez and Scherer [137]. The sandstones used were rich in clay andexhibited swelling behavior as they were saturated with water. The dilatometry tests onthe Bentheim sandstone showed no change in length upon wetting the samples, thus thepresence of swelling clays is negligible.
Several surface features were imaged and analyzed for chemical composition. A SEM
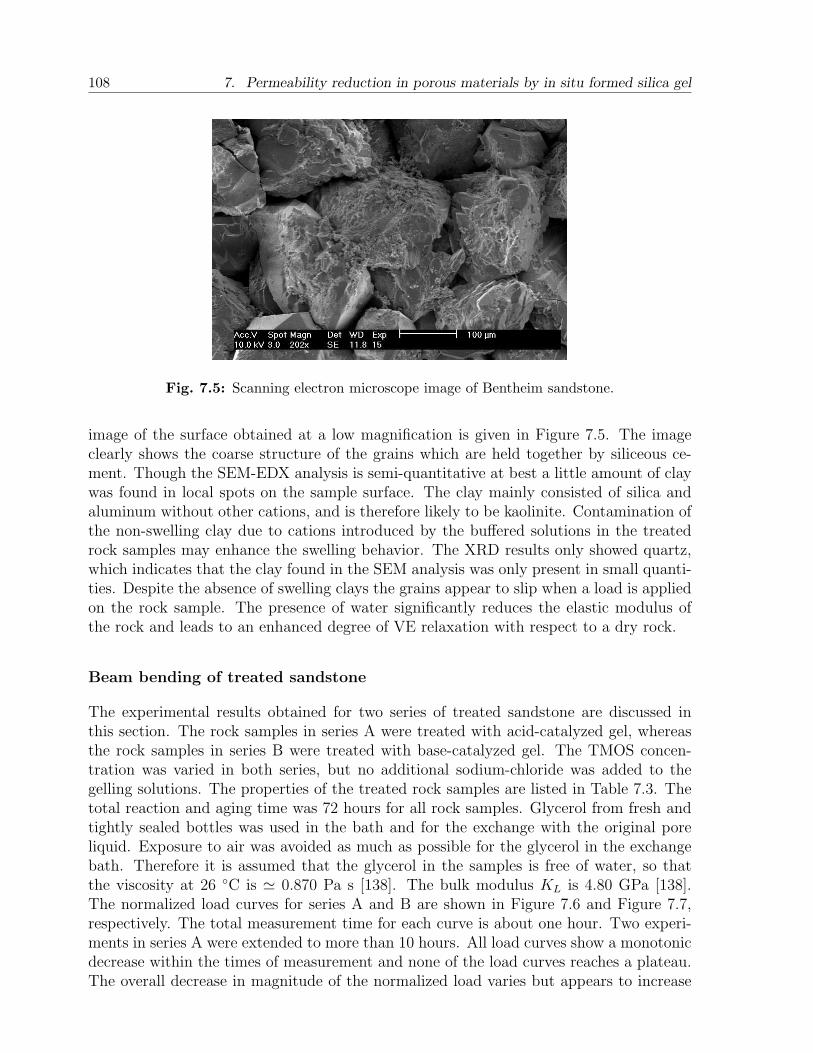
108 7. Permeability reduction in porous materials by in situ formed silica gel
Fig. 7.5: Scanning electron microscope image of Bentheim sandstone.
image of the surface obtained at a low magnification is given in Figure 7.5. The imageclearly shows the coarse structure of the grains which are held together by siliceous ce-ment. Though the SEM-EDX analysis is semi-quantitative at best a little amount of claywas found in local spots on the sample surface. The clay mainly consisted of silica andaluminum without other cations, and is therefore likely to be kaolinite. Contamination ofthe non-swelling clay due to cations introduced by the buffered solutions in the treatedrock samples may enhance the swelling behavior. The XRD results only showed quartz,which indicates that the clay found in the SEM analysis was only present in small quanti-ties. Despite the absence of swelling clays the grains appear to slip when a load is appliedon the rock sample. The presence of water significantly reduces the elastic modulus ofthe rock and leads to an enhanced degree of VE relaxation with respect to a dry rock.
Beam bending of treated sandstone
The experimental results obtained for two series of treated sandstone are discussed inthis section. The rock samples in series A were treated with acid-catalyzed gel, whereasthe rock samples in series B were treated with base-catalyzed gel. The TMOS concen-tration was varied in both series, but no additional sodium-chloride was added to thegelling solutions. The properties of the treated rock samples are listed in Table 7.3. Thetotal reaction and aging time was 72 hours for all rock samples. Glycerol from fresh andtightly sealed bottles was used in the bath and for the exchange with the original poreliquid. Exposure to air was avoided as much as possible for the glycerol in the exchangebath. Therefore it is assumed that the glycerol in the samples is free of water, so thatthe viscosity at 26 C is ' 0.870 Pa s [138]. The bulk modulus KL is 4.80 GPa [138].The normalized load curves for series A and B are shown in Figure 7.6 and Figure 7.7,respectively. The total measurement time for each curve is about one hour. Two experi-ments in series A were extended to more than 10 hours. All load curves show a monotonicdecrease within the times of measurement and none of the load curves reaches a plateau.The overall decrease in magnitude of the normalized load varies but appears to increase
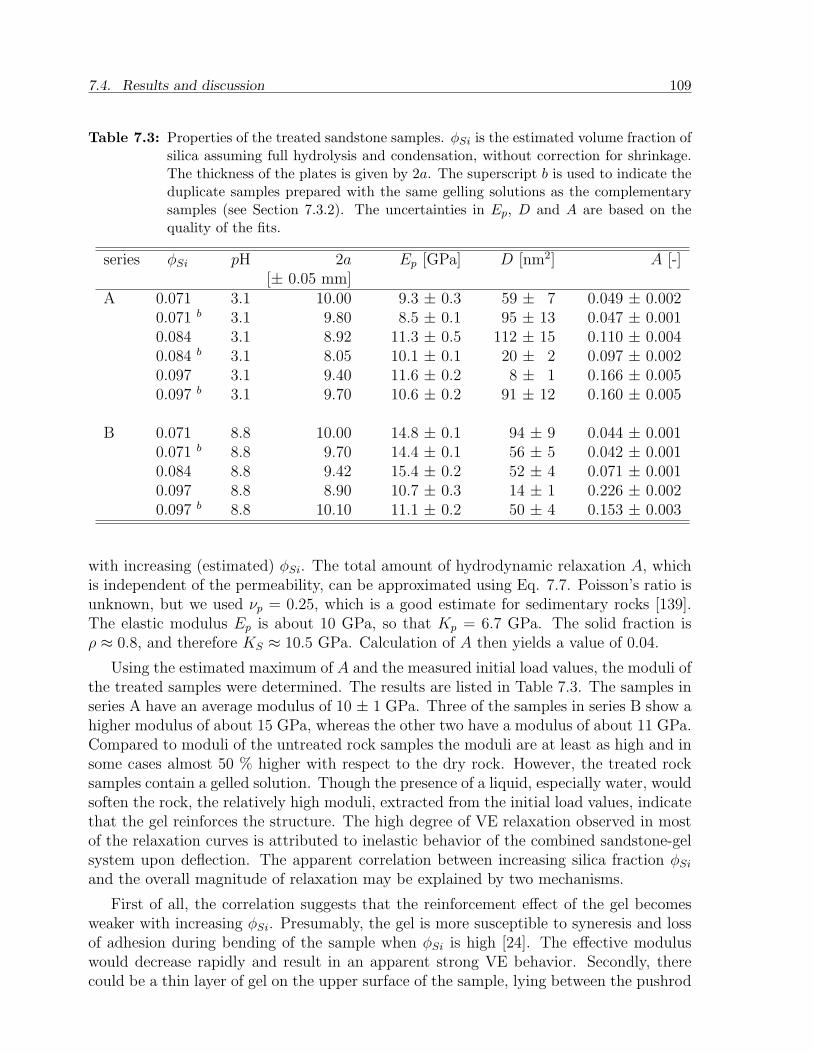
7.4. Results and discussion 109
Table 7.3: Properties of the treated sandstone samples. φSi is the estimated volume fraction ofsilica assuming full hydrolysis and condensation, without correction for shrinkage.The thickness of the plates is given by 2a. The superscript b is used to indicate theduplicate samples prepared with the same gelling solutions as the complementarysamples (see Section 7.3.2). The uncertainties in Ep, D and A are based on thequality of the fits.
series φSi pH 2a Ep [GPa] D [nm2] A [-][± 0.05 mm]
A 0.071 3.1 10.00 9.3 ± 0.3 59 ± 7 0.049 ± 0.0020.071 b 3.1 9.80 8.5 ± 0.1 95 ± 13 0.047 ± 0.0010.084 3.1 8.92 11.3 ± 0.5 112 ± 15 0.110 ± 0.0040.084 b 3.1 8.05 10.1 ± 0.1 20 ± 2 0.097 ± 0.0020.097 3.1 9.40 11.6 ± 0.2 8 ± 1 0.166 ± 0.0050.097 b 3.1 9.70 10.6 ± 0.2 91 ± 12 0.160 ± 0.005
B 0.071 8.8 10.00 14.8 ± 0.1 94 ± 9 0.044 ± 0.0010.071 b 8.8 9.70 14.4 ± 0.1 56 ± 5 0.042 ± 0.0010.084 8.8 9.42 15.4 ± 0.2 52 ± 4 0.071 ± 0.0010.097 8.8 8.90 10.7 ± 0.3 14 ± 1 0.226 ± 0.0020.097 b 8.8 10.10 11.1 ± 0.2 50 ± 4 0.153 ± 0.003
with increasing (estimated) φSi. The total amount of hydrodynamic relaxation A, whichis independent of the permeability, can be approximated using Eq. 7.7. Poisson’s ratio isunknown, but we used νp = 0.25, which is a good estimate for sedimentary rocks [139].The elastic modulus Ep is about 10 GPa, so that Kp = 6.7 GPa. The solid fraction isρ ≈ 0.8, and therefore KS ≈ 10.5 GPa. Calculation of A then yields a value of 0.04.
Using the estimated maximum of A and the measured initial load values, the moduli ofthe treated samples were determined. The results are listed in Table 7.3. The samples inseries A have an average modulus of 10 ± 1 GPa. Three of the samples in series B show ahigher modulus of about 15 GPa, whereas the other two have a modulus of about 11 GPa.Compared to moduli of the untreated rock samples the moduli are at least as high and insome cases almost 50 % higher with respect to the dry rock. However, the treated rocksamples contain a gelled solution. Though the presence of a liquid, especially water, wouldsoften the rock, the relatively high moduli, extracted from the initial load values, indicatethat the gel reinforces the structure. The high degree of VE relaxation observed in mostof the relaxation curves is attributed to inelastic behavior of the combined sandstone-gelsystem upon deflection. The apparent correlation between increasing silica fraction φSi
and the overall magnitude of relaxation may be explained by two mechanisms.
First of all, the correlation suggests that the reinforcement effect of the gel becomesweaker with increasing φSi. Presumably, the gel is more susceptible to syneresis and lossof adhesion during bending of the sample when φSi is high [24]. The effective moduluswould decrease rapidly and result in an apparent strong VE behavior. Secondly, therecould be a thin layer of gel on the upper surface of the sample, lying between the pushrod
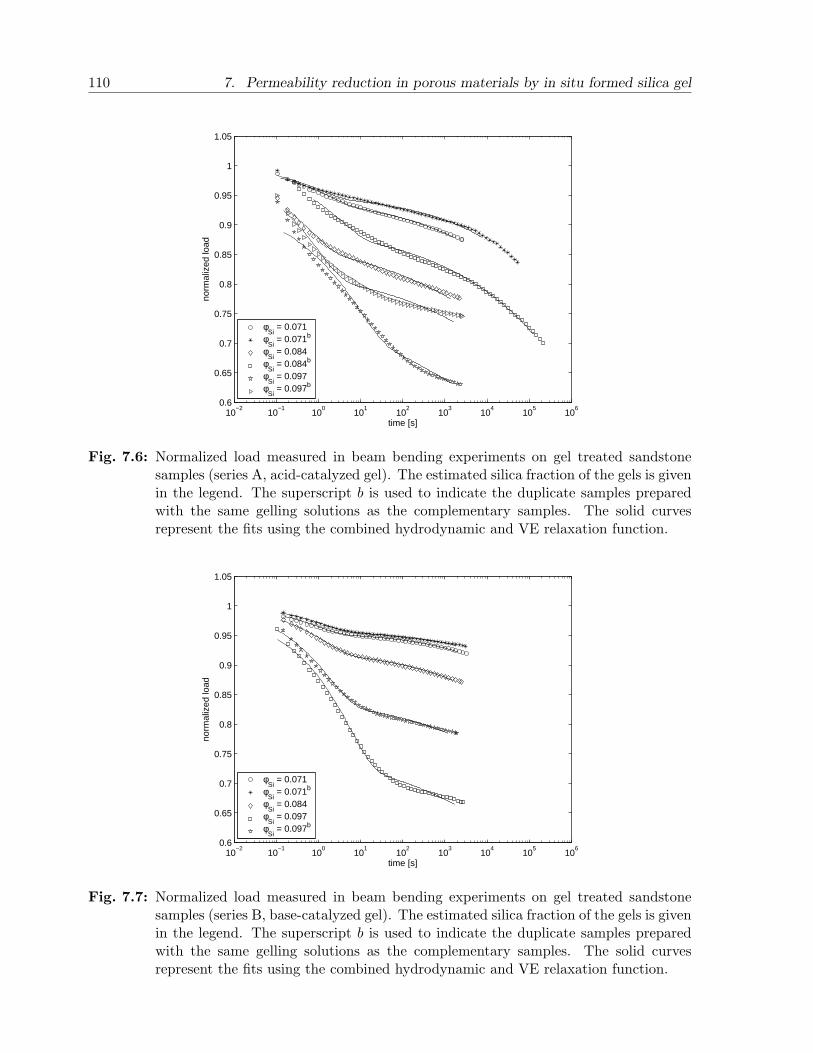
110 7. Permeability reduction in porous materials by in situ formed silica gel
10−2
10−1
100
101
102
103
104
105
106
0.6
0.65
0.7
0.75
0.8
0.85
0.9
0.95
1
1.05
time [s]
norm
aliz
ed lo
ad
φSi
= 0.071φ
Si = 0.071b
φSi
= 0.084φ
Si = 0.084b
φSi
= 0.097φ
Si = 0.097b
Fig. 7.6: Normalized load measured in beam bending experiments on gel treated sandstonesamples (series A, acid-catalyzed gel). The estimated silica fraction of the gels is givenin the legend. The superscript b is used to indicate the duplicate samples preparedwith the same gelling solutions as the complementary samples. The solid curvesrepresent the fits using the combined hydrodynamic and VE relaxation function.
10−2
10−1
100
101
102
103
104
105
106
0.6
0.65
0.7
0.75
0.8
0.85
0.9
0.95
1
1.05
time [s]
norm
aliz
ed lo
ad
φSi
= 0.071φ
Si = 0.071b
φSi
= 0.084φ
Si = 0.097
φSi
= 0.097b
Fig. 7.7: Normalized load measured in beam bending experiments on gel treated sandstonesamples (series B, base-catalyzed gel). The estimated silica fraction of the gels is givenin the legend. The superscript b is used to indicate the duplicate samples preparedwith the same gelling solutions as the complementary samples. The solid curvesrepresent the fits using the combined hydrodynamic and VE relaxation function.
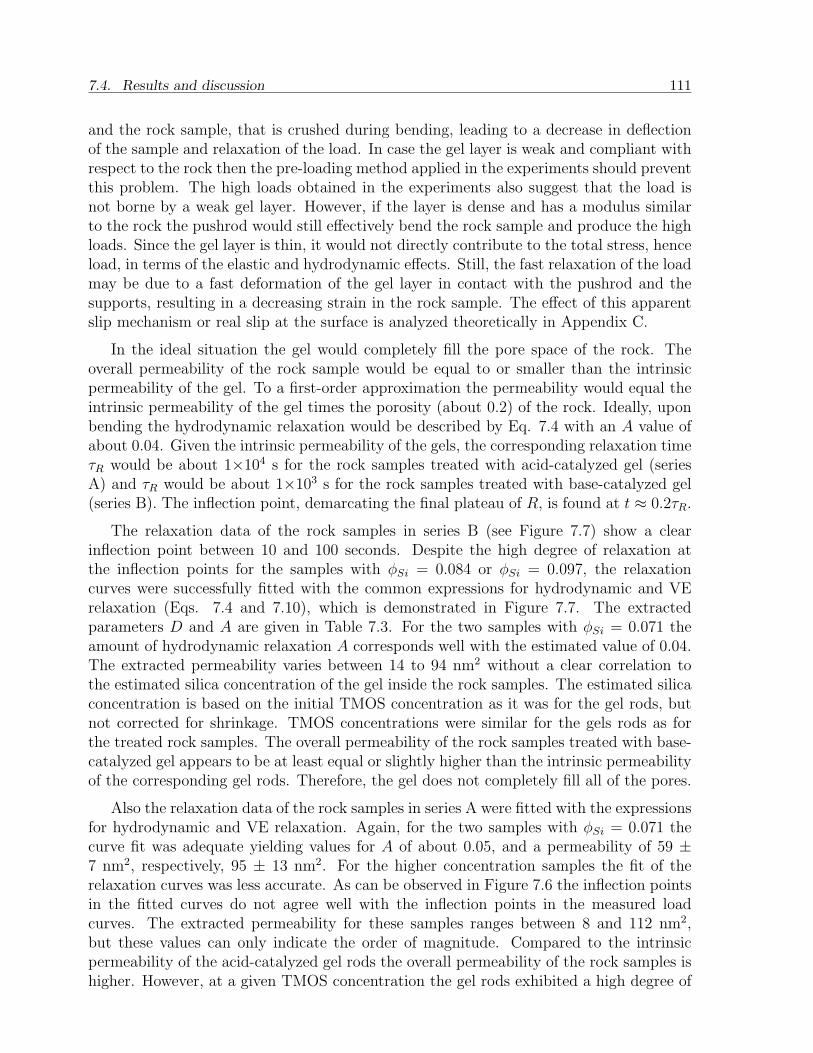
7.4. Results and discussion 111
and the rock sample, that is crushed during bending, leading to a decrease in deflectionof the sample and relaxation of the load. In case the gel layer is weak and compliant withrespect to the rock then the pre-loading method applied in the experiments should preventthis problem. The high loads obtained in the experiments also suggest that the load isnot borne by a weak gel layer. However, if the layer is dense and has a modulus similarto the rock the pushrod would still effectively bend the rock sample and produce the highloads. Since the gel layer is thin, it would not directly contribute to the total stress, henceload, in terms of the elastic and hydrodynamic effects. Still, the fast relaxation of the loadmay be due to a fast deformation of the gel layer in contact with the pushrod and thesupports, resulting in a decreasing strain in the rock sample. The effect of this apparentslip mechanism or real slip at the surface is analyzed theoretically in Appendix C.
In the ideal situation the gel would completely fill the pore space of the rock. Theoverall permeability of the rock sample would be equal to or smaller than the intrinsicpermeability of the gel. To a first-order approximation the permeability would equal theintrinsic permeability of the gel times the porosity (about 0.2) of the rock. Ideally, uponbending the hydrodynamic relaxation would be described by Eq. 7.4 with an A value ofabout 0.04. Given the intrinsic permeability of the gels, the corresponding relaxation timeτR would be about 1×10⁴ s for the rock samples treated with acid-catalyzed gel (seriesA) and τR would be about 1×10³ s for the rock samples treated with base-catalyzed gel(series B). The inflection point, demarcating the final plateau of R, is found at t ≈ 0.2τR.
The relaxation data of the rock samples in series B (see Figure 7.7) show a clearinflection point between 10 and 100 seconds. Despite the high degree of relaxation atthe inflection points for the samples with φSi = 0.084 or φSi = 0.097, the relaxationcurves were successfully fitted with the common expressions for hydrodynamic and VErelaxation (Eqs. 7.4 and 7.10), which is demonstrated in Figure 7.7. The extractedparameters D and A are given in Table 7.3. For the two samples with φSi = 0.071 theamount of hydrodynamic relaxation A corresponds well with the estimated value of 0.04.The extracted permeability varies between 14 to 94 nm2 without a clear correlation tothe estimated silica concentration of the gel inside the rock samples. The estimated silicaconcentration is based on the initial TMOS concentration as it was for the gel rods, butnot corrected for shrinkage. TMOS concentrations were similar for the gels rods as forthe treated rock samples. The overall permeability of the rock samples treated with base-catalyzed gel appears to be at least equal or slightly higher than the intrinsic permeabilityof the corresponding gel rods. Therefore, the gel does not completely fill all of the pores.
Also the relaxation data of the rock samples in series A were fitted with the expressionsfor hydrodynamic and VE relaxation. Again, for the two samples with φSi = 0.071 thecurve fit was adequate yielding values for A of about 0.05, and a permeability of 59 ±7 nm2, respectively, 95 ± 13 nm2. For the higher concentration samples the fit of therelaxation curves was less accurate. As can be observed in Figure 7.6 the inflection pointsin the fitted curves do not agree well with the inflection points in the measured loadcurves. The extracted permeability for these samples ranges between 8 and 112 nm2,but these values can only indicate the order of magnitude. Compared to the intrinsicpermeability of the acid-catalyzed gel rods the overall permeability of the rock samples ishigher. However, at a given TMOS concentration the gel rods exhibited a high degree of
112 7. Permeability reduction in porous materials by in situ formed silica gel
contraction and pore size reduction. The order of magnitude of the permeability foundin series B is comparable to the values found in series A.
7.5 Conclusion
The intrinsic permeability and elastic modulus of various TMOS-based silica alcogelswere successfully measured with the method of beam bending. Addition of sodium-chloride, up to 80 mMolal, and the pH of the solution had no significant effect on themodulus, whereas increasing curing and aging times resulted in increased moduli. Thepermeabilities decreased with increasing silica fraction and aging time. The permeabilityof the acid-catalyzed gels was on the order of 1 nm2. The base-catalyzed gels yieldedpermeabilities 10 to 100 times higher in magnitude than the acid-catalyzed gels, which isnot exclusively attributed to the lower silica fractions of the acid-catalyzed gels, but alsoto the difference in pore structure of the network. Untreated Bentheim sandstone exhibitsa significant viscoelastic behavior upon bending, which is due to slip between the grainsand the low amount of siliceous cement. The permeability of rock samples treated withbase-catalyzed gel is on the order of 10 to 100 nm2 without a clear correlation to the silicadensity of the gel, and is at least as high as the intrinsic permeability of the correspondinggel samples. The permeability of the rock samples treated with acid-catalyzed gel wasdetermined less accurately, but is on the same order of magnitude as for the alkaline series.The findings imply that the gel is not uniformly distributed in the pore space, and thatthe effectiveness of the treatment varies between the samples, but is insensitive to thepH and concentration of the gelling solution. Compared to the untreated rock the overallpermeability is reduced by a factor of at least 104, so that the gel adequately blocks thepores.
Chapter 8
Model of reactive transport of an oil-soluble chemical
in porous media
A physical-mathematical model was developed to describe the injection and reactivetransport of an oil-soluble chemical (OSC) under two-phase conditions in a porousmedium. The model follows from the classical mass balance equations for two-phaseflow and includes the mass fractions for each component and the mass transfer andreaction terms. Numerical calculations were performed to investigate the effect ofthe parameters (flow rate, reaction rate, etc.) on the mass transfer behavior andconcentration profiles. The model was used to simulate the core flow experiments(see Chapter 6), but can also be used to simulate the injection of an OSC in anidealized reservoir, assuming linear flow.
8.1 Introduction
It was found in the bulk phase experiments (see Chapters 2, 3 and 4) and in the coreinjection experiments (see Chapter 6) that the mass transfer of TMOS is predominantlydriven by the hydrolysis reaction of TMOS in the aqueous phase. An important aspectis the solubility of TMOS in water, which is initially poor [24, 34], but the solubilityis increased by the formation of methanol due to the hydrolysis reaction. The rate ofhydrolysis is a strong function of pH, i.e. the rate is minimum at neutral conditions, butit increases in the presence of acid- or base-catalysts. Further, the reaction rates, hencethe mass transfer rates, increase with temperature. In bulk the mass transfer occurstypically on a time scale of hours. The mass transfer in the porous materials is completeon a time scale of less than one hour up to many hours, depending on pH and temperature.
The number of existing models for the simulation of reactive transport of an oil-solublechemical in porous media is limited. A network model was presented by Thompsonand Fogler [42] to simulate the injection of TMOS in a porous medium. Their workwas focussed on the displacement behavior on the pore scale and the effect of changingviscosity of the aqueous phase due to the gel reaction. Recently, Valiollahi developed amodel to simulate the placement of TMOS in sandstone based on classical two-phase flowequations [140].
The physical-mathematical model presented in this chapter simulates the reactivetransport of TMOS/oil in porous media under two-phase conditions. The model assumeslinear flow and can be used to simulate the injection of an OSC in a simple reservoir. Assuch it can be employed in the design process of a water shut-off treatment in order topredict pressure profiles, gel distribution profiles, etc.
113
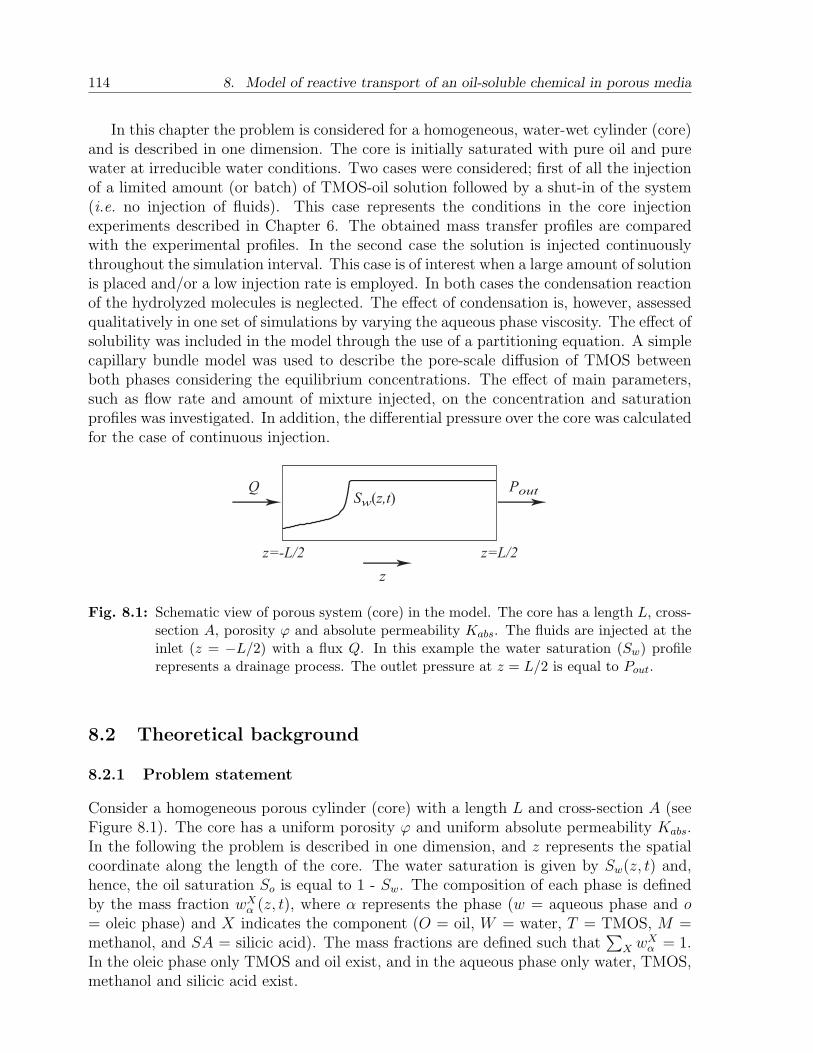
114 8. Model of reactive transport of an oil-soluble chemical in porous media
In this chapter the problem is considered for a homogeneous, water-wet cylinder (core)and is described in one dimension. The core is initially saturated with pure oil and purewater at irreducible water conditions. Two cases were considered; first of all the injectionof a limited amount (or batch) of TMOS-oil solution followed by a shut-in of the system(i.e. no injection of fluids). This case represents the conditions in the core injectionexperiments described in Chapter 6. The obtained mass transfer profiles are comparedwith the experimental profiles. In the second case the solution is injected continuouslythroughout the simulation interval. This case is of interest when a large amount of solutionis placed and/or a low injection rate is employed. In both cases the condensation reactionof the hydrolyzed molecules is neglected. The effect of condensation is, however, assessedqualitatively in one set of simulations by varying the aqueous phase viscosity. The effect ofsolubility was included in the model through the use of a partitioning equation. A simplecapillary bundle model was used to describe the pore-scale diffusion of TMOS betweenboth phases considering the equilibrium concentrations. The effect of main parameters,such as flow rate and amount of mixture injected, on the concentration and saturationprofiles was investigated. In addition, the differential pressure over the core was calculatedfor the case of continuous injection.
Sw(z,t)
z=-L/2 z=L/2
z
Q Pout
Fig. 8.1: Schematic view of porous system (core) in the model. The core has a length L, cross-section A, porosity ϕ and absolute permeability Kabs. The fluids are injected at theinlet (z = −L/2) with a flux Q. In this example the water saturation (Sw) profilerepresents a drainage process. The outlet pressure at z = L/2 is equal to Pout.
8.2 Theoretical background
8.2.1 Problem statement
Consider a homogeneous porous cylinder (core) with a length L and cross-section A (seeFigure 8.1). The core has a uniform porosity ϕ and uniform absolute permeability Kabs.In the following the problem is described in one dimension, and z represents the spatialcoordinate along the length of the core. The water saturation is given by Sw(z, t) and,hence, the oil saturation So is equal to 1 - Sw. The composition of each phase is definedby the mass fraction wX
α (z, t), where α represents the phase (w = aqueous phase and o= oleic phase) and X indicates the component (O = oil, W = water, T = TMOS, M =methanol, and SA = silicic acid). The mass fractions are defined such that
∑X wX
α = 1.In the oleic phase only TMOS and oil exist, and in the aqueous phase only water, TMOS,methanol and silicic acid exist.
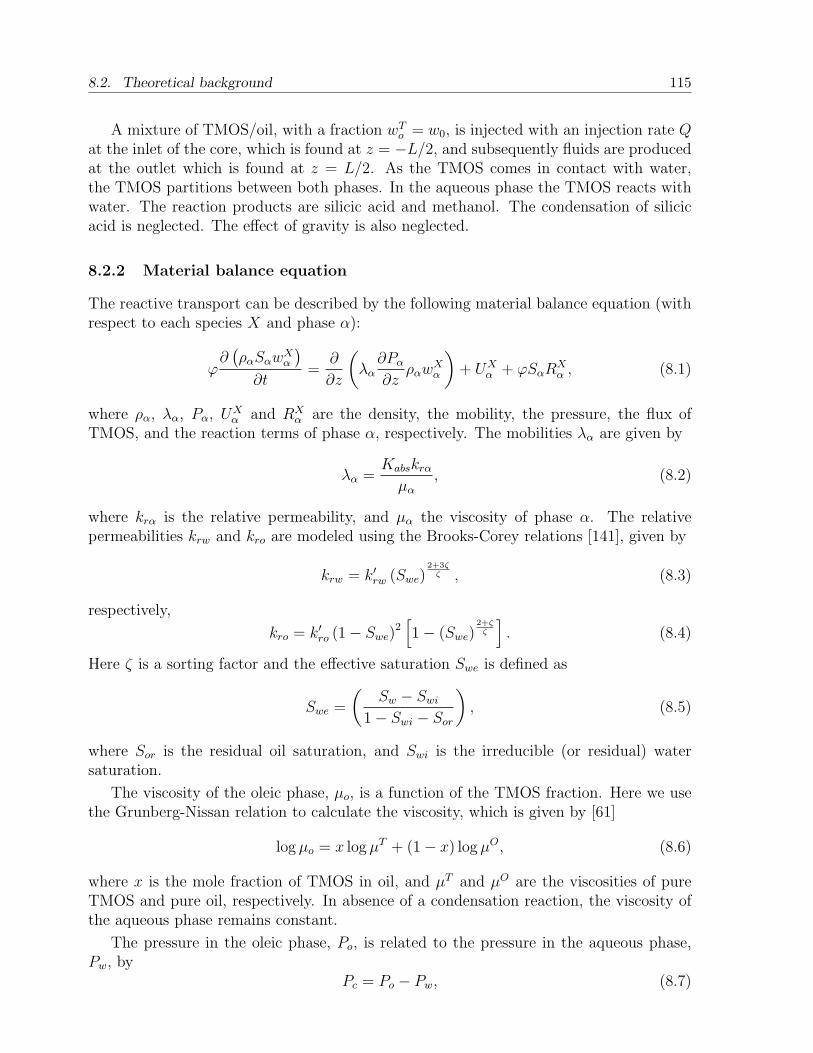
8.2. Theoretical background 115
A mixture of TMOS/oil, with a fraction wTo = w0, is injected with an injection rate Q
at the inlet of the core, which is found at z = −L/2, and subsequently fluids are producedat the outlet which is found at z = L/2. As the TMOS comes in contact with water,the TMOS partitions between both phases. In the aqueous phase the TMOS reacts withwater. The reaction products are silicic acid and methanol. The condensation of silicicacid is neglected. The effect of gravity is also neglected.
8.2.2 Material balance equation
The reactive transport can be described by the following material balance equation (withrespect to each species X and phase α):
ϕ∂(ραSαwX
α
)∂t
=∂
∂z
(λα
∂Pα
∂zραwX
α
)+ UX
α + ϕSαRXα , (8.1)
where ρα, λα, Pα, UXα and RX
α are the density, the mobility, the pressure, the flux ofTMOS, and the reaction terms of phase α, respectively. The mobilities λα are given by
λα =Kabskrα
µα
, (8.2)
where krα is the relative permeability, and µα the viscosity of phase α. The relativepermeabilities krw and kro are modeled using the Brooks-Corey relations [141], given by
krw = k′rw (Swe)2+3ζ
ζ , (8.3)
respectively,
kro = k′ro (1− Swe)2[1− (Swe)
2+ζζ
]. (8.4)
Here ζ is a sorting factor and the effective saturation Swe is defined as
Swe =
(Sw − Swi
1− Swi − Sor
), (8.5)
where Sor is the residual oil saturation, and Swi is the irreducible (or residual) watersaturation.
The viscosity of the oleic phase, µo, is a function of the TMOS fraction. Here we usethe Grunberg-Nissan relation to calculate the viscosity, which is given by [61]
log µo = x log µT + (1− x) log µO, (8.6)
where x is the mole fraction of TMOS in oil, and µT and µO are the viscosities of pureTMOS and pure oil, respectively. In absence of a condensation reaction, the viscosity ofthe aqueous phase remains constant.
The pressure in the oleic phase, Po, is related to the pressure in the aqueous phase,Pw, by
Pc = Po − Pw, (8.7)
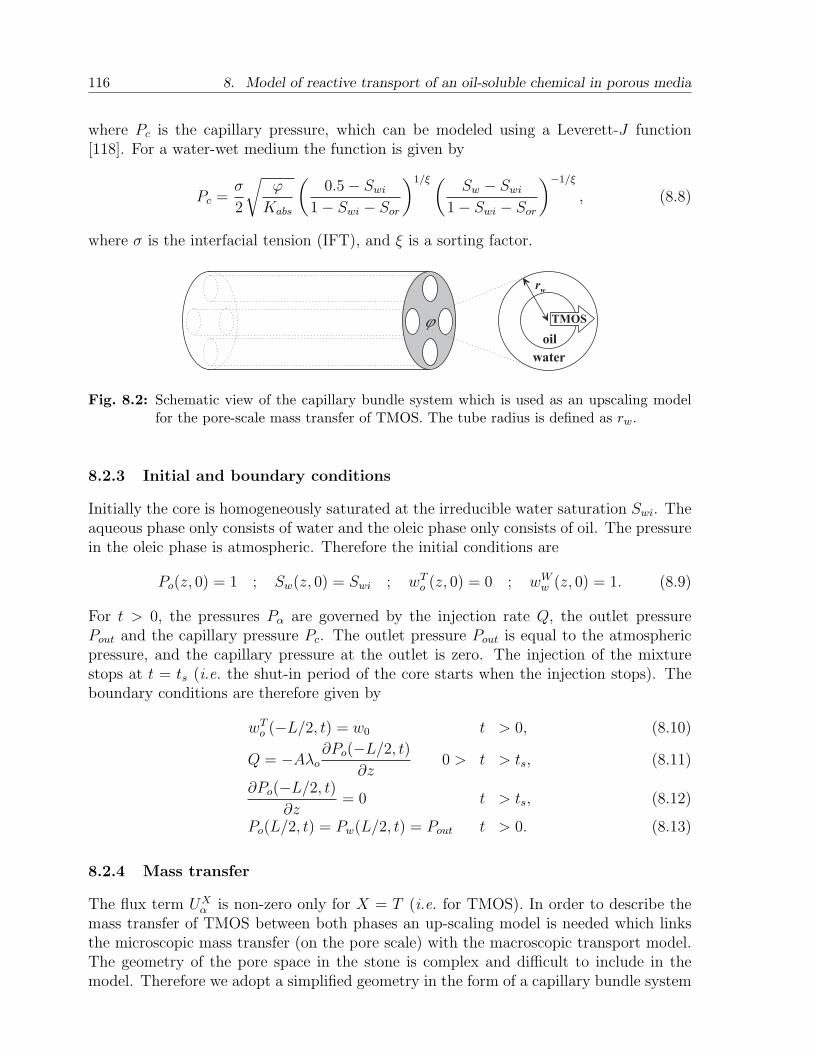
116 8. Model of reactive transport of an oil-soluble chemical in porous media
where Pc is the capillary pressure, which can be modeled using a Leverett-J function[118]. For a water-wet medium the function is given by
Pc =σ
2
√ϕ
Kabs
(0.5− Swi
1− Swi − Sor
)1/ξ (Sw − Swi
1− Swi − Sor
)−1/ξ
, (8.8)
where σ is the interfacial tension (IFT), and ξ is a sorting factor.
r w
o i lw a t e r
j T M O S
Fig. 8.2: Schematic view of the capillary bundle system which is used as an upscaling modelfor the pore-scale mass transfer of TMOS. The tube radius is defined as rw.
8.2.3 Initial and boundary conditions
Initially the core is homogeneously saturated at the irreducible water saturation Swi. Theaqueous phase only consists of water and the oleic phase only consists of oil. The pressurein the oleic phase is atmospheric. Therefore the initial conditions are
Po(z, 0) = 1 ; Sw(z, 0) = Swi ; wTo (z, 0) = 0 ; wW
w (z, 0) = 1. (8.9)
For t > 0, the pressures Pα are governed by the injection rate Q, the outlet pressurePout and the capillary pressure Pc. The outlet pressure Pout is equal to the atmosphericpressure, and the capillary pressure at the outlet is zero. The injection of the mixturestops at t = ts (i.e. the shut-in period of the core starts when the injection stops). Theboundary conditions are therefore given by
wTo (−L/2, t) = w0 t > 0, (8.10)
Q = −Aλo∂Po(−L/2, t)
∂z0 > t > ts, (8.11)
∂Po(−L/2, t)
∂z= 0 t > ts, (8.12)
Po(L/2, t) = Pw(L/2, t) = Pout t > 0. (8.13)
8.2.4 Mass transfer
The flux term UXα is non-zero only for X = T (i.e. for TMOS). In order to describe the
mass transfer of TMOS between both phases an up-scaling model is needed which linksthe microscopic mass transfer (on the pore scale) with the macroscopic transport model.The geometry of the pore space in the stone is complex and difficult to include in themodel. Therefore we adopt a simplified geometry in the form of a capillary bundle system
8.2. Theoretical background 117
(see Figure 8.2). As opposed to the bulk mass transfer model (see Chapters 3 and 4)we include a diffusion term in the mass transfer term UT
o (= -UTw ), which can be readily
incorporated in the two-phase flow model. The term UTo follows from a description of
simple diffusion between both phases within the capillary bundle system, and is given by[140],
UTo = − 4Dϕ
r2w
(1 + S
−1/2o
) (ρo − ρeqo ) , (8.14)
where D is an effective diffusion coefficient, rw is the average pore radius, and ρo is thedensity of TMOS in the oleic phase, which is equal to ρow
To . The equilibrium coefficient
ρeqo follows from the partitioning function
ρeqo = ρeq
w exp
(ε
RgT
), (8.15)
and the total density of TMOS ρT , given by
ρT = ρo + ρw. (8.16)
In Eq. 8.15 Rg is the gas constant, T is the temperature, and ρw is equal to ρwwTw. The
interaction parameter ε is a function of the methanol concentration in water. Due to thepoor solubility of TMOS in water the interaction parameter is on the order of RgT butdecreases as the concentration of methanol is increased due to the hydrolysis of TMOS inwater. As a first order approximation, the parameter ε is chosen as (see also Chapter 3)
ε = ε0
(1− awM
w
), (8.17)
where ε0 is the interaction parameter in absence of methanol and a is an arbitrary scalefactor greater than zero.
8.2.5 Reaction terms
In case of full hydrolysis a TMOS molecule reacts with water according to
Si(OCH3)4 + 4H2O → Si(OH)4 + 4CH3OH. (8.18)
The reaction terms RXα only exist for the aqueous phase, α = w, and are related to a
single molar reaction term R by
RTw = −MT R ; RW
w = −4MW R ; RSAw = MT R ; RM
w = 4MT R, (8.19)
where MX is the molar weight of species X. The molar reaction term is given by
R = k′h(C ′T
w )β(C ′Ww )γ
=k′h
(MT )β(MW )γ(C
T
w)β(CW
w )γ
= kh(CT
w)β(CW
w )γ
= kh(ρw)β+γ(wT
w)β(wW
w )γ,
(8.20)
118 8. Model of reactive transport of an oil-soluble chemical in porous media
where C ′ [mol m−3] and C [kg m−3] are the molar and mass concentration, respectively.Further, k′h and kh are the corresponding hydrolysis rate constants, and β and γ arereaction order coefficients. For a higher-order reaction term (i.e. β+γ > 1) the hydrolysisconstant k′h is scaled inconveniently. A scale factor Z is introduced such that k′h can berelated to a first-order reaction rate k [s−1], i.e.
k′h = Zk, (8.21)
where Z [(m3 mol−1)β+γ−1] can be expressed in terms of the molar volume of TMOS V T
and the molar volume of water V W . In our model we choose
Z = (V T )β(V W )γ−1. (8.22)
8.3 Method of solution
8.3.1 General equation
The equations are solved based on the IMPES method [142]. First the mass balanceequations are rewritten in terms of the oil pressure using appropriate assumptions andrelations. Subsequently, the equations are discretized. In the IMPES method first thepressure is solved for implicitly, after which the saturation (e.g. So) is solved for explicitly.In our extended model the mass fractions of the components are calculated implicitly, andthe mass transfer and reaction terms are updated each time step [140].
Summation of the material balance equation for each component, given by Eq. 8.1,and applying the closure conditions result in the following material balance equations forthe oleic phase and the aqueous phase, respectively:
ϕ∂(ρoSo)
∂t=
∂
∂z
(ρoλo
∂Po
∂z
)− UT
w , (8.23)
ϕ∂(ρwSw)
∂t=
∂
∂z
(ρwλw
∂Pw
∂z
)+ UT
w . (8.24)
Expanding the left-hand side of Eqs. 8.23 and 8.24 yields
ϕSo∂ρo
∂t+ ϕρo
∂So
∂t=
∂
∂z
(ρoλo
∂Po
∂z
)+ UT
o , (8.25)
and
ϕSw∂ρw
∂t+ ϕρw
∂Sw
∂t=
∂
∂z
(ρwλw
∂Pw
∂z
)+ UT
w . (8.26)
Dividing Eq. 8.25 by ρo, and dividing Eq. 8.26 by ρw, and adding both resulting equationsyields
ϕSo
ρo
∂ρo
∂t+ ϕ
Sw
ρw
∂ρw
∂t=
1
ρo
∂
∂z
(ρoλo
∂Po
∂z
)+
1
ρw
∂
∂z
(ρwλw
∂Pw
∂z
)+
(1
ρw
− 1
ρo
)UT
w .
(8.27)
8.4. Results and discussion 119
The densities ρo and ρw are functions of pressure and composition of the correspondingphases. Under isobaric conditions the density of phase α is given by
1
ρα
=∑X
wXα
%X, (8.28)
where %X is the density of component X in a pure liquid. The derivatives of the densitieswith respect to time can be approximated by (see Appendix D)
∂ρo
∂t=
∑I∈O,T
%I ∂wIo
∂t+ coρo
∂Po
∂t, (8.29)
and∂ρw
∂t=
∑J∈W,T,M,SA
%J ∂wJw
∂t+ cwρw
∂Pw
∂t, (8.30)
where co and cw are the average compressibility coefficients of the oleic and the aque-ous phase, respectively. For the sake of simplicity the coefficients are assumed to beindependent of composition. Substitution of Eqs. 8.29 and 8.30 in Eq. 8.27 and somerearrangements result in the following equation (with the assumption that ∂Pc/∂t ≈ 0)
ϕ(Soco + Swcw)∂Po
∂t− 1
ρo
∂
∂z
(ρoλo
∂Po
∂z
)− 1
ρw
∂
∂z
(ρwλw
∂Po
∂z
)= −ϕ
So
ρo
∑I
%I ∂wIo
∂t− ϕ
Sw
ρw
∑J
%J ∂wJw
∂t+
(1
ρw
− 1
ρo
)UT
w −1
ρw
∂
∂z
(ρwλw
∂Pc
∂z
).
(8.31)
8.3.2 Numerical solution
A one-dimensional grid is defined with N grid blocks of size ∆z. The mobility parameterand phase density are weighed upstream. The time step of integration is given by ∆t.Details about the numerical solution are given in Appendix E. In short, the oil pressureis solved first, after which the oil saturation is updated explicitly. Subsequently, themass fractions are updated implicitly. As the saturations, densities and fractions areupdated the reaction rate R can be calculated. The mass transfer term U follows fromthe evaluation of the partitioning function (Eq. 8.15) and the total TMOS density (Eq.8.16).
8.4 Results and discussion
8.4.1 Choice of parameters
In this section the common parameters which have been used in the numerical calculationsare defined first. The choice of the parameters is based on the conditions found in the
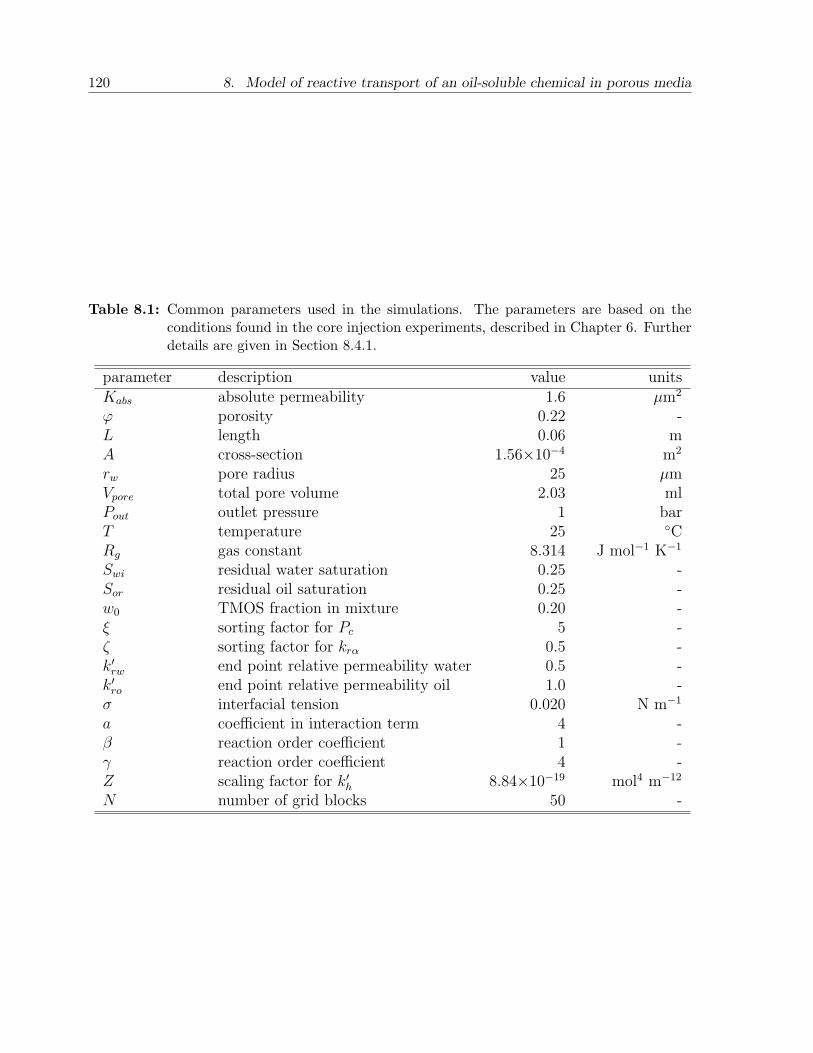
120 8. Model of reactive transport of an oil-soluble chemical in porous media
Table 8.1: Common parameters used in the simulations. The parameters are based on theconditions found in the core injection experiments, described in Chapter 6. Furtherdetails are given in Section 8.4.1.
parameter description value unitsKabs absolute permeability 1.6 µm2
ϕ porosity 0.22 -L length 0.06 mA cross-section 1.56×10⁻⁴ m2
rw pore radius 25 µmVpore total pore volume 2.03 mlPout outlet pressure 1 barT temperature 25 CRg gas constant 8.314 J mol−1 K−1
Swi residual water saturation 0.25 -Sor residual oil saturation 0.25 -w0 TMOS fraction in mixture 0.20 -ξ sorting factor for Pc 5 -ζ sorting factor for krα 0.5 -k′rw end point relative permeability water 0.5 -k′ro end point relative permeability oil 1.0 -σ interfacial tension 0.020 N m−1
a coefficient in interaction term 4 -β reaction order coefficient 1 -γ reaction order coefficient 4 -Z scaling factor for k′h 8.84×10⁻¹⁹ mol4 m−12
N number of grid blocks 50 -
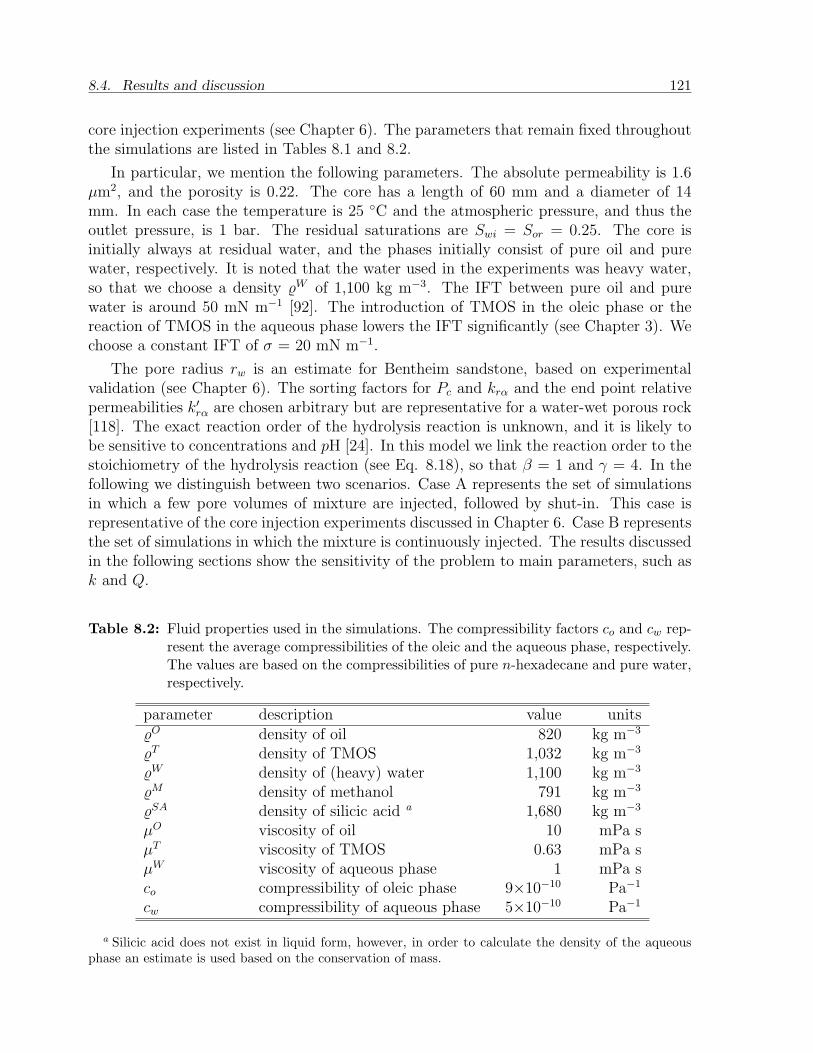
8.4. Results and discussion 121
core injection experiments (see Chapter 6). The parameters that remain fixed throughoutthe simulations are listed in Tables 8.1 and 8.2.
In particular, we mention the following parameters. The absolute permeability is 1.6µm2, and the porosity is 0.22. The core has a length of 60 mm and a diameter of 14mm. In each case the temperature is 25 C and the atmospheric pressure, and thus theoutlet pressure, is 1 bar. The residual saturations are Swi = Sor = 0.25. The core isinitially always at residual water, and the phases initially consist of pure oil and purewater, respectively. It is noted that the water used in the experiments was heavy water,so that we choose a density %W of 1,100 kg m−3. The IFT between pure oil and purewater is around 50 mN m−1 [92]. The introduction of TMOS in the oleic phase or thereaction of TMOS in the aqueous phase lowers the IFT significantly (see Chapter 3). Wechoose a constant IFT of σ = 20 mN m−1.
The pore radius rw is an estimate for Bentheim sandstone, based on experimentalvalidation (see Chapter 6). The sorting factors for Pc and krα and the end point relativepermeabilities k′rα are chosen arbitrary but are representative for a water-wet porous rock[118]. The exact reaction order of the hydrolysis reaction is unknown, and it is likely tobe sensitive to concentrations and pH [24]. In this model we link the reaction order to thestoichiometry of the hydrolysis reaction (see Eq. 8.18), so that β = 1 and γ = 4. In thefollowing we distinguish between two scenarios. Case A represents the set of simulationsin which a few pore volumes of mixture are injected, followed by shut-in. This case isrepresentative of the core injection experiments discussed in Chapter 6. Case B representsthe set of simulations in which the mixture is continuously injected. The results discussedin the following sections show the sensitivity of the problem to main parameters, such ask and Q.
Table 8.2: Fluid properties used in the simulations. The compressibility factors co and cw rep-resent the average compressibilities of the oleic and the aqueous phase, respectively.The values are based on the compressibilities of pure n-hexadecane and pure water,respectively.
parameter description value units%O density of oil 820 kg m−3
%T density of TMOS 1,032 kg m−3
%W density of (heavy) water 1,100 kg m−3
%M density of methanol 791 kg m−3
%SA density of silicic acid a 1,680 kg m−3
µO viscosity of oil 10 mPa sµT viscosity of TMOS 0.63 mPa sµW viscosity of aqueous phase 1 mPa sco compressibility of oleic phase 9×10⁻¹⁰ Pa−1
cw compressibility of aqueous phase 5×10⁻¹⁰ Pa−1
a Silicic acid does not exist in liquid form, however, in order to calculate the density of the aqueousphase an estimate is used based on the conservation of mass.
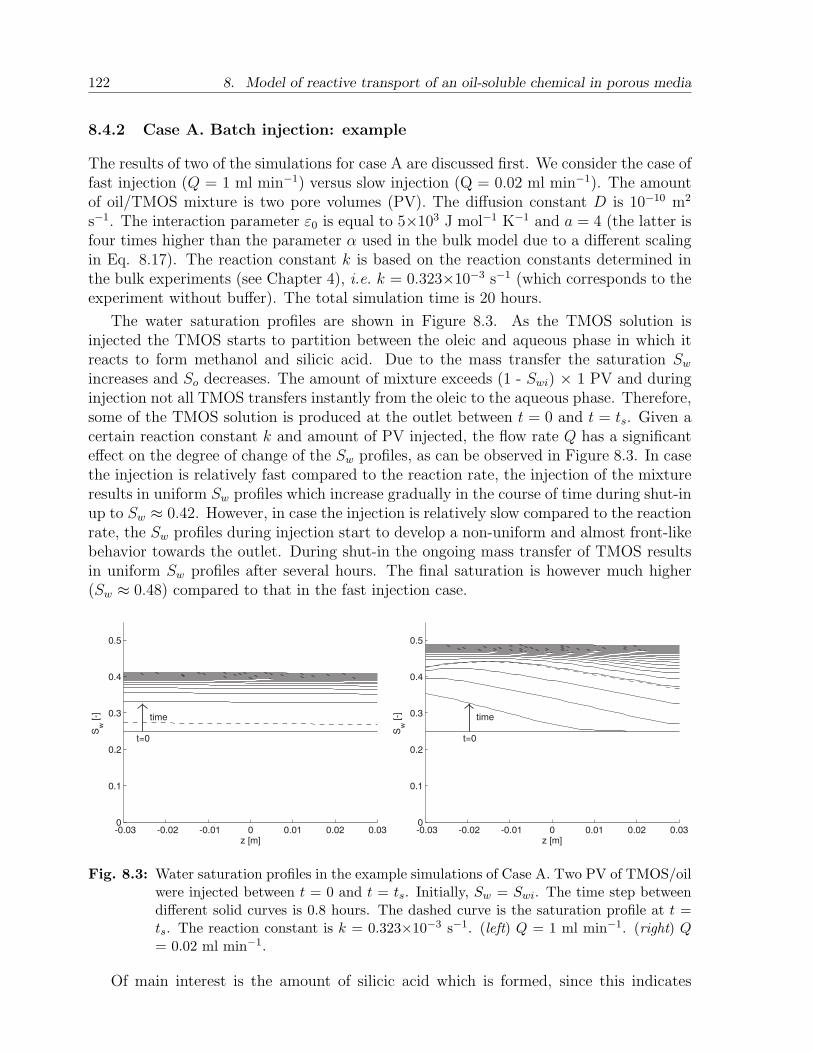
122 8. Model of reactive transport of an oil-soluble chemical in porous media
8.4.2 Case A. Batch injection: example
The results of two of the simulations for case A are discussed first. We consider the case offast injection (Q = 1 ml min−1) versus slow injection (Q = 0.02 ml min−1). The amountof oil/TMOS mixture is two pore volumes (PV). The diffusion constant D is 10−10 m2
s−1. The interaction parameter ε0 is equal to 5×10³ J mol−1 K−1 and a = 4 (the latter isfour times higher than the parameter α used in the bulk model due to a different scalingin Eq. 8.17). The reaction constant k is based on the reaction constants determined inthe bulk experiments (see Chapter 4), i.e. k = 0.323×10⁻³ s−1 (which corresponds to theexperiment without buffer). The total simulation time is 20 hours.
The water saturation profiles are shown in Figure 8.3. As the TMOS solution isinjected the TMOS starts to partition between the oleic and aqueous phase in which itreacts to form methanol and silicic acid. Due to the mass transfer the saturation Sw
increases and So decreases. The amount of mixture exceeds (1 - Swi) × 1 PV and duringinjection not all TMOS transfers instantly from the oleic to the aqueous phase. Therefore,some of the TMOS solution is produced at the outlet between t = 0 and t = ts. Given acertain reaction constant k and amount of PV injected, the flow rate Q has a significanteffect on the degree of change of the Sw profiles, as can be observed in Figure 8.3. In casethe injection is relatively fast compared to the reaction rate, the injection of the mixtureresults in uniform Sw profiles which increase gradually in the course of time during shut-inup to Sw ≈ 0.42. However, in case the injection is relatively slow compared to the reactionrate, the Sw profiles during injection start to develop a non-uniform and almost front-likebehavior towards the outlet. During shut-in the ongoing mass transfer of TMOS resultsin uniform Sw profiles after several hours. The final saturation is however much higher(Sw ≈ 0.48) compared to that in the fast injection case.
-0.03 -0.02 -0.01 0 0.01 0.02 0.030
0.1
0.2
0.3
0.4
0.5
z [m]
Sw [-]
t=0
time
-0.03 -0.02 -0.01 0 0.01 0.02 0.030
0.1
0.2
0.3
0.4
0.5
z [m]
Sw [-]
t=0
time
Fig. 8.3: Water saturation profiles in the example simulations of Case A. Two PV of TMOS/oilwere injected between t = 0 and t = ts. Initially, Sw = Swi. The time step betweendifferent solid curves is 0.8 hours. The dashed curve is the saturation profile at t =ts. The reaction constant is k = 0.323×10⁻³ s−1. (left) Q = 1 ml min−1. (right) Q= 0.02 ml min−1.
Of main interest is the amount of silicic acid which is formed, since this indicates
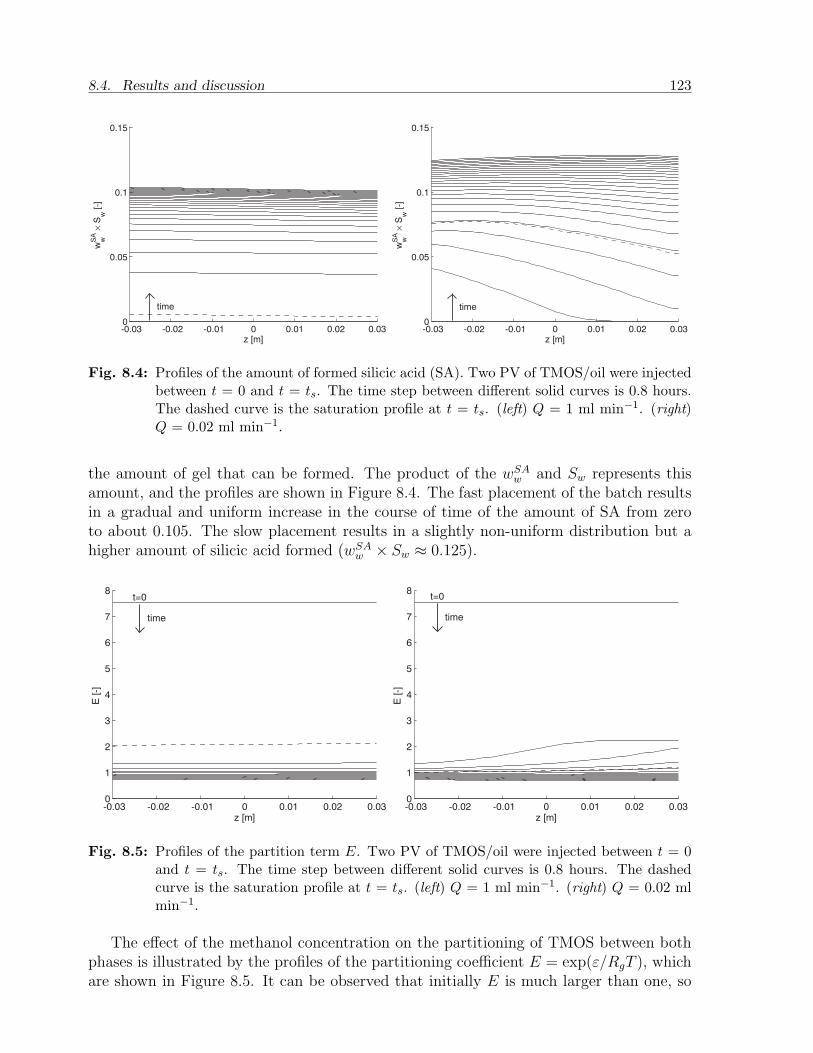
8.4. Results and discussion 123
-0.03 -0.02 -0.01 0 0.01 0.02 0.030
0.05
0.1
0.15
z [m]
wwS
A ×
Sw [
-]
time
-0.03 -0.02 -0.01 0 0.01 0.02 0.030
0.05
0.1
0.15
z [m]
wwS
A ×
Sw [
-]
time
Fig. 8.4: Profiles of the amount of formed silicic acid (SA). Two PV of TMOS/oil were injectedbetween t = 0 and t = ts. The time step between different solid curves is 0.8 hours.The dashed curve is the saturation profile at t = ts. (left) Q = 1 ml min−1. (right)Q = 0.02 ml min−1.
the amount of gel that can be formed. The product of the wSAw and Sw represents this
amount, and the profiles are shown in Figure 8.4. The fast placement of the batch resultsin a gradual and uniform increase in the course of time of the amount of SA from zeroto about 0.105. The slow placement results in a slightly non-uniform distribution but ahigher amount of silicic acid formed (wSA
w × Sw ≈ 0.125).
-0.03 -0.02 -0.01 0 0.01 0.02 0.030
1
2
3
4
5
6
7
8
z [m]
E [
-]
t=0
time
-0.03 -0.02 -0.01 0 0.01 0.02 0.030
1
2
3
4
5
6
7
8
z [m]
E [
-]
t=0
time
Fig. 8.5: Profiles of the partition term E. Two PV of TMOS/oil were injected between t = 0and t = ts. The time step between different solid curves is 0.8 hours. The dashedcurve is the saturation profile at t = ts. (left) Q = 1 ml min−1. (right) Q = 0.02 mlmin−1.
The effect of the methanol concentration on the partitioning of TMOS between bothphases is illustrated by the profiles of the partitioning coefficient E = exp(ε/RgT ), whichare shown in Figure 8.5. It can be observed that initially E is much larger than one, so
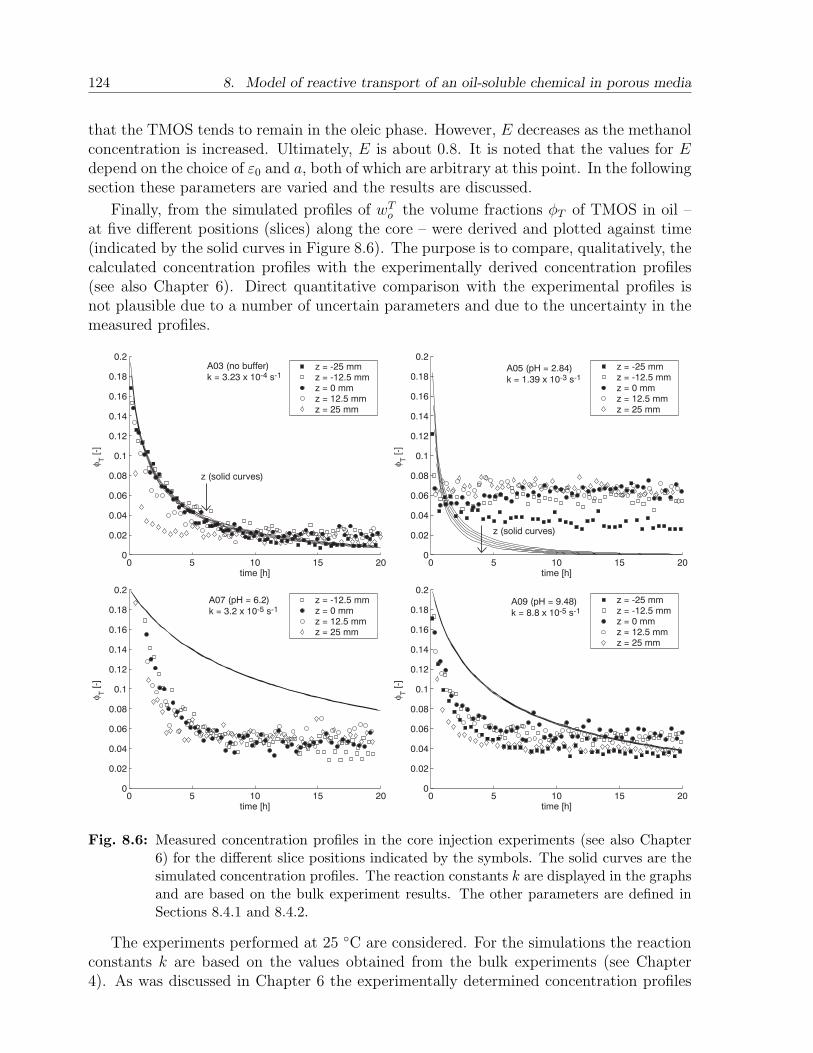
124 8. Model of reactive transport of an oil-soluble chemical in porous media
that the TMOS tends to remain in the oleic phase. However, E decreases as the methanolconcentration is increased. Ultimately, E is about 0.8. It is noted that the values for Edepend on the choice of ε0 and a, both of which are arbitrary at this point. In the followingsection these parameters are varied and the results are discussed.
Finally, from the simulated profiles of wTo the volume fractions φT of TMOS in oil –
at five different positions (slices) along the core – were derived and plotted against time(indicated by the solid curves in Figure 8.6). The purpose is to compare, qualitatively, thecalculated concentration profiles with the experimentally derived concentration profiles(see also Chapter 6). Direct quantitative comparison with the experimental profiles isnot plausible due to a number of uncertain parameters and due to the uncertainty in themeasured profiles.
0 5 10 15 200
0.02
0.04
0.06
0.08
0.1
0.12
0.14
0.16
0.18
0.2
time [h]
φT [-]
z = -25 mmz = -12.5 mmz = 0 mmz = 12.5 mmz = 25 mm
z (solid curves)
A03 (no buffer)
k = 3.23 x 10⁻⁴ s-1
0 5 10 15 200
0.02
0.04
0.06
0.08
0.1
0.12
0.14
0.16
0.18
0.2
time [h]
φT [-]
z = -25 mmz = -12.5 mmz = 0 mmz = 12.5 mmz = 25 mm
z (solid curves)
A05 (pH = 2.84)
k = 1.39 x 10⁻³ s-1
0 5 10 15 200
0.02
0.04
0.06
0.08
0.1
0.12
0.14
0.16
0.18
0.2
time [h]
φT [-]
z = -12.5 mmz = 0 mmz = 12.5 mmz = 25 mm
A07 (pH = 6.2)
k = 3.2 x 10⁻⁵ s-1
0 5 10 15 200
0.02
0.04
0.06
0.08
0.1
0.12
0.14
0.16
0.18
0.2
time [h]
φT [-]
z = -25 mmz = -12.5 mmz = 0 mmz = 12.5 mmz = 25 mm
A09 (pH = 9.48)
k = 8.8 x 10⁻⁵ s-1
Fig. 8.6: Measured concentration profiles in the core injection experiments (see also Chapter6) for the different slice positions indicated by the symbols. The solid curves are thesimulated concentration profiles. The reaction constants k are displayed in the graphsand are based on the bulk experiment results. The other parameters are defined inSections 8.4.1 and 8.4.2.
The experiments performed at 25 C are considered. For the simulations the reactionconstants k are based on the values obtained from the bulk experiments (see Chapter4). As was discussed in Chapter 6 the experimentally determined concentration profiles
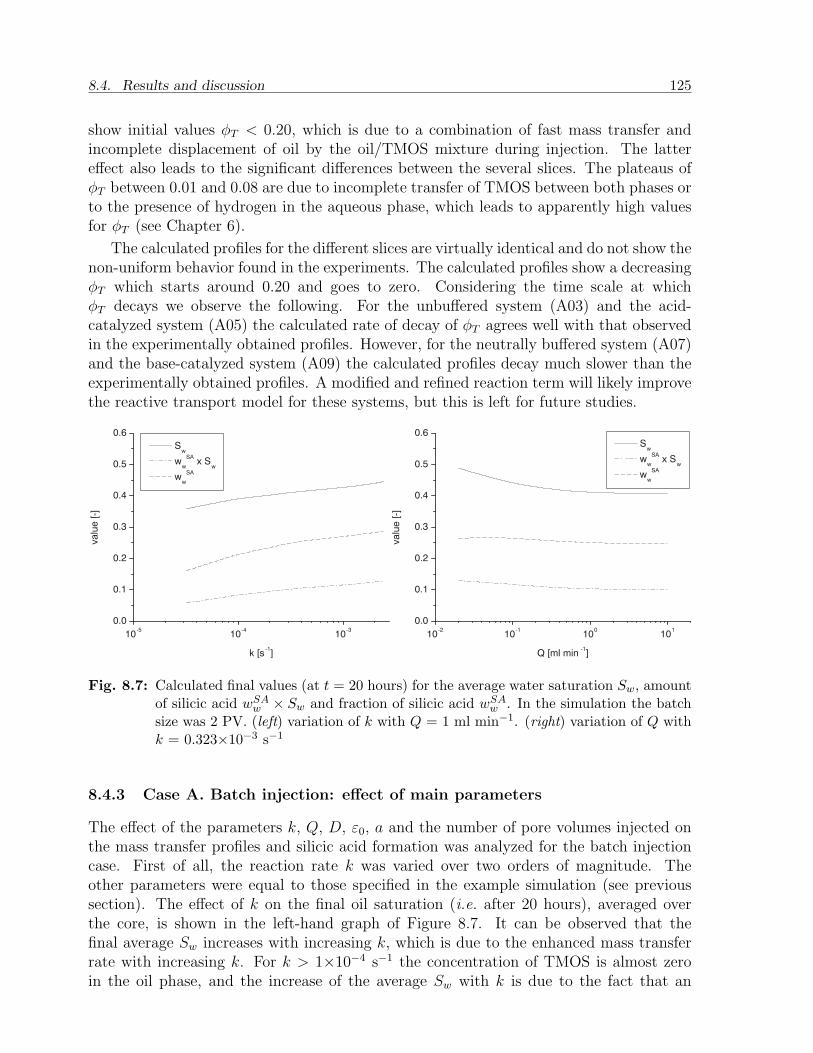
8.4. Results and discussion 125
show initial values φT < 0.20, which is due to a combination of fast mass transfer andincomplete displacement of oil by the oil/TMOS mixture during injection. The lattereffect also leads to the significant differences between the several slices. The plateaus ofφT between 0.01 and 0.08 are due to incomplete transfer of TMOS between both phases orto the presence of hydrogen in the aqueous phase, which leads to apparently high valuesfor φT (see Chapter 6).
The calculated profiles for the different slices are virtually identical and do not show thenon-uniform behavior found in the experiments. The calculated profiles show a decreasingφT which starts around 0.20 and goes to zero. Considering the time scale at whichφT decays we observe the following. For the unbuffered system (A03) and the acid-catalyzed system (A05) the calculated rate of decay of φT agrees well with that observedin the experimentally obtained profiles. However, for the neutrally buffered system (A07)and the base-catalyzed system (A09) the calculated profiles decay much slower than theexperimentally obtained profiles. A modified and refined reaction term will likely improvethe reactive transport model for these systems, but this is left for future studies.
10-5
10-4
10-3
0.0
0.1
0.2
0.3
0.4
0.5
0.6
valu
e [-]
k [s-1]
Sw
ww
SA x S
w
ww
SA
10-2
10-1
100
101
0.0
0.1
0.2
0.3
0.4
0.5
0.6
valu
e [-]
Q [ml min-1]
Sw
ww
SA x S
w
ww
SA
Fig. 8.7: Calculated final values (at t = 20 hours) for the average water saturation Sw, amountof silicic acid wSA
w × Sw and fraction of silicic acid wSAw . In the simulation the batch
size was 2 PV. (left) variation of k with Q = 1 ml min−1. (right) variation of Q withk = 0.323×10⁻³ s−1
8.4.3 Case A. Batch injection: effect of main parameters
The effect of the parameters k, Q, D, ε0, a and the number of pore volumes injected onthe mass transfer profiles and silicic acid formation was analyzed for the batch injectioncase. First of all, the reaction rate k was varied over two orders of magnitude. Theother parameters were equal to those specified in the example simulation (see previoussection). The effect of k on the final oil saturation (i.e. after 20 hours), averaged overthe core, is shown in the left-hand graph of Figure 8.7. It can be observed that thefinal average Sw increases with increasing k, which is due to the enhanced mass transferrate with increasing k. For k > 1×10⁻⁴ s−1 the concentration of TMOS is almost zeroin the oil phase, and the increase of the average Sw with k is due to the fact that an
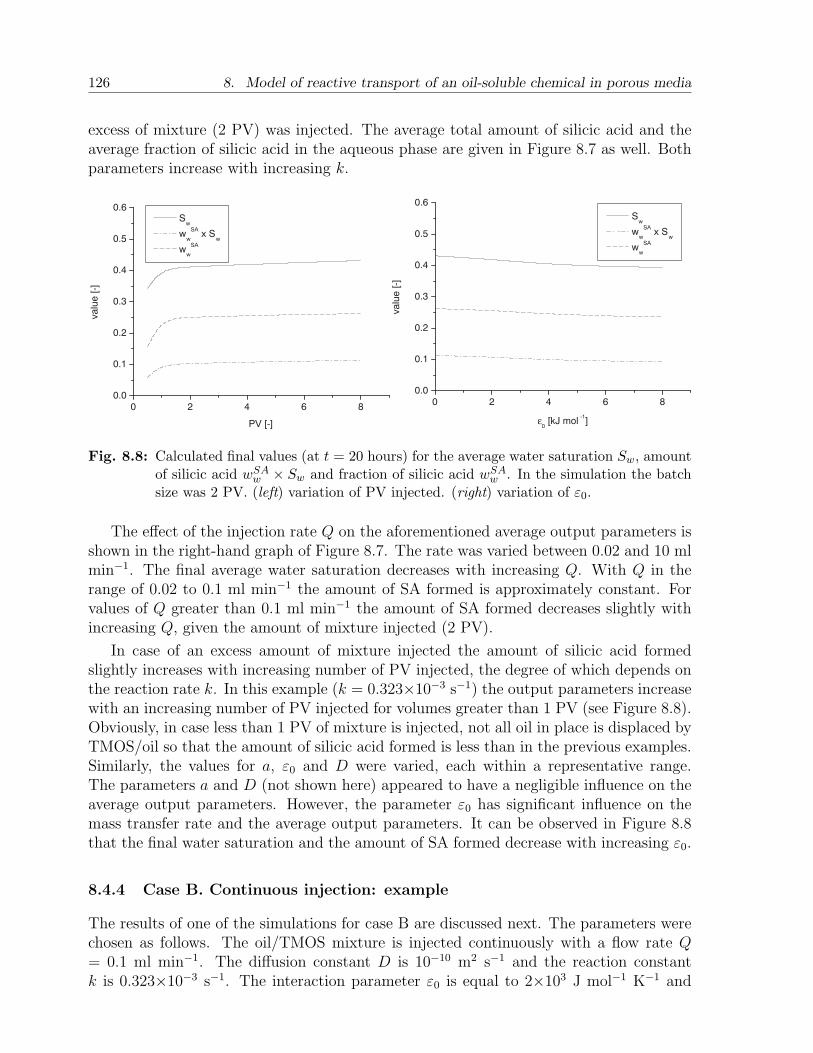
126 8. Model of reactive transport of an oil-soluble chemical in porous media
excess of mixture (2 PV) was injected. The average total amount of silicic acid and theaverage fraction of silicic acid in the aqueous phase are given in Figure 8.7 as well. Bothparameters increase with increasing k.
0 2 4 6 80.0
0.1
0.2
0.3
0.4
0.5
0.6
valu
e [-]
PV [-]
Sw
ww
SA x S
w
ww
SA
0 2 4 6 80.0
0.1
0.2
0.3
0.4
0.5
0.6
valu
e [-]
ε0 [kJ mol
-1]
Sw
ww
SA x S
w
ww
SA
Fig. 8.8: Calculated final values (at t = 20 hours) for the average water saturation Sw, amountof silicic acid wSA
w × Sw and fraction of silicic acid wSAw . In the simulation the batch
size was 2 PV. (left) variation of PV injected. (right) variation of ε0.
The effect of the injection rate Q on the aforementioned average output parameters isshown in the right-hand graph of Figure 8.7. The rate was varied between 0.02 and 10 mlmin−1. The final average water saturation decreases with increasing Q. With Q in therange of 0.02 to 0.1 ml min−1 the amount of SA formed is approximately constant. Forvalues of Q greater than 0.1 ml min−1 the amount of SA formed decreases slightly withincreasing Q, given the amount of mixture injected (2 PV).
In case of an excess amount of mixture injected the amount of silicic acid formedslightly increases with increasing number of PV injected, the degree of which depends onthe reaction rate k. In this example (k = 0.323×10⁻³ s−1) the output parameters increasewith an increasing number of PV injected for volumes greater than 1 PV (see Figure 8.8).Obviously, in case less than 1 PV of mixture is injected, not all oil in place is displaced byTMOS/oil so that the amount of silicic acid formed is less than in the previous examples.Similarly, the values for a, ε0 and D were varied, each within a representative range.The parameters a and D (not shown here) appeared to have a negligible influence on theaverage output parameters. However, the parameter ε0 has significant influence on themass transfer rate and the average output parameters. It can be observed in Figure 8.8that the final water saturation and the amount of SA formed decrease with increasing ε0.
8.4.4 Case B. Continuous injection: example
The results of one of the simulations for case B are discussed next. The parameters werechosen as follows. The oil/TMOS mixture is injected continuously with a flow rate Q= 0.1 ml min−1. The diffusion constant D is 10−10 m2 s−1 and the reaction constantk is 0.323×10⁻³ s−1. The interaction parameter ε0 is equal to 2×10³ J mol−1 K−1 and
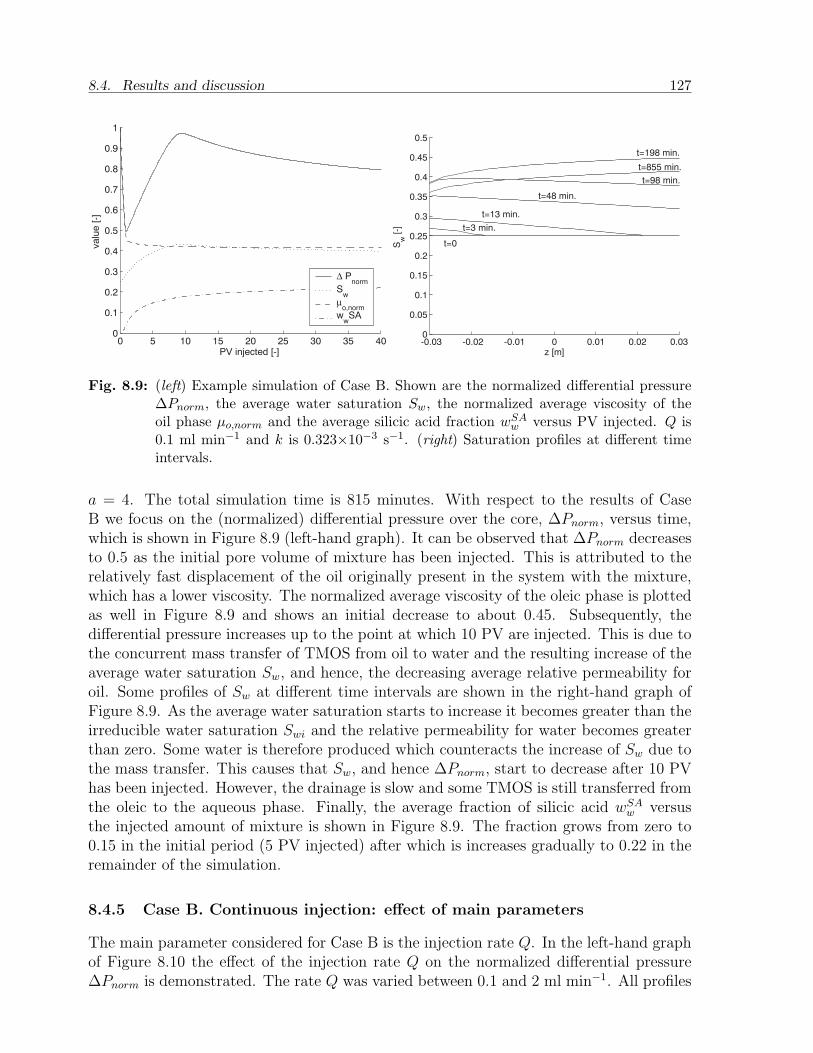
8.4. Results and discussion 127
0 5 10 15 20 25 30 35 400
0.1
0.2
0.3
0.4
0.5
0.6
0.7
0.8
0.9
1
PV injected [-]
va
lue
[-]
∆ Pnorm
Sw
µo,norm
wwSA
-0.03 -0.02 -0.01 0 0.01 0.02 0.030
0.05
0.1
0.15
0.2
0.25
0.3
0.35
0.4
0.45
0.5
z [m]
Sw [
-]
t=0
t=3 min.
t=13 min.
t=48 min.
t=98 min.
t=855 min.
t=198 min.
Fig. 8.9: (left) Example simulation of Case B. Shown are the normalized differential pressure∆Pnorm, the average water saturation Sw, the normalized average viscosity of theoil phase µo,norm and the average silicic acid fraction wSA
w versus PV injected. Q is0.1 ml min−1 and k is 0.323×10⁻³ s−1. (right) Saturation profiles at different timeintervals.
a = 4. The total simulation time is 815 minutes. With respect to the results of CaseB we focus on the (normalized) differential pressure over the core, ∆Pnorm, versus time,which is shown in Figure 8.9 (left-hand graph). It can be observed that ∆Pnorm decreasesto 0.5 as the initial pore volume of mixture has been injected. This is attributed to therelatively fast displacement of the oil originally present in the system with the mixture,which has a lower viscosity. The normalized average viscosity of the oleic phase is plottedas well in Figure 8.9 and shows an initial decrease to about 0.45. Subsequently, thedifferential pressure increases up to the point at which 10 PV are injected. This is due tothe concurrent mass transfer of TMOS from oil to water and the resulting increase of theaverage water saturation Sw, and hence, the decreasing average relative permeability foroil. Some profiles of Sw at different time intervals are shown in the right-hand graph ofFigure 8.9. As the average water saturation starts to increase it becomes greater than theirreducible water saturation Swi and the relative permeability for water becomes greaterthan zero. Some water is therefore produced which counteracts the increase of Sw due tothe mass transfer. This causes that Sw, and hence ∆Pnorm, start to decrease after 10 PVhas been injected. However, the drainage is slow and some TMOS is still transferred fromthe oleic to the aqueous phase. Finally, the average fraction of silicic acid wSA
w versusthe injected amount of mixture is shown in Figure 8.9. The fraction grows from zero to0.15 in the initial period (5 PV injected) after which is increases gradually to 0.22 in theremainder of the simulation.
8.4.5 Case B. Continuous injection: effect of main parameters
The main parameter considered for Case B is the injection rate Q. In the left-hand graphof Figure 8.10 the effect of the injection rate Q on the normalized differential pressure∆Pnorm is demonstrated. The rate Q was varied between 0.1 and 2 ml min−1. All profiles
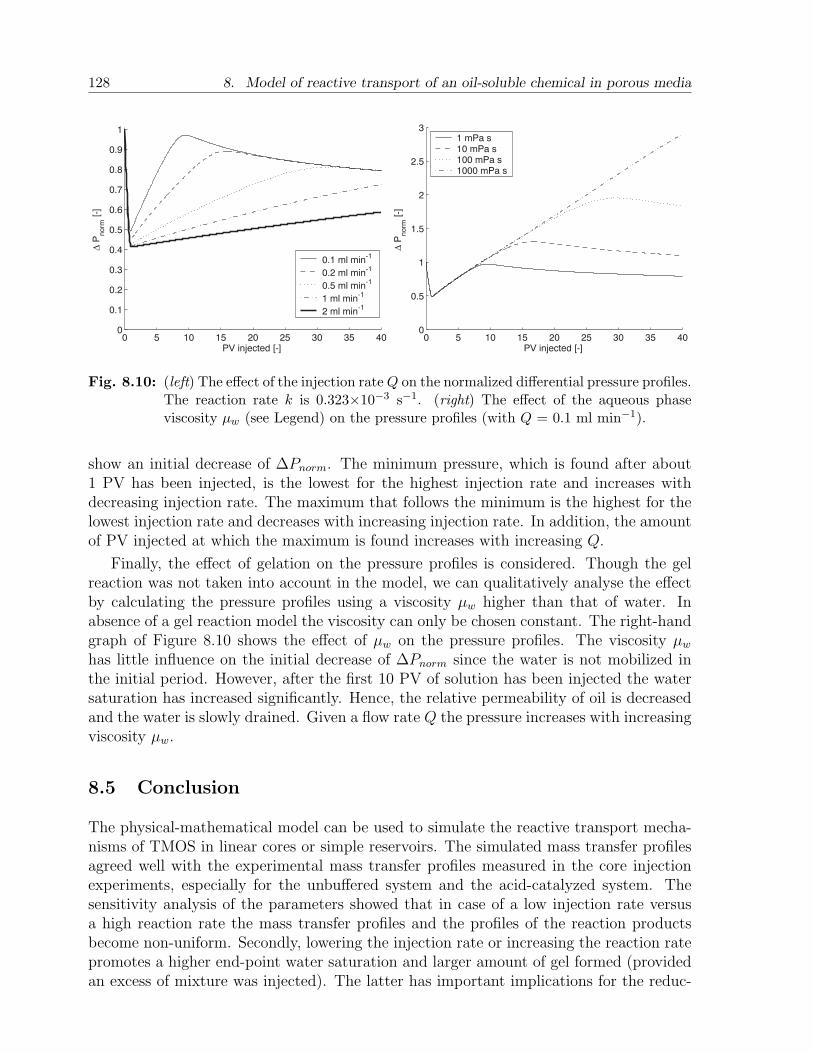
128 8. Model of reactive transport of an oil-soluble chemical in porous media
0 5 10 15 20 25 30 35 400
0.1
0.2
0.3
0.4
0.5
0.6
0.7
0.8
0.9
1
PV injected [-]
∆ P
norm
[-]
0.1 ml min-1
0.2 ml min-1
0.5 ml min-1
1 ml min-1
2 ml min-1
0 5 10 15 20 25 30 35 400
0.5
1
1.5
2
2.5
3
PV injected [-]
∆ P
norm
[-]
1 mPa s10 mPa s100 mPa s1000 mPa s
Fig. 8.10: (left) The effect of the injection rate Q on the normalized differential pressure profiles.The reaction rate k is 0.323×10⁻³ s−1. (right) The effect of the aqueous phaseviscosity µw (see Legend) on the pressure profiles (with Q = 0.1 ml min−1).
show an initial decrease of ∆Pnorm. The minimum pressure, which is found after about1 PV has been injected, is the lowest for the highest injection rate and increases withdecreasing injection rate. The maximum that follows the minimum is the highest for thelowest injection rate and decreases with increasing injection rate. In addition, the amountof PV injected at which the maximum is found increases with increasing Q.
Finally, the effect of gelation on the pressure profiles is considered. Though the gelreaction was not taken into account in the model, we can qualitatively analyse the effectby calculating the pressure profiles using a viscosity µw higher than that of water. Inabsence of a gel reaction model the viscosity can only be chosen constant. The right-handgraph of Figure 8.10 shows the effect of µw on the pressure profiles. The viscosity µw
has little influence on the initial decrease of ∆Pnorm since the water is not mobilized inthe initial period. However, after the first 10 PV of solution has been injected the watersaturation has increased significantly. Hence, the relative permeability of oil is decreasedand the water is slowly drained. Given a flow rate Q the pressure increases with increasingviscosity µw.
8.5 Conclusion
The physical-mathematical model can be used to simulate the reactive transport mecha-nisms of TMOS in linear cores or simple reservoirs. The simulated mass transfer profilesagreed well with the experimental mass transfer profiles measured in the core injectionexperiments, especially for the unbuffered system and the acid-catalyzed system. Thesensitivity analysis of the parameters showed that in case of a low injection rate versusa high reaction rate the mass transfer profiles and the profiles of the reaction productsbecome non-uniform. Secondly, lowering the injection rate or increasing the reaction ratepromotes a higher end-point water saturation and larger amount of gel formed (providedan excess of mixture was injected). The latter has important implications for the reduc-

8.5. Conclusion 129
tion of oil phase conductivity. In case the mixture is injected continuously the calculateddifferential pressure profile appears to be well explained by the average oil viscosity in theinitial stages and the changes in the water saturation in the later stages. The pressureprofiles are dominated by the ratio of the injection rate and the reaction rate. The effectof gelation, in terms of an increased aqueous phase viscosity, is not important in the initialphase of the injection process.

130 8. Model of reactive transport of an oil-soluble chemical in porous media
Chapter 9
Concluding remarks and outlook
This final chapter contains the main conclusions based on the work described inthis thesis. The reactive transport mechanisms are considered first, followed by theconclusions for permeability modification. Finally, the use of TMOS as an OSC forwater shut-off is briefly discussed, and an outlook is given for future research.
9.1 Coupled mass transfer and gel reaction
An overview of the main mechanisms and parameters involved in the reactive transportof TMOS is given in Figure 9.1. Predominantly, the mass transfer of TMOS is drivenby the hydrolysis reaction in the aqueous phase, both in bulk systems and in porousmaterials. The hydrolysis rate (hence the mass transfer rate) increases with temperatureand is strongly dependent on pH. At a neutral pH the rate is minimum but increases inthe presence of acid- or base-catalysts. The transfer of TMOS tends to completion on atime scale of hours. Formation of gel in the aqueous phase before complete transfer doesnot yield an impermeable barrier and in such case the TMOS continues to transfer. Asthe mass transfer is limited by the solubility of TMOS in water and the hydrolysis rate,and not by diffusion, it can be described by a coupled partitioning-reaction model.
The condensation reaction is characterized by the time-dependent transverse relax-ation time T2 of the aqueous phase. Due to the cross-linking of the hydrolyzed TMOSmolecules the T2 decreases with respect to bulk water and reaches a minimum (or plateau)at the gel point. The gel time decreases with increasing temperature and increasingconcentration of TMOS initially present in the oleic phase. The condensation rate ismaximum at a pH around 6 and minimum in the acid-catalyzed systems.
When a solution of TMOS in oil is forced into a water-wet sandstone at the irreduciblewater saturation the solution displaces the non-wetting phase. Concurrently the TMOStransfers to the wetting phase and reacts with water on the pore scale. Since the solutionis placed in the porous medium with a finite injection rate, the accumulation of TMOSand, hence, the formation of gel is non-uniform (i.e. macroscopically) in case of a highhydrolysis rate versus a slow injection rate. The pore scale mechanisms of the gel reactionwere not revealed by the experiments. However, in some of the alkaline systems multi-component T2 spectra were obtained, which indicate that the formation of gel is non-uniform on the pore scale.
131
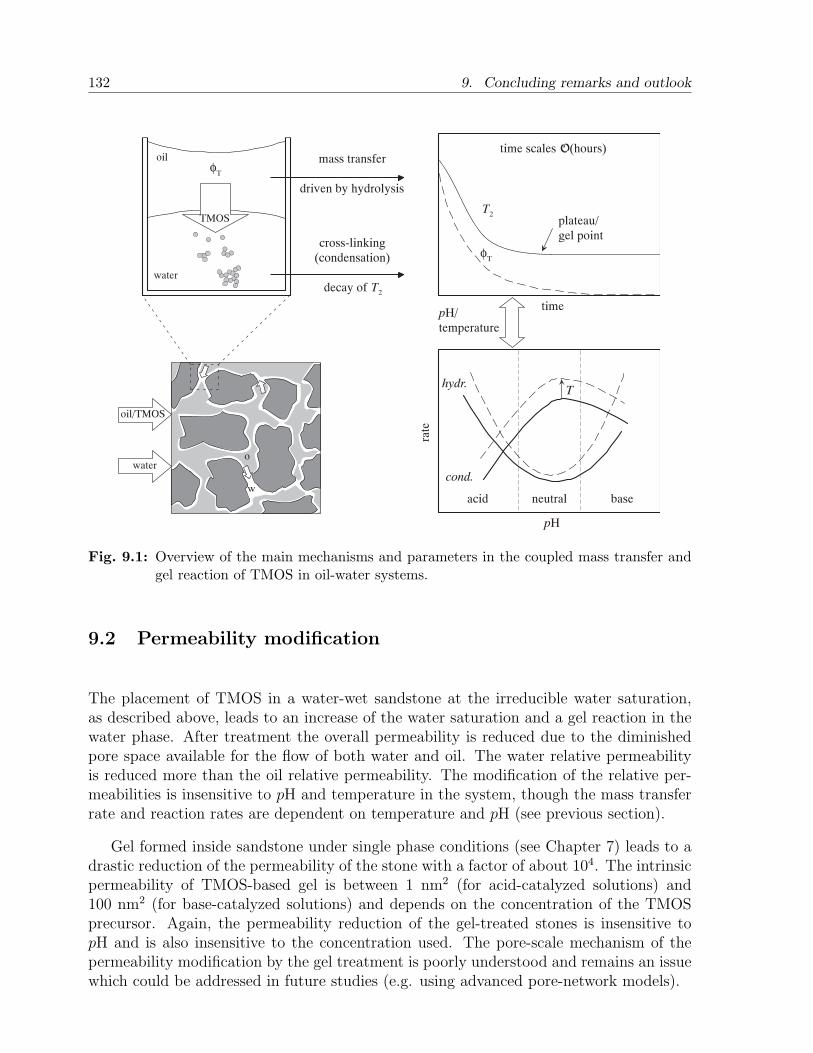
132 9. Concluding remarks and outlook
time
T2
plateau/gel point
TMOS
oil
water
φT
cross-linking(condensation)
decay of T2
mass transfer
driven by hydrolysis
pH
neutralacid base
pH/temperature
rate
hydr.
cond.
T
time scales O(hours)
φT
water
oil/TMOS
w
o
Fig. 9.1: Overview of the main mechanisms and parameters in the coupled mass transfer andgel reaction of TMOS in oil-water systems.
9.2 Permeability modification
The placement of TMOS in a water-wet sandstone at the irreducible water saturation,as described above, leads to an increase of the water saturation and a gel reaction in thewater phase. After treatment the overall permeability is reduced due to the diminishedpore space available for the flow of both water and oil. The water relative permeabilityis reduced more than the oil relative permeability. The modification of the relative per-meabilities is insensitive to pH and temperature in the system, though the mass transferrate and reaction rates are dependent on temperature and pH (see previous section).
Gel formed inside sandstone under single phase conditions (see Chapter 7) leads to adrastic reduction of the permeability of the stone with a factor of about 104. The intrinsicpermeability of TMOS-based gel is between 1 nm2 (for acid-catalyzed solutions) and100 nm2 (for base-catalyzed solutions) and depends on the concentration of the TMOSprecursor. Again, the permeability reduction of the gel-treated stones is insensitive topH and is also insensitive to the concentration used. The pore-scale mechanism of thepermeability modification by the gel treatment is poorly understood and remains an issuewhich could be addressed in future studies (e.g. using advanced pore-network models).
9.3. Water shut-off treatments 133
9.3 Water shut-off treatments
The advantage of using an OSC, such as TMOS, is that it reacts selectively when placedin a reservoir containing both oil and water. In oil-saturated zones the TMOS will onlyform gel in the presence of connate water. As discussed before this will lead to a decreaseof permeability for both oil and water. However, the permeability reduction for oil willbe smaller than the permeability reduction for water.
It is advised to limit, in the application of the OSC, the concentration of TMOS insolution below roughly 20%. This should be done in order to limit the amount of gelformed in the oil-producing zones. After shut-in the production is resumed, the flow of oilwill be reduced but not hindered. Ideally, the water in the watered-out zones is blockedtowards the production well. In case the water channels through the treated oil-saturatedzones it will face a reduced relative permeability due to the formed gel. Reservoir modelscould be used to predict the flow profiles of both oil and water in the near-wellbore afterthe gel treatment, in order to optimize the treatment procedure.
The reaction of TMOS with water leads to a relatively quick formation of gel, especiallyat elevated temperatures and in the presence of base catalysts or some other salts. Theconditions found in the field vary, but temperatures above 50 C and the presence of salts[143, 144] are common in downhole reservoirs. When planning a water shut-off treatmentthe composition of the brine and the temperature downhole should be taken into account.Simple bulk phase experiments could be performed on site to evaluate the gel time. Acontrolled placement of TMOS in a well-defined near-wellbore region without prematuregelation (also in the assembly) is therefore challenging. A preflush of oil could prove to beuseful, first of all in order to cool the wellbore area, and secondly to create a non-wettingpathway in the water-saturated zones.
9.4 Outlook
9.4.1 Extended physical-chemical survey
With respect to the chemical mechanisms of the reactive transport the problem wasanalyzed using a limited set of parameters, in terms of temperature, pH, concentrationof TMOS etc. Since the sol-gel reaction is known to be sensitive not only to pH andtemperature but also to concentration and type of catalysts (salts) [24] it is recommendedto extend the physical-chemical analysis. Furthermore, it would be interesting to studythe effect of oil-composition (and viscosity), wettability and rock type on the reactivetransport mechanisms.
As opposed to the indirect determination of the gel time (based on T2) one could em-ploy rheological measurements. A few test experiments were performed using a Couette-type rheometer (Contraves Low Shear 40) to determine the dynamic shear modulus of agelling TMOS solution (see Figure 9.2). A low-frequency oscillating strain with a smallamplitude was imposed on the solution. The absolute shear modulus, which is initiallyaround 0.015 Pa, increases to about 8 Pa at the gel time. The relatively low and fluctuat-ing modulus after the steep increase is probably a result of a poor contact between the gel
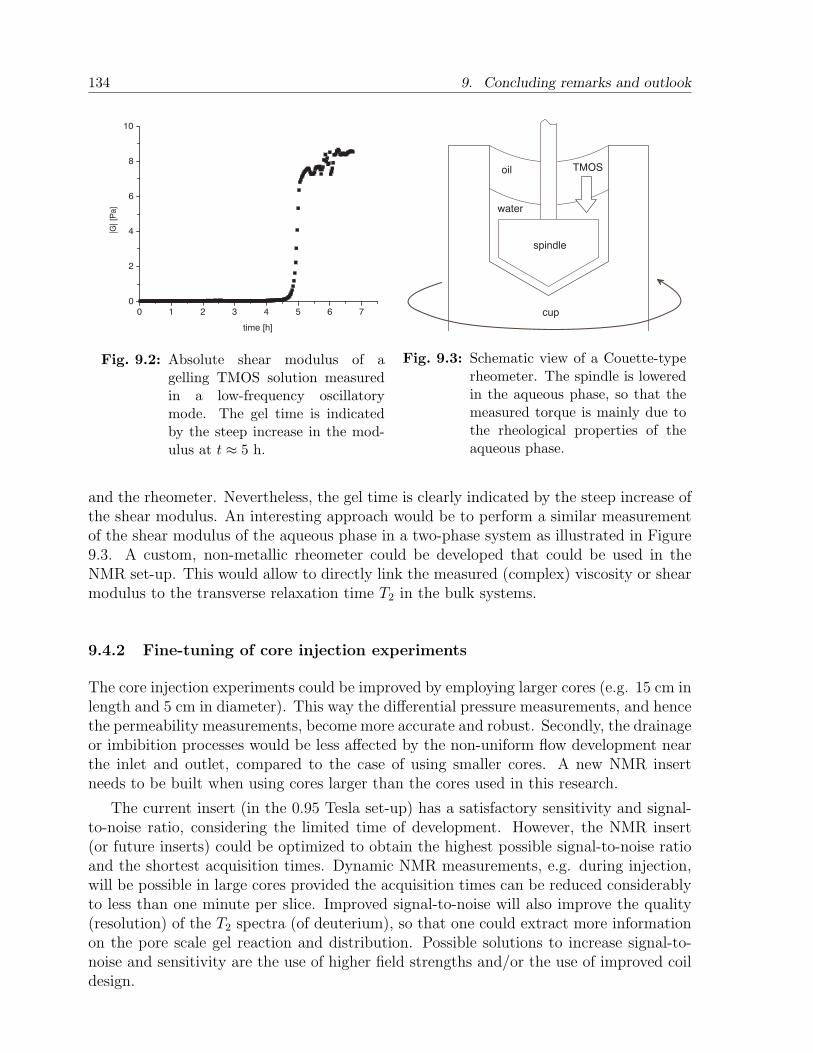
134 9. Concluding remarks and outlook
0 1 2 3 4 5 6 70
2
4
6
8
10
|G| [P
a]
time [h]
Fig. 9.2: Absolute shear modulus of agelling TMOS solution measuredin a low-frequency oscillatorymode. The gel time is indicatedby the steep increase in the mod-ulus at t ≈ 5 h.
oil
water
spindle
cup
TMOS
Fig. 9.3: Schematic view of a Couette-typerheometer. The spindle is loweredin the aqueous phase, so that themeasured torque is mainly due tothe rheological properties of theaqueous phase.
and the rheometer. Nevertheless, the gel time is clearly indicated by the steep increase ofthe shear modulus. An interesting approach would be to perform a similar measurementof the shear modulus of the aqueous phase in a two-phase system as illustrated in Figure9.3. A custom, non-metallic rheometer could be developed that could be used in theNMR set-up. This would allow to directly link the measured (complex) viscosity or shearmodulus to the transverse relaxation time T2 in the bulk systems.
9.4.2 Fine-tuning of core injection experiments
The core injection experiments could be improved by employing larger cores (e.g. 15 cm inlength and 5 cm in diameter). This way the differential pressure measurements, and hencethe permeability measurements, become more accurate and robust. Secondly, the drainageor imbibition processes would be less affected by the non-uniform flow development nearthe inlet and outlet, compared to the case of using smaller cores. A new NMR insertneeds to be built when using cores larger than the cores used in this research.
The current insert (in the 0.95 Tesla set-up) has a satisfactory sensitivity and signal-to-noise ratio, considering the limited time of development. However, the NMR insert(or future inserts) could be optimized to obtain the highest possible signal-to-noise ratioand the shortest acquisition times. Dynamic NMR measurements, e.g. during injection,will be possible in large cores provided the acquisition times can be reduced considerablyto less than one minute per slice. Improved signal-to-noise will also improve the quality(resolution) of the T2 spectra (of deuterium), so that one could extract more informationon the pore scale gel reaction and distribution. Possible solutions to increase signal-to-noise and sensitivity are the use of higher field strengths and/or the use of improved coildesign.
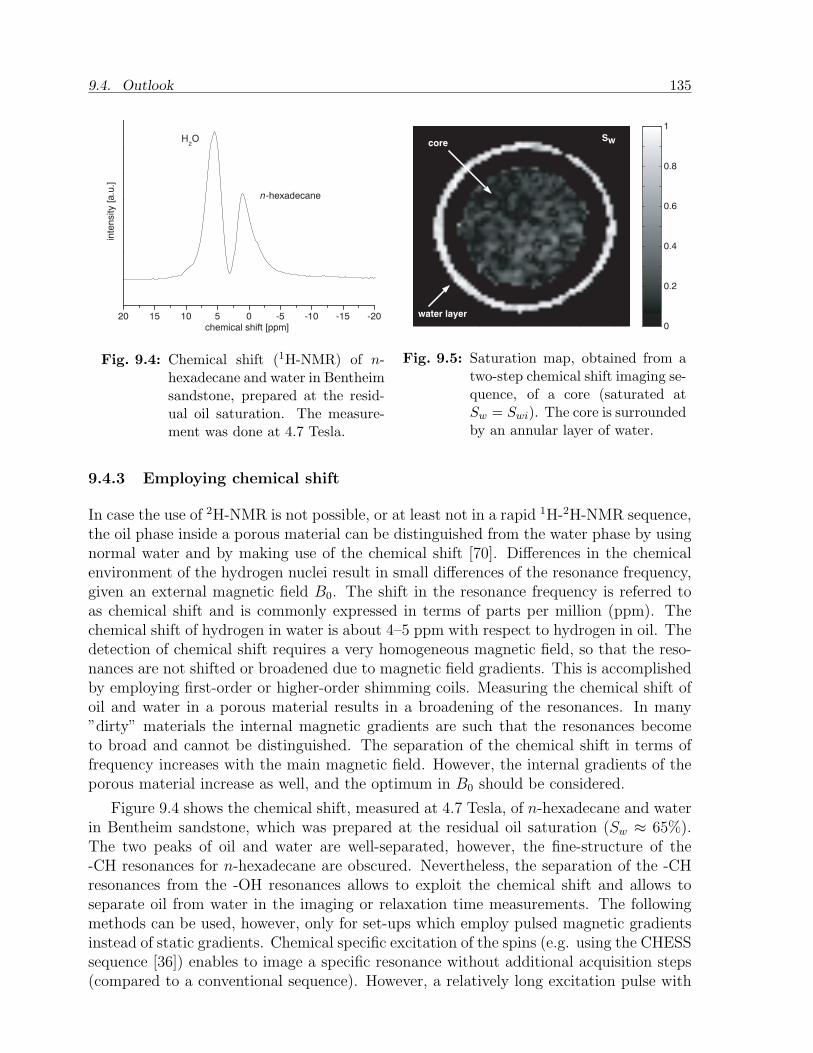
9.4. Outlook 135
20 15 10 5 0 -5 -10 -15 -20
n-hexadecane
H2O
inte
nsity [a.u
.]
chemical shift [ppm]
Fig. 9.4: Chemical shift (1H-NMR) of n-hexadecane and water in Bentheimsandstone, prepared at the resid-ual oil saturation. The measure-ment was done at 4.7 Tesla.
0
0.2
0.4
0.6
0.8
1
core
water layer
Sw
Fig. 9.5: Saturation map, obtained from atwo-step chemical shift imaging se-quence, of a core (saturated atSw = Swi). The core is surroundedby an annular layer of water.
9.4.3 Employing chemical shift
In case the use of 2H-NMR is not possible, or at least not in a rapid 1H-2H-NMR sequence,the oil phase inside a porous material can be distinguished from the water phase by usingnormal water and by making use of the chemical shift [70]. Differences in the chemicalenvironment of the hydrogen nuclei result in small differences of the resonance frequency,given an external magnetic field B0. The shift in the resonance frequency is referred toas chemical shift and is commonly expressed in terms of parts per million (ppm). Thechemical shift of hydrogen in water is about 4–5 ppm with respect to hydrogen in oil. Thedetection of chemical shift requires a very homogeneous magnetic field, so that the reso-nances are not shifted or broadened due to magnetic field gradients. This is accomplishedby employing first-order or higher-order shimming coils. Measuring the chemical shift ofoil and water in a porous material results in a broadening of the resonances. In many”dirty” materials the internal magnetic gradients are such that the resonances becometo broad and cannot be distinguished. The separation of the chemical shift in terms offrequency increases with the main magnetic field. However, the internal gradients of theporous material increase as well, and the optimum in B0 should be considered.
Figure 9.4 shows the chemical shift, measured at 4.7 Tesla, of n-hexadecane and waterin Bentheim sandstone, which was prepared at the residual oil saturation (Sw ≈ 65%).The two peaks of oil and water are well-separated, however, the fine-structure of the-CH resonances for n-hexadecane are obscured. Nevertheless, the separation of the -CHresonances from the -OH resonances allows to exploit the chemical shift and allows toseparate oil from water in the imaging or relaxation time measurements. The followingmethods can be used, however, only for set-ups which employ pulsed magnetic gradientsinstead of static gradients. Chemical specific excitation of the spins (e.g. using the CHESSsequence [36]) enables to image a specific resonance without additional acquisition steps(compared to a conventional sequence). However, a relatively long excitation pulse with
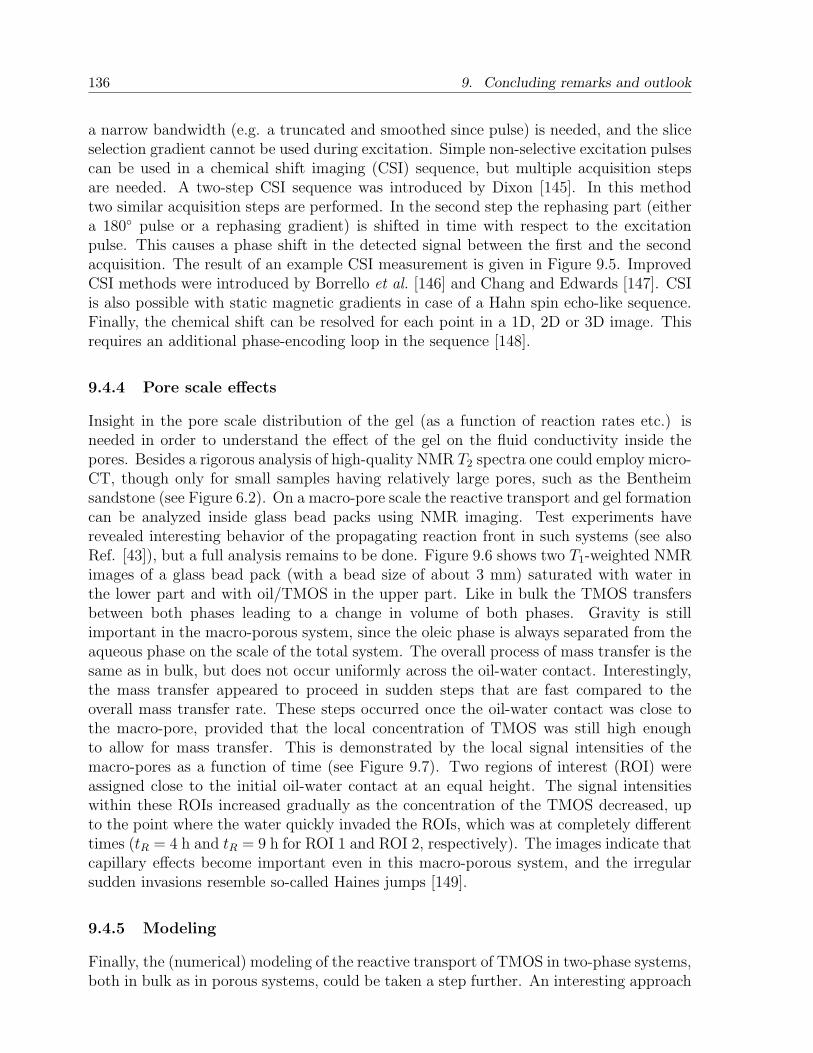
136 9. Concluding remarks and outlook
a narrow bandwidth (e.g. a truncated and smoothed since pulse) is needed, and the sliceselection gradient cannot be used during excitation. Simple non-selective excitation pulsescan be used in a chemical shift imaging (CSI) sequence, but multiple acquisition stepsare needed. A two-step CSI sequence was introduced by Dixon [145]. In this methodtwo similar acquisition steps are performed. In the second step the rephasing part (eithera 180 pulse or a rephasing gradient) is shifted in time with respect to the excitationpulse. This causes a phase shift in the detected signal between the first and the secondacquisition. The result of an example CSI measurement is given in Figure 9.5. ImprovedCSI methods were introduced by Borrello et al. [146] and Chang and Edwards [147]. CSIis also possible with static magnetic gradients in case of a Hahn spin echo-like sequence.Finally, the chemical shift can be resolved for each point in a 1D, 2D or 3D image. Thisrequires an additional phase-encoding loop in the sequence [148].
9.4.4 Pore scale effects
Insight in the pore scale distribution of the gel (as a function of reaction rates etc.) isneeded in order to understand the effect of the gel on the fluid conductivity inside thepores. Besides a rigorous analysis of high-quality NMR T2 spectra one could employ micro-CT, though only for small samples having relatively large pores, such as the Bentheimsandstone (see Figure 6.2). On a macro-pore scale the reactive transport and gel formationcan be analyzed inside glass bead packs using NMR imaging. Test experiments haverevealed interesting behavior of the propagating reaction front in such systems (see alsoRef. [43]), but a full analysis remains to be done. Figure 9.6 shows two T1-weighted NMRimages of a glass bead pack (with a bead size of about 3 mm) saturated with water inthe lower part and with oil/TMOS in the upper part. Like in bulk the TMOS transfersbetween both phases leading to a change in volume of both phases. Gravity is stillimportant in the macro-porous system, since the oleic phase is always separated from theaqueous phase on the scale of the total system. The overall process of mass transfer is thesame as in bulk, but does not occur uniformly across the oil-water contact. Interestingly,the mass transfer appeared to proceed in sudden steps that are fast compared to theoverall mass transfer rate. These steps occurred once the oil-water contact was close tothe macro-pore, provided that the local concentration of TMOS was still high enoughto allow for mass transfer. This is demonstrated by the local signal intensities of themacro-pores as a function of time (see Figure 9.7). Two regions of interest (ROI) wereassigned close to the initial oil-water contact at an equal height. The signal intensitieswithin these ROIs increased gradually as the concentration of the TMOS decreased, upto the point where the water quickly invaded the ROIs, which was at completely differenttimes (tR = 4 h and tR = 9 h for ROI 1 and ROI 2, respectively). The images indicate thatcapillary effects become important even in this macro-porous system, and the irregularsudden invasions resemble so-called Haines jumps [149].
9.4.5 Modeling
Finally, the (numerical) modeling of the reactive transport of TMOS in two-phase systems,both in bulk as in porous systems, could be taken a step further. An interesting approach
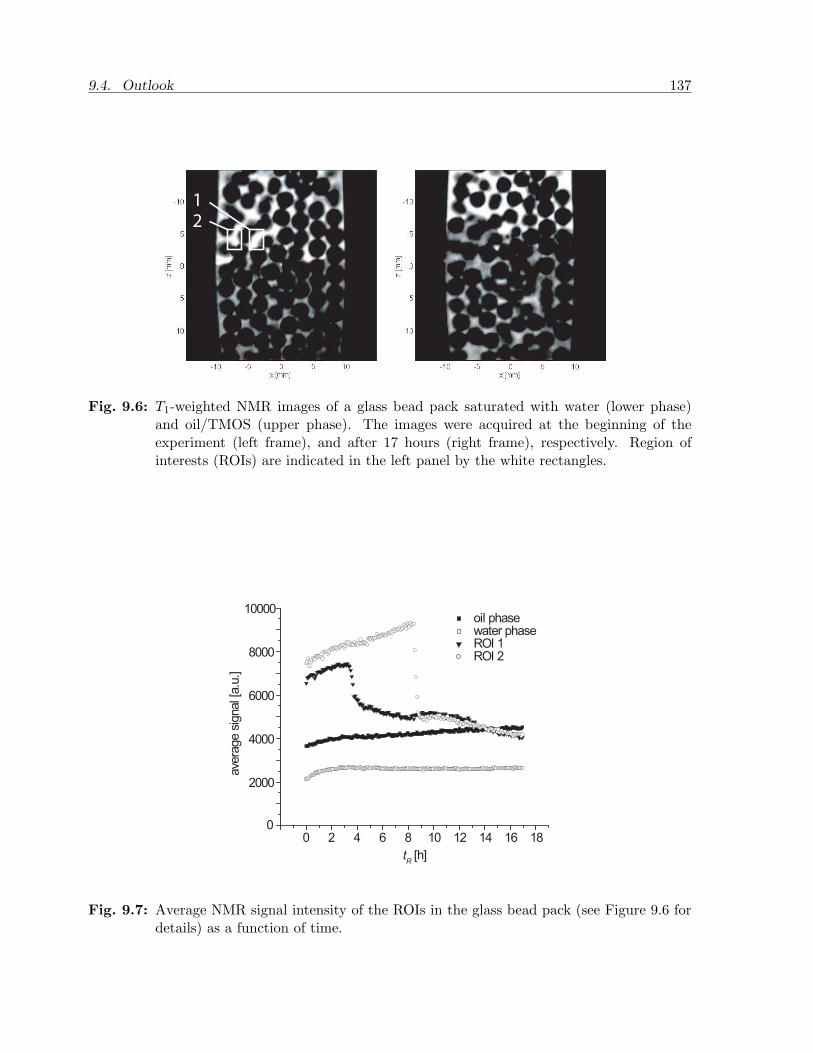
9.4. Outlook 137
1
2
Fig. 9.6: T1-weighted NMR images of a glass bead pack saturated with water (lower phase)and oil/TMOS (upper phase). The images were acquired at the beginning of theexperiment (left frame), and after 17 hours (right frame), respectively. Region ofinterests (ROIs) are indicated in the left panel by the white rectangles.
0 2 4 6 8 10 12 14 16 180
2000
4000
6000
8000
10000 oil phase water phase ROI 1 ROI 2
ave
rage s
ignal [
a.u
.]
tR [h]
Fig. 9.7: Average NMR signal intensity of the ROIs in the glass bead pack (see Figure 9.6 fordetails) as a function of time.
138 9. Concluding remarks and outlook
is to adopt a non-equilibrium thermodynamical model (Cahn-Hilliard models [150] ordiffusive interface models [151]) and to include the description of multi-components andchemical reactions. With a proper free energy expression the effect of solubility of TMOSboth in oil and water can be modeled, and thus also the partitioning behavior of TMOS.Such a model could be used both for bulk systems as for pore-scale models.
As noted in Section 9.3 a reservoir model could be used to simulate the gel placementand flow profiles (after treatment) on the the scale of a reservoir. This would answer thequestion for which situation (i.e. reservoir structure, water breakthrough scenario, etc.)the gel treatment works best, and also how the procedure could be optimized.

139

140
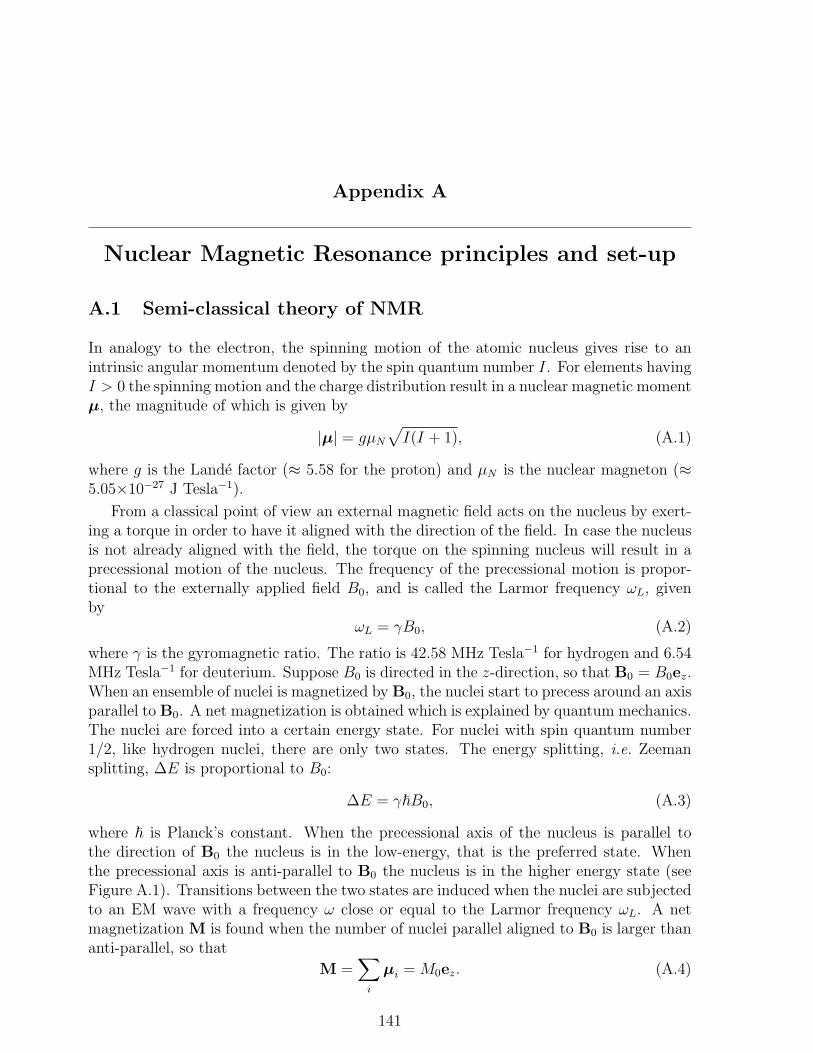
Appendix A
Nuclear Magnetic Resonance principles and set-up
A.1 Semi-classical theory of NMR
In analogy to the electron, the spinning motion of the atomic nucleus gives rise to anintrinsic angular momentum denoted by the spin quantum number I. For elements havingI > 0 the spinning motion and the charge distribution result in a nuclear magnetic momentµ, the magnitude of which is given by
|µ| = gµN
√I(I + 1), (A.1)
where g is the Lande factor (≈ 5.58 for the proton) and µN is the nuclear magneton (≈5.05×10⁻²⁷ J Tesla−1).
From a classical point of view an external magnetic field acts on the nucleus by exert-ing a torque in order to have it aligned with the direction of the field. In case the nucleusis not already aligned with the field, the torque on the spinning nucleus will result in aprecessional motion of the nucleus. The frequency of the precessional motion is propor-tional to the externally applied field B0, and is called the Larmor frequency ωL, givenby
ωL = γB0, (A.2)
where γ is the gyromagnetic ratio. The ratio is 42.58 MHz Tesla−1 for hydrogen and 6.54MHz Tesla−1 for deuterium. Suppose B0 is directed in the z-direction, so that B0 = B0ez.When an ensemble of nuclei is magnetized by B0, the nuclei start to precess around an axisparallel to B0. A net magnetization is obtained which is explained by quantum mechanics.The nuclei are forced into a certain energy state. For nuclei with spin quantum number1/2, like hydrogen nuclei, there are only two states. The energy splitting, i.e. Zeemansplitting, ∆E is proportional to B0:
∆E = γ~B0, (A.3)
where ~ is Planck’s constant. When the precessional axis of the nucleus is parallel tothe direction of B0 the nucleus is in the low-energy, that is the preferred state. Whenthe precessional axis is anti-parallel to B0 the nucleus is in the higher energy state (seeFigure A.1). Transitions between the two states are induced when the nuclei are subjectedto an EM wave with a frequency ω close or equal to the Larmor frequency ωL. A netmagnetization M is found when the number of nuclei parallel aligned to B0 is larger thananti-parallel, so that
M =∑
i
µi = M0ez. (A.4)
141
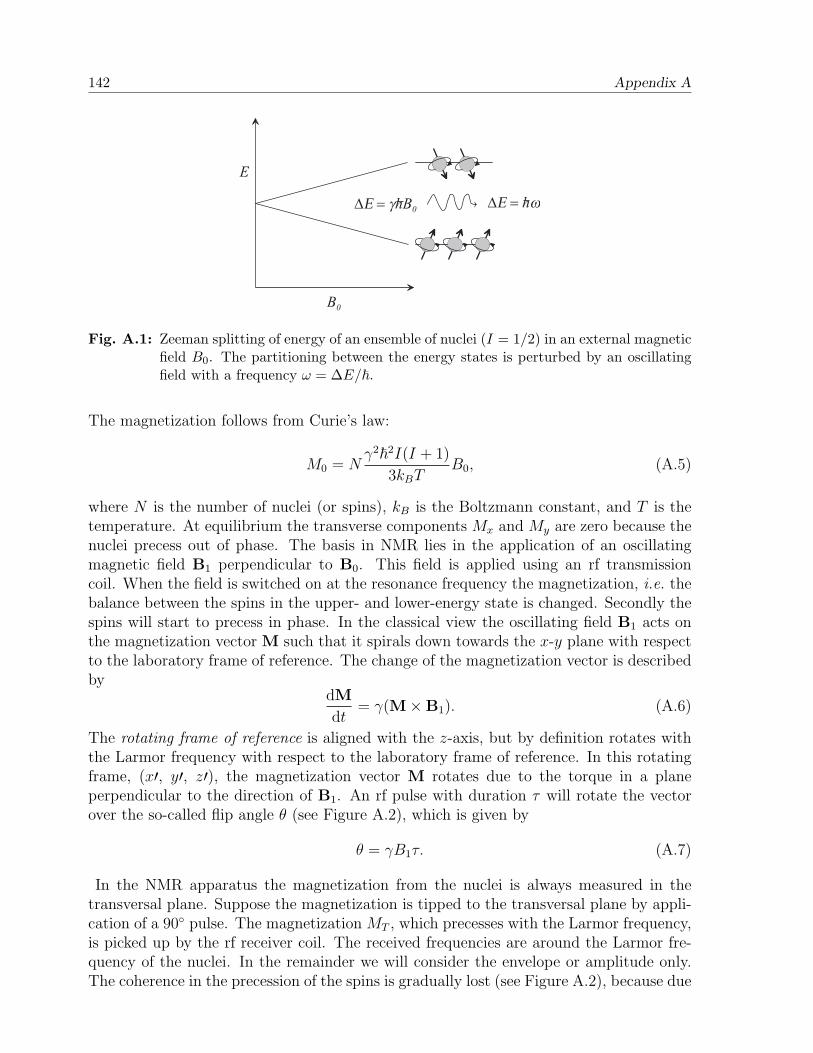
142 Appendix A
E
B 0
D E = g h B 0 D E = h w
Fig. A.1: Zeeman splitting of energy of an ensemble of nuclei (I = 1/2) in an external magneticfield B0. The partitioning between the energy states is perturbed by an oscillatingfield with a frequency ω = ∆E/~.
The magnetization follows from Curie’s law:
M0 = Nγ2~2I(I + 1)
3kBTB0, (A.5)
where N is the number of nuclei (or spins), kB is the Boltzmann constant, and T is thetemperature. At equilibrium the transverse components Mx and My are zero because thenuclei precess out of phase. The basis in NMR lies in the application of an oscillatingmagnetic field B1 perpendicular to B0. This field is applied using an rf transmissioncoil. When the field is switched on at the resonance frequency the magnetization, i.e. thebalance between the spins in the upper- and lower-energy state is changed. Secondly thespins will start to precess in phase. In the classical view the oscillating field B1 acts onthe magnetization vector M such that it spirals down towards the x-y plane with respectto the laboratory frame of reference. The change of the magnetization vector is describedby
dM
dt= γ(M×B1). (A.6)
The rotating frame of reference is aligned with the z-axis, but by definition rotates withthe Larmor frequency with respect to the laboratory frame of reference. In this rotatingframe, (x′, y′, z′), the magnetization vector M rotates due to the torque in a planeperpendicular to the direction of B1. An rf pulse with duration τ will rotate the vectorover the so-called flip angle θ (see Figure A.2), which is given by
θ = γB1τ. (A.7)
In the NMR apparatus the magnetization from the nuclei is always measured in thetransversal plane. Suppose the magnetization is tipped to the transversal plane by appli-cation of a 90 pulse. The magnetization MT , which precesses with the Larmor frequency,is picked up by the rf receiver coil. The received frequencies are around the Larmor fre-quency of the nuclei. In the remainder we will consider the envelope or amplitude only.The coherence in the precession of the spins is gradually lost (see Figure A.2), because due
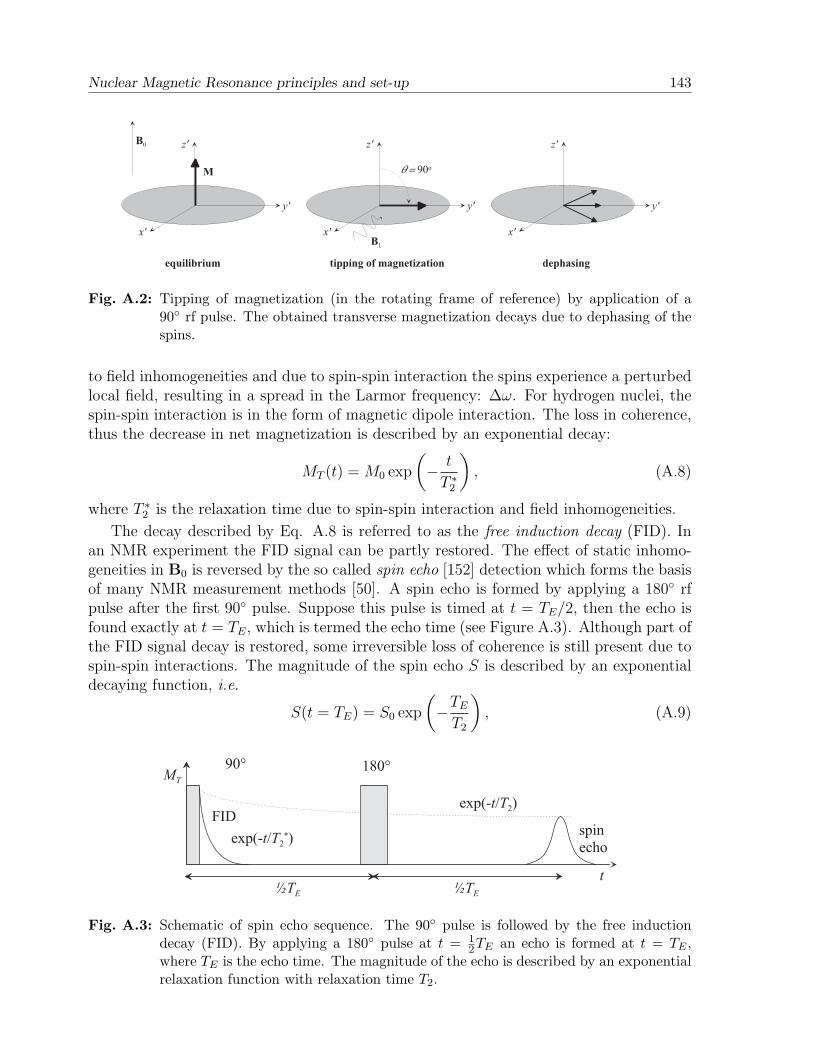
Nuclear Magnetic Resonance principles and set-up 143
z '
y '
x '
z '
y '
x '
z '
y '
x '
B 0
M q = 9 0 o
B 1
e q u i l i b r i u m t i p p i n g o f m a g n e t i z a t i o n d e p h a s i n g
Fig. A.2: Tipping of magnetization (in the rotating frame of reference) by application of a90 rf pulse. The obtained transverse magnetization decays due to dephasing of thespins.
to field inhomogeneities and due to spin-spin interaction the spins experience a perturbedlocal field, resulting in a spread in the Larmor frequency: ∆ω. For hydrogen nuclei, thespin-spin interaction is in the form of magnetic dipole interaction. The loss in coherence,thus the decrease in net magnetization is described by an exponential decay:
MT (t) = M0 exp
(− t
T ∗2
), (A.8)
where T ∗2 is the relaxation time due to spin-spin interaction and field inhomogeneities.
The decay described by Eq. A.8 is referred to as the free induction decay (FID). Inan NMR experiment the FID signal can be partly restored. The effect of static inhomo-geneities in B0 is reversed by the so called spin echo [152] detection which forms the basisof many NMR measurement methods [50]. A spin echo is formed by applying a 180 rfpulse after the first 90 pulse. Suppose this pulse is timed at t = TE/2, then the echo isfound exactly at t = TE, which is termed the echo time (see Figure A.3). Although part ofthe FID signal decay is restored, some irreversible loss of coherence is still present due tospin-spin interactions. The magnitude of the spin echo S is described by an exponentialdecaying function, i.e.
S(t = TE) = S0 exp
(−TE
T2
), (A.9)
t
F I D
9 0 ° 1 8 0 °
e x p ( - t / T 2* )
e x p ( - t / T 2 )
½ T E ½ T E
s p i ne c h o
M T
Fig. A.3: Schematic of spin echo sequence. The 90 pulse is followed by the free inductiondecay (FID). By applying a 180 pulse at t = 1
2TE an echo is formed at t = TE ,where TE is the echo time. The magnitude of the echo is described by an exponentialrelaxation function with relaxation time T2.
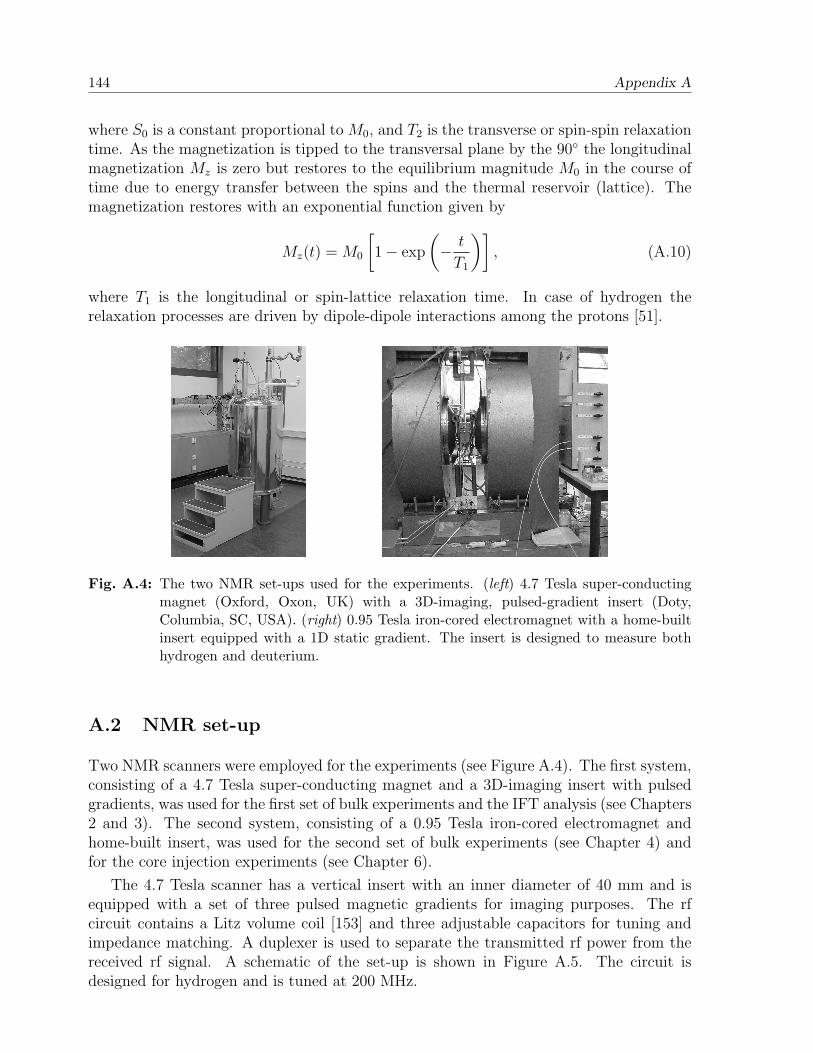
144 Appendix A
where S0 is a constant proportional to M0, and T2 is the transverse or spin-spin relaxationtime. As the magnetization is tipped to the transversal plane by the 90 the longitudinalmagnetization Mz is zero but restores to the equilibrium magnitude M0 in the course oftime due to energy transfer between the spins and the thermal reservoir (lattice). Themagnetization restores with an exponential function given by
Mz(t) = M0
[1− exp
(− t
T1
)], (A.10)
where T1 is the longitudinal or spin-lattice relaxation time. In case of hydrogen therelaxation processes are driven by dipole-dipole interactions among the protons [51].
Fig. A.4: The two NMR set-ups used for the experiments. (left) 4.7 Tesla super-conductingmagnet (Oxford, Oxon, UK) with a 3D-imaging, pulsed-gradient insert (Doty,Columbia, SC, USA). (right) 0.95 Tesla iron-cored electromagnet with a home-builtinsert equipped with a 1D static gradient. The insert is designed to measure bothhydrogen and deuterium.
A.2 NMR set-up
Two NMR scanners were employed for the experiments (see Figure A.4). The first system,consisting of a 4.7 Tesla super-conducting magnet and a 3D-imaging insert with pulsedgradients, was used for the first set of bulk experiments and the IFT analysis (see Chapters2 and 3). The second system, consisting of a 0.95 Tesla iron-cored electromagnet andhome-built insert, was used for the second set of bulk experiments (see Chapter 4) andfor the core injection experiments (see Chapter 6).
The 4.7 Tesla scanner has a vertical insert with an inner diameter of 40 mm and isequipped with a set of three pulsed magnetic gradients for imaging purposes. The rfcircuit contains a Litz volume coil [153] and three adjustable capacitors for tuning andimpedance matching. A duplexer is used to separate the transmitted rf power from thereceived rf signal. A schematic of the set-up is shown in Figure A.5. The circuit isdesigned for hydrogen and is tuned at 200 MHz.
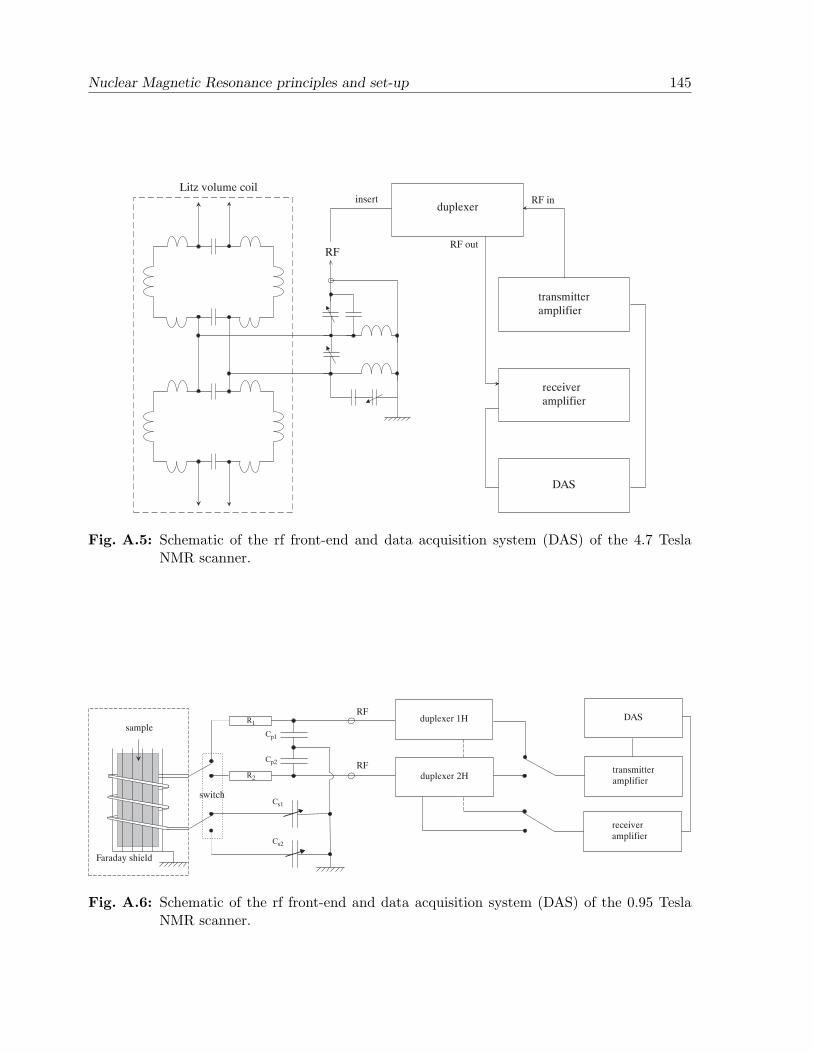
Nuclear Magnetic Resonance principles and set-up 145
Litz volume coil
RF
duplexer
transmitteramplifier
receiveramplifier
DAS
RF in
RF out
insert
Fig. A.5: Schematic of the rf front-end and data acquisition system (DAS) of the 4.7 TeslaNMR scanner.
Faraday shield
sample
switch
R2
Cp1
R1
Cp2
Cs1
Cs2
duplexer 1H
duplexer 2HRF
RF
transmitteramplifier
receiveramplifier
DAS
Fig. A.6: Schematic of the rf front-end and data acquisition system (DAS) of the 0.95 TeslaNMR scanner.
146 Appendix A
The 0.95 Tesla scanner has a vertical insert with an inner diameter of 31 mm. Theinsert was designed to measure both hydrogen (at 40.5 MHz) and deuterium (at 6.23MHz). Two different rf circuits are used which share a single solenoid coil (see FigureA.6). The coil is wound around a Faraday shield which reduces the effect of variations inthe dielectric permittivity of the sample on the tuning [154]. A switch is placed betweenthe coil and the two rf circuits which allows for fast toggling between the measurement ofhydrogen or deuterium. Each circuit has its own duplexer tuned at the proper frequency.The frequency of the transmitted rf power is set by the transmitter. The rf power is fedto one of the duplexers through a relay. Another relay is used to connect the properduplexer to the amplifier for the incoming rf signal which is further processed in the dataacquisition system (DAS). The (mechanical) switch and both relays are controlled bythe DAS. A set of Anderson coils is used to produce a 1D static gradient in the verticaldirection. Both scanners are operated using software developed in the laboratory [155].
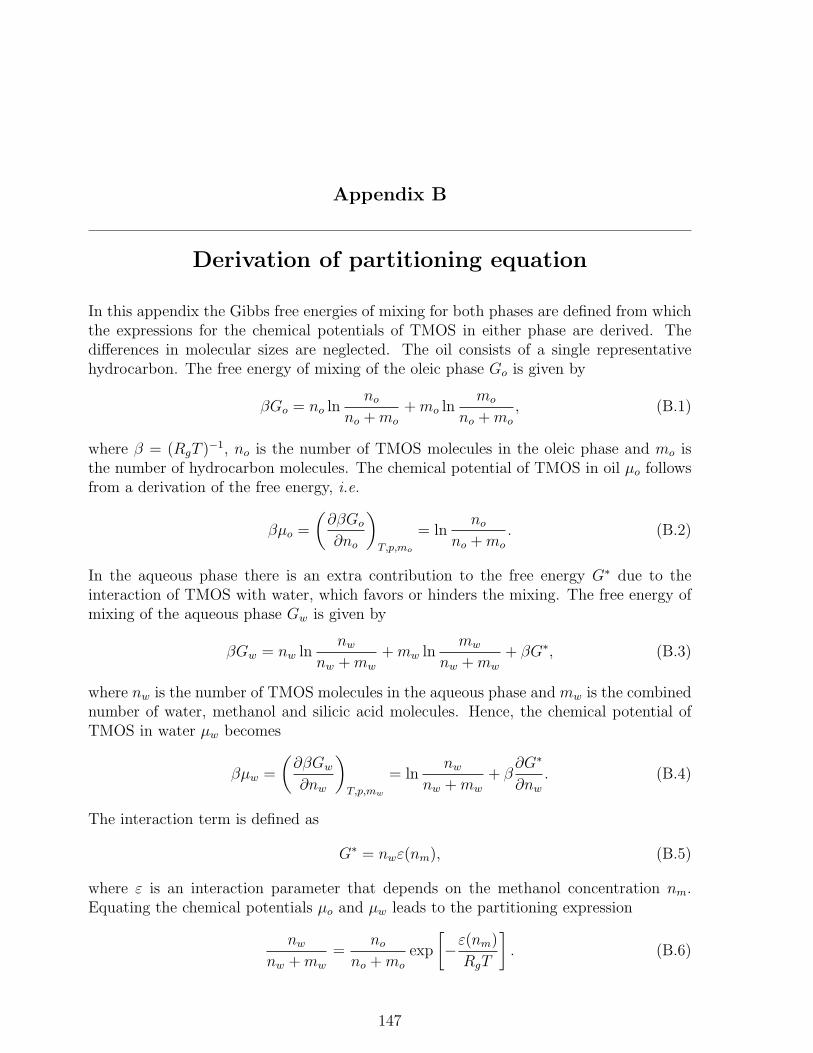
Appendix B
Derivation of partitioning equation
In this appendix the Gibbs free energies of mixing for both phases are defined from whichthe expressions for the chemical potentials of TMOS in either phase are derived. Thedifferences in molecular sizes are neglected. The oil consists of a single representativehydrocarbon. The free energy of mixing of the oleic phase Go is given by
βGo = no lnno
no + mo
+ mo lnmo
no + mo
, (B.1)
where β = (RgT )−1, no is the number of TMOS molecules in the oleic phase and mo isthe number of hydrocarbon molecules. The chemical potential of TMOS in oil µo followsfrom a derivation of the free energy, i.e.
βµo =
(∂βGo
∂no
)T,p,mo
= lnno
no + mo
. (B.2)
In the aqueous phase there is an extra contribution to the free energy G∗ due to theinteraction of TMOS with water, which favors or hinders the mixing. The free energy ofmixing of the aqueous phase Gw is given by
βGw = nw lnnw
nw + mw
+ mw lnmw
nw + mw
+ βG∗, (B.3)
where nw is the number of TMOS molecules in the aqueous phase and mw is the combinednumber of water, methanol and silicic acid molecules. Hence, the chemical potential ofTMOS in water µw becomes
βµw =
(∂βGw
∂nw
)T,p,mw
= lnnw
nw + mw
+ β∂G∗
∂nw
. (B.4)
The interaction term is defined as
G∗ = nwε(nm), (B.5)
where ε is an interaction parameter that depends on the methanol concentration nm.Equating the chemical potentials µo and µw leads to the partitioning expression
nw
nw + mw
=no
no + mo
exp
[−ε(nm)
RgT
]. (B.6)
147

148 Appendix B
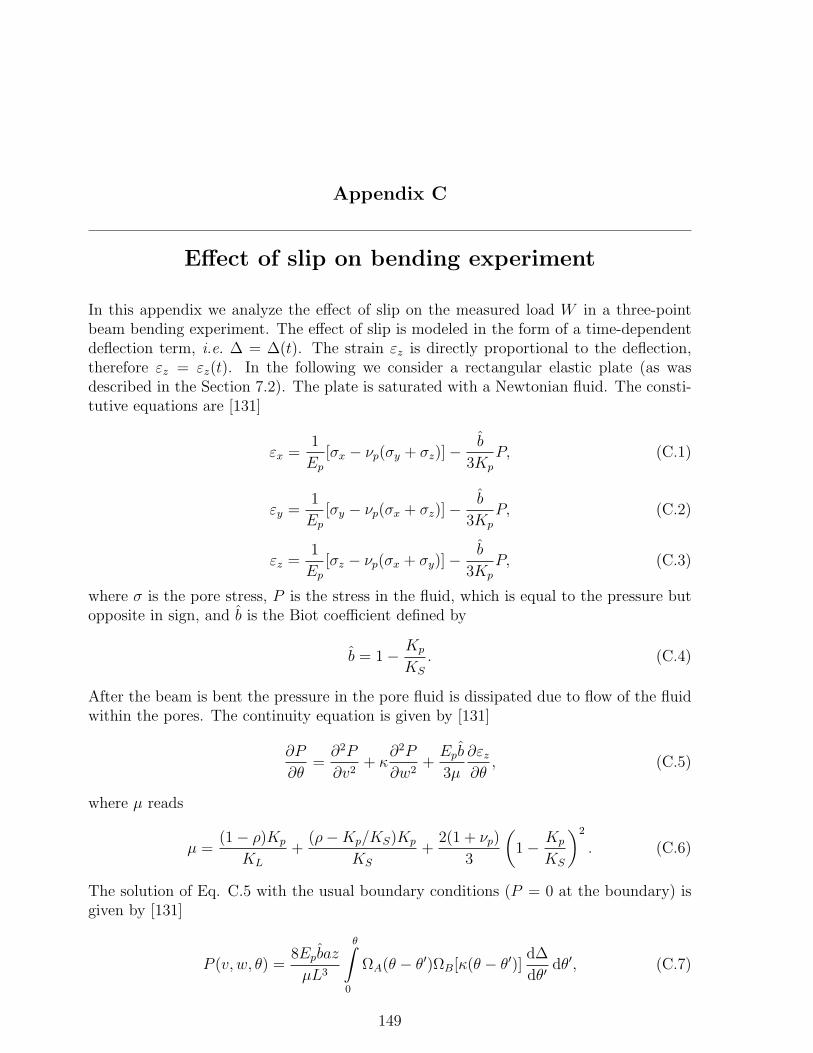
Appendix C
Effect of slip on bending experiment
In this appendix we analyze the effect of slip on the measured load W in a three-pointbeam bending experiment. The effect of slip is modeled in the form of a time-dependentdeflection term, i.e. ∆ = ∆(t). The strain εz is directly proportional to the deflection,therefore εz = εz(t). In the following we consider a rectangular elastic plate (as wasdescribed in the Section 7.2). The plate is saturated with a Newtonian fluid. The consti-tutive equations are [131]
εx =1
Ep
[σx − νp(σy + σz)]−b
3Kp
P, (C.1)
εy =1
Ep
[σy − νp(σx + σz)]−b
3Kp
P, (C.2)
εz =1
Ep
[σz − νp(σx + σy)]−b
3Kp
P, (C.3)
where σ is the pore stress, P is the stress in the fluid, which is equal to the pressure butopposite in sign, and b is the Biot coefficient defined by
b = 1− Kp
KS
. (C.4)
After the beam is bent the pressure in the pore fluid is dissipated due to flow of the fluidwithin the pores. The continuity equation is given by [131]
∂P
∂θ=
∂2P
∂v2+ κ
∂2P
∂w2+
Epb
3µ
∂εz
∂θ, (C.5)
where µ reads
µ =(1− ρ)Kp
KL
+(ρ−Kp/KS)Kp
KS
+2(1 + νp)
3
(1− Kp
KS
)2
. (C.6)
The solution of Eq. C.5 with the usual boundary conditions (P = 0 at the boundary) isgiven by [131]
P (v, w, θ) =8Epbaz
µL3
θ∫0
ΩA(θ − θ′)ΩB[κ(θ − θ′)]d∆
dθ′dθ′, (C.7)
149
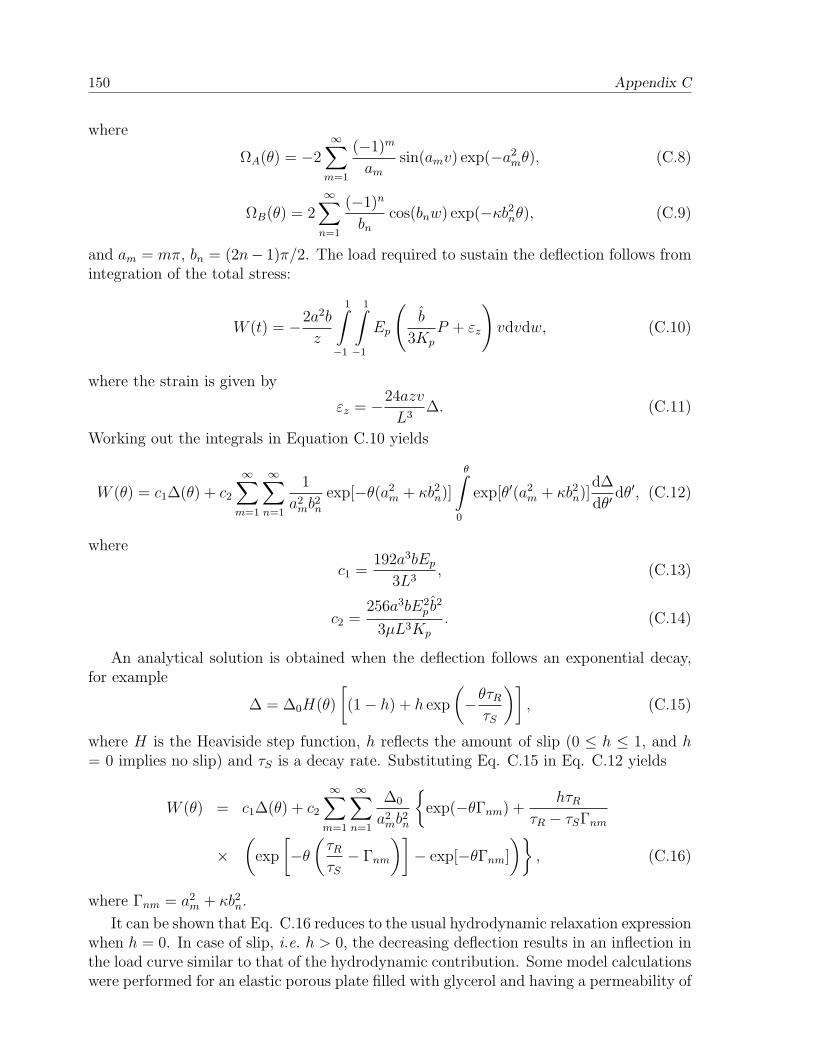
150 Appendix C
where
ΩA(θ) = −2∞∑
m=1
(−1)m
am
sin(amv) exp(−a2mθ), (C.8)
ΩB(θ) = 2∞∑
n=1
(−1)n
bn
cos(bnw) exp(−κb2nθ), (C.9)
and am = mπ, bn = (2n− 1)π/2. The load required to sustain the deflection follows fromintegration of the total stress:
W (t) = −2a2b
z
1∫−1
1∫−1
Ep
(b
3Kp
P + εz
)vdvdw, (C.10)
where the strain is given by
εz = −24azv
L3∆. (C.11)
Working out the integrals in Equation C.10 yields
W (θ) = c1∆(θ) + c2
∞∑m=1
∞∑n=1
1
a2mb2
n
exp[−θ(a2m + κb2
n)]
θ∫0
exp[θ′(a2m + κb2
n)]d∆
dθ′dθ′, (C.12)
where
c1 =192a3bEp
3L3, (C.13)
c2 =256a3bE2
p b2
3µL3Kp
. (C.14)
An analytical solution is obtained when the deflection follows an exponential decay,for example
∆ = ∆0H(θ)
[(1− h) + h exp
(−θτR
τS
)], (C.15)
where H is the Heaviside step function, h reflects the amount of slip (0 ≤ h ≤ 1, and h= 0 implies no slip) and τS is a decay rate. Substituting Eq. C.15 in Eq. C.12 yields
W (θ) = c1∆(θ) + c2
∞∑m=1
∞∑n=1
∆0
a2mb2
n
exp(−θΓnm) +
hτR
τR − τSΓnm
×(
exp
[−θ
(τR
τS
− Γnm
)]− exp[−θΓnm]
), (C.16)
where Γnm = a2m + κb2
n.
It can be shown that Eq. C.16 reduces to the usual hydrodynamic relaxation expressionwhen h = 0. In case of slip, i.e. h > 0, the decreasing deflection results in an inflection inthe load curve similar to that of the hydrodynamic contribution. Some model calculationswere performed for an elastic porous plate filled with glycerol and having a permeability of
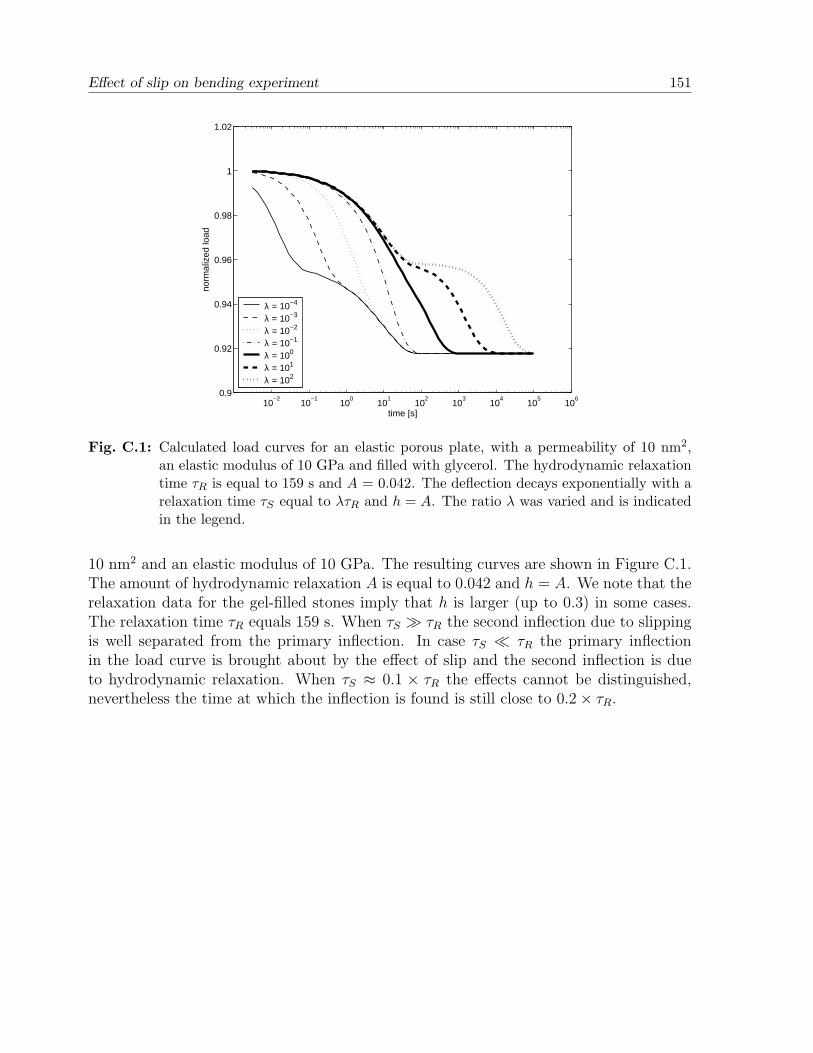
Effect of slip on bending experiment 151
10−2
10−1
100
101
102
103
104
105
106
0.9
0.92
0.94
0.96
0.98
1
1.02
norm
aliz
ed lo
ad
time [s]
λ = 10−4
λ = 10−3
λ = 10−2
λ = 10−1
λ = 100
λ = 101
λ = 102
Fig. C.1: Calculated load curves for an elastic porous plate, with a permeability of 10 nm2,an elastic modulus of 10 GPa and filled with glycerol. The hydrodynamic relaxationtime τR is equal to 159 s and A = 0.042. The deflection decays exponentially with arelaxation time τS equal to λτR and h = A. The ratio λ was varied and is indicatedin the legend.
10 nm2 and an elastic modulus of 10 GPa. The resulting curves are shown in Figure C.1.The amount of hydrodynamic relaxation A is equal to 0.042 and h = A. We note that therelaxation data for the gel-filled stones imply that h is larger (up to 0.3) in some cases.The relaxation time τR equals 159 s. When τS τR the second inflection due to slippingis well separated from the primary inflection. In case τS τR the primary inflectionin the load curve is brought about by the effect of slip and the second inflection is dueto hydrodynamic relaxation. When τS ≈ 0.1 × τR the effects cannot be distinguished,nevertheless the time at which the inflection is found is still close to 0.2× τR.

152 Appendix C
Appendix D
Phase density approximation
The phase densities ρo and ρw are functions of pressure and composition. The derivativeof the density of phase α with respect to time is given by
∂ρα
∂t=∑X
∂ρα
∂wXα
∂wXα
∂t+
∂ρα
∂Pα
∂Pα
∂t. (D.1)
An average compressibility, cα, of phase α is defined such that
cα =1
ρα
∂ρα
∂Pα
. (D.2)
Assuming ideal mixing, at constant pressure the density of phase α is given by
1
ρα
=∑X
wXα
%X, (D.3)
where %X is the density of component X in a pure liquid. The partial derivatives of ρα
with respect to the mass fractions wXα become complicated, especially when the number
of components is greater than two. However, in terms of volume fractions, φXα , the phase
density reads
ρα =∑X
φXα %X . (D.4)
For a two-component mixture the volume fraction φ is related to the mass fraction w by
φ =w%2
w%2 + (1− w)%1
. (D.5)
When %1 ≈ %2 the volume fraction φ is approximately equal to w. Similarly, in a multi-component mixture the volume fractions are approximately equal to the mass fractionswhen the densities of the pure components are approximately equal to each other. Thetime derivative of the phase density can be simplified by assuming that
ρα ≈∑X
wXα %X , (D.6)
so that Eq. D.1 becomes
∂ρα
∂t=∑X
%X ∂wXα
∂t+ cαρα
∂Pα
∂t. (D.7)
153

154 Appendix D
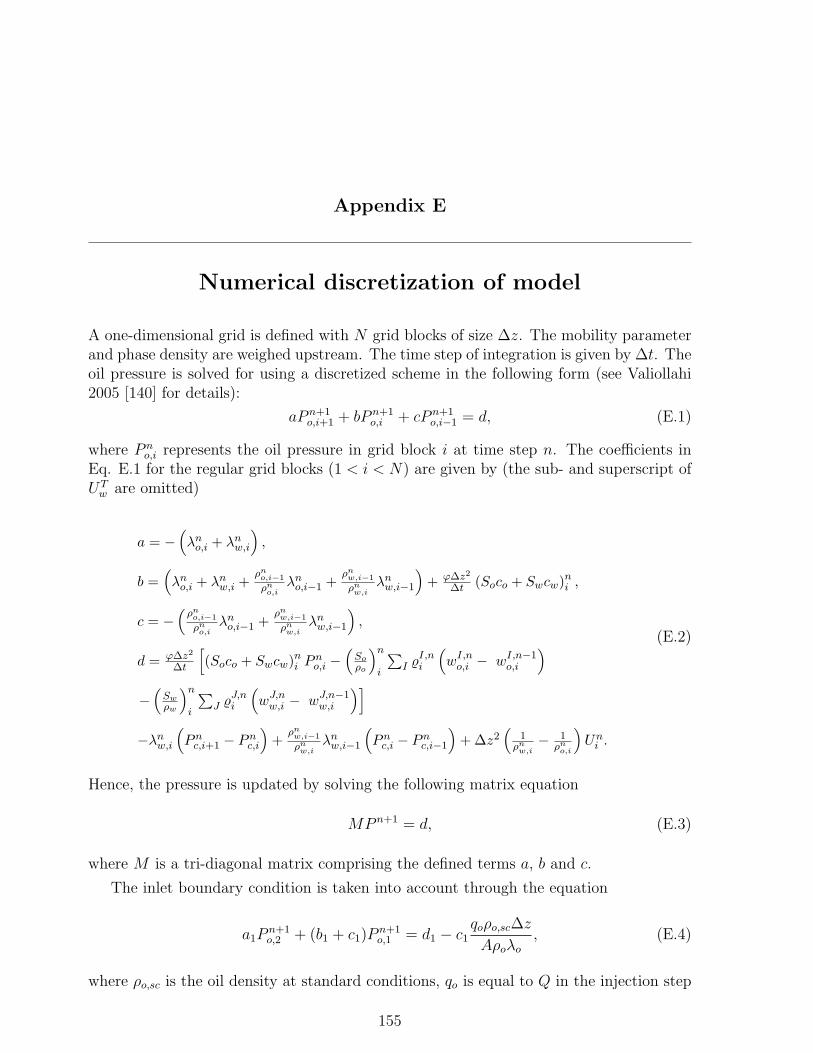
Appendix E
Numerical discretization of model
A one-dimensional grid is defined with N grid blocks of size ∆z. The mobility parameterand phase density are weighed upstream. The time step of integration is given by ∆t. Theoil pressure is solved for using a discretized scheme in the following form (see Valiollahi2005 [140] for details):
aP n+1o,i+1 + bP n+1
o,i + cP n+1o,i−1 = d, (E.1)
where P no,i represents the oil pressure in grid block i at time step n. The coefficients in
Eq. E.1 for the regular grid blocks (1 < i < N) are given by (the sub- and superscript ofUT
w are omitted)
a = −(λn
o,i + λnw,i
),
b =(λn
o,i + λnw,i +
ρno,i−1
ρno,i
λno,i−1 +
ρnw,i−1
ρnw,i
λnw,i−1
)+ ϕ∆z2
∆t (Soco + Swcw)ni ,
c = −(
ρno,i−1
ρno,i
λno,i−1 +
ρnw,i−1
ρnw,i
λnw,i−1
),
d = ϕ∆z2
∆t
[(Soco + Swcw)n
i Pno,i −
(Soρo
)n
i
∑I %I,n
i
(wI,n
o,i − wI,n−1o,i
)−(
Swρw
)n
i
∑J %J,n
i
(wJ,n
w,i − wJ,n−1w,i
)]−λn
w,i
(Pn
c,i+1 − Pnc,i
)+
ρnw,i−1
ρnw,i
λnw,i−1
(Pn
c,i − Pnc,i−1
)+ ∆z2
(1
ρnw,i− 1
ρno,i
)Un
i .
(E.2)
Hence, the pressure is updated by solving the following matrix equation
MP n+1 = d, (E.3)
where M is a tri-diagonal matrix comprising the defined terms a, b and c.
The inlet boundary condition is taken into account through the equation
a1Pn+1o,2 + (b1 + c1)P
n+1o,1 = d1 − c1
qoρo,sc∆z
Aρoλo
, (E.4)
where ρo,sc is the oil density at standard conditions, qo is equal to Q in the injection step
155
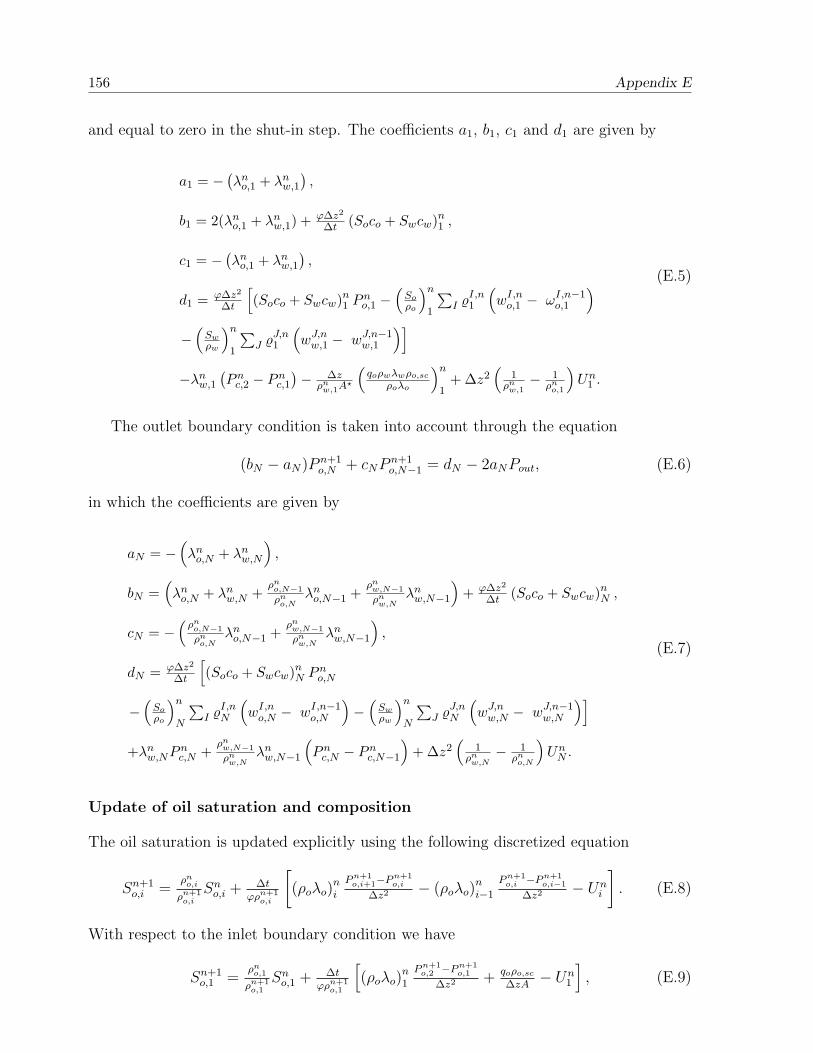
156 Appendix E
and equal to zero in the shut-in step. The coefficients a1, b1, c1 and d1 are given by
a1 = −(λn
o,1 + λnw,1
),
b1 = 2(λno,1 + λn
w,1) + ϕ∆z2
∆t (Soco + Swcw)n1 ,
c1 = −(λn
o,1 + λnw,1
),
d1 = ϕ∆z2
∆t
[(Soco + Swcw)n
1 Pno,1 −
(Soρo
)n
1
∑I %I,n
1
(wI,n
o,1 − ωI,n−1o,1
)−(
Swρw
)n
1
∑J %J,n
1
(wJ,n
w,1 − wJ,n−1w,1
)]−λn
w,1
(Pn
c,2 − Pnc,1
)− ∆z
ρnw,1A?
(qoρwλwρo,sc
ρoλo
)n
1+ ∆z2
(1
ρnw,1− 1
ρno,1
)Un
1 .
(E.5)
The outlet boundary condition is taken into account through the equation
(bN − aN)P n+1o,N + cNP n+1
o,N−1 = dN − 2aNPout, (E.6)
in which the coefficients are given by
aN = −(λn
o,N + λnw,N
),
bN =(λn
o,N + λnw,N +
ρno,N−1
ρno,N
λno,N−1 +
ρnw,N−1
ρnw,N
λnw,N−1
)+ ϕ∆z2
∆t (Soco + Swcw)nN ,
cN = −(
ρno,N−1
ρno,N
λno,N−1 +
ρnw,N−1
ρnw,N
λnw,N−1
),
dN = ϕ∆z2
∆t
[(Soco + Swcw)n
N Pno,N
−(
Soρo
)n
N
∑I %I,n
N
(wI,n
o,N − wI,n−1o,N
)−(
Swρw
)n
N
∑J %J,n
N
(wJ,n
w,N − wJ,n−1w,N
)]+λn
w,NPnc,N +
ρnw,N−1
ρnw,N
λnw,N−1
(Pn
c,N − Pnc,N−1
)+ ∆z2
(1
ρnw,N
− 1ρn
o,N
)Un
N .
(E.7)
Update of oil saturation and composition
The oil saturation is updated explicitly using the following discretized equation
Sn+1o,i =
ρno,i
ρn+1o,i
Sno,i + ∆t
ϕρn+1o,i
[(ρoλo)
ni
P n+1o,i+1−P n+1
o,i
∆z2 − (ρoλo)ni−1
P n+1o,i −P n+1
o,i−1
∆z2 − Uni
]. (E.8)
With respect to the inlet boundary condition we have
Sn+1o,1 =
ρno,1
ρn+1o,1
Sno,1 + ∆t
ϕρn+1o,1
[(ρoλo)
n1
P n+1o,2 −P n+1
o,1
∆z2 + qoρo,sc
∆zA− Un
1
], (E.9)
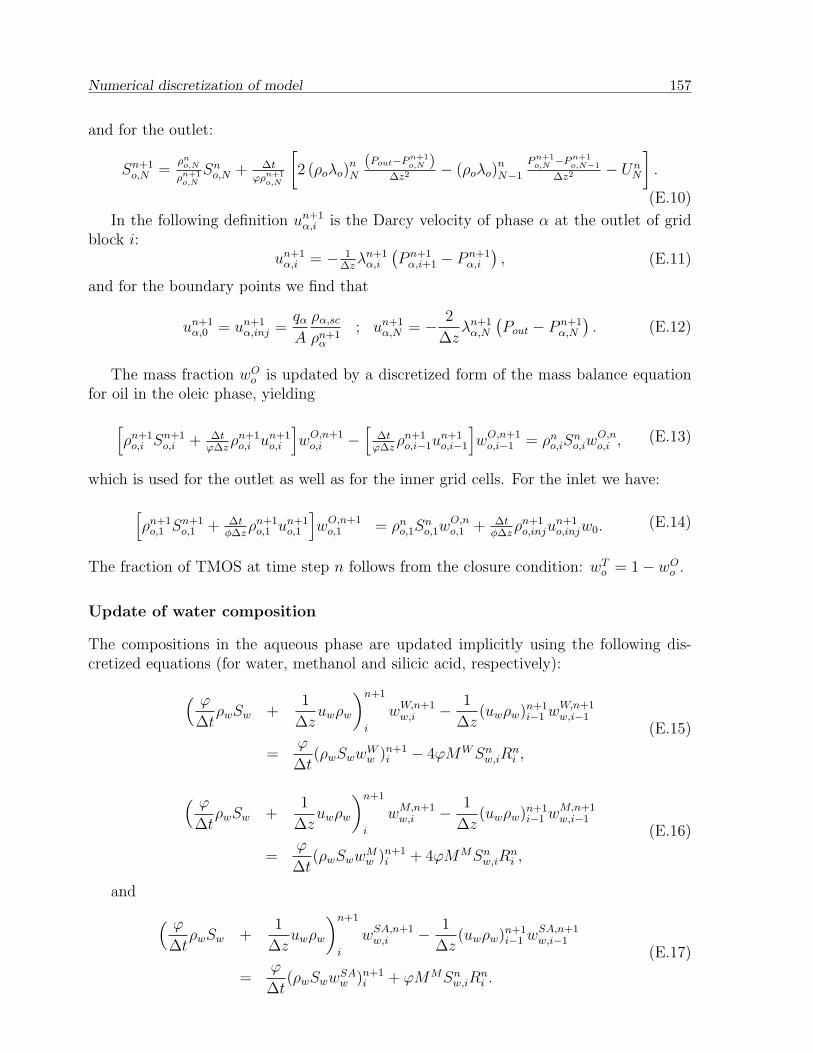
Numerical discretization of model 157
and for the outlet:
Sn+1o,N =
ρno,N
ρn+1o,N
Sno,N + ∆t
ϕρn+1o,N
[2 (ρoλo)
nN
(Pout−P n+1o,N )
∆z2 − (ρoλo)nN−1
P n+1o,N −P n+1
o,N−1
∆z2 − UnN
].
(E.10)
In the following definition un+1α,i is the Darcy velocity of phase α at the outlet of grid
block i:un+1
α,i = − 1∆z
λn+1α,i
(P n+1
α,i+1 − P n+1α,i
), (E.11)
and for the boundary points we find that
un+1α,0 = un+1
α,inj =qα
A
ρα,sc
ρn+1α
; un+1α,N = − 2
∆zλn+1
α,N
(Pout − P n+1
α,N
). (E.12)
The mass fraction wOo is updated by a discretized form of the mass balance equation
for oil in the oleic phase, yielding[ρn+1
o,i Sn+1o,i + ∆t
ϕ∆zρn+1
o,i un+1o,i
]wO,n+1
o,i −[
∆tϕ∆z
ρn+1o,i−1u
n+1o,i−1
]wO,n+1
o,i−1 = ρno,iS
no,iw
O,no,i , (E.13)
which is used for the outlet as well as for the inner grid cells. For the inlet we have:[ρn+1
o,1 Sn+1o,1 + ∆t
φ∆zρn+1
o,1 un+1o,1
]wO,n+1
o,1 = ρno,1S
no,1w
O,no,1 + ∆t
φ∆zρn+1
o,injun+1o,injw0. (E.14)
The fraction of TMOS at time step n follows from the closure condition: wTo = 1− wO
o .
Update of water composition
The compositions in the aqueous phase are updated implicitly using the following dis-cretized equations (for water, methanol and silicic acid, respectively):
( ϕ
∆tρwSw +
1
∆zuwρw
)n+1
i
wW,n+1w,i − 1
∆z(uwρw)n+1
i−1 wW,n+1w,i−1
=ϕ
∆t(ρwSwwW
w )n+1i − 4ϕMW Sn
w,iRni ,
(E.15)
( ϕ
∆tρwSw +
1
∆zuwρw
)n+1
i
wM,n+1w,i − 1
∆z(uwρw)n+1
i−1 wM,n+1w,i−1
=ϕ
∆t(ρwSwwM
w )n+1i + 4ϕMMSn
w,iRni ,
(E.16)
and ( ϕ
∆tρwSw +
1
∆zuwρw
)n+1
i
wSA,n+1w,i − 1
∆z(uwρw)n+1
i−1 wSA,n+1w,i−1
=ϕ
∆t(ρwSwwSA
w )n+1i + ϕMMSn
w,iRni .
(E.17)
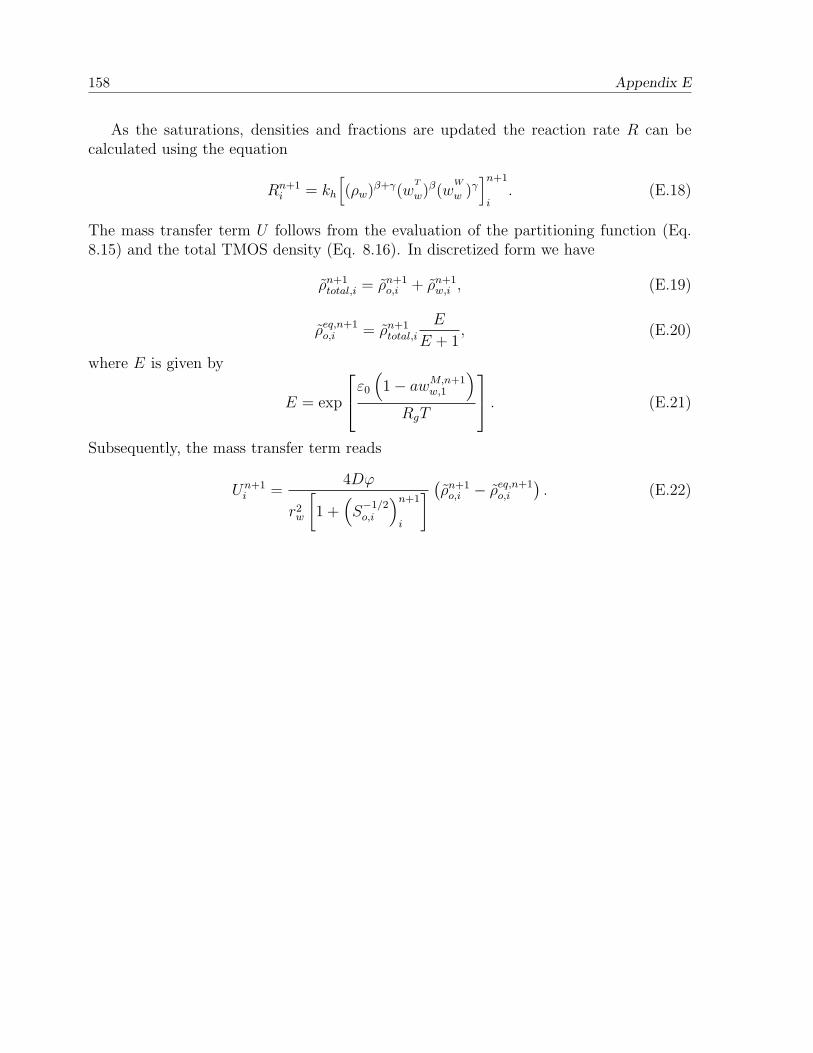
158 Appendix E
As the saturations, densities and fractions are updated the reaction rate R can becalculated using the equation
Rn+1i = kh
[(ρw)β+γ(w
T
w)β(wW
w )γ]n+1
i. (E.18)
The mass transfer term U follows from the evaluation of the partitioning function (Eq.8.15) and the total TMOS density (Eq. 8.16). In discretized form we have
ρn+1total,i = ρn+1
o,i + ρn+1w,i , (E.19)
ρeq,n+1o,i = ρn+1
total,i
E
E + 1, (E.20)
where E is given by
E = exp
ε0
(1− awM,n+1
w,1
)RgT
. (E.21)
Subsequently, the mass transfer term reads
Un+1i =
4Dϕ
r2w
[1 +
(S−1/2o,i
)n+1
i
] (ρn+1o,i − ρeq,n+1
o,i
). (E.22)
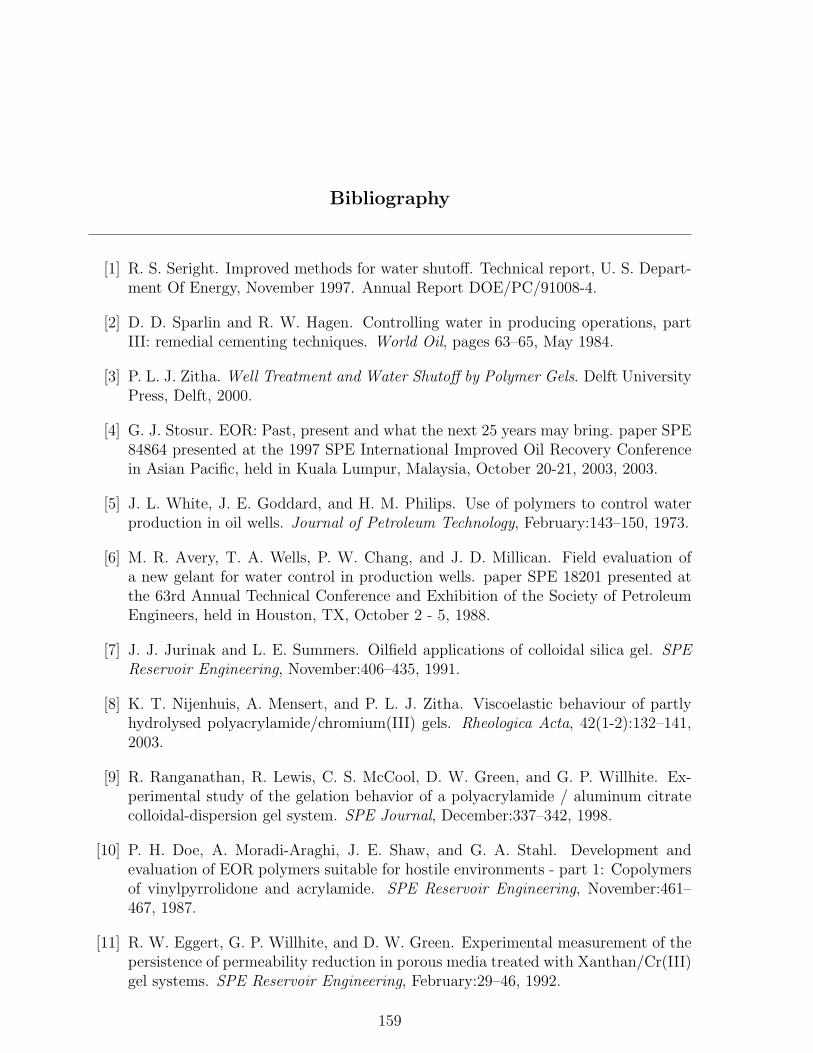
Bibliography
[1] R. S. Seright. Improved methods for water shutoff. Technical report, U. S. Depart-ment Of Energy, November 1997. Annual Report DOE/PC/91008-4.
[2] D. D. Sparlin and R. W. Hagen. Controlling water in producing operations, partIII: remedial cementing techniques. World Oil, pages 63–65, May 1984.
[3] P. L. J. Zitha. Well Treatment and Water Shutoff by Polymer Gels. Delft UniversityPress, Delft, 2000.
[4] G. J. Stosur. EOR: Past, present and what the next 25 years may bring. paper SPE84864 presented at the 1997 SPE International Improved Oil Recovery Conferencein Asian Pacific, held in Kuala Lumpur, Malaysia, October 20-21, 2003, 2003.
[5] J. L. White, J. E. Goddard, and H. M. Philips. Use of polymers to control waterproduction in oil wells. Journal of Petroleum Technology, February:143–150, 1973.
[6] M. R. Avery, T. A. Wells, P. W. Chang, and J. D. Millican. Field evaluation ofa new gelant for water control in production wells. paper SPE 18201 presented atthe 63rd Annual Technical Conference and Exhibition of the Society of PetroleumEngineers, held in Houston, TX, October 2 - 5, 1988.
[7] J. J. Jurinak and L. E. Summers. Oilfield applications of colloidal silica gel. SPEReservoir Engineering, November:406–435, 1991.
[8] K. T. Nijenhuis, A. Mensert, and P. L. J. Zitha. Viscoelastic behaviour of partlyhydrolysed polyacrylamide/chromium(III) gels. Rheologica Acta, 42(1-2):132–141,2003.
[9] R. Ranganathan, R. Lewis, C. S. McCool, D. W. Green, and G. P. Willhite. Ex-perimental study of the gelation behavior of a polyacrylamide / aluminum citratecolloidal-dispersion gel system. SPE Journal, December:337–342, 1998.
[10] P. H. Doe, A. Moradi-Araghi, J. E. Shaw, and G. A. Stahl. Development andevaluation of EOR polymers suitable for hostile environments - part 1: Copolymersof vinylpyrrolidone and acrylamide. SPE Reservoir Engineering, November:461–467, 1987.
[11] R. W. Eggert, G. P. Willhite, and D. W. Green. Experimental measurement of thepersistence of permeability reduction in porous media treated with Xanthan/Cr(III)gel systems. SPE Reservoir Engineering, February:29–46, 1992.
159
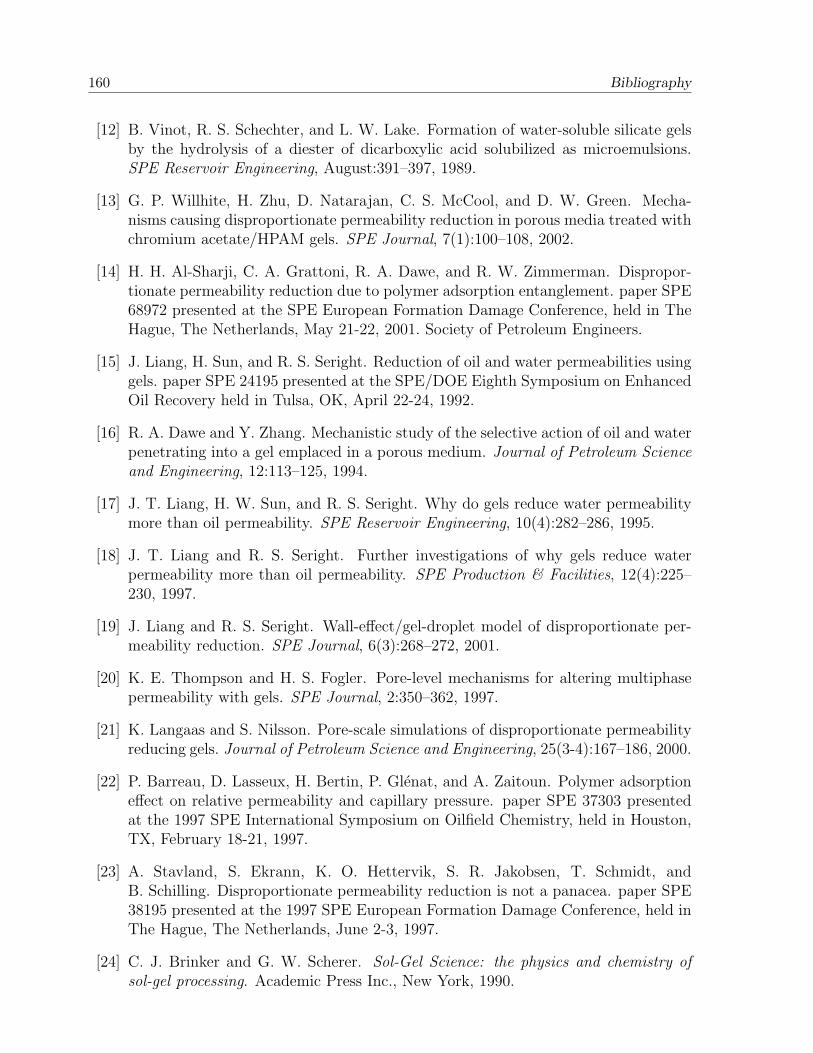
160 Bibliography
[12] B. Vinot, R. S. Schechter, and L. W. Lake. Formation of water-soluble silicate gelsby the hydrolysis of a diester of dicarboxylic acid solubilized as microemulsions.SPE Reservoir Engineering, August:391–397, 1989.
[13] G. P. Willhite, H. Zhu, D. Natarajan, C. S. McCool, and D. W. Green. Mecha-nisms causing disproportionate permeability reduction in porous media treated withchromium acetate/HPAM gels. SPE Journal, 7(1):100–108, 2002.
[14] H. H. Al-Sharji, C. A. Grattoni, R. A. Dawe, and R. W. Zimmerman. Dispropor-tionate permeability reduction due to polymer adsorption entanglement. paper SPE68972 presented at the SPE European Formation Damage Conference, held in TheHague, The Netherlands, May 21-22, 2001. Society of Petroleum Engineers.
[15] J. Liang, H. Sun, and R. S. Seright. Reduction of oil and water permeabilities usinggels. paper SPE 24195 presented at the SPE/DOE Eighth Symposium on EnhancedOil Recovery held in Tulsa, OK, April 22-24, 1992.
[16] R. A. Dawe and Y. Zhang. Mechanistic study of the selective action of oil and waterpenetrating into a gel emplaced in a porous medium. Journal of Petroleum Scienceand Engineering, 12:113–125, 1994.
[17] J. T. Liang, H. W. Sun, and R. S. Seright. Why do gels reduce water permeabilitymore than oil permeability. SPE Reservoir Engineering, 10(4):282–286, 1995.
[18] J. T. Liang and R. S. Seright. Further investigations of why gels reduce waterpermeability more than oil permeability. SPE Production & Facilities, 12(4):225–230, 1997.
[19] J. Liang and R. S. Seright. Wall-effect/gel-droplet model of disproportionate per-meability reduction. SPE Journal, 6(3):268–272, 2001.
[20] K. E. Thompson and H. S. Fogler. Pore-level mechanisms for altering multiphasepermeability with gels. SPE Journal, 2:350–362, 1997.
[21] K. Langaas and S. Nilsson. Pore-scale simulations of disproportionate permeabilityreducing gels. Journal of Petroleum Science and Engineering, 25(3-4):167–186, 2000.
[22] P. Barreau, D. Lasseux, H. Bertin, P. Glenat, and A. Zaitoun. Polymer adsorptioneffect on relative permeability and capillary pressure. paper SPE 37303 presentedat the 1997 SPE International Symposium on Oilfield Chemistry, held in Houston,TX, February 18-21, 1997.
[23] A. Stavland, S. Ekrann, K. O. Hettervik, S. R. Jakobsen, T. Schmidt, andB. Schilling. Disproportionate permeability reduction is not a panacea. paper SPE38195 presented at the 1997 SPE European Formation Damage Conference, held inThe Hague, The Netherlands, June 2-3, 1997.
[24] C. J. Brinker and G. W. Scherer. Sol-Gel Science: the physics and chemistry ofsol-gel processing. Academic Press Inc., New York, 1990.
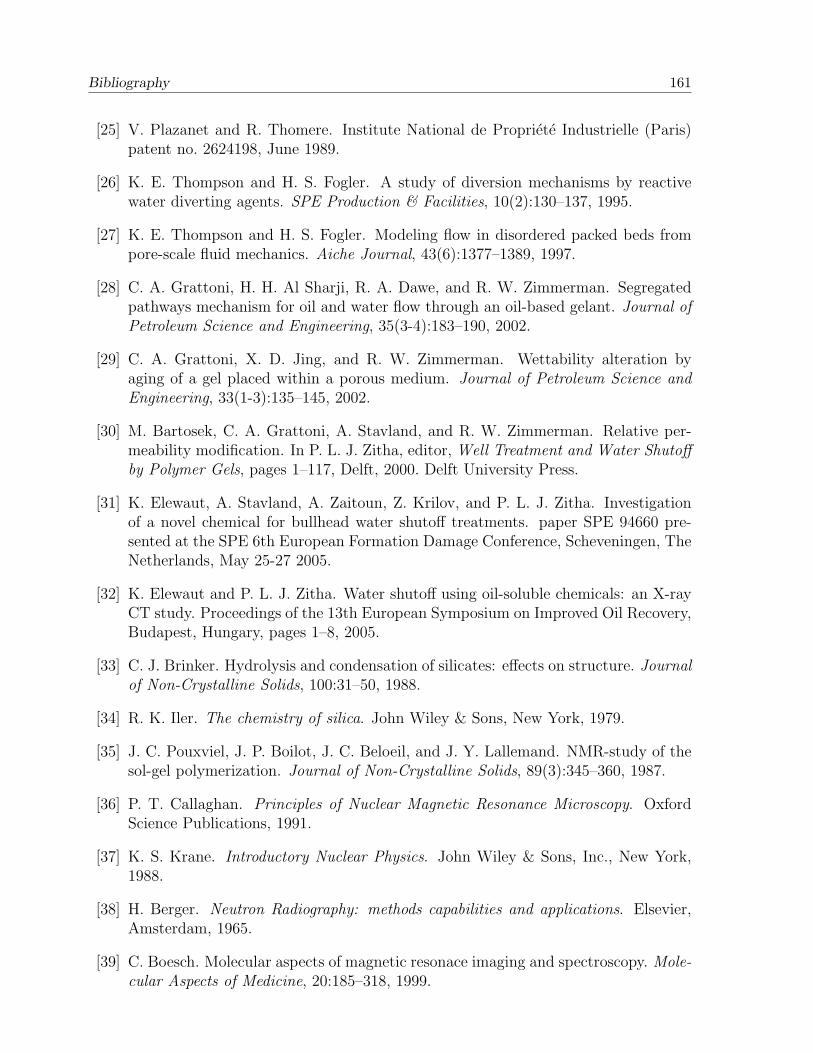
Bibliography 161
[25] V. Plazanet and R. Thomere. Institute National de Propriete Industrielle (Paris)patent no. 2624198, June 1989.
[26] K. E. Thompson and H. S. Fogler. A study of diversion mechanisms by reactivewater diverting agents. SPE Production & Facilities, 10(2):130–137, 1995.
[27] K. E. Thompson and H. S. Fogler. Modeling flow in disordered packed beds frompore-scale fluid mechanics. Aiche Journal, 43(6):1377–1389, 1997.
[28] C. A. Grattoni, H. H. Al Sharji, R. A. Dawe, and R. W. Zimmerman. Segregatedpathways mechanism for oil and water flow through an oil-based gelant. Journal ofPetroleum Science and Engineering, 35(3-4):183–190, 2002.
[29] C. A. Grattoni, X. D. Jing, and R. W. Zimmerman. Wettability alteration byaging of a gel placed within a porous medium. Journal of Petroleum Science andEngineering, 33(1-3):135–145, 2002.
[30] M. Bartosek, C. A. Grattoni, A. Stavland, and R. W. Zimmerman. Relative per-meability modification. In P. L. J. Zitha, editor, Well Treatment and Water Shutoffby Polymer Gels, pages 1–117, Delft, 2000. Delft University Press.
[31] K. Elewaut, A. Stavland, A. Zaitoun, Z. Krilov, and P. L. J. Zitha. Investigationof a novel chemical for bullhead water shutoff treatments. paper SPE 94660 pre-sented at the SPE 6th European Formation Damage Conference, Scheveningen, TheNetherlands, May 25-27 2005.
[32] K. Elewaut and P. L. J. Zitha. Water shutoff using oil-soluble chemicals: an X-rayCT study. Proceedings of the 13th European Symposium on Improved Oil Recovery,Budapest, Hungary, pages 1–8, 2005.
[33] C. J. Brinker. Hydrolysis and condensation of silicates: effects on structure. Journalof Non-Crystalline Solids, 100:31–50, 1988.
[34] R. K. Iler. The chemistry of silica. John Wiley & Sons, New York, 1979.
[35] J. C. Pouxviel, J. P. Boilot, J. C. Beloeil, and J. Y. Lallemand. NMR-study of thesol-gel polymerization. Journal of Non-Crystalline Solids, 89(3):345–360, 1987.
[36] P. T. Callaghan. Principles of Nuclear Magnetic Resonance Microscopy. OxfordScience Publications, 1991.
[37] K. S. Krane. Introductory Nuclear Physics. John Wiley & Sons, Inc., New York,1988.
[38] H. Berger. Neutron Radiography: methods capabilities and applications. Elsevier,Amsterdam, 1965.
[39] C. Boesch. Molecular aspects of magnetic resonace imaging and spectroscopy. Mole-cular Aspects of Medicine, 20:185–318, 1999.
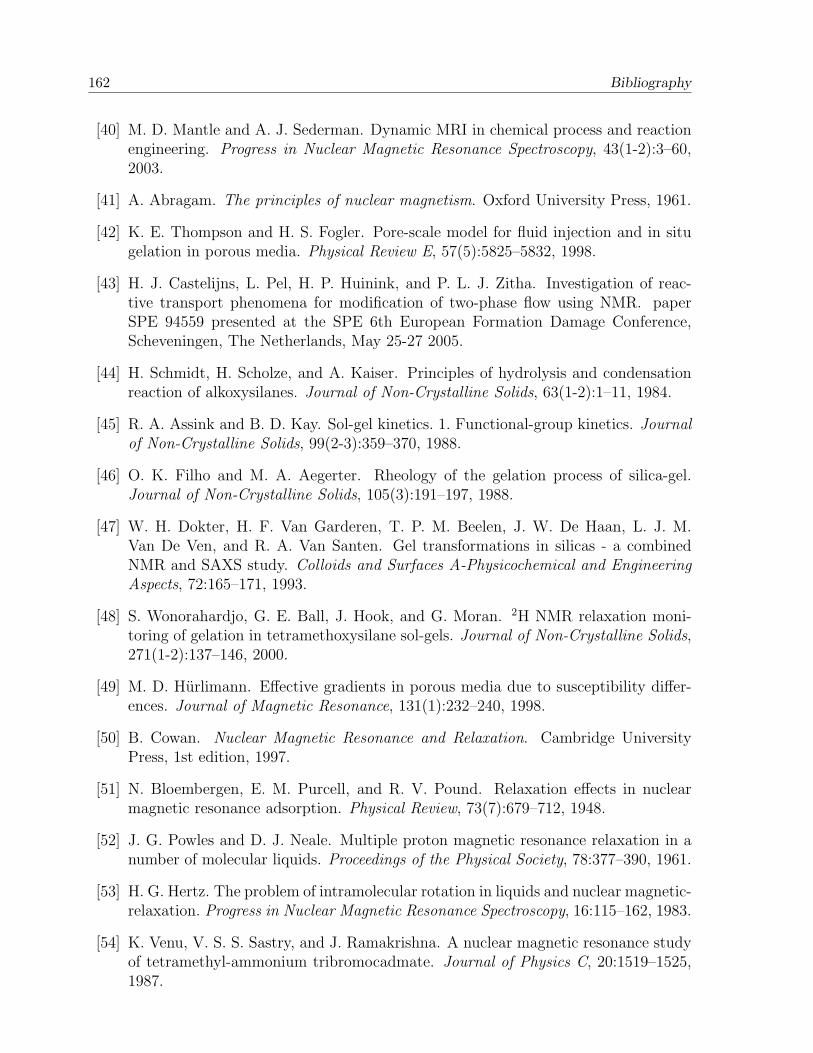
162 Bibliography
[40] M. D. Mantle and A. J. Sederman. Dynamic MRI in chemical process and reactionengineering. Progress in Nuclear Magnetic Resonance Spectroscopy, 43(1-2):3–60,2003.
[41] A. Abragam. The principles of nuclear magnetism. Oxford University Press, 1961.
[42] K. E. Thompson and H. S. Fogler. Pore-scale model for fluid injection and in situgelation in porous media. Physical Review E, 57(5):5825–5832, 1998.
[43] H. J. Castelijns, L. Pel, H. P. Huinink, and P. L. J. Zitha. Investigation of reac-tive transport phenomena for modification of two-phase flow using NMR. paperSPE 94559 presented at the SPE 6th European Formation Damage Conference,Scheveningen, The Netherlands, May 25-27 2005.
[44] H. Schmidt, H. Scholze, and A. Kaiser. Principles of hydrolysis and condensationreaction of alkoxysilanes. Journal of Non-Crystalline Solids, 63(1-2):1–11, 1984.
[45] R. A. Assink and B. D. Kay. Sol-gel kinetics. 1. Functional-group kinetics. Journalof Non-Crystalline Solids, 99(2-3):359–370, 1988.
[46] O. K. Filho and M. A. Aegerter. Rheology of the gelation process of silica-gel.Journal of Non-Crystalline Solids, 105(3):191–197, 1988.
[47] W. H. Dokter, H. F. Van Garderen, T. P. M. Beelen, J. W. De Haan, L. J. M.Van De Ven, and R. A. Van Santen. Gel transformations in silicas - a combinedNMR and SAXS study. Colloids and Surfaces A-Physicochemical and EngineeringAspects, 72:165–171, 1993.
[48] S. Wonorahardjo, G. E. Ball, J. Hook, and G. Moran. 2H NMR relaxation moni-toring of gelation in tetramethoxysilane sol-gels. Journal of Non-Crystalline Solids,271(1-2):137–146, 2000.
[49] M. D. Hurlimann. Effective gradients in porous media due to susceptibility differ-ences. Journal of Magnetic Resonance, 131(1):232–240, 1998.
[50] B. Cowan. Nuclear Magnetic Resonance and Relaxation. Cambridge UniversityPress, 1st edition, 1997.
[51] N. Bloembergen, E. M. Purcell, and R. V. Pound. Relaxation effects in nuclearmagnetic resonance adsorption. Physical Review, 73(7):679–712, 1948.
[52] J. G. Powles and D. J. Neale. Multiple proton magnetic resonance relaxation in anumber of molecular liquids. Proceedings of the Physical Society, 78:377–390, 1961.
[53] H. G. Hertz. The problem of intramolecular rotation in liquids and nuclear magnetic-relaxation. Progress in Nuclear Magnetic Resonance Spectroscopy, 16:115–162, 1983.
[54] K. Venu, V. S. S. Sastry, and J. Ramakrishna. A nuclear magnetic resonance studyof tetramethyl-ammonium tribromocadmate. Journal of Physics C, 20:1519–1525,1987.
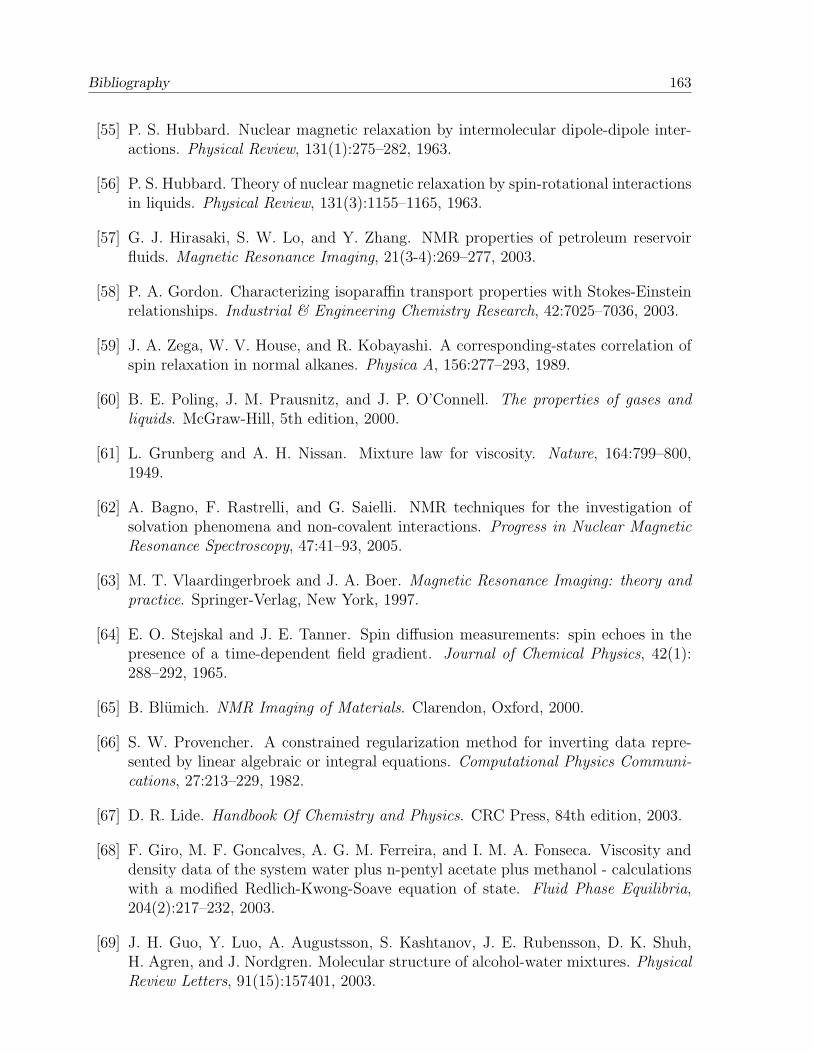
Bibliography 163
[55] P. S. Hubbard. Nuclear magnetic relaxation by intermolecular dipole-dipole inter-actions. Physical Review, 131(1):275–282, 1963.
[56] P. S. Hubbard. Theory of nuclear magnetic relaxation by spin-rotational interactionsin liquids. Physical Review, 131(3):1155–1165, 1963.
[57] G. J. Hirasaki, S. W. Lo, and Y. Zhang. NMR properties of petroleum reservoirfluids. Magnetic Resonance Imaging, 21(3-4):269–277, 2003.
[58] P. A. Gordon. Characterizing isoparaffin transport properties with Stokes-Einsteinrelationships. Industrial & Engineering Chemistry Research, 42:7025–7036, 2003.
[59] J. A. Zega, W. V. House, and R. Kobayashi. A corresponding-states correlation ofspin relaxation in normal alkanes. Physica A, 156:277–293, 1989.
[60] B. E. Poling, J. M. Prausnitz, and J. P. O’Connell. The properties of gases andliquids. McGraw-Hill, 5th edition, 2000.
[61] L. Grunberg and A. H. Nissan. Mixture law for viscosity. Nature, 164:799–800,1949.
[62] A. Bagno, F. Rastrelli, and G. Saielli. NMR techniques for the investigation ofsolvation phenomena and non-covalent interactions. Progress in Nuclear MagneticResonance Spectroscopy, 47:41–93, 2005.
[63] M. T. Vlaardingerbroek and J. A. Boer. Magnetic Resonance Imaging: theory andpractice. Springer-Verlag, New York, 1997.
[64] E. O. Stejskal and J. E. Tanner. Spin diffusion measurements: spin echoes in thepresence of a time-dependent field gradient. Journal of Chemical Physics, 42(1):288–292, 1965.
[65] B. Blumich. NMR Imaging of Materials. Clarendon, Oxford, 2000.
[66] S. W. Provencher. A constrained regularization method for inverting data repre-sented by linear algebraic or integral equations. Computational Physics Communi-cations, 27:213–229, 1982.
[67] D. R. Lide. Handbook Of Chemistry and Physics. CRC Press, 84th edition, 2003.
[68] F. Giro, M. F. Goncalves, A. G. M. Ferreira, and I. M. A. Fonseca. Viscosity anddensity data of the system water plus n-pentyl acetate plus methanol - calculationswith a modified Redlich-Kwong-Soave equation of state. Fluid Phase Equilibria,204(2):217–232, 2003.
[69] J. H. Guo, Y. Luo, A. Augustsson, S. Kashtanov, J. E. Rubensson, D. K. Shuh,H. Agren, and J. Nordgren. Molecular structure of alcohol-water mixtures. PhysicalReview Letters, 91(15):157401, 2003.
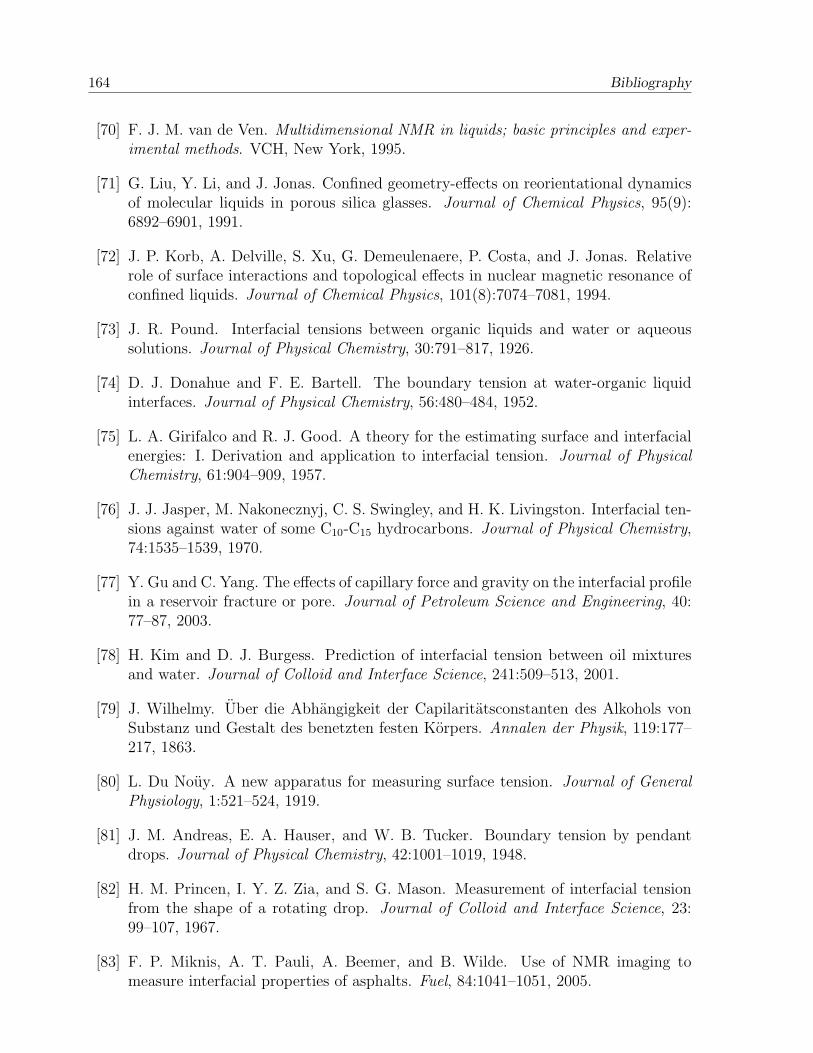
164 Bibliography
[70] F. J. M. van de Ven. Multidimensional NMR in liquids; basic principles and exper-imental methods. VCH, New York, 1995.
[71] G. Liu, Y. Li, and J. Jonas. Confined geometry-effects on reorientational dynamicsof molecular liquids in porous silica glasses. Journal of Chemical Physics, 95(9):6892–6901, 1991.
[72] J. P. Korb, A. Delville, S. Xu, G. Demeulenaere, P. Costa, and J. Jonas. Relativerole of surface interactions and topological effects in nuclear magnetic resonance ofconfined liquids. Journal of Chemical Physics, 101(8):7074–7081, 1994.
[73] J. R. Pound. Interfacial tensions between organic liquids and water or aqueoussolutions. Journal of Physical Chemistry, 30:791–817, 1926.
[74] D. J. Donahue and F. E. Bartell. The boundary tension at water-organic liquidinterfaces. Journal of Physical Chemistry, 56:480–484, 1952.
[75] L. A. Girifalco and R. J. Good. A theory for the estimating surface and interfacialenergies: I. Derivation and application to interfacial tension. Journal of PhysicalChemistry, 61:904–909, 1957.
[76] J. J. Jasper, M. Nakonecznyj, C. S. Swingley, and H. K. Livingston. Interfacial ten-sions against water of some C10-C15 hydrocarbons. Journal of Physical Chemistry,74:1535–1539, 1970.
[77] Y. Gu and C. Yang. The effects of capillary force and gravity on the interfacial profilein a reservoir fracture or pore. Journal of Petroleum Science and Engineering, 40:77–87, 2003.
[78] H. Kim and D. J. Burgess. Prediction of interfacial tension between oil mixturesand water. Journal of Colloid and Interface Science, 241:509–513, 2001.
[79] J. Wilhelmy. Uber die Abhangigkeit der Capilaritatsconstanten des Alkohols vonSubstanz und Gestalt des benetzten festen Korpers. Annalen der Physik, 119:177–217, 1863.
[80] L. Du Nouy. A new apparatus for measuring surface tension. Journal of GeneralPhysiology, 1:521–524, 1919.
[81] J. M. Andreas, E. A. Hauser, and W. B. Tucker. Boundary tension by pendantdrops. Journal of Physical Chemistry, 42:1001–1019, 1948.
[82] H. M. Princen, I. Y. Z. Zia, and S. G. Mason. Measurement of interfacial tensionfrom the shape of a rotating drop. Journal of Colloid and Interface Science, 23:99–107, 1967.
[83] F. P. Miknis, A. T. Pauli, A. Beemer, and B. Wilde. Use of NMR imaging tomeasure interfacial properties of asphalts. Fuel, 84:1041–1051, 2005.
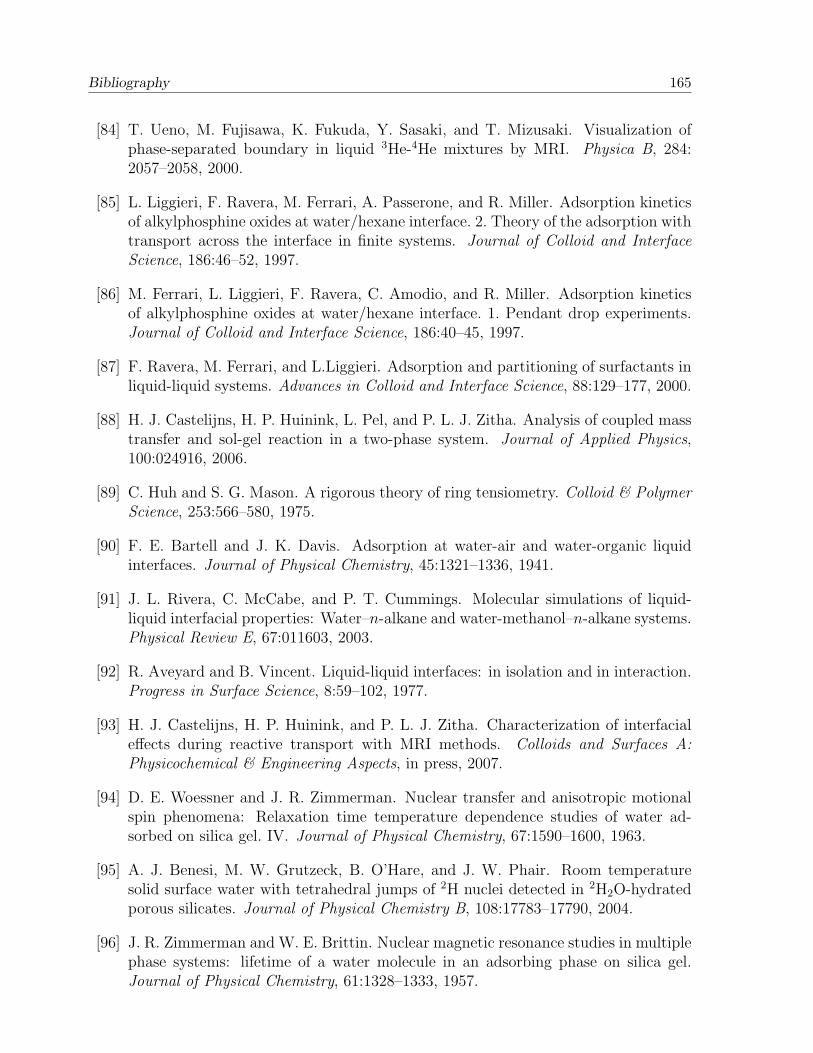
Bibliography 165
[84] T. Ueno, M. Fujisawa, K. Fukuda, Y. Sasaki, and T. Mizusaki. Visualization ofphase-separated boundary in liquid 3He-4He mixtures by MRI. Physica B, 284:2057–2058, 2000.
[85] L. Liggieri, F. Ravera, M. Ferrari, A. Passerone, and R. Miller. Adsorption kineticsof alkylphosphine oxides at water/hexane interface. 2. Theory of the adsorption withtransport across the interface in finite systems. Journal of Colloid and InterfaceScience, 186:46–52, 1997.
[86] M. Ferrari, L. Liggieri, F. Ravera, C. Amodio, and R. Miller. Adsorption kineticsof alkylphosphine oxides at water/hexane interface. 1. Pendant drop experiments.Journal of Colloid and Interface Science, 186:40–45, 1997.
[87] F. Ravera, M. Ferrari, and L.Liggieri. Adsorption and partitioning of surfactants inliquid-liquid systems. Advances in Colloid and Interface Science, 88:129–177, 2000.
[88] H. J. Castelijns, H. P. Huinink, L. Pel, and P. L. J. Zitha. Analysis of coupled masstransfer and sol-gel reaction in a two-phase system. Journal of Applied Physics,100:024916, 2006.
[89] C. Huh and S. G. Mason. A rigorous theory of ring tensiometry. Colloid & PolymerScience, 253:566–580, 1975.
[90] F. E. Bartell and J. K. Davis. Adsorption at water-air and water-organic liquidinterfaces. Journal of Physical Chemistry, 45:1321–1336, 1941.
[91] J. L. Rivera, C. McCabe, and P. T. Cummings. Molecular simulations of liquid-liquid interfacial properties: Water–n-alkane and water-methanol–n-alkane systems.Physical Review E, 67:011603, 2003.
[92] R. Aveyard and B. Vincent. Liquid-liquid interfaces: in isolation and in interaction.Progress in Surface Science, 8:59–102, 1977.
[93] H. J. Castelijns, H. P. Huinink, and P. L. J. Zitha. Characterization of interfacialeffects during reactive transport with MRI methods. Colloids and Surfaces A:Physicochemical & Engineering Aspects, in press, 2007.
[94] D. E. Woessner and J. R. Zimmerman. Nuclear transfer and anisotropic motionalspin phenomena: Relaxation time temperature dependence studies of water ad-sorbed on silica gel. IV. Journal of Physical Chemistry, 67:1590–1600, 1963.
[95] A. J. Benesi, M. W. Grutzeck, B. O’Hare, and J. W. Phair. Room temperaturesolid surface water with tetrahedral jumps of 2H nuclei detected in 2H2O-hydratedporous silicates. Journal of Physical Chemistry B, 108:17783–17790, 2004.
[96] J. R. Zimmerman and W. E. Brittin. Nuclear magnetic resonance studies in multiplephase systems: lifetime of a water molecule in an adsorbing phase on silica gel.Journal of Physical Chemistry, 61:1328–1333, 1957.
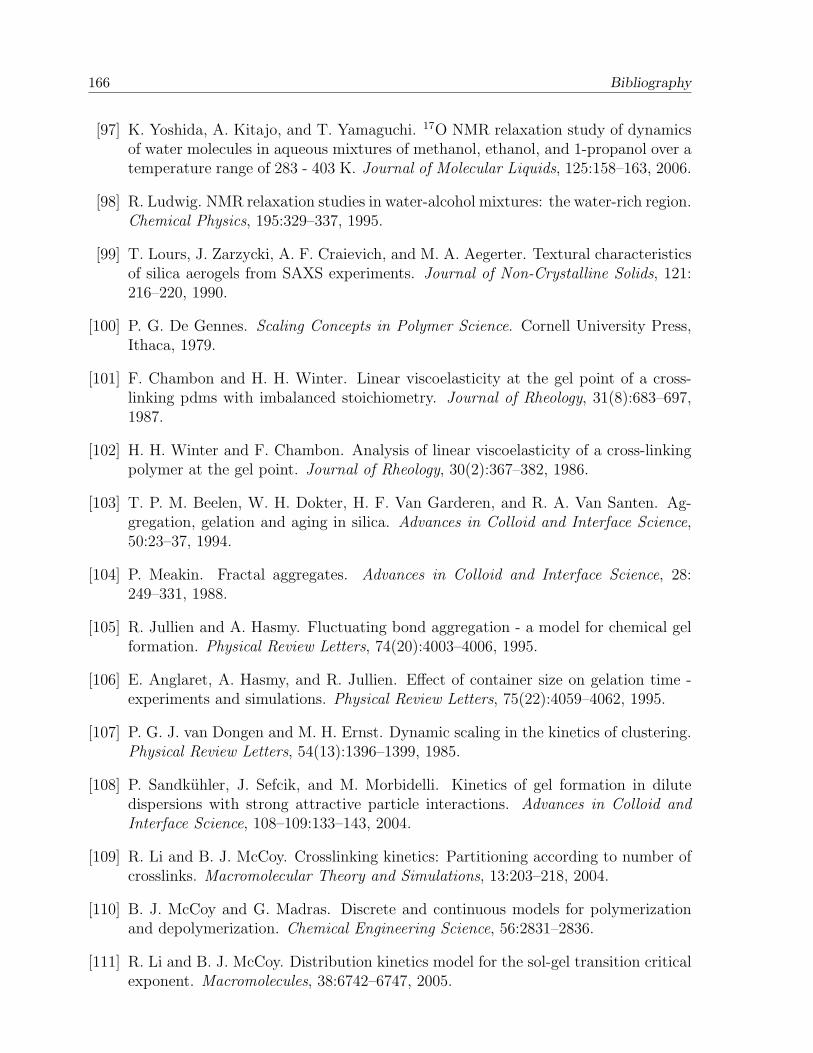
166 Bibliography
[97] K. Yoshida, A. Kitajo, and T. Yamaguchi. 17O NMR relaxation study of dynamicsof water molecules in aqueous mixtures of methanol, ethanol, and 1-propanol over atemperature range of 283 - 403 K. Journal of Molecular Liquids, 125:158–163, 2006.
[98] R. Ludwig. NMR relaxation studies in water-alcohol mixtures: the water-rich region.Chemical Physics, 195:329–337, 1995.
[99] T. Lours, J. Zarzycki, A. F. Craievich, and M. A. Aegerter. Textural characteristicsof silica aerogels from SAXS experiments. Journal of Non-Crystalline Solids, 121:216–220, 1990.
[100] P. G. De Gennes. Scaling Concepts in Polymer Science. Cornell University Press,Ithaca, 1979.
[101] F. Chambon and H. H. Winter. Linear viscoelasticity at the gel point of a cross-linking pdms with imbalanced stoichiometry. Journal of Rheology, 31(8):683–697,1987.
[102] H. H. Winter and F. Chambon. Analysis of linear viscoelasticity of a cross-linkingpolymer at the gel point. Journal of Rheology, 30(2):367–382, 1986.
[103] T. P. M. Beelen, W. H. Dokter, H. F. Van Garderen, and R. A. Van Santen. Ag-gregation, gelation and aging in silica. Advances in Colloid and Interface Science,50:23–37, 1994.
[104] P. Meakin. Fractal aggregates. Advances in Colloid and Interface Science, 28:249–331, 1988.
[105] R. Jullien and A. Hasmy. Fluctuating bond aggregation - a model for chemical gelformation. Physical Review Letters, 74(20):4003–4006, 1995.
[106] E. Anglaret, A. Hasmy, and R. Jullien. Effect of container size on gelation time -experiments and simulations. Physical Review Letters, 75(22):4059–4062, 1995.
[107] P. G. J. van Dongen and M. H. Ernst. Dynamic scaling in the kinetics of clustering.Physical Review Letters, 54(13):1396–1399, 1985.
[108] P. Sandkuhler, J. Sefcik, and M. Morbidelli. Kinetics of gel formation in dilutedispersions with strong attractive particle interactions. Advances in Colloid andInterface Science, 108–109:133–143, 2004.
[109] R. Li and B. J. McCoy. Crosslinking kinetics: Partitioning according to number ofcrosslinks. Macromolecular Theory and Simulations, 13:203–218, 2004.
[110] B. J. McCoy and G. Madras. Discrete and continuous models for polymerizationand depolymerization. Chemical Engineering Science, 56:2831–2836.
[111] R. Li and B. J. McCoy. Distribution kinetics model for the sol-gel transition criticalexponent. Macromolecules, 38:6742–6747, 2005.
Bibliography 167
[112] M. Frenklach. Method of moments with interpolative closure. Chemical EngineeringScience, 57:2229–2239, 2005.
[113] J. E. Martin, J. Wilcoxon, and D. Adolf. Critical exponents for the sol-gel transition.Physical Review A, 36(4):1803–1810.
[114] J. E. Martin and J. Wilcoxon. Spatial correlations and growth in dilute gels. PhysicalReview A, 39(1):252–258.
[115] H. F. Van Garderen, W. H. Dokter, T. P. M. Beelen, R. A. Van Santen, E. Pantos,M. A. J. Michels, and P. A. J. Hilbers. Volume fraction dependence and reorganiza-tion in cluster-cluster aggregation processes. Journal of Chemical Physics, 102(1):480–495, 1995.
[116] A. E. Merbach and E. Toth. The Chemistry of Contrast Agents in Medical MagneticResonance Imaging. John Wiley & Sons, Ltd., Chichester, 2001.
[117] P. W. J. G. Wijnen, T. P. M. Beelen, K. P. J. Rummens, H. C. P. L. Saeijs, J. W. DeHaan, L. J. M. Van De Ven, and R. A. Van Santen. The molecular basis of agingof aqueous silica gel. Journal of Colloid and Interface Science, 145:17–32, 1991.
[118] F. A. L. Dullien. Porous media: fluid transport and pore structure. Academic Press,London, 2nd edition, 1992.
[119] K. R. Brownstein and C. E. Tarr. Importance of classical diffusion in NMR studiesof water in biological cells. Physical Review A, 19(6):2446–2453, 1979.
[120] S. Godefroy, J.-P. Korb, M. Fleury, and R. G. Bryant. Surface nuclear magneticrelaxation and dynamics of water and oil in macroporous media. Physical ReviewE, 64:021605, 2001.
[121] H. Y. Carr and E. M. Purcell. Effects of diffusion on free precession in nuclearmagnetic resonance experiments. Physical Review, 94(3):630–638, 1954.
[122] C. T. P. Chang, A. T. Watson, and C. M. Edwards. NMR imaging of fluids andflow in porous media. In P. Wong, editor, Methods in the physics of porous media,volume 35, pages 387–423, San Diego, 1999. Academic Press.
[123] H. J. Castelijns, G. W. Scherer, L. Pel, and P. L. J. Zitha. Permeability reduction inporous materials by in situ formed silica gel. Journal of Applied Physics, accepted,2007.
[124] H. Hdach, J. Woignier, J. Phalippou, and G. W. Scherer. Effect of aging and pHon the modulus of aerogels. Journal of Non-Crystalline Solids, 121:202–205, 1990.
[125] G. W. Scherer and R. M. Swiatek. Measurement of permeability .2. Silica-gel.Journal of Non-Crystalline Solids, 113(2-3):119–129, 1989.
[126] G. W. Scherer. Bending of gel beams - method for characterizing elastic propertiesand permeability. Journal of Non-Crystalline Solids, 142(1-2):18–35, 1992.
168 Bibliography
[127] G. W. Scherer. Measuring permeability of rigid materials by a beam-bendingmethod: I. Theory. Journal of the American Ceramic Society, 83(9):2231–2239,2000. Erratum, J. Am. Ceram. Soc. 87 (8) (2004) 1612–1613.
[128] W. Vichit-Vadakan and G. W. Scherer. Measuring permeability of rigid materialsby a beam-bending method: II. Porous glass. Journal of the American CeramicSociety, 83(9):2240–2245, 2000. Erratum, J. Am. Ceram. Soc. 87 (8) (2004) 1614.
[129] W. Vichit-Vadakan and G. W. Scherer. Measuring permeability of rigid materialsby a beam-bending method: III. Cement paste. Journal of the American CeramicSociety, 85(6):1537–1544, 2002. Erratum, J. Am. Ceram. Soc. 87 (8) (2004) 1615.
[130] W. Vichit-Vadakan and G. W. Scherer. Measuring permeability and stress relaxationof young cement paste by beam bending. Cement and Concrete Research, 33(12):1925–1932, 2003.
[131] G. W. Scherer. Measuring permeability of rigid materials by a beam-bendingmethod: IV. Transversely isotropic plate. Journal of the American Ceramic So-ciety, 87(8):1517–1524, 2004.
[132] J. Valenza and G. W. Scherer. Measuring permeability of rigid materials by a beam-bending method: V. Isotropic rectangular plates of cement paste. Journal of theAmerican Ceramic Society, 87(10):1927–1931, 2004.
[133] G. W. Scherer. Relaxation of a viscoelastic gel bar: I. Theory. Journal of Sol-GelScience and Technology, 1:169–175, 1994.
[134] G. W. Scherer. Viscoelasticity and permeability of silica gels. Faraday Discussions,(101):225–234, 1995.
[135] G. W. Scherer, S. A. Pardenek, and R. M. Swiatek. Viscoelasticity in silica-gel.Journal of Non-Crystalline Solids, 107(1):14–22, 1988.
[136] J. E. Martin and J. Odinek. On the turbidity of silica gels: aggregation in thepresence of coulumb interactions. Journal of Colloid and Interface Science, 154(2):461–480.
[137] I. Jimenez Gonzalez and G. W. Scherer. Effect of swelling inhibitors on the swellingand stress relaxation of clay bearing stones. Environmental Geology, 46:364–377,2004.
[138] M. L. Sheely. Glycerol viscosity tables. Industrial & Engineering Chemistry Re-search, 24:1060–1064, 1932.
[139] A. N. Tutuncu, A L. Podio, A.R. Gregory, and M. M. Sharma. Nonlinear viscoelasticbehavior of sedimentary rocks, part I: Effect of frequency and strain amplitude.Geophysics, 63:184–194, 1998.
[140] H. Valiollahi. Modeling of the placement of an oil-soluble chemical in porous mediafor water control. Master’s thesis, Delft University of Technology, 2005.
Bibliography 169
[141] R. H. Brooks and A. T. Corey. Properties of porous media affecting fluid flow.Journal of Irrigation and Drainage. Division of American Society Civil Engineering,92:61–88, 1966.
[142] A. Settari. Petroleum Reservoir Simulation. Elsevier, London, 2nd edition, 1979.
[143] R. H. Worden, D. A. C. Manning, and S. H. Bottrell. Multiple generations of highsalinity formation water in the Triassic Sherwood Sandstone: Wytch Farm oilfieldonshore UK. Applied Geochemistry, 21:455–475, 2006.
[144] B. Bazin, E. Brosse, and F. Sommer. Chemistry of oil-field brines in relation todiagenesis of reservoirs 1. Use of mineral stability fields to reconstruct in situ watercompososition. example of the mahakam basin. Marine and Petroleum Geology, 14:481–495, 1997.
[145] W. T. Dixon. Simple proton spectroscopic imaging. Radiology, 153:189–194, 1984.
[146] J. A. Borrello, T. L. Chenevert, C. R. Meyer, A. M. Aisen, and G. M. Glazer. Chem-ical shift-based true water and fat images: Regional phase correction of modifiedspin-echo mr images. Radiology, 164:531–537, 1987.
[147] C. T. Chang and C. M. Edwards. Proton MR two-component chemical shift imagingof fluids in porous media. The Log Analyst, November-December 1993.
[148] L. D. Hall, V. Rajanayagam, and C. Hall. Chemical shift imagin of water and n-dodecane in sedimentary rocks. Journal of Magnetic Resonance, 68:185–188, 1986.
[149] W. B. Haines. Studies in the physical properties of soils: V. the hysteresis effectin capillary properties and the modes of moisture distribution associated therewith.Journal of Agricultural Science, 20:97–116, 1930.
[150] J. W. Cahn. Free energy of a nonuniform system. I. Interfacial free energy. Journalof Chemical Physics, 28(2), 1958.
[151] M. Verschueren. A diffusive-interface model for structure development in flow. The-sis/dissertation, Eindhoven University of Technology, 1999.
[152] E. L. Hahn. Spin echoes. Physical Review, 80(4):580–594, 1950.
[153] F. D. Doty, G. Entzminger, and C. D. Hauck. Error-tolerant RF Litz coils forNMR/MRI. Journal of Magnetic Resonance, 140:17–31, 1999.
[154] L. Pel, K. Kopinga, G. Bertram, and G. Lang. Water-absorption in a fired-clay brickobserved by NMR scanning. Journal of Physics D-Applied Physics, 28(4):675–680,1995.
[155] J. J. van der Sande, L. A. Rijniers, R. N. P. Meerman, S. J. F. Erich, and J. Fei-jen. Programmers reference to the NMR measurement system v3.2. EindhovenUniversity of Technology, internal report, 2004.

170 Bibliography
Summary
The subject of the thesis is two-phase reactive transport of an Oil-Soluble Chemical(OSC). An OSC is a chemical that is soluble and chemically stable in oil, however itreacts with water to form a gel. A novel concept is the use of OSCs in the oil industryfor water control, in order to reduce water production in oil and gas production wells.
The aim of the research was to investigate, on a fundamental level, the reactive trans-port of an OSC in two-phase systems, in bulk and within porous materials. The chemicaltetra-methyl-ortho-silicate (TMOS) was chosen as a model OSC. The choice is inspiredby the potential use of TMOS for water shut-off. When a solution of TMOS in oil comesin contact with water the chemical transfers to the water phase where it undergoes aheterogeneous sol-gel reaction. The main experimental tool used to characterize the re-active transport, both in bulk as in porous materials, was Nuclear Magnetic Resonance(NMR).
In Chapter 2 the NMR methods to monitor the reactive transport in bulk systems areintroduced and described in detail. TMOS was dissolved in n-hexadecane and placed in(small) vials together with demineralized water. Two-dimensional images of a cross sectionof the samples were acquired, which revealed qualitatively the mass transfer behaviorbetween both phases. The concentration of TMOS in oil was determined by measuringthe longitudinal relaxation time T1 of hydrogen in the oleic phase, using calibrations ofT1 for TMOS in n-hexadecane. Further, the transverse relaxation time T2 of hydrogenin the aqueous phase was measured to monitor the progress of gelation. During the gelreaction T2 decreases in the course of time and reaches a minimum (plateau) at the gelpoint. The reduction of T2 is caused by the interaction of the water molecules with thesilica aggregates and the formation of methanol in the gel reaction.
An image analysis method to determine the interfacial tension (IFT) between bothphases in the bulk systems using the NMR images is presented in Chapter 3. The methodis based on interface tracking. A second-order boundary value problem, which describesthe interfacial energy in terms of the IFT and the effect of gravity, is solved and optimizedfor each image, yielding the IFT as a function of time. At an initial concentration of 40vol% of TMOS in oil the IFT is initially about 10 mN m−1, but it increases graduallyto about 20 mN m−1 as the TMOS transfers from oil to water. Also in Chapter 3, aconceptual model is introduced to describe the mass transfer and hydrolysis of TMOSbased on a partitioning-reaction model.
In Chapter 4 the use of a bi-nuclear NMR method is introduced. Again bulk systemswere considered. In this case the water used was D2O. T1 of hydrogen in the oleic phasewas measured to determine the concentration of TMOS in oil, and T2 of deuterium in theaqueous phase was used to characterize the progress of gelation. The experiments showedthat the pH of the aqueous phase is the main parameter that influences the mass transfer
171
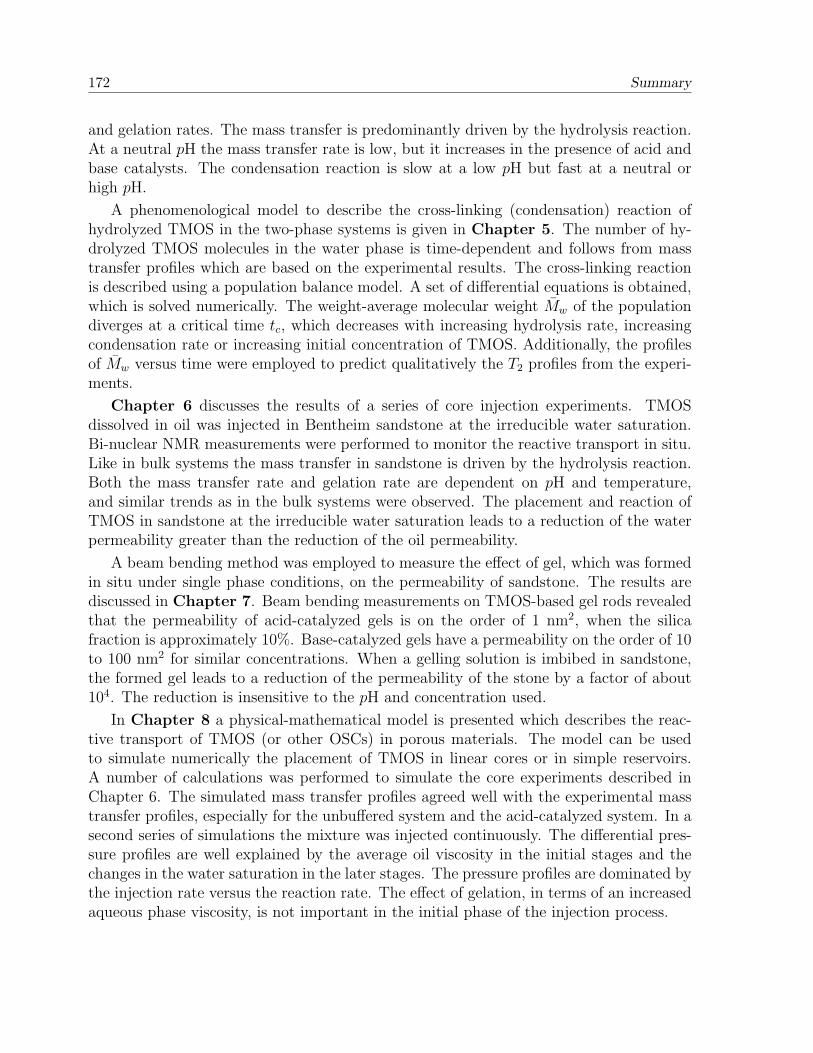
172 Summary
and gelation rates. The mass transfer is predominantly driven by the hydrolysis reaction.At a neutral pH the mass transfer rate is low, but it increases in the presence of acid andbase catalysts. The condensation reaction is slow at a low pH but fast at a neutral orhigh pH.
A phenomenological model to describe the cross-linking (condensation) reaction ofhydrolyzed TMOS in the two-phase systems is given in Chapter 5. The number of hy-drolyzed TMOS molecules in the water phase is time-dependent and follows from masstransfer profiles which are based on the experimental results. The cross-linking reactionis described using a population balance model. A set of differential equations is obtained,which is solved numerically. The weight-average molecular weight Mw of the populationdiverges at a critical time tc, which decreases with increasing hydrolysis rate, increasingcondensation rate or increasing initial concentration of TMOS. Additionally, the profilesof Mw versus time were employed to predict qualitatively the T2 profiles from the experi-ments.
Chapter 6 discusses the results of a series of core injection experiments. TMOSdissolved in oil was injected in Bentheim sandstone at the irreducible water saturation.Bi-nuclear NMR measurements were performed to monitor the reactive transport in situ.Like in bulk systems the mass transfer in sandstone is driven by the hydrolysis reaction.Both the mass transfer rate and gelation rate are dependent on pH and temperature,and similar trends as in the bulk systems were observed. The placement and reaction ofTMOS in sandstone at the irreducible water saturation leads to a reduction of the waterpermeability greater than the reduction of the oil permeability.
A beam bending method was employed to measure the effect of gel, which was formedin situ under single phase conditions, on the permeability of sandstone. The results arediscussed in Chapter 7. Beam bending measurements on TMOS-based gel rods revealedthat the permeability of acid-catalyzed gels is on the order of 1 nm2, when the silicafraction is approximately 10%. Base-catalyzed gels have a permeability on the order of 10to 100 nm2 for similar concentrations. When a gelling solution is imbibed in sandstone,the formed gel leads to a reduction of the permeability of the stone by a factor of about104. The reduction is insensitive to the pH and concentration used.
In Chapter 8 a physical-mathematical model is presented which describes the reac-tive transport of TMOS (or other OSCs) in porous materials. The model can be usedto simulate numerically the placement of TMOS in linear cores or in simple reservoirs.A number of calculations was performed to simulate the core experiments described inChapter 6. The simulated mass transfer profiles agreed well with the experimental masstransfer profiles, especially for the unbuffered system and the acid-catalyzed system. In asecond series of simulations the mixture was injected continuously. The differential pres-sure profiles are well explained by the average oil viscosity in the initial stages and thechanges in the water saturation in the later stages. The pressure profiles are dominated bythe injection rate versus the reaction rate. The effect of gelation, in terms of an increasedaqueous phase viscosity, is not important in the initial phase of the injection process.
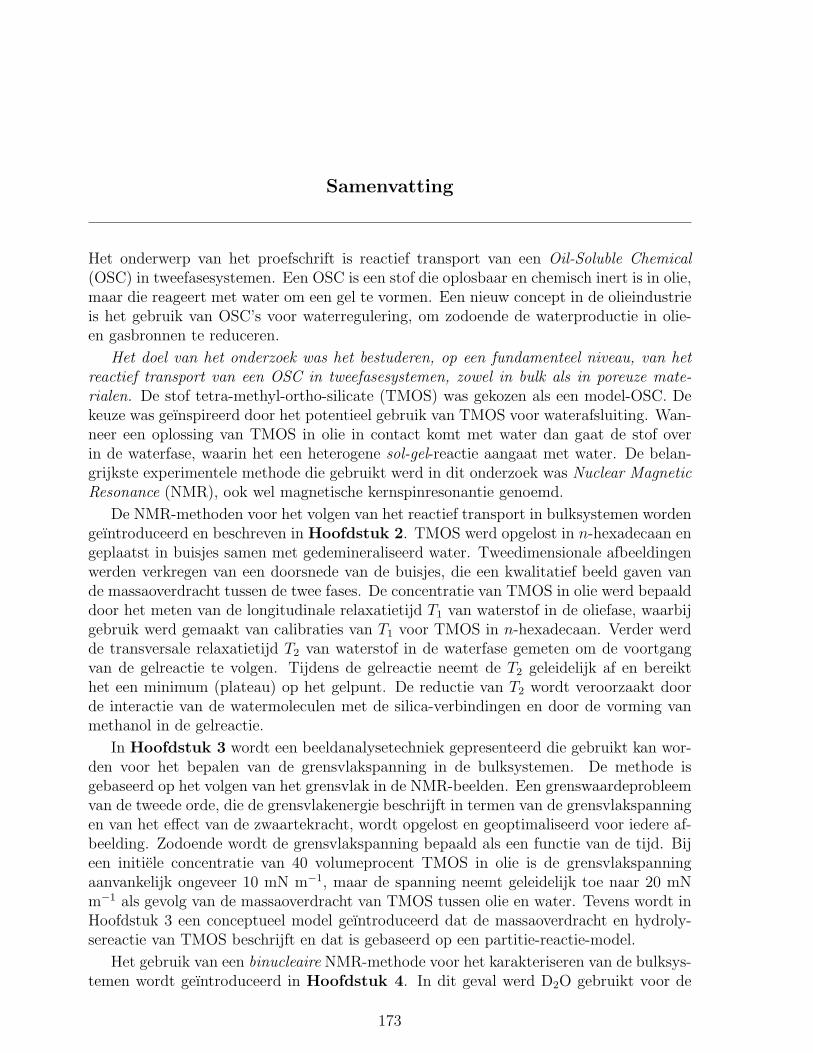
Samenvatting
Het onderwerp van het proefschrift is reactief transport van een Oil-Soluble Chemical(OSC) in tweefasesystemen. Een OSC is een stof die oplosbaar en chemisch inert is in olie,maar die reageert met water om een gel te vormen. Een nieuw concept in de olieindustrieis het gebruik van OSC’s voor waterregulering, om zodoende de waterproductie in olie-en gasbronnen te reduceren.
Het doel van het onderzoek was het bestuderen, op een fundamenteel niveau, van hetreactief transport van een OSC in tweefasesystemen, zowel in bulk als in poreuze mate-rialen. De stof tetra-methyl-ortho-silicate (TMOS) was gekozen als een model-OSC. Dekeuze was geınspireerd door het potentieel gebruik van TMOS voor waterafsluiting. Wan-neer een oplossing van TMOS in olie in contact komt met water dan gaat de stof overin de waterfase, waarin het een heterogene sol-gel-reactie aangaat met water. De belan-grijkste experimentele methode die gebruikt werd in dit onderzoek was Nuclear MagneticResonance (NMR), ook wel magnetische kernspinresonantie genoemd.
De NMR-methoden voor het volgen van het reactief transport in bulksystemen wordengeıntroduceerd en beschreven in Hoofdstuk 2. TMOS werd opgelost in n-hexadecaan engeplaatst in buisjes samen met gedemineraliseerd water. Tweedimensionale afbeeldingenwerden verkregen van een doorsnede van de buisjes, die een kwalitatief beeld gaven vande massaoverdracht tussen de twee fases. De concentratie van TMOS in olie werd bepaalddoor het meten van de longitudinale relaxatietijd T1 van waterstof in de oliefase, waarbijgebruik werd gemaakt van calibraties van T1 voor TMOS in n-hexadecaan. Verder werdde transversale relaxatietijd T2 van waterstof in de waterfase gemeten om de voortgangvan de gelreactie te volgen. Tijdens de gelreactie neemt de T2 geleidelijk af en bereikthet een minimum (plateau) op het gelpunt. De reductie van T2 wordt veroorzaakt doorde interactie van de watermoleculen met de silica-verbindingen en door de vorming vanmethanol in de gelreactie.
In Hoofdstuk 3 wordt een beeldanalysetechniek gepresenteerd die gebruikt kan wor-den voor het bepalen van de grensvlakspanning in de bulksystemen. De methode isgebaseerd op het volgen van het grensvlak in de NMR-beelden. Een grenswaardeprobleemvan de tweede orde, die de grensvlakenergie beschrijft in termen van de grensvlakspanningen van het effect van de zwaartekracht, wordt opgelost en geoptimaliseerd voor iedere af-beelding. Zodoende wordt de grensvlakspanning bepaald als een functie van de tijd. Bijeen initiele concentratie van 40 volumeprocent TMOS in olie is de grensvlakspanningaanvankelijk ongeveer 10 mN m−1, maar de spanning neemt geleidelijk toe naar 20 mNm−1 als gevolg van de massaoverdracht van TMOS tussen olie en water. Tevens wordt inHoofdstuk 3 een conceptueel model geıntroduceerd dat de massaoverdracht en hydroly-sereactie van TMOS beschrijft en dat is gebaseerd op een partitie-reactie-model.
Het gebruik van een binucleaire NMR-methode voor het karakteriseren van de bulksys-temen wordt geıntroduceerd in Hoofdstuk 4. In dit geval werd D2O gebruikt voor de
173
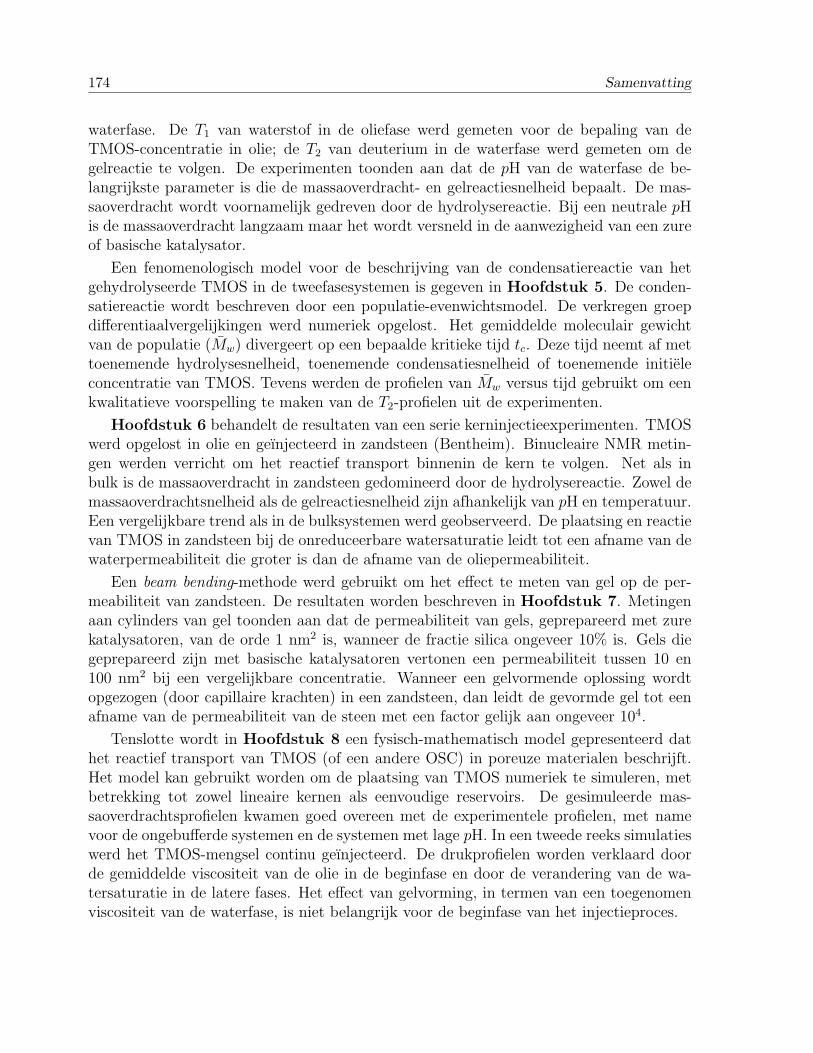
174 Samenvatting
waterfase. De T1 van waterstof in de oliefase werd gemeten voor de bepaling van deTMOS-concentratie in olie; de T2 van deuterium in de waterfase werd gemeten om degelreactie te volgen. De experimenten toonden aan dat de pH van de waterfase de be-langrijkste parameter is die de massaoverdracht- en gelreactiesnelheid bepaalt. De mas-saoverdracht wordt voornamelijk gedreven door de hydrolysereactie. Bij een neutrale pHis de massaoverdracht langzaam maar het wordt versneld in de aanwezigheid van een zureof basische katalysator.
Een fenomenologisch model voor de beschrijving van de condensatiereactie van hetgehydrolyseerde TMOS in de tweefasesystemen is gegeven in Hoofdstuk 5. De conden-satiereactie wordt beschreven door een populatie-evenwichtsmodel. De verkregen groepdifferentiaalvergelijkingen werd numeriek opgelost. Het gemiddelde moleculair gewichtvan de populatie (Mw) divergeert op een bepaalde kritieke tijd tc. Deze tijd neemt af mettoenemende hydrolysesnelheid, toenemende condensatiesnelheid of toenemende initieleconcentratie van TMOS. Tevens werden de profielen van Mw versus tijd gebruikt om eenkwalitatieve voorspelling te maken van de T2-profielen uit de experimenten.
Hoofdstuk 6 behandelt de resultaten van een serie kerninjectieexperimenten. TMOSwerd opgelost in olie en geınjecteerd in zandsteen (Bentheim). Binucleaire NMR metin-gen werden verricht om het reactief transport binnenin de kern te volgen. Net als inbulk is de massaoverdracht in zandsteen gedomineerd door de hydrolysereactie. Zowel demassaoverdrachtsnelheid als de gelreactiesnelheid zijn afhankelijk van pH en temperatuur.Een vergelijkbare trend als in de bulksystemen werd geobserveerd. De plaatsing en reactievan TMOS in zandsteen bij de onreduceerbare watersaturatie leidt tot een afname van dewaterpermeabiliteit die groter is dan de afname van de oliepermeabiliteit.
Een beam bending-methode werd gebruikt om het effect te meten van gel op de per-meabiliteit van zandsteen. De resultaten worden beschreven in Hoofdstuk 7. Metingenaan cylinders van gel toonden aan dat de permeabiliteit van gels, geprepareerd met zurekatalysatoren, van de orde 1 nm2 is, wanneer de fractie silica ongeveer 10% is. Gels diegeprepareerd zijn met basische katalysatoren vertonen een permeabiliteit tussen 10 en100 nm2 bij een vergelijkbare concentratie. Wanneer een gelvormende oplossing wordtopgezogen (door capillaire krachten) in een zandsteen, dan leidt de gevormde gel tot eenafname van de permeabiliteit van de steen met een factor gelijk aan ongeveer 104.
Tenslotte wordt in Hoofdstuk 8 een fysisch-mathematisch model gepresenteerd dathet reactief transport van TMOS (of een andere OSC) in poreuze materialen beschrijft.Het model kan gebruikt worden om de plaatsing van TMOS numeriek te simuleren, metbetrekking tot zowel lineaire kernen als eenvoudige reservoirs. De gesimuleerde mas-saoverdrachtsprofielen kwamen goed overeen met de experimentele profielen, met namevoor de ongebufferde systemen en de systemen met lage pH. In een tweede reeks simulatieswerd het TMOS-mengsel continu geınjecteerd. De drukprofielen worden verklaard doorde gemiddelde viscositeit van de olie in de beginfase en door de verandering van de wa-tersaturatie in de latere fases. Het effect van gelvorming, in termen van een toegenomenviscositeit van de waterfase, is niet belangrijk voor de beginfase van het injectieproces.
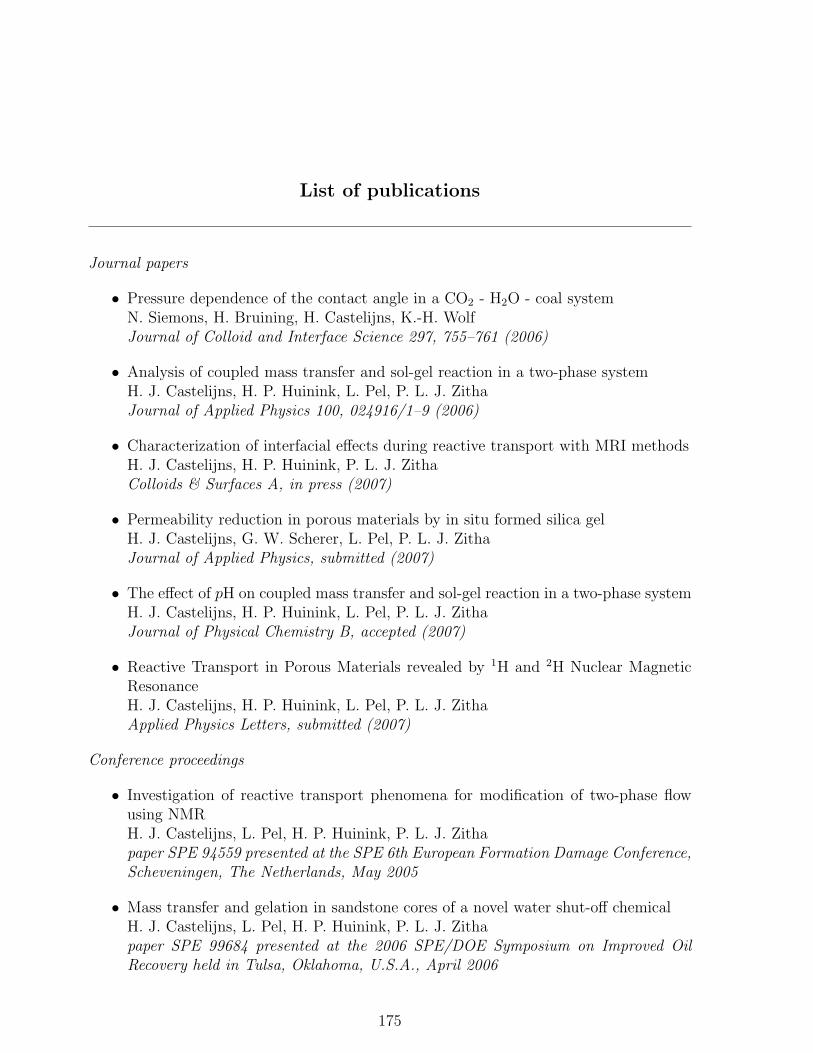
List of publications
Journal papers
• Pressure dependence of the contact angle in a CO2 - H2O - coal systemN. Siemons, H. Bruining, H. Castelijns, K.-H. WolfJournal of Colloid and Interface Science 297, 755–761 (2006)
• Analysis of coupled mass transfer and sol-gel reaction in a two-phase systemH. J. Castelijns, H. P. Huinink, L. Pel, P. L. J. ZithaJournal of Applied Physics 100, 024916/1–9 (2006)
• Characterization of interfacial effects during reactive transport with MRI methodsH. J. Castelijns, H. P. Huinink, P. L. J. ZithaColloids & Surfaces A, in press (2007)
• Permeability reduction in porous materials by in situ formed silica gelH. J. Castelijns, G. W. Scherer, L. Pel, P. L. J. ZithaJournal of Applied Physics, submitted (2007)
• The effect of pH on coupled mass transfer and sol-gel reaction in a two-phase systemH. J. Castelijns, H. P. Huinink, L. Pel, P. L. J. ZithaJournal of Physical Chemistry B, accepted (2007)
• Reactive Transport in Porous Materials revealed by 1H and 2H Nuclear MagneticResonanceH. J. Castelijns, H. P. Huinink, L. Pel, P. L. J. ZithaApplied Physics Letters, submitted (2007)
Conference proceedings
• Investigation of reactive transport phenomena for modification of two-phase flowusing NMRH. J. Castelijns, L. Pel, H. P. Huinink, P. L. J. Zithapaper SPE 94559 presented at the SPE 6th European Formation Damage Conference,Scheveningen, The Netherlands, May 2005
• Mass transfer and gelation in sandstone cores of a novel water shut-off chemicalH. J. Castelijns, L. Pel, H. P. Huinink, P. L. J. Zithapaper SPE 99684 presented at the 2006 SPE/DOE Symposium on Improved OilRecovery held in Tulsa, Oklahoma, U.S.A., April 2006
175

176 List of publications
Dankwoord
Met groot genoegen kijk ik terug op de mooie tijd, de fijne werksfeer en collegialiteit dieik tijdens mijn promotie-aanstelling heb mogen meemaken. Het werken in en behoren tottwee verschillende onderzoeksgroepen (zie About the Author) maakten het geheel tot eenleuke en dynamische belevenis.
Ik wil mijn promotoren, Peter Currie en Stefan Luthi, bedanken voor hun bijdrage aan hetproject en de uitstekende begeleiding tijdens de promotie en de afronding ervan. Specialedank gaat uit naar dagelijkse begeleider, (ex-toegevoegd) promotor en projectleider PacelliZitha die een centrale rol heeft gespeeld in het geheel. Pacelli, bedankt voor de fijne mixvan begeleiding, flexibiliteit, interesse en wetenschappelijke bijdrage die je al die jarengeboden hebt! Hetzelfde geldt zeker ook voor mijn dagelijkse begeleiders in Eindhoven,Leo Pel en Henk Huinink. Met name de experimentele kennis van Leo en zijn ”drive” zijnvan groot belang geweest. Henk, bedankt voor de vele inhoudelijke discussies en de fijnesfeer die ik als kamergenoot mocht meemaken. Zij hebben zich bovendien buitengewooningezet door het lees- en corrigeerwerk van dit proefschrift en de artikelen. Tevens wil ikKlaas Kopinga bedanken voor zijn rol als gastheer en voor de fijne gesprekken over NMR.
I thank all committee members for their participation in the PhD defense and theirvaluable feedback. Also, I thank the participants of the user group and the STW repre-sentatives for their support and interest in our research work.
Uit Delft wil ik verder de volgende mensen bedanken. De specialisten Karel Heller, An-dre Hoving, Jan Etienne, Peter de Vreede, Leo Vogt, Gerard Mathu, Ton van Leeuwen,Henny van der Meulen, Ellen Meijvogel-The King en Jolanda van Haagen ben ik erken-telijk voor de hulp en de prettige sfeer in het Dietzlab. Dit laatste geldt ook voor mijncubicle-genoot Gerard Sigon. Van de wetenschappelijke staf wil ik graag noemen: Su-sanne Rudolph-Floter, Hans Bruining, Du Dong-Xing en Fred Vermolen (van Wiskunde).Verder de administratieve staf: Lydia, Ralf, Marlijn, Margot, Marijke, bedankt voor julliehulp. Special thanks goes to Habib Valiollahi for his major contribution to the numer-ical model and code, which is discussed in Chapter 8. Mijn mede(ex-)promovendi vanhet Dietzlab: Firas, Jeroen, Mohamed, Quoc, Talal, Saikat, Willem-Jan, Yufei, Aihnoa,Ghaithan, Rouhi, Hamid, Christiaan, Menne, Bert-Rik, Patrick, Nikolai en office mateBouko; met velen heb ik erg gezellige momenten beleefd. Koenraad Elewaut, mijn di-recte projectgenoot, bedankt voor de leuke tijd en onderlinge steun die we samen hebbenervaren. Veel succes in je verdere loopbaan!
Ik bedank de KLPD, omdat zij een oogje toekneep tijdens mijn vele ritten tussen Delften Eindhoven.
Uit Eindhoven noem ik de volgende mensen. Grote dank gaat uit naar Hans Dalderop,die werkelijk altijd klaar stond om te helpen op het gebied van labzaken, materialen,bestellingen, etc. Jef Noijen bedank ik graag voor zijn hulp met de electronica en zijn
177
178 Dankwoord
immer opgewekte stemming. Jaap Feijen ben ik erkentelijk voor zijn onuitputtelijke ken-nis op het gebied van de NMR soft- en hardware. Van de overige TPM-staf noem ik:Ria, Kristina, Olaf en Marijn. Van de werkplaats bedank ik Marius, Han, Henk, Franken Ginny, voor het mooie werk dat zij voor mij verricht hebben. Voor de fijne sfeer encollegialiteit wil ik de volgende ”BMT-ers” bedanken: Klaas, Gustav, Jeanine, Jo, Ger-alda, Anneriet, Henk, Edwin, Erik, Maarten, Glenda, Nicole, Evelina, Bram, Jaap, Larry,Hedwig. Natuurlijk de mede(ex-)-AIO’s en studenten van TPM: Tom, Jan, Paul, Jelena,Victoria, Tamerlan, Carola, Gijs, Lourens (voor zijn hulp in mijn 1e en 2e jaar). Ik be-dank NMR-goeroe Bart voor alle steun en (nood)hulp bij de soft- en hardware, en verdermijn collega Ward - ”I didn’t spend four years at Evil Medical School to be called MisterEvil thank you very much” - Jennekens, met wie ik hard gelachen en fijn gewerkt heb.
Special thanks goes to George Scherer for all the help during my visit at Princeton and hiscontribution to the beam bending work. He has been a wonderful host and introduced meto some nice traditional events. Marty Scherer is greatly acknowledged for the excellentdinners. I also like to thank the other members of the Materials Research group, especially:Joe, John and Timothy.
Tenslotte wil ik enkele mensen uit mijn directe omgeving noemen. De doorgebrachte vrijetijd met hen en hun betrokkenheid waren van wezenlijk belang tijdens het promotietraject.Ik bedank mijn vrienden en vriendinnen van de ”HB” en van ”KA” voor alle gezelligheid.Mijn directe familie ben ik dankbaar; Janske, Rombout, Susan, Minke, Henk, Daantje,Nina, Cees en Agnes, en vooral mijn vader Jan, voor alle persoonlijke, culinaire en overigesteun. Bedankt!
About the author
Hein Castelijns was born in Eindhoven, The Netherlands, on January 13, 1979. He at-tended secondary school (atheneum) at the ”Rythovius College” in Eersel from 1991 to1997. In 2003 Hein obtained a Master’s degree in Applied Physics from the EindhovenUniversity of Technology. The final work of the Master’s program was about modelingand numerical simulation of atmospheric vortices and transport processes.
The PhD work, which resulted in this dissertation, was performed in the group of Pe-troleum Engineering from the department of Geotechnology, TU Delft (July 2003 - June2007). The author worked in close cooperation with the group Transport in PermeableMedia of the faculty Applied Physics, TU Eindhoven, where he conducted most of hisexperimental work. In 2006 he visited the Materials Research group of Professor Schererat Princeton University for a three-month period.
179

Prior to the speech, Harald Cramer, member of the Royal Academy of Sciences, addressedthe laureates: ”Dr. Bloch and Dr. Purcell! You have opened the road to new insight intothe micro-world of nuclear physics. Each atom is like a subtle and refined instrument,playing its own faint, magnetic melody, inaudible to human ears. By your methods, thismusic has been made perceptible, and the characteristic melody of an atom can be usedas an identification signal. This is not only an achievement of high intellectual beauty -it also places an analytic method of the highest value in the hands of scientists.¨
From Les Prix Nobel en 1952, editor Goran Liljestrand, Nobel Foundation, Stock-holm, 1953