Embed Size (px)
Citation preview
1
ULTRA SMALL-ANGLE X-RAY SCATTERING STUDY OF FLOCCULATION
IN SILICA-FILLED RUBBER
Satoshi Mihara,1 Rabin N. Datta,2 Wilma K. Dierkes,2 Jacques W.M. Noordermeer,2* Naoya
Amino,1 Yasuhiro Ishikawa,1 Shoutaro Nishitsuji,3 and Mikihiko Takenaka3
1 The Yokohama Rubber Company, Ltd., 2-1 Oiwake, Hiratsuka, Kanagawa, 254-8601, Japan
2 Department of Elastomer Technology and Engineering, Faculty of Engineering Technology,
University of Twente, P.O. Box 217, 7500 AE Enschede, the Netherlands
3 Department of Polymer Chemistry, Graduate School of Engineering, Kyoto University, Katsura,
Nishikyo-ku, Kyoto 661-8510, Japan
* Corresponding author: E-mail: [email protected], tel: +31 53 489 2529, Fax: +31 53
489 2151

2
ABSTRACT
In this study the flocculation of silica during vulcanization is monitored using the USAXS technique for
two different types of silica: a highly dispersible silica (HD) and a conventional silica (CV), mixed into
a blend of S-SBR and BR rubbers. The cutoff length of the silica aggregate Rss and the mass fractal
dimension Dm, which indicate the degree of flocculation of aggregates, are estimated according to the
modified unified equation. The aggregate radius Ra is estimated to be related to the lower cut-off length
Rss, indicating the radius of gyration of the mass-fractal structure. For both silicas Ra increases during
vulcanization. For the CV silica an increase of Dm is observed, whereas no significant increase of Dm
can be seen for the HD silica. Ra of CV is a relatively high compared to that of HD. On the other hand,
the CV silica shows a relatively lower Dm compared to that of HD. These results indicate that CV has a
larger size of aggregates and lower degree of agglomeration of its aggregates. The presence of TESPT
as coupling agent between the silica and rubber decreases the aggregate radius of silica. However, in the
absence of TESPT a low mass-fractal dimension, which means a low degree of agglomeration of
aggregates, is observed. This results from a lower mobility of silica aggregates, depending on the size of
the aggregates. The silica loading also has an influence on the flocculation process. The aggregate
radius increases as the silica loading is increased. At the same time, a higher mass-fractal dimension,
therefore also higher degree of agglomeration can be seen at higher silica loading.

3
Introduction
Filler dispersion in rubber compounds plays an important role in the physical properties of reinforced
rubber. The dispersion of filler in a rubber matrix strongly depends on the polarity difference between
polymer and filler, such as carbon black or silica.
It is generally known that the hierarchical structure of fillers such as the primary particles, aggregates
and agglomerates can still be recognized in a filled rubber. The presence of remaining agglomerates
strongly negatively affects the reinforcing properties of the fillers in rubber, while the aggregates are the
real reinforcing species. The reinforcing properties strongly depend on the following factors: (1) the
degree of physically linked aggregates in the filler network, as often quantified by the Payne effect, and
(2) polymer-filler interaction, for example described as bound rubber.
The relationship between the morphological properties of silica and the reinforced properties of
rubber is not fully understood. Many morphological studies such as with TEM microscopy and
measurement of the electrical percolation threshold have been done in the past to investigate the filler
structure [1-8]. For 3-dimensional observations using TEM, a high volume fraction of fillers such as
commonly used in typical tire tread compounds, leads to difficulties discern the filler structure, because
of an overlap of the structure along the electron beam direction. In addition, the special thin sample of
50-100nm thickness required for a TEM observation, smaller than the average aggregate size of the
filler, also lead to difficulties with respect to a 3-dimensional observation. Measurement of the electrical
percolation threshold is a useful technique for a carbon black filled compound because of its high
conductivity. However, this measurement can not be applied to silica filled-compounds due to lack of
conductivity.
For 3-dimensional characterization of filler-filled compounds, small angle scattering is a useful
technique to understand the morphological properties of fillers in a rubber matrix. Ultra small angle
scattering (USAS) and small angle scattering (SAS) using X-rays, neutrons and visible light have been
widely used earlier to investigate the morphological structure of fillers in rubber matrices [9-13].

4
In the present study, ultra small angle X-ray scattering (USAXS) which can cover a scattering angle q
range of 0.01 to 0.4nm-1 is applied to characterize the filler morphology in a rubber compound. The
focus is on silica-flocculation in a rubber compound during vulcanization. It is worthwhile to mention in
this context that the activation energy of silica flocculation was quantified earlier to be approximately
10 kJ/mole, indicating that silica flocculation is a purely physical phenomenon [14]. In addition,
Reuvekamp et al. proposed that the flocculation of the silica takes place at the very beginning of the
vulcanization [15].
This paper focusses on the morphological properties of the silica during vulcanization. The structural-
hierarchical parameters such as the mass-fractal dimension and the size of the aggregates are estimated
using the Beaucage unified equation, which is composed of a Guinier scattering function combined with
a power-law scattering. Based on the differences of the structural parameters between highly dispersible
silica and conventional silica, the morphological property changes in the rubber compound will be
investigated during the temperature treatment involved in vulcanization.
Experimental
Sample preparation.- The compound formulations are based on a typical tire tread compound according
to the fuel-saving green tire technology as shown in Table 1. In the present study two types of silica, a
highly dispersible silica and a conventional silica are used. Structural analytical data of the silicas are
shown in Table 2. The amount of Bis(tri-Ethoxy-Silyl-Propyl)Tetrasulfide (TESPT) coupling agent
between the silica and rubber in the recipes was adjusted according to equation 1, which is related to the
CTAB (Cetyl Tri-Ammonium Bromide) surface area of the silicas [16]:
)1()()(103.5)( 4silicasilica phrCTABphrTESPT
The total amount of active sulfur was adjusted to 2.1 phr, being the sum of the sulfur contained in the
5
silane and in the curatives.
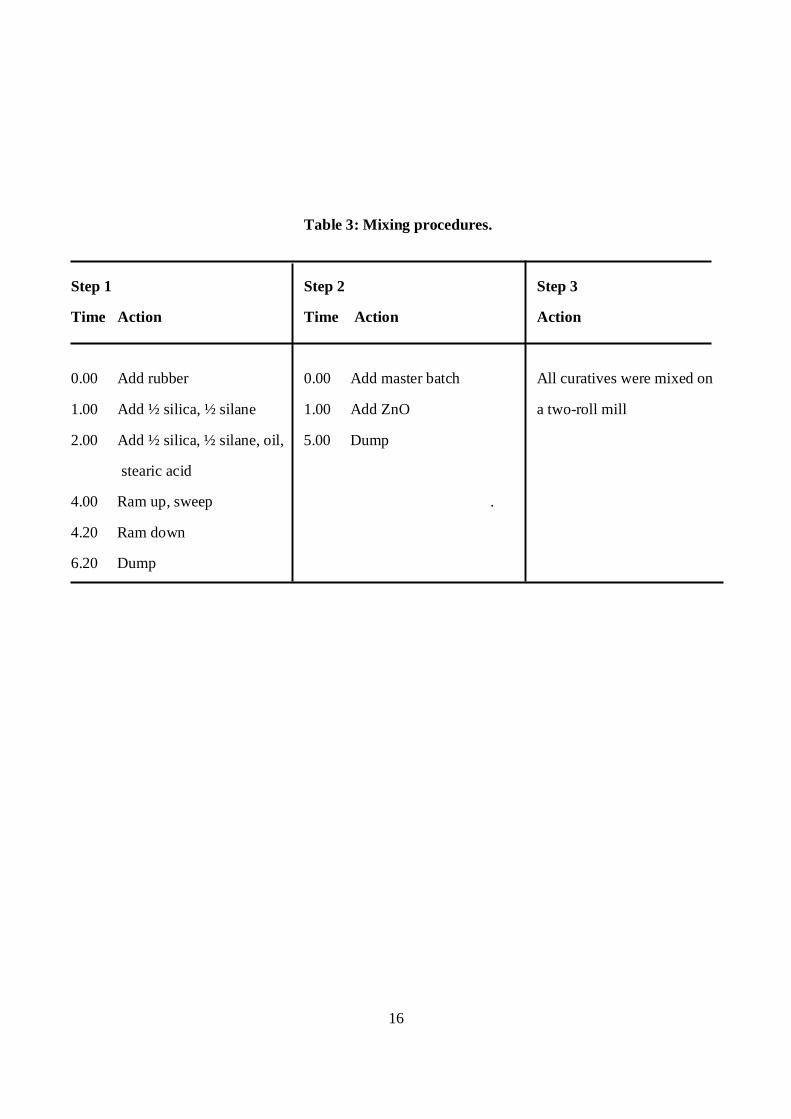
The compounds were mixed in 3 steps. The first two steps were done using a tangential type internal
mixer with 1.7L volume. The mixing procedures are shown in Table 3. The starting temperature of the
mixing chamber was 60 C. The dump temperature in the first two steps was kept below 160 C by
changing the rotor speed. The fill factor of the mixer was fixed to 65%. The curatives were mixed on the
two roll mill in the third step.
Ultra small-angle X-ray scattering (USAX) measurement.- The USAXS measurement was done at
ambient pressure by using the Spring-8 (Super Photon ring-8, Beam line BL19B2, Japan Atomic Energy
Research Institute); world’s largest third-generation synchrotron radiation facility. The time division
method was applied in the present investigation. A layout of the measurement system is described in
Figure 1. The X-ray scattering was detected using the pixel detector (PILTUS) covering the q-range of
0.01 0.4 nm-1 q=(4 )sin : =scattering angle ; =wave length of the X-ray=0.5 Å [24 keV] . The
distance between the sample and the PILTUS is approximately 40 m, therefore the ultra small-angle
scattering X-rays can be detected.
The silica filled rubbers of about 1 mm thickness were held in the thermostatic chamber at the
specified temperature for 1500 sec. Data correction was done for sample transmission and for
background scattering arising from air and fused quartz in the thermostatic chamber.
Data analysis.- A schematic scattering profile combining ultra small-angle neutron scattering (USANS),
ultra small-angle X-ray scattering (USAXS) and small angle X-ray scattering (SAXS) for a precipitated
silica are shown in Figure 2 [11, 12]. At least three separate levels of the structure of silica can be
detected, corresponding to morpholog00ical properties such as the size of the primary particles, the
degree of aggregation or agglomeration and the surface profile of the particles.
In general, for the scattering data as shown in Figure 2, a curve fitting using a unified approach

6
developed by Beacauge is applied for estimation of the structural parameters such as Rss and Rgg
corresponding to the size of aggregates and agglomerates, respectively. The power-law scattering profile
is described as in equation 2 [17].
)2(qqI p
where I(q) is the scattering intensity at the scattering angle q and p is the power law exponent.
In the high q region the scattering intensity decays following Porod’s law. The power law value p=4
indicates the scattering from the smooth surface of the particles. However, it is well known that the filler
surface such as of carbon black and silica is not smooth but rough [18, 19]. In this case, the surface
fractal dimension (Ds) is related to the power-law exponent p as follows:
)3(Dd2p s
where d is the Euclidean dimension of the space (d=3) and Ds is the surface fractal dimension. If I(q)
is plotted as a function of q logarithmically, the slope of ln (I(q)) vs. ln (q) plot can vary between -3 and
-4. On the other side, at low q, the so-called Guinier region, the scattering intensity decays following
Guinier’s law. The decay of the scattering intensity in this region can be described as shown in equation
4:
)4(3Rq
exp0IqI2i
2
where Ri is the structural size of aggregates or agglomerates.
At low scattering angles q two Guinier regions, which mean the two levels of aggregate and
agglomerate sizes, can be seen. As shown in Figure 2, two discrete shape-factor profiles such as Rgg-1
and Rss-1 can be seen, which can be derived from the Guinier scattering function equation 4. Rgg
-1 and
Rss-1 indicate the upper and lower cut-off length of the mass-fractal structure, respectively. The power-
law scattering between these two Guinier regions indicates the mass-fractal structure Dm. In fact, the
power-law slope in this region means the mass-fractal dimension, therefore the power law index p in
equation 5, is characterized as follows [13]:

7
)5(Dp m
For the qualitative analysis of the structural parameters based on the unified equation, the following
equation is applied to the scattering profiles in the present study [13].
where Rgg and Rss are the upper (agglomerates) and lower (aggregate) cut-off length of the mass-fractal
structure, respectively, and A, B, C, D and E are constants.
In the present study, no upper cut-off length (Rgg) for the mass-fractal structure can be seen in the
covered q, as will be described later. Therefore, Rgg is assumed as an infinite value. As a result, the first
two terms in equation 6 can be neglected and the third term, which is an error function, can be taken
constant. Taking these assumptions into account, equation 6 can be simplified as follows [13]:
By using equation 7, the structural parameters such as Rss and Dm are estimated in the present study.
The lower cut-off length Rss indicates the radius of gyration of the mass-fractal structure.
Results
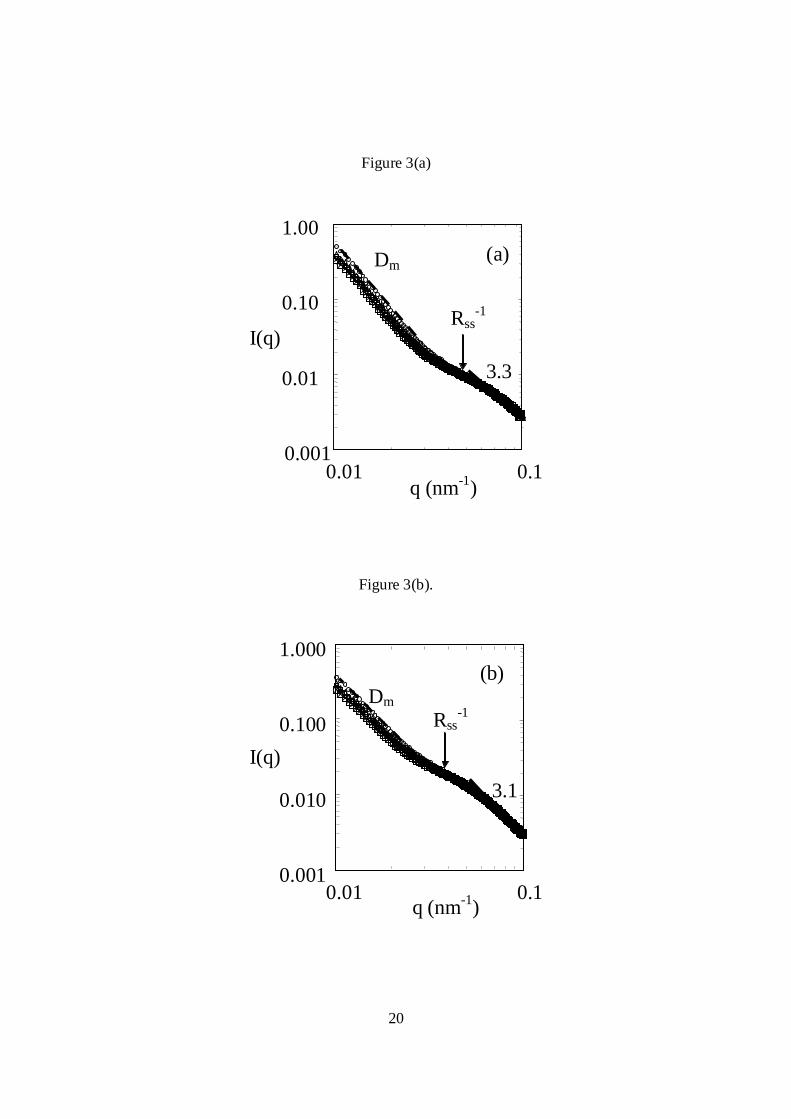
Comparison of the structural parameter between highly dispersible and conventional silica.- Figures 3
(a) and (b) show examples of USAXS scattering profiles for the highly dispersible silica and the
conventional silica at different times. For both silicas, one form-factor profile (Rss-1), as assumed by a
)6()Dd2()Dd2(3
ss2ss
2D
D3gg
2ss
2
2gg
2p
2gg
2
ss
mm
q6
qRerfE3RqexpDq
6
qRerf
3RqexpC
3Rq
expBq3Rq
expAqI
)7()Dd2()Dd2(3
ss2ss
2
D2ss
2
ss
m
q6
qRerfE
3Rq
expD
q3Rq
expCqI

8
Guinier scattering profile, is observed. In addition, two different slopes at high and low q are visible,
which indicate mass-fractal structures with mass-fractal dimension (Dm) and the primary particles with
their surface fractal dimension. The power-law values p at high q do not show a value of p=4, but 3.3
and 3.1, respectively. This means that the surface of the primary particles is not smooth.
In order to investigate the silica flocculation phenomenon, the radius of gyration cut-off length Rss and
the mass-fractal dimension Dm for each silica were estimated according to equation 7. Based on the
assumption that the shape of aggregates is spherical with radius Ra, the radius of gyration Rss can be
described in relation to Ra as follows [11, 13, 17]:
)8(R53R ass
In the present study we therefore can assume that Rss and Dm indicate the size of aggregates and the
degree of the agglomeration of the aggregates, respectively.
Figures 4 (a) and (b) show the estimated radius of the silica aggregates as a function of vulcanization
time at the different temperatures. The aggregate radius of the CV silica is relatively high compared to
that of the HD silica. In addition, the aggregate radius of the CV silica increases slightly faster than that
of HD silica as temperature and time are raised. This translates in the fact that the flocculation rate of
the CV silica is relatively fast compared to that of the HD silica. This tendency of increasing aggregate
size corresponds to the flocculation rate estimated by the RPA2000 measurements [14]. Indeed, the
aggregate radius of the HD silica and the CV silica can be estimated as 24 to 26 nm and 33 to 37 nm,
respectively. At the highest vulcanization temperature of 160 C, the aggregate radius increases quickly
till a vulcanization time of 10 minutes and then remains unchanged. This means that once the
crosslinking reaction proceeds, silica flocculation does not take place any more.
Figures 5 (a) and (b) show the mass-fractal dimension Dm as a function of the vulcanization time at
the different temperatures. For both silicas Dm increases with an increase of vulcanization temperature.
However, in the case of the HD silica, no significant change of Dm during vulcanization can be seen
except for the vulcanization temperature of 160 C. For the CV silica it is clearly seen that Dm increases

9
with increasing vulcanization time. It is interesting to find that the mass-fractal dimension of the CV
silica is relatively low compared to that of the HD silica, while the Rss of the CV silica is higher than
that of the HD silica.
Effect of the filler loading on the structural parameters.- Figures 6(a) and (b) show the radius of
aggregates with different silica loading as a function of vulcanization time. As is evident from Figures
6(a) and (b) for both silicas, a higher Ra is found especially for higher silica loading.
Figures 7 (a) and (b) show the mass-fractal dimension with different silica loading as a function of
vulcanization time. For both silicas, Dm increases as the vulcanization proceeds. In addition, with
increasing silica loading, Dm increases. Again, Dm of the CV silica is relatively low compared to that of
the HD silica.
Effect of the presence of silane on the structural parameters.- The effect of the presence of TESPT on
the structural parameters was investigated and the results are shown in Figures 8 (a) and (b). In the
absence of TESPT, the aggregate radius Ra of the HD silica increases. The higher Ra can be related to a
lower mobility of the aggregates as will be discussed later. In addition, the mass-fractal dimension Dm is
relatively low in the absence of TESPT, which means a lower degree of the agglomeration of the
aggregates.
Discussion
It was observed that the lower cut-off length Rss, which indicates the radius of gyration of the silica
aggregate, increases during vulcanization. In addition, an increase of Dm the mass-fractal dimension,
was seen. It is known that the spherical aggregate of radius Ra is linked to Rss, hence the aggregates size
increases during the vulcanization. From a morphological point of view, it can be mentioned that the
10
HD silica and the CV silica both have a primary particle diameter of approximately 14 nm. Therefore,
the following mechanism regarding the hierarchical structure can be proposed as shown in Figure 9. It
was found that the aggregate radius Ra of the HD silica and the CV silica were approximately 24-26 nm
and 33-37 nm, respectively.
For the CV silica, the increase of aggregate radius Ra during vulcanization is relatively fast compared
to the HD silica: Figure 4. This corresponds to the flocculation rate of the silicas estimated by previous
vulcanization speed measurements [14]. In these measurements, an increase of storage modulus G’
during a heating process was observed due to silica flocculation. This increase of G’ could be related to
an increase of the aggregate size. In fact, the present results conclusively indicate that the increase of the
aggregate size results in the increase of the storage modulus in silica-filled rubber.
A next point to focus on is the degree of agglomeration of the aggregates. In the previous work, due to
the fact that the activation energy of the silica flocculation is approximately 10 kJ/mol, it was indicated
that silica flocculation is a purely physical phenomenon [14]. As stated before, for the estimation of the
structural parameters such as the aggregate radius Ra and the mass-fractal dimension Dm, it was assumed
that the shape of the aggregates or the agglomerates is spherical. Therefore, the mobility of the particles
in terms of their diffusion constant D can be described by equation 9, the Stokes-Einstein equation [19]:
)9(r6
kTD
where: D is the diffusion coefficient, k is Boltzmann’s constant, T is the absolute temperature, is the
viscosity of the matrix and r is the hydrodynamic radius of the particle.
The aggregate radius of the CV silica is relatively high compared to that of the HD silica. This
indicates that the hydrodynamic radius r of the CV silica is relatively high in comparison with the HD
silica. As a result, the mobility of aggregates of the CV silica can be low according to equation 9. This
low mobility of the aggregates then leads to a lower degree of agglomeration of aggregates Dm.
The silica loading also influences the morphological properties of filled rubber. In Figure 6, the radius
of aggregates is higher as the silica loading is increased. The degree of agglomeration of the aggregates

11
Dm also increases with higher silica loading. The attractive force between the particles depends on their
mutual distance. In other words, the correlation length between the particles, which means that the
particles can attract each other, increases with higher silica loading. As a result, the degree of
flocculation of aggregates increases, which is observed as an increase of the mass-fractal dimension Dm.
Therefore, the degree of silica loading is one of the dominant factors for the flocculation process in
silica-filled rubber.
In view of the previous results, the effect of the coupling agent TESPT can now also easily be
understood. The polarity difference between silica and the polymers play an important role in the
morphology of the rubber matrix. TESPT reduces the polarity difference between silica and polymer. In
the absence of TESPT, the aggregate radius Ra is obviously larger as shown in Figure 8, due to a higher
driving force for demixing. On the other hand, the degree of the agglomeration of aggregates Dm then
decreases, due to a decrease of mobility of the aggregates.
Conclusions
The USAXS technique is useful for real time analysis of silica flocculation. The aggregate size of the
CV silica is relatively high compared to that of the HD silica. The aggregate radii Ra for the HD silica
and the CV silica can be estimated as 24-26nm and 33-37 nm, respectively.
The aggregate radius of the CV silica increases fast during vulcanization compared to the HD silica.
This result corresponds with the flocculation rate of silica, as estimated by from vulcanization speed
measurements [14]. On the other hand, for the CV silica, the degree of agglomeration of the aggregates
Dm is relatively lower than for the HD silica. This results from the lower mobility of the aggregates
because of large aggregate size.
An increase of silica loading causes the aggregate radius Ra and the mass-fractal dimension of the

12
agglomerates Dm to increase as well. TESPT plays an important role in the reducing the aggregate
radius Ra of silica. In the absence of TESPT an increase in aggregates radius was found. Since the mass-
fractal dimension Dm strongly depends on the aggregate size of silica, corresponding to physical
diffusion of filler aggregates, in the absence of TESPT a lower mass fractal dimension, which means a
decrease of the mobility of the aggregates, was observed.
The present results again confirm that silica flocculation is a physical phenomenon, as already
demonstrated in our previous work [14].
Acknowledgement
This project was financially supported by the Yokohama Rubber Company LTD.
References
1. Medalia, AJ. J. Colloid Interface Sci., 1967, 24, 393
2. Hess, WM; Ban, LL; McDonald, GC. Rubber Chem. Tech., 1969, 42, 1209
3. Hess, WM; McDonald, GC; Urban, EM. Rubber Chem. Tech., 1972, 44, 204
4. Herd, CR; McDonald, GC; Hess, WM. Rubber Chem. Tech., 1992, 65, 107
5. Medalia, AJ. Rubber Chem. Tech., 1986, 59, 432
6. Ouyang, GB. Kautsch. Gummi Kunstst., 2002, 55, 104
7. Gefen, Y; Aharony, A; Alexander, S. Phys. Rev. Lett., 1983, 50, 77
8. Stroud, D; Bergman, DJ. Phys. Rev. B, 1982, 25, 2061
9. Klüppel, M; Heinrich, G. Rubber Chem. Techn., 1995, 68, 623
10. Göritz, D; Schneider, GJ. Kautschuk HerbstKolloquium DIK, Hannover, Germany 10-13 Nov. 2004
11. Kohls, DJ; Schaefer, DW. Paper No. 68 presented at the Fall 170th Technical Meeting of the Rubber Division, Am.
Chem. Soc., Cincinnati, OH, 10-12 Oct. 2006
12. Schaefer, DW; Kohls, DJ. Paper No. 69 presented at the Fall 170th Technical Meeting of the Rubber Division, Am.
Chem. Soc., Cincinnati, OH, 10-12 Oct. 2006
13. Koga, T; Hashimoto, T; Takenaka, M; Aizawa, K; Amino, N; Nakamura, M, Yamaguchi, D; Koizumi, S.

13
Macromolecules, 2008, 41, 453
14. Mihara, S; Datta, RN; Dierkes, WK; Noordermeer, JWM. Paper No. 63 presented at the Fall 172th Technical Meeting of
the Rubber Division, Am. Chem . Soc., Cleveland, OH, 16-18 Oct. 2007
15. Reuvekamp, LAEM; Debnath, SC; Ten. Brinke, JW; Van. Swaaij, PJ, Noordermeer, JWM. Rubber Chem. Techn., 2004,76, 43
16. Wolff, S; Wang, MJ; Tan, EH. Rubber Chem. Techn., 1993, 66,163
17. Beaucage, GJ. J. Appl. Crystall., 1995, 28, 717
18. Rieker, TP; Hindermann-Bischoff, M. Langmuir,2000, 16, 5588
19. Schmidt, PW. J. Appl. Crystall.,1991, 24, 414
20. Böhm, GG; Nguyen, M. J. Appl. Polym. Sci. , 1995, 55, 1041

14
Table 1: Compound formulations.
1 37.5 phr oil-extended2 CBS: N-Cyclohexyl Benzothiazol Sulfenamide3 DPG: Di-Phenyl Guanidine
Component Product name Supplier phr
S-SBR1 Buna VSL5025 HM-1 Lanxess 103.1
BR Nipol 1220 Nippon Zeon 25
Silica listed in Table 2 listed in Table 2 80
Silane (TESPT) Si69 Degussa 0 or as listed
in Table 2
Aromatic oil Tudalen 3570A Hansen & Rosenthal 4.4
Zinc oxide ZnO Merck 2.5
Stearic acid Merck 2.5
Sulfur J.T. Baker Variable
CBS2 Santocure CBS Flexsys 1.7
DPG3 Perkacit DPG Flexsys 2.0
15
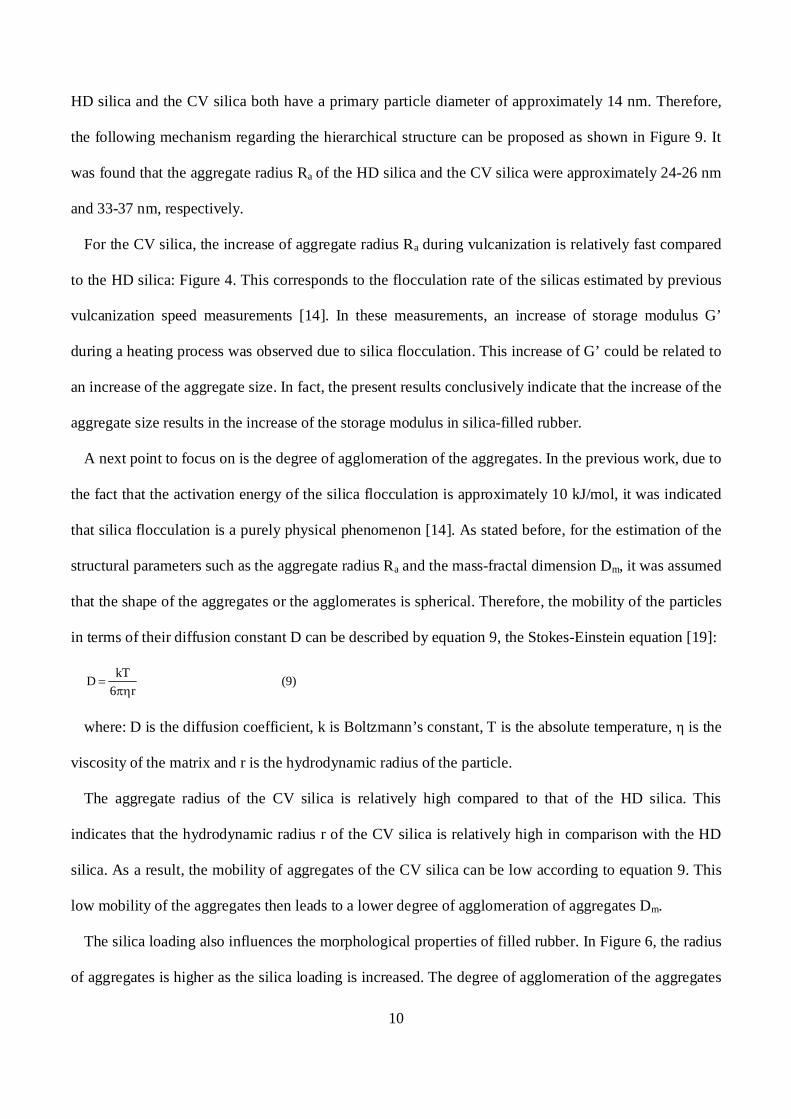
Table 2: Structural analytical data of the silica types.
Code Product Source BET1 CTAB2 DBP3 Silane loading
name (m2/g) (m2/g) (g/100g) (phr)
HD Zeosil 1165MP Rhodia Silices 155 152 196 6.4
CV Ultrasil VN3 Degussa 177 168 183 7.1
1 BET: Brunauer, Emmer and Teller specific surface area2 CTAB: Cetyl Trimethyl Ammonium Bromide specific surface area3 DBP: Di-Butyl Phtalate Adsorption Filler Structure
16
Table 3: Mixing procedures.
Step 1 Step 2 Step 3
Time Action Time Action Action
0.00 Add rubber 0.00 Add master batch All curatives were mixed on
1.00 Add ½ silica, ½ silane 1.00 Add ZnO a two-roll mill
2.00 Add ½ silica, ½ silane, oil, 5.00 Dump
stearic acid
4.00 Ram up, sweep .
4.20 Ram down
6.20 Dump

17
Captions to the figures:
Fig. 1: Schematic layout of USAXS equipment.
Fig. 2: Combined USANS, USAXS and SAXS profiles for silica powder.
Fig. 3: USAXS scattering profiles at 120 oC. (a): Highly dispersible silica 1165MP; (b): Conventionalsilica VN3. (o): 0 min; ( ): 5 min; ( ): 10 min; ( ): 15 min; (x): 20 min.
Fig. 4: Radius of aggregates Ra as a function of vulcanization time at specified temperatures. (a): Highlydispersible silica 1165MP; (b): Conventional silica VN3. ( ): 90 oC; (o): 100 oC; ( ): 120 oC; (x): 160oC.
Fig. 5: Mass- fractal dimension Dm as a function of vulcanization time at specified temperatures. (a):Highly dispersible silica 1165MP; (b): Conventional silica VN3. ( ): 90 oC; (o): 100 oC; ( ): 120 oC;(x): 160 oC.
Fig. 6: Radius of aggregates Ra as a function of vulcanization time at different loadings of silica. (a):Highly dispersible silica 1165MP; (b): Conventional silica VN3. ( ): 90 oC; (o): 100 oC; ( ): 120 oC;(x): 160 oC.
Fig. 7: Mass-fractal dimension Dm as a function of vulcanization time at different loadings of silica. (a):Highly dispersible silica 1165MP; (b): Conventional silica VN3. ( ): 60 phr; (o): 80 phr.
Fig. 8: Effect of TESPT on the structural parameters of silica 1165MP. (a): Radius of aggregates; (b):Mass-fractal dimension. ( ): without TESPT; (o): with TESPT.
Fig. 9: Schematic model of morphological structure during vulcanization. (a): Highly dispersible silica1165MP; (b): Conventional silica VN3.

18
Figure 1.
X-ray shutter Ion chamberThermo chamber
Vacuum chamber Beam stopper
Pixel detector
40 m
X-ray of 24 KeV
Rubber sample

19
Figure 2.
100
102
104
106
108
1010
1012
q (nm-1)10-5 10-4 10-3 10-2 10-1 100
I(q
USAXS
USANS
SAXS
Rss-1Rgg
-1
Agglomerate regime
Aggregateregime
Primary particle regime
Slope=
-3 to -4
Slope=Dm
20
Figure 3(a)
Figure 3(b).
0.001
0.010
0.100
1.000
0.01 0.1q (nm-1)
I(q)Rss
-1
3.3
Dm (a)
0.001
0.010
0.100
1.000
0.01 0.1
I(q)
Rss-1
Dm
q (nm-1)
(b)
3.1

21
Figure 4 (a)
Figure 4(b)

22
Figure 5 (a)
Figure 5 (b)

23
Figure 6 (a) .
Figure 6 (b)

24
Figure 7 (a)
Figure 7 (b)

25
Figure 8 (a)
Figure 8 (b)

26
Figures 9 (a) and (b)


![Structure of Cd-Ga Melts Part 2: X-Ray Small-Angle Scatteringzfn.mpdl.mpg.de/data/Reihe_A/35/ZNA-1980-35a-0938.pdf · Li-Na [9] by X-ray scattering. In the present work the Cd-Ga](https://img.pdfslide.tips/doc/110x75/5f763bbf76e87738ae6f036d/structure-of-cd-ga-melts-part-2-x-ray-small-angle-li-na-9-by-x-ray-scattering.jpg)