Embed Size (px)
Citation preview
TitleUncertainty Estimation and Reduction Measures in the Processof Flood Risk Assessment with Limited Information(Dissertation_全文 )
Author(s) Okazumi, Toshio
Citation Kyoto University (京都大学)
Issue Date 2014-05-23
URL https://doi.org/10.14989/doctor.r12832
Right
Type Thesis or Dissertation
Textversion ETD
Kyoto University
Uncertainty Estimation and Reduction
Measures in the Process of Flood Risk
Assessment with Limited Information
Toshio Okazumi

A Dissertation
Presented to the Faculty of the Graduate School
of Kyoto University
April 2014
©2014 Toshio Okazumi
i
Acknowledgement
At the completion of my thesis, I would like to express my sincere appreciation to those
who provided tremendous support, directly or indirectly, throughout the entire writing
process.
First of all, I would like to express the deepest appreciation to my supervisor, Professor
Tetsuya Sumi of the Disaster Prevention Research Institute (DPRI) of Kyoto University,
for his warm and encouraging advice. It was more than 20 years ago when I was first
acquainted with him. I was just a chief officer in the Ministry of Construction and he
was a senior officer of the same ministry. Since then, I have been very fortunate for
having many occasions working with him, including my first engagement in
full-fledged flood risk assessment in a dam project, and he has provided me with great
assistance and guidance, both professionally and privately, throughout my career. This
time, Professor Sumi kindly accepted to be the supervisor for my dissertation work, and
like in other occasions, he always gave me insightful comments and suggestions. I have
no words to express my gratitude for his generous support.
I would like to thank Professor Tomoharu Hori, Professor Shigenobu Tanaka, Professor
Eiichi Nakakita and Professor Yasuto Tachikawa for being advisors and reviewers for
my research.
Professor Shigenobu Tanaka was the deputy director of the International Centre for
Water Hazard and Risk Management (ICHARM) of the Public Works Research Institute
(PWRI), as well as the head of its water-related disaster research group. He also gave
me positive encouragement to start this research and continued giving a lot of personal
and professional advice. During my thesis writing, he provided a lot of precious advice
for me to improve the thesis. Without his help, I would not have been able to enrich the
contents of my thesis.
Professor Hori kindly accepted my abrupt request to be an advisor for my research and
thesis, and gave warm and useful advice to improve my thesis. I owe a very important
debt to Professor Hori.
Professor Nakakita and Professor Tachikawa also kindly accepted to be reviewers and
gave useful advice despite their busy schedules, particularly at this time of year nearing
ii
a new fiscal year.
I also would like to express sincere appreciation to all supporters in the Philippines for
data collection on the study of Pampanga River Basin. Dr. Susan R. Espinueva, Mr.
Socrates F. Paat, Ms. Rosalie C. Pagulayan and Ms. Sheila S. Schneider in
Hydro-meteorological Department, and Mr. Hilton T. Hernando in the Pampanga River
Flood Forecasting and Warning Center of the Philippines Atmospheric, Geophysical and
Astronomical Services Administration (PAGASA). Ms. Santy B. Ferrer in the Upper
Pampanga River Integrated Irrigation System of the National Irrigation Administration
(NIA-UPRIIS) also provided a great deal of information on the Pantabangan dam.
In addition, the discussion with Mr. Hisashi Mitsuhashi (presently Ministry of Land,
Infrastructure, Transport and Tourism) and Dr. Rabindra Osti of the Asian Development
Bank at the beginning of this study was very helpful and encouraged me to go on
further with my research.
This research is a result of extraordinary support from many staff members at ICHARM.
First of all, it was Dr. Nario Yasuda, the former deputy director of ICHARM-PWRI and
the head of its water related disaster research group, who just came back from Kyoto
University to PWRI in April 2013 that gave me a supportive push to start this research
when I hesitated. Once my decision was made, he became the biggest help to me. He
assisted me with invaluable advice and information based on his rich experience in
research institutes, as well as practical instructions on doctoral thesis writing. When I
was so occupied with writing the thesis and also other papers, he kindly rearranged
work assignment for me with less work load for the time being. It is no exaggeration to
say that this thesis would not have been completed without his support. I greatly
appreciate everything he has done for me.
I am deeply indebted to many other members of ICHARM. Professor Kuniyoshi
Takeuchi, the director of ICHARM, helped me with this research in many ways. Dr.
Shinji Egashira gave fruitful advice for peer review papers prior to this thesis. Dr.
Mamoru Miyamoto, Dr. Badri Bahkta Shrestha, Dr. Maksym Gusyev, Dr. Youngjoo
Kwak and Dr. Ai Sugiura provided tremendous assistance with a lot of instructions,
suggestions and help for me being less experienced in preparing papers and other
requirements. The discussions and activities with many researchers, such as Mr.
Yoshikazu Shimizu, Mr. Seishi Nabesaka, Mr. Daisuke Kuribayashi, Dr. Atsuhiro

iii
Yorozuya, Dr. Sungeun Lee, Dr. Yoshiki Motonaga and Dr. Tadashi Nakasu (now at the
National Research Institute for Earth Science and Disaster Prevention), gave many hints
to improve the research.
Dr. Masahiko Murase informed me of formalities related to thesis writing. Ms. Mayumi
Tomimura and Ms. Taeko Akimoto were always warm and supportive. This dissertation
would not have been materialized if it were not for the support from the ICHARM staff.
I also thank Mr. Masahiko Okubo for his support of checking and improving my poor
English into an excellent manuscript even though my decision to write in English was a
kind of reckless deed.
Finally, my heartfelt appreciation goes to my wife, Hiromi, my son, Yuya, and my
daughter, Arisa, for always being supportive and encouraging. I am also very thankful to
them for letting me stay at Tsukuba alone, though the home is just a few hours away, to
focus on my research and thesis writing.

iv
v
謝 辞
本研究を遂行するにあたって、多くの方々にお世話になり、学位論文を完成
させることができました。以下に記して、感謝の意を表します。
まず、京都大学防災研究所角哲也教授に心より感謝を申し上げます。角教授
と初めてお会いしたのは私が建設省に入って間もない 20 年以上前で、私がまだ
係長、同じ建設省の先輩としていらっしゃいました。それから幸いにして様々
な場面でご指導いただき、特にお世話になったのは、九頭竜川流域委員会にお
ける足羽川ダムの審議でした。私が本格的に洪水リスクアセスメントに携わっ
たのはこの時が初めてで、角教授からは、公私にわたり大変貴重なご指導、ご
助言を頂きました。今回、角教授には、この研究論文についてのご相談を持ち
かけた際にも快く受け入れていただき、何度も丁寧なるご指導を頂きました。
ここに深く感謝申し上げます。
また、論文の完成に際し、貴重なご意見を賜ると伴に、ご指導頂いた堀智晴
教授、田中茂信教授、中北英一教授および立川康人教授に深く感謝申し上げま
す。特に田中茂信教授におかれては、元土木研究所水災害研究グループ長兼水
災害リスクマネジメント国際センター次長でおられ、私の土木研究所での本研
究のきっかけを頂いたのみならず、様々な公私にわたるアドバイスを頂いてい
たところでした。今回の論文についても懇切丁寧なご指導を頂き、先生のおか
げで内容が充実したことは紛れもない事実と言えます。改めて感謝申し上げま
す。堀教授におかれては、突然のお願いにも係わらず、ご丁寧かつ親切にご指
導いただき、ここに深く感謝申し上げます。また、中北教授および立川教授に
おかれましては大変お忙しい時期に適切なご指導を頂き感謝申し上げます。
また、本研究の中心的事例となっているフィリピン国のパンパンガ川に関連
したデータを収集するにあたり、フィリピンの多くの方々にご支援を頂きまし
た。フィリピン科学技術省天文気象局水文気象部のスーザン・エスピヌエバ博
士、ソクラテス・パット氏、ロザリー・パグラヤン氏、シェイラ・シュナイダ
ー氏、パンパンガ川洪水予警報サブセンターのヒルトン・ヘルナンド氏および
国家灌漑局パンパンガ川上流統合灌漑システム事務所のサンティ・フェレール
氏、その他大勢のご支援いただいたフィリピンの皆様に感謝致します。
本研究の初期の頃にはアジア開発銀行の光橋尚司氏(現国土交通省)とラビン
ドラ・オスティ博士との議論が取り組みに大変役に立ちました。
今回の研究については、土木研究所水災害・リスクマネジメント国際センタ
ー(ICHARM)、水災害研究グループの多くの方々にもお世話になりました。
前水災害研究グループ長兼 ICHARM 次長の安田成夫博士には、京都大学防災
vi
研究所から土木研究所に戻られて、それまでためらっていた私の背中を明確に
押していただき、論文としての取りまとめに全面的なバックアップを頂きまし
た。ご自分の研究所での豊富な経験、学位論文での経験を手取り足取りご教示
いただき、さらには論文取りまとめの佳境に入っている時期には仕事の配分ま
でご配慮いただきました。安田博士のご支援無くしてはこの研究論文の取りま
とめは現実のものにならなかったといっても過言ではないと思っております。
ここに深く感謝申し上げます。
ICHARM センター長竹内邦良博士からは様々な形でご支援を頂きました。ま
た、研究・研修監の江頭進治博士におかれましては個別査読論文についてアド
バイスを頂き、博士論文提出の足がかりづくりにご支援頂きました。その他の
多くの ICHARM の研究者に助けられました。特に宮本守博士、バドリ・シュレ
スタ博士、マクシム・グスエフ博士、郭栄珠博士、杉浦愛博士には、まだ研究
者としての経験が浅い私に論文作成にあたって多くの支援を頂きました。他に
も、清水孝一氏、鍋坂誠志氏、栗林大輔氏、萬矢敦啓博士、李商恩博士、本永
良樹博士、中須正博士(現防災科研)などの研究者の皆様との議論から、この
研究論文のヒントに繋がっていったものでした。
さらには、工学博士取得の直近の先輩として細々した手続などを教えていた
だいた村瀬勝彦博士、いつも暖かく見守ってくれ、細かなサポートをしてくれ
た冨村真由美氏および穐本多恵子氏、その他多くの ICHARM 職員の皆様に厚く
御礼を申し上げます。
なんといっても、この稚拙な英語力の私が英語での論文作成に挑戦する暴挙
に走ったにも係わらず、見事な英語に仕上げてくれた大久保雅彦氏の協力には
言葉に言い尽くせないほどの感謝の気持で一杯です。
最後に近郊の単身赴任であるにも係わらず自宅に帰らず本論文の執筆に集中
する時間を与えてくれ、その期間中終始暖かく支えてくれた家族である、妻洋
美、長男雄也、長女有沙に心から感謝の意を表します。
vii
Executive Summary
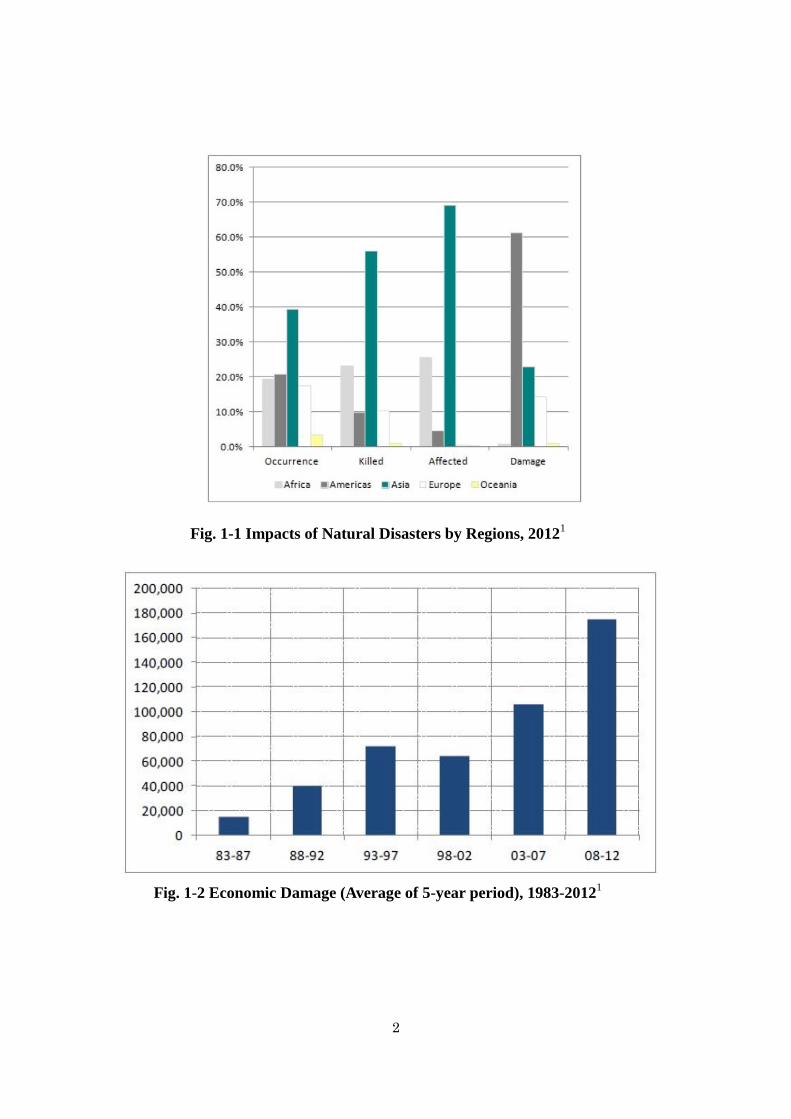
In 2012, 328 natural disasters occurred in the world, leaving 10,783 killed and 104
million affected and causing US$142 billion damage. Of those disasters, 129 (40%)
disasters claimed 6,032 fatalities (55.9%), 72 million affected people (69.2%) and
caused US$32 billion (23.0%) damage in Asia alone. Although efforts are being made
to reduce disaster risk, fatalities and economic damage by natural disasters are still
markedly high. Obviously, it is due to rapid population growth, urbanization and
globalization of economy. Especially, the impact of natural disasters causes serious
damage to many aspects of societies in Asia.
Recently, hot discussions are being made on mainstreaming of disaster risk reduction in
relation to post Millennium Development Goals and post Hyogo Framework for Actions
in United Nations. Mainstreaming of disaster risk reduction links to pre-disaster
measures. Flood risk assessment is a necessary activity to identify appropriate risk
reduction measures in terms of flood disasters.
Flood-prone countries, such as Japan, have been working hard to enhance flood risk
assessment by establishing legal status and developing detailed methodological
guidelines. However, developing countries are still not paying close attention to this
field. Comparison studies on flood risk assessment between Japan and developing
countries are cited for basic understanding of the present global situation of flood risk
assessment.
Even Japan has had extremely severe experiences, for example, when Rikuzentakata,
along with other coastal cities, was hit by the Great East Japan Earthquake and Tsunami
in 2011. Similarly, the 2011 Chao Phraya River flood in Thailand caused serious
damage to industrial parks, which immediately impacted the world economy. In both
cases, if appropriate risk assessment had been implemented and results had been
disseminated prior to disasters, damage would have been mitigated. Field interview
survey results clearly shows that such damage is attributable to lack of risk assessment.
Since developing countries are particularly vulnerable to natural disasters and will be
affected seriously by climate change in the near future, the author decided that the target
should be developing countries for better understanding the present status of flood risk
assessment. However, uncertainty is highly problematic in the process of flood risk
viii
assessment especially in developing countries. This study estimated the degree of
uncertainty contained in each step, and identified influential steps of flood risk
assessment by reviewing the entire risk assessment process in a developing country and
referred the results with past studies addressing the same issue in developed countries.
The results show clear difference between both cases in data and information
unavailability. Three major points were identified from this study: 1) Uncertainty can
greatly influence the quality and availability of data and information; 2) Data
unavailability in some developing countries is a serious problem. Especially, collection
of damage loss data is an urgent matter; and 3) Uncertainty is also linked to model
calculation. Scientists and engineers should have adequate understanding of objectives
and expected results during the process of risk assessment.
The propagation of uncertainty from each independent step was also explained and the
possibility of convergence of uncertainty from each step was found. Furthermore,
another potential location of uncertainty was also discussed. The study conducted on
uncertainty in flood risk assessment as a holistic mechanism in a poor data situation in a
developing country is unique and challenging, since no similar study has conducted
before.
Conventional procedures to review data and check records are the most fundamental
and important actions. In addition, utilizing satellite information and additional
cross-checking processes can be useful. However, it is urgent for developing countries,
as well as developed countries, to start collecting disaster data extensively. Then,
accuracy needed for flood risk assessment can be easily assured with assistance of
technology.
At the end, the author would like to stress the necessity of enhancement of effective data
collection and analysis, as well as the improvement of the entire flood risk assessment
methodology. Furthermore, a lot of problems still remain unsolved for ideal
water-related risk management.
Finally, the author hopes that this thesis will be utilized to encourage discussions and
strengthen research towards further mainstreaming of disaster risk reduction locally and
internationally, especially for developing countries to promote sustainable development.
ix
概 要
2012年は、世界で 328の自然災害が発生し、10,783人が死亡し、1億 4百万人、
1千 4百億ドルの影響を及ぼした。その災害のうち 129(40%)、6,032人(55.9%)
の死者、7千 2百万人(69.2%)への影響、320億ドル(23.0%)の被害がアジアだ
けで生じている。災害リスク低減への努力は行われてきているものの、自然災
害による死者や経済影響はいまだ大きい。明らかにこれは急激な人口増加、都
市化の進展、経済のグローバル化に寄るところが大きい。特に自然災害の影響
はアジアの多くの側面に深刻な被害を生じることとなる。
最近、災害リスク低減の主流化という熱い議論が国連の次期ミレニアム開発目
標や兵庫行動枠組に関連して行われている。災害リスク低減の主流化とは、災
害前の事前対策と関係が深い。洪水リスクアセスメントというのは洪水災害に
関する適切なリスク低減方策を特定する欠かせない取り組みである。
日本のような洪水頻発国では、法的な整備、詳細な手法、ガイドラインの策定
などに洪水リスクアセスメントを強化する取り組みを行ってきている。しかし
ながら、途上国ではまだこの分野に対しては十分な取り組みが行われていると
は言えない。洪水リスクアセスメントについての日本での取り組み、途上国で
の取り組みを、現状の世界の洪水リスクアセスメントの基本的理解のために紹
介している。
日本ですら、かなりひどい経験をしてきている。例えば、陸前高田市と海岸線
の市町村が 2011 年の東日本大震災と津波では被災している。同様に 2011 年のタ
イのチャオプラヤ川洪水では世界経済へ直ちに影響を及ぼすほど工業団地が深
刻な被害を受けた。両方のケースにおいて、適切にリスクアセスメントが行わ
れ、その結果が災害前に適切に周知されていれば、被害ももっと低減できたも
のと思われる。現地でのインタビュー調査結果はリスクアセスメントの欠如が
このような被害の原因であると明確にいえることがわかっている。
途上国は特に自然災害に対して脆弱で近い将来の気候変動による影響は深刻に
うけるものと思われるので、著者は途上国に的を絞り、洪水リスクアセスメン
トの現状をよりよく理解することが必要との認識に至った。しかしながら、特
に途上国においては、洪水リスクアセスメントの各段階における不確実性とい
うのはかなり大きな問題である。この研究は不確実性の程度を各段階において
x
評価して、先進国で行った他の研究事例の結果を参考として、途上国での全体
の洪水リスクアセスメント評価によって、最も影響が大きい段階はどこかを特
定する。結果は明確にデータと各種情報の存在状況によって明確に異なってい
る。主に 3 点がこの研究から明らかになった。1)不確実性はデータ、情報の質と
存在状況により大きく影響を受ける。2)いくつかの途上国におけるデータの不存
在状況は深刻なものがある。特に被害データの収集は喫緊の課題である。3)不確
実性はまた計算モデルにも関係している。科学者、技術者はリスクアセスの各
段階において目的とどのような結果が求められているかを十分に理解した上で
取組む必要がある。
それぞれ独立した検討段階からの不確実性の伝搬が説明でき、それぞれの段階
での不確実性の縮小の可能性があることがわかった。さらに、今回の検討以外
にも不確実性が生じる可能性があると言われている。途上国におけるデータ存
在が厳しい中での洪水リスクアセスメントの各段階による不確実性についての
研究は、他ではない非常に珍しく、困難であるが興味深い取り組みである。
データを精査して、記録をチェックするという従来型の方法は最も基礎的で重
要な手法である。さらに、衛星情報や複数データの照合検査の役に立つ。しか
しながら、途上国では、先進国も同じであるが、災害のデータを精力的に収集
し始めることが喫緊に取組まねばならない。洪水リスクアセスメントに必要な
精度は技術の支援で簡単に得られることができることになる。
最後に、著者は有効なデータの収集と解析を強化することの重要性を、洪水リ
スクアセスメント手法全体のさらなる改善と同じように強調したい。さらに、
理想的な水災害関連リスクマネジメントに向けてはまだかなり多くの課題が残
されていることを強調したい。
おわりに、この論文が、特に持続可能な開発を促進させなければならない途上
国を始めとする、災害リスク低減主流化についての地域的および世界的なさら
なる議論の活発化と研究の強化に活用されることを願ってやまない。
xi
Abbreviations
ADB - Asian Development Bank
ADRC - Asia Disaster Reduction Center
AMCDRR - Asian Ministerial Conference on Disaster Risk Reduction
ASEAN - Association of South-East Asian Nations
BAS - Bureau of Agricultural Statistics
BOI - Board of Investment
BTOP - Block-wise TOP model
CRED - Centre for Research on the Epidemiology of Disasters
CV - Coefficient of Variance
DALA - Damage and Loss Assessment
DDPM - Department of Disaster Prevention and Mitigation, Thailand
DEM - Digital Elevation Model
DRR - Disaster Risk Reduction
EGM - Expert Group Meeting (on Improving Disaster Data to Build
Resilience in Asia and the Pacific)
EM-DAT - International Disaster Database
FID - Flood Inundation Depth model developed by ICHARM
FMMP - Flood Management and Mitigation Programme
FVI - Flood Vulnerability Indices developed by ICHARM
FVI-AF - Flood Vulnerability Indices for Average Flood
FVI-EF - Flood Vulnerability Indices for Extreme Flood
GAR15 - Global Assessment Report 2015
GCM - Global Circulation Model
GDP - Gross Domestic Product
GEJET - Great East Japan Earthquake and Tsunami
GFDRR - Global Facility for Disaster Reduction and Recovery, World Bank
GIS - Geographic Information System
GISTDA - Geo-Informatics and Space Technology Development Agency
GUM - Guide to the expression of uncertainty in measurement
HDD - Hard Disk Drive
HFA - Hyogo Framework for Action
HydroSHED - Hydrological data and maps based on SHuttle Elevation Derivatives
at multiple Scales
IATF - Inter-Agency Task Force on Disaster Reduction
xii
ICHARM - International Centre for Water Hazard and Risk Management
IEAT - Industrial Estate Authority of Thailand
IFAS - Integrated Flood Analysis System
IFRC - International Federation of Red Cross and Red Crescent Societies
IKONOS - IKONOS comes from the Greek word for "image"
IMF - International Monetary Fund
JAXA - Japan Aerospace Exploration Agency
JCC - Japanese Chamber of Commerce
JCGM - Joint Committee for Guides in Metrology
JETRO - Japan External Trade Organization
JICA - Japan International Cooperation Agency
JMA - Japan Meteorological Agency
JSCE - Japan Society of Civil Engineers
MDGs - Millennium Development Goals
MDRR - Mainstreaming of Disaster Risk Reduction
METI - Ministry of Economy, Trade and Industry, Japan
MEXT - Ministry of Education, Culture, Sports, Science and Technology,
Japan
MIKE - hydrologic software developed by Danish Hydraulic Institute
MLIT - Ministry of Land, Infrastructure, Transport and Tourism, Japan
MMC/NIBS - Multi-hazard Mitigation Council of the National Institute of Building
Sciences
MOC - Ministry of Construction (former MLIT)
MODIS - Moderate Resolution Imaging Spectrometer
MRC - Mekong River Commission
MRCS - Mekong River Commission Secretariat
NASA - National Aeronautics and Space Administration
NESDB - National Economic and Social Development Board, Thailand
NILIM - National Institute for Land and Infrastructure Management, Japan
PAGASA - Philippines Atmospheric, Geophysical and Astronomical Services
Administration
PDNA - Post Disaster Needs Assessment
post-MDGs - reformation of Millennium Development Goals
post-HFA/HFA2 - reformation of Hyogo Framework for Action
PRISM - Pico-satellite for Remote-sensing and Innovative Space Mission
PWRI - Public Works Research Institute
xiii
REM - Relative Elevation Model
RID - Royal Irrigation Department of Thailand
RRI - Rainfall-Runoff-Inundation model
SAR - Synthetic Aperture Radar
SD - Standard Deviation
SMART - specific, measureable, attainable, realistic and timely
SOP - Standard Operation Procedure for Policy Evaluation
SRTM - Shuttle Radar Topography Mission
TA - Technical Assistance
THB - Thai Baht
TTJS - The 2011 Tohoku Earthquake Tsunami Joint Survey Group
UN - United Nations
UNESCAP - United Nations Economic and Social Committee in Asia and Pacific
UNISDR - United Nations International Strategy for Disaster Reduction
UNSGAB - United Nations Secretary- Generals’ Advisory Board
UN Water - United Nations Inter-Agency Mechanism on all Freshwater
WB - World Bank
WCDRR - World Conference on Disaster Risk Reduction
WMCDRT - the World Ministerial Conference on Disaster Reduction in Tohoku

xiv
xv
Table of Contents
Chapter 1 .......................................................................................................................... 1
Introduction ..................................................................................................................... 1
1.1 Background ··························································································· 1
1.2 History of “Mainstreaming of Disaster Risk Reduction” ··································· 4
1.3 The International Recognition on the Importance of Water Related Disaster
Risk Assessment ······················································································ 6
1.4 Aims and Scope ······················································································ 8
1.5 Outline of the Thesis ················································································ 9
Chapter 2 ........................................................................................................................ 15
Flood Risk Assessment and its Status Quo .................................................................. 15
2.1 Introduction ·························································································· 15
2.2 Flood Risk Assessment ············································································· 15
2.2.1 Definition of Flood Risk Assessment ................................................................... 16
2.2.2 Procedure of Flood Risk Assessment .................................................................. 16
2.2.3 Difficulty of Flood Risk Assessment .................................................................... 17
2.3 Flood Risk Assessment in Japan ································································· 21
2.3.1 Introduction ....................................................................................................... 21
2.3.2 History of Policy Evaluation ............................................................................... 21
2.3.3 Evaluation System for Public Works in Ministry of Land, Infrastructure,
Transport and Tourism ...................................................................................... 22
2.3.4 Basic Policy for River Improvement and River Improvement Plan .................... 26
2.3.5 Flood Risk Assessment Methodology in the Manual for Flood Control and
Economic Investigation ...................................................................................... 28
2.3.6 Conclusion of the Current Situation of Japan..................................................... 33
2.4 Flood Risk Assessment in the Developing Countries ········································ 34
2.4.1 Difficulties on Flood Risk Assessment in Developing Countries .......................... 34
2.4.2 Study on Comprehensive Flood Management Plan for the Chao Phraya River
Basin Conducted by JICA .................................................................................. 34
2.4.3 Flood Risk Assessment in Cambodian Flood Plain ............................................. 38
2.4.4 Comparison between Flood Risk Assessment in Developing Countries and Japan56
2.5 Conclusions ·························································································· 58
xvi
Chapter 3 ........................................................................................................................ 65
Lack of Risk Assessment before Disasters ................................................................... 65
3.1 Introduction ·························································································· 65
3.2 Lack of Preparedness in the 2011 Chao Phraya River Floods ···························· 66
3.2.1 Hydrological Situation ....................................................................................... 66
3.2.2 Reported Flood Damage ..................................................................................... 70
3.2.3 Overview of Economic Damage .......................................................................... 75
3.2.4 Outline of Field Survey ...................................................................................... 81
3.2.5 Economic Damage Identified in this Survey ....................................................... 81
3.2.6 Historical Background of Settlement of Japanese Companies ............................ 84
3.2.7 Types of Chain-Reaction Economic Damage and Countermeasures ................... 85
3.2.8 Conclusion for Chao Phraya Flood and Damage ................................................ 86
3.3 Lack of Preparedness Made Serious Damage in Rikuzentakata City Hit by the
GEJET ································································································ 88
3.3.1 Outline of Damage by GEJET ............................................................................ 88
3.3.2 Survey Method ................................................................................................... 88
3.3.3 Methodology of Interview Survey in Rikuzentakata City ................................... 91
3.3.4 Urban Development in Rikuzentakata City ........................................................ 92
3.3.5 Conclusion for the Rikuzentakata City Damage ................................................. 95
3.4 Conclusion ···························································································· 95
Chapter 4 ...................................................................................................................... 101
Uncertainty Estimation in the Process of Flood Risk Assessment .......................... 101
4.1 Introduction ························································································ 101
4.1.1 Necessity of study on uncertainty ..................................................................... 101
4.1.2 Uncertainty Estimation .................................................................................... 102
4.1.3 The Process of Uncertainty Estimation ............................................................. 102
4.2 Previous Study····················································································· 103
4.2.1 Purposes ........................................................................................................... 103
4.2.2 Study area ........................................................................................................ 103
4.2.3 Data and information ....................................................................................... 103
4.2.4 Result of analysis .............................................................................................. 107
4.3 Case Study ························································································· 111
4.3.1 Study Area ....................................................................................................... 111
4.3.2 Problems in Observation Data and Validation .................................................. 114
4.3.3 Problems in Flood Reproduction Calculation ................................................... 128
xvii
4.3.4 Problems in Risk Estimation ............................................................................ 132
4.3.5 Influence Items in Uncertainty Estimation ....................................................... 139
4.3.6 Propagation of Uncertainty .............................................................................. 141
4.4 Conclusions ························································································ 142
Chapter 5 ...................................................................................................................... 149
Possible Technologies for Convergence of Uncertainty in Flood Risk
Assessment ..................................................................................................... 149
5.1 Introduction ························································································ 149
5.2 Convergence of Uncertainty ···································································· 150
5.2.1 Hazard Observation Method ............................................................................ 153
5.2.2 Hazard Simulation Method .............................................................................. 155
5.2.3 Damage Estimation Depth Method ................................................................... 160
5.3 Discussion on Limitation and Target of Uncertainty ······································ 162
5.3.1 Limitation of Uncertainty ................................................................................. 162
5.3.2 User’s Perspectives ........................................................................................... 162
5.3.3 Possible Proposal to Reduce Problems .............................................................. 164
5.4 Conclusion ·························································································· 168
Chapter 6 ...................................................................................................................... 171
Overall Conclusions and the Way Forward .............................................................. 171
6.1 Conclusions and Remaining Problems ······················································· 171
6.2 Proposal for Next and Future Challenges ··················································· 173

xviii
xix
Table of Figures
Fig. 1-1 Impacts of Natural Disasters by Regions, 2012 --------------------------------------- 2
Fig. 1-2 Economic Damage (Average of 5-year period) -------------------------------------- 2
Fig. 1-3 Structure and flow chart of the thesis ------------------------------------------------- 11
Fig. 2-1 Procedure of the flood risk assessment ----------------------------------------------- 19
Fig. 2-2 Time frame of evaluation of public works project------------------------------------- 25
Fig. 2-3 Schematic position of flood risk assessment in policy evaluation system-------- 25
Fig. 2-4 Example of flood risk assessment calculated for Kuzuryugawa river--------------- 27
Fig. 2-5 Framework for Basic Policy for River Improvement and River Improvement Plan ------ 27
Fig. 2-6 Procedures of flood risk assessment in the Manual------------------------------------ 30
Fig. 2-7 Location map of Chao Phraya River Basin---------------------------------------------- 37
Fig. 2-8 Result from household field survey in Chao Phraya study---------------------------- 37
Fig. 2-9 Study are (Kompong Cham and Prey Veng, Cambodia) ------------------------------ 39
Fig. 2-10 Procedure of the study-------------------------------------------------------------------- 42
Fig. 2-11 Similarity between river water level and flood level in flood plain---------------- 42
Fig. 2-12 Applying flood hydrographs to each band in the study area such as
a) Division of floodplain by band, b) Interpolation of neighboring hydrographs,
c) Hydrographs for each band ----------------------------------------------------------- 43
Fig. 2-13 Expanding river water level to flood plain level in each band---------------------- 44
Fig. 2-14 Rice cropping distribution----------------------------------------------------------------46
Fig. 2-15 Standard cropping pattern of wet season rice----------------------------------------- 46
Fig. 2-16 Relative damage curves for paddies---------------------------------------------------- 48
Fig. 2-17 Number of days inundation depth over 0.5m during rice period-------------------- 48
Fig. 2-18 Maximum inundation depth map in 2006 (Average year) in study area----------- 50
Fig. 2-19 Agricultural damage map in 2006 (Average year) in study area-------------------- 50
Fig. 2-20 Representation value of a grid----------------------------------------------------------- 52
Fig. 2-21 SD of the maximum inundation depth during rice growing period----------------- 52
Fig. 2-22 Field survey points and their photos---------------------------------------------------- 53
Fig. 2-23 SD of the maximum inundation depth during rice growing period
overlaid on agricultural land use map ------------------------------------------------------- 53
Fig. 2-24 SD of the maximum inundation depth during rice growing period
overlaid on population density distribution and major roads---------------------------- 55
Fig. 3-1 Location map of Chao Phraya River Basin---------------------------------------------- 68
Fig. 3-2 Basin mean monthly rainfall of Chao Phraya River Basin---------------------------- 68
Fig. 3-3 Hydrographs at Nakhon Sawan----------------------------------------------------------- 69
xx
Fig 3-4 Temporal changes of flood inundation areas during the 2011 flood------------------ 69
Fig. 3-5 Impact to adjacent countries in Automobile product----------------------------------- 79
Fig. 3-6 Economic impact by two disasters-------------------------------------------------- 79
Fig. 3-7 Impact to other adjacent countries in HDD import------------------------------------- 80
Fig. 3-8 Impact to workforce movement---------------------------------------------------------- 80
Fig. 3-9 Affected industrial estate and parks (within a dotted line) --------------------------- 83
Fig. 3-10 Categories of chain-reaction economic damage-------------------------------------- 87
Fig. 3-11 The 2011 Tohoku Earthquake Tsunami Joint Survey (TTJS) Group--------------- 90
Fig. 3-12 Location of Rikuzentakata city---------------------------------------------------------- 90
Fig. 3-13 Change of Takata area in Rikuzentakata city (A) 1952, (B) 1968------------------ 94
Fig. 4-1 Map of the River Rhine, its catchment and location of study area Cologne------- 105
Fig. 4-2 Flood time series at gauge Cologne/Rhine: Historical and systematic water level
observations; Systematic discharge observations, annual maximum flood 1846-2004 ------106
Fig. 4-3 Results of inundation estimation by two models-------------------------------------- 108
Fig. 4-4 Risk curve and uncertainty bounds------------------------------------------------------ 108
Fig. 4-5 Relative contribution of the three modules to the total maximum uncertainty range---- 110
Fig. 4-6 Case study area of the Pampanga River Basin with water level observation
station, dams and flood retention basin (Candaba swamp) --------------------------- 112
Fig. 4-7 Present seventeen observation stations in Pampanga river basin------------------- 113
Fig. 4-8 Rainfall stations’ data availability in Pampanga River Basin ----------------------- 118
Fig. 4-9 Observation stations in Pampanga river basin A 12 stations, B 5 stations------------------119
Fig. 4-10 Comparison among four different rainfall datasets---------------------------------- 120
Fig. 4-11 River discharge estimated with the original (circles) and revised (squares) H-Q
curve at the Arayat station-----------------------------------------------------------------124
Fig. 4-12 Comparison between original and revised discharge------------------------------- 124
Fig. 4-13 Change of cross section at Arayat station-------------------------------------------- 125
Fig. 4-14 Continuity of river discharge in Pampanga River----------------------------------- 126
Fig. 4-15 Change of H-Q curve based on field observation----------------------------------- 127
Fig. 4-16 Schematic mechanism of IFAS flood runoff model--------------------------------- 130
Fig. 4-17 Schematic mechanism of BTOP runoff model----------------------------------------130
Fig. 4-18 The calculated by IFAS and BTOP models and observed flood river
discharge at San Isidro station------------------------------------------------------------- 131
Fig. 4-19 Crop damage curves at vegetative, reproductive, maturity
and ripening stages of palay (rice) ------------------------------------------------------- 134
Fig. 4-20 RRI model explanation------------------------------------------------------------------ 136
Fig. 4-21 Maximum A and minimum B estimate agricultural damages for 2011 flood---- 137
xxi
Fig. 4-22 Maximum A and minimum B estimate agricultural damages for similar
magnitude of flood------------------------------------------------------------------------- 138
Fig. 4-23 Schematic relation of uncertainty propagation---------------------------------------144
Fig. 5-1 Convergence of uncertainty-------------------------------------------------------------- 152
Fig. 5-2 Identification of inundation area and depth in the Cambodia plain
from satellite information------------------------------------------------------------------ 154
Fig. 5-3 Schematic difference between MIKE series and RRI model------------------------ 157
Fig. 5-4 Flood Inundation Depth model---------------------------------------------------------- 159
Fig. 5-5 House damage calculation in Cambodian flood plain study------------------------- 161
Fig. 5-6 Flood vulnerability indices of agricultural damages (A) for average flood,
FVI-AF, (B) for extreme flood, FVI-EF------------------------------------------------- 167
List of Tables
Table 2-1 Comparison of the number of rainfall observation stations in four basins --------------- 19
Table 2-2 Category of stock damage reduction by flood in the Manual ------------------- 32
Table 2-3 Flood water depth and damage ratio of house in the Manual ---------------------- 32
Table 2-4 Comparison between Japan and other cases in typical items of flood risk assessment - 57
Table 3-1 Inundation areas of past floods --------------------------------------------------------- 73
Table 3-2 Flood damage ----------------------------------------------------------------------------- 73
Table 3-3 Summary of damage and losses by sector (in million THB) ----------------------- 74
Table 3-4 Assessment by ADB of the flood impact by sector ---------------------------------- 74
Table 3-5 Thai GDP growth ratio (compared to the previous year’s same quarters) -------- 76
Table 3-6 Impact on automobile production in adjacent countries ---------------------------- 76
Table 4-1 Disaster damage and data availability ----------------------------------------------- 117
Table 4-2 Result of variance runoff calculation --------------------------------------------- 131
Table 4-3 Crop damage calculation manual, Bureau of Agriculture Statistics -------------- 134
Table 4-4 Agricultural damage calculated and reported by 2011 flood ---------------------- 136
Table 4-5 Major location of potential uncertainties -------------------------------------------- 140
Table 5-1 Some differences between MIKE series and RRI model -------------------------- 157

xxii
1
Chapter 1
Introduction
1.1 Background
According to Natural Disaster Data Book 20121 of Asia Disaster Reduction Center
(ADRC), 328 natural disasters occurred in the world in 2012, leaving 10,783 killed and
104 million affected and causing US$142 billion damage. Of them, 129 (40%) disasters
claimed a total of 6,032 fatalities (55.9%), 72 million affected people (69.2%) and
caused US$32 billion (23.0%) damage in Asia (Fig. 1-1). These figures are higher than
those of any other regions in the world except for the economic damage recorded in the
United States of America, which was caused mainly by hurricanes and storms. Although
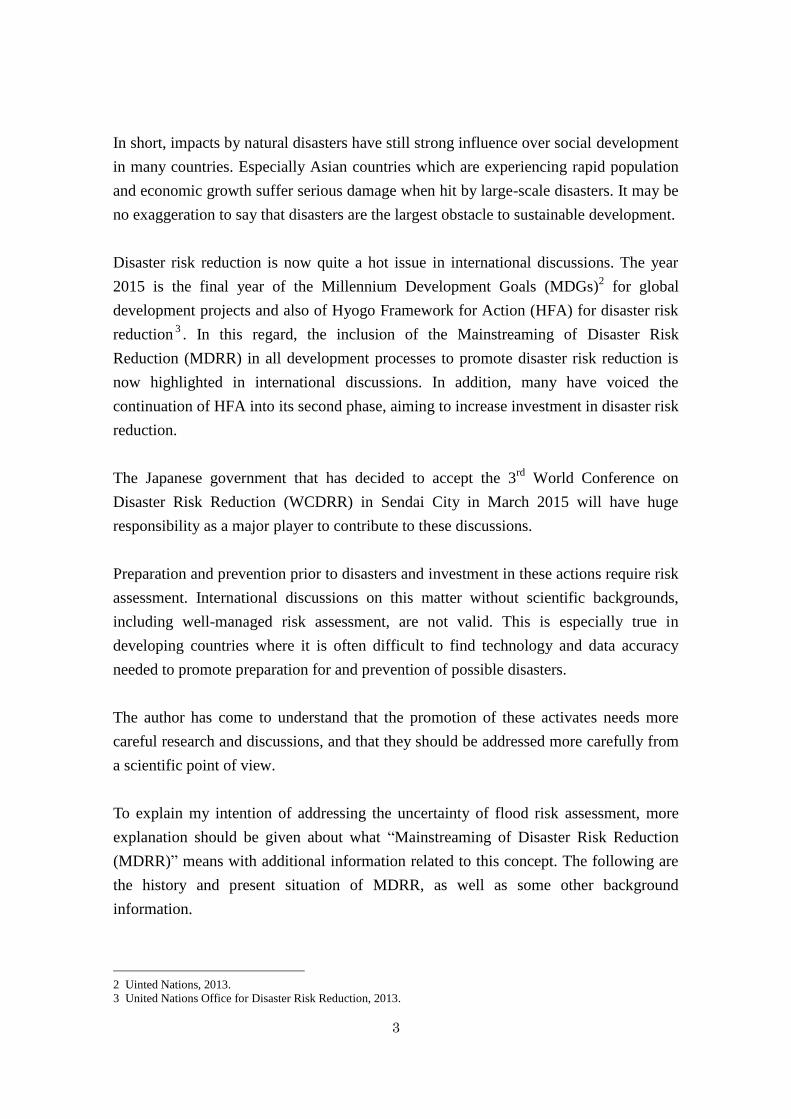
the number of natural disasters is declining from the 1980s, more than 300 natural
disasters occur worldwide every year. The number of fatalities varies from disaster to
disaster, but the 5-year average fatality has been increasing recently. Similarly, the
5-year average economic damage by natural disasters is now clearly maintaining an
upward trend (Fig. 1-2). Fatalities and economic damage by natural disasters are
obviously due to rapid population growth, urbanization and globalization of economy.
Especially, the impact of natural disasters causes serious damage in several aspects of
societies in Asia.
1 Asia disaster reduction center, 2012.
2
Fig. 1-1 Impacts of Natural Disasters by Regions, 20121
Fig. 1-2 Economic Damage (Average of 5-year period), 1983-20121
3
In short, impacts by natural disasters have still strong influence over social development
in many countries. Especially Asian countries which are experiencing rapid population
and economic growth suffer serious damage when hit by large-scale disasters. It may be
no exaggeration to say that disasters are the largest obstacle to sustainable development.
Disaster risk reduction is now quite a hot issue in international discussions. The year
2015 is the final year of the Millennium Development Goals (MDGs)2 for global
development projects and also of Hyogo Framework for Action (HFA) for disaster risk
reduction3. In this regard, the inclusion of the Mainstreaming of Disaster Risk
Reduction (MDRR) in all development processes to promote disaster risk reduction is
now highlighted in international discussions. In addition, many have voiced the
continuation of HFA into its second phase, aiming to increase investment in disaster risk
reduction.
The Japanese government that has decided to accept the 3rd
World Conference on
Disaster Risk Reduction (WCDRR) in Sendai City in March 2015 will have huge
responsibility as a major player to contribute to these discussions.
Preparation and prevention prior to disasters and investment in these actions require risk
assessment. International discussions on this matter without scientific backgrounds,
including well-managed risk assessment, are not valid. This is especially true in
developing countries where it is often difficult to find technology and data accuracy
needed to promote preparation for and prevention of possible disasters.
The author has come to understand that the promotion of these activates needs more
careful research and discussions, and that they should be addressed more carefully from
a scientific point of view.
To explain my intention of addressing the uncertainty of flood risk assessment, more
explanation should be given about what “Mainstreaming of Disaster Risk Reduction
(MDRR)” means with additional information related to this concept. The following are
the history and present situation of MDRR, as well as some other background
information.
2 Uinted Nations, 2013.
3 United Nations Office for Disaster Risk Reduction, 2013.
4
1.2 History of “Mainstreaming of Disaster Risk Reduction”
Recently, the phrase “Mainstreaming of Disaster Risk Reduction” (MDRR) can be seen
and heard in many documents and occasions in the field of disaster management. It first
appeared in a document of the Inter-Agency Task Force on Disaster Reduction (IATF),
which has been discussing the tasks of United Nations International Strategy for
Disaster Reduction (UNISDR). The chairperson’s opening remarks4 at the first meeting
of IATF in 2000 introduced the four goals of the meeting: 1) Increase public awareness
of the risk of natural disasters; 2) Obtain commitments from public authorities to reduce
risks; 3) Engage public participation to create disaster-resistant communities; and 4)
Reduce the economic and social losses of disasters. Although the “mainstreaming” issue
was not included in these four goals, the report of this meeting5 later listed the priority
future works, which included “Mainstreaming disaster reduction in sustainable
development and in national planning.” Then, this work also defined as one of the major
tasks in UNISDR, and since then it has frequently seen in international documents.
At the same time, the project of ProVention Consortium was established in February
2000 with support from the World Bank, declaring MDRR as one of its major activities.
What does MDRR mean? The publication of ProVention6 introduced the definition of
MDRR as “there has been increasing recognition of this need to ‘mainstream’ disaster
risk reduction into development – that is, to consider and address risks emanating from
natural hazards in medium-term strategic frameworks and institutional structures, in
country and sectorial strategies and policies and in the design of individual projects in
hazard-prone countries. A number of development organizations have begun efforts to
mainstream disaster risk reduction into their work, undertaking various related
institutional, policy and procedural changes and adjusting operational practice.”
The activities and the acronym spread around the world at once because of this project
and other activities which had been advocating MDRR.
Furthermore, the World Ministerial Conference on Disaster Reduction in Tohoku
(WMCDRT), 2012, which the Japanese government organized, also emphasized the
importance of MDRR. At the chapter of “Towards Mainstreaming Disaster Reduction”
4 Ms. Carolyn McAskie, 2000.
5 Inter-Agency Task Force for Disaster Reduction, 2000.
6 Charlotte Benson et al., 2007.
5
in the declaration of WMCDRT7, the following sentences are found; a) The participants
underscored the need to mainstream disaster reduction at every level of public policy by
prioritizing it, b) allocating sufficient financial resources to it. c) the central
responsibility of governments and the importance of ensuring the national ownership of
disaster reduction, and d) they also affirmed important roles borne by regional and
international organizations. Furthermore, at the following paragraphs, the good
preparation at the planning stage was also emphasized as follows, “prioritization should
be made in the planning of preparedness in order to effectively allocate limited human
and financial resources for responding to such threats.”
In line with discussions on MDRR, the major discussion is under way about the
reformation of Millennium Development Goals (post MDGs), for the present MDGs
will be due and terminated in 2015. Water-related meetings are also discussing how to
prepare for this new MDGs, and a recommendation that disaster targets should be
incorporated into post-MDGs has prepared by these water-related meetings, e.g.,
thematic session on water and disaster in New York in March 20138, the High Level
Expert and Leaders Panel on Water and Disaster in Japan in June 2013, and Budapest
conference in October 20139. The UN Water, a collaborative group among water related
UN organizations10
, is also preparing a recommendation to emphasize the importance of
tackling issues regarding water related disasters11
.
Major activities on disaster risk reduction are also under way to prepare a post Hyogo
Framework for Action (post-HFA) by 2015 based on the present HFA. The first round of
international consultation was completed in May 2013, and the second round has been
conducting for the key areas based on the first round consultation as follows: 1)
Building community resilience – turning vulnerability into resilience; 2) Sustainable
development, climate change and disaster risk reduction integration; 3) Local level
action; 4) Women as a force in resilience building, gender equity in Disaster Risk
Reduction (DRR); 5) Reducing exposure/underlying risk factors, 6) Strengthening risk
governance and accountability; and 7) Incentivizing DRR in the private sector12
. The
players of the Asia regional consultation has been selected as coordinators in each key
area, and the interested groups has been contributing to each key area in consultation
7 Chair’s Summary, 2012. 8 United Nations Secretary-Generals’ Advisory Board on Water and Sanitation, 2013.
9 Budapest Water Summit, 2013.
10 UN Water, 2013.
11 T. Inoue, 2013.
12 United Nations International Strategy for Disaster Risk Reduction Asia and Pacific, 2013.
6
with the key area coordinators. These contributions will be summarized into
recommendations and submitted to the 6th
Asia Ministerial Conference on Disaster Risk
Reduction (AMCDRR), which will be an important milestone of the second
consultation.
In parallel, UNISDR headquarters is also working on each specific topic. The Global
Assessment Report 2015 (GAR15) shows important activities to collect scientific
contributions and prepare the main report for describing the present situation in terms of
scientific views on disaster risk reduction. The author with colleagues at the
International Centre for Water Hazard and Risk Management (ICHARM) in Public
Works Research Institute (PWRI) is now in preparation for both Asian consultation and
GAR15 for the development of Global Flood and Drought Risk Indices, which are
SMART (specific, measurable, attainable, realistic and timely) indicators with
scientifically reliable background.
The decision has been made by the Japanese government to host the 3rd
WCDRR in
Sendai City in March 2015, following the first conference in Yokohama in 1995 and the
second conference in Kobe in 2005. The Official announcement of this decision was
made at the closing ceremony of the Global Platform in Geneva in June 2013 by the
parliamentary secretary for disaster risk reduction. It will be delivered to the General
Assembly of the United Nations soon, and should be officially approved in the meeting.
The decision came from Japan’s responsibility to contribute Japanese technology on
disaster risk reduction to the international society as the consequence of severe
experiences with several disasters, especially the Great East Japan Earthquake in 2011.
1.3 The International Recognition on the Importance of Water Related Disaster
Risk Assessment
There is another important discussion on MDRR, which is the importance of
preparedness prior to disasters and investment in disaster risk reduction.
At the 2nd
WCDRR in Kobe and the following period after that, forecasting and warning
were major issues, and investment from most donors was spent for those issues because
of the 2004 Indian Ocean Tsunami disaster. Forecasting and warning are important to
reduce fatalities by disasters, but cannot reduce economic damage. The international
society have now come to the common understanding on disaster risk reduction that
7
disaster prevention and investment prior to disasters should be prioritized for
sustainable development of developing countries13
.
The ProVention publication introduces the following explanation:
Disaster risk reduction pays
A Vietnam Red Cross mangrove planting programme implemented in eight
provinces in Vietnam to provide protection to coastal inhabitants from typhoons
and storms cost an average US$ 0.13 million a year over the period 1994 to 2001,
but reduced the annual cost of dyke maintenance by US$ 7.1m. The programme
also helped save lives, protect livelihoods and generate livelihood opportunities.14
Spending 1 per cent of a structure’s value on vulnerability reduction measures can
reduce probable maximum loss from hurricanes by around a third in the Caribbean,
according to regional civil engineering experts.15
One dollar spent by FEMA on hazard mitigation generates an estimated US$ 4 on
average in future benefits according to a study of FEMA grants (including for
retrofitting, structural mitigation projects, public awareness and education and
building codes).16
Only two schools were left standing in Grenada after the passage of Hurricane
Ivan (September 2004). Both had been subject to retrofit through a World Bank
initiative. One of the schools was used to house displaced persons after the event.17
Although some information should be reviewed for its quantification background,
disaster risk reduction prior to disasters is now recognized as an important action in
international discussions with justifications of the cost required for disaster risk
reduction.
Furthermore, at the 4th
AMCDRR held in Incheon in October 201018
, the emphasis of
preparedness and increase of investment was discussed and added to its declaration as
follows:
“On promoting investments on DRR & CCA: to build capacities to track DRR
investments, evaluate financial and economic costs and benefits of DRR to promote
greater investments in reducing disasters in the region, promote comprehensive
13 K. Takeya et al., 2013.
14 International Federation of Red Cross and Red Crescent Societies, 2002.
15 World Bank, 2000. 16 Multihazard Mitigation Council of the National Institute of Building Sciences, 2005. 17 World Bank, 2004.
18 Fourth Asia Ministerial Conference on Disaster Risk Reduction, 2010.
8
preparedness planning to mitigate the impacts of disasters, advocate the international
donor community to increase its funding support for regional and national activities for
DRR and HFA implementation, and apportion at least 10 percent of humanitarian
assistance and 2 percent of development investment resources and funding for DRR by
2015”.
In short, the importance of preparedness and prevention before disasters is widely
recognized in line with MDRR, and risk assessment, the major process of pre-disaster
measures, is also increasingly becoming mandatory. Furthermore, the technology of risk
assessment needs improving, because accuracy of methodology is essential in
appropriate risk assessment.
Research on technology of risk assessment, especially research on uncertainty, should
be also improved and encouraged in keeping up with this political movement.
1.4 Aims and Scope
As described earlier, the international society has recognized that the importance of
disaster prevention and investment prior to disasters. It must be urgently necessary to
enhance disaster risk assessment as a technology to identify pre-disaster measures based
on the needs of individual societies. On the other hand, there are still some problems to
implement disaster risk assessment due to lack of data and information related to
disasters in developing countries. In order to disseminate pre-disaster measures,
problems need to be solved and risk assessment needs to be made easier to apply so that
it can be used as a useful tool for disaster prevention by more decision makers.
In this thesis, the following items are described to provide better understanding of flood
risk assessment and show appropriate directions to take by reviewing recent discussions
in the international society on disaster risk reduction, identifying the needs of individual
societies, understanding the present situation of disaster risk assessment, identifying
present problems to implement disaster risk assessment, making proposals for
improvement, and proposing future research topics as conclusions.
The thesis aims to identify the direction of improvement of disaster risk assessment, and
it targeted at “flood” disasters, which are still the major natural hazard to the world.
More specifically, it highlights uncertainties during the process of flood risk assessment
9
and problems related to uncertainty found in the process of flood risk assessment in
developing countries. It also addresses ways to reduce uncertainty contained in results.
The thesis is considered as the first challenge to tackle the issue of uncertainty reduction
in disaster risk assessment, although previous research has been done to identify
uncertainty on flood risk assessment in developed counties. This research will help
especially developing countries to enhance and accelerate flood risk reduction for
building communities resilient to natural disasters.
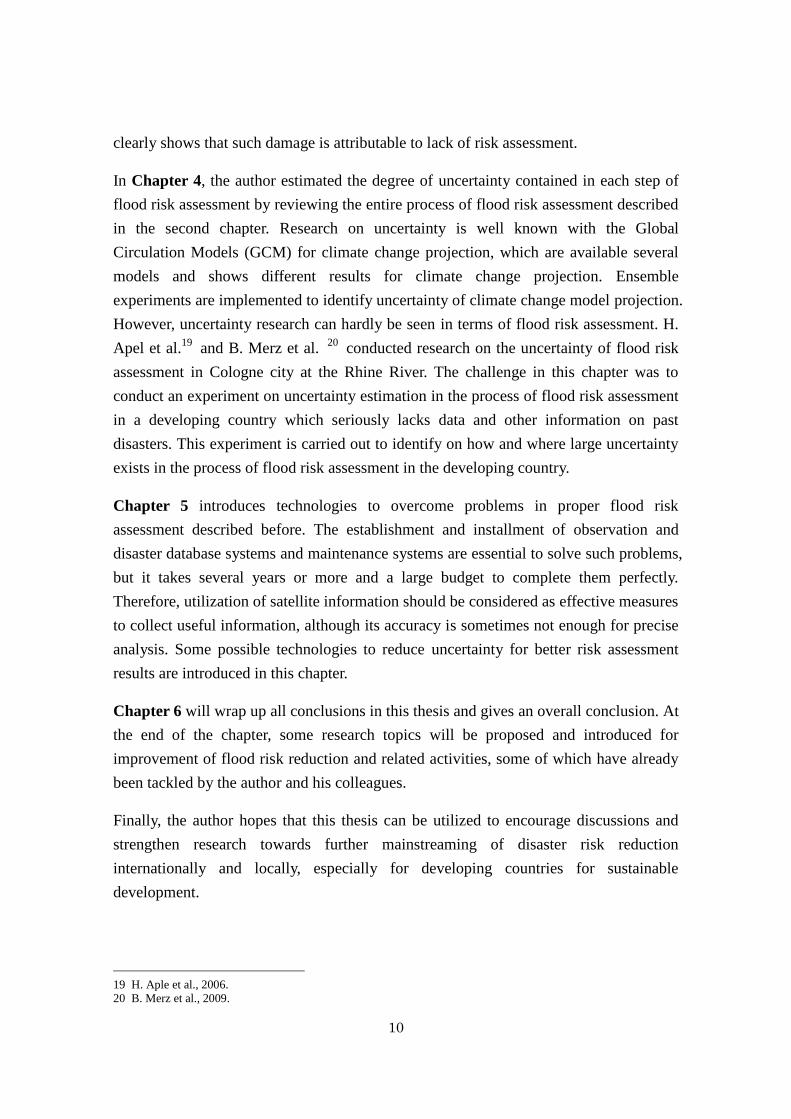
1.5 Outline of the Thesis
This thesis is composed of six chapters, including this chapter, to help better understand
the present situation of disaster risk reduction and limitation of technology and to show
a further direction of research in this area. (Fig.1-3)
The first chapter as an introduction of the thesis introduces the general background on
a recent trend of disaster risk reduction discussion in the world and the author’s
motivation to study flood risk assessment. Especially, the chapter highlights recent hot
discussions on the mainstreaming of disaster risk reduction related to post-MDGs and
post-HFA in United Nations. The mainstreaming of disaster risk reduction links to
pre-disaster measures. Flood risk assessment is a necessary activity to identify
appropriate risk reduction measures in terms of flood disasters.
In Chapter 2, flood risk assessment is introduced with descriptions of its process,
technologies and methodologies. Flood risk assessment in Japan is introduced along
with its legal status and detailed methodological guidelines. Using a Japanese case,
examples of flood risk assessment in developing countries are also introduced.
Comparison studies on flood risk assessment between Japan and developing countries
are cited for basic understanding of the present situation of flood risk assessment.
In Chapter 3, in order to understand the importance of risk assessment, two examples
in recent disasters are introduced; one is the 2011 Chao Phraya River flood in Thailand
and the other is the Rikuzentakata city case hit by the Great East Japan Earthquake and
Tsunami in 2011. In both cases, parts of the countries were seriously damaged by large
disasters. If appropriate risk assessment is implemented and results are disseminated
prior to disasters, damage should be mitigated compared with that in the last disasters.
Field interview survey with affected residents and factories conducted after the disasters
10
clearly shows that such damage is attributable to lack of risk assessment.
In Chapter 4, the author estimated the degree of uncertainty contained in each step of
flood risk assessment by reviewing the entire process of flood risk assessment described
in the second chapter. Research on uncertainty is well known with the Global
Circulation Models (GCM) for climate change projection, which are available several
models and shows different results for climate change projection. Ensemble
experiments are implemented to identify uncertainty of climate change model projection.
However, uncertainty research can hardly be seen in terms of flood risk assessment. H.
Apel et al.19
and B. Merz et al. 20
conducted research on the uncertainty of flood risk
assessment in Cologne city at the Rhine River. The challenge in this chapter was to
conduct an experiment on uncertainty estimation in the process of flood risk assessment
in a developing country which seriously lacks data and other information on past
disasters. This experiment is carried out to identify on how and where large uncertainty
exists in the process of flood risk assessment in the developing country.
Chapter 5 introduces technologies to overcome problems in proper flood risk
assessment described before. The establishment and installment of observation and
disaster database systems and maintenance systems are essential to solve such problems,
but it takes several years or more and a large budget to complete them perfectly.
Therefore, utilization of satellite information should be considered as effective measures
to collect useful information, although its accuracy is sometimes not enough for precise
analysis. Some possible technologies to reduce uncertainty for better risk assessment
results are introduced in this chapter.
Chapter 6 will wrap up all conclusions in this thesis and gives an overall conclusion. At
the end of the chapter, some research topics will be proposed and introduced for
improvement of flood risk reduction and related activities, some of which have already
been tackled by the author and his colleagues.
Finally, the author hopes that this thesis can be utilized to encourage discussions and
strengthen research towards further mainstreaming of disaster risk reduction
internationally and locally, especially for developing countries for sustainable
development.
19 H. Aple et al., 2006.
20 B. Merz et al., 2009.
11
Fig. 1-3 Structure and flow chart of the thesis
12
References
1. Asia disaster reduction center (ADRC), Natural Disaster Data Book 2012.
2. United Nations, We can End Poverty - Millennium Development Goals and Beyond 2015-,
access at 2013. http://www.un.org/millenniumgoals/
3. The United Nations Office for Disaster Risk Reduction, Hyogo Framework for Action (HFA),
access at 2013. http://www.unisdr.org/we/coordinate/hfa
4. Ms. Carolyn McAskie, Introductory Statement by the Chair, Emergency Relief Coordinator, a.i.,
Inter-Agency task Force for Disaster Reduction, Geneva, 27-28 April 2000.
5. Inter-Agency task Force for Disaster Reduction First meeting, Summary Record and
Conclusions, Geneva, 27-28 April 2000.
6. Charlotte Benson and John Twigg with Tiziana Rossetto, Tools for Mainstreaming Disaster
Risk Reduction: Guidance Notes for Development Organizations, ProVention consortium,
January 2007.
7. The World Ministerial Conference on Disaster Reduction in Tohoku, Chair’s Summary,
Tohoku, July 3rd and 4th, 2012.
8. United Nations Secretary-Generals’ Advisory Board on Water and Sanitation (UNSGAB),
Focus action on Water and Disasters, access at 2013.
http://www.unsgab.org/index.php?menu=227
9. Budapest Water Summit – Giver the future a chance! – 8-11 October 2013, access at 2013.
http://www.budapestwatersummit.hu/
10. UN Water, This is UN-Water, access at 2013. http://www.unwater.org/discover.html
11. T. Inoue, International Framework for Mainstreaming Disaster Reduction, Magazine River
(Kasen), July 2013 (in Japanese).
12. UNISDR Asia and Pacific, distributed paper “Call for Expressions of Interest, Inputs for Post
2015 Framework for DRR (HFA2) from the Asia Pacific Region”, September 2013. http://www.unisdr-apps.net/confluence/display/iap09/IAP+Meeting+Home
13. K. Takeya and M. Nagaishi, JICA’s Approach Toward Mainstreaming Disaster Risk
Management, Magazine River (Kasen), July 2013 (in Japanese).
14. International Federation of Red Cross and Red Crescent Societies (IFRC), World Disasters
Report: Focus on reducing risk, Geneva: International Federation of Red Cross and Red
Crescent Societies, 2002.
13
15. World Bank. Managing Catastrophic Risks Using Alternative Risk Financing and Insurance
Pooling Mechanisms. Discussion draft. Washington, DC: World Bank, Finance, Private Sector
and Infrastructure Department, Caribbean Country Management Unit, Latin America and
Caribbean Region, 2000.
16. Multihazard Mitigation Council of the National Institute of Building Sciences (MMC/NIBS),
Natural Hazard Mitigation Saves: An Independent Study to Assess the Future Savings from
Mitigation Activities. Washington, DC: Multi-hazard Mitigation Council of the National
Institute of Building Sciences, 2005.
17. World Bank. Grenada, Hurricane Ivan: Preliminary Assessment of Damages, September 17,
2004. Washington, DC: World Bank, 2004.
http://siteresources.worldbank.org/INTDISMGMT/Resources/grenada_assessment.pdf
18. Fourth Asia Ministerial Conference on Disaster Risk Reduction, Incheon Declaration on
Disaster Risk Reduction in Asia and the Pacific 2010, Incheon, Republic of Korea, 25-28
October 2010.
19. H. Apel, A. H. Thieken, B. Merz, and G. Blöschl, “A probabilistic modeling system for
assessing flood risks”, Natural Hazards (2006) 38: 79-100; DOI: 10.1007/s1069-005-8603-7,
2006.
20. B. Merz and A. H. Thieken, “Flood risk curves and uncertainty bounds”, Natural Hazards, 51, 3,
437-458; DOI:10.1007/s11069-009-9452-6, 2009.

14
15
Chapter 2
Flood Risk Assessment and its Status Quo
2.1 Introduction
In this chapter, flood risk assessment is described with its all steps, technologies and
methodologies. Flood risk assessment in Japan is introduced as an example with its
legal status and detailed methodological guidelines. Using a Japanese case, examples of
flood risk assessment in developing countries are also introduced. Comparison studies
on flood risk assessment between Japan and developing countries are carried out for
basic understanding of the present situation of flood risk assessment.
Through this chapter, discussion is made about the importance of flood risk assessment
as pre-disaster activities to identify necessary actions for flood risk reduction and to
clarify present problems on flood risk assessment, especially the issue of uncertainty in
each risk assessment step. When flood risk assessment is conducted in developing
countries, problems related to uncertainty often emerge. The chapter is devoted to
explain the current situation of flood risk assessment to help understand it better.
2.2 Flood Risk Assessment
This chapter describes the definition, status and procedure of flood risk assessment in
Japan. Following a Japanese case, other cases in developing countries are introduced for
basic understanding of flood risk assessment.
Flood risk assessment can be improved at several levels. At the preliminary level, it is
important to have good understanding of past disasters. Such understanding leads to
good preparedness for future disasters. The next level is improvement of statistical
technology. Better technology can produce better projection of future disasters. The next
progress is based on scientific technology for reproduction by simulation and
assessment of a hazard of a certain magnitude with probability analysis of past hazard
records. The final level is preparation of countermeasures based on damage assessment
and cost effectiveness assessment.
However, in developing countries, it is very difficult to conduct final level of flood risk
16
assessment because of unavailability of past disaster records including
meteor-hydrological data. The projection of hazards and expected damage is necessary
for damage assessment; without this process, cost benefit analysis and preparing
countermeasures for risk reduction, which is required to make informed decisions,
cannot be made. Lack of data and information causes serious problems for future
development.
After the explanation of a Japanese case, cases of developing countries are introduced.
These case studies can help us better understand the present status of flood risk
assessment for discussing problems.
2.2.1 Definition of Flood Risk Assessment
According to the 2009 UNISDR Terminology on Disaster Risk Reduction1, Risk
assessment is defined as “A methodology to determine the nature and extent of risk by
analysing potential hazards and evaluating existing conditions of vulnerability that
together could potentially harm exposed people, property, services, livelihoods and the
environment on which they depend.” Flood risk assessment is a methodology composed
of flood hazard analysis and vulnerability assessment, and the nature and extent of
damage must be identified from both results. In short, identifying expected damage by a
certain magnitude of a hazard (flood) should be the final result of flood risk assessment.
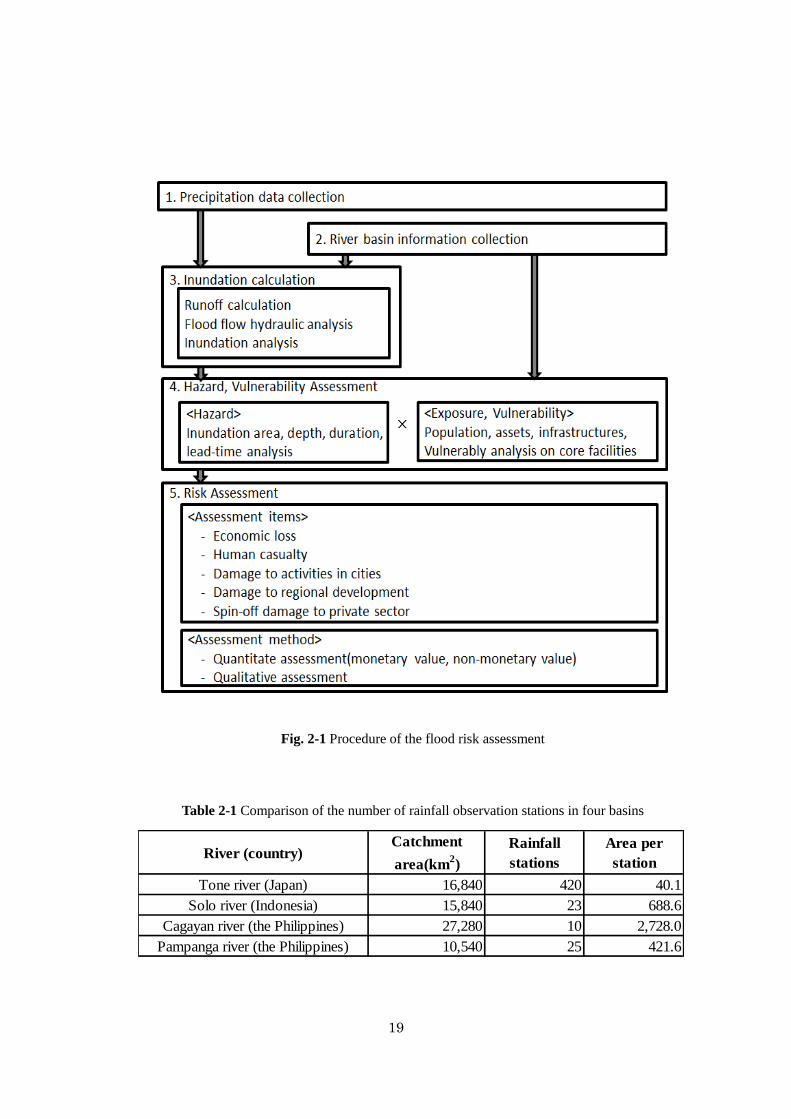
2.2.2 Procedure of Flood Risk Assessment
The investigation volume of the River and Sabo Technical Standard of Japan (June
2012) (hereinafter “the Standard”) describes the protocol of water related disaster risk
assessment (Fig.2-1) in Japan. As explained in Chapter 9 of the Standard, the flood risk
assessment procedure consists of: 1) collecting and arranging precipitation data; 2)
collecting and arranging discharge data; 3) flood discharge and inundation calculation; 4)
hazard and vulnerability investigation; and 5) risk assessment analysis.
In addition to this explanation in the Standard, a hazard is defined as “A dangerous
phenomenon, substance, human activity or condition that may cause loss of life, injury or
other health impacts, property damage, loss of livelihoods and services, social and
economic disruption, or environmental damage”. Its magnitude is explained in the
non-dimensional probability. Vulnerability is defined as “The characteristics and
1 UNISDR, 2009.
17
circumstances of a community, system or asset that make it susceptible to the damaging
effects of a hazard”. It means vulnerability must be explained in terms of human casualty
or economic losses; in other words, the number of fatalities or monetary value. Risk is
defined as “The combination of the probability of an event and its negative
consequences”. It means that risk is expressed as the product of hazard multiplied by
vulnerability; furthermore, risk should be shown in probability and damage.
This relation is explained in the Pressure and Release2 model in the following equations.
(2.1)
The basic structure and framework of flood risk assessment should not be different. In
this thesis, author conducted flood risk assessment following this protocol, estimated
uncertainty in the assessment of precipitation and river discharge data collection and
classification, performed flood reproduction calculation and risk assessment, and
evaluated the amount of total uncertainty on final flood risk assessment results.
2.2.3 Difficulty of Flood Risk Assessment
This thesis reviews the difficulty of two major stages in the process of flood risk
assessment. One is the difficulty during data collection, and the other is during data
analysis. Problems typically lie in data quality and quantity as well as time and cost.
(1) Problems on data quality and quantity
In the second section in Chapter 2 of the Standard, the arrangement of ground
observation stations is described. First, one station should be installed in every single
area which is a part of the total catchment divided into small areas. In each area,
precipitation is considered to be observed evenly. Second, if the catchment cannot be
divided into small areas appropriately, it should be divided into zones of around 50 km2
a piece. Then the station should be installed in each zone. The World Metrological
Organization Guideline3 requires the minimum standard of record is 10-20 km
2 per
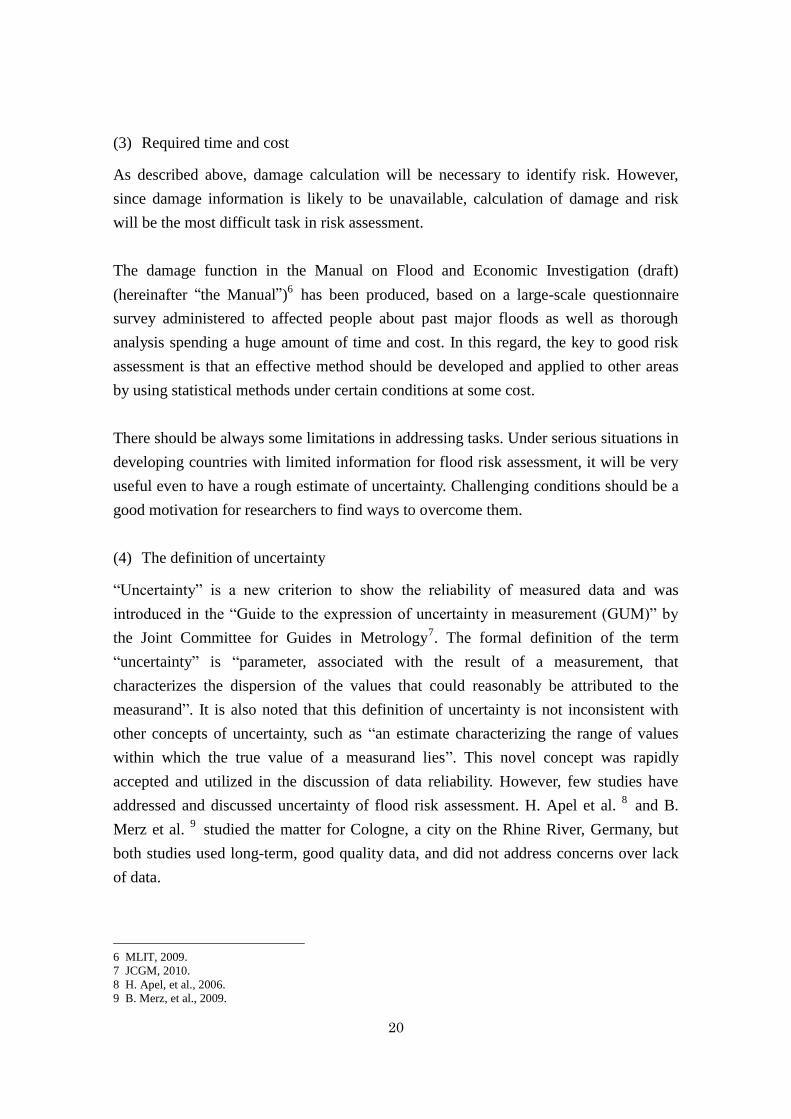
station in an urban area, and 2500 km2 per station in a mountainous area. There is a
great difference in distribution density of installed stations between the Tone river basin
2 B. Wisner, et al., 2004.
3 World Metrological Organization, 2008.
18
in Japan and other river basins in developing countries. (Table 2-1)
In addition, the quality of data also varies. Sometimes, it is difficult to tell which data is
not appropriate, i.e., ground rainfall, satellite rainfall, low discharge, water level or
calculation. It is extremely important to check data with the original record of
observations, cross sections or H-Q rating curves.
Flood inundation simulation results will also be at the mercy of availability of
information on micro-topography and infrastructure for flood regulation. Such
information will influence selection of inundation simulation models.
(2) The status quo of disaster data availability
On the other hand, there is a major obstacle to implementation of disaster risk
assessment. That is disaster data unavailability, especially in developing countries.
The existing major disaster database is International Disaster Database (EM-DAT) by
Centre for Research on the Epidemiology of Disasters (CRED). It is utilized as a major
data source in various reports and analyses, but it has some problems. To enter EM-DAT,
at least one of the following criteria4 must be fulfilled: a) Ten (10) or more people
reported killed; b) Hundred (100) or more people reported affected; c) Declaration of a
state of emergency; and d) Call for international assistance. These criteria make the
database not exhaustive and reliable. To solve this problem in the future, a reliable and
sustainable system of disaster database should be developed in each nation. The disaster
committee and statistic committee in United Nations Economic and Social Committee
in Asia and Pacific (UNESCAP) have discussed the importance of disaster database5,
and it will also be discussed in the General Assembly of UNESCAP.
The results of disaster risk assessment are influenced not only by the methodology of
assessment but also by data availability. The discussion on the emphasis of pre-disaster
countermeasures should be focused on disaster risk reduction, but improvement of
technology and enhancement of disaster data collection should also be tackled together.
4 CRED, access at 2013.
5 EGM on Disaster Data, 2013.
19
Fig. 2-1 Procedure of the flood risk assessment
Table 2-1 Comparison of the number of rainfall observation stations in four basins
River (country)Catchment
area(km2)
Rainfall
stations
Area per
station
Tone river (Japan) 16,840 420 40.1
Solo river (Indonesia) 15,840 23 688.6
Cagayan river (the Philippines) 27,280 10 2,728.0
Pampanga river (the Philippines) 10,540 25 421.6
20
(3) Required time and cost
As described above, damage calculation will be necessary to identify risk. However,
since damage information is likely to be unavailable, calculation of damage and risk
will be the most difficult task in risk assessment.
The damage function in the Manual on Flood and Economic Investigation (draft)
(hereinafter “the Manual”)6 has been produced, based on a large-scale questionnaire
survey administered to affected people about past major floods as well as thorough
analysis spending a huge amount of time and cost. In this regard, the key to good risk
assessment is that an effective method should be developed and applied to other areas
by using statistical methods under certain conditions at some cost.
There should be always some limitations in addressing tasks. Under serious situations in
developing countries with limited information for flood risk assessment, it will be very
useful even to have a rough estimate of uncertainty. Challenging conditions should be a
good motivation for researchers to find ways to overcome them.
(4) The definition of uncertainty
“Uncertainty” is a new criterion to show the reliability of measured data and was
introduced in the “Guide to the expression of uncertainty in measurement (GUM)” by
the Joint Committee for Guides in Metrology7. The formal definition of the term
“uncertainty” is “parameter, associated with the result of a measurement, that
characterizes the dispersion of the values that could reasonably be attributed to the
measurand”. It is also noted that this definition of uncertainty is not inconsistent with
other concepts of uncertainty, such as “an estimate characterizing the range of values
within which the true value of a measurand lies”. This novel concept was rapidly
accepted and utilized in the discussion of data reliability. However, few studies have
addressed and discussed uncertainty of flood risk assessment. H. Apel et al. 8
and B.
Merz et al. 9
studied the matter for Cologne, a city on the Rhine River, Germany, but
both studies used long-term, good quality data, and did not address concerns over lack
of data.
6 MLIT, 2009.
7 JCGM, 2010.
8 H. Apel, et al., 2006.
9 B. Merz, et al., 2009.
21
In this thesis, the author conducted flood risk assessment in a developing country with
careful calibration and validation, while coping with uncertainty contained in observed
data and other information. In the following chapters, the major findings are presented
on: 1) the influence of the poor quality, or missing, data on the flood risk results; 2) the
most influential part of the flood risk assessment process; and 3) data prioritization to
decrease uncertainty when collecting field data.
The author’s findings promote better flood risk assessment in developing countries by
providing more efficient, effective systems and technologies, which eventually leads to
further mitigation of disaster damage.
2.3 Flood Risk Assessment in Japan
2.3.1 Introduction
To understand the significance of flood risk assessment, which is the major theme of
this thesis, it is important to examine how Japan addresses the matter from legal,
technological and methodological aspects. Without good understanding of it, it is
difficult to properly measure the status quo in developing countries. In this regard, this
chapter introduces the background, legal status, technologies and methodologies of
flood risk assessment in Japan.
2.3.2 History of Policy Evaluation
Discussions on policy evaluation started when the final report of the Administrative
Reform Conference was published in December 199710
.
Traditionally, the major task of public administration in Japan has been considered to
create new laws and increase a budget. There have been few sections in the past
governments to review and update policies based on outcomes to meet socio-economic
changes of the time. The conference pointed out this as an unfavorable practice and
made a new recommendation for more thorough, objective reviews on policy strategy
and incorporation of review results into policy formulation.
The conference also proposed that all results and related information should be
disclosed to the public in order to keep fairness and transparency of the policy-making
10 The Administrative Reform Conference, 1997.
22
process.
Responding to this recommendation, a new basic law for central government
reformation was enacted in 1998, and the government of that time started preparation
for systemizing policy evaluation for the first time.
After extensive discussions, the law on policy evaluation conducted by government
agencies was finally established in June 200111
, and each government agency made a
basic plan for implementation of policy evaluation, and policy evaluation finally started
at a full scale. Currently each agency has its own evaluation guidelines for different
project types and conducts pre-event, post-event, and target-based evaluations for their
policies.
2.3.3 Evaluation System for Public Works in Ministry of Land, Infrastructure,
Transport and Tourism
The Ministry of Land, Infrastructure, Transport and Tourism (MLIT) has prepared “the
MLIT Basic Plan for Policy Evaluation”12
. This plan defines three major categories of
evaluation: policy assessment, policy checkup and policy review. In addition, it also
sub-categorizes types of evaluation depending on project types of public works projects,
research and development projects, and regulation and tax policies.
According to the basic plan, evaluation of public works projects is further divided into
three stages: evaluation of a new project at the proposal stage, reevaluation of the
project at the mid-term stage, and final evaluation at the completion stage. Flood risk
assessment plays an essential part in the process of this evaluation system. The most
important occasion for flood risk assessment is the proposal stage, at which a new
project is evaluated to determine whether it should be approved and launched as a flood
risk reduction project (Fig. 2-2). For this purpose, MLIT has devised the standard
operation procedure (SOP) for policy evaluation of new projects at the proposal stage13
.
This SOP is applied to evaluation of new projects for which a draft budget for
construction or preparation of construction is proposed. In the procedure, evaluation of
river and dam projects should be conducted by using the conventional evaluation
system for river improvement plans defined in the River Law (Fig. 2-3).
11 The law on policy evaluation conducted by government agencies, 2001.
12 MLIT, 2002 (revised 2012).
13 MLIT, 2011.
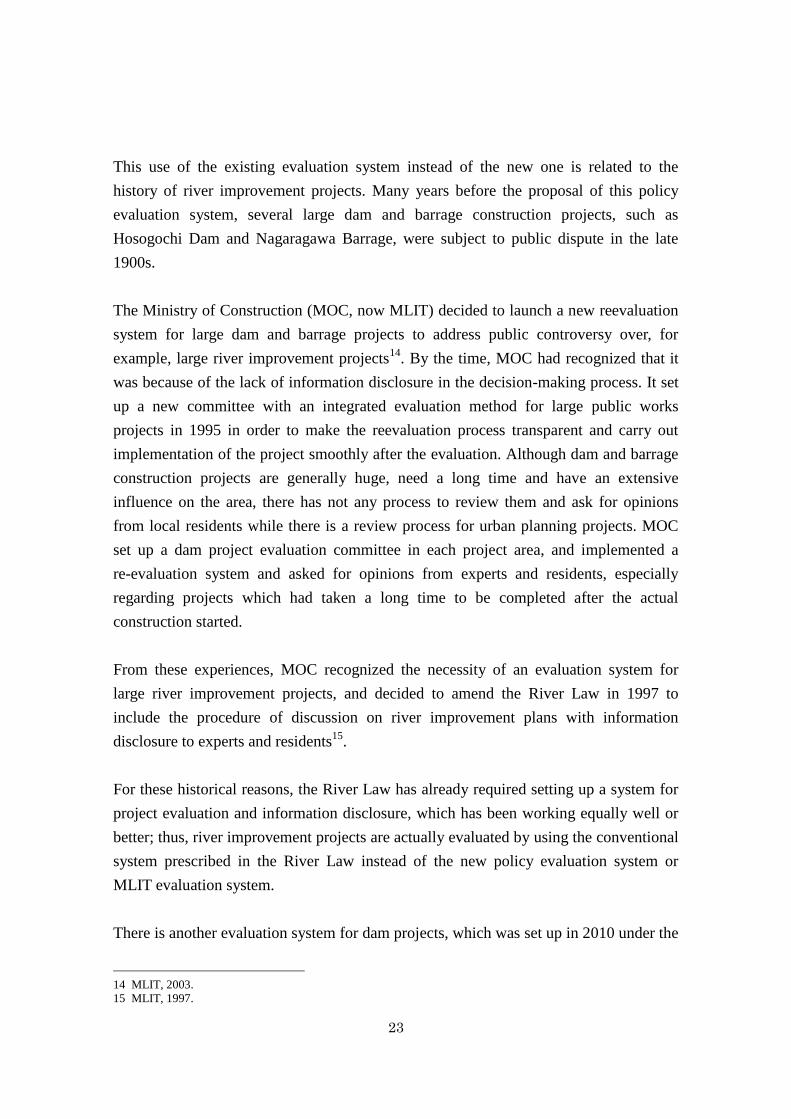
23
This use of the existing evaluation system instead of the new one is related to the
history of river improvement projects. Many years before the proposal of this policy
evaluation system, several large dam and barrage construction projects, such as
Hosogochi Dam and Nagaragawa Barrage, were subject to public dispute in the late
1900s.
The Ministry of Construction (MOC, now MLIT) decided to launch a new reevaluation
system for large dam and barrage projects to address public controversy over, for
example, large river improvement projects14
. By the time, MOC had recognized that it
was because of the lack of information disclosure in the decision-making process. It set
up a new committee with an integrated evaluation method for large public works
projects in 1995 in order to make the reevaluation process transparent and carry out
implementation of the project smoothly after the evaluation. Although dam and barrage
construction projects are generally huge, need a long time and have an extensive
influence on the area, there has not any process to review them and ask for opinions
from local residents while there is a review process for urban planning projects. MOC
set up a dam project evaluation committee in each project area, and implemented a
re-evaluation system and asked for opinions from experts and residents, especially
regarding projects which had taken a long time to be completed after the actual
construction started.
From these experiences, MOC recognized the necessity of an evaluation system for
large river improvement projects, and decided to amend the River Law in 1997 to
include the procedure of discussion on river improvement plans with information
disclosure to experts and residents15
.
For these historical reasons, the River Law has already required setting up a system for
project evaluation and information disclosure, which has been working equally well or
better; thus, river improvement projects are actually evaluated by using the conventional
system prescribed in the River Law instead of the new policy evaluation system or
MLIT evaluation system.
There is another evaluation system for dam projects, which was set up in 2010 under the
14 MLIT, 2003.
15 MLIT, 1997.
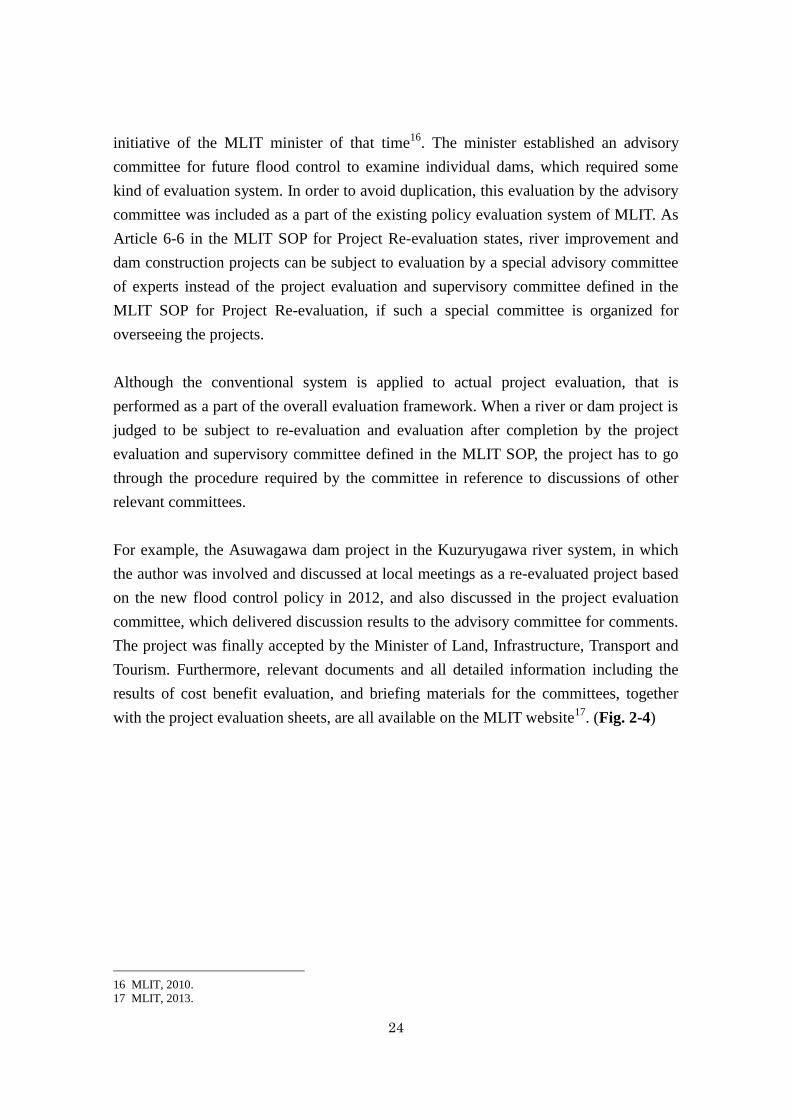
24
initiative of the MLIT minister of that time16
. The minister established an advisory
committee for future flood control to examine individual dams, which required some
kind of evaluation system. In order to avoid duplication, this evaluation by the advisory
committee was included as a part of the existing policy evaluation system of MLIT. As
Article 6-6 in the MLIT SOP for Project Re-evaluation states, river improvement and
dam construction projects can be subject to evaluation by a special advisory committee
of experts instead of the project evaluation and supervisory committee defined in the
MLIT SOP for Project Re-evaluation, if such a special committee is organized for
overseeing the projects.
Although the conventional system is applied to actual project evaluation, that is
performed as a part of the overall evaluation framework. When a river or dam project is
judged to be subject to re-evaluation and evaluation after completion by the project
evaluation and supervisory committee defined in the MLIT SOP, the project has to go
through the procedure required by the committee in reference to discussions of other
relevant committees.
For example, the Asuwagawa dam project in the Kuzuryugawa river system, in which
the author was involved and discussed at local meetings as a re-evaluated project based
on the new flood control policy in 2012, and also discussed in the project evaluation
committee, which delivered discussion results to the advisory committee for comments.
The project was finally accepted by the Minister of Land, Infrastructure, Transport and
Tourism. Furthermore, relevant documents and all detailed information including the
results of cost benefit evaluation, and briefing materials for the committees, together
with the project evaluation sheets, are all available on the MLIT website17
. (Fig. 2-4)
16 MLIT, 2010.
17 MLIT, 2013.
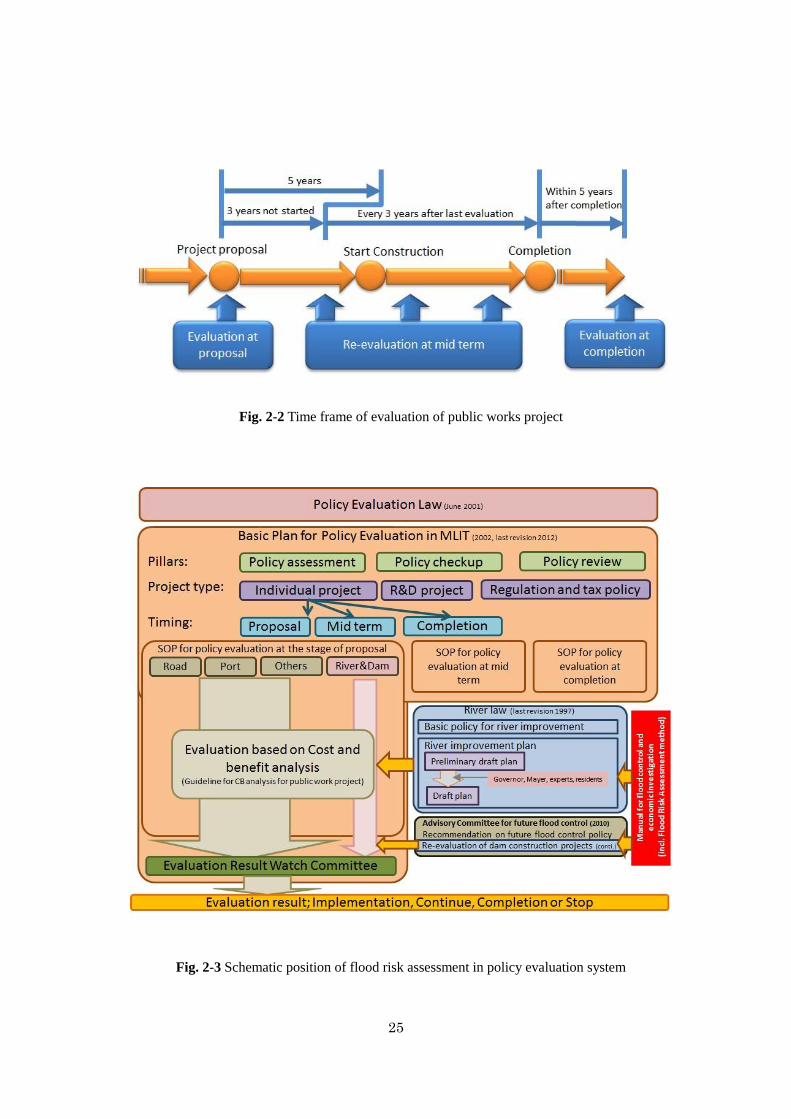
25
Fig. 2-2 Time frame of evaluation of public works project
Fig. 2-3 Schematic position of flood risk assessment in policy evaluation system
26
2.3.4 Basic Policy for River Improvement and River Improvement Plan
The amendment of the River Law in 1997 was made to establish a new river planning
system in order to reflect the recent needs of Japanese people, who hope for rich,
comfortable and high-quality life and prefer the sound environment (Fig. 2-5).
The new river planning system is composed of a basic policy for river improvement
which defines long-term plans for river improvement, and river improvement plans
require practical programs on how to improve rivers over a medium term. A basic policy
for river improvement requires discussions and approval by the National River Advisory
Council and related Governors, and Minister’s approval as long-term policy for its
improvement. River improvement plans require discussions and advice from experts’
group meeting and public hearings with local residents during the process of preparing
the first draft plan. A river basin committee composed of experts and related
municipalities needs to be set up for each river basin and.
Flood risk assessment and cost-benefit analysis are among the most important topics to
be discussed. In addition, information disclosure must be obligatory concerning all
materials used for these official meetings. Anyone can look at such materials at the
MLIT website and public spaces in the local MLIT offices.
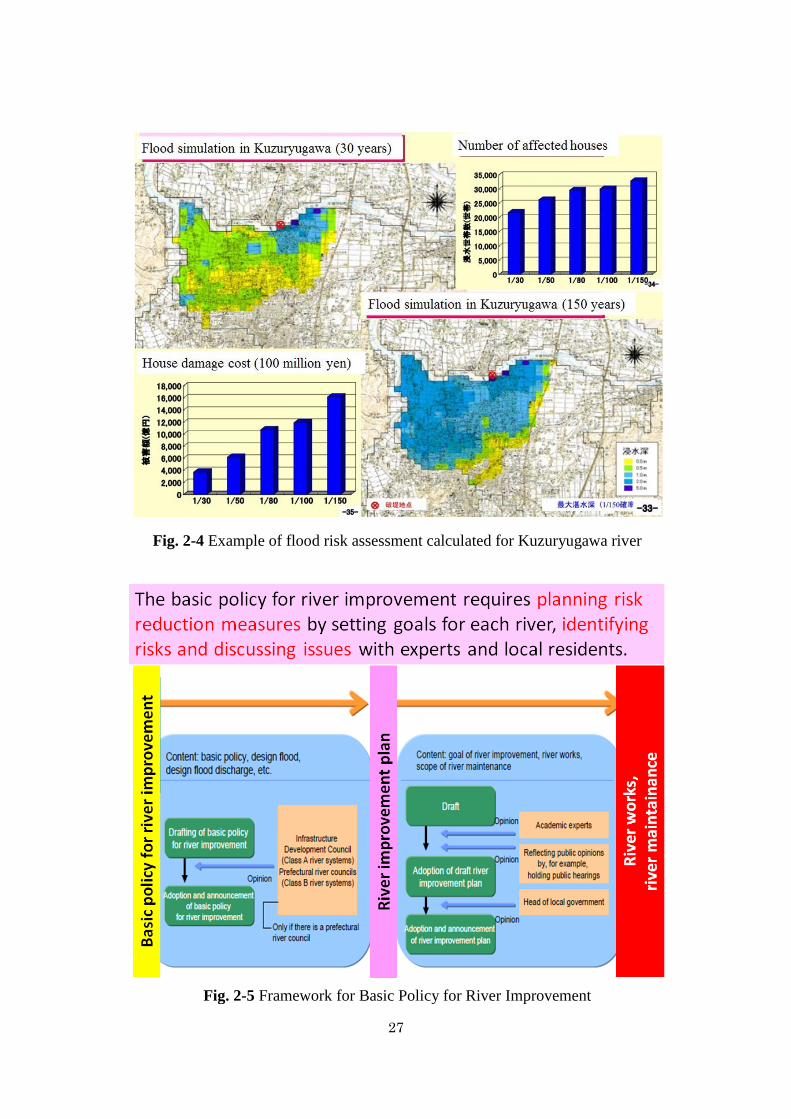
27
Fig. 2-4 Example of flood risk assessment calculated for Kuzuryugawa river
Fig. 2-5 Framework for Basic Policy for River Improvement
and River Improvement Plan
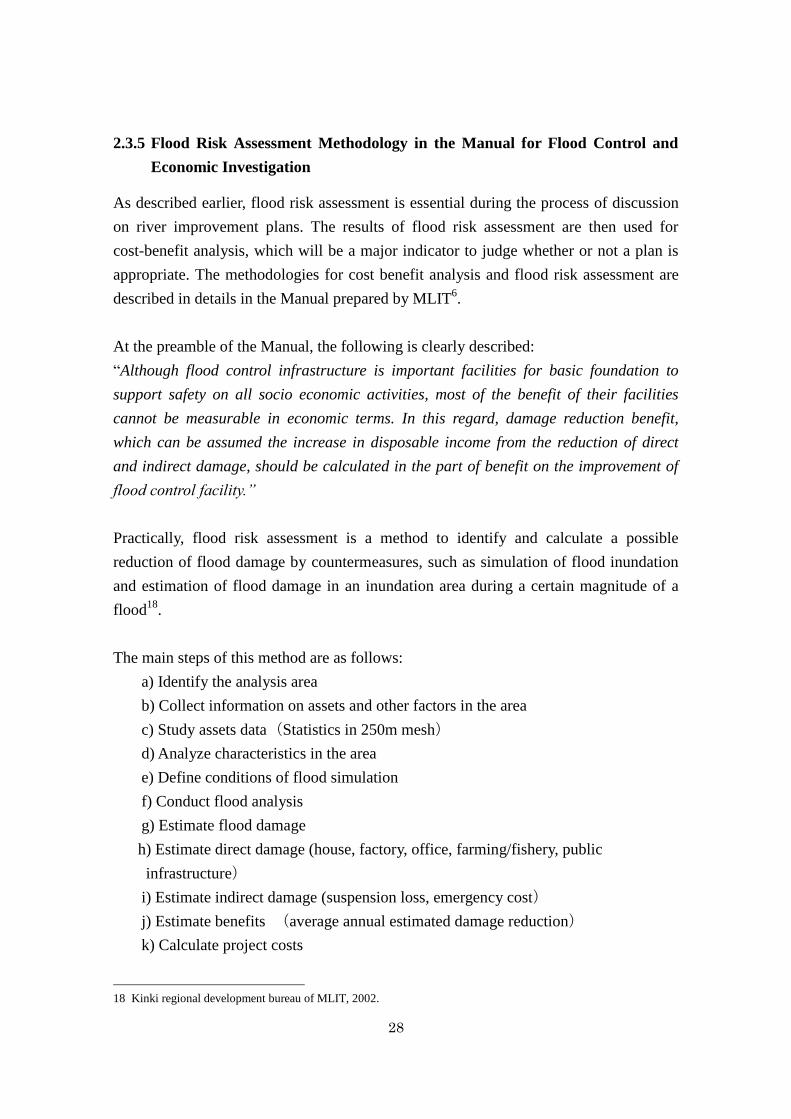
28
2.3.5 Flood Risk Assessment Methodology in the Manual for Flood Control and
Economic Investigation
As described earlier, flood risk assessment is essential during the process of discussion
on river improvement plans. The results of flood risk assessment are then used for
cost-benefit analysis, which will be a major indicator to judge whether or not a plan is
appropriate. The methodologies for cost benefit analysis and flood risk assessment are
described in details in the Manual prepared by MLIT6.
At the preamble of the Manual, the following is clearly described:
“Although flood control infrastructure is important facilities for basic foundation to
support safety on all socio economic activities, most of the benefit of their facilities
cannot be measurable in economic terms. In this regard, damage reduction benefit,
which can be assumed the increase in disposable income from the reduction of direct
and indirect damage, should be calculated in the part of benefit on the improvement of
flood control facility.”
Practically, flood risk assessment is a method to identify and calculate a possible
reduction of flood damage by countermeasures, such as simulation of flood inundation
and estimation of flood damage in an inundation area during a certain magnitude of a
flood18
.
The main steps of this method are as follows:
a) Identify the analysis area
b) Collect information on assets and other factors in the area
c) Study assets data(Statistics in 250m mesh)
d) Analyze characteristics in the area
e) Define conditions of flood simulation
f) Conduct flood analysis
g) Estimate flood damage
h) Estimate direct damage (house, factory, office, farming/fishery, public
infrastructure)
i) Estimate indirect damage (suspension loss, emergency cost)
j) Estimate benefits (average annual estimated damage reduction)
k) Calculate project costs
18 Kinki regional development bureau of MLIT, 2002.
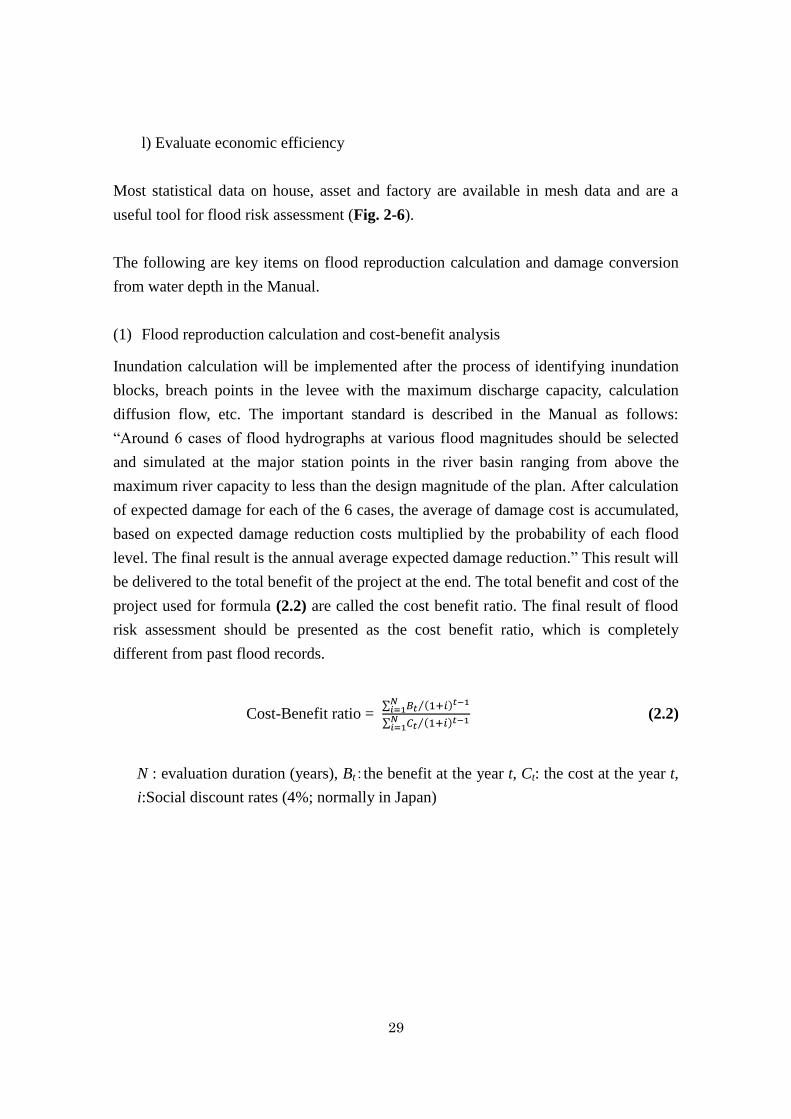
29
l) Evaluate economic efficiency
Most statistical data on house, asset and factory are available in mesh data and are a
useful tool for flood risk assessment (Fig. 2-6).
The following are key items on flood reproduction calculation and damage conversion
from water depth in the Manual.
(1) Flood reproduction calculation and cost-benefit analysis
Inundation calculation will be implemented after the process of identifying inundation
blocks, breach points in the levee with the maximum discharge capacity, calculation
diffusion flow, etc. The important standard is described in the Manual as follows:
“Around 6 cases of flood hydrographs at various flood magnitudes should be selected
and simulated at the major station points in the river basin ranging from above the
maximum river capacity to less than the design magnitude of the plan. After calculation
of expected damage for each of the 6 cases, the average of damage cost is accumulated,
based on expected damage reduction costs multiplied by the probability of each flood
level. The final result is the annual average expected damage reduction.” This result will
be delivered to the total benefit of the project at the end. The total benefit and cost of the
project used for formula (2.2) are called the cost benefit ratio. The final result of flood
risk assessment should be presented as the cost benefit ratio, which is completely
different from past flood records.
Cost-Benefit ratio =
(2.2)
N : evaluation duration (years), Bt:the benefit at the year t, Ct: the cost at the year t,
i:Social discount rates (4%; normally in Japan)
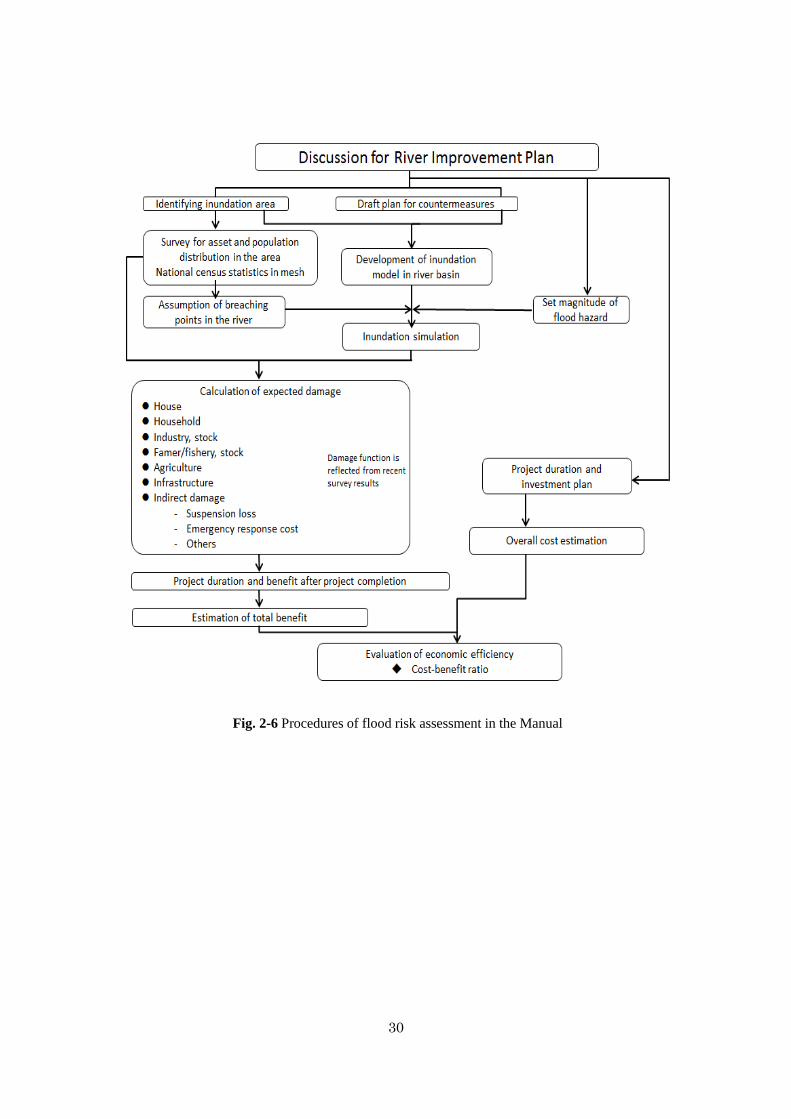
30
Fig. 2-6 Procedures of flood risk assessment in the Manual
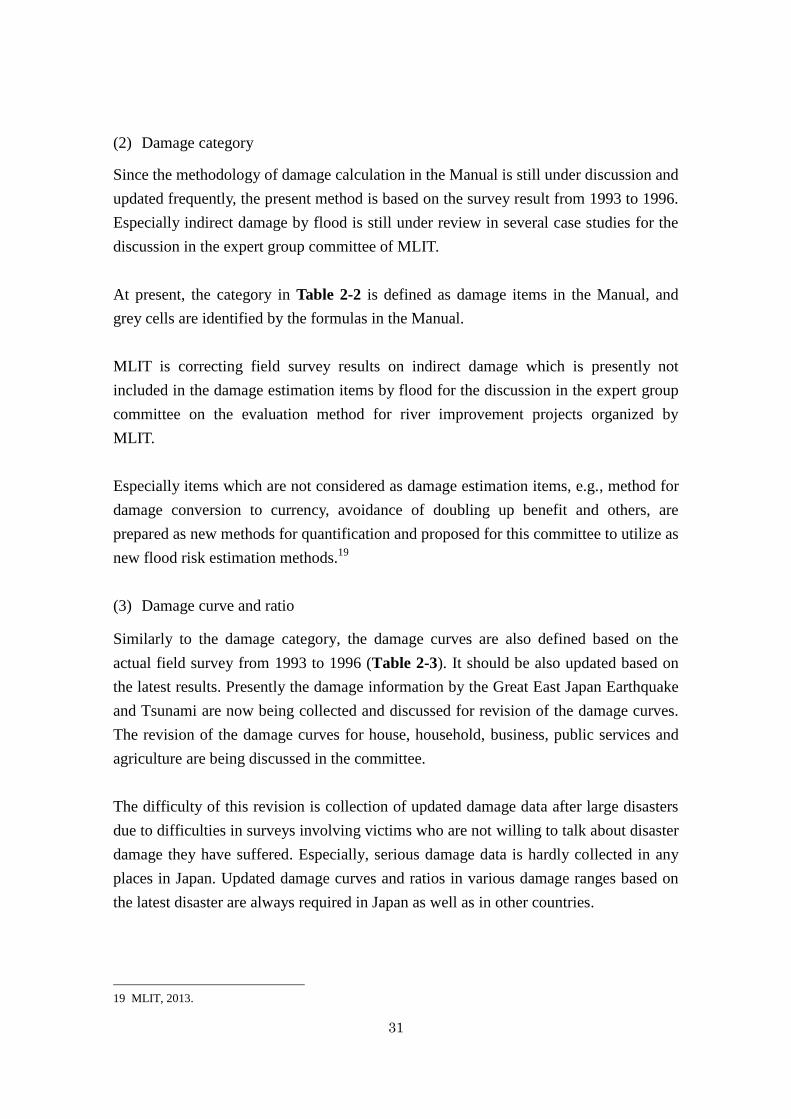
31
(2) Damage category
Since the methodology of damage calculation in the Manual is still under discussion and
updated frequently, the present method is based on the survey result from 1993 to 1996.
Especially indirect damage by flood is still under review in several case studies for the
discussion in the expert group committee of MLIT.
At present, the category in Table 2-2 is defined as damage items in the Manual, and
grey cells are identified by the formulas in the Manual.
MLIT is correcting field survey results on indirect damage which is presently not
included in the damage estimation items by flood for the discussion in the expert group
committee on the evaluation method for river improvement projects organized by
MLIT.
Especially items which are not considered as damage estimation items, e.g., method for
damage conversion to currency, avoidance of doubling up benefit and others, are
prepared as new methods for quantification and proposed for this committee to utilize as
new flood risk estimation methods.19
(3) Damage curve and ratio
Similarly to the damage category, the damage curves are also defined based on the
actual field survey from 1993 to 1996 (Table 2-3). It should be also updated based on
the latest results. Presently the damage information by the Great East Japan Earthquake
and Tsunami are now being collected and discussed for revision of the damage curves.
The revision of the damage curves for house, household, business, public services and
agriculture are being discussed in the committee.
The difficulty of this revision is collection of updated damage data after large disasters
due to difficulties in surveys involving victims who are not willing to talk about disaster
damage they have suffered. Especially, serious damage data is hardly collected in any
places in Japan. Updated damage curves and ratios in various damage ranges based on
the latest disaster are always required in Japan as well as in other countries.
19 MLIT, 2013.
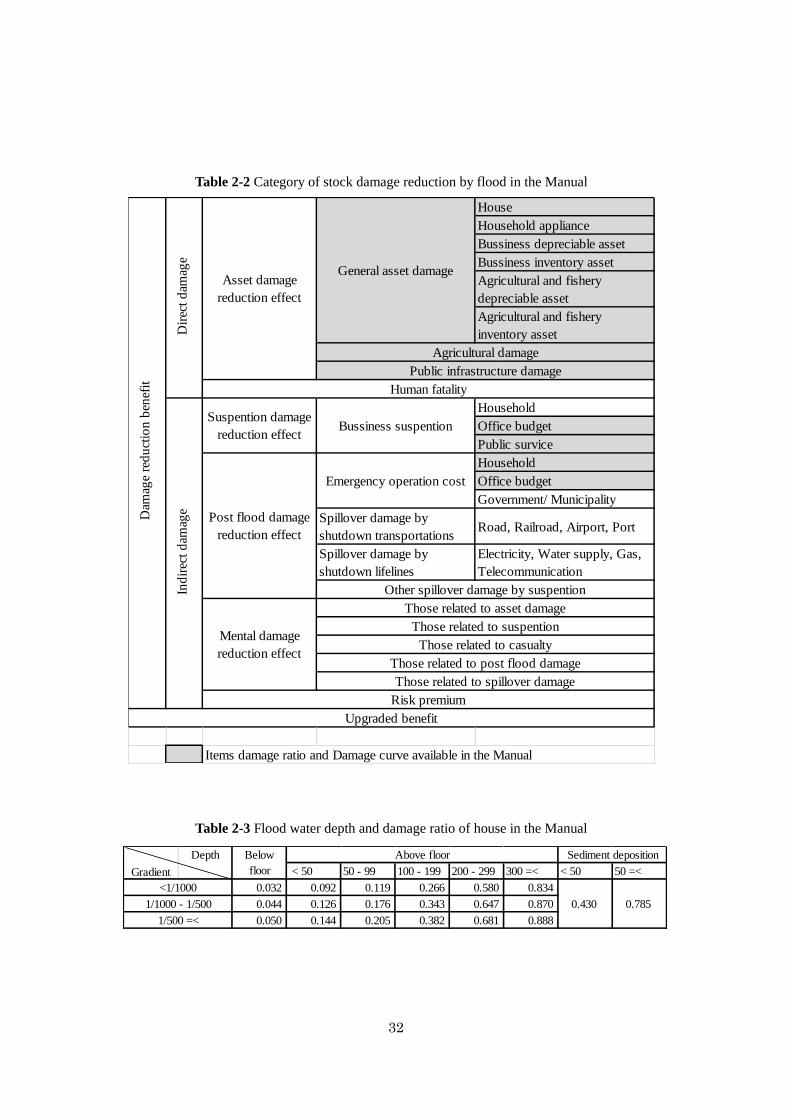
32
Table 2-2 Category of stock damage reduction by flood in the Manual
House
Household appliance
Bussiness depreciable asset
Bussiness inventory asset
Agricultural and fishery
depreciable asset
Agricultural and fishery
inventory asset
Household
Office budget
Public survice
Household
Office budget
Government/ Municipality
Spillover damage by
shutdown transportationsRoad, Railroad, Airport, Port
Spillover damage by
shutdown lifelines
Electricity, Water supply, Gas,
Telecommunication
Upgraded benefit
Dam
age
red
uct
ion
ben
efit
Items damage ratio and Damage curve available in the Manual
Those related to suspention
Those related to casualty
Those related to post flood damage
Those related to spillover damage
Mental damage
reduction effect
Risk premium
Bussiness suspentionSuspention damage
reduction effect
Emergency operation cost
Other spillover damage by suspention
Post flood damage
reduction effect
Dir
ect
dam
age
Ind
irec
t d
amag
e
Those related to asset damage
General asset damage
Agricultural damage
Public infrastructure damage
Asset damage
reduction effect
Human fatality
Table 2-3 Flood water depth and damage ratio of house in the Manual
< 50 50 - 99 100 - 199 200 - 299 300 =< < 50 50 =<
0.032 0.092 0.119 0.266 0.580 0.834
0.044 0.126 0.176 0.343 0.647 0.870
0.050 0.144 0.205 0.382 0.681 0.888
1/1000 - 1/500
1/500 =<
0.430 0.785
Below
floor
Above floor Sediment deposition
Gradient
Depth
<1/1000
33
(4) Example in Kuzuryugawa improvement plan
During the evaluation of the Asuwagawa dam project, in which the author was involved,
the benefits were calculated as damage reduction related to houses and agriculture by
flood control facilities. More specifically, the average annual estimated damage
reduction was calculated under two different conditions: with or without Asuwagawa
dams. The calculation was done at the social discount rate of 4%. The results were
converted into the present value for the target evaluation duration (50 years) after
starting dam operation, and added a remaining value.
Finally, the total benefits were calculated at 110.4 billion yen, and the cost-benefit ratio
was 1.3 in comparison with the total project costs of 85.6 billion yen. The conclusion of
the evaluation was accepted as appropriate20
.
2.3.6 Conclusion of the Current Situation of Japan
Prior to the implementation of a project, thorough evaluation is obligatory by a Japanese
law concerning public works projects. Especially, for construction of large structures,
such as dams, barrages, and long river dykes, cost-benefit analysis with flood risk
assessment was essential.
Fortunately, most information necessary for such evaluation is available as mesh data,
e.g., topography, population, and assets based on the latest census. These data make
detailed flood simulation and damage estimation possible by using the latest damage
conversion formula (damage curves or ratios).
As mentioned earlier, hot discussions are still continuing in Japan on how to evaluate
actual flood damage, which items to be considered in evaluation of indirect damage, and
how to prepare updated damage ratios. This Japanese case study deserves much
attention, since the results will be useful for other countries in terms of flood risk
assessement.19
In other words, flood risk assessment is definitely influenced by the availability of data,
e.g., metrological, hydrological, topographical, societal, economic and other related
information, and latest damage conversion formula.
20 Kinki regional development bureau of MLIT, 2012.
34
2.4 Flood Risk Assessment in the Developing Countries
2.4.1 Difficulties on Flood Risk Assessment in Developing Countries
Risk assessment in Japan can be conducted precisely because of rich data availability,
and can produce accurate results compared with other countries. However, in
developing countries, even simple topographical maps are hard to come by, and
hydrological data, past disaster damage information and other hazard information are
also hardly available.
For example, when Japan International Cooperation Agency (JICA) conducts a study
related to flood risk in a developing country, the team interviews many residents and
collects information as well as available statistics. Especially, a field investigation for
the master plan study after the Chao Phraya flood used 885 interview results after
excluding inappropriate data21
.
Disaster damage data is normally not available in developing countries. Therefore, flood
damage in developing countries is often a result of rough estimation.
Although only rough data is available, damage estimation has to be conducted because
the results are usually required to assess flood risk. Consultants and researchers have
been challenging to prepare appropriate results as hard as possible. The cases of
Thailand and Cambodia are introduced in the following sections, which involve some
assumptions or other tools of satellite information. Through careful field investigation
on lifestyle, micro-topography and crop cultivation characteristics, the simple method
was applied or developed to these cases.22
2.4.2 Study on Comprehensive Flood Management Plan for the Chao Phraya
River Basin Conducted by JICA
A study on flood management for the Chao Phraya basin was intensively implemented
by JICA from 2011 to 2013 in corporation with MLIT, University of Tokyo, Japan
Aerospace Exploration Agency (JAXA), PWRI/ICHARM and 4 hired consultant
companies, just after Chao Phraya River Flood in 2011 with economic losses of around
2.6 billion yen23
.
21 JICA, 2013.
22 T. Okazumi, et al., 2013. 23 Ministry of Foreign affairs, 2013.
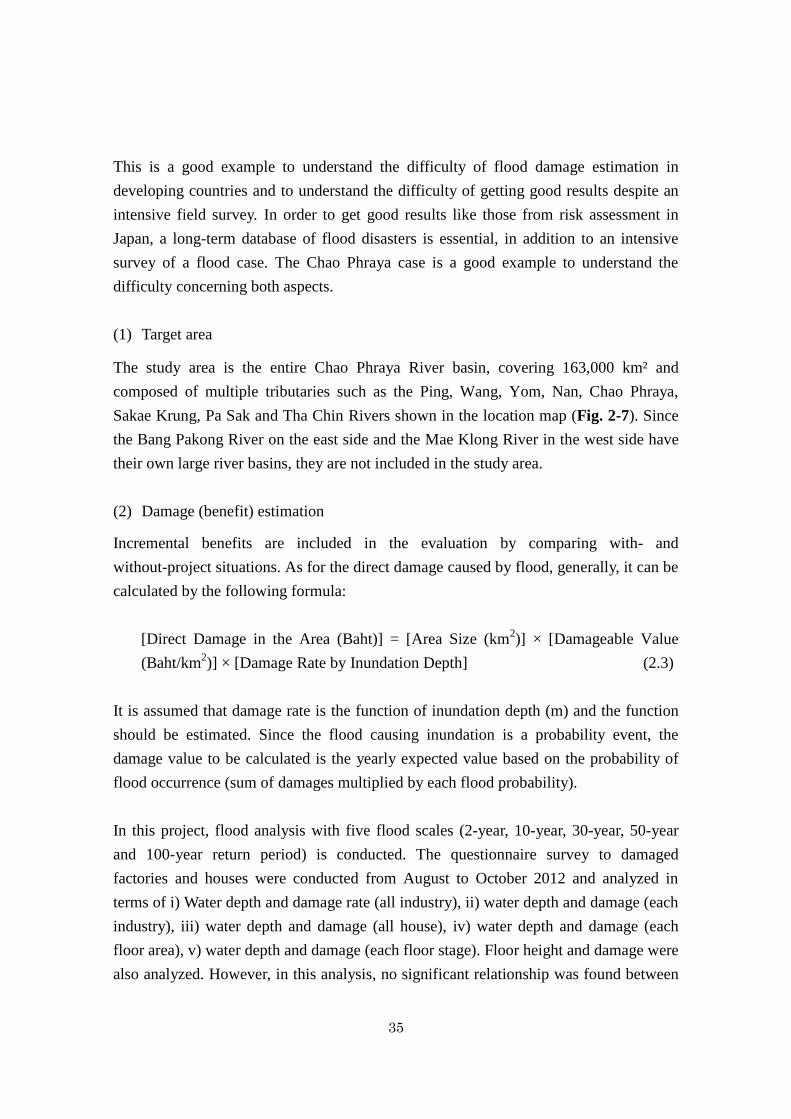
35
This is a good example to understand the difficulty of flood damage estimation in
developing countries and to understand the difficulty of getting good results despite an
intensive field survey. In order to get good results like those from risk assessment in
Japan, a long-term database of flood disasters is essential, in addition to an intensive
survey of a flood case. The Chao Phraya case is a good example to understand the
difficulty concerning both aspects.
(1) Target area
The study area is the entire Chao Phraya River basin, covering 163,000 km² and
composed of multiple tributaries such as the Ping, Wang, Yom, Nan, Chao Phraya,
Sakae Krung, Pa Sak and Tha Chin Rivers shown in the location map (Fig. 2-7). Since
the Bang Pakong River on the east side and the Mae Klong River in the west side have
their own large river basins, they are not included in the study area.
(2) Damage (benefit) estimation
Incremental benefits are included in the evaluation by comparing with- and
without-project situations. As for the direct damage caused by flood, generally, it can be
calculated by the following formula:
[Direct Damage in the Area (Baht)] = [Area Size (km2)] × [Damageable Value
(Baht/km2)] × [Damage Rate by Inundation Depth] (2.3)
It is assumed that damage rate is the function of inundation depth (m) and the function
should be estimated. Since the flood causing inundation is a probability event, the
damage value to be calculated is the yearly expected value based on the probability of
flood occurrence (sum of damages multiplied by each flood probability).
In this project, flood analysis with five flood scales (2-year, 10-year, 30-year, 50-year
and 100-year return period) is conducted. The questionnaire survey to damaged
factories and houses were conducted from August to October 2012 and analyzed in
terms of i) Water depth and damage rate (all industry), ii) water depth and damage (each
industry), iii) water depth and damage (all house), iv) water depth and damage (each
floor area), v) water depth and damage (each floor stage). Floor height and damage were
also analyzed. However, in this analysis, no significant relationship was found between
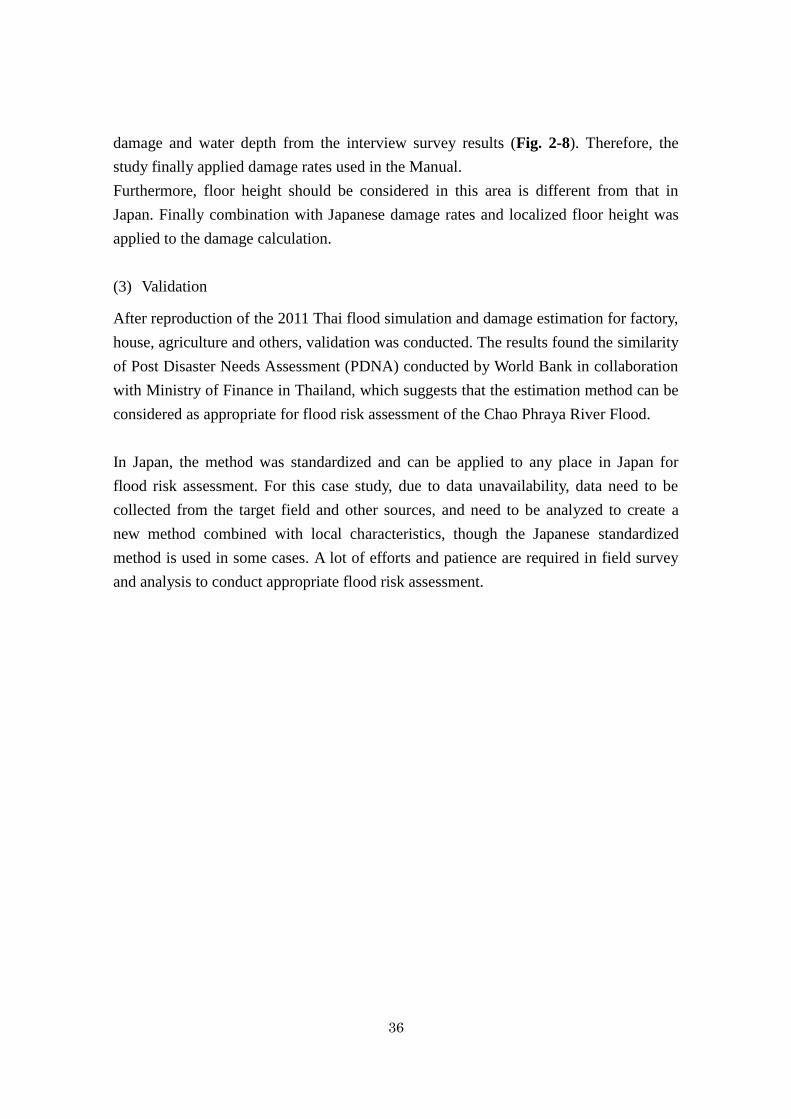
36
damage and water depth from the interview survey results (Fig. 2-8). Therefore, the
study finally applied damage rates used in the Manual.
Furthermore, floor height should be considered in this area is different from that in
Japan. Finally combination with Japanese damage rates and localized floor height was
applied to the damage calculation.
(3) Validation
After reproduction of the 2011 Thai flood simulation and damage estimation for factory,
house, agriculture and others, validation was conducted. The results found the similarity
of Post Disaster Needs Assessment (PDNA) conducted by World Bank in collaboration
with Ministry of Finance in Thailand, which suggests that the estimation method can be
considered as appropriate for flood risk assessment of the Chao Phraya River Flood.
In Japan, the method was standardized and can be applied to any place in Japan for
flood risk assessment. For this case study, due to data unavailability, data need to be
collected from the target field and other sources, and need to be analyzed to create a
new method combined with local characteristics, though the Japanese standardized
method is used in some cases. A lot of efforts and patience are required in field survey
and analysis to conduct appropriate flood risk assessment.
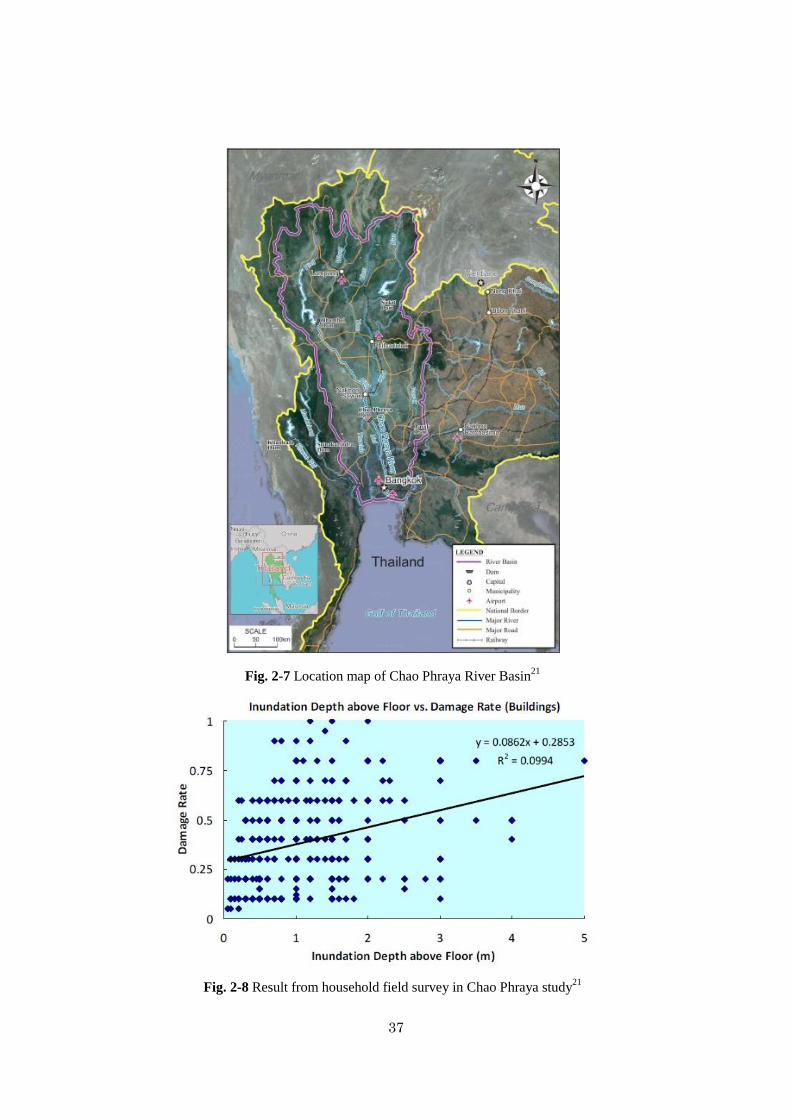
37
Fig. 2-7 Location map of Chao Phraya River Basin21
Fig. 2-8 Result from household field survey in Chao Phraya study21
38
2.4.3 Flood Risk Assessment in Cambodian Flood Plain
This study was conducted in the project of the Asian Development Bank Technical
Assistance No. 7276 (ADB TA7276)24
. The project was carried out by PWRI-ICHARM
as the implement agency and ADB as the executing agency with the Mekong River
Commission (MRC). It was funded by the Japan Fund for Poverty Reduction from the
Japanese government. The objective was the development of a flood vulnerability
assessment methodology for the Mekong flood plain.
The team collected past survey reports from the Mekong River Commission Secretariat
(MRCS) and started analysis, and included some field information based on field survey,
and used satellite information and Geographic Information System (GIS) to estimate
damage.
The results were highly appreciated by the MRCS and ADB as a new attempt to
combine local field information with satellite information and GIS.
(1) Target area
The Kompong Cham and Prey Veng flood plains in Cambodia (Fig. 2-9) were selected
as the study area. Cambodia’s major industry is agriculture, which accounts for 30% of
its Gross Domestic Product (GDP), and farmers account for 60% of its population. In
particular, most of people in the study area are involved in rice cultivation, which is
often damaged by extreme hydrological events. Based on this background, it was
decided that agricultural damage should be calculated as vulnerability in this area.
24 ICHARM, 2013.
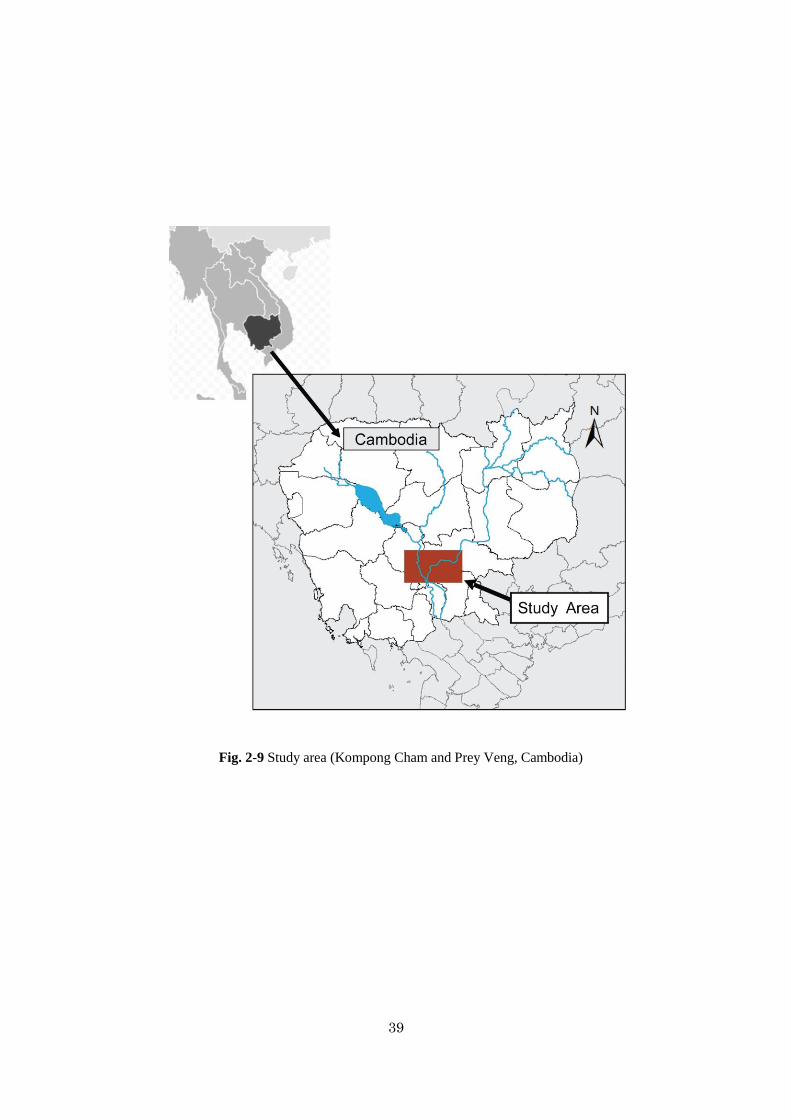
39
Fig. 2-9 Study area (Kompong Cham and Prey Veng, Cambodia)
40
(2) Methodology
a) Procedure
The study was designed as shown in Fig. 2-10. Data from various sources were used as
listed in each box in the flowchart; for example, past studies by the MRC, the LandScan
2009 global population database25
, and previous research papers. GIS-based analysis is
the backbone of this study, utilizing results from each research task conducted in this
study (white boxes) as well as other sources (dark boxes). The benefit to use this
GIS-based method is that as GIS data improves, better assessment results can be
produced easily.
b) DEM analysis
The Shuttle Radar Topography Mission (SRTM) data26
with a horizontal resolution of
3”×3” (app. 90m×90m) and a vertical resolution of 1m were used to identify
micro-topographical conditions in the study area. More precise topographical data, such
as IKONOS data27
, are also available in the market, but the advantages of SRTM DEM,
such as worldwide availability, free of charge and easy accessibility through the
HydroSHEDS28
website, were found to be more important for this study than a higher
level of accuracy that may be ensured by the use of IKONOS.
c) Hydro-metrological analysis
Plinston29
pointed out a tendency during past floods in the Cambodian plain that the
flood-plain inundation level eventually meets the river water level at a certain point (the
circled area in Fig. 2-11). Based on this flood characteristic in this area, flood
inundation areas were identified in the study area without any hydrological and
hydraulic calculation in the following procedure. Firstly, water level data were collected
from monitoring stations in the Mekong River and allied rivers to identify floods and
natural hydro-climatic phenomenon. The hydrological characteristics of the Mekong
River were found based on the analysis of the water level data from seven observation
stations for a period of 17 years: (i) The yearly hydrograph shows seasonal changes and
no significant difference in its water level behavior in each year; and (ii) The water level
shows less variation downstream compared with upstream. Secondly, based on these
characteristics, water stage data (hydrographs) at Kompong Cham and Phnom Penh
25 Budhendra B, et al., 2007.
26 Farr T, et al., 2007.
27 Toutin T, 2004.
28 Lehner B, 2006.
29 Plinston D, 2007.
41
were utilized. These data were used for interpolating the hydrographs between the two
stations (Fig. 2-12) in the analysis of the study area. Thirdly, based on the
characteristics in Fig. 2-12, inundation areas and water depths were identified by
applying the water level at the nearest point in the Mekong River to the strip (or “band”
as referred to in this study) of the flood plain expanding sideways. The flood plain
between the two stations was divided into 31 bands, and hydrographs were plotted for
each band from the interpolated water levels on the same dates. For the overlapping
bands, the interpolated hydrographs at the middle of the overlapping bands were
adopted (Fig. 2-13).
These are the steps of the procedure to estimate flood inundation areas and the water
depth in each cell in the simplified methodology with the flood characteristics of the
Mekong River.
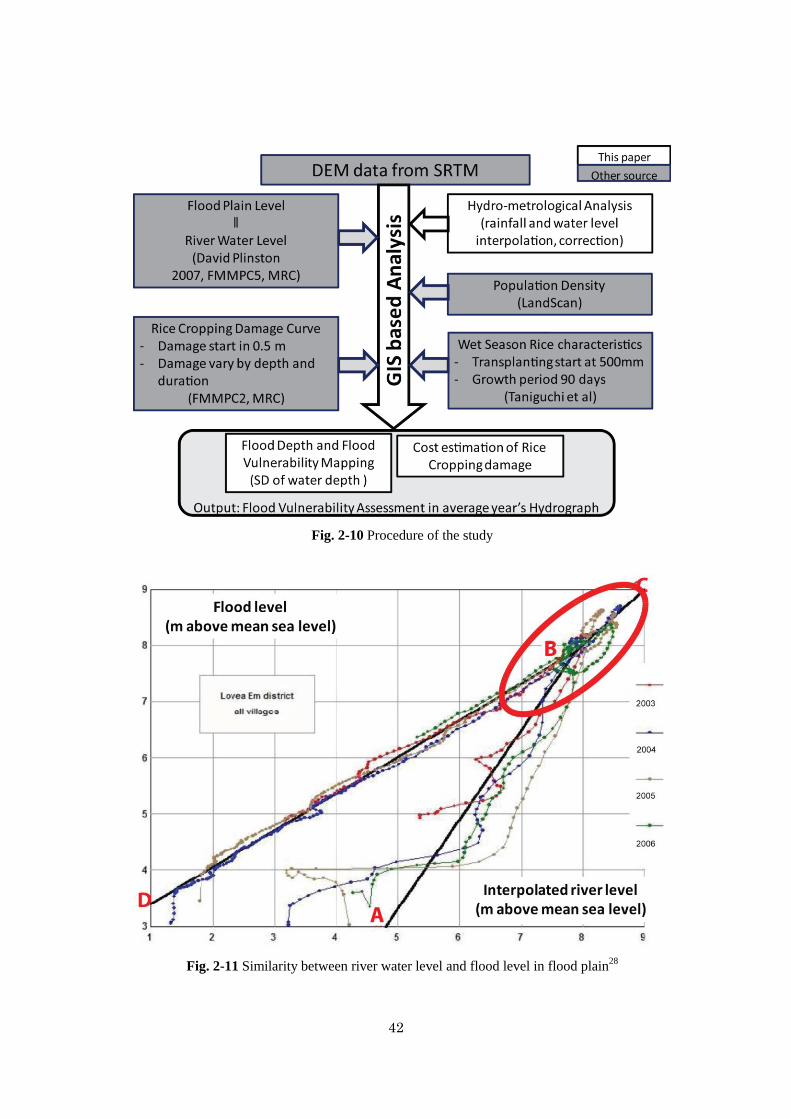
42
Fig. 2-10 Procedure of the study
Fig. 2-11 Similarity between river water level and flood level in flood plain28
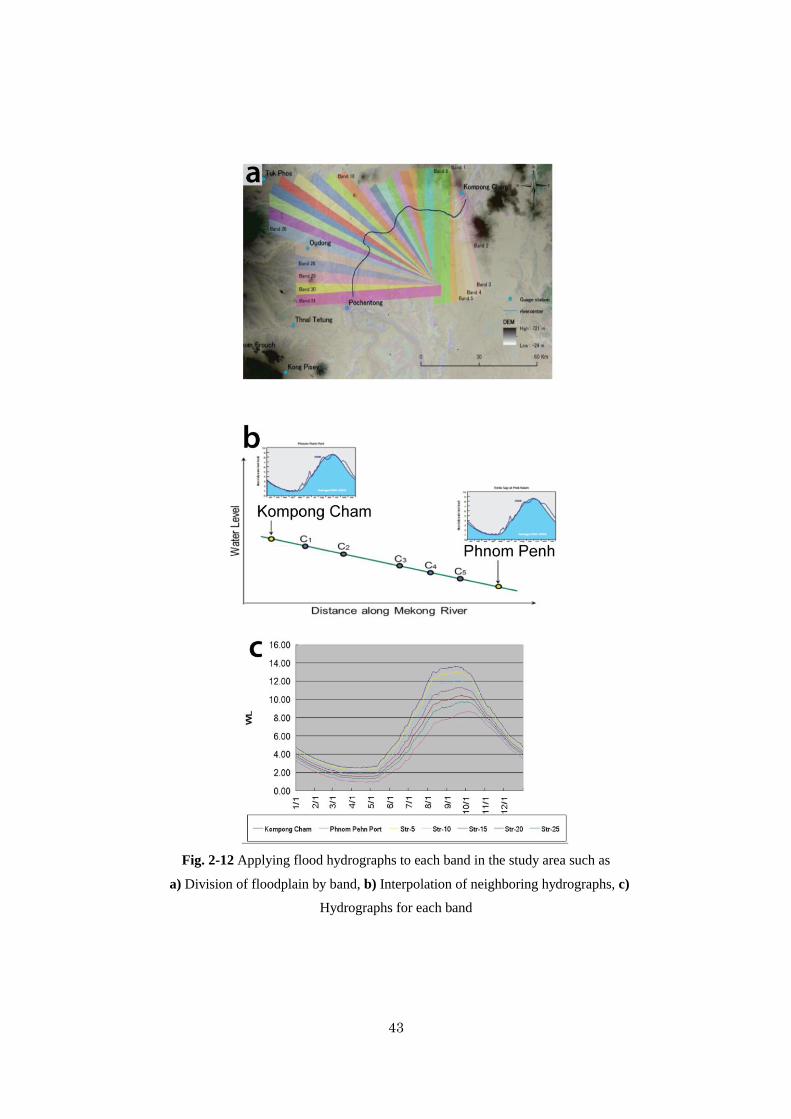
43
Fig. 2-12 Applying flood hydrographs to each band in the study area such as
a) Division of floodplain by band, b) Interpolation of neighboring hydrographs, c)
Hydrographs for each band
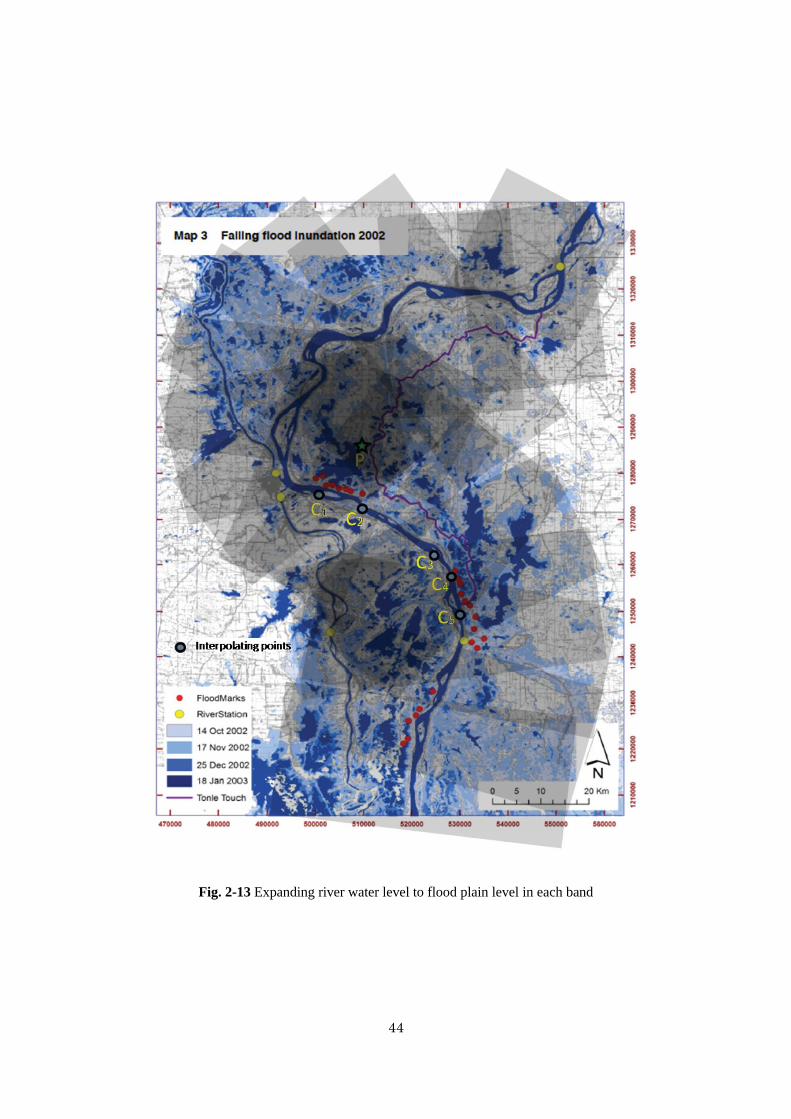
44
Fig. 2-13 Expanding river water level to flood plain level in each band
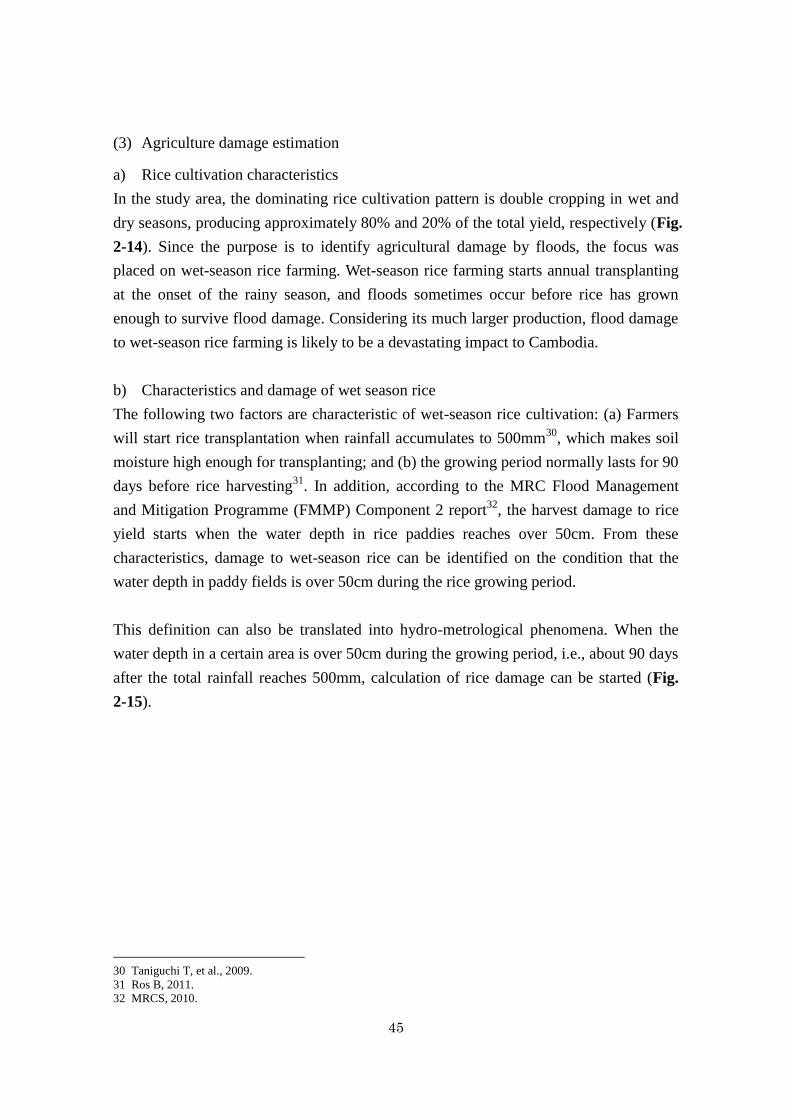
45
(3) Agriculture damage estimation
a) Rice cultivation characteristics
In the study area, the dominating rice cultivation pattern is double cropping in wet and
dry seasons, producing approximately 80% and 20% of the total yield, respectively (Fig.
2-14). Since the purpose is to identify agricultural damage by floods, the focus was
placed on wet-season rice farming. Wet-season rice farming starts annual transplanting
at the onset of the rainy season, and floods sometimes occur before rice has grown
enough to survive flood damage. Considering its much larger production, flood damage
to wet-season rice farming is likely to be a devastating impact to Cambodia.
b) Characteristics and damage of wet season rice
The following two factors are characteristic of wet-season rice cultivation: (a) Farmers
will start rice transplantation when rainfall accumulates to 500mm30
, which makes soil
moisture high enough for transplanting; and (b) the growing period normally lasts for 90
days before rice harvesting31
. In addition, according to the MRC Flood Management
and Mitigation Programme (FMMP) Component 2 report32
, the harvest damage to rice
yield starts when the water depth in rice paddies reaches over 50cm. From these
characteristics, damage to wet-season rice can be identified on the condition that the
water depth in paddy fields is over 50cm during the rice growing period.
This definition can also be translated into hydro-metrological phenomena. When the
water depth in a certain area is over 50cm during the growing period, i.e., about 90 days
after the total rainfall reaches 500mm, calculation of rice damage can be started (Fig.
2-15).
30 Taniguchi T, et al., 2009.
31 Ros B, 2011.
32 MRCS, 2010.
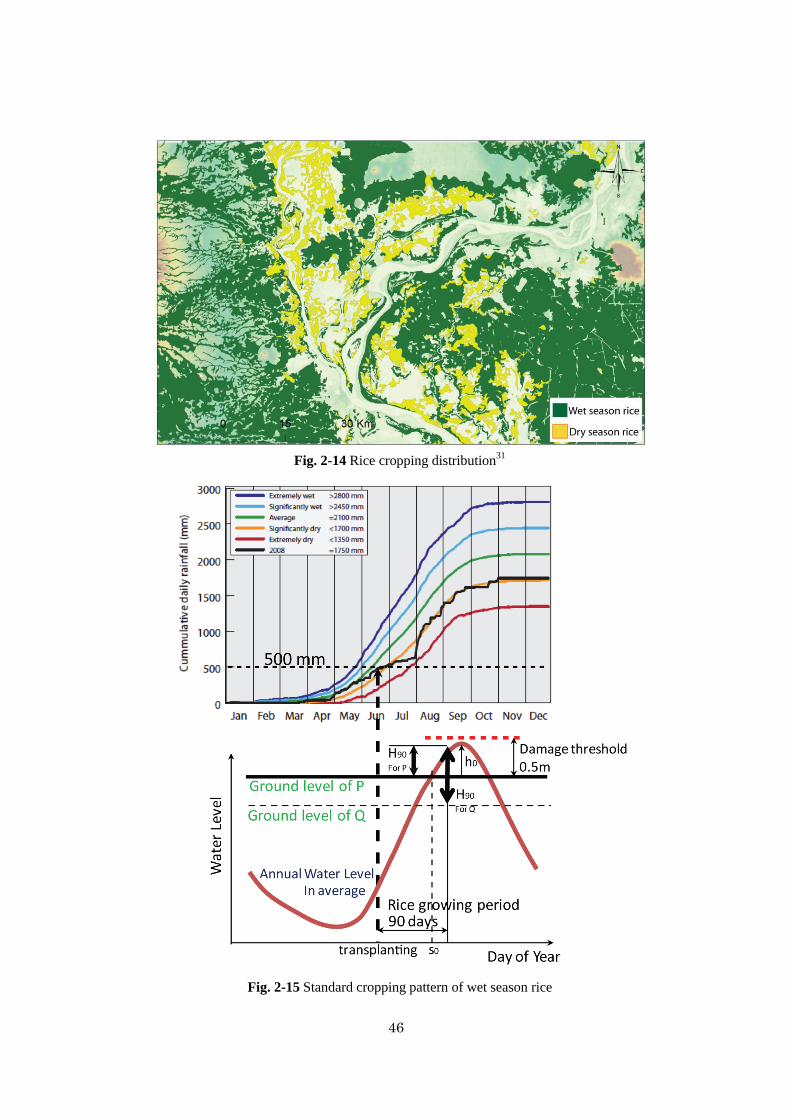
46
Fig. 2-14 Rice cropping distribution31
Fig. 2-15 Standard cropping pattern of wet season rice
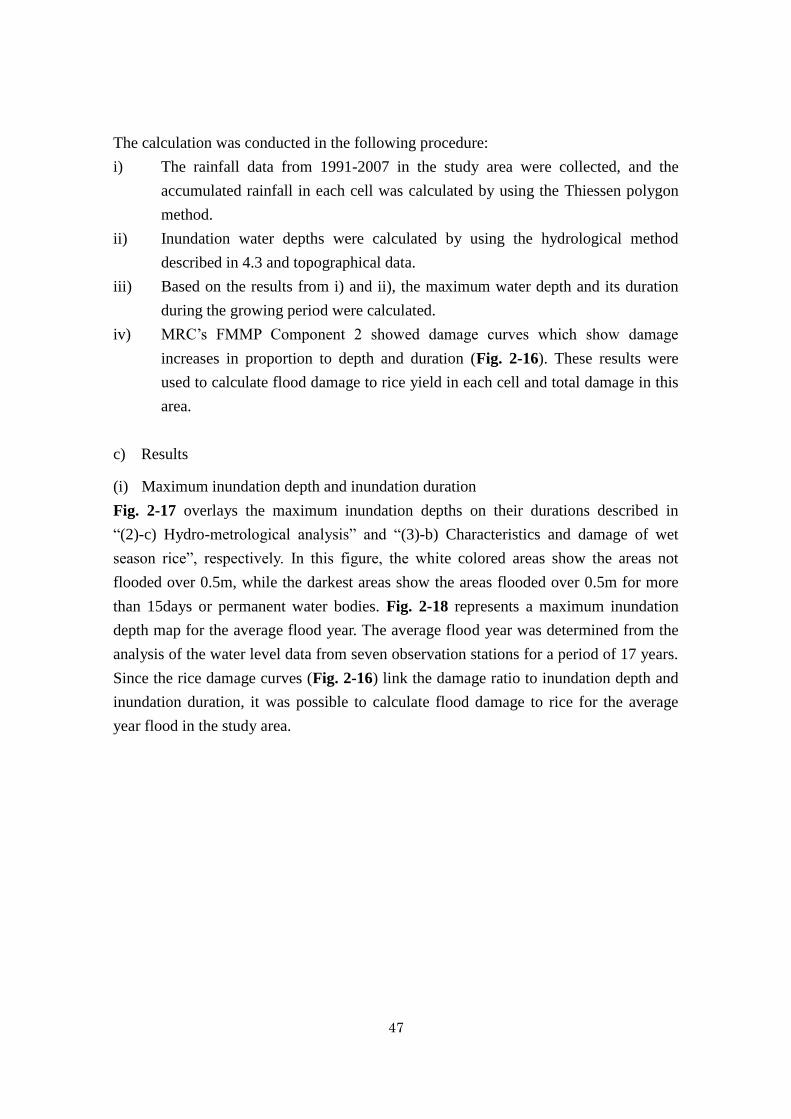
47
The calculation was conducted in the following procedure:
i) The rainfall data from 1991-2007 in the study area were collected, and the
accumulated rainfall in each cell was calculated by using the Thiessen polygon
method.
ii) Inundation water depths were calculated by using the hydrological method
described in 4.3 and topographical data.
iii) Based on the results from i) and ii), the maximum water depth and its duration
during the growing period were calculated.
iv) MRC’s FMMP Component 2 showed damage curves which show damage
increases in proportion to depth and duration (Fig. 2-16). These results were
used to calculate flood damage to rice yield in each cell and total damage in this
area.
c) Results
(i) Maximum inundation depth and inundation duration
Fig. 2-17 overlays the maximum inundation depths on their durations described in
“(2)-c) Hydro-metrological analysis” and “(3)-b) Characteristics and damage of wet
season rice”, respectively. In this figure, the white colored areas show the areas not
flooded over 0.5m, while the darkest areas show the areas flooded over 0.5m for more
than 15days or permanent water bodies. Fig. 2-18 represents a maximum inundation
depth map for the average flood year. The average flood year was determined from the
analysis of the water level data from seven observation stations for a period of 17 years.
Since the rice damage curves (Fig. 2-16) link the damage ratio to inundation depth and
inundation duration, it was possible to calculate flood damage to rice for the average
year flood in the study area.
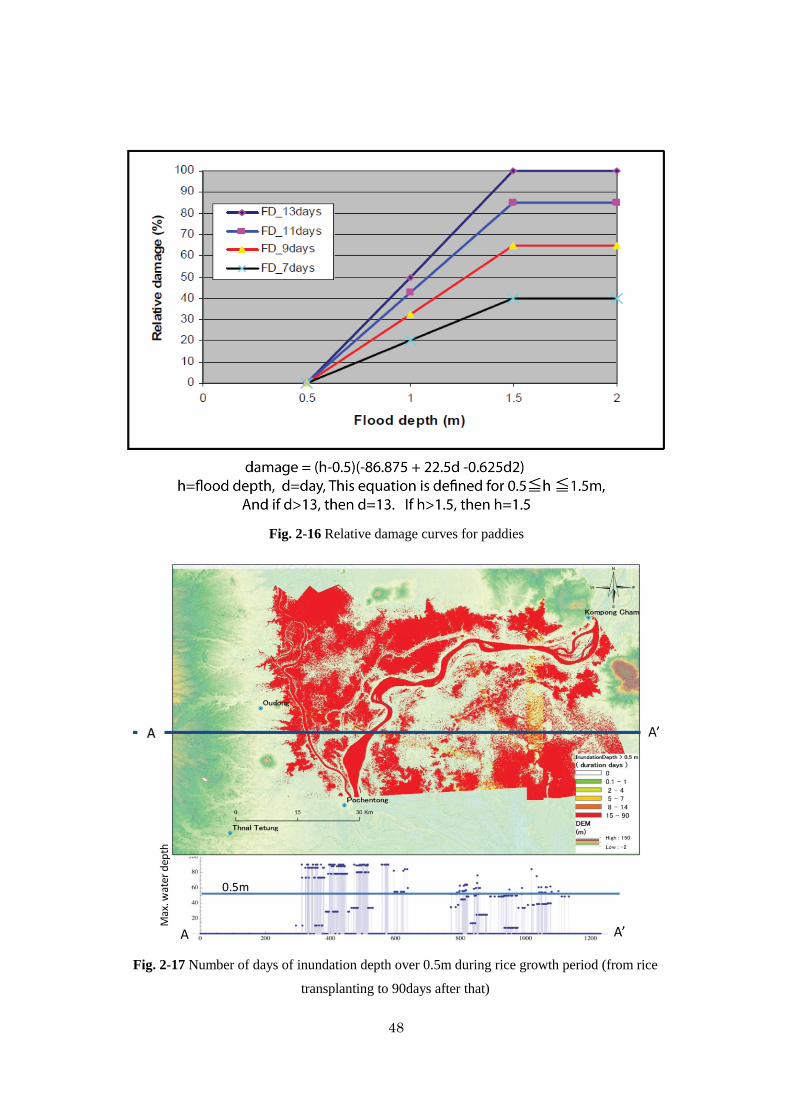
48
Fig. 2-16 Relative damage curves for paddies
Fig. 2-17 Number of days of inundation depth over 0.5m during rice growth period (from rice
transplanting to 90days after that)
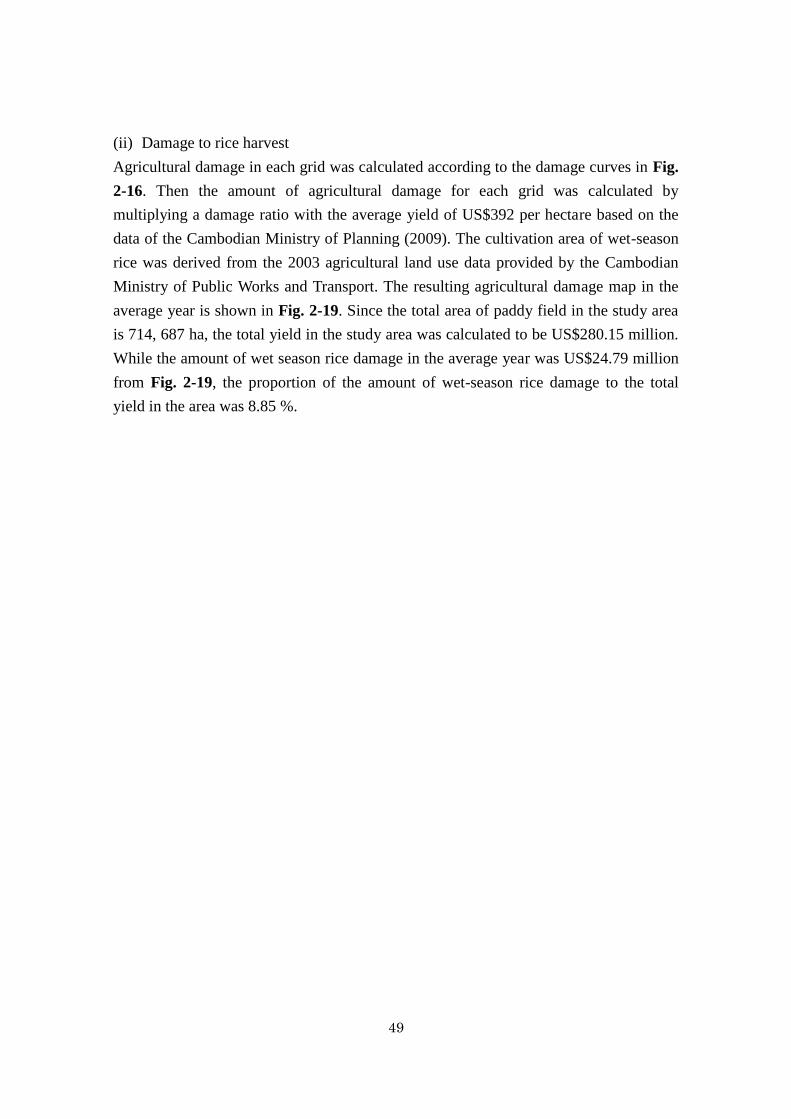
49
(ii) Damage to rice harvest
Agricultural damage in each grid was calculated according to the damage curves in Fig.
2-16. Then the amount of agricultural damage for each grid was calculated by
multiplying a damage ratio with the average yield of US$392 per hectare based on the
data of the Cambodian Ministry of Planning (2009). The cultivation area of wet-season
rice was derived from the 2003 agricultural land use data provided by the Cambodian
Ministry of Public Works and Transport. The resulting agricultural damage map in the
average year is shown in Fig. 2-19. Since the total area of paddy field in the study area
is 714, 687 ha, the total yield in the study area was calculated to be US$280.15 million.
While the amount of wet season rice damage in the average year was US$24.79 million
from Fig. 2-19, the proportion of the amount of wet-season rice damage to the total
yield in the area was 8.85 %.
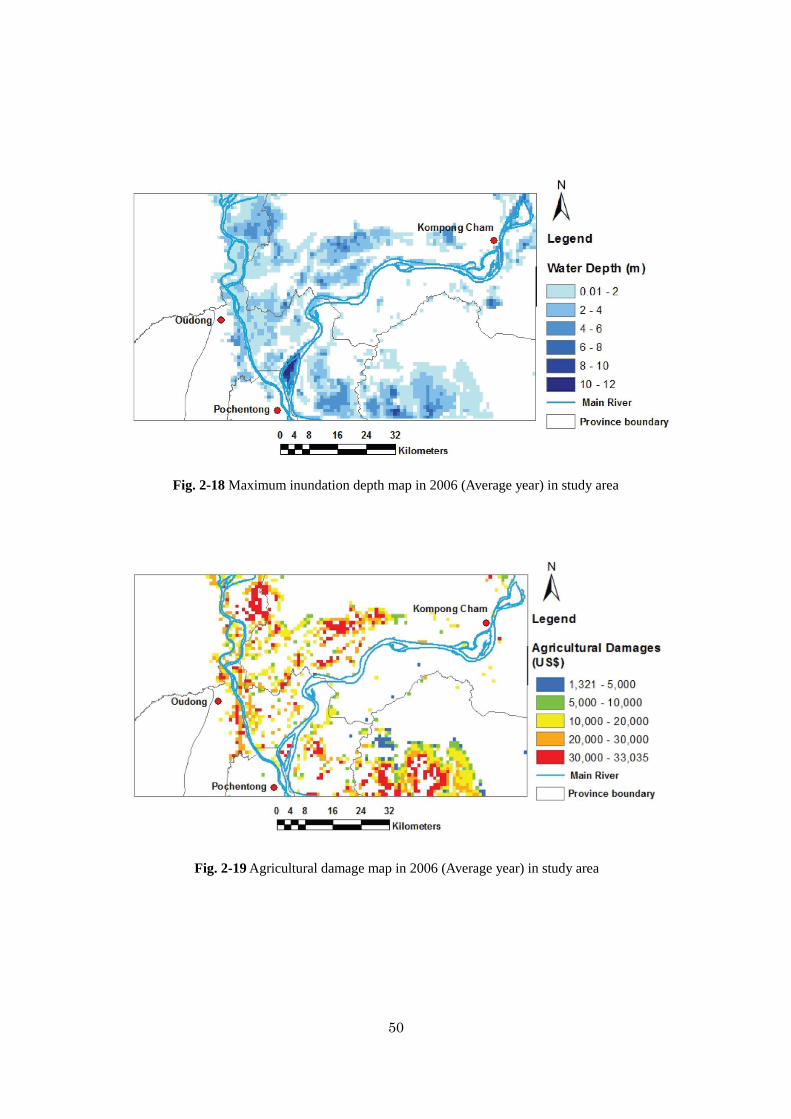
50
Fig. 2-18 Maximum inundation depth map in 2006 (Average year) in study area
Fig. 2-19 Agricultural damage map in 2006 (Average year) in study area
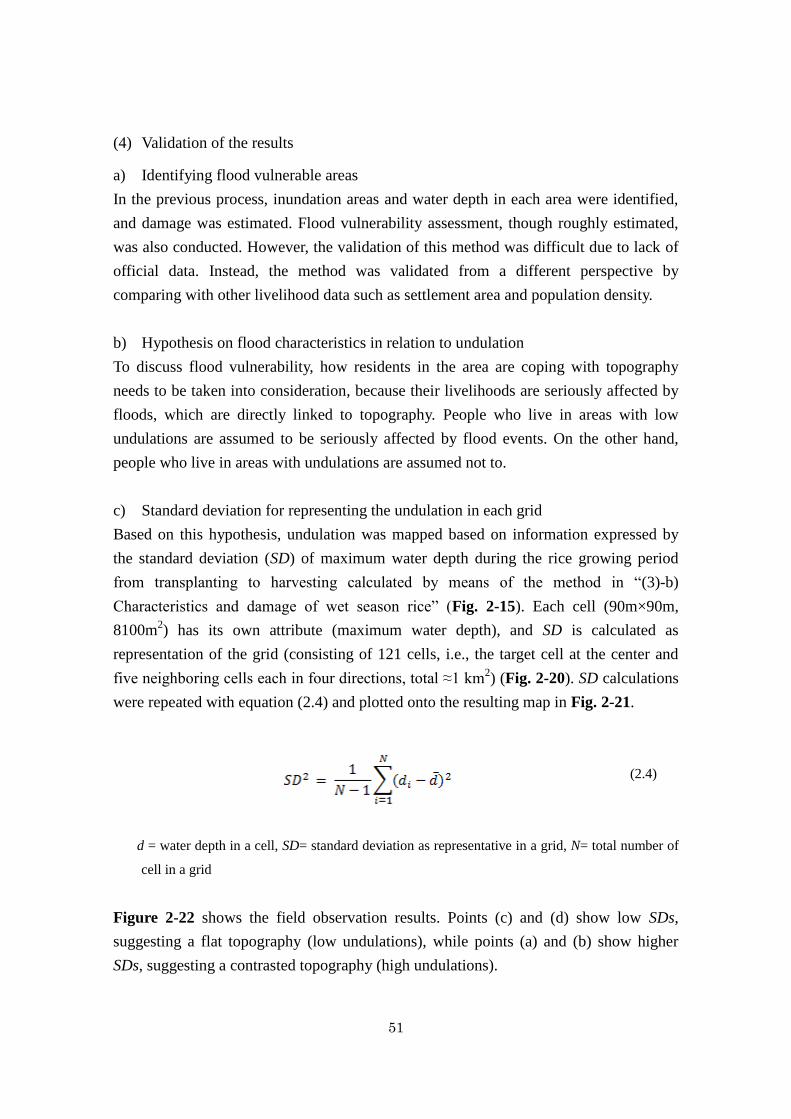
51
(4) Validation of the results
a) Identifying flood vulnerable areas
In the previous process, inundation areas and water depth in each area were identified,
and damage was estimated. Flood vulnerability assessment, though roughly estimated,
was also conducted. However, the validation of this method was difficult due to lack of
official data. Instead, the method was validated from a different perspective by
comparing with other livelihood data such as settlement area and population density.
b) Hypothesis on flood characteristics in relation to undulation
To discuss flood vulnerability, how residents in the area are coping with topography
needs to be taken into consideration, because their livelihoods are seriously affected by
floods, which are directly linked to topography. People who live in areas with low
undulations are assumed to be seriously affected by flood events. On the other hand,
people who live in areas with undulations are assumed not to.
c) Standard deviation for representing the undulation in each grid
Based on this hypothesis, undulation was mapped based on information expressed by
the standard deviation (SD) of maximum water depth during the rice growing period
from transplanting to harvesting calculated by means of the method in “(3)-b)
Characteristics and damage of wet season rice” (Fig. 2-15). Each cell (90m×90m,
8100m2) has its own attribute (maximum water depth), and SD is calculated as
representation of the grid (consisting of 121 cells, i.e., the target cell at the center and
five neighboring cells each in four directions, total ≈1 km2) (Fig. 2-20). SD calculations
were repeated with equation (2.4) and plotted onto the resulting map in Fig. 2-21.
(2.4)
d = water depth in a cell, SD= standard deviation as representative in a grid, N= total number of
cell in a grid
Figure 2-22 shows the field observation results. Points (c) and (d) show low SDs,
suggesting a flat topography (low undulations), while points (a) and (b) show higher
SDs, suggesting a contrasted topography (high undulations).
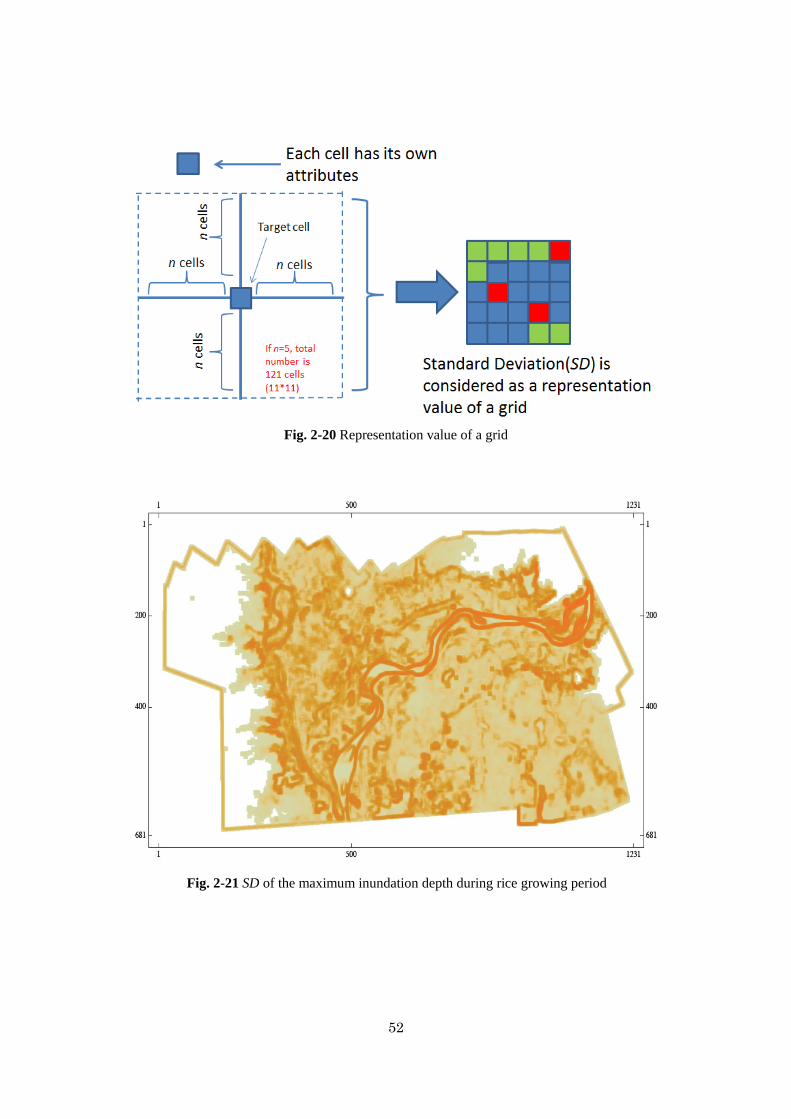
52
Fig. 2-20 Representation value of a grid
Fig. 2-21 SD of the maximum inundation depth during rice growing period
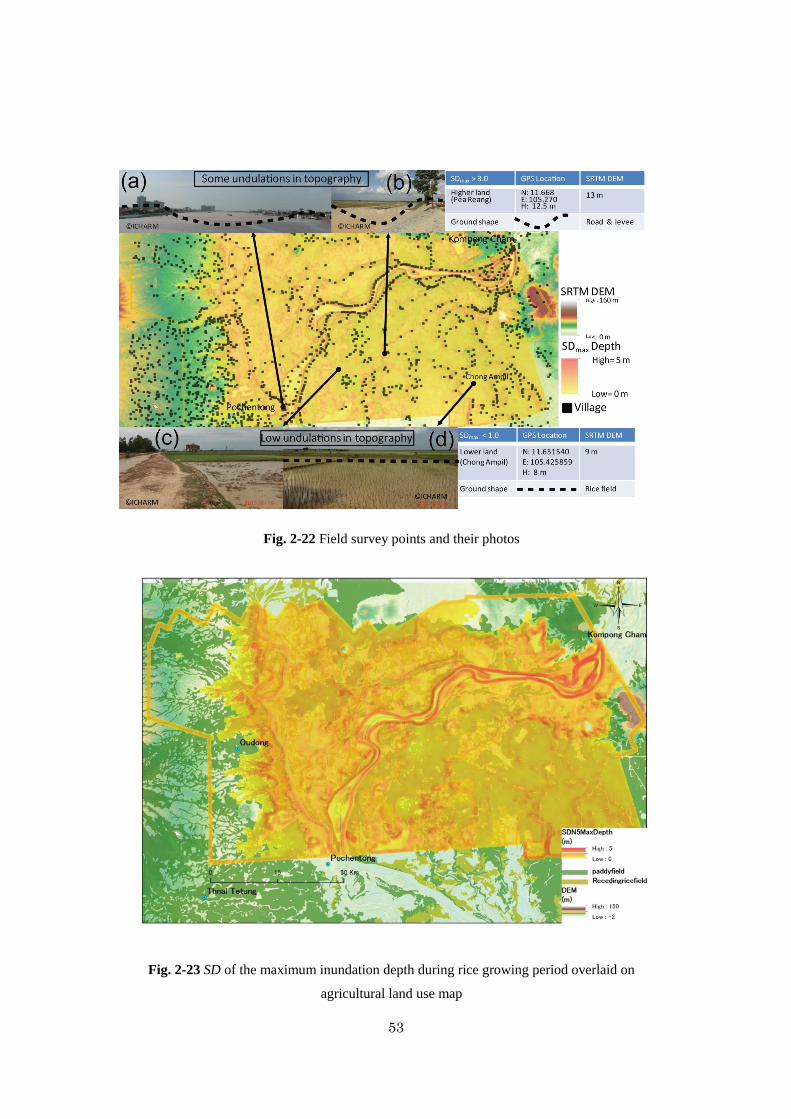
53
Fig. 2-22 Field survey points and their photos
Fig. 2-23 SD of the maximum inundation depth during rice growing period overlaid on
agricultural land use map
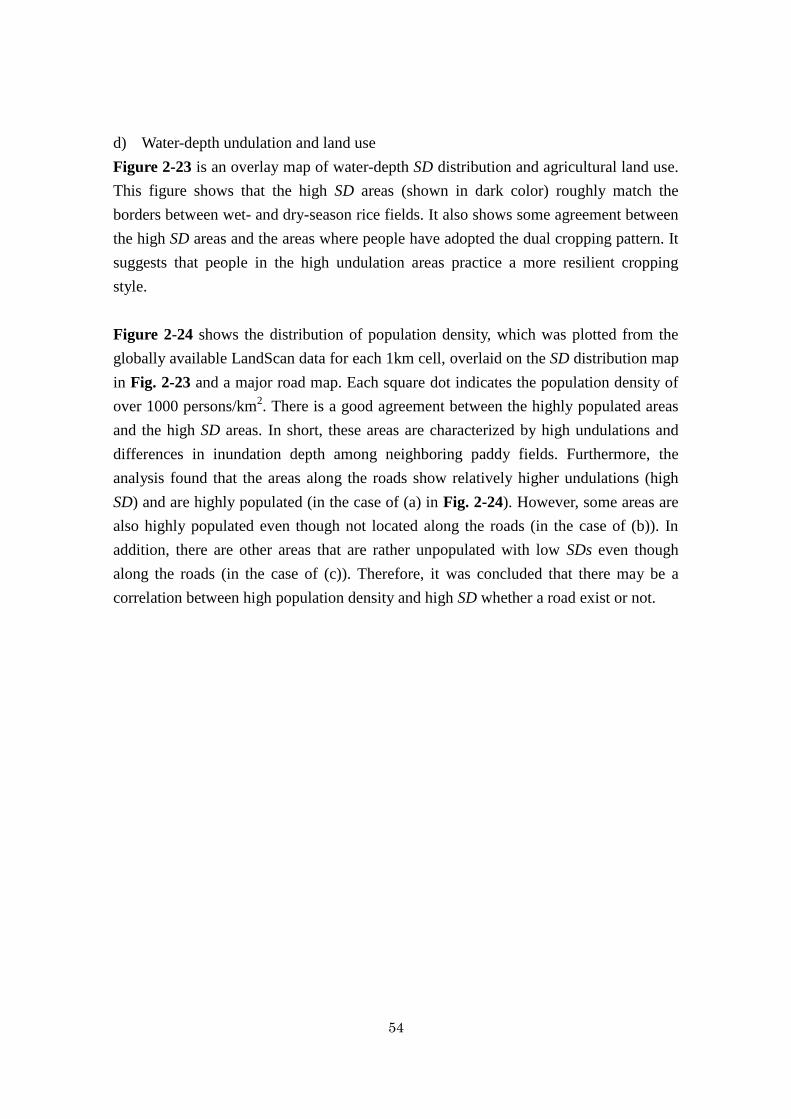
54
d) Water-depth undulation and land use
Figure 2-23 is an overlay map of water-depth SD distribution and agricultural land use.
This figure shows that the high SD areas (shown in dark color) roughly match the
borders between wet- and dry-season rice fields. It also shows some agreement between
the high SD areas and the areas where people have adopted the dual cropping pattern. It
suggests that people in the high undulation areas practice a more resilient cropping
style.
Figure 2-24 shows the distribution of population density, which was plotted from the
globally available LandScan data for each 1km cell, overlaid on the SD distribution map
in Fig. 2-23 and a major road map. Each square dot indicates the population density of
over 1000 persons/km2. There is a good agreement between the highly populated areas
and the high SD areas. In short, these areas are characterized by high undulations and
differences in inundation depth among neighboring paddy fields. Furthermore, the
analysis found that the areas along the roads show relatively higher undulations (high
SD) and are highly populated (in the case of (a) in Fig. 2-24). However, some areas are
also highly populated even though not located along the roads (in the case of (b)). In
addition, there are other areas that are rather unpopulated with low SDs even though
along the roads (in the case of (c)). Therefore, it was concluded that there may be a
correlation between high population density and high SD whether a road exist or not.
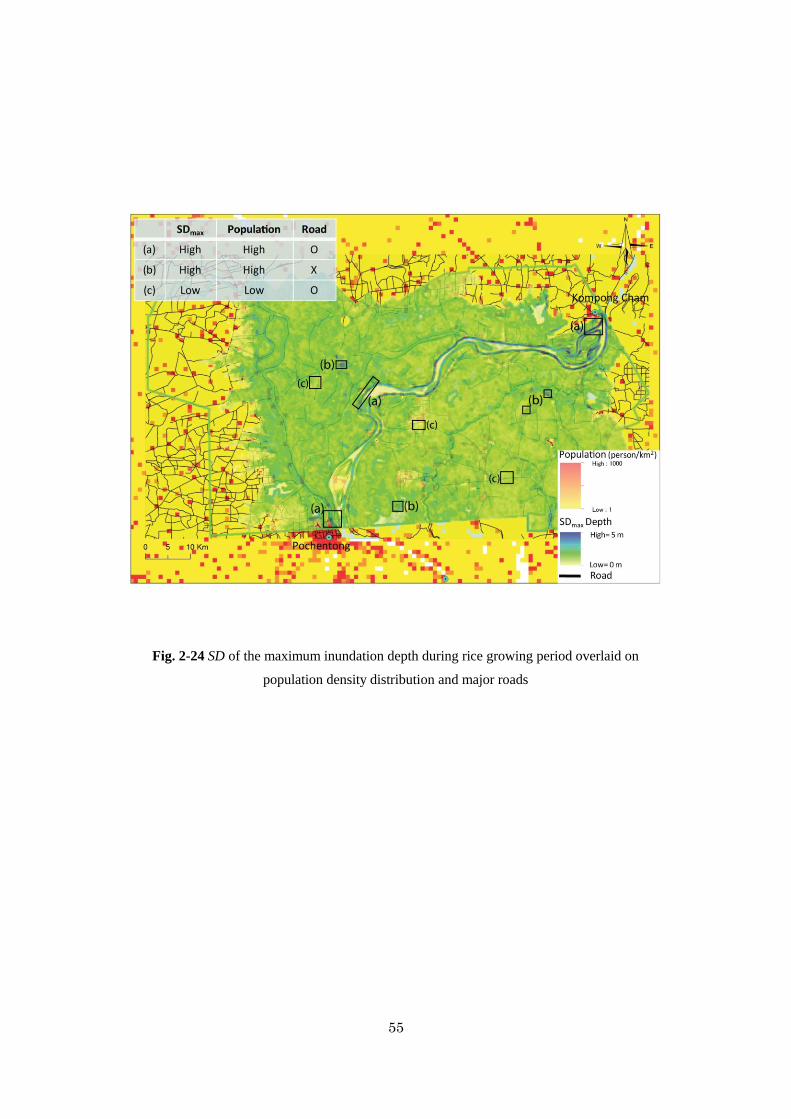
55
Fig. 2-24 SD of the maximum inundation depth during rice growing period overlaid on
population density distribution and major roads
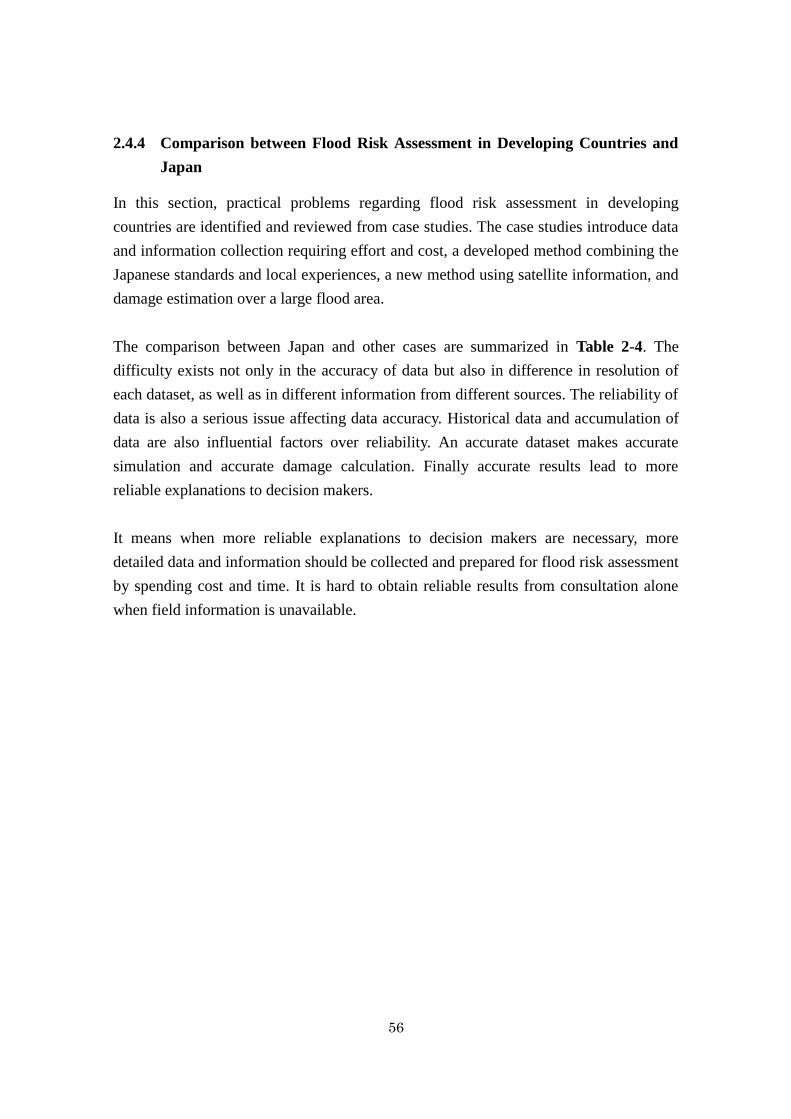
56
2.4.4 Comparison between Flood Risk Assessment in Developing Countries and
Japan
In this section, practical problems regarding flood risk assessment in developing
countries are identified and reviewed from case studies. The case studies introduce data
and information collection requiring effort and cost, a developed method combining the
Japanese standards and local experiences, a new method using satellite information, and
damage estimation over a large flood area.
The comparison between Japan and other cases are summarized in Table 2-4. The
difficulty exists not only in the accuracy of data but also in difference in resolution of
each dataset, as well as in different information from different sources. The reliability of
data is also a serious issue affecting data accuracy. Historical data and accumulation of
data are also influential factors over reliability. An accurate dataset makes accurate
simulation and accurate damage calculation. Finally accurate results lead to more
reliable explanations to decision makers.
It means when more reliable explanations to decision makers are necessary, more
detailed data and information should be collected and prepared for flood risk assessment
by spending cost and time. It is hard to obtain reliable results from consultation alone
when field information is unavailable.
57
Table 2-4 Comparison between Japan and other cases in typical items of flood risk assessment
Major itemsJapanese Standard(the
Manual on FCEI)
Chao Phraya flood mater
plan study
Agriculture damge
estimation in CambodiaComments
Topographic, Socio-
economic information
Standard: 1/2,500
National basic map
SocioEconomic data in
National land numerical
information (50m)
Desital Elevation Model(60";
1800m grid)
2km grid household data,
damage in each small
village(Tambon)
DEM from SRTM (90m
grid)
Population from
LandScan(1km grid)
Landuse from MRCS
survey
Basic information directly
links to accuarcy of result.
Coordination with
inundation model is
necessary
Flood inundation
simulation model
Standard:250m grid, 2D
unsteady flow
6 cases of flood
magnitude
Rainfall Runoff Inundation
model developed by
ICHARM
Hydrological data from
National Climate Data
Center of US
ICHARM Hydro-Geo
Method (assumption from
river water level based on
Cambodian Irrigation
system)
Depending on availability
of topographical and
hydrological info.
Inundation info is
necessary for calibration.
Coordination with asset
info is important.
Damage ratio
Direct damage rate is
defined by water depth,
slope gradient and
duration.
For house, household,
bussiness,
agriculture/fishery
Damage ratio was applied
Japanese one.
Damage was adjusted by
floor height surveyed in the
field.
Wet Season Rice damage
ratio depend on water
depth and duration from
past study by MRCS.
Past study will be useful
for applied local
characteristics.
Data collection from field
is depending on cost and
time.
Result of comparison
Direct damage can be
estimate in better
accuarcy.
Indiret damage is under
consideration
Result of industrial damage
calculation could be adjusted
in cariblation.
Validation of damage
result is difficult.
But, result can be
acceptable by other
validation method.
If higher accuary of
estimation is required,
data collection should be
stengtherned. It means
depending on the
requrement.
58
2.5 Conclusions
In this chapter, flood risk assessment was introduced with its all steps, technologies and
methodologies. Flood risk assessment in Japan was explained with its legal status and
detailed methodological guidelines.
The legal status of flood risk assessment is specified in the Policy Evaluation Law, and
it is currently mandatory to conduct SOP for policy evaluation at proposal, midterm and
completion of the project, following the Basic Plan for Policy Evaluation of MLIT.
Evaluation of river and dam projects at the proposal stage of SOP is linked to the river
improvement planning prescribed in the River Law. For the discussion on each draft
river improvement plan, flood risk assessment and cost benefit analysis have to be done
based on the Manual prepared by MLIT. Because river and dam improvement projects
have a long history of discussion on environment conservation and development, strict
requirements of public information disclosure, evaluation and disclosure of pre-project
activities have been established.
Following the Japanese case, examples of flood risk assessment in developing countries
were also introduced. If flood risk assessment is required for decision making under
poor data and information circumstances, a simplified method based on careful field
survey should be implemented to overcome lack of data for preparing some results
although these results may include some uncertainty.
Based on studies in both cases, comparison in flood risk assessment between Japan and
developing countries was conducted for the basic understanding of the present situation
of flood risk assessment. This comparison study showed availability of dataset and
information is the most influential factor on the accuracy of results, but the coordination
of resolution of data, simulation models and damage calculation is also found as
important considerations. Even a high resolution simulation model cannot function well
if the resolution of data is not good enough to match that of the model. Holistic
coordination and management in flood risk assessment as a system will be the key for
effective implementation.
Through this chapter, discussion was made about the importance of flood risk
assessment as pre-disaster activities to identify necessary action for flood risk reduction
and present problems on flood risk assessment, which mainly concerns uncertainty
59
during each assessment step. It is very common to face problems related to uncertainty
when risk assessment is conducted in developing countries.
Accurate datasets are needed to carry out accurate simulation and accurate damage
calculation, and accurate results lead to more reliable explanations to decision makers. It
means that when more reliable explanations to decision makers are necessary, more
detailed data and information should be collected and prepared for flood risk assessment
by spending cost and time. However, when time and cost are limited, satellites and other
methods should be opted as alternative ways to collect necessary data and information
with careful consideration on uncertainty.
Important steps and recommendations of flood risk assessment in developing countries
were identified as follows:
1) Review available related data and information and collect them as much as possible.
2) Conduct observations and hearings in the field for more data and information, if
they are not enough.
3) Use data and information from satellites as supplementary information.
4) Select runoff and inundation models based on collected data and information.
Sometimes models define what data is necessary. Keep the same level of accuracy
between data and a model for the operability of the model. (A model with a high
resolution is not always necessary.)
5) Conduct careful calibration and validation of reproduction models with good
understanding of the target of flood risk assessment. Satellite information can be
good supplementary information.
6) Prepare damage function based on past disaster investigation. If data is not available,
conduct additional interviews and surveys in the field, or consider combination with
another available standard.
7) Validate damage calculation without appropriate information.
60
Reference
1. United Nations International Strategy for Disaster Reduction (UNISDR), 2009 UNISDR
Terminology on Disaster Risk Reduction, Switzerland, May 2009
2. B. Wisner, P. Blaikie, T. Cannon, and I. Davis, At Risk second edition, Natural hazards,
people’s vulnerability and disasters, Routledge, Taylor and Francis Group, London and New
York, 2004
3. World Metrological Organization, Guide to Hydrological Practices (WMO No.168) 6th Edition,
I.2-24, 2008.
4. Centre for Research on the Epidemiology of Disasters – CRED, Criteria and Definition,
Explanatory Notes, EM-DAT, International Disaster Database, access in 2013,
http://www.emdat.be/criteria-and-definition
5. Expert Group Meeting (EGM) on Improving Disaster Data to Build Resilience in Asia and the
Pacific, Summary and the Way Forward, 1 October 2013,
http://northeast-sro.unescap.org/meeting/2013/EGM.html
6. MLIT, the manuals for flood control and economic investigation (draft), 2009, (in Japanese).
http://www.mlit.go.jp/river/basic_info/seisaku_hyouka/gaiyou/hyouka/h1704/chisui.pdf
7. Joint Committee for Guides in Metrology, “Evaluation of measurement data – guide to the
expression of uncertainty in measurement”, JCGM 100:2008, GUM 1995 with minor
corrections, corrected version 2010
8. H. Apel, A. H. Thieken, B. Merz, and G. Blöschl, “A probabilistic modeling system for
assessing flood risks”, Natural Hazards (2006) 38: 79-100; DOI: 10.1007/s1069-005-8603-7,
2006.
9. B. Merz and A. H. Thieken, “Flood risk curves and uncertainty bounds”, Natural Hazards, 51, 3,
437-458; DOI:10.1007/s11069-009-9452-6, 2009.
10. The Administrative Reform Conference, The final report of Administrative Reform Conference,
December 1997, (in Japanese). http://www.soumu.go.jp/main_sosiki/hyouka/kaigi.htm
11. The law on policy evaluation conducted by government agencies, June 2001, (in Japanese).
http://www.soumu.go.jp/main_sosiki/hyouka/houritu.htm
61
12. MLIT, The Basic Plan for Policy Evaluation in MLIT, 2002 (revised in 2012), (in Japanese).
https://www.mlit.go.jp/common/000223038.pdf
13. MLIT, The standard operation procedure for the policy evaluation at the stage for new project
proposal in MLIT, 2011, (in Japanese). http://www.mlit.go.jp/common/000111427.pdf
14. MLIT, Dam project - Evaluation on various effect and impact to the area - , prepared for
program evaluation, March 2003, (in Japanese).
https://www.mlit.go.jp/common/000043135.pdf
15. MLIT, The amendment of river law, May 1997, (in Japanese).
http://www.mlit.go.jp/river/hourei_tsutatsu/kasen/gaiyou/houritu/9705.html
16. MLIT, The Advisory Committee for future flood control, December 2010, (in Japanese).
http://www.mlit.go.jp/river/shinngikai_blog/tisuinoarikata/
17. MLIT, Carte on project evaluation, 2013, (in Japanese).
http://www.mlit.go.jp/tec/hyouka/public/jghks/chart.htm
18. Kinki regional development bureau of MLIT, Material 2 Flood control in Kuzuryugawa at 5th
Kuzuryuugawa river basin committee, September 2002, (in Japanese).
http://www.kkr.mlit.go.jp/fukui/ryuiki/shiryou.html
19. Water and Disaster Management Bureau, MLIT, 5th Study Group on Evaluation Methodology
of River Improvement, March 2013, (in Japanese).
https://www.mlit.go.jp/river/basic_info/seisaku_hyouka/gaiyou/seisaku/kenkyukai_hyouka/inde
x.html
20. Kinki regional development bureau of MLIT, Material3 Asuwagawa dam project, 7th Project
watch and evaluation committee, March 2012, (in Japanese).
http://www.kkr.mlit.go.jp/plan/zigyohyoka/index-2011-07.html
21. Japan International Cooperation Agency (JICA), Project for the comprehensive flood
management plan for the Chao Phraya river basin, September 2013.
62
22. T. Okazumi, S. Tanaka, Y. Kwak, B. B. Shrestha, and A. Sugiura A., Flood vulnerability
assessment in the light of rice cultivation characteristics in Mekong River flood plain in
Cambodia, Paddy and Water Environment, ISSN 1611-2490, Paddy Water Environ DOI
10.1007/s10333-013-0403-1, 2013.
23. Ministry of Foreign Affairs, Aid policy for Thailand, April 2013.
http://www.mofa.go.jp/mofaj/gaiko/oda/seisaku/houshin/pdfs/thailand-2.pdf
24. International Centre for Water Hazard and Risk Management, Public Works Research Institute,
“Supporting Investment for Water Related Disaster Management”, Asia Development Bank
Technical Assistance no. 7276, March 2013.
http://www.adb.org/projects/documents/supporting-investments-water-related-disaster-manage
ment-tacr
25. Budhendra B, Bright E, Coleman P, Urban M., LandScan USA: a high-resolution geospatial and
temporal modeling approach for population distribution and dynamics. GeoJournal 69: 103-117.
doi:10.1007/s10708-007-9105-9, 2007.
26. Farr T, Rosen P, Caro E, Crippen R, Duren R, Hensley S, Kobrick M, Paller M, Rodriguez E,
Roth L, Seal D, Shaffer S, Shimada J, Umland J, Werner M, Oskin M, Burbank D, Alsdorf D,
The Shuttle Radar Topography Mission, Rev. Geophys45, 2007.
27. Toutin T., DTM Generation from Ikonos In-Track Stereo Images Using a 3D Physical Model,
Photogrammetric Engineering & Remote Sensing, 70(6), 695–702, 2004.
28. Lehner B, Verdin K, Jarvis A., HydroSHEDS Technical Documentation. Version 1.0, World
Wildlife Fund US, Washington, DC: 1-27, 2004. http://hydrosheds.cr.usgs.gov
29. Plinston D., Mapping Flood Statistics in Selected Districts on the Cambodian Flood Plain:
Consultancy Report, Mekong River Commission, The Flood Management and Mitigation
Programme, Land Management Component, 2007.
30. Taniguchi T, Matsumoto T, Shimizu K, Horikawa N, Yoshida T., Development of a Distributed
Water Circulation Model Incorporating Various Paddy Water Uses Part 1, A Model for
Estimating Cropping Pattern and Area, Journal of Japan Society of Hydrology and Water
Resources 22 (2), 101-113, 2009.

63
31. Ros B, Nang P, Chhim C., Agricultural Development and Climate Change, The case of
Cambodia, Cambodia’s leading independent development policy research institute Working
Paper Series No. 65, 2011.
32. Mekong River Commission Secretariat, Flood Damages, Benefits and Flood Risk in Focal
Areas: The Flood Management and Mitigation Programme, Component 2: Structural Measures
& Flood Proofing in the Lower Mekong Basin, Draft Final Report, Volume 2C, 2010.

64
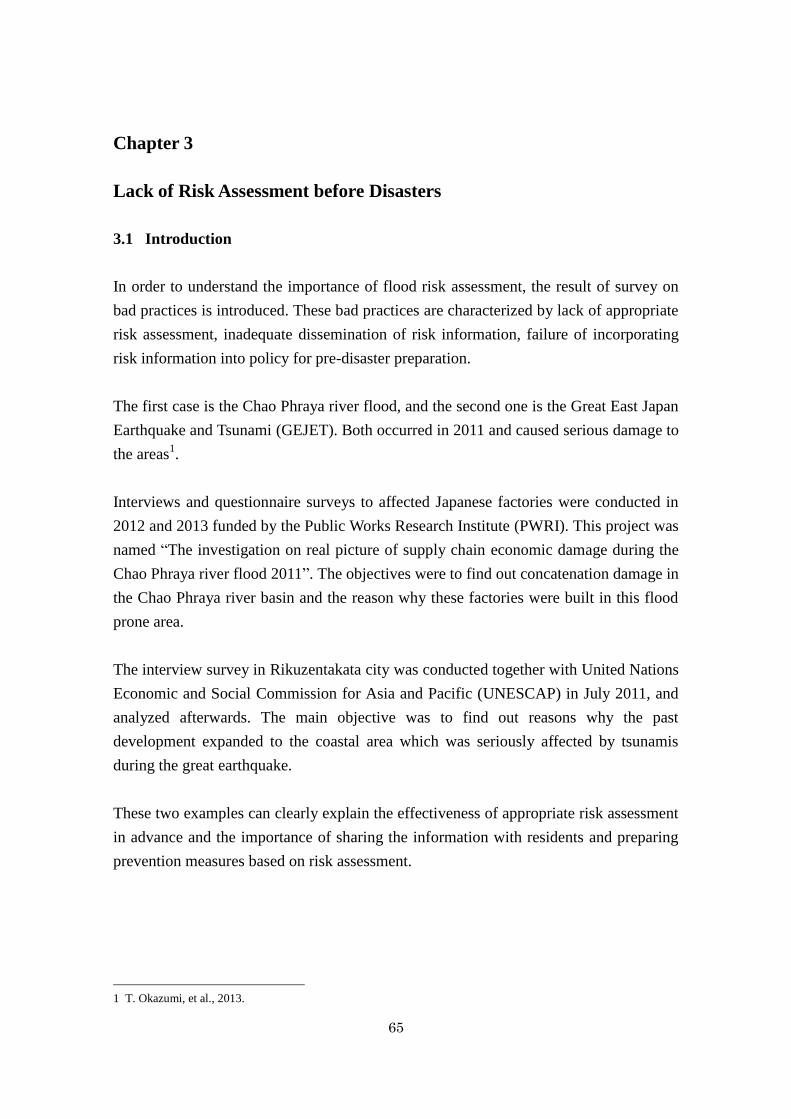
65
Chapter 3
Lack of Risk Assessment before Disasters
3.1 Introduction
In order to understand the importance of flood risk assessment, the result of survey on
bad practices is introduced. These bad practices are characterized by lack of appropriate
risk assessment, inadequate dissemination of risk information, failure of incorporating
risk information into policy for pre-disaster preparation.
The first case is the Chao Phraya river flood, and the second one is the Great East Japan
Earthquake and Tsunami (GEJET). Both occurred in 2011 and caused serious damage to
the areas1.
Interviews and questionnaire surveys to affected Japanese factories were conducted in
2012 and 2013 funded by the Public Works Research Institute (PWRI). This project was
named “The investigation on real picture of supply chain economic damage during the
Chao Phraya river flood 2011”. The objectives were to find out concatenation damage in
the Chao Phraya river basin and the reason why these factories were built in this flood
prone area.
The interview survey in Rikuzentakata city was conducted together with United Nations
Economic and Social Commission for Asia and Pacific (UNESCAP) in July 2011, and
analyzed afterwards. The main objective was to find out reasons why the past
development expanded to the coastal area which was seriously affected by tsunamis
during the great earthquake.
These two examples can clearly explain the effectiveness of appropriate risk assessment
in advance and the importance of sharing the information with residents and preparing
prevention measures based on risk assessment.
1 T. Okazumi, et al., 2013.
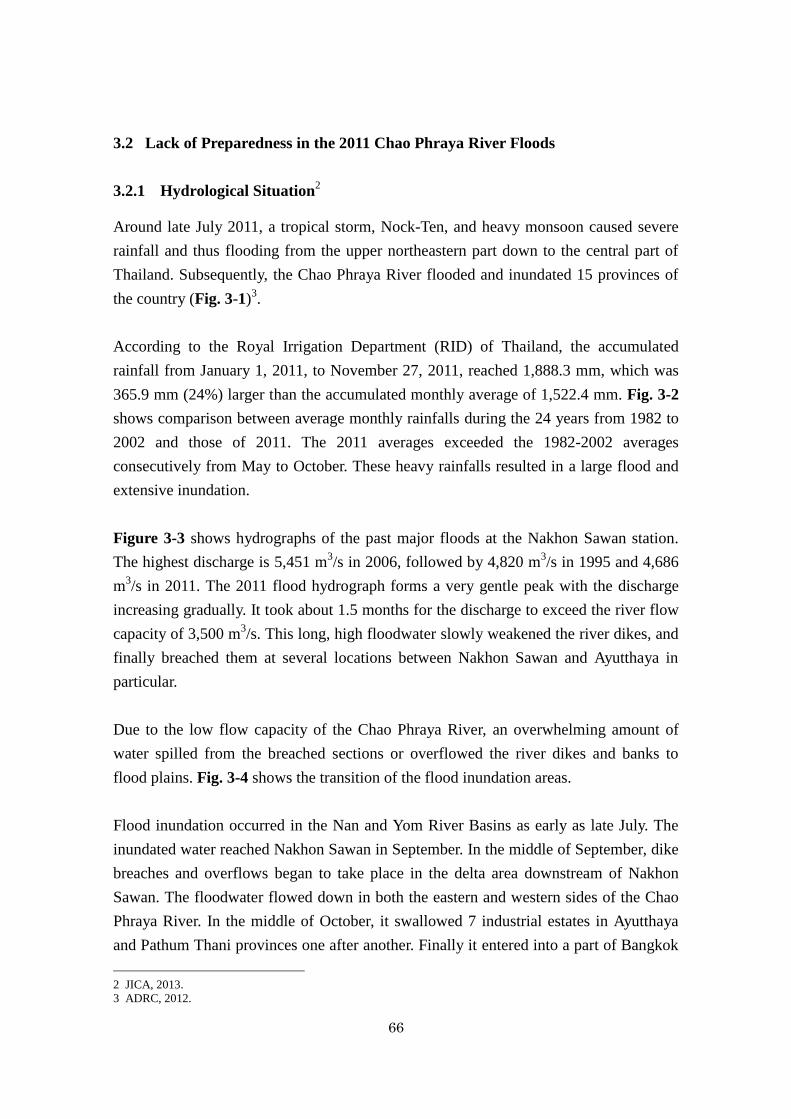
66
3.2 Lack of Preparedness in the 2011 Chao Phraya River Floods
3.2.1 Hydrological Situation2
Around late July 2011, a tropical storm, Nock-Ten, and heavy monsoon caused severe
rainfall and thus flooding from the upper northeastern part down to the central part of
Thailand. Subsequently, the Chao Phraya River flooded and inundated 15 provinces of
the country (Fig. 3-1)3.
According to the Royal Irrigation Department (RID) of Thailand, the accumulated
rainfall from January 1, 2011, to November 27, 2011, reached 1,888.3 mm, which was
365.9 mm (24%) larger than the accumulated monthly average of 1,522.4 mm. Fig. 3-2
shows comparison between average monthly rainfalls during the 24 years from 1982 to
2002 and those of 2011. The 2011 averages exceeded the 1982-2002 averages
consecutively from May to October. These heavy rainfalls resulted in a large flood and
extensive inundation.
Figure 3-3 shows hydrographs of the past major floods at the Nakhon Sawan station.
The highest discharge is 5,451 m3/s in 2006, followed by 4,820 m
3/s in 1995 and 4,686
m3/s in 2011. The 2011 flood hydrograph forms a very gentle peak with the discharge
increasing gradually. It took about 1.5 months for the discharge to exceed the river flow
capacity of 3,500 m3/s. This long, high floodwater slowly weakened the river dikes, and
finally breached them at several locations between Nakhon Sawan and Ayutthaya in
particular.
Due to the low flow capacity of the Chao Phraya River, an overwhelming amount of
water spilled from the breached sections or overflowed the river dikes and banks to
flood plains. Fig. 3-4 shows the transition of the flood inundation areas.
Flood inundation occurred in the Nan and Yom River Basins as early as late July. The
inundated water reached Nakhon Sawan in September. In the middle of September, dike
breaches and overflows began to take place in the delta area downstream of Nakhon
Sawan. The floodwater flowed down in both the eastern and western sides of the Chao
Phraya River. In the middle of October, it swallowed 7 industrial estates in Ayutthaya
and Pathum Thani provinces one after another. Finally it entered into a part of Bangkok
2 JICA, 2013.
3 ADRC, 2012.

67
by the beginning of November. In the lower areas, the inundation continued until the
floodwater drained naturally or was pumped out of the areas in December or later.
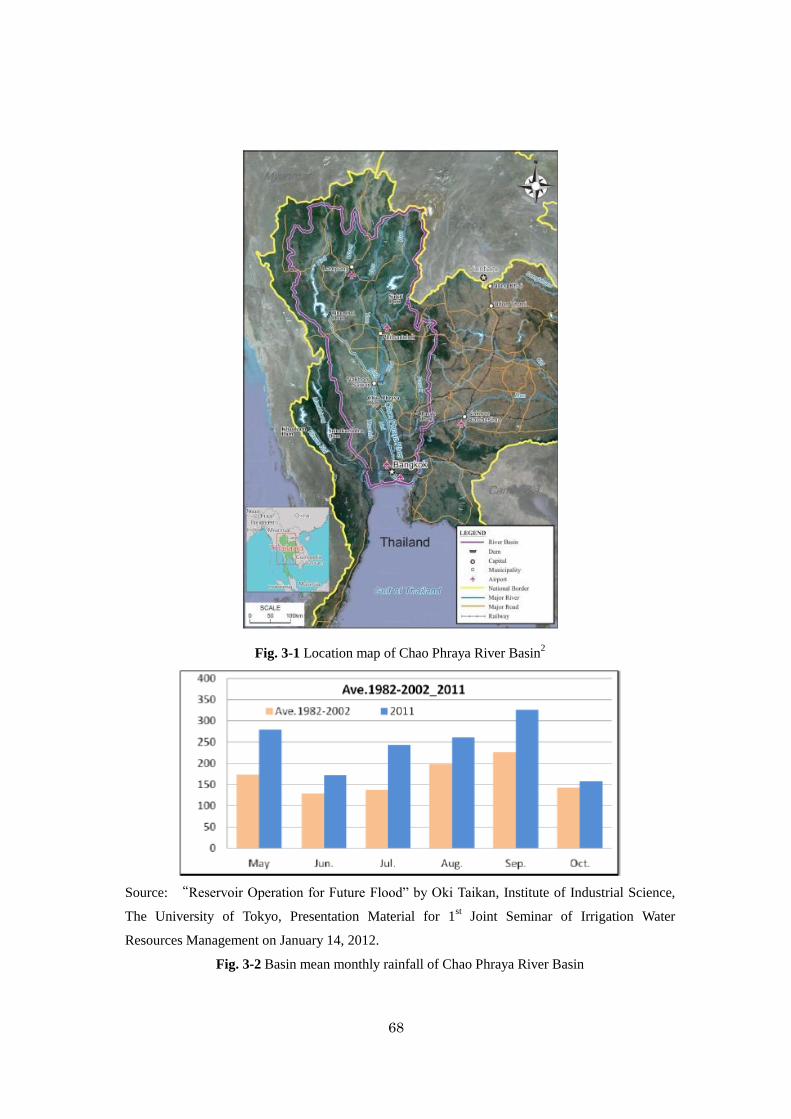
68
Fig. 3-1 Location map of Chao Phraya River Basin2
Source: “Reservoir Operation for Future Flood” by Oki Taikan, Institute of Industrial Science,
The University of Tokyo, Presentation Material for 1st Joint Seminar of Irrigation Water
Resources Management on January 14, 2012.
Fig. 3-2 Basin mean monthly rainfall of Chao Phraya River Basin
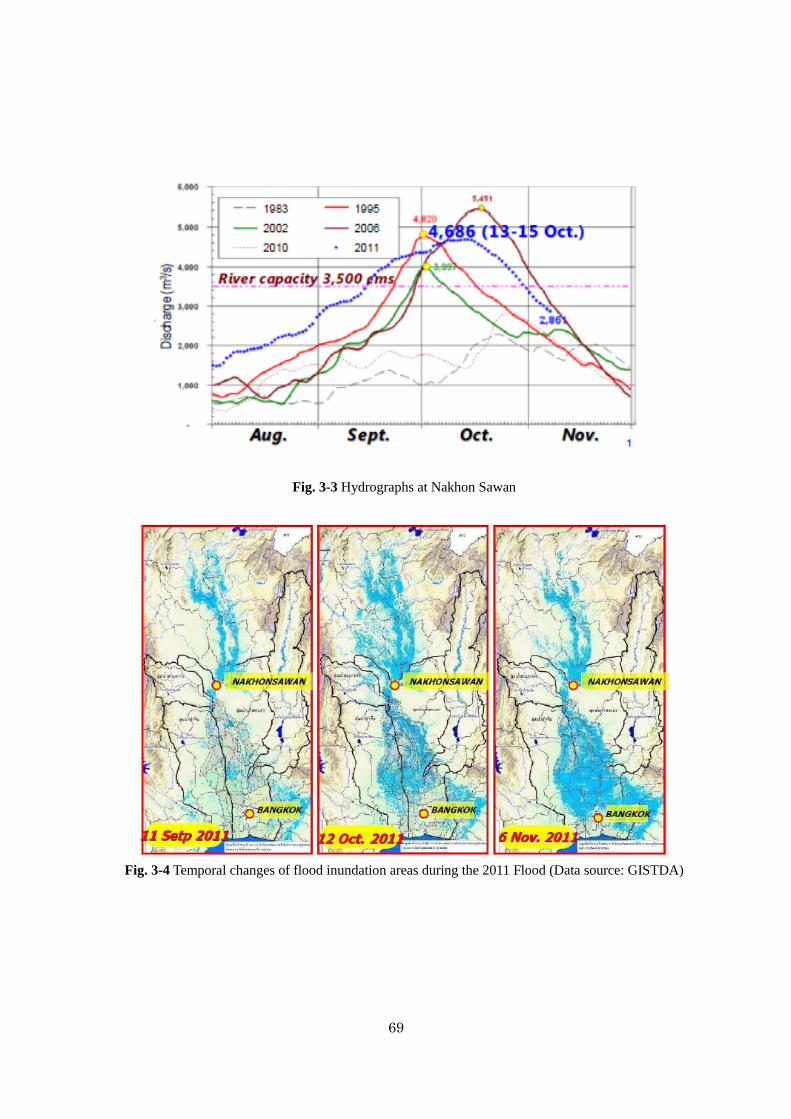
69
Fig. 3-3 Hydrographs at Nakhon Sawan
Fig. 3-4 Temporal changes of flood inundation areas during the 2011 Flood (Data source: GISTDA)
70
3.2.2 Reported Flood Damage
The total inundation area is estimated at approximately 28,000km2. Table 3-1 compares
the inundation areas of past major floods, which clearly shows how extensive the flood
inundation of 2011 was. Accordingly the extensive inundation caused enormous flood
damage as summarized in Table 3-2. Approximately 13 million people, i.e., 1 out of 5
Thai people, were affected, and 657 people were killed in the flood (as of December 1,
2011). Houses and infrastructures as well as agriculture areas were heavily damaged. In
particular, manufactures suffer huge damage and losses as described in the following
subsections.
After the flood disaster, damage and losses were assessed by various agencies. The
World Bank conducted Post Disaster Needs Assessment (PDNA) during November 7-25,
2011, to estimate damage and losses incurred by the flood in 2011 in collaboration with
the Ministry of Finance and both national and international agencies. The full
assessment report was finalized on January 27, 2012. There are also other damage
assessments and preliminary cost estimations for rehabilitation projects compiled by the
government of Thailand and Asian Development Bank (ADB) as well as Japan External
Trade Organization (JETRO).
(1) Post disaster needs assessment (PDNA)
Based on the DALA (Damage and Losses Assessment) methodology4, the total damage
and losses incurred by the flood in 2011 is estimated at 1.43 trillion THB, out of which
the damage of the physical assets amounts to 630.3 billion THB and associated losses
are 799 billion THB, respectively (Table 3-3). According to the DALA methodology,
damage refers to direct impacts on physical assets, products, raw materials machinery
and properties. Losses include reduced or lost production opportunities such as loss of
income, reduced production efficiency, increasing expenditures over a period of time.
Reduction in income due to interruption of service delivery and increase in transport
costs are also considered to be losses.
The manufacturing sector accounted for two-thirds of the disaster damage. Industrial
estates in Ayutthaya and Pathum Thani provinces were severely impacted. The water
resources management sector counted only damage referring to the physical damage
made to dykes, levees and canals, while the finance and banking sector counted only
4 Global Facility for Disaster Reduction and Recovery, access in 2013.
71
losses without serious physical damages. The tourism sector also suffered heavy losses
from losing tourists visits and canceling of attractions and events rather than damage
caused to physical assets.
(2) Rapid flood management assessment by ADB
ADB conducted rapid flood management assessment after the flood in 2011 and
released a report in January 2012. The analysis in the report summarized the impact of
the flood, flooding mechanism, including rainfall records, reservoir operation and flood
water diversion. The financial impact estimate was cited as 1.4 trillion THB from the
assessment of the World Bank (WB) (Table 3-4).
The ADB report analysis suggests that change of land use pattern, namely, reclamation
of wetlands and lack of town planning, increased the surface runoff and retarded flood
water flow. Inappropriate planning and/or engineering designs of infrastructure without
considering water flow patterns also contributed to complicate flood management.
(3) Industrial parks and estate survey by JETRO
JETRO conducted questionnaire surveys for Japanese companies at the occasions of
business seminars. The focus of the survey by JETRO was to update the damage and
impact situations of the Japanese companies and to offer information as to the current
situation and the policies and measures taken by the Thai government in relation to the
trade and investment so that the Japanese companies could make timely business
decisions. This helped the government of Japan to extend policy assistance to both
relevant Thai and Japanese parties to facilitate quick recovery of the manufacturing
sector. In terms of impacts of the manufacturing and retail sectors for Ayutthaya and
Pathum Thani provinces, JETRO and PDNA estimated at 208,611 million THB and
196,436 million THB, respectively. The estimates were similar although the surveys
were based on different samples. At the time of the questionnaire survey in November
2012, the Japanese companies were hoping to resume manufacturing at the same factory
sites in Thailand. No companies wanted to move out of Thailand at that point; however,
they may have to make different business decisions if the situation does not improve in
the future.
(3) Others
Even though the industrial areas with major damage are located in the past flood plains
72
and thus are very vulnerable to floods, the tenant companies had not been informed of
the fact at all. As a result, their awareness of the risk was low and flood preparedness
was insufficient as a whole. Generally speaking, in a sound market mechanism like the
one in the United States, the premiums of flood insurance change in accordance with
inundation depth so that users of the service can recognize the risk to which they are
exposed. In Thailand, however, the premiums do not vary depending on the potential of
risk at each location.
As a whole, the companies that suffered serious damage during the 2011 flood seems to
have low flood-risk awareness.
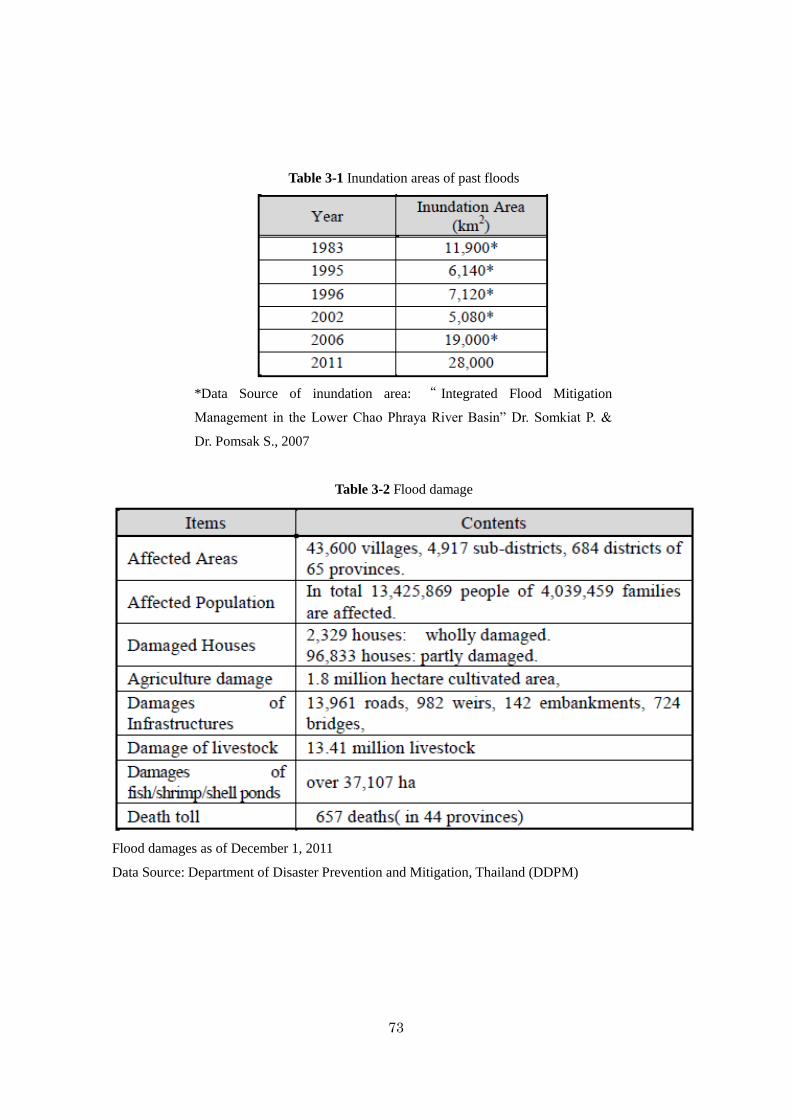
73
Table 3-1 Inundation areas of past floods
*Data Source of inundation area: “ Integrated Flood Mitigation
Management in the Lower Chao Phraya River Basin” Dr. Somkiat P. &
Dr. Pomsak S., 2007
Table 3-2 Flood damage
Flood damages as of December 1, 2011
Data Source: Department of Disaster Prevention and Mitigation, Thailand (DDPM)
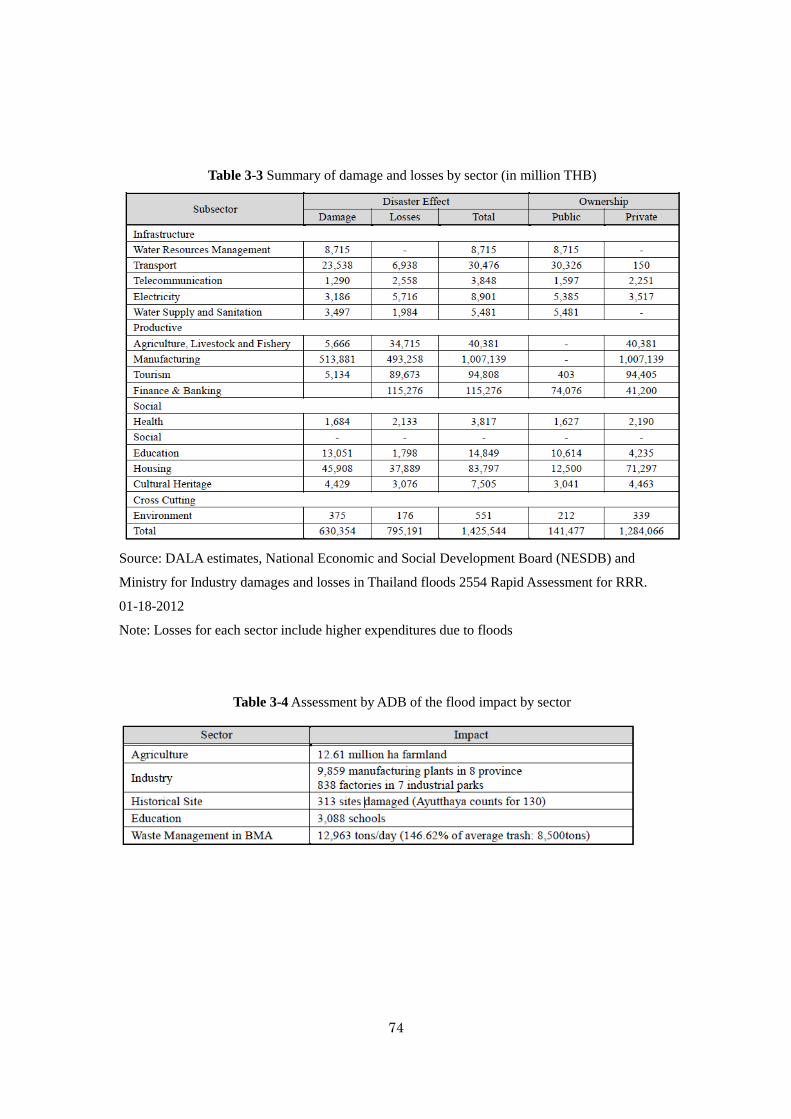
74
Table 3-3 Summary of damage and losses by sector (in million THB)
Source: DALA estimates, National Economic and Social Development Board (NESDB) and
Ministry for Industry damages and losses in Thailand floods 2554 Rapid Assessment for RRR.
01-18-2012
Note: Losses for each sector include higher expenditures due to floods
Table 3-4 Assessment by ADB of the flood impact by sector
75
3.2.3 Overview of Economic Damage
In overall, damage in agriculture, manufacturing and service industries decreased the
country’s GDP (market value) by about 33 billion baht and its economic growth by
3.7%. Consequently, the annual GDP growth resulted in a 0.1% increase in 2011, a huge
drop from the estimated growth of 3.8%5,6
(Table 3-5). Besides these economic drops,
the Chao Phraya floods drew global attention for one specific reason: the impact of the
floods did not remain within Thailand but spread all over the world mainly through
foreign companies and industrial complexes located at the center of the country. This
section is devoted to outline economic damage, especially the chain-reaction damage,
which is considered as the unique characteristic of this disaster event, including the
description of damage types and responses to them based on interviews conducted in
Thailand7.
This flood impacted not only Thailand but also other adjacent countries in Asia. Table
3-6 shows changes in automobile production for four months after the flood8. Thailand
shows a huge decline after the flood compared to the same months in the previous year,
and so do other countries. It shows an 85% drop in November 2011, the Philippines
22.1%, Viet Nam 11.3%, and Malaysia 2.5%. Indonesia was able to keep a high level of
automobile production in October 2011 but could not avoid the flood impact, recoding
only a 0.7% increase in November 2011 (Fig. 3-5).
5 H. E. V., Futrakul, 2012.
6 A. Termpittayapaisith, 2012.
7 METI, 2012.
8 METI, 2012.
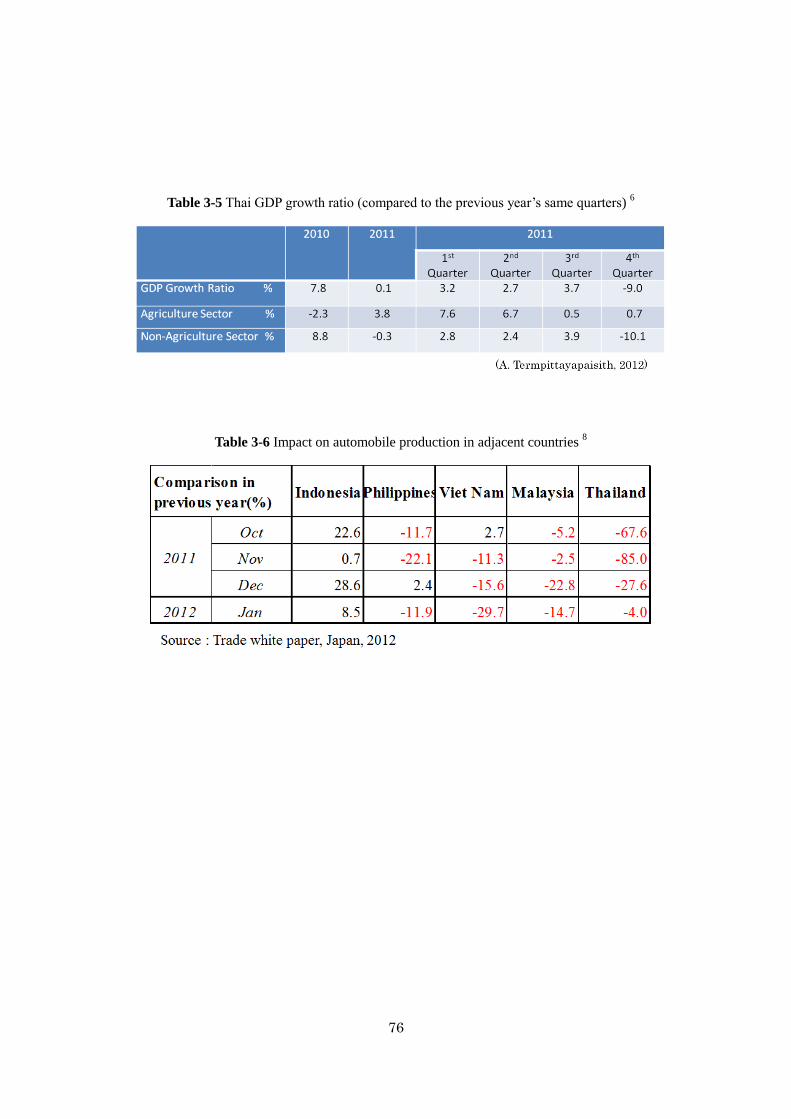
76
Table 3-5 Thai GDP growth ratio (compared to the previous year’s same quarters) 6
Table 3-6 Impact on automobile production in adjacent countries 8
77
The Japanese automobile makers have large proportions in auto manufacturing in the
Association of South-East Asian Nations (ASEAN) area. Especially their shares account
for more than 90% of automobile production in Thailand, Indonesia and the Philippines.
In addition, Thailand plays a hub role for supplying automobile parts to surrounding
countries and regions. In order to survey the impact of the supply-chain interruption by
the Thai flood, the movement of products was reviewed. The product movement in
Thailand and Guangdong in China showed a large impact by the Chao Phraya flood,
which further worsened by the Great East Japan Earthquake in March 2011(Fig. 3-6).
In order to figure out the impact of the flood on the global supply chain in relation to
Hard Disk Drive (HDD), the export of HDD to China before and after the flood was
compared (Fig. 3-7). The HDD export to China decreased by 21.0 % from the figure in
the previous month in 2011, although it was an increase of 6.8%, compared with that in
the same month in 2010. Furthermore, the export to China continued decreasing
dramatically, while China rapidly increased the import of HDD from the Republic of
Korea, the Philippines, Malaysia and increased Chinese products. Finally the total
import of HDD by China stopped decreasing (In November 2011, it was minus 2.1%
compared to the previous month, and plus 9.4% compared to the same month in the
previous year). Still, the import from Thailand was kept at a lower level, while the
import from other countries remained at a higher level, although the import from
Thailand gradually recovered. The total import of HDD to China actually grew larger
than that before the Chao Phraya flood (Fig. 3-7). All this proves that HDD makers and
other supply makers outside Thailand increased its productivity and provided alternate
products after the flood. The HDD industry was different from the automobile industry
in that the flood actually encouraged the production of alternative products to cover the
decrease of the supply from Thailand.
There was another interesting story. Many Japanese companies dispatched Thai workers
from Thailand to factories in Japan in order to keep their supply chains and production
during the Chao Phraya flooding.
Evidence can be seen in Fig. 3-8, which describes the number of Thai workers in Japan
and the world. Damaged Japanese factories dispatched many Thai workers to Japan
temporarily. The statistics in the Central Bank of Thailand indicated that the recent
number of Thai workers in the world is around 1 to 1.5 million and those in Japan count
500. However, just after the Chao Phraya flood, Thai workers in Japan increased up to

78
3,500 in December 2011 due to a large number of those workers sent to Japan, and it
rapidly decreased down to 400 in March 2012 because most of them went back to
Thailand.
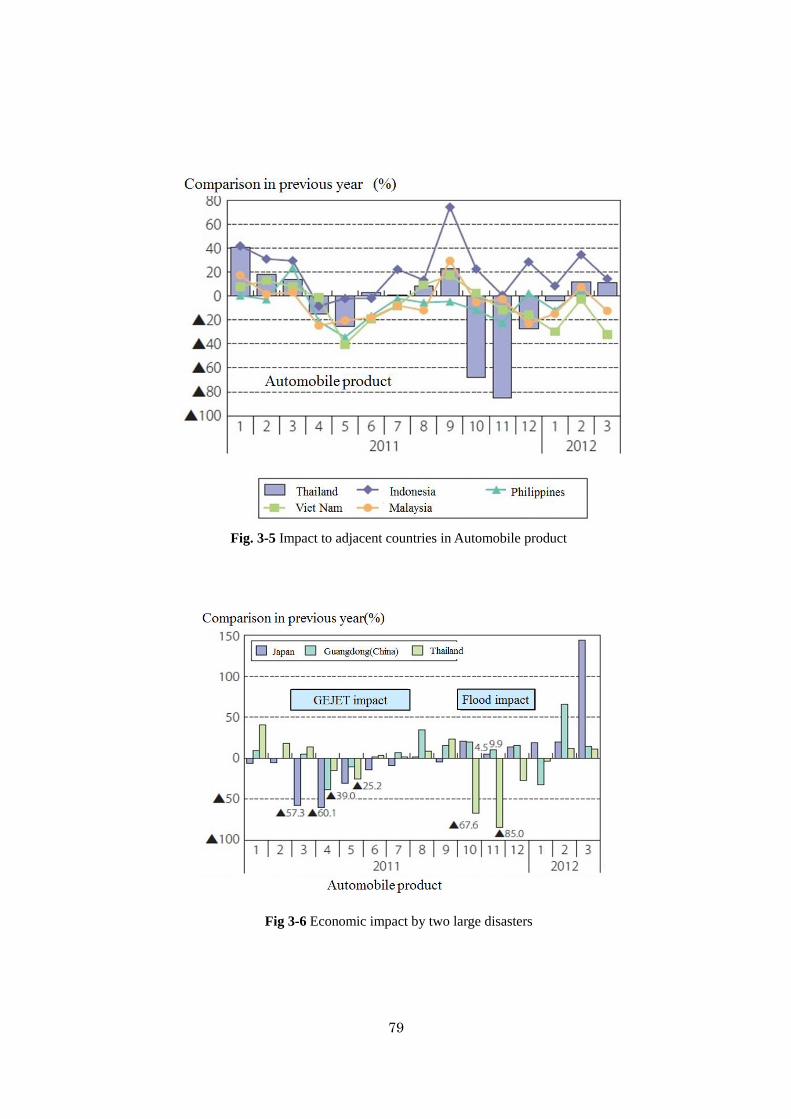
79
Fig. 3-5 Impact to adjacent countries in Automobile product
Fig 3-6 Economic impact by two large disasters
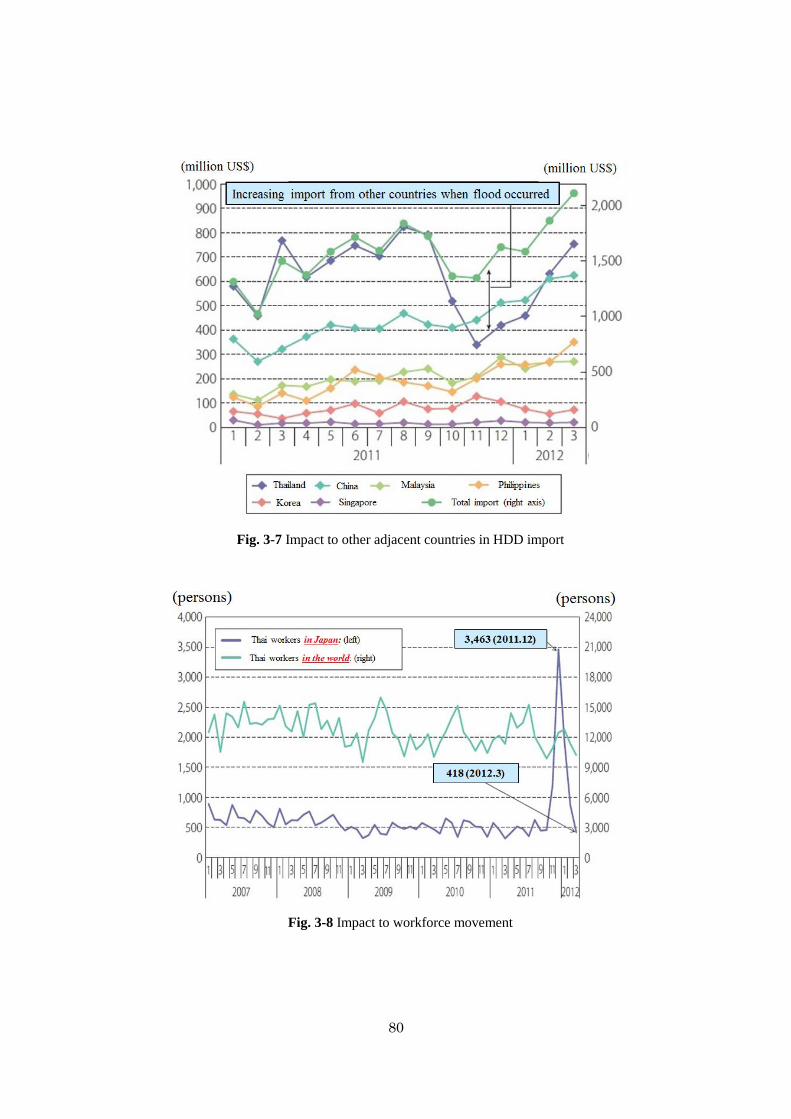
80
Fig. 3-7 Impact to other adjacent countries in HDD import
Fig. 3-8 Impact to workforce movement
81
3.2.4 Outline of Field Survey
With respect to the Chao Phraya River flood case, two sets of investigation were
conducted on the 2011 flood damage in Thailand, especially on its chain-reaction
impact on economic activity. First, literature review and interview survey were
undertaken in Japan for companies with factories affected by the floods, which was
followed by interview survey in Thailand in May 2012. In Thailand, interviews were
conducted with Japanese factories in four industrial complexes, nine Japanese
companies with flood-affected factories, the Japanese Chamber of Commerce, Bangkok
(JCC), and the Bangkok branch of JETRO. Some companies were introduced to the
investigation team through the Japan International Cooperation Agency (JICA), with
which ICHARM is jointly involved in a Chao Phraya flood management project. Others
were contacted thorough snowball sampling and the network of executives of Japanese
companies in Thailand.
Before interviews with individual companies, the team visited JCC and JETRO to
collect general information on expansion of Japanese companies in Thailand and their
responses to the disaster. Then, individual factories in the industrial complexes, such as
the Rojana Industrial Park, Hi-Tech Industrial Estate, Bang Pa-in Industrial Estate, and
Factory Land (Wangnoi) of Ayutthaya Province and the Nava Nakorn Industrial Estate
of Pathum Thani Province, were visited for interviews with representatives of each
factory. Interviews were also carried out at their headquarters in Bangkok. In August
2012, further investigation was conducted for 1,370 Japanese companies in Thailand
through the Internet with help from JCC. As of late-August, 38 of them responded and
their answers are currently being analyzed in detail.
3.2.5 Economic Damage Identified in this Survey
The impact of floods was particularly serious on local Japanese companies in economic
terms. More specifically, Japanese companies that based their businesses in the country
earlier than others had greater damage, reportedly because many of those companies
have their factories in the industrial complexes in central Thailand (Ayutthaya and
Pathum Thani Provinces) that are relatively old, mostly established in the 1980s9. From
October to December of 2011, well over 1,000 factories of 804 companies were
inundated including 43 factories in the Saha Rattana Nakorn Industrial Estate, 198 in
the Rojana Industrial Park, 143 in the Hi-Tech Industrial Estate, 89 in the Bangpa-In
9 The Japanese Society of Thai Studies, 2009.
82
Industrial Estate, 572 in the Factory Land Wangnoi, 227 in the Nava Nakorn Industrial
Estate, and 44 in the Bangkadi Industrial Park (Fig. 3-9). Remarkably, 449 out of 804
were Japanese companies10
. Japan experienced the first annual trade deficit in 2011
since 1980, supposedly in large part due to the Chao Phraya floods in addition to other
economic factors.
The expansion of economic losses caused by the 2011 Thai floods is attributed to
vertical specialization and a supply-chain structure on which Japanese companies have
commonly relied11
. According to the interviews with JETRO and JCC, in most cases,
Japanese manufacturers in Thailand import parts from Japan or procure them from local
manufacturers, put them together and export products to the global market. During the
disaster last year, this vertical specialization and parts procurement system worked
against them and became the principal factor for the damage to expand overseas.
Thailand has been a successful case in many industries, especially cars and electronics,
and thus supporting industries are also prosperous12
. This unfortunately has caused the
rapid and broad expansion of flood damage both domestically and internationally.
The production of HDD and automobile is a typical example. Thailand accounts for
43% of the world’s HDD production13
. The 2011 floods inundated HDD suppliers and
factories, causing price increases and product shortages. The impacts were far-reaching
throughout the world; the global production of end products requiring HDD installation,
such as computers and video recorders, also decreased. In the car industry, due to its
pyramid structure of supporting industries, in which the primary suppliers have over ten
times more secondary and tertiary suppliers underneath, the impact of flood damage
was even greater.
10 JETRO, 2012.
11 Tokyo Marine &Nichido Fire Insurance Co. Ltd., 2011.
12 Japanese Chamber of Commerce Bangkok, 2011/2012.
13 Development Bank of Japan, 2012.
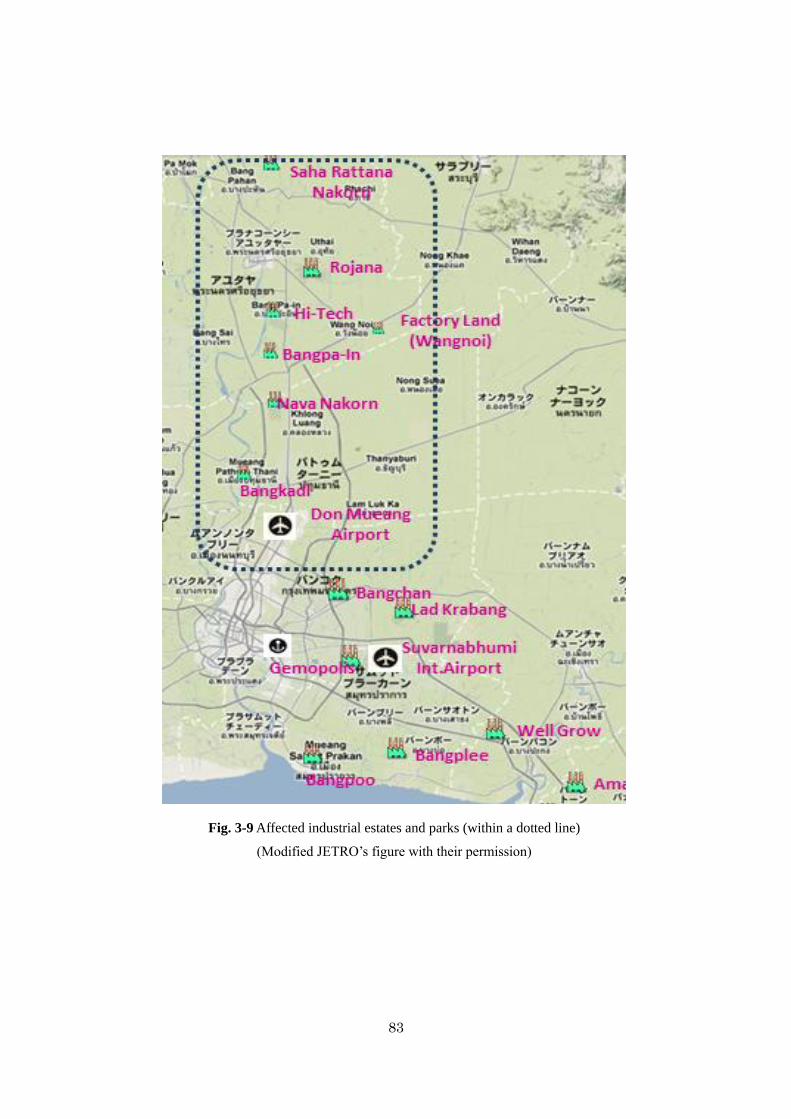
83
Fig. 3-9 Affected industrial estates and parks (within a dotted line)
(Modified JETRO’s figure with their permission)
84
3.2.6 Historical Background of Settlement of Japanese Companies
To identify reasons that Japanese companies had chosen to be in industrial complexes
affected by the 2011 Thai floods, various factors were sorted out into external and
internal ones. External factors include investment policies in favor of foreign companies
by the Board of Investment (BOI) and the Industrial Estate Authority of Thailand
(IEAT), deregulation regarding taxation and foreign workers, efforts by the Thai
government to attract specific industries such as cars, and Thailand’s high-quality and
inexpensive labor. In addition, socio-economic conditions in Japan including Japanese
youth avoiding the manufacturing industry and the strong yen are also considered as
external factors. Internal (corporate) factors include the facts that the country is
relatively safe and at a good location geopolitically and that people are friendly to
Japanese, as well as good social and living conditions14
.
Historically, industrial complexes along the Chao Phraya River were developed earlier
than others in the areas that used to be rice fields. Until the 1970s, industrial areas
around Bangkok were confined within an approximately 50 km from the capital, and
farmland lay farther outside. In the 1980s, more industrial areas were developed in five
provinces around Bangkok. That was the results from efforts by the public and private
sectors to attract foreign companies to Thailand by developing rice fields specifically
for industrial use and by building necessary infrastructures. Consequently, industrial
complexes are located in areas that used to be rice fields15
. Additional incentives were
also provided by BOI and IEAT for foreign companies to make investment to start their
businesses in Thailand16
.
A drastic turn took place in 1997at the Asia currency and economic crises. The Thai
government started economic structural adjustment under the supervision of the
International Monetary Fund (IMF), and had to address new foreign currency policy.
The government deregulated the limitation of investment ratio by foreign capital and
eliminated regulations on import tariff exemptions for raw and other materials. In 2001,
BOI selected five target industries of agriculture and fisheries, automobile, clothing,
information and communications and high-value added services and lifted investment
zone regulations for certain types of business. Subsequently, BOI also designated 2008
and 2009 as the Thailand Investment Year and encouraged more investment in existing
14 Organization for Small & Medium Enterprises and Regional Innovation, 2006.
15 J. Kitahara, 1995.
16 A. Suehiro, 1993.
85
businesses related to, for example, cars and electronics to strengthen competitive edges
in the industrial sector.
Secondary and tertiary suppliers have also come over to Thailand and started business.
Behind this corporate decision are not only the economic incentives explained so far but
also the recent trend of rising yen and a business judgment in which they think that it is
better for them to move to the same location with their main business partners to
continue securing strong business ties17,18,19
.
In May 2012, interviews were conducted to factory representatives of the Rojana
Industrial Park, the Hi-Tech Industrial Estate, the Bangpa-In Industrial Estate, the
Factory Land Wangnoi, and the Nava Nakorn Industrial Estate. Many of them
commonly responded that though they were aware of some flood risk, they thought that
no serious flooding would ever occur in their complexes because they are located in
areas previously used as rice fields.
3.2.7 Types of Chain-Reaction Economic Damage and Countermeasures
In general, companies in a supply chain have a very strong business tie between each
other based on mutual trust. In some cases, because of that, partner companies helped
flood-affected companies to restore their factories and resume manufacturing as soon as
possible. In particular, home appliance manufactures were under tremendous pressure,
because delay in supplying end products to the market eventually means smaller shelf
shares in retail stores, resulting in serious disadvantages in the market. Knowing that, in
the worst case, such conditions could last for a long time, manufacturers made desperate
efforts to restore their offices and factories sometimes even with help from their
partners.
Based on the interviews with factory representatives as mentioned before, the analyses
found that the chain-reaction economic damage can be categorized into three types as
tabulated in Fig. 3-10.
The first category includes the most serious cases. In these cases, there will be no
demand and no supply. What is possible is only to restore facilities as soon as possible.
17 K. Oizumi, 2012.
18 M. Mori, 2010.
19 T. Nakasu, et. al., 2011.
86
Those in this situation are required to secure sales channels for business survival, while
at the same time suppliers continue working to resume manufacturing, checking
progress in restoration and seeking for alternatives to supply as many parts as possible.
The A corporation in the Factory Land Wangnoi, for example, took an emergency
measure to continue manufacturing parts in partner factories. They took another
measure to secure their business by coordinating between parts suppliers and retail
stores not affected by the floods.
Companies in the second category responded differently. A precision instruments maker
is a case in point. This company usually imports parts from Japan, assembles products
in Thailand, and ships them back to Japan. Since this regular production process was no
longer possible as a result of the floods, they sent Thai workers to Japan to have them
continue doing the same work there, which then helped the corporation keep their
business. The company made such a decision because their production takes special
manufacturing techniques and their Thai workers are trained to be specialized in them.
In the third category, suppliers had a hard time because of huge drops in demand for
their parts and thus serious sales decreases. Some companies in this situation made
various efforts to minimize the impact of the floods. While waiting for regular partners
to resume operation, they tried to find new partners who can use their parts and also
control the production.
3.2.8 Conclusion for Chao Phraya Flood and Damage
As mentioned above, based on the Thai government policy, the reclamation was
conducted in the retarding and inundated area previously utilized as paddy field, and
development of industrial clusters has expanded this area to build more industrial parks.
Furthermore, several economic incentives made by the Thai government helped attract
more foreign factories.
While the rapid development in this area, sufficient risk assessment was not conducted
and information related to flood risk was not provided for residents. Then finally foreign
factories installed in these areas were seriously damaged by the 2011 flood.
This is a typical case of poor practice resulting from lack of risk assessment and not
sharing risk information before a disaster.
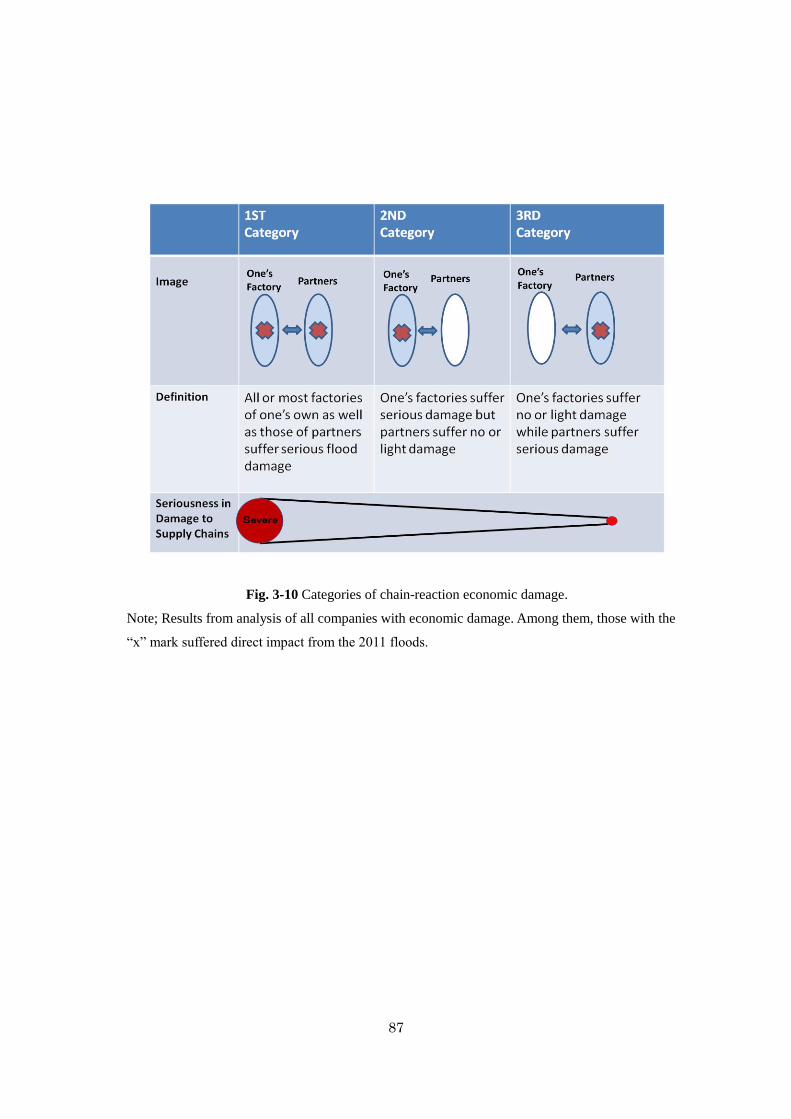
87
Fig. 3-10 Categories of chain-reaction economic damage.
Note; Results from analysis of all companies with economic damage. Among them, those with the
“x” mark suffered direct impact from the 2011 floods.
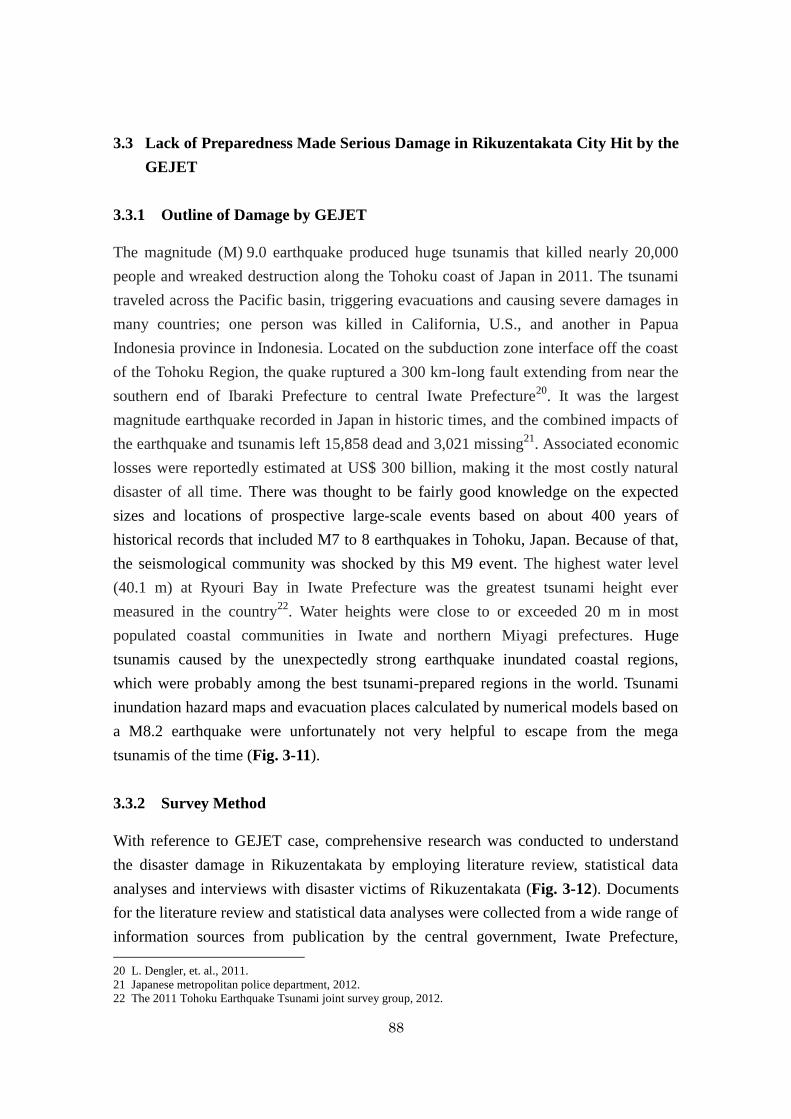
88
3.3 Lack of Preparedness Made Serious Damage in Rikuzentakata City Hit by the
GEJET
3.3.1 Outline of Damage by GEJET
The magnitude (M) 9.0 earthquake produced huge tsunamis that killed nearly 20,000
people and wreaked destruction along the Tohoku coast of Japan in 2011. The tsunami
traveled across the Pacific basin, triggering evacuations and causing severe damages in
many countries; one person was killed in California, U.S., and another in Papua
Indonesia province in Indonesia. Located on the subduction zone interface off the coast
of the Tohoku Region, the quake ruptured a 300 km-long fault extending from near the
southern end of Ibaraki Prefecture to central Iwate Prefecture20
. It was the largest
magnitude earthquake recorded in Japan in historic times, and the combined impacts of
the earthquake and tsunamis left 15,858 dead and 3,021 missing21
. Associated economic
losses were reportedly estimated at US$ 300 billion, making it the most costly natural
disaster of all time. There was thought to be fairly good knowledge on the expected
sizes and locations of prospective large-scale events based on about 400 years of
historical records that included M7 to 8 earthquakes in Tohoku, Japan. Because of that,
the seismological community was shocked by this M9 event. The highest water level
(40.1 m) at Ryouri Bay in Iwate Prefecture was the greatest tsunami height ever
measured in the country22
. Water heights were close to or exceeded 20 m in most
populated coastal communities in Iwate and northern Miyagi prefectures. Huge
tsunamis caused by the unexpectedly strong earthquake inundated coastal regions,
which were probably among the best tsunami-prepared regions in the world. Tsunami
inundation hazard maps and evacuation places calculated by numerical models based on
a M8.2 earthquake were unfortunately not very helpful to escape from the mega
tsunamis of the time (Fig. 3-11).
3.3.2 Survey Method
With reference to GEJET case, comprehensive research was conducted to understand
the disaster damage in Rikuzentakata by employing literature review, statistical data
analyses and interviews with disaster victims of Rikuzentakata (Fig. 3-12). Documents
for the literature review and statistical data analyses were collected from a wide range of
information sources from publication by the central government, Iwate Prefecture,
20 L. Dengler, et. al., 2011. 21 Japanese metropolitan police department, 2012.
22 The 2011 Tohoku Earthquake Tsunami joint survey group, 2012.
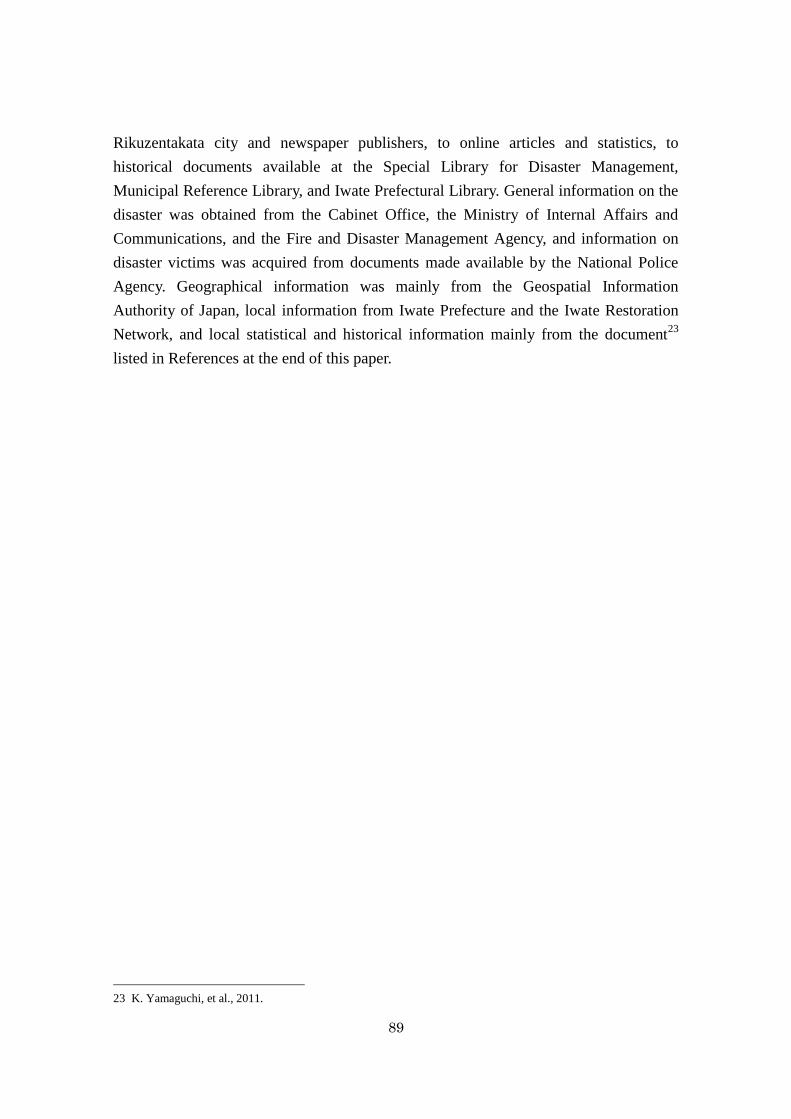
89
Rikuzentakata city and newspaper publishers, to online articles and statistics, to
historical documents available at the Special Library for Disaster Management,
Municipal Reference Library, and Iwate Prefectural Library. General information on the
disaster was obtained from the Cabinet Office, the Ministry of Internal Affairs and
Communications, and the Fire and Disaster Management Agency, and information on
disaster victims was acquired from documents made available by the National Police
Agency. Geographical information was mainly from the Geospatial Information
Authority of Japan, local information from Iwate Prefecture and the Iwate Restoration
Network, and local statistical and historical information mainly from the document23
listed in References at the end of this paper.
23 K. Yamaguchi, et al., 2011.
90
Fig 3-11 The 2011 Tohoku Earthquake Tsunami Joint Survey (TTJS) Group
(http://www.coastal.jp/ttjt/ access as of 19 December 2013)32
Fig. 3-12 Location of Rikuzentakata city
91
3.3.3 Methodology of Interview Survey in Rikuzentakata City
Interview survey was conducted during 18-28 July 2011. A pair or trio of interviewers
visited disaster victims in person at shelters, makeshift houses, remains of private
houses or other places to which they moved after the disaster.
During an interview, interviewees were asked a series of questions according to the
prepared questionnaire sheet. However, the survey was carried out flexibly, not rigidly
following the plan, carefully considering the rights and conditions of interviewees.
A total of 37 victims participated in this interview survey, which helped understand the
evacuation behavior and its background information of 207 people including 55 who
were killed during the disaster.
The joint investigation team on evacuation during the March 11 tsunami disaster
carefully coordinated all interviews of different researchers in this area. The
investigation team including the author was assigned to Rikuzentakata and conducted
the survey with the prepared questionnaire at several places such as shelters and
makeshift houses after getting permission from Rikuzentakata city and its city mayor.
The interviews were conducted very carefully, providing extra care for the feelings of
victims. Although the procedure was all arranged beforehand, the interviewers did not
mind the victims sidetracking, as they had agreed among them before the survey to go
along with the interviewees and listen to whatever they would want to talk about. They
were even prepared to discontinue the interview anytime if necessary. A total of 32
interviews both for individuals and families were carried out during the 2-week survey,
and about 2 to 3 hours was spent per interview.
The survey was originally planned as a quantitative investigation using questionnaires
but turned out to be more like a qualitative investigation when actually conducted. The
interviewees were 37 disaster victims, consisting of 21 females and 16 males aged 40 or
older, though attributes and ages were not determined in some cases. The interview
questions were asked mainly based on the prepared questionnaire, including the life or
death of family members and their detailed evacuation behavior, the relevancy of the
recent evacuation behavior to past tsunami experience, the awareness about hazard
maps, the experience of family talk about tsunamis, the participation in municipal
evacuation drills, and any requests to city and state governments. Besides their answers
92
to the questions, whatever they were willing to talk about was all documented. This
report is written based on part of such recorded interview results.
3.3.4 Urban Development in Rikuzentakata City
On-site interviews were conducted with residents of Rikuzentakata city, which suffered
tremendous tsunami damage, in addition to intensive literature review.
Fig. 3-13 shows the demographic changes in Rikuzentakata after 1960, when the Chili
Tsunami hit the city along with other coastal areas. Comparison of the areas in the black
circles reveals a rapid development of the Takata downtown area after 1960. According
to demographic statistics provided by Iwate Prefecture, Rikuzentakata’s population
showed a 21% decrease between 1980 and 2010. On the other hand, the population of
the Takata area increased from 6,461 in 1950 to 7,711 in 200524
. This population
increase, and hence the expansion of the Takata downtown area, reflected social
conditions of the time. After the 1960 Chili tsunami disaster, tsunami protection projects
were launched along with other national-land enhancement projects, thanks to rapid
economic progress after the strong Isewan Typhoon Disaster in 1959. During those
projects, over 5-meter-high seawalls were constructed to protect the Takata area, which
accelerated the area’s development.
Based on information provided by Rikuzentakata city during the on-site investigation,
the casualty rate of the downtown Takata area is 12%, which is twice as high as the
second highest rate of 6% in Kesen Town. The interview comments of Takata residents
coincide with these statistics and other information. The evidence from the interviews
shows that the residents did not start evacuating right away, that they did not expect the
tsunami to arrive so soon, and that they did not imagine the tsunami coming.
The interviews with affected local residents also revealed that the association of the
initial warning on the tsunami height with their past experience delayed their evacuation.
Rikuzentakata had been hit twice by tsunamis from the earthquakes in Chile; the
tsunami heights were 4-5 meters high in 1960 and 1.9 meters in 2010 and did not cause
serious harm to the area. Because the first warning by Japan Meteorological Agency
(JMA) announced that the expected tsunami height would be about 3 meters, many
local people did not start evacuation soon enough, taking it for granted that the coming
24 Iwate Survey of Statistics Section, 2012.

93
tsunami may also cause little harm to the area. The interview results clearly indicated
that many people thought the tsunami would never come over the railway until they
confirmed its scale with the naked eye. Most tsunami survivors are those living on
higher ground who would have a plenty of time to evacuate even if they start escaping
after seeing the arrival of tsunami.
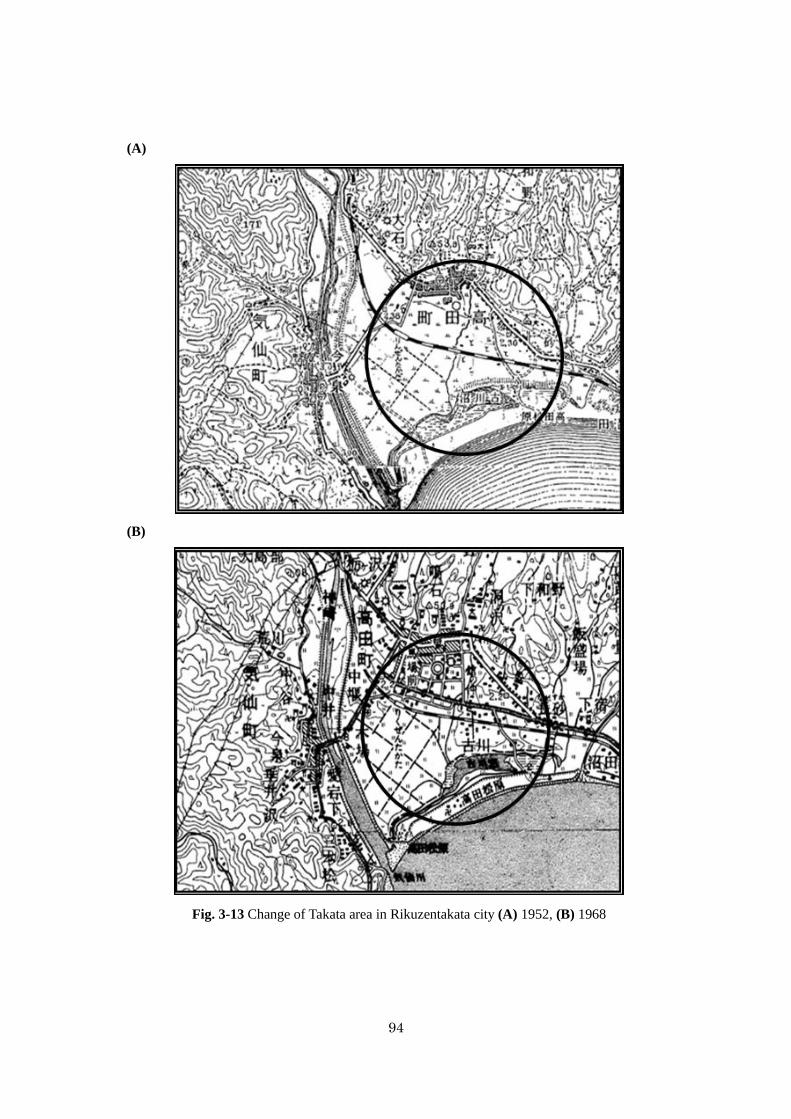
94
(A)
(B)
Fig. 3-13 Change of Takata area in Rikuzentakata city (A) 1952, (B) 1968
95
3.3.5 Conclusion for the Rikuzentakata City Damage
The Rikuzentakata case shows that they expanded urban development up to the coastal
area although the area had a history of being affected by tsunami before. After 1960
because of the Chili tsunami, higher seawalls were implemented. This may be one of the
reasons to expand the development up to the coast.
The improvement of seawalls ironically led to the low preparedness of the residents.
They may have thought that the seawalls were now high enough to protect them from
previous tsunamis, paying little attention to inadequate warning systems. Further
investigation is necessary to confirm the effect of the construction of the seawalls on
local residents.
3.4 Conclusion
In this chapter, two cases were introduced as poor practices. The first case is the Chao
Phraya river flood, and the second one is GEJET. Both occurred in 2011 and caused
serious damage to the areas.
These two examples can clearly explain the effectiveness of appropriate risk assessment
in advance and the importance of sharing information with residents and preparing
prevention measures based on risk assessment.
In the Chao Phraya river flood case, the reclamation was conducted in the retarding and
inundated areas that were utilized as paddy fields previously, and the development of
industrial clusters has expanded in these areas to build more industrial parks with
several economic incentives made by the Thai government. Despite this rapid land
development, sufficient risk assessment was not conducted and information on flood
risk was not provided. Then finally factories in the developed areas were seriously
damaged during the 2011 flood. This is a typical case of poor practice resulting from
lack of risk assessment and risk information sharing before a disaster.
The Rikuzentakata case shows that they expanded urban development up to the coastal
area although the area had a history of being affected by tsunami before. After 1960,
higher seawalls were constructed because of the Chili tsunami. The improvement of
seawalls ironically led to the low preparedness of the residents. They may have thought
that the seawalls were now high enough to protect them from previous levels of
96
tsunamis, paying little attention to inadequate warning systems. In addition, experience
of no significant damage in Chili earthquake tsunami also resulted in low preparedness
among local residents. More investigation is necessary to confirm the psychological
effect of the construction of the seawalls on local residents.
Although each case addresses an issue of accepting development in high risk areas, the
cases clearly represent poor practices in terms of preparedness before disasters on
implementation of risk assessment beforehand and sharing information to all level in
this area. However, careful attention should also be paid to such development in
promoting the mainstreaming of disaster risk reduction in developing policy as
explained in chapter 1.
Poor practices can ironically provide insightful lessons for better understanding disaster
risk management. Based on this understanding, the author will present a practical case
study on uncertainty estimation of flood risk assessment in a developing country in the
following chapter.
97
Reference
1. T. Okazumi, T. Nakasu, M. Sugimoto, and Y. Adikari: Lessons Learnt From Two Unprecedented
Disasters in 2011 -Great East Japan Earthquake and Tsunami in Japan and Chao Phraya River
flood in Thailand-, Background Paper prepared for the Global Assessment Report on Disaster
Risk Reduction 2013. access in 2013:
http://www.preventionweb.net/english/hyogo/gar/2013/en/home/documents.html
2. Japan International Cooperation Agency (JICA), Project for the Comprehensive Flood
Management Plan for the Chao Phraya River Basin, March 2013.
3. Asian Disaster Reduction Center, Thailand: Tropical Strom, Flood: 2011/08/03, 2012
http://www.adrc.asia/view_disaster_en.php?NationCode=764&lang=en&KEY=1544
4. Global Facility for Disaster Reduction and Recovery (GFDRR), Damage, Loss and Needs
Assessment – Tools and Methodology, access at 2014 https://www.gfdrr.org/Track-III-TA-Tools
5. H. E. V., Futrakul, Thailand's economy after the great flood, BLL seminar handout March 23,
2012, Tokyo, 2012. http://www.rieti.go.jp/en/events/bbl/12032301.pdf
6. A. Termpittayapaisith, NESDE Secretary General, Thailand’s Future Development and Water
Management Plans, 2012; http://blogs.yahoo.co.jp/festiva1202/65551342.html
7. Ministry of Economy, Trade and Industry (METI), Disaster Response for Thai Flood, Tokyo,
2012 (in Japanese). http://www.meti.go.jp/topic/data/111028aj.html
8. METI, Trade White Paper 2012 (in Japanese).
http://www.meti.go.jp/report/tsuhaku2012/2012honbun_p/index.html
9. The Japanese Society of Thai Studies ed., Thai Dictionary, Mekong, Japan, 2009 (in Japanese).
10. JETRO, Special Topics: Information on Thai Flood Disaster Recovery, Tokyo, 2012 (in
Japanese). http://www.jetro.go.jp/world/asia/th/flood/
11. Tokyo Marine &Nichido Fire Insurance Co. Ltd., Lesson Learned from 2011 Thai Flood: Water
related disaster risk countermeasures points for overseas offices, Tokyo Marine &Nichido Fire
98
Insurance Co. Ltd., Tokyo, 2011 (in Japanese).
12. Japanese Chamber of Commerce Bangkok, Economic Overviews in Thailand, Bangkok,
2011/2012 (in Japanese).
13. Development Bank of Japan, Impact for HDD Supply Chains caused by Thai Flood, Japan, 2012
(in Japanese). http://www.dbj.jp/ja/topics/report/2011/files/0000008482_file2.pdf
14. Organization for Small & Medium Enterprises and Regional Innovation, Japan, Factual
Investigation on Business Challenge for SME in Thailand, 2006
15. J. Kitahara, Natural and Geographical Features, T. Ayabe, and Y. Ishii, ed., To know more about
Thailand, Kobundo, 1995(in Japanese).
16. A. Suehiro, Thailand: Development and Democracy, Iwanamishoten, 1993(in Japanese).
17. K. Oizumi, How to Think about Thai Flood: Reducing Natural Disaster Risk on Supply Chains,
RIM Transpacific Business Information : 12-44, 2012(in Japanese).
18. M. Mori, Special Issue on Response to A Strong Yen: Starting up Activities Overseas by
Japanese Manufacturing Industries for Survival, Factory Management : 56-12,
Nikkankogyoshinbun, 2010(in Japanese).
19. T. Nakasu, and J. Sato, Thai Environmental Chronology Edit Committee ed. An Environmental
Chronology, Japan and the World, Suirensya, 2011(in Japanese).
20. L. Dengler and M. Sugimoto, Learning from Earthquakes the Japan Tohoku Tsunami of March
11, 2011, EERI/ERI/ITSTs special earthquake report, November, California, 2011.
http://www.eqclearinghouse.org/2011-03-11-sendai/files/2011/11/Japan-eq-report-tsunami2.pdf
21. Japanese metropolitan police department, The Causalities number of the Great East Japan
Earthquake, Tokyo, 2012(in Japanese).
22. The 2011 Tohoku Earthquake Tsunami joint survey group, Field survey results 14 Jan 2012,
Japan, 2012. http://www.coastal.jp/tsunami2011/

99
23. K. Yamaguchi, Y. Shimizu, et al., Japan Descriptive Geographical Memorandum: Hokkaido and
Tohoku II, Asakurashoten, 2011(in Japanese).
24. Iwate Survey of Statistics Section, Iwate Statistics Information, 2012(in Japanese).
http://www3.pref.iwate.jp/webdb/view/outside/s14Tokei/top.html

100
101
Chapter 4
Uncertainty Estimation in the Process of Flood Risk Assessment
4.1 Introduction
4.1.1 Necessity of study on uncertainty
The importance of flood risk assessment has been reaffirmed recently due to the recent
trend of mainstreaming of disaster risk reduction as described in Chapter 1. The
evidence on lack of risk assessment was also confirmed in Chapter 2. In Japan, flood
risk assessment has already established its legal status officially, and has been
implemented in various projects for flood risk reduction as a standardized procedure. In
short, flood risk assessment is mandatory prior to all activities related to flood risk
reduction. In addition, the challenge to obtain more accurate results is continuing, and
progress in this area is constantly being made.
On the other hand, flood damage is still increasing, and enormous economic and human
impacts occur in the world, especially in Asia, which is a region with rapid population
and economic growth. However, the condition of implementation of flood risk
assessment was not so improved in collection and archives of disaster data. It is still a
lot of problems to implement flood risk assessment in the region as described in Chapter
2.
Uncertainty is one of the major issues in flood risk assessment. It is composed of
several steps and each step contains uncertainty. To improve its accuracy effectively, it
is necessary to identify which part of flood risk assessment is the source of uncertainty.
Unfortunately, few studies have been done on uncertainty in terms of the entire process
of flood risk assessment. Research on uncertainty in flood runoff and flood inundation
models can be easily found in the field of hydrology and hydraulics, but discussions on
uncertainty in relation to flood risk assessment as a holistic system are hardly found.
In this chapter, the study on identification of flood risk assessment in a developing
country is introduced to explain which step has a higher degree of uncertainty and how
influential uncertainty from each step may be over the final result. Furthermore,
assuming the entire procedure of flood risk assessment as a system, this study shows
102
how results can be better when each step is improved1. It is hard to find this type of
research involving a developing country, although some studies are found in the case of
developed countries.
4.1.2 Uncertainty Estimation
While Guide to the expression of uncertainty in measurement (GUM) describes
uncertainty in terms of the measurement process2, Takemura et al.
3 applied the concept
to the precaution approach of disaster countermeasures to categorize risk assessment
objectively. For their decision-making process, they classified cases of risk assessment
into three stages: certainty, risk, and uncertainty, and the latter stage was further
separated into ambiguous and blind decision making. Takemura et al., concluded that
the state of blindness in decision-making should be avoided as much as possible, and
that decisions should be made in the state of ambiguity or, more preferably, in the risk
stage when decisions can be made based on likelihood.
B. Merz et al.4 attempted to categorize uncertainty into epistemic and aleatory
uncertainty. They explained aleatory uncertainty is unavoidable and occurs regardless of
efforts to prevent it. Epistemic uncertainty can be reduced by technical improvement. In
this thesis, the author highlights epistemic uncertainty and explains how to reduce it in
flood risk assessment.
4.1.3 The Process of Uncertainty Estimation
According to GUM, the process of uncertainty estimation starts with identifying
uncertainty causes, then estimation of individual uncertainty for each cause, and then
combines all individual uncertainties to evaluate total uncertainty.
In this thesis, based on the standard flood risk assessment process, the author identified
and evaluated potential uncertainty in each assessment module and evaluated the most
critical module for the total of uncertainty by comparing uncertainties in modules with
the coefficient of variation as the standard uncertainty. Following the research of B.
Merz et al., and similar studies, the author identified and evaluated the major causes of
uncertainty listed in their paper, reviewing uncertainty causes and other related items
1 T. Okazumi et al., 2013.
2 JCGM, 2010.
3 K. Takemura, et al., 2004.
4 B. Merz, et al., 2009.
103
during the process of flood risk assessment. The author paid particular attention to
observation data inaccuracy, lack of validation information for the runoff and inundation
calculation, and lack of risk model validation data, which are major problems in
developing countries.
4.2 Previous Study
Few studies have addressed uncertainty in each step of flood risk assessment except B.
Merz and his colleagues, Helmholtz-Centre Potsdam, GFZ German Research Centre for
Geoscience, who have produced some papers. In this section, “Flood risk curves and
uncertainty bounds, 2009”4 which discusses uncertainty by utilizing several runoff
models and risk models at each step of flood risk assessment in River Rhine, will be
introduced as a good reference before tackling the targets.
4.2.1 Purposes
B. Merz and his fellow researchers attempt the separation between aleatory and
epistemic uncertainty in flood risk analysis conducted in the City of Cologne, Germany.
This flood risk assessment consists of three modules; i) flood frequency analysis, ii)
inundation estimation, and iii) damage estimation. In their study, the epistemic
uncertainty of each module is quantified. The epistemic uncertainty associated with the
risk estimation is reduced by introducing additional information into the risk analysis.
Finally, the contribution of the other modules to the total uncertainty is quantified. Then,
they explain the separation of the uncertainty (epistemic) that can be reduced by more
knowledge and the uncertainty (aleatory) that is not reducible.
4.2.2 Study area
The city of Cologne is located at the Lower Rhine (Fig. 4-1). At the Cologne station, the
Rhine has a drainage area of 144,232 km2. Floods in Cologne are caused by rainfall
events with long duration, typically in the range of 10 to 20 days. Most of the floods are
winter floods, caused by rather moderate rainfall.
4.2.3 Data and information
Cologne has a long experience with floods. Fig. 4-2 shows the systematic flood
observations at the Cologne station as well as historic flood records. Recent floods
104
occurred in December 1993 and in January 1995. Both floods had a similar genesis. The
Christmas flood of December 1993 was caused by high antecedent soil moisture due to
a first sequence of rainfall events, followed by abundant rainfall in a second sequence
and snow melt. In January 1995, a similar effect was produced by snow melt and frozen
soil in the uplands. Thus, heavy precipitation in the uplands of the Middle and Lower
Rhine resulted in catastrophic 5 flooding events5,6
. The damages reported to be inflicted
on Cologne amounted to €76.7 million and €33.2 million in 1993 and 1995,
respectively7,8
.
5 Disse et al., 2001.
6 Pfister et al., 2004.
7 Vogt, 1995.
8 Fink et al., 1996.
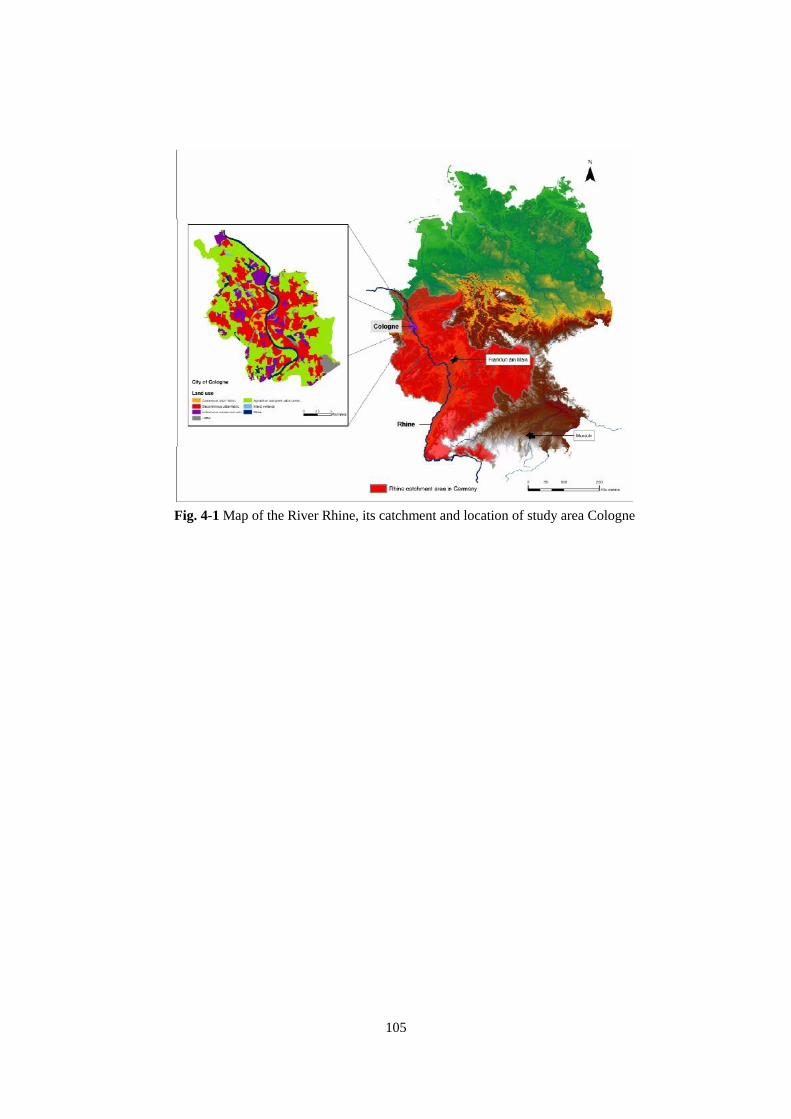
105
Fig. 4-1 Map of the River Rhine, its catchment and location of study area Cologne
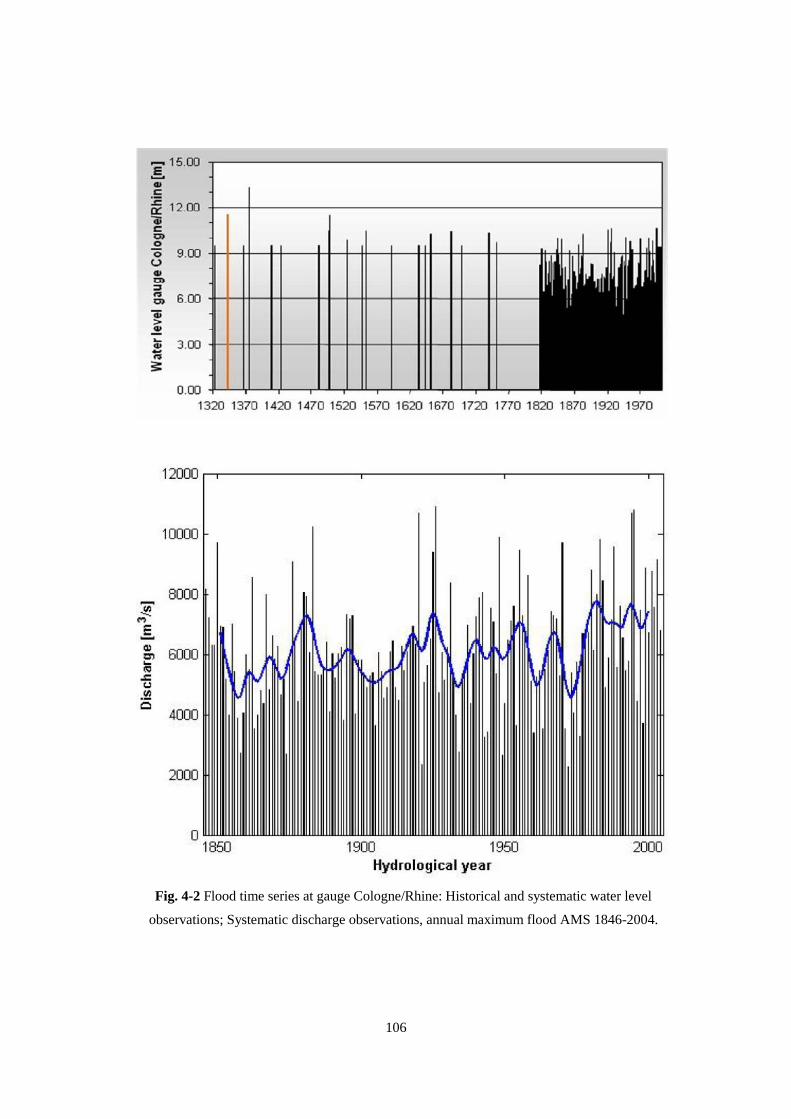
106
Fig. 4-2 Flood time series at gauge Cologne/Rhine: Historical and systematic water level
observations; Systematic discharge observations, annual maximum flood AMS 1846-2004.
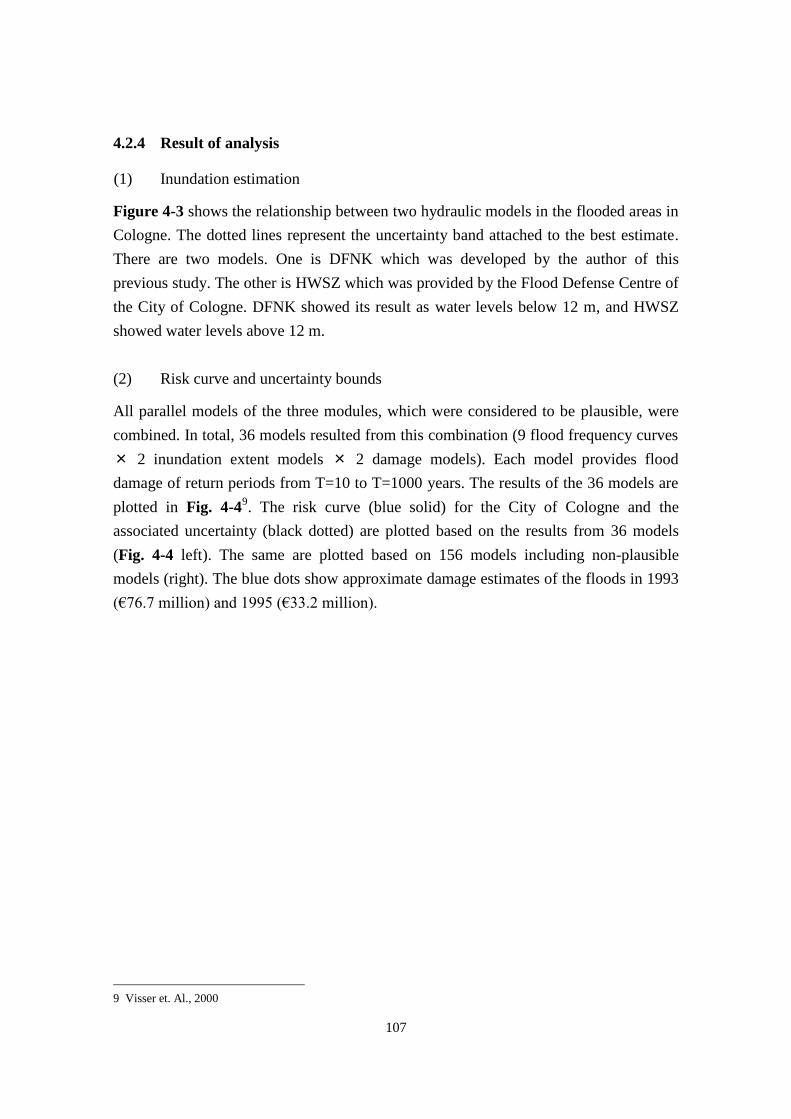
107
4.2.4 Result of analysis
(1) Inundation estimation
Figure 4-3 shows the relationship between two hydraulic models in the flooded areas in
Cologne. The dotted lines represent the uncertainty band attached to the best estimate.
There are two models. One is DFNK which was developed by the author of this
previous study. The other is HWSZ which was provided by the Flood Defense Centre of
the City of Cologne. DFNK showed its result as water levels below 12 m, and HWSZ
showed water levels above 12 m.
(2) Risk curve and uncertainty bounds
All parallel models of the three modules, which were considered to be plausible, were
combined. In total, 36 models resulted from this combination (9 flood frequency curves
× 2 inundation extent models × 2 damage models). Each model provides flood
damage of return periods from T=10 to T=1000 years. The results of the 36 models are
plotted in Fig. 4-49. The risk curve (blue solid) for the City of Cologne and the
associated uncertainty (black dotted) are plotted based on the results from 36 models
(Fig. 4-4 left). The same are plotted based on 156 models including non-plausible
models (right). The blue dots show approximate damage estimates of the floods in 1993
(€76.7 million) and 1995 (€33.2 million).
9 Visser et. Al., 2000
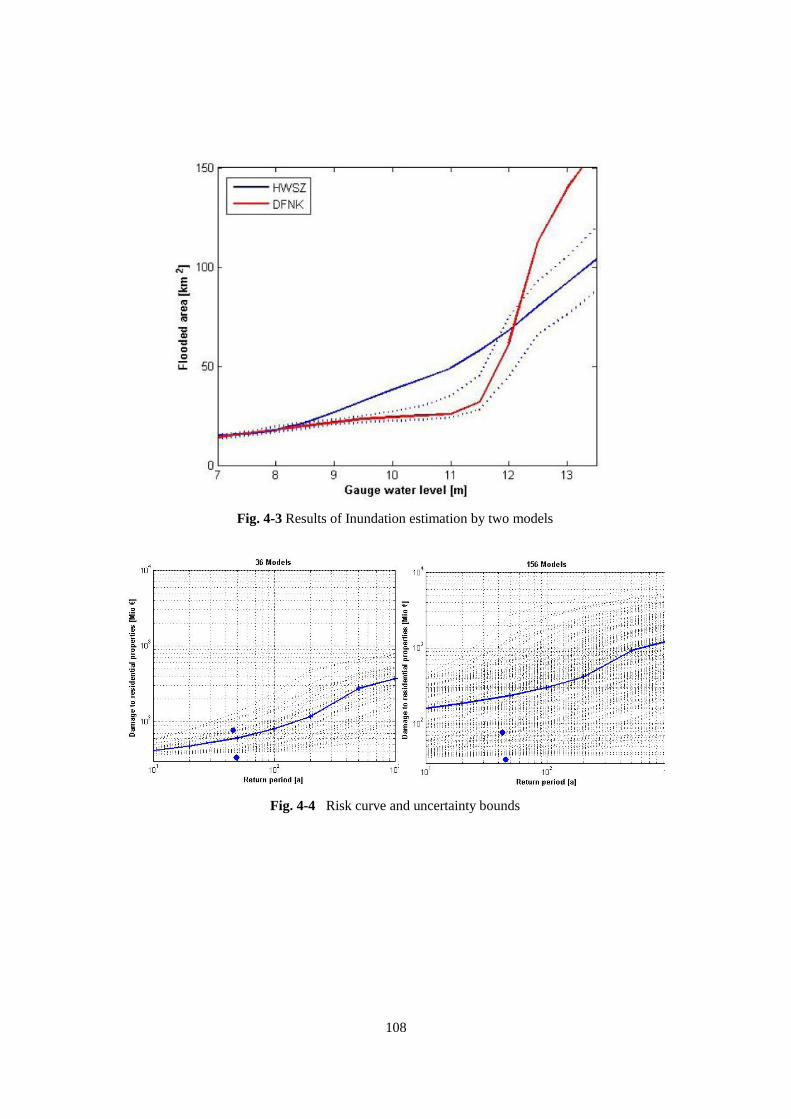
108
Fig. 4-3 Results of Inundation estimation by two models
Fig. 4-4 Risk curve and uncertainty bounds
109
(3) Relative contribution of the three modules to the total maximum uncertainty range
as function of return period
When different modules are combined to obtain an overall result, it is desirable to have
information on the relative roles of different uncertainty sources. The concept of parallel
models provides a simple way to quantify the relative roles. The risk estimated in the
study was composed of three modules. The combination of a module i with the
maximum uncertainty range MURc,T of the complete chain of modules as function of
return period T was calculated as follows:
1. MURc,T was calculated, in which all modules take into account where all models are
considered as plausible. For a specific return period T the maximum uncertainty
range is given by subtracting the minimum value from the maximum value.
2. The reduced uncertainty range URi,T was calculated by using for module i the best
estimate model, while all other modules are in full operation. The different between
MURc,T and URi,T may be seen as the level of uncertainty, caused by the module that
was set to
3. Step 2 was repeated for all modules.
Figure 4-5 shows the result of this procedure applied to the three modules of the flood
risk analysis of the City of Cologne. It is obvious that the damage module contributes a
small share to the total uncertainty. In addition, this share is almost constant throughout
the considered range of return periods. Of more importance for the total epistemic
uncertainty are the two modules of flood frequency estimation and inundation
estimation. Their shares change across the return period range. For return periods below
of 80 years, the uncertainty of inundation estimation contributes a largest share to the
total uncertainty, whereas above 80 years, the total uncertainty is dominated by the
uncertainty of flood frequency analysis.
In reference to this result, the author implemented the following case study applying a
possible method to review all modules of flood risk assessment in a developing country.
The chapter also presents findings from this study.
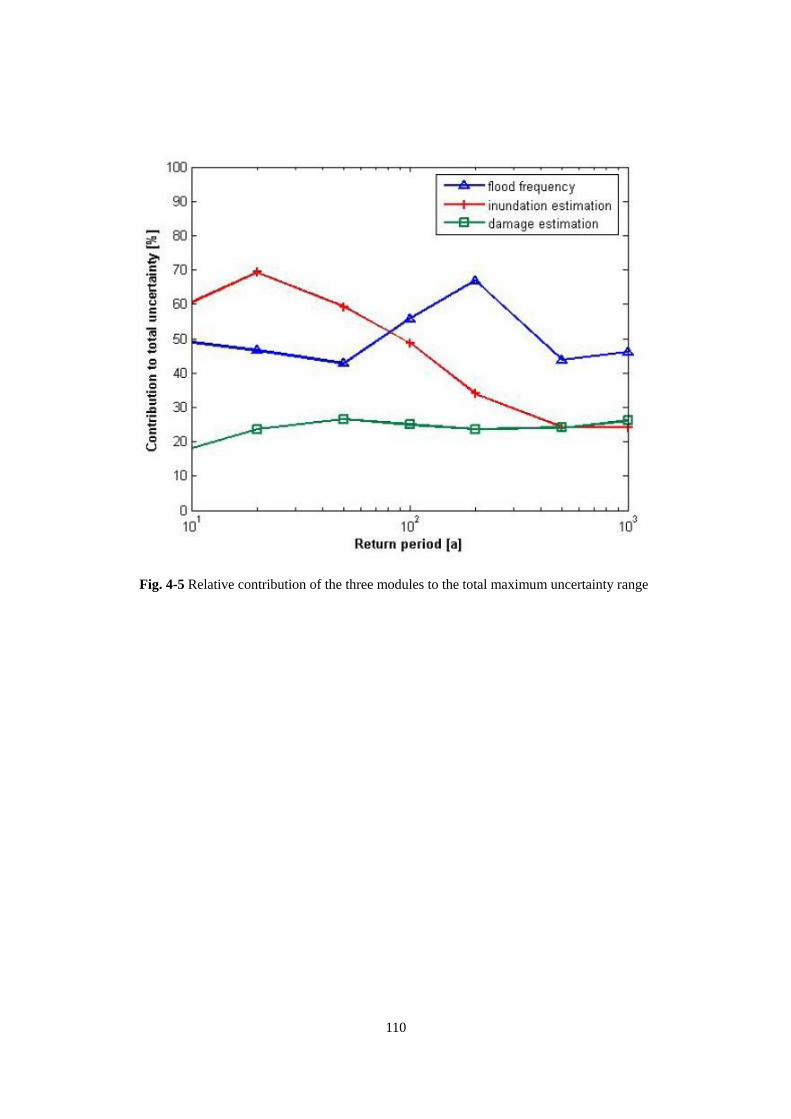
110
Fig. 4-5 Relative contribution of the three modules to the total maximum uncertainty range
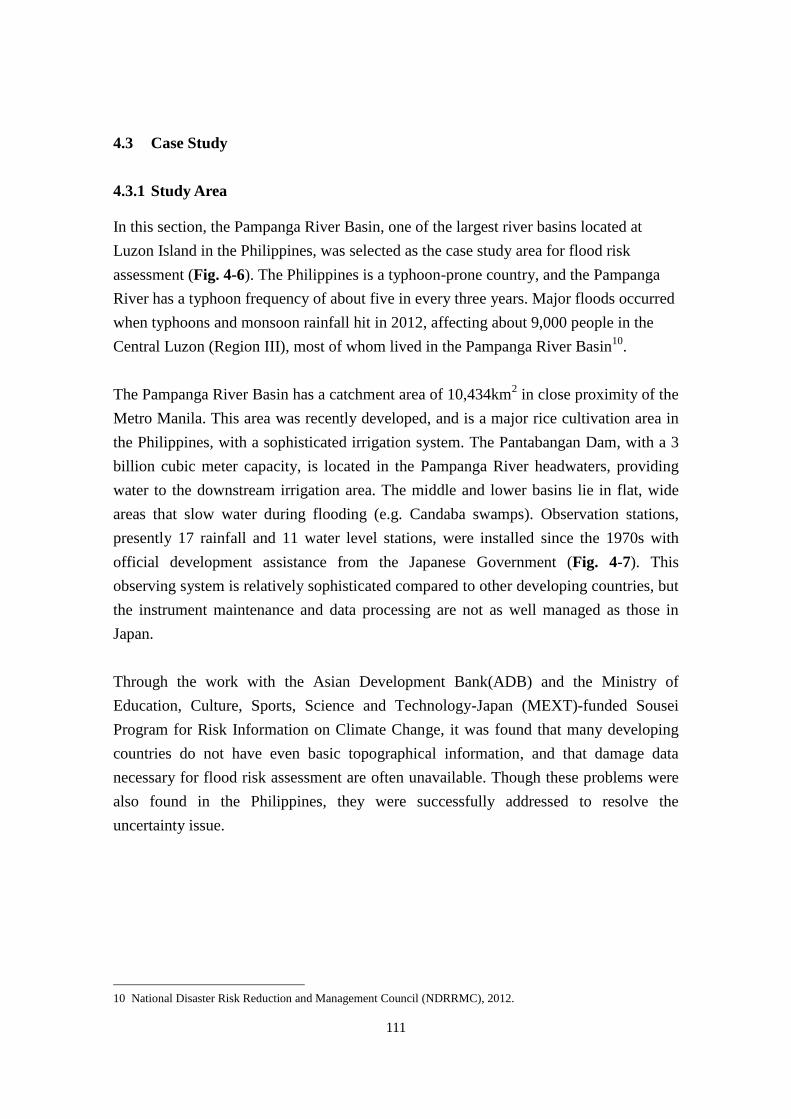
111
4.3 Case Study
4.3.1 Study Area
In this section, the Pampanga River Basin, one of the largest river basins located at
Luzon Island in the Philippines, was selected as the case study area for flood risk
assessment (Fig. 4-6). The Philippines is a typhoon-prone country, and the Pampanga
River has a typhoon frequency of about five in every three years. Major floods occurred
when typhoons and monsoon rainfall hit in 2012, affecting about 9,000 people in the
Central Luzon (Region III), most of whom lived in the Pampanga River Basin10
.
The Pampanga River Basin has a catchment area of 10,434km2 in close proximity of the
Metro Manila. This area was recently developed, and is a major rice cultivation area in
the Philippines, with a sophisticated irrigation system. The Pantabangan Dam, with a 3
billion cubic meter capacity, is located in the Pampanga River headwaters, providing
water to the downstream irrigation area. The middle and lower basins lie in flat, wide
areas that slow water during flooding (e.g. Candaba swamps). Observation stations,
presently 17 rainfall and 11 water level stations, were installed since the 1970s with
official development assistance from the Japanese Government (Fig. 4-7). This
observing system is relatively sophisticated compared to other developing countries, but
the instrument maintenance and data processing are not as well managed as those in
Japan.
Through the work with the Asian Development Bank(ADB) and the Ministry of
Education, Culture, Sports, Science and Technology-Japan (MEXT)-funded Sousei
Program for Risk Information on Climate Change, it was found that many developing
countries do not have even basic topographical information, and that damage data
necessary for flood risk assessment are often unavailable. Though these problems were
also found in the Philippines, they were successfully addressed to resolve the
uncertainty issue.
10 National Disaster Risk Reduction and Management Council (NDRRMC), 2012.
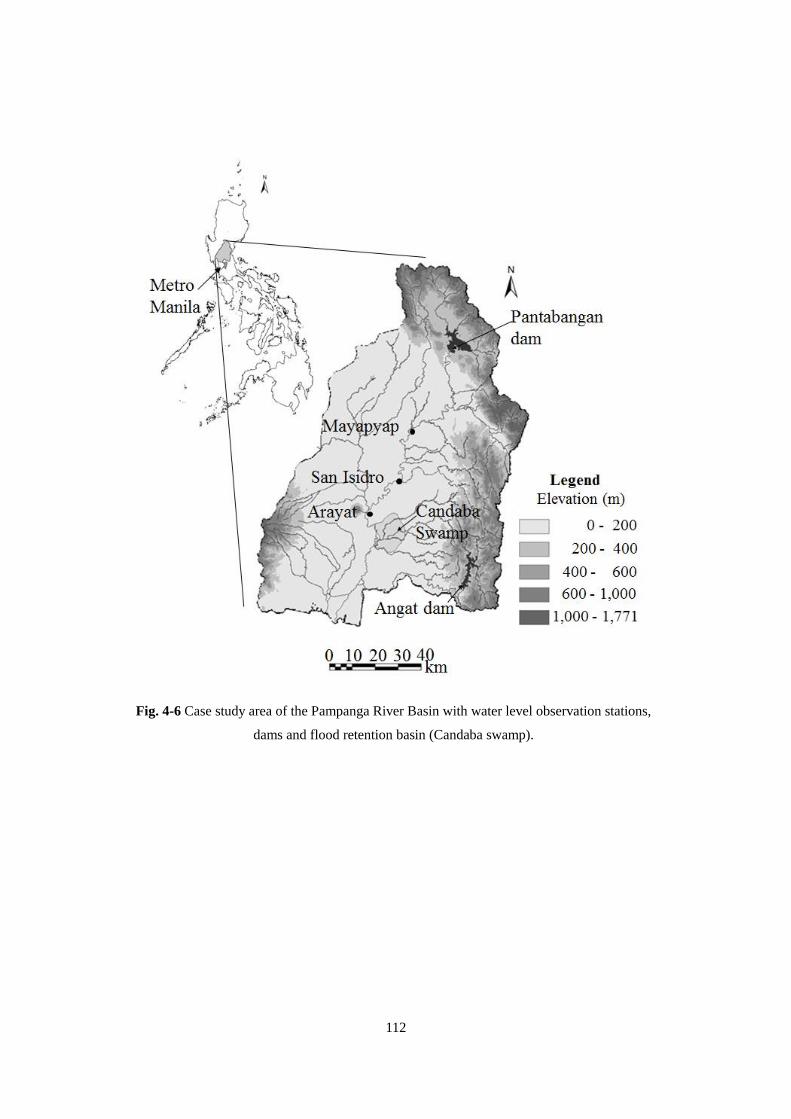
112
Fig. 4-6 Case study area of the Pampanga River Basin with water level observation stations,
dams and flood retention basin (Candaba swamp).
113
Fig. 4-7 Present seventeen observation stations in Pampanga River Basin
114
4.3.2 Problems in Observation Data and Validation
(1) Importance of observation data validation
The major difficulty in conducting flood risk assessment in developing countries lies in
observational data uncertainty. The limited number of observation stations and the lack
of maintenance can sometimes make observations impossible. In addition, lack of data
processing knowledge prevents detection of abnormal values, leaving a great deal of
uncertainty in data.
To plan appropriate countermeasures, problems establishing a reliable mechanism for
flood risk assessment in developing countries should be solved in light of increased
climate change impacts.
(2) Disaster damage record and data availability
In the following sub sections, data review will be discussed. In this process, data
unavailability brings serious problems in various steps. Especially, in probability
analysis, the most crucial point is whether the largest hazard or ones close to that scale
had occurred during the periods with missing data. Data on large-scale hazards can
directly influence a probability curve in probability analysis. Disaster damage record
can be a good reference to determine whether or not major hazards occurred during a
period with poor data availability. If no significant damage was recorded during the
period, it can be evidence of no occurrence of a major hazard. Table 4-1 shows: a) the
total number of affected people by disasters in each year; b) the number of affected
people by flood in Region III, in which the Pampanga River Basin is located; c)
supplementary information by International Disaster Database (EM-DAT); and d)
available data of rainfall and discharge. Data review was conducted to see whether
distractive damage occurred during the periods in which data is unavailable. Category a)
in Table 4-1 includes not only floods but also storms and other disasters, and b) is
available only for recent years after 1998. Review of all available information
confirmed that destructive damage occurred by floods in the Pampanga River in 2004,
2007, 2009 and 2011. In 1990 and 1995, serious damage was found in some areas
including Region III in the Philippines, but it was estimated that Pampanga did not
suffer such serious damage, and floods were not the main hazard in those years,
according to EM-DAT information. The analysis suggests that hazards that occurred
during the years of data unavailability were ones of low magnitude and that their
impacts are uninfluential in probability analysis. For this reason, probable hydrological
115
values were identified from the equinoctial line of the larger dataset.
(3) Reviewing precipitation data
Ideally, as many precipitation data as possible should to be collected in an appropriate
manner for as long a period as possible for accurate flood reproduction. However,
rainfall observation in the Pampanga River Basin was not necessarily an ideal situation.
In 1980, there were merely 7 rainfall observation stations in the basin. In addition, only
5 of them were functioning appropriately and were able to continue recording reliable
data. Then, 7 additional gauging stations were installed after 1992, 5 more stations were
added after 2009, and today 17 stations are in operation (Fig. 4-8 and Fig. 4-9). Such
changes in the amount of observational data are not rare in developing countries,
depending on progress in the installment of stations, technical malfunctions and other
reasons.
Fig. 4-8 shows changes in rainfall data availability and the number of observation
stations in the Pampanga River Basin between 1980 and 2012. In an actual situation, it
is sometimes difficult to decide whether to use data recorded only by a small number of
stations for a long period of time or data recorded by a large number of stations for a
short period of time, because data selection such as this can directly affect the level of
uncertainty. In principle, a probability curve changes as more data accumulates. In this
sense, it is more reasonable to use a larger set of data observed for a longer duration
even with some data missing periods, instead of data observed for a shorter duration
without cease. a In short, duration should include as long a time period as possible. In
this review, the effect of change in the number of stations should be examined in
comparison between the case in which only 5 stations were kept as data source and the
case in which more and more stations were included as data source during those 33
years.
Fig. 4-10 compares the following two datasets: 1) the longest observational duration
regardless of the number of stations (disk in Fig. 4-10 and beige square in Fig. 4-8); 2)
the longest observational duration with the smaller number of stations (square in Fig.
4-10 and dotted square in Fig. 4-8). The basin-average precipitation was calculated by
the Thiessen method for each datasets. The calculation results were then plotted on a
Gumbel probability paper and compared by applying the Gumbel distribution curve as
shown in Eq.4-1. As explained in (2), the total observation duration should be kept as
33 years, and probability analysis was conducted based on assumption of no serious
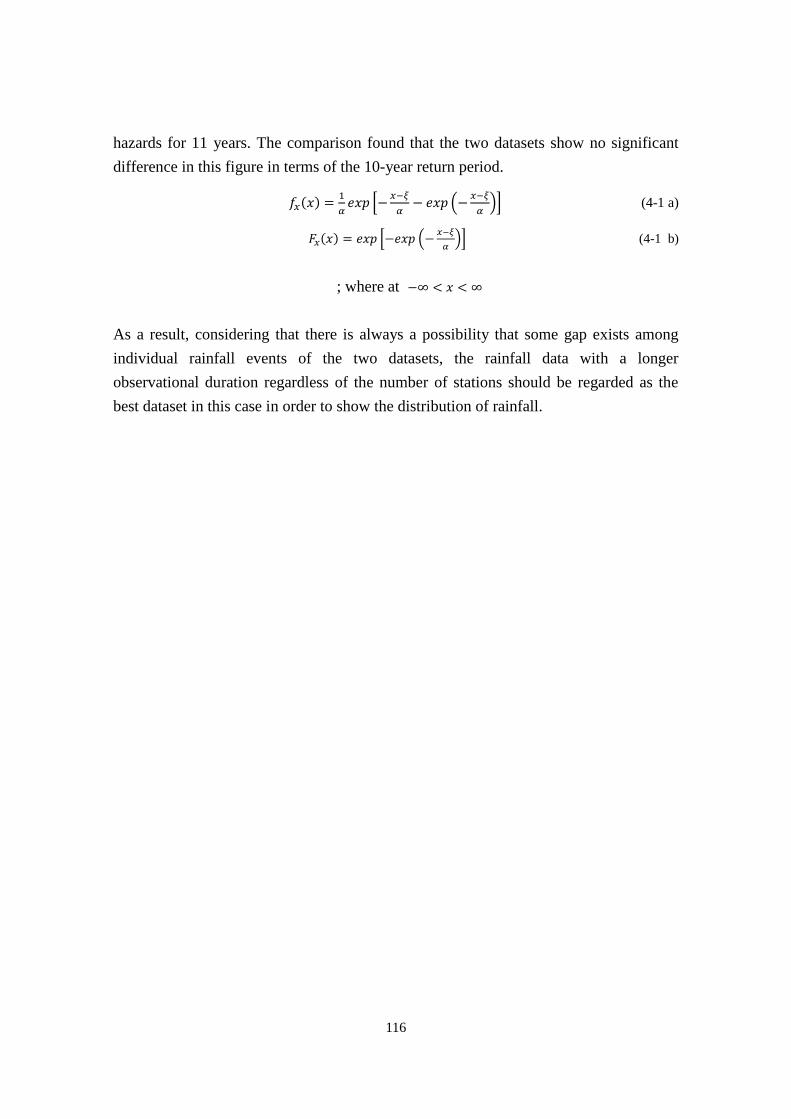
116
hazards for 11 years. The comparison found that the two datasets show no significant
difference in this figure in terms of the 10-year return period.
(4-1 a)
(4-1 b)
; where at
As a result, considering that there is always a possibility that some gap exists among
individual rainfall events of the two datasets, the rainfall data with a longer
observational duration regardless of the number of stations should be regarded as the
best dataset in this case in order to show the distribution of rainfall.
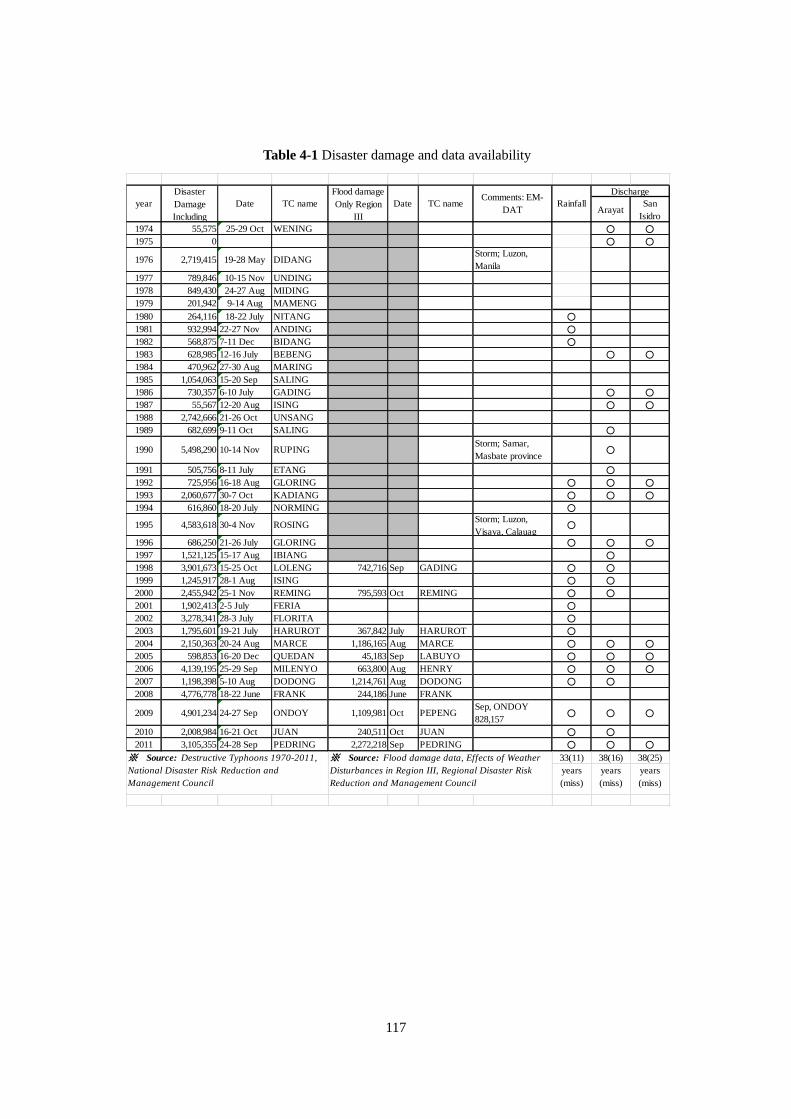
117
Table 4-1 Disaster damage and data availability
ArayatSan
Isidro
1974 55,575 25-29 Oct WENING ○ ○
1975 0 ○ ○
1976 2,719,415 19-28 May DIDANGStorm; Luzon,
Manila
1977 789,846 10-15 Nov UNDING
1978 849,430 24-27 Aug MIDING
1979 201,942 9-14 Aug MAMENG
1980 264,116 18-22 July NITANG ○
1981 932,994 22-27 Nov ANDING ○
1982 568,875 7-11 Dec BIDANG ○
1983 628,985 12-16 July BEBENG ○ ○
1984 470,962 27-30 Aug MARING
1985 1,054,063 15-20 Sep SALING
1986 730,357 6-10 July GADING ○ ○
1987 55,567 12-20 Aug ISING ○ ○
1988 2,742,666 21-26 Oct UNSANG
1989 682,699 9-11 Oct SALING ○
1990 5,498,290 10-14 Nov RUPINGStorm; Samar,
Masbate province○
1991 505,756 8-11 July ETANG ○
1992 725,956 16-18 Aug GLORING ○ ○ ○
1993 2,060,677 30-7 Oct KADIANG ○ ○ ○
1994 616,860 18-20 July NORMING ○
1995 4,583,618 30-4 Nov ROSINGStorm; Luzon,
Visaya, Calauag○
1996 686,250 21-26 July GLORING ○ ○ ○
1997 1,521,125 15-17 Aug IBIANG ○
1998 3,901,673 15-25 Oct LOLENG 742,716 Sep GADING ○ ○
1999 1,245,917 28-1 Aug ISING ○ ○
2000 2,455,942 25-1 Nov REMING 795,593 Oct REMING ○ ○
2001 1,902,413 2-5 July FERIA ○
2002 3,278,341 28-3 July FLORITA ○
2003 1,795,601 19-21 July HARUROT 367,842 July HARUROT ○
2004 2,150,363 20-24 Aug MARCE 1,186,165 Aug MARCE ○ ○ ○
2005 598,853 16-20 Dec QUEDAN 45,183 Sep LABUYO ○ ○ ○
2006 4,139,195 25-29 Sep MILENYO 663,800 Aug HENRY ○ ○ ○
2007 1,198,398 5-10 Aug DODONG 1,214,761 Aug DODONG ○ ○
2008 4,776,778 18-22 June FRANK 244,186 June FRANK
2009 4,901,234 24-27 Sep ONDOY 1,109,981 Oct PEPENGSep, ONDOY
828,157○ ○ ○
2010 2,008,984 16-21 Oct JUAN 240,511 Oct JUAN ○ ○
2011 3,105,355 24-28 Sep PEDRING 2,272,218 Sep PEDRING ○ ○ ○
33(11) 38(16) 38(25)
years
(miss)
years
(miss)
years
(miss)
※ Source: Destructive Typhoons 1970-2011,
National Disaster Risk Reduction and
Management Council
※ Source: Flood damage data, Effects of Weather
Disturbances in Region III, Regional Disaster Risk
Reduction and Management Council
Discharge
Rainfallyear
Disaster
Damage
Including
Date TC name
Flood damage
Only Region
III
Date TC nameComments: EM-
DAT
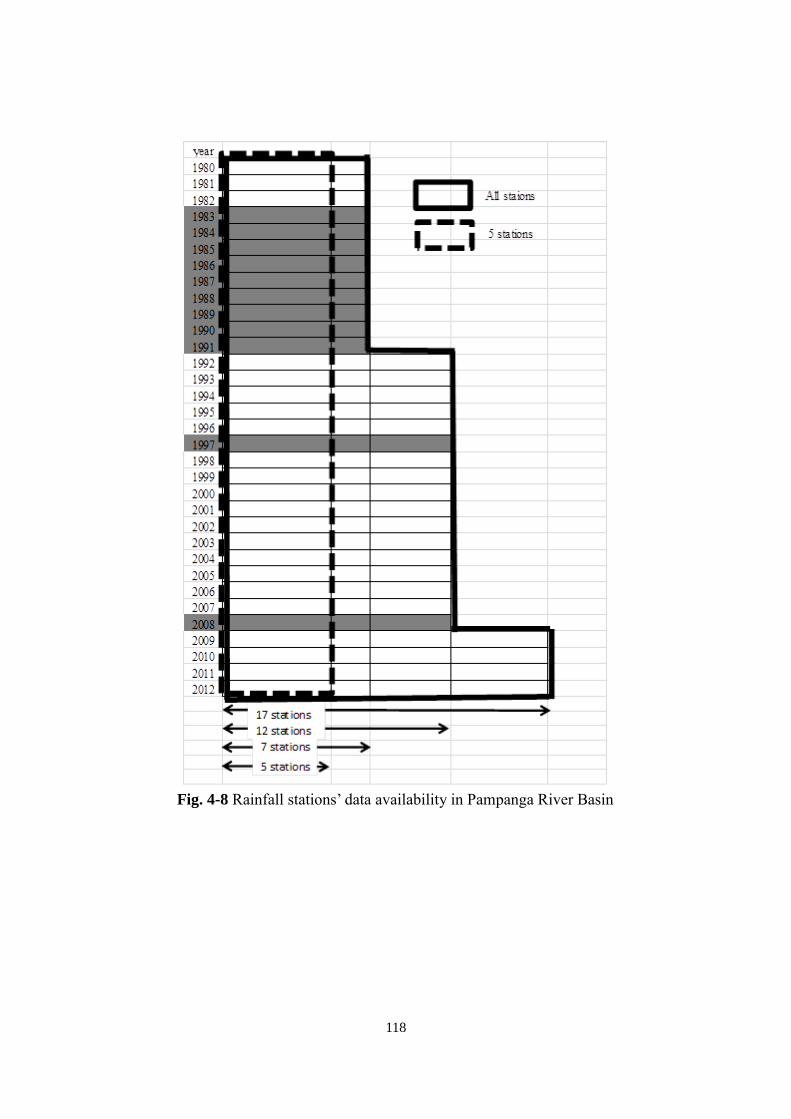
118
Fig. 4-8 Rainfall stations’ data availability in Pampanga River Basin
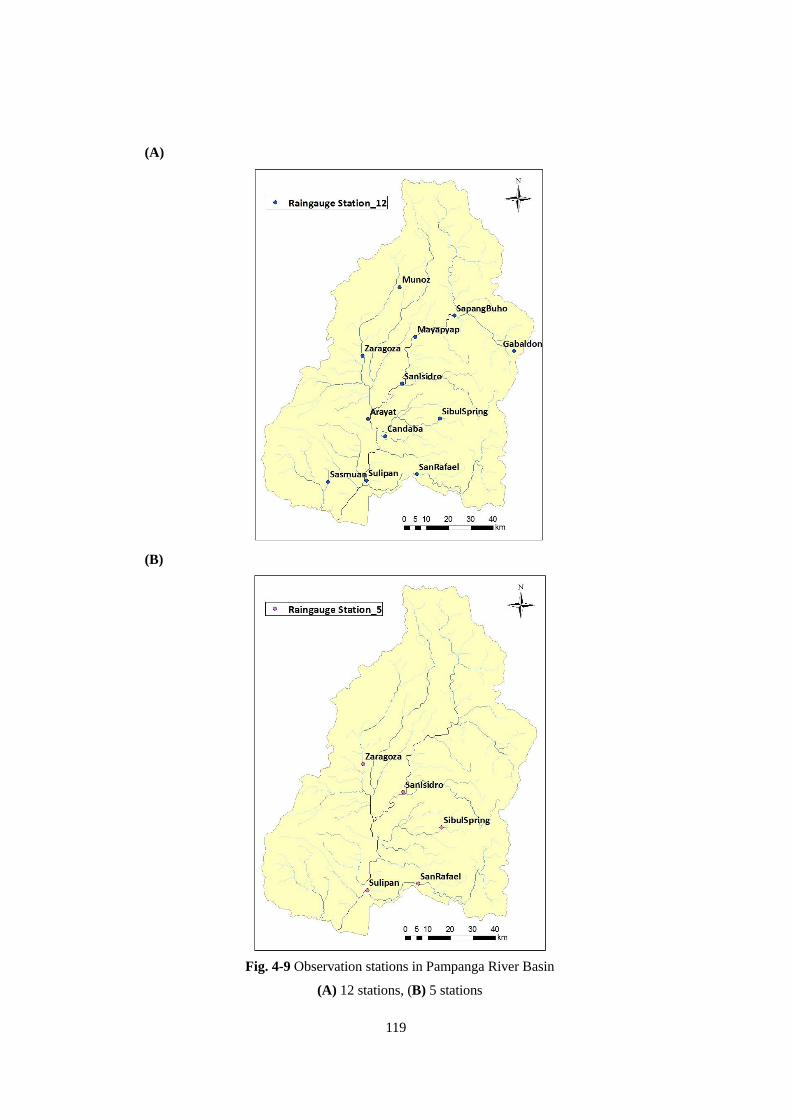
119
(A)
(B)
Fig. 4-9 Observation stations in Pampanga River Basin
(A) 12 stations, (B) 5 stations
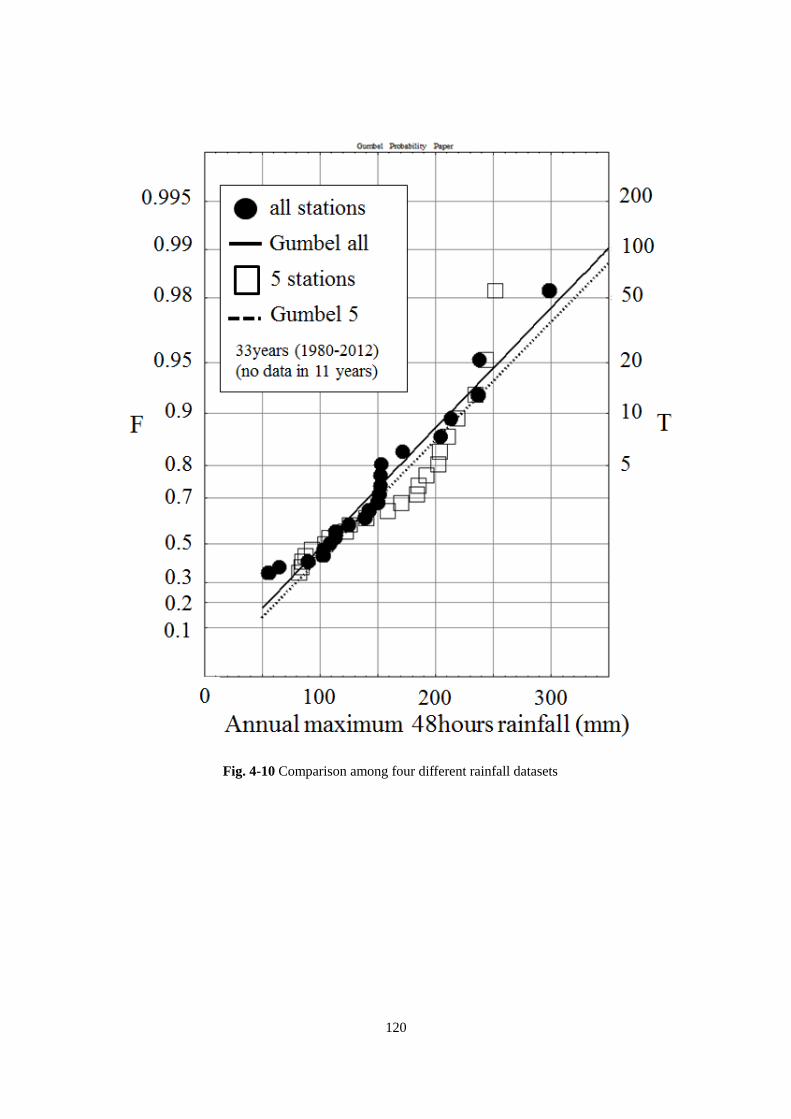
120
Fig. 4-10 Comparison among four different rainfall datasets
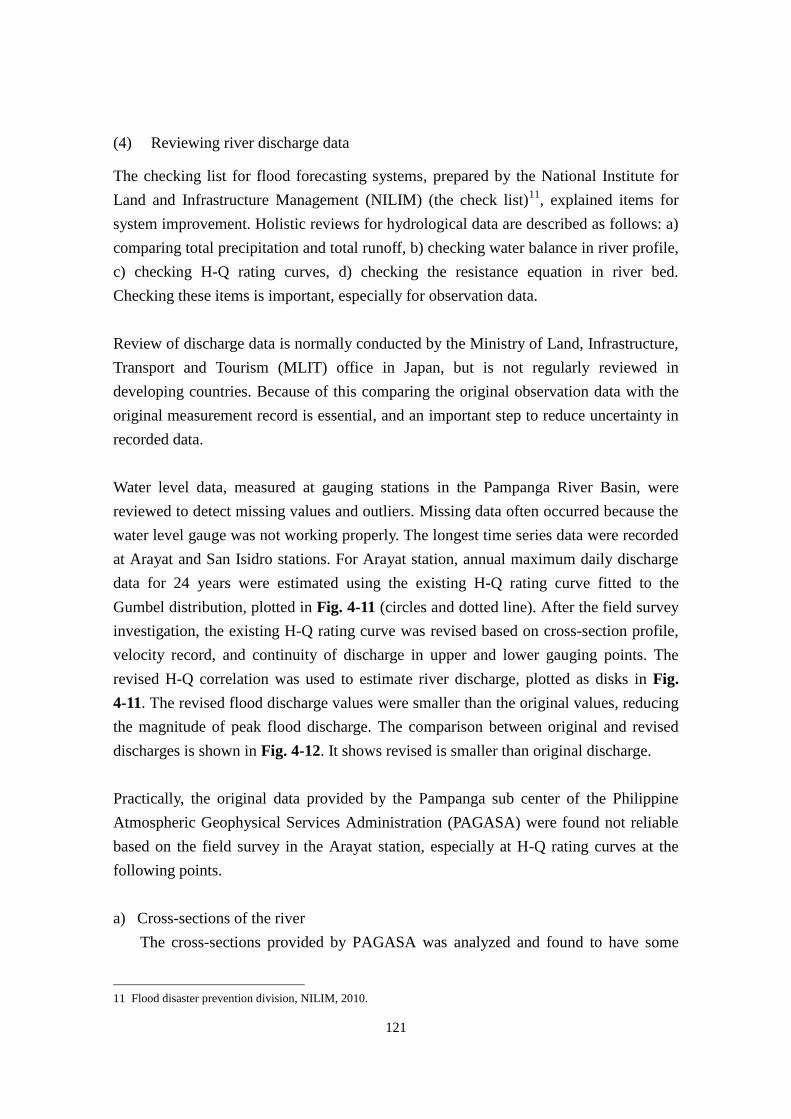
121
(4) Reviewing river discharge data
The checking list for flood forecasting systems, prepared by the National Institute for
Land and Infrastructure Management (NILIM) (the check list)11
, explained items for
system improvement. Holistic reviews for hydrological data are described as follows: a)
comparing total precipitation and total runoff, b) checking water balance in river profile,
c) checking H-Q rating curves, d) checking the resistance equation in river bed.
Checking these items is important, especially for observation data.
Review of discharge data is normally conducted by the Ministry of Land, Infrastructure,
Transport and Tourism (MLIT) office in Japan, but is not regularly reviewed in
developing countries. Because of this comparing the original observation data with the
original measurement record is essential, and an important step to reduce uncertainty in
recorded data.
Water level data, measured at gauging stations in the Pampanga River Basin, were
reviewed to detect missing values and outliers. Missing data often occurred because the
water level gauge was not working properly. The longest time series data were recorded
at Arayat and San Isidro stations. For Arayat station, annual maximum daily discharge
data for 24 years were estimated using the existing H-Q rating curve fitted to the
Gumbel distribution, plotted in Fig. 4-11 (circles and dotted line). After the field survey
investigation, the existing H-Q rating curve was revised based on cross-section profile,
velocity record, and continuity of discharge in upper and lower gauging points. The
revised H-Q correlation was used to estimate river discharge, plotted as disks in Fig.
4-11. The revised flood discharge values were smaller than the original values, reducing
the magnitude of peak flood discharge. The comparison between original and revised
discharges is shown in Fig. 4-12. It shows revised is smaller than original discharge.
Practically, the original data provided by the Pampanga sub center of the Philippine
Atmospheric Geophysical Services Administration (PAGASA) were found not reliable
based on the field survey in the Arayat station, especially at H-Q rating curves at the
following points.
a) Cross-sections of the river
The cross-sections provided by PAGASA was analyzed and found to have some
11 Flood disaster prevention division, NILIM, 2010.
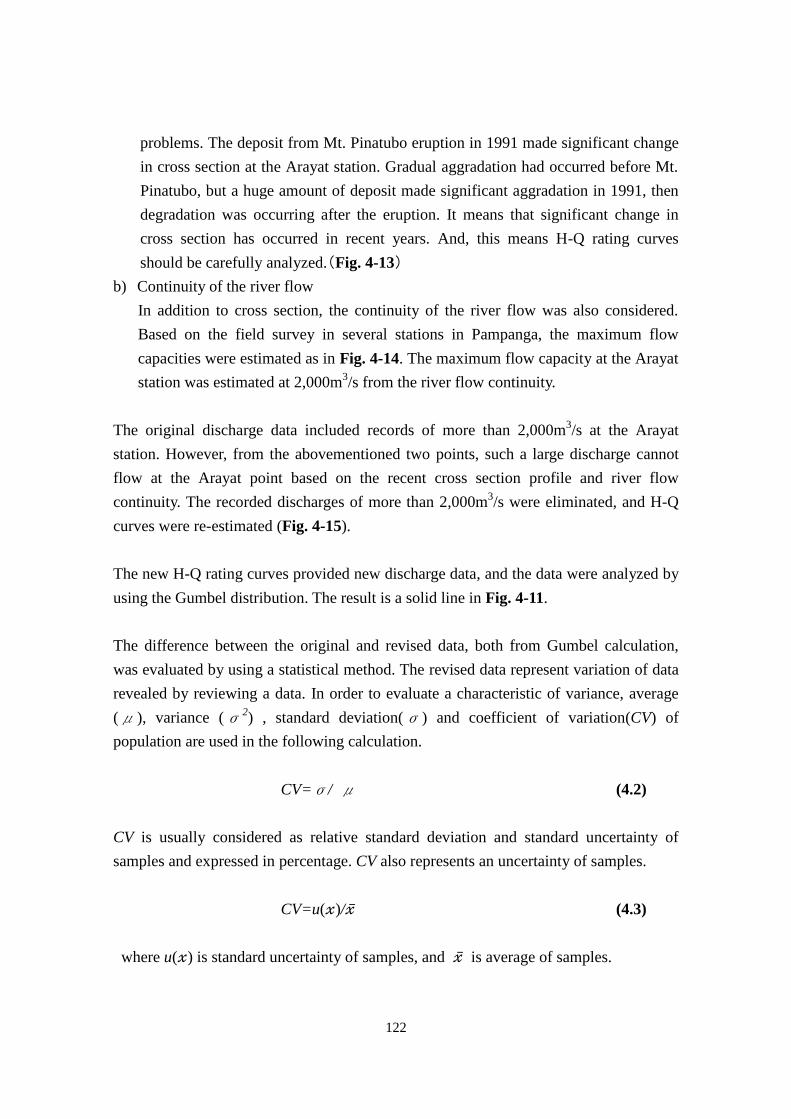
122
problems. The deposit from Mt. Pinatubo eruption in 1991 made significant change
in cross section at the Arayat station. Gradual aggradation had occurred before Mt.
Pinatubo, but a huge amount of deposit made significant aggradation in 1991, then
degradation was occurring after the eruption. It means that significant change in
cross section has occurred in recent years. And, this means H-Q rating curves
should be carefully analyzed.(Fig. 4-13)
b) Continuity of the river flow
In addition to cross section, the continuity of the river flow was also considered.
Based on the field survey in several stations in Pampanga, the maximum flow
capacities were estimated as in Fig. 4-14. The maximum flow capacity at the Arayat
station was estimated at 2,000m3/s from the river flow continuity.
The original discharge data included records of more than 2,000m3/s at the Arayat
station. However, from the abovementioned two points, such a large discharge cannot
flow at the Arayat point based on the recent cross section profile and river flow
continuity. The recorded discharges of more than 2,000m3/s were eliminated, and H-Q
curves were re-estimated (Fig. 4-15).
The new H-Q rating curves provided new discharge data, and the data were analyzed by
using the Gumbel distribution. The result is a solid line in Fig. 4-11.
The difference between the original and revised data, both from Gumbel calculation,
was evaluated by using a statistical method. The revised data represent variation of data
revealed by reviewing a data. In order to evaluate a characteristic of variance, average
(μ), variance (σ2) , standard deviation(σ) and coefficient of variation(CV) of
population are used in the following calculation.
CV=σ/ μ (4.2)
CV is usually considered as relative standard deviation and standard uncertainty of
samples and expressed in percentage. CV also represents an uncertainty of samples.
CV=u( )/ (4.3)
where u( ) is standard uncertainty of samples, and is average of samples.
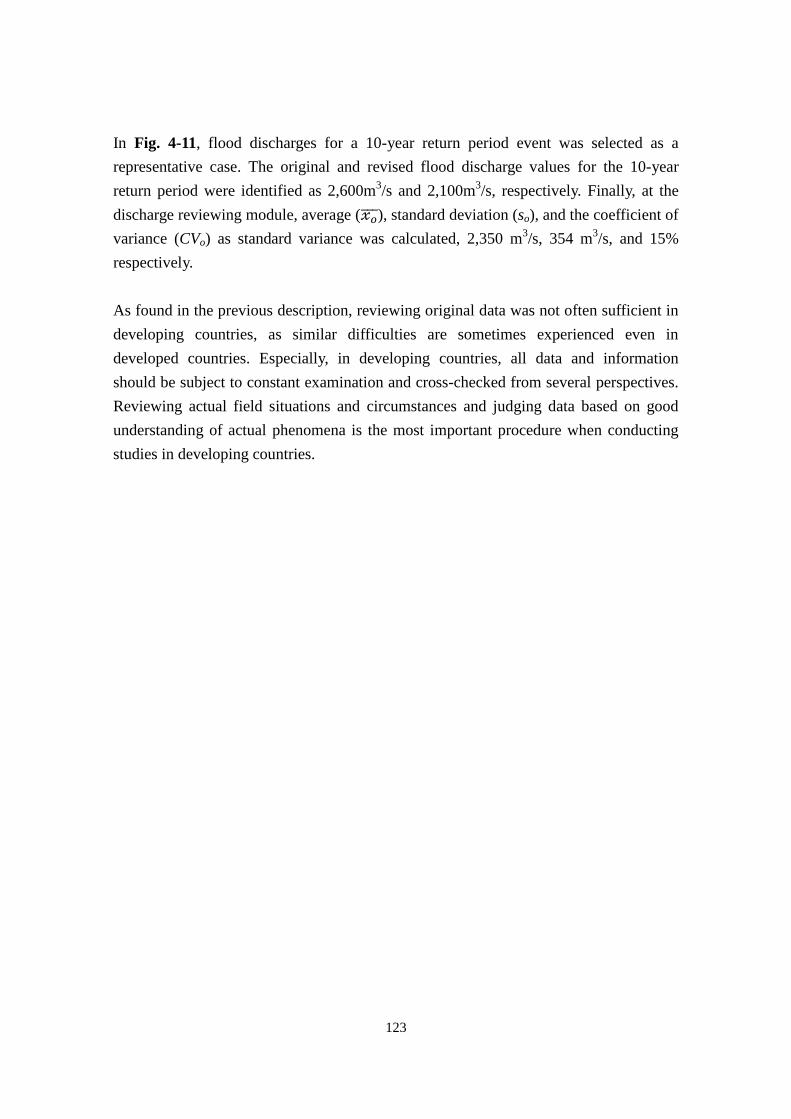
123
In Fig. 4-11, flood discharges for a 10-year return period event was selected as a
representative case. The original and revised flood discharge values for the 10-year
return period were identified as 2,600m3/s and 2,100m
3/s, respectively. Finally, at the
discharge reviewing module, average ( ), standard deviation (so), and the coefficient of
variance (CVo) as standard variance was calculated, 2,350 m3/s, 354 m
3/s, and 15%
respectively.
As found in the previous description, reviewing original data was not often sufficient in
developing countries, as similar difficulties are sometimes experienced even in
developed countries. Especially, in developing countries, all data and information
should be subject to constant examination and cross-checked from several perspectives.
Reviewing actual field situations and circumstances and judging data based on good
understanding of actual phenomena is the most important procedure when conducting
studies in developing countries.
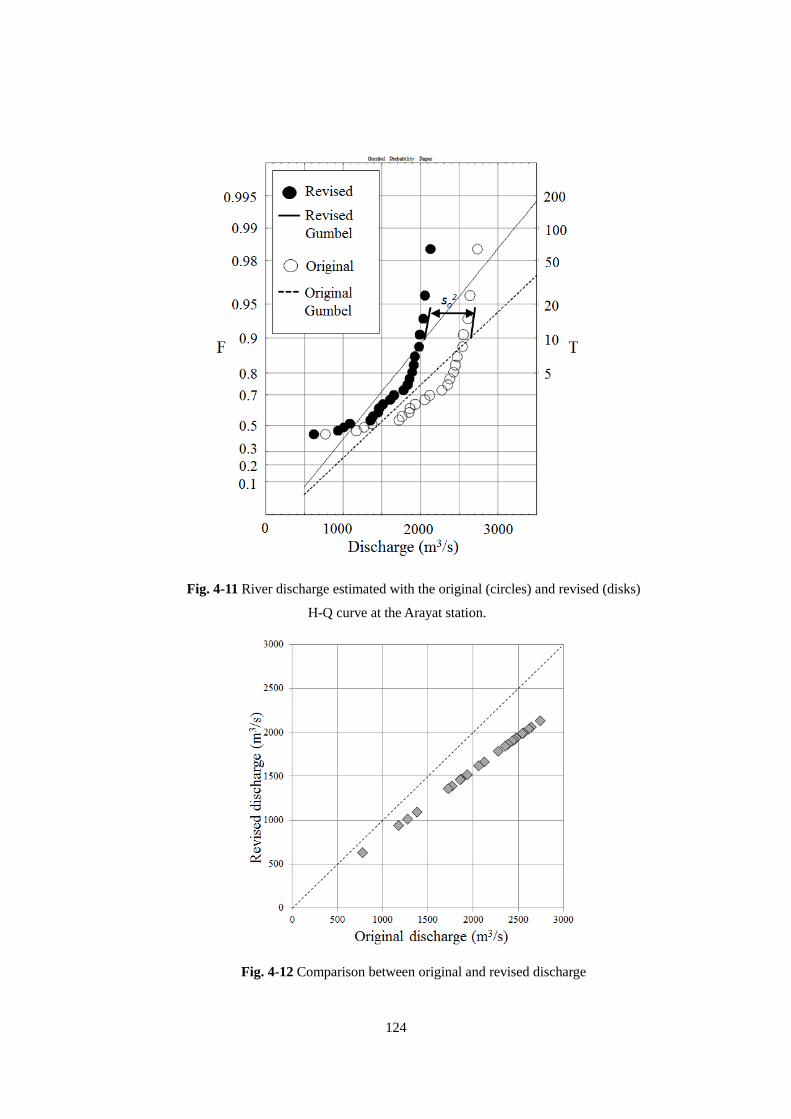
124
Fig. 4-11 River discharge estimated with the original (circles) and revised (disks)
H-Q curve at the Arayat station.
Fig. 4-12 Comparison between original and revised discharge
125
(A)
(B)
Fig. 4-13 Change of cross section at Arayat station
Note: (A) Gradual aggradations had occurred before Mt. Pinatubo erupted, but a
huge amount of deposit made significant aggradations in 1991, then (B) degradation
was occurring after the eruption.
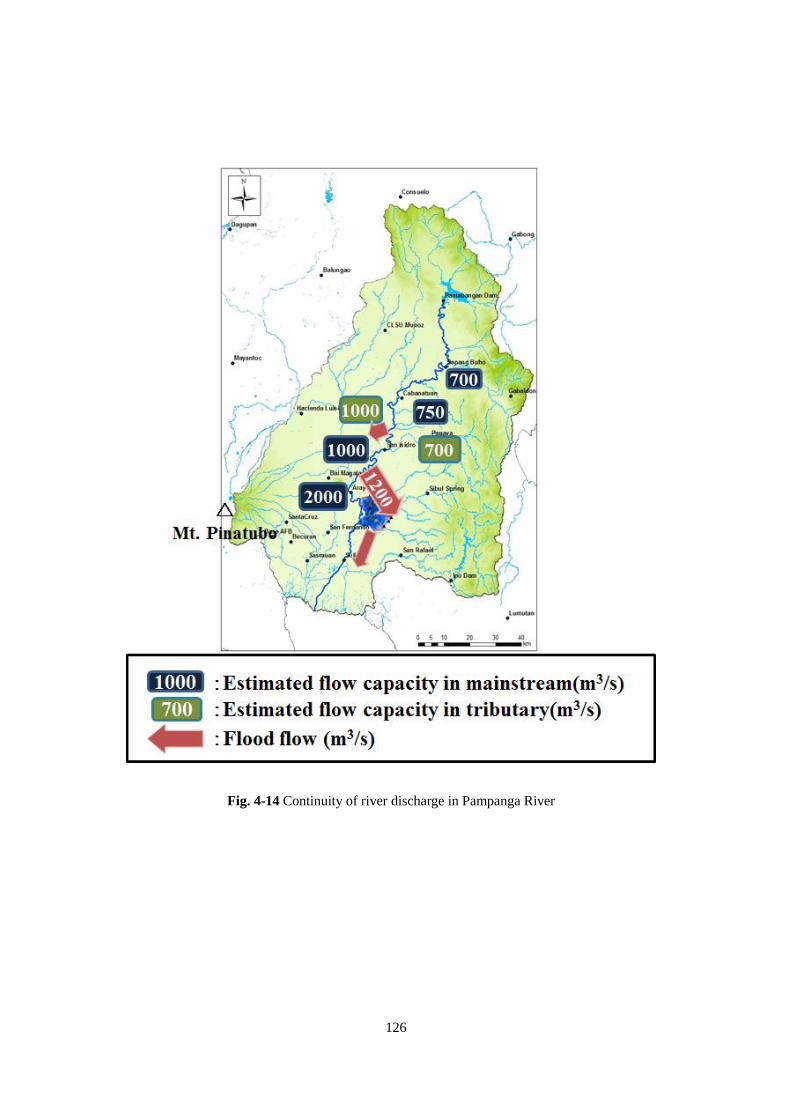
126
Fig. 4-14 Continuity of river discharge in Pampanga River
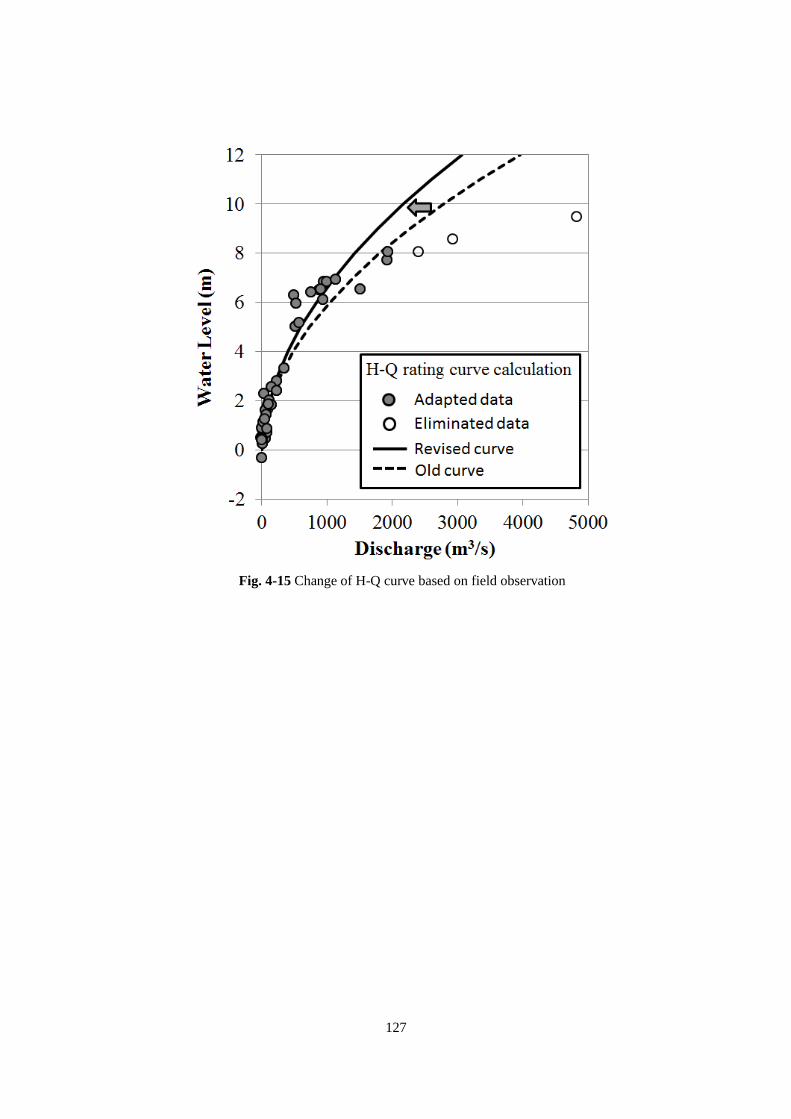
127
Fig. 4-15 Change of H-Q curve based on field observation
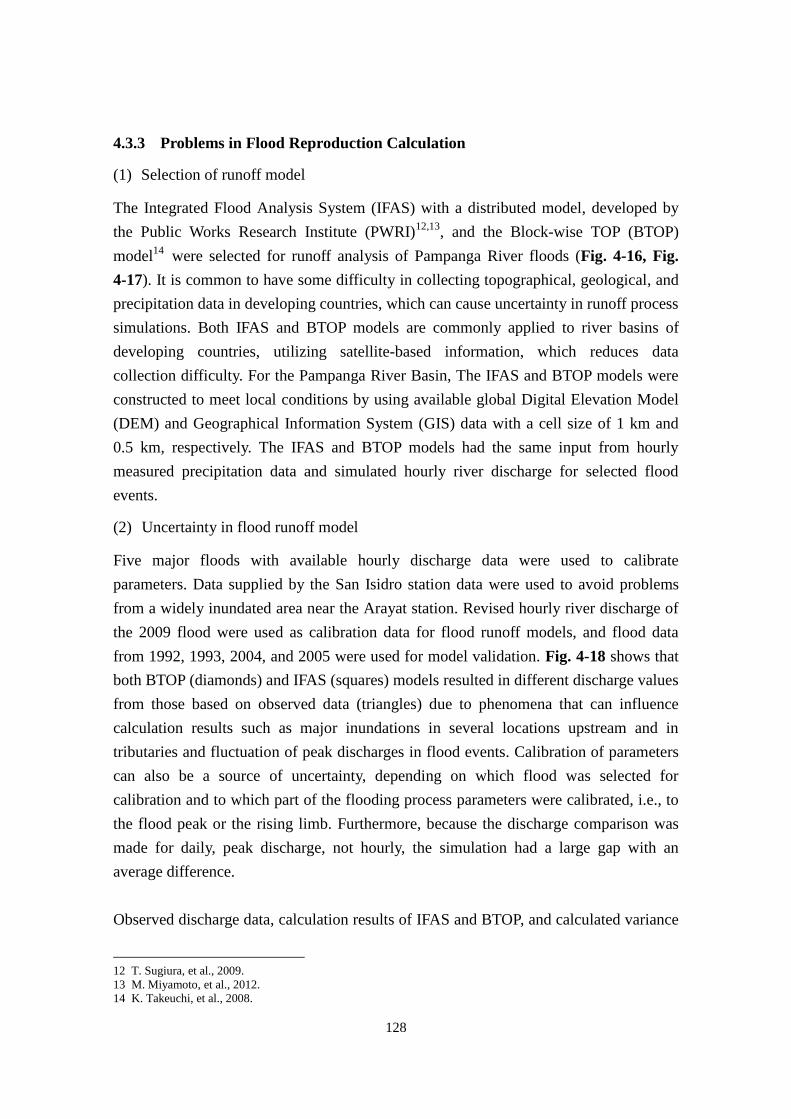
128
4.3.3 Problems in Flood Reproduction Calculation
(1) Selection of runoff model
The Integrated Flood Analysis System (IFAS) with a distributed model, developed by
the Public Works Research Institute (PWRI)12,13
, and the Block-wise TOP (BTOP)
model14
were selected for runoff analysis of Pampanga River floods (Fig. 4-16, Fig.
4-17). It is common to have some difficulty in collecting topographical, geological, and
precipitation data in developing countries, which can cause uncertainty in runoff process
simulations. Both IFAS and BTOP models are commonly applied to river basins of
developing countries, utilizing satellite-based information, which reduces data
collection difficulty. For the Pampanga River Basin, The IFAS and BTOP models were
constructed to meet local conditions by using available global Digital Elevation Model
(DEM) and Geographical Information System (GIS) data with a cell size of 1 km and
0.5 km, respectively. The IFAS and BTOP models had the same input from hourly
measured precipitation data and simulated hourly river discharge for selected flood
events.
(2) Uncertainty in flood runoff model
Five major floods with available hourly discharge data were used to calibrate
parameters. Data supplied by the San Isidro station data were used to avoid problems
from a widely inundated area near the Arayat station. Revised hourly river discharge of
the 2009 flood were used as calibration data for flood runoff models, and flood data
from 1992, 1993, 2004, and 2005 were used for model validation. Fig. 4-18 shows that
both BTOP (diamonds) and IFAS (squares) models resulted in different discharge values
from those based on observed data (triangles) due to phenomena that can influence
calculation results such as major inundations in several locations upstream and in
tributaries and fluctuation of peak discharges in flood events. Calibration of parameters
can also be a source of uncertainty, depending on which flood was selected for
calibration and to which part of the flooding process parameters were calibrated, i.e., to
the flood peak or the rising limb. Furthermore, because the discharge comparison was
made for daily, peak discharge, not hourly, the simulation had a large gap with an
average difference.
Observed discharge data, calculation results of IFAS and BTOP, and calculated variance
12 T. Sugiura, et al., 2009.
13 M. Miyamoto, et al., 2012.
14 K. Takeuchi, et al., 2008.

129
factors were compared in Table 4-2. Especially, the coefficients of variance at runoff
model (CVm) were compared to identify variance characteristics of samples. The results
shows CVm were completely different among the flood events, due to difference in
magnitude of flood and difference in flood peak and rising limb. In the comparison of
each module, the 2009 flood representing of 10 year return period events was evaluated
at 42% of CVm. Since other CVm in different flood events showed completely different
results, identification of CVm in a runoff model should be discussed carefully.
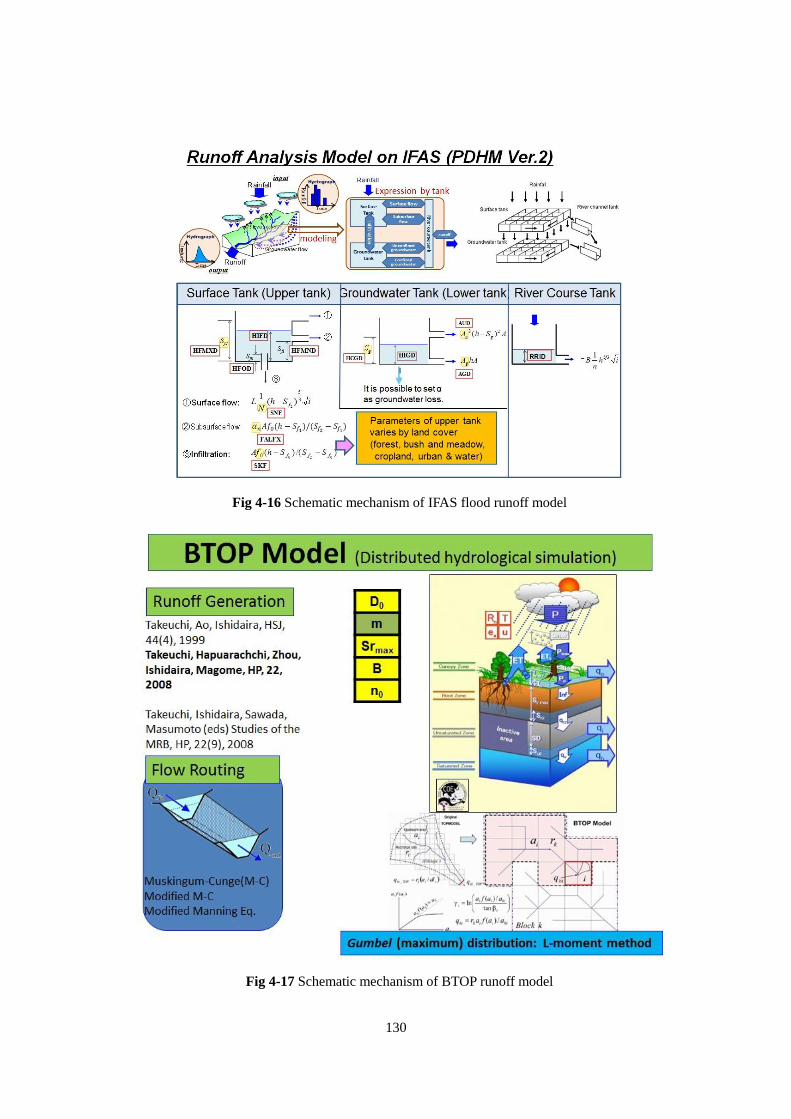
130
Fig 4-16 Schematic mechanism of IFAS flood runoff model
Fig 4-17 Schematic mechanism of BTOP runoff model
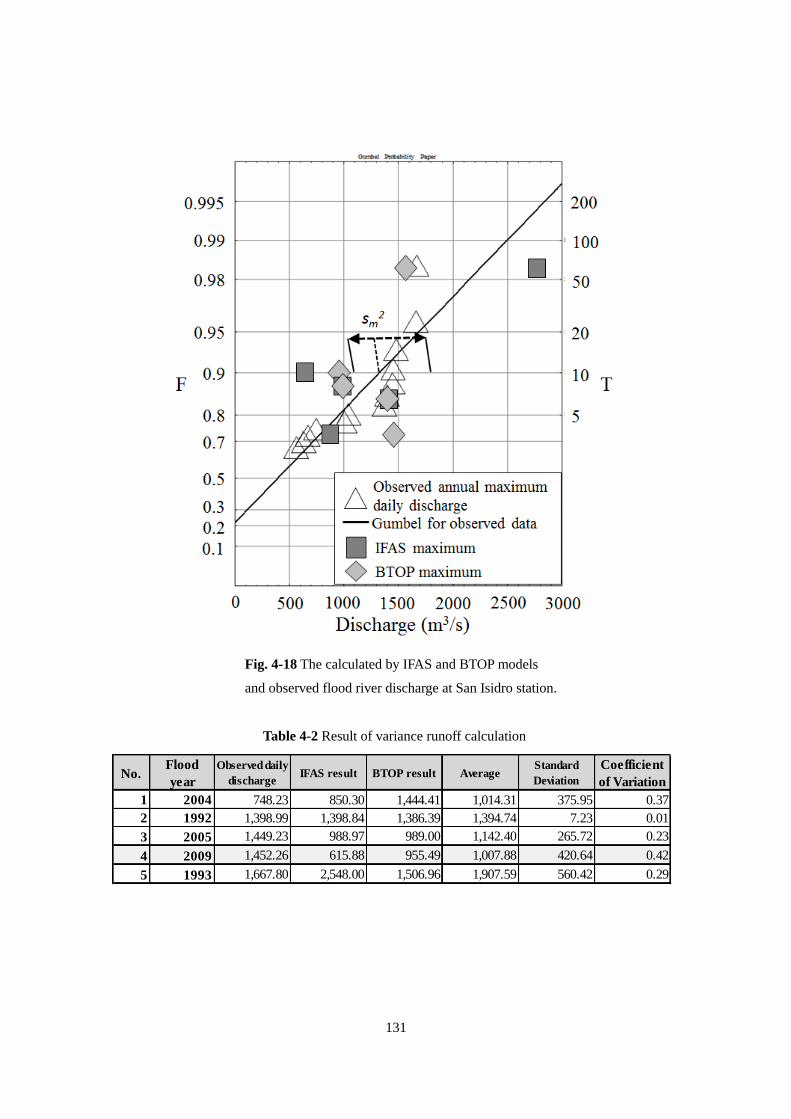
131
Fig. 4-18 The calculated by IFAS and BTOP models
and observed flood river discharge at San Isidro station.
Table 4-2 Result of variance runoff calculation
No.Flood
year
Observed daily
dischargeIFAS result BTOP result Average
Standard
Deviation
Coefficient
of Variation
1 2004 748.23 850.30 1,444.41 1,014.31 375.95 0.37
2 1992 1,398.99 1,398.84 1,386.39 1,394.74 7.23 0.01
3 2005 1,449.23 988.97 989.00 1,142.40 265.72 0.23
4 2009 1,452.26 615.88 955.49 1,007.88 420.64 0.42
5 1993 1,667.80 2,548.00 1,506.96 1,907.59 560.42 0.29
132
4.3.4 Problems in Risk Estimation
(1) Problems in damage estimation
To estimate risk at the final step of flood risk assessment, the results of a hydrological
model in certain magnitude (e.g., inundation area, inundation depth and inundation
duration) are overlaid on population and assets to estimate damage. The flood control
and economic investigation manual15
divided damage into several categories: house
damage, household damage, business damage (amortization or stock), agricultural and
fishery business damage (amortization or stock), agricultural damage, and infrastructure
damage.
In developing countries, damage information itself is inadequately collected and
analyzed. Damage curves used to convert hazard to damage should be created based on
various information. Practically speaking, the agricultural, household, and industrial
damage should be top priority data collected in developing countries.
(2) Damage calculation in developing countries
A general method for agricultural damage calculation is based on inundation depth and
duration. Rice crop damage calculation requires different damage curves for different
growth phases. Crop cultivation information and a crop calendar are used for damage
calculation in an inundation area16,17
. House damage is calculated according to a house
damage function curve, which is the correlation between slope and water depth in Japan.
The Innovation program of climate change projection for the 21st century (Kakushin
program) and Sugiura et al.18,19
developed different damage curves for simple houses in
Nepal, and stilt houses in Cambodia, respectively.
Finally, each industrial classification and factory will have different damage pattern, so
industrial damage should be based on investigation.
(3) Damage calculation in the Pampanga River Basin
Crop cultivation is a major industry in the Philippines and specifically in the Pampanga
River Basin. Crop damage by inundation, as defined by the formula of Bureau of
15 MLIT, 2005.
16 B. B. Shrestha, et al., 2013.
17 T. Okazumi, et al., 2013. 18 MEXT, 2012.
19 A. Sugiura et al., 2013.
133
Agricultural Statistics (BAS), the Philippines20
, can represent flood damage in this river
basin. (Table 4-3)
Local Ministry of Agriculture staff estimate the damage in post-flood investigations
(Fig. 4-19). Actual damage depends on judgment of investigative staff, but the yield loss
formula has a range and can be a source of uncertainty.
Rainfall Runoff Inundation (RRI) model using satellite data was selected to calculate
inundation area, inundation duration, and inundation depth (Fig. 4-20)21,22
. The RRI
created inundation hydrographs for each 0.5 0.5 km grid, and implemented crop
damage calculations by: a) identifying crop area using an overlaid land use map, b)
identifying crop growth stage from a crop calendar and flood timing, and c) estimating
damage based on flood days and water depth to calculate the total damage.
20 Bureau of Agriculture Statistics, 2013
21 T. Sayama, et al., 2013.
22 T. Sayama, et al., 2011.
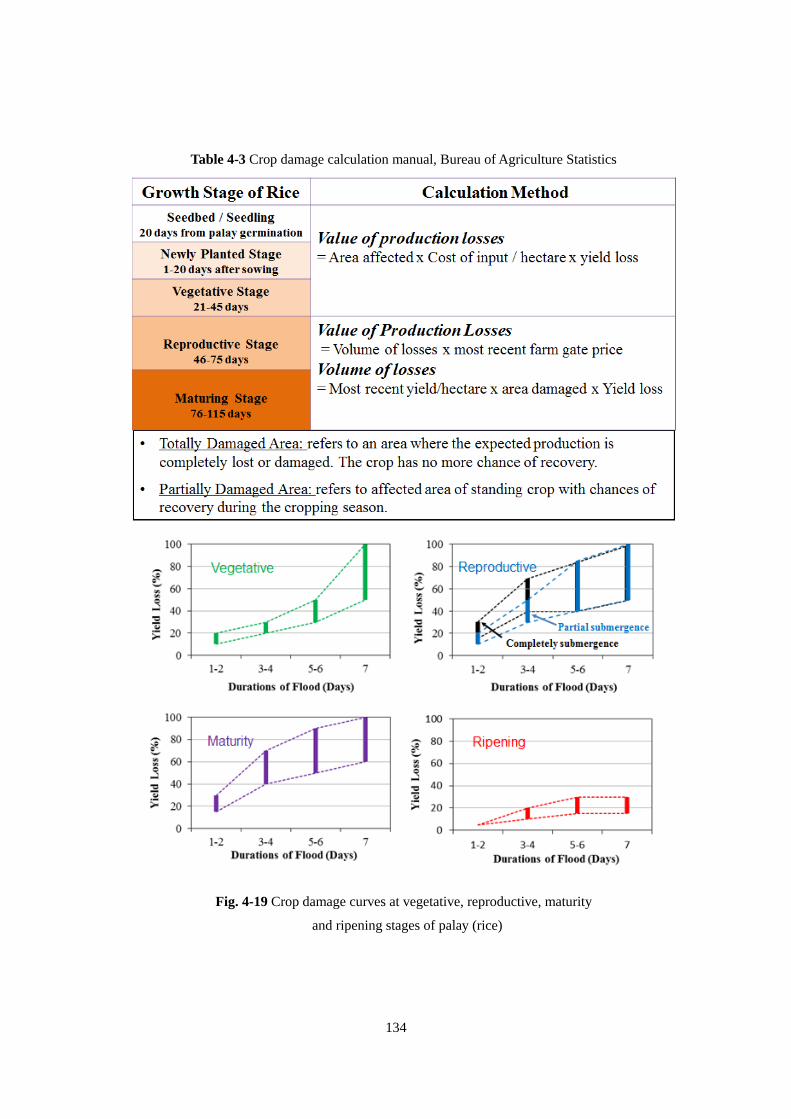
134
Table 4-3 Crop damage calculation manual, Bureau of Agriculture Statistics
Fig. 4-19 Crop damage curves at vegetative, reproductive, maturity
and ripening stages of palay (rice)
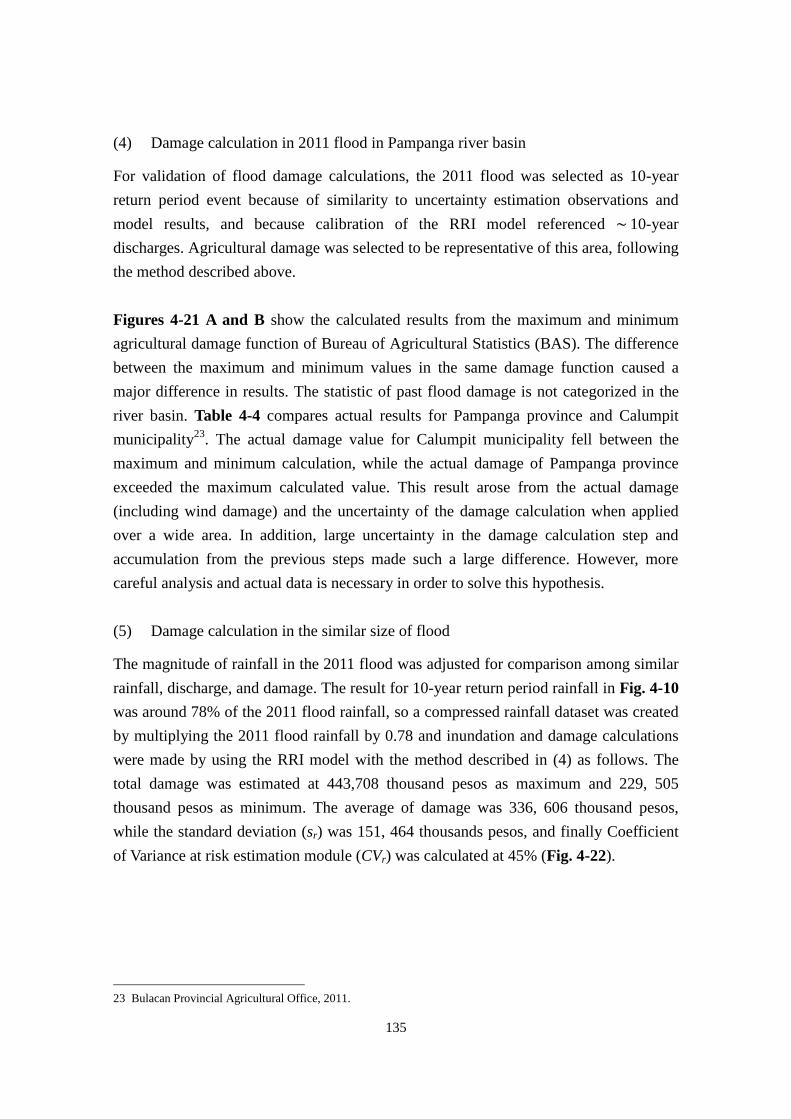
135
(4) Damage calculation in 2011 flood in Pampanga river basin
For validation of flood damage calculations, the 2011 flood was selected as 10-year
return period event because of similarity to uncertainty estimation observations and
model results, and because calibration of the RRI model referenced 10-year
discharges. Agricultural damage was selected to be representative of this area, following
the method described above.
Figures 4-21 A and B show the calculated results from the maximum and minimum
agricultural damage function of Bureau of Agricultural Statistics (BAS). The difference
between the maximum and minimum values in the same damage function caused a
major difference in results. The statistic of past flood damage is not categorized in the
river basin. Table 4-4 compares actual results for Pampanga province and Calumpit
municipality23
. The actual damage value for Calumpit municipality fell between the
maximum and minimum calculation, while the actual damage of Pampanga province
exceeded the maximum calculated value. This result arose from the actual damage
(including wind damage) and the uncertainty of the damage calculation when applied
over a wide area. In addition, large uncertainty in the damage calculation step and
accumulation from the previous steps made such a large difference. However, more
careful analysis and actual data is necessary in order to solve this hypothesis.
(5) Damage calculation in the similar size of flood
The magnitude of rainfall in the 2011 flood was adjusted for comparison among similar
rainfall, discharge, and damage. The result for 10-year return period rainfall in Fig. 4-10
was around 78% of the 2011 flood rainfall, so a compressed rainfall dataset was created
by multiplying the 2011 flood rainfall by 0.78 and inundation and damage calculations
were made by using the RRI model with the method described in (4) as follows. The
total damage was estimated at 443,708 thousand pesos as maximum and 229, 505
thousand pesos as minimum. The average of damage was 336, 606 thousand pesos,
while the standard deviation (sr) was 151, 464 thousands pesos, and finally Coefficient
of Variance at risk estimation module (CVr) was calculated at 45% (Fig. 4-22).
23 Bulacan Provincial Agricultural Office, 2011.
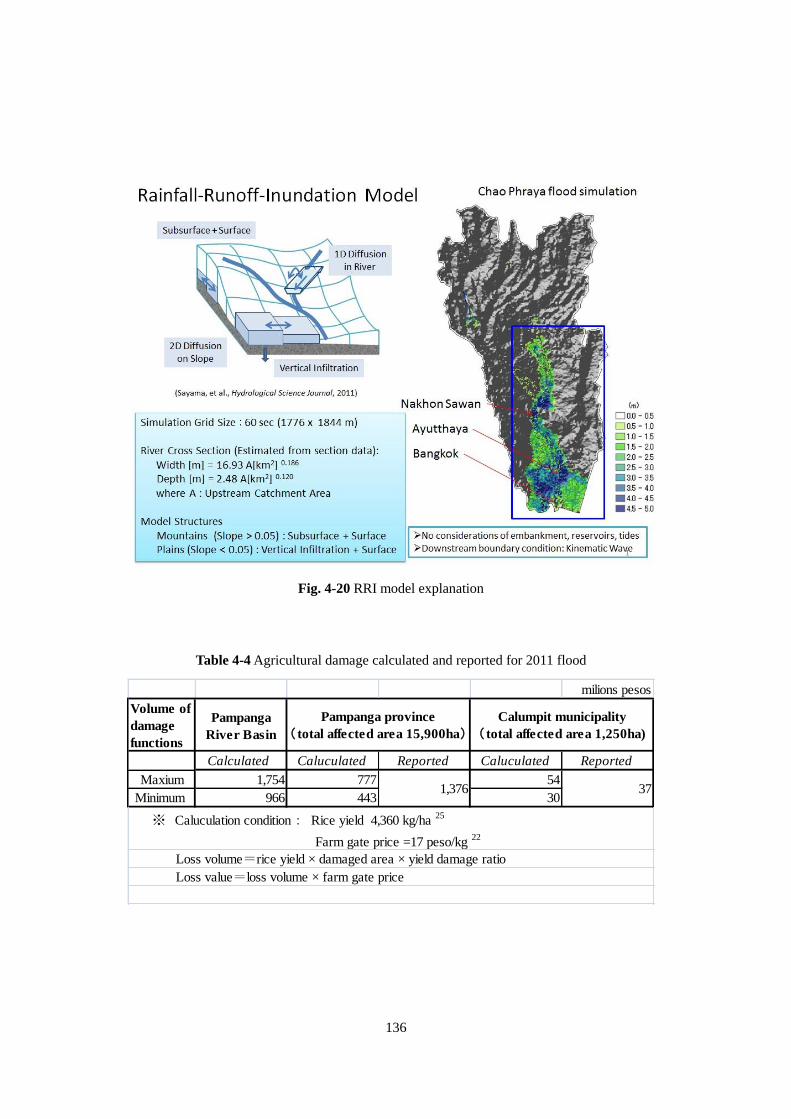
136
Fig. 4-20 RRI model explanation
Table 4-4 Agricultural damage calculated and reported for 2011 flood
milions pesos
Volume of
damage
functions
Pampanga
River Basin
Calculated Caluculated Reported Caluculated Reported
Maxium 1,754 777 54
Minimum 966 443 30
Pampanga province
(total affected area 15,900ha)
Calumpit municipality
(total affected area 1,250ha)
Loss volume=rice yield × damaged area × yield damage ratio
※ Caluculation condition : Rice yield 4,360 kg/ha 25
Farm gate price =17 peso/kg 22
Loss value=loss volume × farm gate price
1,376 37
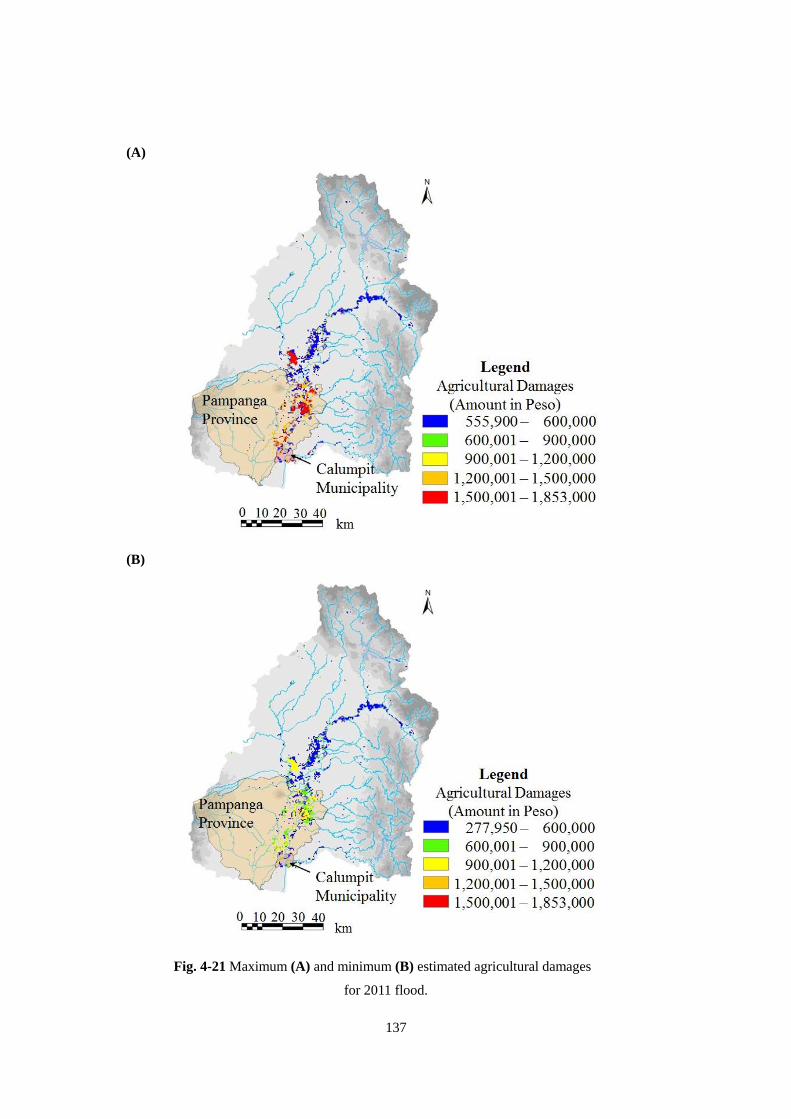
137
(A)
(B)
Fig. 4-21 Maximum (A) and minimum (B) estimated agricultural damages
for 2011 flood.
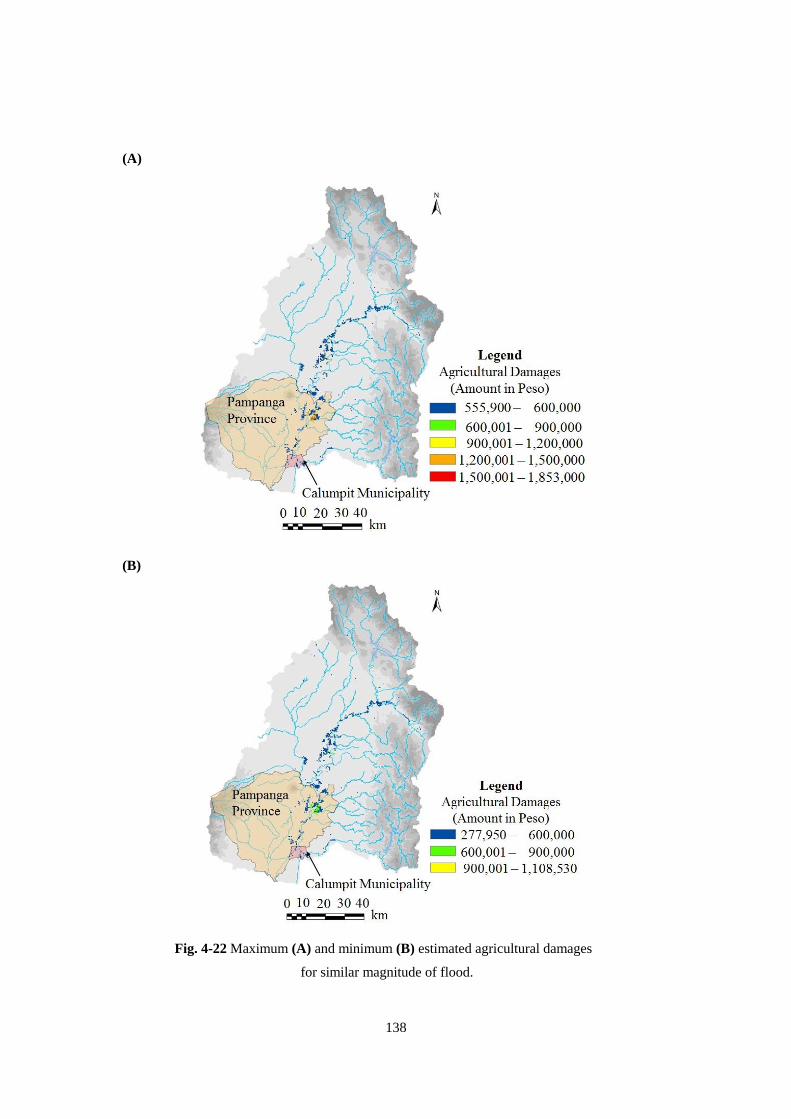
138
(A)
(B)
Fig. 4-22 Maximum (A) and minimum (B) estimated agricultural damages
for similar magnitude of flood.
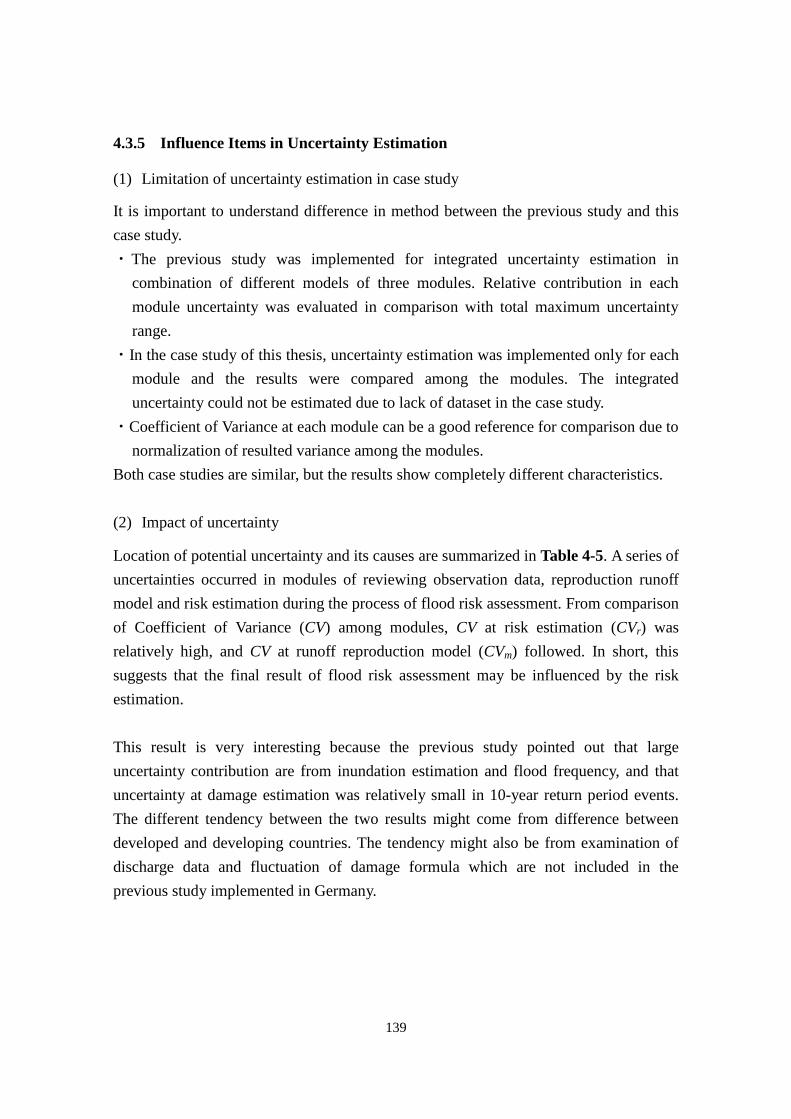
139
4.3.5 Influence Items in Uncertainty Estimation
(1) Limitation of uncertainty estimation in case study
It is important to understand difference in method between the previous study and this
case study.
・The previous study was implemented for integrated uncertainty estimation in
combination of different models of three modules. Relative contribution in each
module uncertainty was evaluated in comparison with total maximum uncertainty
range.
・In the case study of this thesis, uncertainty estimation was implemented only for each
module and the results were compared among the modules. The integrated
uncertainty could not be estimated due to lack of dataset in the case study.
・Coefficient of Variance at each module can be a good reference for comparison due to
normalization of resulted variance among the modules.
Both case studies are similar, but the results show completely different characteristics.
(2) Impact of uncertainty
Location of potential uncertainty and its causes are summarized in Table 4-5. A series of
uncertainties occurred in modules of reviewing observation data, reproduction runoff
model and risk estimation during the process of flood risk assessment. From comparison
of Coefficient of Variance (CV) among modules, CV at risk estimation (CVr) was
relatively high, and CV at runoff reproduction model (CVm) followed. In short, this
suggests that the final result of flood risk assessment may be influenced by the risk
estimation.
This result is very interesting because the previous study pointed out that large
uncertainty contribution are from inundation estimation and flood frequency, and that
uncertainty at damage estimation was relatively small in 10-year return period events.
The different tendency between the two results might come from difference between
developed and developing countries. The tendency might also be from examination of
discharge data and fluctuation of damage formula which are not included in the
previous study implemented in Germany.
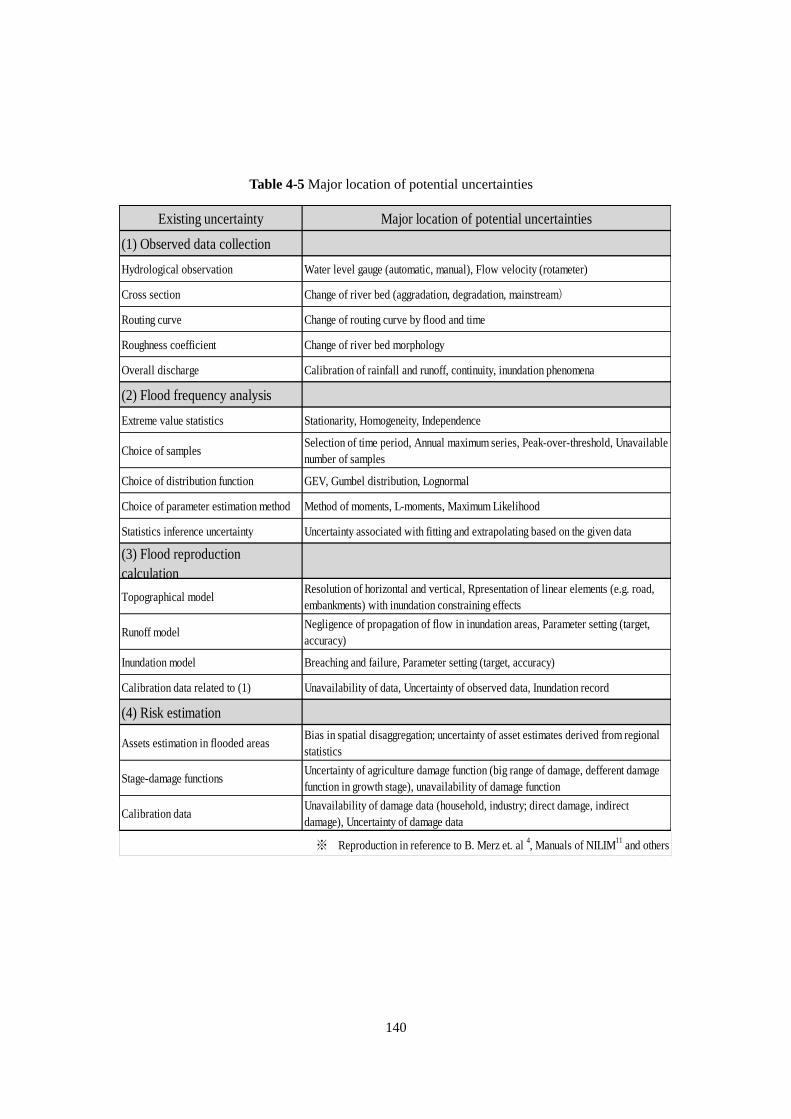
140
Table 4-5 Major location of potential uncertainties
Existing uncertainty Major location of potential uncertainties
(1) Observed data collection
Hydrological observation Water level gauge (automatic, manual), Flow velocity (rotameter)
Cross section Change of river bed (aggradation, degradation, mainstream)
Routing curve Change of routing curve by flood and time
Roughness coefficient Change of river bed morphology
Overall discharge Calibration of rainfall and runoff, continuity, inundation phenomena
(2) Flood frequency analysis
Extreme value statistics Stationarity, Homogeneity, Independence
Choice of samplesSelection of time period, Annual maximum series, Peak-over-threshold, Unavailable
number of samples
Choice of distribution function GEV, Gumbel distribution, Lognormal
Choice of parameter estimation method Method of moments, L-moments, Maximum Likelihood
Statistics inference uncertainty Uncertainty associated with fitting and extrapolating based on the given data
(3) Flood reproduction
calculation
Topographical modelResolution of horizontal and vertical, Rpresentation of linear elements (e.g. road,
embankments) with inundation constraining effects
Runoff modelNegligence of propagation of flow in inundation areas, Parameter setting (target,
accuracy)
Inundation model Breaching and failure, Parameter setting (target, accuracy)
Calibration data related to (1) Unavailability of data, Uncertainty of observed data, Inundation record
(4) Risk estimation
Assets estimation in flooded areasBias in spatial disaggregation; uncertainty of asset estimates derived from regional
statistics
Stage-damage functionsUncertainty of agriculture damage function (big range of damage, defferent damage
function in growth stage), unavailability of damage function
Calibration dataUnavailability of damage data (household, industry; direct damage, indirect
damage), Uncertainty of damage data
※ Reproduction in reference to B. Merz et. al 4, Manuals of NILIM
11 and others
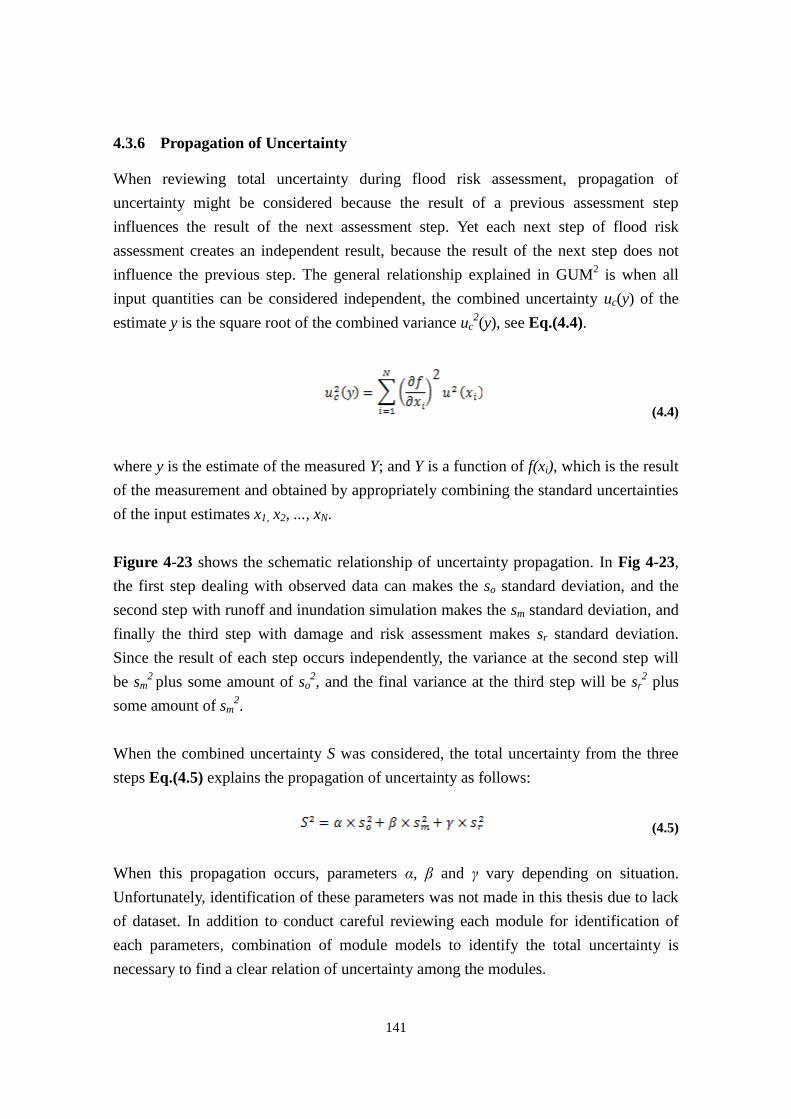
141
4.3.6 Propagation of Uncertainty
When reviewing total uncertainty during flood risk assessment, propagation of
uncertainty might be considered because the result of a previous assessment step
influences the result of the next assessment step. Yet each next step of flood risk
assessment creates an independent result, because the result of the next step does not
influence the previous step. The general relationship explained in GUM2 is when all
input quantities can be considered independent, the combined uncertainty uc(y) of the
estimate y is the square root of the combined variance uc2(y), see Eq.(4.4).
(4.4)
where y is the estimate of the measured Y; and Y is a function of f(xi), which is the result
of the measurement and obtained by appropriately combining the standard uncertainties
of the input estimates x1, x2, ..., xN.
Figure 4-23 shows the schematic relationship of uncertainty propagation. In Fig 4-23,
the first step dealing with observed data can makes the so standard deviation, and the
second step with runoff and inundation simulation makes the sm standard deviation, and
finally the third step with damage and risk assessment makes sr standard deviation.
Since the result of each step occurs independently, the variance at the second step will
be sm2
plus some amount of so2, and the final variance at the third step will be sr
2 plus
some amount of sm2.
When the combined uncertainty S was considered, the total uncertainty from the three
steps Eq.(4.5) explains the propagation of uncertainty as follows:
(4.5)
When this propagation occurs, parameters α, β and γ vary depending on situation.
Unfortunately, identification of these parameters was not made in this thesis due to lack
of dataset. In addition to conduct careful reviewing each module for identification of
each parameters, combination of module models to identify the total uncertainty is
necessary to find a clear relation of uncertainty among the modules.
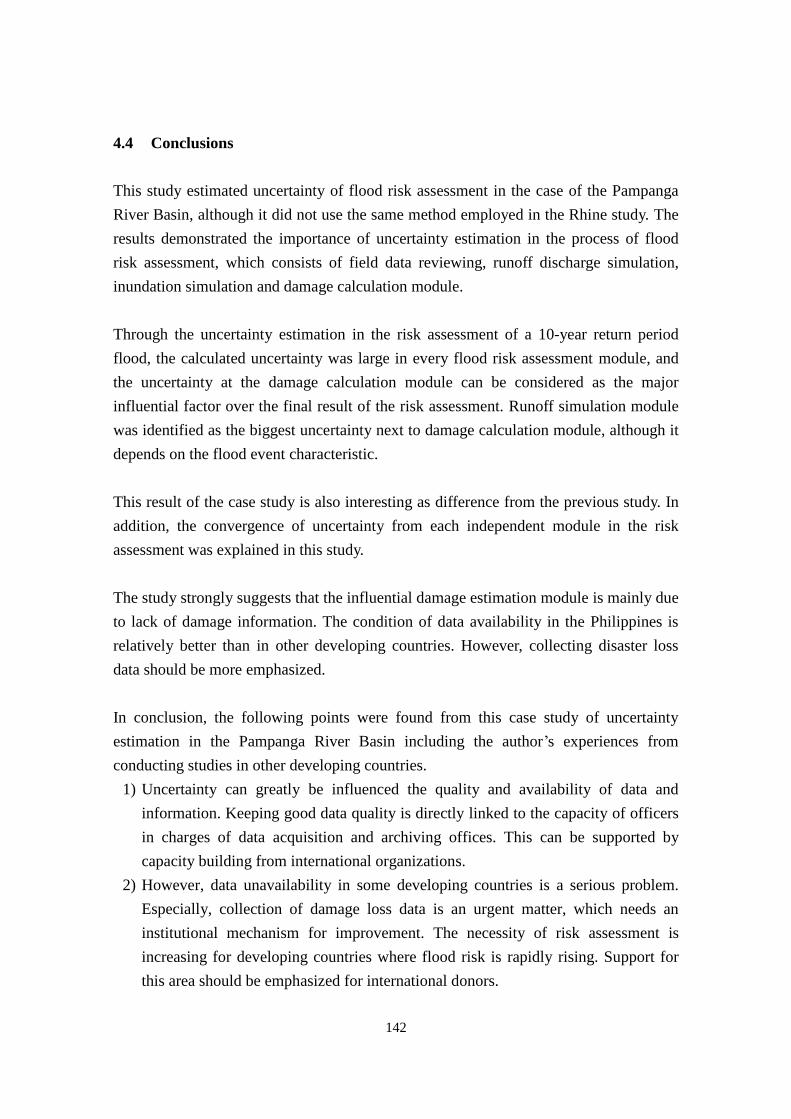
142
4.4 Conclusions
This study estimated uncertainty of flood risk assessment in the case of the Pampanga
River Basin, although it did not use the same method employed in the Rhine study. The
results demonstrated the importance of uncertainty estimation in the process of flood
risk assessment, which consists of field data reviewing, runoff discharge simulation,
inundation simulation and damage calculation module.
Through the uncertainty estimation in the risk assessment of a 10-year return period
flood, the calculated uncertainty was large in every flood risk assessment module, and
the uncertainty at the damage calculation module can be considered as the major
influential factor over the final result of the risk assessment. Runoff simulation module
was identified as the biggest uncertainty next to damage calculation module, although it
depends on the flood event characteristic.
This result of the case study is also interesting as difference from the previous study. In
addition, the convergence of uncertainty from each independent module in the risk
assessment was explained in this study.
The study strongly suggests that the influential damage estimation module is mainly due
to lack of damage information. The condition of data availability in the Philippines is
relatively better than in other developing countries. However, collecting disaster loss
data should be more emphasized.
In conclusion, the following points were found from this case study of uncertainty
estimation in the Pampanga River Basin including the author’s experiences from
conducting studies in other developing countries.
1) Uncertainty can greatly be influenced the quality and availability of data and
information. Keeping good data quality is directly linked to the capacity of officers
in charges of data acquisition and archiving offices. This can be supported by
capacity building from international organizations.
2) However, data unavailability in some developing countries is a serious problem.
Especially, collection of damage loss data is an urgent matter, which needs an
institutional mechanism for improvement. The necessity of risk assessment is
increasing for developing countries where flood risk is rapidly rising. Support for
this area should be emphasized for international donors.
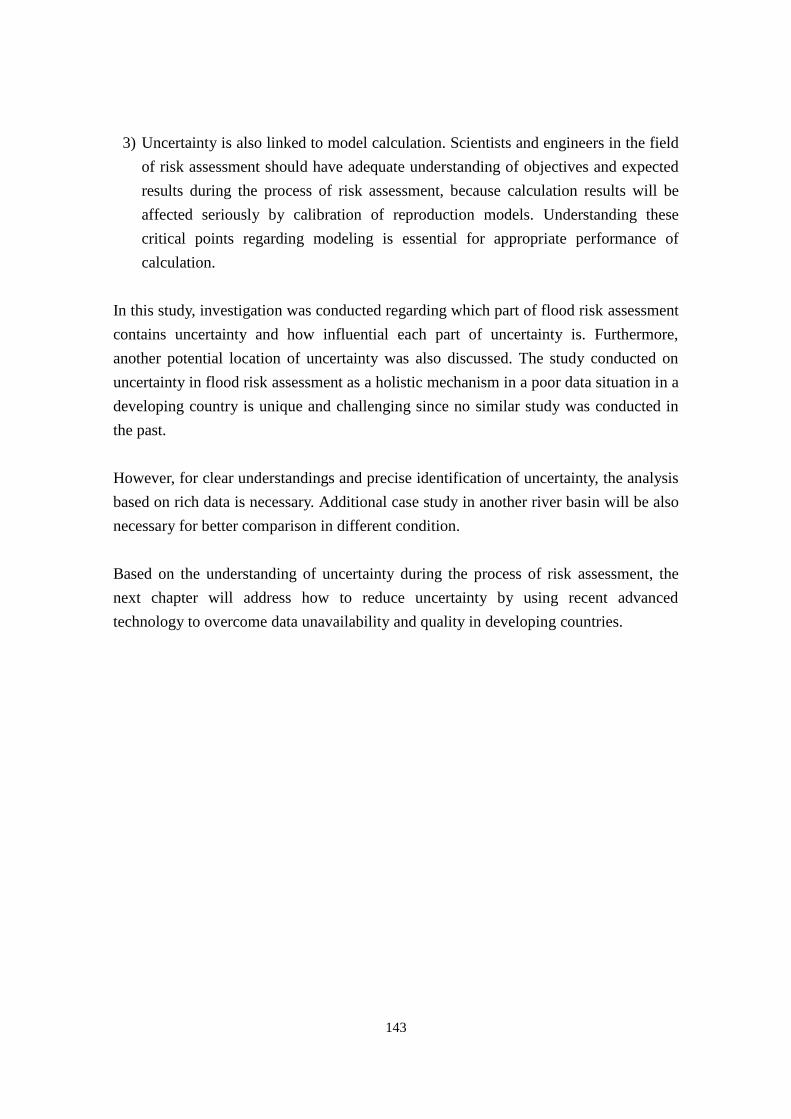
143
3) Uncertainty is also linked to model calculation. Scientists and engineers in the field
of risk assessment should have adequate understanding of objectives and expected
results during the process of risk assessment, because calculation results will be
affected seriously by calibration of reproduction models. Understanding these
critical points regarding modeling is essential for appropriate performance of
calculation.
In this study, investigation was conducted regarding which part of flood risk assessment
contains uncertainty and how influential each part of uncertainty is. Furthermore,
another potential location of uncertainty was also discussed. The study conducted on
uncertainty in flood risk assessment as a holistic mechanism in a poor data situation in a
developing country is unique and challenging since no similar study was conducted in
the past.
However, for clear understandings and precise identification of uncertainty, the analysis
based on rich data is necessary. Additional case study in another river basin will be also
necessary for better comparison in different condition.
Based on the understanding of uncertainty during the process of risk assessment, the
next chapter will address how to reduce uncertainty by using recent advanced
technology to overcome data unavailability and quality in developing countries.
144
Fig. 4-23 Schematic relation of uncertainty propagation
145
References
1. T. Okazumi, M. Miyamoto, B. B. Shrestha, and M. Gusyev, Uncertainty Estimation during the
Process of Flood Risk Assessment in Developing Countries - Case Study in the Pampanga
River basin -, Journal of Disaster Research vol. 9 no.1 : 69-77, 2014.
2. Joint Committee for Guides in Metrology, “Evaluation of measurement data – guide to the
expression of uncertainty in measurement”, JCGM 100:2008, GUM 1995 with minor
corrections, corrected version 2010.
3. K. Takemura, K. Yoshikawa, and S. Fujii, “Taxonomy of uncertainties and risk evaluation”, A
proposal of the theoretical framework, Journal of Socio-technological Research, vol.2, 12-20,
Oct. 2004 (in Japanese).
4. B. Merz and A. H. Thieken, “Flood risk curves and uncertainty bounds”, Natural Hazards, 51, 3,
437-458; DOI:10.1007/s11069-009-9452-6, 2009.
5. M. Disse, H. Engel, Flood events in the Rhine basins: genesis, influences and mitigation,
Natural Hazards 23: 271-290, 2001.
6. L. Pfister, J. Kwadijk, A. Musy, A. Bronstert, and L. Hoffmann, Climate change, land use
change and runoff prediction in the Rhine-Meuse Basin, River Research and Applications 20:
229-241. DOI: 10.1002/rra.775, 2004.
7. R. Vogt, Hochwasser in Koln: Dokumentation der Fachtagung “Mit dem Hochwasser leben”,
Baden-Baden : 48-55, 1995.
8. A. Fink, U. Ulbrich, and H. Engel, Aspects of the January 1995 flood in Germany. Weather 51:
34-39, 1996.
9. Visser H, Folkert RJM, Hoekstra J, de Wolff JJ, Identifying key sources of uncertainty in
climate change projections. Climatic Change 45(3-4): 421-457, 2000.
10. National Disaster Risk Reduction and Management Council, “Sitrep no.11 re Effects of
Tropical Storm “HELEN” and enhanced southwest monsoon”, NDRRMC UPDATA, 19
August, 2012
146
11. National Disaster Risk Reduction and Management Council, “Destructive Typhoon 1970-2011”,
2012.
12. Regional Disaster Risk Reduction and Management Council, “Flood Damage Data, Effect of
Weather Disturbance in Region III”, 2012.
13. J.R. Stedinger, and R.M. Vogel, E.Foufoula-georgiou, Frequency Analysis of Extreme Events,
Chapter 18, Handbook of Hydrology, McGRAW-HILL, INC., 1993.
14. Flood disaster prevention division, Research Center for Disaster Management, National
Institute for Land and Infrastructure Management, Ministry of Land, Infrastructure, Transport
and Tourism, Japan, “Checklist of flood forecasting system, ver. 2009, details and supplemental
explanation”, June 2010.
15. T. Sugiura, K. Fukami, N. Fujiwara, K. Hamaguchi, S. Nakamura, S. Hironaka, K. Nakamura,
T. Wada, M. Ishikawa, T. Shimizu, H. Inomata, and K. Ito; “Development of integrated flood
analysis system (IFAS) and its applications”, Proceeding of the 8th International Conference on
Hydro-informatics (HIC2009), CD-ROM, 2009.
16. M. Miyamoto, A. Sugiura, T. Okazumi, S. Tanaka, S. Nabesaka, and K. Fukami, “Suggestion
for an advanced early warning system based on flood forecasting in Bengawan Solo river basin,
Indonesia”, Proceedings of the 10th International Conference on Hydro-informatics, Hamburg,
Germany, 2012.
17. K. Takeuchi, P. Hapuarachchi, M. Zhou, H. Ishidaira, and J. Magome, “A BTOP model to
extend TOPMODEL for distributed hydrological simulation of large basins”, Hydrological
Processes, 22: 3236-3251, 2008.
18. Ministry of Land, Infrastructure, Transport and Tourism, “Manual on flood control and
economic investigation (draft)”, April 2005 (in Japanese).
19. B. B. Shrestha, T. Okazumi, S. Tanaka, A. Sugiura, Y. Kwak, and S. Hibino, “Development of
flood vulnerability indices for lower Mekong basin in Cambodian floodplain”, Annual Journal
of Hydraulic Engineering, JSCE, Vol.57, February, 2013.
147
20. T. Okazumi, S. Tanaka, Y. Kwak, B. B. Shrestha, and A. Sugiura, “Flood vulnerability
assessment in the light of rice cultivation characteristics in Mekong river flood plain in
Cambodia”, Paddy and Water Environment, DOI 10.1007/s10333-013-043-1, 2013.
21. Ministry of Education, Culture, Sports, Science and Technology-Japan, “Report in 2011,
projection of the change in future weather extremes using super-high-resolution atmospheric
models, innovative program of climate change projection for the 21st century”: 207-218, March
2012 (in Japanese).
22. A. Sugiura, S. Tanaka, T. Okazumi, Y. Kwak, S. Hibino, and B. B. Shrestha, “Calculation of
flood house damages in the Mekong river basin in Cambodia”, 6th International Perspective on
Water resources and the Environment, Turkey, January 2013.
23. Bureau of Agricultural Statistics, “Manual on damage assessment and reporting system”,
Department of Agriculture, Philippines, February 2013.
24. T. Sayama, Y. Tatebe, M. Fujioka, T. Ushiyama, A. Yorozuya, and S. Tanaka, “Rainfall -
runoff inundation forecasting in 2011 Thailand flood”, Journal of Japan Society of Civil
Engineering, 2013 (in Japanese).
25. T. Sayama, G. Ozawa, T. Kawakami, S. Nabesaka, and K. Fukami, “Rainfall-runoff-inundation
analysis of Pakistan flood 2010 at the Kabul river basin”, Hydrological Science Journal, IAHS,
2011.
26. Bulacan Provincial Agricultural Office, “Final validation report for cereals”, 2011.

148
149
Chapter 5
Possible Technologies for Convergence of Uncertainty in Flood Risk
Assessment
5.1 Introduction
In the previous chapter, the results of the case study clearly showed uncertainty exists in
each step of flood risk assessment, and the greatest uncertainty exists in damage
calculation. Furthermore, uncertainty in each step is carried over to the next step in
flood risk assessment, and the final uncertainty becomes large as a result of
accumulation of uncertainty at each step. Uncertainty contained in the results reflects
the unavailability and quality of data and information, and it is also linked to difficulty
in collecting information in developing countries. Especially, it is the evidence that
information on direct damage, for example, to human, house, agriculture and industry is
sometimes difficult to collect, and that some countries do not have any systems for
damage data collection or damage calculation. Unfortunately, this kind of difficulty
exists not only in the process using damage data, but also in other steps of flood risk
assessment. In conclusion, it is clear that overcoming this difficulty is an important
challenge for uncertain studies.
This means that flood risk assessment can be seen as one holistic system consisting of
multiple steps. Identifying uncertainty in each step, finding out the most problematic
step, clarifying an uncertainty accumulation mechanism to the final result, and
specifying causes of uncertainty are similar to system maintenance.
The interesting mechanism is that each step receives uncertainty from the previous step,
adds more uncertainty unique in each step, and carries it over to the next step. An actual
flood is assessed in each step based on a wide range of data such as precipitation, water
level, inundation area, water depth, and damage. Uncertainty adds up through the
process of risk assessment because each set of data contains uncertainty, which is carries
over to the next step at which uncertainty from the previous step is combined with
uncertainty at the current step.
In this aspect, this chapter recommends necessary actions to reduce uncertainty, and
introduces useful technology for that purpose. Combination of conventional measures
150
and new technology can help for cross-checking data and information, and contributes
to reduction of uncertainty in the final results.
Other issues discussed in this section are what is the main target in uncertainty reduction,
what level of uncertainty can be considered acceptable, and how much uncertainty can
be reduced by the technology proposed in this study.
5.2 Convergence of Uncertainty
Efforts to reduce uncertainty in each step of flood risk assessment are important to
obtain reasonable results because of the stepwise-linkages. Accumulation of each effort
brings a better result. In this aspect, conventional and basic procedures should be the
foundation of all technology; however, new technology is also available in the world.
Combination of conventional and new technology and use of multiple sets of
information to cross-check data at each step are useful during flood risk assessment. As
for new technology, the development of satellite data and the improvement of its
availability are effective to cross-check information and thus to reduce uncertainty
especially in developing countries. Uncertainty can be further reduced by the combining
observation information (e.g., cross section, flow velocity, historical flood record,
maximum flood marks in past floods to identify the maximum inundation area and
depth) with satellite information (Moderate Resolution Imaging Spectrometer (MODIS),
Synthetic Aperture Radar (SAR) and Pico-satellite for Remote-sensing and Innovative
Space Mission (PRISM)) to identify inundation areas and depths, and vegetation growth
measurement. Uncertainty reduction in each step, represented by white arrows in Fig.
5-1, reduced uncertainty in the entire process and produced better assessment results1,2
.
Before introduction of new technology, the following are recommendations will reduce
uncertainty in flood risk assessment:
a) Data collection: Field data play an important, fundamental role in statistical
analysis, model simulation, and damage estimation. Preparation of reliable, accurate
hydrological and damage data is a costly and time-consuming process, but of
paramount importance for risk assessment of past and future flood events.
b) Data cross-validation: Through international cooperation, a reliable and automated
data collection mechanism needs to be established a major activity for
1 A. Yorozuya et al., 2013.
2 T. Okazumi et al., 2013.
151
mainstreaming disaster risk reduction. Satellite information was useful for data
collection in remote areas without observing stations, and to cross-validate field
data. The data cross-validation reduced uncertainty and such research should be
encouraged on this topic.
c) Data prioritization: From a flood risk reduction perspective, further research is
needed in the field of flood risk uncertainty estimation to identify cost-effective,
relevant flood damage mitigation actions. Accurately estimating flood risk
uncertainty requires the stepwise approach of data prioritization to cover critical
data gaps. In addition, satellite information should be used as supplementary
measures to reduce uncertainty during the flood risk assessment process.
Based on these recommendations, potential technology will be discussed in the
following subsections in terms of hazard observation, reproduction model, and damage
estimation.
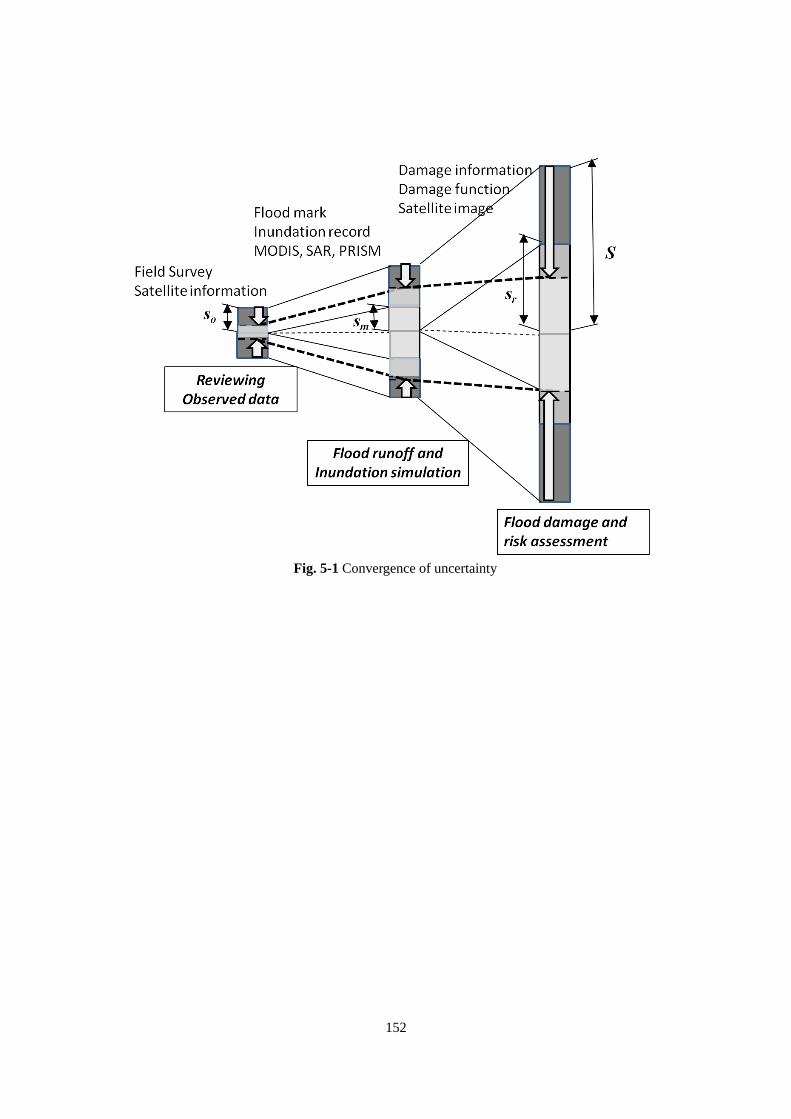
152
Fig. 5-1 Convergence of uncertainty
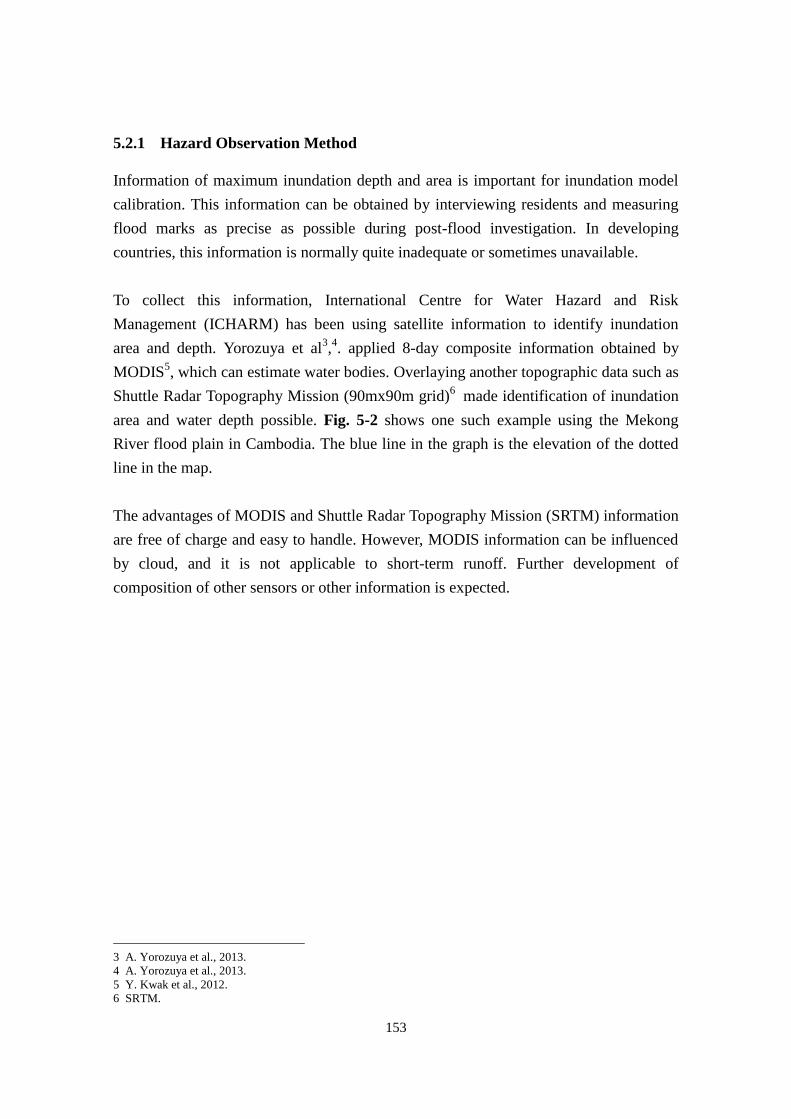
153
5.2.1 Hazard Observation Method
Information of maximum inundation depth and area is important for inundation model
calibration. This information can be obtained by interviewing residents and measuring
flood marks as precise as possible during post-flood investigation. In developing
countries, this information is normally quite inadequate or sometimes unavailable.
To collect this information, International Centre for Water Hazard and Risk
Management (ICHARM) has been using satellite information to identify inundation
area and depth. Yorozuya et al3,4. applied 8-day composite information obtained by
MODIS5, which can estimate water bodies. Overlaying another topographic data such as
Shuttle Radar Topography Mission (90mx90m grid)6 made identification of inundation
area and water depth possible. Fig. 5-2 shows one such example using the Mekong
River flood plain in Cambodia. The blue line in the graph is the elevation of the dotted
line in the map.
The advantages of MODIS and Shuttle Radar Topography Mission (SRTM) information
are free of charge and easy to handle. However, MODIS information can be influenced
by cloud, and it is not applicable to short-term runoff. Further development of
composition of other sensors or other information is expected.
3 A. Yorozuya et al., 2013.
4 A. Yorozuya et al., 2013.
5 Y. Kwak et al., 2012.
6 SRTM.
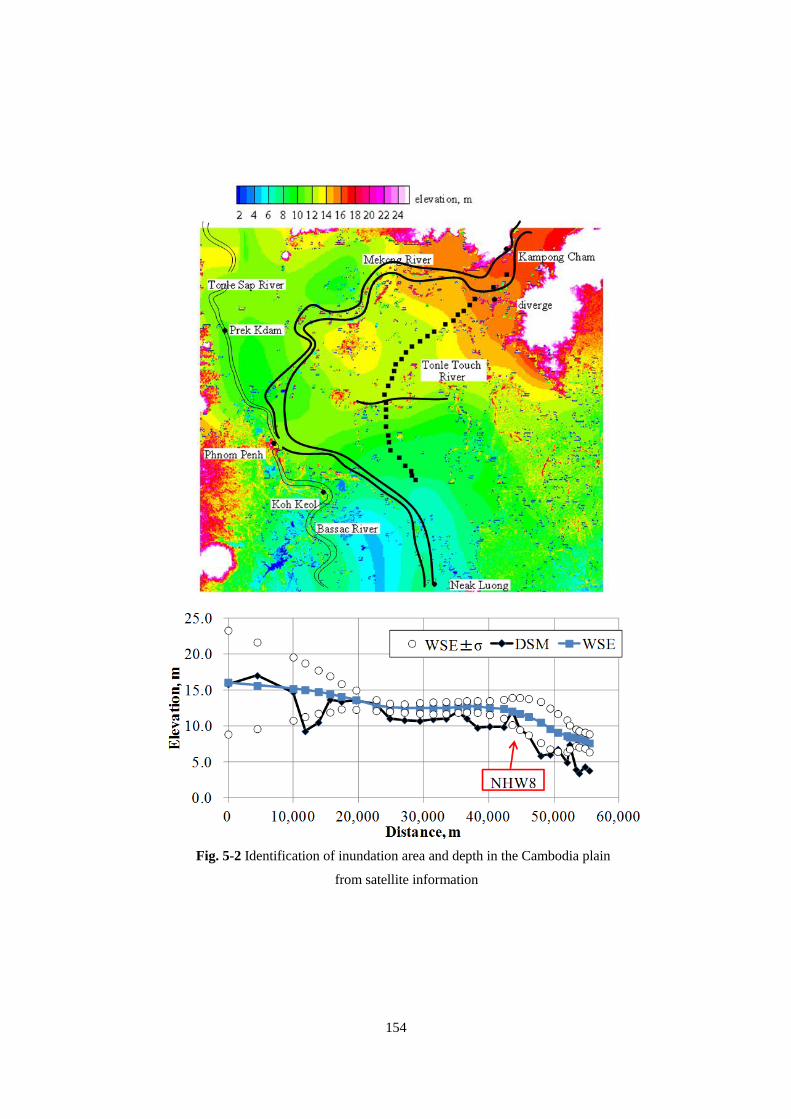
154
Fig. 5-2 Identification of inundation area and depth in the Cambodia plain
from satellite information
155
5.2.2 Hazard Simulation Method
When selecting a runoff and inundation simulation model, one can easily select a
popular model. However, it does not work sometimes in developing countries because it
usually needs detailed topography as input data. In such a case, one has to decide to use
the model even though it requires a huge amount of time and cost to measure the target
area or to simply give it up. To avoid this situation, a simulation model applicable to
developing counties is introduced in this subsection.
(1) Runoff-Rainfall Inundation (RRI) model7,8
ICHARM developed the RRI model, which can overcome difficulties in implementing
flood inundation simulation in wide flat plains where existing models have problems in
simulation.
The RRI model can simulate rainfall running down the slope, gathering into the river,
flowing in the river, and flooding at the same time. This model can use satellite rainfall
and satellite topography.
A Japan International Cooperation Agency (JICA) report presented comparison between
the RRI model and the MIKE model as a popular model. Major results are shown in Fig.
5-2 and Table 5-19.
While the MIKE model is a simplified model, the RRI model is a unique model which
can simulate both runoff and inundation. However, compared with other types of
software, RRI is still simple, being provided free of charge as an open program using m
code, though it needs more improvement in applicability to a wider range of conditions.
(2) ICHARM Hydro-Geo method10,11
The ICHARM Hydro-Geo Method was developed to identify inundation area and depth
in a Cambodian flood plain using a Cambodian irrigation system with colematage
which naturally intakes water to paddy fields. The method was introduced in detail in
section 2.4.3 with utilized hydro-meteorological analysis, Geographic Information
7 T. Sayama et al., 2013.
8 T. Sayama et al., 2011. 9 JICA, 2013.
10 T. Okazumi et al., 2013.
11 ICHARM, 2013.
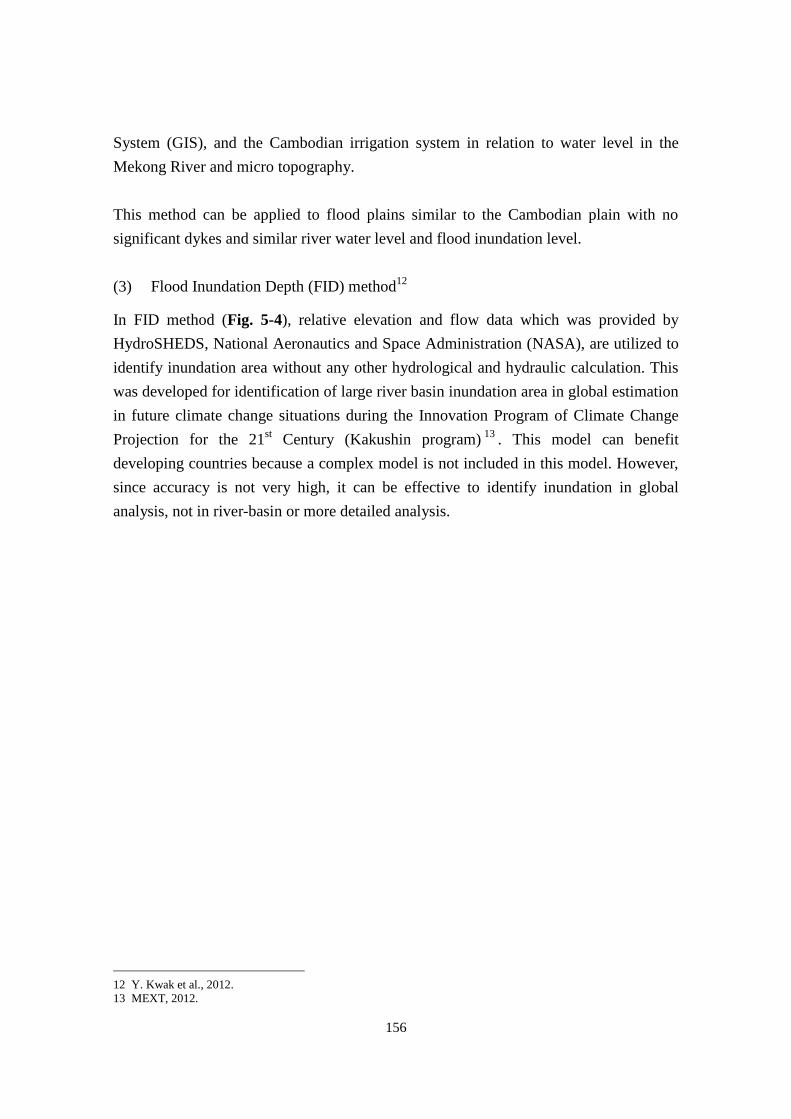
156
System (GIS), and the Cambodian irrigation system in relation to water level in the
Mekong River and micro topography.
This method can be applied to flood plains similar to the Cambodian plain with no
significant dykes and similar river water level and flood inundation level.
(3) Flood Inundation Depth (FID) method12
In FID method (Fig. 5-4), relative elevation and flow data which was provided by
HydroSHEDS, National Aeronautics and Space Administration (NASA), are utilized to
identify inundation area without any other hydrological and hydraulic calculation. This
was developed for identification of large river basin inundation area in global estimation
in future climate change situations during the Innovation Program of Climate Change
Projection for the 21st Century (Kakushin program)
13. This model can benefit
developing countries because a complex model is not included in this model. However,
since accuracy is not very high, it can be effective to identify inundation in global
analysis, not in river-basin or more detailed analysis.
12 Y. Kwak et al., 2012.
13 MEXT, 2012.
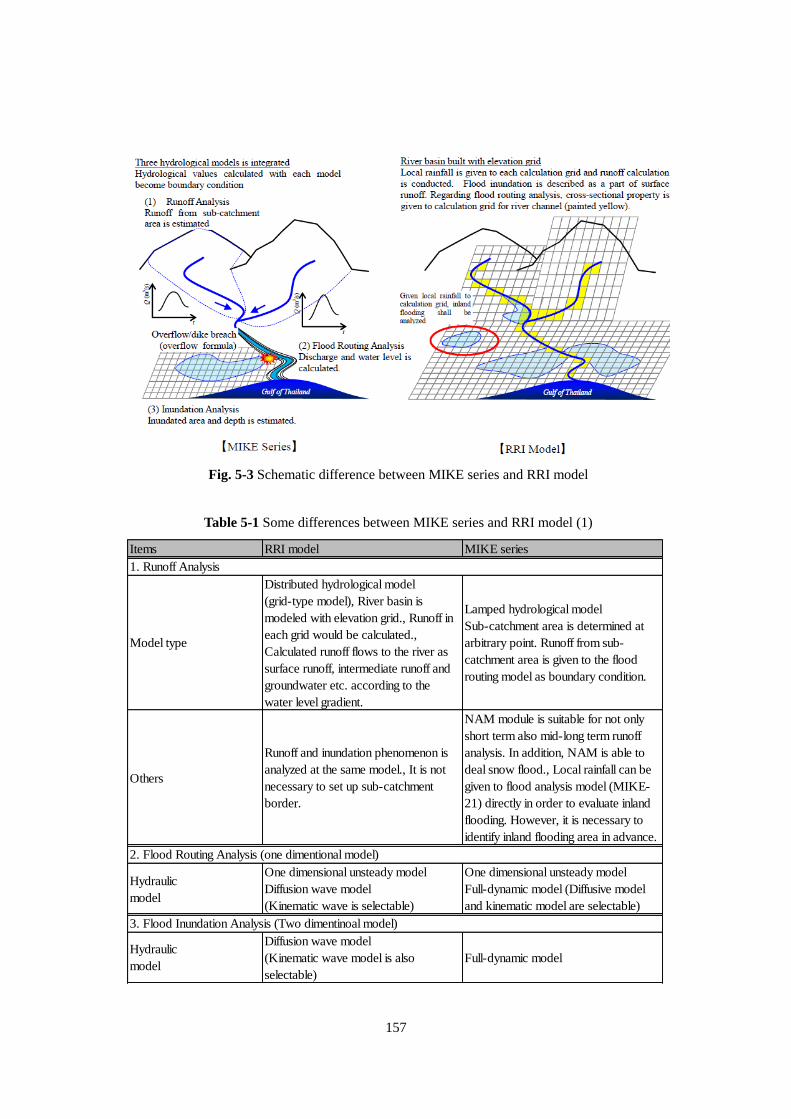
157
Fig. 5-3 Schematic difference between MIKE series and RRI model
Table 5-1 Some differences between MIKE series and RRI model (1)
Items RRI model MIKE series
Model type
Distributed hydrological model
(grid-type model), River basin is
modeled with elevation grid., Runoff in
each grid would be calculated.,
Calculated runoff flows to the river as
surface runoff, intermediate runoff and
groundwater etc. according to the
water level gradient.
Lamped hydrological model
Sub-catchment area is determined at
arbitrary point. Runoff from sub-
catchment area is given to the flood
routing model as boundary condition.
Others
Runoff and inundation phenomenon is
analyzed at the same model., It is not
necessary to set up sub-catchment
border.
NAM module is suitable for not only
short term also mid-long term runoff
analysis. In addition, NAM is able to
deal snow flood., Local rainfall can be
given to flood analysis model (MIKE-
21) directly in order to evaluate inland
flooding. However, it is necessary to
identify inland flooding area in advance.
Hydraulic
model
One dimensional unsteady model
Diffusion wave model
(Kinematic wave is selectable)
One dimensional unsteady model
Full-dynamic model (Diffusive model
and kinematic model are selectable)
Hydraulic
model
Diffusion wave model
(Kinematic wave model is also
selectable)
Full-dynamic model
1. Runoff Analysis
2. Flood Routing Analysis (one dimentional model)
3. Flood Inundation Analysis (Two dimentinoal model)
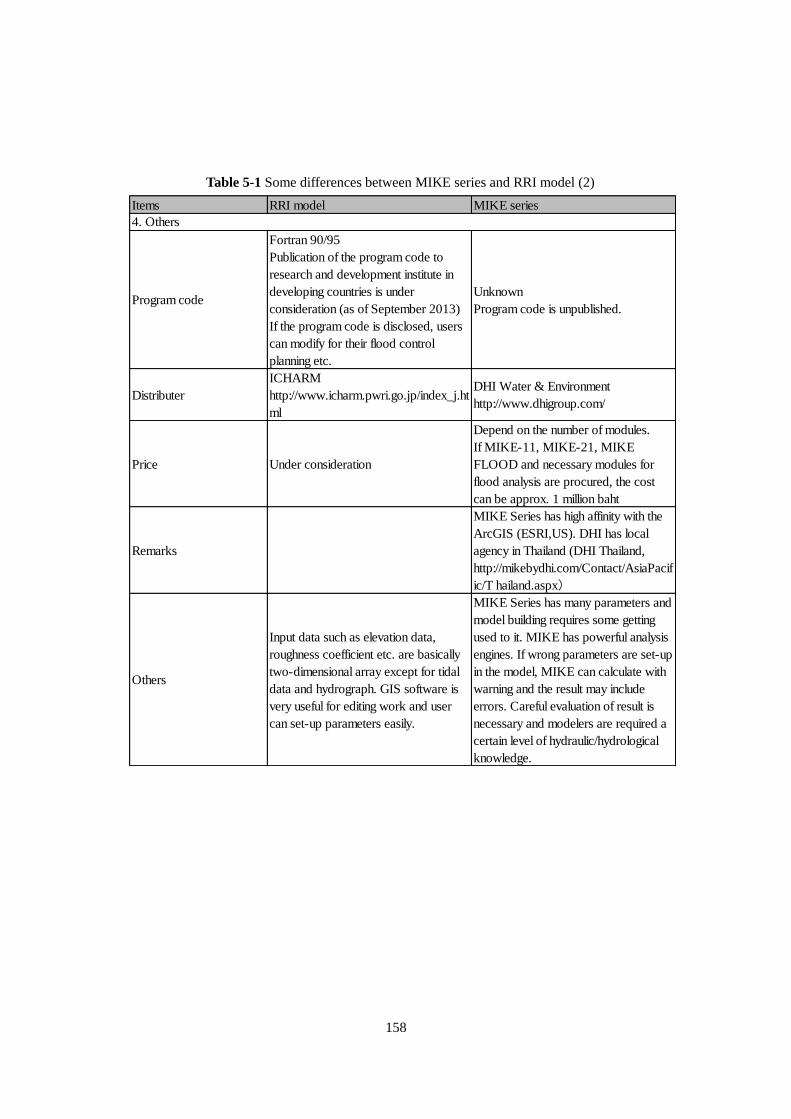
158
Table 5-1 Some differences between MIKE series and RRI model (2)
Items RRI model MIKE series
Program code
Fortran 90/95
Publication of the program code to
research and development institute in
developing countries is under
consideration (as of September 2013)
If the program code is disclosed, users
can modify for their flood control
planning etc.
Unknown
Program code is unpublished.
Distributer
ICHARM
http://www.icharm.pwri.go.jp/index_j.ht
ml
DHI Water & Environment
http://www.dhigroup.com/
Price Under consideration
Depend on the number of modules.
If MIKE-11, MIKE-21, MIKE
FLOOD and necessary modules for
flood analysis are procured, the cost
can be approx. 1 million baht
Remarks
MIKE Series has high affinity with the
ArcGIS (ESRI,US). DHI has local
agency in Thailand (DHI Thailand,
http://mikebydhi.com/Contact/AsiaPacif
ic/T hailand.aspx)
Others
Input data such as elevation data,
roughness coefficient etc. are basically
two-dimensional array except for tidal
data and hydrograph. GIS software is
very useful for editing work and user
can set-up parameters easily.
MIKE Series has many parameters and
model building requires some getting
used to it. MIKE has powerful analysis
engines. If wrong parameters are set-up
in the model, MIKE can calculate with
warning and the result may include
errors. Careful evaluation of result is
necessary and modelers are required a
certain level of hydraulic/hydrological
knowledge.
4. Others
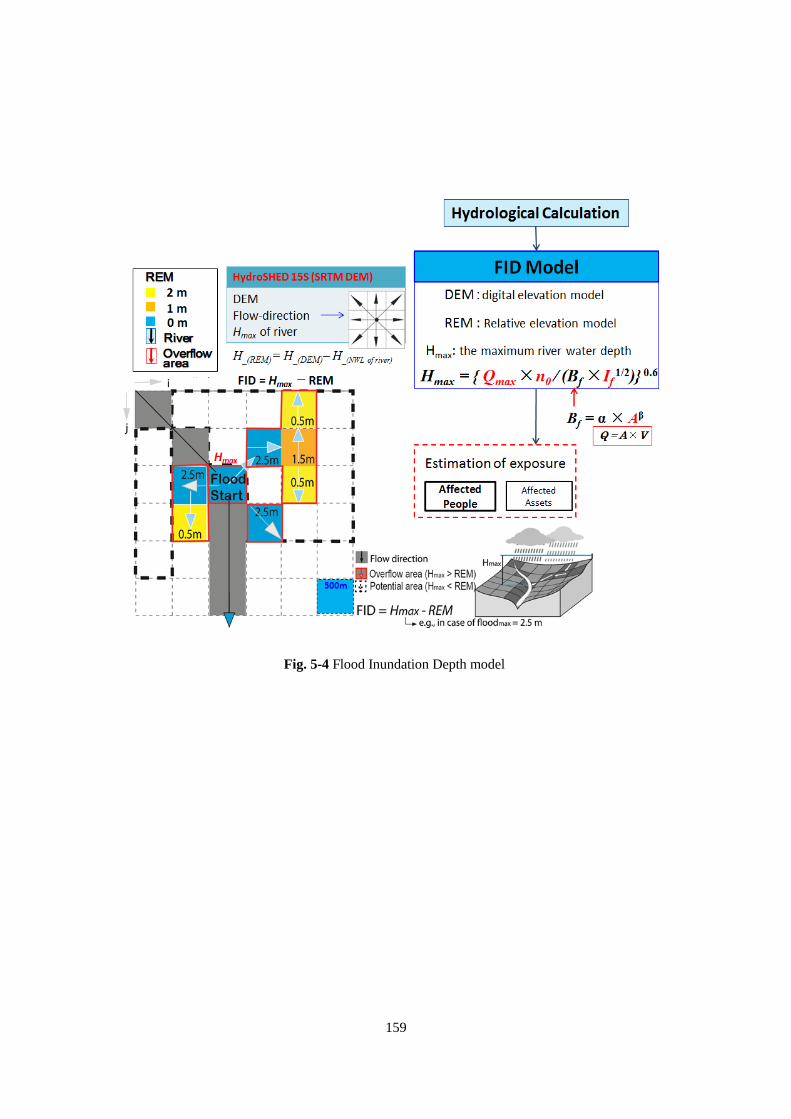
159
Fig. 5-4 Flood Inundation Depth model
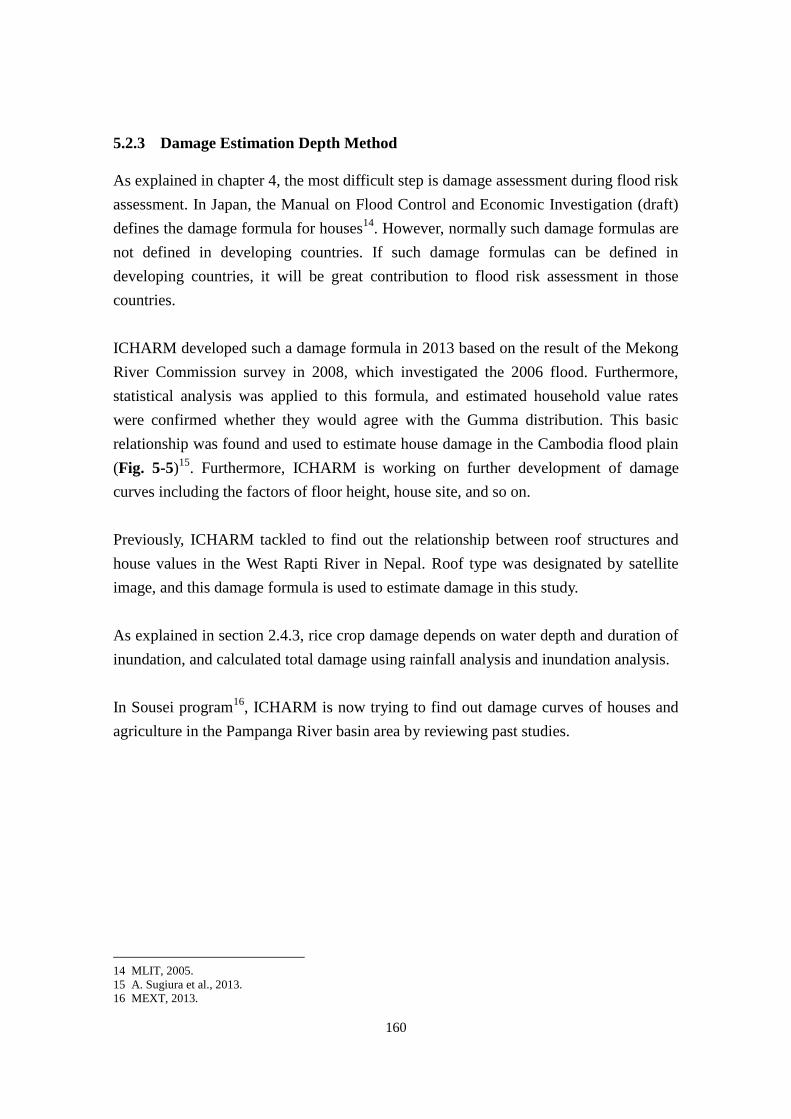
160
5.2.3 Damage Estimation Depth Method
As explained in chapter 4, the most difficult step is damage assessment during flood risk
assessment. In Japan, the Manual on Flood Control and Economic Investigation (draft)
defines the damage formula for houses14
. However, normally such damage formulas are
not defined in developing countries. If such damage formulas can be defined in
developing countries, it will be great contribution to flood risk assessment in those
countries.
ICHARM developed such a damage formula in 2013 based on the result of the Mekong
River Commission survey in 2008, which investigated the 2006 flood. Furthermore,
statistical analysis was applied to this formula, and estimated household value rates
were confirmed whether they would agree with the Gumma distribution. This basic
relationship was found and used to estimate house damage in the Cambodia flood plain
(Fig. 5-5)15
. Furthermore, ICHARM is working on further development of damage
curves including the factors of floor height, house site, and so on.
Previously, ICHARM tackled to find out the relationship between roof structures and
house values in the West Rapti River in Nepal. Roof type was designated by satellite
image, and this damage formula is used to estimate damage in this study.
As explained in section 2.4.3, rice crop damage depends on water depth and duration of
inundation, and calculated total damage using rainfall analysis and inundation analysis.
In Sousei program16
, ICHARM is now trying to find out damage curves of houses and
agriculture in the Pampanga River basin area by reviewing past studies.
14 MLIT, 2005.
15 A. Sugiura et al., 2013.
16 MEXT, 2013.
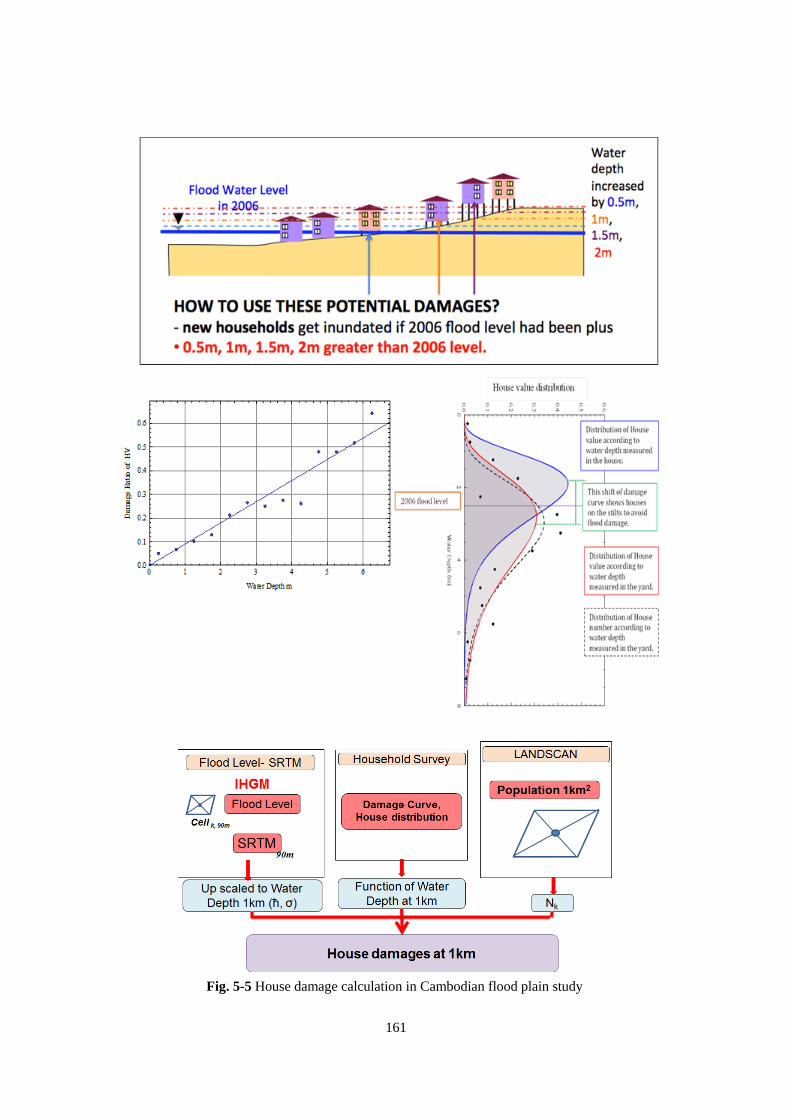
161
Fig. 5-5 House damage calculation in Cambodian flood plain study
162
5.3 Discussion on Limitation and Target of Uncertainty
As explained in the previous chapters, uncertainty always occurs during flood risk
assessment; even greater uncertainty is often expected during flood risk assessment in
developing countries. Furthermore, data unavailability makes validation of the results
difficult. As a consequence, the results of calculation are often not reliable, which makes
the implementation of flood risk assessment seemingly meaningless.
This subsection discusses the limitation of uncertainty and the limitation of
implementation of flood risk assessment.
5.3.1 Limitation of Uncertainty
In the discussion of the limitation of uncertainty during flood risk assessment, it is
important to start it with how to use the results of such assessment. The original
objective defines what extent of accuracy is necessary.
5.3.2 User’s Perspectives
First, it is critical to review the purposes of flood risk assessment and consider how to
use the results of the assessment.
Flood risk assessment is usually implemented on a river-basin scale. And its purpose is
the identification of countermeasures after flood damage has occurred in consideration
of the weakest point in the river, types of frequent damage, and expected locations
prone to future floods among other issues.
If there are some areas with the same probability of flood damage, the following are
considered: Which area is the most vulnerable or may suffer the most serious damage,
what kind of countermeasures should be selected, what other measures, such as
avoidance, transfer, removal, shift and reduction, should be considered, what kind of or
how large measures are appropriate, how much it will cost to implement such measures ,
what are the results of cost-benefit analysis, and whether such measures are feasible or
not.
In short, the following are identified as important points:
1) Identification of high risk areas and their boundary
163
2) Ranking of high risk areas
3) Identification of countermeasures and their cost
4) Identification of the effectiveness of the measures
5) Cost benefit analysis
The results of flood risk assessment will influence the quality of countermeasures.
Accurate results lead to detailed and accurate analysis, selection of appropriate
countermeasures, and good justification to explain to decision-makers for budget and
institution.
The framework of risk management to tackle disasters is composed of four methods: 1)
Reduction, 2) Avoidance, 3) Transfer, and 4) Acceptance.17
“Acceptance” is accepting a certain size of disaster and damage, and “Transfer” is
accepting disaster and damage and compensating damage by insurance for recovery. In
both cases, damage will be accepted. Only in the case of avoidance or reduction,
countermeasure should be considered.
“Reduction” refers to mitigation of damage, especially prevention of damage by
structural measures. So-called structural measures should be validated in magnitude of
investment and size of structure, location of measures, and quality of structure. The
feasibility should be justified before starting the project of structures by cost-benefit
analysis. This is pre evaluation of individual public works projects described in section
2.3.3.
Individual public works projects include cost for necessary investigation and data
collection. However, avoidance countermeasures should not be justified to invest in
implementation. Cost for avoidance such as land use regulation, flood forecasting and
warning system should be allocated to societal cost.
In this regard, because measures to be implemented should be different as a society to
protect grows, more accurate and detailed information and data should be collected
depending on developmental level of the society.
In the preliminary level, reviewing past hazards with inundated records can bring
17 N. Maki, 2006.
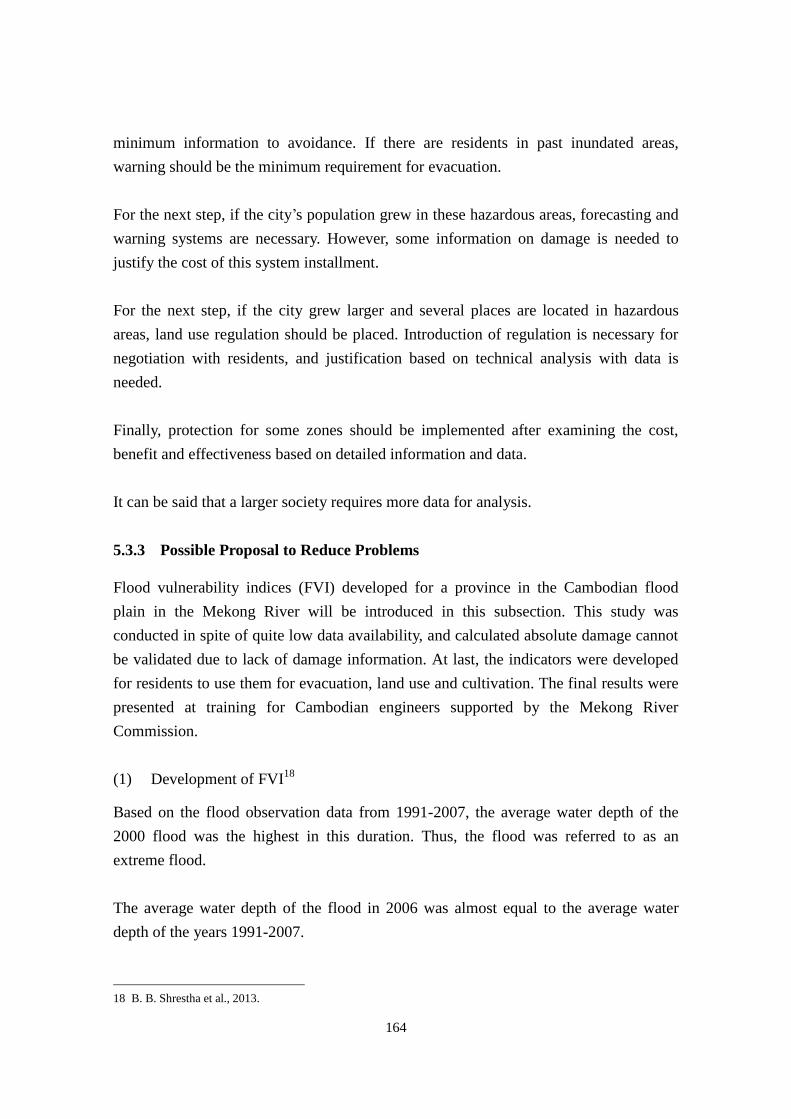
164
minimum information to avoidance. If there are residents in past inundated areas,
warning should be the minimum requirement for evacuation.
For the next step, if the city’s population grew in these hazardous areas, forecasting and
warning systems are necessary. However, some information on damage is needed to
justify the cost of this system installment.
For the next step, if the city grew larger and several places are located in hazardous
areas, land use regulation should be placed. Introduction of regulation is necessary for
negotiation with residents, and justification based on technical analysis with data is
needed.
Finally, protection for some zones should be implemented after examining the cost,
benefit and effectiveness based on detailed information and data.
It can be said that a larger society requires more data for analysis.
5.3.3 Possible Proposal to Reduce Problems
Flood vulnerability indices (FVI) developed for a province in the Cambodian flood
plain in the Mekong River will be introduced in this subsection. This study was
conducted in spite of quite low data availability, and calculated absolute damage cannot
be validated due to lack of damage information. At last, the indicators were developed
for residents to use them for evacuation, land use and cultivation. The final results were
presented at training for Cambodian engineers supported by the Mekong River
Commission.
(1) Development of FVI18
Based on the flood observation data from 1991-2007, the average water depth of the
2000 flood was the highest in this duration. Thus, the flood was referred to as an
extreme flood.
The average water depth of the flood in 2006 was almost equal to the average water
depth of the years 1991-2007.
18 B. B. Shrestha et al., 2013.
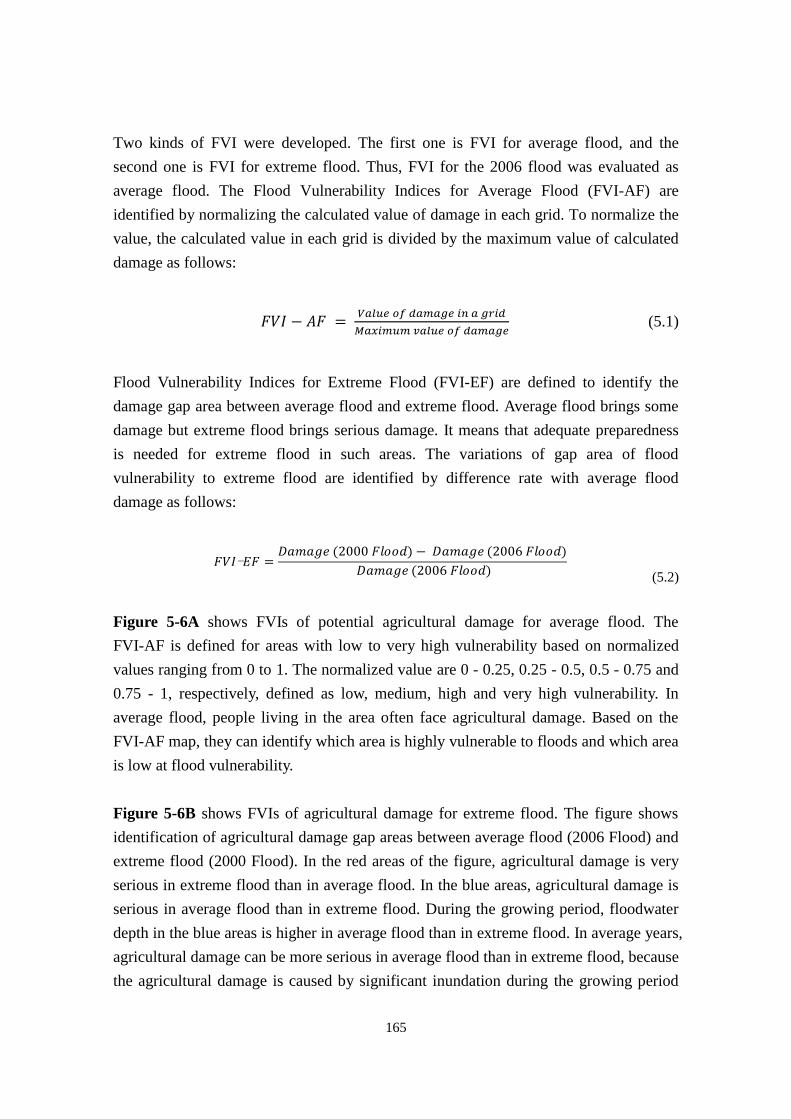
165
Two kinds of FVI were developed. The first one is FVI for average flood, and the
second one is FVI for extreme flood. Thus, FVI for the 2006 flood was evaluated as
average flood. The Flood Vulnerability Indices for Average Flood (FVI-AF) are
identified by normalizing the calculated value of damage in each grid. To normalize the
value, the calculated value in each grid is divided by the maximum value of calculated
damage as follows:
(5.1)
Flood Vulnerability Indices for Extreme Flood (FVI-EF) are defined to identify the
damage gap area between average flood and extreme flood. Average flood brings some
damage but extreme flood brings serious damage. It means that adequate preparedness
is needed for extreme flood in such areas. The variations of gap area of flood
vulnerability to extreme flood are identified by difference rate with average flood
damage as follows:
(5.2)
Figure 5-6A shows FVIs of potential agricultural damage for average flood. The
FVI-AF is defined for areas with low to very high vulnerability based on normalized
values ranging from 0 to 1. The normalized value are 0 - 0.25, 0.25 - 0.5, 0.5 - 0.75 and
0.75 - 1, respectively, defined as low, medium, high and very high vulnerability. In
average flood, people living in the area often face agricultural damage. Based on the
FVI-AF map, they can identify which area is highly vulnerable to floods and which area
is low at flood vulnerability.
Figure 5-6B shows FVIs of agricultural damage for extreme flood. The figure shows
identification of agricultural damage gap areas between average flood (2006 Flood) and
extreme flood (2000 Flood). In the red areas of the figure, agricultural damage is very
serious in extreme flood than in average flood. In the blue areas, agricultural damage is
serious in average flood than in extreme flood. During the growing period, floodwater
depth in the blue areas is higher in average flood than in extreme flood. In average years,
agricultural damage can be more serious in average flood than in extreme flood, because
the agricultural damage is caused by significant inundation during the growing period
=𝐷 𝑚 𝑔 (2000 ) 𝐷 𝑚 𝑔 (2006 )
𝐷 𝑚 𝑔 (2006 )
166
which is determined by accumulated rainfall of that area.
By utilizing FVI-AF, information on vulnerable areas can be easily found, and areas
where preparedness is needed can be easily identified. In average flood, some damage is
experienced in the Cambodian flood plain, but when extreme flood occurs, serious
damage is inflicted to the area. That means that adequate preparedness for extreme flood
is needed in such areas. By utilizing FVI-EF to identify gap area between average flood
damage and extreme flood damage, areas where serious preparedness for extreme flood
is needed can be identified.
FVIs are designed also to estimate agricultural damage. They can identify areas which
are easily affected by floods. The results of FVIs can be used to effectively increase
preparedness for floods in the areas of agriculture, houses and other assets. The
developed FVIs can be useful for local communities, decision makers and developers
when translation tools are well prepared.
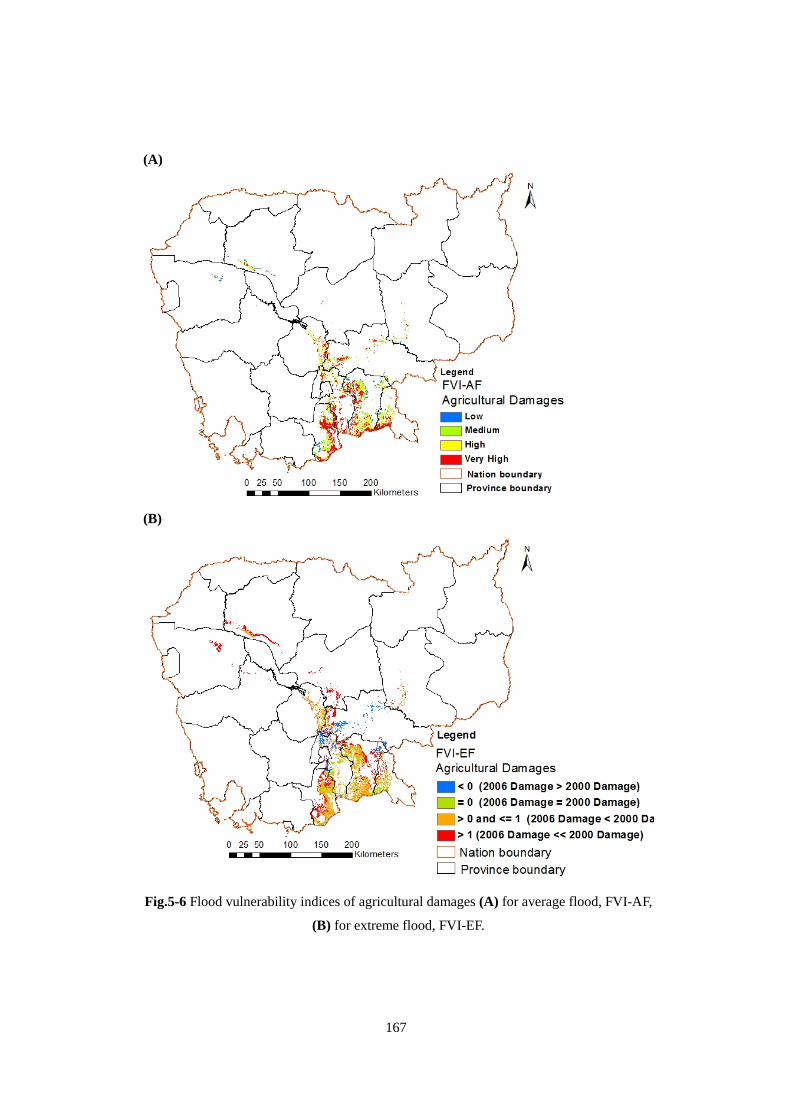
167
(A)
(B)
Fig.5-6 Flood vulnerability indices of agricultural damages (A) for average flood, FVI-AF,
(B) for extreme flood, FVI-EF.
168
5.4 Conclusion
Uncertainty in flood risk assessment shows interesting behaviors. It affects individual
results, is carried over to the next step, and influences the final results. It is also found
that additional information, such as field survey results and satellite information can
reduce uncertainty at each step.
Conventional procedures to review data and check records are the most fundamental
and important actions. In addition, utilizing satellite information and an additional
cross-checking process can be very useful.
The analysis of flood risk assessment showed a holistic mechanism and locations of
potential uncertainty in the process, as well as the possibility of convergence of
uncertainty. It should be good guidance to engineers working on models and technology
to collect better information.
The limitation of uncertainty cannot be defined because it depends on social progress
and the necessity level of flood risk assessment. However, accumulation and archives of
data and information cannot improve immediately. It is urgent for developing countries,
as well as developed countries, to start collecting disaster data. Once data availability
improves, accuracy needed for flood risk assessment can be easily assured with
assistance of technology.
For supporting developing countries, it is important first of all to identify necessary
information for flood risk assessment and to enhance data availability for
cross-checking. Although data and information are often limited in developing countries,
relative risk indicators such as FVI can help overcome poor data and technology to offer
useful advice about land use and evacuation by using average flood damage and
extreme flood damage, and its combination.
169
References
1. A. Yorozuya, H. Kamimera, T. Okazumi, Y. Kwak, “Study about estimation of water surface
elevation on inundated area applying satellite based information”, Journal of River
Engineering, Japan Society of Civil Engineering, vol. 19 : 341-344, June 2013 (in Japanese).
2. T. Okazumi, S. Tanaka, “Applicable methodologies for flood risk assessment in the river
basin in developing countries”, Journal of River Engineering, Japan Society of Civil
Engineering, vol. 19 : 17-20, June 2013 (in Japanese).
3. Kwak, Y. et al., Estimation of flood volume in Chao Phraya river basin, Thailand from
MODIS images coupled with flood Inundation level, IEEE-IGARSS2012 : 887-890, 2012.
4. Shuttle Radar Topography Mission http://www2.jpl.nasa.gov/srtm/
5. A. Yorozuya, et al., Study on PRISM DSM Application to Inundation Analysis and its
Modification Method, Journal of Japan Society of Civil Engineers Ser. B1(Hydraulic
Engineering), Vol.69, No.4, I_1549-I_1554, 2013 (in Japanese).
6. A. Yorozuya, H. Kamimera, T. Okazumi, Y. Iwami, and Y. Kwak, Estimation of water
surface elevation on inundated area using satellite based information. In Piantadosi, J.,
Anderssen, R.S. and Boland J. (eds) MODSIM, 20th International Congress on Modelling and
Simulation. Modelling and Simulation Society of Australia and New Zealand, December
2013 : 2353-2359. ISBN: 978-0-9872143-3-1, 2013.
7. T. Sayama, Y. Tatebe, M. Fujioka, T. Ushiyama, A. Yorozuya, and S. Tanaka, “Rainfall -
runoff inundation forecasting in 2011 Thailand flood”, Journal of Japan Society of Civil
Engineering, 2013 (in Japanese).
8. Takahiro Sayama, Go Ozawa, Takahiro Kawakami, Seishi Nabesaka and Kazuhiko Fukami:
Rainfall-Runoff-Inundation Analysis of Pakistan Flood 2010 at the Kabul River Basin,
Hydrological Science Journal, IAHS, 2011.
9. Japan International Cooperation Agency (JICA), Project for the comprehensive flood
management plan for the Chao Phraya river basin, September 2013.
170
10. T. Okazumi, S. Tanaka, Y. Kwak, B. B. Shrestha, and A. Sugiura A., Flood vulnerability
assessment in the light of rice cultivation characteristics in Mekong River flood plain in
Cambodia, Paddy and Water Environment, ISSN 1611-2490, Paddy Water Environ DOI
10.1007/s10333-013-0403-1, 2013.
11. International Centre for Water Hazard and Risk Management, Public Works Research Institute,
“Supporting Investment for Water Related Disaster Management”, Asia Development Bank
Technical Assistance no. 7276, March 2013.
http://www.adb.org/projects/documents/supporting-investments-water-related-disaster-manag
ement-tacr
12. Kwak. Y., K. Takeuchi, J. Magome and K. Fukami: A new approach to flood risk assessment
in Asia-Pacific region based on MRI-AGCM outputs, Hydrological Research Letters, 2012.
13. Ministry of Education, Culture, Sports, Science and Technology-Japan, “Report in 2011,
projection of the change in future weather extremes using super-high-resolution atmospheric
models, innovative program of climate change projection for the 21st century” : 207-218,
March 2012 (in Japanese).
14. Ministry of Land, Infrastructure, Transport and Tourism, “Manual on flood control and
economic investigation (draft)”, April 2005 (in Japanese).
15. Sugiura A., Tanaka S., Okazumi T., Kwak Y., Hibino S., Shrestha B.B., Calculation of Flood
House Damages in the Mekong River Basin in Cambodia, Proceedings of “International
Perspective on Water Resources and the Environment”, Turkey, 2013.
16. MEXT, “Report in 2013, Precise impact assessments on climate change in the Program for
Risk Information on Climate Change” : 69-71, 2013 (in Japanese).
17. N. Maki, Special topics; “Disaster Countermeasures Using Land Use Regulation – Towards
Safety and Security National Land-“, Journal of Natural Disaster Science, J. JSNDS 25-2
135-154, 2006 (in Japanese).
18. B. B. Shrestha, T. Okazumi, S. Tanaka, A. Sugiura, Y. Kwak, S. Hibino, Development of
flood vulnerability indices for lower Mekong basin in Cambodian floodplain, Journal of Japan
Society of Civil Engineers, Ser. B1 (Hydraulic Engineering), Vol.69, No.4, I_1-I_6, 2013
171
Chapter 6
Overall Conclusions and the Way Forward
6.1 Conclusions and Remaining Problems
The objective of this thesis is to give guidance for good understanding of present
problems and necessary actions to be taken in the future in order to encourage and
improve technology of flood risk assessment towards disaster risk reduction in the
world. For this purpose, the author decided that the target should be developing
countries for better understanding the present situations in the world, because
identification of problems in developing countries will provide useful information that
will contribute to this objective.
The framework of this thesis was introduced in chapter 1 as follows:
Chapter 1 introduced the definition and background of mainstreaming of disaster
risk reduction.
Chapter 2 introduced the present status of flood risk assessment in Japan and
developing countries.
Chapter 3 showed poor practices in which pre-disaster assessment was not well
implemented due to the lack of understanding of its importance.
Chapter 4 introduced the results of a case study in a developing county for
identification of problems and influential factors in flood risk assessment.
Chapter 5 introduced possible new technologies to reduce uncertainty and proposed
approaches to tackle flood risk uncertainty.
The details of the findings in each chapter are described in the following:
In Chapter 2, flood risk assessment was introduced with its all steps, technologies and
methodologies. Flood risk assessments in Japan and developing countries were
introduced. If flood risk assessment is required for decision making under poor data and
information circumstances, a simplified method based on careful field survey should be
implemented to overcome lack of data. Comparison studies on flood risk assessment
between cases in Japan and developing countries were conducted for the basic
understanding of the present situation of flood risk assessment. Through this chapter,
discussion was made about the importance of flood risk assessment as pre-disaster
activities to identify necessary action for flood risk reduction and present problems on
172
flood risk assessment, which mainly concerns uncertainty.
In Chapter 3, two cases were introduced as poor practices. The first case is the Chao
Phraya river flood, and the second one is the Great East Japan Earthquake and Tsunami.
Both occurred in 2011 and caused serious damage to the areas. These two examples can
clearly explain the effectiveness of appropriate risk assessment in advance and the
importance of sharing information with residents and preparing prevention measures
based on risk assessment. In the two cases, the main problem is poor coordination with
development and risk assessment. In the Chao Phraya river flood case, land
development was conducted and expanded to build more industrial parks with several
economic incentives without sufficient risk assessment and information on flood risk.
Then finally factories in these areas were seriously damaged by the 2011 flood. The
Rikuzentakata city case showed that urban development was expanded up to the coastal
area which experienced tsunami before without paying little attention to inadequate
warning systems.
In Chapter 4, a study was implemented for estimation of uncertainty during flood risk
assessment in the case of the Pampanga River basin. Through the uncertainty estimation
in the risk assessment of a 10-year return period flood, the calculated uncertainty was
large in every flood risk assessment step, and the uncertainty at the damage calculation
step can be considered as the major influential factor over the final result of the risk
assessment. The study strongly suggests that this is mainly due to lack of damage
information. In addition, this is probably characteristics of developing countries because
a past study in Germany showed damage estimation was not the most influential factor
to the total uncertainty. The following three points were found from this case study of
uncertainty estimation: 1) Uncertainty can greatly influence the quality and availability
of data and information; 2) Data unavailability in some developing countries is a serious
problem. Especially, collection of damage loss data is an urgent matter; and 3)
Uncertainty is also linked to model calculation. Scientists and engineers should have
adequate understanding of objectives and expected results during the process of risk
assessment. At the end, investigation was conducted where uncertainty is and how much
influence they are. And discussion on another potential location of uncertainty also
introduced. Such study on uncertainty of flood risk assessment procedure as holistic
mechanism in poor data situation in developing country must be unique and challenging.
No similar study was conducted in the past.
173
In Chapter 5, uncertainty in flood risk assessment shows quite interesting behaviors. It
affects individual results at each step is carried over to the next step, and influences the
final results. Analysis of flood risk assessment showed holistic mechanism and
locations of potential uncertainties in each process, and possibility of convergence. It
gave good guidance to developer who works for technology to observe better
information and useful model. Conventional procedures to review data and check
records are most fundamental and important actions. In addition, utilizing satellite
information and an additional cross-checking process can be useful. At present,
however, limitation of uncertainty cannot be defined, and the accumulation and archives
of data and information cannot improve immediately. It is urgent for developing
countries, as well as developed countries, to start collecting disaster data. Then,
accuracy needed for flood risk assessment can be easily assured with assistance of
technology.
This study provides interesting results for understanding uncertainty in flood risk
assessment. Especially, the study results are different compared with past study results.
However, the following items still remain for further research.
1) Identification on detailed causes of uncertainty at each step of flood risk assessment,
and its range /band of uncertainty.
2) Effectiveness of uncertainty reduction by advanced technology and development of
further technology.
3) Development of method on effective data collection and damage formula
The abovementioned development can enhance effective data collection and analysis,
and improve the entire flood risk assessment methodology. Furthermore, a lot of
problems still remain unsolved for ideal water-related risk management, which will be
presented in the following subsection.
6.2 Proposal for Next and Future Challenges
In this thesis, uncertainty was highlighted as one of the problems during flood risk
assessment. However, there are many remaining problems aside from flood risk. Studies
which should be implemented in the near future are introduced in the following. They
should be rigorously promoted for future progress in this field.
174
(1) Further implementation of research on uncertainty during flood risk assessment is
important for enhancing pre-disaster measures. Especially, uncertainty estimation
of flood risk assessment under poor data and information circumstances in
developing countries should be an urgent research topic. It is important to add more
case studies in this field.
(2) Drought is sometimes a more serious problem than flood in the world. Under
climate change conditions, high drought risk areas will spread in the world. There
are a lot of past studies on hydrological drought in future climate change conditions,
but not many on socio-economic drought risk. International Centre for Water
Hazard and Risk Management (ICHARM) has been tackling this problem recently,
and more research should be encouraged to develop a socio-economic drought risk
assessment methodology.1
(3) The development of global flood and drought risk indices is another research area
that should be promoted. If simple flood and drought risk indices are successfully
developed, investment in this filed will be encouraged. Combination of these
indices and a basin level methodology such as (1) and (2) can expand regional
activities.2。
(4) The major purpose of flood risk assessment is to apply its results to cost-benefit
analysis as explained in chapter 2. Quantifying structural measures can be possible,
but quantifying non-structural measures is difficult. That is why it is difficult to
explain what non-structural measures should be implemented to what extent. For
encouraging non-structural measures, quantifying them is important for justification.
Recently, social capital is recognized as a key indicator for preparedness of
non-structural measures. ICHARM is now tackling measuring this societal capital
by conducting questionnaire surveys for community leaders to develop Flood
Disaster Preparedness Indices3, which should be formulated for practical use.
Especially, there is some limitation to tackle structural measures alone in
developing countries. Such activities to encourage non-structural measures should
also be implemented.
1 MEXT, April 2013.
2 ICHARM, 2013.
3 T. Nakasu, et al., 2012.

175
(5) It is important to expand research to cover a wide range of water-related disasters
besides floods including droughts, storm surges, and tsunamis. The development of
risk assessment for these hazards should also be discussed.
The author hopes that this study can encourage further research on uncertainty in flood
risk assessment, development of effective technology and countermeasures,
enhancement of pre-disaster measures, and finally reduction of damage of natural
hazards.
176
References
1. MEXT, “Report in 2013, Precise impact assessments on climate change in the Program for Risk
Information on Climate Change” : 69-71, 2013 (in Japanese).
2. International Centre for Water Hazard and Risk Management, Public Works Research Institute,
“Supporting Investment for Water Related Disaster Management”, Asia Development Bank
Technical Assistance no. 7276, March 2013.
http://www.adb.org/projects/documents/supporting-investments-water-related-disaster-manage
ment-tacr
3. T. Nakasu, T. Okazumi, and Y. Shimizu, Development of local disaster preparedness indices for
flood in Thailand – Case study in Ubon Ratchathani and Hat Yai, Journal of Thai Studies, The
Japanese Society for Thai Studies, No. 12 : 65-81, 2012 (in Japanese).


![Revision Topic 1 [141 marks] · A student measures the radius r of a sphere with an absolute uncertainty Δr. What is the fractional uncertainty in the volume of the ... The measurement](https://img.pdfslide.tips/doc/110x75/5f7f86dc593be323a81e6f92/revision-topic-1-141-marks-a-student-measures-the-radius-r-of-a-sphere-with-an.jpg)