Embed Size (px)
Citation preview

Unit 6: Simple Linear RegressionLecture 2: Outliers and inference
Statistics 101
Thomas Leininger
June 18, 2013

Types of outliers in linear regression
Types of outliers
How do(es) the outlier(s) in-fluence the least squaresline?
To answer this questionthink of where theregression line would bewith and without theoutlier(s).
●
●
●
●
●
●
●
●
●
●
●
●
●
●
●
●●
●
●
●
●
●
●
●
●
●
●
●
●
●●
●
●
●
●
●
●●
●
●
●
●
●
●
●
●
●
●●
●
●
●
●
●
●
●
●
●
●
−20
−10
0
●
●
● ●●
●
●
●
●
●
●●
●●●
●
●
●●
●
●● ●●
●
●●
●
●
●●
●
●
●●
●●
●
●
●
●
●●
●
●
●
●●●
●●
●
●
●
●
●
●●
●
−5
0
5
Statistics 101 (Thomas Leininger) U6 - L2: Outliers and inference June 18, 2013 2 / 26

Types of outliers in linear regression
Types of outliers
How do(es) the outlier(s) in-fluence the least squaresline? ●
●
● ● ●●
●
●
●
●
●
●
●●●●
●●
●●
●●
●
●
●●
●
●
●
●
●
●●
●
●
●
●
●
●
●
●
●
●
●
●
●
●
●●
●
●
●
●●●
●●
●●
● ●
●
●
●
●
●
●
●
●●
●
0
5
10
●
●
●●
●
●
●
●
●
●
●
●
●●●●
●
●●●
●
●
●
●
●●
●
●
●
●●
●
●●
●
●
●
●
●●
●
●
●
●
●
●
●●●
●
●
●
●●●
●●
●●
●
●
●
●
●
● ●
●●
●
●
●
−2
0
2
Statistics 101 (Thomas Leininger) U6 - L2: Outliers and inference June 18, 2013 3 / 26
Types of outliers in linear regression
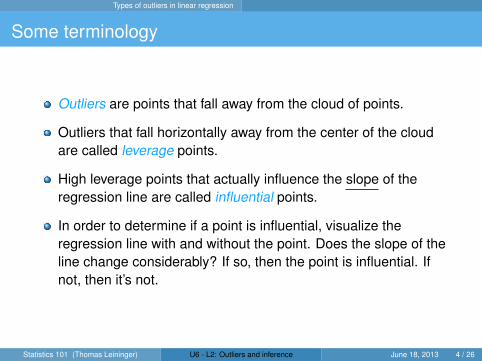
Some terminology
Outliers are points that fall away from the cloud of points.
Outliers that fall horizontally away from the center of the cloudare called leverage points.
High leverage points that actually influence the slope of theregression line are called influential points.
In order to determine if a point is influential, visualize theregression line with and without the point. Does the slope of theline change considerably? If so, then the point is influential. Ifnot, then it’s not.
Statistics 101 (Thomas Leininger) U6 - L2: Outliers and inference June 18, 2013 4 / 26

Types of outliers in linear regression
Influential points
Data are available on the log of the surface temperature and the logof the light intensity of 47 stars in the star cluster CYG OB1.
●
●
●
●
●
●
●
●
●
●
●
● ●
●
●
●
●
●●
●
●
●
●
●
●
●●
●
●
●
●
●
●
●
●
●
●
● ●
●
●
●
●●
●
●
●
3.6 3.8 4.0 4.2 4.4 4.6
4.0
4.5
5.0
5.5
6.0
log(temp)
log(
light
inte
nsity
)
w/ outliersw/o outliers
Statistics 101 (Thomas Leininger) U6 - L2: Outliers and inference June 18, 2013 5 / 26

Types of outliers in linear regression
Types of outliers
Question
Which of the below best de-scribes the outlier?
(a) influential
(b) leverage
(c) none of the above
(d) there are no outliers
●
●
●●
●
●
●
●
●
●
●
●
●●
●
●
●
●
●●
●
●
●●
●
●
●
●
●
●
●
●
●
●
●
●
●
●
●
●
●
●
●
● ●
●
●
●
●
●
●
●
●
●
●
●
●
●
●●
●
●
●
●
●
●
●
●●
●
●
●
●
●
●
●
●
●
●
● ●
●
●
●
●
●
● ●
●
●
●
●
●
●
●
●
●
●●
●●
●
●
●
●●
●
●
●
●
●
●●
● ●
●
●
●
●
●
●
●
●
●
●
●●
●
●
●
●
●
●
●
●
●
●
●
●
●
●
●
●
●
●
●
●
●
●
●
●−20
0
20
40
●
●
●
●
●
●
● ●
●
● ●
●●●
●
●
●●●
●
● ●
●
●
●
●
●
●●
●
●
●
● ●
●●
●
●
●
●
●
● ●
●
●●
●
● ●
●
●
●
●●
●●
●●
●
●
●
●
●
●
●●
●
●
●●
●
●
●
●
●
●
●
●
●
●
●
●
●●
●●
●
●
●●
●
●
●●
●●
●
● ●
●●●
●
●●
●
●
●●
●
●
●
●
●
●
●●
●
●
●
●
●●
●
● ●
●●
●
●●
● ●
●
●●
●
●●
●
●
●
●
●
●
●●●
●
●●
−2
0
2
Statistics 101 (Thomas Leininger) U6 - L2: Outliers and inference June 18, 2013 6 / 26
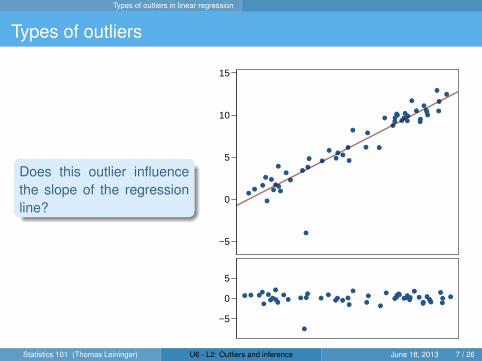
Types of outliers in linear regression
Types of outliers
Does this outlier influencethe slope of the regressionline?
●
●
●
●
●
●
●
●
●
●
●
● ●
●
●
●
●
●
●
●●
●●
●
●
●
●
●
●
●
●
●
●
●
●
● ●
●
●
●
●
●
●
●● ●
●
●
●
●
●
−5
0
5
10
15
● ●●● ●●
●●
●
●●●
● ●●
●●●
●●●
●
●●
●●
● ●●
●●
● ●●●
●●● ●
●
●
●
●
●●●●
●
●
●
●
−5
0
5
Statistics 101 (Thomas Leininger) U6 - L2: Outliers and inference June 18, 2013 7 / 26
Types of outliers in linear regression
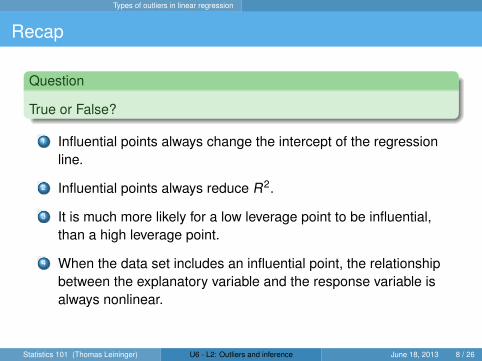
Recap
Question
True or False?
1 Influential points always change the intercept of the regressionline.
2 Influential points always reduce R2.
3 It is much more likely for a low leverage point to be influential,than a high leverage point.
4 When the data set includes an influential point, the relationshipbetween the explanatory variable and the response variable isalways nonlinear.
Statistics 101 (Thomas Leininger) U6 - L2: Outliers and inference June 18, 2013 8 / 26

Types of outliers in linear regression
Recap (cont.)
R = 0.08,R2 = 0.0064
●
●
●
●
●
●●●
●
●●
●
●
●●
●
●
●●
●●
●
●
●●
●
●
●●
●
●
●
●
●
●
●
●
●
●
●●
●
●
●
● ●●
●
●
●
●●
●
●
●
●
●
●
●
●● ●
●●
● ●
●
● ●
●
−2
0
2
4
6
8
10
●
●
●
●
●
●
●●
●
●●
●
●
● ●●
●
● ●●●
●
●
● ●
●
●
●
●
●
●
●
●
●
●
●
●
●
●
●●
●
●
●
● ●●
●
●
●
●●
●
●
●
●
●
●
●
●● ●
●●
● ●
●
● ●
●
−2
0
2
R = 0.79,R2 = 0.6241
●
●
● ● ●●
●
●
●
●
●
●
●●●●
●●
●●
●●
●
●
●●
●
●
●
●
●
●●
●
●
●
●
●
●
●
●
●
●
●
●
●
●
●●
●
●
●
●●●
●●
●●
● ●
●
●
●
●
●
●
●
●●
●
0
5
10
●
●
●●
●
●
●
●
●
●
●
●
●●●●
●
●●●
●
●
●
●
●●
●
●
●
●●
●
●●
●
●
●
●
●●
●
●
●
●
●
●
●●●
●
●
●
●●●
●●
●●
●
●
●
●
●
● ●
●●
●
●
●
−2
0
2
Statistics 101 (Thomas Leininger) U6 - L2: Outliers and inference June 18, 2013 9 / 26
Inference for linear regression Understanding regression output from software
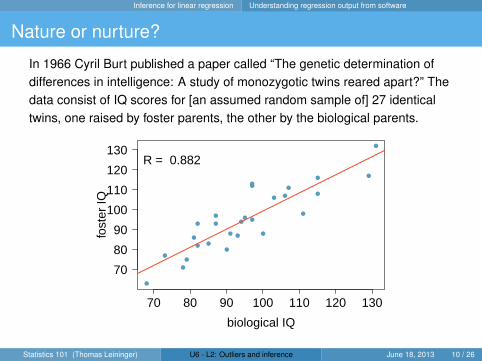
Nature or nurture?
In 1966 Cyril Burt published a paper called “The genetic determination ofdifferences in intelligence: A study of monozygotic twins reared apart?” Thedata consist of IQ scores for [an assumed random sample of] 27 identicaltwins, one raised by foster parents, the other by the biological parents.
●●
●
●
● ●
●
●
●
●●
●
●
●
●
●
●
●
●
●
●●
●●
● ●
●
70 80 90 100 110 120 130
70
80
90
100
110
120
130
biological IQ
fost
er IQ
R = 0.882
Statistics 101 (Thomas Leininger) U6 - L2: Outliers and inference June 18, 2013 10 / 26
Inference for linear regression Understanding regression output from software
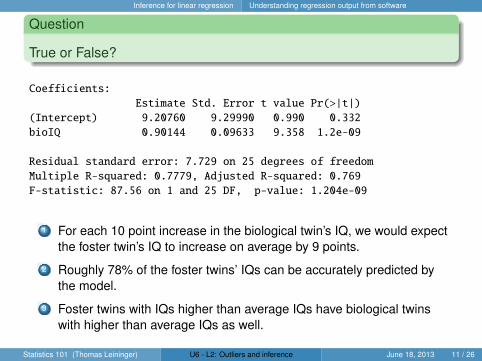
Question
True or False?
Coefficients:
Estimate Std. Error t value Pr(>|t|)
(Intercept) 9.20760 9.29990 0.990 0.332
bioIQ 0.90144 0.09633 9.358 1.2e-09
Residual standard error: 7.729 on 25 degrees of freedom
Multiple R-squared: 0.7779, Adjusted R-squared: 0.769
F-statistic: 87.56 on 1 and 25 DF, p-value: 1.204e-09
1 For each 10 point increase in the biological twin’s IQ, we would expectthe foster twin’s IQ to increase on average by 9 points.
2 Roughly 78% of the foster twins’ IQs can be accurately predicted bythe model.
3 Foster twins with IQs higher than average IQs have biological twinswith higher than average IQs as well.
Statistics 101 (Thomas Leininger) U6 - L2: Outliers and inference June 18, 2013 11 / 26
Inference for linear regression HT for the slope
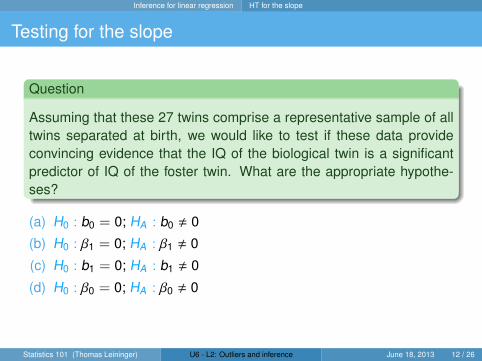
Testing for the slope
Question
Assuming that these 27 twins comprise a representative sample of alltwins separated at birth, we would like to test if these data provideconvincing evidence that the IQ of the biological twin is a significantpredictor of IQ of the foster twin. What are the appropriate hypothe-ses?
(a) H0 : b0 = 0; HA : b0 , 0
(b) H0 : β1 = 0; HA : β1 , 0
(c) H0 : b1 = 0; HA : b1 , 0
(d) H0 : β0 = 0; HA : β0 , 0
Statistics 101 (Thomas Leininger) U6 - L2: Outliers and inference June 18, 2013 12 / 26
Inference for linear regression HT for the slope
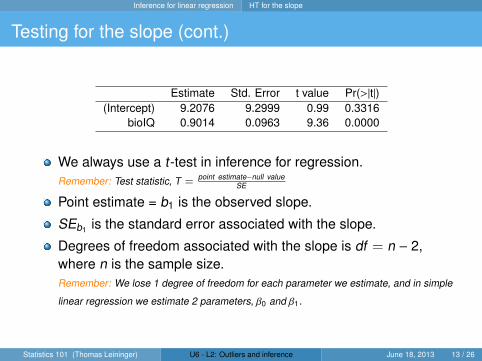
Testing for the slope (cont.)
Estimate Std. Error t value Pr(>|t|)(Intercept) 9.2076 9.2999 0.99 0.3316
bioIQ 0.9014 0.0963 9.36 0.0000
We always use a t-test in inference for regression.Remember: Test statistic, T = point estimate−null value
SE
Point estimate = b1 is the observed slope.
SEb1 is the standard error associated with the slope.
Degrees of freedom associated with the slope is df = n − 2,where n is the sample size.Remember: We lose 1 degree of freedom for each parameter we estimate, and in simple
linear regression we estimate 2 parameters, β0 and β1.
Statistics 101 (Thomas Leininger) U6 - L2: Outliers and inference June 18, 2013 13 / 26

Inference for linear regression HT for the slope
Testing for the slope (cont.)
Estimate Std. Error t value Pr(>|t|)(Intercept) 9.2076 9.2999 0.99 0.3316
bioIQ 0.9014 0.0963 9.36 0.0000
T =
df =
p − value =
Statistics 101 (Thomas Leininger) U6 - L2: Outliers and inference June 18, 2013 14 / 26

Inference for linear regression HT for the slope
% College graduate vs. % Hispanic in LA
What can you say about the relationship between of % college gradu-ate and % Hispanic in a sample of 100 zip code areas in LA?
Education: College graduate
0.0
0.2
0.4
0.6
0.8
1.0
No dataFreeways
Race/Ethnicity: Hispanic
0.0
0.2
0.4
0.6
0.8
1.0
No dataFreeways
Statistics 101 (Thomas Leininger) U6 - L2: Outliers and inference June 18, 2013 15 / 26
Inference for linear regression HT for the slope
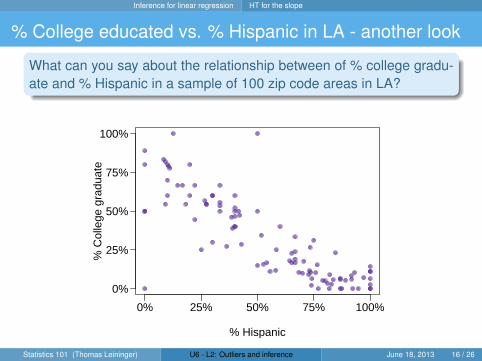
% College educated vs. % Hispanic in LA - another look
What can you say about the relationship between of % college gradu-ate and % Hispanic in a sample of 100 zip code areas in LA?
% Hispanic
% C
olle
ge g
radu
ate
0% 25% 50% 75% 100%
0%
25%
50%
75%
100%
Statistics 101 (Thomas Leininger) U6 - L2: Outliers and inference June 18, 2013 16 / 26
Inference for linear regression HT for the slope
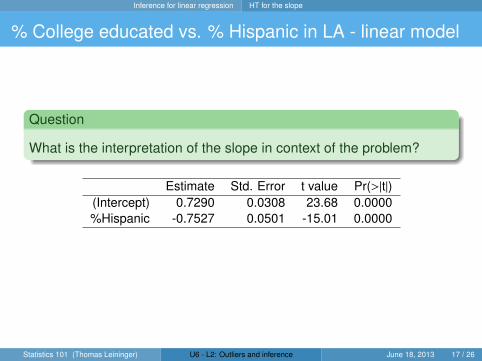
% College educated vs. % Hispanic in LA - linear model
Question
What is the interpretation of the slope in context of the problem?
Estimate Std. Error t value Pr(>|t|)(Intercept) 0.7290 0.0308 23.68 0.0000%Hispanic -0.7527 0.0501 -15.01 0.0000
Statistics 101 (Thomas Leininger) U6 - L2: Outliers and inference June 18, 2013 17 / 26

Inference for linear regression HT for the slope
% College educated vs. % Hispanic in LA - linear model
Do these data provide convincing evidence that there is a statisticallysignificant relationship between % Hispanic and % college graduatesin zip code areas in LA?
Estimate Std. Error t value Pr(>|t|)(Intercept) 0.7290 0.0308 23.68 0.0000
hispanic -0.7527 0.0501 -15.01 0.0000
How reliable is this p-value if these zip code areas are not randomlyselected?
Statistics 101 (Thomas Leininger) U6 - L2: Outliers and inference June 18, 2013 18 / 26

Inference for linear regression CI for the slope
Confidence interval for the slope
Question
Remember that a confidence interval is calculated as point estimate±ME andthe degrees of freedom associated with the slope in a simple linear regressionis n−2. Which of the below is the correct 95% confidence interval for the slopeparameter? Note that the model is based on observations from 27 twins.
Estimate Std. Error t value Pr(>|t|)(Intercept) 9.2076 9.2999 0.99 0.3316
bioIQ 0.9014 0.0963 9.36 0.0000
(a) 9.2076 ± 1.65 × 9.2999
(b) 0.9014 ± 2.06 × 0.0963
(c) 0.9014 ± 1.96 × 0.0963
(d) 9.2076 ± 1.96 × 0.0963
Statistics 101 (Thomas Leininger) U6 - L2: Outliers and inference June 18, 2013 19 / 26

Inference for linear regression CI for the slope
Recap
Inference for the slope for a SLR model (only one explanatoryvariable):
Hypothesis test:
T =b1 − null value
SEb1
df = n − 2
Confidence interval:b1 ± t?df=n−2SEb1
The null value is often 0 since we are usually checking for anyrelationship between the explanatory and the response variable.
The regression output gives b1, SEb1 , and two-tailed p-value forthe t-test for the slope where the null value is 0.
We rarely do inference on the intercept, so we’ll be focusing onthe estimates and inference for the slope.
Statistics 101 (Thomas Leininger) U6 - L2: Outliers and inference June 18, 2013 20 / 26
Inference for linear regression CI for the slope
Caution
Always be aware of the type of data you’re working with: randomsample, non-random sample, or population.
Statistical inference, and the resulting p-values, are meaninglesswhen you already have population data.
If you have a sample that is non-random (biased), the results willbe unreliable.
The ultimate goal is to have independent observations – and youknow how to check for those by now.
Statistics 101 (Thomas Leininger) U6 - L2: Outliers and inference June 18, 2013 21 / 26
Inference for linear regression An alternative statistic
Variability partitioning
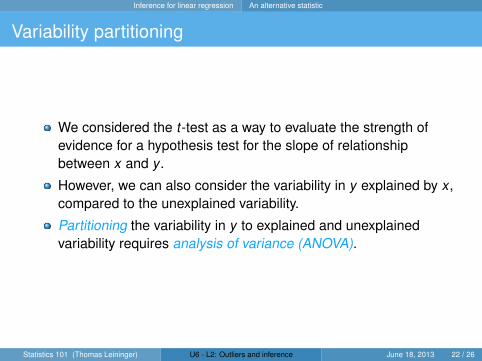
We considered the t-test as a way to evaluate the strength ofevidence for a hypothesis test for the slope of relationshipbetween x and y.
However, we can also consider the variability in y explained by x,compared to the unexplained variability.
Partitioning the variability in y to explained and unexplainedvariability requires analysis of variance (ANOVA).
Statistics 101 (Thomas Leininger) U6 - L2: Outliers and inference June 18, 2013 22 / 26
Inference for linear regression An alternative statistic
ANOVA output - Sum of squares
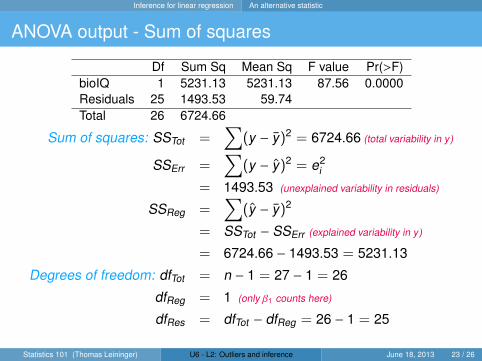
Df Sum Sq Mean Sq F value Pr(>F)bioIQ 1 5231.13 5231.13 87.56 0.0000Residuals 25 1493.53 59.74Total 26 6724.66
Sum of squares: SSTot =∑
(y − y)2 = 6724.66 (total variability in y)
SSErr =∑
(y − y)2 = e2i
= 1493.53 (unexplained variability in residuals)
SSReg =∑
(y − y)2
= SSTot − SSErr (explained variability in y)
= 6724.66 − 1493.53 = 5231.13
Degrees of freedom: dfTot = n − 1 = 27 − 1 = 26
dfReg = 1 (only β1 counts here)
dfRes = dfTot − dfReg = 26 − 1 = 25
Statistics 101 (Thomas Leininger) U6 - L2: Outliers and inference June 18, 2013 23 / 26

Inference for linear regression An alternative statistic
ANOVA output - F-test
Df Sum Sq Mean Sq F value Pr(>F)bioIQ 1 5231.13 5231.13 87.56 0.0000Residuals 25 1493.53 59.74Total 26 6724.66
Mean squares: MSReg =SSReg
dfReg=
5231.131
= 5231.13
MSErr =SSErr
dfErr=
1493.5325
= 59.74
F-statistic: F(1,25) =MSReg
MSErr= 87.56 (ratio of explained to unexplained variability)
The null hypothesis is β1 = 0 and the alternative is β1 , 0. With alarge F-statistic, and a small p-value, we
Statistics 101 (Thomas Leininger) U6 - L2: Outliers and inference June 18, 2013 24 / 26

Inference for linear regression An alternative statistic
Revisit R2
Remember, R2 is the proportion of variability in y explained bythe model:
A large R2 suggests a linear relationship between x and y exists.
There are actually two ways to calculate R2:(1) From the definition: proportion of explained to total variability(2) Using correlation: square of the correlation coefficient
Statistics 101 (Thomas Leininger) U6 - L2: Outliers and inference June 18, 2013 25 / 26
Inference for linear regression An alternative statistic
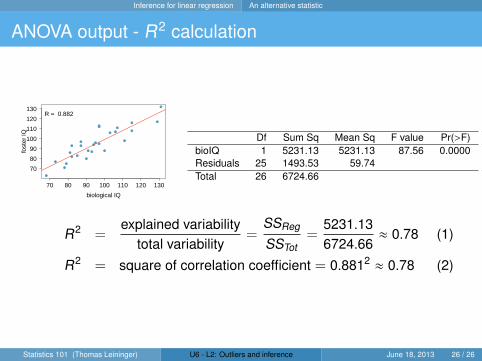
ANOVA output - R2 calculation
●●
●
●
● ●
●
●
●
●●
●
●
●
●
●
●
●
●
●
●●
●●
● ●
●
70 80 90 100 110 120 130
70
80
90
100
110
120
130
biological IQ
fost
er IQ
R = 0.882
Df Sum Sq Mean Sq F value Pr(>F)bioIQ 1 5231.13 5231.13 87.56 0.0000Residuals 25 1493.53 59.74Total 26 6724.66
R2 =explained variability
total variability=
SSReg
SSTot=
5231.136724.66
≈ 0.78 (1)
R2 = square of correlation coefficient = 0.8812 ≈ 0.78 (2)
Statistics 101 (Thomas Leininger) U6 - L2: Outliers and inference June 18, 2013 26 / 26