Embed Size (px)
Citation preview
UNIVERSIDAD COMPLUTENSE DE MADRID FACULTAD DE VETERINARÍA
TESIS DOCTORAL
Estudio del efecto del procesado e ingredientes funcionales en la textura de purés de patata frescos y congelados
MEMORIA PARA OPTAR AL GRADO DE DOCTORA
PRESENTADA POR
María José Jiménez Sánchez
Directores
María Dolores Álvarez Torres Wenceslao Canet Parreño
Madrid, 2015 ©María José Jiménez Sánchez, 2015
UNIVERSIDAD COMPLUTENSE DE MADRID
Facultad de Veterinaria
y
CONSEJO SUPERIOR DE INVESTIGACIONES CIENTÍFICAS
Instituto de Ciencia y Tecnología de Alimentos y Nutrición (ICTAN-CSIC)
Estudio del efecto del procesado e ingredientes
funcionales en la textura de purés de patata
frescos y congelados
Tesis Doctoral presentada por
MARÍA JOSÉ JIMÉNEZ SÁNCHEZ
Realizada bajo la dirección de los doctores
MARÍA DOLORES ÁLVAREZ TORRES
WENCESLAO CANET PARREÑO
Universidad Complutense de Madrid Consejo Superior de
Facultad de Veterinaria Investigaciones Científicas

DOÑA MARÍA DOLORES ÁLVAREZ TORRES, DRA. INGENIERA
AGRÓNOMA Y CIENTÍFICA TITULAR DEL CONSEJO SUPERIOR DE
INVESTIGACIONES CIENTÍFICAS (CSIC) Y DON WENCESLAO CANET
PARREÑO, DR. INGENIERO AGRÓNOMO Y PROFESOR DE
INVESTIGACIÓN DEL CONSEJO SUPERIOR DE INVESTIGACIONES
CIENTÍFICAS (CSIC),
CERTIFICAN:
Que la memoria titulada “Estudio del efecto del procesado e ingredientes
funcionales en la textura de purés de patata frescos y congelados” presentada por
la Licenciada en Biología María José Jiménez Sánchez para optar al grado de
Doctora, ha sido desarrollada bajo su dirección con total dedicación y rigor
científico en el Instituto de Ciencia y Tecnología de Alimentos y Nutrición del
Consejo Superior de Investigaciones Científicas (ICTAN-CSIC) y, considerando que
de acuerdo a la legislación vigente cumple con todas las exigencias académicas para
su presentación, lectura y defensa como trabajo de Tesis Doctoral, autorizan su
presentación para que sea juzgada por el tribunal correspondiente.
Y para que así conste a los efectos oportunos, firman el presente certificado en
Madrid, a de 25 de febrero de 2015.
Dra. María Dolores Álvarez Torres Prof. Dr. Wenceslao Canet Parreño

“Me enseñaron que el camino del progreso no es rápido ni fácil”
Marie Salomea Curie (1867-1934)
Premio Nobel de Física, 1903.
Premio Nobel de Química, 1911.
“Nunca consideres el estudio como una obligación, sino como una
oportunidad para penetrar en el bello y maravilloso mundo del saber”
Albert Einstein (1879-1955)
Premio Nobel de Química, 1921.
“La ciencia siempre vale la pena porque sus descubrimientos, tarde o
temprano, siempre se aplican”
Severo Ochoa (1905-1993)
Premio Nobel de Medicina, 1959.

A mis padres,
a mi hermano y a Raúl,
el hombre de mi vida.

Agradecimientos

AGRADECIMIENTOS
Ha sido un largo camino, no sin obstáculos, el recorrido para la finalización de esta tesis.
Por ese motivo, quiero dar las gracias a todas y cada una de aquellas personas que han hecho
posible que ese día haya llegado hoy.
En primer lugar, quiero agradecer de manera especial y sincera a mis directores de tesis,
la Doctora María Dolores Álvarez Torres y al Doctor Wenceslao Canet Parreño, su esfuerzo,
apoyo, dedicación, comprensión, ánimo y paciencia. Me hicisteis sentir parte de vuestra “familia
científica” desde el primer día que la Doctora Pilar Montero me puso en vuestro camino. Gracias
también a ella porque no pudo haber elegido manos más sabias en las que poner mi futuro.
Wenceslao, gracias por compartir conmigo tus formidables estudios y diseños científicos sobre
reología y textura, pero sobre todo gracias por buscar mi bienestar laboral y personal, espero
que algún día podamos formar ese grupo de reología, textura y análisis sensorial en el ICTAN. A
ti Mayoyes, miles de gracias por estar siempre dispuesta para ayudarme, por comprender y
apoyar mi situación especial para realizar esta tesis, por ser ante todo persona y no jefa, por tu
amistad y por aportar una de las cosas más importantes de este trabajo: siempre una sonrisa
repleta de conocimientos y buenos consejos. Wenceslao y Mayoyes: “gracias y felicidades
porque este trabajo también es vuestro éxito”.
Gracias al comité técnico de análisis sensorial de AENOR del que formo parte, por abrir
ante mis ojos el extenso mundo del análisis sensorial y porque he encontrado profesionales y
compañeros magnificos en él.
Gracias Bea porque, sin conocerme, me brindaste tu apoyo y ayuda desde el primer
momento.
Gracias a mis compañeros y amigos de despacho, Pilar, Raúl y Nacho por hacer cada día
de trabajo más divertido y agradable que el anterior, no imagino un despacho mejor en el que
estar, sois unas personas magníficas.
AGRADECIMIENTOS
A mis compis del desayuno, Inma, Gonzalo y Esteban, por esas mañanas arreglando el
mundo entre risas.
Gracias a mi familia de Córdoba, con los que comencé en este mundo de la Facultad y
especialmente a Pilar, Carmen, María José y Ana Belén, gracias por escuchar mis risas y mis
llantos, nunca olvidaré aquellos días.
A mi familia política, Manoli y Paco, porque gracias a nuestras animadas charlas sobre
alimentación y ecología se ha despertado en mí un gran interés por el mundo científico de las
legumbres.
Y como no, gracias a mi gente, la que siempre está ahí. Gracias a mi hermano, por darme
siempre el privilegio de ser tu confidente a pesar de la diferencia de edad, y porque cada vez
más tú eres también el mío. Te has ganado un lugar privilegiado en mi vida y sé que algún día
alcanzaras tus sueños, mientras tanto yo estaré aquí para ayudarte siempre.
Gracias a mis padres por lo más importante que he aprendido, cariño, amor y respeto. A ti
mamá, gracias porque siempre comprendiste que tenía que estudiar, por dejarme ir a Córdoba y
luego a Madrid a pesar de tus lágrimas, espero que ahora se vean recompensadas. Papá
gracias por desear para mí lo que tú no pudiste tener y por invertir tus olivos de San Benito en mi
primer ordenador, él estará orgulloso no sólo de mi sino también de ti.
Raúl, gracias porque sé que siempre vas cogiéndome la mano y apretándomela fuerte
para que sepa que estás cada segundo conmigo, no puede haber mayor riqueza en el mundo
que compartir la vida contigo.
Gracias a todos,
María José.
Índice de contenidos

ÍNDICE DE CONTENIDOS
iii
CAPÍTULO 1. INTRODUCCIÓN 1
CAPÍTULO 2. OBJETIVOS Y ESTRUCTURA DE LA TESIS DOCTORAL 2.1 OBJETIVOS DE LA TESIS DOCTORAL 2.2 ESTRUCTURA DE LA TESIS DOCTORAL
7 9
10
CAPÍTULO 3. REVISIÓN BIBLIOGRÁFICA 3.1 EL PURÉ DE PATATA: INGREDIENTES FUNCIONALES Y SITUACIÓN
ACTUAL 3.1.1 MATERIA PRIMA 3.1.2 CRIOPROTECTORES 3.1.3 SITUACIÓN ACTUAL
3.2 INGREDIENTES FUNCIONALES 3.2.1 INULINA 3.2.2 ACEITE DE OLIVA VIRGEN EXTRA 3.2.3 AISLADO DE PROTEÍNA DE SOJA
3.3 IMPORTANCIA DE LA TEXTURA Y LA REOLOGÍA EN EL PURÉ DE PATATA
3.4 SITUACIÓN ACTUAL DEL ANÁLISIS SENSORIAL DESCRIPTIVO 3.4.1 PERFIL DE TEXTURA 3.4.2 ANÁLISIS CUANTITATIVO DESCRIPTIVO (QDA) 3.4.3 FLASH PROFILE 3.4.4 PROJECTIVE MAPPING & NAPPING®
3.5 REFERENCIAS BIBLIOGRÁFICAS
15
17 17 20 24 27 27 30 33
35 37 41 42 44 46 48
CAPÍTULO 4. TRABAJOS EXPERIMENTALES 71
73
TEXTURE OF EXTRA VIRGIN OLIVE OIL-ENRICHED MASHED POTATOES: SENSORY, INSTRMENTAL AND STRUCTURAL RELATIONSHIPS. ABSTRACT PRACTICAL APPLICATIONS INTRODUCTION MATERIALS AND METHODS
Materials Preparation of MP samples Freezing, thawing and heating procedures Instrumental texture measurements Other quality parameters Sensory analyses Scanning electron microscopy (SEM) Statistical analysis
RESULTS AND DISCUSSION Instrumental texture measurements Color measurements and expressible water Sensory analyses Microstructure examination
CONCLUSION REFERENCES
75 75 76 78 78 79 79 80 81 82 83 83 84 84 89 93
101 105 106
ÍNDICE DE CONTENIDOS
iv
113 SENSORY AND TEXTURE PROPERTIES OF MASHED
POTATO INCORPORATED WITH INULIN AND OLIVE OIL BLENDS. ABSTRACT INTRODUCTION MATERIALS AND METHODS
Material Preparation of MP samples Freezing, thawing and heating procedures Sensory analysis Instrumental texture measurements Expressible water Statistical analysis
RESULTS AND DISCUSSION Influence of composition and the freeze/thaw cycle on sensory attributes of MP samples Principal component analyses (PCA) of sensory scores Influence of composition and freeze/thaw cycle on instrumental texture measurements and Ew of MP samples
CONCLUSIONS REFERENCES
115 115 118 118 118 119 120 121 121 123 123
123 134
140 146 147
155
TEXTURE PERCEPTION DETERMINED BY SOY PROTEIN ISOLATE AND INULIN ADDITION IN POTATO PUREE: LINKS WITH MECHANICAL AND MICROSTRUCTURAL FEATURES. ABSTRACT PRACTICAL APPLICATIONS INTRODUCTION MATERIALES AND METHODS
Preparation of PP samples Sensory evaluation Rheological measurements Scanning electron microscopy (SEM) Statistical analysis
RESULTS AND DISCUSSION Sensory properties evaluated by the trained panel Sensory properties evaluated by the untrained panel Correlations between descriptors rated by untrained and trained panels Rheological behavior Microstructure examination
CONCLUSION REFERENCES
157 157 158 160 160 160 161 163 164 164 165 165 169
174 176 181 185 186
ÍNDICE DE CONTENIDOS
v
191 SENSORY DESCRIPTION OF POTATO PUREE
ENRICHED WITH INDIVIDUAL FUNCTIONAL INGREDIENTS AND THEIR BLENDS ABSTRACT PRACTICAL APPLICATIONS INTRODUCTION MATERIALS AND METHODS
Materials Preparation of PP samples Freeze/thaw cycle Sensory evaluation Texture profile analysis Statistical analysis
RESULTS AND DISCUSSION QDA-Trained panel FP-Semi-trained panel PM-Untrained panel Comparison of results from the three panels Relationships between sensory and instrumental data
CONCLUSION REFERENCES
193 193 194 197 197 198 198 199 203 203 205 205 208 210 213 216 222 224
CAPÍTULO 5. DISCUSIÓN INTEGRADORA
5.1 EFECTO EN LA TEXTURA DE LOS PURÉS DE PATATA DE LA ADICIÓN DE ACEITE DE OLIVA VIRGEN EXTRA Y CRIOPROTECTORES.
5.2 EFECTO EN LA TEXTURA DE LOS PURÉS DE PATATA DE LA ADICIÓN DE MEZCLAS DE INULINA Y ACEITE DE OLIVA VIRGEN EXTRA.
5.3 EFECTO DE LA ADICIÓN DE MEZCLAS DE AISLADO DE PROTEÍNA DE SOJA E INULINA Y DEL PROCESADO EN LA TEXTURA DE PURÉS DE PATATA. APLICACIÓN DE UNA HERRAMIENTA ESTADÍSTICA PARA VALIDAR LAS DIFERENCIAS DEL PRODUCTO Y LOS RENDIMIENTOS DE UN PANEL ENTRENADO Y OTRO NO ENTRENADO.
5.4 DESCRIPCIÓN Y CUANTIFICACIÓN DE LOS ATRIBUTOS SENSORIALES DE PURÉS DE PATATA ENRIQUECIDOS CON MEZCLAS DE TRES INGREDIENTES FUNCIONALES MEDIANTE PANELES CON DIFERENTES GRADOS DE ENTRENAMIENTO. RELACIÓN CON LAS PROPIEDADES MECÁNICAS.
229
231
235
240
245
CAPÍTULO 6. CONCLUSIONES 249

Capítulo 1
INTRODUCCIÓN

INTRODUCCIÓN
3
En los últimos años el contexto económico, social y cultural ha generado que en
los hogares de los países desarrollados cada vez se dedique menos tiempo a la
preparación de platos elaborados de forma tradicional. La necesidad de comodidad y
rápidez experimentada por los consumidores debido al ritmo de vida incesante en las
grandes urbes ha fomentado la expasión en el mercado de platos precocinados y
alimentos congelados. Simultáneamente, la dieta de la población de los países
industrializados ha experimentado cambios sustanciales, aumentando la ingesta calórica
total debido en parte al reducido consumo de hidratos de carbono complejos, fibra,
vegetales y frutas. Los datos de los últimos años sobre obesidad, adulta e infantil, y
enfermedades cardiovasculares han generado un aumento de la preocupación y
concienciación social por la necesidad de introducir una alimentación y hábitos de
consumo más saludables. Como consecuencia de este reciente y creciente interés por
una alimentación más sana, la industria alimentaria está realizando una fuerte inversión
en el desarrollo de los denominados alimentos funcionales, llamados así porque además
de cubrir las necesidades metabólicas del individuo, afectan beneficiosamente a una o
más funciones del organismo de modo que mejoran el estado de salud o bienestar,
reduciendo el riesgo de enfermedades (Diplock y col., 1999). La necesidad de demostrar
científicamente los efectos reductores o preventivos de enfermedad a consecuencia del
consumo de alimentos funcionales está provocando que la Comunidad Científica
Internacional realice un gran esfuerzo en el estudio de los mecanismos por los que los
componentes de alimentos funcionales afectan a una determinada función en el
organismo. Una línea fundamental de investigación para el diseño y desarrollo de
alimentos funcionales consiste en la modificación de la formulación de un alimento
tradicional eliminando o sustituyendo determininados ingredientes (grasa, azúcar, etc.) o
INTRODUCCIÓN
4
adicionando compuestos de características saludables contrastadas (fibra soluble, ácidos
graso, vitaminas, fitoesteroles, etc.) (Fogliano y Vitaglione, 2005).
Entre la variedad de ingredientes funcionales que existen en el mercado, y en base
a las ventajas que ofrecen las fibras solubles (Schaafsma y col., 2015), los ácidos grasos
monoinsaturados tipo oléico (Pampaloni y col., 2014; Fuccelli y col., 2014) y la
proteína de soja (Tang y col., 2012), se consideró de especial interés estudiar el efecto
de la adición individual de inulina de cadena larga, aceite de oliva virgen extra y aislado
de proteína de soja en las características reológicas, de textura y calidad sensorial final
de puré de patata natural, tanto recién elaborado como tras un proceso de
congelación/descongelación. Del mismo modo, se estudia el efecto de incorporar
mezclas de los mencionados ingredientes funcionales, de forma que el consumo del
puré que los contenga contribuya a la ingesta recomendada de cada uno de ellos,
investigando el efecto producido en la calidad del puré como consecuecia de la posible
existencia de fenómenenos de sinergismo o antagonismo entre los constituyentes del
producto.
Las modificaciones en la composición de los alimentos convencionales, así como
el procesado, pueden provocar cambios en las propiedades organolépticas de dichos
alimentos que a su vez pueden afectar a la calidad sensorial de los mismos. Una de las
propiedades con mayor importancia en la calidad de los productos de patata recién
elaborados y procesados es la textura, o llamada con más rigor “propiedades texturales”,
ya que está directamente relacionada con su calidad sensorial. Por tanto, el estudio de
cómo puede afectar a las propiedades texturales la reformulación de un producto es de
vital importancia para la industria alimentaria, donde la innovación y el desarrollo de
nuevos alimentos funcionales deben cubrir las preferencias y la aceptación de los
consumidores finales.
INTRODUCCIÓN
5
Durante bastante tiempo, la disciplina de la tecnología de los alimentos ha
desarrollado métodos instrumentales que permiten medir la textura (Pons y Fiszman,
1996). No obstante, un análisis más exhaustivo de la textura puede obtenerse mediante
la correlación de las propiedades texturales obtenidas de forma instrumental con
aquellas derivadas de una evaluación sensorial. Los perfiles sensoriales obtenidos de los
productos mediante un análisis descriptivo son esenciales para definir y cuantificar las
características sensoriales que diferencian dichos productos. Esto permite a las empresas
alimentarias optimizar el producto acercándolo a la composición final deseada para su
consumo. Tanto el perfil sensorial de textura como el análisis descriptivo cuantitativo
(QDA®) son técnicas convencionales y muy utilizadas para describir y cuantificar las
variaciones en las propiedades sensoriales de los alimentos. Ambas técnicas son
realizadas por un panel de jueces entrenados o expertos utilizando términos específicos
y complejos para definir los atributos sensoriales percibidos. Junto con la dificultad para
interpretar el vocabulario utilizado así como el procedimiento para la evaluación de los
atributos definidos, estos métodos ofrecen otra desventaja en relación al proceso largo y
tedioso de entrenamiento de los jueces. La información obtenida mediante estas
técnicas, aunque precisa y detallada, puede estar alejada de las diferencias percibidas
por los consumidores en una situación real de consumo (Tarancón, 2013).
Actualmente se están aplicando nuevas técnicas sensoriales descriptivas que se
pueden utilizar de forma alternativa y/o complementaria a las metodologías
convencionales y que pueden resolver algunas de las limitaciones descritas. Una de
éstas metodologías es el Flash Profile (Dairou y Sieffermann, 2002) que combina el
Perfil de Libre Elección y el Método de Ordenamiento; sus características más prácticas
son que cada miembro del panel genera su propio conjunto de atributos de forma
individual, y que la evaluación se realiza mediante una comparación simultánea de
INTRODUCCIÓN
6
todas las muestras permitiendo una mejor discriminación del producto. Otra de las
técnicas que resultan atractivas es el Projective Mapping y su variante el Napping®,
desarrolladas por Pagès (2005), en la que los jueces tienen que situar las muestras en un
espacio bidimensional en función de sus similitudes o diferencias utilizando para dicho
posicionamiento su propio criterio individual lo que hace del Projective Mapping un
procedimiento flexible y espontáneo (Moussaoui y Varela, 2010). Este método puede
combinarse con una breve descripción de las muestras por parte de los jueces con lo que
se obtiene un perfil mucho más completo (Pagès, 2003; Perrin y col., 2008). Tanto para
la realización del Flash Profile como del Projetive Mapping no es necesaria la
participación de un panel de jueces entrenados o expertos, con lo que el tiempo
empleado en su entrenamiento se ve claramente reducido, además como los miembros
del panel utilizan su propio vocabulario la descripción del producto se acerca más a las
expectativas y preferencias de los consumidores.
Todas las técnicas instrumentales junto con las nuevas metododologías sensoriales
aplicadas en la presente Tesis Doctoral pueden ayudar a estudiar el efecto de la adición
de ingredientes funcionales en la modificación de las propiedades texturales de los purés
de patata frescos y congelados, definiendo mejor las características de estos productos.
Aunque algunas de estas técnicas se han utilizado con éxito en diferentes alimentos, no
se ha encontrado bibliografía referente a purés de patata frescos y procesados, por lo
que su aplicación podría suponer una vía interesante de estudio.
Capítulo 2
OBJETIVOS Y ESTRUCTURA DE
LA TESIS DOCTORAL

OBJETIVOS Y ESTRUCTURA DE LA TESIS DOCTORAL
9
2.1. OBJETIVOS DE LA TESIS DOCTORAL
El objetivo principal de la presente Tesis Doctoral fue estudiar el efecto del
procesado y de la adición de distintos ingredientes funcionales en la textura de purés de
patata frescos y congelados, mediante metodologías sensoriales e instrumentales que
permiten caracterizar y optimizar la calidad tecnológica y sensorial de este tipo de
productos.
Para alcanzar este objetivo se establecieron los siguientes objetivos parciales y
específicos:
Evaluar los efectos de añadir aceite de oliva virgen extra en las propiedades
texturales, físicas, estructurales y sensoriales de purés de patata recién
elaborados o frescos y posteriormente a su congelación.
Estudiar los efectos que tiene la adición de diferentes mezclas de inulina y aceite
de oliva virgen extra sobre las características texturales, físicas y sensoriales de
purés de patata frescos y congelados.
Identificar y reducir el número de atributos sensoriales que describen la textura
percibida en los purés de patata recién elaborados y tras su congelación,
formulados con diferentes mezclas de inulina y aceite de oliva virgen extra.
Validar estadísticamente los efectos que tiene sobre la textura de purés de patata
frescos y congelados, la adición de una mezcla de aislado de proteína de soja e
inulina en diferentes proporciones, y analizar las diferencias entre los productos,
comparando las actuaciones de un panel de jueces entrenados y otro compuesto
por jueces no entrenados.
OBJETIVOS Y ESTRUCTURA DE LA TESIS DOCTORAL
10
Conocer el grado de correlación existente entre la textura percibida y las
propiedades reológicas y estructurales de purés de patata frescos y congelados
formulados con diferentes mezclas de aislado de proteína de soja e inulina.
Caracterizar los purés de patata congelados y formulados con inulina, aceite de
oliva virgen extra y aislado de proteína de soja, aplicando dos metodologías
sensoriales innovadoras (Flash Profile y Projective Mapping) mediante la
utilización de dos paneles de jueces con diferentes grados de entrenamiento.
Comparar los perfiles sensoriales generados a través de estos dos métodos
sensoriales innovadores con el perfil sensorial obtenido mediante un análisis
descriptivo cuantitativo convencional, realizado por un panel de jueces
entrenado.
2.2. ESTRUCTURA DE LA TESIS DOCTORAL
El trabajo de investigación realizado ha dado origen a cuatro publicaciones
científicas cuyo contenido se muestra en el Capítulo 4: “Trabajos experimentales” de
la presente Tesis Doctoral. Las referencias de estas publicaciones son:
Alvarez, M.D., Fernández, C., Jiménez, M.J. and Canet, W. (2011). Texture
of extra virgin olive oil-enriched mashed potatoes: sensory, instrumental and
structural relationships. Journal of Texture Studies, 42, 413-429.
Alvarez, M.D., Fernández, C., Olivares, M.D., Jiménez, M.J. and Canet, W.
(2013). Sensory and texture properties of mashed potato incorporated with inulin
and olive oil blends. International Journal of Food Properties, 16, 1-21.
OBJETIVOS Y ESTRUCTURA DE LA TESIS DOCTORAL
11
Alvarez, M.D., Jiménez, M.J., Olivares, M.D., Barrios, L. and Canet, W.
(2012). Texture perception determined by soy protein isolate and inulin addition
in potato puree: links with mechanical and microstructural features. Journal of
Texture Studies, 43, 361-374.
Jiménez, M.J., Canet, W. and Alvarez, M.D. (2013). Sensory description of
potato puree enriched with individual functional ingredients and their blends.
Journal of Texture Studies, 44, 301-316.
En la primera publicación se evaluaron los efectos de añadir aceite de oliva virgen
extra en la textura instrumental y en los atributos sensoriales de purés de patata recién
elaborados y congelados/descongelados, formulados sin y con crioprotectores (al objeto
de minimizar el daño causado por la congelación y descongelación). Para ello, se
estudiaron y analizaron los resultados de utilizar diferentes concentraciones de aceite de
oliva virgen extra, de la incorporación de una mezcla de dos polisacáridos (kappa-
carragenato y goma xantana) para la estabilización del puré de patata, y del procesado
de la muestras en las propiedades texturales derivadas de ensayos de extrusión inversa y
penetración cónica, en las propiedades físicas (color y sinéresis), en la microestructura
de los purés y en los atributos sensoriales derivados de un análisis de perfil de textura
(TPA).
Con la finalidad de obtener un producto rico en fibra soluble, en el segundo
trabajo se enriquecieron los purés de patata elaborados con aceite de oliva virgen extra
mediante la adición de inulina. Se estudiaron los efectos que la mezcla de ambos
ingredientes funcionales tuvo en las propiedades de textura sensoriales e instrumentales,
tanto en purés frescos como en purés congelados/descongelados, elaborados ambos con
y sin crioprotectores. Además, aplicando el análisis de componentes principales, se
OBJETIVOS Y ESTRUCTURA DE LA TESIS DOCTORAL
12
identificaron y redujeron los atributos sensoriales que describen la textura, mediante
combinaciones lineales de dichos atributos.
En el tercer trabajo experimental se estudió el efecto que la adición de mezclas de
aislado de proteína de soja e inulina produce en la textura de purés de patata recién
elaborados y congelados/descongelados mediante la evaluación de las propiedades
reológicas, microestructurales y sensoriales. El estudio de las propiedades sensoriales se
abordó utilizando un enfoque fundamentalmente estadístico, considerando a los jueces
como efectos fijos o aleatorios, lo que permitió validar las evaluaciones de los paneles
sensoriales utilizados (entrenado y no entrenado), valorar el nivel de acuerdo en las
evaluaciones sensoriales realizadas por los miembros de cada panel, así como la
correlación de los resultados de ambos paneles.
En la cuarta y última publicación, para la caracterización sensorial de este tipo de
productos se profundizó en la aplicación de dos nuevas metodologías sensoriales
descriptivas, Flash Profile y Projective Mapping, mediante la utilización de paneles con
diferentes grados de entrenamiento. A través del uso de las citadas técnicas sensoriales,
se evaluaron purés de patata elaborados con tres ingredientes funcionales (aceite de
oliva virgen extra, inulina y aislado de proteína de soja) y los resultados se compararon
con los obtenidos tras su evaluación mediante una metodología descriptiva cuantitativa
convencional en la que participaron jueces entrenados. El trabajo de este último panel,
se ve reflejado no sólo en el resto de capítulos de la presente Tesis Doctoral, sino
también en numerosos estudios realizados, a lo largo de ocho años, por este grupo de
investigación. Otro aspecto considerado en este capítulo fue la correlación de las
características de textura instrumental con los atributos sensoriales generados por cada
uno de los tres paneles de jueces.
OBJETIVOS Y ESTRUCTURA DE LA TESIS DOCTORAL
13
Así mismo, el trabajo experimental desarrollado para llevar a cabo la presente
Tesis Doctoral, ha permitido obtener paralelamente los siguientes trabajos científicos:
Canet, W., Fernández, C., Olivares, M.D., Jiménez, M.J. and Alvarez, M.D.
(2010). Effect of inulin and extra virgin olive oil blends on sensory and
instrumental texture measurements of mashed potatoes. 4th
European Conference
on Sensory and Consumer Research. A Sense of Quality. Vitoria (Spain).
Jiménez, M.J., Canet, W. and Alvarez, M.D. (2012). Chapter 1: Dynamic
rheology and sensory properties determined by inulin/extra virgin olive oil
blends in mashed potatoes: effects of hydrocolloids addition and freeze/thaw. In
Book tittle: Olive Consumption and Health. A. Savalas and Soussana M.
Nicolau (Eds), pp: 1-42. Nova Science Publishers, Inc, NY, USA. ISBN: 978-1-
62100-774-6.
Jiménez, M.J., Canet, W. and Alvarez, M.D. (2013). Chapter 1: Descriptive
Sensory Analysis of Food: Conventional versus Innovative Methodologies. In
Book tittle: New Developments in Sensory Processing Research. M. Voisin and
R. Brunel (Eds), pp: 1-51. Nova Science Publishers, Inc, NY, USA. ISBN: 978-
1-62808-399-6.
Alvarez, M.D., Canet, W. and Jiménez, M.J. (2014). Chapter 1: Rheology,
texture and functionality of soy protein isolate-based potato puree: instrumental,
sensory and structural relationships. In Book tittle: Soy Protein: Production
Methods, Functional Properties and Food Sources. Jon M. Casamides and H.
Gonzalez (Eds), pp: 1-46. Nova Science Publishers, Inc, NY, USA. ISBN: 978-
1-62948-579-9.

Capítulo 3
REVISIÓN BIBLIOGRÁFICA

REVISIÓN BIBLIOGRÁFICA
17
3.1 EL PURÉ DE PATATA: INGREDIENTES Y SITUACIÓN ACTUAL.
3.1.1 MATERIA PRIMA
La selección de la patata como materia prima para la elaboración de los purés
estudiados en la presente Tesis Doctoral, es debida a su elevada importancia económica
por ser un producto que ocupa una posición única en la dieta humana ya que posee un
alto valor nutricional y es una fuente considerable de energía.
La patata (Solanum tuberosum L.) es originaria de la Cordillera de los Andes,
existiendo actualmente más de 4.500 variedades catalogadas y cultivadas en más de 100
países (Pieterse y Judd, 2014). En el siglo XVI fue traída a Europa por los españoles,
adaptándose con rapidez a las condiciones del norte por lo que pronto se convirtió en
alimento básico en una época de acelerado crecimiento demográfico.
Según la División Estadística de la FAO (FAOSTAT), los principales países
productores de patata son China, India, Rusia, Ucrania y Estados Unidos. Con una
producción mundial de más de 365 millones de toneladas en el año 2012, la patata
representa el cuarto alimento básico del mundo, después del maíz, el trigo y el arroz. La
producción en España se ha mantenido relativamente constante en los últimos dos años,
situándose alrededor de los 2 millones de toneladas (FAO, 2013).
Debido a sus propiedades nutritivas y al coste de su producción, la patata está
siendo de vital importancia en países en vías de desarrollo con escasos recursos
económicos donde la población padece carencias alimenticias extremas. Un claro
ejemplo puede encontrarse en las zonas urbanas del África subsahariana, donde las
patatas han adquirido gran popularidad y, se han convertido en un alimento básico
fundamental y en un importante cultivo comercial. Como señaló Eric Keuneman, Jefe
REVISIÓN BIBLIOGRÁFICA
18
del Servicio de Cultivos y Pastos de la FAO: “Para las personas de bajos ingresos de las
zonas urbanas y rurales, la patata realmente es un tesoro enterrado”.
Según la variedad, la patata contiene, aproximadamente, un 78% de agua y un
22% de materia seca. De esa materia seca, entre el 60% y el 80% corresponde a
almidón, lo que hace de la patata un alimento saludable. Además, la patata contiene
proteínas, poca grasa y abundantes micronutrientes, especialmente vitamina C y una
cantidad moderada de hierro. Así mismo, este tubérculo tiene vitaminas B1, B3 y B6,
ácido pantoténico y riboflavina, y otros minerales como potasio, fósforo y magnesio, así
como fibra y compuestos antioxidantes, los cuales pueden contribuir a prevenir
enfermedades relacionadas con el envejecimiento.
El componente sólido mayoritario de la patata, el almidón, es un polisacárido de
glucosa anhidra, constituido por dos componentes: amilosa y amilopectina. La amilosa
es un polímero lineal y soluble en agua caliente (70-80 ºC), mientras que la
amilopectina es ramificada e insoluble. Ambas están formadas por unidades de glucosa;
en el caso de la amilosa unidas entre ellas por enlaces α-(1→4), lo que da lugar a una
cadena lineal, mientras que en la amilopectina aparecen ramificaciones debidas a
enlaces α-(1→6), cada 20 o 30 glucosas (Aberle y col., 1994).
Las propiedades funcionales aportadas por el almidón (textura, viscosidad y
retención de humedad, entre otras) se desarrollan cuando los gránulos gelatinizan. El
proceso de gelatinización ocurre al calentar los gránulos de almidón en presencia de
agua. En la gelatinización se producen cambios irreversibles como fusión cristalina,
pérdida de birrefringencia y solubilización (Mitolo, 2006).
La gelatinización del almidón tiene lugar en exceso de agua y condiciones de
humedad limitadas en un intervalo de temperatura, que se conoce como temperatura de
gelatinización y depende de la variedad (Alvarez, 1996). Durante la gelatinización del
REVISIÓN BIBLIOGRÁFICA
19
almidón, parte de la amilosa difunde del gránulo (Smith, 1980) y las regiones de
amilopectina cristalina absorben agua, dando lugar a un hinchamiento de los gránulos
de almidón. Estos cambios van acompañados de un aumento de viscosidad del producto
debido a que los gránulos de almidón se adhieren unos a otros (Whistler y Daniel,
1993).
En el proceso de enfriamiento de la suspensión gelatinizada, la pérdida de la
estructura ovalada y cristalina del gránulo de almidón, ocurrida durante la
gelatinización, es parcialmente recuperada debido a que las cadenas lineales de amilosa
se orientan paralelamente y se unen de nuevo mediante puentes de hidrógeno
formándose una red reticular tridimensional. Cuando este reordenamiento ocurre, el
agua retenida es expulsada fuera de la red, es decir, se separan la fase sólida (cristales de
amilosa y de amilopectina) y la fase acuosa (agua líquida). Esta intensa e irreversible
transición desde el estado soluble o disperso a otro insoluble, no hinchado y
microcristalino, se conoce como retrogradación del almidón (Whistler y Daniel,
1993). El proceso de exclusión de agua que acompaña a la retrogradación se denomina
sinéresis. La retrogradación produce un aumento de las propiedades texturales dureza y
cohesividad y una disminución de la adhesividad y de la fracturabilidad, especialmente
manifiestos a 4 ºC, que están relacionados con la disminución de la amilosa soluble y
con el desarrollo de una red polimérica en el almidón gelatinizado (Alvarez, 1996).
La gelatinización y retrogradación son las dos propiedades funcionales más
importantes del almidón. Un calentamiento paulatino de tubérculos en medio acuoso, es
decir, la cocción de patatas, ocasiona la separación de las células y la gelatinización del
almidón (Reeve, 1977), y a su vez, el enfriamiento promueve su retrogradación
(Jankowski, 1992).
REVISIÓN BIBLIOGRÁFICA
20
La tendencia del almidón a retrogradarse se ve favorecida por las bajas
temperaturas (especialmente en torno a 0 ºC), pH neutro y concentraciones altas de
almidón. El grado de retrogradación dependerá también del peso molecular y del tipo de
almidón (Eliasson y Kim, 1992; Achayuthakan y Suphantharika, 2008).
Una opción para mejorar el comportamiento de los almidones nativos consiste en
combinarlos con otros hidrocoloides, capaces de ligar e inmovilizar agua.
3.1.2 CRIOPROTECTORES
Los procesos de congelación y descongelación inducen fenómenos de sinéresis e
inestabilidad, produciéndose agregaciones y sedimentaciones que causan el deterioro de
la textura de los purés vegetales (Downey, 2002). Una estrategia para minimizar el daño
causado por dichos procesos consiste en la adición de crioprotectores que interaccionan
con el agua (Sych y col., 1990), disminuyendo la velocidad de crecimiento de los
cristales de hielo, alterando su forma (Bolliger y col., 2000) y ofreciendo protección
frente a los efectos perjudiciales de la descongelación en particular.
Los crioprotectores utilizados en la industria alimentaria son adicionados a
distintos productos con fines tales como controlar la estructura, textura y estabilidad
frente al procesado. Los dos crioprotectores más utilizados son los polisacáridos y las
proteínas.
Los polisacáridos poseen efecto crioprotector para hacer frente a necesidades
específicas como es la mejora de la textura. Así mismo, se caracterizan particularmente
por su capacidad de retención de agua (Dickinson, 1998).
REVISIÓN BIBLIOGRÁFICA
21
El interés tecnológico de las mezclas de polisacáridos, en particular entre el
almidón y otros polisacáridos, es motivado por la aptitud que las mezclas de estas
macromoléculas tienen para influir en la capacidad de gelificación, emulsificación,
modificación de la viscosidad, estabilización de suspensiones y capacidad de retención
de agua además de proporcionar atractivas propiedades funcionales (Medina-Torres y
col., 2003). Los hidrocoloides, por tanto, son utilizados en productos elaborados a base
de almidón para controlar la gelatinización y las propiedades reológicas de los
almidones. Procesos como la cocción de pan y pasteles, extrusión de productos a base
de cereales, espesamiento y gelificación de salsas, cremas, purés vegetales y rellenos de
pasteles, son todos dependientes de la gelatinización del almidón durante su utilización
industrial.
Downey (2002) estudió el efecto de la adición de varios hidrocoloides (goma
xantana, goma guar, pectina y carragenato) y de proteínas lácteas (caseinato sódico y
concentrado proteico del lactosuero) en la sinéresis y en la máxima resistencia a la
penetración en purés vegetales congelados y descongelados, poniendo de manifiesto que
dependiendo del vegetal, se puede mantener su calidad o mejorarla después de la
descongelación a través de la selección apropiada de un crioprotector. El tipo y la
concentración del hidrocoloide influyen de manera considerable en la textura y las
propiedades sensoriales de este grupo de productos.
Se han llevado a cabo diferentes estudios dirigidos a cuantificar las características
reológicas de los hidrocoloides individualmente o en formulaciones de alimentos
(Krumel y Sarkar, 1975; Sanderson, 1981; Dickie y Kokini, 1983; Stanley, 1990; White
y col., 1993; Abdelrahim y col., 1995; Da Silva y Rao, 1995; Ma y Barbosa-Canovas,
1996; Da Silva y col., 1997; Fernández, 2008; Albert, 2011; Morell y col., 2014;
Tárrega y col., 2014).
REVISIÓN BIBLIOGRÁFICA
22
En la presente Tesis Doctoral se eligieron dos polisacáridos como crioprotectores
para su adición a los purés de patata estudiados. Esta decisión tiene su origen en los
estudios realizados previamente por este grupo de investigación con diferentes
crioprotectores (pectina de bajo metoxilo, goma xantana, kappa-carragenato y caseinato
sódico) y sus mezclas, y que tuvieron como fruto diversas publicaciones científicas
(Alvarez y col., 2011; Canet, 2011) y una patente de invención (Canet y col., 2010).
Los resultados más notables de dichos estudios permitieron concluir que, la
mezcla óptima de crioprotectores es la formada por la goma xantana y el kappa-
carragenato, ambos adicionados en concentraciones individuales de 1,5 g kg-1
.
La incorporación de los dos polisacáridos logra inhibir el deterioro de la textura
consecuencia de fenómenos de sinéresis e inestabilidad inducidos por el proceso de
congelación. Además, hace que los purés de patata estudiados en la presente Tesis
Doctoral presenten unas características reológicas, texturales, de color y organolépticas
similares, e incluso superiores, tanto a las de los productos comercializados
actualmente, como a las que posee un puré de patata fresco elaborado de forma
convencional.
Como ya se ha mencionado, uno de los hidrocoloides utilizados fue el kappa-
carragenato (k-C). Éste es un polisacárido lineal aniónico sulfatado, concretamente
poligalactano de alto peso molecular, formado por la repetición alternada de unidades
de D-galactosa y de 3-6 anhidro-D-galactosa que se unen mediante enlaces glicosídicos
alternos α-(1→3) y β-(1→4), y pueden estar presentes grupos éster sulfato en algunas o
en todas las unidades de galactosa (Stanley, 1990). En el k-C, la unidad ligada en
posición 4 se encuentra como 3-6 anhidro, lo que posibilita a la molécula adoptar la
estructura ordenada de doble hélice necesaria para la gelificación (Rees y col., 1982).
REVISIÓN BIBLIOGRÁFICA
23
Existen diversos estudios de su aplicación en alimentos relativos a su
combinación con almidones (Lai y col., 1999; Autio y col., 2002; Tecante y Doublier,
2002; Verbeken y col., 2004; Arocas, 2010). El k-C ha sido principalmente utilizado
como agente gelificante en productos lácteos (Arltoft y col., 2008).
El otro hidrocoloide utilizado en la presente Tesis Doctoral fue la goma xantana
(XG): heteropolisacárido extracelular, de alto peso molecular, producido por diversas
especies de bacterias del género Xanthomonas campestris, siendo la B-1459 la bacteria
utilizada comercialmente para su síntesis (Katzbauer, 1998; Song y col., 2006). La XG
está formada por unidades de β-D-glucosa unidas por enlaces β-(1→4), una rama
trisacárida constituida por una unidad de ácido glucurónico entre dos unidades de
manosa se une a cada unidad de glucosa en la posición 3 (Jansson y col., 1975).
La XG presenta una elevada capacidad de retención de agua, por lo que ofrece una
excelente estabilidad frente a los procesos de congelación y descongelación (García-
Ochoa y col., 2000). Por ello, se utiliza en productos de panadería, proporcionando
estabilidad durante la cocción y el enfriamiento de la harina de trigo, ofreciendo la
posibilidad de mejorar la calidad del pan, tanto durante la conservación en el estado
congelado como en su descongelación en microondas. En este último proceso es
deseable un aumento de la capacidad de retención de agua, con el fin de obstaculizar la
pérdida rápida de agua que se produce, obteniéndose así un producto menos duro
(Mandala, 2005). La XG se utiliza también para mejorar la textura de salsas, mezclas de
formulaciones secas, confitería y productos lácteos como agente aglutinante, espesante,
estabilizador y agente que proporciona cuerpo a los productos, entre otros (Mandala y
col., 2004).
REVISIÓN BIBLIOGRÁFICA
24
La adición de gomas en general, y de XG en particular, estabiliza la textura de las
dispersiones de alimentos (Hoefler, 2004), por lo que puede utilizarse para estabilizar y
mejorar las propiedades reológicas de puré de patata, tanto fresco como después de ser
sometido a un proceso de congelación. Varios autores han estudiado el efecto de
diferentes gomas en las propiedades reológicas de dispersiones de alimentos, tales como
rellenos de frutas (Wei y col., 2001), ketchup (Sahin y Ozdemir, 2004), salsas (Mandala
y col., 2004), pastas (Choi y Yoo, 2006), nuggets (Albert, 2009) y salsas blancas
(Arocas, 2010).
3.1.3 SITUACIÓN ACTUAL
El desarrollo económico y el crecimiento progresivo de los países industrializados
inducen nuevas realidades sociales, entre ellas la reducción drástica del tiempo dedicado
a la preparación doméstica de los alimentos. La necesidad de productos elaborados y la
exigencia cada vez mayor del consumidor, ha sido respondida por la industria
alimentaria con una enorme expansión de los alimentos congelados. El mercado de
comidas preparadas congeladas representa en España uno de los mayores subsectores
en términos de volumen y valor económico. Junto con la ventaja de una mayor vida útil,
las comidas preparadas basadas en vegetales como es el caso del puré de patata, y dado
el tedioso proceso de elaboración que requiere, sería interesante disponer de productos
de este tipo congelados, tanto para la restauración colectiva como para el consumo
individual (Fernández, 2008).
Además, nuestra conciencia cada vez mayor de la relación existente entre el
alimento y la salud ha incrementado la demanda hacia alimentos con alto contenido en
fibra y baja cantidad de grasa (Nishinari, 2009).
REVISIÓN BIBLIOGRÁFICA
25
En nuestro mercado, es relativamente reciente la aparición de cremas vegetales
que tomando como base la patata, han dado lugar a una variedad de productos
refrigerados cuyo consumo a diferentes temperaturas permiten ser una fuente excelente
de fibra, minerales y vitaminas indispensables en una dieta sana y equilibrada
(Fernández, 2008). La combinación de sabor, textura y apariencia influye en la
preferencia y aceptación que el consumidor tiene sobre estos productos. El puré de
patata es un producto muy aceptado bien como acompañamiento de una comida
preparada o como producto individual. Además el puré de patata, utilizado también
como ingrediente fundamental para alimentación infantil en forma de potitos, presenta
ventajas frente a otros alimentos infantiles basados en cereales, especialmente trigo y
cereales relacionados, debido a su efecto hipoalergénico.
En el caso de la patata, y especialmente en los países desarrollados, su consumo
está pasando del producto fresco a los productos procesados que, tomando como base la
patata, permiten obtener alimentos con un alto valor añadido. En respuesta a la creciente
demanda de los consumidores hacia alimentos de alta calidad, fáciles de preparar, se
han desarrollado nuevas e innovadoras formas de utilización de la patata, siendo sus
productos derivados congelados los más importantes. Asimismo, existen en el mercado
una creciente y amplia variedad de comidas preparadas congeladas, que ofrecen además
una manufacturación y flexibilidad sustancialmente más prolongada que la comida
preparada refrigerada, la cual presenta una vida útil relativamente corta.
Multinacionales importantes como Heinz, Unilever o Conagrafoods, incluyen en
su actividad un sector dedicado a la comercialización de productos congelados. Marcas
como Boston Market, CountryCrock, Lamb Weston o Lutosa entre otras, cuentan entre
sus productos estrella con el puré de patata congelado que además de ser fabricado
como producto individual, se incluye en una gran variedad de platos congelados como
REVISIÓN BIBLIOGRÁFICA
26
componente principal o como guarnición. El puré de patata congelado es utilizado
además de para la elaboración de patatas fritas estilo francés (tipo paja) y patatas fritas
tipo chips (Lamberti y col., 2004), también como ingrediente base o intermedio en gran
número de especialidades, formas y sabores como croquetas, bocaditos, gratinados, etc.,
siendo estas especialidades dirigidas a todo tipo de cocina y población (hindú,
americana, asiática, mediterránea, etc.), y consumidas casi diariamente.
Actualmente, los únicos tipos de puré de patata que pueden ser adquiridos
comercialmente en el mercado español son el puré de patata que se elabora a partir de
copos o escamas desecados que es ampliamente aceptado, y un puré de patata a base de
copos de patata deshidratados ya reconstituido con escaso éxito comercial. El puré de
patata, principalmente desecado, se produce y consume a gran escala en un amplio
número de países europeos (Reino Unido, Francia, Bélgica, Bulgaria…), Estados
Unidos y Canadá (Redmond y col., 2002). Por lo tanto, se considera de alto interés y
previsible éxito comercial la existencia de un puré de patata congelado cuya
presentación final sea en raciones unipersonales o familiares y que, con una
descongelación y calentamiento final rápido en microondas, permita tanto al
consumidor como a la restauración colectiva disponer de un producto de alta calidad y
estabilidad, para ser servido como un primer plato o como acompañamiento a los platos
principales de cualquier comida, evitando el prolongado y tedioso procedimiento de
preparación convencional (Canet, 2001).
Por otro lado, los purés de patata elaborados y estudiados en la presente Tesis
Doctoral poseen también interesantes propiedades nutricionales y saludables, ya que
han sido suplementados con tres ingredientes funcionales (aceite de oliva virgen extra,
inulina y aislado de proteína de soja) cuyo beneficio para la salud humana ha sido
REVISIÓN BIBLIOGRÁFICA
27
demostrado (Tang y col., 2012; Fuccelli y col., 2014; Pampaloni y col., 2014;
Schaafsma y col., 2015).
3.2 INGREDIENTES FUNCIONALES
El puré de patata en sí mismo es un alimento compuesto básicamente por almidón,
que puede ser considerado como un sistema semisólido, es decir, es un material
viscoelástico (Foegeding y col., 2011). Además del almidón nativo de la patata, los
purés estudiados en la presente Tesis Doctoral constituyen un sistema combinado con
proteína de leche desnaturalizada, agua y sal, junto con crioprotectores añadidos (kappa-
carragenato y goma xantana) cuando los productos van a ser congelados (Alvarez y col.,
2012).
Las variaciones en la composición de los purés de patata iniciales mediante la
adición de nuevos ingredientes podrían producir notables diferencias en el producto
final (Bayarri y col., 2011). Dicha adición de ciertos ingredientes funcionales y
nutricionales (inulina, aceite de oliva virgen extra y aislado de proteína de soja) influirá
en las características estructurales, fisicoquímicas, texturales y en la calidad sensorial
del producto final. Además, mediante la suplementación de los purés con los
mencionados ingredientes es posible obtener unos productos con mayor valor
nutricional y mucho más saludables.
3.2.1 INULINA
La inulina (INL) es un componente natural de varias frutas y verduras aunque de
forma industrial se produce principalmente a partir de la raíz de la achicoria en copos
REVISIÓN BIBLIOGRÁFICA
28
mediante una extracción a elevada temperatura seguida de un proceso de intercambio de
iones (Dysseleer y Hoffem, 1995).
Químicamente, la inulina natural es una mezcla de cadenas de oligómeros y/o
polímeros con un número variable de moléculas de fructosa que están unidas mediante
enlaces glicosídicos beta (1→2), responsables de sus características nutricionales
(Zimmeri, 2003). La última molécula de fructosa se une a su vez a una molécula de
glucosa mediante un enlace glicosídico alfa (1→2) como en la sacarosa (Roberfroid,
1999).
El grado de polimerización de las cadenas oscila entre 2 y 60 unidades, así la
inulina natural se caracteriza por un grado de polimerización medio de 12 unidades.
Pueden obtenerse dos tipos de inulina, una de cadena corta, cuyo grado de
polimerización oscila entre 2 y 7 unidades, mediante hidrólisis parcial enzimática de la
INL nativa, y una inulina de cadena larga (grado de polimerización entre 22 y 25
unidades) mediante procesos físicos (Franck, 2002).
Desde un punto de vista fisiológico, la inulina es un carbohidrato no digerible con
especial interés para la industria alimentaria, es precisamente la configuración beta que
existe en sus monómeros de fructosa lo que garantiza a la inulina su carácter como fibra
dietética (Flamm y col., 2001) ya que esta configuración la hace resistente a la hidrólisis
en el intestino delgado debido a que las enzimas que actúan a este nivel del tracto
digestivo son específicas para las uniones α-glicosídicas.
Por tanto, la inulina tiene beneficios saludables para el ser humano inherentes a su
condición de fibra dietética, como son la regulación del tránsito intestinal, la reducción
de los niveles de lípidos y colesterol en sangre y el incremento de la absorción de calcio
(Roberfroid, 1993; Flam, 2001).
REVISIÓN BIBLIOGRÁFICA
29
Otros beneficios reportados sobre la salud que aporta la inulina son aquellos
derivados de su función prebiótica, relacionados principalmente con la estimulación del
crecimiento de la bacterias beneficiosas (por ejemplo: bifidobacterias) (Roberfroid y
col., 1999; Roberfroid y Slavin, 2000) y la disminución de crecimiento de fusobacterias
y clostridium (Kaur y Gupta 2002).
La inulina ha sido añadida a diferentes alimentos en cantidades que varían desde
los 3 g a los 6 g por ración, para incrementar la ingestión de fibra soluble, o para
asegurar la producción de bífidus añadiendo entre 3 g y 8 g por ración (Coussement,
1999).
Además de los ya citados beneficios en la salud humana, la INL ofrece otras
propiedades tecnológicas interesantes tales como actuar como un edulcorante bajo en
calorías, sustitutivo de grasa o agente de textura (Tungland y Meyer, 2002).
La inulina mezclada con disoluciones acuosas desarrolla una estructura de gel
formada por una red de partículas cristalinas (Hébette y col., 1998; Chiavaro y col.,
2007), cuyas propiedades se asemejan más a las de una red de cristales de grasa en el
aceite (Bot y col., 2004). Esta estructura es blanca y cremosa, pudiéndose incorporar a
alimentos para sustituir la grasa (Franck, 1993) ya que proporciona una textura untuosa
y una sensación en boca cremosa (Frippiat y Smits, 1996).
La inulina tiene un sabor neutro, es incolora y tiene una mínima influencia sobre
las características sensoriales de los alimentos por lo que puede ser considerada como
forma invisible para poder añadir fibra a los alimentos. Son numerosos los estudios
realizados sobre el efecto que tiene la adición de este ingrediente funcional sobre las
características reológicas y sensoriales de una amplia variedad de productos como en
helados (Schaller-Povolny y Smith, 2001; El-Nagar y col., 2002), yogures (Dello
Staffolo y col., 2004; Guven y col., 2005; Kip y col., 2006; Brennan y col., 2008), queso
REVISIÓN BIBLIOGRÁFICA
30
fresco (Koca y Metin, 2004; Henelly y col., 2006), postres lácteos (Tárrega y Costell,
2006; Cardarelliy col., 2008), yogures bajos en grasa (Kip y col., 2006; Srisuvor y col.,
2013) y bebidas lácteas (Villegas y Costell, 2007). Ha sido también utilizada en pasta
(Brennany col., 2004), pasteles (Moscattoy col., 2006) y chocolates (Bolenz y col.,
2006). Más recientemente, se han investigado los efectos que ejerce la inulina sobre
parámetros de color y textura en carnes cocidas (Alvarez y Barbut, 2013) e incluso se
han estudiado las propiedades acústicas y de fractura en galletas enriquecidas con este
fructano (Laguna y col., 2013).
3.2.2 ACEITE DE OLIVA VIRGEN EXTRA
El aceite de oliva es un alimento muy presente en países de la región del
Mediterráneo como España, Italia y Grecia, donde es considerado el alimento más
representativo de la denominada “dieta mediterránea” y en la que proporciona el 85%
del contenido de grasa (Muniz, 2007). En estas regiones, las características nutricionales
del aceite son muy apreciadas y conocidas desde hace mucho tiempo por lo que es
utilizado diariamente para una gran variedad de fines culinarios incluso en frituras
debido a su remarcable resistencia a la oxidación térmica (Paraskevopoulou y col.,
2005).
Gracias al interés creciente que está surgiendo sobre la dieta mediterránea y a la
creencia de que el aceite previene ciertas enfermedades (Boskou y Visioli, 2003), su
consumo ha aumentado considerablemente en las regiones fuera del área del
Mediterráneo. Su interés, se consolidó con la inclusión de una declaración por parte de
la Administración de Alimentos y Medicamentos (FDA) del Departamento de Salud y
Servicios Humanos de los Estados Unidos (US Federal Drug Administration) en las
REVISIÓN BIBLIOGRÁFICA
31
etiquetas del aceite de oliva comercializado, donde se declara que el consumo de dos
cucharadas (23 g) de aceite al día reduce el riesgo de sufrir enfermedades coronarias.
El aceite de oliva virgen extra (EVOO) es definido por el Consejo Internacional
Oleícola (IOC) como aquel aceite obtenido únicamente del fruto del olivo (Olea
europaea L.), la aceituna, que ha sido extraído sólo mediante procesos mecánicos o
físicos sin la utilización de disolventes o procedimientos de reesterificación y, sin que
haya sido mezclado con aceites de otra naturaleza. La acidez libre del EVOO expresada
en ácido oleico debe ser como máximo de 0,8 g por 100 g. La ausencia del proceso de
refinamiento ayuda a preservar el delicado aroma y las propiedades nutricionales y
sensoriales que lo distinguen de otros aceites comestibles (Boskou y col., 2006).
Desde el punto de vista bromatológico, la composición del aceite de oliva puede
dividirse en dos fracciones: una fracción mayoritaria, denominada saponificable que
representa el 98-99% del peso total del aceite, y otra fracción minoritaria o
insaponificable que alcanza sobre el 2% del peso del aceite de oliva. Entre los
constituyentes de la fracción saponificable están los triglicéridos, componente principal
del aceite de oliva, diglicéridos, monoglicéridos y ácidos grasos libres (Andrews y col.,
2003). La fracción insaponificable incluye una gran variedad de compuestos químicos
tales como fosfolípidos, ceras, esteroles libres, tocoferoles, clorofilas y carotenoides; sin
embargo, lo que diferencia al EVOO de otros aceites comestibles son, en términos de
composición, los compuestos minoritarios fenólicos y volátiles (Carrasco-Pancorbo y
col., 2005; Bendini y col., 2007).
Los compuestos fenólicos poseen propiedades antioxidantes muy importantes
jugando un papel principal en la aterogénesis y cáncer (Muniz, 2007), también
contribuyen a las propiedades organolépticas del aceite de oliva virgen extra
relacionándose principalmente con la astringencia y el sabor amargo (Servili y
REVISIÓN BIBLIOGRÁFICA
32
Montedoro, 2002; Siliani y col., 2006; Beltrán y col., 2007). Estos atributos pueden
permanecer en boca mucho tiempo después de la deglución pudiendo afectar a su
aceptación por parte de los consumidores (Caporale y col., 2006). Por otro lado, los
compuestos volátiles han sido relacionados con el aroma del aceite de oliva virgen extra
(Cerretani y col., 2008).
Las propiedades organolépticas, nutricionales, culinarias y saludables han
motivado la compra y consumición del aceite de oliva virgen extra, cumpliendo las
expectativas tanto de los consumidores más expertos como de aquellos que se inician en
el consumo un alimento más saludable, nutritivo y natural (Delgado y col., 2011). La
tendencia en los últimos años ha sido elaborar productos con menor contenido en
grasas, sin embargo, los consumidores son reacios a aceptar productos alimenticios con
propiedades texturales y de sabor diferentes a aquellos productos tradicionales (Nagar y
col., 2002). Por tanto, las demandas de los consumidores y de la industria alimenticia
han generado un interés creciente por alimentos con reducido contenido en colesterol
pero sin defectos sensoriales. En ocasiones, el EVOO ha sido utilizado para sustituir
otras grasas vegetales como la margarina en la elaboración de pasteles (Matsakidou y
col., 2010) estudiando su efecto sobre la dureza y la cohesividad. También se ha
utilizado para sustituir parcial o totalmente la grasa animal en productos tales como
“salami”, estudiándose el efecto de dicha sustitución sobre la calidad química, física y
sensorial (Severini y col., 2003), y aunque la textura de este alimento sufrió
modificaciones, el producto resultante fue más saludable. Asimismo, se reportó que el
uso de aceite de oliva en productos cárnicos para reemplazar la grasa animal puede ser
beneficioso para la salud. Por otro lado, el aceite de oliva virgen extra ha sido añadido a
productos vegetales, como purés de tomate y judías (Dinnella y col., 2012). Además, se
REVISIÓN BIBLIOGRÁFICA
33
han realizado estudios sobre la aceptabilidad del maíz sometido a un proceso de fritura
con EVOO (Ryan y col., 2008).
3.2.3 AISLADO DE PROTEÍNA DE SOJA
Las proteínas son los ingredientes funcionales tecnológicos más importantes ya
que poseen un amplio rango de propiedades funcionales dinámicas (sensoriales,
kinestésicas, hidratantes, superficiales, reológicas y texturales) que pueden mostrar una
versatilidad durante el procesado de los alimentos y mejorar los atributos de calidad de
los mismos (Torrezan y col., 2007).
La proteína de soja es una fuente importante de proteínas vegetales que posee bajo
contenido en grasa y un alto valor nutricional, además, debido a su bajo coste
económico, es la proteína vegetal predominantemente disponible en los mercados de
todo el mundo (Molina y col., 2002).
Durante siglos los productos que contienen soja han sido la fuente principal de
proteínas vegetales en la dieta de los países orientales. Recientemente, el consumo de
alimentos de soja ha aumentado de forma considerable como consecuencia de la
atribución de beneficios nutricionales y sobre la salud humana, originados por una
presencia equilibrada de todos los aminoácidos esenciales y un alto contenido en lisina.
Friedman y Brandon (2001), publicaron que la consumición de soja previene
enfermedades tales como el cáncer y la osteoporosis (Herrero y col., 2008). Asimismo,
la Administración de Alimentos y Medicamentos del Departamento de Salud y
Servicios Humanos de los Estados Unidos (US Federal Drug Administration (FDA))
aprobó una declaración de propiedades saludables de la proteína de soja referentes a la
reducción sobre el riesgo de padecer enfermedades coronarias (Stewart, 2005).
REVISIÓN BIBLIOGRÁFICA
34
Desde el punto de vista de desarrollo de productos, la proteína de soja ha sido
utilizada en un amplio rango de alimentos debido a sus propiedades funcionales que
mejoran la calidad de los productos alimenticios y, que hacen que la proteína de soja sea
la proteína vegetal más utilizada en la industria alimenticia. Las propiedades funcionales
más relevantes son la gelatinización, emulsión, solubilidad, espesante y capacidad de
retener agua (Tseng y col., 2008; Liu y Kuo, 2010).
El aislado de proteína de soja (SPI) es la forma más refinada de la proteína de soja
con un contenido mínimo en soja del 90%. El SPI está compuesto por dos fracciones
proteicas globulares: 7S (β-conglicina) y 11S (glicina). El comportamiento funcional del
SPI depende, fundamentalmente, del grado de desnaturalización, disociación y
agregación de las dos subunidades así como del ratio (p/p) de esas dos fracciones
proteicas (Tseng y col., 2009).
Los diferentes tratamientos aplicados durante la extracción y/o procesado del SPI
causan cambios físicos y químicos en la proteína (Puppo y col., 2000). Esas
modificaciones son las que hacen que el aislado de proteína de soja se haya convertido
en un ingrediente alimenticio muy versátil que puede mejorar las características
organolépticas y el valor nutricional de los productos alimenticios a los que se añaden
(Tseng y col., 2009). Sistemas alimenticos tales como tofu, pasta, productos horneados,
alimentos infantiles, bebidas y productos cárnicos, son algunos de los productos a los
que se ha añadido SPI (Riaz, 2006; Hagenimana y col., 2007).
Así mismo, la adición de aislado de proteína de soja ha sido investigada en
yogurts (Drake y col., 2002), helados (Friedeck y col., 2003), leche de soja (Chambers
IV y col., 2006), carne (Youssef y Barbut, 2011) y geles de uva para confitería
(Siegwein y col., 2011).
REVISIÓN BIBLIOGRÁFICA
35
3.3 IMPORTANCIA DE LA TEXTURA Y LA REOLOGÍA EN EL PURÉ DE
PATATA.
La mayoría de alimentos entre los que se encuentra el puré de patata no pueden
clasificarse dentro del comportamiento típico de un líquido (viscosidad) ni de un sólido
(elasticidad), ya que presentan un comportamiento viscoelástico, es decir, que presentan
componentes de ambos comportamientos. El estudio de las propiedades viscoelásticas
de los alimentos en términos de propiedades físicas bien definidas puede ser útil para
caracterizar su textura y relacionarla con la estructura interna.
La textura de los alimentos es uno de los atributos primarios directamente
relacionado con su calidad sensorial y además es determinante de la aceptabilidad de los
alimentos por parte del consumidor (Fernández, 2008; Arocas, 2011).
La textura se define como “conjunto de propiedades reológicas y de estructura
(geométricas y de superficie) de un producto, perceptibles por los mecanoreceptores, los
receptores táctiles y en ciertos casos, por los visuales y auditivos” (UNE 2010, ISO
5492). Szczesniak (2002) define la textura como “una manifestación sensorial y
funcional de las propiedades estructurales, mecánicas y de superficie de los alimentos
detectada mediante los sentidos de la vista, oído, tacto y kinestésicos”.
Debido al carácter multidimensional y complejo de la textura, ha sido adoptado el
término “propiedades texturales” que implica un espectro bastante más amplio de
parámetros. Las propiedades texturales de un alimento están determinadas por las
características físicas de los elementos estructurales del material y se relacionan con la
respuesta a la deformación, modo de desintegración y flujo por la aplicación de una
fuerza (Arocas, 2011). El acto habitual de comer puede considerarse como un acto de
rotura, deformación y desintegración del alimento en la boca, por lo que el estudio de
REVISIÓN BIBLIOGRÁFICA
36
las propiedades reológicas de los alimentos cuando son sometidos a determinadas
fuerzas se puede llegar a relacionar con la textura percibida, considerada como un factor
principal de la calidad (Bourne, 1982; Arocas, 2011).
Por su parte, la reología permite determinar mediante métodos instrumentales una
serie de parámetros objetivos directamente relacionados con las características
sensoriales y subjetivas que definen la textura de un alimento. Por tanto, mediante el
estudio de los parámetros reológicos de los alimentos se puede llegar a una valoración
objetiva de su textura. Puesto que la textura engloba todas las propiedades mecánicas o
parámetros reológicos perceptibles por los sentidos y pueden ser medidos mediante
métodos objetivos instrumentales, es razonable que se apliquen dichos métodos para
obtener rápidamente resultados precisos y reproducibles. No obstante, mediante la
evaluación sensorial el ser humano es capaz de percibir, describir, cuantificar e integrar
la totalidad de la textura, abarcando parámetros mecánicos, geométricos y de superficie,
por lo que sería lógico pensar que el método más adecuado para su evaluación sea el
análisis sensorial (Fernández, 2008).
Está claro que existe una relación estrecha entre el comportamiento reológico de
los alimentos y su textura, por lo que el área de la tecnología de los alimentos ha
dirigido durante bastante tiempo su interés hacia el desarrollo de métodos objetivos
instrumentales para la medida de la textura (Pons y Fiszman, 1996). Entre los métodos
que se han utilizado en la presente Tesis Doctoral se encuentran la penetración cónica,
la extrusión inversa, los ensayos reológicos dinámicos y el análisis de perfil de textura.
Llegados a este punto, no cabe la menor duda sobre el hecho de que una clara
comprensión de las propiedades reológicas y texturales de un alimento es fundamental
en la investigación y desarrollo de nuevos productos (Steffe, 1996). Además, es muy
REVISIÓN BIBLIOGRÁFICA
37
importante poder correlacionar estas propiedades instrumentales de la textura con
aquellas derivadas de la evaluación sensorial.
Las propiedades texturales y reológicas tienen una gran influencia sobre la
preferencia y aceptación de los alimentos por los consumidores (Szczesnik y col., 1971;
Szczesniak, 2002; Bourne, 2002), siendo especialmente importantes en el caso de los
productos de patata recién elaborados y procesados (Fernández, 2008).
En el presente trabajo de investigación se ha optimizado la formulación del puré
de patata mediante la adición de ingredientes funcionales mejorando así el valor
nutricional de este producto alimenticio. Sin embargo, estos ingredientes afectan la
textura del producto elaborado, por lo que el estudio de este atributo es fundamental
para la obtención de un nuevo producto con una calidad final que garantice su
aceptabilidad por parte del consumidor.
3.4 SITUACIÓN ACTUAL DEL ANÁLISIS SENSORIAL DESCRIPTIVO.
El análisis sensorial descriptivo es la herramienta más sofisticada y ampliamente
utilizada entre todas las metodologías de las que disponen los profesionales sensoriales
cuando se comparan con los métodos de aceptación y discriminación (Stone y Sidel,
2004; Varela y Ares, 2012).
Según Stone y Sidel (2004), el análisis descriptivo es una metodología sensorial
que proporciona descripciones cuantitativas de los productos basados en las
percepciones de un grupo de sujetos cualificados. Todos los métodos de análisis
descriptivo implican la detección (discriminación) y descripción de aspectos sensoriales
tanto cualitativos como cuantitativos de un producto. El número de jueces que
normalmente participan en un ensayo descriptivo se sitúa entre ocho y veinte. La
REVISIÓN BIBLIOGRÁFICA
38
cualificación de dichos jueces implica una serie de etapas, de entre ellas puede
considerarse más importante aquella que consiste en desarrollar un procedimiento de
evaluación consensuado para determinar qué características sensoriales han de ser
evaluadas y cómo debe realizarse dicha evaluación. Por otro lado, el rendimiento del
panel debe ser controlado periódicamente en términos de poder de discriminación,
acuerdo existente entre los miembros del panel y reproducibilidad para lograr resultados
precisos y fiables (Valentín y col., 2012), además de detallados y consistentes en el
tiempo (Moussaoui y Varela, 2010).
Desde el punto de vista de desarrollo de productos, la información descriptiva es
esencial para centrarse en aquellas características identificadas como diferentes y poder
establecer relaciones causales entre esas propiedades diferentes y el cambio o
modificación de ingredientes o variables en el procesado del producto (Stone y Sidel,
2004). Este es uno de motivos por los que el perfil descriptivo de un producto se ha
venido realizando de manera rutinaria por las industrias alimenticias para definir y
cuantificar aquellas características sensoriales en las que los productos se diferencian;
esta información tiene aplicaciones tales como la mejora y desarrollo de un producto, el
control de calidad (Stone y Sidel, 1993; Lawless y Heymann, 2010), comprender las
preferencias de consumidores (Greenhoff y MacFie, 1994) y relacionar esta información
con datos obtenidos a partir de análisis instrumentales (Lee y col., 1999).
El análisis sensorial descriptivo convencional proporciona datos de muy buena
calidad pero como contrapartida requiere de un extenso entrenamiento de los jueces en
relación al vocabulario utilizado, antes de que estos puedan participar en un estudio
como instrumento sensorial fidedigno. Además, debido a que el vocabulario y el
entrenamiento han de ser adaptados a cada producto evaluado, para completar este
análisis pueden requerirse desde semanas a meses (Valentín y col., 2012). Esto hace que
REVISIÓN BIBLIOGRÁFICA
39
las metodologías convencionales sean especialmente tediosas y complicadas de realizar.
En empresas pequeñas este proceso conlleva un elevado gasto económico que a menudo
no pueden sostener. Por el contrario, en las grandes empresas, capaces de acometer
dicho gasto, surgen otros problemas como es la necesidad de invertir mucho tiempo ya
que estas empresas a veces ofrecen un amplio rango de productos que requieren del
trabajo paralelo de varios paneles. Además, la etapa de entrenamiento, que
generalmente es bastante extensa, se consolida como otra gran desventaja para las
empresas que quieren ofrecer una rápida respuesta en los mercados (Murray y col.,
2001; Lawless y Heymann, 2010).
Por todas las vicisitudes mencionadas, es obvia la necesidad de métodos
descriptivos más rápidos, efectivos, con menores costes económicos y más flexibles, de
forma que se agilice la descripción sensorial de cada alimento nuevo que aparecerá en el
mercado.
Como respuesta a estas demandas, en los últimos años se han desarrollado varias
metodologías alternativas a los métodos tradicionales. Estas metodologías novedosas no
requieren de fase de entrenamiento, pudiendo ser realizadas por sujetos con diferentes
niveles de especialización que van desde jueces semientrenados hasta consumidores sin
ningún tipo de experiencia en análisis sensorial, y que están resultando exitosos dado
que son capaces de generar mapas sensoriales muy similares a aquellos obtenidos
mediante la participación de jueces altamente entrenados (Varela y Ares, 2012). Estos
métodos novedosos ofrecen a los miembros del panel la oportunidad de seleccionar sus
propios atributos que identificarán características menos técnicas y más similares a las
que un consumidor identificaría.
De esa manera, la información obtenida sobre la percepción que estos sujetos
tienen de las características sensoriales de interés es más realista y fiable. Esta cuestión
REVISIÓN BIBLIOGRÁFICA
40
es particularmente importante para las empresas dedicadas a la alimentación ya que
pueden lanzar al mercado productos que se corresponden con las percepciones y
preferencias de los consumidores (Faye y col., 2006).
Tanto Husson y colaboradores (2001) como Worch y colaboradores (2010) han
aconsejado que la utilización de estos métodos nuevos con la participación de
consumidores es una buena alternativa a los métodos convencionales. Según estos
autores, los perfiles sensoriales obtenidos con consumidores cumplen los requisitos de
discriminación y reproducibilidad necesarios, siendo una alternativa interesante cuando
las empresas tienen dificultades para utilizar paneles de jueces entrenados. Sin embargo,
es importante enfatizar el hecho de que estos métodos más recientes no pueden ser
considerados como sustitutivos de los métodos clásicos, ya que estos últimos son más
exactos debido al extensivo entrenamiento que reciben los jueces; por lo tanto, los
métodos nuevos han emergido más como un complemento a los métodos clásicos que
como una sustitución.
El perfil sensorial de un alimento orienta a los participantes implicados en el
desarrollo del mismo para poder realizar cambios que mejoren el producto,
aproximándolo al perfil deseado por los consumidores. Por tanto, el conocimiento de la
“composición deseada” de un producto permite la optimización del mismo y, por otro
lado, son muy deseables en las industrias los modelos validados que relacionen las
medidas sensoriales con las instrumentales (Murray y col., 2001).
Considerando todo lo mencionado, es vital que continúe la investigación sobre el
análisis sensorial descriptivo, focalizando las ideas en los métodos más novedosos con
la finalidad de que cambien las ideas tradicionales y se asegure un potencial óptimo de
esta herramienta en el futuro.
REVISIÓN BIBLIOGRÁFICA
41
3.4.1 PERFIL DE TEXTURA.
El método de Perfil de Textura fue desarrollado en los años sesenta por General
Foods Corporation con el objetivo de definir los parámetros texturales de los alimentos
(Skinner, 1988).
En un principio, Szczesniak (1963) desarrolló un sistema de clasificación de la
textura el cual pretendía acercar la disparidad existente entre la terminología textural
utilizada por los expertos y la utilizada por los consumidores, clasificando la textura
percibida en tres grupos de características: mecánicas, geométricas y otras.
Posteriormente, este método fue ampliado por Civille y Szczesniak (1973) y
Civille y Liska (1975) para considerar atributos específicos que describen productos
concretos, incluyendo alimentos semisólidos, bebidas y otros productos no alimenticios.
El Perfil de Textura pretende describir la textura desde el primer bocado hasta la
masticación completa del alimento considerando aspectos temporales de los atributos
(Brandt y col., 1963).
Según Stone y Sidel (2004), este método representó avances en el análisis
descriptivo desde un punto de vista estructural, es decir, en el desarrollo de la
terminología descriptiva, las escalas para registrar las intensidades y las palabras o
productos utilizados como extremos en cada categoría de la escala.
El objetivo de este método era eliminar los problemas derivados de la alta
variabilidad individual de los sujetos participantes en el mismo, permitir la comparación
directa de los resultados con materiales conocidos y proporcionar una correlación
elevada con las medidas instrumentales (Szczesniak, 1963).
Los panelistas son seleccionados en base a su habilidad para discriminar las
diferencias de textura en productos específicos conocidos para los que el panel se
entrena (alimentos sólidos, semisólidos, bebidas, etc.) (Meilgaard y col., 2007). Estos
REVISIÓN BIBLIOGRÁFICA
42
últimos autores señalaron que para el entrenamiento, los panelistas evalúan una amplia
variedad de productos de la misma categoría que el producto objeto de estudio, con la
finalidad de proporcionar un amplio marco de referencia. Los panelistas definen todos
los términos y todos los procedimientos para la evaluación, reduciéndose así la
variabilidad encontrada en la mayoría de los análisis descriptivos.
La principal ventaja del Pefil de Textura es que a los panelistas se les enseñan los
principios subyacentes de la textura, y esta experiencia de aprendizaje permite a los
jueces evitar tediosas discusiones sobre términos redundantes y seleccionar los términos
más apropiados técnicamente y más descriptivos para la evaluación de los productos
(Meilgaard y col., 2007).
Un entrenamiento del panel tan extenso podría considerarse como una desventaja,
sin embargo Otremba y colaboradores (2000) señalaron que conduce a una mayor
coherencia y precisión por parte del panel.
3.4.2 ANÁLISIS CUANTITATIVO DESCRIPTIVO (QDA)
El análisis cuantitativo descriptivo fue desarrollado en el Departamento de
Ciencia de los Alimentos de la Universidad de California en Davis. Según Murray y
colaboradores (2001), el análisis cuantitativo descriptivo fue desarrollado durante los
años 70 para tratar de subsanar en parte algunos de los problemas asociados con el
Perfil de Textura (Stone y col., 1974; Stone y Sidel, 1993). Con frecuencia, los sujetos
que participan en el análisis cuantitativo descriptivo (en inglés, Quantitative Descriptive
Analysis, QDA) son previamente seleccionados de entre un grupo numeroso de
candidatos, mediante cuestionarios dietéticos y los propios productos objeto de estudio,
entendiéndose que los individuos que son consumidores frecuentes de dichos productos
son más sensibles a las diferencias entre los mismos, y por tanto, más discriminativos
REVISIÓN BIBLIOGRÁFICA
43
(Sawyer, 1962). El entrenamiento de los paneles para la evaluación sensorial mediante
el método cuantitativo descriptivo requiere el uso de productos e ingredientes que sirven
como referencia, al igual que se hace cuando se aplican otros métodos descriptivos, lo
que ayuda a estimular la generación de terminología. Es importante tener en cuenta que
el proceso para el desarrollo de vocabulario tiene que ser consistente aunque los
panelistas son libres para desarrollar sus propios términos que posteriormente utilizarán
para puntuar las muestras.
El método cuantitativo descriptivo está basado en el principio de habilidad de los
panelistas para verbalizar las percepciones de un producto de una manera fidedigna; los
jueces son seleccionados y entrenados en el reconocimiento de atributos y su posterior
clasificación utilizando un lenguaje sensorial común y consensuado. Más tarde, los
jueces puntúan los productos para obtener una descripción cuantitativa completa del
producto en estudio (ASTM, 1992).
De cualquier manera, el lenguaje utilizado en este método no es técnico, sino más
bien un lenguaje cotidiano, aunque los panelistas requieren de un cierto nivel de práctica
para comprender el significado de los atributos. El análisis cuantitativo descriptivo
asume que los jueces usarán diferentes partes de la escala para evaluar los atributos de
los productos. Los diseños del análisis descriptivo están basados en medidas repetidas.
Una limitación del QDA es que es difícil comparar resultados entre paneles, entre
laboratorios y espacios de tiempo diferentes (Murray y col., 2001). Por el contrario, el
entrenamiento de los jueces para la aplicación de este método tiene una duración más
breve que el requerido por otros métodos.
El análisis cuantitativo descriptivo ha supuesto un cambio significativo en la
forma en la que los científicos sensoriales y los usuarios del análisis sensorial abordan
la metodología descriptiva, gracias al uso de una escala gráfica que reduce el sesgo
REVISIÓN BIBLIOGRÁFICA
44
originado cuando se utilizan números en la clasificación, el tratamiento estadístico de
los datos, la separación de los panelistas durante la evaluación y el enfoque gráfico que
se utiliza para presentar los resultados.
3.4.3 FLASH PROFILE
El método Flash Profile (FP) fue sugerido para la descripción sensorial por Dairou
y Sieffermann (2002), quienes lo definieron como una combinación original de la
selección de términos mediante libre elección, junto con el método de ordenación
basado en la presentación simultánea de todo el conjunto de productos estudiados.
En la práctica, las muestras codificadas son presentadas todas juntas a los jueces.
En un primer paso, los panelistas tiene que analizarlas de forma comparativa con el
objetivo de generar todos los descriptores que ellos consideren apropiados para la
discriminación posterior de las muestras. En una segunda etapa, y para cada atributo
generado, ellos ordenan todas las muestras de “poco” a “mucho”, de forma que los
empates entre las muestras están también permitidos. Como en un perfil de libre
elección, cada juez genera su propio conjunto de atributos de forma individual, los
cuales tienen que ser lo suficientemente discriminantes como para permitir la
ordenación de las muestras. En este método no se indica a los panelistas el número de
atributos que deben generar (Dairou y Sieffermann, 2002; Delarue y Sieffermann, 2004;
Lassoued y col., 2008; Moussaoui y Varela, 2010); sin embargo, sí son instruidos para
que eviten utilizar términos hedónicos.
La comparación simultánea de todas las muestras permite una mejor
discriminación del producto. Además, cuando las muestras analizadas pertenecen a la
misma o similar categoría de producto, el FP puede ser más discriminativo que el perfil
convencional (Mazzucheli y Guinard, 1999; Delarue y Sieffermann, 2004).
REVISIÓN BIBLIOGRÁFICA
45
Entre las ventajas del Flash Profile destaca la de ser una herramienta rápida de
mapeo sensorial, ser fácil de comprender por los panelistas, ser apropiada para
aplicaciones en las que es necesaria una respuesta rápida, así como ser una herramienta
inicial de búsqueda para un nuevo conjunto o categoría de productos y para estudiar un
mercado específico (Dairou y Sieffermann, 2002; Delarue y Sieffermann, 2004; Tarea y
col., 2007).
Una limitación del FP, siendo un método comparativo, es que el número de
muestras que pueden ser evaluadas es limitado, y esto podría depender de la categoría
de producto. Otra desventaja del Flash Profile es que cada juez crea su propia lista de
atributos, y por lo tanto la interpretación semántica puede ser compleja (Dairou y
Sieffermann, 2002; Veinand y col., 2011). Sin embargo, se ha probado que incluso
aunque este método genera una gran cantidad de atributos diferentes, los más
importantes o principales para la descripción de un conjunto de muestras están bien
representados cuando se utiliza el FP, incluso cuando los consumidores hablan
diferentes idiomas, lo que hace que este método sea especialmente idóneo para
establecer comparaciones entre los resultados de diferentes países (Moussaoui y Varela,
2010).
Flash Profile ha sido utilizado para la descripción de diversos productos
alimenticios como mermeladas de frutos rojos (Dairou y Sieffermann, 2002), productos
lácteos de fruta (Delarue y Sieffermann, 2004), purés comerciales de manzanas y peras
(Tarea y col., 2007), pan (Lassoued y col., 2008), bebidas calientes (Moussaoui y
Varela, 2010), cuajada (Gómez Alvarado y col., 2010), tés fríos de limón (Veinand y
col., 2011) y nuggets de pescado (Albert y col., 2011).
REVISIÓN BIBLIOGRÁFICA
46
3.4.4 PROJECTIVE MAPPING & NAPPING®
Projective Mapping (PM), y su variante Napping®, son métodos de perfil que han
sido desarrollados al objeto de reunir una configuración Euclidiana para cada juez en
una única sesión sensorial (Pagès, 2005). Estos métodos fueron originalmente derivados
de la psicología y previamente utilizados en investigaciones cualitativas de mercado
para obtener asociaciones entre productos (Risvik y col., 1994; Pagès, 2005). PM fue
propuesto para utilizarlo con consumidores, y junto con los resultados de un panel
entrenado explicar la descripción del producto (Risvik y col., 1994).
Las muestras son simultáneamente presentadas a los panelistas, para ser
posicionadas por cada juez en un espacio bidimensional como un “mantel” (la palabra
“nappe” en francés, da origen al nombre Napping) o más a menudo en un folio A4 o A3
en blanco. Las muestras son colocadas por los participantes según las diferencias y
similitudes entre ellas, de tal forma que cuánto más pequeña es la distancia que separa
dos muestras, más similares son estas muestras (Perrin y col., 2008). El criterio para el
posicionamiento de las muestras y su importancia son elegidas de forma individual por
cada juez, lo que hace del Projective Mapping un procedimiento flexible y espontáneo
(Moussaoui y Varela, 2010). El procesado simultáneo de todas estas configuraciones
proporciona un resultado gráfico de todos los productos en el que dos productos están
cercanos si ellos son percibidos de forma similar por todo el panel de jueces (Pagès,
2005).
Después del posicionamiento de las muestras, a veces se realiza un método
conocido como Ultra Flash Profiling (Pagès, 2003; Perrin y col., 2008) que consiste en
que los participantes en un Projective Mapping deben escribir directamente en el folio
A3 o A4 los atributos que motivaron el posicionamiento de las muestras; de esta manera
se obtiene una descripción de las diferencias y similitudes entre ellas.
REVISIÓN BIBLIOGRÁFICA
47
Mediante el análisis estadístico multivariante de los datos, todos los mapas
individuales son reunidos en una configuración consenso que junto con los comentarios
o atributos generados podrían determinar el perfil sensorial del conjunto de muestras en
términos de distancias y descripciones percibidas por el grupo de jueces.
Napping® es un método flexible que todavía hoy se está desarrollando para
adaptarlo a diferentes objetivos dependiendo de la complejidad de los productos objeto
de análisis. Está basado en la percepción global de las diferencias de un grupo de
muestras, y puede considerarse como una forma natural e intuitiva de describir los
productos por parte de los consumidores y que además es más cercana a lo que ocurre
en el mercado real (Ares y col., 2011; Carrillo y col., 2012).
Napping® presenta la ventaja de ser bastante comprensible y fácil de realizar para
los consumidores. Risvik y colaboradores (1997) incluso sugirieron la viabilidad de
utilizarlo con niños dada la posibilidad de convertir el método en un juego. Sin
embargo, Ares y colaboradores (2011) señalaron que para los consumidores noveles
otras técnicas asimismo novedosas pueden resultar más fáciles de comprender y de
llevarse a cabo que el propio Napping®.
Una desventaja del Napping es la limitación en el número de productos que
pueden ser evaluados al mismo tiempo, y aunque va a depender mucho de las
características sensoriales del producto, generalmente el máximo es de doce (Pagès,
2005). Otras limitaciones son la reproducibilidad, validación y robustez de los
resultados que, como en la mayoría de las técnicas noveles, no se han estudiado todavía
con suficiente detalle (Varela y Ares, 2012).
Esta metodología se ha aplicado para la evaluación sensorial de diversos
productos alimenticios como sopas comerciales deshidratadas (Risvik y col., 1994),
queso de leche de oveja (Bárcenas y col., 2004), zumo de cítricos (Nestrud y Lawless,
REVISIÓN BIBLIOGRÁFICA
48
2008), chocolate (Kennedy y col., 2009), barritas (King y col., 1998; Kennedy, 2010),
vinos (Perrin y Pagès, 2009), bebidas calientes (Moussaoui y Varela, 2010), manzana y
queso (Nestrud y Lawless, 2010), postres lácteos (Ares y col., 2010), bebidas en polvo
(Ares y col., 2011) y nuggets de pescado (Albert y col., 2011).
3.5 REFERENCIAS BIBLIOGRÁFICAS
Abdelrahim, K.A., Ramaswamy, H.S. y van de Voort, F.R. (1995). Rheological
properties of starch solutions under aseptic processing temperatures. Food Research
International, 28, 473-480
Aberle, T., Burchard, W., Vorwerg, W. y Radosta, S. (1994). Conformational
contributions of amylase and amylopectin to the structural-properties of starches from
various sources. Starch-Starke, 46 (9), 329-335
Achayuthakan, P. y Suphantharika, M. (2008). Pasting and rheological properties of
waxy corn starch as affected by GG and xanthan gum. Carbohydrate Polymers, 71 (1),
9-17
Albert, A., Perez-Munuera, I., Quiles, A., Salvador, A., Fiszman, S.M. y Hernando,
I. (2009). Adhesion in fried battered nuggets: performance of different Hydrocolloids as
predusts using three cooking procedures. Food Hydrocolloids, 23, 1443-1448
Albert, A. (2011). Diseño de alimentos precocinados rebozados para microondas.
Desarrollo de metodologías instrumentales y sensoriales. Tesis Doctoral. Instituto de
Agroquímica y Tecnología de alimentos (IATA-CSIC), Universidad Politécnica de
Valencia.
REVISIÓN BIBLIOGRÁFICA
49
Albert, A., Varela, P., Salvador, A., Hough, G., and Fiszman, S. (2011). Overcoming
the issues in the sensory description of hot served food with a complex texture.
Applications of QDA®, flash profiling and projective mapping using panels with
different degrees of training. Food Quality and Preference, 22, 463-473
Alvarez, D. y Barbut, S. (2013). Effect of inulin, beta-Glucan and their mixtures on
emulsion stability color and textural parameters of cooked meat batters. Meat science,
94, 320-327
Álvarez, M.D. (1996). Caracterización reológica de tejidos de patata tratados
térmicamente. Cinéticas de ablandamiento. Tesis Doctoral. Escuela Técnica Superior de
Ingenieros Agrónomos, Universidad Politécnica de Madrid.
Álvarez, M.D., Fernández, C. y Canet, W. (2011). Effect of cryoprotectant mixtures
on rheological properties of fresh and frozen/thawed mashed potatoes. Journal of Food
Process Engineering, 34(2), 224-250
Álvarez, M.D., Jiménez, M.J., Olivares, M.D., Barrios, L. y Canet, W. (2012).
Texture perception determined by soy protein isolate and inulin addition in potato
puree: links with mechanical and microstructural features. Journal of Texture Studies,
43, 361-374
Andrews, P., Busch, J-L-H-C, De Joode, T., Groenewegen, A. y Alexandre, H.
(2003). Sensory properties of virgin olive oil polyphenols: identification of deacetoxy-
ligstroside aglycon as key contributor to pungency. Journal of Agriculture and Food
Chemistry, 51, 1415-1420
REVISIÓN BIBLIOGRÁFICA
50
Ares, G., Deliza, R., Barreiro, C., Gimenez, A. y Gámbaro, A. (2010). Comparison
of two sensory profiling techniques based on consumer perception. Food Quality and
Preference, 21, 417-426
Ares, G., Varela, P., Rado, G. y Gimenez, A. (2011). Are consumer profiling
techniques equivalent for some product categories? The case of orange-flavoured
powdered drinks. International Journal of Food Science and Technology, 46, 1600-
1608
Arltoft, D.; Madsen, F. y Ipsen, R. (2008). Relating the microstructure pectin and
carrageenan in dairy desserts to rheological and sensory characteristics. Food
Hydrocolloids, 22(4), 660-673
Arocas, A., Sanz, T., Salvador, A., Varela, P., y Fiszman, S.M. (2010). Sensory
properties determined by starch type in White sauces. Effects of freeze/thaw and
Hydrocolloids addition. Journal of Food Science, 75(2), S132-S140
Arocas, D. (2011). Efectos del procesamiento, congelación y recalentamiento en la
calidad de salsas blancas elaboradas con distintos almidones. Tesis Doctoral. Instituto
de Agroquímica y Tecnología de alimentos (IATA-CSIC), Universidad Politécnica de
Valencia.
ASTM. (1992). Quantitative descriptive analysis (QDA). ASTM digital library, doi:
10.1520/MNL10523M
Autio, K., Vesterinen, E. y Stolt, M. (2002). Rheological properties of mixed starch-
kappa-carrageenan gels in relation to enzymatic digestibility. Food Hydrocolloids,
16(2), 169-174
REVISIÓN BIBLIOGRÁFICA
51
Bárcenas, P., Pérez Elortondo, F.J. y Albisu, M. (2004). Projective mapping in
sensory analysis of ewes milk cheeses: a study on consumers and trained panel
performance. Food Research International, 37, 723-729
Bayarri, S., González-Tomás, L., Hernando, I., Lluch, M.A. y Costell, E. (2011).
Texture perceived on inulin-enriched low-fat semisolid dairy desserts. Rheological and
structural basis. Journal of Texture Studies, 42, 174-184
Beltrán, G., Ruano, M.T., Jiménez, A., Uceda, M., y Aguilera, M.P. (2007).
Evaluation of virgin olive oil bitterness by total phenol content analysis. European
Journal of Lipid Science and Technology, 109, 193-197
Bendini, A., Cerretani, L., Carrasco-Pancorbo, A., Gómez-Caravaca, A.M.,
Segura-Carretero, A., Fernández-Gutiérrez, A. y Lercker, G. (2007). Phenolic
molecules in virgin olive oils: a survey of their sensory properties, health effects,
antioxidant activity and analytical methods. An overview of the last decade. Molecules,
12, 1679-1719
Bolenz, S., Amtsberg, K. y Schape, R. (2006). The broader usage of sugars and fillers
in milk chocolate made possible by the new EC cocoa directive. International Journal
of Food Science and Technology, 41, 45-55
Bolliger, S., Wildmoser, H., Goff, H.D. y Tharp, B.W. (2000). Relationship between
ice cream mix viscoelasticity and ice crystal growth in ice cream. International Dairy
Journal, 10, 791-797.
REVISIÓN BIBLIOGRÁFICA
52
Boscou, D. y Visioli, F. (2003). Biophenols in olive oil and olives. En Bioavailability of
Micronutrients and Minor Dietary Compounds. Metabolic and Technological Aspects.
Ed por: Vaquero, M.P., Garcia-Arias, T., Carbajal, A. y Sanchez-Muniz, F.J., Research
Signpost, Kerala, India, pp 161-169
Boskou, D., Blekas, G. y Tsimidou, M. (2006). Olive oil composition. In Olive oil:
Chemistry and Technology, Vol. 4. Ed por: Boskou, D. Champaign: AOCS Press, pp.
41-72
Bot, A., Erle, U., Vreeker, R. y Agterof, W.G.M. (2004). Influence of crystallization
conditions on the large deformation rheology of inulin gels. Food Hydrocolloids, 18,
547-556
Bourne, M.C. (1982). Texture, viscosity and foods. En Food Texture and Viscosity.
Academic Press. Nueva York, pp. 1-23
Bourne, M.C. (2002). Food texture and viscosity: Concept and measurement (2nd Ed.)
Academic Press, San Diego, pp. 3-6
Brandt, M.A., Skinner, E.Z. y Coleman, J.A. (1963). Texture profile method. Journal
of Food Science, 28, 404-409
Brennan, C.S., Kun, V. y Tudorica, C.M. (2004). Inulin enriched pasta: effects on
textural properties and starch degradation. Food Chemistry, 86, 189-193
Brennan, C.S. y Tudorica, C.M. (2008). Carbohydrate-based fat replacers in the
modification of the rheological, textural and sensory quality of yoghurt: comparative
study of the utilisation of barley beta-glucan, guar gum and inulin. International
Journal of Food Science and Technology, 43, 824-833
REVISIÓN BIBLIOGRÁFICA
53
Canet, W. (2001). Caracterización reológica y optimización de la textura de purés
vegetales congelados. Efecto y especificaciones del proceso, conservación y
preparación final. Proyecto AGL 2001-2290.
Canet, W., Fernández, C. y Álvarez, M.D. (2011). Functionality of amidated low
methoxyl pectin and xanthan gum blends on the texture and color of mashed potatoes.
Journal of Food Process Engineering, 34(3), 746-776
Canet, W., Álvarez, M.D. y Fernández, C. (2010). Puré de patata natural congelado y
estabilizado mediante una mezcla de crioprotectores y su procedimiento de elaboración.
Patente Española de Invención ES 2 322 529 B1, 29.03.2010.
Caporale, G., Policastro, S., Carlucci A. y Monteleone, E. (2006). Consumer
expectations for sensory properties in virgin olive oil. Food Quality and Preference, 17,
116-125
Cardarelli, H.R., Buriti, F.C.A., Castro, I.A. y Saad, S.M.I. (2008). Inulin and
oligofructose improve sensory quality and increase the probiotic viable count in
potentially symbiotic petit-suisse cheese. LWT-Food Science and Technology, 41, 1037-
1046
Carrasco-Pancorbo, A., Cerretani, L., Bendini, A., Segura-Carretero, A., Gallina
Toshi, T. y Fernández-Gutiérrez, A. (2005). Analytical determination of polyphenols
in olive oils. Journal of Separation Science, 28, 837-858
Carrillo, E., Varela, P. y Fiszman, S. (2012). Packaging information as a modulator of
consumers’ perception of enriched and reduced-calorie biscuits in tasting and non-
tasting test. Food Quality and Preference, 25, 105-115
REVISIÓN BIBLIOGRÁFICA
54
Cerretani, L., Salvador, M.D., Bendini, A. y Fregapane, G. (2008). Relationship
between sensory evaluation performed by Italian and Spanish official panels and
volatile and phenolic profiles of virgin olive oil. Chemosensory Perception, 1, 258-267
Chambers IV, E., Jenkins, A. y McGuire, B.H. (2006). Flavor properties of plain soy
milk. Journal of Sensory Studies, 21, 165-179
Chiavaro, E., Vittadini, E. y Corradini, C. (2007). Physicochemical characterization
and stability of inulin gels. European Food Research and Technology, 225, 85-94
Choi, S.J. y Yoo, B. (2006). Rheological effect of gum addition to hot pepper-soybean
pastes. International Journal of Food Science and Technology, 41 (2), 56-62
Civille, G.V. y Szczesniak, A.S. (1973). Guidelines to training a texture profile panel.
Journal of Texture Studies, 4, 204-223
Civille, G.V. y Liska, I.H. (1975). Modifications and applications to foods of General
Foods sensory texture profile technique. Journal of Texture Studies, 6, 19-31
Coussement, P.A.A. (1999). Inulin and oligofructose: Safe intakes and legal status.
Journal of Nutrition, 129, 1412S-1417S
Dairou, V. y Siefferemann, J.-M. (2002). A comparison of 14 jams characterized by
conventional profile and a quick original method, flash profile. Journal of Food
Science, 67, 826-834
Da Silva, J.A.L. y Rao, M.A. (1995). Rheology of structure development in high-
methoxyl pectin/sugar systems. Food Technology, 49(10), 70-73
REVISIÓN BIBLIOGRÁFICA
55
Da Silva, J.A.L., Pedro, M.S., Oliveira, J.C. y Rao, M.A. (1997). Granule size
distribution and rheological behavior of heated modified waxy and unmodified maize
starch dispersions. Journal of Texture Studies, 28, 123-138
Delgado, C., y Guinard, J.-X. (2011). Sensory properties of californian and imported
extra virigin olive oils. Journal of Food Science, 76(3), S170-S176
Delarue, J. y Sieffermann, J.-M. (2004). Sensory mapping using Flash profile.
Comparison with a conventional descriptive method for the evaluation of the flavour of
fruit dairy products. Food Quality and Preference, 15, 383-392
Dello Staffolo, M., Bertola, N., Martino, M. y Bevilacqua, A. (2004). Influence of
dietary fiber addition on sensory and rheological properties of yogurt. International
Dairy Journal, 14, 263-268
Dickie, A.M. y Kokini, J.L. (1983). An improved model for food thickness from non-
Newtonian fluid mechanics in the mouth. Journal of Food Science, 48, 57-65
Dickinson, E. (1998). Stability and rheological implications of electrostatic milk
protein-polysaccharide interactions. Trends in Food Science and Technology, 9, 347-
354
Dinella, C., Masi, C., Zoboli, G. y Monteleone, E. (2012). Sensory functionality of
extra virgin olive oil in vegetables foods assessed by Temporal Dominance of
Sensations and Descriptive Analysis. Food Quality and Preference, 26, 141-150
Diplock, A.T., Aggett, P.A., Ashwell, M., Bornet, F., Fern EB y Roberfroid MB.
(1999). Scientific concepts of functional foods in Europe: Consensus Document. British
Journal of Nutricion, 81, 1-27.
REVISIÓN BIBLIOGRÁFICA
56
Drake, M.A., Chem, X.Q., Tamarapu, S. y Leenanon, B. (2002). Soy protein
fortification affects chemical, sensory and microbiological properties of dairy yogurts.
Journal Food Science, 65, 1244-1247
Downey, G. (2002). Quality changes in frozen and thawed, cooked purée vegetables
containing hydrocolloids, gum and dairy powders. International Journal of Food
Science and Technology, 37, 869-877
Dysseleer, P. y Hoffem, D.I. (1995). Inulin, an alternative dietary fibre. Properties and
quantitative analysis. European Journal of Clinical Nutrition, 49(3), S145-S152
Eliasson, A.C. y Kim, H.R. (1992). Changes in rheological properties of
hydroxypropyl potato starch pastes during freeze-thaw treatments (I). A rheological
approach for evaluation of freeze-thaw stability. Journal of Texture Studies, 23, 279-
295
El-Nagar, G., Cloves, G., Tudorica, C.M., Kuri, V. y Brennan, C.S. (2002).
Rheological quality and stability of yog-ice cream with added inulin. International
Journal of Dairy Technology, 55, 1-5
FAO. Http:// www.fao.org. Accedido el 28 de Agosto 2014.
Faye, P., Bremaud, D., Teillet, E., Courcoux, P., Giboreau, A. y Nicod, H. (2006).
An alternative to external preference mapping based on consumer perceptive mapping.
Food Quality and Preference, 17, 604-614
Fernández, C. (2008). Caracterización reológica y optimización de la textura de purés
de patata frescos y congelados. Efectos del procesado y adición de crioprotectores. Tesis
Doctoral. Facultad de Veterinaria. Universidad Complutense de Madrid.
REVISIÓN BIBLIOGRÁFICA
57
Flamm, G., Glinsmann, W., Kritchevsky, D., Prosky, L. y Roberfroid, M. (2001).
Inulin and oligofructose as dietary fiber: A review of the evidence. Critical Reviews in
Food Science, 41, 353-362
Foegeding, E.A., Daubert, C.R., Drake, M.A., Essick, G., Trulsson, M., Vinyard,
C.J. y Van de Velde, F. (2011). A comprehensive approach to understanding textural
properties of semi-and soft-solid foods. Journal of Texture Studies, 42, 103-129
Fogliano, V. y Vitaglione, P. (2005). Functional foods: Planning and development.
Molecular Nutrition and Food Research, 49 (3), 256-262.
Franck, A. (1993). Rafticreming: the new process allowing to turn fat into dietary fibre.
En FIE 1992 Conference proceeding. Maarssen: Expononsult Publishers, pp. 193-197
Franck, A. (2002). Technological functionality of inulin and oligofructose. British
Journal of Nutrition, 2, 287-291
Friedeck, K.G., Karagul-yuccer, Y. y Drake, M.A. (2003). Soy protein fortification
of a low dairy-based ice cream. Journal Food Science, 68, 2651-2657
Friedman, M. y Brandon, D.L. (2001). Nutritional and health benefits of soy proteins.
Journal of Agricultural and Food Chemistry, 49, 1069-1086
Frippiat, A. y Smits, G. (1996). Compositions having a creamy structure and
containing fructane, preparation method therefore and uses thereof. European Patent 0
607 187 B1
REVISIÓN BIBLIOGRÁFICA
58
Fuccelli, R., Sepporta, M.V., Rosignoli, P., Morozzi, G., Servili, M. y Fabiani, R.
(2014). Preventive activity of olive oil phenolic compounds on alkene epoxides induced
oxidative DNA damage on human peripheral blood mononuclear cells. Nutrition and
and Cancer-an International Journal, 66(8), 1322-1330
García-Ochoa, F., Santos, V.E., Casas, J.A. y Gómez, E. (2002). Xanthan gum:
Production, recovery, and properties. Biotechnology Advances, 18, 549-579
Gómez Alvarado, T., Hernández Cervantes, M., López Velazquez, J., Santiago
Cabreral, R., Ramón Canul, L.G. y Juárez Barrientos, J.M. (2010). Caracterización
sensorial del queso freso “quajada” en tres localidades de Oaxaca, México: diferencias
en la percepción sensorial. Revista Venezolana de Ciencia y Tecnología de los
Alimentos, 1, 127-140
Greenhoff, K. y MacFie, H.J.H. (1994). Preference mapping in practice. En
Measurement of food preferences. Ed por: MacFie, H.J.H y Thomson, D.M.H..
Glasgow: Blackie Academic and Professional, pp. 137-166
Hagenimana, A., Ding, X. y Gu, W.Y. (2007). Steady state flow behaviours of
extruded blend of rice flour and soy protein concentrate. Food Chemistry, 101, 241-247
Hébette, C.L.M., Delcour, J.A., Koch, M.H.J., Booten, K., Kleppinger, R.,
Mischenkod, N. y Reynaers, H. (1998). Complex melting of semi-crystalline chicory
(Cichorium intybus L.) root inulin. Carbohydrate Research, 310, 65-75
Henelly, P.J., Dunne, P.G., O’Sullivan, M. y O’Riordan, E.D. (2006). Textural,
rheological and microstructural properties of imitation cheese containing inulin. Journal
of Food Engineering, 75, 388-395
REVISIÓN BIBLIOGRÁFICA
59
Herrero, A.M., Carmona, P., Cofrades, S. y Jiménez-Colmenero, F. (2008). Raman
spectroscopic determination of structural changes in meat batters upon soy protein
addition and heat treatment. Food Research International, 41, 765-772
Hoefler, A.C. (2004). Hydrocolloids. Ed por: Eagan Press. Minnesota, USA, pp: 55-65
Husson, F., Le Dien, S. y Pagès, J. (2001). Which value can be granted to sensory
profiles given by consumers? Methodology and results. Food Quality and Preference,
12, 291-296
Jankowski, T. (1992). Influence of starch retrogradation on the texture of cooked
potato tuber. International Journal of Food Science and Technology, 27, 637-642
Jansson, P.E.; Keene, L. y Lindberg, B. (1975). Structure of extracellular
polysaccharide from Xanthomonas campestris. Carbohydrate Research, 45, 275-282
Katzbauer, B. (1998). Properties and applications of xanthan gum. Polymer
Degradation and Stability, 59, 81-84
Kaur, N. y Gupta, A.K. (2002). Applications of inulin and oligofructose in health and
nutrition. Journal of Bioscience, 27, 703-714
Kennedy, J. y Heymann, H. (2009). Projective mapping and descriptive analysis of
milk and dark chocolates. Journal of Sensory Studies, 24, 220-233
Kennedy, J. (2010). Evaluation of replicated projective mapping of granola bars.
Journal of Sensory Studies, 25, 672-684
King, M.C., Cliff, M.A. y Hall, J.W. (1998). Comparison of projective mapping and
sorting data collection and multivariate methodologies for identification of similarity-
of-use snack bars. Journal of Sensory Studies, 13, 347-358
REVISIÓN BIBLIOGRÁFICA
60
Kinsella, J.E. (1979). Functional properties of soy proteins. Journal of the American
Oil Chemists’ Society 56, 242-258
Kip, P., Meyer, D. y Jellema, R.H. (2006). Inulins improve sensoric and textural
properties of low-fat yoghurts. International Dairy Journal, 16, 1098-1103
Koca, N. y Metin, M. (2004). Textural, melting and sensory properties of low-fat fresh
kashar cheese produced by using fat replacers. International Dairy Journal. 14, 365-373
Krumel, K.L. y Sarkar, N. (1975). Flow properties of gums useful to the food
industry. Food Technology, 29(4), 36-44
Laguna, L., Primo-Martin, C., Salvador, A., and Sanz, T. (2013). Inulin and
Erythritol as sucrose replacers in short-dough cookies: sensory, facture and acoustic
properties. Journal of Food Science, 78, S777-S784
Lai, V.M.F., Huang, A.L. y Lii, C.Y. (1999). Modeling the temperature effect on the
flow behavior of sweet potato puree. Journal of Food Process Engineering, 22, 235-247
Lamberti, M., Geiselmann, A., Conde-Petit, B. y Escher, F. (2004). Starch
transformation and structure development in production and reconstitution of potato
flakes. LWT-Food Science and Technology, 37, 417-427
Lassoued, N., Delarue, J., Launay, B. y Michon, C. (2008). Baked product texture:
Correlations between instrumental and sensory characterization using flash profile.
Journal of Cereal Science, 48, 133-143
Lawless, H.T. y Heymann, H. (2010). Sensory evaluation of food. Principles and
practices (2nd Ed.). New York: Springer
REVISIÓN BIBLIOGRÁFICA
61
Lee, S.-Y., Luna-Guzman, I., Chang, S., Barret, D.M. y Guinard, J.-X. (1999).
Relating descriptive analysis and instrumental texture data of processed diced tomatoes.
Food Quality and Preference, 10, 447-455
Liu, H.-H. y Kuo, M.-I. (2010). Effect of microwave heating on the viscoelastic
property and microstructure of soy protein isolate gel. Journal of Texture Studies, 42, 1-
9
Ma, L. y Barbosa-Canovas, G.V. (1997). Viscoelastic properties of xanthan gels
interacting with cations. Journal of Food Science, 62(6), 1124-1128
Mandala, I.G., Savvas, T.P. y Kostaropoulus, A.E. (2004). Xanthan and locust bean
gumm influence on the rheology and structure of a white model-sauce. Journal of Food
Engineering, 64, 335-342
Mandala, I.G.; Michon, C. y Launay, B. (2004). Phase and rheological behaviors of
xanthan/amylase and xanthan/starch mixed systems. Carbohydrate Polymers, 58, 285-
292
Mandala, I.G. (2005). Physical properties of fresh and frozen stored, microwave-
reheated breads, containing hydrocolloids. Journal of Food Engineering, 66, 291-300
Matsakidou, A., Blekas, G. y Paraskevopoulou, A. (2010). Aroma and physical
characteristics of cakes prepared by replacing margarine with extra virgin olive oil.
LWT-Food Science and Technology, 43, 949-957
Mazzucheli, R. y Guinard, J.X. (1999). Comparison of monadic and simultaneous
sample presentation modes in a descriptive analysis of milk chocolate. Journal of
Sensory Studies, 14, 235-248
REVISIÓN BIBLIOGRÁFICA
62
Medina-Torres, L., Brito-De la Fuente, E., Torrestiana-Sanchez, B. y Alonso, S.
(2003). Mechanical properties of gel fored by mixtures of mucilage gum (Opuntia ficus
indica) and carrageenans. Carbohydrate Polymers, 52(2), 143-150
Meilgaard, M.C., Civille, G.G. y Carr, B.T. (2007). Sensory evaluation techniques
(4th Ed.), Boca Raton, FL: CRC Press, pp. 173
Mitolo, J.J. (2006). Starch Selection and Interaction in Foods. En Ingredient
Interactions. Effects on Food Quality. Ed por: Gaonkar, A.G. y McPherson, A. New
York: Taylor & Francis, pp. 140-164
Molina, E., Defaye, A.B. y Ledward, D.A. (2002). Soy protein pressure-induced gels.
Food Hydrocolloids 16, 625-632
Morell, P., Fiszman, S.M., Varela, P. y Hernando, I. (2014). Hydrocolloids for
enhancing satiety: Relating oral digestion to rheology, structure and sensory perception.
Food Hydrocolloids, 41, 343-353
Moscatto, J.A., Borsato, D., Bona, E., de Oliveira, A.S. y de Oliveira Hauly, M.C.
(2006). The optimization of the formulation for a chocolate cake containing inulin and
yacon meal. International Journal of Food Science and Technology, 41, 181-188
Moussaoui, K.A. y Varela, P. (2010). Exploring consumer product profiling
techniques and their linkage to a quantitative descriptive analysis. Food Quality and
Preference, 21, 1088-1099
Muniz, F.J.S. (2007). Aceite de olive, clave de vida en la cuenca Mediterránea. Anales
de la Real Academia Nacional de Farmacia, 73(3), 653-692
REVISIÓN BIBLIOGRÁFICA
63
Murray, J.M., Delahunty, D.M. y Baxter, I.A. (2001) Descriptive sensory analysis:
past, present and future. Food Research International, 34, 461-471
Nagar, G., Clowes, G., Tudorica, C.M., Kuri, V. y Brennan, C.S. (2002).
Rheological quality and stability of yog-ice cream with inulin. International Journal of
Dairy Technology, 55, 89-93
Nestrud, M. y Lawless, H. (2008). Perceptual mapping of citrus juices using projective
mapping and profiling data from culinary professionals and consumers. Food Quality
and Preference, 19, 431-438
Nestrud, M.A. y Lawless, H.T. (2010). Perceptual mapping of apples and cheeses
using projective mapping and sorting. Journal of Sensory Studies, 25, 390-405
Nishinari, K. (2009). Texture and rheology in food and health. Food Science and
Technology Research, 15, 99-106
Otremba, M.M., Dikeman, M.E., Milliken, G.A., Stroda, S.L., Chambers IV, E. y
Chambers, D. (2000). Interrelationships between descriptive texture profile sensory
panel and descriptive attribute sensory panel evaluations of beef Longissimus and
Semitendinosus muscles. Meat Science, 54, 325-332
Pagès, J. (2003). Recueil direct de distances sensorielles: Application à l’évaluation de
dix vins blancs du Val-de-Loire. Sciences des Aliments, 23, 679-688
Pampaloni, B., Mavilia, C., Fabbri, S., Romani, A., Ieri, F., Tanini, A., Tonelli, F. y
Brandi, M. L. (2014). In vitro effects of extracts of extra virgin olive oil on human
colon cancer cells. Nutrition and cancer-an International Journal, 66(7), 1228-1236
REVISIÓN BIBLIOGRÁFICA
64
Paraskevopoulou, A., Boskou, D. y Kiosseoglou, V. (2005). Stabilization of olive oil-
lemon juice emulsion with polysaccharides. Food Chemistry, 90, 627-634
Perrin, L., Symoneaux, R., Maître, I., Asselin, C., Jourjon, F. y Pagès, J. (2008).
Comparison of three sensory methods for use with the Napping®
procedure: Case of ten
wines from Loir Valley. Food Quality and Preference, 19, 1-11
Perrin, L. y Pagès, J. (2009). Construction of a product space from the Ultra-flash
profiling method: application to ten red wines from the Loire Valley. Journal of Sensory
Studies, 24, 372-395
Pieterse, L. y Judd, J. (2014). World catalogue of potato varieties. Ed por: Pieterse, L.
y Judd, J. 6th Edition, pp. 326. ISBN: 978-3-86263-086-8
Pons, M. y Fiszman, S.M. (1996). Instrumental texture profile analysis with particular
reference to gelled systems. Journal of Texture Studies, 27, 597-624
Puppo, M.C., Sorgentini, D.A. y Añón, M.C. (2000). Rheological study of dispersions
prepared with modified soybean protein isolates. Journal of the American Oil Chemists’
Society, 77, 63-71
Redmond, G.A., Butler, F. y Gormeley, T.R. (2002). The effect of freezing conditions
on the quality of freeze-chilled reconstituted mashed potato. LWT-Food Science and
Technology, 35, 201-204
Rees, D.A., Morris, E.R., Thom, D. y Madden, J.K. (1982). Shapes and interactions
of carbohydrate chains. En: The polysaccharides, vol.1. Ed por: Aspinal, G.O.,
Academic Press, New York, Pp. 195-290
REVISIÓN BIBLIOGRÁFICA
65
Reeve, R. M. (1977). Pectin, starch and texture of potatoes: some practical and
theoretical implications. Journal of Texture Studies, 8, 1-17
Riaz, M.N. (2006). Processing of soybeans into ingredients. En Soy Applications in
Food. Ed por: Riaz, M.N. Taylor & Francis Group, Boca Raton, FL, pp. 39-62
Risvik, E., McEwan, J.A., Colwill, J.S., Rogers, R. y Lyon, D.H. (1994). Projective
mapping: A tool for sensory analysis and consumer research. Food Quality and
Preference, 5, 263-269
Risvik, E., McEwan, J.A. y Rodbotten, M. (1997). Evaluation of sensory profiling
and projective mapping data. Food Quality and Preference, 8, 63-71
Roberfroid, M. (1993). Dietary fiver, inulin and oligofructose: a review comparing
their physiological effects. Critical Reviews in Food Science and Nutrition, 32(2), 103-
148
Roberfroid, M.B. (1999). Concepts in functional foods: The case of inulin and
oligofructose. Journal of Nutrition, 129(75), 1398S-1401S
Roberfroid, M. y Slavin, J. (2000). Nondigestible oligosaccharides. Critical Reviews
in Food Science, 40, 461-480
Ryan, L.C., Mestrallet, M.G., Nepote, V., Conci, S. y Grosso, N.R. (2008).
Composition, stability and acceptability of different vegetables oils used for frying
peanuts. International Journal of Food Science and Technology, 43, 193-199
Schaafsma, G. y Slavin, J. L. (2015). Significance of inulin fructans in the human diet.
Comprehensive Reviews in Food Science and Food Safety, 14, 37-47
REVISIÓN BIBLIOGRÁFICA
66
Sahin, H. y Ozdemir, F. (2004). Effect of some hydrocolloids on the rheological
properties of different formulated ketchups. Food Hydrocolloids, 18, 1015-1022
Sanderson, G.R. (1981). Polysaccharides in food. Food Technology, 7(4), 50-56
Sawyer, F.M., Stone, H., Abplanalp, H. y Stewart, G.F. (1962). Repeatability
estimates in sensory panel selection. Journal of Food Science, 27, 386-393
Schaller-Povolny, L.A. y Smith, D.E. (2001). Viscosity and freezing point of a
reduced fat ice cream mix as related to inulin content. Milchwissenschaft, 56, 25-29
Severini, C., De Pilli, T. y Baiano, A. (2003). Partial substitution of pork backfat with
extra-virgin olive oil in “salami” products: effects on chemical, physical and sensorial
quality. Meat Science, 64(3), 323-331
Servili, M. y Montedoro, G.F. (2002). Contribution of phenolic compounds to virgin
olive oil quality. European Journal of Lipid Science and Technology, 104, 602-613
Siliani, S., Mattei, A., Benevieri Innocenti, L. y Zanoni, B. (2006). Bitter taste and
phenolic compounds in extra virgin olive oil: an empirical relationship. Journal of Food
Quality, 29, 431-441
Skinner, E.Z. (1988). The texture profile method. En Applied Sensory Analysis of
Food. Ed. por: H. R. Moskowitz. Boca Raton, FL: CRC Press, pp. 89-107
Smith, P. (1980). Course notes on “Industrial drying technology”. The Center for
Professional Advancement, East Brunswick, NJ
Song, K.W., Kuk, H.Y. y Chang, G.S. (2006). Rheology of concentrated xanthan gum
solutions: Steady shear flow behavior. Fibers and Polymers, 7 (2), 129-138
REVISIÓN BIBLIOGRÁFICA
67
Srisuvor, N., Chinprahast, N., Prakitchaiwattana, C. y Subhimaros, S. (2013).
Effects of inulin and polydextrose on physicochemical and sensory properties of low-fat
set yoghurt with probiotic-cultured banana purée. LWT-Food Science and Technology,
51, 30-36
Stanley, N.F. (1990). Carrageenans. En: Food gels. Chapter 3. Ed por: Elservier
Applied Science, New York, NY. pp.79-119
Steffe, J. (1996). Rheological methods in food process engineering. Michigan, Freeman
Press, pp. 1-10, 295-317, 258-262
Stewart, K.L. (2005). Soy good for you. Better Nutrition, 67, 24-26
Stone, H., Sidel, J.L., Oliver, S., Woolsey, A. y Singleton, R.C. (1974). Sensory
evaluation by quantitative descriptive analysis. Food Technology, 28, 24-33
Stone, H. y Sidel, J.L. (1993) Sensory evaluation practices (2nd Ed.), London:
Elservier Academic Press, Inc
Stone, H. y Sidel, J.L. (2004) Sensory evaluation practices (3rd Ed.). London: Elservier
Academic Press
Sych, J., Lacroix, C., Adambounou, L.T. y Castaigne, F. (1990). Cryoprotective
effects of some materials on cod-surimi proteins during frozen storage. Journal of Food
Science, 55, 1222-1227
Szczesniak, A.S. (1963). Classification of textural characteristics. Journal of Food
Science, 28, 385-389
Szczesniak, A.S. y Kahn, E.E. (1971). Consumer awareness of and attitudes to food
texture. I. Adults. Journal of Texture Studies, 2, 280-295
REVISIÓN BIBLIOGRÁFICA
68
Szczesniak, A.S. (2002). Texture is a sensory property. Food Quality and Preference,
13, 215-225
Tang, X., Master, Q.P.W., Le, G.W. y Shi, Y.H. (2012). Effects of heat treatment on
structural modification and in vivo antioxidant capacity of soy protein. Nutrition, 28,
1180-1185
Tarancón, P. (2013). Influencia de la grasa en las propiedades físicas y sensoriales de
galletas. Alternativas para la mejora del perfil de ácidos grasos. Tesis Doctoral. Instituto
de Agroquímica y Tecnología de alimentos (IATA-CSIC), Universidad Politécnica de
Valencia.
Tarea, S., Cuvelier, G. y Sieffermann, J.-M. (2007). Sensory evaluation of texture of
49 commercial apple and pear purees. Journal Food Quality, 30, 1121-1131
Tarrega, A. y Costell, E. (2006). Effect of inulin addition on rheological and sensory
properties of fat-free starch-based dairy desserts. International Dairy Journal, 16, 1104-
1112
Tarrega, A., Martinez, M., Velez-Ruiz, J.F. y Fiszman, S.M. (2014). Hydrocolloids
as a tool for modulating the expected satiety of milk-based snacks. Food Hydrocolloids,
39, 51-57
Tecante, A. y Doublier, J.L. (2002). Rheological investigation of the interaction
between amylose and kappa-carrageenan. Carbohydrate Polymers, 49(2), 177-183
Torrezan, R., Tham, W.P., Bell, A.E., Frazier, R.A. y Cristianini, M. (2007). Effects
of high pressure on functional properties of soy protein. Food Chemistry 104, 140-147
REVISIÓN BIBLIOGRÁFICA
69
Tseng, Y.-C., Xiong, Y.L. y Boatright, W.L. (2008). Effects of Inulin/Oligofructose
on the thermal stability and acid-induced gelation of soy proteins. Journal of Food
Science, 73(2), E44-E50
Tseng, Y.-C., Xiong, Y.L. y Yang, F. (2009). Influence of inulin/oligofructose on the
acid-induced cold aggregation and gelation of preheated soy proteins. Journal of the
Science of Food and Agriculture, 89, 2650-2658
Tungland, B.C. y Meyer, D. (2002). Non digestible oligo-and polysaccharides (dietary
fiber): Their physiology and role in human health and food. Comprehensive Reviews in
Food Science and Food Safety, 1, 73-92
UNE-EN ISO 5492:2010.Vocabulario. Manual de análisis sensorial. Aenor, Madrid.
Valentin, D., Chollet, S., Lelièvre, M. y Abdi, H. (2012). Quick and dirty but still
pretty good: a review of new descriptive methods in food science. International Journal
of Food Science and Technology, 47, 1563-1578
Varela, P. y Ares, G. (2012). Sensory profiling, the blurred line between sensory and
consumer science. A review of novel methods for product characterization. Food
Research International, 48, 893-908
Veinand, B., Godefroy, C., Adam, C. y Delarue, J. (2011). Highlight of important
product characteristics for consumers. Comparison of three sensory descriptive methods
performed by consumers. Food Quality and Preference, 22, 474-485
Verbeken, D., Thas, O. y Dewettinck, K. (2004). Textural properties of gelled dairy
desserts containing kappa-carrageenan and starch. Food Hydrocolloids, 18(5), 817-823
REVISIÓN BIBLIOGRÁFICA
70
Villegas, B. y Costell, E. (2007). Flow behavior of inulin milk beverages. Influence of
inulin average chain length and of milk fat content. International Dairy Journal, 17,
776-781
Wei, Y.P., Wang, C.S. y Wu, J.S.B. (2001). Flow properties of fruit fillings. Food
Research International, 34, 377-381
Whistler, R.L. y Daniel, J.R. (1993). Carbohidratos. En Química de los alimentos. 2ª
ed. Ed por: Fenemma, D. R., Acribia. S. A. Zaragoza. España
White, J.P., Davidson, V.J. y Otten, L. (1993). A capillary viscometer for
characterization of fluid foods. Canadian Institute of Food Science and Technology
Journal, 26, 109-114
Worch, T., Lê, S. y Punter, P. (2010). How reliable are the consumers? Comparison of
sensory profiles from consumers and experts. Food Quality and Preference, 21, 309-
318
Youssef, M.K. y Barbut, S. (2011). Effects of two types of soy protein isolates, native
and preheated whey protein isolates on emulsified meat batters prepared at different
protein levels. Meat Science, 87, 54-60
Zimeri, J.E. y Kokini, J.L. (2003). Morphological characterization of the phase
behavior of inulin-waxy maize starch systems in high moisture environments.
Carbohydrate Polymers, 52, 225-236
Capítulo 4
Trabajos experimentales

TEXTURE OF EXTRA VIRGIN OLIVE OIL-ENRICHED
MASHED POTATOES: SENSORY, INSTRUMENTAL
AND STRUCTURAL RELATIONSHIPS.
María Dolores Alvarez, Cristina Fernández, María José Jiménez and Wenceslao
Canet.
Journal of Texture Studies 42 (2011), 413-429.

Texture of extra virgin olive oil-enriched mashed potatoes…
75
ABSTRACT
The aim of this work was to study the effect of the addition of extra virgin olive
oil (EVOO) on instrumental textural properties, sensory texture profile analysis (TPA)
and microstructure of fresh and frozen/thawed mashed potatoes formulated without and
with added cryoprotectants [kappa-carrageenan (κ-C) and xanthan gum (XG)]. EVOO
behaves as soft filler due to droplet aggregates, whereas addition of cryoprotectants led
to more structured mashed potatoes (MP) thanks to the gelling properties of κ-C. Both
the percentage of added EVOO and processing had a much less significant effect on the
texture of the MP containing κ-C and XG, evidencing the ability of this biopolymer
blend to impart freeze/thaw stability. All samples with added EVOO were perceived as
significantly softer and creamier than the samples without EVOO, whereas all MP
samples with added cryoprotectants were perceived as significantly thicker and creamier
than those without hydrocolloids.
KEYWORDS
Extra virgin olive oil, freezing, mashed potatoes, microstructure, texture, TPA
sensory attributes
PRACTICAL APPLICATIONS
Previous studies showed that the quality after freezing and thawing may be
improved by the addition of 1.5 g/kg of kappa-carrageenan and 1.5 g/kg of xanthan
gum, and/or incorporation of dietary fiber, improvement of mashed potatoes texture by
retarding starch retrogradation and increasing water-holding capacity. Growing
Texture of extra virgin olive oil-enriched mashed potatoes…
76
awareness of the link between diet and health is fast changing consumer habits, so that
there has been increasing demand for foods with health enhancing properties. Extra
virgin olive oil (EVOO) has important nutritional characteristics linked to its biophenol
content and has very important antioxidant properties. The results have shown that
although instrumental textural data were able to explain differences in consistency
perceived, structural information is needed to understand differences in creaminess.
Back extrusion test is recommended to industry as practical quality control tool in the
commercial production of mashed potatoes with added EVOO.
INTRODUCTION
Various health organizations recommend a daily intake of around 600 g of fruit
and vegetables, but few people manage to consume this amount. Led by consumer
demand, the food industry has shown an increased interest in the manufacture of
healthier and more natural fruit and vegetable food products, such as soups, drinks and
sauces (Whybrow et al. 2006). Mashed potatoes (MP) made from 100 % fresh potato
tubers are, in addition, a natural vegetable semisolid food, which may also be suitable
for freezing as a ready-meal component or as a product in itself such as potato gratin
(Alvarez et al. 2009).
Olive oil is an important component of the diet of the countries surrounding the
Mediterranean Sea. Because of its composition, olive oil is a good source of biophenols
(Boskou and Visioli 2003) as well as lipid-soluble and water-soluble vitamins
(tocopherols, β-carotene, ascorbic acid). In addition, thanks to its balanced fatty acid
composition virgin olive oil has highly appreciated nutritional characteristics (Mildner-
Szkudlarz and Jeleń 2010), known for a long time to the people of the Mediterranean
Texture of extra virgin olive oil-enriched mashed potatoes…
77
region, who use it daily for a variety of culinary purposes. Biophenols with important
antioxidant properties and a role in atherogenesis and cancer have been found and
quantified in virgin and extra virgin olive oils (EVOOs; Muniz 2007). However,
consumption has also increased in non-Mediterranean areas thanks to growing interest
in the Mediterranean diet and a belief that it prevents certain diseases (Boskou and
Visioli 2003; Paraskevopoulou et al. 2005). A classic white sauce usually contains
flour, milk and butter, but olive oil has been added to a white model-sauce to produce
an innovative sauce approximating “Mediterranean cooking” (Mandala et al. 2004).
The oil volume fraction exerts profound effects on the physicochemical and
viscoelastic properties of emulsions, such as droplet size distribution, creaming,
oxidative stability and rheology (Dickinson and Chen 1999). Fat droplets influence the
overall physicochemical and sensory properties of foods in a variety of different ways
(Chantrapornchai et al. 1999). A great deal of research has been done on the influence
of fat droplets on the rheology, stability and flavour of food emulsions, but less is
known about their influence on emulsion appearance. Color is one of the major
attributes affecting consumer perception of the quality of virgin olive oil (Criado et al.
2008), and chloroplast pigments (chlorophyll and carotenoids) are mainly responsible
for the color of virgin olive oil, ranging from yellow–green to greenish gold (Ayuso et
al. 2004).
Texture is by far the most important quality criterion for consumer sensory
acceptance of freshly prepared and processed potato products, and particularly of
frozen/thawed and dehydrated MPs. A fluffy and medium-consistency texture is
desirable, whereas pastiness, gumminess and stickiness are negative attributes
(Lamberti et al. 2004). Texture instability remains the most significant challenge for
frozen food products, especially with inevitable post-production temperature
Texture of extra virgin olive oil-enriched mashed potatoes…
78
fluctuations. Loss of moisture and changes in textural attributes often result in
significant reduction of product quality.
Previous studies showed that the addition of kappa-carageenan (κ-C) and xanthan
gum (XG) to MP at a low concentration (each cryoprotectant at 1.5 g/kg) is
recommendable on the basis of overall acceptability, especially when the product is
going to be frozen (Alvarez et al. 2009; Fernández et al. 2009). κ-C provides the
appropriate texture, while XG imparts creaminess and mouthfeel to the product.
No research has been done on the addition of olive oil in fresh and frozen/thawed
mashed potatoes (designated FMP and F/TMP, respectively), particularly with EVOO.
The use of EVOO rather than commercial olive oil is preferable because of its high
concentrations of both unsaturated fatty acids and antioxidant compounds such as
polyphenols and tocopherols (Severini et al. 2003). The purpose of the present research
was to evaluate the effects of adding EVOO on the textural, physical, structural and
sensory characteristics of FMP and F/TMP formulated without and with added
cryoprotectants.
MATERIALS AND METHODS
Materials
The potatoes used were fresh tubers (cv Kennebec) from Aguilar de Campoo
(Burgos, Spain) grown in 2008. κ-C (GENULACTA carrageenan type LP-60) and XG
(Keltrol F [E]) were donated by Premium Ingredients, S.L. (Girona, Spain). EVOO
(Carbonell, Sevilla, Spain) was chosen for addition to the MP. Following range-finding
experiments, the lower and upper levels of EVOO to be used were set at 10 and 50 g/kg,
Texture of extra virgin olive oil-enriched mashed potatoes…
79
respectively. A sample without EVOO was also prepared for each type of MP and
processing conditions.
Preparation of MP Samples
Tubers were manually washed, peeled and diced. MP were prepared in ~ 2000 g
batches from 607.7 g/kg of potatoes, 230.8 g/kg of semi-skimmed in-bottle sterilized
milk (fat content, 15.5 g/kg), 153.8 g/kg of water, 7.7 g/kg of salt (NaCl) and the
corresponding EVOO concentration (0, 10, 25 and 50 g/kg) using a TM 31 food
processor (Vorwerk España, M.S.L., S.C., Madrid, Spain). MPs were prepared without
and with added κ-C and XG (MPA and MPB samples, respectively). In the latter case,
hydrocolloids (each at 1.5 g/kg) were also added to the rest of the ingredients in the
form of a dry powder. All the ingredients were cooked for 35 min at 90C (blade speed:
40 rpm) (Alvarez et al. 2009; Fernández et al. 2009). The mash was ground for 40 s
(1,200 rpm) and for 20 s (2,600 rpm). The product was at once homogenized through a
stainless steel sieve (diameter: 1.5 mm). The highest EVOO concentration was added
twice to the MP to evaluate the effect of order of addition and EVOO thermal treatment
on MP quality. First, 50 g/kg of EVOO was added along with the rest of the ingredients
as indicated above, whereas in the second case the same EVOO concentration
(designated “50b” g/kg) was added to the MP before final homogenization. Half of each
fresh blend (FMP samples) was analysed immediately and the other half was frozen and
thawed (F/TMP samples). Two repetitions of each composition were prepared in
different weeks.
Freezing, Thawing and Heating Procedures
MP samples were placed on flat-freezing and microwave-thawing trays, and then
frozen by forced convection with liquid nitrogen vapour in an Instron programmable
Texture of extra virgin olive oil-enriched mashed potatoes…
80
chamber (model 3119-05, −70/+250C) at −60C until their thermal centres reached −24C
(Fernández et al. 2009). After freezing, the samples were packed in polyethylene plastic
bags, sealed under light vacuum (–0.05 MPa) on a Multivac packing machine (Sepp
Haggenmüller KG, Wolfertschwenden, Germany), and placed in a domestic freezer for
storage at −24C. Packed frozen samples were thawed in a Samsung M1712N
microwave oven (Samsung Electronics S.A., Madrid, Spain). Samples were heated for
20 min at an output power rating of 600 W. Samples were brought up to 55C by placing
Denmark). Sample testing was 55C, where water and product temperatures were
monitored by T-type thermocouples as described elsewhere (Alvarez et al. 2005, 2008,
2009; Fernández et al. 2008).
Instrumental Texture Measurements
Back extrusion (BE) and cone penetration (CP) mechanical tests were performed
in order to study the empirical rheological behavior of “semisolid like” samples. Both
experiments were performed using a TA.HDPlus Texture Analyser (Stable Micro
Systems Ltd, Godalming, UK) equipped with a 300 N load cell. During tests, MP
samples were kept at 55C by means of a Temperature Controlled Peltier Cabinet
(XT/PC) coupled to a separate heat exchanger and proportional-integral-derivative
control unit. For performance of BE tests, a rig (model A/BE, Stable Micro Systems)
was used consisting of a flat 45 mm diameter perspex disc plunger that was driven into
a larger perspex cylinder sample holder (50 mm diameter) to force down into the MP
samples and flow it upward through the concentric annular space between plunger and
the container. The measuring cup was filled with 50 ± 1 g of MP. Product was extruded
to a distance of 20 mm at 2 mm/s compression rate. At this point (most likely to be the
maximum force), the probe returns to its original position. From the recorded force-time
Texture of extra virgin olive oil-enriched mashed potatoes…
81
curves, texture parameters with physical meaning are calculated, which vary from
simple consistency indices to a derived flow behavior index, which is obtained
according to the mathematical model suggested by Osorio and Steffe (1987). In this
study, maximum positive force of extrusion (firmness (N)) and the negative area of
extrusion (viscosity index (N·s)) have been taken into account in order to describe
texture changing in MP samples. For performing the CP tests, a Texture Technologies
Corporation spreadability rig (HDP/SR, Stable Micro Systems) was used, consisting of
a 45° conical perspex probe (P/45 C) that penetrated a conical sample holder containing
7 ± 0.1 g of MP product. Product was penetrated to a distance of 17.5 mm at 3 mm/s
compression rate. CP work per displaced volume (J/m3) required to accomplish
penetration was calculated from the area under the curve up to the “peak” or maximum
penetration force, and the average force of the complete curve (N) was also recorded.
Texture measurements were performed in quadruplicate and results averaged.
Other Quality Parameters
The color of the MP in the pots was measured with a Hunter-Lab model D25
(Reston, VA) color difference meter fitted with a 5 cm diameter aperture. Results were
expressed in accordance with the CIELAB system with reference to illuminant D65 and
a visual angle of 10°. The parameters determined were L*, a
* and b
*. A higher L
* value
indicated a brighter or whiter sample and values of a*
and b* indicated red-green and
yellow-blue colors. Yellowness index (YI) was calculated as 142.86b*/L
* (Fernández et
al. 2008).
Expressible water (Ew) was measured by centrifugal force. Centrifuge tubes
containing approximately 10 g of MP were centrifuged at 15,000×g for 30 min in a
Sorvall®, RC-5B apparatus (Global Medical Instrumentation, Inc, Clearwater, MN). Ew
Texture of extra virgin olive oil-enriched mashed potatoes…
82
was expressed as the percentage of liquid separated per total weight of sample in the
centrifuge tube (Eliasson and Kim 1992). Measurements of color and Ew were
performed in quadruplicate and the results averaged.
Sensory Analyses
MP samples were subjected to texture profile analysis (TPA) modified to evaluate
vegetables purees according to UNE 87025 (1996), which was used to select and define
the sensory attributes included in the profile. A panel of 4 assessors, previously trained
according to the ISO guidelines (ISO 8586-1 1993) and with specific exercise in MP for
8 years (Alvarez et al. 2005, 2008; Fernández et al. 2008), evaluated the textural
attributes of the samples. Profile attributes were classified into four groups (Alvarez et
al. 2008). Attributes are listed in the order of the perception according to ISO guidelines
(ISO 13299 2003): attributes perceived before putting the sample in mouth (granularity
and moisture [1]); attributes perceived at the time of putting the sample in the mouth
(stickiness, denseness, homogeneity, moisture [2] and firmness); attributes perceived at
the time of preparing the sample in the mouth for swallowing (cohesiveness,
adhesiveness and fibrousness [1]); attributes perceived during final and residual phases
of mastication (ease of swallowing, palate coating and fibrousness [2]). Thereby, for
moisture and fibrousness, numbers in brackets [1] and [2] refer to the order of their
perception in the mastication process. A description of the sensory attributes evaluated
during the TPA can be found elsewhere (Alvarez et al. 2008).
Samples were evaluated, in duplicate, in morning sessions (11:00 a.m.-1:00 p.m.).
Daily for 40 days, assessors were given four samples (about 20 g each), for scoring
attributes of each group in the texture profile. All the samples were served at 55 ± 1C on
Petri dishes. This sample temperature was reached and kept constant by placing the
Texture of extra virgin olive oil-enriched mashed potatoes…
83
product in the Hetofrig CB60VS water bath prior to testing. For each sample, panelists
evaluated the perceived intensity of the 13 attributes on 8 cm descriptive linear scales
labeled at each anchor: (left anchor: 1 = ‘‘not detectable”; right anchor: 9 = ‘‘extremely
intense’’). To reduce fatigue a rest period of 5 min was taken after scoring each sample.
MP samples were also subjected to an overall acceptability (OA) test based on all
sensory attributes (texture, color, taste) on a 9-point hedonic scale (with 8 cm) labelled
at each anchor: (left anchor: 1 = “dislike extremely”; right anchor: 9 = “like
extremely”). In this case, sensory assessment was conducted by a 14-member untrained
panel. Every day, one sample (about 20 g each) was served under the same conditions
as indicated above.
Scanning Electron Microscopy (SEM)
MP microstructure was examined by SEM using a Hitachi model S-2.100
microscope (Hitachi Ltd., Tokyo, Japan) National Center For Metallurgical Research
(CENIM-CSIC). MP samples were air-dried, then mounted and sputter-coated with Au
(200 A aprox.) in a SPI diode sputtering system metallizer. Photomicrographs were
taken with a digital system Scanvision 1.2 of Röntgenanalysen-Technik (800x1.200
pixel, Rontec, GmbH, Berlin, Germany).
Statistical Analysis
A three-way analysis of variance (ANOVA) with interactions was applied to
evaluate how the three factors studied—EVOO concentration, presence or absence of
hydrocolloids and performance or not of processing —affected the texture, color,
sensory attributes and the OA of the MP. Ew was always zero for the MPB samples; a
two-way ANOVA with interactions was applied to evaluate how EVOO concentration
and processing affected the Ew of the products. Minimum significant differences were
Texture of extra virgin olive oil-enriched mashed potatoes…
84
calculated using Fisher’s least significant difference test (99% for comparison of
instrumental parameters and 95% for comparison of sensory attributes and OA).
Analyses were performed with Statgraphics®
software version 5.0 (STSC Inc.,
Rockville, MD).
RESULTS AND DISCUSSION
Instrumental Texture Measurements
Table 1 shows the effects of EVOO concentration, cryoprotectant addition and
processing on the values of the textural properties derived from the BE and CP tests.
Samples with added κ-C and XG, as well as those subjected to freezing/thawing,
presented significantly higher and lower textural properties than their respective
counterparts. Previous studies showed that when κ-C/XG blends were added to FMP
and F/TMP samples, κ-C provided the appropriate texture whereas XG imparted
creaminess to the product (Alvarez et al. 2009; Fernández et al. 2009; Alvarez et al. in
press). Analogously, in starch/XG blends, it was observed that XG does not interfere in
potato starch network building (Mandala and Palogou (2003); Mandala et al. 2004).
Therefore, addition of both hydrocolloids to MP produces a more structured system
which is associated with the gelling properties of κ-C. In natural MP, the product was
softer than the fresh control after freezing and thawing (Alvarez et al. 2005). MP is a
starchy food, and as such may present quality problems such as syneresis and
organoleptic and textural changes. These problems have been ascribed to phase
separation caused by retrogradation of the starch (Eliasson and Kim 1992; Kim and
Eliasson 1993).
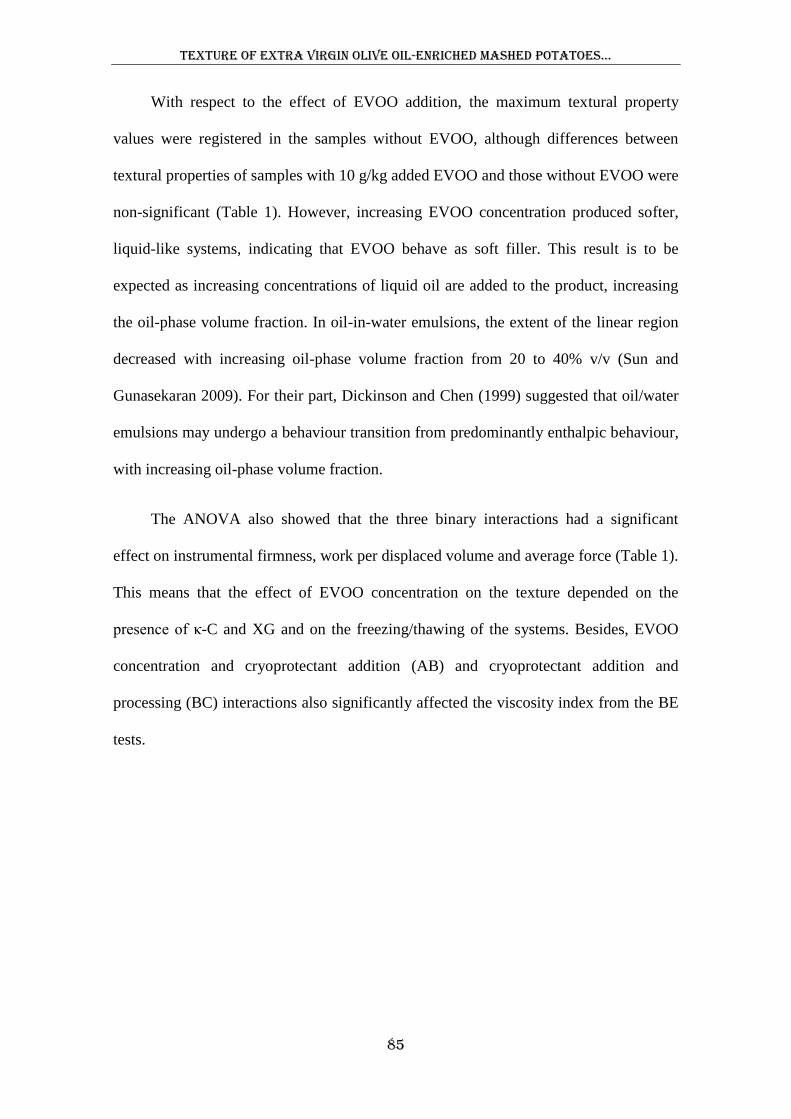
Texture of extra virgin olive oil-enriched mashed potatoes…
85
With respect to the effect of EVOO addition, the maximum textural property
values were registered in the samples without EVOO, although differences between
textural properties of samples with 10 g/kg added EVOO and those without EVOO were
non-significant (Table 1). However, increasing EVOO concentration produced softer,
liquid-like systems, indicating that EVOO behave as soft filler. This result is to be
expected as increasing concentrations of liquid oil are added to the product, increasing
the oil-phase volume fraction. In oil-in-water emulsions, the extent of the linear region
decreased with increasing oil-phase volume fraction from 20 to 40% v/v (Sun and
Gunasekaran 2009). For their part, Dickinson and Chen (1999) suggested that oil/water
emulsions may undergo a behaviour transition from predominantly enthalpic behaviour,
with increasing oil-phase volume fraction.
The ANOVA also showed that the three binary interactions had a significant
effect on instrumental firmness, work per displaced volume and average force (Table 1).
This means that the effect of EVOO concentration on the texture depended on the
presence of κ-C and XG and on the freezing/thawing of the systems. Besides, EVOO
concentration and cryoprotectant addition (AB) and cryoprotectant addition and
processing (BC) interactions also significantly affected the viscosity index from the BE
tests.
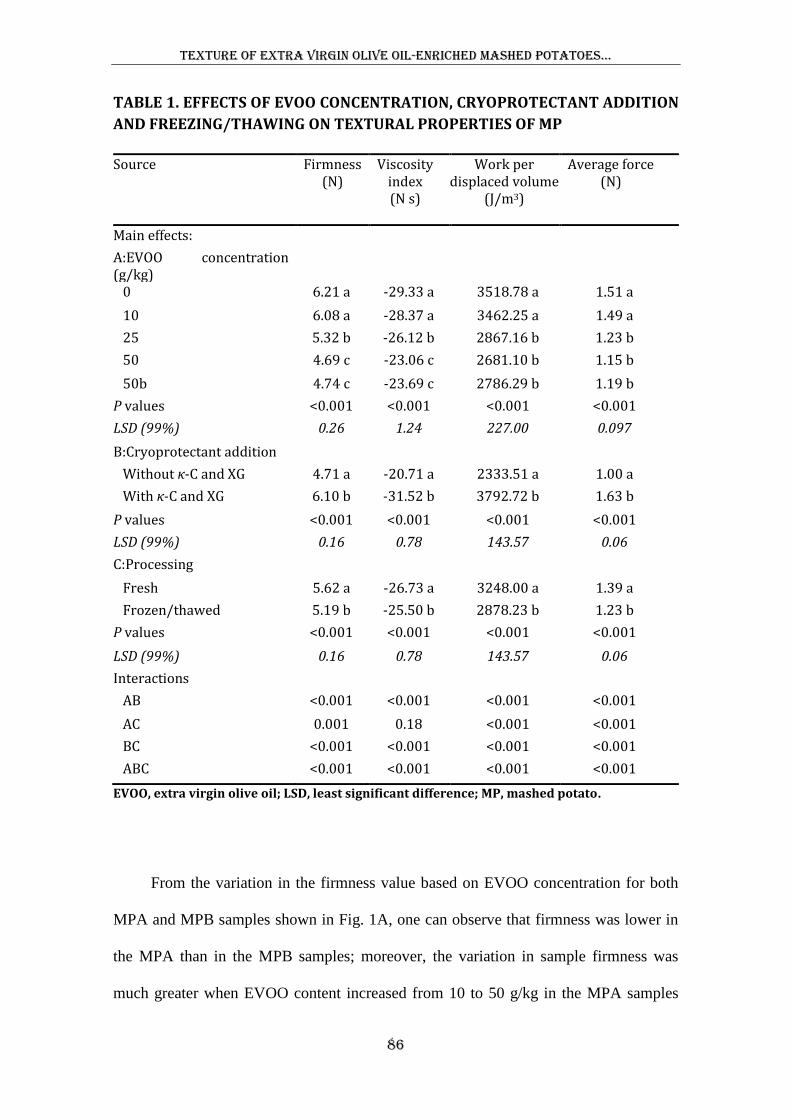
Texture of extra virgin olive oil-enriched mashed potatoes…
86
TABLE 1. EFFECTS OF EVOO CONCENTRATION, CRYOPROTECTANT ADDITION
AND FREEZING/THAWING ON TEXTURAL PROPERTIES OF MP
Source Firmness (N)
Viscosity index (N s)
Work per displaced volume
(J/m3)
Average force (N)
Main effects:
A:EVOO concentration (g/kg)
0 6.21 a -29.33 a 3518.78 a 1.51 a
10 6.08 a -28.37 a 3462.25 a 1.49 a
25 5.32 b -26.12 b 2867.16 b 1.23 b
50 4.69 c -23.06 c 2681.10 b 1.15 b
50b 4.74 c -23.69 c 2786.29 b 1.19 b
P values <0.001 <0.001 <0.001 <0.001
LSD (99%) 0.26 1.24 227.00 0.097
B:Cryoprotectant addition
Without κ-C and XG 4.71 a -20.71 a 2333.51 a 1.00 a
With κ-C and XG 6.10 b -31.52 b 3792.72 b 1.63 b
P values <0.001 <0.001 <0.001 <0.001
LSD (99%) 0.16 0.78 143.57 0.06
C:Processing
Fresh 5.62 a -26.73 a 3248.00 a 1.39 a
Frozen/thawed 5.19 b -25.50 b 2878.23 b 1.23 b
P values <0.001 <0.001 <0.001 <0.001
LSD (99%) 0.16 0.78 143.57 0.06
Interactions
AB <0.001 <0.001 <0.001 <0.001
AC 0.001 0.18 <0.001 <0.001
BC <0.001 <0.001 <0.001 <0.001
ABC <0.001 <0.001 <0.001 <0.001
EVOO, extra virgin olive oil; LSD, least significant difference; MP, mashed potato.
From the variation in the firmness value based on EVOO concentration for both
MPA and MPB samples shown in Fig. 1A, one can observe that firmness was lower in
the MPA than in the MPB samples; moreover, the variation in sample firmness was
much greater when EVOO content increased from 10 to 50 g/kg in the MPA samples
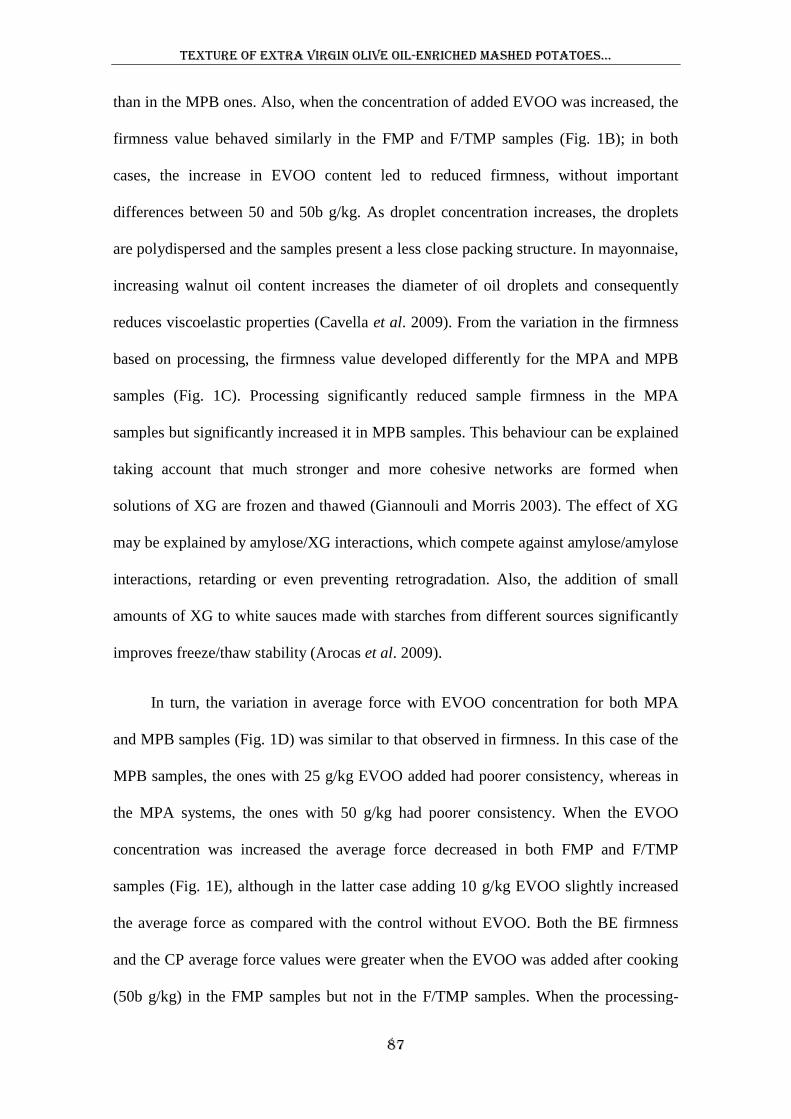
Texture of extra virgin olive oil-enriched mashed potatoes…
87
than in the MPB ones. Also, when the concentration of added EVOO was increased, the
firmness value behaved similarly in the FMP and F/TMP samples (Fig. 1B); in both
cases, the increase in EVOO content led to reduced firmness, without important
differences between 50 and 50b g/kg. As droplet concentration increases, the droplets
are polydispersed and the samples present a less close packing structure. In mayonnaise,
increasing walnut oil content increases the diameter of oil droplets and consequently
reduces viscoelastic properties (Cavella et al. 2009). From the variation in the firmness
based on processing, the firmness value developed differently for the MPA and MPB
samples (Fig. 1C). Processing significantly reduced sample firmness in the MPA
samples but significantly increased it in MPB samples. This behaviour can be explained
taking account that much stronger and more cohesive networks are formed when
solutions of XG are frozen and thawed (Giannouli and Morris 2003). The effect of XG
may be explained by amylose/XG interactions, which compete against amylose/amylose
interactions, retarding or even preventing retrogradation. Also, the addition of small
amounts of XG to white sauces made with starches from different sources significantly
improves freeze/thaw stability (Arocas et al. 2009).
In turn, the variation in average force with EVOO concentration for both MPA
and MPB samples (Fig. 1D) was similar to that observed in firmness. In this case of the
MPB samples, the ones with 25 g/kg EVOO added had poorer consistency, whereas in
the MPA systems, the ones with 50 g/kg had poorer consistency. When the EVOO
concentration was increased the average force decreased in both FMP and F/TMP
samples (Fig. 1E), although in the latter case adding 10 g/kg EVOO slightly increased
the average force as compared with the control without EVOO. Both the BE firmness
and the CP average force values were greater when the EVOO was added after cooking
(50b g/kg) in the FMP samples but not in the F/TMP samples. When the processing-
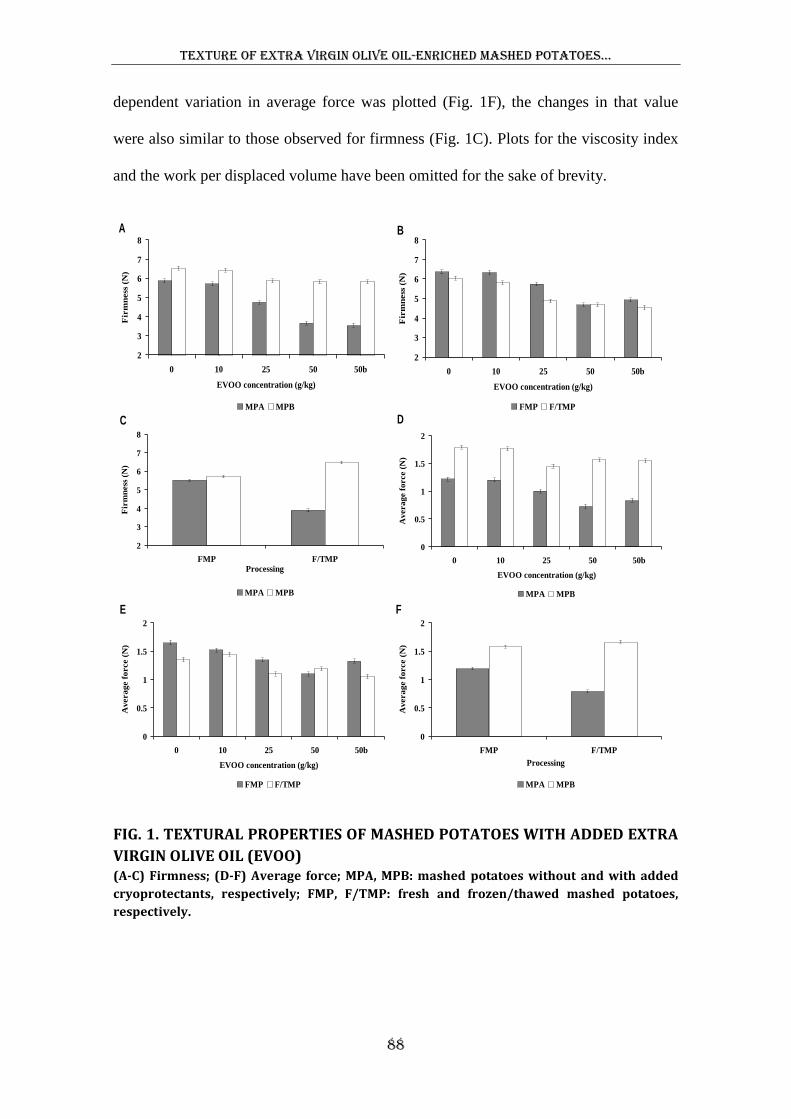
Texture of extra virgin olive oil-enriched mashed potatoes…
88
dependent variation in average force was plotted (Fig. 1F), the changes in that value
were also similar to those observed for firmness (Fig. 1C). Plots for the viscosity index
and the work per displaced volume have been omitted for the sake of brevity.
FIG. 1. TEXTURAL PROPERTIES OF MASHED POTATOES WITH ADDED EXTRA
VIRGIN OLIVE OIL (EVOO) (A-C) Firmness; (D-F) Average force; MPA, MPB: mashed potatoes without and with added
cryoprotectants, respectively; FMP, F/TMP: fresh and frozen/thawed mashed potatoes,
respectively.
0
0.5
1
1.5
2
0 10 25 50 50b
EVOO concentration (g/kg)
Av
era
ge f
orce (
N)
FMP F/TMP
A B
C D
E F
2
3
4
5
6
7
8
0 10 25 50 50b
EVOO concentration (g/kg)
Fir
mn
ess
(N
)
MPA MPB
2
3
4
5
6
7
8
0 10 25 50 50b
EVOO concentration (g/kg)
Fir
mn
ess
(N
)FMP F/TMP
0
0.5
1
1.5
2
0 10 25 50 50b
EVOO concentration (g/kg)
Average f
orce (
N)
MPA MPB
2
3
4
5
6
7
8
FMP F/TMP
Processing
Fir
mn
ess
(N
)
MPA MPB
0
0.5
1
1.5
2
FMP F/TMP
Processing
Av
era
ge f
orce (
N)
MPA MPB
Texture of extra virgin olive oil-enriched mashed potatoes…
89
Color Measurements and Expressible Water
All the three factors studied significantly changed the color parameters, although
processing did not significantly affect the yellowness index (YI) (Table 2). An increase
in EVOO level favours higher L* value (lightness) due to an increase in the overall light
scattering associated with the scattering properties of fat (Chantrapornchai et al. 1999).
As the EVOO concentration increased there was an increase in redness (decreasingly
negative a* values) and in yellowness (YI), associated with the augmented pigment
content of the MP. The pigment profile of the virgin olive oil comprises chlorophyll a,
chlorophyll b, and derivative pigments associated with the acidic medium of the oil
extraction process (Criado et al. 2008).
L* increased when κ-C and XG were added to the MP, which could be partially
due to their absolute water-holding capacity (WHC) as discussed below. Also, a* was
higher in the MPB than in the MPA samples, indicating significant raised sample
redness. The loss of greenness associated with cryoprotectant addition was probably due
to the presence of XG in the system as found previously (Fernández et al. 2008).
Increased lightness in the F/TMP samples as compared to their FTM counterparts may
have been partly due to the formation of fissures produced by the growth of ice crystals
during freezing, which favours the release of water; this would transmit the light more
rather than capturing it. For its part the loss of greenness found in the processed samples
(a* values nearer to 0) as compared to the fresh counterparts could be due to slight non-
enzymatic browning (Maillard reaction) during microwave thawing.
On the other hand, the three interactions had a significant effect on L* and YI
(Table 2). Moreover, AB and EVOO concentration and processing (AC) interactions
significantly affected the a* value. The variation in the L* value based on EVOO
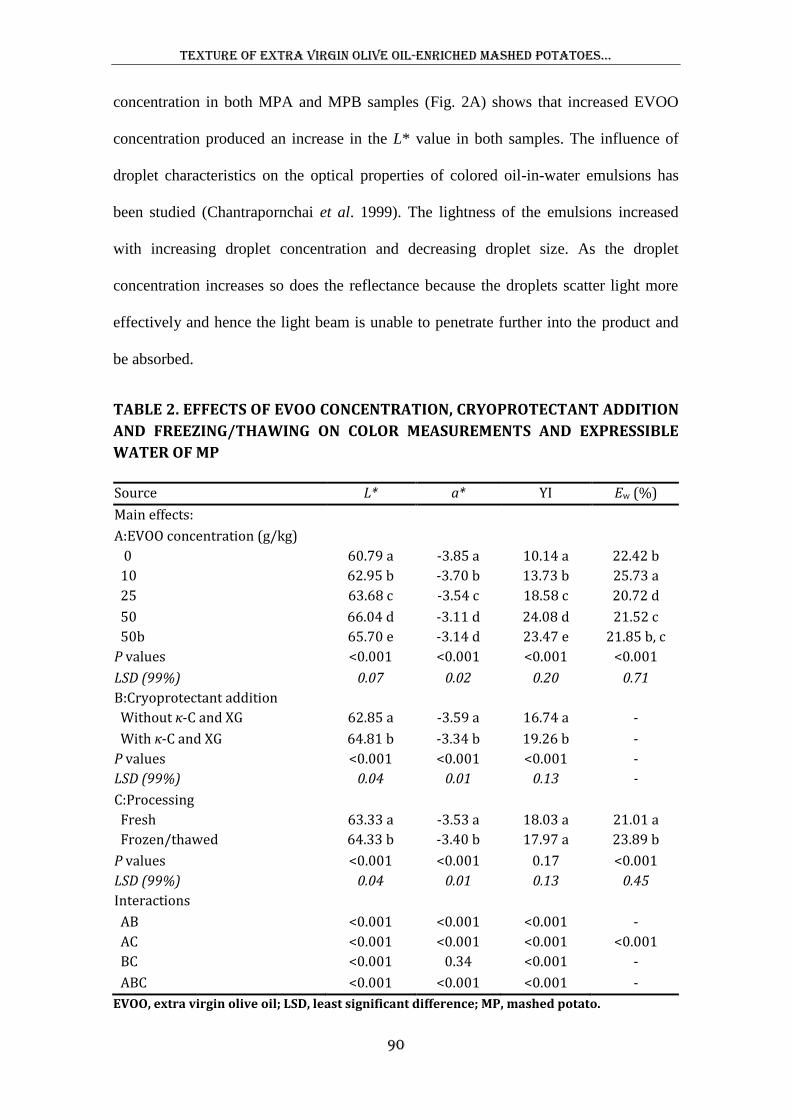
Texture of extra virgin olive oil-enriched mashed potatoes…
90
concentration in both MPA and MPB samples (Fig. 2A) shows that increased EVOO
concentration produced an increase in the L* value in both samples. The influence of
droplet characteristics on the optical properties of colored oil-in-water emulsions has
been studied (Chantrapornchai et al. 1999). The lightness of the emulsions increased
with increasing droplet concentration and decreasing droplet size. As the droplet
concentration increases so does the reflectance because the droplets scatter light more
effectively and hence the light beam is unable to penetrate further into the product and
be absorbed.
TABLE 2. EFFECTS OF EVOO CONCENTRATION, CRYOPROTECTANT ADDITION
AND FREEZING/THAWING ON COLOR MEASUREMENTS AND EXPRESSIBLE
WATER OF MP
Source L* a* YI Ew (%)
Main effects:
A:EVOO concentration (g/kg)
0 60.79 a -3.85 a 10.14 a 22.42 b
10 62.95 b -3.70 b 13.73 b 25.73 a
25 63.68 c -3.54 c 18.58 c 20.72 d
50 66.04 d -3.11 d 24.08 d 21.52 c
50b 65.70 e -3.14 d 23.47 e 21.85 b, c
P values <0.001 <0.001 <0.001 <0.001
LSD (99%) 0.07 0.02 0.20 0.71
B:Cryoprotectant addition
Without κ-C and XG 62.85 a -3.59 a 16.74 a -
With κ-C and XG 64.81 b -3.34 b 19.26 b -
P values <0.001 <0.001 <0.001 -
LSD (99%) 0.04 0.01 0.13 -
C:Processing
Fresh 63.33 a -3.53 a 18.03 a 21.01 a
Frozen/thawed 64.33 b -3.40 b 17.97 a 23.89 b
P values <0.001 <0.001 0.17 <0.001
LSD (99%) 0.04 0.01 0.13 0.45
Interactions
AB <0.001 <0.001 <0.001 -
AC <0.001 <0.001 <0.001 <0.001
BC <0.001 0.34 <0.001 -
ABC <0.001 <0.001 <0.001 -
EVOO, extra virgin olive oil; LSD, least significant difference; MP, mashed potato.
Texture of extra virgin olive oil-enriched mashed potatoes…
91
The differences between the L* values of the MPA samples and their MPB
counterparts increased with increasing the EVOO content (Fig. 2A). In emulsions, XG
is added to the aqueous phase to prevent droplets from rapidly creaming and
coalescence (Parker et al. 1995; Sun and Gunasekaran 2009). In this study oil droplet
diameters were not measured, but it is probable that the droplets in the MPB samples
were smaller than in the ones without cryoprotectants as the presence of XG in the
system would prevent coalescence. The reason why the L* values were lower in the
MPA samples, then, is that reflectance decreases with increasing droplet diameter. Note
that in the MPB samples the L* value was greater when the EVOO was added after
cooking (50b g/kg), whereas in the MPA systems it was greater in the samples with 50
g/kg EVOO added before cooking. This discrepancy could also be related to the
presence of cryoprotectants in the system. MP with EVOO added before final
homogenization would be expected to have larger droplets because the oil was not
thoroughly triturated. In the presence of XG, the droplets scatter light more effectively
when the oil is not so strongly entrapped in the matrix. In the MPA samples on the other
hand, reflectance probably decreased because the scattering efficiency of the droplets
decreases above a certain droplet size (Chantrapornchai et al. 1999).
In turn, as the droplet concentration increases, more reflected light travels through
the oil phase of the MP being absorbed by the pigments mentioned earlier, intensifying
the color of the MP (Figs. 2B, C). However, as regards YI values, there were small
differences between FMP and F/TMP samples. Anyway, the color differences found
between samples, although significant, should not be of major importance in practical
terms.
Ew changed significantly with EVOO concentration and processing (Table 2), and
the AC interaction had a significant effect on the WHC of the samples (Fig. 2d). In this
Texture of extra virgin olive oil-enriched mashed potatoes…
92
study, addition of κ-C and XG reduced the Ew of both FMP and F/TMP samples to 0%,
corroborating the well-established ability of XG to reduce water separation (Alvarez et
al. 2008, 2009; Arocas et al. 2009), and evidencing the existence of XG-water or XG-
water-XG interactions in the systems. XG is an anionic, hygroscopic material of
exceptional pseudoplasticity (Baranowska et al. 2008); its texturizing effect can be
achieved at low gum concentration because of unusual water-holding ability. Also,
adding XG (0.3% w/w) to corn starch pastes (10% w/w) minimized amylose
retrogradation, syneresis and rheological changes after freezing (Ferrero et al. 1994).
Certainly, the Ew values confirm that XG effectively stabilizes MP against syneresis
when no more than 1.5 g/kg is added.
Besides, WHC was greater in the FMP samples than in their F/TMP counterparts
at all EVOO concentrations (Fig. 2d). This result is probably related to structural
damage caused by freezing. The addition of EVOO at low concentrations significantly
increased Ew, mainly in the processed samples, which is likely due to that the interchain
spaces were occupied by oil, displacing the water (Liehr and Kuliche 1996). However,
the addition of EVOO at higher concentrations significantly reduced water loss,
probably because excess oil hindered the release of water from the starch matrix. EVOO
by itself was not effective in enhancing the WHC of MP. In any case Ew percentages
were also quite high (> 20) in both FMP and F/TMP samples without added EVOO,
evidencing the presence of weak starch-water or starch-water-starch interactions in all
the systems. Water separation in the MPA samples is related to starch retrogradation
and consequent reduction of WHC (BeMiller and Whistler 1996).
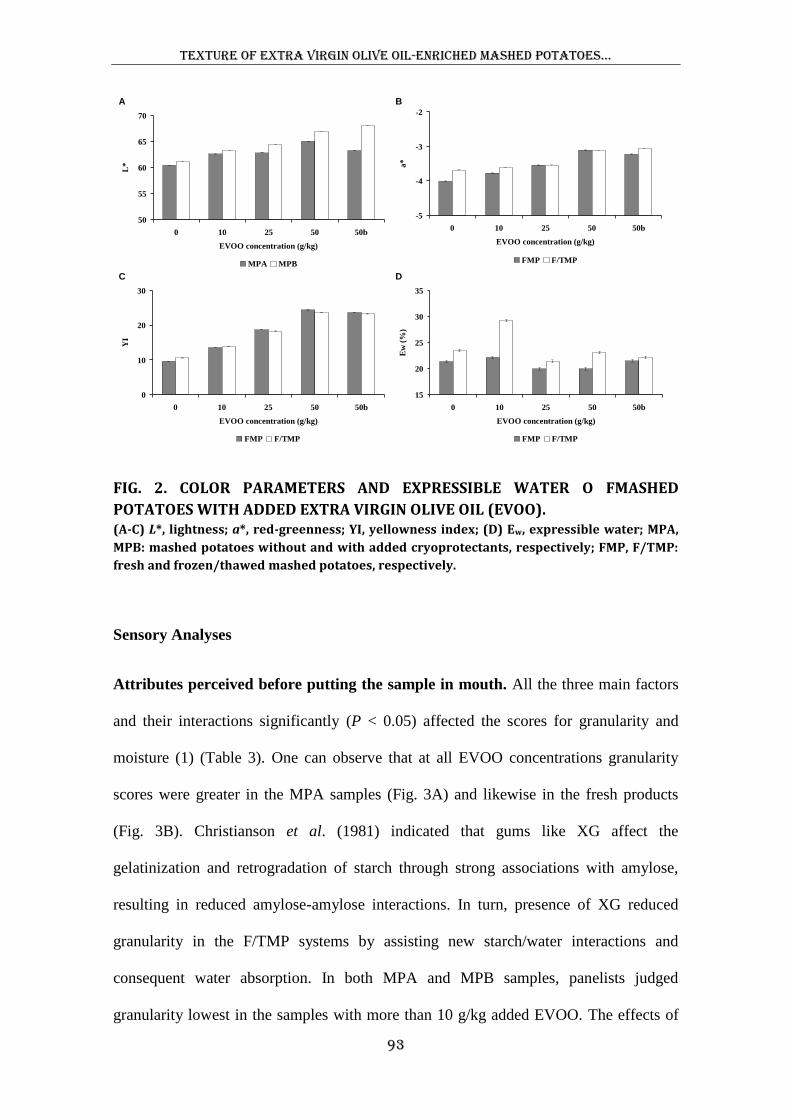
Texture of extra virgin olive oil-enriched mashed potatoes…
93
FIG. 2. COLOR PARAMETERS AND EXPRESSIBLE WATER O FMASHED
POTATOES WITH ADDED EXTRA VIRGIN OLIVE OIL (EVOO). (A-C) L*, lightness; a*, red-greenness; YI, yellowness index; (D) Ew, expressible water; MPA,
MPB: mashed potatoes without and with added cryoprotectants, respectively; FMP, F/TMP:
fresh and frozen/thawed mashed potatoes, respectively.
Sensory Analyses
Attributes perceived before putting the sample in mouth. All the three main factors
and their interactions significantly (P < 0.05) affected the scores for granularity and
moisture (1) (Table 3). One can observe that at all EVOO concentrations granularity
scores were greater in the MPA samples (Fig. 3A) and likewise in the fresh products
(Fig. 3B). Christianson et al. (1981) indicated that gums like XG affect the
gelatinization and retrogradation of starch through strong associations with amylose,
resulting in reduced amylose-amylose interactions. In turn, presence of XG reduced
granularity in the F/TMP systems by assisting new starch/water interactions and
consequent water absorption. In both MPA and MPB samples, panelists judged
granularity lowest in the samples with more than 10 g/kg added EVOO. The effects of
A B
C D
50
55
60
65
70
0 10 25 50 50b
EVOO concentration (g/kg)
L*
MPA MPB
-5
-4
-3
-2
0 10 25 50 50b
EVOO concentration (g/kg)
a*
FMP F/TMP
0
10
20
30
0 10 25 50 50b
EVOO concentration (g/kg)
YI
FMP F/TMP
15
20
25
30
35
0 10 25 50 50b
EVOO concentration (g/kg)
Ew
(%
)
FMP F/TMP
Texture of extra virgin olive oil-enriched mashed potatoes…
94
EVOO on granularity are related to the lubricating and coating properties conferred by
the oil as reported for vanilla custard desserts (De wijk et al. 2003).
In turn, moisture (1) decreased significantly with respect to MPA samples with
the addition of cryoprotectants in both FMP and F/TMP (Fig. 3C). Panelists detected
greater ability to hold water molecules in MPB samples, confirming the results for Ew
values. Similarly, panelists detected less aqueousness in the processed samples than in
the fresh ones, probably due to water loss.
Attributes perceived at the time of putting the sample in the mouth. Stickiness
scores were significantly higher in the MPB samples, although there were no
differences in these scores as a consequence of EVOO concentration or processing
(Table 3; Fig. 3D). In turn, the three factors significantly affected scores for denseness,
homogeneity, moisture (2) and firmness. Denseness was significantly higher in the
processed than in the fresh samples only when EVOO was added at the highest
concentrations (Fig. 3E). Also, denseness was lower in the MPA than in the MPB
samples (Fig. 3F), and only in this latter case were denseness scores significantly higher
in the F/TMP samples than in their FMP counterparts.
When EVOO concentration was increased, homogeneity increased in both MPA
and MPB samples (Fig. 3G). Note that the presence of EVOO in the systems rendered
differences in homogeneity among MPA and MPB samples less appreciable. Also,
when EVOO concentration was increased (Fig. 3H), homogeneity increased in the FMP
products but was almost constant in the processed samples. This indicates a positive
effect of adding EVOO to MP, since the negative effect of freezing on this attribute is
masked by the oil. Panelists detected reduced moisture (2) in the MPB samples and in
Texture of extra virgin olive oil-enriched mashed potatoes…
95
the processed systems, and when the EVOO concentration was increased, moisture (2)
significantly increased when cryoprotectants were also added (Fig. 3I).
In turn, panelists detected reduced firmness in the samples with added EVOO,
without added cryoprotectants and without processing. One can observe that the
processed samples with the lower and higher EVOO concentrations were the firmest,
whereas in the systems with 25 g kg-1
added EVOO the fresh samples had similar
firmness than the control (Fig. 4A). In the MPA samples there were no differences
between firmness scores in fresh and processed samples (Fig. 4b); however, panelists
detected increased firmness in processed MP with added κ-C and XG, matching the
result for textural properties in MPB samples (Figs. 1c,f).
Attributes perceived at the time of preparing the sample in the mouth for
swallowing. EVOO concentration, cryoprotectant addition and processing also had a
significant effect on cohesiveness, adhesiveness and fibrousness (1) (Table 3). When
EVOO concentration was increased, cohesiveness and adhesiveness scores decreased
significantly in the MPB samples (Figs. 4C,D). In the MPA samples there were no
significant differences between the adhesiveness scores of fresh and processed samples
(Fig. 4E), whereas panelists scored the processed MPB samples higher for adhesiveness
than their fresh counterparts. Scores for fibrousness (1) also decreased with increasing
EVOO concentration, with cryoprotectant addition and with processing (Figs. 4F,G).
Again, addition of cryprotectants reduced differences in fibrousness (1) between fresh
and processed samples. This is probably related to the fact that the hydrocolloids can
make systems in the rubbery state more viscous, reducing molecular mobility and
preventing retrogradation (Ferrero et al .1994).
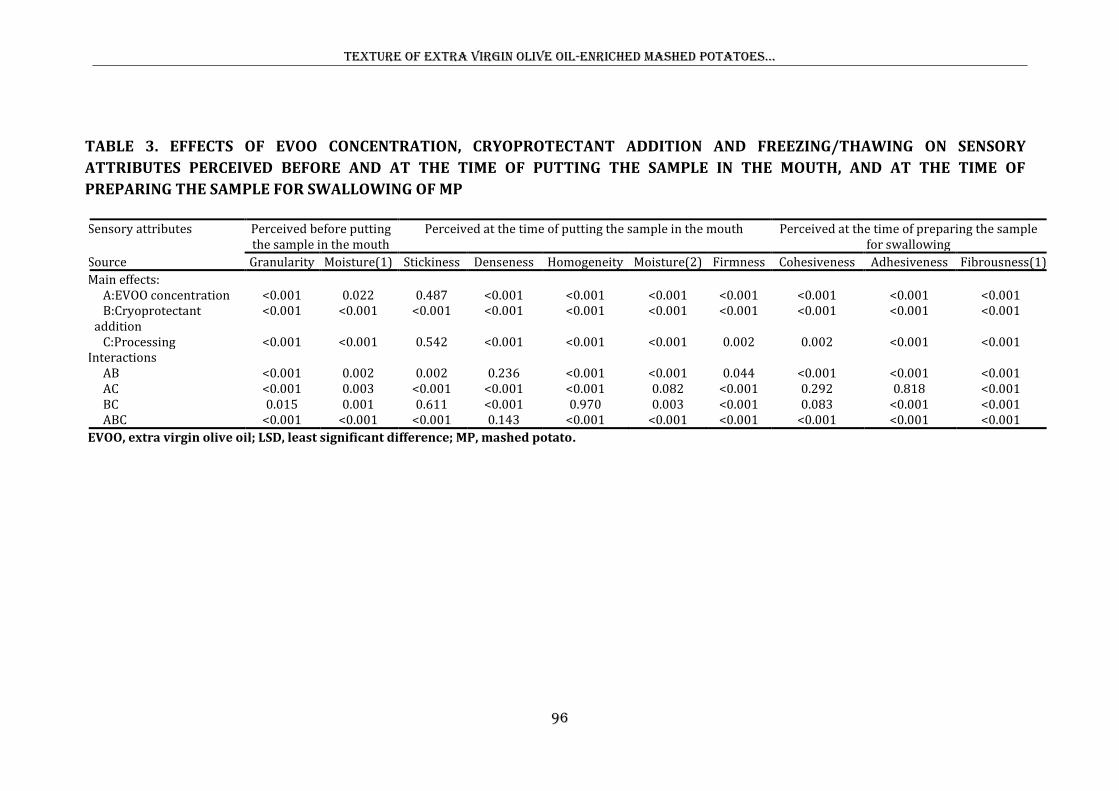
Texture of extra virgin olive oil-enriched mashed potatoes…
96
TABLE 3. EFFECTS OF EVOO CONCENTRATION, CRYOPROTECTANT ADDITION AND FREEZING/THAWING ON SENSORY
ATTRIBUTES PERCEIVED BEFORE AND AT THE TIME OF PUTTING THE SAMPLE IN THE MOUTH, AND AT THE TIME OF
PREPARING THE SAMPLE FOR SWALLOWING OF MP
Sensory attributes Perceived before putting the sample in the mouth
Perceived at the time of putting the sample in the mouth Perceived at the time of preparing the sample for swallowing
Source Granularity Moisture(1) Stickiness Denseness Homogeneity Moisture(2) Firmness Cohesiveness Adhesiveness Fibrousness(1)
Main effects: A:EVOO concentration <0.001 0.022 0.487 <0.001 <0.001 <0.001 <0.001 <0.001 <0.001 <0.001 B:Cryoprotectant addition
<0.001 <0.001 <0.001 <0.001 <0.001 <0.001 <0.001 <0.001 <0.001 <0.001
C:Processing <0.001 <0.001 0.542 <0.001 <0.001 <0.001 0.002 0.002 <0.001 <0.001 Interactions
AB <0.001 0.002 0.002 0.236 <0.001 <0.001 0.044 <0.001 <0.001 <0.001 AC <0.001 0.003 <0.001 <0.001 <0.001 0.082 <0.001 0.292 0.818 <0.001 BC 0.015 0.001 0.611 <0.001 0.970 0.003 <0.001 0.083 <0.001 <0.001 ABC <0.001 <0.001 <0.001 0.143 <0.001 <0.001 <0.001 <0.001 <0.001 <0.001
EVOO, extra virgin olive oil; LSD, least significant difference; MP, mashed potato.
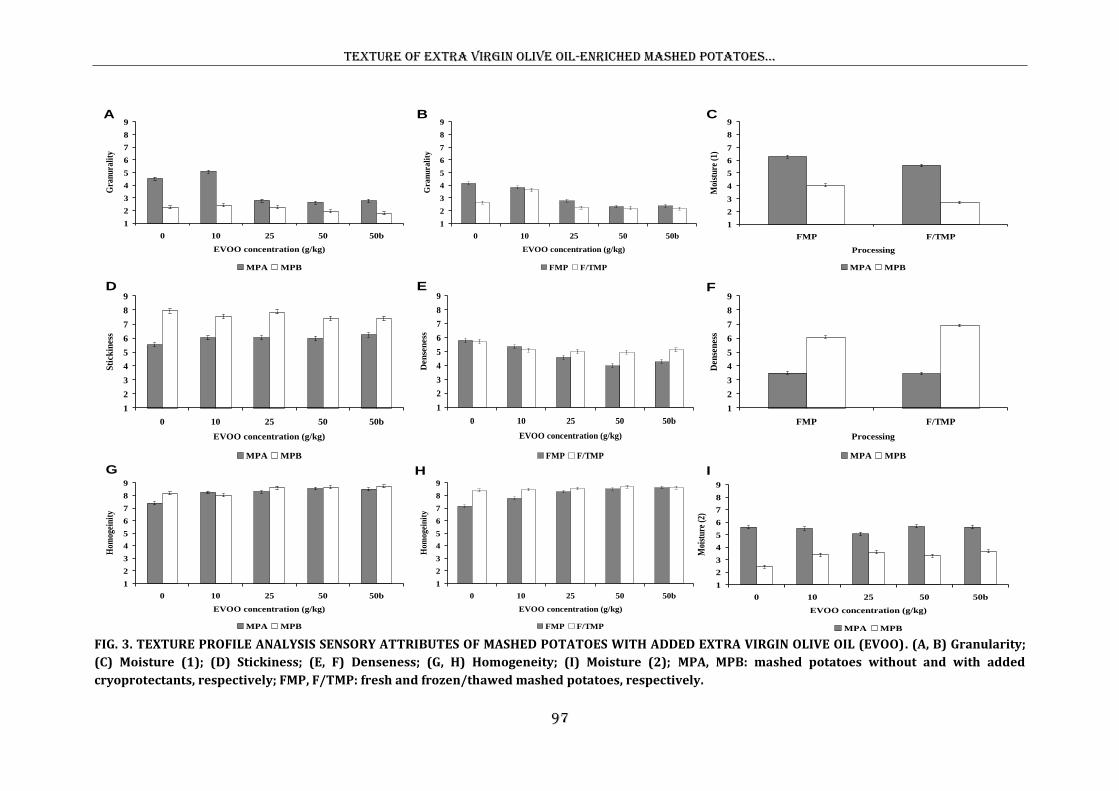
Texture of extra virgin olive oil-enriched mashed potatoes…
97
FIG. 3. TEXTURE PROFILE ANALYSIS SENSORY ATTRIBUTES OF MASHED POTATOES WITH ADDED EXTRA VIRGIN OLIVE OIL (EVOO). (A, B) Granularity;
(C) Moisture (1); (D) Stickiness; (E, F) Denseness; (G, H) Homogeneity; (I) Moisture (2); MPA, MPB: mashed potatoes without and with added
cryoprotectants, respectively; FMP, F/TMP: fresh and frozen/thawed mashed potatoes, respectively.
1
2
3
4
5
6
7
8
9
0 10 25 50 50b
EVOO concentration (g/kg)
Hom
ogei
nit
y
MPA MPB
1
2
3
4
5
6
7
8
9
0 10 25 50 50b
EVOO concentration (g/kg)
Gra
nu
rali
ty
MPA MPB
A B C
D E F
G H I
1
2
3
4
5
6
7
8
9
0 10 25 50 50b
EVOO concentration (g/kg)
Gra
nu
rali
ty
FMP F/TMP
1
2
3
4
5
6
7
8
9
0 10 25 50 50b
EVOO concentration (g/kg)
Sti
ckin
ess
MPA MPB
1
2
3
4
5
6
7
8
9
0 10 25 50 50b
EVOO concentration (g/kg)
Den
sen
ess
FMP F/TMP
1
2
3
4
5
6
7
8
9
0 10 25 50 50b
EVOO concentration (g/kg)
Ho
mo
gei
nit
y
FMP F/TMP
1
2
3
4
5
6
7
8
9
0 10 25 50 50b
EVOO concentration (g/kg)
Moi
stur
e (2
)
MPA MPB
1
2
3
4
5
6
7
8
9
FMP F/TMP
Processing
Moi
stu
re (
1)
MPA MPB
1
2
3
4
5
6
7
8
9
FMP F/TMP
Processing
Den
sen
ess
MPA MPB
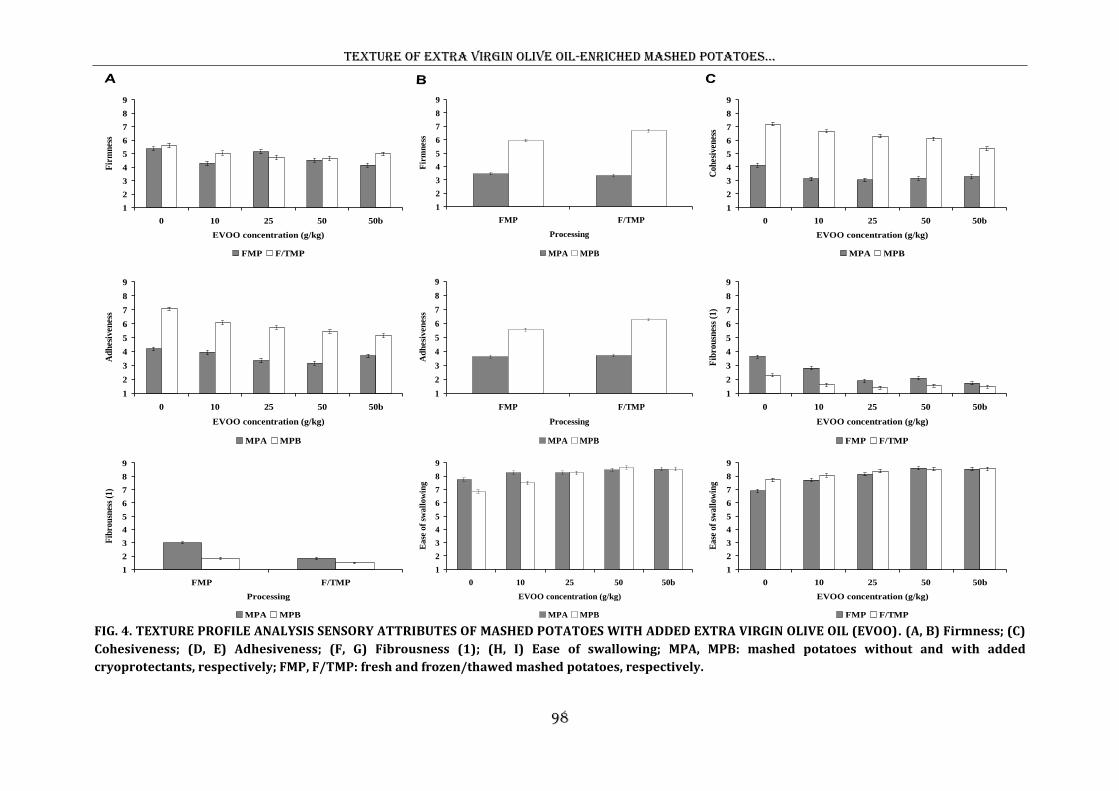
Texture of extra virgin olive oil-enriched mashed potatoes…
98
FIG. 4. TEXTURE PROFILE ANALYSIS SENSORY ATTRIBUTES OF MASHED POTATOES WITH ADDED EXTRA VIRGIN OLIVE OIL (EVOO). (A, B) Firmness; (C)
Cohesiveness; (D, E) Adhesiveness; (F, G) Fibrousness (1); (H, I) Ease of swallowing; MPA, MPB: mashed potatoes without and with added
cryoprotectants, respectively; FMP, F/TMP: fresh and frozen/thawed mashed potatoes, respectively.
1
2
3
4
5
6
7
8
9
0 10 25 50 50b
EVOO concentration (g/kg)
Fir
mn
ess
FMP F/TMP
1
2
3
4
5
6
7
8
9
0 10 25 50 50b
EVOO concentration (g/kg)
Co
hes
iven
ess
MPA MPB
1
2
3
4
5
6
7
8
9
0 10 25 50 50b
EVOO concentration (g/kg)
Ad
hes
iven
ess
MPA MPB
1
2
3
4
5
6
7
8
9
0 10 25 50 50b
EVOO concentration (g/kg)
Fib
rou
snes
s (1
)
FMP F/TMP
1
2
3
4
5
6
7
8
9
0 10 25 50 50b
EVOO concentration (g/kg)
Ea
se o
f sw
all
ow
ing
MPA MPB
1
2
3
4
5
6
7
8
9
0 10 25 50 50b
EVOO concentration (g/kg)
Ea
se o
f sw
all
ow
ing
FMP F/TMP
1
2
3
4
5
6
7
8
9
FMP F/TMP
Processing
Fir
mn
ess
MPA MPB
1
2
3
4
5
6
7
8
9
FMP F/TMP
ProcessingA
dh
esi
ven
ess
MPA MPB
1
2
3
4
5
6
7
8
9
FMP F/TMP
Processing
Fib
rou
snes
s (1
)
MPA MPB
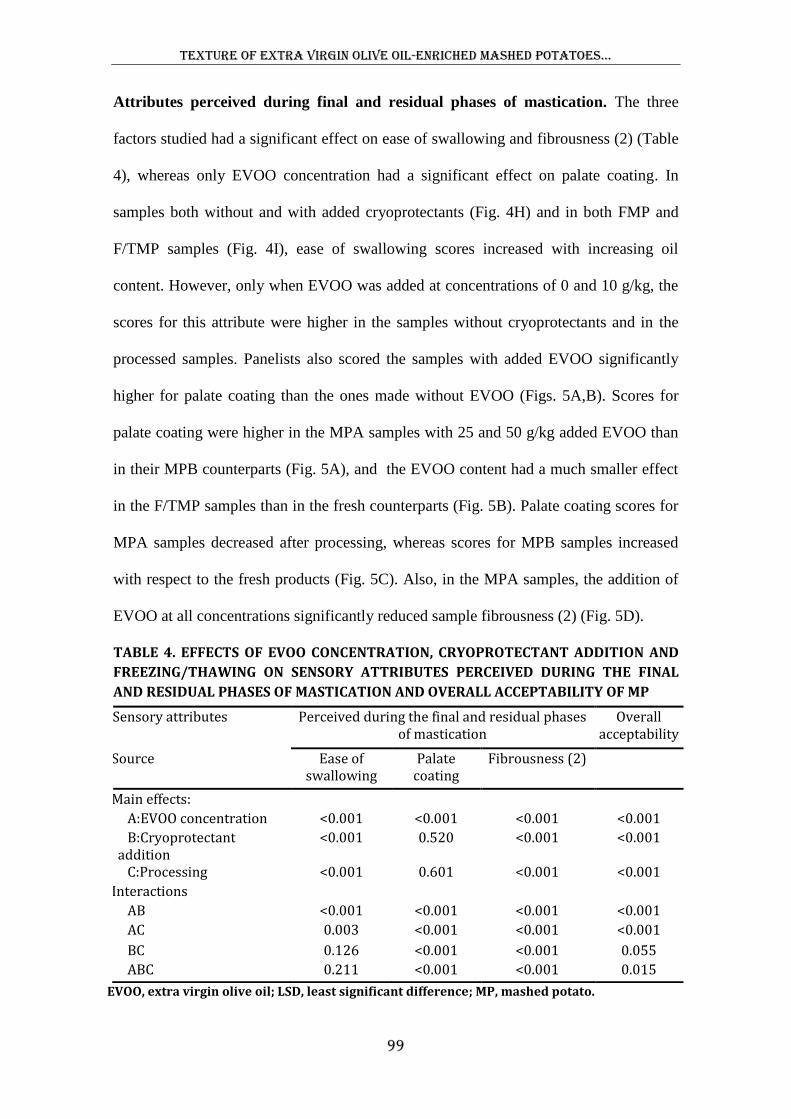
Texture of extra virgin olive oil-enriched mashed potatoes…
99
Attributes perceived during final and residual phases of mastication. The three
factors studied had a significant effect on ease of swallowing and fibrousness (2) (Table
4), whereas only EVOO concentration had a significant effect on palate coating. In
samples both without and with added cryoprotectants (Fig. 4H) and in both FMP and
F/TMP samples (Fig. 4I), ease of swallowing scores increased with increasing oil
content. However, only when EVOO was added at concentrations of 0 and 10 g/kg, the
scores for this attribute were higher in the samples without cryoprotectants and in the
processed samples. Panelists also scored the samples with added EVOO significantly
higher for palate coating than the ones made without EVOO (Figs. 5A,B). Scores for
palate coating were higher in the MPA samples with 25 and 50 g/kg added EVOO than
in their MPB counterparts (Fig. 5A), and the EVOO content had a much smaller effect
in the F/TMP samples than in the fresh counterparts (Fig. 5B). Palate coating scores for
MPA samples decreased after processing, whereas scores for MPB samples increased
with respect to the fresh products (Fig. 5C). Also, in the MPA samples, the addition of
EVOO at all concentrations significantly reduced sample fibrousness (2) (Fig. 5D).
TABLE 4. EFFECTS OF EVOO CONCENTRATION, CRYOPROTECTANT ADDITION AND
FREEZING/THAWING ON SENSORY ATTRIBUTES PERCEIVED DURING THE FINAL
AND RESIDUAL PHASES OF MASTICATION AND OVERALL ACCEPTABILITY OF MP
EVOO, extra virgin olive oil; LSD, least significant difference; MP, mashed potato.
¡Sensory attributes Perceived during the final and residual phases of mastication
Overall acceptability
Source Ease of swallowing
Palate coating
Fibrousness (2)
Main effects:
A:EVOO concentration <0.001 <0.001 <0.001 <0.001
B:Cryoprotectant addition
<0.001 0.520 <0.001 <0.001
C:Processing <0.001 0.601 <0.001 <0.001
Interactions
AB <0.001 <0.001 <0.001 <0.001
AC 0.003 <0.001 <0.001 <0.001
BC 0.126 <0.001 <0.001 0.055
ABC 0.211 <0.001 <0.001 0.015
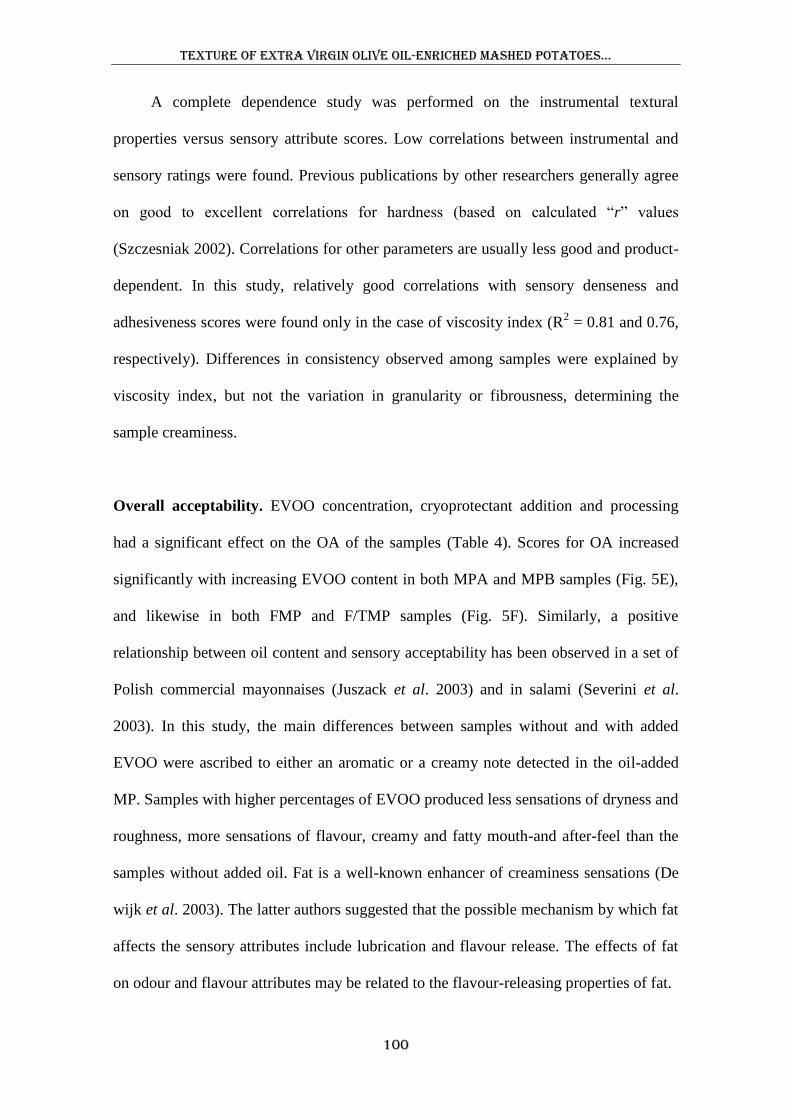
Texture of extra virgin olive oil-enriched mashed potatoes…
100
A complete dependence study was performed on the instrumental textural
properties versus sensory attribute scores. Low correlations between instrumental and
sensory ratings were found. Previous publications by other researchers generally agree
on good to excellent correlations for hardness (based on calculated “r” values
(Szczesniak 2002). Correlations for other parameters are usually less good and product-
dependent. In this study, relatively good correlations with sensory denseness and
adhesiveness scores were found only in the case of viscosity index (R2 = 0.81 and 0.76,
respectively). Differences in consistency observed among samples were explained by
viscosity index, but not the variation in granularity or fibrousness, determining the
sample creaminess.
Overall acceptability. EVOO concentration, cryoprotectant addition and processing
had a significant effect on the OA of the samples (Table 4). Scores for OA increased
significantly with increasing EVOO content in both MPA and MPB samples (Fig. 5E),
and likewise in both FMP and F/TMP samples (Fig. 5F). Similarly, a positive
relationship between oil content and sensory acceptability has been observed in a set of
Polish commercial mayonnaises (Juszack et al. 2003) and in salami (Severini et al.
2003). In this study, the main differences between samples without and with added
EVOO were ascribed to either an aromatic or a creamy note detected in the oil-added
MP. Samples with higher percentages of EVOO produced less sensations of dryness and
roughness, more sensations of flavour, creamy and fatty mouth-and after-feel than the
samples without added oil. Fat is a well-known enhancer of creaminess sensations (De
wijk et al. 2003). The latter authors suggested that the possible mechanism by which fat
affects the sensory attributes include lubrication and flavour release. The effects of fat
on odour and flavour attributes may be related to the flavour-releasing properties of fat.
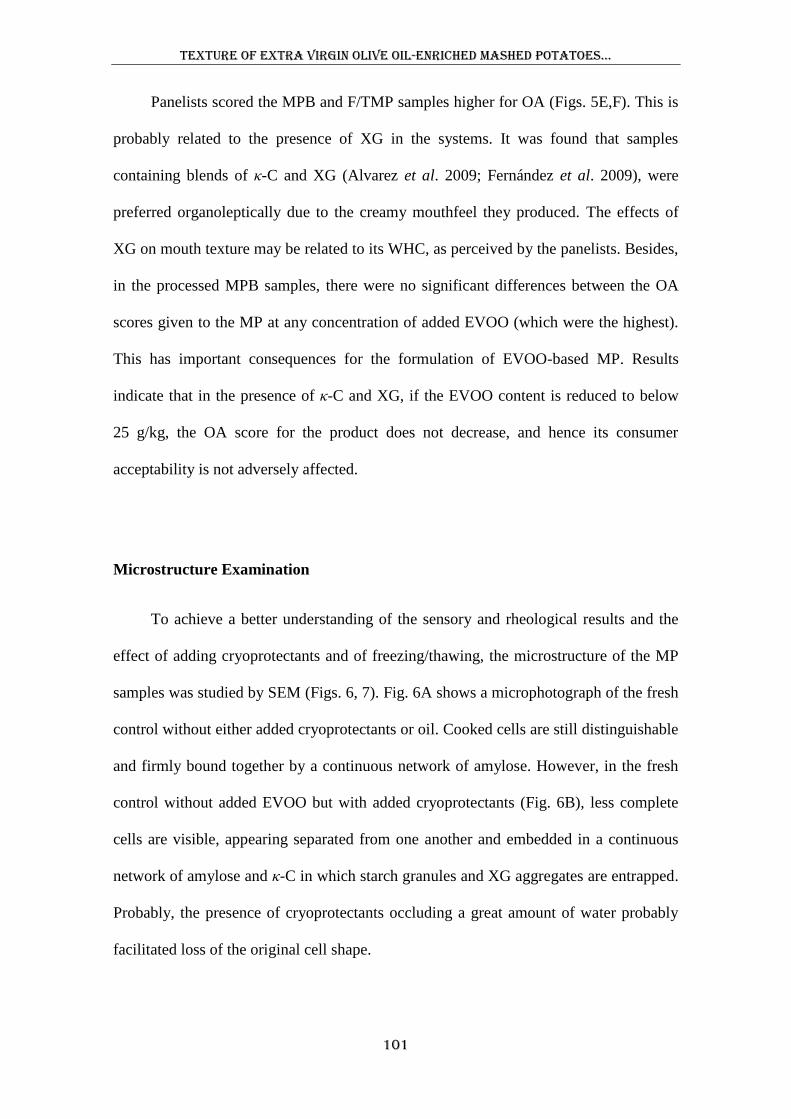
Texture of extra virgin olive oil-enriched mashed potatoes…
101
Panelists scored the MPB and F/TMP samples higher for OA (Figs. 5E,F). This is
probably related to the presence of XG in the systems. It was found that samples
containing blends of κ-C and XG (Alvarez et al. 2009; Fernández et al. 2009), were
preferred organoleptically due to the creamy mouthfeel they produced. The effects of
XG on mouth texture may be related to its WHC, as perceived by the panelists. Besides,
in the processed MPB samples, there were no significant differences between the OA
scores given to the MP at any concentration of added EVOO (which were the highest).
This has important consequences for the formulation of EVOO-based MP. Results
indicate that in the presence of κ-C and XG, if the EVOO content is reduced to below
25 g/kg, the OA score for the product does not decrease, and hence its consumer
acceptability is not adversely affected.
Microstructure Examination
To achieve a better understanding of the sensory and rheological results and the
effect of adding cryoprotectants and of freezing/thawing, the microstructure of the MP
samples was studied by SEM (Figs. 6, 7). Fig. 6A shows a microphotograph of the fresh
control without either added cryoprotectants or oil. Cooked cells are still distinguishable
and firmly bound together by a continuous network of amylose. However, in the fresh
control without added EVOO but with added cryoprotectants (Fig. 6B), less complete
cells are visible, appearing separated from one another and embedded in a continuous
network of amylose and κ-C in which starch granules and XG aggregates are entrapped.
Probably, the presence of cryoprotectants occluding a great amount of water probably
facilitated loss of the original cell shape.
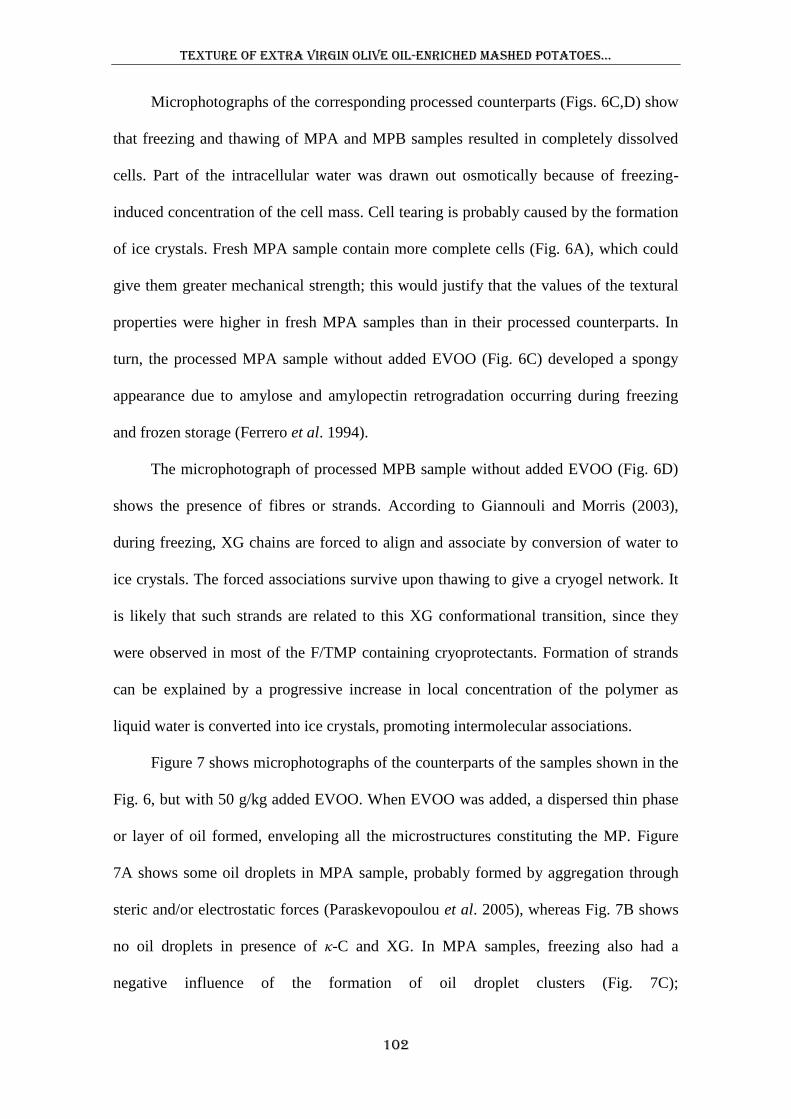
Texture of extra virgin olive oil-enriched mashed potatoes…
102
Microphotographs of the corresponding processed counterparts (Figs. 6C,D) show
that freezing and thawing of MPA and MPB samples resulted in completely dissolved
cells. Part of the intracellular water was drawn out osmotically because of freezing-
induced concentration of the cell mass. Cell tearing is probably caused by the formation
of ice crystals. Fresh MPA sample contain more complete cells (Fig. 6A), which could
give them greater mechanical strength; this would justify that the values of the textural
properties were higher in fresh MPA samples than in their processed counterparts. In
turn, the processed MPA sample without added EVOO (Fig. 6C) developed a spongy
appearance due to amylose and amylopectin retrogradation occurring during freezing
and frozen storage (Ferrero et al. 1994).
The microphotograph of processed MPB sample without added EVOO (Fig. 6D)
shows the presence of fibres or strands. According to Giannouli and Morris (2003),
during freezing, XG chains are forced to align and associate by conversion of water to
ice crystals. The forced associations survive upon thawing to give a cryogel network. It
is likely that such strands are related to this XG conformational transition, since they
were observed in most of the F/TMP containing cryoprotectants. Formation of strands
can be explained by a progressive increase in local concentration of the polymer as
liquid water is converted into ice crystals, promoting intermolecular associations.
Figure 7 shows microphotographs of the counterparts of the samples shown in the
Fig. 6, but with 50 g/kg added EVOO. When EVOO was added, a dispersed thin phase
or layer of oil formed, enveloping all the microstructures constituting the MP. Figure
7A shows some oil droplets in MPA sample, probably formed by aggregation through
steric and/or electrostatic forces (Paraskevopoulou et al. 2005), whereas Fig. 7B shows
no oil droplets in presence of κ-C and XG. In MPA samples, freezing also had a
negative influence of the formation of oil droplet clusters (Fig. 7C);
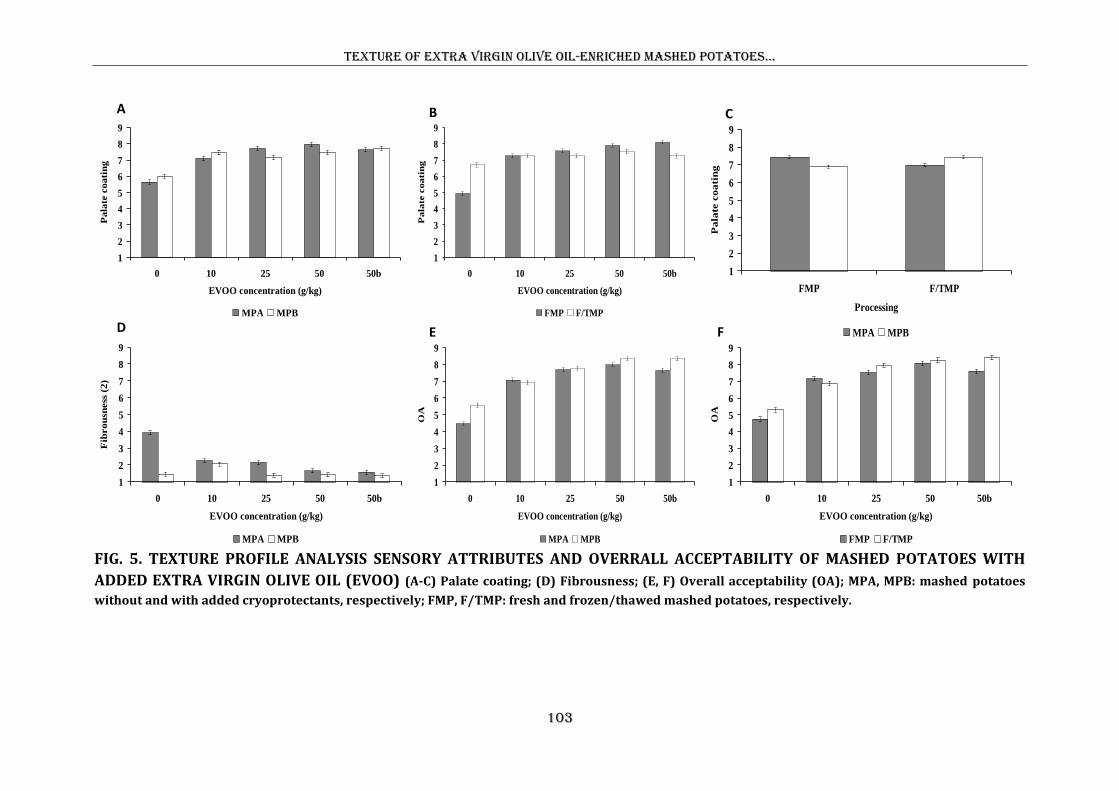
Texture of extra virgin olive oil-enriched mashed potatoes…
103
FIG. 5. TEXTURE PROFILE ANALYSIS SENSORY ATTRIBUTES AND OVERRALL ACCEPTABILITY OF MASHED POTATOES WITH
ADDED EXTRA VIRGIN OLIVE OIL (EVOO) (A-C) Palate coating; (D) Fibrousness; (E, F) Overall acceptability (OA); MPA, MPB: mashed potatoes
without and with added cryoprotectants, respectively; FMP, F/TMP: fresh and frozen/thawed mashed potatoes, respectively.
1
2
3
4
5
6
7
8
9
0 10 25 50 50b
EVOO concentration (g/kg)
Fib
ro
usn
ess
(2
)
MPA MPB
1
2
3
4
5
6
7
8
9
0 10 25 50 50b
EVOO concentration (g/kg)
Pa
late
co
ati
ng
FMP F/TMP
1
2
3
4
5
6
7
8
9
0 10 25 50 50b
EVOO concentration (g/kg)
OA
MPA MPB
1
2
3
4
5
6
7
8
9
0 10 25 50 50b
EVOO concentration (g/kg)
OA
FMP F/TMP
1
2
3
4
5
6
7
8
9
0 10 25 50 50b
EVOO concentration (g/kg)
Pa
late
co
ati
ng
MPA MPB
1
2
3
4
5
6
7
8
9
FMP F/TMP
Processing
Pa
late
co
ati
ng
MPA MPB
A
A B C
D E F
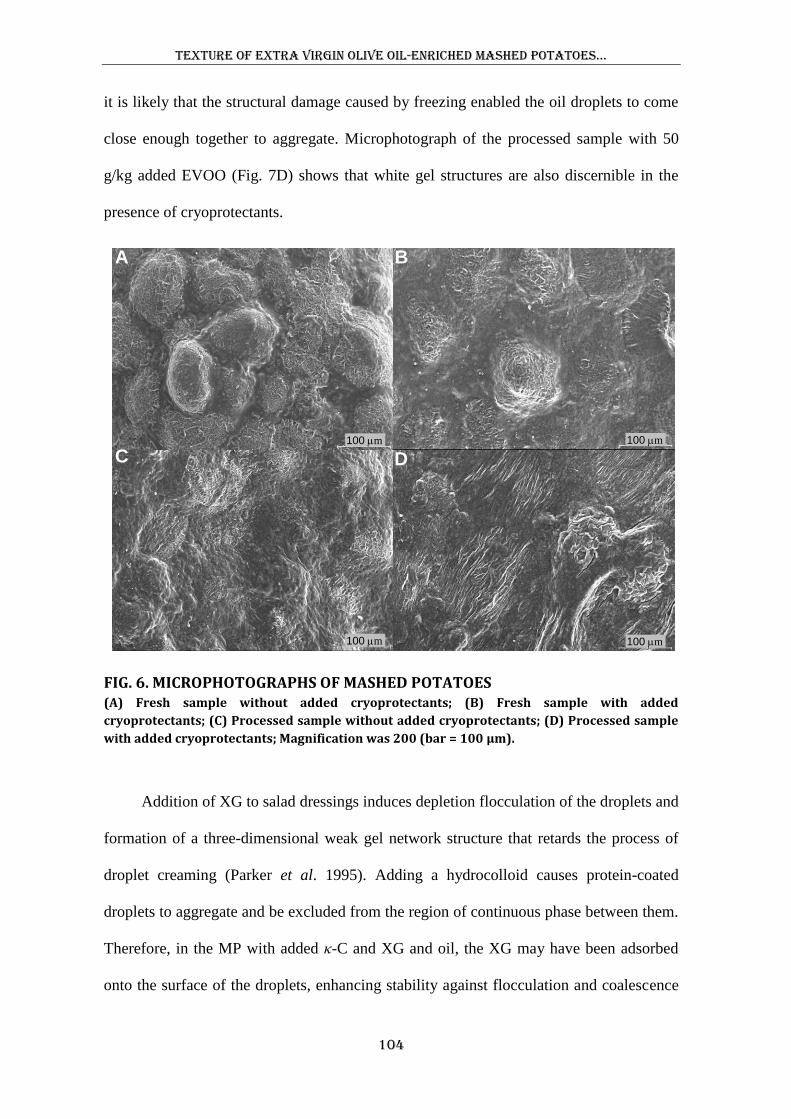
Texture of extra virgin olive oil-enriched mashed potatoes…
104
it is likely that the structural damage caused by freezing enabled the oil droplets to come
close enough together to aggregate. Microphotograph of the processed sample with 50
g/kg added EVOO (Fig. 7D) shows that white gel structures are also discernible in the
presence of cryoprotectants.
FIG. 6. MICROPHOTOGRAPHS OF MASHED POTATOES (A) Fresh sample without added cryoprotectants; (B) Fresh sample with added
cryoprotectants; (C) Processed sample without added cryoprotectants; (D) Processed sample
with added cryoprotectants; Magnification was 200 (bar = 100 μm).
Addition of XG to salad dressings induces depletion flocculation of the droplets and
formation of a three-dimensional weak gel network structure that retards the process of
droplet creaming (Parker et al. 1995). Adding a hydrocolloid causes protein-coated
droplets to aggregate and be excluded from the region of continuous phase between them.
Therefore, in the MP with added κ-C and XG and oil, the XG may have been adsorbed
onto the surface of the droplets, enhancing stability against flocculation and coalescence
B
D
A
C100 mm
100 mm
100 mm
100 mm
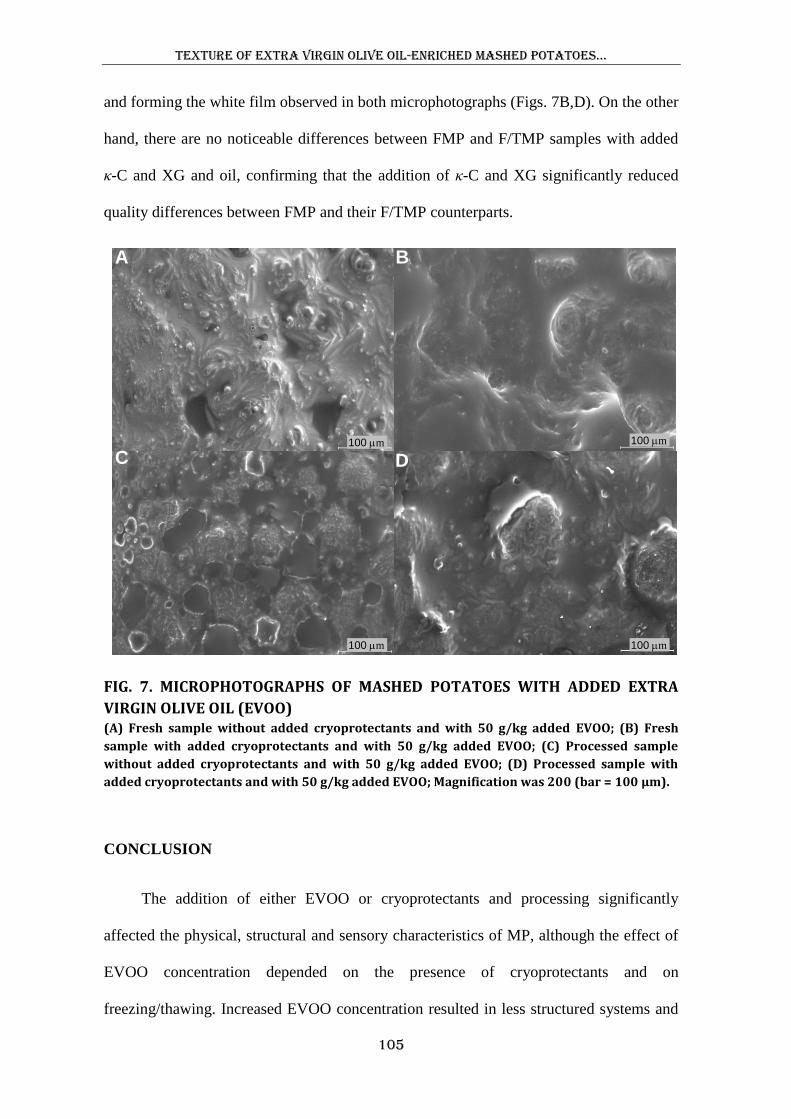
Texture of extra virgin olive oil-enriched mashed potatoes…
105
and forming the white film observed in both microphotographs (Figs. 7B,D). On the other
hand, there are no noticeable differences between FMP and F/TMP samples with added
κ-C and XG and oil, confirming that the addition of κ-C and XG significantly reduced
quality differences between FMP and their F/TMP counterparts.
FIG. 7. MICROPHOTOGRAPHS OF MASHED POTATOES WITH ADDED EXTRA
VIRGIN OLIVE OIL (EVOO) (A) Fresh sample without added cryoprotectants and with 50 g/kg added EVOO; (B) Fresh
sample with added cryoprotectants and with 50 g/kg added EVOO; (C) Processed sample
without added cryoprotectants and with 50 g/kg added EVOO; (D) Processed sample with
added cryoprotectants and with 50 g/kg added EVOO; Magnification was 200 (bar = 100 μm).
CONCLUSION
The addition of either EVOO or cryoprotectants and processing significantly
affected the physical, structural and sensory characteristics of MP, although the effect of
EVOO concentration depended on the presence of cryoprotectants and on
freezing/thawing. Increased EVOO concentration resulted in less structured systems and
C D100 mm
100 mm
100 mm
100 mm
A B
Texture of extra virgin olive oil-enriched mashed potatoes…
106
enhancement of color due to an increase in overall light scattering and pigment content.
Addition of κ-C and XG improved thickness, possibly through the exclusion effect of
swollen starch granules promoting gelation of the κ-C. Addition of EVOO in increasing
concentrations enhanced the sensory quality of MP in terms of reduced granularity,
denseness, cohesiveness, adhesiveness and fibrousness, and increased homogeneity, ease
of swallowing and palate coating. Instrumental texture measurements were able to
distinguish the variations in mechanical textural attributes scored by the panellists.
Conversely, geometrical textural attributes (granularity, homogeneity and fibrousness)
have to be support by structural traits. Creaminess was the most crucial factor for OA of
the products and could be explained by the presence of EVOO aggregates observed by
microstructure analysis. Samples with 50 g/kg added EVOO were judged the best of all.
There is a possibility of using EVOO in combination with MP to provide a highly
nutritious product with improved physicochemical, functional and sensory characteristics.
ACKNOWLEDGEMENTS
The authors wish to thank the Spanish Ministry of Science and Innovation for
financial support (AGL2007-62851), and P. Adeva, I. Amurrio and A. García of the
Electron Miscroscopy Laboratory (CENIM-CSIC).
REFERENCES
ALVAREZ, M.D., FERNÁNDEZ, C. and CANET, W. 2005. Effect of freezing/thawing
conditions and long-term frozen storage on the quality of mashed potatoes. J. Food
Agric. 85, 2327-2340.
Texture of extra virgin olive oil-enriched mashed potatoes…
107
ALVAREZ, M.D., CANET, W. and FERNÁNDEZ, C. 2008. Effect of addition of
biopolymers on the mechanical properties, colour and sensory attributes of fresh and
frozen/thawed mashed potatoes. Eur. Food Res. Technol. 226, 1525-1544.
ALVAREZ, M.D., FERNÁNDEZ, C. and CANET, W. 2009. Enhancement of freezing
stability in mashed potatoes by the incorporation of kappa-carrageenan and xanthan
gum blends. J. Sci. Food Agric. 89, 2115-2127.
ALVAREZ, M.D., FERNÁNDEZ, C. and CANET, W. Effect of cryoprotectant mixtures
on rheological properties of fresh and froze/thawed mashed potatoes J. Food Process
Eng. DOI: 10.1111/j.1745-4530.2008.00350.x
AROCAS, A., SANZ, T. and FISZMAN, S.M. 2009. Improving effect of xanthan and
locust bean gums on the freeze-thaw stability of white sauces made with different
native starches. Food Hydrocolloids 23, 2478-2484.
AYUSO, J., HARO, M.R. and ESCOLAR, D. 2004. Simulation of the visible spectra for
edible virgin oils: Potential uses. Appl. Spectr. 7, 474–480.
BARANOWSKA, H.M., SIKORA, M., KOWALSKI, S. and TOMASIK, P. 2008.
Interactions of potato starch with selected polysaccharide hydrocolloids as measured
by low-field NMR. Food Hydrocolloids 22, 336-345.
BEMILLER, J.N. and WHISTLER, R.L. 1996. Carbohydrates. In Food chemistry (O.R.
Fennema, ed.) pp. 157–224, Marcel Dekker, New York.
BOSKOU, D. and VISIOLI, F. 2003. Biophenols in olive oil and olives. In
Bioavailability of micronutrients and minor dietary compounds. Metabolic and
technological aspects (M.P. Vaquero, T. Garcia-Arias, A. Carbajal and F.J. Sanchez-
Muniz, eds.) pp. 161–169, Research Signpost, Kerala.
Texture of extra virgin olive oil-enriched mashed potatoes…
108
CAVELLA, S; DI MONACO, R., TORRIERI, E. and MASI, P. 2009. Structure of a new
functional walnut oil-enriched mayonnaise. 9th International Conference on Chemical
and Progress Engineering, pts 1-3. Chemical Engineering Transactions 17, 879-884.
CHANTRAPORNCHAI, W., CLYDESDALE, F. and MCCLEMENTS, D.J. 1999.
Influence of droplet characteristics on the optical properties of colored oil-in-water
emulsions. Colloid Surface A 155, 373-382.
CHRISTIANSON, D.D., HODGE, J.E., OSBORNE, D. and DETROY, R.W. 1981.
Gelatinization of wheat starch as modified by xanthan gum, guar gum, and cellulose
gum. Cereal Chem. 58(6), 513–517.
CRIADO, M.N., ROMERO, M.P., CASANOVAS, M. and MOTILVA, M.J. 2008.
Pigment profile and colour of monovarietal virgin olive oils from Arbequina cultivar
obtained during two consecutive crop seasons. Food Chem. 110, 873-880.
DICKINSON, E. and CHEN, J.S. 1999. Heat-set whey protein emulsion gels: Role of
active and inactive filler particles. J. Disper. Sci. Technol. 20, 197–213.
DE WIJK, R.A., VAN GEMERT, L.J., TERPSTRA, M.E.J. and WILKISON, C.L. 2003.
Texture of semi-solids; sensory and instrumental measurements on vanilla custard
desserts. Food Qual. Prefer. 14, 305-317.
DICKINSON, E. and CHEN, J.S. 1999. Heat-set whey protein emulsion gels: Role of
active and inactive filler particles. J. Disper. Sci. Thechnol. 20, 197-213.
ELIASSON, A.C. and KIM, H.R. 1992. Changes in rheological properties of
hydroxypropyl potato starch pastes during freeze-thaw treatments I. A rheological
approach for evaluation of freeze-thaw stability. J. Texture Studies 23, 279-295.
Texture of extra virgin olive oil-enriched mashed potatoes…
109
FERNÁNDEZ, C., ALVAREZ, M.D. and CANET, W. 2008. Steady shear and yield
stress of fresh and frozen/thawed mashed potatoes: effect of biopolymers addition.
Food Hydrocolloids 22, 1381-1395.
FERNÁNDEZ, C., CANET, W. and ALVAREZ, M.D. 2009. Quality of mashed
potatoes: effect of adding blends of kappa-carrageenan and xanthan gum. Eur. Food
Res. Technol. 229, 205-222.
FERRERO, C., MARTINO, M.N. and Zaritzky, N.E. 1994. Corn starch–xanthan gum
interaction and its effect on the stability during storage of frozen gelatinized
suspensions. Starch-Stärke 46(8), 300–308.
GIANNOULI, P. and MORRIS, E.R. 2003. Cryogelation of xanthan. Food Hydrocolloids
17, 495-501.
ISO 13299 2003. Sensory analysis – Methodology – General guidance for establishing a
sensory profile.
ISO 8586–1 1993. Sensory analysis – general guidance for the selection, training and
monitoring of assessors – part 1: selected assessors.
JUSZACK, L., FORTUNA, T. and KOSLA, A. 2003. Sensory and rheological properties
of Polish commercial mayonnaises. Nahrung 47, 232-235.
KIM, H.R. and ELIASSON, A.C. 1993. Changes in rheological properties of
hydroxypropyl potato starch pastes during freeze-thaw treatments II. Effect of molar
substitution and cross-linking. J. Texture Studies 24, 199-213.
Texture of extra virgin olive oil-enriched mashed potatoes…
110
LAMBERTI, M., GEISELMANN, A., CONDE-PETIT, B. and ESCHER, F. 2004.
Starch transformation and structure development in production and reconstitution of
potato flakes. LWT-Food Sci. Technol. 37, 417–427.
LIEHR, M. and KULICHE, W.M. 1996. Rheological examination of the influence of
hydrocolloids on the freeze-thaw-stability of starch gels. Starch-Stärke 48, 52-57.
MANDALA, I.G. and PALOGOU, E.D. 2003. Effect of preparation conditions and
starch/xanthan concentration on gelation process of potato starch systems. Int. J. Food
Prop. 6(2), 311–328.
MANDALA, I.G., SAVVAs, T.P. and KOSTAROPOULOS, A.E. 2004. Xanthan and
locust bean gum influence on the rheology and structure of a white model-sauce. J.
Food Eng. 64, 335–342.
MILDNER-SZKUDLARZ, S and JELEŃ, H.H. 2010. Detection of olive oil adulteration
with rapeseed and sunflower oils mos electronic nose and SMPE-MS. J. Food Qual
33, 21-41.
MUNIZ, F.J.S. 2007. Olive oil, life key in the Mediterranean area. Anales de la Real
Academia Nacional de Farmacia 73(3), 653-692.
OSORIO, F.A. and STEFFE, J.F. 1987. Back extrusion of power law fluids. J. Texture
Studies 18, 43-63.
PARASKEVOPOULOU, A., BOSKOU, D. and KIOSSEOGLOU, V. 2005. Stabilization
of olive oil- lemon juice emulsion with polysaccharides. Food Chem. 90, 627-634.
PARKER, A., GUNNING, P.A., NG, K. and ROBINS, M.M. 1995. How does xanthan
stabilise salad dressing? Food Hydrocolloids 9, 333–342.
Texture of extra virgin olive oil-enriched mashed potatoes…
111
SEVERINI, C., DE PILLI, T. and BAIANO, A. 2003. Partial substitution of pork backfat
with extra-virgin olive oil in ‘salami’ products: effects on chemical, physical and
sensorial quality. Meat Sci. 64, 323-331.
SUN, C. and GUNASEKARAN, S. 2009. Effects of protein concentration and oil-phase
volume fraction on the stability and rheology of menhaden oil-in-water emulsions
stabilized by whey protein isolate with xanthan gum. Food Hydrocolloids 23, 165-
174.
SZCZESNIAK, A.S. 2002. Texture is a sensory property. Food Qual. Pref. 13, 215–225.
UNE 87025 1996. Manual de análisis sensorial. Tomo I–Alimentación. Aenor, Madrid,
pp 167–186.
WHYBROW, S., HARRISON, C.L.S., MAYER, C. and STUBBS, R.J. 2006. Effects of
added fruits and vegetables on dietary intakes and body weight in Scottish adults.
British J. Nutr. 95, 496–503.

SENSORY AND TEXTURE PROPERTIES OF MASHED
POTATO INCORPORATED WITH INULIN AND OLIVE
OIL BLENDS.
María Dolores Alvarez, Cristina Fernández, María Dolores Olivares,
María José Jiménez and Wenceslao Canet.
International Journal of Food Properties 16 (2013), 1-21

Sensory and texture properties of mashed potato…
115
ABSTRACT
The effect of adding different ratios of inulin (INL) and extra virgin olive oil
(EVOO) blends, formulated without (MPA) and with cryoprotectants (MPB), on texture
properties of fresh (FMP) and frozen/thawed mashed potatoes (F/TMP) was studied. INL
and EVOO behaved like soft fillers, but INL was associated with increased fibrousness
and EVOO with increased creaminess. In the total dataset and FMP, F/TMP and MPA
subgroups, component 1 was a contrast between mechanical and surface textural
attributes, whereas in MPB samples component 1 was determined by geometrical
attributes. Addition of INL at 30 g/kg and EVOO at 45 g/kg is recommended.
KEYWORDS
Mashed potatoes, Inulin, Extra virgin olive oil, Principal component analysis,
Sensory properties, Back extrusion
INTRODUCTION
Recent changes in our lifestyles have led to an increasing demand for convenience
foods, and our growing awareness of the relationship between food and health has
increased the demand for higher-fiber, lower-fat products.[1]
However, the addition of
functional and nutritional food ingredients such as inulin (INL) and/or extra virgin olive
oil (EVOO), will produce perceptible differences in the sensory properties of mashed
potatoes (MP). In most cases, INL has been added to different foods, in amounts ranging
from 3 to 6 g per portion, to increase soluble fiber ingestion, or to assure bifidus
production by adding 3–8 g per portion.[2]
INL is also currently used in food formulations
Sensory and texture properties of mashed potato…
116
as a techno-functional agent for fat replacement, bulking, water retention, etc.[3]
A fat-like
texture can be achieved by increasing the INL concentration and average degree of
polymerization above a critical value.[4]
In particular, long-chain INL can act as a fat
mimetic due to its capacity to form microcrystals, which interact with one another to form
small aggregates that occlude a large amount of water; thus creating a fine, creamy
texture that gives a mouthfeel similar to that of fat.[5]
Olive oil is an important dietary component of Mediterranean countries, and EVOO
has nutritional and sensory characteristics that make it unique. On November 2004, the
US Federal Drug Administration (FDA) permitted the following claim on olive oil labels
concerning “the benefits on the risk of coronary heart disease of eating about 2
tablespoons (23 g) of olive oil daily, because of the monounsaturated fat (MUFA) in olive
oil”.[6]
It is expected that consumers can attain this daily intake from different olive oil-
containing foods.
Technologically, the industry increasingly needs to be able to understand and
control texture and is therefore willing to help promote more innovation and new product
development. Today, texture is seen as a positive quality attribute denoting product
freshness, excellent food preparation and eating enjoyment.[7]
Textural evaluation is
consequently an important step in assessing the functionality of food products. Sensory
evaluation of foods and beverages is also important and is usually carried out using
conventional techniques such as descriptive analysis.[8]
A sensory panel test was used to
evaluate instrumental parameters and the sensory texture in cooked potatoes.[9]
A sensory
texture profile analysis uses trained assessors to describe and give quantitative texture
measures of a given food. This is applied using standard rating scales, which provide a
quantitative evaluation of the mechanical and other texture parameters by measuring
qualitative and quantitative textural differences of similar samples. A sensory descriptive
Sensory and texture properties of mashed potato…
117
texture profile including thirteen sensory attributes (geometrical, mechanical, surface and
other residual characteristics) was developed for MP in which the panel produced reliable
results for most of the attributes with respect to discriminative ability and
reproducibility.[10]
Principal component analysis (PCA) is among the multivariate techniques that can
be applied to extract relevant information from descriptive sensory trials. In the case of
highly correlated data, typical of sets of food-quality measurements, PCA will typically
lead to a small number of fused feature variables (the principal components), which are
always orthogonal and often have a ready physical interpretation.[11]
This reduction
should aim at identifying those descriptors that are sufficient to describe the product,
while at the same time avoiding characteristics that are difficult to quantify.
As an MP sample behaves like a high-volume-fraction dispersion, the addition of
INL (extra dry matter) would be expected to result in a firmer product. However, there is
little information on the sensory characteristics of INL and how it may be affected by
interactions with other ingredients like starch or different kinds of hydrocolloids; nor is
there information available on the effects of EVOO incorporation on the sensory
characteristics of MP products. EVOO is a liquid material, and therefore a system to
which it is added would be expected to be softer whatever the concentration used.
Therefore, MP formulation may be optimized not only to improve nutritional value but at
the same time to gain more insights into the sensory properties of such systems.
The purpose of the present research was therefore: (1) to evaluate the effect of
adding different ratios of INL/EVOO blends on the sensory properties and instrumental
texture measurements of FMP and F/TMP formulated without and with added
cryoprotectants (kappa-carrageenan and xanthan gum); (2) to reduce and explain the
perceived texture by means of linear combinations of the sensory attributes, using PCA.
Sensory and texture properties of mashed potato…
118
The reliability of the sensory properties and the panel consonance are also discussed in
some detail.
MATERIALS AND METHODS
Material
The potatoes used were fresh tubers (cv Kennebec) from Aguilar de Campoo
(Burgos, Spain). INL with the trade name Orafti®HP (BENEO-Orafti, Tienen, Belgium)
was a “long-chain” INL with an average DP (total number of fructose or glucose units) ≥
23 and purity of 99.5% (producer’s data). EVOO (Carbonell, Sevilla, Spain) was chosen
for addition to the MP. Kappa-carrageenan (κ-C) (GENULACTA carrageenan type LP-
60) and xanthan gum (XG) (Keltrol F [E]) were donated by Premium Ingredients, S.L.
(Girona, Spain). Five different I:EVOO blend ratios were added to the samples (15 g/kg
(I)/45 g/kg (EVOO), 15:45; 30 g/kg (I)/30 g/kg (EVOO), 30:30; 45 g/kg (I)/15 g/kg
(EVOO), 45:15; 30 g/kg (I)/45 g/kg (EVOO), 30:45; 45 g/kg (I)/30 g/kg (EVOO), 45:30).
Additional samples without added ingredients (0:0 control), with 60 g/kg added I alone
(60:0) and with 60 g/kg added EVOO alone (0:60) were also prepared for each type of
MP and processing condition.
Preparation of MP Samples
Tubers were manually washed, peeled and diced. MP were prepared in ~2,000 g
batches from: 1,185 g of potatoes, 450 mL of semi-skimmed in-bottle sterilized milk (fat
content, 15.5 g/kg), 300 mL of water, 15 g of salt (NaCl) and the corresponding EVOO
concentration (0-60 g/kg), depending on the I:EVOO ratio, using a TM 31 food processor
(Vorwerk España, M.S.L., S.C., Madrid, Spain). In turn, the corresponding INL
concentration (0-60 g/kg) was previously dissolved in 750 mL of water and milk at 70°C
Sensory and texture properties of mashed potato…
119
for 15 min and agitated with a magnetic stirrer at 600 rpm. MPs were prepared without
and with added κ-C and XG (MPA and MPB samples, respectively). In the latter case,
hydrocolloids (each at 1.5 g/kg) were added to the rest of the ingredients in dry powder
form. All the ingredients were cooked for 35 min at 90°C (blade speed: 0.10 × g).[10, 12]
The mash was ground for 40 s (blade speed: 80 × g) and for 20 s (blade speed: 1,000 × g)
and then immediately homogenized through a stainless steel sieve (diameter: 1.5 mm).
Half of each fresh blend (FMP samples) was analyzed at once and the other half was
frozen and subsequently thawed (F/TMP samples). Two repetitions of each composition
were prepared in different weeks for randomization.
Freezing, Thawing and Heating Procedures
MP samples were placed on flat-freezing and microwave thawing trays, and then
frozen by forced convection with liquid nitrogen vapor in an Instron programmable
chamber (model 3119-05, −70/+250°C) at −60°C until their thermal centers reached
−24°C.[13]
After freezing, the samples were packed in polyethylene plastic bags, sealed
under light vacuum (–0.05 MPa) on a Multivac packing machine (Sepp Haggenmüller
KG, Wolfertschwenden, Germany), and placed in a domestic freezer for storage at
−24°C. Packed frozen samples were thawed in a Samsung M1712N microwave oven
(Samsung Electronics S.A., Madrid, Spain) by heating for 20 min at an output power
rating of 600 W. After thawing, the temperature reached at the product thermal center
was measured in all cases (+75 ± 5°C). The temperature was then reduced to 55°C by
placing the samples in a Hetofrig CB60VS water bath (Heto Lab Equipment A/S,
Birkerd, Denmark) as this is the preferred temperature for MP consumption.[10]
Sensory and texture properties of mashed potato…
120
Sensory Analysis
MP samples were subjected to texture profile analysis (TPA), modified to evaluate
vegetable purees according to UNE 87025 (1996)[14]
and other relevant International
Standards,[15]
and then used to select and define the sensory attributes included in the
profile. A panel of 4 assessors, previously trained according to the ISO guidelines[16]
and
with 8 years of specific experience assessing MP, evaluated the textural attributes of the
samples. Descriptive panels usually have 8 to 12 assessors though they may have more,
or as few as 4.[17]
An important point to note here is that as it is the assessors themselves
who are the measuring instruments in sensory analysis, it is necessary to confirm their
efficacy by evaluating the consistency of their replies and their ability to distinguish
differences.[18]
In fact attempts have been made to train and incorporate new members to
the panel. In these cases, models of analysis of variance ANOVA have been performed
with interactions for each attribute including assessor and sample as factors. The results
showed significant effects of assessor × sample interaction, illustrating disagreement
among the new assessors and the 4 earlier members in scoring the samples for a lot of
attributes. Certainly, specific instructions regarding panel size are not appropriate because
of the many factors that have to be considered.[17]
Profile attributes were classified into four groups (Table 1). Attributes are listed in
order of perception according to ISO guidelines.[17]
Note that for moisture and
fibrousness, numbers in brackets (1) and (2) refer to the order of their perception in the
mastication process. Samples were evaluated in duplicate in morning sessions (1:00
p.m.), every day for 64 days, and assessors were given four samples (about 20 g each) for
scoring the attributes of each group in the texture profile. All the samples were served at
55°C in white plastic vessels, and the sample temperature was reached and kept constant
by placing the product in the Hetofrig CB60VS water bath prior to testing. For each
Sensory and texture properties of mashed potato…
121
sample, panelists evaluated the perceived intensity of the 13 attributes on 8 cm
descriptive linear scales labeled at each anchor: (left anchor: 1 = ‘‘not detectable”; right
anchor: 9 = ‘‘extremely intense’’). To reduce fatigue a rest period of 5 min was taken
after scoring each sample.
Instrumental Texture Measurements
A back extrusion (BE) test was performed using a TA.HDPlus Texture Analyzer
(Stable Micro Systems Ltd, Godalming, UK) equipped with a 300 N load cell.[19]
During
tests, MP samples were kept at 55°C by means of a temperature controlled Peltier cabinet
(XT/PC) coupled to a heat exchanger and a proportional-integral-derivative (PID)
controller. For BE tests, a rig (model A/BE, Stable Micro Systems) was used consisting
of a flat 45 mm diameter Perspex disc plunger that moved within a 50 mm inner diameter
Perspex cylinder sample holder containing 50 1 g of MP sample. The product was
extruded to a distance of 20 mm at a 2 mm/s compression rate. Recorded force time
curves provided the maximum positive force of extrusion (BE firmness (N)) and the
negative area of extrusion (BE viscosity index (N s)).[20]
Texture measurements were
performed in quadruplicate and results averaged.
Expressible Water
Expressible water (Ew) was measured by centrifugal force according to Eliasson and
Kim. [21]
Centrifuge tubes containing approximately 10 g of MP were centrifuged at
15,000 × g for 30 min in a Sorvall®, RC-5B apparatus (Global Medical Instrumentation,
Inc, Clearwater, MN). Ew was expressed as the percentage of liquid separated per total
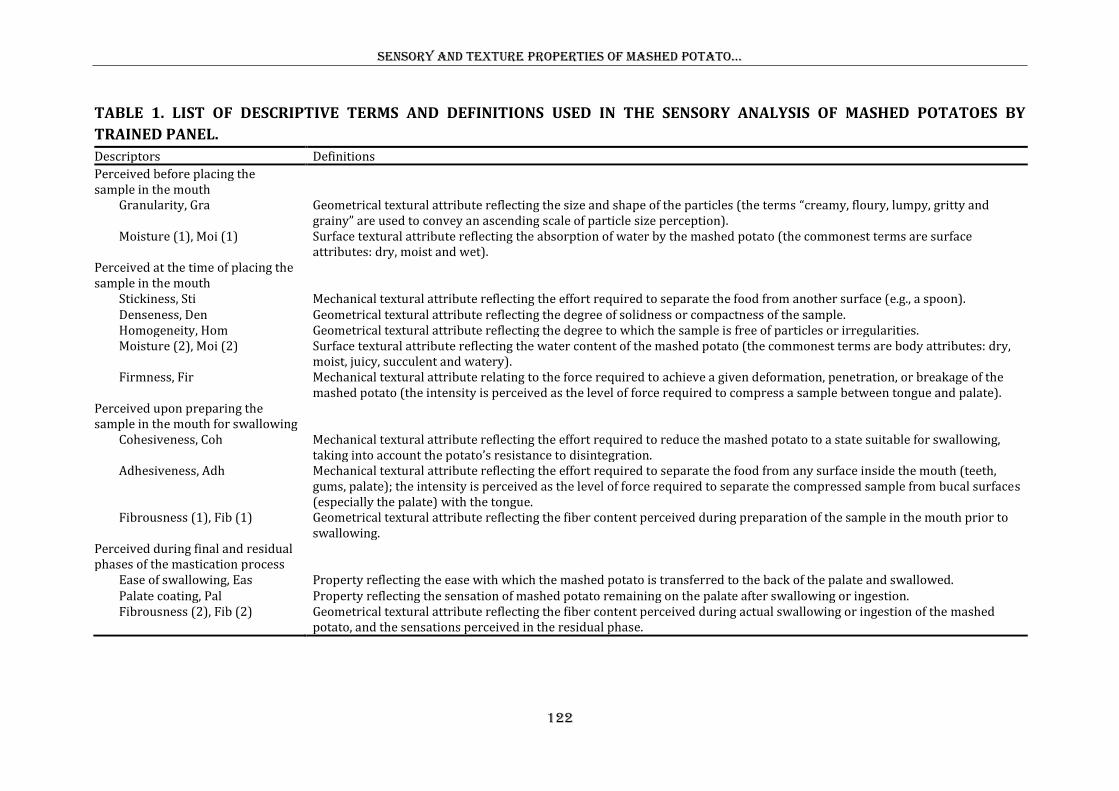
Sensory and texture properties of mashed potato…
122
TABLE 1. LIST OF DESCRIPTIVE TERMS AND DEFINITIONS USED IN THE SENSORY ANALYSIS OF MASHED POTATOES BY
TRAINED PANEL.
Descriptors Definitions
Perceived before placing the sample in the mouth
Granularity, Gra Geometrical textural attribute reflecting the size and shape of the particles (the terms “creamy, floury, lumpy, gritty and grainy” are used to convey an ascending scale of particle size perception).
Moisture (1), Moi (1) Surface textural attribute reflecting the absorption of water by the mashed potato (the commonest terms are surface attributes: dry, moist and wet).
Perceived at the time of placing the sample in the mouth
Stickiness, Sti Mechanical textural attribute reflecting the effort required to separate the food from another surface (e.g., a spoon). Denseness, Den Geometrical textural attribute reflecting the degree of solidness or compactness of the sample. Homogeneity, Hom Geometrical textural attribute reflecting the degree to which the sample is free of particles or irregularities. Moisture (2), Moi (2) Surface textural attribute reflecting the water content of the mashed potato (the commonest terms are body attributes: dry,
moist, juicy, succulent and watery). Firmness, Fir Mechanical textural attribute relating to the force required to achieve a given deformation, penetration, or breakage of the
mashed potato (the intensity is perceived as the level of force required to compress a sample between tongue and palate). Perceived upon preparing the sample in the mouth for swallowing
Cohesiveness, Coh Mechanical textural attribute reflecting the effort required to reduce the mashed potato to a state suitable for swallowing, taking into account the potato’s resistance to disintegration.
Adhesiveness, Adh Mechanical textural attribute reflecting the effort required to separate the food from any surface inside the mouth (teeth, gums, palate); the intensity is perceived as the level of force required to separate the compressed sample from bucal surfaces (especially the palate) with the tongue.
Fibrousness (1), Fib (1) Geometrical textural attribute reflecting the fiber content perceived during preparation of the sample in the mouth prior to swallowing.
Perceived during final and residual phases of the mastication process
Ease of swallowing, Eas Property reflecting the ease with which the mashed potato is transferred to the back of the palate and swallowed. Palate coating, Pal Property reflecting the sensation of mashed potato remaining on the palate after swallowing or ingestion. Fibrousness (2), Fib (2) Geometrical textural attribute reflecting the fiber content perceived during actual swallowing or ingestion of the mashed
potato, and the sensations perceived in the residual phase.
Sensory and texture properties of mashed potato…
123
weight of sample in the centrifuge tube. Measurements were performed in quadruplicate
and the results averaged.
Statistical Analyses
A three-way analysis of variance (ANOVA) with interactions was applied to
evaluate how the three factors studied––INL:EVOO ratio, presence or absence of
hydrocolloids and performance or not of a freeze/thaw cycle––affected the sensory
attributes and the instrumental texture measurements of the MP. A two-way ANOVA
with interactions was applied to evaluate how the INL:EVOO ratio and freeze/thaw cycle
affected the Ew of the products and it was found that the Ew was always zero for all the
MPB samples. Minimum significant differences were calculated using Fisher’s least
significant difference tests (95% for comparison of sensory attributes and 99% for
comparison of instrumental parameters).
The dataset (n = 256) and the FMP (n = 128), F/TMP (n = 128), MPA (n = 128)
and MPB samples (n = 128) were analyzed by PCA to investigate the interdependence of
the sensory attributes via identification of new, uncorrelated variables. Statistical analyses
were performed with Statgraphics® software version 5.0 (STSC Inc., Rockville, MD,
USA).
RESULTS AND DISCUSSION
Influence of Composition and the Freeze/Thaw Cycle on Sensory Attributes
of MP Samples
Table 2 shows the effects of the three factors studied on the scores awarded to the
sensory attributes of the MP samples. Graphs of the sensory attributes for different binary
interactions are shown in Figs. 1 and 2. Binary interactions were considered since their
Sensory and texture properties of mashed potato…
124
importance (F values) is mostly much higher than the triple interactions. All the three
main factors significantly (P < 0.05) affected the textural attribute scores with some
exceptions such as homogeneity and ease of swallowing scores, which were unaffected
by cryoprotectant addition and the freeze/thaw cycle respectively. The three binary
interactions also had a significant effect on most sensory attribute scores, although only
the INL:EVOO ratio, cryoprotectant addition (AB), the INL:EVOO ratio and the
freeze/thaw cycle (AC) interactions significantly affected granularity and ease of
swallowing scores.
Attributes Perceived before Putting the Sample in Mouth. Fig. 1a shows the variation
in granularity based on the INL:EVOO ratio for both MPA and MPB samples. One can
observe that, except for samples with an added 30:30 ratio, granularity scores were higher
in the MPA samples. The presence of XG in the MPB systems reduced the grainy
appearance by slowing or preventing starch retrogradation during the freeze/thaw
cycle.[22-24]
Brennan et al.[25]
studied the pasting properties and freeze/thaw stability of
natural waxy maize starches in the presence of XG using a Rapid Visco Analyzer (RVA)
and turbidimetric analysis. Freeze/thaw stability was determined after four cycles over a 4
weeks period during which XG reduced starch retrogradation and increased freeze/thaw
stability. Arocas et al.[26]
reported that gums like XG affect the gelatinization and
retrogradation of starch through strong associations with amylose, resulting in reduced
amylose-amylose interactions. Visually, the texture of frozen/thawed MPA samples
appeared to be spongy, stratified and flaky, as reflected by the significant increase in
granularity scores. This undesirable appearance was not observed in the MPB samples.
In both MPA and MPB samples, panelists judged granularity to be higher in
samples with an added 60:0 ratio than in the 0:0 control, even though in the MPB
Sensory and texture properties of mashed potato…
125
products granularity scores in the samples with added 15:45, 30:30, 45:15 and 45:30
ratios were also significantly higher than those for the 0:0 control, and increased with
increasing INL content. Furthermore, panelists found that samples with added 60:0 and
45:15 ratios had a sandy texture associated with the presence of large INL crystals which
were even visible to the naked eye. The initial INL concentration may affect both the
crystallization and aggregation processes and consequently the rate of sedimentation.[27]
At 45 and 60 g/kg, INL concentrations, the chains crystallize faster, which could explain
the sedimentation detected in these samples. On adding long-chain INL some aggregates
formed, embedded in a continuous network composed mainly of milk proteins with some
immersed starch granules.[28]
These aggregates were characterized by a rough outline,
which could justify the significant increase in the perceived grainy appearance. On the
contrary, at a fixed total concentration (60 g/kg), in both MPA and MPB samples,
panelists judged granularity to be lowest in the samples with higher EVOO
concentrations (0:60 and 15:45 ratios). Also, with a fixed INL content in both MPA and
MPB samples, granularity scores decreased significantly with increasing EVOO content.
These effects of EVOO on decreasing granularity are related to the lubricating and
coating properties conferred by the oil as reported for vanilla custard desserts.[29]
Variation in moisture (1) based on the INL:EVOO ratios for both MPA and MPB
samples are shown in the graph in Fig. 1b, and in all cases panelists detected increased
aqueousness in the samples with added ingredients, whether alone or in associated
blends. EVOO is a liquid material, and therefore, on adding EVOO, the systems would be
expected to be moister whatever the concentration used. On the other hand, as MP
samples behave like a high-volume-fraction dispersion, the addition of INL (extra dry
matter) would be expected to result in a drier product. However, both ingredients
appeared to produce a similar effect on this surface textural attribute. The INL long-chain
Sensory and texture properties of mashed potato…
126
structure resembles that of a network of fat crystals in oil, since this type of INL forms
small microcrystal aggregates that occlude a considerable amount of water.[27]
In fact,
again in both MPA and MPB samples at a fixed EVOO concentration, moisture (1) scores
increased linearly with INL content in all cases (15:45 vs 30:45 ratio and 30:30 vs 45:30
ratio), whereas at a fixed INL concentration, moisture (1) only increased linearly with
EVOO concentrations in MPA (30:30 vs 30: 45 ratios) and MPB (45:15 vs 45:30)
samples. Therefore, panelists detected that it was much easier to increase visual moisture
(1) when INL was added to the systems. As suggested by Kim and Wang,[30]
heating time
probably induced INL hydrolysis which in turn led to an increase in the reducing sugar
concentration and probably caused a decrease in average polymer chain lengths.
According to the latter authors, temperatures above 80°C under neutral conditions caused
some degree of hydrolysis of dissolved highly-polymerized INL molecules, and long INL
chains were probably degraded into smaller ones which were unable to form a gel.
Panelists also detected less aqueousness, and hence a greater ability to hold water
molecules in MPB samples. XG is an anionic, hygroscopic material of exceptional
pseudoplasticity,[31]
and its texturizing effect can be achieved at low gum concentrations
because of its unusual water-holding ability.
Attributes Perceived at the Time of Putting the Sample in the Mouth. The variation
in stickiness scores determined by the INL:EVOO ratio in both FMP and F/TMP
samples, shown in Fig. 1c, indicates that stickiness was significantly higher in the fresh
samples than in those subjected to a freeze/thaw cycle when EVOO was added either
alone (0:60 ratio) or blended with INL at increasing concentrations. Though EVOO
behaves like a soft filler suspended in a rigid matrix, it still confers stickiness to the
product, which may be related to the coating properties of the oil.[29]
In the F/TMP
Sensory and texture properties of mashed potato…
127
samples, panelists judged stickiness to be lower in the systems with added INL:EVOO
ratios than in the 0:0 control.
The panelists also detected higher denseness in both MPA and MPB samples
without either added INL or EVOO (Fig. 1d). In all cases, denseness scores were
significantly higher in the MPB than in the MPA samples; this result is attributed to the
gelling properties of the κ-C as reported previously.[12]
At a fixed total concentration,
denseness scores were lower in the MPA samples with only added INL (ratio 60:0) than
in those with only added EVOO (ratio 0:60). According to Carriere[32]
the transition from
dilute to semi-dilute solution behavior in polymers is designated as c*, and the results
seem to indicate that INL did not reach the c* concentration even at the highest
concentration used in this study (60 g/kg). In the MPA samples, panelists judged
denseness to be highest in the samples with an added 30:30 ratio, indicating the positive
synergistic effect of the two ingredients. Homogeneity scores were higher in the F/TMP
samples than in their FMP counterparts (Fig. 1e), and the I:EVOO ratio affected
homogeneity much less in the F/TMP samples than in their fresh counterparts. All this
suggests that the effect of INL addition on the presence of irregularities in the MP
samples is negative at higher fructan concentrations, although this effect is counteracted
by a freeze/thaw cycle.
In comparison with 0:0 control, panelists detected greater moisture (2) in both FMP
and F/TMP systems with added INL/EVOO blends (Fig. 1f), as in the case of moisture
(1). The panelists also detected increased aqueousness in the FMP samples with added
blend ratios of 60:0 and 45:15. Sensory firmness assessment confirmed that both INL and
EVOO behave like soft fillers, with olive oil suspended and INL entrapped in a
continuous phase (amylose/amylopectin matrix) due to the disruption and complete
solubilization of the potato starch granules. At a fixed total concentration (Fig. 2a), there
Sensory and texture properties of mashed potato…
128
were non-significant differences between the firmness scores of the MPB samples with
addition ratios of 60:0, 0:60, 15:45 and 30:30 as well as between the firmness scores of
the MPA samples with addition ratios of 60:0, 15:45 and 30:30. This suggests that at the
same concentration both ingredients produced a similar effect on the thickness of the
samples. Nevertheless, at fixed EVOO and INL concentrations the decrease in firmness
when both INL and EVOO concentrations were increased was more significant in the
case of the MPB samples (ratios of 15:45 vs 30:45 and 30:30 vs 45:30) and (ratios of
30:30 vs 30:45 and 45:15 vs 45:30) respectively.
Attributes Perceived at the Time of Preparing the Sample in the Mouth for
Swallowing. The variations in cohesiveness and adhesiveness scores for INL:EVOO
ratios of both MPA and MPB samples as well as FMP and F/TMP samples are shown in
Figs. 2b and 2c, respectively. At a fixed total concentration, cohesiveness scores were
higher in the MPA samples with addition ratios of 15:45, 30:30 and 45:15, and lower
with ratios of 0:60 and 60:0 ratios. These results suggest that in the MPA samples
synergism between EVOO and INL also positively affected cohesiveness when they were
added in associated blends, as compared to the scores awarded when they were added
singly (ratios of 60:0 and 0:60). On the other hand, cohesiveness scores were lower in the
MPB samples with addition ratios of 15:45 and 30:30 than in those with ratios of 0:60
and 60:0, supporting the hypothesis that the presence of cryoprotectants masked the effect
produced by INL:EVOO ratio variations on the cohesiveness of these samples. Moreover,
at fixed EVOO and INL concentrations cohesiveness decreased linearly in both MPA and
MPB samples with increasing INL and EVOO concentrations. In the FMP samples, at a
fixed total concentration, adhesiveness scores were higher in the samples with higher
EVOO concentrations (0:60 and 15:45 ratios) (Fig. 2c), although there were non-
Sensory and texture properties of mashed potato…
129
significant differences among the adhesiveness scores of the FMP samples with addition
ratios of 60:0, 30:30 and 45:15. This again indicates that both ingredients produced a very
similar effect on adhesiveness. However, in the F/TMP samples, at a fixed total
concentration, panelists judged adhesiveness to be highest in the samples with lower EVOO
concentrations (ratios of 60:0 and 45:15).
Fibrousness (1) scores increased with respect to 0:0 control when INL was added alone
and when EVOO was added at a concentration of 15 g kg-1 (45:15 ratio), but decreased with
increasing EVOO content, with cryoprotectant addition and with processing (Table 2).
These variations in the fibrousness (1) score for the INL:EVOO ratio in both FMP and
F/TMP samples (Fig. 2d) shows that except for the samples with an addition ratio of 30:30,
fibrousness (1) was significantly lower in the F/TMP samples than in the FMP ones. This
result is probably related to the presence of XG in the MPB frozen/thawed systems, which
reduced fibrousness (1). Hydrocolloids can make rubbery systems more viscous, reducing
molecular mobility and preventing retrogradation.[22, 23]
Furthermore, at a fixed total
concentration there were no significant differences between the fibrousness scores of the
F/TMP samples. On the other hand, fibrousness (1) scores were significantly higher in the
FMP samples with higher INL contents (60:0 and 45:15 ratios). Kim et al.[4]
found
differences in INL particle sizes between low shearing, high shearing and thermally induced
gels. The average particle size of INL crystals varied from 30 μm for low-shear-induced gel
to approximately 2 μm for thermally induced gels. Changes in the particle distribution were
also observed with the apparition of new particles (<10 μm) that were ascribed to INL
crystal aggregates formed during the continuous phase of the system. According to this
information, the increase in fibrousness (1) perceived for samples with higher I contents
could be explained by the presence of large INL crystal aggregates.
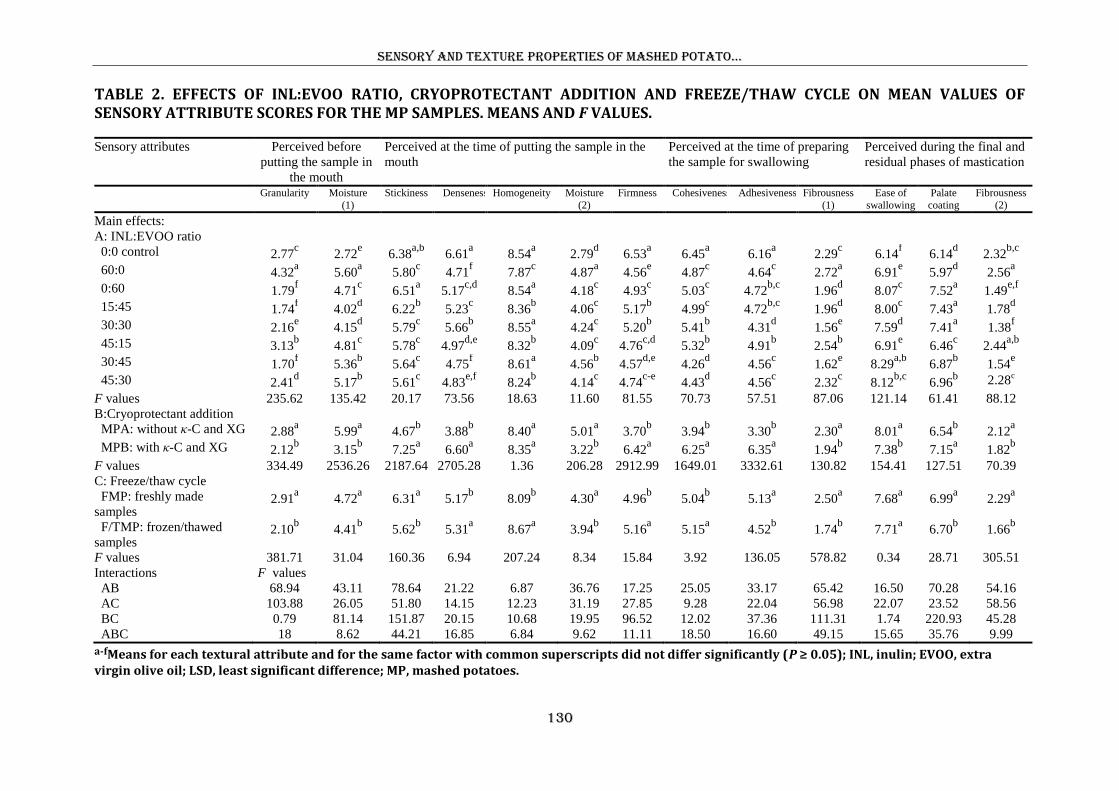
Sensory and texture properties of mashed potato…
130
TABLE 2. EFFECTS OF INL:EVOO RATIO, CRYOPROTECTANT ADDITION AND FREEZE/THAW CYCLE ON MEAN VALUES OF SENSORY ATTRIBUTE SCORES FOR THE MP SAMPLES. MEANS AND F VALUES.
Sensory attributes Perceived before
putting the sample in
the mouth
Perceived at the time of putting the sample in the
mouth
Perceived at the time of preparing
the sample for swallowing
Perceived during the final and
residual phases of mastication
Granularity Moisture
(1)
Stickiness Denseness Homogeneity Moisture
(2)
Firmness Cohesiveness Adhesiveness Fibrousness
(1)
Ease of
swallowing
Palate
coating
Fibrousness
(2)
Main effects:
A: INL:EVOO ratio
0:0 control 2.77c 2.72
e 6.38
a,b 6.61
a 8.54
a 2.79
d 6.53
a 6.45
a 6.16
a 2.29
c 6.14
f 6.14
d 2.32
b,c
60:0 4.32a 5.60
a 5.80
c 4.71
f 7.87
c 4.87
a 4.56
e 4.87
c 4.64
c 2.72
a 6.91
e 5.97
d 2.56
a
0:60 1.79f 4.71
c 6.51
a 5.17
c,d 8.54
a 4.18
c 4.93
c 5.03
c 4.72
b,c 1.96
d 8.07
c 7.52
a 1.49
e,f
15:45 1.74f 4.02
d 6.22
b 5.23
c 8.36
b 4.06
c 5.17
b 4.99
c 4.72
b,c 1.96
d 8.00
c 7.43
a 1.78
d
30:30 2.16e 4.15
d 5.79
c 5.66
b 8.55
a 4.24
c 5.20
b 5.41
b 4.31
d 1.56
e 7.59
d 7.41
a 1.38
f
45:15 3.13b 4.81
c 5.78
c 4.97
d,e 8.32
b 4.09
c 4.76
c,d 5.32
b 4.91
b 2.54
b 6.91
e 6.46
c 2.44
a,b
30:45 1.70f 5.36
b 5.64
c 4.75
f 8.61
a 4.56
b 4.57
d,e 4.26
d 4.56
c 1.62
e 8.29
a,b 6.87
b 1.54
e
45:30 2.41d 5.17
b 5.61
c 4.83
e,f 8.24
b 4.14
c 4.74
c-e 4.43
d 4.56
c 2.32
c 8.12
b,c 6.96
b 2.28
c
F values 235.62 135.42 20.17 73.56 18.63 11.60 81.55 70.73 57.51 87.06 121.14 61.41 88.12
B:Cryoprotectant addition
MPA: without κ-C and XG 2.88a 5.99
a 4.67
b 3.88
b 8.40
a 5.01
a 3.70
b 3.94
b 3.30
b 2.30
a 8.01
a 6.54
b 2.12
a
MPB: with κ-C and XG 2.12b 3.15
b 7.25
a 6.60
a 8.35
a 3.22
b 6.42
a 6.25
a 6.35
a 1.94
b 7.38
b 7.15
a 1.82
b
F values 334.49 2536.26 2187.64 2705.28 1.36 206.28 2912.99 1649.01 3332.61 130.82 154.41 127.51 70.39
C: Freeze/thaw cycle
FMP: freshly made
samples 2.91
a 4.72
a 6.31
a 5.17
b 8.09
b 4.30
a 4.96
b 5.04
b 5.13
a 2.50
a 7.68
a 6.99
a 2.29
a
F/TMP: frozen/thawed
samples 2.10
b 4.41
b 5.62
b 5.31
a 8.67
a 3.94
b 5.16
a 5.15
a 4.52
b 1.74
b 7.71
a 6.70
b 1.66
b
F values 381.71 31.04 160.36 6.94 207.24 8.34 15.84 3.92 136.05 578.82 0.34 28.71 305.51
Interactions F values
AB 68.94 43.11 78.64 21.22 6.87 36.76 17.25 25.05 33.17 65.42 16.50 70.28 54.16
AC 103.88 26.05 51.80 14.15 12.23 31.19 27.85 9.28 22.04 56.98 22.07 23.52 58.56
BC 0.79 81.14 151.87 20.15 10.68 19.95 96.52 12.02 37.36 111.31 1.74 220.93 45.28
ABC 18 8.62 44.21 16.85 6.84 9.62 11.11 18.50 16.60 49.15 15.65 35.76 9.99
a-fMeans for each textural attribute and for the same factor with common superscripts did not differ significantly (P ≥ 0.05); INL, inulin; EVOO, extra virgin olive oil; LSD, least significant difference; MP, mashed potatoes.
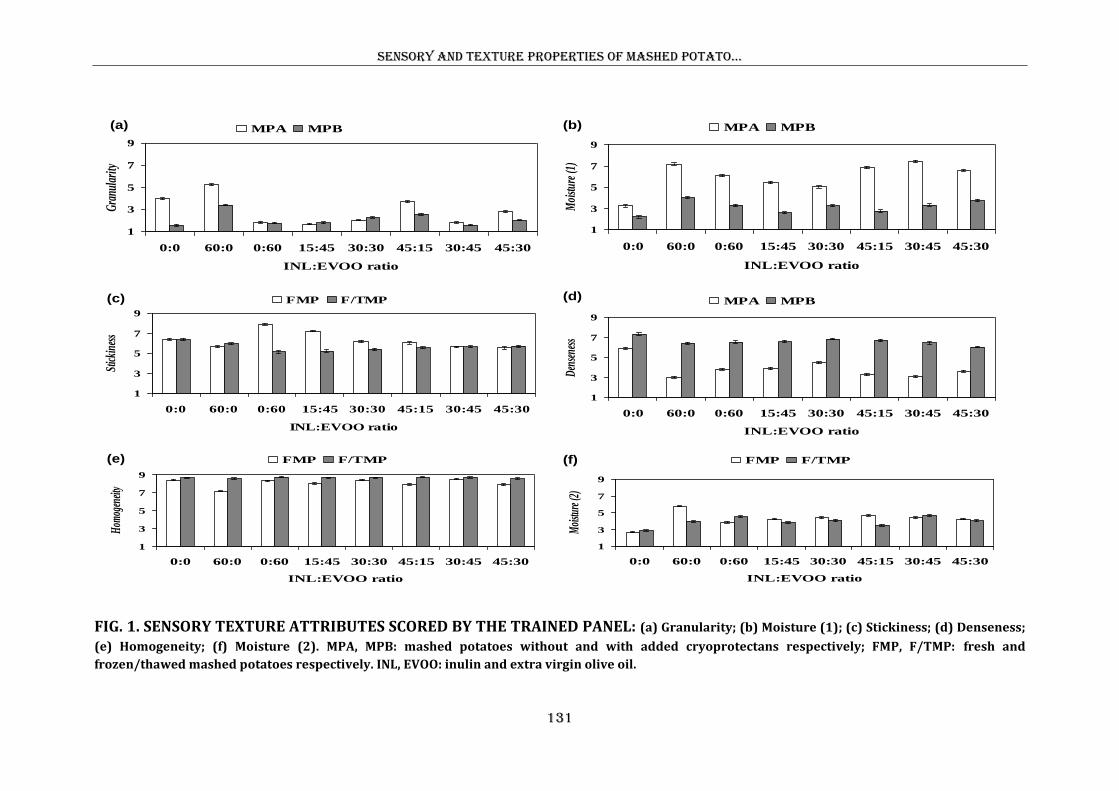
Sensory and texture properties of mashed potato…
131
FIG. 1. SENSORY TEXTURE ATTRIBUTES SCORED BY THE TRAINED PANEL: (a) Granularity; (b) Moisture (1); (c) Stickiness; (d) Denseness;
(e) Homogeneity; (f) Moisture (2). MPA, MPB: mashed potatoes without and with added cryoprotectans respectively; FMP, F/TMP: fresh and
frozen/thawed mashed potatoes respectively. INL, EVOO: inulin and extra virgin olive oil.
1
3
5
7
9
0:0 60:0 0:60 15:45 30:30 45:15 30:45 45:30
INL:EVOO ratio M
oistu
re (2
)
FMP F/TMP
1
3
5
7
9
0:0 60:0 0:60 15:45 30:30 45:15 30:45 45:30
INL:EVOO ratio
Hom
ogen
eity
FMP F/TMP
1
3
5
7
9
0:0 60:0 0:60 15:45 30:30 45:15 30:45 45:30
INL:EVOO ratio
Den
sene
ss
MPA MPB
1
3
5
7
9
0:0 60:0 0:60 15:45 30:30 45:15 30:45 45:30
INL:EVOO ratio
Stic
kine
ss
FMP F/TMP
1
3
5
7
9
0:0 60:0 0:60 15:45 30:30 45:15 30:45 45:30
INL:EVOO ratio
Moi
sture
(1)
MPA MPB
1
3
5
7
9
0:0 60:0 0:60 15:45 30:30 45:15 30:45 45:30
INL:EVOO ratio
Gra
nula
rity
MPA MPB(a)
(c) (d)
(b)
(e) (f)
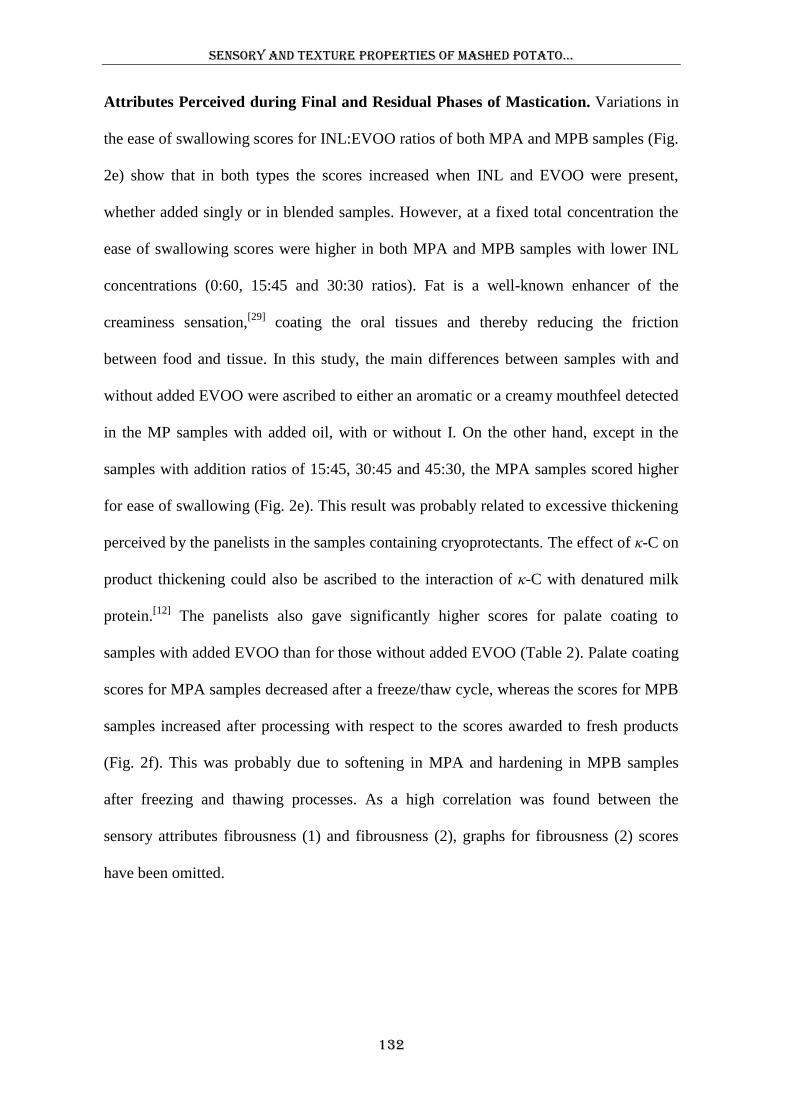
Sensory and texture properties of mashed potato…
132
Attributes Perceived during Final and Residual Phases of Mastication. Variations in
the ease of swallowing scores for INL:EVOO ratios of both MPA and MPB samples (Fig.
2e) show that in both types the scores increased when INL and EVOO were present,
whether added singly or in blended samples. However, at a fixed total concentration the
ease of swallowing scores were higher in both MPA and MPB samples with lower INL
concentrations (0:60, 15:45 and 30:30 ratios). Fat is a well-known enhancer of the
creaminess sensation,[29]
coating the oral tissues and thereby reducing the friction
between food and tissue. In this study, the main differences between samples with and
without added EVOO were ascribed to either an aromatic or a creamy mouthfeel detected
in the MP samples with added oil, with or without I. On the other hand, except in the
samples with addition ratios of 15:45, 30:45 and 45:30, the MPA samples scored higher
for ease of swallowing (Fig. 2e). This result was probably related to excessive thickening
perceived by the panelists in the samples containing cryoprotectants. The effect of κ-C on
product thickening could also be ascribed to the interaction of κ-C with denatured milk
protein.[12]
The panelists also gave significantly higher scores for palate coating to
samples with added EVOO than for those without added EVOO (Table 2). Palate coating
scores for MPA samples decreased after a freeze/thaw cycle, whereas the scores for MPB
samples increased after processing with respect to the scores awarded to fresh products
(Fig. 2f). This was probably due to softening in MPA and hardening in MPB samples
after freezing and thawing processes. As a high correlation was found between the
sensory attributes fibrousness (1) and fibrousness (2), graphs for fibrousness (2) scores
have been omitted.
Sensory and texture properties of mashed potato…
133
FIG. 2. SENSORY TEXTURE ATTRIBUTES SCORED BY THE TRAINED PANEL: (a) Firmness; (b) Cohesiveness; (c) Adhesiveness; (d)
Fibrousness; (e) Ease of swallowing; (f) Palate coating. MPA, MPB: mashed potatoes without and with added cryoprotectans respectively; FMP, F/TMP:
fresh and frozen/thawed mashed potatoes respectively. INL, EVOO: inulin and extra virgin olive oil.
1
3
5
7
9
FMP F/TMPP
alat
e co
atin
g
MPA MPB
1
3
5
7
9
0:0 60:0 0:60 15:45 30:30 45:15 30:45 45:30
INL:EVOO ratio
Eas
e of
sw
allo
win
g
MPA MPB
1
3
5
7
9
0:0 60:0 0:60 15:45 30:30 45:15 30:45 45:30
INL:EVOO ratio
Fib
rou
snes
s (1
)
FMP F/TMP
1
3
5
7
9
0:0 60:0 0:60 15:45 30:30 45:15 30:45 45:30
INL:EVOO ratio
Adh
esiv
enes
s
FMP F/TMP
1
3
5
7
9
0:0 60:0 0:60 15:45 30:30 45:15 30:45 45:30
INL:EVOO ratio
Coh
esiv
enes
s
MPA MPB
1
3
5
7
9
0:0 60:0 0:60 15:45 30:30 45:15 30:45 45:30
INL:EVOO ratio
Fir
mn
ess
MPA MPB
(c) (d)
(e)
(a) (b)
(f)
Sensory and texture properties of mashed potato…
134
Principal Component Analyses (PCAs) of Sensory Scores
Abbreviations for sensory attributes, as shown in Table 1, are used in this
subsection mainly for the sake of brevity. As the method proposed by Dijksterhuis[33]
was
used to evaluate panel consonance, an independent PCA was carried out of the total
dataset (n = 256) for each attribute (4 panelists and 64 samples) obtained from the
conventional profile. High consonance coefficients (the ratio between the first eigenvalue
and the sum of the others) indicate one-dimensional solutions or, in other words, that the
panelists use the attribute in a similar way. Some differences were found between
attributes. With four attributes (Sti, Adh, Eas and Pal) the solutions were
multidimensional, with low consonance coefficients (0.58, 0.64, 0.55 and 0.53
respectively) and with the second eigenvalue almost as high as the first one. Moi (1) and
Coh showed medium consonance coefficients (0.78 and 0.75 respectively). For the
remaining 7 attributes the consonance coefficients were high and the second eigenvalue
considerably lower than the first one. The highest coefficients were recorded for Fib (1)
and Fib (2) (0.97 and 0.86 respectively). All this suggests an acceptable level of
consonance between panelists although more training in the use of Sti, Adh and residual
attributes (Eas and Pal) could improve the results.
Table 3 shows the two components extracted in each PCA analysis (total dataset
and FMP, F/TMP, MPA and MPB subgroups considered separately) for all the thirteen
sensory attributes. The eigenvalues of the third component were lower than 1.0 in all the
cases. Figs. 3 and 4 show the biplots of the two principal components for the sensory
attributes. PCA revealed that two principal components accounted for >74% of the total
variability (Table 3) when all the data were included in the PCA analysis (Fig. 3),
whereas the total variability explained by the first and second axes was slightly higher
(>75%) when FMP and F/TMP samples were considered (Figs. 4a, 4b) separately, and
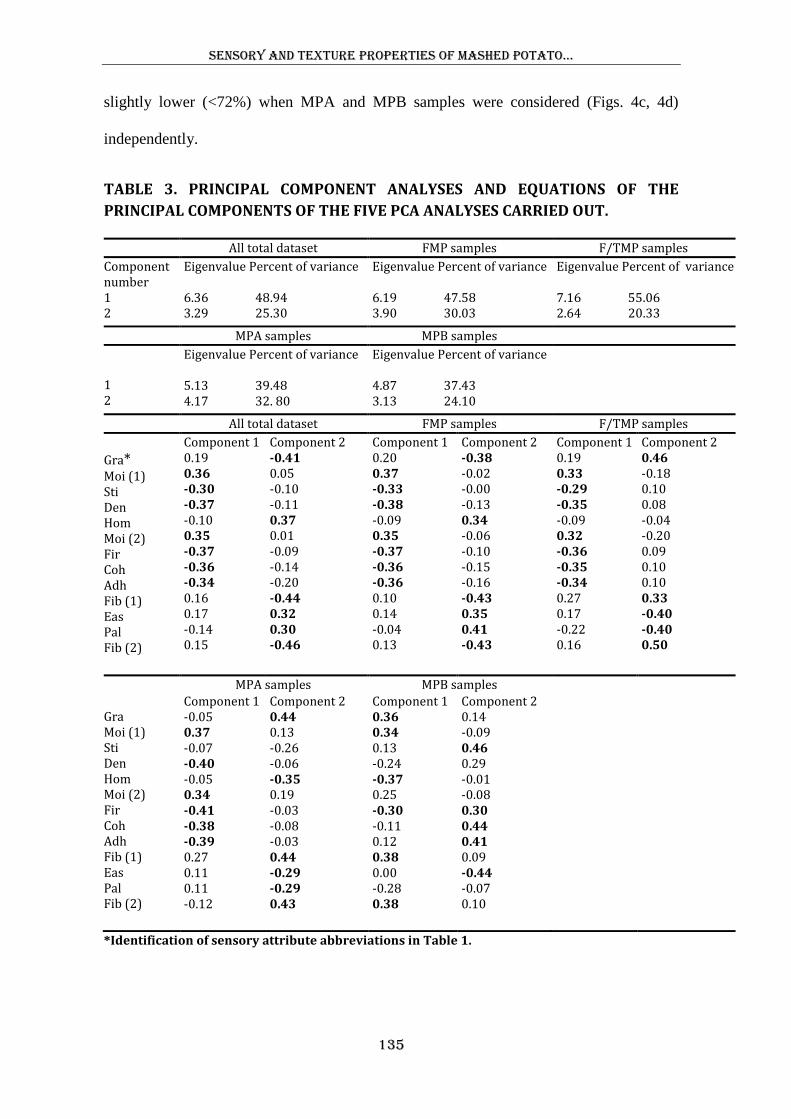
Sensory and texture properties of mashed potato…
135
slightly lower (<72%) when MPA and MPB samples were considered (Figs. 4c, 4d)
independently.
TABLE 3. PRINCIPAL COMPONENT ANALYSES AND EQUATIONS OF THE
PRINCIPAL COMPONENTS OF THE FIVE PCA ANALYSES CARRIED OUT. All total dataset FMP samples F/TMP samples
Component number 1 2
Eigenvalue Percent of variance 6.36 48.94 3.29 25.30
Eigenvalue Percent of variance 6.19 47.58 3.90 30.03
Eigenvalue Percent of variance 7.16 55.06 2.64 20.33
MPA samples MPB samples
1 2
Eigenvalue Percent of variance 5.13 39.48 4.17 32. 80
Eigenvalue Percent of variance 4.87 37.43 3.13 24.10
All total dataset FMP samples F/TMP samples
Gra* Moi (1) Sti Den Hom Moi (2) Fir Coh Adh Fib (1) Eas Pal Fib (2)
Component 1 0.19 0.36 -0.30 -0.37 -0.10 0.35 -0.37 -0.36 -0.34 0.16 0.17 -0.14 0.15
Component 2 -0.41 0.05 -0.10 -0.11 0.37 0.01 -0.09 -0.14 -0.20 -0.44 0.32 0.30 -0.46
Component 1 0.20 0.37 -0.33 -0.38 -0.09 0.35 -0.37 -0.36 -0.36 0.10 0.14 -0.04 0.13
Component 2 -0.38 -0.02 -0.00 -0.13 0.34 -0.06 -0.10 -0.15 -0.16 -0.43 0.35 0.41 -0.43
Component 1 0.19 0.33 -0.29 -0.35 -0.09 0.32 -0.36 -0.35 -0.34 0.27 0.17 -0.22 0.16
Component 2 0.46 -0.18 0.10 0.08 -0.04 -0.20 0.09 0.10 0.10 0.33 -0.40 -0.40 0.50
MPA samples MPB samples
Gra Moi (1) Sti Den Hom Moi (2) Fir Coh Adh Fib (1) Eas Pal Fib (2)
Component 1 -0.05 0.37 -0.07 -0.40 -0.05 0.34 -0.41 -0.38 -0.39 0.27 0.11 0.11 -0.12
Component 2 0.44 0.13 -0.26 -0.06 -0.35 0.19 -0.03 -0.08 -0.03 0.44 -0.29 -0.29 0.43
Component 1 0.36 0.34 0.13 -0.24 -0.37 0.25 -0.30 -0.11 0.12 0.38 0.00 -0.28 0.38
Component 2 0.14 -0.09 0.46 0.29 -0.01 -0.08 0.30 0.44 0.41 0.09 -0.44 -0.07 0.10
*Identification of sensory attribute abbreviations in Table 1.
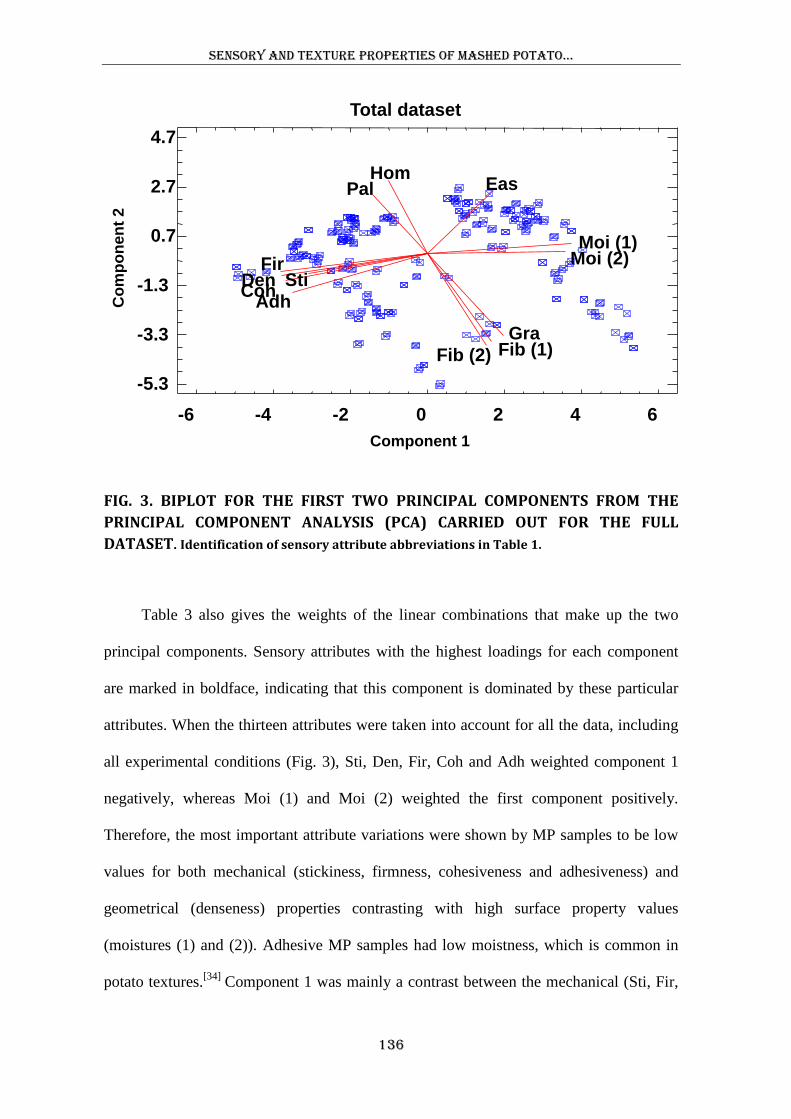
Sensory and texture properties of mashed potato…
136
FIG. 3. BIPLOT FOR THE FIRST TWO PRINCIPAL COMPONENTS FROM THE
PRINCIPAL COMPONENT ANALYSIS (PCA) CARRIED OUT FOR THE FULL
DATASET. Identification of sensory attribute abbreviations in Table 1.
Table 3 also gives the weights of the linear combinations that make up the two
principal components. Sensory attributes with the highest loadings for each component
are marked in boldface, indicating that this component is dominated by these particular
attributes. When the thirteen attributes were taken into account for all the data, including
all experimental conditions (Fig. 3), Sti, Den, Fir, Coh and Adh weighted component 1
negatively, whereas Moi (1) and Moi (2) weighted the first component positively.
Therefore, the most important attribute variations were shown by MP samples to be low
values for both mechanical (stickiness, firmness, cohesiveness and adhesiveness) and
geometrical (denseness) properties contrasting with high surface property values
(moistures (1) and (2)). Adhesive MP samples had low moistness, which is common in
potato textures.[34]
Component 1 was mainly a contrast between the mechanical (Sti, Fir,
-6 -4 -2 0 2 4 6
Component 1
-5.3
-3.3
-1.3
0.7
2.7
4.7C
om
po
nen
t 2
Total dataset
Moi (1)Moi (2)
EasPalHom
GraFib (1)Fib (2)
AdhCoh
StiDenFir
Sensory and texture properties of mashed potato…
137
Coh, Adh) and surface texture attributes (Moi (1), Moi (2)), and acted as an index of the
mechanical behavior and moistness of the product. On the other hand, intercorrelated
sensory attributes with nearly equal loadings were assumed to represent some
redundancy. Den, Fir and Coh in particular had nearly equal loadings, and Moi (1) and
Moi (2) explained the same characteristic.
Component 2 was positively weighted by Hom, Eas and Pal and negatively
dominated by Gra and both Fib (1) and Fib (2). This means that when the panelists
detected more granularity and fibrousness, they detected poorer homogeneity, ease of
swallowing and palate coating. Component 2 integrates four geometrical attributes (Gra,
Hom, Fib (1) and Fib (2)) associated with the arrangement of particles in the product, and
surface roughness or smoothness properties of MP texture according to Szczesniak.[7]
Hence, component 2 may be identified mainly with geometrical and residual textural
attributes which serve as an index of the roughness/smoothness of the MP samples. Note
that although Den is a geometrical attribute, it correlated strongly with two mechanical
properties (Fir and Coh). This indicated that the panel had difficulty to distinguish
between force (Coh) and deformation (Fir) of the mechanical properties and between
solidness (Den) of the geometrical ones. The level of representation of an original
attribute in the first and second principal component planes (Fig. 3) can be measured by
means of the cumulative determination coefficient, defined as commonalities (data not
shown). Firm, Coh and Adh, in that order, were the most important of the mechanical
sensory attributes, explained to a great extent by the first two principal components,
whereas geometrical Hom and residual Eas and Pal were only explained to a fairly
moderate extent (with low percentages).
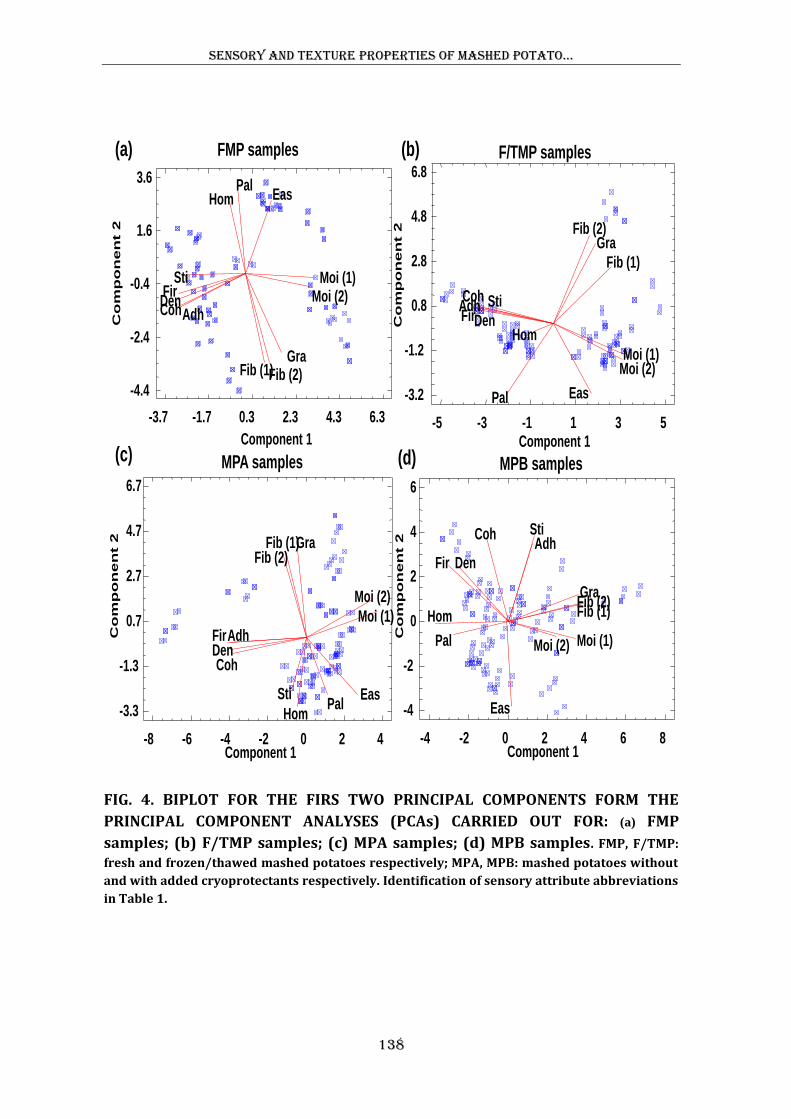
Sensory and texture properties of mashed potato…
138
FIG. 4. BIPLOT FOR THE FIRS TWO PRINCIPAL COMPONENTS FORM THE
PRINCIPAL COMPONENT ANALYSES (PCAs) CARRIED OUT FOR: (a) FMP
samples; (b) F/TMP samples; (c) MPA samples; (d) MPB samples. FMP, F/TMP:
fresh and frozen/thawed mashed potatoes respectively; MPA, MPB: mashed potatoes without
and with added cryoprotectants respectively. Identification of sensory attribute abbreviations
in Table 1.
-3.7 -1.7 0.3 2.3 4.3 6.3
Component 1
-4.4
-2.4
-0.4
1.6
3.6
Co
mp
on
en
t 2
FMP samples
Moi (1)Moi (2)
EasPal
Hom
GraFib (1)Fib (2)
AdhCoh
Sti
DenFir
(a)
-5 -3 -1 1 3 5Component 1
-3.2
-1.2
0.8
2.8
4.8
6.8
Co
mp
on
en
t 2
F/TMP samples
Moi (1)Moi (2)
EasPal
Hom
Gra
Fib (1)
Fib (2)
AdhCoh Sti
DenFir
(b)
-8 -6 -4 -2 0 2 4Component 1
-3.3
-1.3
0.7
2.7
4.7
6.7
Co
mp
on
en
t 2
MPA samples
Moi (1)
Moi (2)
EasPal
Hom
GraFib (1)Fib (2)
Adh
Coh
Sti
DenFir
-4 -2 0 2 4 6 8Component 1
-4
-2
0
2
4
6
Co
mp
on
en
t 2
MPB samples
Moi (1)Moi (2)
Eas
Pal
Hom
Gra
Fib (1)Fib (2)
AdhCoh Sti
DenFir
(c) (d)
Sensory and texture properties of mashed potato…
139
It is worth noting that when considering only FMP samples, both components are
dominated by the same sensory attributes (Fig. 4a, Table 3). In this case geometrical Den
and mechanical Adh were the attributes best explained by the two components, whereas
explanation percentages for Hom and Eas were the lowest. Then again, if we consider
F/TMP samples separately (Fig. 4b, Table 3), Sti, Den, Fir, Coh and Adh also negatively
weighted component 1, whereas it was positively weighted by Moi (1) and Moi (2), the
same as in the PCA analyses with the complete dataset and with FMP samples; MP
samples had high moistness but low levels of Sti, Den, Fir, Coh and Adh. However, Eas
and Pal strongly weighted component 2 negatively, which in this case, was positively
dominated by Gra and Fib (2). MP is a starchy food and as such may present quality
problems such as syneresis, organoleptic and textural changes, especially if subjected to
freeze-thaw cycles. These problems have been ascribed to phase separation caused by
starch retrogradation.[21]
Therefore, this change in the sign of the sensory attributes
weighting component 2 is likely related to starch retrogradation caused by the freezing
process in the products without added cryoprotectants, and consequently the panelists
gave them higher scores for granularity and fibrousness. Of the mechanical attributes, Fir
was the one best explained by the first two principal components and may therefore be
considered the best suited to evaluate MP texture in the F/TMP samples.
In the case of the MPA samples (Fig. 4c, Table 3), again Moi (1) and Moi (2)
positively weighted the first component, whereas it was weighted negatively by Den, Fir,
Coh and Adh. Also, as in the F/TMP samples, Gra, Fib (1) and Fib (2) positively
weighted the second component, whereas it was negatively weighted by Hom, Eas and
Pal. Curiously, Fib (1) was the most important sensory attribute in this case, explained to
a great extent by the first two components. This result therefore confirms that the absence
of κ-C and XG in the frozen/thawed systems increased visual granularity.
Sensory and texture properties of mashed potato…
140
However, if we consider the MPB samples separately (Fig. 4d, Table 3) we find a
change in the correlations of the sensory attributes with both components, probably due
to a reduction or absence of starch retrogradation. As mentioned above, gums like XG
affect starch gelatinization through strong associations with amylose, resulting in reduced
starch retrogradation.[26]
Gra, Moi (1), Fib (1) and Fib (2) positively weighted component
1, whereas it was negatively weighted by Hom in particular; this factor is negatively
dominated by Hom and almost equally weighted on the Gra, Fib (1) and Fib (2) ratings.
Hence, component 1 is identified in this case with the geometrical attributes detected
either before putting the sample in the mouth or during the final and residual phases of
mastication, serving as an index of the roughness/smoothness of the MP samples. Also,
Sti, Coh and Adh in particular, positively weighted component 2, though this factor was
negatively dominated by Eas. In the MPB samples, component 2 was mainly a contrast
between the mechanical texture attributes of the MP samples perceived during chewing
versus residual ease of swallowing. MP samples with high levels of Coh, Sti and Adh had
low Eas. Here again, Fib (1) and Fib (2) had equal loadings (Table 3) as they explained
the same characteristic. In the MPB samples, Fib (2), Fib (1) and Sti were the sensory
attributes best explained by the two components (in that order). Certainly, new PCA
analyses were run when redundant attributes were eliminated in any analysis, but these
data are not shown for the sake of brevity. The main point of interest is that Fib (2) and
Moi (2) in particular could be removed with only a small percentage loss of information.
Influence of Composition and a Freeze/Thaw Cycle on Instrumental Texture
Measurements and Ew of MP Samples
Table 4 shows the effects of the INL:EVOO ratio, cryoprotectant addition and a
freeze/thaw cycle on the values of the instrumental texture measurements derived from
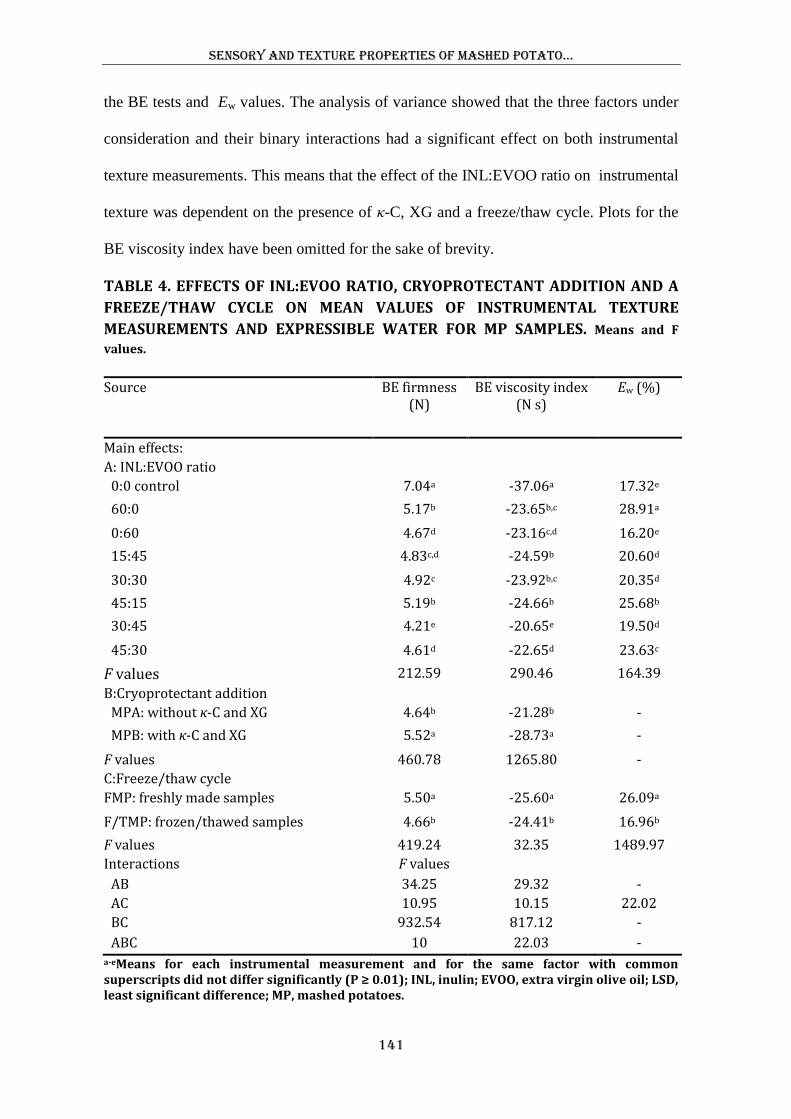
Sensory and texture properties of mashed potato…
141
the BE tests and Ew values. The analysis of variance showed that the three factors under
consideration and their binary interactions had a significant effect on both instrumental
texture measurements. This means that the effect of the INL:EVOO ratio on instrumental
texture was dependent on the presence of κ-C, XG and a freeze/thaw cycle. Plots for the
BE viscosity index have been omitted for the sake of brevity.
TABLE 4. EFFECTS OF INL:EVOO RATIO, CRYOPROTECTANT ADDITION AND A
FREEZE/THAW CYCLE ON MEAN VALUES OF INSTRUMENTAL TEXTURE
MEASUREMENTS AND EXPRESSIBLE WATER FOR MP SAMPLES. Means and F
values.
Source BE firmness (N)
BE viscosity index (N s)
Ew (%)
Main effects:
A: INL:EVOO ratio
0:0 control 7.04a -37.06a 17.32e
60:0 5.17b -23.65b,c 28.91a
0:60 4.67d -23.16c,d 16.20e
15:45 4.83c,d -24.59b 20.60d
30:30 4.92c -23.92b,c 20.35d
45:15 5.19b -24.66b 25.68b
30:45 4.21e -20.65e 19.50d
45:30 4.61d -22.65d 23.63c
F values 212.59 290.46 164.39
B:Cryoprotectant addition
MPA: without κ-C and XG 4.64b -21.28b -
MPB: with κ-C and XG 5.52a -28.73a -
F values 460.78 1265.80 -
C:Freeze/thaw cycle
FMP: freshly made samples 5.50a -25.60a 26.09a
F/TMP: frozen/thawed samples 4.66b -24.41b 16.96b
F values 419.24 32.35 1489.97
Interactions F values
AB 34.25 29.32 -
AC 10.95 10.15 22.02
BC 932.54 817.12 -
ABC 10 22.03 - a-eMeans for each instrumental measurement and for the same factor with common superscripts did not differ significantly (P ≥ 0.01); INL, inulin; EVOO, extra virgin olive oil; LSD, least significant difference; MP, mashed potatoes.
Sensory and texture properties of mashed potato…
142
Maximum instrumental texture values were registered in a 0:0 control (Table 4). By
adding 60 g/kg of INL alone (60:0 ratio) all the instrumental measurements were
significantly reduced when compared with the 0:0 control, whereas adding 60 g/kg of
EVOO alone (0:60 ratio) significantly reduced instrumental BE firmness as compared to
the addition of 60 g/kg of INL alone. This indicates that EVOO addition alone produced
softer systems than INL addition alone. However, variations in the BE firmness value
based on the INL:EVOO ratios in both MPA and MPB samples (Fig. 5a) show that in all
cases (except for 0:0 control) BE firmness was lower in the MPA than in the MPB
samples; moreover, the variation in the firmness of the samples with both ingredients was
much greater in the case of the MPA samples. Only MPB samples with addition ratios of
30:45 and 45:30 (at a higher total concentration, 75 g/kg) had significantly lower BE
firmness values than those with a lower fixed total concentration (60 g/kg). The presence
of hydrocolloids resulted in an improved, more solid, reinforced three-dimensional
network structure, possibly through the exclusion effect of swollen starch granules
promoting κ-C gelation in the aqueous phase. κ-C provided the appropriate texture, while
XG imparted creaminess to the product.[12]
Analogously, in starch/XG blends, it was
observed that XG does not interfere with potato starch network building.[35, 36]
The differences in BE firmness values between MPA and MPB samples were lower
when INL was added at the higher concentrations (60:0, 45:15 and 45:30 ratios).
Therefore, in the absence of κ-C and XG, INL addition at concentrations above 45 g/kg
(either alone or blended with EVOO) produced a thickening effect on the MP as
compared to I addition at lower concentrations. It is possible that in MPA samples, the
structure of the MP was thickened due to the high INL concentration, because the system
had enough particles and/or sufficient molecular INL chain density to reach a critical
crowding effect.[4, 30]
This speculation is in agreement with the microstructure observed

Sensory and texture properties of mashed potato…
143
in INL-EVOO-based MP samples,[37]
where amylose/amylopectin form a rigid matrix in
which I particles are trapped. Guggisberg et al. [38]
showed that even though firmness and
creaminess of low-fat set yogurt increased with both INL and fat content, the highest
level of INL considered (4%) was not enough to imitate the whole-milk yogurt. In turn,
Villegas and Costell[5]
observed that low-fat milk beverages with a similar thickness and
creaminess to those perceived in whole-milk beverages could be obtained by adding
long-chain INL at a concentration above 8%. Of the MPA samples with added
INL:EVOO, the ones with the lowest EVOO concentration (45:15 ratio) were firmest
(Fig. 5a). At a fixed EVOO concentration, the firmness of the MPB samples decreased
significantly with increasing INL concentrations (15:45 vs 30:45 and 30:30 vs 45:30
ratios); whereas at a fixed INL concentration, the addition of EVOO at higher
concentrations considerably reduced BE firmness in both MPA and MPB samples (30:30
vs 30:45 and 45:15 vs 45:30 ratios). Both ingredients caused softening of the MP
samples, but when they were added in blends, the degree of softening was more
dependent on EVOO concentration. In oil/water emulsions, the extent of the linear region
has been reported to decrease with increasing oil-phase volume fraction from 20% to
40% v/v.[39]
When INL/EVOO blends were added to MP, the BE firmness value behaved
similarly in the FMP and F/TMP samples (Fig. 5b). In natural MP the product was also
softer than the fresh control after freezing and thawing.[10]
When compared with samples
with added INL alone, the differences in firmness between fresh and frozen/thawed
samples were greater in samples with INL/EVOO blends. Probably, the structural damage
caused by freezing enabled the oil droplets to come close enough together to aggregate
through steric and/or electrostatic forces.[40]
Variations in BE firmness based on a
freeze/thaw cycle showed that the BE firmness value developed differently for MPA and
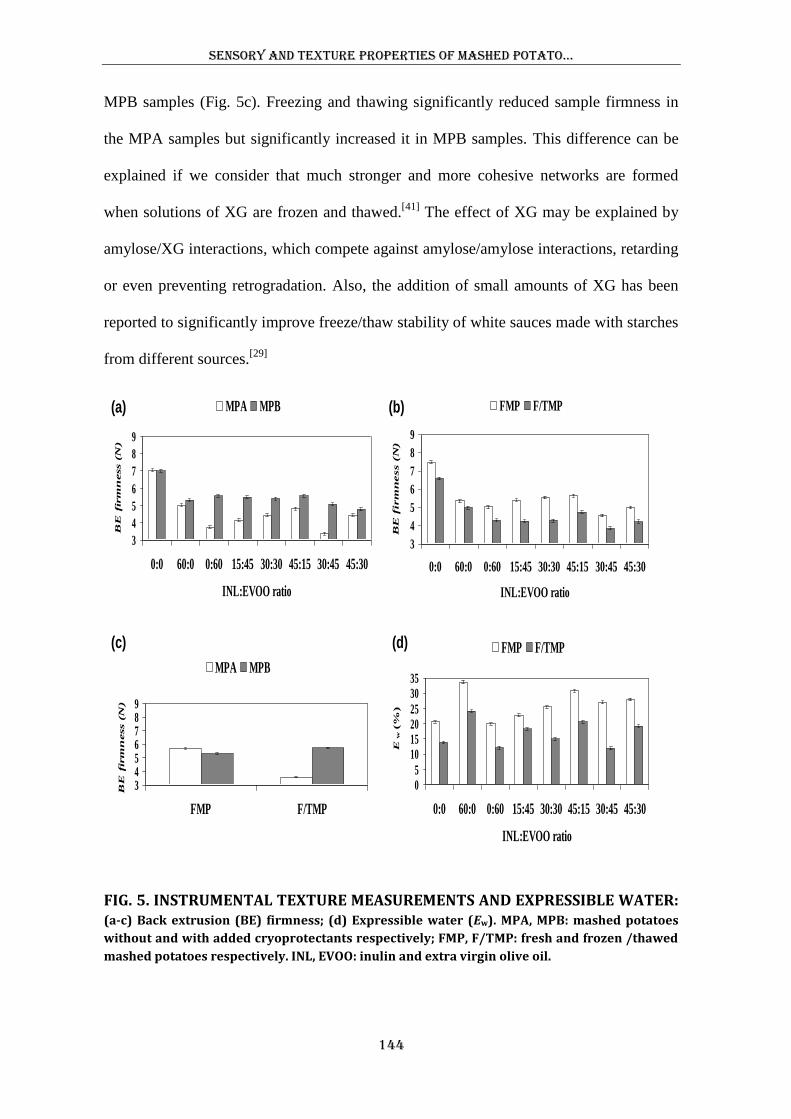
Sensory and texture properties of mashed potato…
144
MPB samples (Fig. 5c). Freezing and thawing significantly reduced sample firmness in
the MPA samples but significantly increased it in MPB samples. This difference can be
explained if we consider that much stronger and more cohesive networks are formed
when solutions of XG are frozen and thawed.[41]
The effect of XG may be explained by
amylose/XG interactions, which compete against amylose/amylose interactions, retarding
or even preventing retrogradation. Also, the addition of small amounts of XG has been
reported to significantly improve freeze/thaw stability of white sauces made with starches
from different sources.[29]
FIG. 5. INSTRUMENTAL TEXTURE MEASUREMENTS AND EXPRESSIBLE WATER: (a-c) Back extrusion (BE) firmness; (d) Expressible water (Ew). MPA, MPB: mashed potatoes
without and with added cryoprotectants respectively; FMP, F/TMP: fresh and frozen /thawed
mashed potatoes respectively. INL, EVOO: inulin and extra virgin olive oil.
05
10152025
3035
0:0 60:0 0:60 15:45 30:30 45:15 30:45 45:30
INL:EVOO ratio
Ew (
%)
FMP F/TMP
3456789
FMP F/TMP
BE
fir
mn
ess (
N)
MPA MPB
3
4
5
6
7
8
9
0:0 60:0 0:60 15:45 30:30 45:15 30:45 45:30
INL:EVOO ratio
BE
firm
ness (
N)
FMP F/TMP
3
4
5
6
7
8
9
0:0 60:0 0:60 15:45 30:30 45:15 30:45 45:30
INL:EVOO ratio
BE
fir
mn
ess (
N)
MPA MPB(a)
(c) (d)
(b)
Sensory and texture properties of mashed potato…
145
Ew value variations for different INL:EVOO ratios of both FMP and F/TMP
samples are shown in Fig. 5d. In both FMP and F/TMP samples, at a fixed total
concentration, the highest and lowest Ew values were registered in samples with addition
ratios of 60:0 and 0:60 respectively. Furthermore, in the FMP products the water holding
capacity (WHC) decreased linearly with increasing INL content (0:60, 15:45, 30:30 and
45:15 ratios), probably due to large INL particles occupying the interchain spaces and,
displacing the water. Nevertheless, EVOO by itself did not affect the WHC of MP
systems (Table 4). Besides, Ew was greater in the FMP samples than in their F/TMP
counterparts in all cases. This is related in part to water loss occurring in the
frozen/thawed samples through recrystallization and sublimation phenomena. However,
these results also suggest that cooling prior to freezing, as well as freezing itself, might
have favored conformational changes in the INL molecules, which in turn would have
resulted in a smaller solid particle size and a larger surface exposed to interaction with
water.[42]
This could account for the superior water retention detected in the F/TMP
samples. Moreover, as long-chain INL particles are only held together by physical
interaction between molecules,[43]
the mechanical strength of the crystallized INL
particles might have been too low to support the stresses caused by ice crystal growth
during freezing. Also, in these systems there could have been sedimentation of INL
crystals as a result of decreasing temperature[44]
and subsequent recrystallization during
thawing and heating. After freezing, enough water may be present to allow a small
fraction of INL to recrystallize with different solubility properties.
After a complete dependence study which was carried out on the sensory attribute
scores versus instrumental texture measurements, low correlations between instrumental
and sensory ratings were found. Previous publications by other researchers generally
agreed on good to excellent correlations for hardness (based on calculated “r” values),[7]
Sensory and texture properties of mashed potato…
146
which contrasts with correlations for other parameters that are usually mediocre and
product dependent. In this study, when considering different subgroups separately,
relatively high correlations with sensory firmness scores were found in the case of BE
firmness, so that relationships were statistically significant as linear functions. The best
correlation was found between BE firmness and perceived firmness when the F/TMP
samples with added cryoprotectants were considered separately (R2 = 0.88). Differences
in thickness observed among samples were explained by BE firmness, but not the
variation in other surface and geometrical textural attributes, determining sample
creaminess. Certainly, although mechanical and rheological properties are the
predominant stimuli affecting texture perception in most foods, results indicate that in the
case of MP samples, matching rheological behavior with perceived texture is not
guaranteed, as reported by Bayarri et al.[28]
CONCLUSIONS
Mechanical texture properties have confirmed that both INL and EVOO can be
considered as soft fillers suspended and entrapped in a rigid amylose/amylopectin matrix
respectively. The most obvious difference was observed between 0:0 control and samples
containing 15:45 and 30:45 ratios, which was ascribed mainly to the fact that the samples
containing higher EVOO concentrations received lower granularity scores. In FMP
samples, the sensory texture profile of products with an added 30:30 ratio was similar to
that of the product without added ingredients. This result has important consequences for
the formulation of MP with added inulin and extra virgin olive oil blends, since the food
industry places particular emphasis on the development of foods that have the same
desirable quality attributes as the original product. On the contrary, in both F/TMP and
Sensory and texture properties of mashed potato…
147
MPA samples considered separately, the texture profile of the product without added
ingredients was very different from that of MP samples containing INL and EVOO,
whether added singly or in associated blends. If the product is to be frozen, and therefore
contains cryoprotectants, κ-C and XG mask the effect of adding different INL/EVOO
blends on the texture profile of the MP samples, probably due to the water holding
capacity conferred by XG. PCA of the total dataset and FMP, F/TMP and MPA samples
considered separately showed that component 1 served as an index of the mechanical
behavior and moistness of the product, whereas when MPB samples were analyzed
separately, the first principal component served as an index of the roughness/smoothness
in response to reduced starch retrogradation in the presence of κ-C and XG. Although the
level of consonance between panelists was acceptable, better results could have been
achieved with more training in the use of stickiness, adhesiveness, ease of swallowing
and palate coating. Furthermore, the results suggest that there is an overlap between
moisture (1) and moisture (2), between fibrousness (1) and fibrousness (2) and between
stickiness and adhesiveness. Certainly, more work is needed on reselection of some
sensory attributes.
ACKNOWLEDGMENTS
The authors wish to thank the Spanish Ministry of Science and Innovation for
financial support (AGL2007-62851).
REFERENCES
1. Nishinari, K. Texture and rheology in food and health. Food Science and
Technology Research 2009, 15, 99-106.
Sensory and texture properties of mashed potato…
148
2. Coussement, P.A.A. Inulin and oligofructose: safe intakes and legal status.
Journal of Nutrition 1999, 129, 1412S–1417S.
3. O’Brien, C.M.; Mueller, A.; Scannell, A.G.M.; Arendt, E.K. Evaluation of the
effects of fat replacers on the quality of wheat bread. Journal of Food Engineering 2003,
56, 265–267.
4. Kim, Y.; Faqih, M.N.; Wang, S.S. Factors affecting gel formation of inulin.
Carbohydrate Polymers 2001, 46, 135-145.
5. Villegas, B.; Carbonell, I.; Costell, E. Inulin milk beverages: sensory differences
in thickness and creaminess using r-index análisis of the ranking data. Journal of Sensory
Studies 2007, 22, 377-393.
6. US Food and Drug Administration. Press Release P04-100. November 1, 2004,
http://www.fda.gov/bbs/topics/news/2004/NEW01129.htlm. Accessed on April 14, 2010.
7. Szczesniak, A.S. Texture is a sensory property. Food Quality and Preference
2002, 13, 215-225.
8. Deliza, R.; Macfie, H.; Hedderley, D. The consumer perception of passion-fruit
juice using Free-Choice Profiling. Journal of Sensory Studies 2005, 20, 17–27.
9. Blahovec, J.; Esmir, A.A.S.; Valentora, H. Simplified texture profile análisis of
cooked potatoes. International Journal of Food Properties 2000, 3(2), 193-206.
Sensory and texture properties of mashed potato…
149
10. Alvarez, M.D.; Fernández, C.; Canet, W. Effect of freezing/thawing conditions
and long-term frozen storage on the quality of mashed potatoes. Journal of the Science of
Food and Agriculture 2005, 85, 2327-2340.
11. Bruwer, M.-J.; MacGregor, J.F.; Bourg, W.M. Fusion of sensory and mechanical
testing data to define measures of snack food texture. Food Quality and Preference 2007,
18, 890-900.
12. Alvarez, M.D.; Fernández, C.; Canet, W. Enhancement of freezing stability in
mashed potatoes by the incorporation of kappa-carrageenan and xanthan gum blends.
Journal of the Science of Food and Agriculture 2009, 89, 2115-2127.
13. Fernández, C.; Canet, W.; Alvarez, M.D. Quality of mashed potatoes: effect of
adding blends of kappa-carrageenan and xanthan gum. European Food Research and
Technology 2009, 229, 205-222.
14. UNE 87025. Manual de análisis sensorial. Tomo I–Alimentación 1996. Aenor,
Madrid, pp 167–186.
15. ISO. Sensory analysis. Vocabulary 2008. Standard nº.5492. Geneva, Switzerland.
16. ISO. Sensory analysis. General guidance for the selection, training and monitoring
of assessors. Part 1: Selected assessors 1993. Standard nº.8586-1. Geneva, Switzerland.
17. ISO. Sensory analysis. Methodology. General guidance for establishing a sensory
profile 2003. Standard nº.13299. Geneva, Switzerland.
18. Costell, E.; Damasio, M.H.; Izquierdo, L.; Durán, L. Selección de un equipo de
catadores para el análisis descriptivo de la textura no oral de geles de hidrocoloides.
Revista de Agroquímica y Tecnología de los Alimentos 1989, 29(3), 375–383.
Sensory and texture properties of mashed potato…
150
19. Alvarez, M.D.; Fernández, C.; Olivares, M.D.; Canet, W. Comparative
characterization of dietary fibre enriched frozen/thawed mashed potatoes. International
Journal of Food Properties, in press.
20. Nasaruddin, F.; Chin, N.L.; Yusof, Y.A. Effect of processing on instrumental
textural properties of traditional dodol using back extrusion. International Journal of Food
Properties, in press.
21. Eliasson, A.C.; Kim, H.R. Changes in rheological properties of hydroxypropyl
potato starch pastes during freeze-thaw treatments I. A rheological approach for
evaluation of freeze-thaw stability. Journal of Texture Studies 1992, 23, 279-295.
22. Ferrero, C.; Martino, M.N.; Zaritzky, N.E. Stability of frozen starch pastes: effect
of freezing, storage and xanthan gum addition. Journal of Food Processing and
Preservation 1993, 17, 191–211.
23. Ferrero, C.; Martino, M.N.; Zaritzky, N.E. Corn starch–xanthan gum interaction
and its effect on the stability during storage of frozen gelatinized suspensions. Starch
1994, 46(8), 300–308.
24. Ferrero, C.; Zaritzky, N.E. Effect of freezing rate and frozen storage on starch-
sucrose-hydrocolloid systems. Journal of the Science of Food and Agriculture 2000, 80,
2149-2158.
25. Brennan, C.S.; Tan, C.K.; Kuri, V.; Tudorica, C.M. The pasting behaviour and
freeze-thaw stability of native starch and native starch-xanthan gum pastes. International
Journal of Food Science and Technology 2004, 39, 1017–1022.
Sensory and texture properties of mashed potato…
151
26. Arocas, A.; Sanz, T.; Fiszman, S.M. Improving effect of xanthan and locust bean
gums on the freeze-thaw stability of white sauces made with different native starches.
Food Hydrocolloids 2009, 23, 2478-2484.
27. Bot, A.; Erle, U.; Vreeker, R.; Agterof, W. Influence of crystallisation conditions
on the large deformation rheology of inulin gels. Food Hydrocolloids 2004, 18, 547-556.
28. Bayarri, S.; González-Tomás, L.; Hernando, I.; Lluch, M.A.; Costell, E. Texture
perceived on inulin-enriched low-fat semisolid Dairy desserts. Rheological and structural
basis. Journal of Texture Studies 2011, Doi:10.1111/j.1745-4603.2010.00280.x
29. de Wijk, R.A.; van Gemert, L.J.; Terpstra, M.E.J.; Wilkison, C.L. Texture of
semi-solids; sensory and instrumental measurements on vanilla custard desserts. Food
Quality and Preference 2003, 14, 305-317.
30. Kim, Y.; Wang, S.S. Kinetic study of thermally induced inulin gel. Journal of
Food Science 2001, 66, 991-997.
31. Baranowska, H.M.; Sikora, M.; Kowalski, S.; Tomasik, P. Interactions of potato
starch with selected polysaccharide hydrocolloids as measured by low-field NMR. Food
Hydrocolloids 2008, 22, 336-345.
32. Carriere, C.J. Evaluation of the entanglement molecular weights of maize starches
from solution rheological measurements. Cereal Chemistry 1998, 75(3), 360–364.
33. Dijksterhuis, G. Assessing panel consonance. Food Quality and Preference 1995,
6 (1), 7-14.
34. Thybo, A.K.; Martens, M. Instrumental and sensory characterization of cooked
potato texture. Journal of Texture Studies 1999, 30, 259-278.
Sensory and texture properties of mashed potato…
152
35. Mandala, I.G.; Palogou, E.D. Effect of preparation conditions and starch/xanthan
concentration on gelation process of potato starch systems. International Journal of Food
Properties 2003, 6, 311–328.
36. Mandala, I.G.; Savvas, T.P.; Kostaropoulos, A.E. Xanthan and locust bean gum
influence on the rheology and structure of a white model-sauce. Journal of Food
Engineering 2004, 64, 335–342.
37. Alvarez, M.D.; Fernández, C.; Olivares, M.D.; Canet, W. Rheological behaviour
and functionality of inulin-extra virgen olive oil-based mashed potatoes. International
Journal of Food Science and Technology 2010, 45, 2108-2118.
38. Guggisberg, D.; Cuthbert-Steven, J.; Piccinali, P.; Bütikofer, U.; Eberhard, P.
(2009). Rheological, microstructural and sensory characterization of low-fat and whole
milk set yogurt as influenced by inulin addition. International Dairy Journal 2009, 19,
107-115.
39. Sun, C.; Gunasekaran, S. Effects of protein concentration and oil-phase volume
fraction on the stability and rheology of menhaden oil-in-water emulsions stabilized by
whey protein isolate with xanthan gum. Food Hydrocolloids 2009, 23, 165-174.
40. Paraskevopoulou, A.; Boskou, D.; Kiosseoglou, V. Stabilization of olive oil-
lemon juice emulsion with polysaccharides. Food Chemistry 2005, 90, 627-634.
41. Giannouli, P.; Morris, E.R. Cryogelation of xanthan. Food Hydrocolloids 2003,
17, 495-501.
42. Chiavaro, E.; Vittadini, E.; Corradini, C. Physicochemical characterization and
stability of inulin gels. European Food Research Technology 2007, 225, 85–94.
Sensory and texture properties of mashed potato…
153
43. Ronkart, S.N.; Paquot, M.; Deroanne, C.; Fougnies, C.; Besbes, S; Blecker, C.S.
Development of gelling properties of inulin by microfluidization. Food Hydrocolloids
2010, 24, 318-324.
44. Toneli, J.T.C.L.; Park, K.J.; Murr, F.E.X.; Negreiros, A.A. Efeito da umidade
sobre a microestrutura da inulina em pó. Ciencia e Tecnología de Alimentos 2008, 28,
122-131.

TEXTURE PERCEPTION DETERMINED BY SOY
PROTEIN ISOLATE AND INULIN ADDITION IN
POTATO PUREE: LINKS WITH MECHANICAL AND
MICROSTRUCTURAL FEATURES.
María Dolores Alvarez, María José Jiménez, María Dolores Olivares,
Laura Barrios and Wenceslao Canet.
Journal of Texture Studies 43 (2012), 361-374.

Texture perception determined by soy protein isolate and inulin…
157
ABSTRACT
This study evaluated the effect of adding soy protein isolate (SPI) and long-chain
inulin (INL) blends with 10 different SPI:INL ratios on the textural, rheological and
microstructural properties of freshly made and frozen/thawed potato puree. All the potato
puree samples were subjected to a sensory texture profile analysis and a trained panel
rated the intensity of six descriptors, while an untrained panel did the same on six
selected frozen/thawed products. The main SPI:INL ratio effect remained significant for
all the descriptors evaluated, when the analysis of variance was applied considering the
untrained assessors as random effects. However, only trained panel scores for creaminess
corresponded well with untrained assessor ratings. Rheological flow index values were
linked with variations in perceived consistency, and geometric and surface textural
attributes were explained by structural features such as the presence of INL crystallites
and SPI coarse strands.
KEYWORDS
Flow behavior, long-chain inulin, microstructure, soy protein isolate, texture
perception, trained and untrained panel
PRACTICAL APPLICATIONS
A potato puree (PP) serving of 200 g with added soy protein isolate (SPI) and/or
inulin (INL) concentrations of 1.5-6% provides from 3 to 12 g of SPI and/or INL,
respectively. The presence of SPI strands is a dominant factor in texture perception of PP
with regards to mouthfeel geometric attributes (visual graininess and fibrousness) and the
Texture perception determined by soy protein isolate and inulin…
158
afterfeel attribute (mouth coating), while INL crystallites are the most important feature
influencing creaminess. By adding small amounts of SPI (1.5%) together with INL at
>3% increases the intensity of perceived creaminess, which was the most important
descriptor in practical terms. In view of the foregoing, PP with added SPI and INL is a
promising foodstuff for incorporating into a diet and in addition, even improves product
structure.
INTRODUCTION
Food texture is defined as “all the rheological and structural (geometric and
surface) attributes of the product perceptible by means of mechanical, tactile and, where
appropriate, visual and auditory receptors” (Foegeding et al. 2011). Many instrumental
methods are geared to determining rheological characteristics of food products
(Wilkinson et al. 2000). Nevertheless, Heath and Lucas (1987) recognized that advances
in understanding texture perception would depend on a multidisciplinary approach
considering sensory research, physiology and research into food structure.
Basically, potato puree (PP) is formulated with native potato starch (Alvarez et al.
2009), and this starch-based food can be considered as a semisolid or soft-solid,
viscoelastic material (Foegeding et al. 2011). Changing their composition by adding new
ingredients would result in texture changes of the final product. Soy protein isolate (SPI)
is an ingredient that can improve the organoleptic characteristics and nutritional value of
food products (Tseng et al. 2009). Because of the health benefits of inulin (INL) in the
human diet, much research has focused on this ingredient (Bot et al. 2004; González-
Tomás et al. 2008).
Texture perception determined by soy protein isolate and inulin…
159
The classification of textural terms for solids and semisolids gave rise to a profiling
method of texture description (Texture Profile Analysis [TPA]) (Szczesniak 2002),
providing qualitative and quantitative measures of a product’s characteristics. Qualitative
component comprises the descriptive terms which define the sensory profile of the
product, while quantitative component measures the intensity of each attribute perceived
to be present (Carlucci and Monteleone 2001).
Starch-based products have been characterized by sensory descriptors such as
mouth coating, creaminess, or thickness (De Wijk et al. 2003, 2006). High-fat custards
produced less sensation of dryness and fibrousness, and more sensations of flavor,
creamy, fatty mouthfeel and after-feel than their zero fat-containing counterparts (De
Wijk et al. 2003). Addition of olive oil enhanced the PPs sensory quality reducing
granularity, denseness, cohesiveness, adhesiveness and fibrousness, and increasing
homogeneity, ease of swallowing and palate coating (Alvarez et al. 2011b).
Two types of panels are used, namely the trained profile panel, commonly modeled
after the General Foods Texture Profile Panel (Cardello et al. 1985) and the consumer
panel, used frequently for obtaining hedonic texture measures. Research on starch-based
foods is mostly conducted to study sensory characteristics rated by trained panels.
However, no research has been conducted to assess the relationships between judgments
of the perceived texture of starch-based foods by trained and untrained panelists.
Moreover, in many research papers, a description of the model of analysis of variance
(ANOVA) used is often ignored, even though there are two main ANOVA models (Næs
and Langsrud 1998). Assessors should be considered as fixed parameters to analyze the
type of individual differences, but as random variables to validate product differences
(Carlucci and Monteleone 2001).
Texture perception determined by soy protein isolate and inulin…
160
The first objective of this study was to evaluate the effect of the SPI:INL ratio and a
freeze/thaw cycle on the perceived texture of PPs supplemented with different SPI/INL
blends using a statistical approach to validate product differences as well as trained and
untrained panel performances. A second objective was to study as to what extent the
perceived texture in these systems is related to rheological flow properties and
microstructural features.
MATERIALS AND METHODS
Materials
The potatoes used were tubers (cv Kennebec) from Aguilar de Campoo (Burgos,
Spain). Readily dispersible SPI (PRO-FAM 646, ADM, Netherlands) was used without
further purification. INL (Orafti HP, BENEO-Orafti, Tienen, Belgium) was a “long-
chain” INL with a degree of polymerization, DP ≥ 23 and 99.5% purity (producer’s data).
κ-C (GENULACTA carrageenan type LP-60) and XG (Keltrol F [E]) were donated by
Premium Ingredients, S.L. (Girona, Spain). Eight SPI:INL ratio blends were added to
samples: 1.5:4.5 (that is 1.5%, of the total raw ingredients, [SPI]/4.5% [INL]), 3:3,
4.5:1.5, 1.5:6, 3:4.5, 4.5:3, 6:1.5 and 6:6. Samples without added ingredients (0:0
control), with 6% added INL alone (0:6) and with 6% added SPI alone (6:0) were also
prepared for both fresh PP (FPP) and those subjected to a freeze/thaw cycle (F/TPP).
Preparation of PP Samples
Tubers were manually washed, peeled and diced. PP were prepared in ~1,350-g
batches from 790 g of potatoes, 300 mL of semi-skimmed in-bottle sterilized milk, 200
mL of water, 10 g of salt (NaCl) and 1.95 g each of two hydrocolloids, κ-C and XG
Texture perception determined by soy protein isolate and inulin…
161
(Premium Ingredients, L.L., Girona, Spain) (Alvarez et al. 2009), using a TM 31 food
processor (Vorwerk España, M.S.L., S.C., Madrid, Spain). The INL (0-6%) was
previously dissolved in the 300 mL of milk and 150 mL of water at 70C for 15 min and
stirred constantly with a magnetic stirrer. The ingredients were first cooked for 30 min at
90C (blade speed: 40 rpm) and any evaporated water was replaced gravimetrically. At
this point, SPI which had previously been hydrated at a ratio of SPI to water of 1:5 was
added at 1.5-6%. Water used to hydrate SPI was removed from the initial water content
(200 mL). Next, all the ingredients were cooked at 90C for 5 min. The mash was ground
for 40 s (1,200 rpm) and 20 s (2,600 rpm), and then homogenized through a stainless steel
sieve (diameter: 1.5 mm). Half of each fresh blend was analyzed immediately, and the
other half was frozen and thawed. Freezing, thawing and heating procedures can be
consulted (Alvarez et al. 2011a,b). Sample testing temperature was 55C as this is the
preferred temperature for PP consumption.
Sensory Evaluation
PP samples which were subjected to sensory TPA, modified to evaluate vegetable
purees according to UNE 87025 (1996) and other relevant International Standards (ISO
2008), were used to select and define the descriptors included in the profile. Profile
attributes were classified into four groups (Fernández et al. 2008; Alvarez et al. 2011b),
but only six selected descriptors were rated in this study (Table 1). Descriptors are listed
in order of perception according to ISO guidelines (ISO 2003). A panel of four assessors,
previously trained (ISO 1993), evaluated the descriptors of the samples.
Daily, for 44 days at a fixed time (1:00 p.m.), assessors were given one PP sample
(about 50 g each), for scoring the attributes of the 22 samples, in duplicate. All the
samples were served in white plastic vessels at a temperature of 55 ± 1C. For each
Texture perception determined by soy protein isolate and inulin…
162
sample, panelists evaluated the perceived intensity of the attributes on 8 cm descriptive
linear scales labeled at each anchor: (left anchor: 1 = ‘‘not detectable”; right anchor: 9 =
‘‘extremely intense’’).
An untrained panel of 27 assessors (8 males, 19 females) rated the intensity of the
descriptors on only six selected F/TPP samples, in triplicate, over six sessions and each
panelists evaluated three samples per session. These samples were selected in order to be
sure that the variation between them was sufficiently large (considerable differences can
be observed between the microstructure of these samples; see Microstructure
Examination subsection). At the start of each session, untrained panelists were given a
printed response sheet with written instructions for the test, including the definition of
each attribute to be judged during the session (Table 1), as well as the main adjectives
corresponding to each anchor of the scale. In addition, untrained panelists were given a
20-min orientation session on the day before the test session; the panel leader explained
the objectives of the study and untrained panelists were instructed to perform exactly the
same sensory/psychophysics tasks than the trained panelists. These tasks included
discussion in the rendering of operational definitions and scaling of each specific textural
attribute. At each session, the untrained panelists were encouraged to refer to instructions
and definitions of the attributes, and other spoken explanations were given to the panel
when required. Moreover, each panelist was observed while he/she made the trial
evaluations. The untrained panel had never previously evaluated PPs, although many had
previously participated in making textural or other analytical sensory scores of a variety
of foods. Definitely, the untrained panelist did not evidence difficulty to evaluate these
descriptors in the six selected F/TPP samples. Similarly, samples were served at about 55
± 1C in white plastic vessels, and the intensity of each attribute was scored as indicated
above. Still mineral water was used as palate cleanser. The untrained panel was asked to
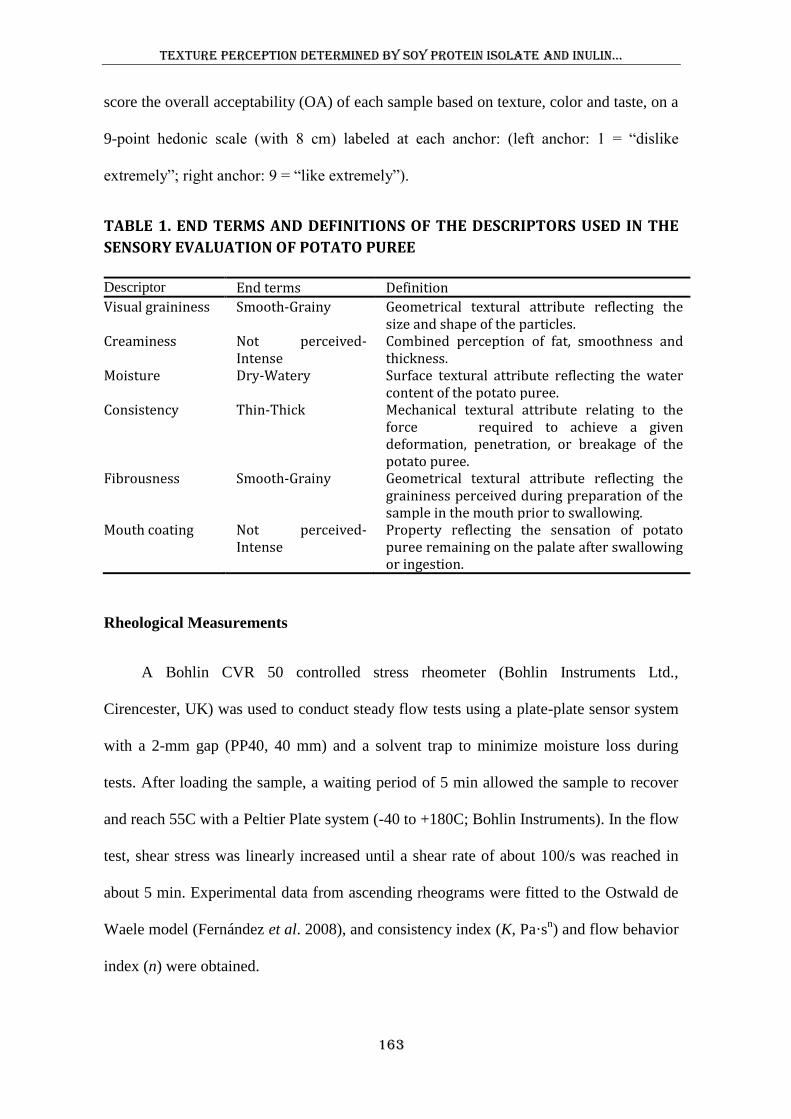
Texture perception determined by soy protein isolate and inulin…
163
score the overall acceptability (OA) of each sample based on texture, color and taste, on a
9-point hedonic scale (with 8 cm) labeled at each anchor: (left anchor: 1 = “dislike
extremely”; right anchor: 9 = “like extremely”).
TABLE 1. END TERMS AND DEFINITIONS OF THE DESCRIPTORS USED IN THE
SENSORY EVALUATION OF POTATO PUREE
Descriptor End terms Definition
Visual graininess Smooth-Grainy Geometrical textural attribute reflecting the size and shape of the particles.
Creaminess Not perceived-Intense
Combined perception of fat, smoothness and thickness.
Moisture Dry-Watery Surface textural attribute reflecting the water content of the potato puree.
Consistency Thin-Thick Mechanical textural attribute relating to the force required to achieve a given deformation, penetration, or breakage of the potato puree.
Fibrousness Smooth-Grainy Geometrical textural attribute reflecting the graininess perceived during preparation of the sample in the mouth prior to swallowing.
Mouth coating Not perceived-Intense
Property reflecting the sensation of potato puree remaining on the palate after swallowing or ingestion.
Rheological Measurements
A Bohlin CVR 50 controlled stress rheometer (Bohlin Instruments Ltd.,
Cirencester, UK) was used to conduct steady flow tests using a plate-plate sensor system
with a 2-mm gap (PP40, 40 mm) and a solvent trap to minimize moisture loss during
tests. After loading the sample, a waiting period of 5 min allowed the sample to recover
and reach 55C with a Peltier Plate system (-40 to +180C; Bohlin Instruments). In the flow
test, shear stress was linearly increased until a shear rate of about 100/s was reached in
about 5 min. Experimental data from ascending rheograms were fitted to the Ostwald de
Waele model (Fernández et al. 2008), and consistency index (K, Pa·sn) and flow behavior
index (n) were obtained.
Texture perception determined by soy protein isolate and inulin…
164
Apparent viscosity values at 50/s (ηapp,50 [Pa·s]) would represent the approximate
viscosity felt in mouth (Bourne 2002). Thus, apparent viscosity values at 50/s were
estimated (Eq. 1) and associated with oral evaluation of consistency.
ηapp,50.
n-1
Kokini oral shear stress (σoral [Pa]) has been used as a physical index of the sensory
perception of thickness (Bayarri et al. 2011). Therefore, n and K values were used to
calculate the σoral and considered as an index of perceived thickness or consistency.
Scanning Electron Microscopy (SEM)
PP microstructure was examined by SEM using a Hitachi model S-2.100
microscope (Hitachi, Ltd., Tokyo, Japan). PP samples were air-dried, then mounted and
sputter-coated with Au (200 A approx.) in a SPI diode sputtering system metallizer.
Photomicrographs were taken with a digital system Scanvision 1.2 of Röntgenanalysen-
Technik (800 ×1,200 pixel, Rontec, GmbH, Berlin, Germany).
Statistical Analysis
A three-way mixed-model ANOVA (SPI:INL ratio [S], treatment [T], i.e.
performance or not of a freeze/thaw cycle and assessor [A]) with interactions was applied
to the sensory descriptors evaluated by the trained panel, assuming that main effects and
interactions were fixed effects. A two-way mixed-model ANOVA (SPI:INL ratio [S],
treatment [T], and S × T) was also applied to the descriptors, likewise, ignoring random
effects. Subsequently, a three-way mixed-model ANOVA was performed on the
descriptors rated by the untrained panel to analyze the SPI:INL ratio, assessor (A) and
replicate (R) effects and their interactions, again assuming that main effects and
interactions were fixed effects. Next, a two-way mixed-model ANOVA (S, A and S × A)
Texture perception determined by soy protein isolate and inulin…
165
was applied, considering assessors and interaction as random effects (Carlucci and
Monteleone 2001). Minimum significant differences were calculated using Fisher’s least
significant difference test (LSD; 95%).
In turn, a two-way mixed-model ANOVA (S, T and S × T) was applied to
rheological data (n, K, ηapp,50, and σoral). Significant differences were determined using
Fisher’s test (LSD; 99%). Correlations between descriptors rated by untrained and trained
panels were determined by multiple regressions with confidence intervals of 95%.
Pearson correlations were also established between rheological properties and perceived
consistency rated by the trained panel. All analyses were performed using Statistical
Package for the Social Sciences (SPSS) 19.0 software (SPSS, Inc., Chicago, IL).
RESULTS AND DISCUSSION
Sensory Properties Evaluated by the Trained Panel
The three-way mixed-model ANOVA showed a significant (P < 0.05) SPI:INL
ratio and treatment main effects for all the descriptors (Table 2). Furthermore, S × T
interactions were significant in all cases. Assessors were not significant for five
descriptors, showing consistency between judges for these attributes. However, assessors
were a significant source of variation in the case of fibrousness, indicating that additional
training in the use of this descriptor could be needed. Even so, the effect of T × A and S ×
A interactions was not significant for all textural attributes, indicating a good level of
agreement among the panel members regarding their evaluations. According to Carlucci
and Monteleone (2001), as assessors were considered as fixed effects, no conclusions can
be extended to the population from which the assessors were drawn.
Texture perception determined by soy protein isolate and inulin…
166
Effect of the SPI:INL Ratio in the FPP and F/TPP Samples. After considering only S
and T effects and their interaction, the two-way mixed-model ANOVA again showed that
both main effects and interaction were a significant (P < 0.05) source of variation for all
attributes (data not shown). Table 3 shows the mean values of each descriptor for both
FPP and F/TPP samples. In the FPP samples, scores for graininess were very low and
those for creaminess very high, for the control and all the samples with higher INL
contents. However, by increasing SPI concentrations, perceived graininess increased and
creaminess decreased. All the other FPP samples had significantly higher moisture and
lower consistency scores when compared with the 0:0 control, indicating that either SPI
or INL are hygroscopic ingredients and behaved as soft fillers. Exudation of the
continuous liquid phase of gels during compression gives rise to watery/juicy sensory
attributes (van Vliet et al. 2009), although the microstructural characteristics of the gels
are also involved. Long-chain INL structure resembles that of a network of fat crystals in
oil, since this type of INL forms small microcrystal aggregates that occlude a large
amount of water, thereby creating a smooth and creamy texture (Bot et al. 2004;
Guggisberg et al. 2009). Similarly, an important functional property in SPI is gelation
during thermal treatment with desirable water holding capacity (WHC) (Tseng et al.
2009). However, FPP samples with an added 6:6 ratio had the lowest consistency score,
suggesting that perceived water content is not the only factor influencing perceived
consistency in FPP products.
Significantly, fresh 0:0 control and samples with added 0:6, 3:3 and 1.5:6 ratios had
the lowest fibrousness scores, while samples with higher SPI contents had the highest
fibrousness ratings. Samples with higher SPI and INL contents also presented the highest
and lowest scores respectively for mouth coating. Stading and Hermansson (1990) found
that 10-12% solutions of β-lactoglobulin preheated to 90-95 °C formed fine-stranded gels
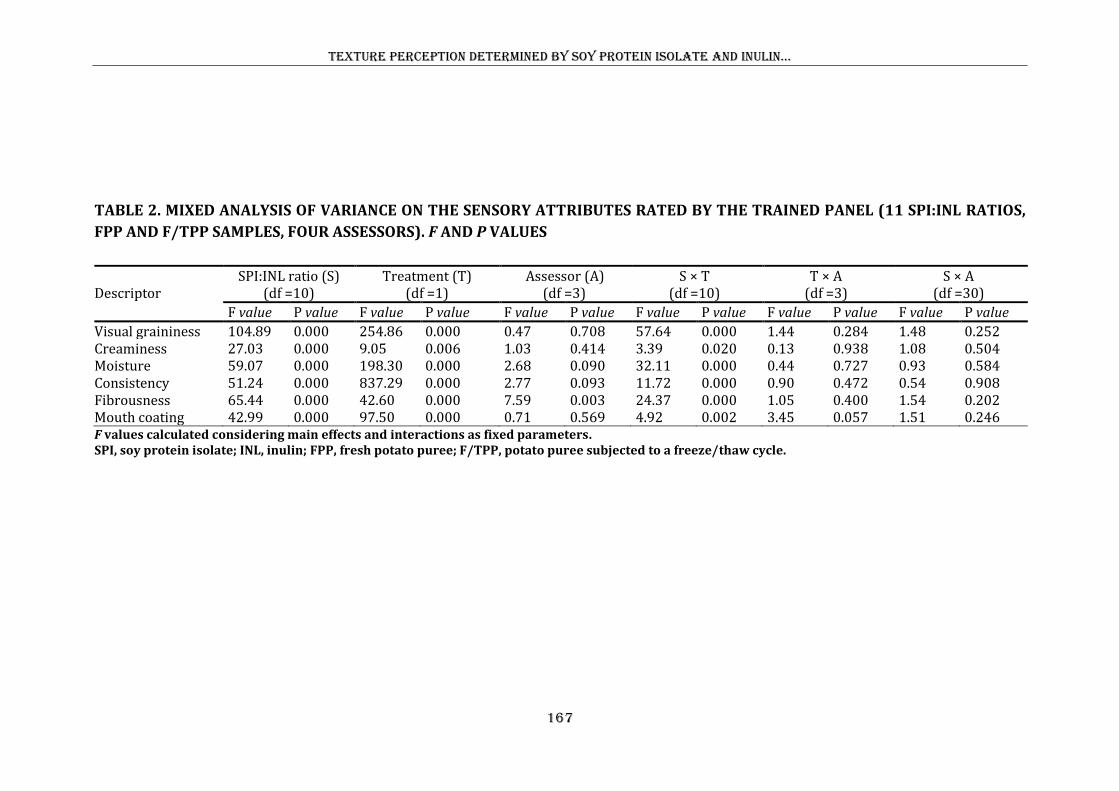
Texture perception determined by soy protein isolate and inulin…
167
TABLE 2. MIXED ANALYSIS OF VARIANCE ON THE SENSORY ATTRIBUTES RATED BY THE TRAINED PANEL (11 SPI:INL RATIOS,
FPP AND F/TPP SAMPLES, FOUR ASSESSORS). F AND P VALUES
Descriptor
SPI:INL ratio (S) (df =10)
Treatment (T) (df =1)
Assessor (A) (df =3)
S × T (df =10)
T × A (df =3)
S × A (df =30)
F value P value F value P value F value P value F value P value F value P value F value P value
Visual graininess 104.89 0.000 254.86 0.000 0.47 0.708 57.64 0.000 1.44 0.284 1.48 0.252 Creaminess 27.03 0.000 9.05 0.006 1.03 0.414 3.39 0.020 0.13 0.938 1.08 0.504 Moisture 59.07 0.000 198.30 0.000 2.68 0.090 32.11 0.000 0.44 0.727 0.93 0.584 Consistency 51.24 0.000 837.29 0.000 2.77 0.093 11.72 0.000 0.90 0.472 0.54 0.908 Fibrousness 65.44 0.000 42.60 0.000 7.59 0.003 24.37 0.000 1.05 0.400 1.54 0.202 Mouth coating 42.99 0.000 97.50 0.000 0.71 0.569 4.92 0.002 3.45 0.057 1.51 0.246 F values calculated considering main effects and interactions as fixed parameters. SPI, soy protein isolate; INL, inulin; FPP, fresh potato puree; F/TPP, potato puree subjected to a freeze/thaw cycle.
Texture perception determined by soy protein isolate and inulin…
168
with flexible or rigid strands at low and high pH respectively. Surely, the presence of
such SPI threads provoked an increase in intensity of fibrousness and mouth coating
detected in the samples with higher SPI contents.
In turn, F/TPP samples with higher SPI contents were also more negatively affected
by a freeze/thaw cycle and registered a significant increase in surface graininess as
compared to their FPP counterparts (Table 3). Hashizume et al. (1971) reported that
soybean proteins, when frozen in a solution, associate by intermolecular S-S bonds and
become partly insoluble after thawing because they are closer to each other due to the
more highly concentrated solution produced by the partially frozen water. It is thought
that these changes might lead to a pronounced increase in visual graininess and a more
significant decrease in creaminess in the frozen samples with higher SPI concentrations
when compared with their FPP counterparts. Conversely, when higher amounts of INL
were added to F/TPP samples, they had a significantly lower grainy appearance and
higher creaminess scores than those with added SPI at the higher concentrations. This
result is in accordance with that observed previously in low-fat and whole milk set
yoghurt (Guggisberg et al. 2009). The authors reported that with rising INL
concentration, perception of the creaminess increases as well. When F/TPP samples with
a higher added INL content were thawed by microwave, the water accumulated in INL
crystallites probably tended to diffuse uniformly within the matrix, giving rise to a
homogeneous structure due to readsorption of the water by the amylose. It is
hypothesized that the presence of INL reduces starch retrogradation and may be effective
in the melting of retrograded starch during thawing.
Finally, the incorporation of both SPI and INL ingredients, either alone or blended,
significantly decreased the perceived moisture in the F/TPP samples as compared to their
FPP counterparts, except in the samples with an added 6:1.5 ratio, which was also
Texture perception determined by soy protein isolate and inulin…
169
accompanied by a significant rise in consistency. This was due to intracellular water being
drawn out osmotically when the product was thawed because of the freezing-induced
concentration of the cell mass (Fernández et al. 2008). As a consequence, the perceived
fibrousness and mouth coating were also mostly higher in the F/TPP samples than in their
FPP counterparts.
Sensory Properties Evaluated by the Untrained Panel
Main Effects and Interactions as Fixed Parameters. The three-way mixed-model
ANOVA indicated a significant (P < 0.05) SPI:INL ratio and assessor main effects for all
the descriptors and the OA (Table 4). In these cases, it is important to know whether
assessor variability may influence the estimation of SPI:INL ratio differences. The
significance or not, of the effect of S × A interaction can provide information on this point.
The effect of this interaction was significant for all the descriptors, indicating a certain lack
of concordance within the panel. A part of the S × A interaction is due to scale use, but the
remaining part can be due to other individual differences such as sensitivity, motivation and
culture (Carlucci and Monteleone 2001). In turn, replicate effects were also significant for
all the descriptors, except for moisture, and the OA, confirming that members of an
untrained panel give big variation in their analytical evaluations.
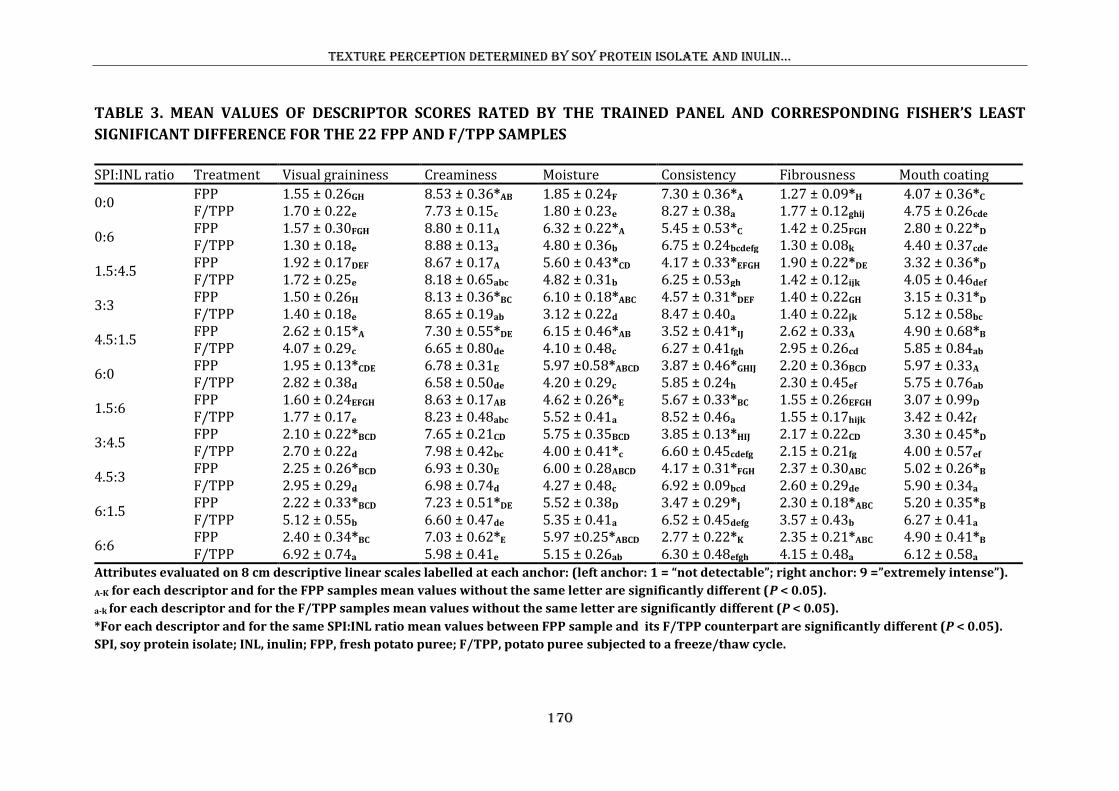
Texture perception determined by soy protein isolate and inulin…
170
TABLE 3. MEAN VALUES OF DESCRIPTOR SCORES RATED BY THE TRAINED PANEL AND CORRESPONDING FISHER’S LEAST
SIGNIFICANT DIFFERENCE FOR THE 22 FPP AND F/TPP SAMPLES
SPI:INL ratio Treatment Visual graininess Creaminess Moisture Consistency Fibrousness Mouth coating
0:0 FPP 1.55 ± 0.26GH 8.53 ± 0.36*AB 1.85 ± 0.24F 7.30 ± 0.36*A 1.27 ± 0.09*H 4.07 ± 0.36*C F/TPP 1.70 ± 0.22e 7.73 ± 0.15c 1.80 ± 0.23e 8.27 ± 0.38a 1.77 ± 0.12ghij 4.75 ± 0.26cde
0:6 FPP 1.57 ± 0.30FGH 8.80 ± 0.11A 6.32 ± 0.22*A 5.45 ± 0.53*C 1.42 ± 0.25FGH 2.80 ± 0.22*D F/TPP 1.30 ± 0.18e 8.88 ± 0.13a 4.80 ± 0.36b 6.75 ± 0.24bcdefg 1.30 ± 0.08k 4.40 ± 0.37cde
1.5:4.5 FPP 1.92 ± 0.17DEF 8.67 ± 0.17A 5.60 ± 0.43*CD 4.17 ± 0.33*EFGH 1.90 ± 0.22*DE 3.32 ± 0.36*D F/TPP 1.72 ± 0.25e 8.18 ± 0.65abc 4.82 ± 0.31b 6.25 ± 0.53gh 1.42 ± 0.12ijk 4.05 ± 0.46def
3:3 FPP 1.50 ± 0.26H 8.13 ± 0.36*BC 6.10 ± 0.18*ABC 4.57 ± 0.31*DEF 1.40 ± 0.22GH 3.15 ± 0.31*D F/TPP 1.40 ± 0.18e 8.65 ± 0.19ab 3.12 ± 0.22d 8.47 ± 0.40a 1.40 ± 0.22jk 5.12 ± 0.58bc
4.5:1.5 FPP 2.62 ± 0.15*A 7.30 ± 0.55*DE 6.15 ± 0.46*AB 3.52 ± 0.41*IJ 2.62 ± 0.33A 4.90 ± 0.68*B F/TPP 4.07 ± 0.29c 6.65 ± 0.80de 4.10 ± 0.48c 6.27 ± 0.41fgh 2.95 ± 0.26cd 5.85 ± 0.84ab
6:0 FPP 1.95 ± 0.13*CDE 6.78 ± 0.31E 5.97 ±0.58*ABCD 3.87 ± 0.46*GHIJ 2.20 ± 0.36BCD 5.97 ± 0.33A F/TPP 2.82 ± 0.38d 6.58 ± 0.50de 4.20 ± 0.29c 5.85 ± 0.24h 2.30 ± 0.45ef 5.75 ± 0.76ab
1.5:6 FPP 1.60 ± 0.24EFGH 8.63 ± 0.17AB 4.62 ± 0.26*E 5.67 ± 0.33*BC 1.55 ± 0.26EFGH 3.07 ± 0.99D F/TPP 1.77 ± 0.17e 8.23 ± 0.48abc 5.52 ± 0.41a 8.52 ± 0.46a 1.55 ± 0.17hijk 3.42 ± 0.42f
3:4.5 FPP 2.10 ± 0.22*BCD 7.65 ± 0.21CD 5.75 ± 0.35BCD 3.85 ± 0.13*HIJ 2.17 ± 0.22CD 3.30 ± 0.45*D F/TPP 2.70 ± 0.22d 7.98 ± 0.42bc 4.00 ± 0.41*c 6.60 ± 0.45cdefg 2.15 ± 0.21fg 4.00 ± 0.57ef
4.5:3 FPP 2.25 ± 0.26*BCD 6.93 ± 0.30E 6.00 ± 0.28ABCD 4.17 ± 0.31*FGH 2.37 ± 0.30ABC 5.02 ± 0.26*B F/TPP 2.95 ± 0.29d 6.98 ± 0.74d 4.27 ± 0.48c 6.92 ± 0.09bcd 2.60 ± 0.29de 5.90 ± 0.34a
6:1.5 FPP 2.22 ± 0.33*BCD 7.23 ± 0.51*DE 5.52 ± 0.38D 3.47 ± 0.29*J 2.30 ± 0.18*ABC 5.20 ± 0.35*B F/TPP 5.12 ± 0.55b 6.60 ± 0.47de 5.35 ± 0.41a 6.52 ± 0.45defg 3.57 ± 0.43b 6.27 ± 0.41a
6:6 FPP 2.40 ± 0.34*BC 7.03 ± 0.62*E 5.97 ±0.25*ABCD 2.77 ± 0.22*K 2.35 ± 0.21*ABC 4.90 ± 0.41*B F/TPP 6.92 ± 0.74a 5.98 ± 0.41e 5.15 ± 0.26ab 6.30 ± 0.48efgh 4.15 ± 0.48a 6.12 ± 0.58a
Attributes evaluated on 8 cm descriptive linear scales labelled at each anchor: (left anchor: 1 = “not detectable”; right anchor: 9 =”extremely intense”).
A-K for each descriptor and for the FPP samples mean values without the same letter are significantly different (P < 0.05).
a-k for each descriptor and for the F/TPP samples mean values without the same letter are significantly different (P < 0.05).
*For each descriptor and for the same SPI:INL ratio mean values between FPP sample and its F/TPP counterpart are significantly different (P < 0.05).
SPI, soy protein isolate; INL, inulin; FPP, fresh potato puree; F/TPP, potato puree subjected to a freeze/thaw cycle.
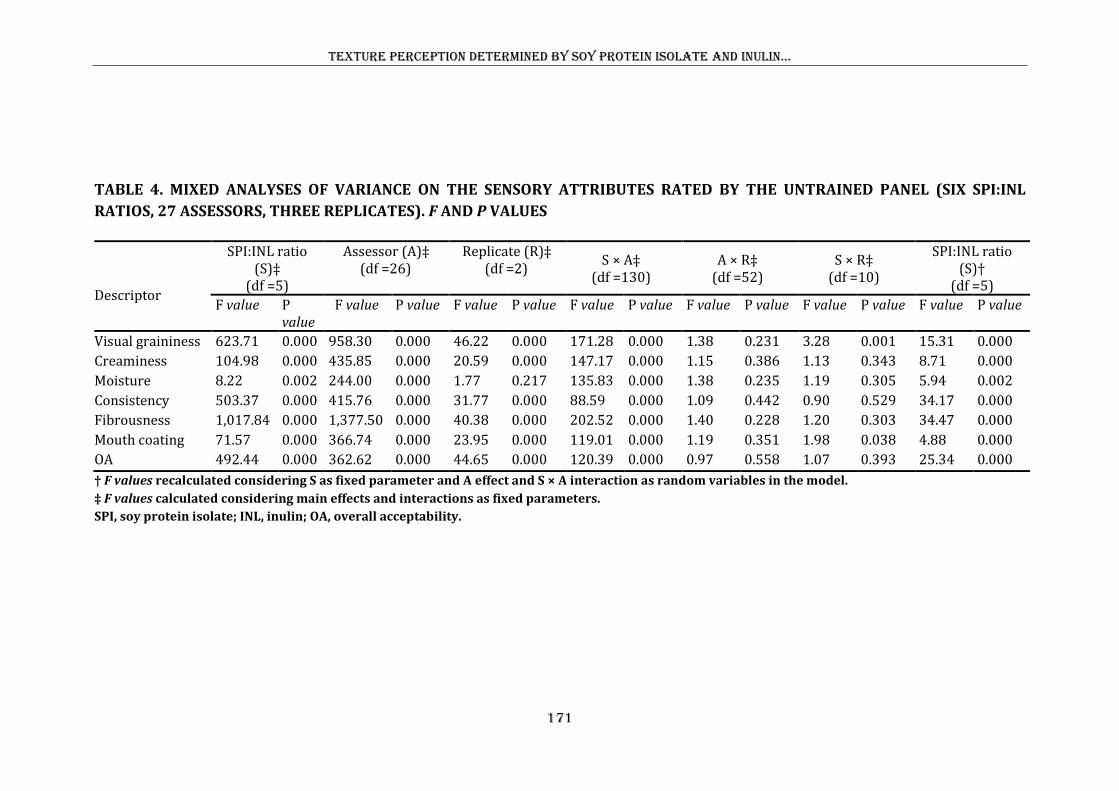
Texture perception determined by soy protein isolate and inulin…
171
TABLE 4. MIXED ANALYSES OF VARIANCE ON THE SENSORY ATTRIBUTES RATED BY THE UNTRAINED PANEL (SIX SPI:INL
RATIOS, 27 ASSESSORS, THREE REPLICATES). F AND P VALUES
Descriptor
SPI:INL ratio (S)‡
(df =5)
Assessor (A)‡ (df =26)
Replicate (R)‡ (df =2)
S × A‡ (df =130)
A × R‡ (df =52)
S × R‡ (df =10)
SPI:INL ratio (S)†
(df =5)
F value P value
F value P value F value P value F value P value F value P value F value P value F value P value
Visual graininess 623.71 0.000 958.30 0.000 46.22 0.000 171.28 0.000 1.38 0.231 3.28 0.001 15.31 0.000
Creaminess 104.98 0.000 435.85 0.000 20.59 0.000 147.17 0.000 1.15 0.386 1.13 0.343 8.71 0.000
Moisture 8.22 0.002 244.00 0.000 1.77 0.217 135.83 0.000 1.38 0.235 1.19 0.305 5.94 0.002
Consistency 503.37 0.000 415.76 0.000 31.77 0.000 88.59 0.000 1.09 0.442 0.90 0.529 34.17 0.000
Fibrousness 1,017.84 0.000 1,377.50 0.000 40.38 0.000 202.52 0.000 1.40 0.228 1.20 0.303 34.47 0.000
Mouth coating 71.57 0.000 366.74 0.000 23.95 0.000 119.01 0.000 1.19 0.351 1.98 0.038 4.88 0.000
OA 492.44 0.000 362.62 0.000 44.65 0.000 120.39 0.000 0.97 0.558 1.07 0.393 25.34 0.000
† F values recalculated considering S as fixed parameter and A effect and S × A interaction as random variables in the model.
‡ F values calculated considering main effects and interactions as fixed parameters.
SPI, soy protein isolate; INL, inulin; OA, overall acceptability.
Texture perception determined by soy protein isolate and inulin…
172
Assessors and Interaction as Random Effects. In spite of the relevance of the S × A
interaction, the main SPI:INL ratio effect for all attributes and OA remained significant
when the ANOVA model was applied considering assessor and interaction as random
effects (Table 4). This means that when the influence of individual differences between
assessors was eliminated, all textural attributes and overall acceptability differed among
F/TPP samples. This result also indicates that the untrained panel did not create enough
variance to obscure differences between samples with different added SPI:INL ratios.
However, the S effect is much less significant for the model when assessor and interaction
are considered as random variables, confirming that the distinction could have wide-ranging
consequences (Næs and Langsrud 1998).
Effect of the SPI:INL Ratio in the F/TPP Samples. Once the mean values of the
descriptors and the OA of samples and the significant differences between them (Table 5)
had been established, the sensory differences were analyzed relating to SPI and INL content.
Grainy appearance scores were higher for the control, for the samples with SPI added alone
and unexpectedly for those with an added 1.5:6 ratio. Samples with added 0:6, 3:3 and 1.5:6
ratios registered the highest scores for creaminess. In turn, the moisture scores of samples
with added INL alone and with a 4.5:3 ratio were significantly higher than that of the 0:0
control. The perceived consistency decreased significantly with the addition of INL alone
but increased considerably with the addition of only SPI. Fibrousness of samples with added
SPI alone did not differ appreciably from that of the 0:0 control, while mouth coating
remained within very narrow margins of variation. Note that although differences between
samples were significant for the six attributes, scores in Table 5 show relatively little
variation per attribute between samples, clearly indicating that the level of the training and
the experience affected perception (Table 3). Additionally, samples with higher INL
contents (0:6 and 1.5:6 ratios) had higher OA scores. In these samples, untrained panelists
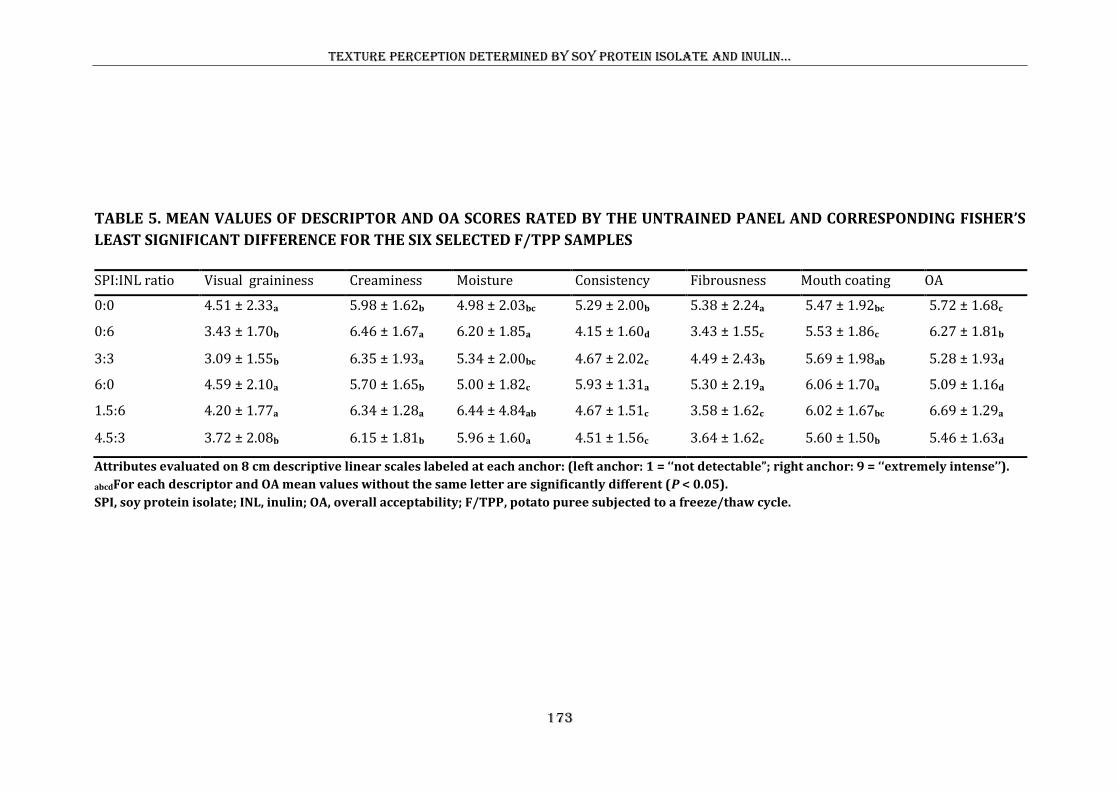
Texture perception determined by soy protein isolate and inulin…
173
TABLE 5. MEAN VALUES OF DESCRIPTOR AND OA SCORES RATED BY THE UNTRAINED PANEL AND CORRESPONDING FISHER’S
LEAST SIGNIFICANT DIFFERENCE FOR THE SIX SELECTED F/TPP SAMPLES
SPI:INL ratio Visual graininess Creaminess Moisture Consistency Fibrousness Mouth coating OA
0:0 4.51 ± 2.33a 5.98 ± 1.62b 4.98 ± 2.03bc 5.29 ± 2.00b 5.38 ± 2.24a 5.47 ± 1.92bc 5.72 ± 1.68c
0:6 3.43 ± 1.70b 6.46 ± 1.67a 6.20 ± 1.85a 4.15 ± 1.60d 3.43 ± 1.55c 5.53 ± 1.86c 6.27 ± 1.81b
3:3 3.09 ± 1.55b 6.35 ± 1.93a 5.34 ± 2.00bc 4.67 ± 2.02c 4.49 ± 2.43b 5.69 ± 1.98ab 5.28 ± 1.93d
6:0 4.59 ± 2.10a 5.70 ± 1.65b 5.00 ± 1.82c 5.93 ± 1.31a 5.30 ± 2.19a 6.06 ± 1.70a 5.09 ± 1.16d
1.5:6 4.20 ± 1.77a 6.34 ± 1.28a 6.44 ± 4.84ab 4.67 ± 1.51c 3.58 ± 1.62c 6.02 ± 1.67bc 6.69 ± 1.29a
4.5:3 3.72 ± 2.08b 6.15 ± 1.81b 5.96 ± 1.60a 4.51 ± 1.56c 3.64 ± 1.62c 5.60 ± 1.50b 5.46 ± 1.63d
Attributes evaluated on 8 cm descriptive linear scales labeled at each anchor: (left anchor: 1 = ‘‘not detectable”; right anchor: 9 = ‘‘extremely intense’’).
abcdFor each descriptor and OA mean values without the same letter are significantly different (P < 0.05).
SPI, soy protein isolate; INL, inulin; OA, overall acceptability; F/TPP, potato puree subjected to a freeze/thaw cycle.
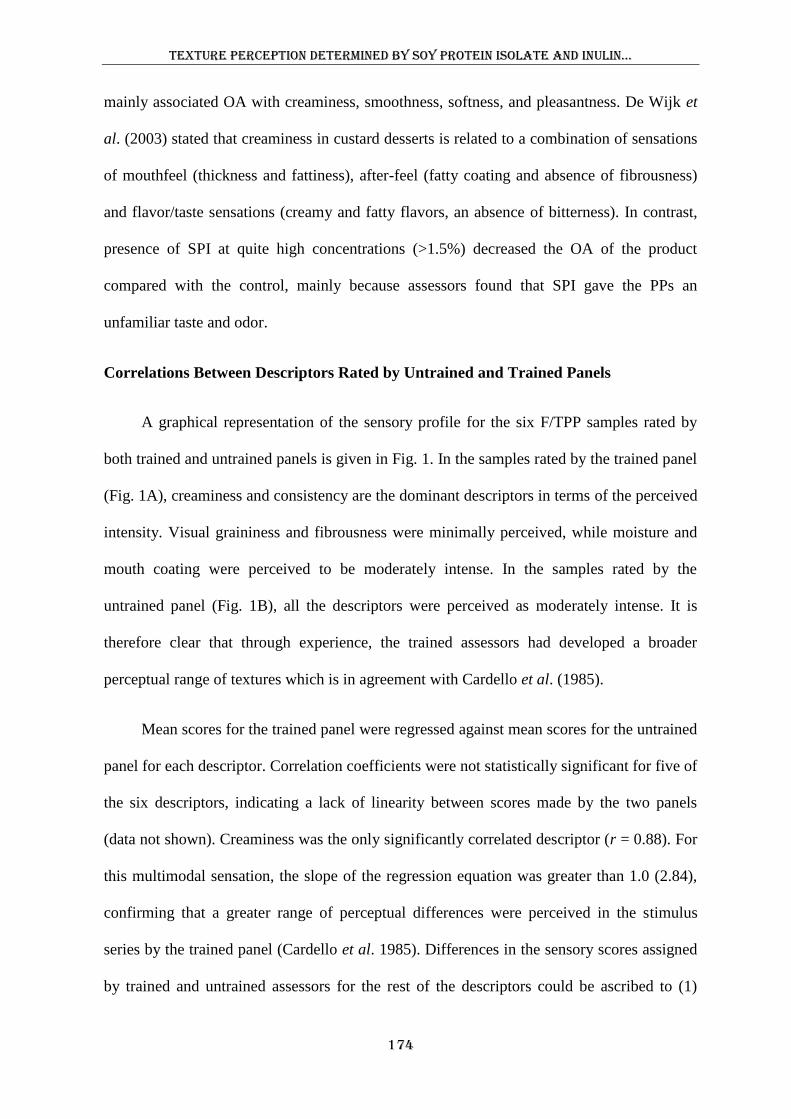
Texture perception determined by soy protein isolate and inulin…
174
mainly associated OA with creaminess, smoothness, softness, and pleasantness. De Wijk et
al. (2003) stated that creaminess in custard desserts is related to a combination of sensations
of mouthfeel (thickness and fattiness), after-feel (fatty coating and absence of fibrousness)
and flavor/taste sensations (creamy and fatty flavors, an absence of bitterness). In contrast,
presence of SPI at quite high concentrations (>1.5%) decreased the OA of the product
compared with the control, mainly because assessors found that SPI gave the PPs an
unfamiliar taste and odor.
Correlations Between Descriptors Rated by Untrained and Trained Panels
A graphical representation of the sensory profile for the six F/TPP samples rated by
both trained and untrained panels is given in Fig. 1. In the samples rated by the trained panel
(Fig. 1A), creaminess and consistency are the dominant descriptors in terms of the perceived
intensity. Visual graininess and fibrousness were minimally perceived, while moisture and
mouth coating were perceived to be moderately intense. In the samples rated by the
untrained panel (Fig. 1B), all the descriptors were perceived as moderately intense. It is
therefore clear that through experience, the trained assessors had developed a broader
perceptual range of textures which is in agreement with Cardello et al. (1985).
Mean scores for the trained panel were regressed against mean scores for the untrained
panel for each descriptor. Correlation coefficients were not statistically significant for five of
the six descriptors, indicating a lack of linearity between scores made by the two panels
(data not shown). Creaminess was the only significantly correlated descriptor (r = 0.88). For
this multimodal sensation, the slope of the regression equation was greater than 1.0 (2.84),
confirming that a greater range of perceptual differences were perceived in the stimulus
series by the trained panel (Cardello et al. 1985). Differences in the sensory scores assigned
by trained and untrained assessors for the rest of the descriptors could be ascribed to (1)
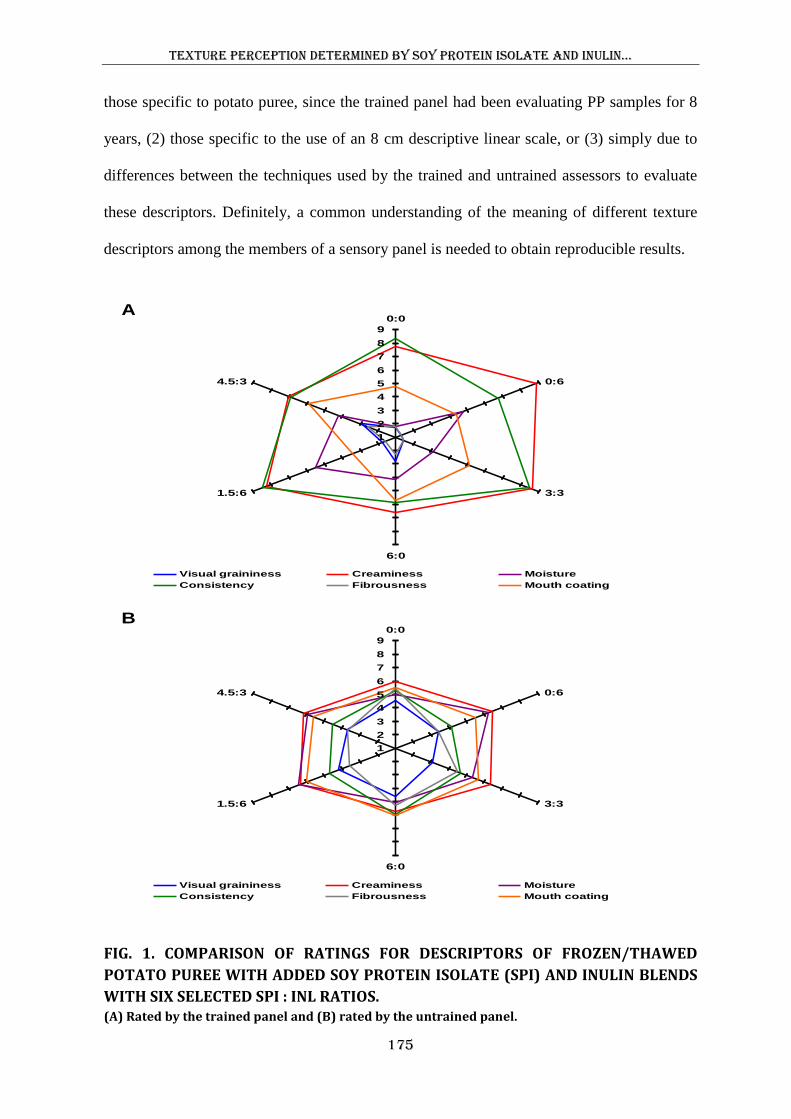
Texture perception determined by soy protein isolate and inulin…
175
those specific to potato puree, since the trained panel had been evaluating PP samples for 8
years, (2) those specific to the use of an 8 cm descriptive linear scale, or (3) simply due to
differences between the techniques used by the trained and untrained assessors to evaluate
these descriptors. Definitely, a common understanding of the meaning of different texture
descriptors among the members of a sensory panel is needed to obtain reproducible results.
FIG. 1. COMPARISON OF RATINGS FOR DESCRIPTORS OF FROZEN/THAWED
POTATO PUREE WITH ADDED SOY PROTEIN ISOLATE (SPI) AND INULIN BLENDS
WITH SIX SELECTED SPI : INL RATIOS. (A) Rated by the trained panel and (B) rated by the untrained panel.
1
2
3
4
5
6
7
8
9
0:0
0:6
3:3
6:0
1.5:6
4.5:3
Visual graininess Creaminess Moisture
Consistency Fibrousness Mouth coating
1
2
3
4
5
6
7
8
9
0:0
0:6
3:3
6:0
1.5:6
4.5:3
Visual graininess Creaminess Moisture
Consistency Fibrousness Mouth coating
A
B
Texture perception determined by soy protein isolate and inulin…
176
Rheological Behavior
Characterization of the PP Samples. Plots of shear stress vs. shear rate for both FPP and
F/TPP samples with added 0:0, 0:6, 3:3, 6:0, 1.5:6 and 4.5:3 ratios revealed a non-
Newtonian flow behavior and exhibited typical pseudoplastic behavior and yield stress (Fig.
2A,B). The flow curves were similar in all the other products. This type of behavior is in
accordance with that observed previously in PP (Fernández et al. 2008). Most of FPP and
F/TPP samples with added SPI/INL blends presented lower resistance to flow than the
controls, although the performance of a freeze/thaw cycle decreased the differences between
the rheological behavior of the 0:0 control and that of the samples with added 3:3 and 1.5:6
ratios (Fig. 2B). F/TPP samples exhibited greater shear stress than their FPP counterparts.
Effect of the SPI:INL Ratio and a Freeze/Thaw Cycle on the Rheological Properties.
The two-way mixed-model ANOVA indicated a significant (P < 0.01) S and T main effects
for all the rheological properties and indices (Table 6). Furthermore, S × T interactions were
significant for K, ηapp,50 and σoral values. In spite of this, samples with added SPI:INL ratios
had similar pseudoplasticity (n) to the 0:0 control, although a freeze/thaw cycle increased
pseudoplasticity of the samples.
Generally speaking, the addition of SPI/INL blends reduced the consistency index, the
apparent viscosity at 50/s and the instrumental index of oral consistency with respect to the
0:0 control. At a fixed INL content, the K, ηapp,50 and σoral values decreased with increasing
SPI concentration from 1.5 to 6%, evidence of a decreased number of intermolecular cross-
links resulting in a weaker matrix. This behavior is typical of gels filled with deformable
particles (Jampen et al. 2001). According to the latter authors, in gels containing deformable
particles, the linear decrease in storage modulus in line with increasing volume fractions is
due to particle compliance under stress or to particle separation from the matrix, thereby
Texture perception determined by soy protein isolate and inulin…
177
FIG. 2. STRESS SWEEP CURVES OF POTATO PUREE WITH ADDED SOY PROTEIN
ISOLATE (SPI) AND INULIN (INL) BLENDS WITH SIX SELECTED SPI: INL RATIOS (A) Fresh potato puree (FPP) and (B) frozen/thawed potato puree (F/TPP).
B
F/TPP
A
FPP
0
100
200
300
400
0 20 40 60 80 100
Shear rate/s
Sh
ea
r s
tre
ss
(P
a)
0:0 0:6 3:3 6:0 1.5:6 4.5:3
0
100
200
300
400
0 20 40 60 80 100
Shear rate/s
Sh
ea
r s
tre
ss
(P
a)
0:0 0:6 3:3 6:0 1.5:6 4.5:3
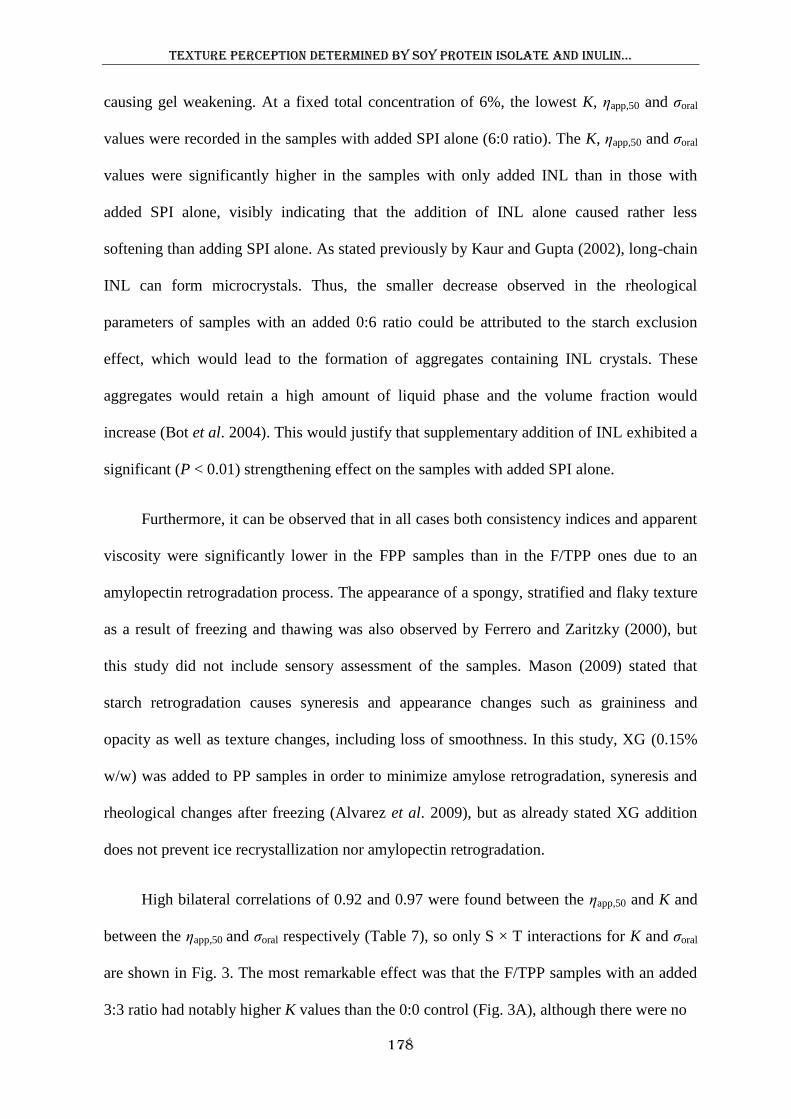
Texture perception determined by soy protein isolate and inulin…
178
causing gel weakening. At a fixed total concentration of 6%, the lowest K, ηapp,50 and σoral
values were recorded in the samples with added SPI alone (6:0 ratio). The K, ηapp,50 and σoral
values were significantly higher in the samples with only added INL than in those with
added SPI alone, visibly indicating that the addition of INL alone caused rather less
softening than adding SPI alone. As stated previously by Kaur and Gupta (2002), long-chain
INL can form microcrystals. Thus, the smaller decrease observed in the rheological
parameters of samples with an added 0:6 ratio could be attributed to the starch exclusion
effect, which would lead to the formation of aggregates containing INL crystals. These
aggregates would retain a high amount of liquid phase and the volume fraction would
increase (Bot et al. 2004). This would justify that supplementary addition of INL exhibited a
significant (P < 0.01) strengthening effect on the samples with added SPI alone.
Furthermore, it can be observed that in all cases both consistency indices and apparent
viscosity were significantly lower in the FPP samples than in the F/TPP ones due to an
amylopectin retrogradation process. The appearance of a spongy, stratified and flaky texture
as a result of freezing and thawing was also observed by Ferrero and Zaritzky (2000), but
this study did not include sensory assessment of the samples. Mason (2009) stated that
starch retrogradation causes syneresis and appearance changes such as graininess and
opacity as well as texture changes, including loss of smoothness. In this study, XG (0.15%
w/w) was added to PP samples in order to minimize amylose retrogradation, syneresis and
rheological changes after freezing (Alvarez et al. 2009), but as already stated XG addition
does not prevent ice recrystallization nor amylopectin retrogradation.
High bilateral correlations of 0.92 and 0.97 were found between the ηapp,50 and K and
between the ηapp,50 and σoral respectively (Table 7), so only S × T interactions for K and σoral
are shown in Fig. 3. The most remarkable effect was that the F/TPP samples with an added
3:3 ratio had notably higher K values than the 0:0 control (Fig. 3A), although there were no
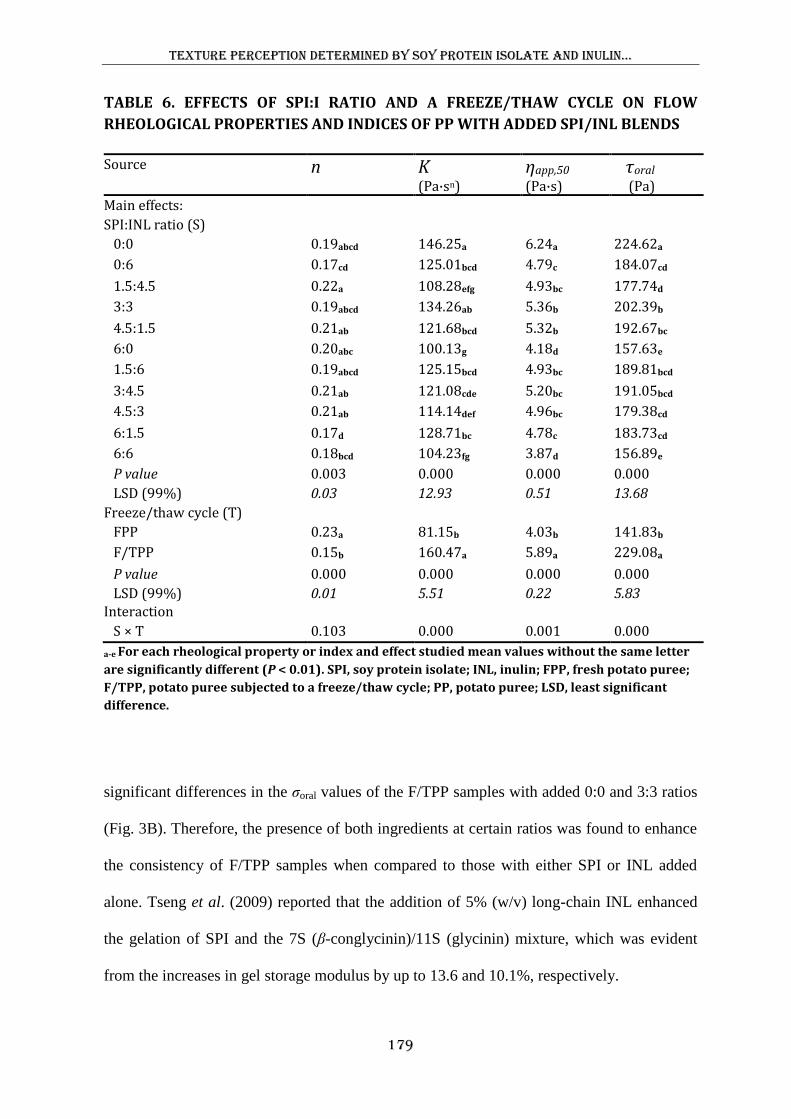
Texture perception determined by soy protein isolate and inulin…
179
TABLE 6. EFFECTS OF SPI:I RATIO AND A FREEZE/THAW CYCLE ON FLOW
RHEOLOGICAL PROPERTIES AND INDICES OF PP WITH ADDED SPI/INL BLENDS
Source n K (Pa·sn)
ηapp,50 (Pa·s)
τoral (Pa)
Main effects:
SPI:INL ratio (S)
0:0 0.19abcd 146.25a 6.24a 224.62a
0:6 0.17cd 125.01bcd 4.79c 184.07cd
1.5:4.5 0.22a 108.28efg 4.93bc 177.74d
3:3 0.19abcd 134.26ab 5.36b 202.39b
4.5:1.5 0.21ab 121.68bcd 5.32b 192.67bc
6:0 0.20abc 100.13g 4.18d 157.63e
1.5:6 0.19abcd 125.15bcd 4.93bc 189.81bcd
3:4.5 0.21ab 121.08cde 5.20bc 191.05bcd
4.5:3 0.21ab 114.14def 4.96bc 179.38cd
6:1.5 0.17d 128.71bc 4.78c 183.73cd
6:6 0.18bcd 104.23fg 3.87d 156.89e
P value 0.003 0.000 0.000 0.000
LSD (99%) 0.03 12.93 0.51 13.68
Freeze/thaw cycle (T)
FPP 0.23a 81.15b 4.03b 141.83b
F/TPP 0.15b 160.47a 5.89a 229.08a
P value 0.000 0.000 0.000 0.000
LSD (99%) 0.01 5.51 0.22 5.83 Interaction
S × T 0.103 0.000 0.001 0.000
a-e For each rheological property or index and effect studied mean values without the same letter
are significantly different (P < 0.01). SPI, soy protein isolate; INL, inulin; FPP, fresh potato puree;
F/TPP, potato puree subjected to a freeze/thaw cycle; PP, potato puree; LSD, least significant
difference.
significant differences in the σoral values of the F/TPP samples with added 0:0 and 3:3 ratios
(Fig. 3B). Therefore, the presence of both ingredients at certain ratios was found to enhance
the consistency of F/TPP samples when compared to those with either SPI or INL added
alone. Tseng et al. (2009) reported that the addition of 5% (w/v) long-chain INL enhanced
the gelation of SPI and the 7S (β-conglycinin)/11S (glycinin) mixture, which was evident
from the increases in gel storage modulus by up to 13.6 and 10.1%, respectively.
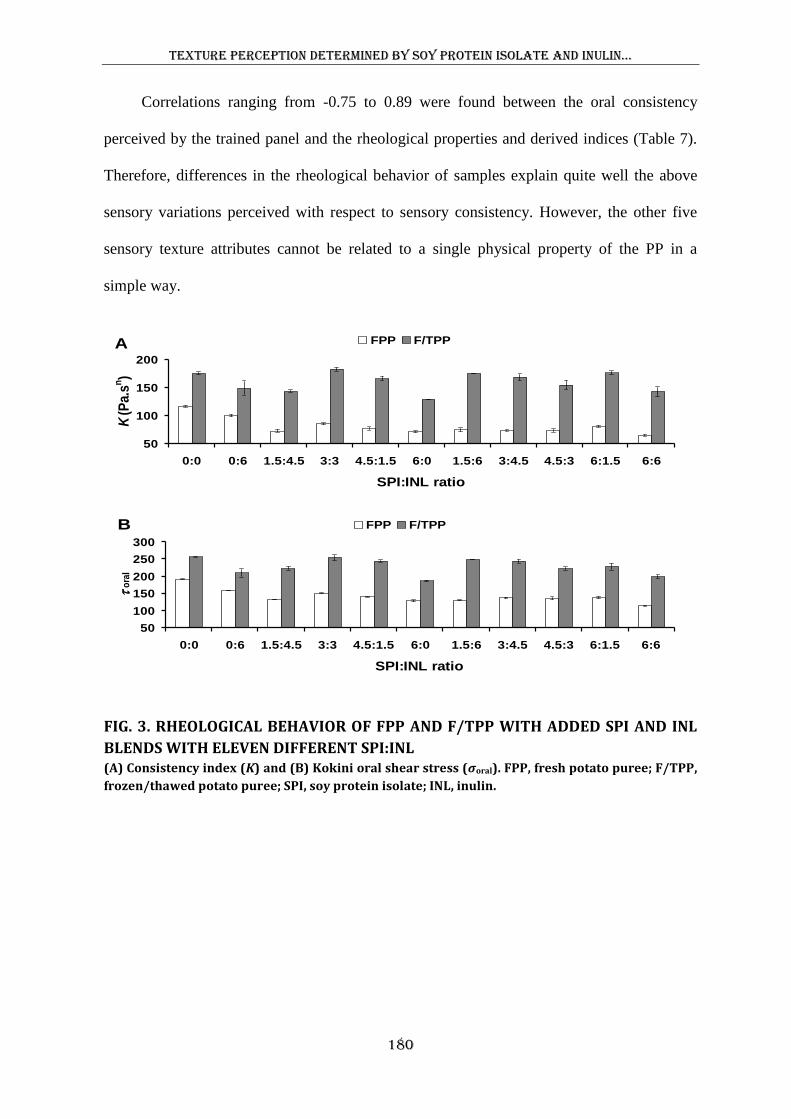
Texture perception determined by soy protein isolate and inulin…
180
Correlations ranging from -0.75 to 0.89 were found between the oral consistency
perceived by the trained panel and the rheological properties and derived indices (Table 7).
Therefore, differences in the rheological behavior of samples explain quite well the above
sensory variations perceived with respect to sensory consistency. However, the other five
sensory texture attributes cannot be related to a single physical property of the PP in a
simple way.
FIG. 3. RHEOLOGICAL BEHAVIOR OF FPP AND F/TPP WITH ADDED SPI AND INL
BLENDS WITH ELEVEN DIFFERENT SPI:INL (A) Consistency index (K) and (B) Kokini oral shear stress (σoral). FPP, fresh potato puree; F/TPP,
frozen/thawed potato puree; SPI, soy protein isolate; INL, inulin.
A
B
50
100
150
200
0:0 0:6 1.5:4.5 3:3 4.5:1.5 6:0 1.5:6 3:4.5 4.5:3 6:1.5 6:6
SPI:INL ratio
K(P
a.s
n)
FPP F/TPP
50
100
150
200
250
300
0:0 0:6 1.5:4.5 3:3 4.5:1.5 6:0 1.5:6 3:4.5 4.5:3 6:1.5 6:6
SPI:INL ratio
to
ral
FPP F/TPP
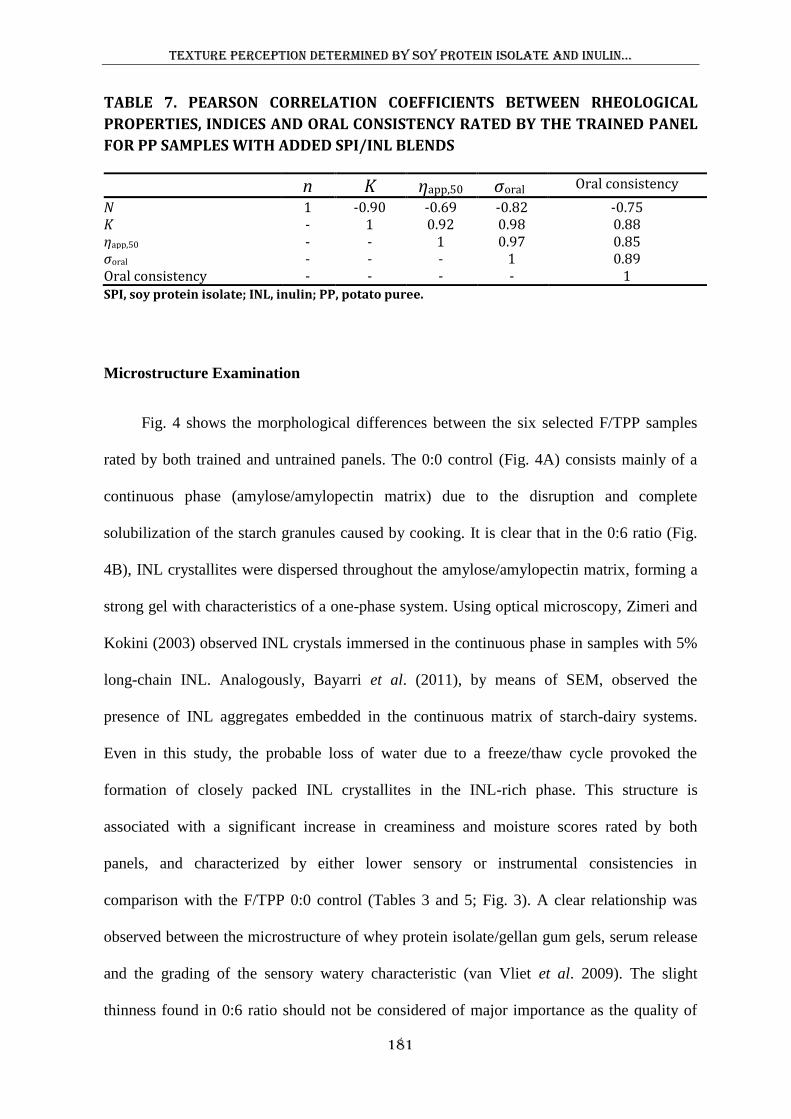
Texture perception determined by soy protein isolate and inulin…
181
TABLE 7. PEARSON CORRELATION COEFFICIENTS BETWEEN RHEOLOGICAL
PROPERTIES, INDICES AND ORAL CONSISTENCY RATED BY THE TRAINED PANEL
FOR PP SAMPLES WITH ADDED SPI/INL BLENDS
n K ηapp,50 σoral Oral consistency
N 1 -0.90 -0.69 -0.82 -0.75 K - 1 0.92 0.98 0.88 ηapp,50 - - 1 0.97 0.85 σoral - - - 1 0.89 Oral consistency - - - - 1 SPI, soy protein isolate; INL, inulin; PP, potato puree.
Microstructure Examination
Fig. 4 shows the morphological differences between the six selected F/TPP samples
rated by both trained and untrained panels. The 0:0 control (Fig. 4A) consists mainly of a
continuous phase (amylose/amylopectin matrix) due to the disruption and complete
solubilization of the starch granules caused by cooking. It is clear that in the 0:6 ratio (Fig.
4B), INL crystallites were dispersed throughout the amylose/amylopectin matrix, forming a
strong gel with characteristics of a one-phase system. Using optical microscopy, Zimeri and
Kokini (2003) observed INL crystals immersed in the continuous phase in samples with 5%
long-chain INL. Analogously, Bayarri et al. (2011), by means of SEM, observed the
presence of INL aggregates embedded in the continuous matrix of starch-dairy systems.
Even in this study, the probable loss of water due to a freeze/thaw cycle provoked the
formation of closely packed INL crystallites in the INL-rich phase. This structure is
associated with a significant increase in creaminess and moisture scores rated by both
panels, and characterized by either lower sensory or instrumental consistencies in
comparison with the F/TPP 0:0 control (Tables 3 and 5; Fig. 3). A clear relationship was
observed between the microstructure of whey protein isolate/gellan gum gels, serum release
and the grading of the sensory watery characteristic (van Vliet et al. 2009). The slight
thinness found in 0:6 ratio should not be considered of major importance as the quality of
Texture perception determined by soy protein isolate and inulin…
182
the product was improved. Note that the untrained panel preferred the PPs enriched with the
highest INL concentration used, this smoothness and decreased sensation of graininess being
ascribed to increased INL. The decreased oral graininess is the result of the lubricating and
coating properties of INL crystals, which clearly masked the fibrousness detected in the 0:0
control.
In the case of samples with an added 3:3 ratio (Fig. 4C), it is not possible to appreciate
any gel SPI structure (probably because no gelation occurred). In addition, the INL did not
form a continuous phase, since its lower concentration reduced the density of these particles
in the product. It is possible to appreciate spherical and obloid-shaped INL crystallites
throughout the sample but with fewer interconnections between them compared with the
added 0:6 ratio (Fig. 4B). This fact might have led to reduced lubrication and a drier
sensation, as reflected by an increase in both the consistency index (Fig. 3A) and the
perceived consistency accompanied by a decrease in the wet feeling in the mouth (Table 3).
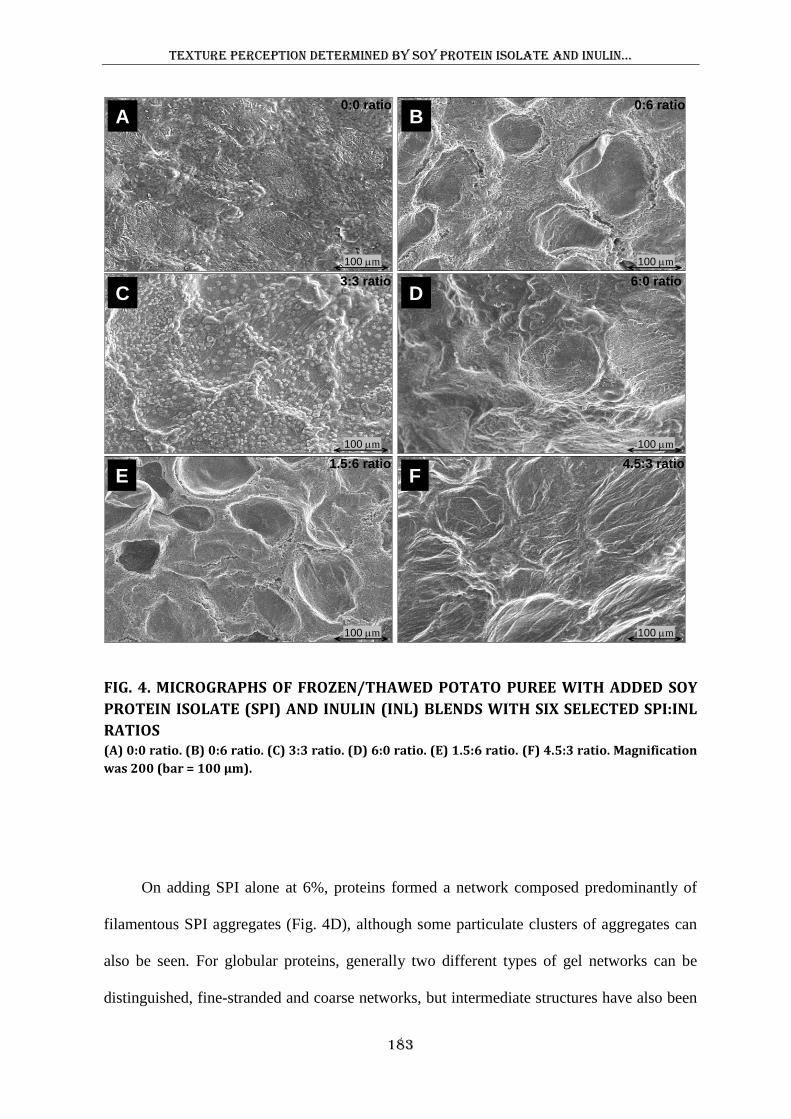
Texture perception determined by soy protein isolate and inulin…
183
FIG. 4. MICROGRAPHS OF FROZEN/THAWED POTATO PUREE WITH ADDED SOY
PROTEIN ISOLATE (SPI) AND INULIN (INL) BLENDS WITH SIX SELECTED SPI:INL
RATIOS (A) 0:0 ratio. (B) 0:6 ratio. (C) 3:3 ratio. (D) 6:0 ratio. (E) 1.5:6 ratio. (F) 4.5:3 ratio. Magnification
was 200 (bar = 100 μm).
On adding SPI alone at 6%, proteins formed a network composed predominantly of
filamentous SPI aggregates (Fig. 4D), although some particulate clusters of aggregates can
also be seen. For globular proteins, generally two different types of gel networks can be
distinguished, fine-stranded and coarse networks, but intermediate structures have also been
0:0 ratio
100 mm
C
E
A B
D
F
6:0 ratio
0:6 ratio
3:3 ratio
100 mm
100 mm 100 mm
1.5:6 ratio
100 mm
4.5:3 ratio
100 mm
Texture perception determined by soy protein isolate and inulin…
184
reported (Lakemond et al. 2003). This coarse-stranded SPI gel was characterized by a
significant decrease in the rheological properties and consistency perceived by the trained
panel. The influence of particle-matrix interactions was studied by van Vliet (1988) who
found that a linear decrease in gel strength with an increase in volume fraction only occurred
with non-interacting gel materials. As stress is applied to the system, small amounts of water
may be released from the SPI strands, thus forming an aqueous boundary layer around them
and reducing any interactions with the amylose/amylopectin matrix. Addition of SPI alone
gave rise to a less creamy, rougher product with more mouth coating, which could also be
explained by the presence of these filamentous SPI aggregates.
The appearance of samples with an added 1.5:6 ratio (Fig. 4E) was quite similar to that
of samples with added INL alone (Fig. 4B), forming a continuous INL network without
appreciable protein inclusions. In contrast, the appearance of samples with an added 4.5:3
ratio was quite unlike that of samples with an added ratio of 3:3. In samples with 4.5%
added SPI and 3% added INL (Fig. 4F), SPI again formed a filamentous network without
distinguishable INL crystals which would be preferentially excluded from the protein
surfaces. Thus, SPI at 4.5% supports the INL structure by building up a second coarse-
stranded network. There were also some differences between samples with added 6:0 and
4.5:3 ratios. When 4.5% SPI was blended with 3% INL (Fig. 4F), the SPI gel structure had
thicker, more shrunken strands than with added SPI alone (Fig. 4D). In spite of staying
hidden, INL crystallites significantly strengthened the F/TPP samples with SPI gel alone
(Fig. 3). The presence of INL must have a synergistic effect on SPI gelation, and this effect
may depend on SPI concentration, the SPI:INL ratio, and possibly solvent properties (e.g.,
water activity). It is well known that freezing reduces water activity due to ice formation and
the high concentrations of solutes in unfrozen water. When the concentration of SPI, was
high, the addition of INL probably caused more aw reduction, exerted stronger hydrogen
Texture perception determined by soy protein isolate and inulin…
185
bonding with water, and/or produced greater physical interactions (e.g., entanglements) with
SPI molecules. Such reactions, combined with the excluded volume effect, would lead to
enhanced protein-protein interactions as manifested by the increase in rheological properties.
According to Tseng et al. (2009), the excluded volume effect is likely the major force
driving soy globulins into a more stable state in the presence of this neutral carbohydrate.
CONCLUSION
Despite an untrained panel being able to distinguish between PP samples with
different added SPI:INL ratios, only a good linear correlation was observed between trained
and untrained evaluations for creaminess. Perceived consistency rated by the trained panel
was linked to flow rheological indices which show that there is no interaction between the
amylose/amylopectin matrix and the dispersed particles. Presence of SPI strands was a
dominant factor in texture perception, regarding mouth feel geometric attributes (visual
graininess and fibrousness) and after feel attribute (mouth coating), while INL crystallites
were the main feature influencing creaminess. The addition of small amounts of SPI (1.5%)
and INL at >3% increased the intensity of perceived creaminess. SPI-water interactions
would appear to be weaker than those between INL and water, and the more fluid-like
behavior observed in samples with added SPI at concentrations ≥ 4.5% may be attributable
to water release from the SPI gel in the discontinuous phase. Microstructural characteristics
are evidently needed to understand the non-mechanical part of the perceived texture in PPs
with these added functional ingredients.
ACKNOWLEDGMENTS
The authors wish to thank the Spanish Ministry of Science and Innovation for their
financial support (AGL2007-62851 and AGL2011-28569), and P. Adeva, I. Amurrio and A.
Texture perception determined by soy protein isolate and inulin…
186
García of the Electron Miscroscopy Laboratory at the Spanish National Metallurgical
Research Center (CENIM-CSIC).
REFERENCES
ALVAREZ, M.D., FERNÁNDEZ, C. and CANET, W. 2009. Enhancement of freezing
stability in mashed potatoes by the incorporation of kappa-carrageenan and xanthan gum
blends. J. Sci. Food Agric. 89, 2115-2127.
ALVAREZ, M.D., FERNÁNDEZ, C., SOLAS, M.T. and CANET, W. 2011. Viscoelasticity
and microstructure of inulin-enriched mashed potatoes: influence of freezing and
cryoprotectants. J. Food Eng. 102, 66-76.
ALVAREZ, M.D., FERNÁNDEZ, C., JIMÉNEZ, M.J. and CANET, W. Texture of extra
virgin olive oil-enriched mashed potatoes: sensory, instrumental and structural
relationships. J. Texture Studies. 42, 413-429.
BAYARRI, S., GONZÁLEZ-TOMÁS, L., HERNANDO, I., LLUCH, M.A. and COSTELL,
E. 2011. Texture perceived on inulin-enriched low-fat semisolid dairy desserts.
Rheological and structural basis. J. Texture Studies 42, 174-184.
BOT, A., ERLE, U., VREEKER, R. and AGTEROF, W. 2004. Influence of crystallisation
conditions on the large deformation rheology of inulin gels. Food Hydrocoll. 18, 547-
56.
BOURNE, M.C. 2002. Food Texture and Viscosity: Concept and Measurement. Academic
Press, New York, NY.
CARDELLO, A.V., MALLER, O., KAPSALIS, J.G., SEGARS, R.A., SAWYER, F.M.,
MURPHY, C. and MOSKOWITZ, H.R. 1985. Perception of texture by trained and
consumer panelists. J. Food Sci. 47, 1186-1197.
Texture perception determined by soy protein isolate and inulin…
187
CARLUCCI, A. and MONTELEONE, E. 2001. Statistical validation of sensory data: a
study on wine. J. Sci. Food Agric. 81, 751-758.
DE WIJK, R.A., VAN GEMERT, L.J., TERPSTRA, M.E.J. and WILKISON, C.L. 2003.
Texture of semi-solids; sensory and instrumental measurements on vanilla custard
desserts. Food Qual. Prefer. 14, 305-317.
DE WIJK, R.A., PRINZ, J.F. and JANSSEN, A.M. 2006. Explaining perceived oral texture
of starch-based custard desserts from standard and novel instrumentals tests. Food
Hydrocoll. 20, 24-34.
FERNÁNDEZ, C., ALVAREZ, M.D. and CANET, W. 2008. Steady shear and yield stress
of fresh and frozen/thawed mashed potatoes: effect of biopolymers addition. Food
Hydrocoll. 22, 1381-1395.
FERRERO, C. and ZARITZKY, N.E. 2000. Effect of freezing rate and frozen storage on
starch-sucrose-hydrocolloid systems. J. Sci. Food Agric. 80, 2149-2158.
FOEGEDING, E.A., DAUBERT, C.R., DRAKE, M.A., ESSICK, G., TRULSSON, M.,
VINYARD, C.J. and VAN DE VELDE F. 2011. A comprehensive approach to
understanding textural properties of semi- and soft-solid foods. J. Texture Studies 42,
103-129.
GONZÁLEZ-TOMÁS, L., COLL-MARQUÉS, J. and COSTELL, E. 2008. Viscoelasticity
of inulin-starch-based dairy systems. Influence of inulin average chain length. Food
Hydrocoll. 22, 1372–1380.
GUGGISBERG, D., CUTHBERT-STEVEN, J., PICCINALI, P., BÜTIKOFER, U. and
EBERHARD, P. 2009. Rheological, microstructural and sensory characterization of low-
fat and whole milk set yogurt as influenced by inulin addition. Int. Dairy J. 19, 107-115.
HASHIZUME, K., KAKIUCHI, K., KOYAMA, E. and WATANABE, T. 1971.
Denaturation of soy protein by freezing. Agric. Biol. Chem. 35, 449-459.
Texture perception determined by soy protein isolate and inulin…
188
HEATH, M.R. and LUCAS, P.W. 1987. Mastication: the need for collaborative research. J.
Texture Studies 18, 111–123.
[ISO] Intl. Organization for Standardization. 1993. International Standard 8586-1. Sensory
analysis–general guidance for the selection, training and monitoring of assessors – part
1: selected assessors. Geneva, Switzerland: ISO.
[ISO] Intl. Organization for Standardization. 2003. International Standard 13299. Sensory
analysis–Methodology–General guidance for establishing a sensory profile. Geneva,
Switzerland: ISO.
[ISO] Intl. Organization for Standardization. 2008. International Standard 5492. Sensory
analysis–Vocabulary. Geneva, Switzerland: ISO.
JAMPEN, S., BRITT, I.J., YADA, S., and TUNG, M.A. 2001. Rheological properties of
gellan gels containing filler particles. J. Food Sci. 66, 289–293.
KAUR, N., and GUPTA, A.K. 2002. Applications of inulin and oligofructose in health and
nutrition. J. Biosci. 27, 703-714.
LAKEMOND, C.M.M., DE JONGH, H.H.J., PAQUES, M., VAN VLIET, T., GRUPPEN,
H. and VORAGEN, G.J. 2003. Gelation of soy glycinin; influence of pH and ionic
strength on network structure in relation to protein conformation. Food Hydrocoll. 17,
365-377.
MASON, W.R. 2009. Starch uses in foods. In Starch: Chemistry and Technology (J.
BeMiller, and R. Whistler, eds.) Third edition pp. 745-795, Food Science and
Technology, International Series, Elsevier Inc., New York, NY.
NÆS T, and LANGSRUD, O. 1998. Fixed or random assessors in sensory profiling? Food
Qual. Pref. 9, 145-152.
STADING, M. and HERMANSSON, A.-M. 1990. Viscoelastic behaviour of β-lactoglobulin
gel structures. Food Hydrocoll. 4,121–135.
Texture perception determined by soy protein isolate and inulin…
189
SZCZESNIAK, A.S. 2002. Texture is a sensory property. Food Qual. Pref. 13, 215–225.
TSENG, Y.-C., XIONG, Y.L. and YANG, F. 2009. Influence of inulin/oligofructose on the
acid-induced cold aggregation and gelation of preheated soy proteins. J. Sci. Food Agric.
89, 2650-2658.
UNE 87025 1996. Manual De Análisis Sensorial, Tomo I–Alimentación, Aenor, Madrid,
Spain. pp. 167–186.
VAN VLIET, T. 1988. Rheological properties of filled gels: Influence of filler matrix
interaction. Colloid Polym. Sci. 266, 518-524.
VAN VLIET, T., VAN AKEN, G.A, DE JONGH, H.H.J. and HAMER, R.J. 2009. Colloidal
aspects of texture perception. Adv. Colloid Interface Sci. 150, 27-40.
WILKINSON, C., DIJKSTERHUIS, G.B. and MINEKUS, M. 2000. From food structure to
texture. Trends in Food Sci. Technol. 11, 442-450.
ZIMERI, J.E. and KOKINI, J.L. 2003. Morphological characterization of the phase
behaviour of inulin-waxy maize starch systems in high moisture environments.
Carbohydr. Polym. 52, 225-236.

SENSORY DESCRIPTION OF POTATO PUREE
ENRICHED WITH INDIVIDUAL FUNCTIONAL
INGREDIENTS AND THEIR BLENDS.
María José Jiménez, Wenceslao Canet and María Dolores Alvarez.
Journal of Texture Studies 44 (2013), 301-316

Sensory description of potato puree enriched with individual functional…
193
ABSTRACT
This study compares trained, semi-trained and untrained sensory profiles for seven
potato puree (PP) samples by using quantitative descriptive analysis (QDA), flash profiling
(FP) and projective mapping (PM), respectively. Data analysis methods for QDA, FP and
PM were principal component analysis, generalized Procrustes analysis and multiple factor
analysis (MFA). For the three profiling techniques, hierarchical clustering analysis was
applied to group PPs as per their sensory profiles. Assessors’ consensus was analyzed
through MFA and correlation coefficients. For each technique, MFA also allowed assessing
correlations between sensory and instrumental variables. Results showed that both FP and
PM methodologies were able to identify differences in sensory characteristics of PPs,
providing very similar sensory maps. Nevertheless, higher correlations between sensory
attributes evaluated by semi-trained and trained assessors were found, indicating that
preferably FP should be used as a rapid choice to QDA in hot served PPs.
KEYWORDS
Extra virgin olive oil, flash profile, long-chain inulin, potato puree, projective
mapping, quantitative descriptive analysis, soy protein isolate
PRACTICAL APPLICATIONS
But even with some restrictions, results of this study showed that with semi-trained
and untrained panels, spatial configurations obtained by FP and PM were relevant to
describe sensory profiles of PPs. Both rapid substitute methods presented a strong
correlation with QDA (high regression vector coefficients), but FP task would be preferred
Sensory description of potato puree enriched with individual functional…
194
over PM. However, one disadvantage of these techniques is that they do not allow obtaining
average rating scores, and therefore an assessment of least significant differences via
ANOVA can not be done. Therefore, it is important to highlight that both FM and PM
methodologies might be particularly recommended when you cannot train a panel for a
specific application, but preferably they should be considered complementary to trained
assessors’ data. Application of these consumer profiling techniques showed that there is a
possibility of using inulin in combination with PPs to provide a highly nutritious product
with improved consumers’ acceptance.
INTRODUCTION
Descriptive analysis involves the detection (discrimination) and the description of both
the qualitative and quantitative sensory aspects of a product by trained panels of judges
(Meilgaard et al. 2007). Amongst the most widely used descriptive analysis is the
quantitative descriptive analysis (QDA) (Stone et al. 1974). It is based on the principle of a
panelist’s ability to verbalize perceptions of a product in a reliable manner; panelists are
screened and trained in attribute recognition and scaling, they use a common and agreed
sensory language, and products are scored on repeated trials to obtain a complete
quantitative description (ASTM 1992).
Sensory science has developed several new methodologies of sensory mapping and
profiling alternative to conventional profiling as well as new statistical analysis, e.g., the free
choice profiling (Williams and Langron 1984), the spectrum method (Meilgaard et al. 2007),
and the ultra-flash profiling (Perrin et al. 2008). Between these recent methodologies are
also flash profiling (FP) (Sieffermann 2000; 2002) and projective mapping (PM) (Pagès
2005), which are attractive because they do not demand a training stage and individual
Sensory description of potato puree enriched with individual functional…
195
sessions are possible (Albert et al. 2011). FP is an original combination of free-choice terms
selection in combination with ranking method based on simultaneous presentation of the
whole product set (Dairou and Sieffermann 2002). Others main specificities of FP are to
allow to judges the use of their own list of attributes (Delarue and Sieffermann 2004). PM,
and its variant Napping, are profiling methods that were developed (Pagès 2005) in order to
collect an Euclidean configuration for each assessor in a single sensory session. Samples
simultaneously presented are positioned by each assessor on a tablecloth or a blank paper
according to the differences/similarities (sensory distances) present between them in such a
way that the smaller the distance separating two samples, the more similar they are (Perrin et
al. 2008). The positioning criteria and their importance are chosen on an individual basis by
each assessor, which makes PM a flexible and spontaneous procedure (Moussaoui and
Varela 2010). The simultaneous processing of all these configurations provides a graphical
display of the product in which two products are near if they were perceived similar by the
whole panel of subjects (Pagès 2005).
Nevertheless, there are only few works comparing these techniques systematically in
the same sample set, and where these three methods – QDA, FP and PM – have been
compared simultaneously for foods that are served hot. Moussaoui and Varela (2010)
explored the performance of FP and PM methods and their linkage to a QDA among target
consumers of hot beverages. Following, Albert et al. (2011) used QDA, FP and PM to study
their suitability on hot fish nuggets, and concluding that FP and PM could be used as quick
alternatives to QDA in these products.
Potato purees (PPs) themselves make up a combined system of native potato starch,
denatured milk protein, water and salt plus added cryoprotectants (kappa-carrageenan [κ-C]
and xanthan gum [XG]) as the product is intended to be frozen (Alvarez et al. 2012).
Variations in the composition of PPs by adding new ingredients would produce noticeable
Sensory description of potato puree enriched with individual functional…
196
differences in the physical and sensory properties of the final product (Bayarri et al. 2011).
For example, addition of extra virgin olive oil (EVOO) enhanced the PPs sensory quality
reducing granularity, denseness, cohesiveness, adhesiveness and fibrousness, and increasing
homogeneity, ease of swallowing and palate coating (Alvarez et al. 2011b). Addition of
long-chain inulin (INL) gave rise to a low-fat semisolid dairy dessert with the same
thickness intensity as the full-fat sample, though less creamy, rougher and with more mouth
coating (Bayarri et al. 2011). In turn, assessors found that soy protein isolate (SPI) conferred
excessive thickness and gave the PPs an unfamiliar taste and odor (Alvarez et al. 2012).
Previous sensory analyses showed that the preferred temperature for PP consumption
was 55C (Alvarez et al. 2011b, 2012). Therefore, a problem for the assessment of these
products is the preparation and heating processes and the necessity of serving the samples
hot at homogeneous temperature for the whole panel in a sensory test. However, as both FP
and PM are based in the comparison of the entire sample set at once, this requires a
consistency in the samples received by each assessor, but it allows being slightly more
relaxed in the handling of the samples within assessors (Albert et al. 2011). According to the
latter authors, in QDA a variation in a couple of degrees in temperature could cause a
significant change in texture ratings, which would ultimately change the final averages or
the panel-performance-related parameters.
Taking the above into consideration, this study aimed to: (1) prove whether semi-
trained and untrained panels are able to describe PPs and generate relevant attributes by two
descriptive methods: FP and PM; (2) contrast the applicability of the two methods and to
correlate the outcomes to a trained panel via QDA; and (3) ascertain correlations between
textural attributes generated by the three panels and instrumental variables.
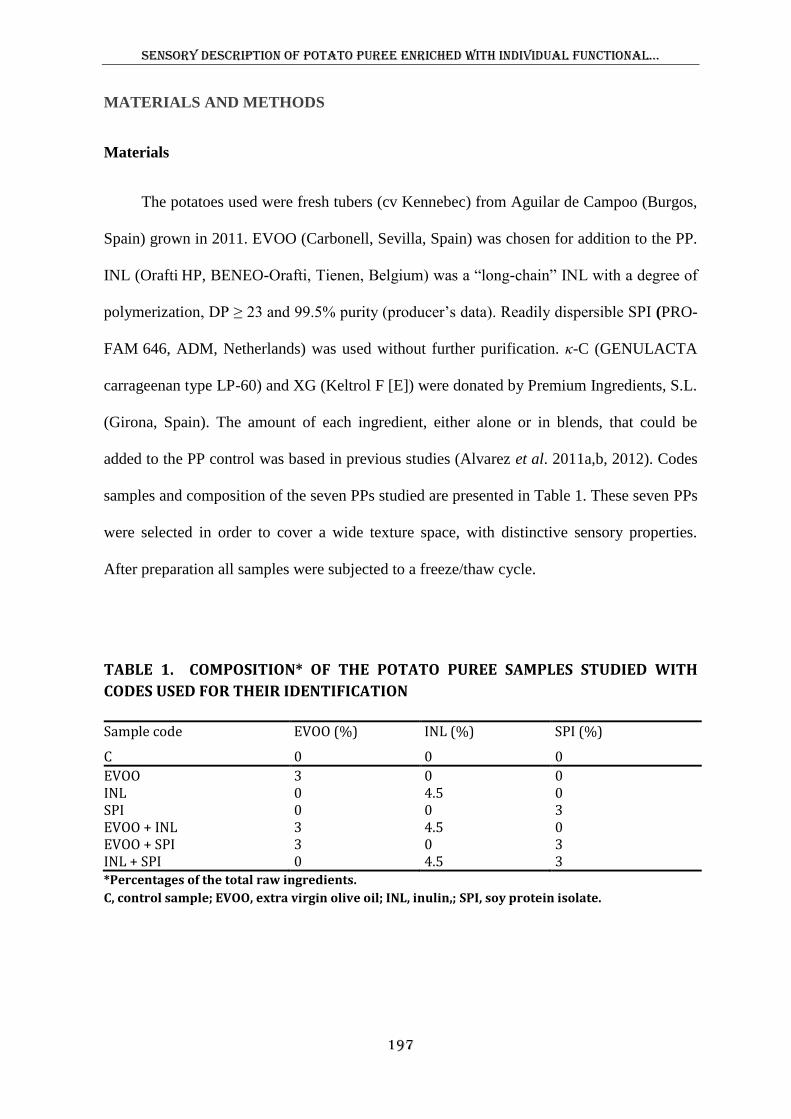
Sensory description of potato puree enriched with individual functional…
197
MATERIALS AND METHODS
Materials
The potatoes used were fresh tubers (cv Kennebec) from Aguilar de Campoo (Burgos,
Spain) grown in 2011. EVOO (Carbonell, Sevilla, Spain) was chosen for addition to the PP.
INL (Orafti HP, BENEO-Orafti, Tienen, Belgium) was a “long-chain” INL with a degree of
polymerization, DP ≥ 23 and 99.5% purity (producer’s data). Readily dispersible SPI (PRO-
FAM 646, ADM, Netherlands) was used without further purification. κ-C (GENULACTA
carrageenan type LP-60) and XG (Keltrol F [E]) were donated by Premium Ingredients, S.L.
(Girona, Spain). The amount of each ingredient, either alone or in blends, that could be
added to the PP control was based in previous studies (Alvarez et al. 2011a,b, 2012). Codes
samples and composition of the seven PPs studied are presented in Table 1. These seven PPs
were selected in order to cover a wide texture space, with distinctive sensory properties.
After preparation all samples were subjected to a freeze/thaw cycle.
TABLE 1. COMPOSITION* OF THE POTATO PUREE SAMPLES STUDIED WITH
CODES USED FOR THEIR IDENTIFICATION
Sample code EVOO (%) INL (%) SPI (%)
C 0 0 0
EVOO INL SPI EVOO + INL EVOO + SPI INL + SPI
3 0 0 3 3 0
0 4.5 0 4.5 0 4.5
0 0 3 0 3 3
*Percentages of the total raw ingredients.
C, control sample; EVOO, extra virgin olive oil; INL, inulin,; SPI, soy protein isolate.
Sensory description of potato puree enriched with individual functional…
198
Preparation of PP Samples
Tubers were manually washed, peeled and diced. The seven fresh PP samples were
prepared in ~1,350-g batches from 790 g of potatoes, 300 mL of semi-skimmed in-bottle
sterilized milk, 200 mL of water, 10 g of salt (NaCl) and 1.95 g each of two hydrocolloids,
κ-C and XG (Premium Ingredients, S.L., Girona, Spain), using a TM 31 food processor
(Vorwerk España, M.S.L., S.C., Madrid, Spain). When used, at this point, EVOO was added
at 3% to the rest of the ingredients. This amount was removed from the initial water content
(200 mL). Analogously, when used, INL which had been previously dissolved in the 300
mL of milk and 150 mL of water at 70C for 15 min agitating constantly with a magnetic
stirrer was added at 4.5%. In all the cases, the ingredients were first cooked for 30 min at
90C (blade speed: 40 rpm) and any evaporated water was replaced gravimetrically. In terms
of processing, there were serious difficulties in cooking SPI together the rest of the
ingredients. For this reason, when used, at this point SPI that had previously been hydrated
at a ratio of SPI to water of 1:5 was added at 3%. Water used to hydrate SPI was removed
from the initial water content (200 mL). Next, in all the cases, all the ingredients were
cooked at 90C for 5 min. The mash was ground for 40 s (1,200 rpm) and 20 s (2,600 rpm),
and then homogenized through a stainless steel sieve (diameter: 1.5 mm). Then, the seven
fresh PP samples were frozen and thawed.
Freeze/Thaw Cycle
PP samples were placed on flat-freezing and microwave thawing trays, and then
frozen by forced convection with liquid nitrogen vapor in an Instron programmable chamber
(model 3119-05, -70/+250C) at -60C until their thermal centers reached -24C. After
freezing, the samples were packed in polyethylene plastic bags, sealed under light vacuum (-
0.05 MPa) on a Multivac packing machine (Sepp Haggenmüller KG, Wolfertschwenden,
Sensory description of potato puree enriched with individual functional…
199
Germany), and placed in a domestic freezer for storage at -24C. Packed frozen samples were
thawed in a Samsung M1712N microwave oven (Samsung Electronics S.A., Madrid, Spain).
Samples were heated for 20 min at an output power rating of 600 W.
Sensory Evaluation
Three sensory descriptive methodologies were performed by panels with varying
degrees of training. The idea was to choose “the worse situation” to check if semi-trained
and untrained assessors could give a relevant and similar product mapping than a trained
panel with the advantage of saving time and effort. In each methodology, the seven PPs
were served in white plastic vessels, coded with a three digit number, at a temperature of 55
± 1C, as previous studies showed that this is preferred temperature for PP consumption
(Alvarez et al. 2011a,b, 2012). After thawing, samples were brought up to 55C and kept at
this temperature by placing them in a Hetofrig CB60VS water bath (Heto Lab Equipment
A/S, BirkerØd, Denmark) prior to tasting, where water and product temperatures were
monitored by T-type thermocouples. For the FP and PM panels, all samples were presented
at the same time. Mineral water was at assessors’ disposal to rinse their palate between
samples.
QDA. Selection of Descriptors, Assessors’ Training and Samples Evaluation. A trained
sensory panel of eight assessors tested the seven PP samples. Nevertheless, there was
difference in the training experience and time of the assessors. Four of them had extensive
previous experience (more than 7 years) in both QDA and texture profile (TP) of PP samples
(Fernández et al. 2008; Alvarez et al. 2011b), whereas the rest had been trained specifically
in TP of PPs for 1 year in accordance with ISO (1993). For that reason, the development of a
common language for the description of the texture of PPs had been earlier consensual and
Sensory description of potato puree enriched with individual functional…
200
discussed by the complete panel. An initial list of terms was prepared by combining the
descriptors included in a TP developed (Alvarez et al. 2011b) with those used in a previous
QDA (Fernández et al. 2008), which had been adapted to evaluate PP products from Adams
et al. (1981). Three 3-h sessions were held during which the seven PP samples were
presented to the assessors and they were asked to evaluate the suitability of all the
preselected terms to describe the sensory characteristics of the PPs according to the checklist
method (Damasio and Costell 1991). During these sessions, many attributes were left aside
by the majority vote of the panel either by lack of consensus or because of the difficulty in
comprehension or evaluation procedure. A list, composed of 13 terms regarding texture,
taste and color of the samples was finally selected (Table 2). None of the panel members had
any problem in conceptualizing, defining and training themselves in these attributes.
Subsequently, consensus on the tasting procedure as well as agreement upon how to
quantify the intensity of all the attributes was reached after 1-hour session.
QDA of the seven samples was carried out in duplicate over 14 sessions at a fixed time
(1:00 p.m.), and each assessor evaluated one sample (about 50 g each) per session. However,
the PP sample without more added ingredients (C sample) was presented every day for
reference together with the corresponding daily sample. This process allowed the assessors
to create the appropriate context for each scale. Panelists rated the intensity of the 13
attributes on a structured 8-cm line scale labeled at each anchor with the end terms shown in
Table 2 (e.g., for visual graininess, left anchor: 1 = ‘‘smooth”; right anchor: 9 = ‘‘grainy’’,
etc.). For each sample, textural attributes were evaluated first. Then, assessors were asked to
evaluate taste, and finally, color attributes.
Sensory description of potato puree enriched with individual functional…
201
FP. Panel and Samples Evaluation. FP was carried out by 30 semi-trained assessors with
experience in sensory description of other food products (not PPs); they were recruited
among students and employees of the Institute of Food Science, Technology and Nutrition
(ICTAN-CSIC). FP consisted of two sessions in which the seven samples were presented all
at the same time. During the first session, the assessors were given an explanation about the
procedure. Then, the assessors were asked to taste and examine the samples in order to
generate their own provisional list of attributes individually, which should be sufficiently
discriminant to allow a ranking of the samples. The assessors were instructed to avoid
hedonic terms; in the second session they assessed the seven PPs, ranking all samples from
“least” to “most” according to each attribute (ties were allowed).
PM. Panel and Samples Evaluation. PM was carried out by 30 untrained students and
employees of the Institute of Food Science, Technology and Nutrition (ICTAN-CSIC) (27-
56) years old. Members of the untrained panel were different from those who took part in
the FP task. Assessors had no previous experience in sensory assessment. The 30 untrained
assessors were acceptors, frequent consumers of potato products and not rejecters of milk.
The seven PP samples were simultaneously presented to each judge placed in the middle of
an A3 (29.7 × 42 cm) sheet. Assessors were given verbal instructions and allowed to ask for
clarification before they began. Instructions were as follows: taste and examine the PPs and
arrange the vessels of the paper in such a way that those which are similar are close together,
and those very different are far apart. Do this according to whatever terms or attributes you
choose. PM exercise was combined with ultra-flash profiling: after placing them on the
sheet, assessors were asked to describe the individual products or groups by directly writing
on the sheet as a means to describe the differences or sensory characteristics. Ultra-flash
profiling has been used by other authors (Perrin et al. 2008; Moussaoui and Varela 2010;
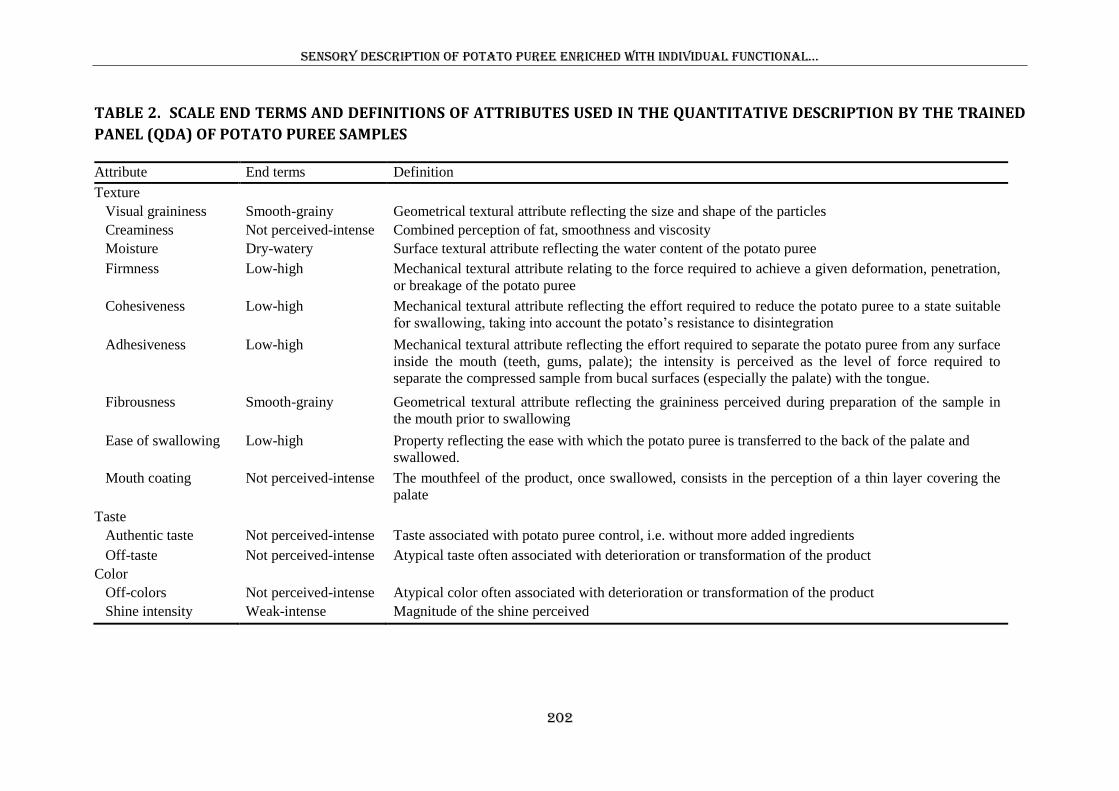
Sensory description of potato puree enriched with individual functional…
202
TABLE 2. SCALE END TERMS AND DEFINITIONS OF ATTRIBUTES USED IN THE QUANTITATIVE DESCRIPTION BY THE TRAINED
PANEL (QDA) OF POTATO PUREE SAMPLES
Attribute End terms Definition
Texture
Visual graininess Smooth-grainy Geometrical textural attribute reflecting the size and shape of the particles
Creaminess Not perceived-intense Combined perception of fat, smoothness and viscosity
Moisture Dry-watery Surface textural attribute reflecting the water content of the potato puree
Firmness Low-high Mechanical textural attribute relating to the force required to achieve a given deformation, penetration,
or breakage of the potato puree
Cohesiveness Low-high Mechanical textural attribute reflecting the effort required to reduce the potato puree to a state suitable
for swallowing, taking into account the potato’s resistance to disintegration
Adhesiveness Low-high Mechanical textural attribute reflecting the effort required to separate the potato puree from any surface
inside the mouth (teeth, gums, palate); the intensity is perceived as the level of force required to
separate the compressed sample from bucal surfaces (especially the palate) with the tongue.
Fibrousness Smooth-grainy Geometrical textural attribute reflecting the graininess perceived during preparation of the sample in
the mouth prior to swallowing
Ease of swallowing Low-high Property reflecting the ease with which the potato puree is transferred to the back of the palate and
swallowed.
Mouth coating Not perceived-intense The mouthfeel of the product, once swallowed, consists in the perception of a thin layer covering the
palate
Taste
Authentic taste Not perceived-intense Taste associated with potato puree control, i.e. without more added ingredients
Off-taste Not perceived-intense Atypical taste often associated with deterioration or transformation of the product
Color
Off-colors Not perceived-intense Atypical color often associated with deterioration or transformation of the product
Shine intensity Weak-intense Magnitude of the shine perceived
Sensory description of potato puree enriched with individual functional…
203
Albert et al. 2011) as a good complement to PM. Data were collected manually as the x- and
y-coordinates to the center of each vessel from the lower left corner of the paper. The aim of
this test was profile the products with the use of consumers’ words.
Texture Profile Analysis.
Texture profile analysis (TPA) was performed using a TA.HDPlus Texture Analyser
(Stable Micro Systems Ltd, Godalming, U.K.) equipped with a 300 N load cell. During tests,
PPs were kept at 55C by means of a Temperature Controlled Peltier Cabinet (XT/PC)
coupled to a separate heat exchanger and proportional-integral-derivative control unit. For
performance of TPA tests, an aluminium cylindrical probe (P/35) with 35 mm diameter was
driven into a 60 mm diameter stainless steel vessel containing 50 ± 1 g of sample. Samples
were compressed to 33% of initial height at a compression speed of 3 mm/s, with a rest
period of 5 s between cycles. Previous studies showed that under these conditions the action
of the jaw is properly imitated (Canet et al. 2011). Consistency (N), adhesiveness (N s),
springiness (dimensionless), cohesiveness (dimensionless) and gumminess (N) were
reported for each sample. In this study, hardness was termed consistency following Kramer
(1973), who suggested that since food slurries such as sauces are invariably non-Newtonian,
this characteristic could properly be called “consistency.” Texture measurements were
performed in quadruplicate and results averaged.
Statistical Analysis
QDA data were analyzed using two-way mixed-model analysis of variance (ANOVA)
on the attributes rated by the trained panel to analyze sample and assessor effects and their
interaction, assuming that either main effects or interaction were fixed effects. Significant
differences between samples were determined by the Fisher’s least significant difference test
at 5%. Principal component analysis (PCA) based on the Pearson’s correlation matrix was
Sensory description of potato puree enriched with individual functional…
204
conducted on the mean values of attribute intensities presenting significant differences. PCA
is a statistical tool that helps to summarize, and therefore communicates better the results
from descriptive panel profiling (Moussaoui and Varela 2010).
For the FP data, individual matrices for each assessor (samples x attributes) were built
in order to enter product rankings. A generalized Procrustes analysis (GPA) (Gower 1975)
was then performed on the 30 matrices in order to obtain the sample and attribute
configurations.
The projective maps from each assessor obtained by the PM were analyzed by
multiple factor analysis (MFA) (Pagès and Husson 2001). MFA was performed on data
obtained from the positioning of the seven samples on the A3 sheets as well as the attributes
each assessor generated to describe the samples. The sample coordinates were measured in
centimeters and attributes listed together with their frequencies of mention across the
untrained panel, resulting in three tables: x, y, attributes. Frequency of mention scores of
synonyms and repeated sensory attributes were combined and considered as one variable in
the data analysis (i.e., authentic taste, potato taste, natural taste, homemade taste would be
entered as authentic taste with a frequency of mention that is the sum of the frequencies of
each word). MFA was performed for each assessor incorporating the descriptive analysis
data of the ultra-flash profile as supplementary variables (Perrin et al. 2008).
Following PCA, GPA and MFA, hierarchical clustering analysis (HCA) was carried
out on the sample mean configuration coordinates in order to highlight sample clusters as
perceived by the three panels. Clustering parameters were dissimilarity, Euclidean distance
and agglomeration method: Ward’s method and automatic truncation (Albert et al. 2011).
On the other hand, semi-trained and untrained panel maps were correlated with the
trained panel map using a MFA in such a way that mean scores from the trained panel were
Sensory description of potato puree enriched with individual functional…
205
considered as an additional data set to nonexperienced individual data. The regression vector
(Rv) coefficient was also used to compare the agreement in the structure of the
configurations determined by the evaluations of the three panels. Rv coefficient has values
between 0 and 1 with numbers closer to 1 indicating greater similarity. Moreover, sensory
data from each of the three methods were analyzed jointly with instrumental data from TPA
tests using MFA (Escofier and Pagés 1990). In this analysis, only those attributes generated
by the three panels that described textural characteristics of the samples were taken into
account.
All data analyses were carried out with XLSTAT add-in for Microsoft Excel software
version 2012 (Addinsoft, Paris, France).
RESULTS AND DISCUSSION
QDA – Trained Panel
A definitive list with the 13 attributes was created by consensus (Table 2). An
important point to note here is that there was difference in the training experience and time
of the assessors; therefore it is important to know whether assessor variability may influence
the estimation of sample differences. Two-way mixed-model ANOVA analysis (Table 3)
showed that the 13 attributes evaluated differed among samples (P < 0.05). Assessors were
not a significant source of variation for any of attributes studied. There was a good level of
agreement among the new assessors and the four earlier members regarding their
evaluations, i.e., no lack of concordance within the panel ratings was observed.
Figure 1 shows the relative positioning of the samples and attributes in the sensory
space generated by the trained panel. PCA of descriptive data revealed a clear discrimination
Sensory description of potato puree enriched with individual functional…
206
of the sample set following the average ratings of the 13 attributes. Results showed that the
first component explained 87.2% of the total variability and was mainly relate to texture
attributes. Looking at how the samples were positioned in the bidimensional space, samples
with added both EVOO and INL ingredients, either alone or blended, showed higher
creaminess and ease of swallowing, and were perceived as having more intense shine than
the samples with added SPI, either alone or blended with INL or EVOO, which showed
higher visual graininess, firmness, adhesiveness, cohesiveness, fibrousness and mouth
coating. This coincides with the observation by Alvarez et al. (2011b) that addition of
EVOO oil significantly enhances the texture of PP samples. Alvarez et al. (2012) also found
that the presence of SPI strands was a dominant factor in texture perception of PP with
regard to the mouthfeel geometric attribute (fibrousness) and the after-feel attribute (mouth
coating), while presence of INL crystallites was the most important feature increasing
creaminess, moisture and overall acceptability. In turn, milk beverage model systems with
added INL were perceived as significantly creamier than samples without INL (Villegas et
al. 2007).
In turn, the second component explained 7.8% of total variability and was defined
mainly by taste attributes and as well by moisture. In the upper part, there was the control (C
sample) that was perceived as having more authentic taste than the rest of samples due to the
strong potato flavor detected in the product. In turn, EVOO + INL sample was perceived to
be the moistest. It can also be observed that either off-taste or off-colors described PPs with
added EVOO + SPI blend, indicating that the addition of these two ingredients together
produced an unpleasant either taste or color.
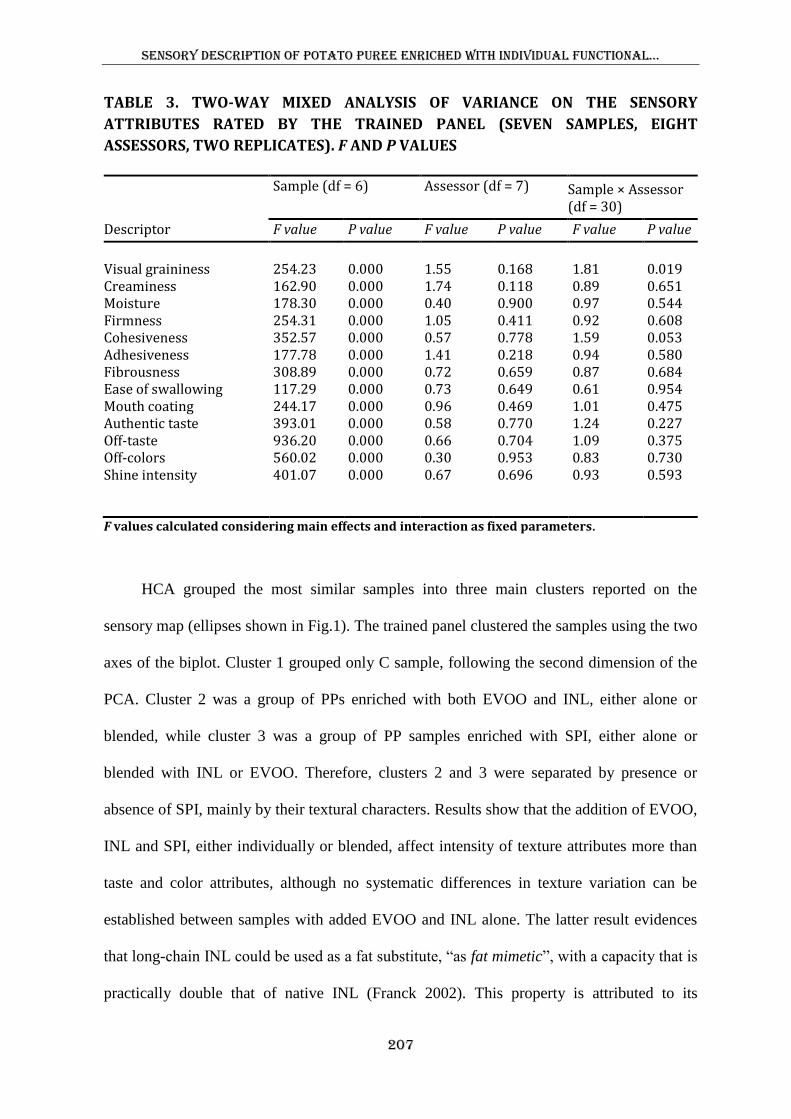
Sensory description of potato puree enriched with individual functional…
207
TABLE 3. TWO-WAY MIXED ANALYSIS OF VARIANCE ON THE SENSORY
ATTRIBUTES RATED BY THE TRAINED PANEL (SEVEN SAMPLES, EIGHT
ASSESSORS, TWO REPLICATES). F AND P VALUES
Sample (df = 6) Assessor (df = 7) Sample × Assessor (df = 30)
Descriptor F value P value F value P value F value P value
Visual graininess
254.23
0.000
1.55
0.168
1.81
0.019
Creaminess 162.90 0.000 1.74 0.118 0.89 0.651 Moisture 178.30 0.000 0.40 0.900 0.97 0.544 Firmness Cohesiveness Adhesiveness
254.31 352.57 177.78
0.000 0.000 0.000
1.05 0.57 1.41
0.411 0.778 0.218
0.92 1.59 0.94
0.608 0.053 0.580
Fibrousness 308.89 0.000 0.72 0.659 0.87 0.684 Ease of swallowing Mouth coating Authentic taste Off-taste Off-colors Shine intensity
117.29 244.17 393.01 936.20 560.02 401.07
0.000 0.000 0.000 0.000 0.000 0.000
0.73 0.96 0.58 0.66 0.30 0.67
0.649 0.469 0.770 0.704 0.953 0.696
0.61 1.01 1.24 1.09 0.83 0.93
0.954 0.475 0.227 0.375 0.730 0.593
F values calculated considering main effects and interaction as fixed parameters.
HCA grouped the most similar samples into three main clusters reported on the
sensory map (ellipses shown in Fig.1). The trained panel clustered the samples using the two
axes of the biplot. Cluster 1 grouped only C sample, following the second dimension of the
PCA. Cluster 2 was a group of PPs enriched with both EVOO and INL, either alone or
blended, while cluster 3 was a group of PP samples enriched with SPI, either alone or
blended with INL or EVOO. Therefore, clusters 2 and 3 were separated by presence or
absence of SPI, mainly by their textural characters. Results show that the addition of EVOO,
INL and SPI, either individually or blended, affect intensity of texture attributes more than
taste and color attributes, although no systematic differences in texture variation can be
established between samples with added EVOO and INL alone. The latter result evidences
that long-chain INL could be used as a fat substitute, “as fat mimetic”, with a capacity that is
practically double that of native INL (Franck 2002). This property is attributed to its
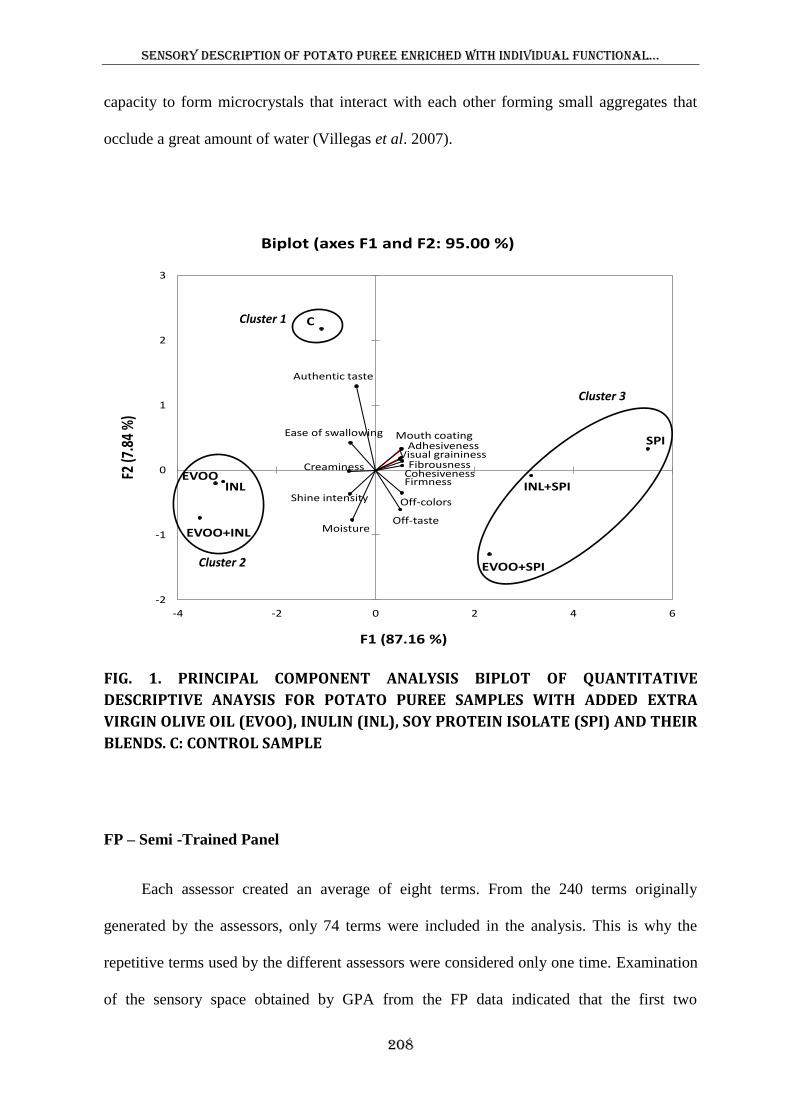
Sensory description of potato puree enriched with individual functional…
208
capacity to form microcrystals that interact with each other forming small aggregates that
occlude a great amount of water (Villegas et al. 2007).
FIG. 1. PRINCIPAL COMPONENT ANALYSIS BIPLOT OF QUANTITATIVE
DESCRIPTIVE ANAYSIS FOR POTATO PUREE SAMPLES WITH ADDED EXTRA
VIRGIN OLIVE OIL (EVOO), INULIN (INL), SOY PROTEIN ISOLATE (SPI) AND THEIR
BLENDS. C: CONTROL SAMPLE
FP – Semi -Trained Panel
Each assessor created an average of eight terms. From the 240 terms originally
generated by the assessors, only 74 terms were included in the analysis. This is why the
repetitive terms used by the different assessors were considered only one time. Examination
of the sensory space obtained by GPA from the FP data indicated that the first two
C
EVOO
EVOO+INL
EVOO+SPI
INL INL+SPI
SPI
Off-colorsShine intensity
Visual graininessCreaminess
Moisture
FirmnessCohesiveness
Adhesiveness
Fibrousness
Ease of swallowing Mouth coating
Authentic taste
Off-taste
-2
-1
0
1
2
3
-4 -2 0 2 4 6
F2 (7
.84
%)
F1 (87.16 %)
Biplot (axes F1 and F2: 95.00 %)
Cluster 1
Cluster 2
Cluster 3
Sensory description of potato puree enriched with individual functional…
209
dimensions accounted for the 83% of the total variability (Fig. 2). The first dimension
appears to be a contrast between samples with added SPI, either alone or blended with
EVOO or INL, and the rest of the samples, and involved multivariate perceptions (texture,
taste and appearance) grouping in the negative part attributes as sandy, earthy, pasty, palate
coating, grainy, off-taste, off-colors and visual opacity. C sample and those enriched with
both INL and EVOO, either alone or blended, showed higher creaminess, aqueous texture,
easy of swallowing, and characteristics of homemade products and better general
appearance than samples with added SPI. The second dimension was defined mainly by
taste attributes. Samples with added EVOO were perceived as having oilier odor and taste,
while C sample, in the lower part of this dimension, was perceived as having more intense
puree odor and taste notes. Anyway, note as quite attributes correlated to both dimensions.
Sample clustering obtained with HCA showed three groups as the one obtained from
QDA results. Cluster 1 was a group enclosing C sample and sample with added INL alone.
This is probably because assessors were able to perceive the darkening caused by either SPI
or EVOO addition. In the FP method, description is obtained from a ranking of the products,
attribute per attribute (Perrin and Pagès 2009). PPs with added SPI were perceived darker
brown in color, whereas the samples with added EVOO were yellower in color, which was
previously associated with augmented pigment content (Alvarez et al. 2011b). In contrast,
INL is a white powder and produced a lighter colored PP than the control. Probably, for this
reason, semi-trained panel perceived the color of PP samples with added INL alone as being
more similar to C sample characteristic color, as Kennebec potatoes have a white flesh and
PPs without more added ingredients look also quite pale. In turn, cluster 2 was a group of
samples enriched with both EVOO alone and the EVOO + INL blend, and finally the
samples with added SPI were clustered in a group 3. As a result, samples with added SPI
were perceived as more adhesive, dense, firm, fibrous and sandy, while the samples with
Sensory description of potato puree enriched with individual functional…
210
added either INL or EVOO alone were perceived as less sticky, firm and fibrous, and, in
contrast, the most creamy and aqueous. The presence of EVOO was also separated along the
second dimension. The samples with added EVOO alone and with added EVOO + INL
blend characterized by attributes mainly relate to oily taste and odor. In addition, as it was
also observed in the QDA outcome, semi-trained panel also perceived the samples with
added EVOO + SPI blend as having a rancid taste and aroma.
PM – Untrained Panel
There were 55 terms originally generated by the untrained panel, although only 38
different attributes were considered in the MFA of the PM data. Seventeen terms related
with hedonic descriptions were eliminated, and synonyms used by different assessors were
combined into one term. As made by semi-trained assessors, untrained ones also used their
own terms with a more spontaneous and varied generation of attributes as compared to
trained assessors. When MFA was applied to the PM task, the first two components
accounted for 76.7% of the variability. As found by Albert et al. (2011), variability
explained is lower than those obtained by QDA and FP. The latter authors attributed this fact
to differences between panels in previous experience.
Figure 3 shows the correlation circle MFA of the PM together the results of the HCA
performed on attributes. As in the FP task, the first dimension separates samples with added
SPI, either alone or blended with EVOO or INL, and the rest of samples. This dimension
grouped attributes such as palate coating, pasty, off-taste, adhesive, adherent, rancid taste
and rancid smell, which were in the negative part. In the positive part of the first dimension
were positioned the C sample and those enriched with both INL and EVOO, either alone or
blended. The second dimension was defined mainly by taste and aroma attributes and C
Sensory description of potato puree enriched with individual functional…
211
sample was in the upper part of this dimension. Certainly, untrained panelists showed
evidence of a high purchase intent towards the control (different assessors commented that
definitely would buy it), which was associated with its excellent aroma and taste, and
referred to with the term “commercial”.
Moreover, sample clustering obtained with the HCA another time revealed 3 groups.
Cluster 1 was a group enclosing C sample and those enriched with INL alone, and were
accordingly described by aroma and taste attributes. Cluster 2 was a group of samples with
added EVOO, either alone or blended with INL, whereas cluster 3 grouped PPs enriched
with SPI, either alone or blended with INL or EVOO. Therefore, the third cluster was
separated from the other two ones in response to SPI presence. As a result, all the samples
with added SPI were perceived as more pasty than the samples with added both INL and
EVOO, either alone or blended. In turn, samples enriched with both EVOO alone and
EVOO + INL blend were described by attributes related to oil and smooth taste and smooth
texture, whereas samples with added both INL alone and EVOO + INL blend were
perceived as more creamy and watery, easier to swallow and with a natural aroma. Finally,
as found in the QDA and FP outcomes, samples with added SPI blended either with INL or
with EVOO were perceived as having a taste and smell rancid.
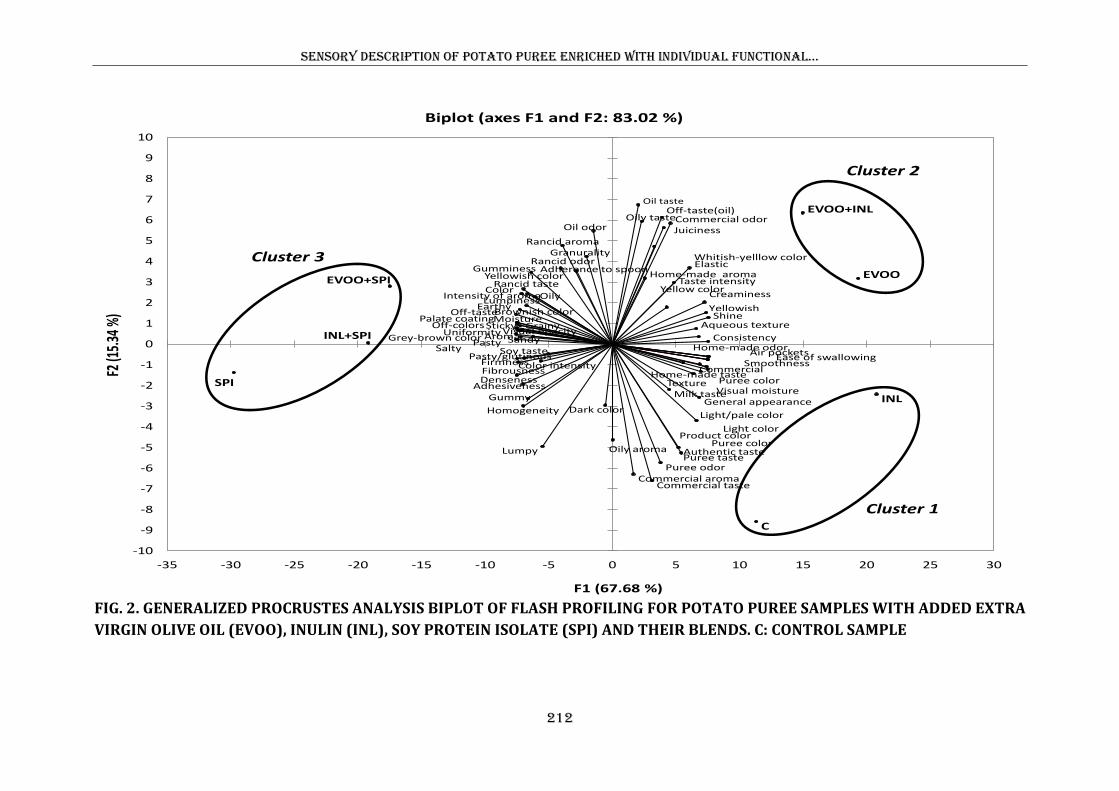
Sensory description of potato puree enriched with individual functional…
212
FIG. 2. GENERALIZED PROCRUSTES ANALYSIS BIPLOT OF FLASH PROFILING FOR POTATO PUREE SAMPLES WITH ADDED EXTRA
VIRGIN OLIVE OIL (EVOO), INULIN (INL), SOY PROTEIN ISOLATE (SPI) AND THEIR BLENDS. C: CONTROL SAMPLE
C
EVOO
INL
SPI
INL+SPI
EVOO+INL
EVOO+SPI
Oil odor
Rancid odor
Creaminess
Oil taste
Milk taste
Juiciness
AdhesivenessGummy
Authentic taste
Shine
Home-made taste
Palate coating
SandySoy taste
Visual moisture
Color intensityFibrousness
Granurality
Taste intensity
Denseness
Ease of swallowing
Intensity of aroma
Product color
Color
Air pockets
AromaSticky
Smoothness
Earthy
Commercial aroma
Grainy
Commercial taste
Aqueous textureOff-colorsMoisture
Light color
Homogeneity
Consistency
Firmness
Lumpy
Oily taste
Visual opacity
Adherence to spoon
Off-taste(oil)
Pasty/glutinous
Home-made aroma
Puree tastePuree odor
Puree color
General appearance
Brownish color
Yellow color
Uniformity
Light/pale colorDark color
Lumpiness
Pasty
Oily
Commercial odor
Puree color
Yellowish color
Home-made odor
Elastic
Salty
Texture
Off-taste
Grey-brown color
Oily aroma
Gumminess
Rancid taste
Rancid aroma
Commercial
-10
-9
-8
-7
-6
-5
-4
-3
-2
-1
0
1
2
3
4
5
6
7
8
9
10
-35 -30 -25 -20 -15 -10 -5 0 5 10 15 20 25 30
F2 (1
5.34
%)
F1 (67.68 %)
Biplot (axes F1 and F2: 83.02 %)
Yellowish
Whitish-yelllow colorCluster 3
Cluster 2
Cluster 1
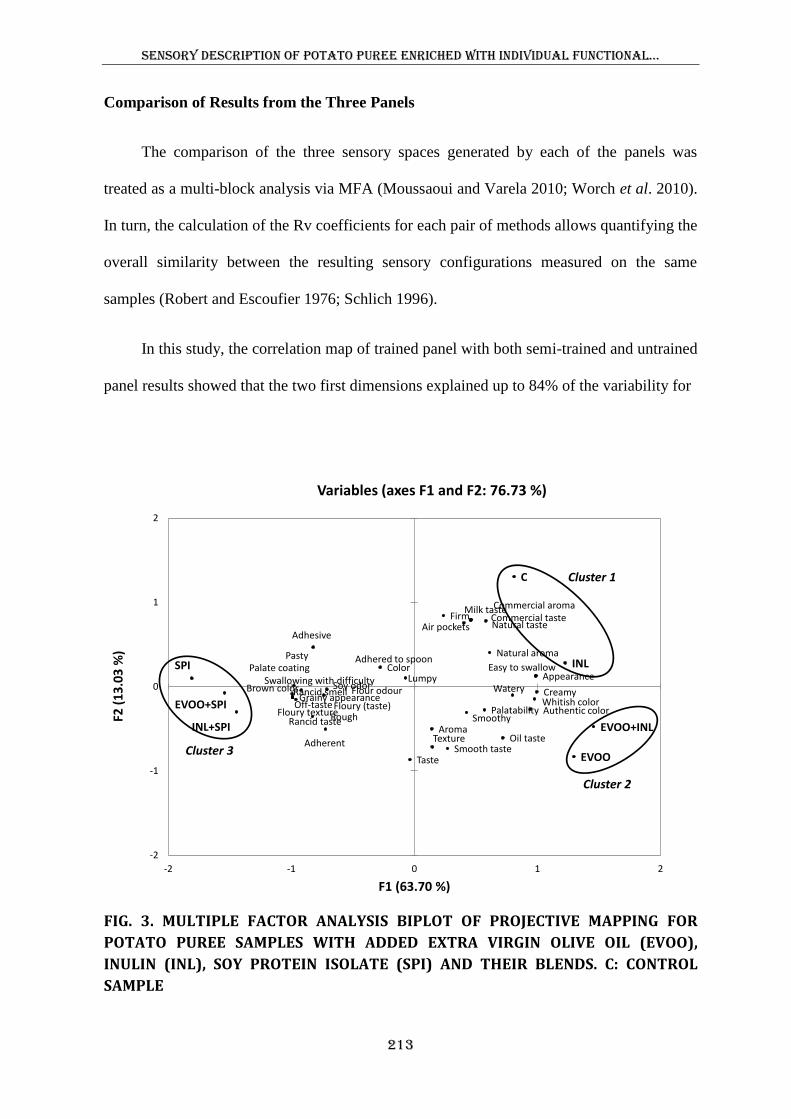
Sensory description of potato puree enriched with individual functional…
213
Comparison of Results from the Three Panels
The comparison of the three sensory spaces generated by each of the panels was
treated as a multi-block analysis via MFA (Moussaoui and Varela 2010; Worch et al. 2010).
In turn, the calculation of the Rv coefficients for each pair of methods allows quantifying the
overall similarity between the resulting sensory configurations measured on the same
samples (Robert and Escoufier 1976; Schlich 1996).
In this study, the correlation map of trained panel with both semi-trained and untrained
panel results showed that the two first dimensions explained up to 84% of the variability for
FIG. 3. MULTIPLE FACTOR ANALYSIS BIPLOT OF PROJECTIVE MAPPING FOR
POTATO PUREE SAMPLES WITH ADDED EXTRA VIRGIN OLIVE OIL (EVOO),
INULIN (INL), SOY PROTEIN ISOLATE (SPI) AND THEIR BLENDS. C: CONTROL
SAMPLE
Brown color
Whitish colorAuthentic color
Appearance
Grainy appearance
Smoothy
Oil taste
Natural taste
Rancid taste
Off-taste
Commercial taste
Floury (taste)
Milk taste
Smooth taste
Natural aroma
Flour odourSoy odor
Commercial aroma
Rancid smell Creamy
Pasty
Watery
Rough
Lumpy
Firm
Palatability
Air pockets
Adherent
Adhesive
Adhered to spoonEasy to swallow
Swallowing with difficultyPalate coating Color
AromaTexture
Floury texture
Taste
C
EVOO
INLSPI
INL+SPI EVOO+INL
EVOO+SPI
-2
-1
0
1
2
-2 -1 0 1 2
F2 (
13.0
3 %
)
F1 (63.70 %)
Variables (axes F1 and F2: 76.73 %)
Cluster 3
Cluster 1
Cluster 2
Sensory description of potato puree enriched with individual functional…
214
FP and 83% for PM. The two Rv coefficients were greater than or equal to 0.90 (Rv for
QDA versus FP was 0.92 and for QDA versus PM was 0.90), indicating that there was good
agreement across the two pairs of comparisons. Anyway, FP sensory space was further
similar to that of QDA than was the PM one. Albert et al. (2011) obtained a little lower Rv
coefficients in the comparison of the sensory spaces generated by the same three methods
for fish nuggets (Rv for QDA versus FP was 0.86 and for QDA versus PM was 0.82). In
turn, in hot beverages, Moussaoui and Varela (2010) obtained a Rv value of 0.91 when
comparing the sensory spaces generated by a trained panel (via QDA) versus a consumer
panel (via FP).
Superimposed representation of the attributes evaluated by both QDA and FP
methods, shown in the Fig. 4, allows the evaluation of the relationships between them. The
equivalent attributes “adhesiveness” (r = 0.95), “fibrousness” (r = 0.86), “creaminess” (r =
0.95), “off-colors” (r = 0.95) and “off-taste” (r = 0.89) generated by both panels were
located close, suggesting a high correlation between both evaluations. For six commercial
milk desserts, also a high correlation between “creaminess” evaluated by consumers and
trained assessors was found, which indicated that the definition given by the trained
assessors’ panel could be close to consumers’ creaminess perception (Bruzzone et al. 2012).
Certainly, in the comparison between QDA and FP panels, no disagreement was found
between the assessors of both panels for any of the equivalent attributes generated. This
suggests that, even though semi-trained assessors had not experience in sensory description
of PP samples, they were able to evaluate them in a similar way as trained assessors did.
In turn, Fig. 5 shows the comparison between the sensory spaces generated by both
trained and untrained panels. Furthermore, the attributes’ representation showed high
correlation between equivalent attributes. For instance, the attributes “creaminess” and
“creamy” appear to be high and positively correlated (r = 0.93). The same occurs for the
Sensory description of potato puree enriched with individual functional…
215
pairs of terms “ease of swallowing” and “easy to swallow” (r = 0.98), “moisture” and
“watery” (r = 0.80), “adhesiveness” and “adhesive” (r = 0.92) and “mouth coating” and
“palate coating” (r = 0.91). In PP samples subjected to sensory TP, an untrained panel was
able to distinguish between PP samples with different added SPI:INL ratios, but only a good
linear correlation was observed between trained and untrained evaluations for “creaminess”
(Alvarez et al. 2012). Nevertheless, a disagreement between both trained and untrained
panels was observed for the pair of the terms “firmness” and “firm” (r = -0.07).
Interestingly, and in contrast, “firmness” was highly correlated with “pasty” (r = 0.98); this
allows the observation that the “firmness” perception was not quite well described by
untrained assessors.
On the other hand, the MFA partial points representation of the samples evaluated by
QDA and FP methods (Fig. 6a), shows that PPs with greater variability are both C and INL
samples because the semi-trained panel discriminates these products better in the second
dimension, whereas trained panelists discriminate the INL sample better in the first one
(Figs. 1 and 2). In turn, the MFA partial points graph of the samples evaluated by QDA and
PM methods (Fig. 6b) shows that PPs with more variability are both C and SPI samples,
even though in this case both trained and untrained panels discriminate these two samples
well again in similar dimensions (Figs. 1 and 3). Anyway, SPI sample rated by the trained
panel is opposed to the same sample rated by the untrained panel. Despite these
disagreements, Rv coefficients between both nonexpert and trained panels are high, which
shows that the disagreement is minimal and concern only two PP samples in both
comparisons. Therefore, it would be possible state that the attributes generated by the semi-
trained and untrained panels reflected well those used by the trained panel, and the samples
spaces are in fact close. Similar results were observed in the comparison of sensory profiles
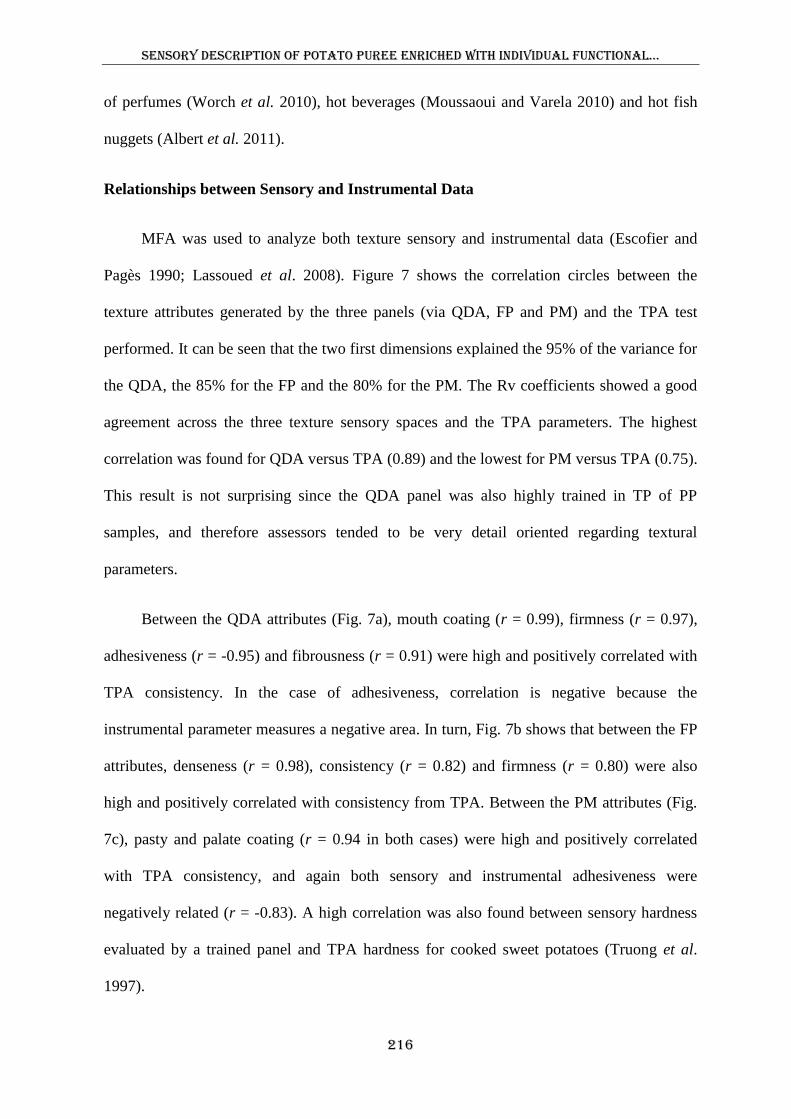
Sensory description of potato puree enriched with individual functional…
216
of perfumes (Worch et al. 2010), hot beverages (Moussaoui and Varela 2010) and hot fish
nuggets (Albert et al. 2011).
Relationships between Sensory and Instrumental Data
MFA was used to analyze both texture sensory and instrumental data (Escofier and
Pagès 1990; Lassoued et al. 2008). Figure 7 shows the correlation circles between the
texture attributes generated by the three panels (via QDA, FP and PM) and the TPA test
performed. It can be seen that the two first dimensions explained the 95% of the variance for
the QDA, the 85% for the FP and the 80% for the PM. The Rv coefficients showed a good
agreement across the three texture sensory spaces and the TPA parameters. The highest
correlation was found for QDA versus TPA (0.89) and the lowest for PM versus TPA (0.75).
This result is not surprising since the QDA panel was also highly trained in TP of PP
samples, and therefore assessors tended to be very detail oriented regarding textural
parameters.
Between the QDA attributes (Fig. 7a), mouth coating (r = 0.99), firmness (r = 0.97),
adhesiveness (r = -0.95) and fibrousness (r = 0.91) were high and positively correlated with
TPA consistency. In the case of adhesiveness, correlation is negative because the
instrumental parameter measures a negative area. In turn, Fig. 7b shows that between the FP
attributes, denseness (r = 0.98), consistency (r = 0.82) and firmness (r = 0.80) were also
high and positively correlated with consistency from TPA. Between the PM attributes (Fig.
7c), pasty and palate coating (r = 0.94 in both cases) were high and positively correlated
with TPA consistency, and again both sensory and instrumental adhesiveness were
negatively related (r = -0.83). A high correlation was also found between sensory hardness
evaluated by a trained panel and TPA hardness for cooked sweet potatoes (Truong et al.
1997).
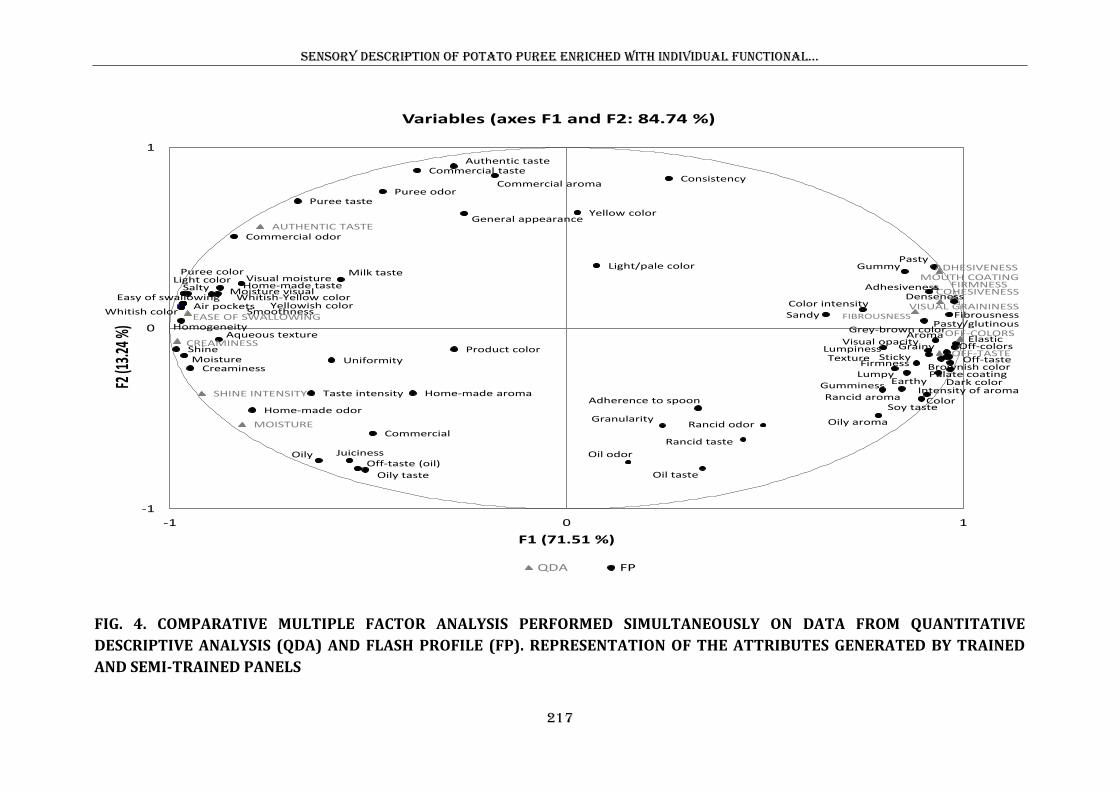
Sensory description of potato puree enriched with individual functional…
217
FIG. 4. COMPARATIVE MULTIPLE FACTOR ANALYSIS PERFORMED SIMULTANEOUSLY ON DATA FROM QUANTITATIVE
DESCRIPTIVE ANALYSIS (QDA) AND FLASH PROFILE (FP). REPRESENTATION OF THE ATTRIBUTES GENERATED BY TRAINED
AND SEMI-TRAINED PANELS
OFF-COLORS
SHINE INTENSITY
VISUAL GRAININESS
CREAMINESS
MOISTURE
FIRMNESSCOHESIVENESS
ADHESIVENESS
FIBROUSNESSEASE OF SWALLOWING
MOUTH COATING
AUTHENTIC TASTE
OFF-TASTE
Adherence to spoon
Adhesiveness
Air pockets
Aqueous texture Aroma
Authentic taste
Brownish color
Color
Color intensity
Commercial
Commercial aroma
Commercial odor
Commercial tasteConsistency
FirmnessCreaminess
Dark color
Denseness
Earthy
Easy of swallowing
Elastic
Fibrousness
General appearance
Grainy
Granularity
Grey-brown color
Gumminess
Gummy
Home-made aroma
Home-made odor
Home-made taste
Homogeneity
Intensity of aroma
Juiciness
Light color
Light/pale color
Lumpiness
Lumpy
Milk taste
Moisture
Moisture visual
Off-colors
Off-taste
Off-taste (oil)Oil odor
Oil taste
Oily
Oily aroma
Oily taste
Palate coating
Pasty
Pasty/glutinous
Product color
Puree color
Puree odorPuree taste
Rancid aroma
Rancid odor
Rancid taste
Salty
Sandy
Shine
Smoothness
Soy taste
Sticky
Taste intensity
TextureUniformity
Visual moisture
Visual opacity
Whitish color
Whitish-Yellow color
Yellow color
Yellowish color
-1
0
1
-1 0 1
F2 (1
3.24
%)
F1 (71.51 %)
Variables (axes F1 and F2: 84.74 %)
QDA FP
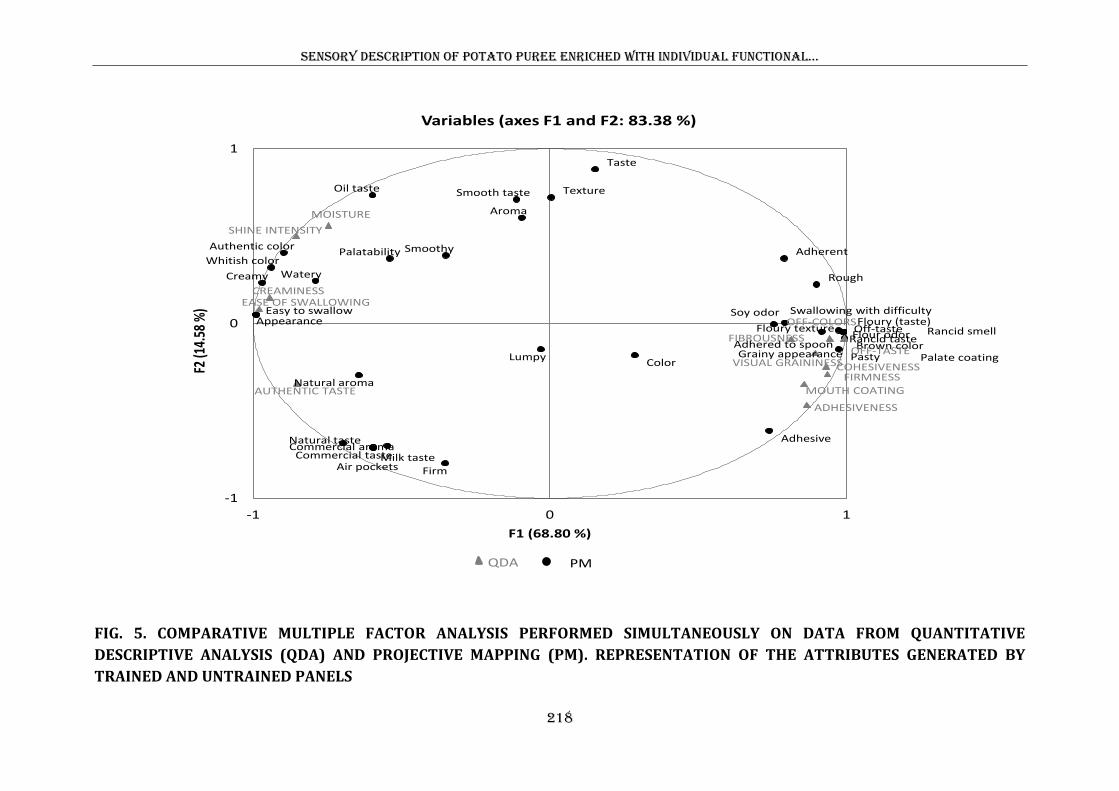
Sensory description of potato puree enriched with individual functional…
218
FIG. 5. COMPARATIVE MULTIPLE FACTOR ANALYSIS PERFORMED SIMULTANEOUSLY ON DATA FROM QUANTITATIVE
DESCRIPTIVE ANALYSIS (QDA) AND PROJECTIVE MAPPING (PM). REPRESENTATION OF THE ATTRIBUTES GENERATED BY
TRAINED AND UNTRAINED PANELS
Brown color
Whitish color
Authentic color
Appearance
Grainy appearance
Smoothy
Oil taste
Natural taste
Rancid tasteOff-taste
Commercial taste
Floury (taste)
Milk taste
Smooth taste
Natural aroma
Flour odor
Soy odor
Commercial aroma
Rancid smell
Creamy
Pasty
Watery Rough
Lumpy
Firm
Palatability
Air pockets
Adherent
Adhesive
Adhered to spoon
Easy to swallow Swallowing with difficulty
Palate coatingColor
Aroma
Texture
Floury texture
Taste
OFF-COLORS
SHINE INTENSITY
VISUAL GRAININESS
CREAMINESS
MOISTURE
FIRMNESSCOHESIVENESS
ADHESIVENESS
FIBROUSNESS
EASE OF SWALLOWING
MOUTH COATINGAUTHENTIC TASTE
OFF-TASTE
-1
0
1
-1 0 1
F2 (1
4.58
%)
F1 (68.80 %)
Variables (axes F1 and F2: 83.38 %)
QDA PM
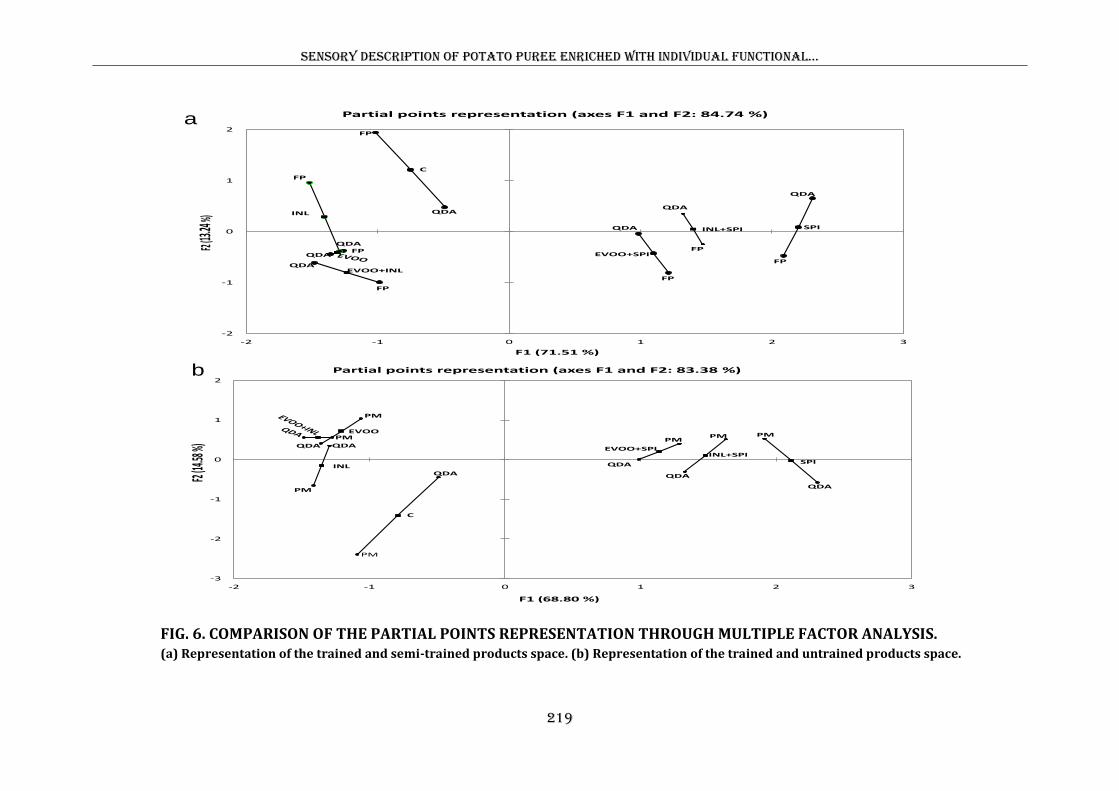
Sensory description of potato puree enriched with individual functional…
219
FIG. 6. COMPARISON OF THE PARTIAL POINTS REPRESENTATION THROUGH MULTIPLE FACTOR ANALYSIS. (a) Representation of the trained and semi-trained products space. (b) Representation of the trained and untrained products space.
a
QDA
C
FP
QDAFP
QDA
INL
FP
QDA
SPI
FP
QDA
INL+SPI
FP
QDAEVOO+INL
FP
QDA
EVOO+SPI
FP
-2
-1
0
1
2
-2 -1 0 1 2 3
F2 (13
.24%)
F1 (71.51 %)
Partial points representation (axes F1 and F2: 84.74 %)
C
EVOO
INLSPI
INL+SPIEVOO+SPI
QDA
PM
QDA
PM
QDA
PMQDA
PM
QDA
PMPM
QDA
PM
-3
-2
-1
0
1
2
-2 -1 0 1 2 3
F2 (14
.58 %)
F1 (68.80 %)
Partial points representation (axes F1 and F2: 83.38 %)
a
b
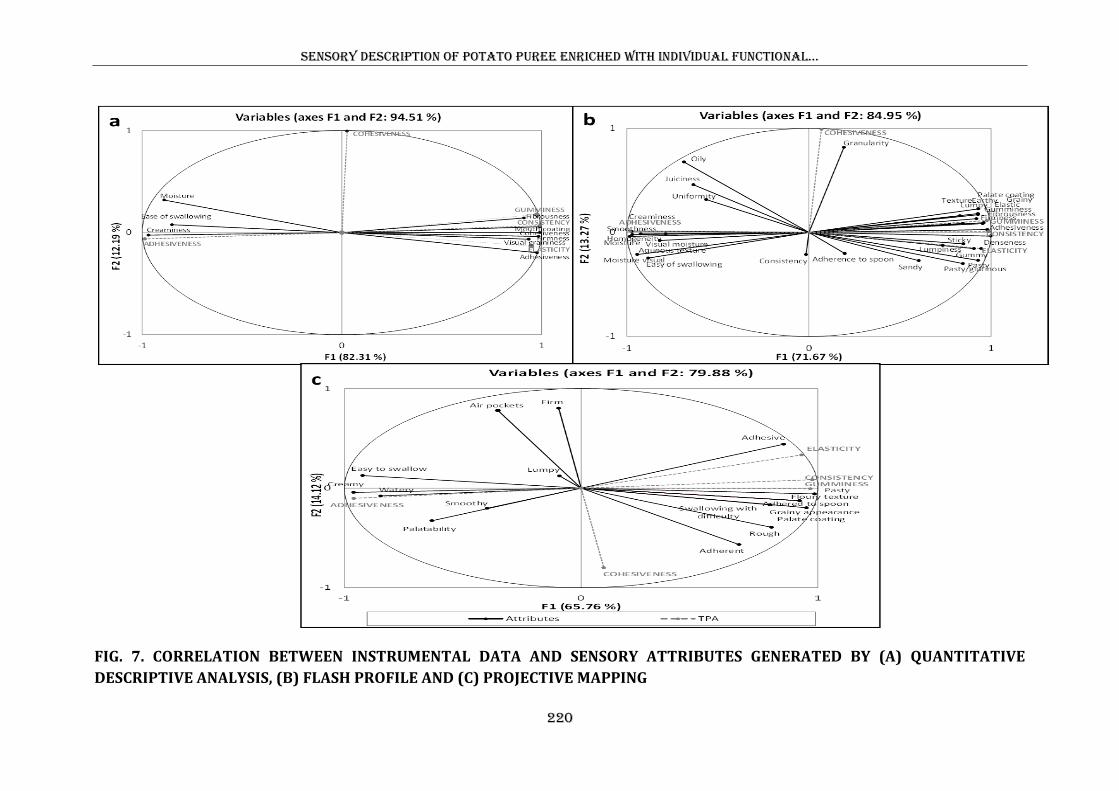
Sensory description of potato puree enriched with individual functional…
220
FIG. 7. CORRELATION BETWEEN INSTRUMENTAL DATA AND SENSORY ATTRIBUTES GENERATED BY (A) QUANTITATIVE
DESCRIPTIVE ANALYSIS, (B) FLASH PROFILE AND (C) PROJECTIVE MAPPING
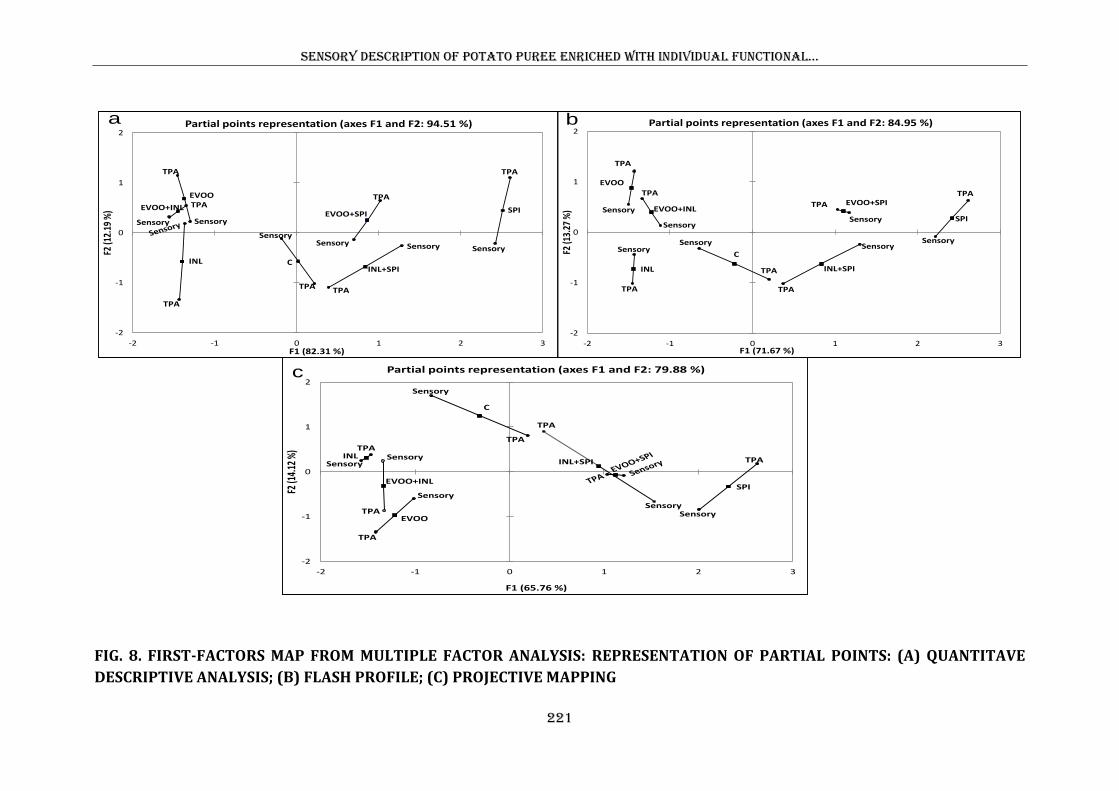
Sensory description of potato puree enriched with individual functional…
221
FIG. 8. FIRST-FACTORS MAP FROM MULTIPLE FACTOR ANALYSIS: REPRESENTATION OF PARTIAL POINTS: (A) QUANTITAVE
DESCRIPTIVE ANALYSIS; (B) FLASH PROFILE; (C) PROJECTIVE MAPPING
C
EVOO
INL
SPI
INL+SPI
EVOO+INL
Sensory
TPA
Sensory
TPA
Sensory
TPA
Sensory
TPA
Sensory
TPA
Sensory
TPA
-2
-1
0
1
2
-2 -1 0 1 2 3
F2 (1
4.12
%)
F1 (65.76 %)
Partial points representation (axes F1 and F2: 79.88 %)
C
EVOO
INL
SPI
INL+SPI
EVOO+INLEVOO+SPI
Sensory
TPA
Sensory
TPA
TPA
Sensory
TPA
Sensory
TPA
Sensory
TPA
Sensory
TPA
-2
-1
0
1
2
-2 -1 0 1 2 3
F2 (1
2.19
%)
F1 (82.31 %)
Partial points representation (axes F1 and F2: 94.51 %)
C
EVOO
INL
SPI
INL+SPI
EVOO+INLEVOO+SPI
Sensory
TPA
Sensory
TPA
Sensory
TPA
Sensory
TPA
Sensory
TPA
Sensory
TPA
Sensory
TPA
-2
-1
0
1
2
-2 -1 0 1 2 3
F2 (1
3.27
%)
F1 (71.67 %)
Partial points representation (axes F1 and F2: 84.95 %)a b
c
Sensory description of potato puree enriched with individual functional…
222
Partial points’ representations for QDA, FP and PM versus TPA (Fig. 8) show as
to a given PP sample correspond two partial points, which reflect sensory and
instrumental images. The proximity between these two images can be interpreted as
coherence (Pagès and Husson 2005). In QDA, the two closest images correspond to
EVOO + INL samples (Fig. 8a). In FP, images are closer to EVOO + SPI samples (Fig.
8b). In turn, in PM, both images are very close to either EVOO + SPI samples or to
samples with added INL alone (Fig.8c). Therefore, at each sensory method, for cited
samples, sensory and instrumental characteristics are more in agreement, and it can be
said that the two measurements are coherent to each other. However, for the three
sensory methods, the product that presented more discordance between sensory and
instrumental characteristics was the INL + SPI sample. In all three cases, the first axis
sets apart PPs with added SPI either alone or blended with INL or EVOO and PPs with
added INL and EVOO either individually or combined between them whatever the
adopted point of view (sensory or instrumental). Analogously, for QDA, FP and PM,
the second axis sets apart the C sample.
CONCLUSION
Relative positioning of both samples and attributes in the three QDA, FP and PM
sensory spaces was quite comparable. In all cases, there was an opposition between
samples with presence or absence of SPI along the first dimension, so samples with
added SPI, either alone or blended with INL or EVOO were separated from the rest,
driven by textural attributes. In contrast, samples positioning along the second
dimension was mostly dependant on color, aroma and taste characteristics. When
clustering samples via HCA, products were grouped into three clusters in the three
Sensory description of potato puree enriched with individual functional…
223
methods. Cluster 1 grouped only control sample (C) in the QDA, whereas samples with
added INL alone were clustered with C sample in both FP and PM methodologies,
mostly because of appearance and taste characteristics.
In turn, Rv coefficient between QDA versus FP was 0.92 and for QDA versus PM
was 0.90, so there was a good agreement with QDA in both alternative methodologies,
even though FP sensory space was further similar to that of QDA than was PM one.
Higher correlations between textural attributes evaluated by trained and semi-trained
panels were found, indicating that although semi-trained assessors had not experience in
PPs texture description, they were able to evaluate them in a similar way as trained
assessors did. Nevertheless, the untrained assessors’ perception of ‘firm/firmness’ was
not well correlated to the trained panel assessment. This finding suggests that there is a
limit in the quality of information that can be obtained via consumers’ description. In
the study of the relation between the three texture sensory spaces and the TPA
parameters, also lower correlation was found for PM versus TPA. Anyway, the
difficulty with attributes coming from semi-trained and untrained assessors is that their
real meaning and how they were measured is unknown, since only QDA panel knew the
exact definition of all attributes.
In addition, there were various differences in the terms used by the three panels
for sample description. When the terms distribution is compared by senses, it can be
observed that the distribution is globally quite similar for FP and PM modalities.
Appearance, taste, texture and odor represented over 25, 19, 40 and 15%, respectively,
of the terms generated by semi-trained assessors, and above 16, 24, 45 and 16%,
respectively, of the terms generated by untrained ones. Trained assessors generated the
highest percentage of texture terms (69%), whereas appearance and taste represented
over 15%, respectively, and they did not develop terms associated to odor. This can be
Sensory description of potato puree enriched with individual functional…
224
explained as QDA panel was highly trained in texture assessment, whereas non-trained
panels used more diverse and impulsive terms, making more references to the
appearance and taste.
Accordingly, texture attributes were not the most relevant to the target consumers,
whereas that trained assessors were inclined to look into samples details mostly related
to texture neglecting other characteristics more obvious for the consumers (such as odor
or appearance).
ACKNOWLEDGMENTS
The authors wish to thank the Spanish Ministry of Economy and Competitiveness
for financial support (AGL2011-28569).
REFERENCES
ADAMS, M.J., BEDFORD, L.V. and GEERING, J. 1981. QAV – a Method for
the Sensory Appraisal of Quality Processed Vegetable Varieties. Technical
Memorandum 278. The Campden Food Preservation Research Association, Chipping,
Campden, Gloucestershire, UK, pp 7-29.
ALBERT, A., VARELA, P., SALVADOR, A., HOUGH, G. and FISZMAN, S.
2011. Overcoming the issues in the sensory description of hot served food with a
complex texture. Application of QDA®, flash profiling and projective mapping using
panels with different degrees of training. Food Qual. Pref. 22, 463-473.
ALVAREZ, M.D., FERNÁNDEZ, C., SOLAS, M.T. and CANET, W. 2011a.
Viscoelasticity and microstructure of inulin-enriched mashed potatoes: influence of
freezing and cryoprotectants. J. Food Eng. 102, 66-76.
Sensory description of potato puree enriched with individual functional…
225
ALVAREZ, M.D., FERNÁNDEZ, C., JIMÉNEZ, M.J. and CANET, W. 2011b.
Texture of extra virgin olive oil-enriched mashed potatoes: sensory, instrumental and
structural relationships. J. Texture Studies 42, 413-429.
ALVAREZ, M.D., JIMÉNEZ, M.J., OLIVARES, M.D., BARRIOS, L. and
CANET, W. 2012. Texture perception determined by soy protein isolate and inulin
addition in potato puree: links with mechanical and microstructural features. J. Texture
Studies 43, 361-374.
ASTM. 1992. Quantitative descriptive analysis (QDA). ASTM digital library. doi:
10.1520/MNL10523M.
BAYARRI, S., GONZÁLEZ-TOMÁS, L., HERNANDO, I., LLUCH, M.A. and
COSTELL, E. 2011. Texture perceived on inulin-enriched low-fat semisolid dairy
desserts. Rheological and structural basis. J Texture Studies 42, 174-184.
BRUZZONE, F., ARES, G. and GIMÉNEZ, A. 2012. Consumers’ texture
perception of milk desserts. II- Comparison with trained assessors’ data. J Texture
Studies 43, 214-226.
CANET, W., FERNÁNDEZ, C. and ALVAREZ, M.D. (2011). Functionality of
amidated low methoxyl pectin and Santan gum blends on the texture and color of
mashed potatoes. ducts. J. Food Process Eng. 34, 746-776.
DAIROU, V. and SIEFFERMANN, J.-M. 2002. A comparison of 14 jams
characterized by conventional profile and a quick original method, the flash profile. J.
Food Sci. 67, 601-618.
DAMASIO, M.H. and COSTELL, E. 1991. Análisis sensorial descriptivo:
Generación de descriptores y selección de catadores. Rev.Agroquím. Tecnol. Aliment.
31, 165–178.
Sensory description of potato puree enriched with individual functional…
226
DELARUE, J. and SIEFFERMANN, J.-M. 2004. Sensory mapping using Flash
profile. Comparison with a conventional descriptive method for the evaluation of the
flavor of fruit dairy products. Food Qual. Pref. 15, 383-392.
ESCOFIER, B. and PAGÉS, P. 1990. Analyses factorielles simples et multiples,
second ed. Dunod, París.
FERNÁNDEZ, C., ALVAREZ, M.D. and CANET, W. 2008. Steady shear and
yield stress of fresh and frozen/thawed mashed potatoes: effect of biopolymers addition.
Food Hydrocolloids 22, 1381-1395.
FRANCK, A. 2002. Technological functionality of inulin and oligofructose. Br.
J.Nutr. 2, 287–291.
GOWER, J.C. 1975. Generalized procrustes analysis. Psychometrika 40, 33-51.
International Organization for Standardization (ISO). 1993. International
Standard 8586-1. Sensory Analysis–General Guidance for the Selection, Training and
Monitoring of Assessors – Part 1: Selected Assessors, ISO, Geneva, Switzerland.
KRAMER, A. 1973. Food texture-definition, measurement and relation to other
food quality attributes. In Texture Measurement of Foods (A. Kramer and A.S.
Szczesniak, eds.) pp. 1–9, D. Reidel Publishing Company, Dordrecht, Holland.
LASSOUED, N., DELARE, J., LAUNAY, B. and MICHON, C. 2008. Baked
product texture: Correlations between instrumental and sensory characterization using
Flash Profile. J. Cereal Sci. 48, 133-143.
MEILGAARD, M.C., CIVILLE, G.V. and CARR, B.T. 2007. Sensory evaluation
techniques (4th ed.). Boca Raton, FL: CRC Press, pp 173.
MOUSSAOUI, K.A. and VARELA, P. 2010. Exploring consumer product
profiling techniques and their linkage to a quantitative descriptive analysis. Food Qual.
Prefer. 21, 1088-1099.
Sensory description of potato puree enriched with individual functional…
227
PAGÈS, J. 2005. Collection and analysis of perceived product inter-distances
using multiple factor analysis: Application to the study of ten white wines from Loire
Valley. Food Qual. Prefer. 16, 642-649.
PAGÈS, J. and HUSSON, F. 2001. Inter-laboratory comparison of sensory
profiles: Methodology and results. Food Qual. Prefer. 12, 297-309.
PAGÈS, J. and HUSSON, F. 2005. Multiple factor analysis with confidence
ellipses: a methodology to study the relationships between sensory and instrumental
data. J. Chemometrics 19, 138-144.
PERRIN, L. and PAGÈS, J. 2009. Construction of a product space from the ultra-
flash profiling method: application to 10 red wines from the Lorey valle. J. Sensory
Studies 24, 372–395.
PERRIN, L., SYMONEAUX, R., MAÎTRE, I., ASSELIN, C., JOURJON, F.
PERRIN, L. and PAGÈS, J. 2008. Comparison of three sensory methods for use with
Napping procedure: Case of ten wines from Loire valley. Food Qual. Prefer. 19, 1-11.
ROBERT, P. and ESCOUFIER, Y. 1976. A unifying tool for linear multivariate
statistical methods: The Rv-coefficient. Applied Statistics 25, 257-265.
SCHLICH, P. 1996. Defining and validating assessor compromises about product
distances and attribute correlations. In Multivariate analysis of data in sensory science
(T. Næs and E. Risvik, eds), Elsevier, Amsterdam, Netherlands.
SIEFFERMANN, J.-M. 2000. Le profil flash-un outil rapide et innovant
d’évaluation sensorielle descriptive. In AGORAL 2000, XIIèmes rencontres
“L’innovation: de l’idèe au success” (pp. 335-340), Montpellier, France.
SIEFFERMANN, J.-M. 2002. Flash Profile. A new method of sensory descriptive
analysis. In AIFST 35th Convention, July 21-24, Sidney, Australia.
Sensory description of potato puree enriched with individual functional…
228
STONE, H., SIDEL, J., OLIVER, S., WOOSLEY, A., and SINGLETON, R.C.
1974. Sensory evaluation by quantitative descriptive analysis. Food Technology 28, 24-
34.
TRUONG, V.D. WALTER JR, W.M. and HAMANN, D.D. 1997. Relationship
between instrumental and sensory parameters of cooked sweetpotato texture. J. Texture
Studies 28, 163-185.
VILLEGAS, B., CARBONELL, I., COSTELL, E., 2007. Inulin milk beverages:
sensory differences in thickness and creaminess using r-index análisis of the ranking
data. J. Sensory Studies 22, 377–393.
WILLIAMS, A.A., LANGRON S.P. 1984. The use of Free-choice Profiling for
the evaluation of commercial ports. J Sci Food Agric 35(5): 558-568.
WORCH, T., LÊ, S., PUNTER, P. 2010. How reliable are the consumers?
Comparison of sensory profiles from consumers and experts. Food Qual. Pref. 21, 309-
318.
Capítulo 5
Discusión integradora

DISCUSIÓN integradora
231
La presente tesis doctoral se enmarca dentro del proyecto de la Comisión
Interministerial de Ciencia y Tecnología (Proyecto del Plan Nacional de I+D AGL2007-
62851) titulado “Efecto de la adición de ingredientes funcionales en el comportamiento
reológico y la textura de cremas y purés vegetales frescos y congelados”. En concreto,
esta investigación se centra en el estudio del efecto de la adición de diferentes
ingredientes funcionales y de sus mezclas en el comportamiento reológico, textura y
propiedades sensoriales de puré de patata fresco y sometido a un proceso de
congelación/descongelación, como consecuencia de la pérdida de calidad del producto
que está asociada con esta tecnología.
Los resultados indicaron que las mejoras se pueden obtener afrontando diferentes
líneas de actuación. Por un lado, están las intervenciones concretas en la formulación
del alimento, es decir, la elección adecuada e incorporación de los diferentes
ingredientes funcionales (aceite de oliva virgen extra, inulina, aislado de proteína de
soja y sus mezclas) a una matriz (puré de patata) conocida e investigada previamente, y
que posiblemente constituye la visión más clásica para abordar la mejora del alimento
desde un punto de vista funcional y nutricional. Por otro lado, el desarrollo y la
aplicación de metodologías sensoriales más innovadoras y rápidas, así como la
aplicación de herramientas para la validación y correlación estadística de los datos
obtenidos, constituye la aportación más innovadora de la presente memoria.
Efecto en la textura de los purés de patata de la adición de aceite de oliva virgen
extra y crioprotectores.
El primer objetivo abordado en esta tesis consistió en evaluar los efectos
ocasionados por la incorporación de aceite de oliva virgen extra y de crioprotectores en
DISCUSIÓN integradora
232
la estructura y textura de puré de patata, lo que suponía un compromiso entre, por un
lado, tratar de reducir el daño mecánico asociado con la congelación/descongelación
para obtener la adecuada textura en el producto final, y por otro, la elaboración de un
producto cardiosaludable y con importantes propiedades antioxidantes. Para ello, se
estudiaron los purés de patata elaborados con diferentes concentraciones de aceite de
oliva virgen extra y con una mezcla de dos hidrocoloides (goma xantana y kappa-
carragenato), evaluando cómo la presencia o ausencia de estos últimos, y la
suplementación con el primero, afectaba a la textura, microestructura y, finalmente, a la
aceptabilidad global de los productos frescos y procesados.
Los resultados de las medidas objetivas instrumentales de textura indicaron que
tanto la firmeza (derivada del ensayo de extrusión inversa) como la fuerza media
(derivada del ensayo de penetración cónica), aumentaban en las muestras elaboradas
con crioprotectores y disminuían en aquellas que no contenían estos hidrocoloides, en
comparación con sus valores en los correspondientes productos frescos, debido al
procesado. Esto se explica debido al hecho de que las soluciones con goma xantana
forman redes mucho más firmes y cohesivas cuando son congeladas y descongeladas.
Ambas propiedades disminuyeron en las muestras tanto recién elaboradas como
congeladas y descongeladas cuando se aumentó la concentración de aceite de oliva
añadida, obteniéndose productos menos estructurados. El aumento de la concentración
de aceite de oliva virgen extra produjo sistemas más líquidos, suaves y blandos,
indicando que el aceite fluidifica y/o lubrica el puré de patata, como reflejan las
medidas de fuerza media y de firmeza que fueron significativamente mayores en las
muestras control sin aceite añadido.
En cuanto a las propiedades de color, los resultados revelaron que el incremento
de aceite de oliva incrementó la luminosidad del puré, debido al aumento de la luz
DISCUSIÓN integradora
233
dispersada que está asociada con las propiedades de dispersión de la luz que posee la
grasa. Además, debido al elevado contenido en pigmentos (clorofila a y b) del aceite de
oliva, el incremento de éste ingrediente en el puré ocasionó que los productos fueran
más verdosos y amarillentos.
El estudio del perfil sensorial de los purés formulados con aceite de oliva fue
realizado mediante la técnica del perfil de textura que permitió evaluar los atributos
según se percibían a lo largo del proceso de consumo del puré (en una fase visual antes
de llegar a la boca, durante la masticación en boca, cuando se prepara el puré para ser
ingerido y en una fase final y residual de la ingestión). Los resultados obtenidos de la
evaluación realizada por 4 jueces entrenados indicaron que los tres factores estudiados
(adición de aceite de oliva, adición de crioprotectores y procesado), así como sus
interacciones, tuvieron un efecto significativo en todos los atributos evaluados excepto
en la pegajosidad (sólo afectada significativamente por la adición de crioprotectores) y
el recubrimiento del paladar (afectado sólo significativamente por la adición de aceite
de oliva). En una primera fase visual, los atributos evaluados fueron la granulosidad y
la humedad. El primero disminuyó cuando se incrementó la concentración de aceite de
oliva añadido, lo que se relaciona con las propiedades de lubricación y recubrimiento
que confiere el aceite de oliva al puré de patata. El segundo, asimismo disminuyó en las
muestras elaboradas con crioprotectores debido a la capacidad de éstos últimos para
retener agua.
En una segunda etapa se evaluaron atributos percibidos durante la masticación del
puré; los resultados indicaron una disminución de la densidad percibida y un
incremento de la homogeneidad, con el incremento del aceite de oliva, mientras que no
se observaron diferencias significativas en la pegajosidad del producto como
consecuencia de este efecto. La percepción sensorial de los tres atributos evaluados
DISCUSIÓN integradora
234
durante la fase de preparación del puré para su ingestión (cohesividad, adhesividad y
fibrosidad), disminuyó como consecuencia de la adición de concentraciones crecientes
de aceite de oliva (> 10 g/kg). Esta reducción fue más significativa en presencia de los
crioprotectores, y cuya presencia también disminuyó significativamente las diferencias
en la fibrosidad percibida en los purés frescos y congelados/descongelados lo que
probablemente esté relacionado con el hecho de que los hidrocoloides pueden
transformar los sistemas desde un estado elástico de goma a un estado más fluido,
reduciendo además la movilidad molecular y previniendo la retrogradación. Los
resultados revelaron que las puntuaciones otorgadas tanto el atributo sensorial facilidad
de deglución del puré, así como al recubrimiento del paladar que confiere el producto,
se incrementaron con el aumento de la cantidad de aceite de oliva virgen extra añadida
al producto.
En lo referente a la aceptabilidad general, los resultados indicaron que las
muestras con cantidades elevadas de aceite tuvieron mayor aceptabilidad, atribuida a las
notas aromáticas, cremosidad y sensación grasa en boca detectadas en esos purés,
además de por la disminución de la sensación de sequedad y aspereza. Los panelistas
también mostraron una mayor aceptabilidad hacia las muestras con crioprotectores
añadidos, lo que probablemente esté relacionado con la sensación cremosa en boca que
produce asimismo la goma xantana. Los resultados indicaron que las muestras más
aceptables fueron aquellas elaboradas con 50 g/kg de aceite de oliva virgen extra. Sin
embargo, en presencia de hidrocoloides es posible reducir el contenido de aceite de
oliva por debajo incluso de 25 g/kg, sin que ello afecte a la aceptabilidad de estos
productos de forma negativa.
DISCUSIÓN integradora
235
Efecto en la textura de los purés de patata de la adición de mezclas de inulina y
aceite de oliva virgen extra.
Puesto que la adición de aceite de oliva virgen extra a los purés de patata,
estudiada en la anterior sección, produjo cambios en las propiedades texturales y
organolépticas, así como en la aceptabilidad de estos productos, en esta segunda etapa
de la tesis se propuso el estudio del efecto en dichas características de la adición de
aceite de oliva junto con inulina, y de esta forma el objetivo fue obtener un producto
rico en ácidos grasos saludables, un compuesto bioactivo (fibra soluble) y de alto valor
nutricional. Por otro lado, se consideró que la adición de inulina y aceite de oliva de
forma conjunta podría producir un alimento tecnológicamente mejorado, debido a la
cremosidad proporcionada por la fibra soluble que da en boca una sensación similar a la
de la grasa, y que previamente se comprobó que era del agrado de los consumidores.
Para ello, se prepararon un total de ocho formulaciones distintas de puré de patata:
cinco de ellas eran mezclas de aceite de oliva e inulina con diferentes concentraciones
de ambos, dos estaban elaboradas cada una con uno de los ingredientes de forma
individual y una formulación se utilizó como muestra control, elaborándola sin
ingredientes funcionales añadidos. Las ocho muestras se elaboraron con y sin
crioprotectores, y se evaluaron inmediatamente después de su elaboración y tras un
proceso de congelación/descongelación.
En primer lugar, se evaluaron las diferencias en las propiedades mecánicas de
textura mediante un ensayo de extrusión inversa. Los resultados obtenidos de este
ensayo indicaron que el efecto de las mezclas de aceite de oliva e inulina en estas
propiedades es del mismo modo función tanto de la adición de crioprotectores como del
procesado. Las muestras sin ingredientes funcionales añadidos tuvieron los valores
DISCUSIÓN integradora
236
máximos de firmeza e índice de viscosidad, y estos valores se vieron reducidos en
mayor medida cuando sólo se añade la concentración más elevada de aceite de oliva (60
g/kg) que cuando se añade la misma cantidad de inulina. Por tanto, de forma individual
el aceite de oliva produce sistemas más blandos que la inulina. Esta disminución puede
esperarse debido a que con la adición de aceite de oliva se está aumentando la fracción
de volumen de la fase oleosa, mientras que la explicación para la disminución en la
consistencia de los purés con la adición de inulina puede ser atribuida a las altas
temperaturas alcanzadas durante la cocción del puré; a temperaturas mayores de 80 ºC
se produce una hidrólisis parcial de la inulina causando un predominio de moléculas
cortas de inulina que no pueden formar zonas de unión fácilmente, lo que posiblemente
justifica la consistencia más baja del puré enriquecido con inulina en comparación con
las muestras control.
En cuanto a la adición de crioprotectores, los resultados mostraron que, excepto
para la muestra control, la firmeza fue menor en las muestras sin hidrocoloides
añadidos. Esto es debido a que la goma xantana, dadas sus propiedades gelificantes,
produce unos sistemas más estructurados, aunque sin embargo estas diferencias en la
firmeza entre las muestras con y sin crioprotectores son menores cuando la inulina se
añade a una concentración elevada (ratios 60:0. 45:15 y 45:30). Por tanto, en ausencia
de crioprotectores, la adición de inulina sola en cantidades mayores de 45 g/kg junto
con aceite de oliva, produjo un espesamiento del puré. Tanto el aceite de oliva como la
inulina se comportan como ingredientes que fluidifican el producto produciendo un
ablandamiento de los purés, aunque cuando ambos ingredientes se añaden
conjuntamente el ablandamiento es más dependiente de la concentración del aceite de
oliva. También se observó una variación diferente de la firmeza en las muestras con y
sin crioprotectores debido al procesado, produciéndose una disminución en la firmeza
DISCUSIÓN integradora
237
de las muestras sin crioprotectores cuando fueron congeladas y descongeladas, y un
aumento en las muestras con crioprotectores tras su congelación/descongelación. Esto
puede explicarse si se considera que cuando las soluciones con goma xantana son
congeladas y descongeladas se forman redes mucho más fuertes y cohesivas.
El estudio de la sinéresis o exudado (Ew) permitió observar que tanto en las
muestras recién elaboradas como en las congeladas/descongeladas, los valores mayores
de Ew se registraron en los purés con inulina añadida de forma individual, mientras que
Ew fue menor en los purés enriquecidos solamente con aceite de oliva. Además, la
capacidad de retención de agua en los purés frescos decreció con el incremento de la
concentración de inulina, debido a que la gran cantidad de moléculas de inulina ocupan
espacios intercatenarios que desplazan el agua.
El siguiente paso fue evaluar los cambios en las propiedades sensoriales de textura
mediante la técnica del perfil realizando dicha evaluación siguiendo el proceso de
consumo del puré de patata. Los trece atributos evaluados por cuatro jueces entrenados
se dividieron en cuatro fases según el orden de percepción. Como resultados relevantes
se pueden citar que la adición de aceite de oliva disminuye la granulosidad visual
estando además asociada con un aumento de la cremosidad. Con elevadas
concentraciones de aceite de oliva (0:60, 15:30 y 30:30), la facilidad de deglución y el
recubrimiento de paladar fueron mayores, lo que se atribuye al hecho de que la grasa es
un potenciador de la sensación de cremosidad, que produce un recubrimiento de los de
tejidos bucales y, por tanto, reduce la fricción entre el alimento y los mismos. En este
estudio, las principales diferencias entre las muestras con y sin aceite de oliva añadido
se relacionaron con la sensación aromática y de cremosidad en boca detectada en las
muestras con aceite, independientemente de la presencia o ausencia de inulina en los
sistemas. Ambas fibrosidades (una percibida antes de ingerir el puré y otra durante la
DISCUSIÓN integradora
238
ingestión) estuvieron fuertemente correlacionadas, y se incrementaron en los purés con
los contenidos más altos de inulina (60:0 y 45:15), lo que se relaciona con la presencia
de grandes agregados de cristalitos del fructano. Ambas humedades (la primera visual y
la segunda percibida en boca) también estuvieron altamente correlacionadas, y además,
en todos los purés, la humedad fue mayor que en la muestra control (0:0).
Los resultados evidenciaron una pegajosidad significativamente mayor en las
muestras recién elaboradas cuando se añadió aceite de oliva de forma individual o
mezclado con concentraciones crecientes de inulina. Esto ocurre porque tanto la inulina
como el aceite producen un efecto similar en la textura del puré, suavizándolo debido a
que ambos ingredientes se encuentran dentro de una matriz rígida de gránulos de
almidón gelatinizados. Por otro lado, se observó que la presencia de crioprotectores
enmascara el efecto producido en la cohesividad de las muestras por la variación de las
concentraciones de aceite e inulina.
Los resultados obtenidos a partir del análisis del perfil de textura sensorial
permiten recomendar un enriquecimiento del puré de patata con la adición de 30 g/kg de
inulina y 45 g/kg de aceite de oliva virgen extra.
Para investigar la interdependencia de los atributos se realizaron una serie de
análisis de componentes principales (ACP) sobre diferentes conjuntos de datos, es decir,
de forma separada sobre los datos de las muestras frescas, congeladas/descongeladas,
con y sin crioprotectores, y sobre el conjunto total de los datos. Los resultados
mostraron que la primera componente fue principalmente un contraste entre atributos de
textura mecánicos (pegajosidad, firmeza, cohesividad y adherencia) y atributos
texturales de superficie (humedad (1) y humedad (2)), tanto cuando se evaluó el
conjunto total de datos, como cuando se consideraron las muestras frescas, procesadas y
DISCUSIÓN integradora
239
sin crioprotectores de forma individual. Los jueces detectaron que las muestras más
adhesivas tenían una menor humedad, una característica bastante común en la textura de
la patata. Por otro lado, la segunda componente pudo ser identificada principalmente
con atributos texturales geométricos (granulosidad, homogeneidad, fibrosidad (1) y
fibrosidad (2)) y residuales (facilidad de deglución y recubrimiento del paladar). Sin
embargo, cuando se realizó el ACP sobre las muestras con crioprotectores de forma
separada, la primera componente fue identificada en este caso con los atributos
geométricos de textura detectados durante la fase de masticación y en la fase final y
residual de la ingestión. Estos cambios en las correlaciones de los atributos con las
componentes se debe probablemente a la reducción o ausencia de la retrogradación del
almidón asociada con la congelación y descongelación del producto, que ocurre cuando
la goma xantana y el kappa-carragenato no están presentes. Este hecho puede ser
confirmado, dado que se observó que los purés congelados/descongelados en ausencia
de crioprotectores tuvieron una granulosidad visual y una fibrosidad elevadas. De la
misma manera, la fibrosidad percibida antes de ingerir el puré fue el atributo mejor
explicado por las dos componentes principales en las muestras sin crioprotectores, y por
lo tanto, el más determinante para la evaluación de su textura, mientras que en las
muestras congeladas y descongeladas el atributo más idóneo para la evaluación de
dichas muestras fue la firmeza. De estos análisis, también se derivaron otros resultados
de interés: el primero fue el hecho de que se observó que existe una elevada correlación
entre las dos humedades y las dos fibrosidades percibidas en distintas fases del proceso
de masticación, y que por lo tanto, se puede prescindir de la evaluación tanto de la
humedad como de la fibrosidad percibidas durante la ingestión del puré, sin que ello
suponga una pérdida significativa de información; el segundo resultado hace referencia
al nivel de concordancia del panel, éste análisis mostró que había un bajo nivel de
DISCUSIÓN integradora
240
acuerdo entre los panelistas para los atributos pegajosidad, adhesividad, facilidad de
deglución y recubrimiento del paladar, lo que reflejaba que los jueces no emplearon
estos atributos de la misma forma.
Efecto de la adición de mezclas de aislado de proteína de soja e inulina y del
procesado en la textura de purés de patata. Aplicación de una herramienta
estadística para validar las diferencias del producto y los rendimientos de un panel
entrenado y otro no entrenado.
En esta parte de la tesis se estudiaron las consecuencias que la adición de mezclas
de inulina (INL) y aislado de proteína de soja (SPI) tenía en las propiedades reológicas,
sensoriales de textura y microestructurales de purés de patata recién elaborados y tras
sufrir un proceso de congelación y descongelación.
Para la evaluación reológica de los purés de patata enriquecidos con estas
mezclas, se elaboraron los productos con diez ratios diferentes de SPI:INL (0:6; 6:0;
3:3; 1,5:4,5; 4,5:1,5; 3:4,5; 4,5:3; 6:6; 6:1,5; 1,5:6), y se compararon con una muestra
control sin ingredientes añadidos (0:0), estudiándose el comportamiento reológico de las
muestras recién elaboradas y tras un ciclo de congelación y descongelación. Con
respecto al efecto de este ciclo de congelación y descongelación, los resultados
mostraron que en todos los casos el índice de consistencia derivado del modelo
reológico de Ostwald-De Waele y la viscosidad aparente en 50 s-1
dentro de la zona
pseudoplástica fueron más elevados en las muestras congeladas y descongeladas, lo que
se atribuye a un posible proceso de retrogradación de la amilopectina que no es evitado
ni minimizado por la adición de goma xantana, la cual sí evita la retrogradación de la
amilosa y la sinéresis. Además, la presencia de ambos ingredientes funcionales en las
DISCUSIÓN integradora
241
muestras congeladas incrementó su consistencia en comparación con aquellas que sólo
tenían inulina o aislado de proteína de soja. El estudio del efecto del ratio SPI:INL
permite establecer que la adición de estas mezclas reduce el índice de consistencia (k)
del producto con respecto a la muestra control elaborada sin estos ingredientes. Por otro
lado, cuando la cantidad de inulina añadida fue del 6%, la adición de aislado de proteína
de soja en cantidades crecientes desde el 1,5% al 6%, ocasionó una disminución de las
tres propiedades reológicas determinadas (índice de consistencia (k), viscosidad
aparente en 50 s-1
(ηapp,50) y del esfuerzo de cizalla de Kokini (σoral). Cuando se añadió
inulina de forma individual, las propiedades reológicas citadas fueron mayores que
cuando se añadió aislado de proteína de soja individualmente. Esto indica que la adición
del aislado en una concentración mayor o igual a 4,5% causa que el sistema sea
relativamente más viscoso y fluido, y menos elástico. El menor ablandamiento causado
por la adición de inulina se atribuye al efecto de exclusión del almidón, lo que conduce
a la formación de agregados que contienen cristales de inulina y que retienen una
elevada cantidad de fase líquida incrementando la fracción de volumen. Ello justificaría
que la adición de inulina refuerce la estructura de las muestras elaboradas sólo con
aislado de proteína de soja.
Por otro lado, se realizó un análisis sensorial de perfil de textura (TPA) de las
muestras elaboradas con los diferentes ratios de SPI:INL, evaluándose seis atributos
sensoriales de textura. Esta evaluación fue realizada por dos paneles diferentes, uno
entrenado compuesto por cuatro miembros (y que realizó los distintos análisis
sensoriales llevados a cabo a lo largo de esta tesis), y uno no entrenado, formado por
veintisiete miembros (n = 27).
El panel entrenado evaluó las mismas muestras que se analizaron reológicamente,
tanto recién elaboradas como después de su procesado. Sin embargo, para la evaluación
DISCUSIÓN integradora
242
sensorial realizada por el panel no entrenado se seleccionaron tan sólo seis muestras
(0:0; 0:6; 3:3; 6:0; 1,5:6; 4,5:3) que fueron previamente sometidas al proceso de
congelación/descongelación. Estos ratios fueron seleccionados al objeto de garantizar
una variación elevada entre las muestras evaluadas por los panelistas no entrenados y,
efectivamente, diferencias muy considerables pudieron apreciarse entre las
microestructuras constitutivas de estas muestras.
El estudio del efecto del ratio SPI:INL en las muestras de puré de patata reveló
que en las muestras con elevadas concentraciones de aislado de proteína de soja, la
presencia de este componente provocó un incremento de la granulosidad visual, del
recubrimiento del paladar y de la fibrosidad, y una disminución de la cremosidad
debido a la presencia de hebras del aislado. Sin embargo, en las muestras con elevadas
cantidades de inulina se produjo el efecto contrario, siendo especialmente notable el
incremento de la sensación de cremosidad percibida. Este hecho se asocia con la
presencia de microcristales de inulina que ocluyen gran cantidad de agua creando una
textura suave y cremosa en los purés recién elaborados. Además, en los purés
congelados y descongelados en microondas, probablemente el agua acumulada en los
microcristales de inulina tiende a difundirse dentro de la matriz del puré, dando lugar a
una estructura más homogénea debido a la reabsorción del agua por la amilosa. Por lo
tanto, previsiblemente la inulina reduce la retrogradación del almidón, facilitando
asimismo la fusión del almidón retrogradado durante la descongelación.
Cuando los jueces entrenados y no entrenados fueron considerados como factores
fijos, es posible evaluar el tipo de diferencias individuales existentes entre los miembros
del panel, sin embargo, las conclusiones no pueden extenderse a la población a la que
pertenecen estos jueces. Los resultados mostraron que los jueces entrenados tuvieron
consistencia y un buen nivel de acuerdo entre ellos en la evaluación de todos los
DISCUSIÓN integradora
243
atributos, excepto en la fibrosidad, atributo para el que sería necesario un entrenamiento
adicional. Sin embargo, cuando los jueces no entrenados se consideraron como efectos
fijos, éstos mostraron falta de concordancia para todos los atributos, evidenciando así
que estos jueces son en sí mismos una importante fuente de variación en las
evaluaciones que realizan. Parte de esa variación puede ser debida al uso diferente que
los jueces hacen de la escala, y otra parte puede atribuirse a diferencias entre panelistas
tales como su desigual sensibilidad, motivación y cultura. Para obtener más
conclusiones relativas a este aspecto, los jueces no entrenados se consideraron también
como factores aleatorios, y los resultados mostraron que cuando la influencia de las
diferencias individuales entre los jueces es eliminada, todos los atributos texturales
fueron significativamente diferentes entre las muestras, e indicando que, pese a todo,
este panel no entrenado no creó la suficiente varianza como para ocultar las diferencias
entre las muestras evaluadas. Además, mientras que para el panel entrenado los
atributos dominantes, en términos de intensidad percibida, fueron la cremosidad y la
consistencia, para el panel no entrenado todos los atributos fueron percibidos de forma
moderadamente intensa, lo que indica que debido al entrenamiento recibido y a la
experiencia adquirida, el panel entrenado utiliza un intervalo más amplio para la
percepción de cada atributo sensorial. Por otra parte, el estudio de correlación entre las
puntuaciones de los atributos sensoriales evaluados por ambos paneles, permitió
observar que sólo las puntuaciones otorgadas a la cremosidad por los dos paneles
estaban correlacionadas. Por tanto, este resultado evidencia que un entrenamiento
mínimo en común del significado de los diferentes descriptores de la textura entre los
miembros de un panel sensorial no entrenado puede permitir obtener resultados más
reproducibles. El estudio de la aceptabilidad general del producto realizado por los
jueces no entrenados, mostró que las muestras con las concentraciones más elevadas de
DISCUSIÓN integradora
244
inulina (1,5:6 y 0:6) tuvieron la aceptabilidad mayor, debido a la suavidad y a la
disminución de la sensación granulosa, ambas percibidas con el incremento de inulina.
La menor granulosidad oral es el resultado de las propiedades de lubricación y
recubrimiento que confieren los cristales de inulina, lo que reduce significativamente la
fibrosidad percibida en la muestra control. Por el contrario, la aceptabilidad general del
producto fue significativamente menor en las muestras enriquecidas con las mayores
concentraciones de aislado de proteína de soja (3:3, 6:0 y 4,5:3).
Por último, se estudió la microestructura de las mismas seis muestras elaboradas
para la evaluación sensorial llevada a cabo por el panel no entrenado. La
microestructura de la muestra control reveló la existencia de una fase continua (matriz
amilosa/amilopectina), mientras que en las muestras que sólo contenían inulina (ratio
0:6) se observaron los cristalitos de inulina dispersos a través de esta matriz formando
un gel fuerte. La pérdida de agua consecuencia de la realización de un ciclo de
congelación y descongelación, ocasionó la formación de una red compacta de cristales
de inulina que se relaciona con una elevada cremosidad y humedad, y con una baja
consistencia sensorial e instrumental. En la muestra con la misma cantidad de ambos
ingredientes funcionales (ratio 3:3), no se observó una estructura de gel correspondiente
al aislado de proteína de soja, probablemente debido al hecho de que no ocurre
gelificación en esta concentración. En las muestras a las que sólo se añadió aislado de
proteína de soja, se observó una red compacta formada por filamentos agregados del
aislado, lo que se asocia a la baja cremosidad y el alto recubrimiento del paladar
percibidos por los jueces en estas muestras. En la muestra 4,5:3 se distingue una red de
filamentos del aislado sin cristales visibles de inulina que, aunque ocultos, tuvieron un
efecto sinérgico en la gelificación del aislado, fortaleciendo las muestras que sólo se
habían enriquecido con el aislado de proteína de soja.
DISCUSIÓN integradora
245
Descripción y cuantificación de los atributos sensoriales de purés de patata
enriquecidos con mezclas de tres ingredientes funcionales mediante paneles con
diferentes grados de entrenamiento. Relación con las propiedades mecánicas.
En este último capítulo de la tesis, se evaluó la capacidad de dos paneles con
distinto grado de entrenamiento para generar atributos relevantes que permitieran
describir purés de patata elaborados con aceite de oliva virgen extra (EVOO), inulina
(INL) y aislado de proteína de soja (SPI), mediante dos metodologías sensoriales
descriptivas novedosas: Flash Profile (FP) y Projective Mapping (PM). Estos dos
métodos fueron realizados por un panel semientrenado (FP) y uno no entrenado (PM), y
sus resultados fueron contrastados con los obtenidos mediante un análisis descriptivo
convencional (QDA) realizado por un panel entrenado. El objetivo de utilizar paneles
con diferentes grados de entrenamiento fue analizar si los jueces semientrenados y no
entrenados podrían generar mapas sensoriales relevantes y similares a aquellos
obtenidos por un panel entrenado, con la ventaja de ahorrar tiempo y esfuerzo en dicho
entrenamiento. Estos análisis se realizaron sobre una muestra de puré de patata (control)
sin ingredientes añadidos y seis muestras elaboradas con los tres ingredientes
mencionados, y que fueron añadidos tanto individualmente como en mezclas binarias
(EVOO, SPI, INL, EVOO+INL, EVOO+SPI y INL+SPI). Sin embargo, estas técnicas
descriptivas rápidas tienen el inconveniente de no permitir un análisis de varianza
convencional, y por este motivo, los resultados obtenidos de cada una de las tres
técnicas descriptivas se analizaron mediante tres tipos de herramientas estadísticas
diferentes: Análisis de Componentes Principales (ACP), Análisis Multifactorial (AMF)
y Análisis Generalizado de Procrustes (AGP).
Los perfiles sensoriales obtenidos a partir de los tres paneles, diferenciaron
claramente todos los purés de aquellos elaborados con aislado de proteína de soja, tanto
DISCUSIÓN integradora
246
añadido individualmente como mezclado con aceite de oliva o inulina (1ª dimensión),
estando relacionados estos últimos principalmente con una alta puntuación otorgada a
los atributos de textura granulosidad visual, firmeza, adhesividad, cohesividad,
fibrosidad y recubrimiento de la boca (por el panel entrenado), arenoso, terroso,
pastoso, recubrimiento del paladar y granuloso (por el panel semientrenado), y
pastoso, adhesivo, adherente y recubrimiento del paladar (por el panel no entrenado).
Además, en los tres paneles las muestras enriquecidas con aislado de proteína de soja,
añadida tanto de forma individual como junto a los otros dos ingredientes funcionales
fueron caracterizadas por tener un olor y sabor rancio, así como sabores y aromas
extraños. El resto de los purés (C, INL, EVOO e INL+EVOO) fueron posicionados a lo
largo de la segunda dimensión y fueron descritos principalmente mediante atributos de
color, aroma y sabor. Los análisis clusters (ACH) realizados sobre los resultados de los
tres paneles, clasificaron las muestras en tres grupos. En el caso de los paneles
semientrenado y no entrenado, las muestras control y aquellas enriquecidas sólo con
inulina quedaron agrupadas juntas, y fueron caracterizadas por ser más cremosas,
acuosas, fáciles de tragar, y con un aroma y sabor natural. Varios panelistas no
entrenados incluso manifestaron una intención elevada de compra hacia el control, lo
que atribuyeron a su excelente aroma y sabor. A su vez, el panel entrenado separó el
puré sin ingredientes funcionales añadidos (control) del resto de purés enriquecidos,
debido a su sabor a patata más intenso. En estos ACH, los grupos o clusters se
separaron como consecuencia de la presencia o ausencia de aislado de proteína de soja
en los productos, en respuesta a las características texturales conferidas por este
ingrediente. Las muestras con aceite de oliva y con mezclas de éste con inulina fueron
caracterizadas por tener un suave olor y sabor a aceite y, a su vez, una textura
igualmente suave.
DISCUSIÓN integradora
247
Los tres espacios sensoriales fueron comparados mediante un análisis
multifactorial (AMF), al objeto de cuantificar la similitud general entre las
configuraciones sensoriales obtenidas para las mismas muestras por los tres paneles.
Los resultados de este análisis, mostraron que las dos nuevas metodologías están en
bastante acuerdo con el QDA, siendo el espacio sensorial generado por el FP más
similar al del QDA que aquél generado por el PM. Asimismo, se estudiaron las
correlaciones existentes entre los atributos generados por los tres paneles, observándose
la existencia de una alta correlación entre los atributos generados por el QDA y el FP.
Por lo tanto, la definición dada por los jueces entrenados a los distintos atributos
sensoriales fue bastante próxima a la percepción que los consumidores semientrenados
tuvieron de los mismos. De hecho, entre los jueces de ambos paneles no se apreciaron
diferencias para ninguno de los atributos equivalentes generados, siendo los más
correlacionados la adhesividad (0,95), la fibrosidad (0,86), la cremosidad (0,95), la
presencia de colores extraños (0,95) y la presencia de sabores extraños (0,89). Estos
resultados sugieren que los panelistas semientrenados, y que no poseen experiencia en
la evaluación sensorial de purés de patata, fueron capaces de evaluarlos de una manera
muy similar a como lo hicieron los panelistas entrenados. Sin embargo, cuando se
establecieron las correlaciones entre los atributos generados por los consumidores no
entrenados y el panel entrenado, sí que se observó una discrepancia o falta de
correlación entre los atributos firmeza (generado por los jueces entrenados) y firme
(generado por los panelistas no entrenados), así como una alta correlación entre esta
firmeza y el atributo pastoso (generado por los panelistas no entrenados). Por lo tanto,
en este caso, parece que la percepción de firmeza no fue bien descrita por los jueces no
entrenados.
DISCUSIÓN integradora
248
Por último, y asimismo mediante análisis multifactorial (AMF), se compararon los
tres espacios sensoriales de textura obtenidos a partir de las tres técnicas con los datos
derivados de un perfil instrumental de textura. Los resultados mostraron que los
atributos sensoriales de textura del método descriptivo convencional (QDA) estuvieron
más correlacionados con las medidas instrumentales que aquellos de las otras dos
técnicas sensoriales. Esto se justifica, porque los jueces entrenados, lo están de forma
más específica en los parámetros texturales, y por lo tanto, estos jueces tienden a ser
más detallistas respecto de los atributos sensoriales de textura, mientras que prestan una
menor atención a las percepciones sensoriales de sabor y apariencia. Por el contrario,
los jueces semientrenados y no entrenados se centraron más en estos últimos atributos
sensoriales. La consistencia instrumental derivada del TPA estuvo altamente
correlacionada con los atributos sensoriales recubrimiento de boca y paladar, pastoso,
densidad, consistencia, firmeza, fibrosidad y adhesividad.
El puré elaborado con aislado de proteína de soja e inulina fue la muestra que
obtuvo una correlación más baja entre los atributos sensoriales de textura y las
propiedades instrumentales. Para los paneles semientrenados y de consumidores, la
muestra con una mayor correlación entre medidas sensoriales e instrumentales fue
aquella elaborada con aceite de oliva y aislado de proteína de soja, mientras que para el
panel de jueces entrenados lo fue el puré de patata elaborado con la mezcla de aceite e
inulina.
Capítulo 6
conclusiones

CONCLUSIONES
251
Los resultados obtenidos en la presente Tesis Doctoral permiten extraer las
conclusiones que se enumeran a continuación:
Efecto en la textura de los purés de patata de la adición de aceite de oliva virgen
extra y crioprotectores.
1. La adición de aceite de oliva virgen extra o de crioprotectores al puré de patata,
así como el procesado del mismo, afectaron significativamente las características
físicas, estructurales y sensoriales del puré de patata. Por un lado, el incremento
de la concentración de aceite de oliva originó sistemas menos estructurados y
realzó el color y la luminosidad del puré de patata. Por otra parte, la adición de
kappa-carragenato y goma xantana incrementó la consistencia del producto, como
consecuencia del efecto de exclusión de los gránulos de almidón hinchados que
promueve y favorece la gelificación del kappa-carragenato.
2. La adición de aceite de oliva en concentraciones crecientes mejora la calidad
sensorial del puré de patata, reduciendo las percepciones de granulosidad,
densidad, cohesividad, adhesividad y fibrosidad, e incrementando las de
homogeneidad, facilidad de deglución y recubrimiento del paladar conferido por
el producto.
3. Las medidas objetivas instrumentales son capaces de diferenciar las mismas
variaciones o modificaciones en los atributos mecánicos de la textura de los purés
apreciadas por los panelistas, mientras que por el contrario las variaciones o
diferencias en los atributos geométricos de la textura del producto, tales como la
granulosidad, la homogeneidad y la fibrosidad son más complejas, y precisan de
una información de carácter estructural que facilite su interpretación.
CONCLUSIONES
252
4. Otros atributos, como la cremosidad, la sensación grasa o la suavidad, que
dependen principalmente de la microestructura y de las propiedades superficiales
del producto, contribuyen decisivamente a la sensación de textura así como a la
aceptabilidad total de los purés de patata enriquecidos con aceite de oliva virgen
extra, especialmente cuando se añade en una concentración de 50g/kg.
5. Por lo tanto, es posible elaborar un puré de patata enriquecido con aceite de oliva
virgen extra, proporcionando al consumidor un producto con un perfil nutritivo
mejorado. Además, por un lado, compensa algunos de los defectos de textura que
provoca la congelación y, por otro, enriquece las características físico-químicas,
funcionales y sensoriales del producto.
Efecto en la textura de los purés de patata de la adición de mezclas de inulina y
aceite de oliva virgen extra.
1. Las propiedades mecánicas de la textura ponen de manifiesto que la adición de
inulina y de aceite de oliva virgen extra a puré de patata, tanto de forma individual
como en sus mezclas, origina un ablandamiento de la matriz rígida de
amilosa/amilopectina del producto, produciéndose asimismo un efecto sinérgico
entre ambos ingredientes funcionales.
2. La elaboración de un puré de patata enriquecido con 15 o 30 g/kg de inulina y 45
g/kg de aceite de oliva virgen extra es muy adecuada para lograr un incremento en
la ingesta diaria tanto de fibra soluble como de ácidos grasos monoinsaturados.
Ambas combinaciones de ingredientes ocasionan una importante modificación en
la composición y estructura del producto, que mejora la percepción sensorial de la
CONCLUSIONES
253
textura del mismo con una granulosidad significativamente inferior a la del puré
de patata control, a la vez que una aceptabilidad total superior.
3. El perfil sensorial de textura del puré de patata recién elaborado enriquecido con
la misma cantidad de inulina y aceite de oliva virgen extra en la proporción 30:30
es muy similar al del puré control elaborado sin ingredientes funcionales
añadidos. Este resultado es de gran utilidad práctica, dado que la industria
alimentaria tiene un interés específico en la formulación de nuevos productos sin
cambios en su aceptación con respecto al producto original. Por el contrario, la
realización de un ciclo de congelación y descongelación, especialmente en el caso
de que no se incorporen crioprotectores, lleva asociado que el perfil de textura del
puré de patata enriquecido con mezclas de inulina y aceite de oliva difiera
significativamente del correspondiente al del puré de patata no enriquecido,
disminuyendo su calidad sensorial.
4. Los crioprotectores kappa-carragenato y goma xantana enmascaran los efectos de
añadir diferentes mezclas de inulina y aceite de oliva sobre el perfil de textura de
las muestras de puré de patata, lo que se atribuye a la capacidad de retención de
agua conferida por la goma xantana.
5. Los análisis de componentes principales realizados individualmente sobre los
datos de las muestras recién elaboradas, congeladas y descongeladas, sin
crioprotectores añadidos, así como sobre el conjunto total de todos los datos,
revelaron que la primera componente representó un índice del comportamiento
mecánico y de la humedad del producto, mientras que cuando se realizó el análisis
sobre los datos de las muestras elaboradas con crioprotectores de forma separada,
la primera componente principal constituyó un índice de la aspereza/suavidad de
CONCLUSIONES
254
las muestras como respuesta a la inferior retrogradación que experimenta el
almidón en presencia de los hidrocoloides kappa-carragenato y goma xantana.
6. Se ha observado que existía un nivel aceptable de concordancia entre las
percepciones sensoriales de textura de los panelistas que desarrollaron y evaluaron
el perfil de textura. No obstante, los resultados se podrían optimizar realizando un
entrenamiento más exhaustivo en el uso de las parejas de atributos sensoriales
pegajosidad y adhesividad, así como en la facilidad de deglución y el
recubrimiento del paladar.
7. Asimismo, se observó un solapamiento entre las puntuaciones otorgadas a las
percepciones de las dos humedades, de la pegajosidad y la adhesividad, así como
de las dos fibrosidades del producto, todo ello a pesar de que estos atributos
sensoriales eran percibidos en distintas fases del proceso de masticación. Este
resultado sugirió la posibilidad de llevar a cabo una mejora del perfil sensorial de
textura desarrollado para el puré de patata, a través de una reselección de algunos
de los atributos sensoriales que fueron consensuados originalmente.
Efecto de la adición de mezclas de aislado de proteína de soja e inulina y del
procesado en la textura de purés de patata. Aplicación de una herramienta
estadística para validar las diferencias del producto y los rendimientos de un panel
entrenado y otro no entrenado.
1. A pesar de que un panel no entrenado es capaz de diferenciar las muestras de puré
de patata elaboradas con diferentes cantidades de mezclas de aislado de proteína
de soja e inulina, sólo para el atributo sensorial cremosidad se identificó una
correlación lineal elevada entre las evaluaciones de este panel y las
correspondientes a un panel entrenado. La percepción de consistencia de los
CONCLUSIONES
255
panelistas entrenados estuvo bien relacionada con los parámetros reológicos que
identifican el flujo del producto enriquecido con estas mezclas, reflejando estos
últimos la no existencia de interacciones entre la matriz rígida de
amilosa/amilopectina y las partículas de soja e inulina dispersas en esta matriz.
Por lo tanto, las propiedades de flujo del producto podrían considerarse en este
caso como estímulos responsables de la consistencia percibida sensorialmente.
Sin embargo, la consistencia no representó por sí sola la textura del producto, y
los otros cinco atributos del perfil de textura (granulosidad visual, cremosidad,
humedad, fibrosidad y recubrimiento), que también contribuyeron decisivamente
a la textura del puré, no pueden relacionarse con una sola propiedad física, si no
que dependen fundamentalmente de la microestructura del producto.
2. Así, la presencia de hebras de aislado de proteína de soja fue un factor dominante
en la percepción de los atributos geométricos de la textura percibidos antes y
durante la ingestión del puré de patata (granulosidad visual y fibrosidad), así
como en la del atributo residual recubrimiento en boca, mientras que la presencia
de cristalitos de inulina fue la característica principal que contribuyó a la
cremosidad del producto. Este último atributo fue percibido con mayor intensidad
cuando el puré de patata se formuló añadiendo una concentración pequeña de
aislado de proteína de soja (1,5%) junto con una concentración de inulina superior
al 3%.
3. El comportamiento más fluido que se observó en las muestras enriquecidas con
aislado de proteína de soja en concentraciones mayores o iguales a 4,5%, refleja
que el gel de aislado de proteína de soja formado en la matriz del producto tenía
baja capacidad de retener agua y, por lo tanto, de reducir la sinéresis del mismo.
CONCLUSIONES
256
4. Las características microestructurales y las propiedades superficiales del producto
son evidentemente necesarias para comprender la parte no mecánica de la textura
percibida en los purés de patata elaborados con inulina y aislado de proteína de
soja, reflejando la importancia de que se estudien en el puré de patata las
relaciones composición-estructura-propiedades físicas-propiedades sensoriales.
Descripción y cuantificación de los atributos sensoriales de purés de patata
enriquecidos con mezclas de tres ingredientes funcionales mediante paneles con
diferentes grados de entrenamiento. Relación con las propiedades mecánicas.
1. El posicionamiento relativo de las muestras de puré de patata y los atributos
sensoriales generados mediante análisis descriptivo cuantitativo, flash profile y
projective mapping, evidenció que los espacios sensoriales obtenidos por las tres
técnicas podían considerarse lo suficientemente similares, aunque un análisis más
exhaustivo deja entrever interesantes diferencias entre ellos. Los resultados
mostraron que existe una oposición entre muestras a lo largo de la primera
dimensión, y que fue dependiente de la presencia o ausencia de aislado de
proteína de soja en la formulación; así las muestras elaboradas con soja, añadida
tanto de forma individual como mezclada con aceite o inulina, se separaron del
resto como consecuencia de los atributos sensoriales de textura percibidos en los
purés. Sin embargo, el posicionamiento de las muestras de puré a lo largo de la
segunda dimensión fue más dependiente de otras percepciones sensoriales, tales
como el color, su aroma y el sabor.
2. Asimismo, con las tres metodologías sensoriales utilizadas, los análisis de clusters
agruparon las muestras de puré en tres grupos distintos. Sin embargo, mientras
que en el análisis descriptivo cuantitativo el cluster 1 sólo agrupó a la muestra
CONCLUSIONES
257
control sin ingredientes funcionales añadidos, en las dos metodologías más
innovadoras la muestra control fue agrupada junto con aquella elaborada con
inulina, en respuesta a las distintas percepciones sensoriales relacionadas con la
apariencia y el sabor.
3. A su vez, los resultados obtenidos mediante análisis multifactorial mostraron que
existe una adecuada correlación entre el análisis descriptivo cuantitativo (QDA) y
las dos nuevas metodologías ensayadas; no obstante, el espacio sensorial derivado
del flash profile fue más similar al del QDA que el espacio sensorial derivado
utilizando la metodología projective mapping.
4. Los atributos sensoriales de textura evaluados por los paneles entrenado (QDA) y
semientrenado (flash profile) mostraron elevadas correlaciones, indicando que
aunque los jueces semientrenados no tenían experiencia en la descripción de la
textura del puré de patata, eran capaces de evaluarla y percibirla de forma similar
a como lo hicieron los jueces entrenados. Sin embargo, la percepción sensorial de
la firmeza de los jueces no entrenados (projective mapping), no estaba en
correlacionada con la percepción que tuvo el panel entrenado de este atributo de la
textura. Esto sugiere la necesidad de investigar las percepciones de los
consumidores para favorecer la optimización de la calidad sensorial de nuevos
productos.
5. Del mismo modo, los parámetros instrumentales de textura mostraron una
correlación más baja con las percepciones sensoriales de la textura generadas a
través del projective mapping. Este resultado evidencia que se desconoce tanto el
significado real de los atributos de textura generados por los jueces
semientrenados y no entrenados, así como la forma en la que son medidos, siendo
CONCLUSIONES
258
por lo tanto interesante y aconsejable obtener información y entender cómo
perciben y describen los consumidores las diferencias entre los purés de patata.
6. Finalmente, se observaron diferencias en los atributos organolépticos utilizados
por los tres paneles para la descripción de las diferencias entre muestras de puré.
La distribución de atributos de acuerdo al empleo de los diferentes sentidos fue
globalmente bastante similar para las dos nuevas metodologías. Sin embargo, los
jueces entrenados generaron un porcentaje superior de atributos sensoriales de
textura que de apariencia y sabor, y no generaron atributos asociados con el olor.
Por el contrario, los atributos de textura no fueron tan relevantes para los
consumidores, quienes prestaron mayor atención a las percepciones sensoriales
del aroma y la apariencia.