Embed Size (px)
Citation preview
UNIVERSIDAD NACIONAL DE INGENIERÍA FACULTAD DE INGENIERÍA CIVIL
EFECTO DE LA UTILIZACIÓN DE LA CASCARILLA DE ARROZ Y ALMIDÓN COMO LIGANTE EN LA RESISTENCIA DE PANELES
AGLOMERADOS DE USO EN LA CONSTRUCCIÓN
TESIS
PARA OPTAR EL GRADO DE MAESTRO EN TECNOLOGÍA DE LA CONSTRUCCIÓN
ELABORADO POR:
LIZBETH CASAS SANDOVAL
ASESOR:
MSc. ANA TORRE CARRILLO
LIMA - PERÚ 2015
“EFECTO DE LA UTILIZACIÓN DE LA CASCARILLA DE ARROZ Y ALMIDÓN COMO LIGANTE EN LA RESISTENCIA DE PANELES AGLOMERADOS DE USO
EN LA CONSTRUCCIÓN”
Ing. Lizbeth Casas Sandoval
Presentado a la Unidad de Posgrado de la Facultad de Ingeniería Civil en cumplimiento parcial de los requerimientos para el grado de:
MAESTRO EN TECNOLOGÍA DE LA CONSTRUCCIÓN DE LA
UNIVERSIDAD NACIONAL DE INGENIERÍA
2015
Autor : Ing. Lizbeth Casas Sandoval
Recomendado : Ing. MSc. Ana Torre Carrillo Asesor de la Tesis Aceptado por : Dr. Ing. Luis Mosquera Leiva Jefe de la Unidad de Posgrado @ 2015; Universidad Nacional de Ingeniería, todos los derechos reservados ó el autor autoriza a la UNI-FIC a reproducir la tesis en su totalidad o en partes.
UNIVERSIDAD NACIONAL DE INGENIERIA FACULTAD DE INGENIERÍA CIVIL UNIDAD DE POSGRADO
TESIS: “EFECTO DE LA UTILIZACIÓN DE LA CASCARILLA DE ARROZ Y ALMIDÓN COMO LIGANTE EN LA RESISTENCIA DE PANELES AGLOMERADOS DE USO EN LA CONSTRUCCIÓN” ING. LIZBETH CASAS SANDOVAL iii
DEDICATORIA
A mis hijos Leonardo Gabriel, Frida Sophía y Rodrigo Alessandro, porque su llegada cambió mi existencia, porque en sus sonrisas encuentro paz y porque son el motor que me impulsa a ser mejor persona día a día.
A mi esposo, por su apoyo incondicional, por compartir mis sueños y ser partícipe en la consecución de mis objetivos.
A mis padres, Marisol y Luis, porque creyeron en mí y me dieron su apoyo y ejemplo en todo momento.
A mis amigos y familiares, porque con sus palabras de aliento, contribuyeron a la culminación del presente trabajo.
Lizbeth
DEDICATORIA
UNIVERSIDAD NACIONAL DE INGENIERIA FACULTAD DE INGENIERÍA CIVIL UNIDAD DE POSGRADO
TESIS: “EFECTO DE LA UTILIZACIÓN DE LA CASCARILLA DE ARROZ Y ALMIDÓN COMO LIGANTE EN LA RESISTENCIA DE PANELES AGLOMERADOS DE USO EN LA CONSTRUCCIÓN” ING. LIZBETH CASAS SANDOVAL iv
AGRADECIMIENTO
Agradezco primeramente a Dios, por acompañarme e iluminar mi camino, por darme
fortaleza, paciencia y por permitir que pueda llegar a cumplir mis metas.
Mi inmensa gratitud a mi asesora, la Ing. MSc. Ana Torre Carillo, por su incondicional
apoyo durante todo el desarrollo de esta investigación.
A mi esposo y mi familia, por sus valiosos aportes e inmensurable ayuda durante este
tiempo.
A mis compañeros de trabajo por interesarse en mis sueños y por su valiosas
contribuciones en el desarrollo del estudio.
A mis amigos con quienes compartimos fructíferas jornadas de estudio, amistad e
increíbles momentos que perdurarán por siempre.
AGRADECIMIENTO
UNIVERSIDAD NACIONAL DE INGENIERIA FACULTAD DE INGENIERÍA CIVIL UNIDAD DE POSGRADO
TESIS: “EFECTO DE LA UTILIZACIÓN DE LA CASCARILLA DE ARROZ Y ALMIDÓN COMO LIGANTE EN LA RESISTENCIA DE PANELES AGLOMERADOS DE USO EN LA CONSTRUCCIÓN” ING. LIZBETH CASAS SANDOVAL v
ÍNDICE GENERAL
Pág.
Dedicatoria iii Agradecimiento iv Índice General v Lista de Figuras ix Lista de Fotos xi Lista de Tablas xii Lista de Símbolos y de siglas xiv RESUMEN xv ABSTRACT xvi INTRODUCCIÓN xvii CAPÍTULO I: GENERALIDADES 1.1. ESTADO SITUACIONAL DE LA CASCARILLA 01 1.1.1. Cultivo de arroz en el Perú 02 1.1.2. Cultivo de arroz en la región San Martín 02 1.1.3. Volumen de producción y Rendimientos 03 1.1.4. Volúmenes de cascarilla de arroz 03 1.1.5. Problemática ambiental 04 1.2. FABRICACIÓN DE PANELES AGLOMERADOS 04 1.2.1. Reseña histórica sobre los paneles aglomerados 04 1.2.2. Tipos de paneles aglomerados 05 1.2.3. Aplicaciones y usos en la construcción 08 1.2.4. Requisitos generales para la fabricación de paneles 09 1.2.5. Valores Requeridos 09 1.3. MERCADO DE PANELES AGLOMERADOS EN EL PERÚ 13 CAPÍTULO II: MARCO TEÓRICO 2.1. MARCO TEÓRICO 14
2.1.1. Resistencia a la flexión 14 2.1.2. Módulo de elasticidad en flexión 18 2.1.3. Cohesión interna o tracción perpendicular a las
caras 20 2.1.4. Resistencia al arranque de superficie 21 2.1.5. Densidad de la muestra 21 2.1.6. Contenido de Humedad 22 2.1.7. Absorción y cambios dimensionales 22
ÍNDICE
UNIVERSIDAD NACIONAL DE INGENIERIA FACULTAD DE INGENIERÍA CIVIL UNIDAD DE POSGRADO
TESIS: “EFECTO DE LA UTILIZACIÓN DE LA CASCARILLA DE ARROZ Y ALMIDÓN COMO LIGANTE EN LA RESISTENCIA DE PANELES AGLOMERADOS DE USO EN LA CONSTRUCCIÓN” ING. LIZBETH CASAS SANDOVAL vi
CAPÍTULO III: DESARROLLO DEL ESTUDIO
3.1. MATERIALES 23 3.1.1. Cascarilla de arroz 23 3.1.2. Almidón 28 3.1.3. Agua 28
3.2. FABRICACIÓN DE LOS PANELES 29 3.2.1. Metodología de Trabajo 29 3.2.2. Selección de la cascarilla 33 3.2.3. Secado 33 3.2.4. Encolado 34 3.2.5. Prensado 36
3.3. MÉTODOS DE ENSAYO 37 3.3.1. Dimensiones de los tableros 37 3.3.2. Obtención de probetas 38 3.3.3. Determinación de propiedades físicas 40 3.3.3.1. Densidad normal del tablero 40 3.3.3.2. Perfil de densidad 41 3.3.3.3. Determinación del contenido de Humedad en
equilibrio 42 3.3.3.4. Absorción 43 3.3.3.5. Cambios dimensionales 44 3.3.4. Determinación de propiedades mecánicas 44 3.3.4.1. Determinación de la Resistencia a la Flexión y
del Módulo de Elasticidad en Flexión (UNE – EN 310, 1993) 44
3.3.4.2. Determinación de la resistencia a la tracción perpendicular a las caras del tablero (UNE – EN 310, 1993) 52
3.3.4.3. Determinación de la resistencia al arranque de la superficie de los tableros (UNE – EN 311, 2002) 57
CAPÍTULO IV: RESULTADOS Y ANÁLISIS
4.1. Dimensiones de los tableros 63 4.2. Propiedades físicas 64 4.2.1. Densidad normal 64 4.2.2. Perfil de densidad 66 4.2.3. Contenido de humedad 68 4.2.4. Absorción de humedad 69 4.2.5. Hinchamiento en espesor 70 4.3. Propiedades físicas 71 4.3.1. Flexión estática 71 4.3.2. Tracción perpendicular a las caras 80 4.3.3. Resistencia al arranque de la superficie 86
ÍNDICE
UNIVERSIDAD NACIONAL DE INGENIERIA FACULTAD DE INGENIERÍA CIVIL UNIDAD DE POSGRADO
TESIS: “EFECTO DE LA UTILIZACIÓN DE LA CASCARILLA DE ARROZ Y ALMIDÓN COMO LIGANTE EN LA RESISTENCIA DE PANELES AGLOMERADOS DE USO EN LA CONSTRUCCIÓN” ING. LIZBETH CASAS SANDOVAL vii
CONCLUSIONES Y RECOMENDACIONES Conclusiones 88 Recomendaciones 89
REFERENCIAS BIBLIOGRÁFICAS
Referencias Bibliográficas 90
ANEXOS
Anexo N° 01 : Resultados del Ensayo de Flexión – Universidad Nacional de Ingeniería 93
Anexo N° 02 : Resultados del Ensayo de Flexión (Carga – Deformación) – Universidad Nacional de Ingeniería 94
Anexo N° 03 : Resultados del Ensayo de Tracción Perpendicular a las Caras – Universidad Nacional de Ingeniería 95
Anexo N° 04 : Resultados del Ensayo de Resistencia al Arranque de la Superficie – Universidad Nacional de Ingeniería 96
Anexo N° 05 : Ensayos en Laboratorio de Suelos – Universidad Nacional de San Martín, M01-E01-01 97
Anexo N° 06 : Ensayos en Laboratorio de Suelos – Universidad Nacional de San Martín, M01-E01-02 98
Anexo N° 07 : Ensayos en Laboratorio de Suelos – Universidad Nacional de San Martín, M01-E01-03 99
Anexo N° 08 : Ensayos en Laboratorio de Suelos – Universidad Nacional de San Martín, M01-E02-01 100
Anexo N° 09 : Ensayos en Laboratorio de Suelos – Universidad Nacional de San Martín, M01-E02-02 101
Anexo N° 10 : Ensayos en Laboratorio de Suelos – Universidad Nacional de San Martín, M01-E02-03 102
Anexo N° 11 : Resultados – Medición de Espesor en Probetas – Universidad Nacional de San Martín 103
Anexo N° 12 : Norma ASTM D 1037 - 91 Methods of test for building fiberboars evaluating properties. Philadelphia, EE.UU. (6):81-100 104
Anexo N° 13 : Norma Europea UNE - EN 309. Tableros de Partículas, Definición y clasificación 114
Anexo N° 14 : Norma Europea UNE - EN 310. Determinación de Módulo de Elasticidad en Flexión y de Resistencia a la Flexión 122
Anexo N° 15 : Norma Europea UNE - EN 311. Arranque de la superficie de los tableros 132
Anexo N° 16 : Norma Europea UNE - EN 312. Tableros de partículas, Especificaciones 142
Anexo N° 17 : Norma Europea UNE - EN 317. Determinación de la Hinchazón en Espesor después de Inmersión en Agua 163
Anexo N° 18 : Norma Europea UNE - EN 319. Determinación de la Resistencia a la Tracción Perpendicular a
ÍNDICE
UNIVERSIDAD NACIONAL DE INGENIERIA FACULTAD DE INGENIERÍA CIVIL UNIDAD DE POSGRADO
TESIS: “EFECTO DE LA UTILIZACIÓN DE LA CASCARILLA DE ARROZ Y ALMIDÓN COMO LIGANTE EN LA RESISTENCIA DE PANELES AGLOMERADOS DE USO EN LA CONSTRUCCIÓN” ING. LIZBETH CASAS SANDOVAL viii
las Caras del Tablero 171 Anexo N° 19 : Norma Europea UNE - EN 322. Determinación
del Contenido de Humedad 180 Anexo N° 20 : Matriz de Consistencia 187
ÍNDICE
UNIVERSIDAD NACIONAL DE INGENIERIA FACULTAD DE INGENIERÍA CIVIL UNIDAD DE POSGRADO
TESIS: “EFECTO DE LA UTILIZACIÓN DE LA CASCARILLA DE ARROZ Y ALMIDÓN COMO LIGANTE EN LA RESISTENCIA DE PANELES AGLOMERADOS DE USO EN LA CONSTRUCCIÓN” ING. LIZBETH CASAS SANDOVAL ix
LISTA DE FIGURAS
Figura N° Pág.
CAPÍTULO I
1.1. Producción de cascarilla de arroz en la región San Martín 04
CAPÍTULO II
2.1. Probeta solicitada con una fuerza central, con los diagramas de fuerza cortante y momento flector respectivos 14
2.2. Elemento de sección rectangular sometido a flexión 15 2.3. Plano neutro y distribución de esfuerzos 15 2.4. Modelo matemático del ensayo a flexión como viga biapoyada 16 2.5. Curva de carga – deformación en la zona de deformación elástica 19 2.6. Diagrama del Ensayo de Tracción 20
CAPÍTULO III
3.1 Diseño de la muestra 29 3.2 Dimensiones para la fabricación del molde de acero 32 3.3 Diagrama de procesos de fabricación de paneles 32 3.4 Ingredientes para la fabricación del aglomerante 35 3.5 Dimensiones del panel fabricado 37 3.6 Esquema de corte de las muestras – Espesor 01 38 3.7 Esquema de corte de las muestras – Espesor 02 39 3.8 Punto de medida – Ensayo de Densidad Normal 41 3.9 Esquema de ensayo de flexión estática 45 3.10 Dimensiones de la probeta – Ensayo de Flexión 48 3.11 Ejemplos de dispositivos para la determinación de la resistencia a la
tracción perpendicular 54 3.12 Hongo de acero – Dispositivo para el ensayo de resistencia al
arranque de la superficie 58 3.13 Cuadro de centrado - Dispositivo para el ensayo de resistencia al
arranque de la superficie 58 3.14 Dispositivo Cardan - Ensayo de resistencia al arranque de la
superficie 59
CAPÍTULO IV
4.1 Espesores promedio de las muestras o tableros 63 4.2 Densidad Normal de los tableros E-01 (12.5mm) 64 4.3 Densidad Normal de los tableros E-02 (19mm) 65 4.4 Perfil de Densidad de las muestras, E-01 66 4.5 Perfil de Densidad de las muestras, E-02 67 4.6 Contenido de humedad (%) en las muestras 68
LISTA DE FIGURAS
UNIVERSIDAD NACIONAL DE INGENIERIA FACULTAD DE INGENIERÍA CIVIL UNIDAD DE POSGRADO
TESIS: “EFECTO DE LA UTILIZACIÓN DE LA CASCARILLA DE ARROZ Y ALMIDÓN COMO LIGANTE EN LA RESISTENCIA DE PANELES AGLOMERADOS DE USO EN LA CONSTRUCCIÓN” ING. LIZBETH CASAS SANDOVAL x
4.7 Absorción de humedad de los tableros 69 4.8 Tendencia de la resistencia a la flexión estática (MOR – E-01) 73 4.9 Tendencia de la resistencia a la flexión estática (MOR – E-02) 76 4.10 Curvas de Carga – Deformación a partir de las mediciones obtenidas
durante el ensayo. 79 4.11 Resultados de la Elasticidad promedio en flexión estática – M01 79 4.12 Tendencia de la tracción perpendicular al plano para los tableros
tipo E-01 81 4.13 Tendencia de la tracción perpendicular al plano para los tableros
tipo E-01 84
LISTA DE FIGURAS
UNIVERSIDAD NACIONAL DE INGENIERIA FACULTAD DE INGENIERÍA CIVIL UNIDAD DE POSGRADO
TESIS: “EFECTO DE LA UTILIZACIÓN DE LA CASCARILLA DE ARROZ Y ALMIDÓN COMO LIGANTE EN LA RESISTENCIA DE PANELES AGLOMERADOS DE USO EN LA CONSTRUCCIÓN” ING. LIZBETH CASAS SANDOVAL xi
LISTA DE FOTOS
Foto N° Pág.
CAPÍTULO III
3.1 Cascarilla de arroz 24 3.2 Instrumentos utilizados para la fabricación de los paneles 31 3.3 Molde de acero para fabricación de las probetas 31 3.4 Secado de la cascarilla de arroz 33 3.5 Encolado manual de la mezcla 35 3.6 Conformación del colchón en el molde 36 3.7 Prensado de la muestra en el molde 36 3.8 Grupo de paneles 37 3.9 Corte de muestras 40 3.10 Determinación del contenido de humedad 43 3.11 Ensayo de absorción 43 3.12 Hinchamiento a las 24horas 44 3.13 Equipos utilizados para la realización del Ensayo de Flexión 46 3.14 Grupo de Probetas Tipo E-01 47 3.15 Grupo de Probetas Tipo E-02 47 3.16 Distancia entre apoyos para probetas E-01 49 3.17 Distancia entre apoyos para probetas E-02 49 3.18 Cabeza de carga cilíndrica en el centro de la probeta 50 3.19 Aplicación de la carga 50 3.20 Registro de la carga máxima 51 3.21 Vista de la falla en la probeta M1, E02, 02 51 3.22 Máquina de Ensayo Universal 53 3.23 Bloques de madera 54 3.24 Vista del Grupo de Probetas para el Ensayo de Tracción
Perpendicular a las caras 54 3.25 Grupo de Probetas Encoladas 55 3.26 Aplicación de la carga 56 3.27 Medición de la carga 57 3.28 Probeta habilitada – Ensayo de resistencia al arranque de la
Superficie 60 3.29 Probetas habilitadas y adheridas al hongo metálico para el
ensayo de resistencia al arranque 60 3.30 Colocación del Extractómetro 61 3.31 Ensayo de resistencia al arranque de la superficie – Falla en la
Probeta 61
LISTA DE FOTOS
UNIVERSIDAD NACIONAL DE INGENIERIA FACULTAD DE INGENIERÍA CIVIL UNIDAD DE POSGRADO
TESIS: “EFECTO DE LA UTILIZACIÓN DE LA CASCARILLA DE ARROZ Y ALMIDÓN COMO LIGANTE EN LA RESISTENCIA DE PANELES AGLOMERADOS DE USO EN LA CONSTRUCCIÓN” ING. LIZBETH CASAS SANDOVAL xii
LISTA DE TABLAS
Tabla N° Pág.
CAPÍTULO I
1.1 Clasificación de los diferentes tipos de tableros y sus valores correspondientes 06
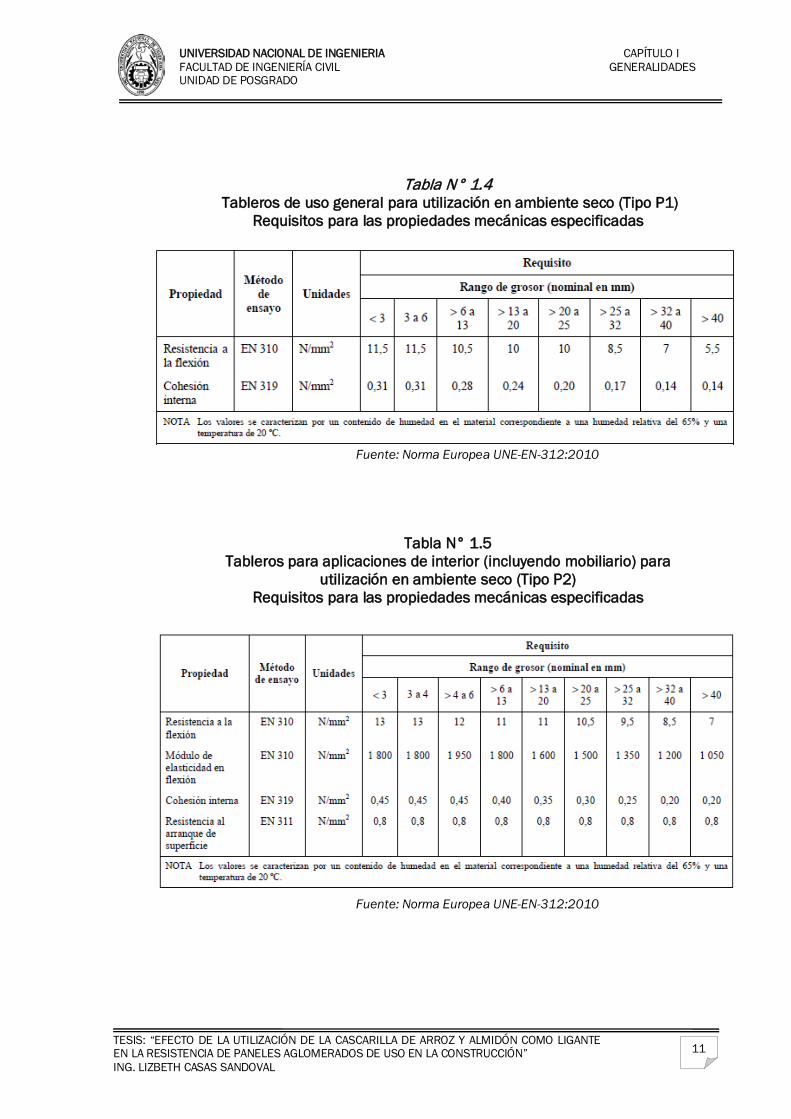
1.2 Clasificación de los tableros de acuerdo a su uso 08 1.3 Especificaciones generales a la salida de fábrica 10 1.4 Tableros de uso general para utilización en ambiente seco (Tipo P1)
Requisitos para las propiedades mecánicas especificadas 11 1.5 Tableros para aplicaciones de interior (incluyendo mobiliario) para
utilización en ambiente seco (Tipo P2) Requisitos para las propiedades mecánicas especificadas 11
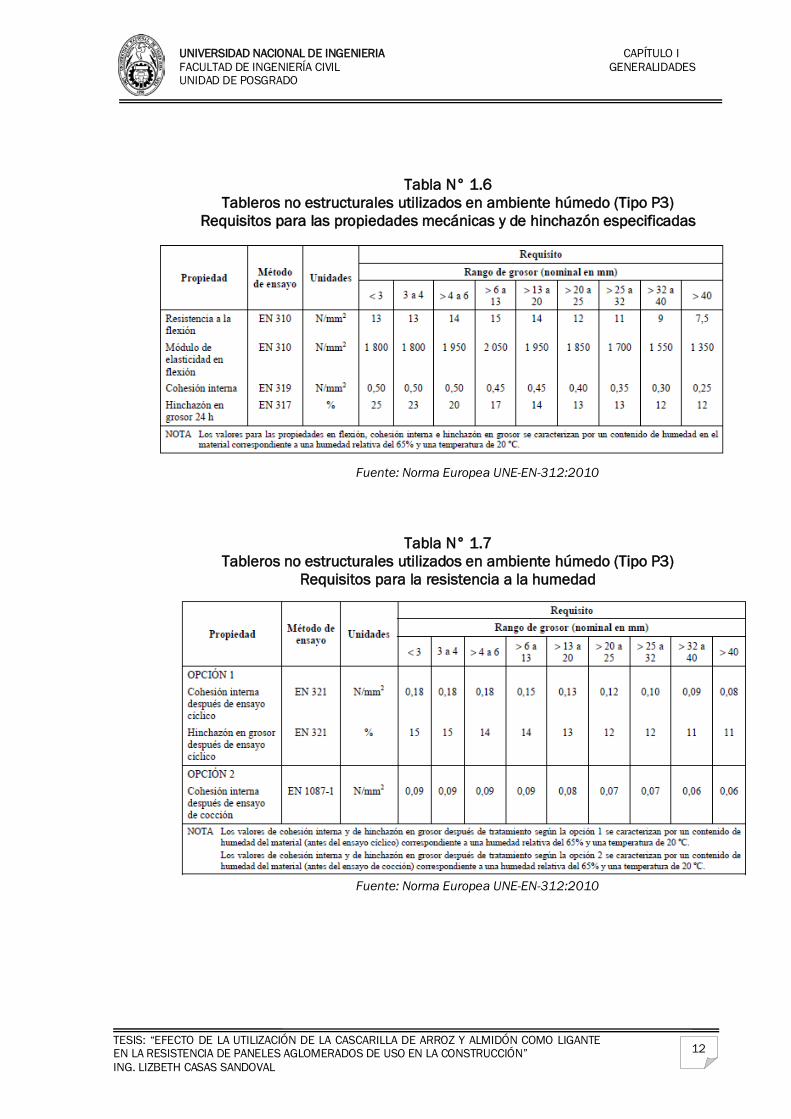
1.6 Tableros no estructurales utilizados en ambiente húmedo (Tipo P3) Requisitos para las propiedades mecánicas y de hinchazón especificadas 12
1.7 Tableros no estructurales utilizados en ambiente húmedo (Tipo P3) Requisitos para la resistencia a la humedad 12
CAPÍTULO III
3.1 Composición química de la cascarilla de arroz a diferentes porcentajes de humedad 25
3.2 Poder calórico inferior de cascarilla de arroz a diferentes porcentajes de humedad 26
3.3 Composición mineral de ceniza en la cascarilla de arroz 26 3.4 Análisis fisicoquímico de la composición de la cascarilla de arroz 27 3.5 Composición Química del Almidón de Yuca 28 3.6 Materiales para la fabricación de los paneles 30 3.7 Masa de componentes del aglomerante 34 3.8 Número de probetas según ensayos de propiedades físicas y
mecánicas 40
CAPÍTULO IV
4.1 Espesores de los tableros o muestras en mm 63 4.2 Densidad Normal Muestras de Espesor tipo E-01 (12.5mm) 64 4.3 Densidad Normal Muestras de Espesor tipo E-02 (19mm) 65 4.4 Resultados Perfil de Densidad – Espesor Tipo E-01 66 4.5 Resultados Perfil de Densidad – Espesor Tipo E-02 67 4.6 Contenido de Humedad en los tableros (12.5mm) 68 4.7 Absorción de Humedad a 2h 69 4.8 Absorción de Humedad a 24h 69 4.9 Análisis de Varianza para la Absorción de humedad de los
tableros (24 horas) 70
LISTA DE TABLAS
UNIVERSIDAD NACIONAL DE INGENIERIA FACULTAD DE INGENIERÍA CIVIL UNIDAD DE POSGRADO
TESIS: “EFECTO DE LA UTILIZACIÓN DE LA CASCARILLA DE ARROZ Y ALMIDÓN COMO LIGANTE EN LA RESISTENCIA DE PANELES AGLOMERADOS DE USO EN LA CONSTRUCCIÓN” ING. LIZBETH CASAS SANDOVAL xiii
4.10 Hinchamiento en espesor en % a 2 horas 71 4.11 Hinchamiento en espesor en % a 24 horas 71 4.12 Módulo de ruptura en flexión estática (MOR), E-01 72 4.13 Pruebas de normalidad 73 4.14 Análisis de Varianza para la prueba de resistencia de flexión estática
de los tableros tipo E-01 74 4.15 Prueba de hipótesis 74 4.16 Módulo de ruptura en flexión estática (MOR), E-02 75 4.17 Pruebas de normalidad 76 4.18 Análisis de Varianza para la prueba de resistencia de flexión estática
de los tableros tipo E-02 77 4.19 Prueba de hipótesis 77 4.20 Resumen - Módulo de ruptura en flexión estática (MOR) 77 4.21 Módulo de elasticidad en flexión estática (MOE) 78 4.22 Prueba de hipótesis 80 4.23 Valores representativos del MOR en Tracción Perpendicular al plano –
Tablero Espesor Tipo E-01 80 4.24 Pruebas de normalidad 81 4.25 Análisis de Varianza para la prueba de tracción perpendicular al plano
de los tableros tipo E-01 82 4.26 Prueba de hipótesis 82 4.27 Valores representativos del MOR en Tracción Perpendicular al plano –
Tablero Espesor Tipo E-02 83 4.28 Pruebas de normalidad 84 4.29 Análisis de Varianza para la prueba de tracción perpendicular al plano
de los tableros tipo E-01 85 4.30 Prueba de hipótesis 85 4.31 Resumen – Valores representativos del MOR en Tracción perpendicular
al plano 86 4.32 Resultados del Ensayo de Resistencia al Arranque de Superficie- SS 86 4.33 Prueba de hipótesis 87
LISTA DE TABLAS
UNIVERSIDAD NACIONAL DE INGENIERIA FACULTAD DE INGENIERÍA CIVIL UNIDAD DE POSGRADO
TESIS: “EFECTO DE LA UTILIZACIÓN DE LA CASCARILLA DE ARROZ Y ALMIDÓN COMO LIGANTE EN LA RESISTENCIA DE PANELES AGLOMERADOS DE USO EN LA CONSTRUCCIÓN” ING. LIZBETH CASAS SANDOVAL xiv
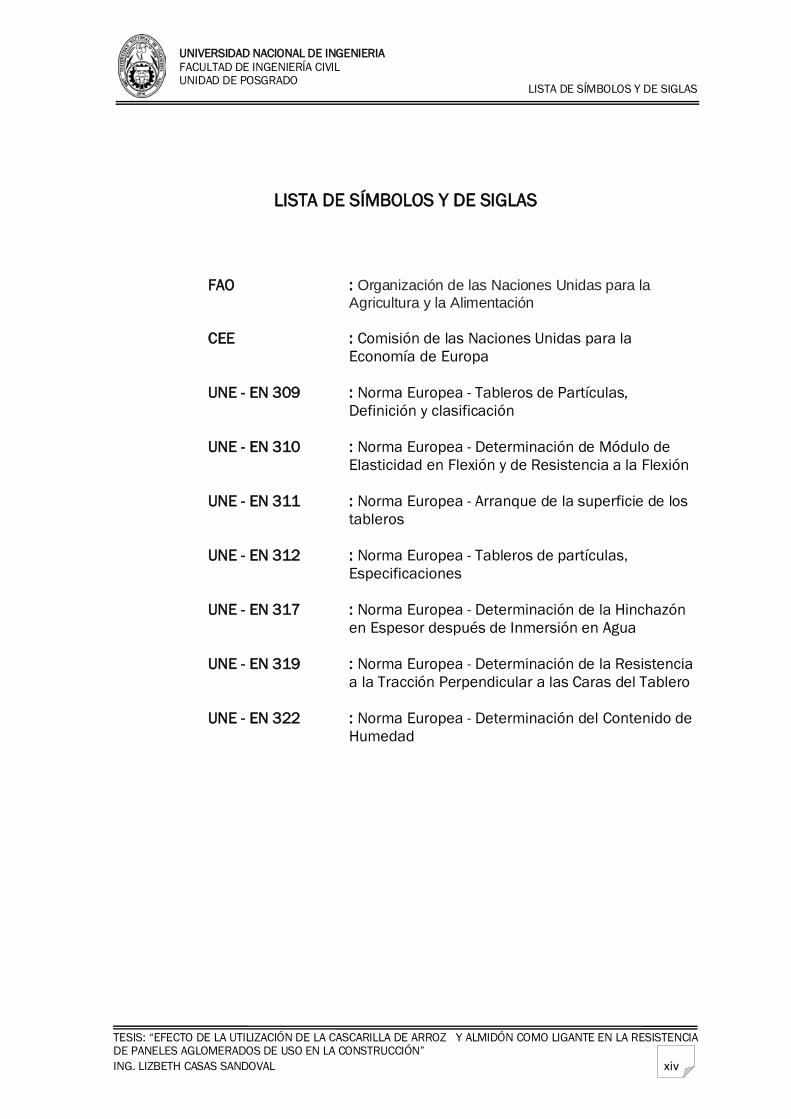
LISTA DE SÍMBOLOS Y DE SIGLAS
FAO : Organización de las Naciones Unidas para la
Agricultura y la Alimentación CEE : Comisión de las Naciones Unidas para la
Economía de Europa UNE - EN 309 : Norma Europea - Tableros de Partículas,
Definición y clasificación UNE - EN 310 : Norma Europea - Determinación de Módulo de
Elasticidad en Flexión y de Resistencia a la Flexión UNE - EN 311 : Norma Europea - Arranque de la superficie de los
tableros UNE - EN 312 : Norma Europea - Tableros de partículas,
Especificaciones UNE - EN 317 : Norma Europea - Determinación de la Hinchazón
en Espesor después de Inmersión en Agua UNE - EN 319 : Norma Europea - Determinación de la Resistencia
a la Tracción Perpendicular a las Caras del Tablero UNE - EN 322 : Norma Europea - Determinación del Contenido de
Humedad
LISTA DE SÍMBOLOS Y DE SIGLAS
UNIVERSIDAD NACIONAL DE INGENIERIA FACULTAD DE INGENIERÍA CIVIL UNIDAD DE POSGRADO
TESIS: “EFECTO DE LA UTILIZACIÓN DE LA CASCARILLA DE ARROZ Y ALMIDÓN COMO LIGANTE EN LA RESISTENCIA DE PANELES AGLOMERADOS DE USO EN LA CONSTRUCCIÓN” ING. LIZBETH CASAS SANDOVAL xv
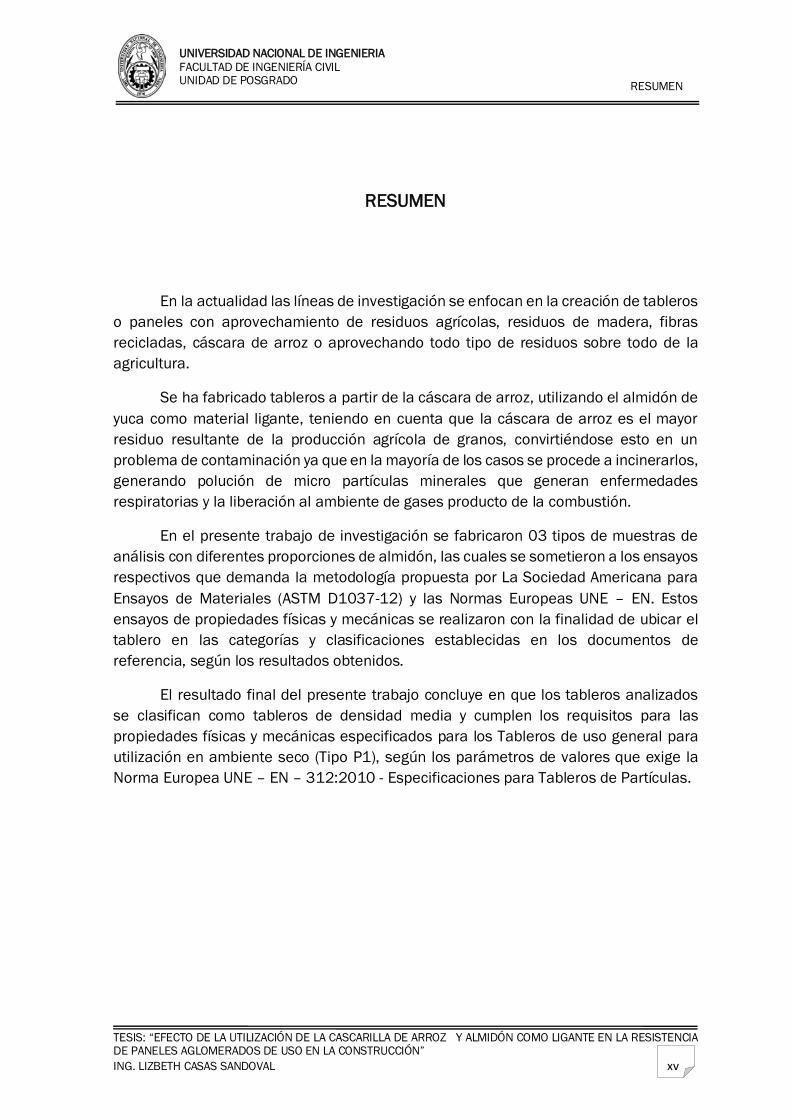
RESUMEN
En la actualidad las líneas de investigación se enfocan en la creación de tableros o paneles con aprovechamiento de residuos agrícolas, residuos de madera, fibras recicladas, cáscara de arroz o aprovechando todo tipo de residuos sobre todo de la agricultura.
Se ha fabricado tableros a partir de la cáscara de arroz, utilizando el almidón de yuca como material ligante, teniendo en cuenta que la cáscara de arroz es el mayor residuo resultante de la producción agrícola de granos, convirtiéndose esto en un problema de contaminación ya que en la mayoría de los casos se procede a incinerarlos, generando polución de micro partículas minerales que generan enfermedades respiratorias y la liberación al ambiente de gases producto de la combustión.
En el presente trabajo de investigación se fabricaron 03 tipos de muestras de análisis con diferentes proporciones de almidón, las cuales se sometieron a los ensayos respectivos que demanda la metodología propuesta por La Sociedad Americana para Ensayos de Materiales (ASTM D1037-12) y las Normas Europeas UNE – EN. Estos ensayos de propiedades físicas y mecánicas se realizaron con la finalidad de ubicar el tablero en las categorías y clasificaciones establecidas en los documentos de referencia, según los resultados obtenidos.
El resultado final del presente trabajo concluye en que los tableros analizados se clasifican como tableros de densidad media y cumplen los requisitos para las propiedades físicas y mecánicas especificados para los Tableros de uso general para utilización en ambiente seco (Tipo P1), según los parámetros de valores que exige la Norma Europea UNE – EN – 312:2010 - Especificaciones para Tableros de Partículas.
RESUMEN
UNIVERSIDAD NACIONAL DE INGENIERIA FACULTAD DE INGENIERÍA CIVIL UNIDAD DE POSGRADO
TESIS: “EFECTO DE LA UTILIZACIÓN DE LA CASCARILLA DE ARROZ Y ALMIDÓN COMO LIGANTE EN LA RESISTENCIA DE PANELES AGLOMERADOS DE USO EN LA CONSTRUCCIÓN” ING. LIZBETH CASAS SANDOVAL xvi
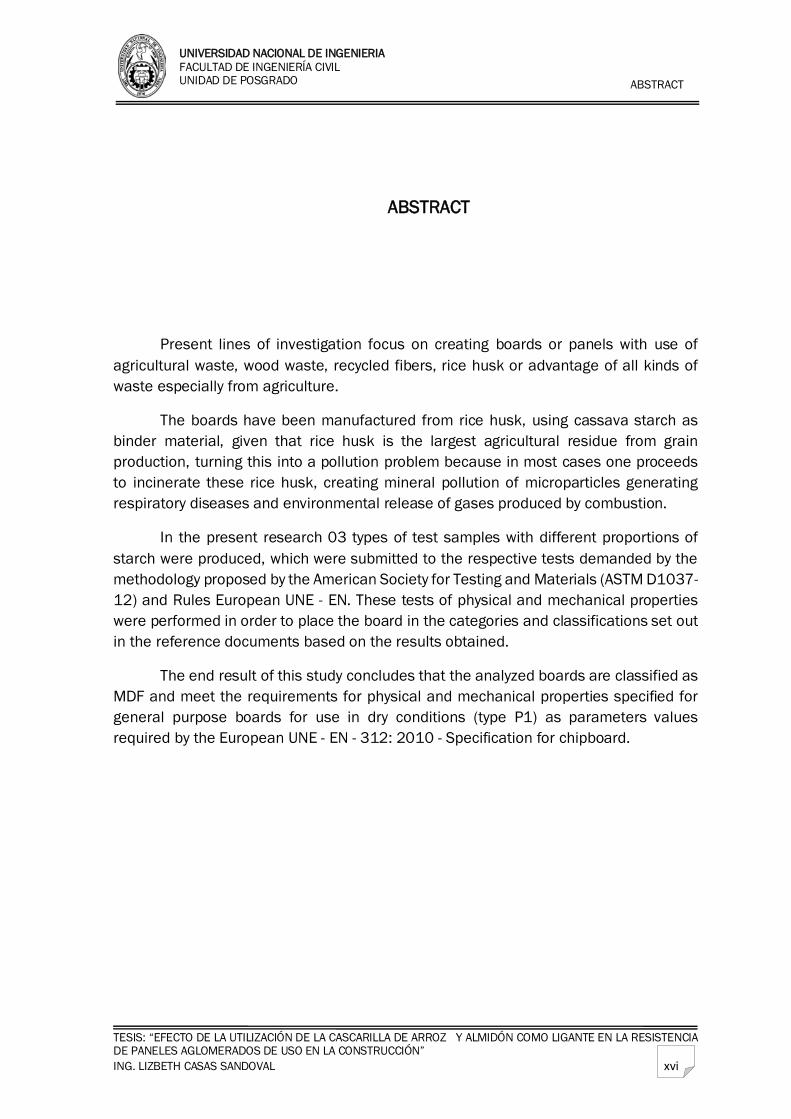
ABSTRACT
Present lines of investigation focus on creating boards or panels with use of agricultural waste, wood waste, recycled fibers, rice husk or advantage of all kinds of waste especially from agriculture.
The boards have been manufactured from rice husk, using cassava starch as binder material, given that rice husk is the largest agricultural residue from grain production, turning this into a pollution problem because in most cases one proceeds to incinerate these rice husk, creating mineral pollution of microparticles generating respiratory diseases and environmental release of gases produced by combustion.
In the present research 03 types of test samples with different proportions of starch were produced, which were submitted to the respective tests demanded by the methodology proposed by the American Society for Testing and Materials (ASTM D1037-12) and Rules European UNE - EN. These tests of physical and mechanical properties were performed in order to place the board in the categories and classifications set out in the reference documents based on the results obtained.
The end result of this study concludes that the analyzed boards are classified as MDF and meet the requirements for physical and mechanical properties specified for general purpose boards for use in dry conditions (type P1) as parameters values required by the European UNE - EN - 312: 2010 - Specification for chipboard.
ABSTRACT
UNIVERSIDAD NACIONAL DE INGENIERIA FACULTAD DE INGENIERÍA CIVIL UNIDAD DE POSGRADO
TESIS: “EFECTO DE LA UTILIZACIÓN DE LA CASCARILLA DE ARROZ Y ALMIDÓN COMO LIGANTE EN LA RESISTENCIA DE PANELES AGLOMERADOS DE USO EN LA CONSTRUCCIÓN” ING. LIZBETH CASAS SANDOVAL xvii
INTRODUCCIÓN
En el Perú, la cáscara de arroz es el mayor residuo resultante de la producción agrícola de granos. Del volumen total producido en el año 2012, que es 2´999 141 tn, (MINAG-DGCA), de las cuales 599 828.20 tn es cascarilla, es decir 20% de lo producido. De cada cinco toneladas de arroz producidas, una tonelada es cáscara y el destino final de tales cantidades de cáscara es el desecho siendo esto un foco de contaminación y un problema tangible al cual las autoridades responsables hasta ahora no han podido encontrarle solución.
La Organización de las Naciones Unidas para la Agricultura y la Alimentación (FAO) y la Comisión de las Naciones Unidas para la Economía de Europa (CEE), celebraron una consulta internacional sobre tableros de fibra y tableros de madera aglomerada en Ginebra, Suiza del 21 de enero al 4 de febrero de 1957 (FAO, 1968), en la cual se adoptaron los siguientes acuerdos y conclusiones internacionales publicadas en su informe definitivo: método de ensayo; diferencias del material; producción, consumo y comercio mundiales; materias primas; proceso y equipo; aspectos económicos de la producción y comercialización; propiedades, aplicaciones y usos; así como la necesidad y urgencia de realizar investigación en todos los países, pugnando por conseguir resultados de sus productos. Manzano, A. (2000).
Becerra (1976), determinó y evaluó las características físicas y mecánicas: usando dos muestras de tableros aglomerados de madera de 50x50 cm con un espesor aproximado de 1.79 cm y un contenido de humedad de 10 %. El método de ensayo que utilizó es el que se especifican en las normas ASTM D 1037 - 91, (1991), los resultados que se obtuvieron superaron los mínimos establecidos para un tablero de densidad media.
Poblete (1979), determinó en tableros de partículas de distintos espesores y densidades, de qué manera se ven afectadas las propiedades físico- mecánicas al incluir aserrín de desecho industrial de aserraderos alternativos de Pinus radiata en la capa media. Los resultados indican que es posible incluir aserrín en la capa media hasta ciertas proporciones sin mermas importantes de estas propiedades, aunque la resistencia a la flexión se disminuye. En cuanto al hinchamiento, se aprecia poca variación comparándose los resultados obtenidos con los valores exigidos por la Norma DIN para estas propiedades. La resistencia a flexión resultó ser limitante para los tableros con alto contenido de aserrín.
La Sociedad Americana para Ensayos de Materiales (ASTM), se preocupó por incluir en sus Normas, los lineamientos adoptados internacionalmente para evaluar las propiedades físicas y mecánicas de los tableros de fibra y madera aglomerada y una norma general para interpretar con precisión los resultados obtenidos (ASTM, 1991).
El Comité Europeo de Normalización (CEN), aprobó el 08 de diciembre del 2004, la Norma Europea EN 309, donde se refiere a los tableros de partículas, su definición y
INTRODUCCIÓN
UNIVERSIDAD NACIONAL DE INGENIERIA FACULTAD DE INGENIERÍA CIVIL UNIDAD DE POSGRADO
TESIS: “EFECTO DE LA UTILIZACIÓN DE LA CASCARILLA DE ARROZ Y ALMIDÓN COMO LIGANTE EN LA RESISTENCIA DE PANELES AGLOMERADOS DE USO EN LA CONSTRUCCIÓN” ING. LIZBETH CASAS SANDOVAL xviii
clasificación; y el 23 de julio del 2010 aprobó la Norma Europea EN 312, en donde se refiere a las especificaciones de los tableros de partículas.
Siendo la actividad arrocera del país, una industria que se encuentra en gran expansión, con un incremento promedio de 5.6% anual (Superficie sembrada nacional en ha, 2011-2012 – MINAG - DGCA), la disposición final de la cáscara de arroz es un problema sumamente importante, cuando no existe un estudio concreto, sobre que se puede hacer con ella. Este problema social se repite en varias zonas del país. Agregándosele a esto el hecho que en la mayoría de los casos se procede a incinerar estos desechos, con lo que se genera polución de micro partículas minerales que generan enfermedades respiratorias y la liberación al ambiente de gases producto de la combustión. Por ello, es conveniente identificar las diferentes aplicaciones y usos de la cascarilla de arroz.
Con el presente estudio de investigación se contribuirá a solucionar un problema ambiental que genera la inadecuada disposición final de los residuos de la industria molinera del arroz.
El presente trabajo de investigación se estructura en cuatro (04) capítulos.
En el Capítulo I, se presentan las generalidades con los alcances de contenidos asociados al tema principal de estudio, desde el estado situacional hasta las especificaciones, clasificación y requerimientos mínimos que deben cumplir los paneles aglomerados según la clasificación a la que aspiran.
En el Capítulo II, se desarrolla el sustento conceptual relacionado con el tema estudiado, bases teóricas y principios matemáticos utilizados en la solución del problema mediante el desarrollo del marco teórico.
El Capítulo III consiste en el desarrollo del estudio de investigación, comprende la descripción de los materiales utilizados en la etapa de experimentación, así como también el proceso de fabricación de los paneles y los métodos de ensayo establecidos para cada una de las pruebas de determinación de propiedades físicas y mecánicas.
En el Capítulo IV se presentan y analizan los resultados de todos los ensayos realizados, se presenta los resultados tabulados con su análisis e interpretación, así como también sus respectivas pruebas de hipótesis que permiten establecer las conclusiones correspondientes.
Finalmente, se expresan las conclusiones relativas al cumplimiento de los objetivos propuestos y de aquellos aspectos considerados de interés, así como las recomendaciones o sugerencias que se podrían implementar.
UNIVERSIDAD NACIONAL DE INGENIERIA CAPÍTULO I FACULTAD DE INGENIERÍA CIVIL GENERALIDADES UNIDAD DE POSGRADO
TESIS: “EFECTO DE LA UTILIZACIÓN DE LA CASCARILLA DE ARROZ Y ALMIDÓN COMO LIGANTE EN LA RESISTENCIA DE PANELES AGLOMERADOS DE USO EN LA CONSTRUCCIÓN” ING. LIZBETH CASAS SANDOVAL
1
CAPITULO I GENERALIDADES
1.1. ESTADO SITUACIONAL DE LA CASCARILLA
Experimentalmente la cascarilla de arroz se ha utilizado en procesos industriales, como combustible o relleno para materiales, cabe aclarar que se aprovecha en su estado natural, es decir como biomasa. Sin embargo también se han realizado estudios acerca de la utilización de la ceniza, como resultado de su combustión, gracias a sus propiedades, siendo utilizada en distintos productos como cemento, caucho o plástico, ya sea como relleno o en su conformación, mejorando las propiedades mecánicas o simplemente para reducir costos.
Como combustibles
Sierra, J. (2009). Indicó que el poder calorífico de la cascarilla de arroz es similar al de la madera y al de otros residuos agrícolas. Sin embargo, su densidad es de aproximadamente 110 kg/m3 y este pequeño valor produce dificultades en su almacenamiento e incrementa el costo de su transporte .En todo caso, anualmente se generan 380,000 TM de cascarilla de arroz y esta cantidad equivale a 120000 TEP (Tonelada equivalente de petróleo) por año de energía que está disponible y es desperdiciada.
Teniendo en cuenta estas potencialidades y la facilidad del acceso de la materia prima es conveniente explorar nuevas tecnologías que hagan posible su aprovechamiento como combustible y fuente de generación termo eléctrica.
Como aislante térmico
Las características aislante térmicas de la cascarilla de arroz puede aprovecharse de distintas maneras, además de representar un material de bajo costo y de fácil acceso por ser la región San Martin el mayor productor de este cereal en el país.
Es por ello que Cadena, C. & Bula, A. (2002) Pusieron énfasis en la necesidad de desarrollar alternativas tecnológicas que permitan la utilización de elementos desechados en procesos productivos para aprovechar su potencial y contribuir a la disminución del impacto ambiental que puedan generar por una inadecuada disposición, surge la oportunidad de aprovechar productos vegetales de desecho que permitan innovar en el área de los materiales de ingeniería, campo en el cual la cascarilla de arroz se perfila como un aislante térmico de alta efectividad, competitividad y de fácil obtención, lo cual contribuye al reemplazo de productos derivados del petróleo.
UNIVERSIDAD NACIONAL DE INGENIERIA CAPÍTULO I FACULTAD DE INGENIERÍA CIVIL GENERALIDADES UNIDAD DE POSGRADO
TESIS: “EFECTO DE LA UTILIZACIÓN DE LA CASCARILLA DE ARROZ Y ALMIDÓN COMO LIGANTE EN LA RESISTENCIA DE PANELES AGLOMERADOS DE USO EN LA CONSTRUCCIÓN” ING. LIZBETH CASAS SANDOVAL
2
Como adición para el concreto
Villegas, C (2012) Tesis para optar el título de Maestro en Tecnología de la Construcción: “Utilización de puzolanas naturales en la elaboración de prefabricados con base cementicia destinados a la construcción de viviendas de bajo costo”, busca una alternativa tecnológica que utiliza puzolanas naturales, especialmente la cascarilla de arroz, muy abundante en el país, para producir morteros y concretos, reduciendo el volumen del cemento, cumpliendo con los parámetros físicos y mecánicos que indican las normas vigentes.
Como panel aglomerado
Con los estudios realizados por Tapia, C., Paredes, C., Simbaña, A. & Leao, A. (2008). Diseñaron un procedimiento que consiste en elaborar un tablero constituido por tres capas con la diferencia de que las partículas de las capas exteriores son más pequeñas que la interior, además esta última tiene un espesor más grande. El agente inorgánico que se usa como aglutinante depende de la utilización final del tablero; por ejemplo, si es para interiores se utiliza urea-formaldehído, mientras que resinas fenol-formaldehído son usadas cuando la humedad es un factor determinante.
1.1.1. Cultivo de arroz en el Perú
Según el Ministerio de agricultura (2013). El arroz Oryza Sativa, es una planta gramínea que pertenece a la familia poaceae, es considerado uno de los principales cultivos de importancia nacional que más aporta al PBI agropecuario y agrícola, generando la mayor cantidad de empleos en el sector. Aportó el 2012 con el 4.85% del PBI agropecuario y con el 8.23% del PBI agrícola del país. Generó alrededor de 44.7 millones de jornales que equivalen a 161,300 empleos anuales permanentes, representando en el ámbito rural una fuerte influencia económica y social. Se estima que la inversión en mano de obra es de 30% de la producción bruta arrocera nacional. La producción de arroz viene creciendo a una tasa promedio de 3.6% en los últimos once años, sustentado por la mayor área cosechada el año 2009 con 404.6 miles de hectáreas. Sin embargo se aprecia una reducción en los años 2010 y 2011, recuperándose a partir del 2012.
1.1.2. Cultivo de arroz en la región San Martin
Según la Dirección Regional de Agricultura San Martin, (2013).La mayor superficie sembrada de arroz en la campaña agrícola 2012-2013, presentan las provincias de Rioja, Moyobamba y Bellavista; que en conjunto significa el 72 % del total de la superficie sembrada a nivel regional, 22 % lo comparten las provincias de Picota, Tocache y San Martín; mientras que el 6% restante de la superficie sembrada, lo comparten las provincias de El Huallaga, Mariscal Cáceres, El Dorado y Lamas, respectivamente. En lo que se refiere a
UNIVERSIDAD NACIONAL DE INGENIERIA CAPÍTULO I FACULTAD DE INGENIERÍA CIVIL GENERALIDADES UNIDAD DE POSGRADO
TESIS: “EFECTO DE LA UTILIZACIÓN DE LA CASCARILLA DE ARROZ Y ALMIDÓN COMO LIGANTE EN LA RESISTENCIA DE PANELES AGLOMERADOS DE USO EN LA CONSTRUCCIÓN” ING. LIZBETH CASAS SANDOVAL
3
variedades predomina a nivel regional la esperanza, en seguida están las variedades Línea mejorada, Conquista, Selva Alta, etc. La Dirección Regional de Agricultura San Martin, (2013), indica que durante la campaña agrícola 2012-2013, llegó a sembrar 81,653 hectáreas a nivel de la región San Martín; disminuyendo en 5.67 % respecto a la campaña 2011-2012, la misma que representa la mayor superficie sembrada en las nueve últimas campañas. En la campaña que finalizó se observa que las mayores siembras se registraron entre los meses de enero y febrero, con una incidencia del 10.22 y 10.76 % del total de la superficie sembrada. Se debe fundamentalmente a la mayor disponibilidad del recurso hídrico. Francisco Tello Perú SAC, (2009). Indicó que en la región San Martin pueden realizarse dos campañas arroceras por año, cosechándose al sexto mes de la siembra, representando una ventaja comparativa frente a otras regiones del Perú; los rendimientos por campaña son inferiores a los logrados en la costa norte y el sur del país, siendo su promedio de 6 TM/Ha – Campaña medido en arroz cáscara, pudiendo obtenerse un total al año de 12 TM/ha-año; en los campos preparados para el cultivo,
1.1.3. Volumen de producción y rendimientos
La Dirección Regional de Agricultura San Martin, (2013). Indicó que la producción de arroz cáscara en el 2013, alcanzó a 563,990 TM, que comparado al año anterior registró una disminución de 2.0%; igualmente, en el año 2012 se registró la mayor producción de arroz cáscara respecto a los últimos nueve años. En los meses de mayo y junio del 2013 se registró mayor producción con una incidencia de 9.86 % y 10.59 %; a consecuencia de las mayores superficies cosechadas en similares meses, y mayor demanda en mercados.
1.1.4. Volúmenes de cascarilla de arroz
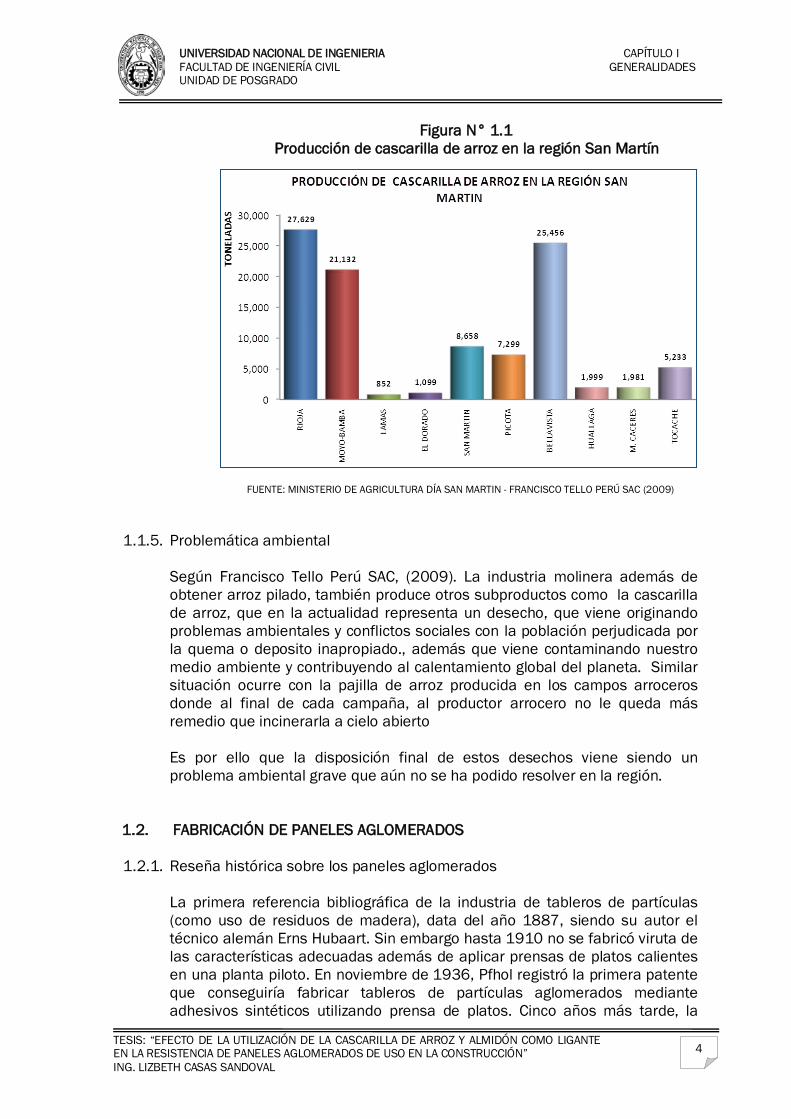
Según Francisco Tello Perú SAC, (2009). La oferta de cascarilla de arroz que se produce en la provincia de San Martin, se calculó a partir de la data estructura con la visita a los molinos reportados, a partir de la información secundaria proporcionada por el Ministerio de Agricultura. En el siguiente gráfico se muestra los volúmenes generados por la actividad molinera en la región San Martín.
UNIVERSIDAD NACIONAL DE INGENIERIA CAPÍTULO I FACULTAD DE INGENIERÍA CIVIL GENERALIDADES UNIDAD DE POSGRADO
TESIS: “EFECTO DE LA UTILIZACIÓN DE LA CASCARILLA DE ARROZ Y ALMIDÓN COMO LIGANTE EN LA RESISTENCIA DE PANELES AGLOMERADOS DE USO EN LA CONSTRUCCIÓN” ING. LIZBETH CASAS SANDOVAL
4
Figura N° 1.1 Producción de cascarilla de arroz en la región San Martín
FUENTE: MINISTERIO DE AGRICULTURA DÍA SAN MARTIN - FRANCISCO TELLO PERÚ SAC (2009)
1.1.5. Problemática ambiental
Según Francisco Tello Perú SAC, (2009). La industria molinera además de obtener arroz pilado, también produce otros subproductos como la cascarilla de arroz, que en la actualidad representa un desecho, que viene originando problemas ambientales y conflictos sociales con la población perjudicada por la quema o deposito inapropiado., además que viene contaminando nuestro medio ambiente y contribuyendo al calentamiento global del planeta. Similar situación ocurre con la pajilla de arroz producida en los campos arroceros donde al final de cada campaña, al productor arrocero no le queda más remedio que incinerarla a cielo abierto
Es por ello que la disposición final de estos desechos viene siendo un problema ambiental grave que aún no se ha podido resolver en la región.
1.2. FABRICACIÓN DE PANELES AGLOMERADOS
1.2.1. Reseña histórica sobre los paneles aglomerados La primera referencia bibliográfica de la industria de tableros de partículas (como uso de residuos de madera), data del año 1887, siendo su autor el técnico alemán Erns Hubaart. Sin embargo hasta 1910 no se fabricó viruta de las características adecuadas además de aplicar prensas de platos calientes en una planta piloto. En noviembre de 1936, Pfhol registró la primera patente que conseguiría fabricar tableros de partículas aglomerados mediante adhesivos sintéticos utilizando prensa de platos. Cinco años más tarde, la
UNIVERSIDAD NACIONAL DE INGENIERIA CAPÍTULO I FACULTAD DE INGENIERÍA CIVIL GENERALIDADES UNIDAD DE POSGRADO
TESIS: “EFECTO DE LA UTILIZACIÓN DE LA CASCARILLA DE ARROZ Y ALMIDÓN COMO LIGANTE EN LA RESISTENCIA DE PANELES AGLOMERADOS DE USO EN LA CONSTRUCCIÓN” ING. LIZBETH CASAS SANDOVAL
5
firma Torfit – Werke A.G. de Haseke, en la ciudad alemana de Bremen, puso en marcha la primera línea de fabricación de tablero aglomerado, con una producción diaria de 10t, utilizando una prensa de 3x2m, en la que se podía fabricar gruesos de 4 a 25mm con una densidad de 800 a 1000 kg/m3. También en 1941, el Instituto Fred Falirni de Zurich, patentó el proceso de tres capas con distinto contenido de humedad en las capas interna y externa, poniendo en marcha la innovación tecnológica patentada en Suiza en 1943. El punto de inflexión en el desarrollo de los tableros o paneles, data de 1930; en el que Portland Manufacturing Company de EEUU empleó el uso de adhesivos de urea formaldehído y fenol formaldehído en sus líneas de producción de Giordano. (Flores, 2005). La utilización inicial de los tableros de partículas se hizo con un criterio de sustitución de los tableros contrachapados, dado que resultaban mucho más económicos, y en algunas aplicaciones en interior pueden sustituirlos. El desarrollo de esta industria se produjo cuando se aprovecharon las propiedades específicas de estos tableros de partículas para fabricar productos con características propias, como muros cortina, muebles de oficina o de cocina, mobiliario de uso general, etc. La última etapa en su utilización ha sido el recubrimiento con chapas decorativas de madera o con laminados y recubrimientos de productos plásticos como la melanina. Rivarola, A., Rojo, L., Gardey, M. & Arena, A. (2006). Decían que el mercado de las placas de aglomerado de madera ha registrado una tendencia creciente en cuanto a la capacidad de producción de las empresas fabricantes, y el mercado sudamericano es uno de los más dinámicos en los últimos años. Este crecimiento determina un problema de disponibilidad de materia prima, ya que el proceso clásico utiliza madera virgen en altas proporciones, lo que a su vez trae aparejado problemas de competitividad debido a su alto costo. Esto motiva que se esté procurando encontrar soluciones sustituyendo total o parcialmente la madera virgen por materiales reciclados, que incluyen generalmente residuos de la construcción, material de embalajes, viejos muebles y otros materiales similares.
1.2.2. Tipos de paneles aglomerados
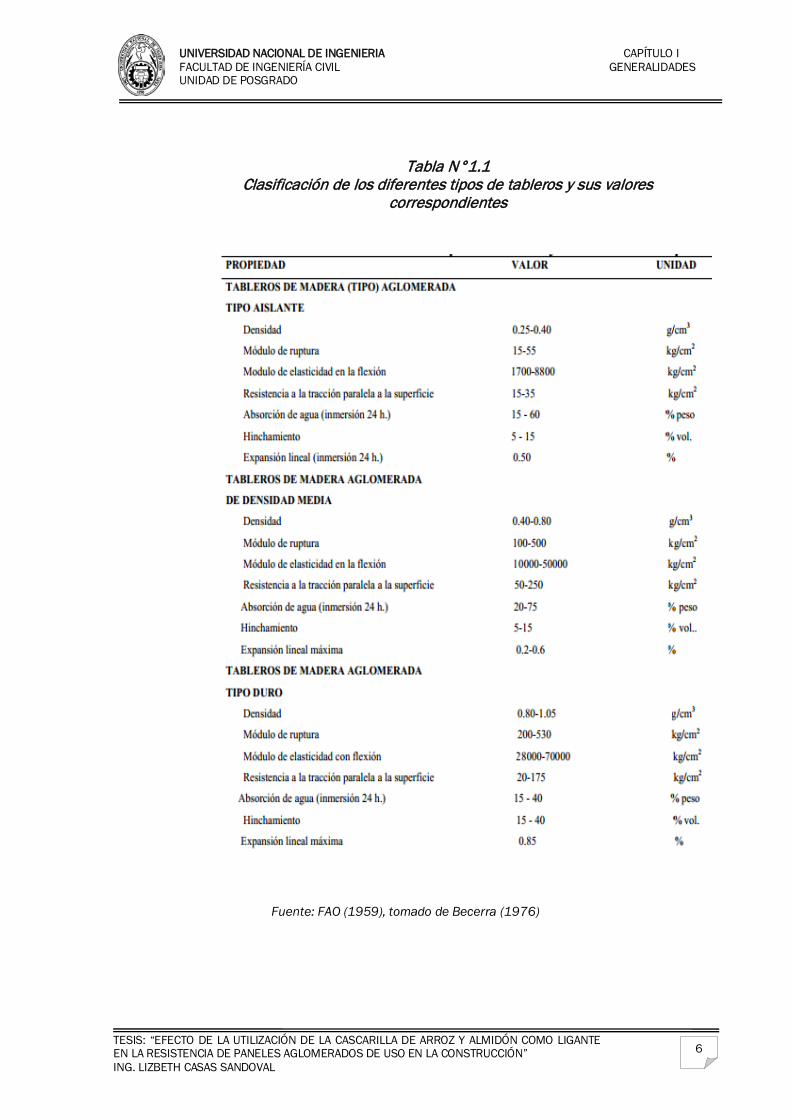
Entre las principales formas de clasificación de los tableros aglomerados de partículas con respecto a la diversidad de tipos se encuentran: el tamaño de las partículas, tamaño de las partículas en las superficies y en el centro y la densidad del tablero. Clasificado por la FAO en 1959, tal como se muestra en la Tabla N°1.1. Manzano, A. (2000).
UNIVERSIDAD NACIONAL DE INGENIERIA CAPÍTULO I FACULTAD DE INGENIERÍA CIVIL GENERALIDADES UNIDAD DE POSGRADO
TESIS: “EFECTO DE LA UTILIZACIÓN DE LA CASCARILLA DE ARROZ Y ALMIDÓN COMO LIGANTE EN LA RESISTENCIA DE PANELES AGLOMERADOS DE USO EN LA CONSTRUCCIÓN” ING. LIZBETH CASAS SANDOVAL
6
Tabla N°1.1 Clasificación de los diferentes tipos de tableros y sus valores
correspondientes
Fuente: FAO (1959), tomado de Becerra (1976)
UNIVERSIDAD NACIONAL DE INGENIERIA CAPÍTULO I FACULTAD DE INGENIERÍA CIVIL GENERALIDADES UNIDAD DE POSGRADO
TESIS: “EFECTO DE LA UTILIZACIÓN DE LA CASCARILLA DE ARROZ Y ALMIDÓN COMO LIGANTE EN LA RESISTENCIA DE PANELES AGLOMERADOS DE USO EN LA CONSTRUCCIÓN” ING. LIZBETH CASAS SANDOVAL
7
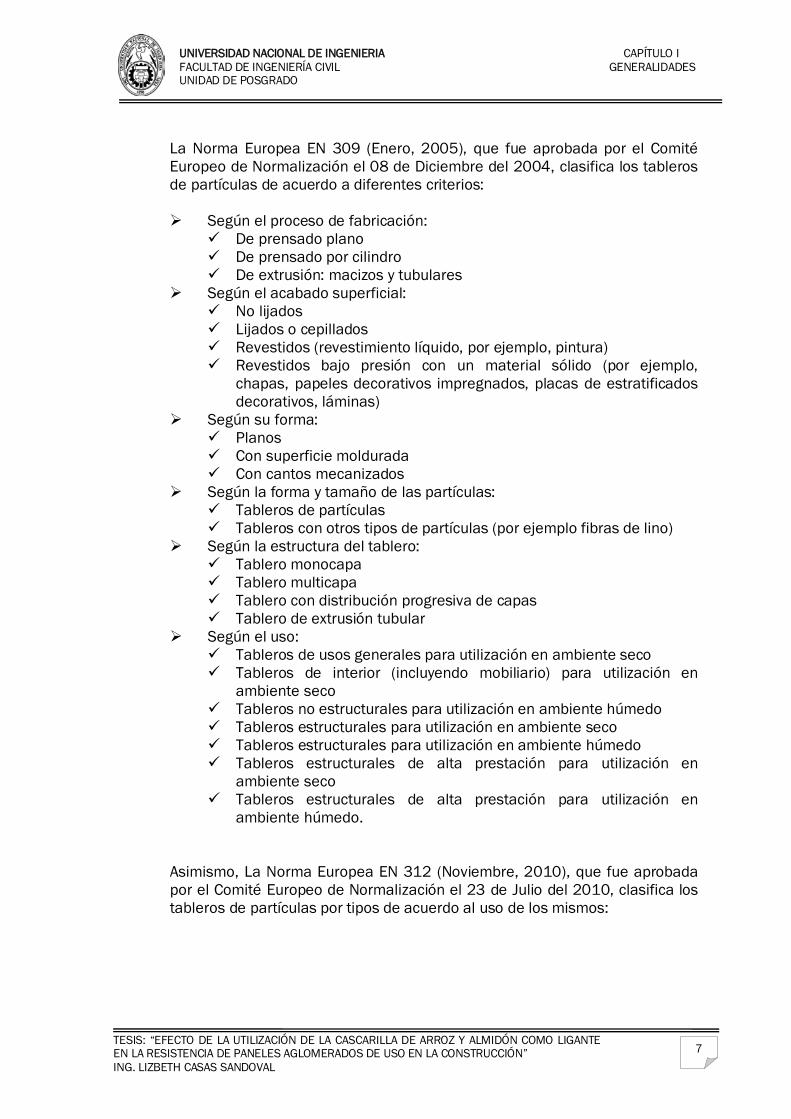
La Norma Europea EN 309 (Enero, 2005), que fue aprobada por el Comité Europeo de Normalización el 08 de Diciembre del 2004, clasifica los tableros de partículas de acuerdo a diferentes criterios:
Según el proceso de fabricación:
De prensado plano De prensado por cilindro De extrusión: macizos y tubulares
Según el acabado superficial: No lijados Lijados o cepillados Revestidos (revestimiento líquido, por ejemplo, pintura) Revestidos bajo presión con un material sólido (por ejemplo,
chapas, papeles decorativos impregnados, placas de estratificados decorativos, láminas)
Según su forma: Planos Con superficie moldurada Con cantos mecanizados
Según la forma y tamaño de las partículas: Tableros de partículas Tableros con otros tipos de partículas (por ejemplo fibras de lino)
Según la estructura del tablero: Tablero monocapa Tablero multicapa Tablero con distribución progresiva de capas Tablero de extrusión tubular
Según el uso: Tableros de usos generales para utilización en ambiente seco Tableros de interior (incluyendo mobiliario) para utilización en
ambiente seco Tableros no estructurales para utilización en ambiente húmedo Tableros estructurales para utilización en ambiente seco Tableros estructurales para utilización en ambiente húmedo Tableros estructurales de alta prestación para utilización en
ambiente seco Tableros estructurales de alta prestación para utilización en
ambiente húmedo.
Asimismo, La Norma Europea EN 312 (Noviembre, 2010), que fue aprobada por el Comité Europeo de Normalización el 23 de Julio del 2010, clasifica los tableros de partículas por tipos de acuerdo al uso de los mismos:
UNIVERSIDAD NACIONAL DE INGENIERIA CAPÍTULO I FACULTAD DE INGENIERÍA CIVIL GENERALIDADES UNIDAD DE POSGRADO
TESIS: “EFECTO DE LA UTILIZACIÓN DE LA CASCARILLA DE ARROZ Y ALMIDÓN COMO LIGANTE EN LA RESISTENCIA DE PANELES AGLOMERADOS DE USO EN LA CONSTRUCCIÓN” ING. LIZBETH CASAS SANDOVAL
8
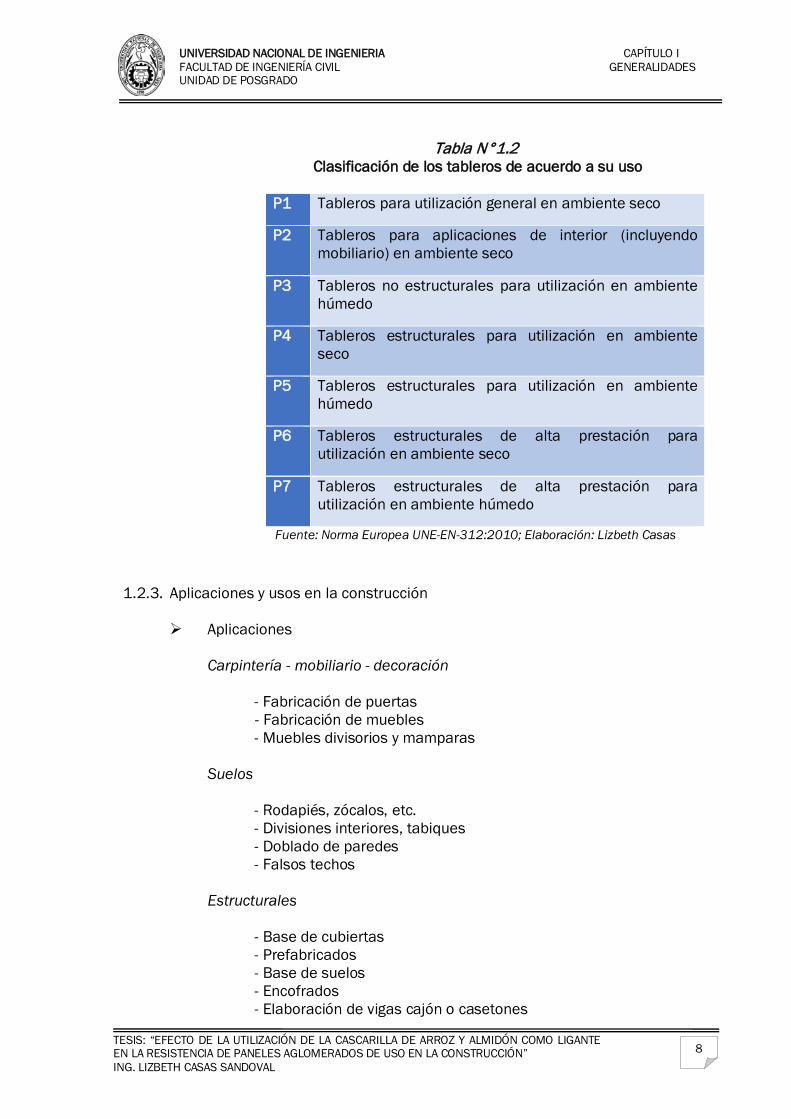
Tabla N°1.2
Clasificación de los tableros de acuerdo a su uso
P1 Tableros para utilización general en ambiente seco
P2 Tableros para aplicaciones de interior (incluyendo mobiliario) en ambiente seco
P3 Tableros no estructurales para utilización en ambiente húmedo
P4 Tableros estructurales para utilización en ambiente seco
P5 Tableros estructurales para utilización en ambiente húmedo
P6 Tableros estructurales de alta prestación para utilización en ambiente seco
P7 Tableros estructurales de alta prestación para utilización en ambiente húmedo
Fuente: Norma Europea UNE-EN-312:2010; Elaboración: Lizbeth Casas
1.2.3. Aplicaciones y usos en la construcción
Aplicaciones
Carpintería - mobiliario - decoración - Fabricación de puertas - Fabricación de muebles - Muebles divisorios y mamparas
Suelos
- Rodapiés, zócalos, etc. - Divisiones interiores, tabiques - Doblado de paredes - Falsos techos
Estructurales
- Base de cubiertas - Prefabricados - Base de suelos - Encofrados - Elaboración de vigas cajón o casetones
UNIVERSIDAD NACIONAL DE INGENIERIA CAPÍTULO I FACULTAD DE INGENIERÍA CIVIL GENERALIDADES UNIDAD DE POSGRADO
TESIS: “EFECTO DE LA UTILIZACIÓN DE LA CASCARILLA DE ARROZ Y ALMIDÓN COMO LIGANTE EN LA RESISTENCIA DE PANELES AGLOMERADOS DE USO EN LA CONSTRUCCIÓN” ING. LIZBETH CASAS SANDOVAL
9
- Paneles sándwich
Tipos Acabado superficial lijado (estándar) y recubiertos (chapas de madera, papeles decorativos impregnados, laminados decorativos termoestables (de poliéster, de PVC, etc)
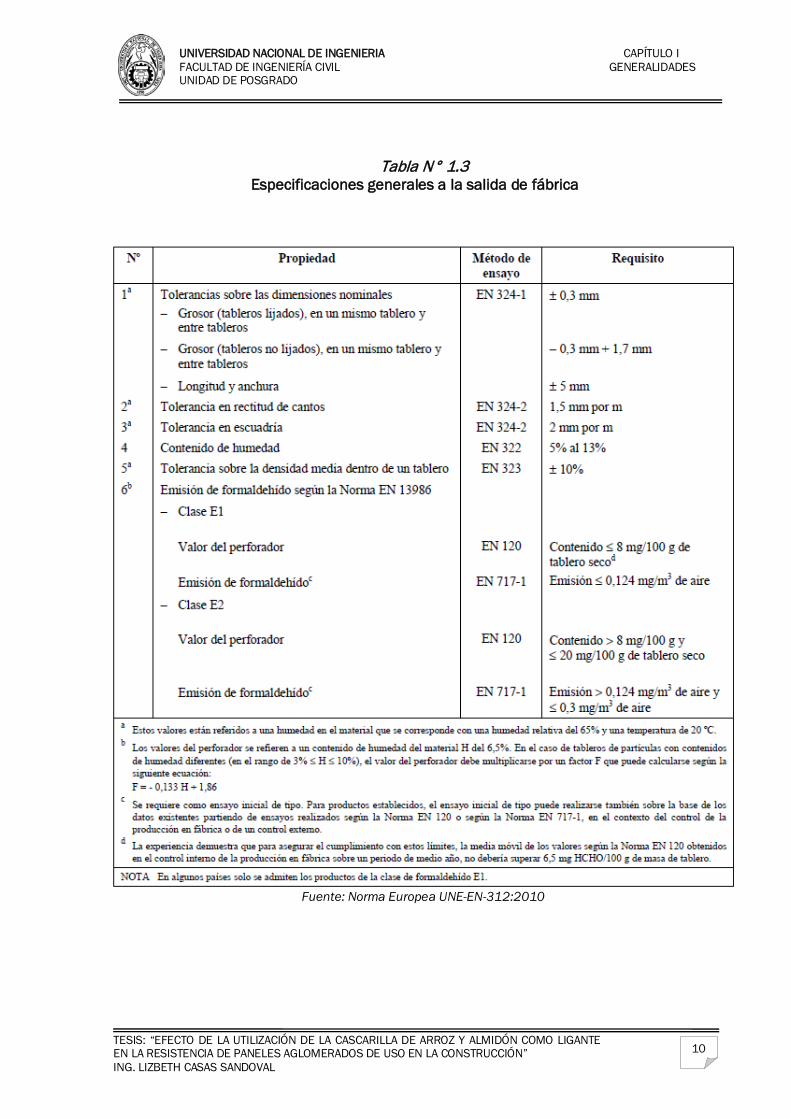
1.2.4. Requisitos Generales para la Fabricación de Paneles
La Norma Europea UNE–EN–312: 2010, establece que los tableros de partículas deben satisfacer a su salida de fábrica los requisitos generales establecidos en la Tabla N° 1.3. Para determinados tipos o aplicaciones de los tableros de partículas se requieren tolerancias especiales para las propiedades dimensionales relacionadas bajo el epígrafe n°1. En el caso de los tableros cortados a medida, o de tableros con mecanizaciones adicionales (como por ejemplo machihembrado o similares), se pueden acordar tolerancias especiales para las propiedades 1, 2 y 3.
1.2.5. Valores Requeridos
La Norma Europea UNE–EN–312: 2010, establece como requisitos los valores correspondientes a los dados en las tablas N°1.4, 1.5, 1.6 y 1.7.
UNIVERSIDAD NACIONAL DE INGENIERIA CAPÍTULO I FACULTAD DE INGENIERÍA CIVIL GENERALIDADES UNIDAD DE POSGRADO
TESIS: “EFECTO DE LA UTILIZACIÓN DE LA CASCARILLA DE ARROZ Y ALMIDÓN COMO LIGANTE EN LA RESISTENCIA DE PANELES AGLOMERADOS DE USO EN LA CONSTRUCCIÓN” ING. LIZBETH CASAS SANDOVAL
10
Tabla N° 1.3 Especificaciones generales a la salida de fábrica
Fuente: Norma Europea UNE-EN-312:2010
UNIVERSIDAD NACIONAL DE INGENIERIA CAPÍTULO I FACULTAD DE INGENIERÍA CIVIL GENERALIDADES UNIDAD DE POSGRADO
TESIS: “EFECTO DE LA UTILIZACIÓN DE LA CASCARILLA DE ARROZ Y ALMIDÓN COMO LIGANTE EN LA RESISTENCIA DE PANELES AGLOMERADOS DE USO EN LA CONSTRUCCIÓN” ING. LIZBETH CASAS SANDOVAL
11
Tabla N° 1.4 Tableros de uso general para utilización en ambiente seco (Tipo P1)
Requisitos para las propiedades mecánicas especificadas
Fuente: Norma Europea UNE-EN-312:2010
Tabla N° 1.5 Tableros para aplicaciones de interior (incluyendo mobiliario) para
utilización en ambiente seco (Tipo P2) Requisitos para las propiedades mecánicas especificadas
Fuente: Norma Europea UNE-EN-312:2010
UNIVERSIDAD NACIONAL DE INGENIERIA CAPÍTULO I FACULTAD DE INGENIERÍA CIVIL GENERALIDADES UNIDAD DE POSGRADO
TESIS: “EFECTO DE LA UTILIZACIÓN DE LA CASCARILLA DE ARROZ Y ALMIDÓN COMO LIGANTE EN LA RESISTENCIA DE PANELES AGLOMERADOS DE USO EN LA CONSTRUCCIÓN” ING. LIZBETH CASAS SANDOVAL
12
Tabla N° 1.6 Tableros no estructurales utilizados en ambiente húmedo (Tipo P3)
Requisitos para las propiedades mecánicas y de hinchazón especificadas
Fuente: Norma Europea UNE-EN-312:2010
Tabla N° 1.7 Tableros no estructurales utilizados en ambiente húmedo (Tipo P3)
Requisitos para la resistencia a la humedad
Fuente: Norma Europea UNE-EN-312:2010
UNIVERSIDAD NACIONAL DE INGENIERIA CAPÍTULO I FACULTAD DE INGENIERÍA CIVIL GENERALIDADES UNIDAD DE POSGRADO
TESIS: “EFECTO DE LA UTILIZACIÓN DE LA CASCARILLA DE ARROZ Y ALMIDÓN COMO LIGANTE EN LA RESISTENCIA DE PANELES AGLOMERADOS DE USO EN LA CONSTRUCCIÓN” ING. LIZBETH CASAS SANDOVAL
13
1.3. MERCADO DE PANELES AGLOMERADOS EN EL PERÚ
Tableros Peruanos S.A. (TAPESA), una empresa fundada en abril del año 1973, se inicia como parte de un proyecto elaborado y promovido por la División Técnica de la Central de Cooperativas Agrarias Azucareras del Perú (CECOAAP), con la participación de importantes cooperativas azucareras, entre ellas las empresas agroindustriales Cartavio S.A.A., Casagrande S.A.A. y Laredo S.A., iniciando sus actividades el 27 de febrero del año 1977, con la fabricación de tableros aglomerados marca "Maderba". El objeto de la sociedad es la fabricación de tableros usando bagazo, subproducto de la caña de azúcar y madera de pino; aglomerados, con resina, como materia prima. La empresa está ubicada al norte del Perú en el distrito de Laredo, departamento de La Libertad, siendo esta ubicación estratégica por su cercanía a los principales ingenios azucareros del país. El Grupo Gloria, como propietario de las empresas Cartavio y Casa Grande, es el accionista mayoritario que controla la gestión de la sociedad. TAPESA tiene una sólida posición en el mercado peruano de la construcción y fabricación de muebles, artesanías y publicidad. Según el acabado de la superficie cuentan con los tipos: Maderba SP (tableros sin lijar), Maderba Plus (tableros lijados) y Maderba Melamina (tableros con aplicación de paneles melamínicos) y tableros decorativos para cielos rasos, adaptándose a las exigencias del mercado con una amplia variedad de espesores desde 4mm hasta 45mm y contando con personal altamente calificado. TAPESA es la única empresa nacional dedicada a la fabricación de tableros aglomerados, compitiendo con productos importados principalmente procedentes de Chile y Ecuador. (Grupo Gloria). La firma MASISA cuenta con un negocio central, que es la fabricación y comercialización de tableros de partículas y de fibra de madera para muebles y arquitectura de interiores en Latinoamérica. Las unidades estratégicas de los negocios Forestal y Red Placacentro cumplen un rol muy relevante para garantizar el éxito de su negocio central. La compañía ve con optimismo las proyecciones asociadas a la demanda inmobiliaria en nuestro país, donde el desarrollo de proyectos de construcción e inmobiliarios viene impulsando la demanda de tableros aglomerados, o también conocidos como melamínicos, con los que compite Masisa.
UNIVERSIDAD NACIONAL DE INGENIERIA CAPÍTULO II FACULTAD DE INGENIERÍA CIVIL MARCO TEÓRICO UNIDAD DE POSGRADO
TESIS: “EFECTO DE LA UTILIZACIÓN DE LA CASCARILLA DE ARROZ Y ALMIDÓN COMO LIGANTE EN LA RESISTENCIA DE PANELES AGLOMERADOS DE USO EN LA CONSTRUCCIÓN” ING. LIZBETH CASAS SANDOVAL
14
CAPITULO II MARCO TEÓRICO 2.1. MARCO TEÓRICO
2.1.1. Resistencia a la flexión
Si las fuerzas que actúan sobre un cuerpo tienden a inducir una solicitación de tracción en una parte de su sección transversal, y una solicitación de compresión en la sección restante, entonces el cuerpo está sometido a flexión. (Escalona & Hernández, 2011) El procedimiento analítico para la determinación de los valores característicos que necesitamos para clasificar e identificar las propiedades mecánicas, viene sistematizado a continuación:
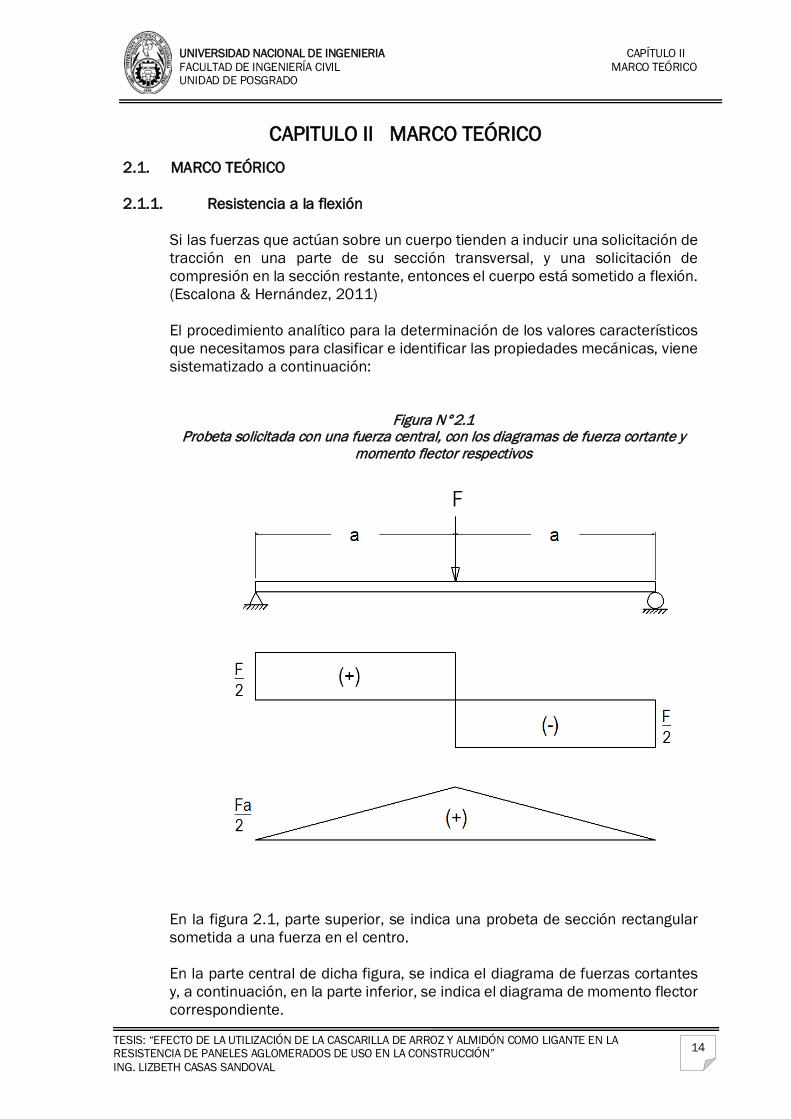
Figura N°2.1 Probeta solicitada con una fuerza central, con los diagramas de fuerza cortante y
momento flector respectivos
En la figura 2.1, parte superior, se indica una probeta de sección rectangular sometida a una fuerza en el centro. En la parte central de dicha figura, se indica el diagrama de fuerzas cortantes y, a continuación, en la parte inferior, se indica el diagrama de momento flector correspondiente.
UNIVERSIDAD NACIONAL DE INGENIERIA CAPÍTULO II FACULTAD DE INGENIERÍA CIVIL MARCO TEÓRICO UNIDAD DE POSGRADO
TESIS: “EFECTO DE LA UTILIZACIÓN DE LA CASCARILLA DE ARROZ Y ALMIDÓN COMO LIGANTE EN LA RESISTENCIA DE PANELES AGLOMERADOS DE USO EN LA CONSTRUCCIÓN” ING. LIZBETH CASAS SANDOVAL
15
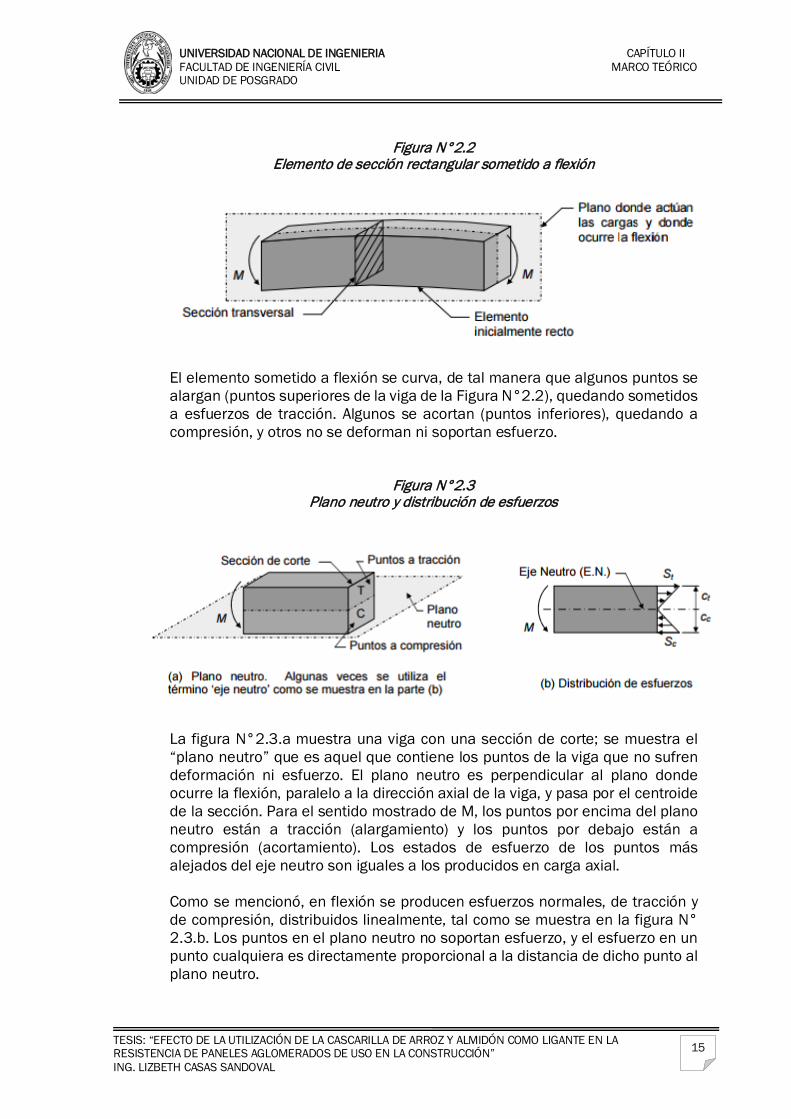
Figura N°2.2
Elemento de sección rectangular sometido a flexión
El elemento sometido a flexión se curva, de tal manera que algunos puntos se alargan (puntos superiores de la viga de la Figura N°2.2), quedando sometidos a esfuerzos de tracción. Algunos se acortan (puntos inferiores), quedando a compresión, y otros no se deforman ni soportan esfuerzo.
Figura N°2.3 Plano neutro y distribución de esfuerzos
La figura N°2.3.a muestra una viga con una sección de corte; se muestra el “plano neutro” que es aquel que contiene los puntos de la viga que no sufren deformación ni esfuerzo. El plano neutro es perpendicular al plano donde ocurre la flexión, paralelo a la dirección axial de la viga, y pasa por el centroide de la sección. Para el sentido mostrado de M, los puntos por encima del plano neutro están a tracción (alargamiento) y los puntos por debajo están a compresión (acortamiento). Los estados de esfuerzo de los puntos más alejados del eje neutro son iguales a los producidos en carga axial. Como se mencionó, en flexión se producen esfuerzos normales, de tracción y de compresión, distribuidos linealmente, tal como se muestra en la figura N° 2.3.b. Los puntos en el plano neutro no soportan esfuerzo, y el esfuerzo en un punto cualquiera es directamente proporcional a la distancia de dicho punto al plano neutro.
UNIVERSIDAD NACIONAL DE INGENIERIA CAPÍTULO II FACULTAD DE INGENIERÍA CIVIL MARCO TEÓRICO UNIDAD DE POSGRADO
TESIS: “EFECTO DE LA UTILIZACIÓN DE LA CASCARILLA DE ARROZ Y ALMIDÓN COMO LIGANTE EN LA RESISTENCIA DE PANELES AGLOMERADOS DE USO EN LA CONSTRUCCIÓN” ING. LIZBETH CASAS SANDOVAL
16
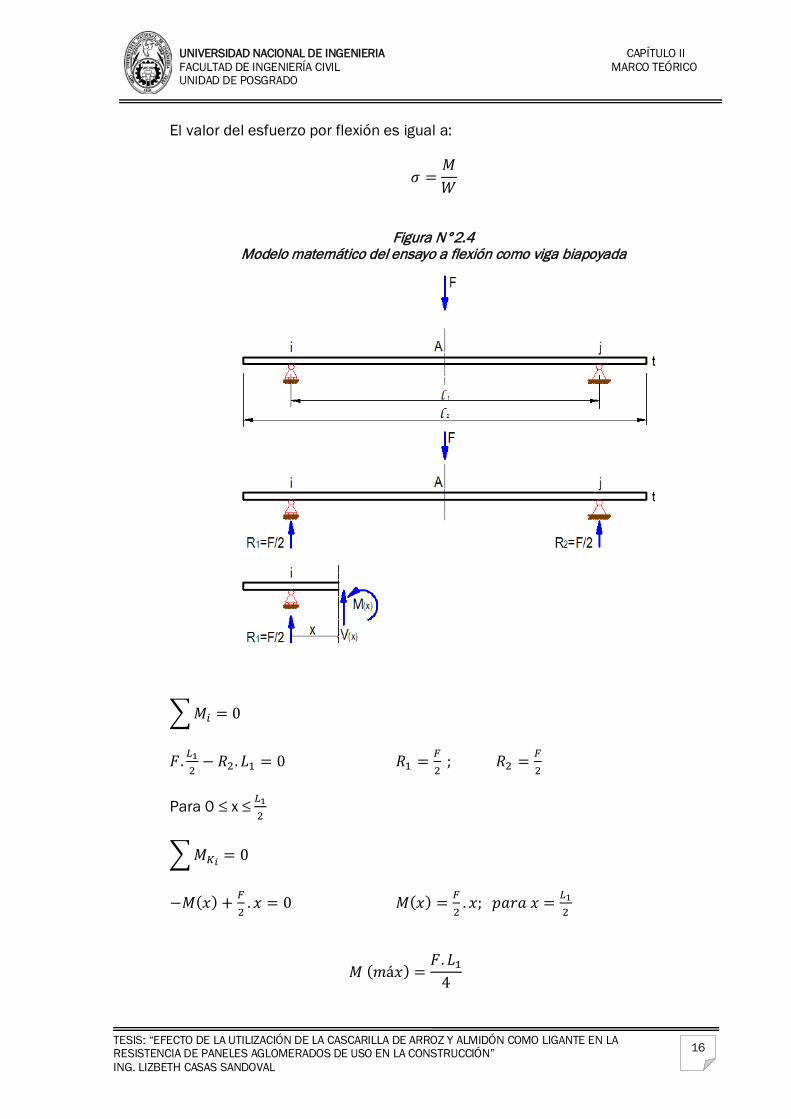
El valor del esfuerzo por flexión es igual a:
𝜎𝜎 =𝑀𝑀𝑊𝑊
Figura N°2.4 Modelo matemático del ensayo a flexión como viga biapoyada
�𝑀𝑀𝑖𝑖 = 0
𝐹𝐹. 𝐿𝐿12− 𝑅𝑅2. 𝐿𝐿1 = 0 𝑅𝑅1 = 𝐹𝐹
2 ; 𝑅𝑅2 = 𝐹𝐹
2
Para 0 ≤ x ≤ 𝐿𝐿1
2
�𝑀𝑀𝐾𝐾𝑖𝑖 = 0
−𝑀𝑀(𝑥𝑥) + 𝐹𝐹2
. 𝑥𝑥 = 0 𝑀𝑀(𝑥𝑥) = 𝐹𝐹2
. 𝑥𝑥; 𝑝𝑝𝑝𝑝𝑝𝑝𝑝𝑝 𝑥𝑥 = 𝐿𝐿12
𝑀𝑀 (𝑚𝑚á𝑥𝑥) =𝐹𝐹. 𝐿𝐿1
4
UNIVERSIDAD NACIONAL DE INGENIERIA CAPÍTULO II FACULTAD DE INGENIERÍA CIVIL MARCO TEÓRICO UNIDAD DE POSGRADO
TESIS: “EFECTO DE LA UTILIZACIÓN DE LA CASCARILLA DE ARROZ Y ALMIDÓN COMO LIGANTE EN LA RESISTENCIA DE PANELES AGLOMERADOS DE USO EN LA CONSTRUCCIÓN” ING. LIZBETH CASAS SANDOVAL
17
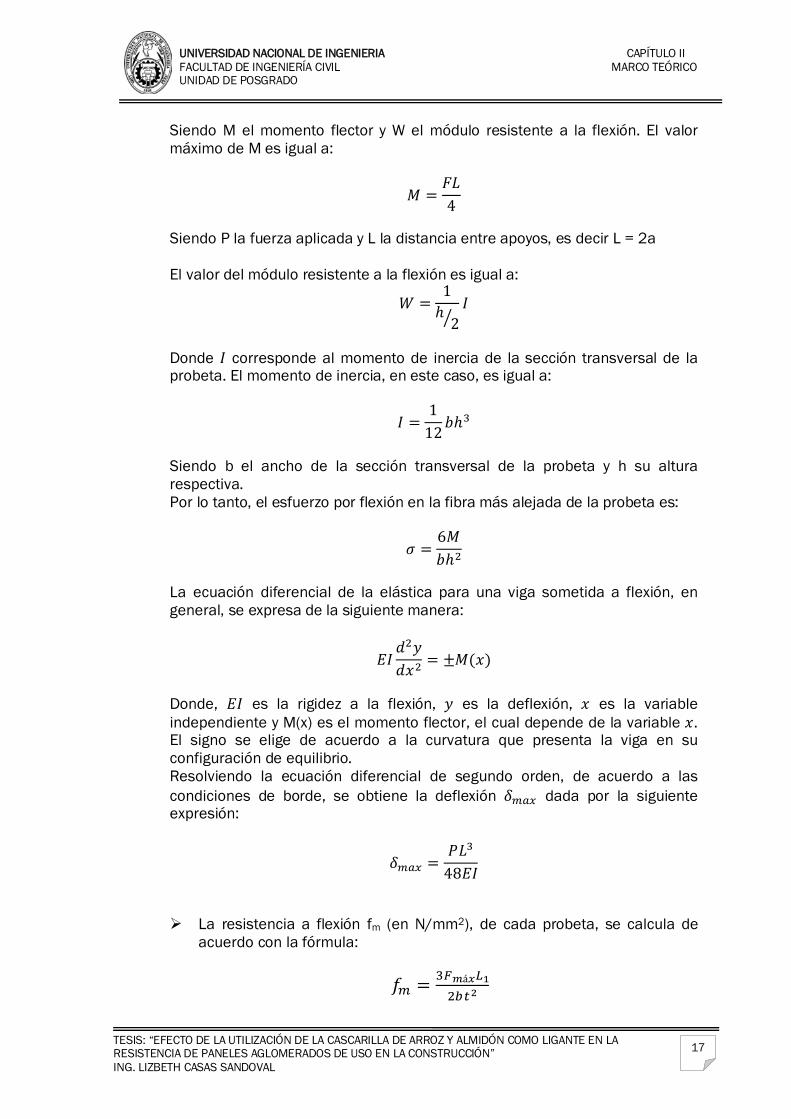
Siendo M el momento flector y W el módulo resistente a la flexión. El valor máximo de M es igual a:
𝑀𝑀 =𝐹𝐹𝐿𝐿4
Siendo P la fuerza aplicada y L la distancia entre apoyos, es decir L = 2a El valor del módulo resistente a la flexión es igual a:
𝑊𝑊 =1ℎ
2�𝐼𝐼
Donde 𝐼𝐼 corresponde al momento de inercia de la sección transversal de la probeta. El momento de inercia, en este caso, es igual a:
𝐼𝐼 =1
12𝑏𝑏ℎ3
Siendo b el ancho de la sección transversal de la probeta y h su altura respectiva. Por lo tanto, el esfuerzo por flexión en la fibra más alejada de la probeta es:
𝜎𝜎 =6𝑀𝑀𝑏𝑏ℎ2
La ecuación diferencial de la elástica para una viga sometida a flexión, en general, se expresa de la siguiente manera:
𝐸𝐸𝐼𝐼𝑑𝑑2𝑦𝑦𝑑𝑑𝑥𝑥2 = ±𝑀𝑀(𝑥𝑥)
Donde, 𝐸𝐸𝐼𝐼 es la rigidez a la flexión, 𝑦𝑦 es la deflexión, 𝑥𝑥 es la variable independiente y M(x) es el momento flector, el cual depende de la variable 𝑥𝑥. El signo se elige de acuerdo a la curvatura que presenta la viga en su configuración de equilibrio. Resolviendo la ecuación diferencial de segundo orden, de acuerdo a las condiciones de borde, se obtiene la deflexión 𝛿𝛿𝑚𝑚𝑚𝑚𝑚𝑚 dada por la siguiente expresión:
𝛿𝛿𝑚𝑚𝑚𝑚𝑚𝑚 =𝑃𝑃𝐿𝐿3
48𝐸𝐸𝐼𝐼 La resistencia a flexión fm (en N/mm2), de cada probeta, se calcula de
acuerdo con la fórmula: 𝑓𝑓𝑚𝑚 = 3𝐹𝐹𝑚𝑚á𝑥𝑥𝐿𝐿1
2𝑏𝑏𝑡𝑡2
UNIVERSIDAD NACIONAL DE INGENIERIA CAPÍTULO II FACULTAD DE INGENIERÍA CIVIL MARCO TEÓRICO UNIDAD DE POSGRADO
TESIS: “EFECTO DE LA UTILIZACIÓN DE LA CASCARILLA DE ARROZ Y ALMIDÓN COMO LIGANTE EN LA RESISTENCIA DE PANELES AGLOMERADOS DE USO EN LA CONSTRUCCIÓN” ING. LIZBETH CASAS SANDOVAL
18
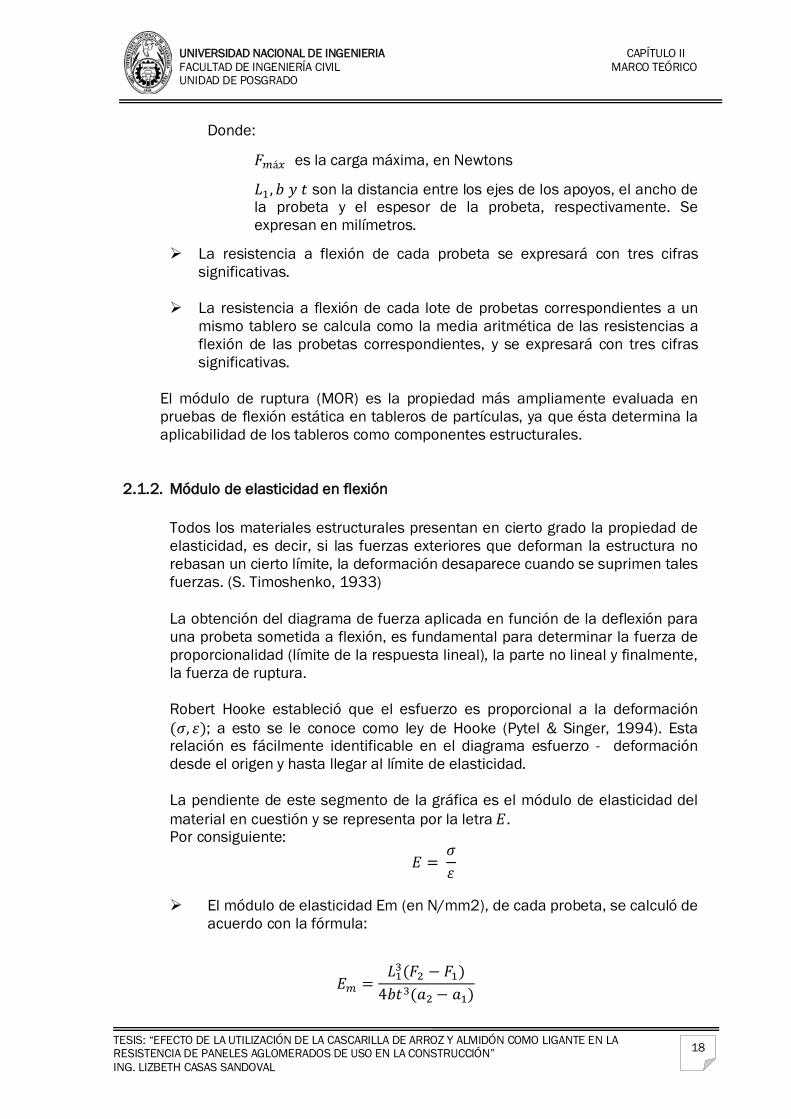
Donde:
𝐹𝐹𝑚𝑚á𝑚𝑚 es la carga máxima, en Newtons
𝐿𝐿1, 𝑏𝑏 𝑦𝑦 𝑡𝑡 son la distancia entre los ejes de los apoyos, el ancho de la probeta y el espesor de la probeta, respectivamente. Se expresan en milímetros.
La resistencia a flexión de cada probeta se expresará con tres cifras significativas.
La resistencia a flexión de cada lote de probetas correspondientes a un mismo tablero se calcula como la media aritmética de las resistencias a flexión de las probetas correspondientes, y se expresará con tres cifras significativas.
El módulo de ruptura (MOR) es la propiedad más ampliamente evaluada en pruebas de flexión estática en tableros de partículas, ya que ésta determina la aplicabilidad de los tableros como componentes estructurales.
2.1.2. Módulo de elasticidad en flexión
Todos los materiales estructurales presentan en cierto grado la propiedad de elasticidad, es decir, si las fuerzas exteriores que deforman la estructura no rebasan un cierto límite, la deformación desaparece cuando se suprimen tales fuerzas. (S. Timoshenko, 1933) La obtención del diagrama de fuerza aplicada en función de la deflexión para una probeta sometida a flexión, es fundamental para determinar la fuerza de proporcionalidad (límite de la respuesta lineal), la parte no lineal y finalmente, la fuerza de ruptura. Robert Hooke estableció que el esfuerzo es proporcional a la deformación (𝜎𝜎, 𝜀𝜀); a esto se le conoce como ley de Hooke (Pytel & Singer, 1994). Esta relación es fácilmente identificable en el diagrama esfuerzo - deformación desde el origen y hasta llegar al límite de elasticidad. La pendiente de este segmento de la gráfica es el módulo de elasticidad del material en cuestión y se representa por la letra 𝐸𝐸. Por consiguiente:
𝐸𝐸 = 𝜎𝜎𝜀𝜀
El módulo de elasticidad Em (en N/mm2), de cada probeta, se calculó de
acuerdo con la fórmula:
𝐸𝐸𝑚𝑚 =𝐿𝐿13(𝐹𝐹2 − 𝐹𝐹1)
4𝑏𝑏𝑡𝑡3(𝑝𝑝2 − 𝑝𝑝1)
UNIVERSIDAD NACIONAL DE INGENIERIA CAPÍTULO II FACULTAD DE INGENIERÍA CIVIL MARCO TEÓRICO UNIDAD DE POSGRADO
TESIS: “EFECTO DE LA UTILIZACIÓN DE LA CASCARILLA DE ARROZ Y ALMIDÓN COMO LIGANTE EN LA RESISTENCIA DE PANELES AGLOMERADOS DE USO EN LA CONSTRUCCIÓN” ING. LIZBETH CASAS SANDOVAL
19
Donde:
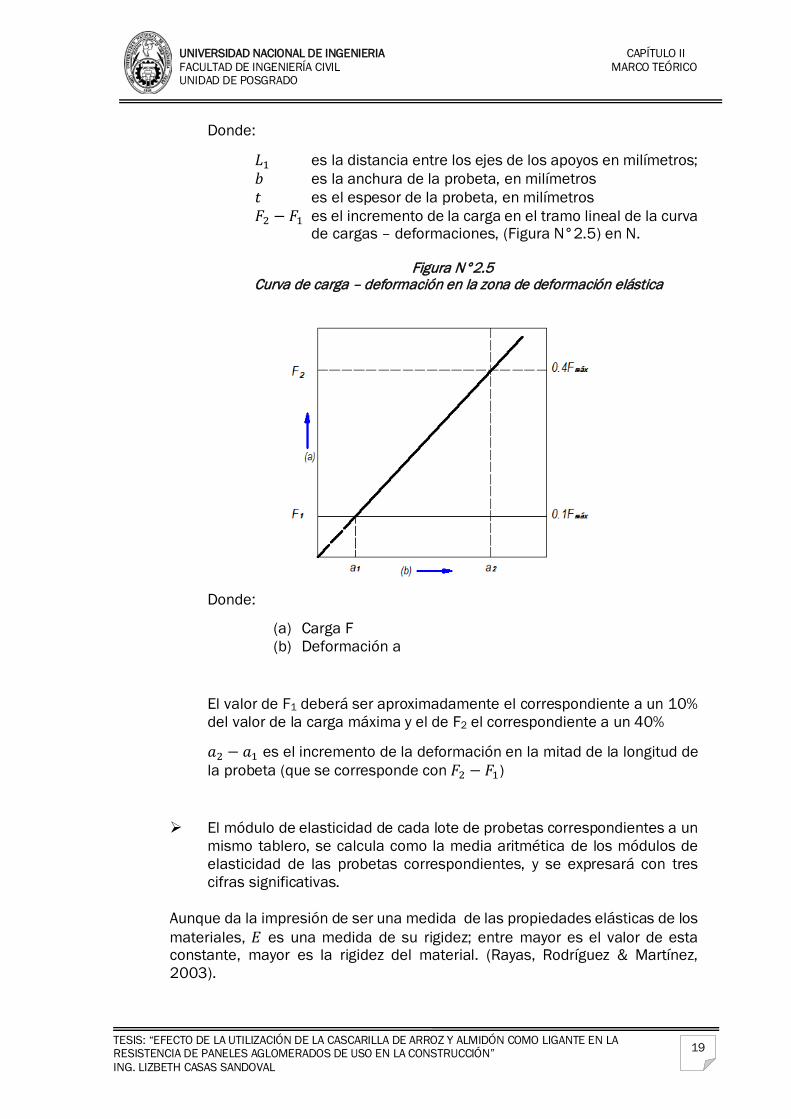
𝐿𝐿1 es la distancia entre los ejes de los apoyos en milímetros; 𝑏𝑏 es la anchura de la probeta, en milímetros 𝑡𝑡 es el espesor de la probeta, en milímetros 𝐹𝐹2 − 𝐹𝐹1 es el incremento de la carga en el tramo lineal de la curva
de cargas – deformaciones, (Figura N°2.5) en N.
Figura N°2.5 Curva de carga – deformación en la zona de deformación elástica
Donde:
(a) Carga F (b) Deformación a
El valor de F1 deberá ser aproximadamente el correspondiente a un 10% del valor de la carga máxima y el de F2 el correspondiente a un 40%
𝑝𝑝2 − 𝑝𝑝1 es el incremento de la deformación en la mitad de la longitud de la probeta (que se corresponde con 𝐹𝐹2 − 𝐹𝐹1)
El módulo de elasticidad de cada lote de probetas correspondientes a un mismo tablero, se calcula como la media aritmética de los módulos de elasticidad de las probetas correspondientes, y se expresará con tres cifras significativas.
Aunque da la impresión de ser una medida de las propiedades elásticas de los materiales, 𝐸𝐸 es una medida de su rigidez; entre mayor es el valor de esta constante, mayor es la rigidez del material. (Rayas, Rodríguez & Martínez, 2003).
UNIVERSIDAD NACIONAL DE INGENIERIA CAPÍTULO II FACULTAD DE INGENIERÍA CIVIL MARCO TEÓRICO UNIDAD DE POSGRADO
TESIS: “EFECTO DE LA UTILIZACIÓN DE LA CASCARILLA DE ARROZ Y ALMIDÓN COMO LIGANTE EN LA RESISTENCIA DE PANELES AGLOMERADOS DE USO EN LA CONSTRUCCIÓN” ING. LIZBETH CASAS SANDOVAL
20
2.1.3. Cohesión interna o Tracción perpendicular a las caras
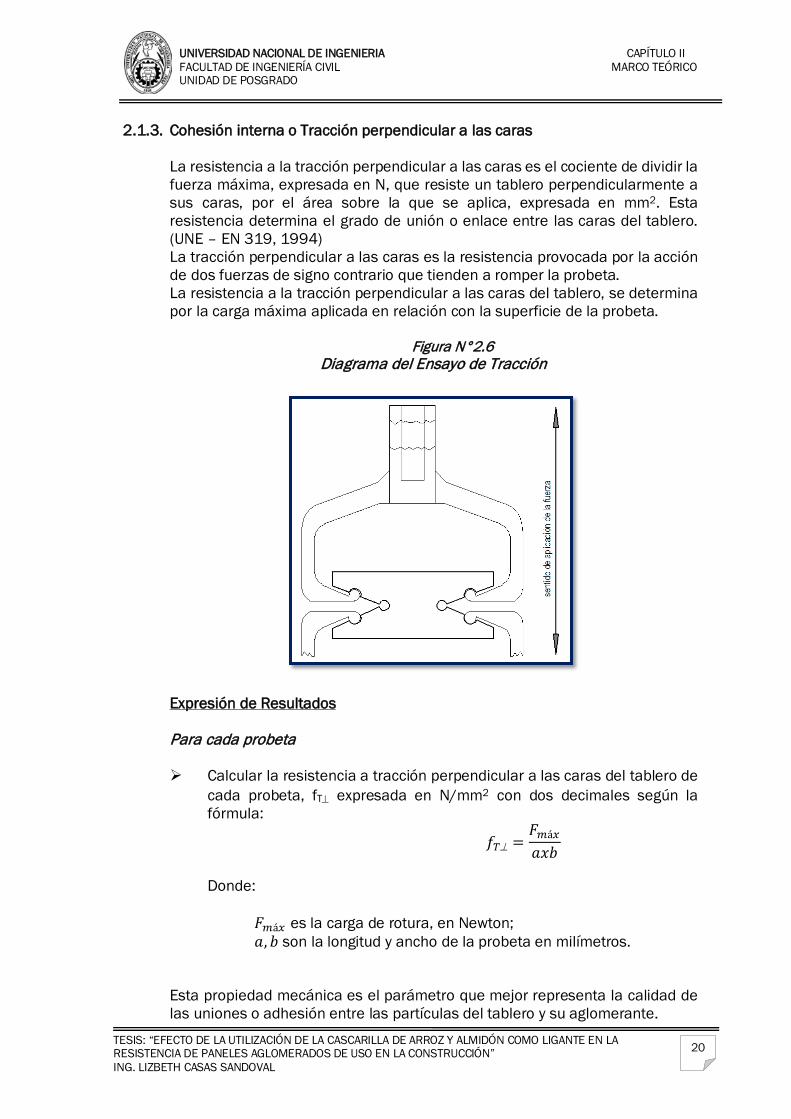
La resistencia a la tracción perpendicular a las caras es el cociente de dividir la fuerza máxima, expresada en N, que resiste un tablero perpendicularmente a sus caras, por el área sobre la que se aplica, expresada en mm2. Esta resistencia determina el grado de unión o enlace entre las caras del tablero. (UNE – EN 319, 1994) La tracción perpendicular a las caras es la resistencia provocada por la acción de dos fuerzas de signo contrario que tienden a romper la probeta. La resistencia a la tracción perpendicular a las caras del tablero, se determina por la carga máxima aplicada en relación con la superficie de la probeta.
Figura N°2.6 Diagrama del Ensayo de Tracción
Expresión de Resultados Para cada probeta Calcular la resistencia a tracción perpendicular a las caras del tablero de
cada probeta, fT⊥ expresada en N/mm2 con dos decimales según la fórmula:
𝑓𝑓𝑇𝑇⊥ =𝐹𝐹𝑚𝑚á𝑚𝑚
𝑝𝑝𝑥𝑥𝑏𝑏
Donde:
𝐹𝐹𝑚𝑚á𝑚𝑚 es la carga de rotura, en Newton; 𝑝𝑝, 𝑏𝑏 son la longitud y ancho de la probeta en milímetros.
Esta propiedad mecánica es el parámetro que mejor representa la calidad de las uniones o adhesión entre las partículas del tablero y su aglomerante.
UNIVERSIDAD NACIONAL DE INGENIERIA CAPÍTULO II FACULTAD DE INGENIERÍA CIVIL MARCO TEÓRICO UNIDAD DE POSGRADO
TESIS: “EFECTO DE LA UTILIZACIÓN DE LA CASCARILLA DE ARROZ Y ALMIDÓN COMO LIGANTE EN LA RESISTENCIA DE PANELES AGLOMERADOS DE USO EN LA CONSTRUCCIÓN” ING. LIZBETH CASAS SANDOVAL
21
La resistencia a la tracción perpendicular a las caras es un indicador de la calidad del tablero ya que nos informa acerca de su capacidad para actuar como un conjunto sólido y compacto en condiciones diferentes.
2.1.4. Resistencia al arranque de superficie Este ensayo tiene por finalidad definir la adhesión de las partículas de la probeta. Expresión de Resultados Para cada probeta Calcular el valor de la resistencia al arranque de la superficie SS de cada
probeta expresado en Newtons por milímetro cuadrado (N/mm2), según la ecuación:
𝑆𝑆𝑆𝑆 =𝐹𝐹𝑚𝑚á𝑚𝑚
𝐴𝐴 Donde:
𝐹𝐹𝑚𝑚á𝑚𝑚 es la carga de rotura, en Newton; 𝐴𝐴 es la superficie indicada en milímetros cuadrados (mm2).
Para un tablero La resistencia a la tracción perpendicular de un tablero es la media
aritmética del conjunto de los resultados obtenidos sobre todas las probetas tomadas de ese tablero. El resultado se expresa en N/mm2 con dos decimales.
2.1.5. Densidad de la Muestra
La densidad normal es el coeficiente de la masa y el volumen de la probeta.
Expresión de los Resultados
La densidad, ρ, de cada probeta (en gr/cm3) se calcula mediante la fórmula:
ρ = 𝑚𝑚
𝑏𝑏1𝑥𝑥𝑏𝑏2𝑥𝑥𝑡𝑡𝑥𝑥106
Donde:
𝑚𝑚 es la masa de la probeta en gr; 𝑏𝑏1, 𝑏𝑏2, 𝑡𝑡 en cm.
La densidad de un tablero se obtiene calculando la media
aritmética de la densidad de las probetas extraídas de dicho tablero y expresado en kg/m3 con aproximación de tres cifras.
UNIVERSIDAD NACIONAL DE INGENIERIA CAPÍTULO II FACULTAD DE INGENIERÍA CIVIL MARCO TEÓRICO UNIDAD DE POSGRADO
TESIS: “EFECTO DE LA UTILIZACIÓN DE LA CASCARILLA DE ARROZ Y ALMIDÓN COMO LIGANTE EN LA RESISTENCIA DE PANELES AGLOMERADOS DE USO EN LA CONSTRUCCIÓN” ING. LIZBETH CASAS SANDOVAL
22
La densidad del tablero determina el grado de compactación de las partículas y dependiente de la densidad de la cascarilla y del proceso de prensado aplicado.
2.1.6. Contenido de Humedad La determinación del contenido de humedad tiene como finalidad definir la cantidad de agua contenida en las probetas. La eliminación del agua ocurre por secamiento en estufa a una temperatura de (102±2)°C, hasta alcanzar masa constante.
Expresión de los Resultados
El contenido de humedad (CH) se determinó en las mismas probetas utilizadas en la evaluación de la densidad normal, aplicando la siguiente fórmula:
𝐶𝐶𝐶𝐶 = [(𝑃𝑃𝑃𝑃 − 𝑃𝑃𝑃𝑃)/𝑃𝑃𝑃𝑃] ∗ 100
Donde:
CH = Contenido de Humedad Pi = Peso inicial Po = Peso final o anhidro
2.1.7. Absorción y Cambios dimensionales La absorción se evaluó en períodos de 2 horas y 24 horas de inmersión. Para ello, las probetas de 76 x 152mm de área se pesaron inicialmente a las condiciones normales de equilibrio (Pi), posteriormente, se introdujeron en agua durante los dos periodos indicados, al término de cada uno se volvieron a pesar par así registrar su peso final (Pf), aplicando posteriormente la fórmula:
𝐴𝐴 = [(𝑃𝑃𝑓𝑓 − 𝑃𝑃𝑃𝑃)/𝑃𝑃𝑃𝑃] ∗ 100 (%)
Donde: A = Absorción, en % del peso inicial
Pf = Peso final en gramos Pi = Peso inicial en gramos
Los cambios dimensionales corresponden a la diferencia entre el espesor de la probeta húmeda (Ef) y el espesor de la probeta climatizada o inicial (Ei) en relación al espesor de la probeta climatizada. Se expresa como % del espesor inicial aplicando la fórmula:
∝= �(𝐸𝐸𝐸𝐸−𝐸𝐸𝑖𝑖)
𝐸𝐸𝑖𝑖� ∗ 100 (%)
Donde:
α = Cambios dimensionales, en % Ef = Espesor final, al 0.01mm Ei = Espesor inicial, al 0.01mm
UNIVERSIDAD NACIONAL DE INGENIERIA CAPÍTULO III FACULTAD DE INGENIERÍA CIVIL DESARROLLO UNIDAD DE POSGRADO DEL ESTUDIO
TESIS: “EFECTO DE LA UTILIZACIÓN DE LA CASCARILLA DE ARROZ Y ALMIDÓN COMO LIGANTE EN LA RESISTENCIA DE PANELES AGLOMERADOS DE USO EN LA CONSTRUCCIÓN” ING. LIZBETH CASAS SANDOVAL
23
CAPÍTULO III DESARROLLO DEL ESTUDIO
3.1. MATERIALES
3.1.1 Cascarilla de arroz
Cascarilla de Arroz
Es una fibra corta que recubre naturalmente el grano para protegerlo del ambiente. Su longitud varía entre 5 y 11 mm según la especie considerada, es de estructura ondulada y apariencia superficial irregular. Tiene propiedades altamente abrasivas, 6 en la escala de Mohs en estado natural. Su estructura presenta un volumen poroso del 54%, cavidades que permanecerán cerradas en tanto no se someta a un proceso de combustión.
Esta fibra presenta un comportamiento ignífugo, es decir que no inicia fácilmente la combustión y no produce llama mientras se quema. Es probable que este aspecto, así como su alta estabilidad bioquímica, se deba a que es la fibra vegetal con mayor contenido de minerales, así como también a su alta concentración de silicio (90 al 97% SiO). Calero & Vásconez (2012)
La cascarilla de arroz es difícil de manejar, ya que se dispersa fácilmente, dada su densidad (650 Kg/cm3) y tamaño, lo que le da cierta capacidad de fluir, por lo que sus aplicaciones en estas condiciones son limitadas; en tal sentido se procederá a su aglomeración.
Geometría de las Partículas
Ginzel y Peraza (1966) citados por Poblete (1979), mencionan que la geometría de las partículas determina la superficie específica del material que se debe recubrir con el adhesivo. La superficie específica depende fundamentalmente de la densidad de la madera y del espesor. Esto significa una mayor superficie de encolado al disminuir el tamaño de las partículas, obteniéndose para una misma cantidad de adhesivo un encolado defectuoso o insuficiente. Otro factor negativo es la superficie rugosa del material, disminuyéndose el área de contacto entre los gránulos.
Para Ginzel, W. et al., (1966) citado por Medina & Ambrogi (1994), el tipo y forma de la partícula es determinante en cuanto a la calidad del panel a producir. Así la resistencia del aglomerado depende de la propia resistencia de la partícula y de su capacidad para transmitir la misma al panel. La resistencia de la partícula depende fundamentalmente de su
UNIVERSIDAD NACIONAL DE INGENIERIA CAPÍTULO III FACULTAD DE INGENIERÍA CIVIL DESARROLLO UNIDAD DE POSGRADO DEL ESTUDIO
TESIS: “EFECTO DE LA UTILIZACIÓN DE LA CASCARILLA DE ARROZ Y ALMIDÓN COMO LIGANTE EN LA RESISTENCIA DE PANELES AGLOMERADOS DE USO EN LA CONSTRUCCIÓN” ING. LIZBETH CASAS SANDOVAL
24
peso específico, y su capacidad de transmisión depende del tipo y forma de aplicación de la cola, así como de las características de las partículas.
La forma de la partícula afecta la calidad del encolado y así ambos factores afectan a la resistencia mecánica del panel (Medina, J. C. & Ambrogi, 1994).
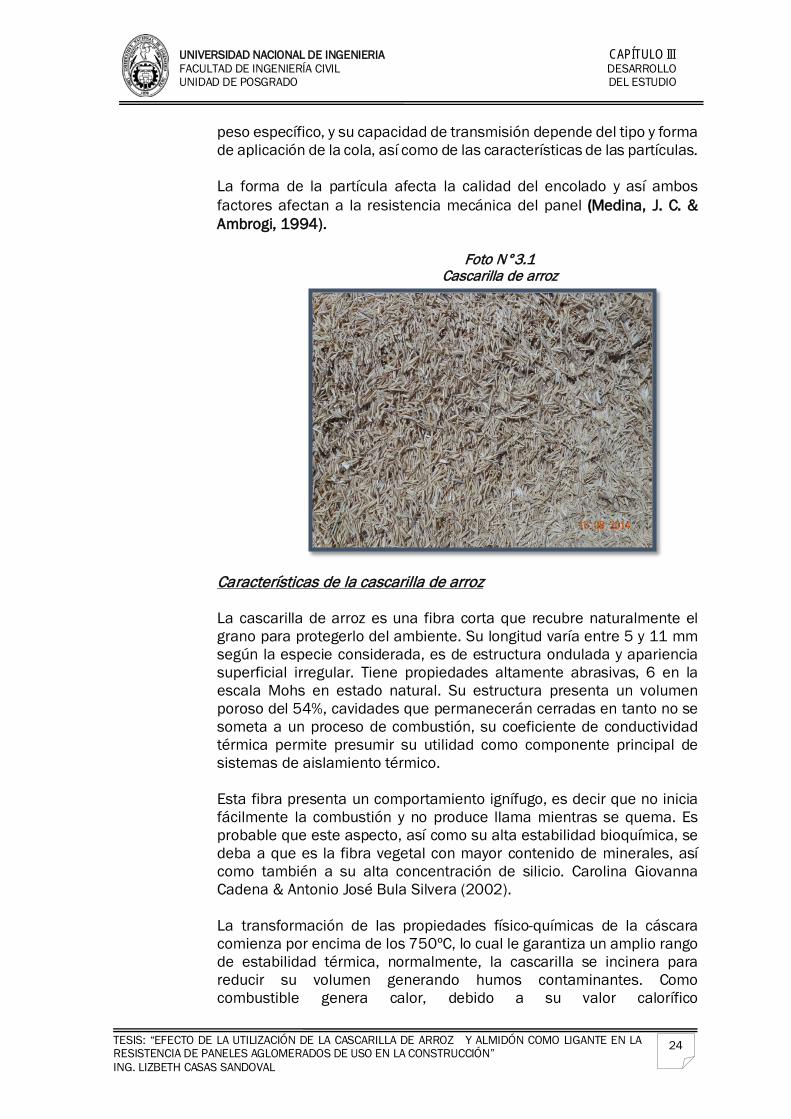
Foto N°3.1
Cascarilla de arroz
Características de la cascarilla de arroz
La cascarilla de arroz es una fibra corta que recubre naturalmente el grano para protegerlo del ambiente. Su longitud varía entre 5 y 11 mm según la especie considerada, es de estructura ondulada y apariencia superficial irregular. Tiene propiedades altamente abrasivas, 6 en la escala Mohs en estado natural. Su estructura presenta un volumen poroso del 54%, cavidades que permanecerán cerradas en tanto no se someta a un proceso de combustión, su coeficiente de conductividad térmica permite presumir su utilidad como componente principal de sistemas de aislamiento térmico. Esta fibra presenta un comportamiento ignífugo, es decir que no inicia fácilmente la combustión y no produce llama mientras se quema. Es probable que este aspecto, así como su alta estabilidad bioquímica, se deba a que es la fibra vegetal con mayor contenido de minerales, así como también a su alta concentración de silicio. Carolina Giovanna Cadena & Antonio José Bula Silvera (2002).
La transformación de las propiedades físico-químicas de la cáscara comienza por encima de los 750ºC, lo cual le garantiza un amplio rango de estabilidad térmica, normalmente, la cascarilla se incinera para reducir su volumen generando humos contaminantes. Como combustible genera calor, debido a su valor calorífico
UNIVERSIDAD NACIONAL DE INGENIERIA CAPÍTULO III FACULTAD DE INGENIERÍA CIVIL DESARROLLO UNIDAD DE POSGRADO DEL ESTUDIO
TESIS: “EFECTO DE LA UTILIZACIÓN DE LA CASCARILLA DE ARROZ Y ALMIDÓN COMO LIGANTE EN LA RESISTENCIA DE PANELES AGLOMERADOS DE USO EN LA CONSTRUCCIÓN” ING. LIZBETH CASAS SANDOVAL
25
(aproximadamente 16720 KJ/kg), y la ceniza resultante contiene un porcentaje en sílice superior al 90%. Francisco Tello Perú SAC, (2009). La cascarilla de arroz presenta una gran variedad de características fisicoquímicas que es preciso estudiar, según la aplicación que se desee darle. El contenido de humedad, la composición química y el poder calorífico de la cascarilla son aspectos que hay que conocer para la construcción y el funcionamiento de hornos y hogares mecánicos que son los más adecuados para la quema e incineración de este subproducto de la molinería arrocera. Francisco Tello Perú SAC, (2009). Composición química
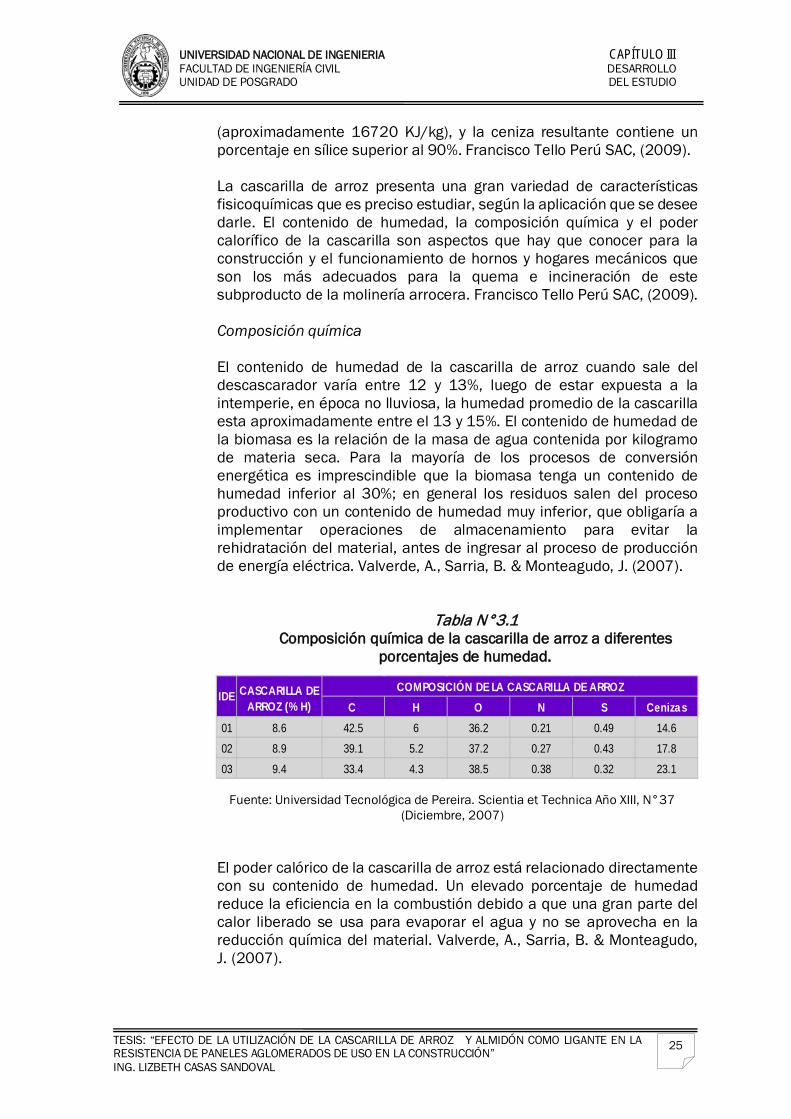
El contenido de humedad de la cascarilla de arroz cuando sale del descascarador varía entre 12 y 13%, luego de estar expuesta a la intemperie, en época no lluviosa, la humedad promedio de la cascarilla esta aproximadamente entre el 13 y 15%. El contenido de humedad de la biomasa es la relación de la masa de agua contenida por kilogramo de materia seca. Para la mayoría de los procesos de conversión energética es imprescindible que la biomasa tenga un contenido de humedad inferior al 30%; en general los residuos salen del proceso productivo con un contenido de humedad muy inferior, que obligaría a implementar operaciones de almacenamiento para evitar la rehidratación del material, antes de ingresar al proceso de producción de energía eléctrica. Valverde, A., Sarria, B. & Monteagudo, J. (2007).
Tabla N°3.1 Composición química de la cascarilla de arroz a diferentes
porcentajes de humedad.
Fuente: Universidad Tecnológica de Pereira. Scientia et Technica Año XIII, N°37 (Diciembre, 2007)
El poder calórico de la cascarilla de arroz está relacionado directamente con su contenido de humedad. Un elevado porcentaje de humedad reduce la eficiencia en la combustión debido a que una gran parte del calor liberado se usa para evaporar el agua y no se aprovecha en la reducción química del material. Valverde, A., Sarria, B. & Monteagudo, J. (2007).
C H O N S Cenizas01 8.6 42.5 6 36.2 0.21 0.49 14.602 8.9 39.1 5.2 37.2 0.27 0.43 17.803 9.4 33.4 4.3 38.5 0.38 0.32 23.1
CASCARILLA DE ARROZ (% H)
IDECOMPOSICIÓN DE LA CASCARILLA DE ARROZ
UNIVERSIDAD NACIONAL DE INGENIERIA CAPÍTULO III FACULTAD DE INGENIERÍA CIVIL DESARROLLO UNIDAD DE POSGRADO DEL ESTUDIO
TESIS: “EFECTO DE LA UTILIZACIÓN DE LA CASCARILLA DE ARROZ Y ALMIDÓN COMO LIGANTE EN LA RESISTENCIA DE PANELES AGLOMERADOS DE USO EN LA CONSTRUCCIÓN” ING. LIZBETH CASAS SANDOVAL
26
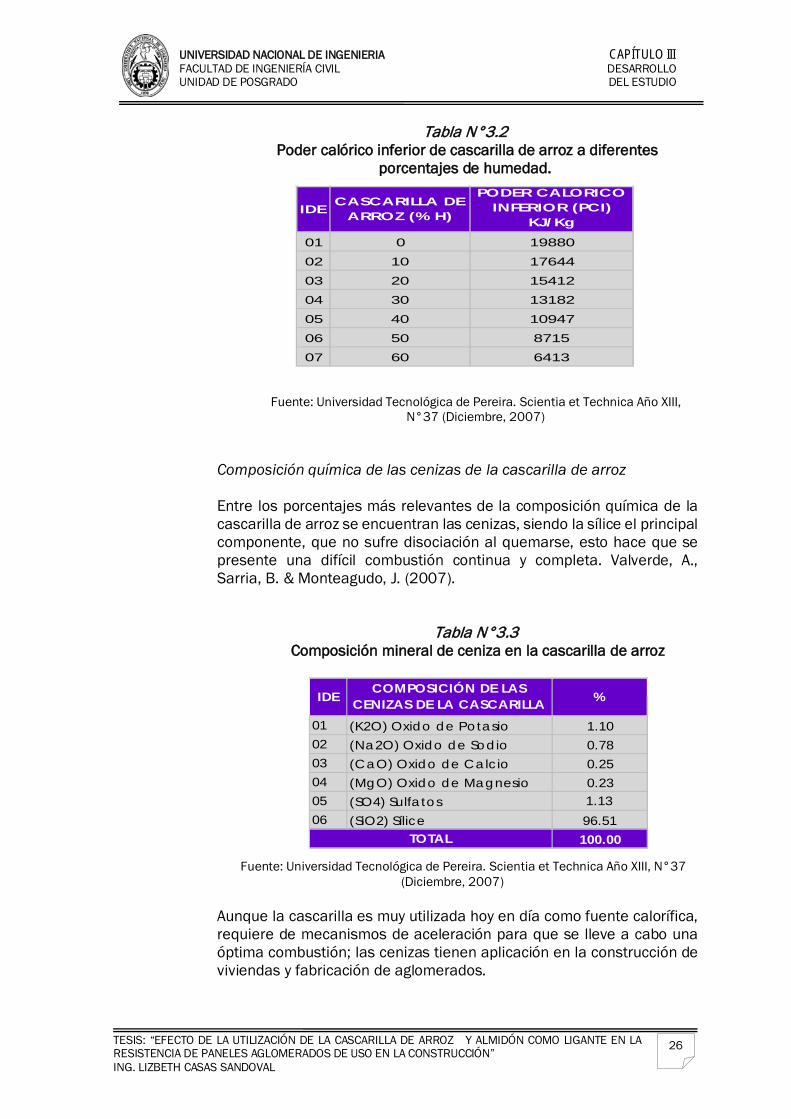
Tabla N°3.2 Poder calórico inferior de cascarilla de arroz a diferentes
porcentajes de humedad.
Fuente: Universidad Tecnológica de Pereira. Scientia et Technica Año XIII, N°37 (Diciembre, 2007)
Composición química de las cenizas de la cascarilla de arroz
Entre los porcentajes más relevantes de la composición química de la cascarilla de arroz se encuentran las cenizas, siendo la sílice el principal componente, que no sufre disociación al quemarse, esto hace que se presente una difícil combustión continua y completa. Valverde, A., Sarria, B. & Monteagudo, J. (2007).
Tabla N°3.3 Composición mineral de ceniza en la cascarilla de arroz
Fuente: Universidad Tecnológica de Pereira. Scientia et Technica Año XIII, N°37 (Diciembre, 2007)
Aunque la cascarilla es muy utilizada hoy en día como fuente calorífica, requiere de mecanismos de aceleración para que se lleve a cabo una óptima combustión; las cenizas tienen aplicación en la construcción de viviendas y fabricación de aglomerados.
01 0 1988002 10 1764403 20 1541204 30 1318205 40 1094706 50 871507 60 6413
IDE CASCARILLA DE ARROZ (% H)
PODER CALORICO INFERIOR (PCI)
KJ/Kg
01 (K2O) Oxido de Potasio 1.1002 (Na2O) Oxido de Sodio 0.7803 (CaO) Oxido de Calcio 0.2504 (MgO) Oxido de Magnesio 0.2305 (SO4) Sulfatos 1.1306 (SiO2) Sílice 96.51
100.00
IDE COMPOSICIÓN DE LAS CENIZAS DE LA CASCARILLA %
TOTAL
UNIVERSIDAD NACIONAL DE INGENIERIA CAPÍTULO III FACULTAD DE INGENIERÍA CIVIL DESARROLLO UNIDAD DE POSGRADO DEL ESTUDIO
TESIS: “EFECTO DE LA UTILIZACIÓN DE LA CASCARILLA DE ARROZ Y ALMIDÓN COMO LIGANTE EN LA RESISTENCIA DE PANELES AGLOMERADOS DE USO EN LA CONSTRUCCIÓN” ING. LIZBETH CASAS SANDOVAL
27
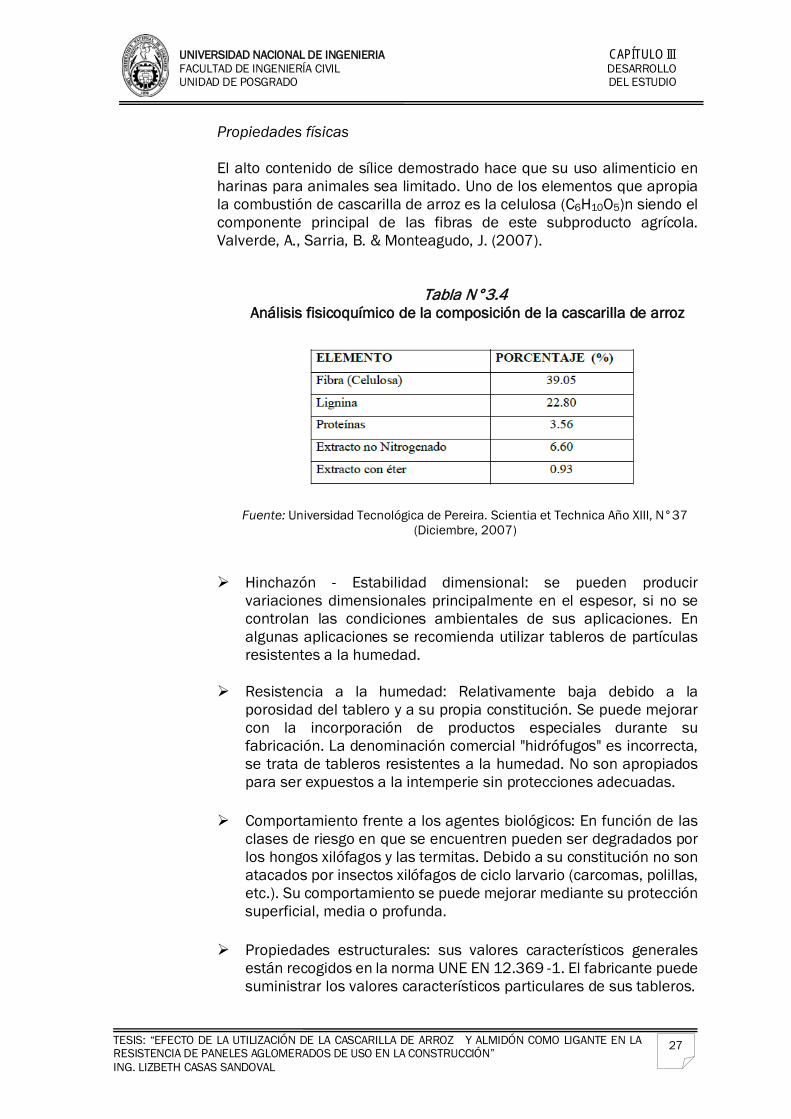
Propiedades físicas
El alto contenido de sílice demostrado hace que su uso alimenticio en harinas para animales sea limitado. Uno de los elementos que apropia la combustión de cascarilla de arroz es la celulosa (C6H10O5)n siendo el componente principal de las fibras de este subproducto agrícola. Valverde, A., Sarria, B. & Monteagudo, J. (2007).
Tabla N°3.4 Análisis fisicoquímico de la composición de la cascarilla de arroz
Fuente: Universidad Tecnológica de Pereira. Scientia et Technica Año XIII, N°37 (Diciembre, 2007)
Hinchazón - Estabilidad dimensional: se pueden producir variaciones dimensionales principalmente en el espesor, si no se controlan las condiciones ambientales de sus aplicaciones. En algunas aplicaciones se recomienda utilizar tableros de partículas resistentes a la humedad.
Resistencia a la humedad: Relativamente baja debido a la
porosidad del tablero y a su propia constitución. Se puede mejorar con la incorporación de productos especiales durante su fabricación. La denominación comercial "hidrófugos" es incorrecta, se trata de tableros resistentes a la humedad. No son apropiados para ser expuestos a la intemperie sin protecciones adecuadas.
Comportamiento frente a los agentes biológicos: En función de las
clases de riesgo en que se encuentren pueden ser degradados por los hongos xilófagos y las termitas. Debido a su constitución no son atacados por insectos xilófagos de ciclo larvario (carcomas, polillas, etc.). Su comportamiento se puede mejorar mediante su protección superficial, media o profunda.
Propiedades estructurales: sus valores característicos generales
están recogidos en la norma UNE EN 12.369 -1. El fabricante puede suministrar los valores característicos particulares de sus tableros.
UNIVERSIDAD NACIONAL DE INGENIERIA CAPÍTULO III FACULTAD DE INGENIERÍA CIVIL DESARROLLO UNIDAD DE POSGRADO DEL ESTUDIO
TESIS: “EFECTO DE LA UTILIZACIÓN DE LA CASCARILLA DE ARROZ Y ALMIDÓN COMO LIGANTE EN LA RESISTENCIA DE PANELES AGLOMERADOS DE USO EN LA CONSTRUCCIÓN” ING. LIZBETH CASAS SANDOVAL
28
3.1.2 Almidón
El elemento aglomerante o aglutinante que debe conferirle la tensión de unión entre las partículas es la resina, para la realización del presente estudio se ha optado por el uso de un aglomerante de almidón de yuca, ya que es un adherente natural de fácil fabricación y obtención a nivel nacional y que además no representa el impacto negativo para el ecosistema propio que generan aglutinantes químicos utilizados comúnmente en la producción de aglomerados de partículas. Los almidones comerciales se obtienen de las semillas de cereales, particularmente de maíz (Zea mays), trigo (Triticum spp.), varios tipos de arroz (Oryza sativa), y de algunas raíces y tubérculos, particularmente de papa (Solanum tuberosum) y mandioca (Manihot esculenta).
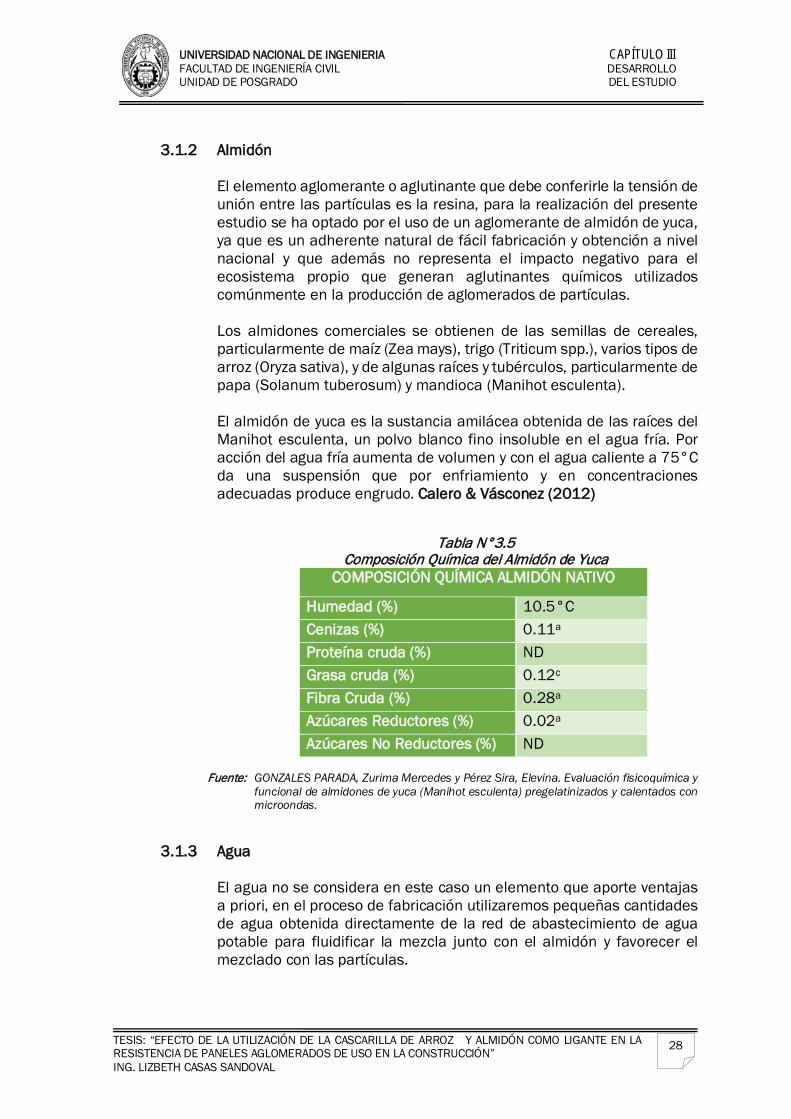
El almidón de yuca es la sustancia amilácea obtenida de las raíces del Manihot esculenta, un polvo blanco fino insoluble en el agua fría. Por acción del agua fría aumenta de volumen y con el agua caliente a 75°C da una suspensión que por enfriamiento y en concentraciones adecuadas produce engrudo. Calero & Vásconez (2012)
Tabla N°3.5 Composición Química del Almidón de Yuca
COMPOSICIÓN QUÍMICA ALMIDÓN NATIVO
Humedad (%) 10.5°C Cenizas (%) 0.11a
Proteína cruda (%) ND Grasa cruda (%) 0.12c
Fibra Cruda (%) 0.28a
Azúcares Reductores (%) 0.02a
Azúcares No Reductores (%) ND Fuente: GONZALES PARADA, Zurima Mercedes y Pérez Sira, Elevina. Evaluación fisicoquímica y
funcional de almidones de yuca (Manihot esculenta) pregelatinizados y calentados con microondas.
3.1.3 Agua
El agua no se considera en este caso un elemento que aporte ventajas a priori, en el proceso de fabricación utilizaremos pequeñas cantidades de agua obtenida directamente de la red de abastecimiento de agua potable para fluidificar la mezcla junto con el almidón y favorecer el mezclado con las partículas.
UNIVERSIDAD NACIONAL DE INGENIERIA CAPÍTULO III FACULTAD DE INGENIERÍA CIVIL DESARROLLO UNIDAD DE POSGRADO DEL ESTUDIO
TESIS: “EFECTO DE LA UTILIZACIÓN DE LA CASCARILLA DE ARROZ Y ALMIDÓN COMO LIGANTE EN LA RESISTENCIA DE PANELES AGLOMERADOS DE USO EN LA CONSTRUCCIÓN” ING. LIZBETH CASAS SANDOVAL
29
3.2. FABRICACIÓN DE LOS PANELES
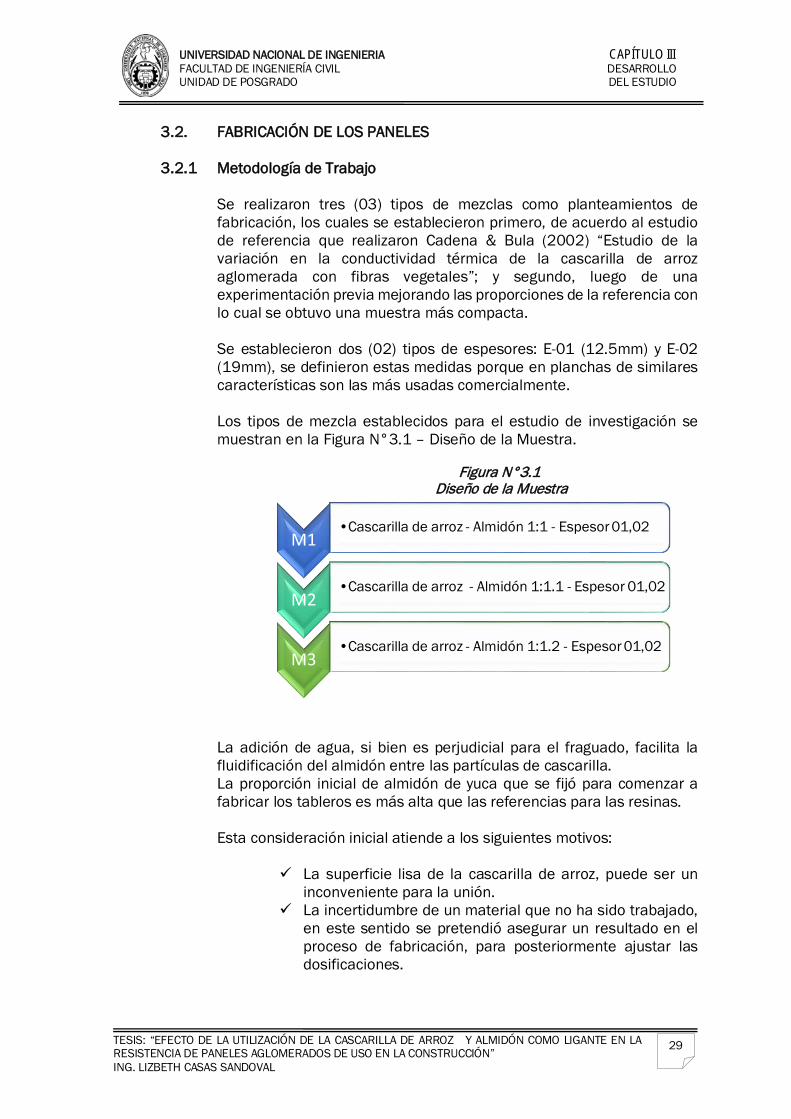
3.2.1 Metodología de Trabajo
Se realizaron tres (03) tipos de mezclas como planteamientos de fabricación, los cuales se establecieron primero, de acuerdo al estudio de referencia que realizaron Cadena & Bula (2002) “Estudio de la variación en la conductividad térmica de la cascarilla de arroz aglomerada con fibras vegetales”; y segundo, luego de una experimentación previa mejorando las proporciones de la referencia con lo cual se obtuvo una muestra más compacta. Se establecieron dos (02) tipos de espesores: E-01 (12.5mm) y E-02 (19mm), se definieron estas medidas porque en planchas de similares características son las más usadas comercialmente. Los tipos de mezcla establecidos para el estudio de investigación se muestran en la Figura N°3.1 – Diseño de la Muestra.
Figura N°3.1
Diseño de la Muestra
La adición de agua, si bien es perjudicial para el fraguado, facilita la fluidificación del almidón entre las partículas de cascarilla. La proporción inicial de almidón de yuca que se fijó para comenzar a fabricar los tableros es más alta que las referencias para las resinas.
Esta consideración inicial atiende a los siguientes motivos:
La superficie lisa de la cascarilla de arroz, puede ser un
inconveniente para la unión. La incertidumbre de un material que no ha sido trabajado,
en este sentido se pretendió asegurar un resultado en el proceso de fabricación, para posteriormente ajustar las dosificaciones.
M1•Cascarilla de arroz - Almidón 1:1 - Espesor 01,02
M2•Cascarilla de arroz - Almidón 1:1.1 - Espesor 01,02
M3•Cascarilla de arroz - Almidón 1:1.2 - Espesor 01,02
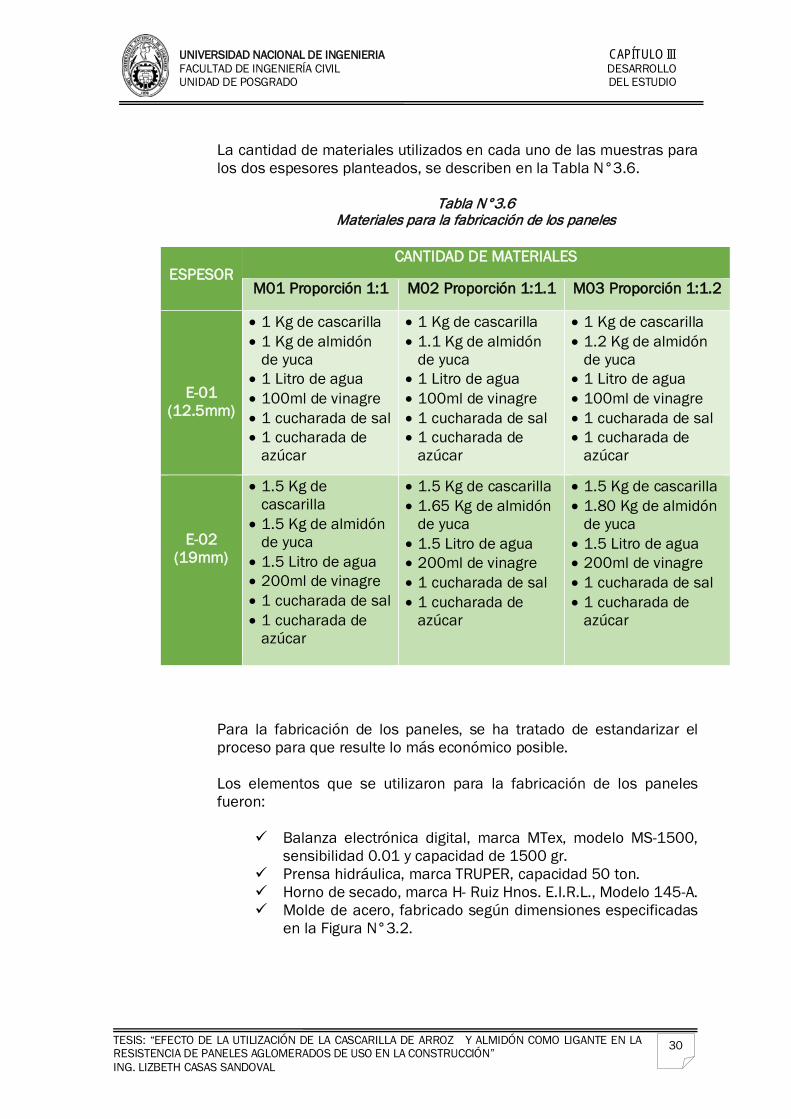
UNIVERSIDAD NACIONAL DE INGENIERIA CAPÍTULO III FACULTAD DE INGENIERÍA CIVIL DESARROLLO UNIDAD DE POSGRADO DEL ESTUDIO
TESIS: “EFECTO DE LA UTILIZACIÓN DE LA CASCARILLA DE ARROZ Y ALMIDÓN COMO LIGANTE EN LA RESISTENCIA DE PANELES AGLOMERADOS DE USO EN LA CONSTRUCCIÓN” ING. LIZBETH CASAS SANDOVAL
30
La cantidad de materiales utilizados en cada uno de las muestras para los dos espesores planteados, se describen en la Tabla N°3.6.
Tabla N°3.6 Materiales para la fabricación de los paneles
ESPESOR CANTIDAD DE MATERIALES
M01 Proporción 1:1 M02 Proporción 1:1.1 M03 Proporción 1:1.2
E-01 (12.5mm)
• 1 Kg de cascarilla • 1 Kg de almidón
de yuca • 1 Litro de agua • 100ml de vinagre • 1 cucharada de sal • 1 cucharada de
azúcar
• 1 Kg de cascarilla • 1.1 Kg de almidón
de yuca • 1 Litro de agua • 100ml de vinagre • 1 cucharada de sal • 1 cucharada de
azúcar
• 1 Kg de cascarilla • 1.2 Kg de almidón
de yuca • 1 Litro de agua • 100ml de vinagre • 1 cucharada de sal • 1 cucharada de
azúcar
E-02 (19mm)
• 1.5 Kg de cascarilla
• 1.5 Kg de almidón de yuca
• 1.5 Litro de agua • 200ml de vinagre • 1 cucharada de sal • 1 cucharada de
azúcar
• 1.5 Kg de cascarilla • 1.65 Kg de almidón
de yuca • 1.5 Litro de agua • 200ml de vinagre • 1 cucharada de sal • 1 cucharada de
azúcar
• 1.5 Kg de cascarilla • 1.80 Kg de almidón
de yuca • 1.5 Litro de agua • 200ml de vinagre • 1 cucharada de sal • 1 cucharada de
azúcar
Para la fabricación de los paneles, se ha tratado de estandarizar el proceso para que resulte lo más económico posible.
Los elementos que se utilizaron para la fabricación de los paneles fueron:
Balanza electrónica digital, marca MTex, modelo MS-1500,
sensibilidad 0.01 y capacidad de 1500 gr. Prensa hidráulica, marca TRUPER, capacidad 50 ton. Horno de secado, marca H- Ruiz Hnos. E.I.R.L., Modelo 145-A. Molde de acero, fabricado según dimensiones especificadas
en la Figura N°3.2.
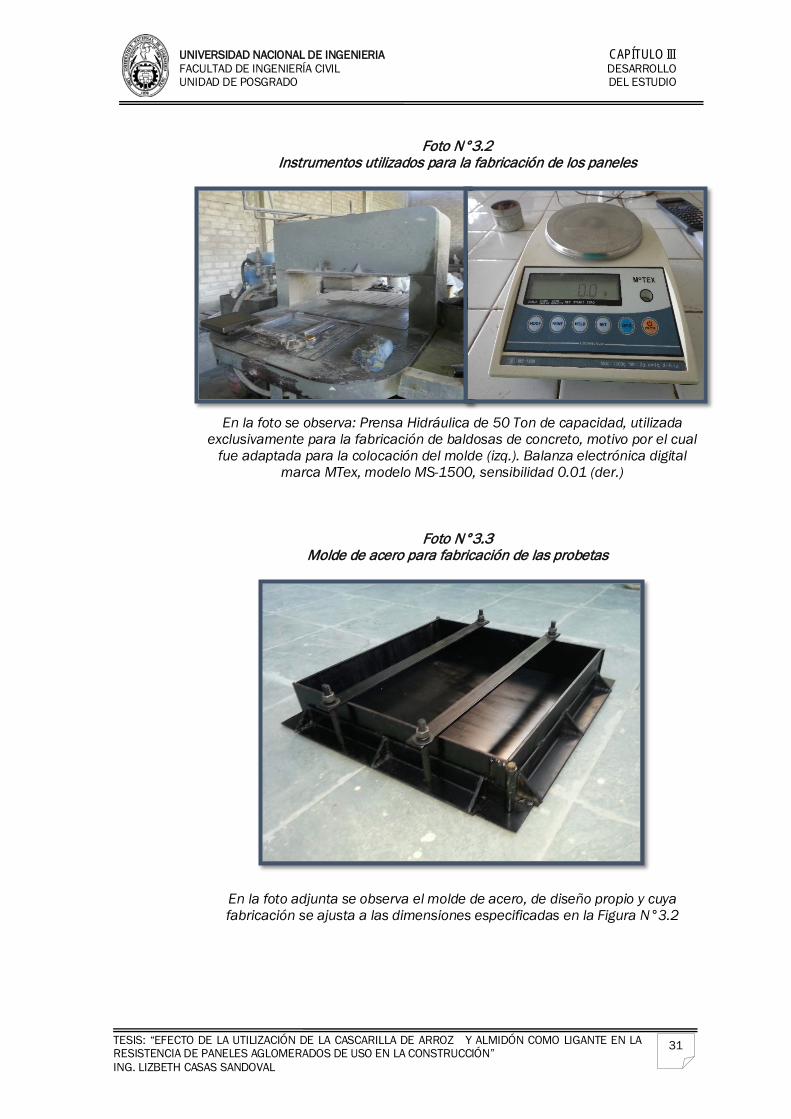
UNIVERSIDAD NACIONAL DE INGENIERIA CAPÍTULO III FACULTAD DE INGENIERÍA CIVIL DESARROLLO UNIDAD DE POSGRADO DEL ESTUDIO
TESIS: “EFECTO DE LA UTILIZACIÓN DE LA CASCARILLA DE ARROZ Y ALMIDÓN COMO LIGANTE EN LA RESISTENCIA DE PANELES AGLOMERADOS DE USO EN LA CONSTRUCCIÓN” ING. LIZBETH CASAS SANDOVAL
31
Foto N°3.2
Instrumentos utilizados para la fabricación de los paneles
En la foto se observa: Prensa Hidráulica de 50 Ton de capacidad, utilizada exclusivamente para la fabricación de baldosas de concreto, motivo por el cual
fue adaptada para la colocación del molde (izq.). Balanza electrónica digital marca MTex, modelo MS-1500, sensibilidad 0.01 (der.)
Foto N°3.3 Molde de acero para fabricación de las probetas
En la foto adjunta se observa el molde de acero, de diseño propio y cuya fabricación se ajusta a las dimensiones especificadas en la Figura N°3.2
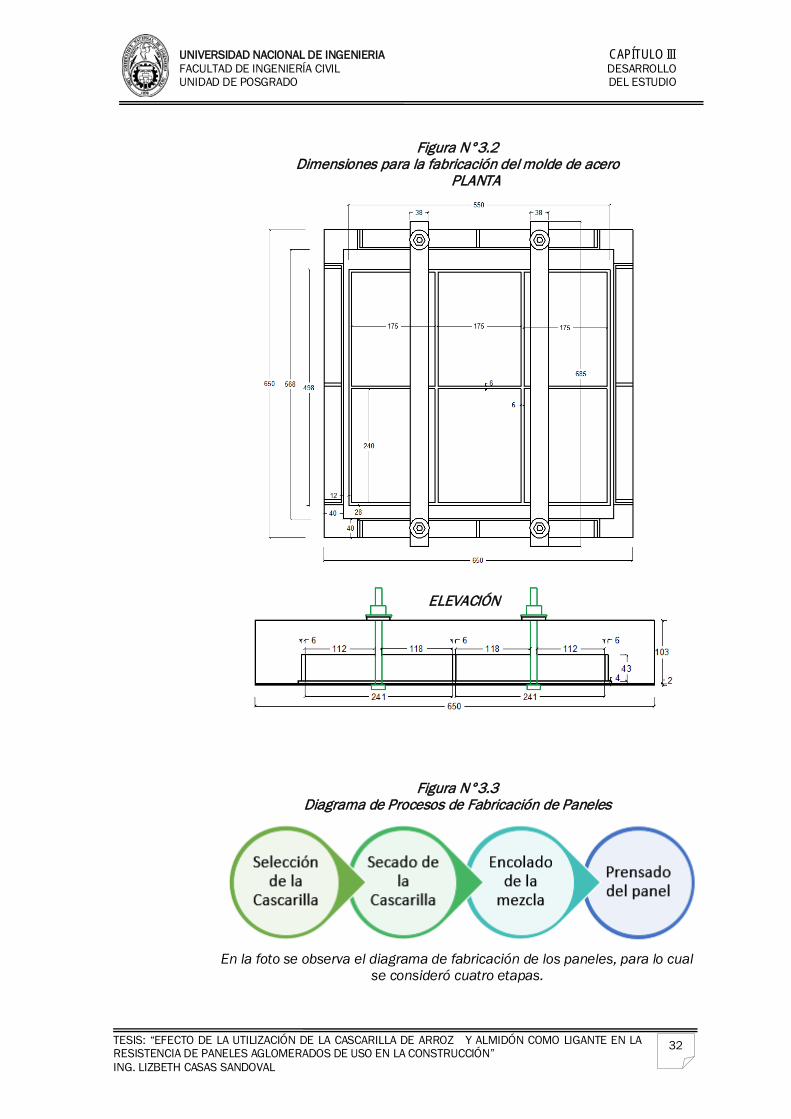
UNIVERSIDAD NACIONAL DE INGENIERIA CAPÍTULO III FACULTAD DE INGENIERÍA CIVIL DESARROLLO UNIDAD DE POSGRADO DEL ESTUDIO
TESIS: “EFECTO DE LA UTILIZACIÓN DE LA CASCARILLA DE ARROZ Y ALMIDÓN COMO LIGANTE EN LA RESISTENCIA DE PANELES AGLOMERADOS DE USO EN LA CONSTRUCCIÓN” ING. LIZBETH CASAS SANDOVAL
32
Figura N°3.2
Dimensiones para la fabricación del molde de acero PLANTA
Figura N°3.3 Diagrama de Procesos de Fabricación de Paneles
En la foto se observa el diagrama de fabricación de los paneles, para lo cual
se consideró cuatro etapas.
ELEVACIÓN
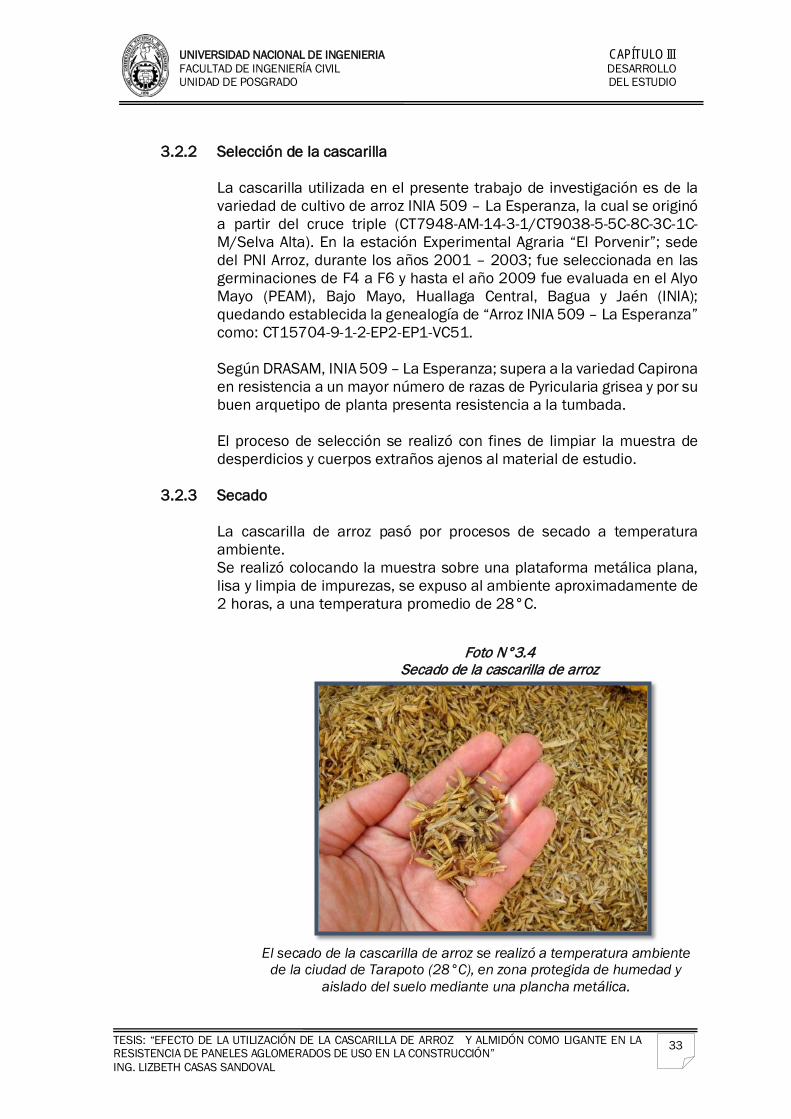
UNIVERSIDAD NACIONAL DE INGENIERIA CAPÍTULO III FACULTAD DE INGENIERÍA CIVIL DESARROLLO UNIDAD DE POSGRADO DEL ESTUDIO
TESIS: “EFECTO DE LA UTILIZACIÓN DE LA CASCARILLA DE ARROZ Y ALMIDÓN COMO LIGANTE EN LA RESISTENCIA DE PANELES AGLOMERADOS DE USO EN LA CONSTRUCCIÓN” ING. LIZBETH CASAS SANDOVAL
33
3.2.2 Selección de la cascarilla
La cascarilla utilizada en el presente trabajo de investigación es de la variedad de cultivo de arroz INIA 509 – La Esperanza, la cual se originó a partir del cruce triple (CT7948-AM-14-3-1/CT9038-5-5C-8C-3C-1C-M/Selva Alta). En la estación Experimental Agraria “El Porvenir”; sede del PNI Arroz, durante los años 2001 – 2003; fue seleccionada en las germinaciones de F4 a F6 y hasta el año 2009 fue evaluada en el Alyo Mayo (PEAM), Bajo Mayo, Huallaga Central, Bagua y Jaén (INIA); quedando establecida la genealogía de “Arroz INIA 509 – La Esperanza” como: CT15704-9-1-2-EP2-EP1-VC51. Según DRASAM, INIA 509 – La Esperanza; supera a la variedad Capirona en resistencia a un mayor número de razas de Pyricularia grisea y por su buen arquetipo de planta presenta resistencia a la tumbada. El proceso de selección se realizó con fines de limpiar la muestra de desperdicios y cuerpos extraños ajenos al material de estudio.
3.2.3 Secado
La cascarilla de arroz pasó por procesos de secado a temperatura ambiente. Se realizó colocando la muestra sobre una plataforma metálica plana, lisa y limpia de impurezas, se expuso al ambiente aproximadamente de 2 horas, a una temperatura promedio de 28°C.
Foto N°3.4 Secado de la cascarilla de arroz
El secado de la cascarilla de arroz se realizó a temperatura ambiente
de la ciudad de Tarapoto (28°C), en zona protegida de humedad y aislado del suelo mediante una plancha metálica.
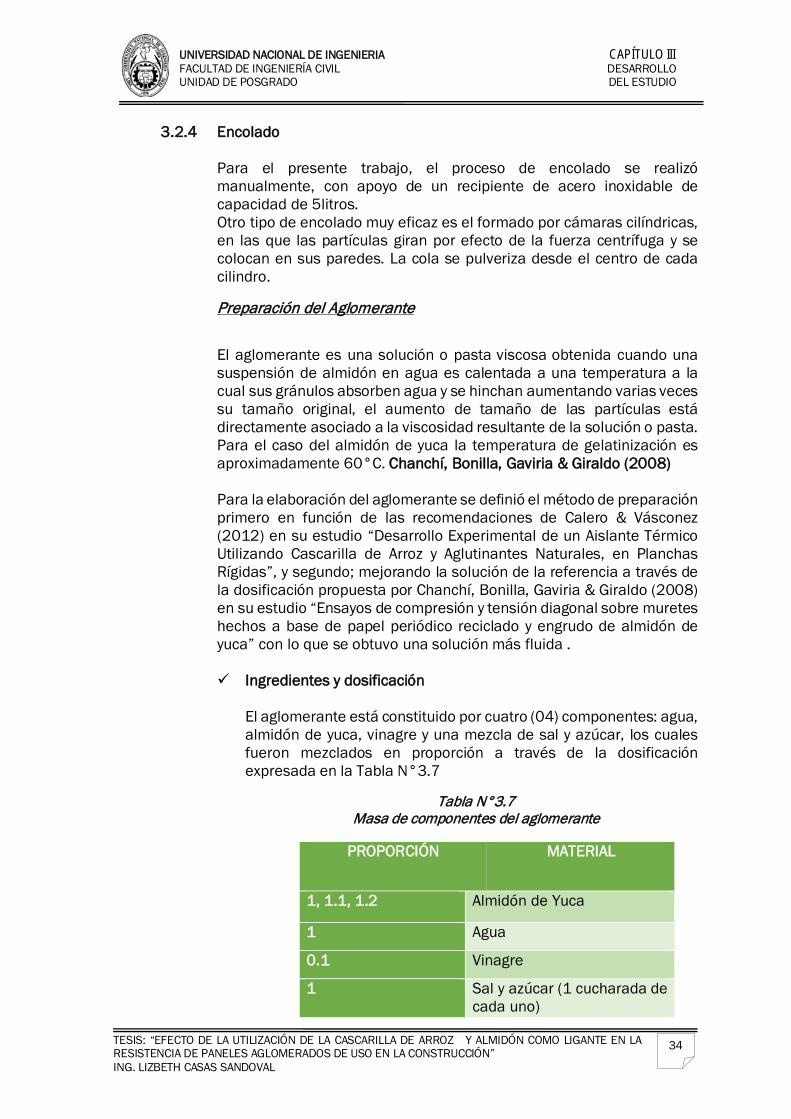
UNIVERSIDAD NACIONAL DE INGENIERIA CAPÍTULO III FACULTAD DE INGENIERÍA CIVIL DESARROLLO UNIDAD DE POSGRADO DEL ESTUDIO
TESIS: “EFECTO DE LA UTILIZACIÓN DE LA CASCARILLA DE ARROZ Y ALMIDÓN COMO LIGANTE EN LA RESISTENCIA DE PANELES AGLOMERADOS DE USO EN LA CONSTRUCCIÓN” ING. LIZBETH CASAS SANDOVAL
34
3.2.4 Encolado
Para el presente trabajo, el proceso de encolado se realizó manualmente, con apoyo de un recipiente de acero inoxidable de capacidad de 5litros. Otro tipo de encolado muy eficaz es el formado por cámaras cilíndricas, en las que las partículas giran por efecto de la fuerza centrífuga y se colocan en sus paredes. La cola se pulveriza desde el centro de cada cilindro.
Preparación del Aglomerante
El aglomerante es una solución o pasta viscosa obtenida cuando una suspensión de almidón en agua es calentada a una temperatura a la cual sus gránulos absorben agua y se hinchan aumentando varias veces su tamaño original, el aumento de tamaño de las partículas está directamente asociado a la viscosidad resultante de la solución o pasta. Para el caso del almidón de yuca la temperatura de gelatinización es aproximadamente 60°C. Chanchí, Bonilla, Gaviria & Giraldo (2008)
Para la elaboración del aglomerante se definió el método de preparación primero en función de las recomendaciones de Calero & Vásconez (2012) en su estudio “Desarrollo Experimental de un Aislante Térmico Utilizando Cascarilla de Arroz y Aglutinantes Naturales, en Planchas Rígidas”, y segundo; mejorando la solución de la referencia a través de la dosificación propuesta por Chanchí, Bonilla, Gaviria & Giraldo (2008) en su estudio “Ensayos de compresión y tensión diagonal sobre muretes hechos a base de papel periódico reciclado y engrudo de almidón de yuca” con lo que se obtuvo una solución más fluida .
Ingredientes y dosificación
El aglomerante está constituido por cuatro (04) componentes: agua, almidón de yuca, vinagre y una mezcla de sal y azúcar, los cuales fueron mezclados en proporción a través de la dosificación expresada en la Tabla N°3.7
Tabla N°3.7
Masa de componentes del aglomerante
PROPORCIÓN MATERIAL
1, 1.1, 1.2 Almidón de Yuca
1 Agua
0.1 Vinagre
1 Sal y azúcar (1 cucharada de cada uno)
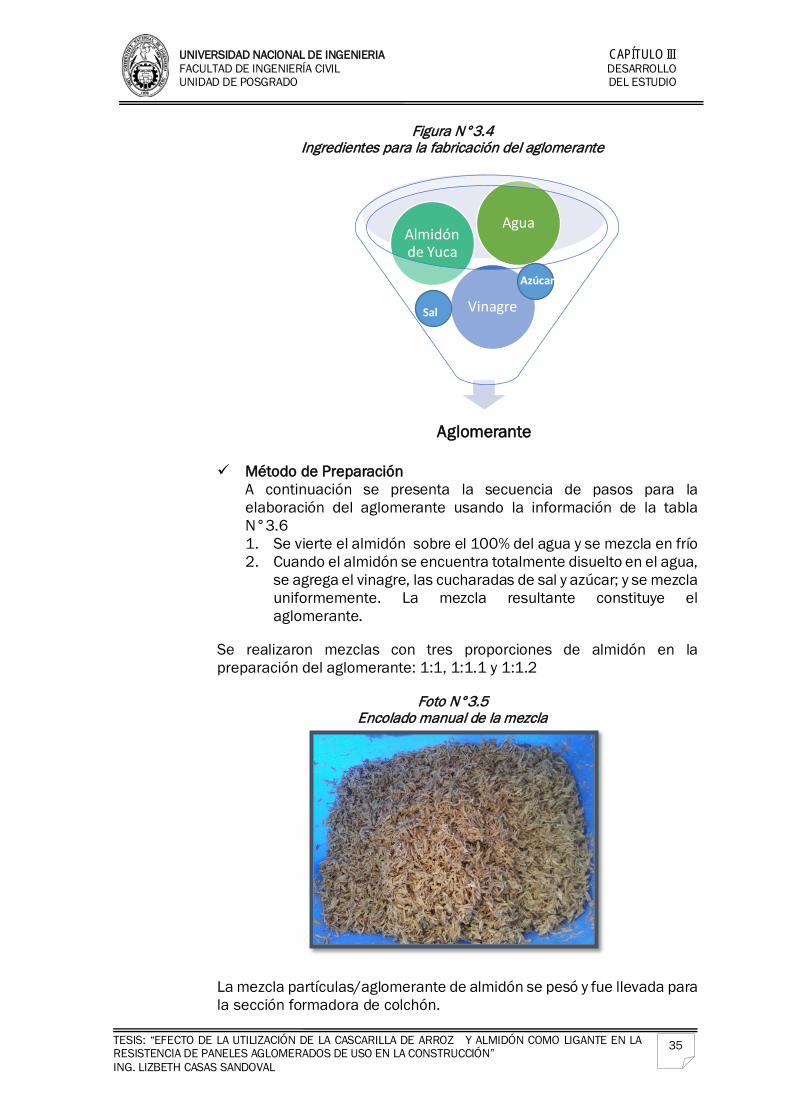
UNIVERSIDAD NACIONAL DE INGENIERIA CAPÍTULO III FACULTAD DE INGENIERÍA CIVIL DESARROLLO UNIDAD DE POSGRADO DEL ESTUDIO
TESIS: “EFECTO DE LA UTILIZACIÓN DE LA CASCARILLA DE ARROZ Y ALMIDÓN COMO LIGANTE EN LA RESISTENCIA DE PANELES AGLOMERADOS DE USO EN LA CONSTRUCCIÓN” ING. LIZBETH CASAS SANDOVAL
35
Figura N°3.4 Ingredientes para la fabricación del aglomerante
Método de Preparación A continuación se presenta la secuencia de pasos para la elaboración del aglomerante usando la información de la tabla N°3.6 1. Se vierte el almidón sobre el 100% del agua y se mezcla en frío 2. Cuando el almidón se encuentra totalmente disuelto en el agua,
se agrega el vinagre, las cucharadas de sal y azúcar; y se mezcla uniformemente. La mezcla resultante constituye el aglomerante.
Se realizaron mezclas con tres proporciones de almidón en la preparación del aglomerante: 1:1, 1:1.1 y 1:1.2
Foto N°3.5
Encolado manual de la mezcla
La mezcla partículas/aglomerante de almidón se pesó y fue llevada para la sección formadora de colchón.
Aglomerante
Vinagre
Almidón de Yuca
Agua
Sal
Azúcar
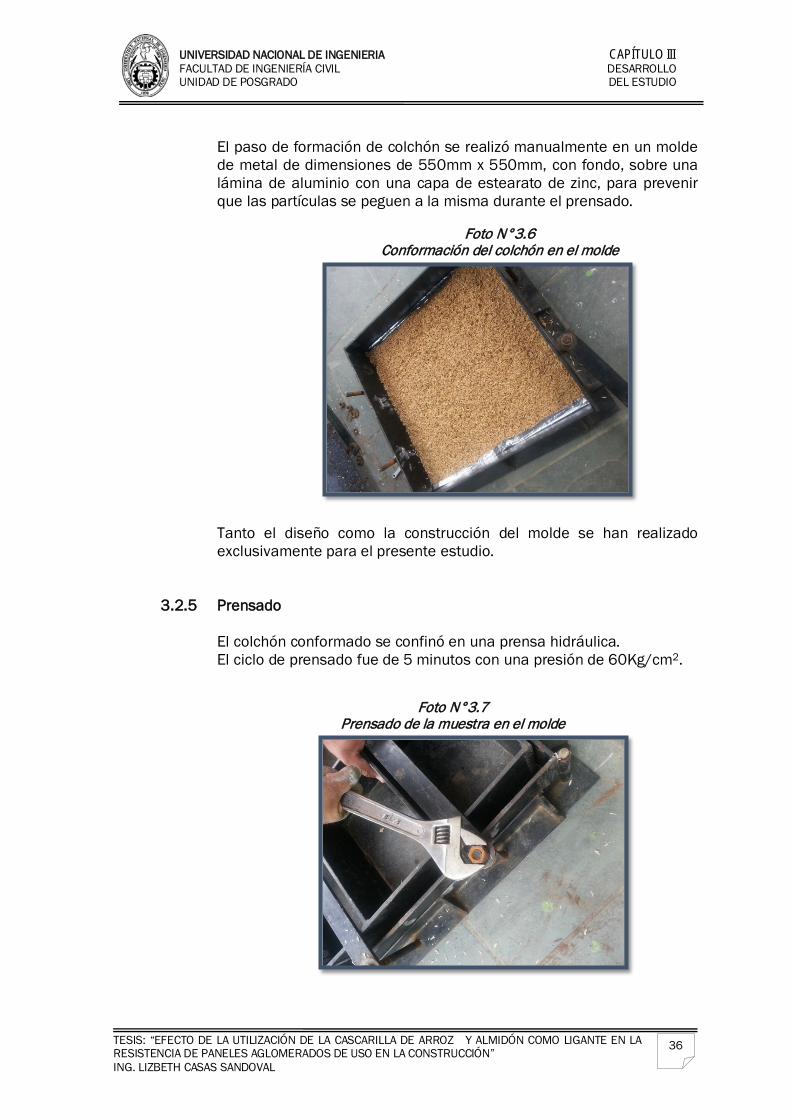
UNIVERSIDAD NACIONAL DE INGENIERIA CAPÍTULO III FACULTAD DE INGENIERÍA CIVIL DESARROLLO UNIDAD DE POSGRADO DEL ESTUDIO
TESIS: “EFECTO DE LA UTILIZACIÓN DE LA CASCARILLA DE ARROZ Y ALMIDÓN COMO LIGANTE EN LA RESISTENCIA DE PANELES AGLOMERADOS DE USO EN LA CONSTRUCCIÓN” ING. LIZBETH CASAS SANDOVAL
36
El paso de formación de colchón se realizó manualmente en un molde de metal de dimensiones de 550mm x 550mm, con fondo, sobre una lámina de aluminio con una capa de estearato de zinc, para prevenir que las partículas se peguen a la misma durante el prensado.
Foto N°3.6
Conformación del colchón en el molde
Tanto el diseño como la construcción del molde se han realizado exclusivamente para el presente estudio.
3.2.5 Prensado
El colchón conformado se confinó en una prensa hidráulica. El ciclo de prensado fue de 5 minutos con una presión de 60Kg/cm2.
Foto N°3.7 Prensado de la muestra en el molde
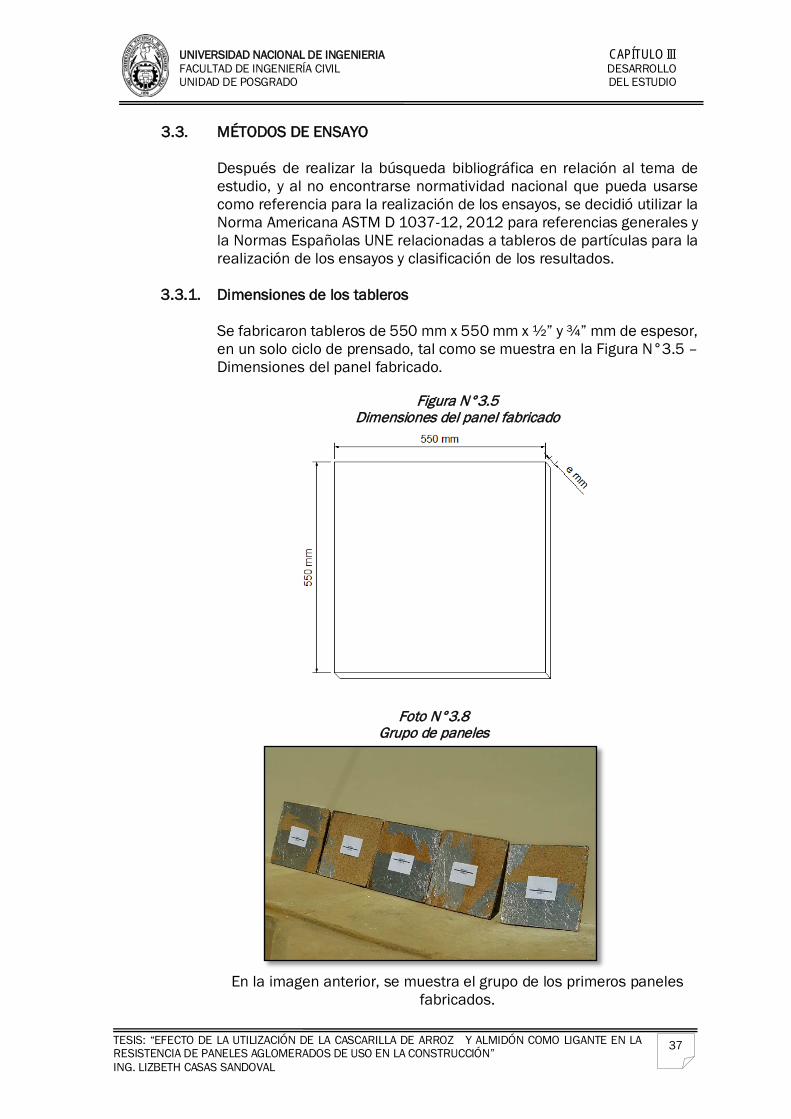
UNIVERSIDAD NACIONAL DE INGENIERIA CAPÍTULO III FACULTAD DE INGENIERÍA CIVIL DESARROLLO UNIDAD DE POSGRADO DEL ESTUDIO
TESIS: “EFECTO DE LA UTILIZACIÓN DE LA CASCARILLA DE ARROZ Y ALMIDÓN COMO LIGANTE EN LA RESISTENCIA DE PANELES AGLOMERADOS DE USO EN LA CONSTRUCCIÓN” ING. LIZBETH CASAS SANDOVAL
37
3.3. MÉTODOS DE ENSAYO Después de realizar la búsqueda bibliográfica en relación al tema de estudio, y al no encontrarse normatividad nacional que pueda usarse como referencia para la realización de los ensayos, se decidió utilizar la Norma Americana ASTM D 1037-12, 2012 para referencias generales y la Normas Españolas UNE relacionadas a tableros de partículas para la realización de los ensayos y clasificación de los resultados.
3.3.1. Dimensiones de los tableros
Se fabricaron tableros de 550 mm x 550 mm x ½” y ¾” mm de espesor, en un solo ciclo de prensado, tal como se muestra en la Figura N°3.5 – Dimensiones del panel fabricado.
Figura N°3.5
Dimensiones del panel fabricado
Foto N°3.8 Grupo de paneles
En la imagen anterior, se muestra el grupo de los primeros paneles
fabricados.
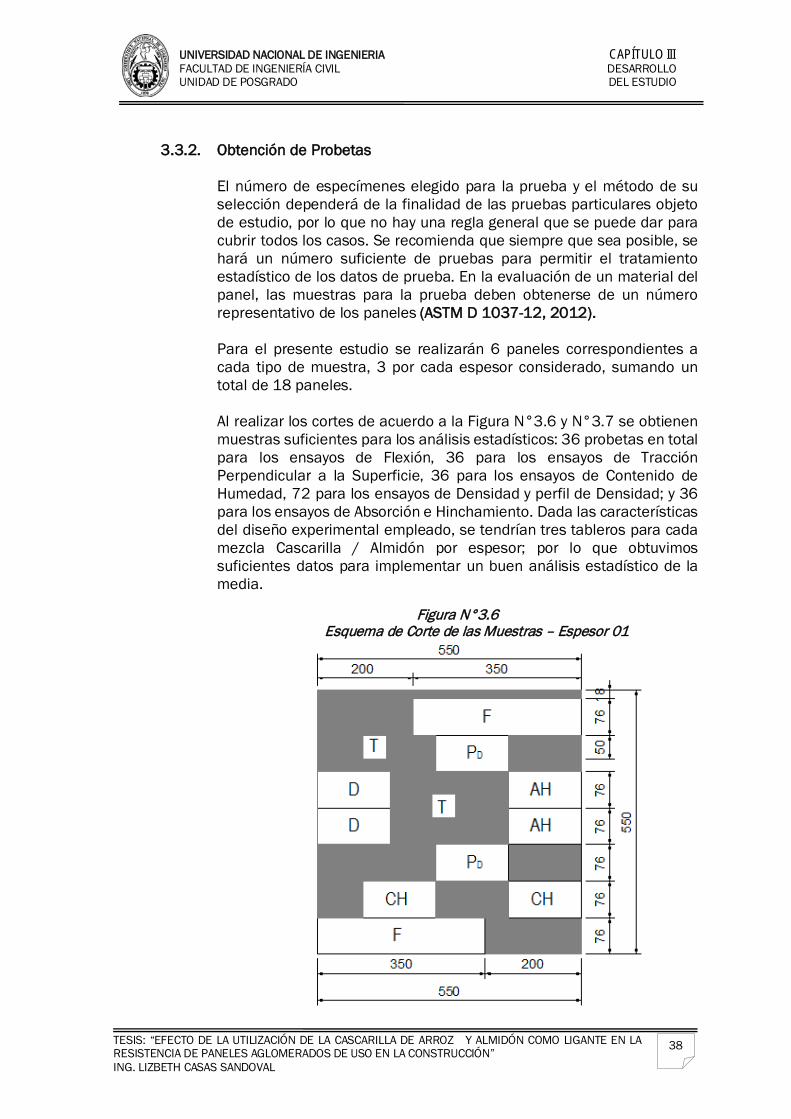
UNIVERSIDAD NACIONAL DE INGENIERIA CAPÍTULO III FACULTAD DE INGENIERÍA CIVIL DESARROLLO UNIDAD DE POSGRADO DEL ESTUDIO
TESIS: “EFECTO DE LA UTILIZACIÓN DE LA CASCARILLA DE ARROZ Y ALMIDÓN COMO LIGANTE EN LA RESISTENCIA DE PANELES AGLOMERADOS DE USO EN LA CONSTRUCCIÓN” ING. LIZBETH CASAS SANDOVAL
38
3.3.2. Obtención de Probetas
El número de especímenes elegido para la prueba y el método de su selección dependerá de la finalidad de las pruebas particulares objeto de estudio, por lo que no hay una regla general que se puede dar para cubrir todos los casos. Se recomienda que siempre que sea posible, se hará un número suficiente de pruebas para permitir el tratamiento estadístico de los datos de prueba. En la evaluación de un material del panel, las muestras para la prueba deben obtenerse de un número representativo de los paneles (ASTM D 1037-12, 2012).
Para el presente estudio se realizarán 6 paneles correspondientes a cada tipo de muestra, 3 por cada espesor considerado, sumando un total de 18 paneles. Al realizar los cortes de acuerdo a la Figura N°3.6 y N°3.7 se obtienen muestras suficientes para los análisis estadísticos: 36 probetas en total para los ensayos de Flexión, 36 para los ensayos de Tracción Perpendicular a la Superficie, 36 para los ensayos de Contenido de Humedad, 72 para los ensayos de Densidad y perfil de Densidad; y 36 para los ensayos de Absorción e Hinchamiento. Dada las características del diseño experimental empleado, se tendrían tres tableros para cada mezcla Cascarilla / Almidón por espesor; por lo que obtuvimos suficientes datos para implementar un buen análisis estadístico de la media.
Figura N°3.6 Esquema de Corte de las Muestras – Espesor 01
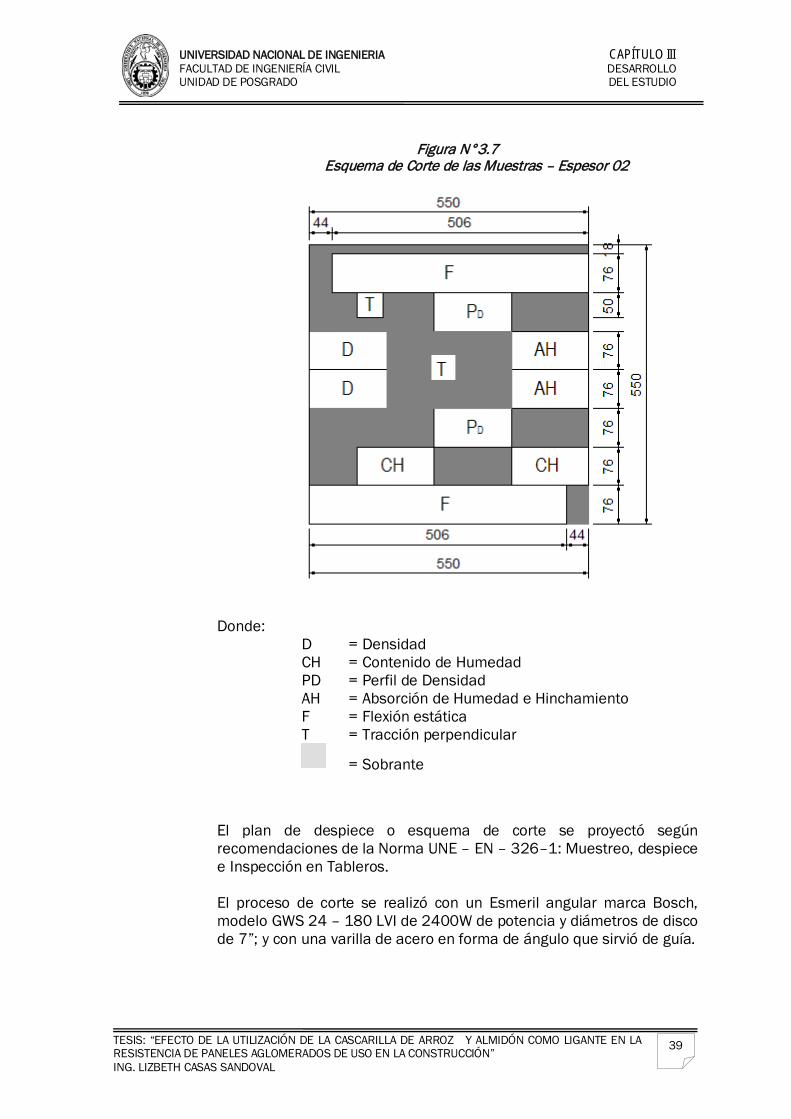
UNIVERSIDAD NACIONAL DE INGENIERIA CAPÍTULO III FACULTAD DE INGENIERÍA CIVIL DESARROLLO UNIDAD DE POSGRADO DEL ESTUDIO
TESIS: “EFECTO DE LA UTILIZACIÓN DE LA CASCARILLA DE ARROZ Y ALMIDÓN COMO LIGANTE EN LA RESISTENCIA DE PANELES AGLOMERADOS DE USO EN LA CONSTRUCCIÓN” ING. LIZBETH CASAS SANDOVAL
39
Figura N°3.7
Esquema de Corte de las Muestras – Espesor 02
Donde: D = Densidad CH = Contenido de Humedad PD = Perfil de Densidad AH = Absorción de Humedad e Hinchamiento
F = Flexión estática T = Tracción perpendicular
= Sobrante
El plan de despiece o esquema de corte se proyectó según recomendaciones de la Norma UNE – EN – 326–1: Muestreo, despiece e Inspección en Tableros. El proceso de corte se realizó con un Esmeril angular marca Bosch, modelo GWS 24 – 180 LVI de 2400W de potencia y diámetros de disco de 7”; y con una varilla de acero en forma de ángulo que sirvió de guía.
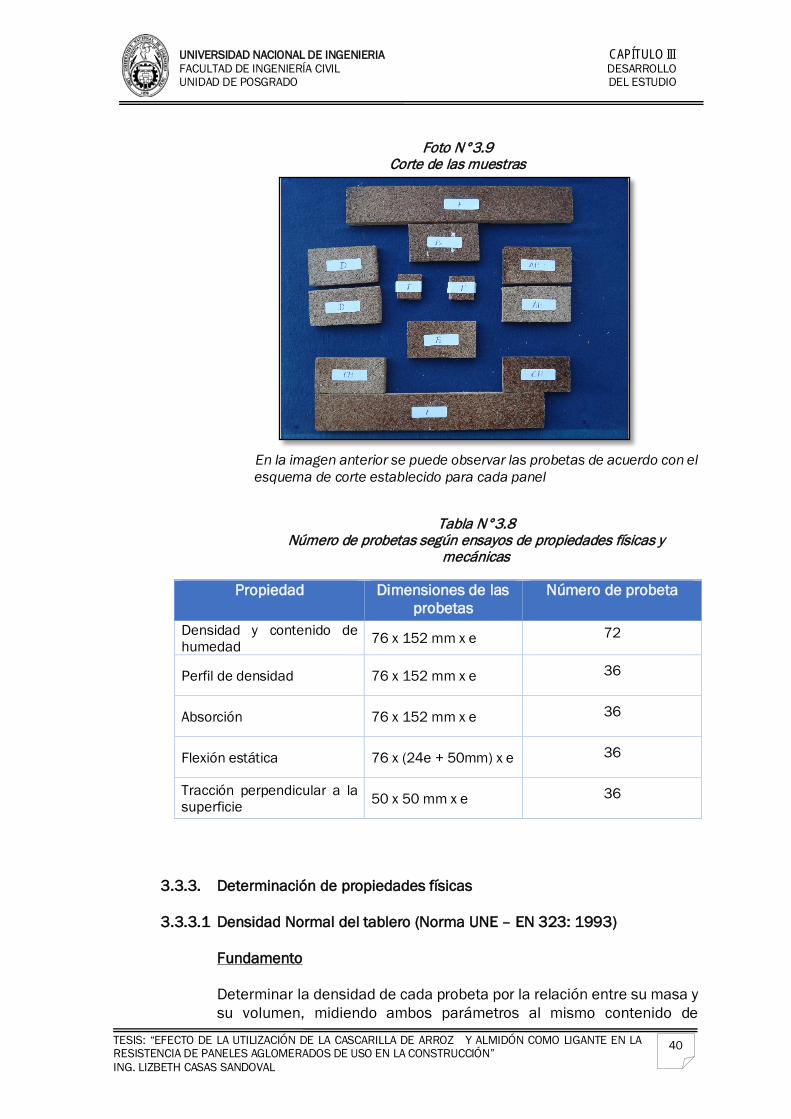
UNIVERSIDAD NACIONAL DE INGENIERIA CAPÍTULO III FACULTAD DE INGENIERÍA CIVIL DESARROLLO UNIDAD DE POSGRADO DEL ESTUDIO
TESIS: “EFECTO DE LA UTILIZACIÓN DE LA CASCARILLA DE ARROZ Y ALMIDÓN COMO LIGANTE EN LA RESISTENCIA DE PANELES AGLOMERADOS DE USO EN LA CONSTRUCCIÓN” ING. LIZBETH CASAS SANDOVAL
40
Foto N°3.9
Corte de las muestras
En la imagen anterior se puede observar las probetas de acuerdo con el esquema de corte establecido para cada panel
Tabla N°3.8 Número de probetas según ensayos de propiedades físicas y
mecánicas
Propiedad Dimensiones de las probetas
Número de probeta
Densidad y contenido de humedad 76 x 152 mm x e 72
Perfil de densidad 76 x 152 mm x e 36
Absorción 76 x 152 mm x e 36
Flexión estática 76 x (24e + 50mm) x e 36
Tracción perpendicular a la superficie 50 x 50 mm x e 36
3.3.3. Determinación de propiedades físicas
3.3.3.1 Densidad Normal del tablero (Norma UNE – EN 323: 1993)
Fundamento Determinar la densidad de cada probeta por la relación entre su masa y su volumen, midiendo ambos parámetros al mismo contenido de
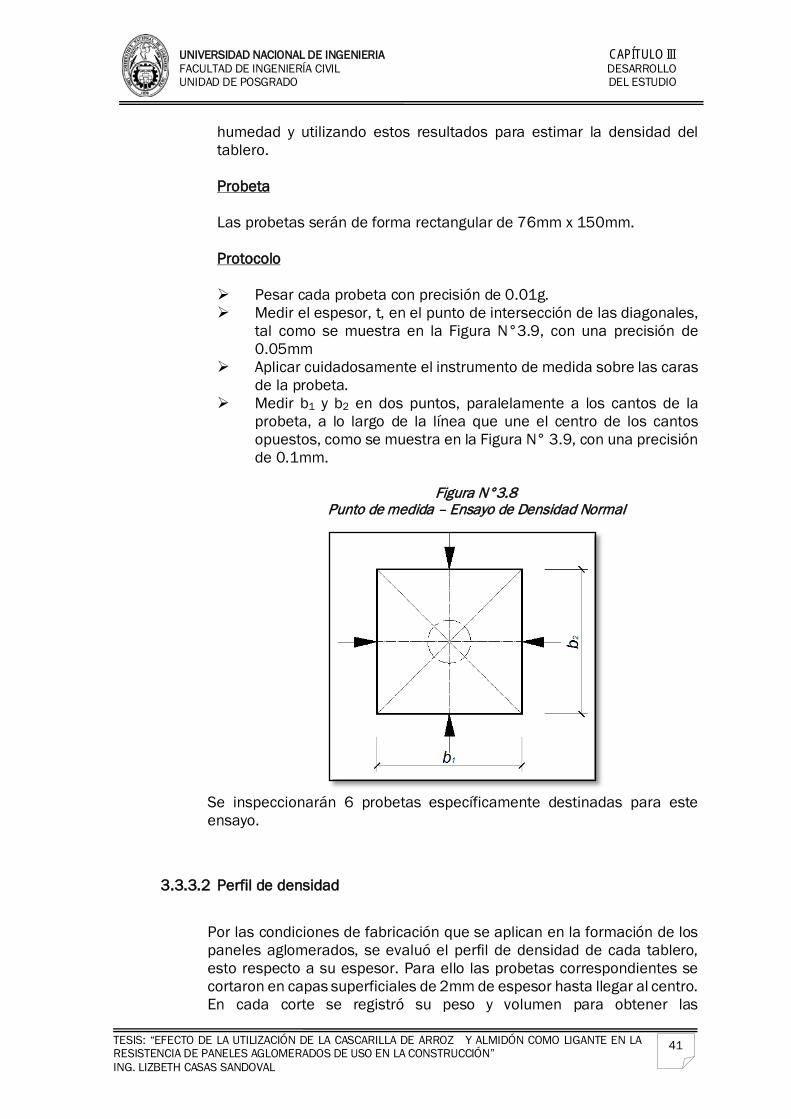
UNIVERSIDAD NACIONAL DE INGENIERIA CAPÍTULO III FACULTAD DE INGENIERÍA CIVIL DESARROLLO UNIDAD DE POSGRADO DEL ESTUDIO
TESIS: “EFECTO DE LA UTILIZACIÓN DE LA CASCARILLA DE ARROZ Y ALMIDÓN COMO LIGANTE EN LA RESISTENCIA DE PANELES AGLOMERADOS DE USO EN LA CONSTRUCCIÓN” ING. LIZBETH CASAS SANDOVAL
41
humedad y utilizando estos resultados para estimar la densidad del tablero. Probeta Las probetas serán de forma rectangular de 76mm x 150mm. Protocolo Pesar cada probeta con precisión de 0.01g. Medir el espesor, t, en el punto de intersección de las diagonales,
tal como se muestra en la Figura N°3.9, con una precisión de 0.05mm
Aplicar cuidadosamente el instrumento de medida sobre las caras de la probeta.
Medir b1 y b2 en dos puntos, paralelamente a los cantos de la probeta, a lo largo de la línea que une el centro de los cantos opuestos, como se muestra en la Figura N° 3.9, con una precisión de 0.1mm.
Figura N°3.8
Punto de medida – Ensayo de Densidad Normal
Se inspeccionarán 6 probetas específicamente destinadas para este ensayo.
3.3.3.2 Perfil de densidad
Por las condiciones de fabricación que se aplican en la formación de los paneles aglomerados, se evaluó el perfil de densidad de cada tablero, esto respecto a su espesor. Para ello las probetas correspondientes se cortaron en capas superficiales de 2mm de espesor hasta llegar al centro. En cada corte se registró su peso y volumen para obtener las
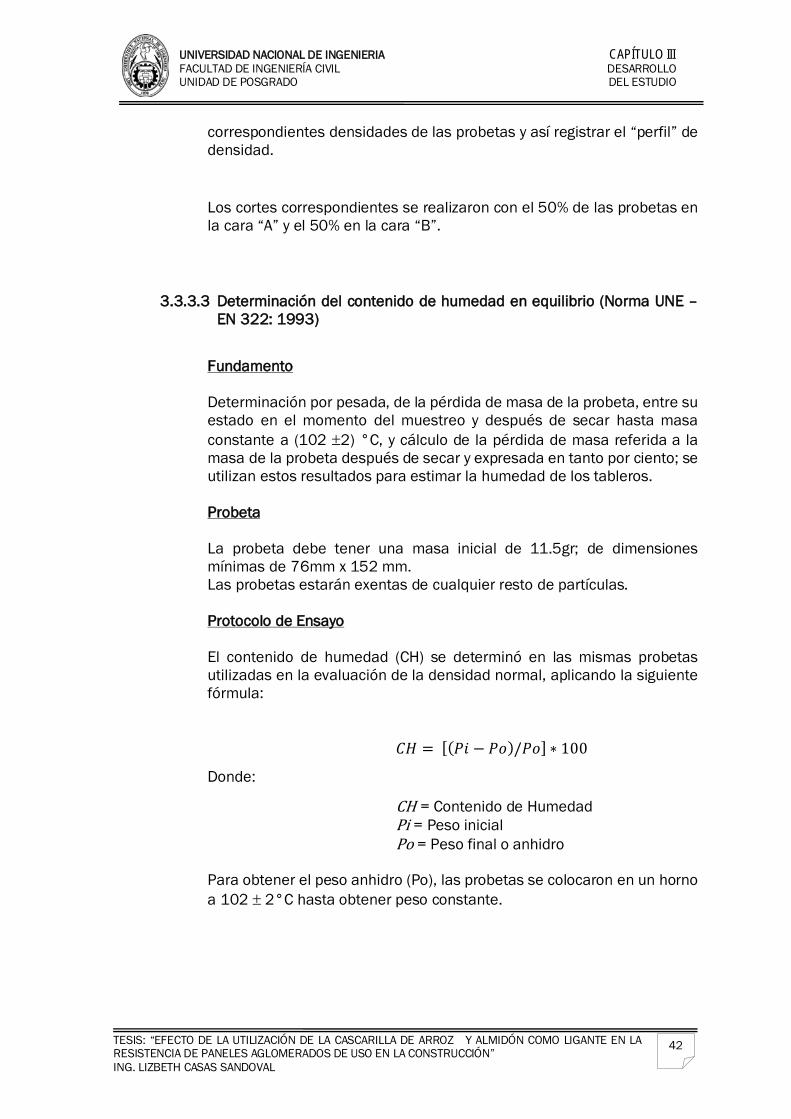
UNIVERSIDAD NACIONAL DE INGENIERIA CAPÍTULO III FACULTAD DE INGENIERÍA CIVIL DESARROLLO UNIDAD DE POSGRADO DEL ESTUDIO
TESIS: “EFECTO DE LA UTILIZACIÓN DE LA CASCARILLA DE ARROZ Y ALMIDÓN COMO LIGANTE EN LA RESISTENCIA DE PANELES AGLOMERADOS DE USO EN LA CONSTRUCCIÓN” ING. LIZBETH CASAS SANDOVAL
42
correspondientes densidades de las probetas y así registrar el “perfil” de densidad.
Los cortes correspondientes se realizaron con el 50% de las probetas en la cara “A” y el 50% en la cara “B”.
3.3.3.3 Determinación del contenido de humedad en equilibrio (Norma UNE – EN 322: 1993)
Fundamento Determinación por pesada, de la pérdida de masa de la probeta, entre su estado en el momento del muestreo y después de secar hasta masa constante a (102 ±2) °C, y cálculo de la pérdida de masa referida a la masa de la probeta después de secar y expresada en tanto por ciento; se utilizan estos resultados para estimar la humedad de los tableros.
Probeta La probeta debe tener una masa inicial de 11.5gr; de dimensiones mínimas de 76mm x 152 mm. Las probetas estarán exentas de cualquier resto de partículas.
Protocolo de Ensayo El contenido de humedad (CH) se determinó en las mismas probetas utilizadas en la evaluación de la densidad normal, aplicando la siguiente fórmula:
𝐶𝐶𝐶𝐶 = [(𝑃𝑃𝑃𝑃 − 𝑃𝑃𝑃𝑃)/𝑃𝑃𝑃𝑃] ∗ 100
Donde:
CH = Contenido de Humedad Pi = Peso inicial Po = Peso final o anhidro
Para obtener el peso anhidro (Po), las probetas se colocaron en un horno a 102 ± 2°C hasta obtener peso constante.
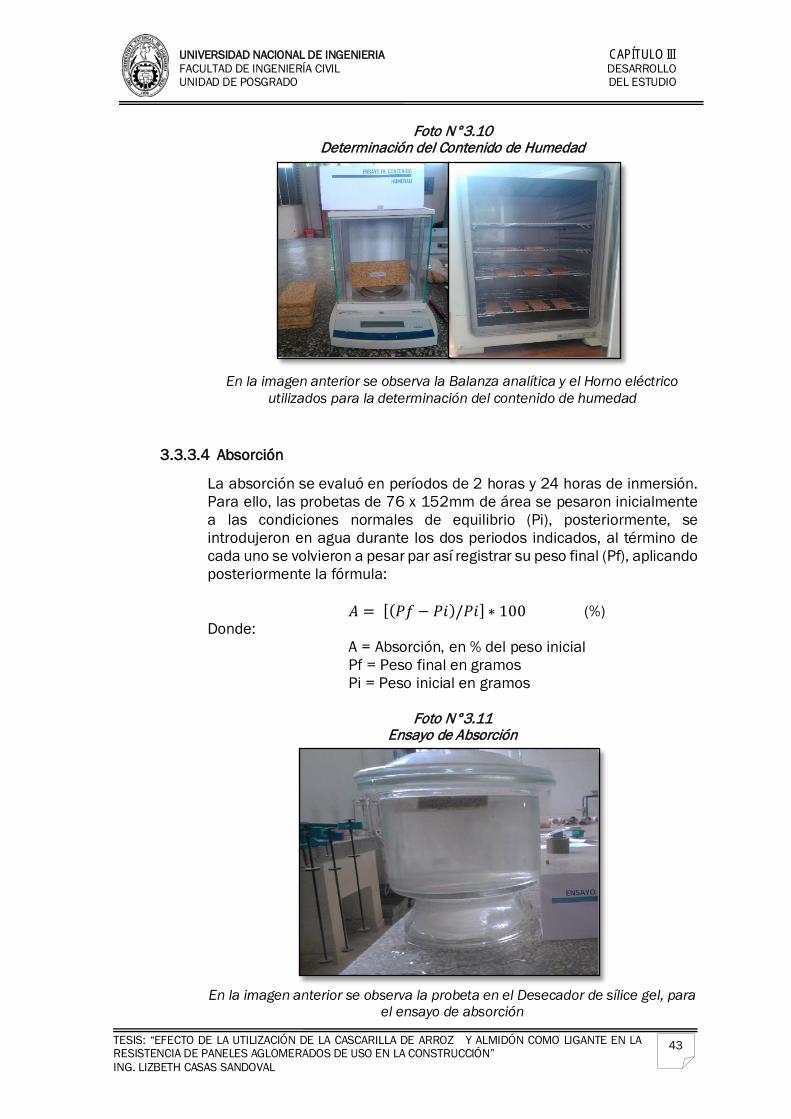
UNIVERSIDAD NACIONAL DE INGENIERIA CAPÍTULO III FACULTAD DE INGENIERÍA CIVIL DESARROLLO UNIDAD DE POSGRADO DEL ESTUDIO
TESIS: “EFECTO DE LA UTILIZACIÓN DE LA CASCARILLA DE ARROZ Y ALMIDÓN COMO LIGANTE EN LA RESISTENCIA DE PANELES AGLOMERADOS DE USO EN LA CONSTRUCCIÓN” ING. LIZBETH CASAS SANDOVAL
43
Foto N°3.10 Determinación del Contenido de Humedad
En la imagen anterior se observa la Balanza analítica y el Horno eléctrico utilizados para la determinación del contenido de humedad
3.3.3.4 Absorción
La absorción se evaluó en períodos de 2 horas y 24 horas de inmersión. Para ello, las probetas de 76 x 152mm de área se pesaron inicialmente a las condiciones normales de equilibrio (Pi), posteriormente, se introdujeron en agua durante los dos periodos indicados, al término de cada uno se volvieron a pesar par así registrar su peso final (Pf), aplicando posteriormente la fórmula:
𝐴𝐴 = [(𝑃𝑃𝑃𝑃 − 𝑃𝑃𝑃𝑃)/𝑃𝑃𝑃𝑃] ∗ 100 (%)
Donde: A = Absorción, en % del peso inicial
Pf = Peso final en gramos Pi = Peso inicial en gramos
Foto N°3.11 Ensayo de Absorción
En la imagen anterior se observa la probeta en el Desecador de sílice gel, para
el ensayo de absorción
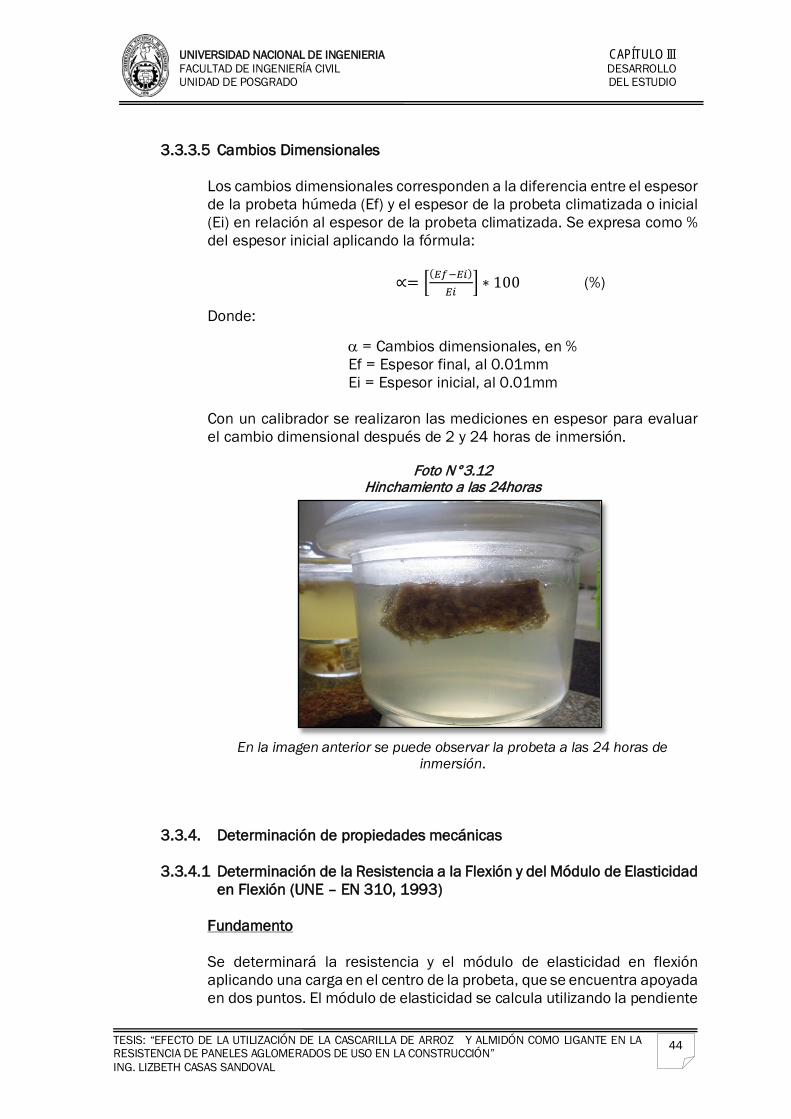
UNIVERSIDAD NACIONAL DE INGENIERIA CAPÍTULO III FACULTAD DE INGENIERÍA CIVIL DESARROLLO UNIDAD DE POSGRADO DEL ESTUDIO
TESIS: “EFECTO DE LA UTILIZACIÓN DE LA CASCARILLA DE ARROZ Y ALMIDÓN COMO LIGANTE EN LA RESISTENCIA DE PANELES AGLOMERADOS DE USO EN LA CONSTRUCCIÓN” ING. LIZBETH CASAS SANDOVAL
44
3.3.3.5 Cambios Dimensionales
Los cambios dimensionales corresponden a la diferencia entre el espesor de la probeta húmeda (Ef) y el espesor de la probeta climatizada o inicial (Ei) en relación al espesor de la probeta climatizada. Se expresa como % del espesor inicial aplicando la fórmula:
∝= �(𝐸𝐸𝐸𝐸−𝐸𝐸𝐸𝐸)
𝐸𝐸𝐸𝐸� ∗ 100 (%)
Donde:
α = Cambios dimensionales, en % Ef = Espesor final, al 0.01mm Ei = Espesor inicial, al 0.01mm
Con un calibrador se realizaron las mediciones en espesor para evaluar el cambio dimensional después de 2 y 24 horas de inmersión.
Foto N°3.12
Hinchamiento a las 24horas
En la imagen anterior se puede observar la probeta a las 24 horas de
inmersión.
3.3.4. Determinación de propiedades mecánicas
3.3.4.1 Determinación de la Resistencia a la Flexión y del Módulo de Elasticidad en Flexión (UNE – EN 310, 1993)
Fundamento
Se determinará la resistencia y el módulo de elasticidad en flexión aplicando una carga en el centro de la probeta, que se encuentra apoyada en dos puntos. El módulo de elasticidad se calcula utilizando la pendiente
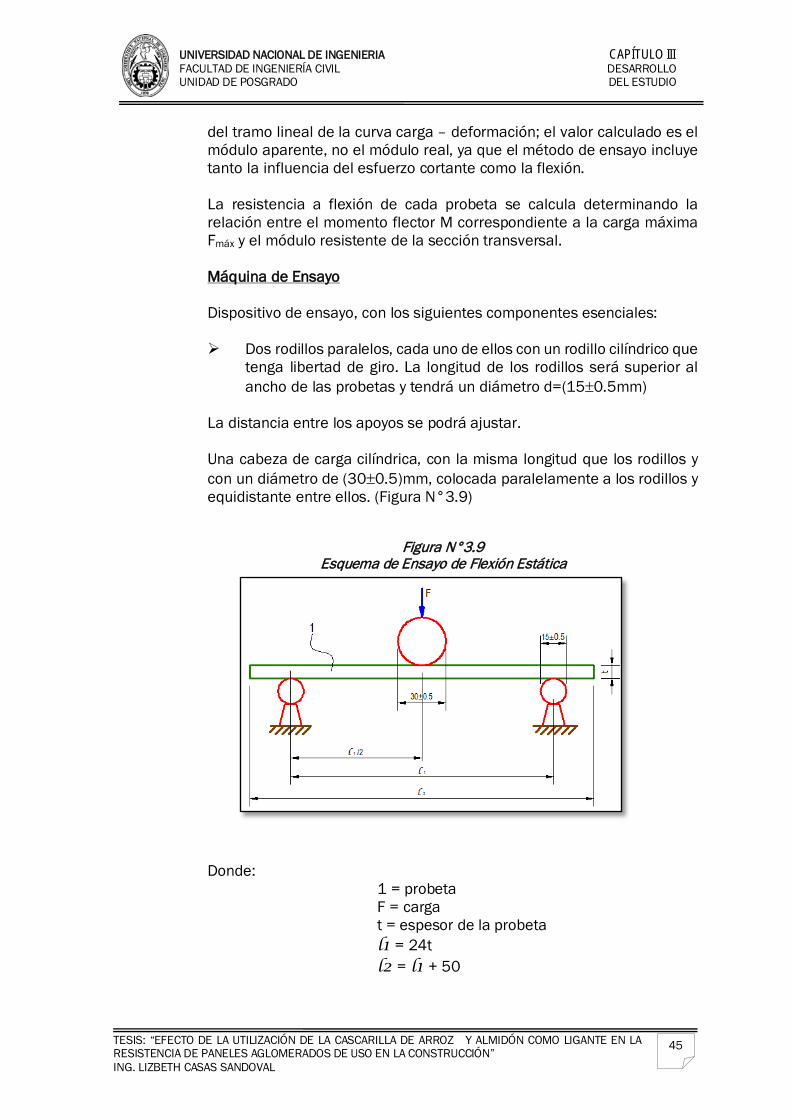
UNIVERSIDAD NACIONAL DE INGENIERIA CAPÍTULO III FACULTAD DE INGENIERÍA CIVIL DESARROLLO UNIDAD DE POSGRADO DEL ESTUDIO
TESIS: “EFECTO DE LA UTILIZACIÓN DE LA CASCARILLA DE ARROZ Y ALMIDÓN COMO LIGANTE EN LA RESISTENCIA DE PANELES AGLOMERADOS DE USO EN LA CONSTRUCCIÓN” ING. LIZBETH CASAS SANDOVAL
45
del tramo lineal de la curva carga – deformación; el valor calculado es el módulo aparente, no el módulo real, ya que el método de ensayo incluye tanto la influencia del esfuerzo cortante como la flexión. La resistencia a flexión de cada probeta se calcula determinando la relación entre el momento flector M correspondiente a la carga máxima Fmáx y el módulo resistente de la sección transversal.
Máquina de Ensayo
Dispositivo de ensayo, con los siguientes componentes esenciales:
Dos rodillos paralelos, cada uno de ellos con un rodillo cilíndrico que
tenga libertad de giro. La longitud de los rodillos será superior al ancho de las probetas y tendrá un diámetro d=(15±0.5mm)
La distancia entre los apoyos se podrá ajustar. Una cabeza de carga cilíndrica, con la misma longitud que los rodillos y con un diámetro de (30±0.5)mm, colocada paralelamente a los rodillos y equidistante entre ellos. (Figura N°3.9)
Figura N°3.9 Esquema de Ensayo de Flexión Estática
Donde:
1 = probeta F = carga t = espesor de la probeta l1 = 24t l2 = l1 + 50
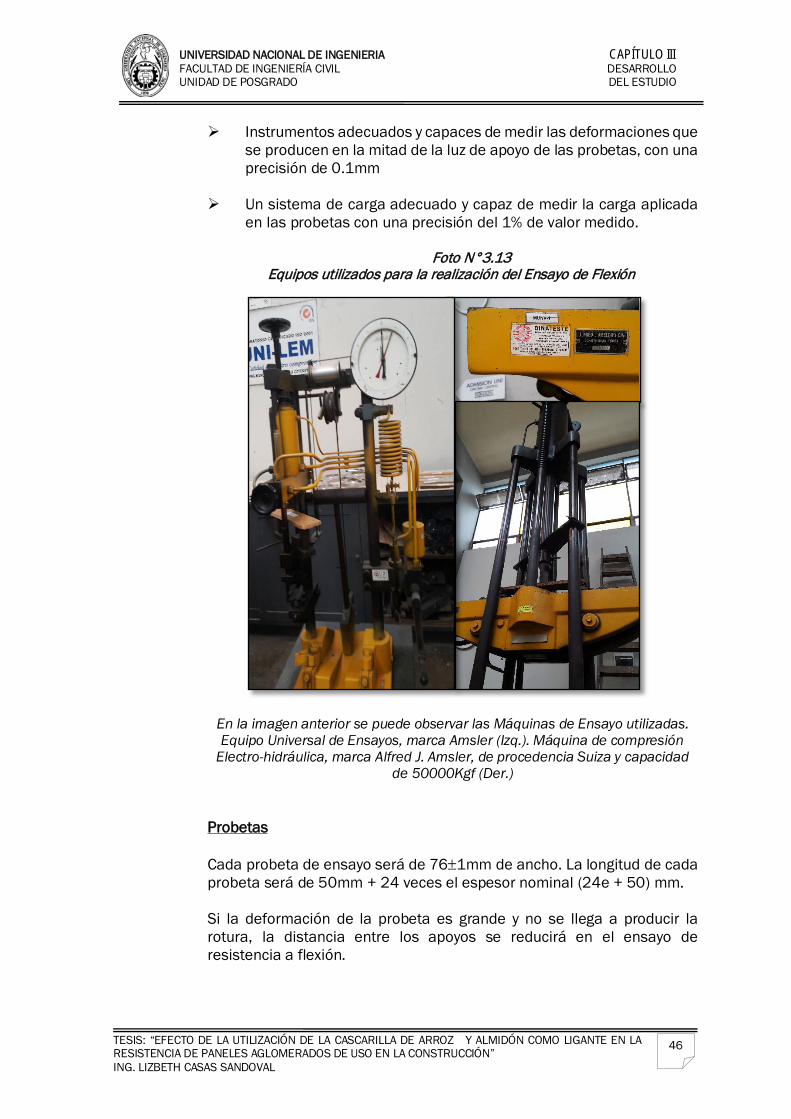
UNIVERSIDAD NACIONAL DE INGENIERIA CAPÍTULO III FACULTAD DE INGENIERÍA CIVIL DESARROLLO UNIDAD DE POSGRADO DEL ESTUDIO
TESIS: “EFECTO DE LA UTILIZACIÓN DE LA CASCARILLA DE ARROZ Y ALMIDÓN COMO LIGANTE EN LA RESISTENCIA DE PANELES AGLOMERADOS DE USO EN LA CONSTRUCCIÓN” ING. LIZBETH CASAS SANDOVAL
46
Instrumentos adecuados y capaces de medir las deformaciones que se producen en la mitad de la luz de apoyo de las probetas, con una precisión de 0.1mm
Un sistema de carga adecuado y capaz de medir la carga aplicada en las probetas con una precisión del 1% de valor medido.
Foto N°3.13
Equipos utilizados para la realización del Ensayo de Flexión
En la imagen anterior se puede observar las Máquinas de Ensayo utilizadas. Equipo Universal de Ensayos, marca Amsler (Izq.). Máquina de compresión
Electro-hidráulica, marca Alfred J. Amsler, de procedencia Suiza y capacidad de 50000Kgf (Der.)
Probetas
Cada probeta de ensayo será de 76±1mm de ancho. La longitud de cada probeta será de 50mm + 24 veces el espesor nominal (24e + 50) mm. Si la deformación de la probeta es grande y no se llega a producir la rotura, la distancia entre los apoyos se reducirá en el ensayo de resistencia a flexión.
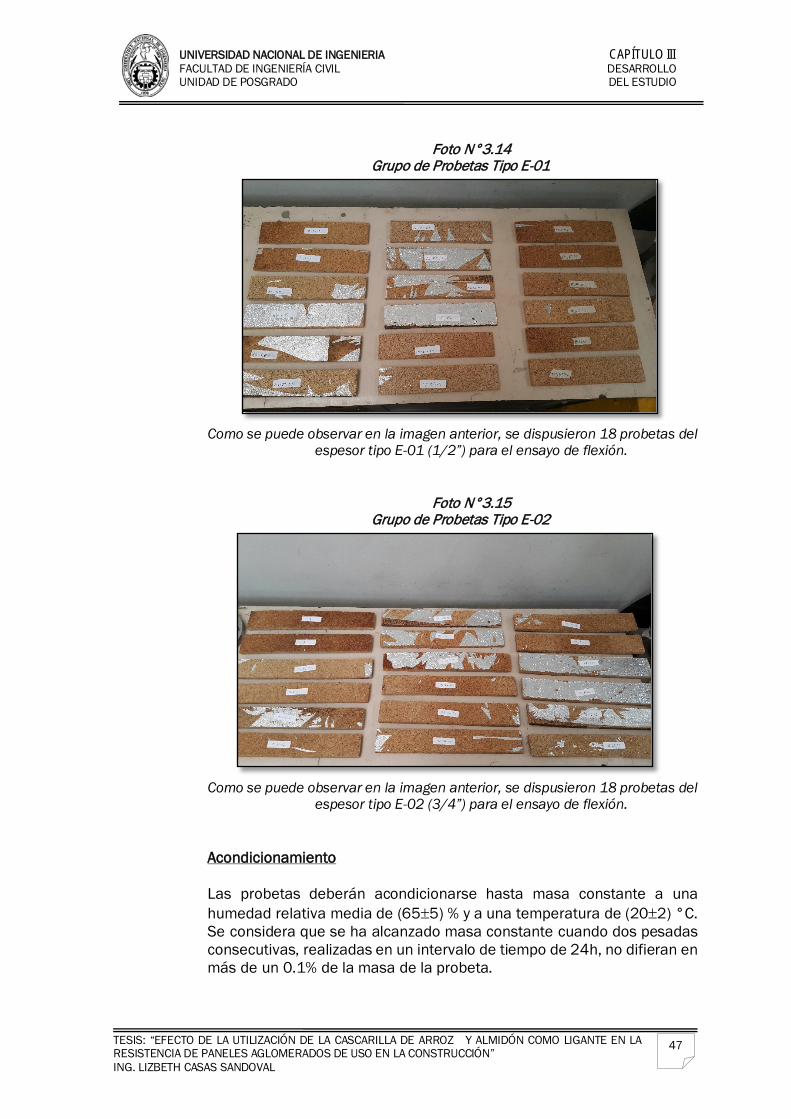
UNIVERSIDAD NACIONAL DE INGENIERIA CAPÍTULO III FACULTAD DE INGENIERÍA CIVIL DESARROLLO UNIDAD DE POSGRADO DEL ESTUDIO
TESIS: “EFECTO DE LA UTILIZACIÓN DE LA CASCARILLA DE ARROZ Y ALMIDÓN COMO LIGANTE EN LA RESISTENCIA DE PANELES AGLOMERADOS DE USO EN LA CONSTRUCCIÓN” ING. LIZBETH CASAS SANDOVAL
47
Foto N°3.14
Grupo de Probetas Tipo E-01
Como se puede observar en la imagen anterior, se dispusieron 18 probetas del
espesor tipo E-01 (1/2”) para el ensayo de flexión.
Foto N°3.15 Grupo de Probetas Tipo E-02
Como se puede observar en la imagen anterior, se dispusieron 18 probetas del
espesor tipo E-02 (3/4”) para el ensayo de flexión.
Acondicionamiento
Las probetas deberán acondicionarse hasta masa constante a una humedad relativa media de (65±5) % y a una temperatura de (20±2) °C. Se considera que se ha alcanzado masa constante cuando dos pesadas consecutivas, realizadas en un intervalo de tiempo de 24h, no difieran en más de un 0.1% de la masa de la probeta.
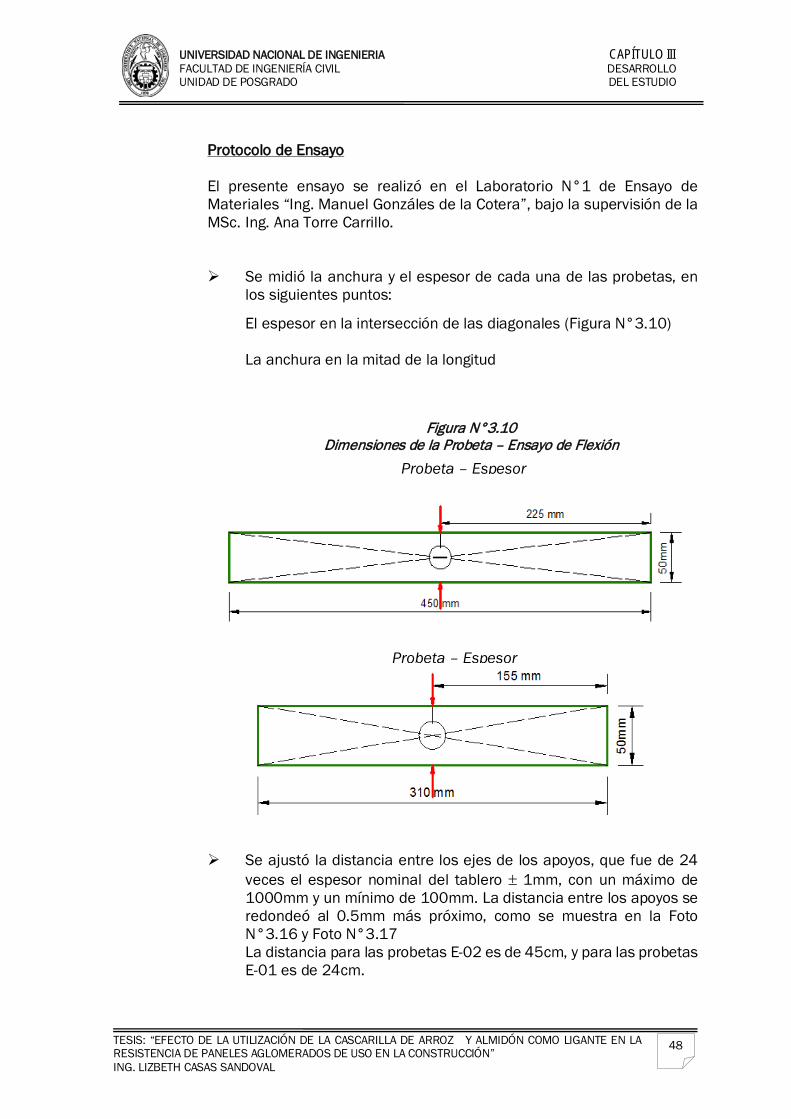
UNIVERSIDAD NACIONAL DE INGENIERIA CAPÍTULO III FACULTAD DE INGENIERÍA CIVIL DESARROLLO UNIDAD DE POSGRADO DEL ESTUDIO
TESIS: “EFECTO DE LA UTILIZACIÓN DE LA CASCARILLA DE ARROZ Y ALMIDÓN COMO LIGANTE EN LA RESISTENCIA DE PANELES AGLOMERADOS DE USO EN LA CONSTRUCCIÓN” ING. LIZBETH CASAS SANDOVAL
48
Protocolo de Ensayo El presente ensayo se realizó en el Laboratorio N°1 de Ensayo de Materiales “Ing. Manuel Gonzáles de la Cotera”, bajo la supervisión de la MSc. Ing. Ana Torre Carrillo.
Se midió la anchura y el espesor de cada una de las probetas, en
los siguientes puntos:
El espesor en la intersección de las diagonales (Figura N°3.10) La anchura en la mitad de la longitud
Figura N°3.10 Dimensiones de la Probeta – Ensayo de Flexión
Se ajustó la distancia entre los ejes de los apoyos, que fue de 24 veces el espesor nominal del tablero ± 1mm, con un máximo de 1000mm y un mínimo de 100mm. La distancia entre los apoyos se redondeó al 0.5mm más próximo, como se muestra en la Foto N°3.16 y Foto N°3.17 La distancia para las probetas E-02 es de 45cm, y para las probetas E-01 es de 24cm.
Probeta – Espesor
Probeta – Espesor
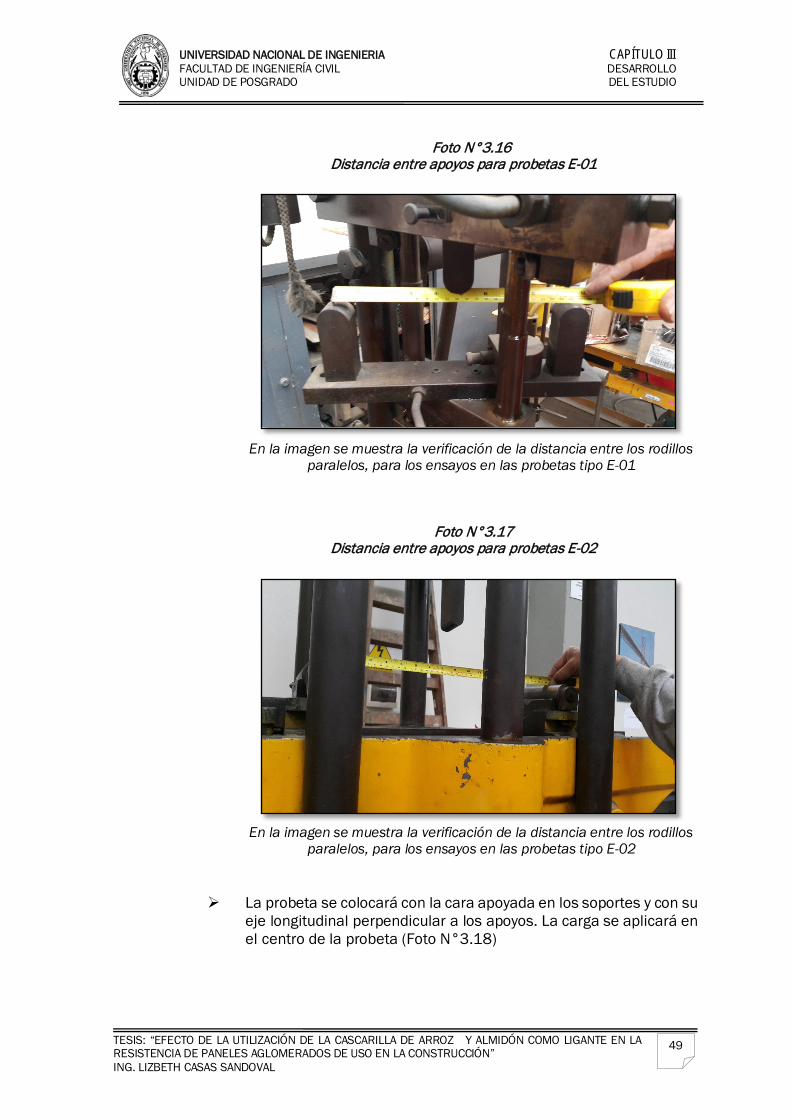
UNIVERSIDAD NACIONAL DE INGENIERIA CAPÍTULO III FACULTAD DE INGENIERÍA CIVIL DESARROLLO UNIDAD DE POSGRADO DEL ESTUDIO
TESIS: “EFECTO DE LA UTILIZACIÓN DE LA CASCARILLA DE ARROZ Y ALMIDÓN COMO LIGANTE EN LA RESISTENCIA DE PANELES AGLOMERADOS DE USO EN LA CONSTRUCCIÓN” ING. LIZBETH CASAS SANDOVAL
49
Foto N°3.16
Distancia entre apoyos para probetas E-01
En la imagen se muestra la verificación de la distancia entre los rodillos
paralelos, para los ensayos en las probetas tipo E-01
Foto N°3.17 Distancia entre apoyos para probetas E-02
En la imagen se muestra la verificación de la distancia entre los rodillos
paralelos, para los ensayos en las probetas tipo E-02
La probeta se colocará con la cara apoyada en los soportes y con su eje longitudinal perpendicular a los apoyos. La carga se aplicará en el centro de la probeta (Foto N°3.18)
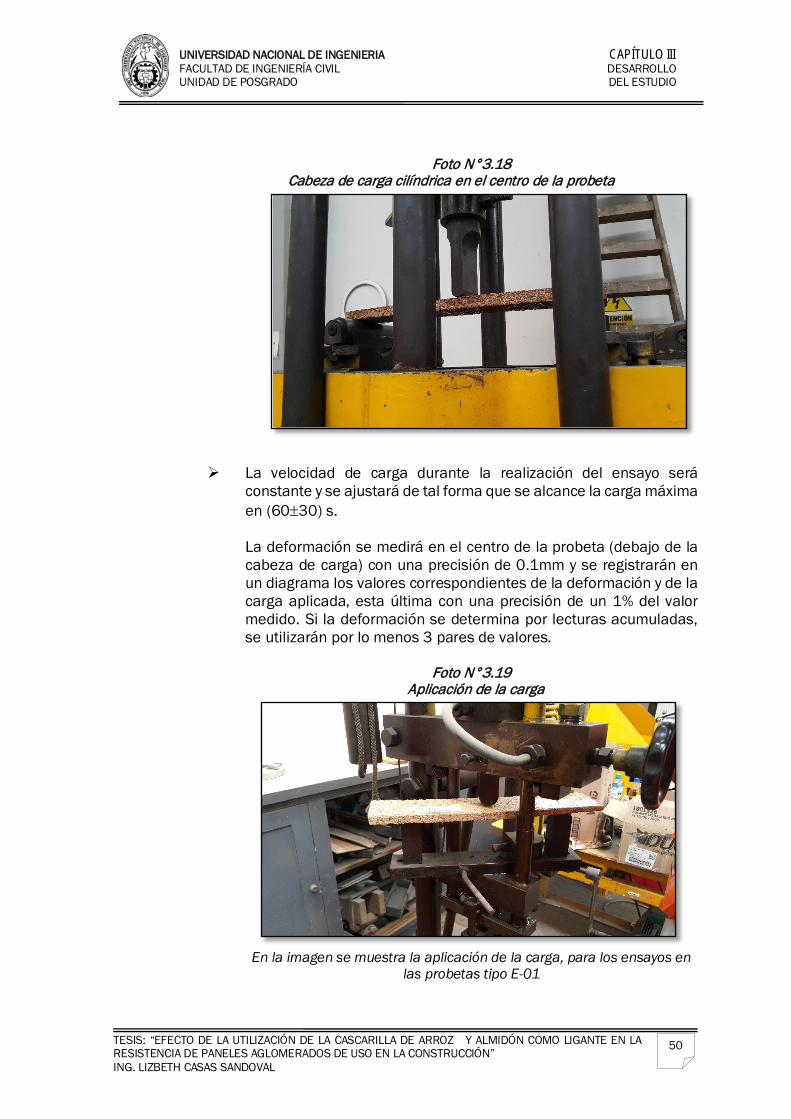
UNIVERSIDAD NACIONAL DE INGENIERIA CAPÍTULO III FACULTAD DE INGENIERÍA CIVIL DESARROLLO UNIDAD DE POSGRADO DEL ESTUDIO
TESIS: “EFECTO DE LA UTILIZACIÓN DE LA CASCARILLA DE ARROZ Y ALMIDÓN COMO LIGANTE EN LA RESISTENCIA DE PANELES AGLOMERADOS DE USO EN LA CONSTRUCCIÓN” ING. LIZBETH CASAS SANDOVAL
50
Foto N°3.18 Cabeza de carga cilíndrica en el centro de la probeta
La velocidad de carga durante la realización del ensayo será constante y se ajustará de tal forma que se alcance la carga máxima en (60±30) s. La deformación se medirá en el centro de la probeta (debajo de la cabeza de carga) con una precisión de 0.1mm y se registrarán en un diagrama los valores correspondientes de la deformación y de la carga aplicada, esta última con una precisión de un 1% del valor medido. Si la deformación se determina por lecturas acumuladas, se utilizarán por lo menos 3 pares de valores.
Foto N°3.19
Aplicación de la carga
En la imagen se muestra la aplicación de la carga, para los ensayos en
las probetas tipo E-01
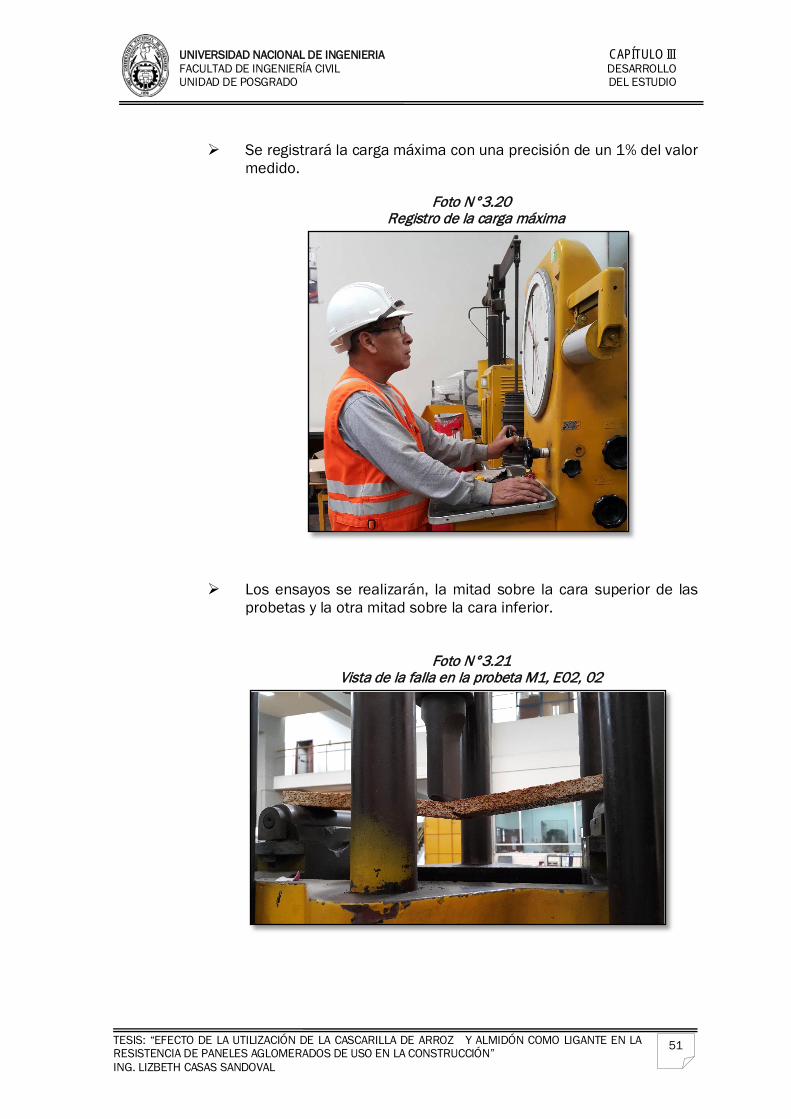
UNIVERSIDAD NACIONAL DE INGENIERIA CAPÍTULO III FACULTAD DE INGENIERÍA CIVIL DESARROLLO UNIDAD DE POSGRADO DEL ESTUDIO
TESIS: “EFECTO DE LA UTILIZACIÓN DE LA CASCARILLA DE ARROZ Y ALMIDÓN COMO LIGANTE EN LA RESISTENCIA DE PANELES AGLOMERADOS DE USO EN LA CONSTRUCCIÓN” ING. LIZBETH CASAS SANDOVAL
51
Se registrará la carga máxima con una precisión de un 1% del valor
medido.
Foto N°3.20 Registro de la carga máxima
Los ensayos se realizarán, la mitad sobre la cara superior de las probetas y la otra mitad sobre la cara inferior.
Foto N°3.21 Vista de la falla en la probeta M1, E02, 02
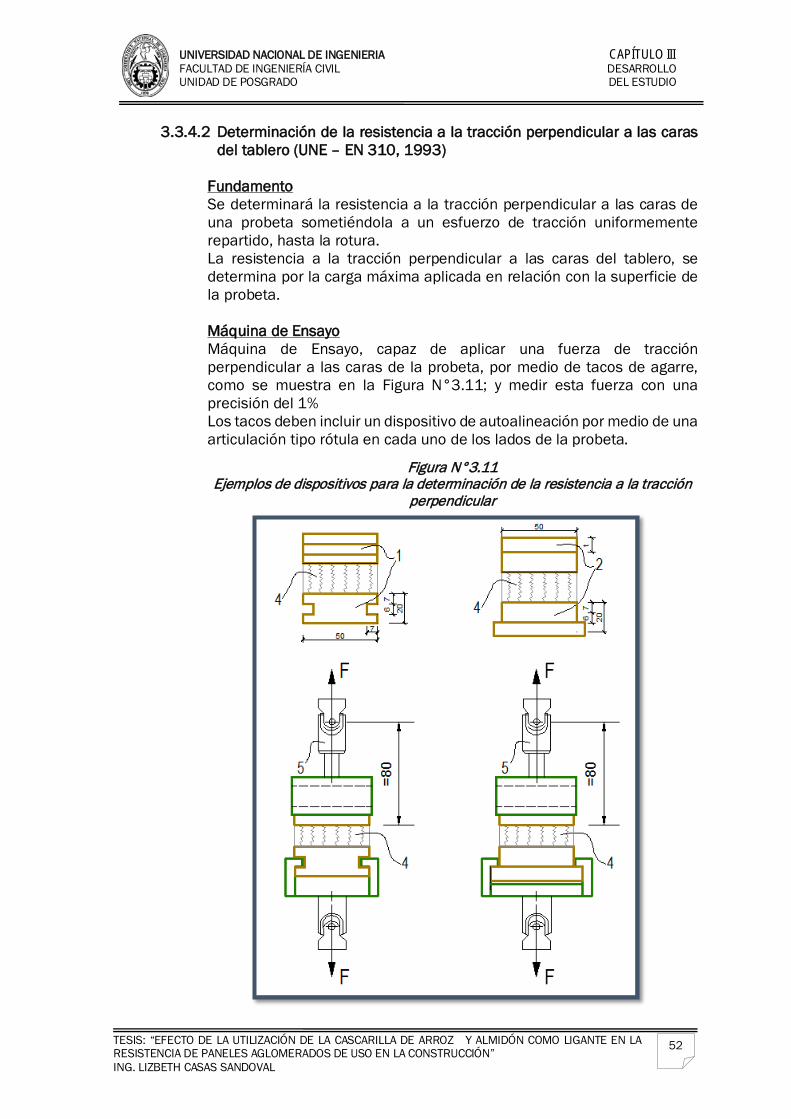
UNIVERSIDAD NACIONAL DE INGENIERIA CAPÍTULO III FACULTAD DE INGENIERÍA CIVIL DESARROLLO UNIDAD DE POSGRADO DEL ESTUDIO
TESIS: “EFECTO DE LA UTILIZACIÓN DE LA CASCARILLA DE ARROZ Y ALMIDÓN COMO LIGANTE EN LA RESISTENCIA DE PANELES AGLOMERADOS DE USO EN LA CONSTRUCCIÓN” ING. LIZBETH CASAS SANDOVAL
52
3.3.4.2 Determinación de la resistencia a la tracción perpendicular a las caras del tablero (UNE – EN 310, 1993)
Fundamento Se determinará la resistencia a la tracción perpendicular a las caras de una probeta sometiéndola a un esfuerzo de tracción uniformemente repartido, hasta la rotura. La resistencia a la tracción perpendicular a las caras del tablero, se determina por la carga máxima aplicada en relación con la superficie de la probeta. Máquina de Ensayo Máquina de Ensayo, capaz de aplicar una fuerza de tracción perpendicular a las caras de la probeta, por medio de tacos de agarre, como se muestra en la Figura N°3.11; y medir esta fuerza con una precisión del 1% Los tacos deben incluir un dispositivo de autoalineación por medio de una articulación tipo rótula en cada uno de los lados de la probeta.
Figura N°3.11 Ejemplos de dispositivos para la determinación de la resistencia a la tracción
perpendicular
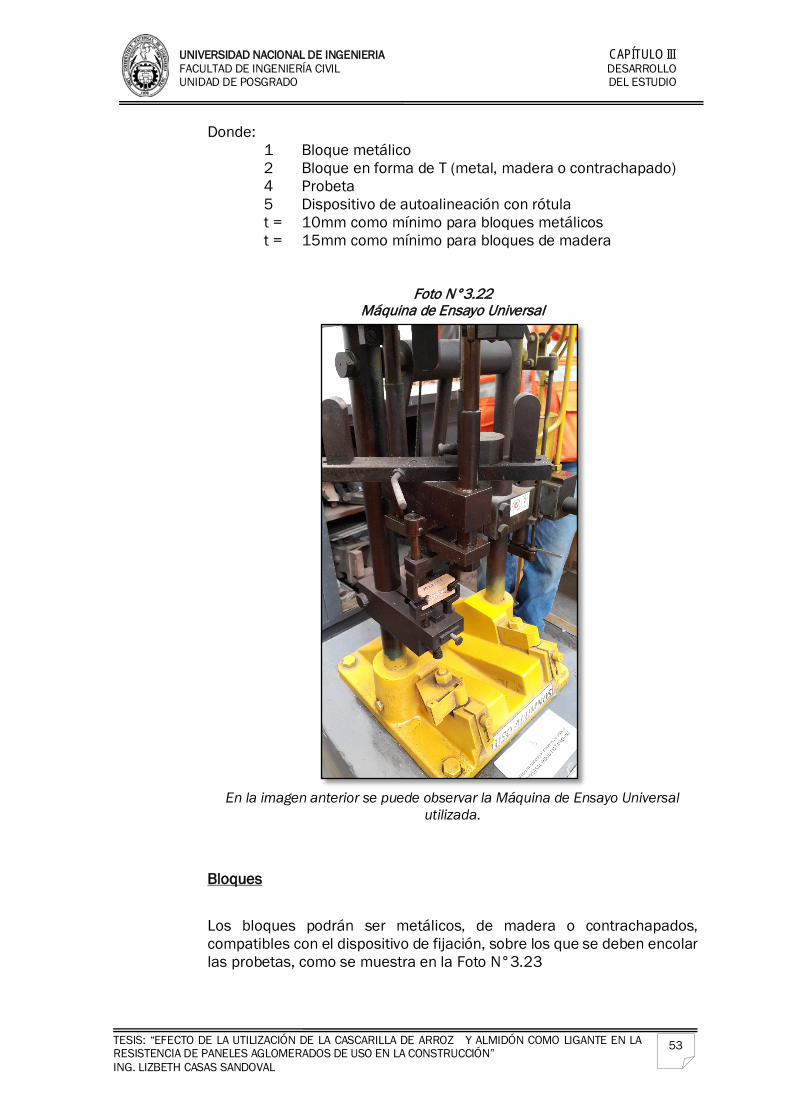
UNIVERSIDAD NACIONAL DE INGENIERIA CAPÍTULO III FACULTAD DE INGENIERÍA CIVIL DESARROLLO UNIDAD DE POSGRADO DEL ESTUDIO
TESIS: “EFECTO DE LA UTILIZACIÓN DE LA CASCARILLA DE ARROZ Y ALMIDÓN COMO LIGANTE EN LA RESISTENCIA DE PANELES AGLOMERADOS DE USO EN LA CONSTRUCCIÓN” ING. LIZBETH CASAS SANDOVAL
53
Donde: 1 Bloque metálico 2 Bloque en forma de T (metal, madera o contrachapado) 4 Probeta 5 Dispositivo de autoalineación con rótula t = 10mm como mínimo para bloques metálicos t = 15mm como mínimo para bloques de madera
Foto N°3.22 Máquina de Ensayo Universal
En la imagen anterior se puede observar la Máquina de Ensayo Universal
utilizada.
Bloques
Los bloques podrán ser metálicos, de madera o contrachapados, compatibles con el dispositivo de fijación, sobre los que se deben encolar las probetas, como se muestra en la Foto N°3.23
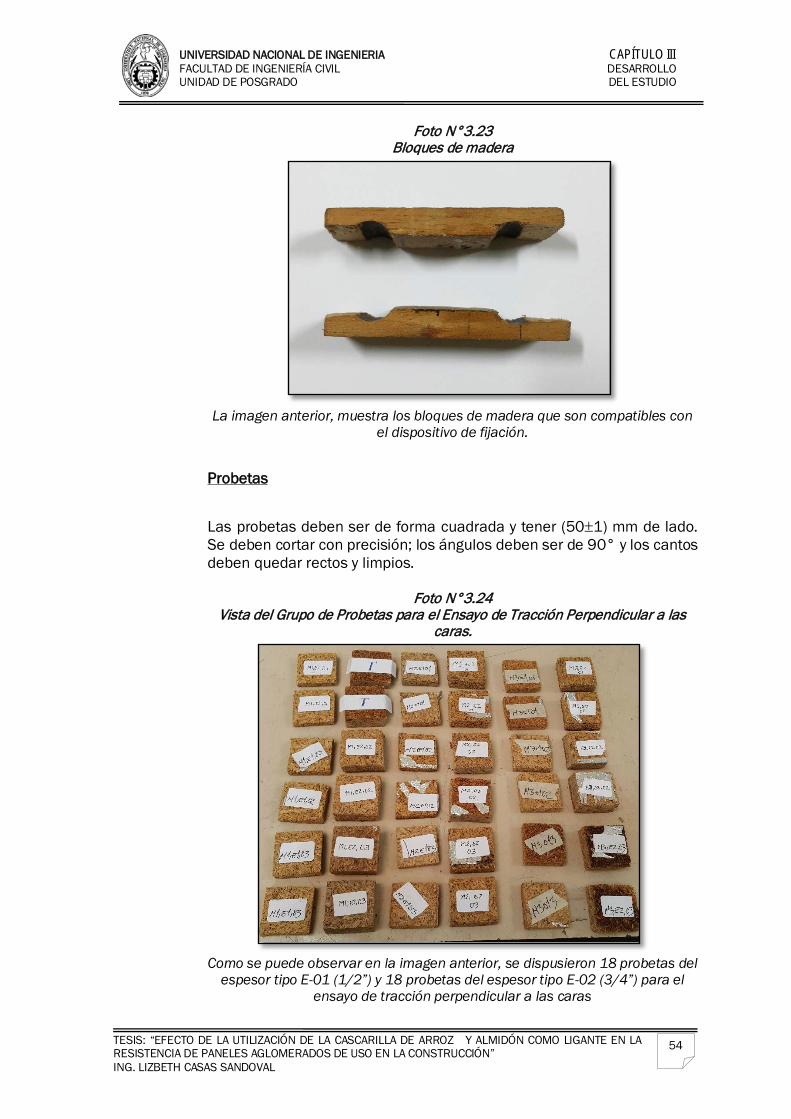
UNIVERSIDAD NACIONAL DE INGENIERIA CAPÍTULO III FACULTAD DE INGENIERÍA CIVIL DESARROLLO UNIDAD DE POSGRADO DEL ESTUDIO
TESIS: “EFECTO DE LA UTILIZACIÓN DE LA CASCARILLA DE ARROZ Y ALMIDÓN COMO LIGANTE EN LA RESISTENCIA DE PANELES AGLOMERADOS DE USO EN LA CONSTRUCCIÓN” ING. LIZBETH CASAS SANDOVAL
54
Foto N°3.23 Bloques de madera
La imagen anterior, muestra los bloques de madera que son compatibles con
el dispositivo de fijación.
Probetas
Las probetas deben ser de forma cuadrada y tener (50±1) mm de lado. Se deben cortar con precisión; los ángulos deben ser de 90° y los cantos deben quedar rectos y limpios.
Foto N°3.24
Vista del Grupo de Probetas para el Ensayo de Tracción Perpendicular a las caras.
Como se puede observar en la imagen anterior, se dispusieron 18 probetas del
espesor tipo E-01 (1/2”) y 18 probetas del espesor tipo E-02 (3/4”) para el ensayo de tracción perpendicular a las caras
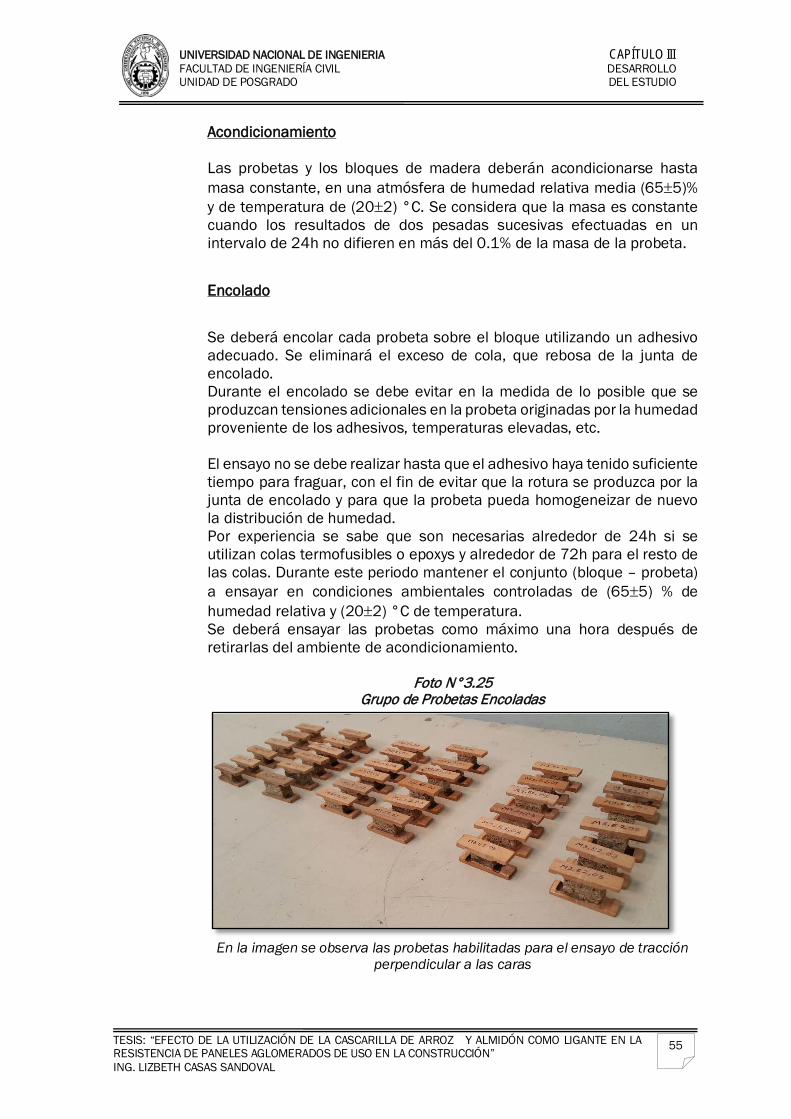
UNIVERSIDAD NACIONAL DE INGENIERIA CAPÍTULO III FACULTAD DE INGENIERÍA CIVIL DESARROLLO UNIDAD DE POSGRADO DEL ESTUDIO
TESIS: “EFECTO DE LA UTILIZACIÓN DE LA CASCARILLA DE ARROZ Y ALMIDÓN COMO LIGANTE EN LA RESISTENCIA DE PANELES AGLOMERADOS DE USO EN LA CONSTRUCCIÓN” ING. LIZBETH CASAS SANDOVAL
55
Acondicionamiento Las probetas y los bloques de madera deberán acondicionarse hasta masa constante, en una atmósfera de humedad relativa media (65±5)% y de temperatura de (20±2) °C. Se considera que la masa es constante cuando los resultados de dos pesadas sucesivas efectuadas en un intervalo de 24h no difieren en más del 0.1% de la masa de la probeta.
Encolado
Se deberá encolar cada probeta sobre el bloque utilizando un adhesivo adecuado. Se eliminará el exceso de cola, que rebosa de la junta de encolado. Durante el encolado se debe evitar en la medida de lo posible que se produzcan tensiones adicionales en la probeta originadas por la humedad proveniente de los adhesivos, temperaturas elevadas, etc. El ensayo no se debe realizar hasta que el adhesivo haya tenido suficiente tiempo para fraguar, con el fin de evitar que la rotura se produzca por la junta de encolado y para que la probeta pueda homogeneizar de nuevo la distribución de humedad. Por experiencia se sabe que son necesarias alrededor de 24h si se utilizan colas termofusibles o epoxys y alrededor de 72h para el resto de las colas. Durante este periodo mantener el conjunto (bloque – probeta) a ensayar en condiciones ambientales controladas de (65±5) % de humedad relativa y (20±2) °C de temperatura. Se deberá ensayar las probetas como máximo una hora después de retirarlas del ambiente de acondicionamiento.
Foto N°3.25
Grupo de Probetas Encoladas
En la imagen se observa las probetas habilitadas para el ensayo de tracción
perpendicular a las caras
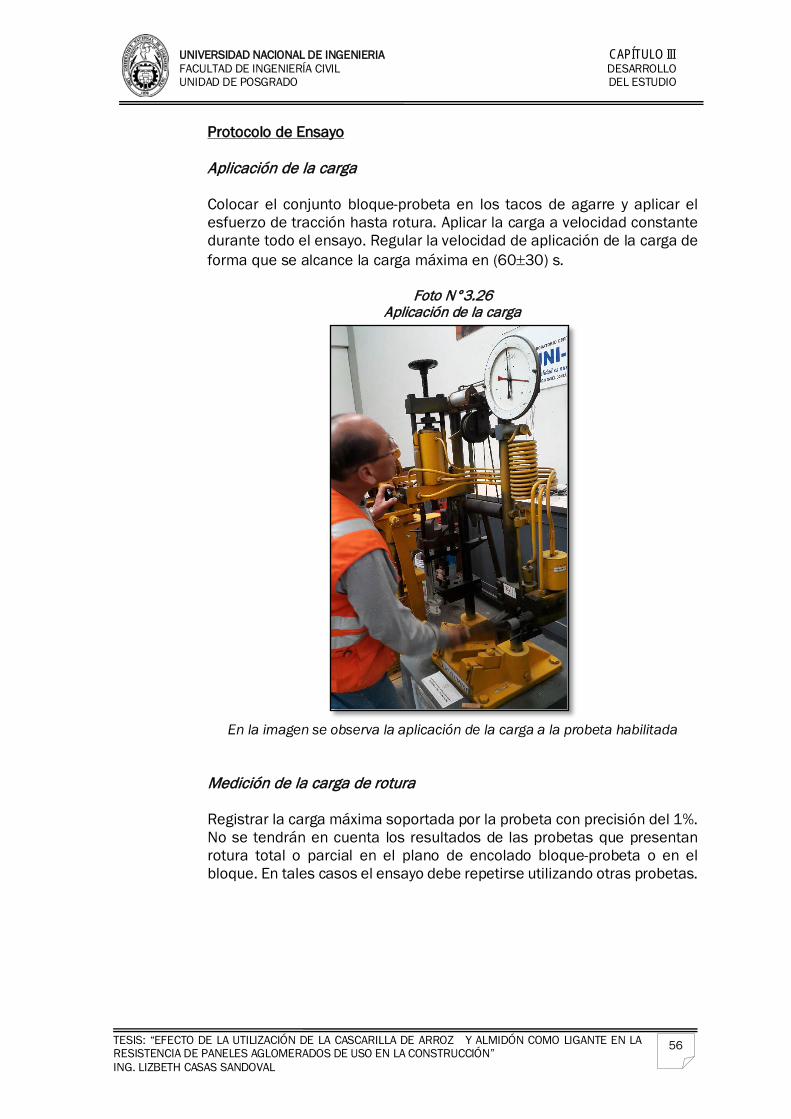
UNIVERSIDAD NACIONAL DE INGENIERIA CAPÍTULO III FACULTAD DE INGENIERÍA CIVIL DESARROLLO UNIDAD DE POSGRADO DEL ESTUDIO
TESIS: “EFECTO DE LA UTILIZACIÓN DE LA CASCARILLA DE ARROZ Y ALMIDÓN COMO LIGANTE EN LA RESISTENCIA DE PANELES AGLOMERADOS DE USO EN LA CONSTRUCCIÓN” ING. LIZBETH CASAS SANDOVAL
56
Protocolo de Ensayo
Aplicación de la carga Colocar el conjunto bloque-probeta en los tacos de agarre y aplicar el esfuerzo de tracción hasta rotura. Aplicar la carga a velocidad constante durante todo el ensayo. Regular la velocidad de aplicación de la carga de forma que se alcance la carga máxima en (60±30) s.
Foto N°3.26 Aplicación de la carga
En la imagen se observa la aplicación de la carga a la probeta habilitada
Medición de la carga de rotura Registrar la carga máxima soportada por la probeta con precisión del 1%. No se tendrán en cuenta los resultados de las probetas que presentan rotura total o parcial en el plano de encolado bloque-probeta o en el bloque. En tales casos el ensayo debe repetirse utilizando otras probetas.
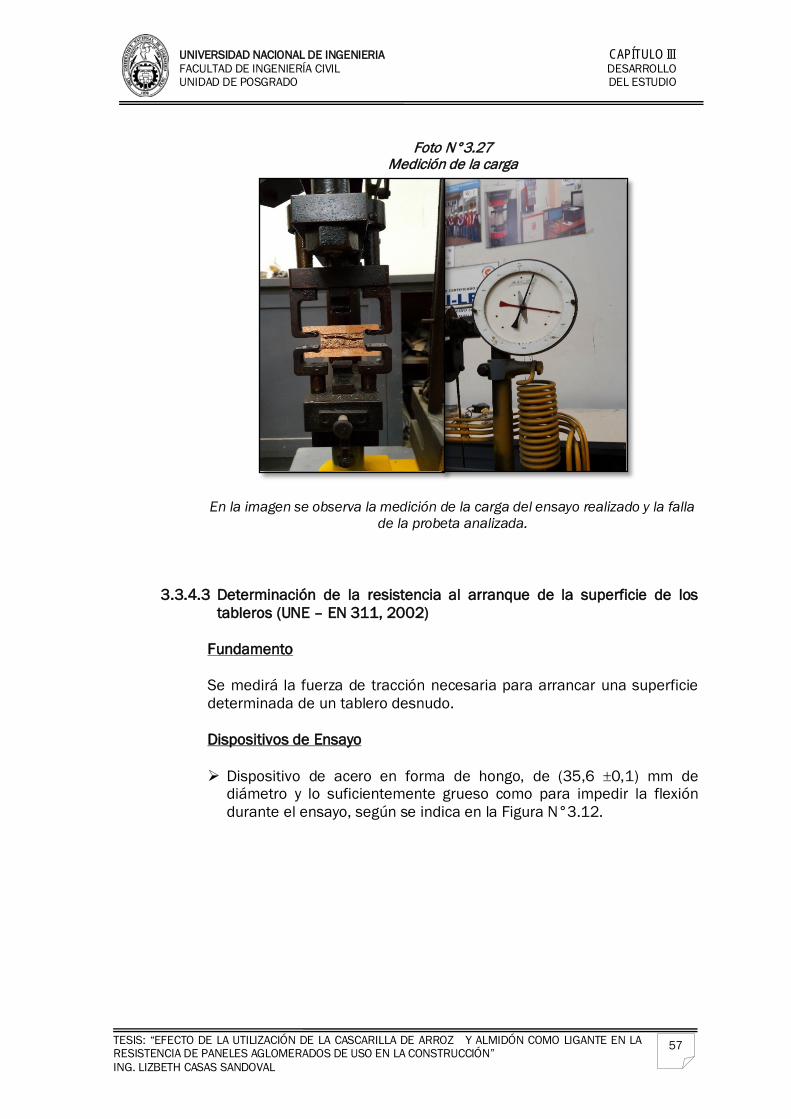
UNIVERSIDAD NACIONAL DE INGENIERIA CAPÍTULO III FACULTAD DE INGENIERÍA CIVIL DESARROLLO UNIDAD DE POSGRADO DEL ESTUDIO
TESIS: “EFECTO DE LA UTILIZACIÓN DE LA CASCARILLA DE ARROZ Y ALMIDÓN COMO LIGANTE EN LA RESISTENCIA DE PANELES AGLOMERADOS DE USO EN LA CONSTRUCCIÓN” ING. LIZBETH CASAS SANDOVAL
57
Foto N°3.27
Medición de la carga En la imagen se observa la medición de la carga del ensayo realizado y la falla
de la probeta analizada.
3.3.4.3 Determinación de la resistencia al arranque de la superficie de los tableros (UNE – EN 311, 2002)
Fundamento Se medirá la fuerza de tracción necesaria para arrancar una superficie determinada de un tablero desnudo. Dispositivos de Ensayo Dispositivo de acero en forma de hongo, de (35,6 ±0,1) mm de
diámetro y lo suficientemente grueso como para impedir la flexión durante el ensayo, según se indica en la Figura N°3.12.
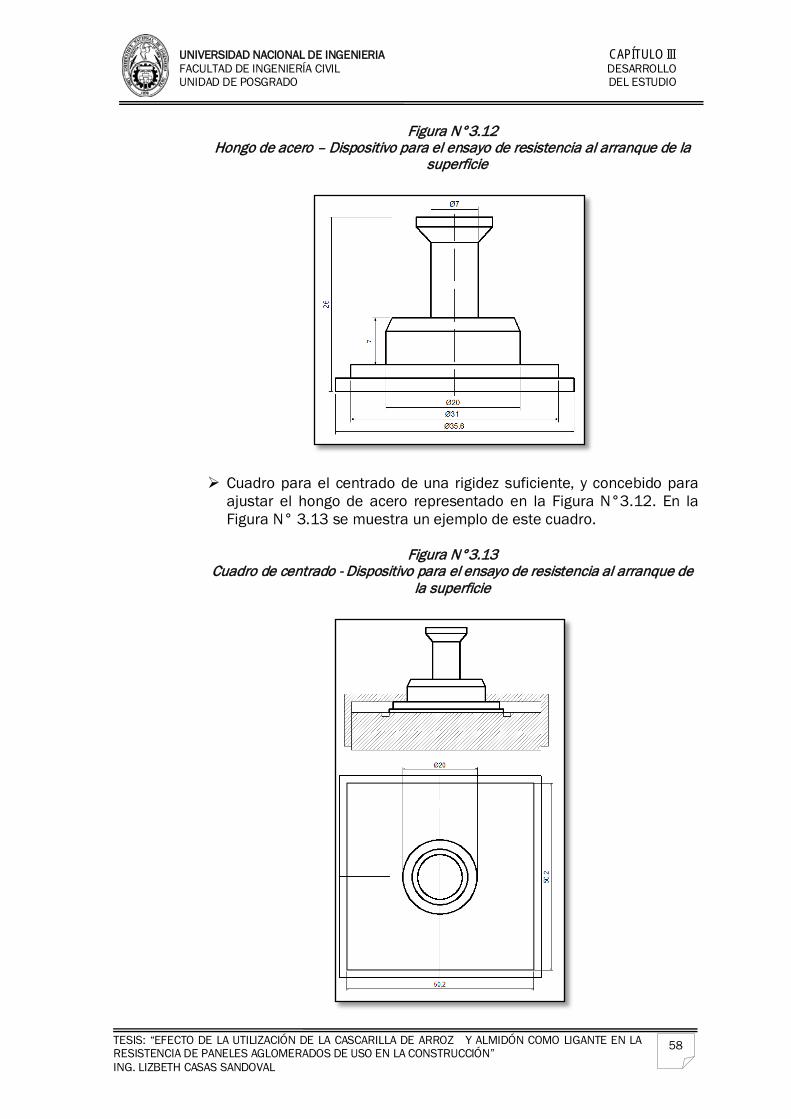
UNIVERSIDAD NACIONAL DE INGENIERIA CAPÍTULO III FACULTAD DE INGENIERÍA CIVIL DESARROLLO UNIDAD DE POSGRADO DEL ESTUDIO
TESIS: “EFECTO DE LA UTILIZACIÓN DE LA CASCARILLA DE ARROZ Y ALMIDÓN COMO LIGANTE EN LA RESISTENCIA DE PANELES AGLOMERADOS DE USO EN LA CONSTRUCCIÓN” ING. LIZBETH CASAS SANDOVAL
58
Figura N°3.12 Hongo de acero – Dispositivo para el ensayo de resistencia al arranque de la
superficie
Cuadro para el centrado de una rigidez suficiente, y concebido para ajustar el hongo de acero representado en la Figura N°3.12. En la Figura N° 3.13 se muestra un ejemplo de este cuadro.
Figura N°3.13
Cuadro de centrado - Dispositivo para el ensayo de resistencia al arranque de la superficie
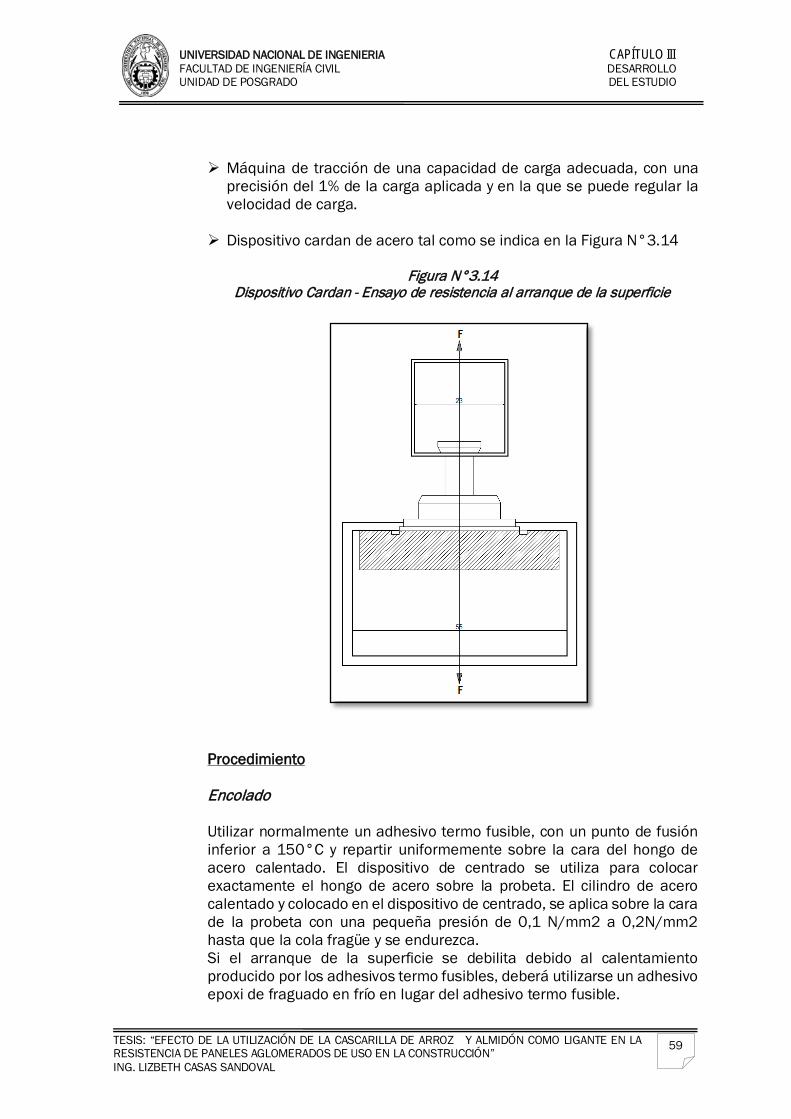
UNIVERSIDAD NACIONAL DE INGENIERIA CAPÍTULO III FACULTAD DE INGENIERÍA CIVIL DESARROLLO UNIDAD DE POSGRADO DEL ESTUDIO
TESIS: “EFECTO DE LA UTILIZACIÓN DE LA CASCARILLA DE ARROZ Y ALMIDÓN COMO LIGANTE EN LA RESISTENCIA DE PANELES AGLOMERADOS DE USO EN LA CONSTRUCCIÓN” ING. LIZBETH CASAS SANDOVAL
59
Máquina de tracción de una capacidad de carga adecuada, con una precisión del 1% de la carga aplicada y en la que se puede regular la velocidad de carga.
Dispositivo cardan de acero tal como se indica en la Figura N°3.14
Figura N°3.14 Dispositivo Cardan - Ensayo de resistencia al arranque de la superficie
Procedimiento Encolado Utilizar normalmente un adhesivo termo fusible, con un punto de fusión inferior a 150°C y repartir uniformemente sobre la cara del hongo de acero calentado. El dispositivo de centrado se utiliza para colocar exactamente el hongo de acero sobre la probeta. El cilindro de acero calentado y colocado en el dispositivo de centrado, se aplica sobre la cara de la probeta con una pequeña presión de 0,1 N/mm2 a 0,2N/mm2 hasta que la cola fragüe y se endurezca. Si el arranque de la superficie se debilita debido al calentamiento producido por los adhesivos termo fusibles, deberá utilizarse un adhesivo epoxi de fraguado en frío en lugar del adhesivo termo fusible.
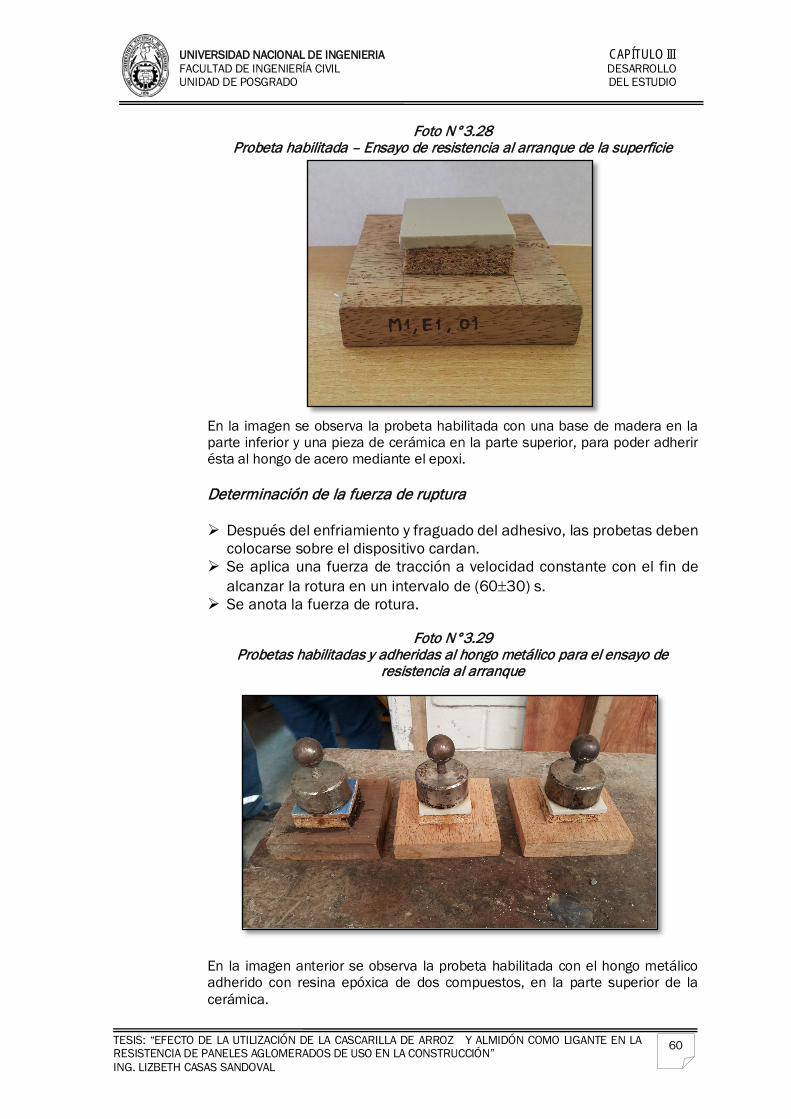
UNIVERSIDAD NACIONAL DE INGENIERIA CAPÍTULO III FACULTAD DE INGENIERÍA CIVIL DESARROLLO UNIDAD DE POSGRADO DEL ESTUDIO
TESIS: “EFECTO DE LA UTILIZACIÓN DE LA CASCARILLA DE ARROZ Y ALMIDÓN COMO LIGANTE EN LA RESISTENCIA DE PANELES AGLOMERADOS DE USO EN LA CONSTRUCCIÓN” ING. LIZBETH CASAS SANDOVAL
60
Foto N°3.28 Probeta habilitada – Ensayo de resistencia al arranque de la superficie
En la imagen se observa la probeta habilitada con una base de madera en la parte inferior y una pieza de cerámica en la parte superior, para poder adherir ésta al hongo de acero mediante el epoxi. Determinación de la fuerza de ruptura Después del enfriamiento y fraguado del adhesivo, las probetas deben
colocarse sobre el dispositivo cardan. Se aplica una fuerza de tracción a velocidad constante con el fin de
alcanzar la rotura en un intervalo de (60±30) s. Se anota la fuerza de rotura.
Foto N°3.29
Probetas habilitadas y adheridas al hongo metálico para el ensayo de resistencia al arranque
En la imagen anterior se observa la probeta habilitada con el hongo metálico adherido con resina epóxica de dos compuestos, en la parte superior de la cerámica.
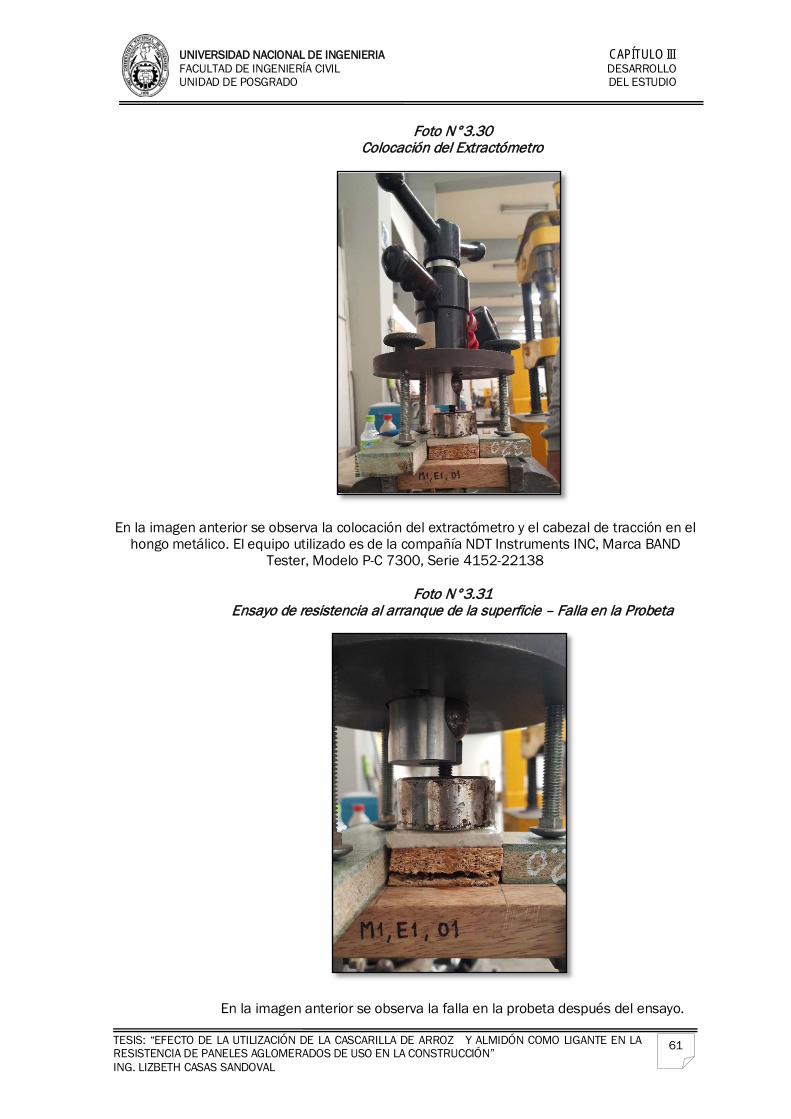
UNIVERSIDAD NACIONAL DE INGENIERIA CAPÍTULO III FACULTAD DE INGENIERÍA CIVIL DESARROLLO UNIDAD DE POSGRADO DEL ESTUDIO
TESIS: “EFECTO DE LA UTILIZACIÓN DE LA CASCARILLA DE ARROZ Y ALMIDÓN COMO LIGANTE EN LA RESISTENCIA DE PANELES AGLOMERADOS DE USO EN LA CONSTRUCCIÓN” ING. LIZBETH CASAS SANDOVAL
61
Foto N°3.30 Colocación del Extractómetro
En la imagen anterior se observa la colocación del extractómetro y el cabezal de tracción en el hongo metálico. El equipo utilizado es de la compañía NDT Instruments INC, Marca BAND
Tester, Modelo P-C 7300, Serie 4152-22138
Foto N°3.31 Ensayo de resistencia al arranque de la superficie – Falla en la Probeta
En la imagen anterior se observa la falla en la probeta después del ensayo.
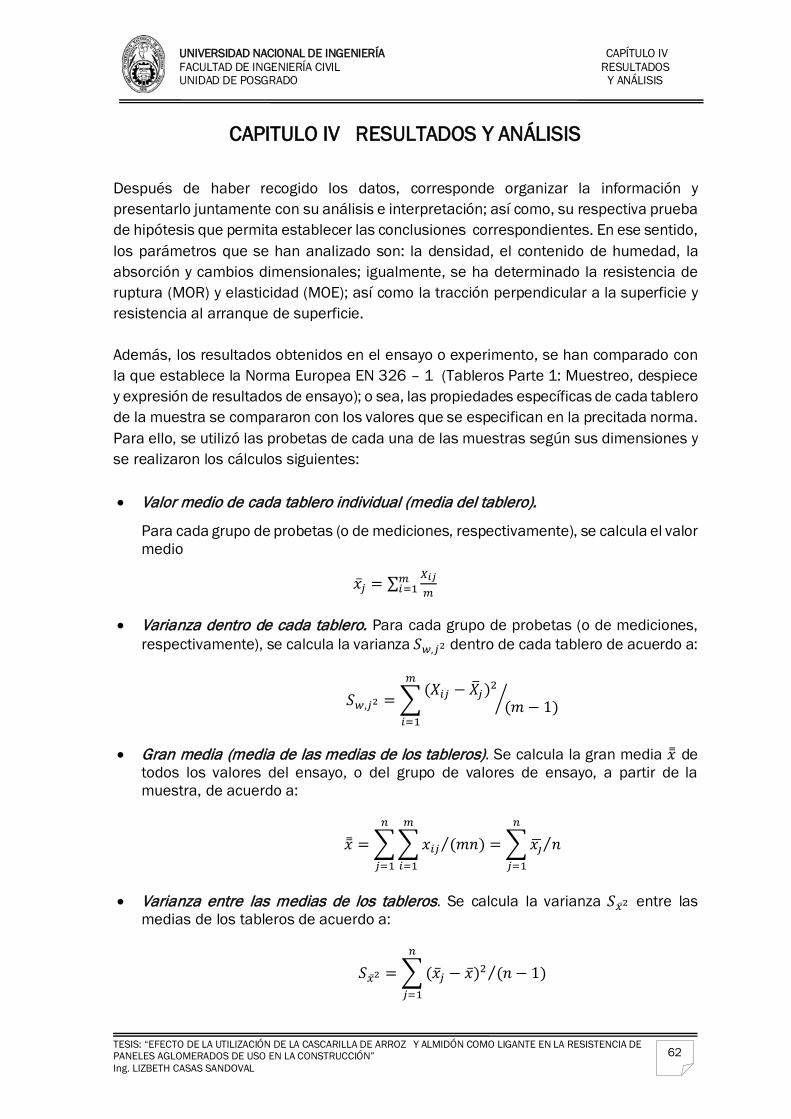
UNIVERSIDAD NACIONAL DE INGENIERÍA CAPÍTULO IV FACULTAD DE INGENIERÍA CIVIL RESULTADOS UNIDAD DE POSGRADO Y ANÁLISIS
TESIS: “EFECTO DE LA UTILIZACIÓN DE LA CASCARILLA DE ARROZ Y ALMIDÓN COMO LIGANTE EN LA RESISTENCIA DE PANELES AGLOMERADOS DE USO EN LA CONSTRUCCIÓN” Ing. LIZBETH CASAS SANDOVAL
62
CAPITULO IV RESULTADOS Y ANÁLISIS Después de haber recogido los datos, corresponde organizar la información y presentarlo juntamente con su análisis e interpretación; así como, su respectiva prueba de hipótesis que permita establecer las conclusiones correspondientes. En ese sentido, los parámetros que se han analizado son: la densidad, el contenido de humedad, la absorción y cambios dimensionales; igualmente, se ha determinado la resistencia de ruptura (MOR) y elasticidad (MOE); así como la tracción perpendicular a la superficie y resistencia al arranque de superficie. Además, los resultados obtenidos en el ensayo o experimento, se han comparado con la que establece la Norma Europea EN 326 – 1 (Tableros Parte 1: Muestreo, despiece y expresión de resultados de ensayo); o sea, las propiedades específicas de cada tablero de la muestra se compararon con los valores que se especifican en la precitada norma. Para ello, se utilizó las probetas de cada una de las muestras según sus dimensiones y se realizaron los cálculos siguientes: • Valor medio de cada tablero individual (media del tablero).
Para cada grupo de probetas (o de mediciones, respectivamente), se calcula el valor medio
�̅�𝑥𝑗𝑗 = ∑ 𝑋𝑋𝑖𝑖𝑖𝑖𝑚𝑚
𝑚𝑚𝑖𝑖=1
• Varianza dentro de cada tablero. Para cada grupo de probetas (o de mediciones,
respectivamente), se calcula la varianza 𝑆𝑆𝑤𝑤,𝑗𝑗2 dentro de cada tablero de acuerdo a:
𝑆𝑆𝑤𝑤,𝑗𝑗2 = � (𝑋𝑋𝑖𝑖𝑗𝑗 − 𝑋𝑋�𝑗𝑗)2(𝑚𝑚− 1)�
𝑚𝑚
𝑖𝑖=1
• Gran media (media de las medias de los tableros). Se calcula la gran media �̿�𝑥 de
todos los valores del ensayo, o del grupo de valores de ensayo, a partir de la muestra, de acuerdo a:
�̿�𝑥 = ��𝑥𝑥𝑖𝑖𝑗𝑗 (𝑚𝑚𝑚𝑚)⁄ = �𝑥𝑥𝚥𝚥� 𝑚𝑚⁄𝑛𝑛
𝑗𝑗=1
𝑚𝑚
𝑖𝑖=1
𝑛𝑛
𝑗𝑗=1
• Varianza entre las medias de los tableros. Se calcula la varianza 𝑆𝑆�̅�𝑥2 entre las
medias de los tableros de acuerdo a:
𝑆𝑆�̅�𝑥2 = � (�̅�𝑥𝑗𝑗 − �̅�𝑥)2 (𝑚𝑚 − 1)⁄𝑛𝑛
𝑗𝑗=1
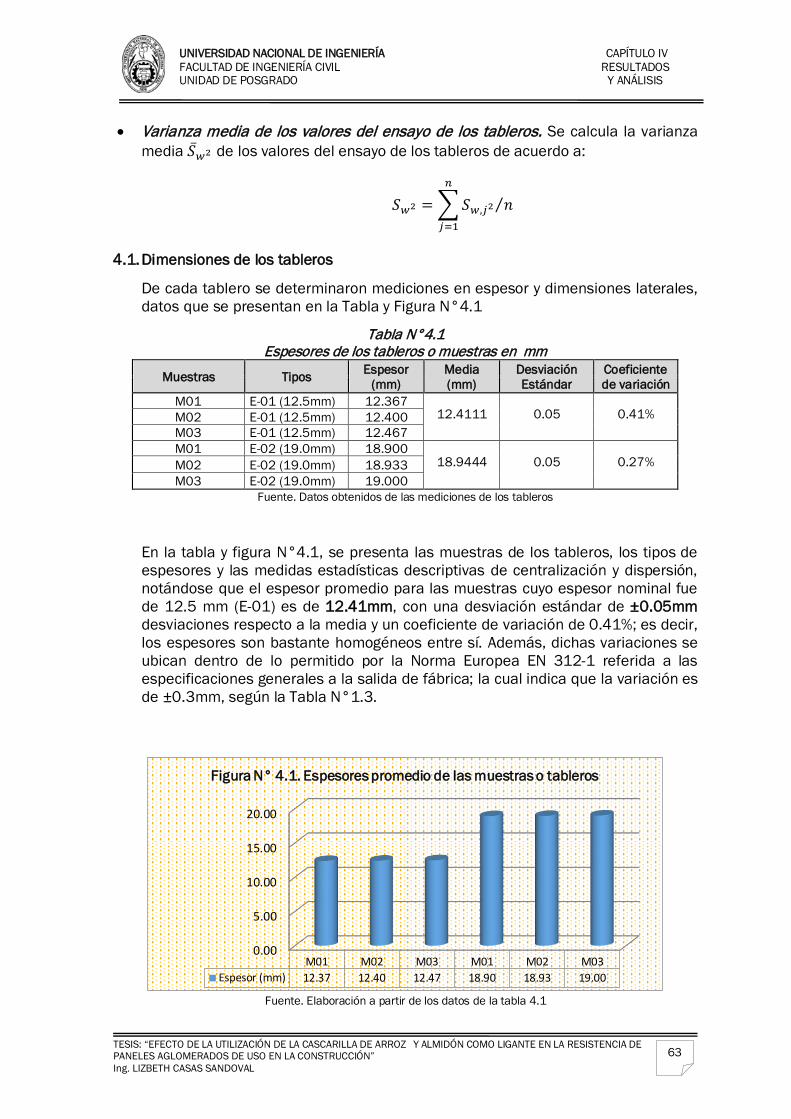
UNIVERSIDAD NACIONAL DE INGENIERÍA CAPÍTULO IV FACULTAD DE INGENIERÍA CIVIL RESULTADOS UNIDAD DE POSGRADO Y ANÁLISIS
TESIS: “EFECTO DE LA UTILIZACIÓN DE LA CASCARILLA DE ARROZ Y ALMIDÓN COMO LIGANTE EN LA RESISTENCIA DE PANELES AGLOMERADOS DE USO EN LA CONSTRUCCIÓN” Ing. LIZBETH CASAS SANDOVAL
63
• Varianza media de los valores del ensayo de los tableros. Se calcula la varianza media 𝑆𝑆̅𝑤𝑤2 de los valores del ensayo de los tableros de acuerdo a:
𝑆𝑆𝑤𝑤2 = �𝑆𝑆𝑤𝑤,𝑗𝑗2 𝑚𝑚⁄𝑛𝑛
𝑗𝑗=1
4.1. Dimensiones de los tableros
De cada tablero se determinaron mediciones en espesor y dimensiones laterales, datos que se presentan en la Tabla y Figura N°4.1
Tabla N°4.1 Espesores de los tableros o muestras en mm
Muestras Tipos Espesor (mm)
Media (mm)
Desviación Estándar
Coeficiente de variación
M01 E-01 (12.5mm) 12.367 12.4111 0.05 0.41% M02 E-01 (12.5mm) 12.400
M03 E-01 (12.5mm) 12.467 M01 E-02 (19.0mm) 18.900
18.9444 0.05 0.27% M02 E-02 (19.0mm) 18.933 M03 E-02 (19.0mm) 19.000
Fuente. Datos obtenidos de las mediciones de los tableros
En la tabla y figura N°4.1, se presenta las muestras de los tableros, los tipos de espesores y las medidas estadísticas descriptivas de centralización y dispersión, notándose que el espesor promedio para las muestras cuyo espesor nominal fue de 12.5 mm (E-01) es de 12.41mm, con una desviación estándar de ±0.05mm desviaciones respecto a la media y un coeficiente de variación de 0.41%; es decir, los espesores son bastante homogéneos entre sí. Además, dichas variaciones se ubican dentro de lo permitido por la Norma Europea EN 312-1 referida a las especificaciones generales a la salida de fábrica; la cual indica que la variación es de ±0.3mm, según la Tabla N°1.3.
Fuente. Elaboración a partir de los datos de la tabla 4.1
0.00
5.00
10.00
15.00
20.00
M01 M02 M03 M01 M02 M03Espesor (mm) 12.37 12.40 12.47 18.90 18.93 19.00
Figura N° 4.1. Espesores promedio de las muestras o tableros
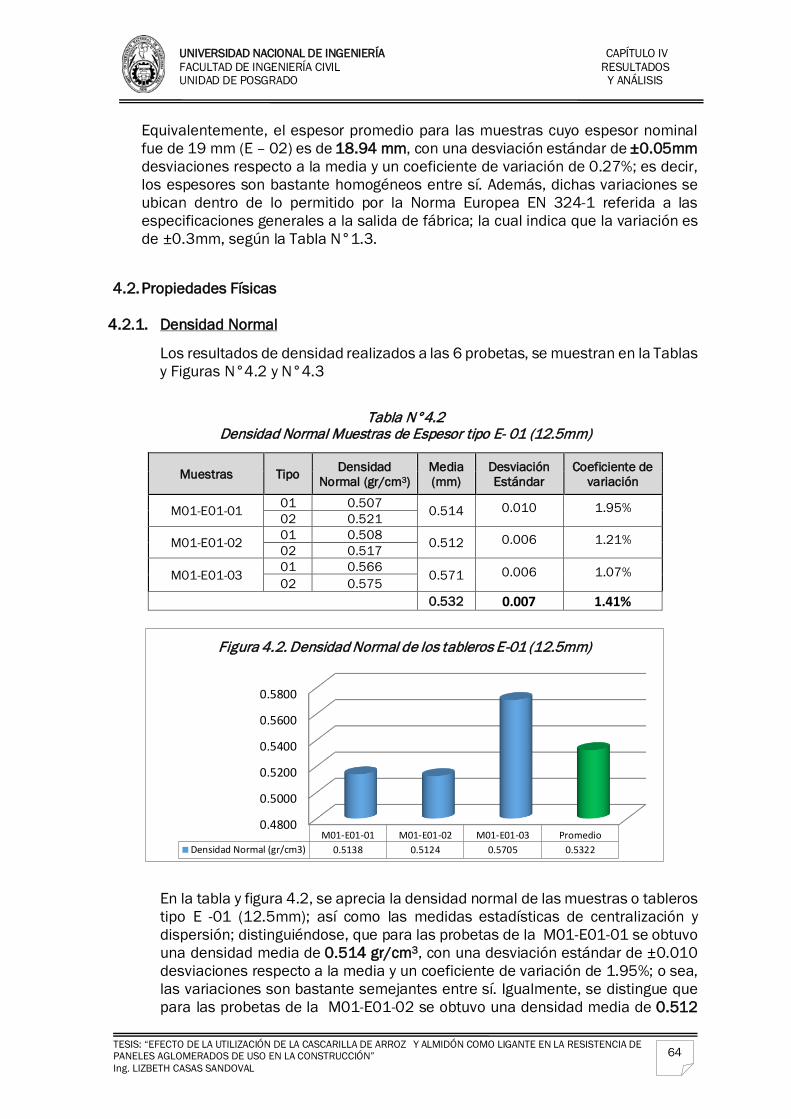
UNIVERSIDAD NACIONAL DE INGENIERÍA CAPÍTULO IV FACULTAD DE INGENIERÍA CIVIL RESULTADOS UNIDAD DE POSGRADO Y ANÁLISIS
TESIS: “EFECTO DE LA UTILIZACIÓN DE LA CASCARILLA DE ARROZ Y ALMIDÓN COMO LIGANTE EN LA RESISTENCIA DE PANELES AGLOMERADOS DE USO EN LA CONSTRUCCIÓN” Ing. LIZBETH CASAS SANDOVAL
64
Equivalentemente, el espesor promedio para las muestras cuyo espesor nominal fue de 19 mm (E – 02) es de 18.94 mm, con una desviación estándar de ±0.05mm desviaciones respecto a la media y un coeficiente de variación de 0.27%; es decir, los espesores son bastante homogéneos entre sí. Además, dichas variaciones se ubican dentro de lo permitido por la Norma Europea EN 324-1 referida a las especificaciones generales a la salida de fábrica; la cual indica que la variación es de ±0.3mm, según la Tabla N°1.3.
4.2. Propiedades Físicas
4.2.1. Densidad Normal
Los resultados de densidad realizados a las 6 probetas, se muestran en la Tablas y Figuras N°4.2 y N°4.3
Tabla N°4.2
Densidad Normal Muestras de Espesor tipo E- 01 (12.5mm)
Muestras Tipo Densidad Normal (gr/cm3)
Media (mm)
Desviación Estándar
Coeficiente de variación
M01-E01-01 01 0.507 0.514 0.010 1.95% 02 0.521
M01-E01-02 01 0.508 0.512 0.006 1.21% 02 0.517
M01-E01-03 01 0.566 0.571 0.006 1.07% 02 0.575 0.532 0.007 1.41%
En la tabla y figura 4.2, se aprecia la densidad normal de las muestras o tableros tipo E -01 (12.5mm); así como las medidas estadísticas de centralización y dispersión; distinguiéndose, que para las probetas de la M01-E01-01 se obtuvo una densidad media de 0.514 gr/cm3, con una desviación estándar de ±0.010 desviaciones respecto a la media y un coeficiente de variación de 1.95%; o sea, las variaciones son bastante semejantes entre sí. Igualmente, se distingue que para las probetas de la M01-E01-02 se obtuvo una densidad media de 0.512
0.4800
0.5000
0.5200
0.5400
0.5600
0.5800
M01-E01-01 M01-E01-02 M01-E01-03 PromedioDensidad Normal (gr/cm3) 0.5138 0.5124 0.5705 0.5322
Figura 4.2. Densidad Normal de los tableros E-01 (12.5mm)
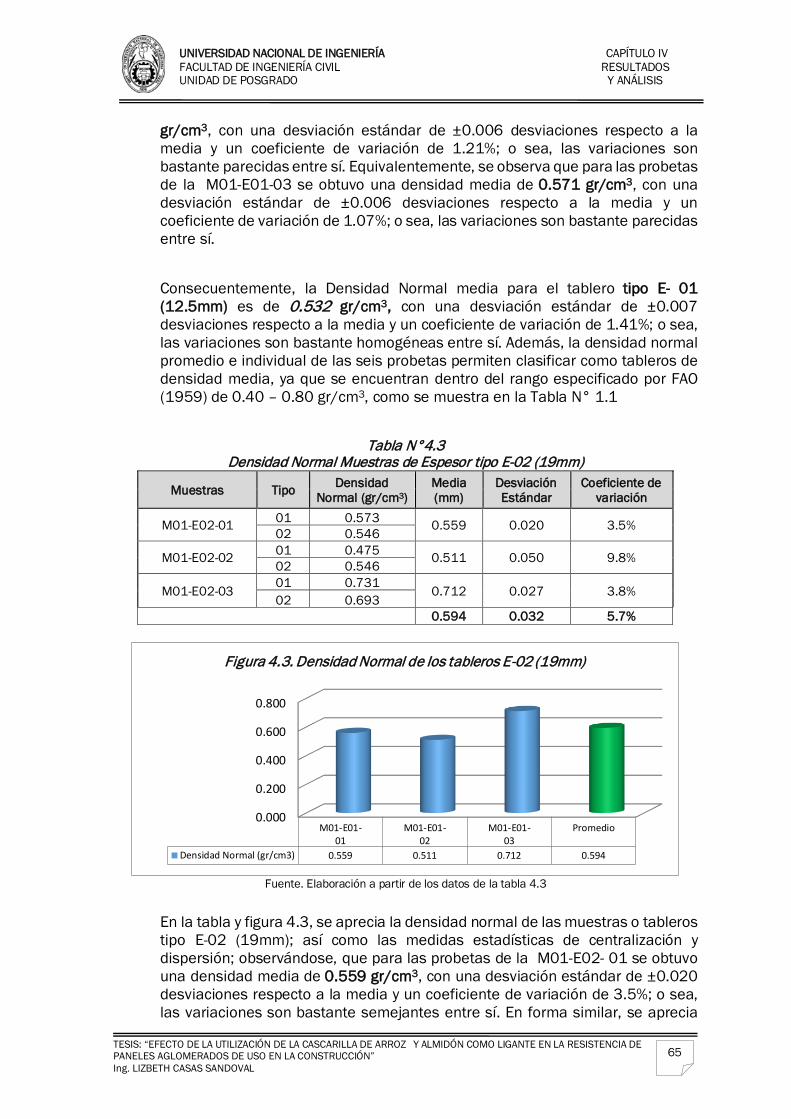
UNIVERSIDAD NACIONAL DE INGENIERÍA CAPÍTULO IV FACULTAD DE INGENIERÍA CIVIL RESULTADOS UNIDAD DE POSGRADO Y ANÁLISIS
TESIS: “EFECTO DE LA UTILIZACIÓN DE LA CASCARILLA DE ARROZ Y ALMIDÓN COMO LIGANTE EN LA RESISTENCIA DE PANELES AGLOMERADOS DE USO EN LA CONSTRUCCIÓN” Ing. LIZBETH CASAS SANDOVAL
65
gr/cm3, con una desviación estándar de ±0.006 desviaciones respecto a la media y un coeficiente de variación de 1.21%; o sea, las variaciones son bastante parecidas entre sí. Equivalentemente, se observa que para las probetas de la M01-E01-03 se obtuvo una densidad media de 0.571 gr/cm3, con una desviación estándar de ±0.006 desviaciones respecto a la media y un coeficiente de variación de 1.07%; o sea, las variaciones son bastante parecidas entre sí.
Consecuentemente, la Densidad Normal media para el tablero tipo E- 01 (12.5mm) es de 0.532 gr/cm3, con una desviación estándar de ±0.007 desviaciones respecto a la media y un coeficiente de variación de 1.41%; o sea, las variaciones son bastante homogéneas entre sí. Además, la densidad normal promedio e individual de las seis probetas permiten clasificar como tableros de densidad media, ya que se encuentran dentro del rango especificado por FAO (1959) de 0.40 – 0.80 gr/cm3, como se muestra en la Tabla N° 1.1
Tabla N°4.3
Densidad Normal Muestras de Espesor tipo E-02 (19mm)
Muestras Tipo Densidad Normal (gr/cm3)
Media (mm)
Desviación Estándar
Coeficiente de variación
M01-E02-01 01 0.573 0.559 0.020 3.5% 02 0.546
M01-E02-02 01 0.475 0.511 0.050 9.8% 02 0.546
M01-E02-03 01 0.731 0.712 0.027 3.8% 02 0.693 0.594 0.032 5.7%
Fuente. Elaboración a partir de los datos de la tabla 4.3
En la tabla y figura 4.3, se aprecia la densidad normal de las muestras o tableros tipo E-02 (19mm); así como las medidas estadísticas de centralización y dispersión; observándose, que para las probetas de la M01-E02- 01 se obtuvo una densidad media de 0.559 gr/cm3, con una desviación estándar de ±0.020 desviaciones respecto a la media y un coeficiente de variación de 3.5%; o sea, las variaciones son bastante semejantes entre sí. En forma similar, se aprecia
0.000
0.200
0.400
0.600
0.800
M01-E01-01
M01-E01-02
M01-E01-03
Promedio
Densidad Normal (gr/cm3) 0.559 0.511 0.712 0.594
Figura 4.3. Densidad Normal de los tableros E-02 (19mm)
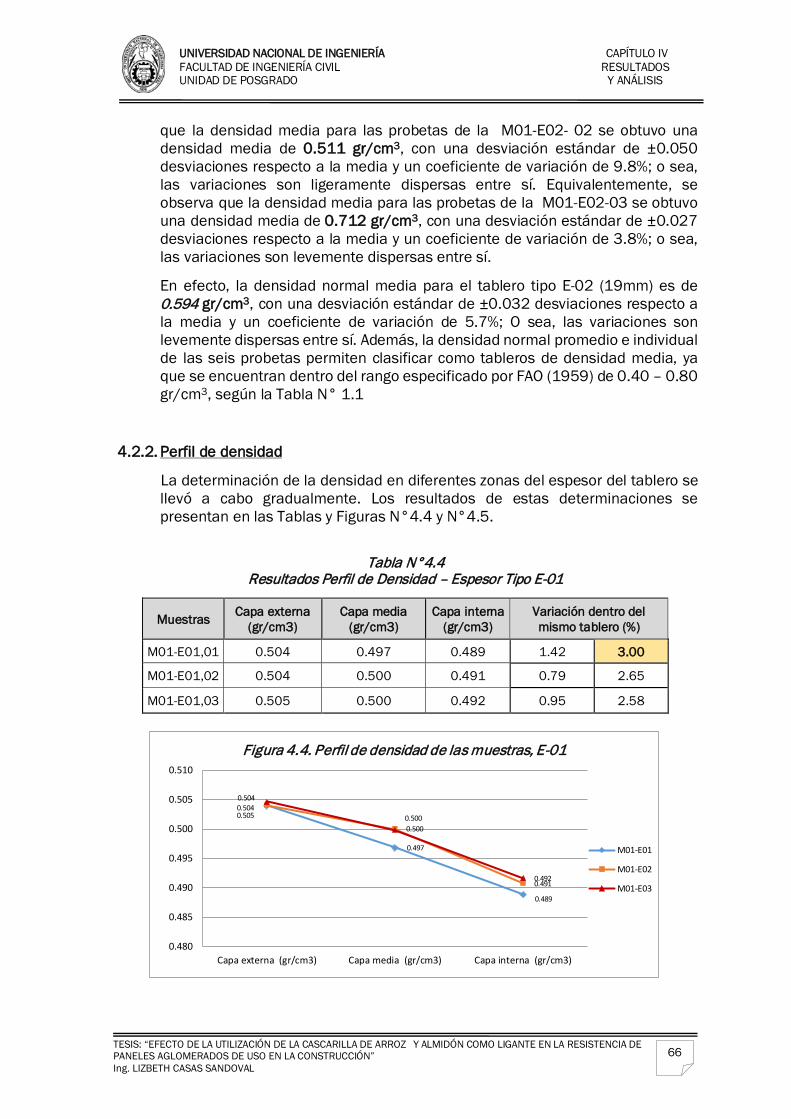
UNIVERSIDAD NACIONAL DE INGENIERÍA CAPÍTULO IV FACULTAD DE INGENIERÍA CIVIL RESULTADOS UNIDAD DE POSGRADO Y ANÁLISIS
TESIS: “EFECTO DE LA UTILIZACIÓN DE LA CASCARILLA DE ARROZ Y ALMIDÓN COMO LIGANTE EN LA RESISTENCIA DE PANELES AGLOMERADOS DE USO EN LA CONSTRUCCIÓN” Ing. LIZBETH CASAS SANDOVAL
66
que la densidad media para las probetas de la M01-E02- 02 se obtuvo una densidad media de 0.511 gr/cm3, con una desviación estándar de ±0.050 desviaciones respecto a la media y un coeficiente de variación de 9.8%; o sea, las variaciones son ligeramente dispersas entre sí. Equivalentemente, se observa que la densidad media para las probetas de la M01-E02-03 se obtuvo una densidad media de 0.712 gr/cm3, con una desviación estándar de ±0.027 desviaciones respecto a la media y un coeficiente de variación de 3.8%; o sea, las variaciones son levemente dispersas entre sí.
En efecto, la densidad normal media para el tablero tipo E-02 (19mm) es de 0.594 gr/cm3, con una desviación estándar de ±0.032 desviaciones respecto a la media y un coeficiente de variación de 5.7%; O sea, las variaciones son levemente dispersas entre sí. Además, la densidad normal promedio e individual de las seis probetas permiten clasificar como tableros de densidad media, ya que se encuentran dentro del rango especificado por FAO (1959) de 0.40 – 0.80 gr/cm3, según la Tabla N° 1.1
4.2.2. Perfil de densidad
La determinación de la densidad en diferentes zonas del espesor del tablero se llevó a cabo gradualmente. Los resultados de estas determinaciones se presentan en las Tablas y Figuras N°4.4 y N°4.5.
Tabla N°4.4
Resultados Perfil de Densidad – Espesor Tipo E-01
Muestras Capa externa (gr/cm3)
Capa media (gr/cm3)
Capa interna (gr/cm3)
Variación dentro del mismo tablero (%)
M01-E01,01 0.504 0.497 0.489 1.42 3.00
M01-E01,02 0.504 0.500 0.491 0.79 2.65
M01-E01,03 0.505 0.500 0.492 0.95 2.58
0.504
0.497
0.489
0.504
0.500
0.491
0.505 0.500
0.492
0.480
0.485
0.490
0.495
0.500
0.505
0.510
Capa externa (gr/cm3) Capa media (gr/cm3) Capa interna (gr/cm3)
Figura 4.4. Perfil de densidad de las muestras, E-01
M01-E01
M01-E02
M01-E03
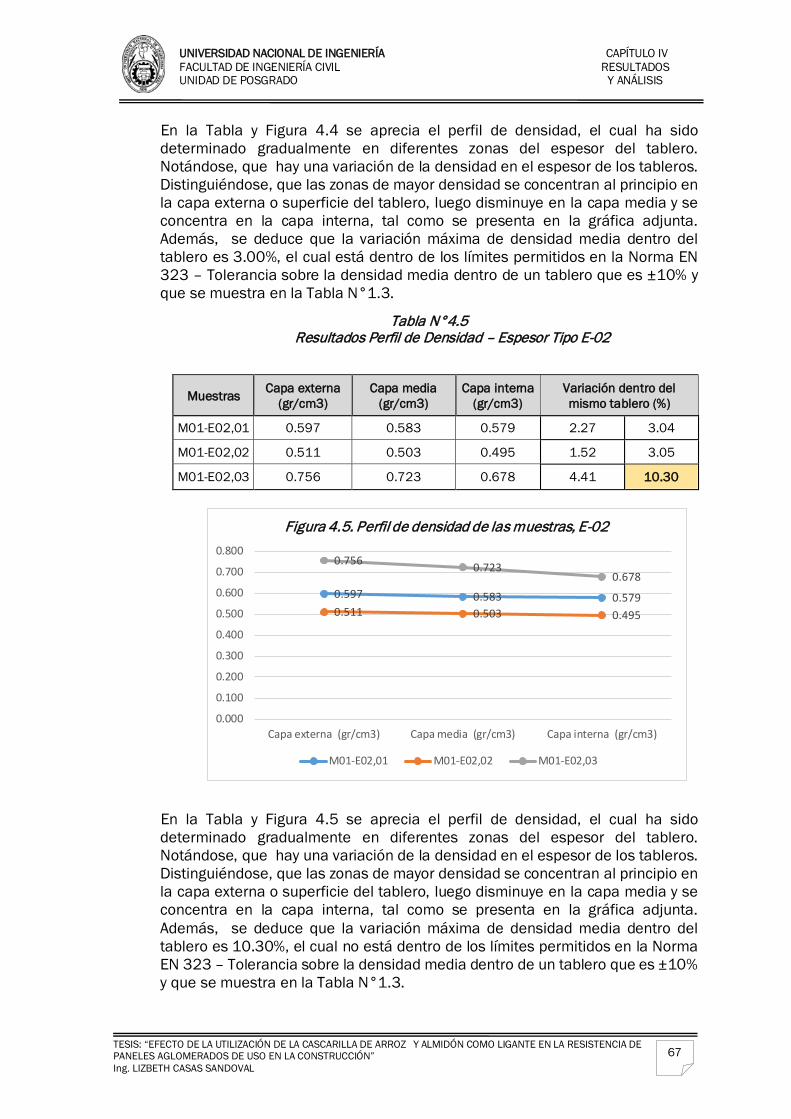
UNIVERSIDAD NACIONAL DE INGENIERÍA CAPÍTULO IV FACULTAD DE INGENIERÍA CIVIL RESULTADOS UNIDAD DE POSGRADO Y ANÁLISIS
TESIS: “EFECTO DE LA UTILIZACIÓN DE LA CASCARILLA DE ARROZ Y ALMIDÓN COMO LIGANTE EN LA RESISTENCIA DE PANELES AGLOMERADOS DE USO EN LA CONSTRUCCIÓN” Ing. LIZBETH CASAS SANDOVAL
67
En la Tabla y Figura 4.4 se aprecia el perfil de densidad, el cual ha sido determinado gradualmente en diferentes zonas del espesor del tablero. Notándose, que hay una variación de la densidad en el espesor de los tableros. Distinguiéndose, que las zonas de mayor densidad se concentran al principio en la capa externa o superficie del tablero, luego disminuye en la capa media y se concentra en la capa interna, tal como se presenta en la gráfica adjunta. Además, se deduce que la variación máxima de densidad media dentro del tablero es 3.00%, el cual está dentro de los límites permitidos en la Norma EN 323 – Tolerancia sobre la densidad media dentro de un tablero que es ±10% y que se muestra en la Tabla N°1.3.
Tabla N°4.5 Resultados Perfil de Densidad – Espesor Tipo E-02
Muestras Capa externa (gr/cm3)
Capa media (gr/cm3)
Capa interna (gr/cm3)
Variación dentro del mismo tablero (%)
M01-E02,01 0.597 0.583 0.579 2.27 3.04
M01-E02,02 0.511 0.503 0.495 1.52 3.05
M01-E02,03 0.756 0.723 0.678 4.41 10.30
En la Tabla y Figura 4.5 se aprecia el perfil de densidad, el cual ha sido determinado gradualmente en diferentes zonas del espesor del tablero. Notándose, que hay una variación de la densidad en el espesor de los tableros. Distinguiéndose, que las zonas de mayor densidad se concentran al principio en la capa externa o superficie del tablero, luego disminuye en la capa media y se concentra en la capa interna, tal como se presenta en la gráfica adjunta. Además, se deduce que la variación máxima de densidad media dentro del tablero es 10.30%, el cual no está dentro de los límites permitidos en la Norma EN 323 – Tolerancia sobre la densidad media dentro de un tablero que es ±10% y que se muestra en la Tabla N°1.3.
0.597 0.583 0.5790.511 0.503 0.495
0.756 0.7230.678
0.000
0.100
0.200
0.300
0.400
0.500
0.600
0.700
0.800
Capa externa (gr/cm3) Capa media (gr/cm3) Capa interna (gr/cm3)
Figura 4.5. Perfil de densidad de las muestras, E-02
M01-E02,01 M01-E02,02 M01-E02,03
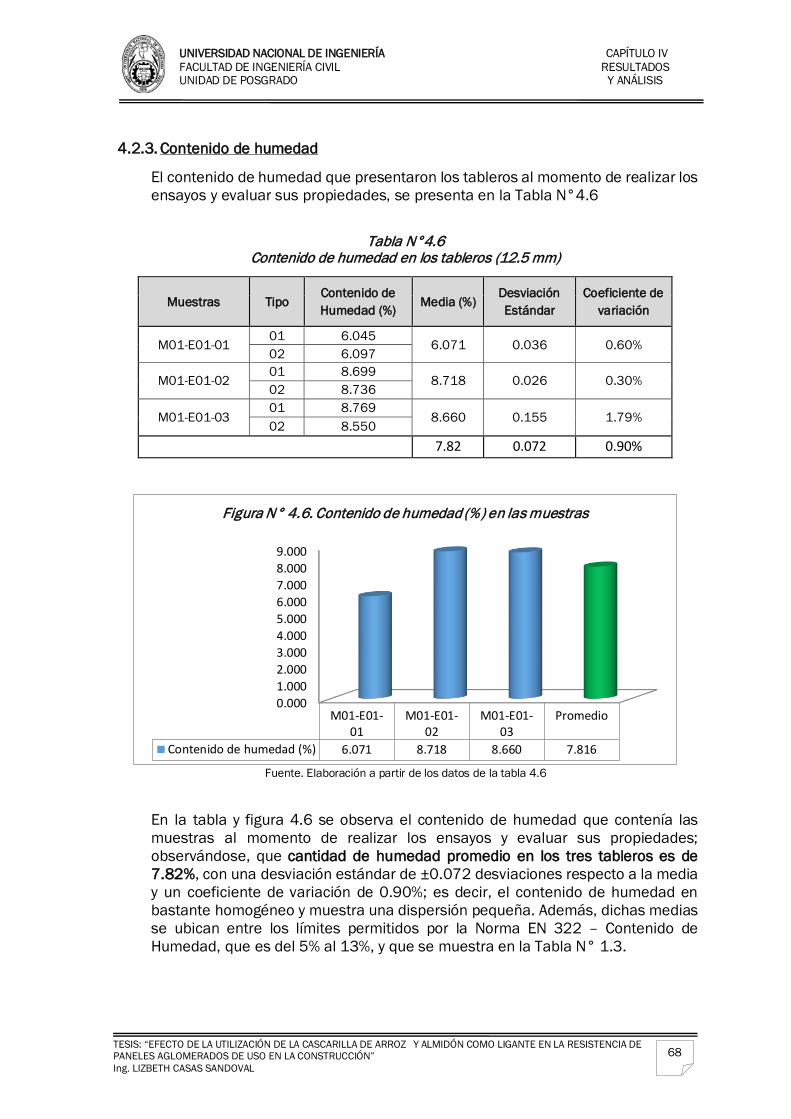
UNIVERSIDAD NACIONAL DE INGENIERÍA CAPÍTULO IV FACULTAD DE INGENIERÍA CIVIL RESULTADOS UNIDAD DE POSGRADO Y ANÁLISIS
TESIS: “EFECTO DE LA UTILIZACIÓN DE LA CASCARILLA DE ARROZ Y ALMIDÓN COMO LIGANTE EN LA RESISTENCIA DE PANELES AGLOMERADOS DE USO EN LA CONSTRUCCIÓN” Ing. LIZBETH CASAS SANDOVAL
68
4.2.3. Contenido de humedad
El contenido de humedad que presentaron los tableros al momento de realizar los ensayos y evaluar sus propiedades, se presenta en la Tabla N°4.6
Tabla N°4.6
Contenido de humedad en los tableros (12.5 mm)
Muestras Tipo Contenido de Humedad (%) Media (%)
Desviación Estándar
Coeficiente de variación
M01-E01-01 01 6.045
6.071 0.036 0.60% 02 6.097
M01-E01-02 01 8.699
8.718 0.026 0.30% 02 8.736
M01-E01-03 01 8.769
8.660 0.155 1.79% 02 8.550 7.82 0.072 0.90%
Fuente. Elaboración a partir de los datos de la tabla 4.6
En la tabla y figura 4.6 se observa el contenido de humedad que contenía las muestras al momento de realizar los ensayos y evaluar sus propiedades; observándose, que cantidad de humedad promedio en los tres tableros es de 7.82%, con una desviación estándar de ±0.072 desviaciones respecto a la media y un coeficiente de variación de 0.90%; es decir, el contenido de humedad en bastante homogéneo y muestra una dispersión pequeña. Además, dichas medias se ubican entre los límites permitidos por la Norma EN 322 – Contenido de Humedad, que es del 5% al 13%, y que se muestra en la Tabla N° 1.3.
0.0001.0002.0003.0004.0005.0006.0007.0008.0009.000
M01-E01-01
M01-E01-02
M01-E01-03
Promedio
Contenido de humedad (%) 6.071 8.718 8.660 7.816
Figura N° 4.6. Contenido de humedad (%) en las muestras
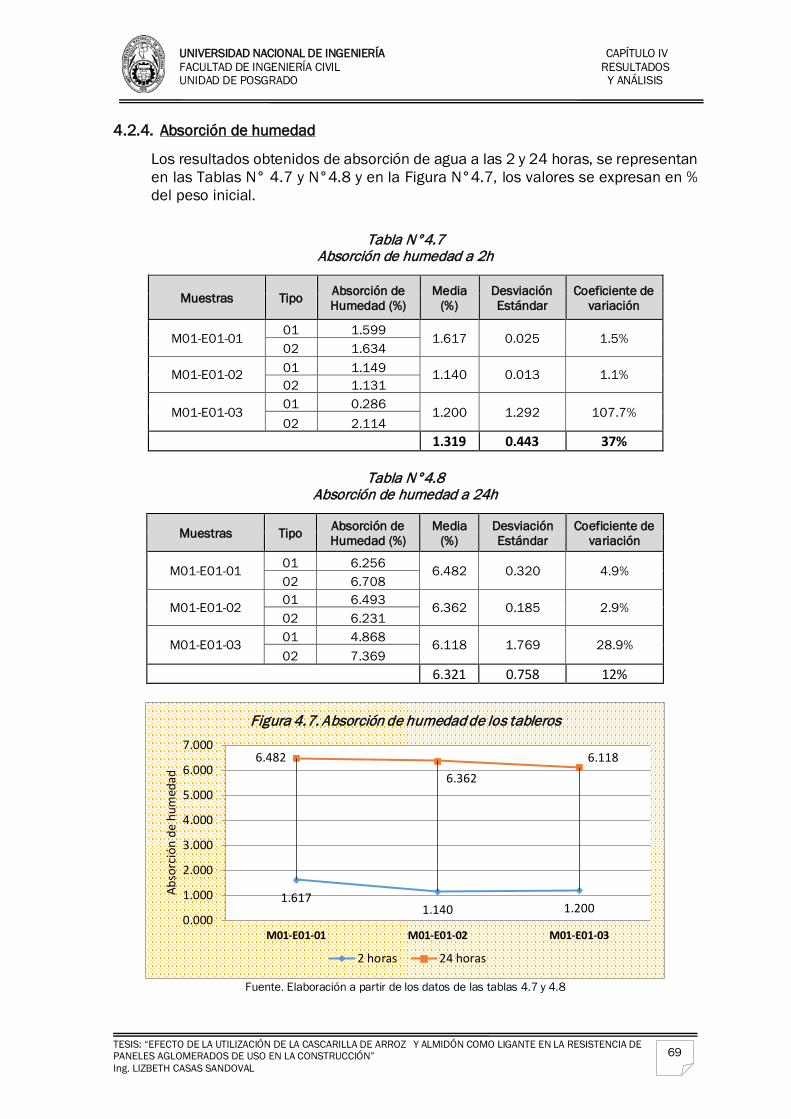
UNIVERSIDAD NACIONAL DE INGENIERÍA CAPÍTULO IV FACULTAD DE INGENIERÍA CIVIL RESULTADOS UNIDAD DE POSGRADO Y ANÁLISIS
TESIS: “EFECTO DE LA UTILIZACIÓN DE LA CASCARILLA DE ARROZ Y ALMIDÓN COMO LIGANTE EN LA RESISTENCIA DE PANELES AGLOMERADOS DE USO EN LA CONSTRUCCIÓN” Ing. LIZBETH CASAS SANDOVAL
69
4.2.4. Absorción de humedad
Los resultados obtenidos de absorción de agua a las 2 y 24 horas, se representan en las Tablas N° 4.7 y N°4.8 y en la Figura N°4.7, los valores se expresan en % del peso inicial.
Tabla N°4.7
Absorción de humedad a 2h
Muestras Tipo Absorción de Humedad (%)
Media (%)
Desviación Estándar
Coeficiente de variación
M01-E01-01 01 1.599 1.617 0.025 1.5% 02 1.634
M01-E01-02 01 1.149 1.140 0.013 1.1% 02 1.131
M01-E01-03 01 0.286 1.200 1.292 107.7% 02 2.114 1.319 0.443 37%
Tabla N°4.8
Absorción de humedad a 24h
Muestras Tipo Absorción de Humedad (%)
Media (%)
Desviación Estándar
Coeficiente de variación
M01-E01-01 01 6.256 6.482 0.320 4.9% 02 6.708
M01-E01-02 01 6.493 6.362 0.185 2.9% 02 6.231
M01-E01-03 01 4.868 6.118 1.769 28.9% 02 7.369 6.321 0.758 12%
Fuente. Elaboración a partir de los datos de las tablas 4.7 y 4.8
1.6171.140 1.200
6.4826.362
6.118
0.000
1.000
2.000
3.000
4.000
5.000
6.000
7.000
M01-E01-01 M01-E01-02 M01-E01-03
Abso
rció
n de
hum
edad
Figura 4.7. Absorción de humedad de los tableros
2 horas 24 horas
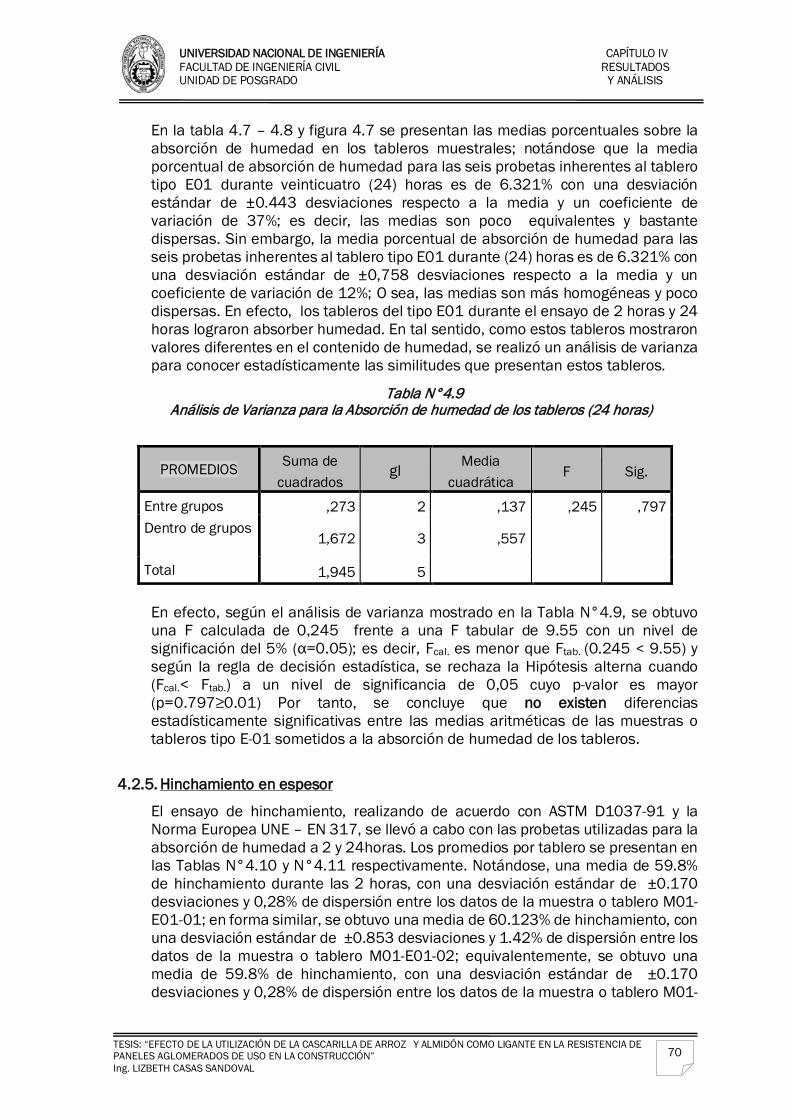
UNIVERSIDAD NACIONAL DE INGENIERÍA CAPÍTULO IV FACULTAD DE INGENIERÍA CIVIL RESULTADOS UNIDAD DE POSGRADO Y ANÁLISIS
TESIS: “EFECTO DE LA UTILIZACIÓN DE LA CASCARILLA DE ARROZ Y ALMIDÓN COMO LIGANTE EN LA RESISTENCIA DE PANELES AGLOMERADOS DE USO EN LA CONSTRUCCIÓN” Ing. LIZBETH CASAS SANDOVAL
70
En la tabla 4.7 – 4.8 y figura 4.7 se presentan las medias porcentuales sobre la absorción de humedad en los tableros muestrales; notándose que la media porcentual de absorción de humedad para las seis probetas inherentes al tablero tipo E01 durante veinticuatro (24) horas es de 6.321% con una desviación estándar de ±0.443 desviaciones respecto a la media y un coeficiente de variación de 37%; es decir, las medias son poco equivalentes y bastante dispersas. Sin embargo, la media porcentual de absorción de humedad para las seis probetas inherentes al tablero tipo E01 durante (24) horas es de 6.321% con una desviación estándar de ±0,758 desviaciones respecto a la media y un coeficiente de variación de 12%; O sea, las medias son más homogéneas y poco dispersas. En efecto, los tableros del tipo E01 durante el ensayo de 2 horas y 24 horas lograron absorber humedad. En tal sentido, como estos tableros mostraron valores diferentes en el contenido de humedad, se realizó un análisis de varianza para conocer estadísticamente las similitudes que presentan estos tableros.
Tabla N°4.9 Análisis de Varianza para la Absorción de humedad de los tableros (24 horas)
PROMEDIOS Suma de cuadrados
gl Media cuadrática
F Sig.
Entre grupos ,273 2 ,137 ,245 ,797 Dentro de grupos
1,672 3 ,557 Total 1,945 5 En efecto, según el análisis de varianza mostrado en la Tabla N°4.9, se obtuvo una F calculada de 0,245 frente a una F tabular de 9.55 con un nivel de significación del 5% (α=0.05); es decir, Fcal. es menor que Ftab. (0.245 < 9.55) y según la regla de decisión estadística, se rechaza la Hipótesis alterna cuando (Fcal.< Ftab.) a un nivel de significancia de 0,05 cuyo p-valor es mayor (p=0.797≥0.01) Por tanto, se concluye que no existen diferencias estadísticamente significativas entre las medias aritméticas de las muestras o tableros tipo E-01 sometidos a la absorción de humedad de los tableros.
4.2.5. Hinchamiento en espesor
El ensayo de hinchamiento, realizando de acuerdo con ASTM D1037-91 y la Norma Europea UNE – EN 317, se llevó a cabo con las probetas utilizadas para la absorción de humedad a 2 y 24horas. Los promedios por tablero se presentan en las Tablas N°4.10 y N°4.11 respectivamente. Notándose, una media de 59.8% de hinchamiento durante las 2 horas, con una desviación estándar de ±0.170 desviaciones y 0,28% de dispersión entre los datos de la muestra o tablero M01-E01-01; en forma similar, se obtuvo una media de 60.123% de hinchamiento, con una desviación estándar de ±0.853 desviaciones y 1.42% de dispersión entre los datos de la muestra o tablero M01-E01-02; equivalentemente, se obtuvo una media de 59.8% de hinchamiento, con una desviación estándar de ±0.170 desviaciones y 0,28% de dispersión entre los datos de la muestra o tablero M01-
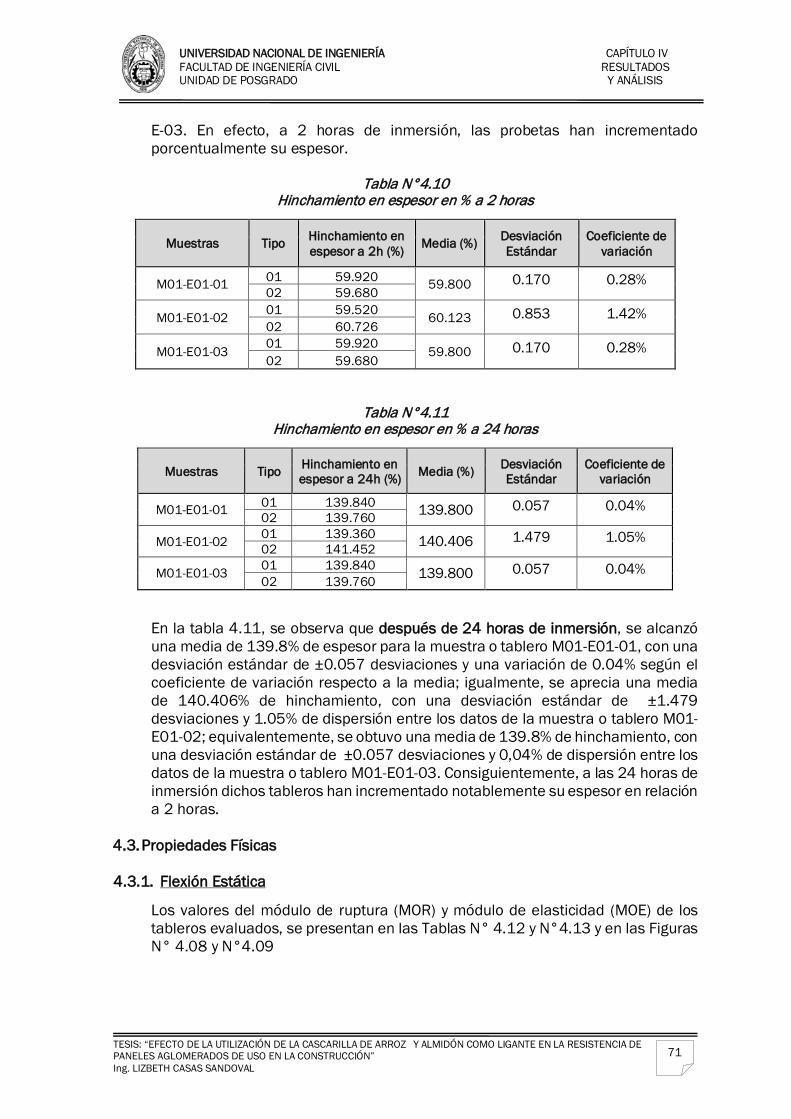
UNIVERSIDAD NACIONAL DE INGENIERÍA CAPÍTULO IV FACULTAD DE INGENIERÍA CIVIL RESULTADOS UNIDAD DE POSGRADO Y ANÁLISIS
TESIS: “EFECTO DE LA UTILIZACIÓN DE LA CASCARILLA DE ARROZ Y ALMIDÓN COMO LIGANTE EN LA RESISTENCIA DE PANELES AGLOMERADOS DE USO EN LA CONSTRUCCIÓN” Ing. LIZBETH CASAS SANDOVAL
71
E-03. En efecto, a 2 horas de inmersión, las probetas han incrementado porcentualmente su espesor.
Tabla N°4.10
Hinchamiento en espesor en % a 2 horas
Muestras Tipo Hinchamiento en espesor a 2h (%) Media (%) Desviación
Estándar Coeficiente de
variación
M01-E01-01 01 59.920 59.800 0.170 0.28% 02 59.680
M01-E01-02 01 59.520 60.123 0.853 1.42% 02 60.726
M01-E01-03 01 59.920 59.800 0.170 0.28% 02 59.680
Tabla N°4.11 Hinchamiento en espesor en % a 24 horas
Muestras Tipo Hinchamiento en espesor a 24h (%) Media (%) Desviación
Estándar Coeficiente de
variación
M01-E01-01 01 139.840 139.800 0.057 0.04% 02 139.760
M01-E01-02 01 139.360 140.406 1.479 1.05% 02 141.452
M01-E01-03 01 139.840 139.800 0.057 0.04% 02 139.760
En la tabla 4.11, se observa que después de 24 horas de inmersión, se alcanzó una media de 139.8% de espesor para la muestra o tablero M01-E01-01, con una desviación estándar de ±0.057 desviaciones y una variación de 0.04% según el coeficiente de variación respecto a la media; igualmente, se aprecia una media de 140.406% de hinchamiento, con una desviación estándar de ±1.479 desviaciones y 1.05% de dispersión entre los datos de la muestra o tablero M01-E01-02; equivalentemente, se obtuvo una media de 139.8% de hinchamiento, con una desviación estándar de ±0.057 desviaciones y 0,04% de dispersión entre los datos de la muestra o tablero M01-E01-03. Consiguientemente, a las 24 horas de inmersión dichos tableros han incrementado notablemente su espesor en relación a 2 horas.
4.3. Propiedades Físicas
4.3.1. Flexión Estática
Los valores del módulo de ruptura (MOR) y módulo de elasticidad (MOE) de los tableros evaluados, se presentan en las Tablas N° 4.12 y N°4.13 y en las Figuras N° 4.08 y N°4.09
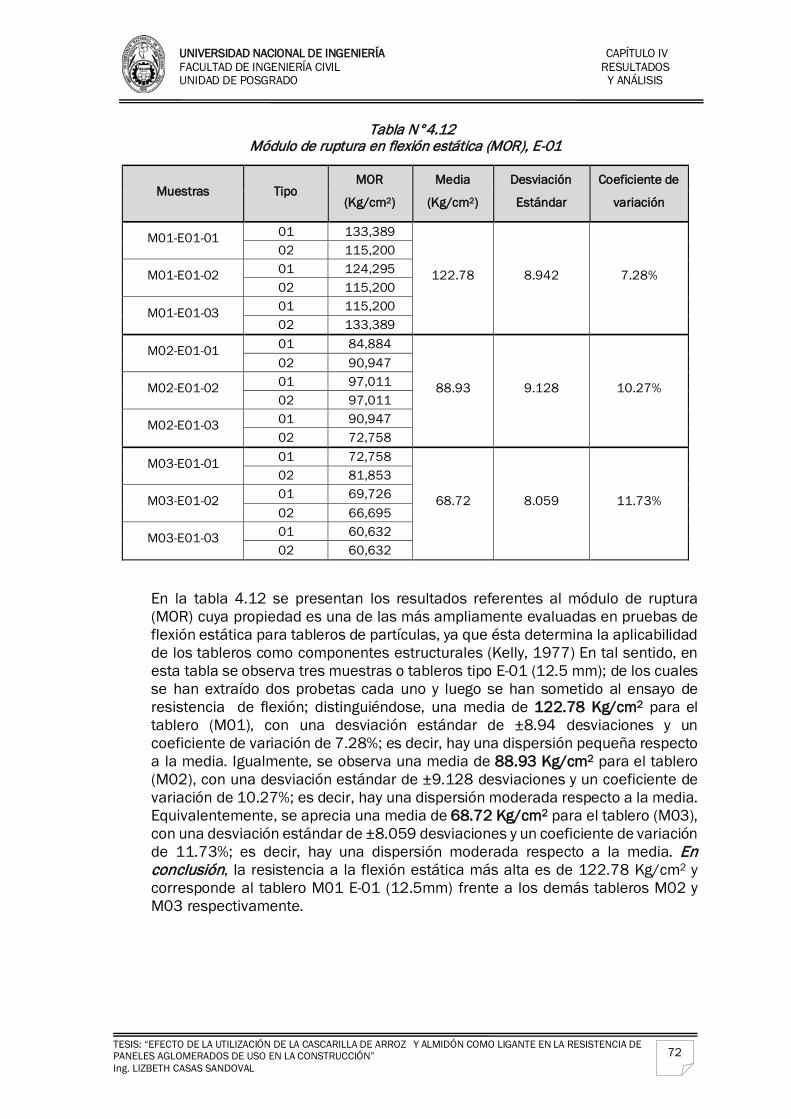
UNIVERSIDAD NACIONAL DE INGENIERÍA CAPÍTULO IV FACULTAD DE INGENIERÍA CIVIL RESULTADOS UNIDAD DE POSGRADO Y ANÁLISIS
TESIS: “EFECTO DE LA UTILIZACIÓN DE LA CASCARILLA DE ARROZ Y ALMIDÓN COMO LIGANTE EN LA RESISTENCIA DE PANELES AGLOMERADOS DE USO EN LA CONSTRUCCIÓN” Ing. LIZBETH CASAS SANDOVAL
72
Tabla N°4.12 Módulo de ruptura en flexión estática (MOR), E-01
Muestras Tipo MOR
(Kg/cm2)
Media
(Kg/cm2)
Desviación
Estándar
Coeficiente de
variación
M01-E01-01 01 133,389
122.78 8.942 7.28%
02 115,200
M01-E01-02 01 124,295 02 115,200
M01-E01-03 01 115,200 02 133,389
M02-E01-01 01 84,884
88.93 9.128 10.27%
02 90,947
M02-E01-02 01 97,011 02 97,011
M02-E01-03 01 90,947 02 72,758
M03-E01-01 01 72,758
68.72 8.059 11.73%
02 81,853
M03-E01-02 01 69,726 02 66,695
M03-E01-03 01 60,632 02 60,632
En la tabla 4.12 se presentan los resultados referentes al módulo de ruptura (MOR) cuya propiedad es una de las más ampliamente evaluadas en pruebas de flexión estática para tableros de partículas, ya que ésta determina la aplicabilidad de los tableros como componentes estructurales (Kelly, 1977) En tal sentido, en esta tabla se observa tres muestras o tableros tipo E-01 (12.5 mm); de los cuales se han extraído dos probetas cada uno y luego se han sometido al ensayo de resistencia de flexión; distinguiéndose, una media de 122.78 Kg/cm2 para el tablero (M01), con una desviación estándar de ±8.94 desviaciones y un coeficiente de variación de 7.28%; es decir, hay una dispersión pequeña respecto a la media. Igualmente, se observa una media de 88.93 Kg/cm2 para el tablero (M02), con una desviación estándar de ±9.128 desviaciones y un coeficiente de variación de 10.27%; es decir, hay una dispersión moderada respecto a la media. Equivalentemente, se aprecia una media de 68.72 Kg/cm2 para el tablero (M03), con una desviación estándar de ±8.059 desviaciones y un coeficiente de variación de 11.73%; es decir, hay una dispersión moderada respecto a la media. En conclusión, la resistencia a la flexión estática más alta es de 122.78 Kg/cm2 y corresponde al tablero M01 E-01 (12.5mm) frente a los demás tableros M02 y M03 respectivamente.
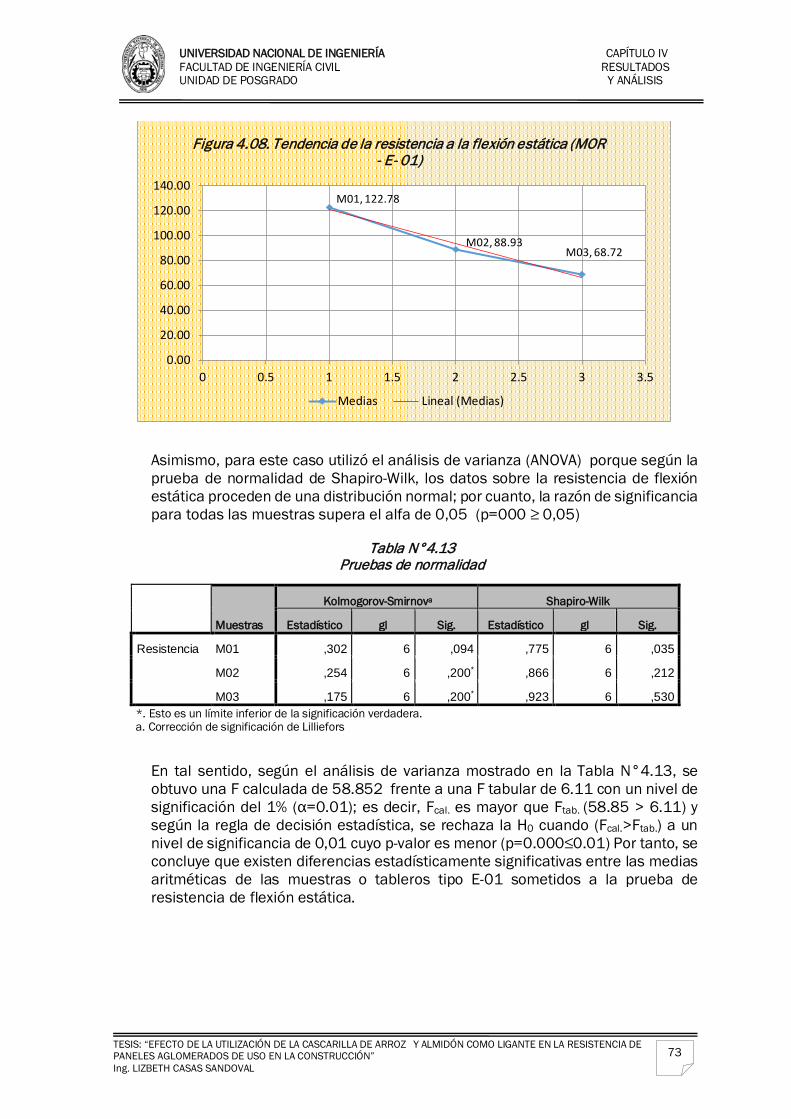
UNIVERSIDAD NACIONAL DE INGENIERÍA CAPÍTULO IV FACULTAD DE INGENIERÍA CIVIL RESULTADOS UNIDAD DE POSGRADO Y ANÁLISIS
TESIS: “EFECTO DE LA UTILIZACIÓN DE LA CASCARILLA DE ARROZ Y ALMIDÓN COMO LIGANTE EN LA RESISTENCIA DE PANELES AGLOMERADOS DE USO EN LA CONSTRUCCIÓN” Ing. LIZBETH CASAS SANDOVAL
73
Asimismo, para este caso utilizó el análisis de varianza (ANOVA) porque según la prueba de normalidad de Shapiro-Wilk, los datos sobre la resistencia de flexión estática proceden de una distribución normal; por cuanto, la razón de significancia para todas las muestras supera el alfa de 0,05 (p=000 ≥ 0,05)
Tabla N°4.13
Pruebas de normalidad
Muestras
Kolmogorov-Smirnova Shapiro-Wilk
Estadístico gl Sig. Estadístico gl Sig.
Resistencia M01 ,302 6 ,094 ,775 6 ,035
M02 ,254 6 ,200* ,866 6 ,212
M03 ,175 6 ,200* ,923 6 ,530 *. Esto es un límite inferior de la significación verdadera. a. Corrección de significación de Lilliefors
En tal sentido, según el análisis de varianza mostrado en la Tabla N°4.13, se obtuvo una F calculada de 58.852 frente a una F tabular de 6.11 con un nivel de significación del 1% (α=0.01); es decir, Fcal. es mayor que Ftab. (58.85 > 6.11) y según la regla de decisión estadística, se rechaza la H0 cuando (Fcal.>Ftab.) a un nivel de significancia de 0,01 cuyo p-valor es menor (p=0.000≤0.01) Por tanto, se concluye que existen diferencias estadísticamente significativas entre las medias aritméticas de las muestras o tableros tipo E-01 sometidos a la prueba de resistencia de flexión estática.
M01, 122.78
M02, 88.93M03, 68.72
0.00
20.00
40.00
60.00
80.00
100.00
120.00
140.00
0 0.5 1 1.5 2 2.5 3 3.5
Figura 4.08. Tendencia de la resistencia a la flexión estática (MOR - E- 01)
Medias Lineal (Medias)
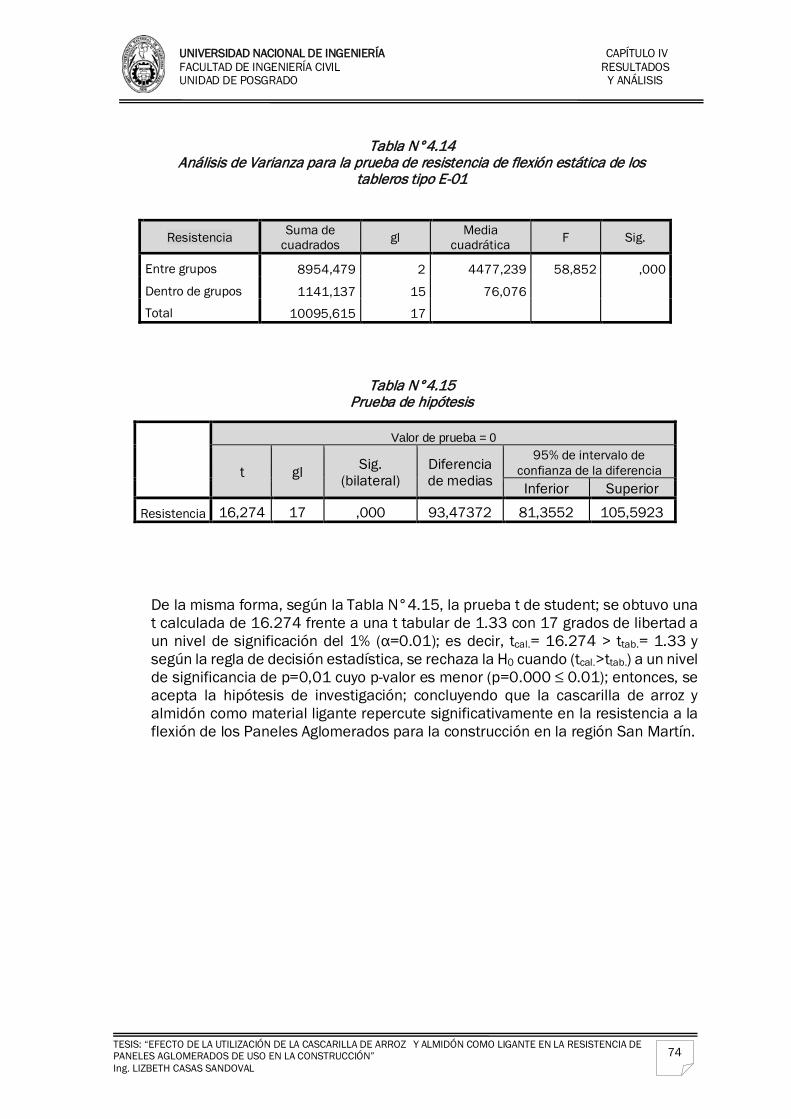
UNIVERSIDAD NACIONAL DE INGENIERÍA CAPÍTULO IV FACULTAD DE INGENIERÍA CIVIL RESULTADOS UNIDAD DE POSGRADO Y ANÁLISIS
TESIS: “EFECTO DE LA UTILIZACIÓN DE LA CASCARILLA DE ARROZ Y ALMIDÓN COMO LIGANTE EN LA RESISTENCIA DE PANELES AGLOMERADOS DE USO EN LA CONSTRUCCIÓN” Ing. LIZBETH CASAS SANDOVAL
74
Tabla N°4.14
Análisis de Varianza para la prueba de resistencia de flexión estática de los tableros tipo E-01
Resistencia Suma de cuadrados gl Media
cuadrática F Sig.
Entre grupos 8954,479 2 4477,239 58,852 ,000
Dentro de grupos 1141,137 15 76,076
Total 10095,615 17
Tabla N°4.15
Prueba de hipótesis
Valor de prueba = 0
t gl Sig. (bilateral)
Diferencia de medias
95% de intervalo de confianza de la diferencia Inferior Superior
Resistencia 16,274 17 ,000 93,47372 81,3552 105,5923 De la misma forma, según la Tabla N°4.15, la prueba t de student; se obtuvo una t calculada de 16.274 frente a una t tabular de 1.33 con 17 grados de libertad a un nivel de significación del 1% (α=0.01); es decir, tcal.= 16.274 > ttab.= 1.33 y según la regla de decisión estadística, se rechaza la H0 cuando (tcal.>ttab.) a un nivel de significancia de p=0,01 cuyo p-valor es menor (p=0.000 ≤ 0.01); entonces, se acepta la hipótesis de investigación; concluyendo que la cascarilla de arroz y almidón como material ligante repercute significativamente en la resistencia a la flexión de los Paneles Aglomerados para la construcción en la región San Martín.
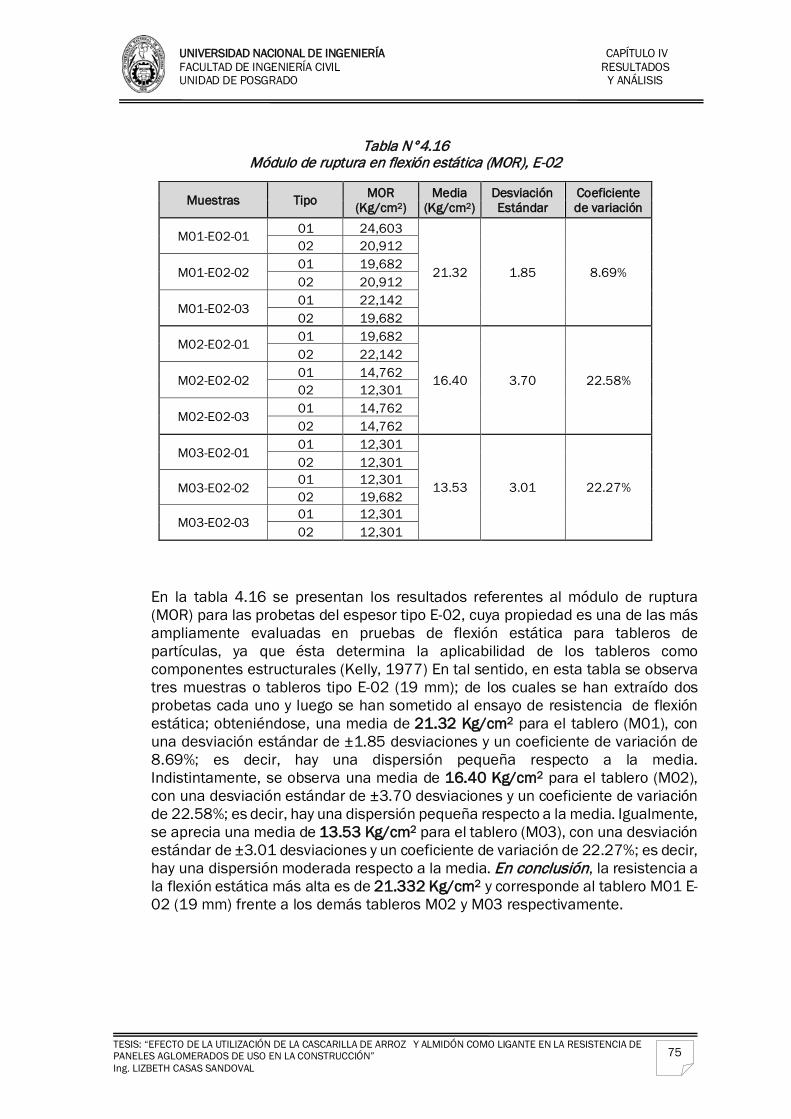
UNIVERSIDAD NACIONAL DE INGENIERÍA CAPÍTULO IV FACULTAD DE INGENIERÍA CIVIL RESULTADOS UNIDAD DE POSGRADO Y ANÁLISIS
TESIS: “EFECTO DE LA UTILIZACIÓN DE LA CASCARILLA DE ARROZ Y ALMIDÓN COMO LIGANTE EN LA RESISTENCIA DE PANELES AGLOMERADOS DE USO EN LA CONSTRUCCIÓN” Ing. LIZBETH CASAS SANDOVAL
75
Tabla N°4.16
Módulo de ruptura en flexión estática (MOR), E-02
Muestras Tipo MOR (Kg/cm2)
Media (Kg/cm2)
Desviación Estándar
Coeficiente de variación
M01-E02-01 01 24,603
21.32 1.85 8.69%
02 20,912
M01-E02-02 01 19,682 02 20,912
M01-E02-03 01 22,142 02 19,682
M02-E02-01 01 19,682
16.40 3.70 22.58%
02 22,142
M02-E02-02 01 14,762 02 12,301
M02-E02-03 01 14,762 02 14,762
M03-E02-01 01 12,301
13.53 3.01 22.27%
02 12,301
M03-E02-02 01 12,301 02 19,682
M03-E02-03 01 12,301 02 12,301
En la tabla 4.16 se presentan los resultados referentes al módulo de ruptura (MOR) para las probetas del espesor tipo E-02, cuya propiedad es una de las más ampliamente evaluadas en pruebas de flexión estática para tableros de partículas, ya que ésta determina la aplicabilidad de los tableros como componentes estructurales (Kelly, 1977) En tal sentido, en esta tabla se observa tres muestras o tableros tipo E-02 (19 mm); de los cuales se han extraído dos probetas cada uno y luego se han sometido al ensayo de resistencia de flexión estática; obteniéndose, una media de 21.32 Kg/cm2 para el tablero (M01), con una desviación estándar de ±1.85 desviaciones y un coeficiente de variación de 8.69%; es decir, hay una dispersión pequeña respecto a la media. Indistintamente, se observa una media de 16.40 Kg/cm2 para el tablero (M02), con una desviación estándar de ±3.70 desviaciones y un coeficiente de variación de 22.58%; es decir, hay una dispersión pequeña respecto a la media. Igualmente, se aprecia una media de 13.53 Kg/cm2 para el tablero (M03), con una desviación estándar de ±3.01 desviaciones y un coeficiente de variación de 22.27%; es decir, hay una dispersión moderada respecto a la media. En conclusión, la resistencia a la flexión estática más alta es de 21.332 Kg/cm2 y corresponde al tablero M01 E-02 (19 mm) frente a los demás tableros M02 y M03 respectivamente.
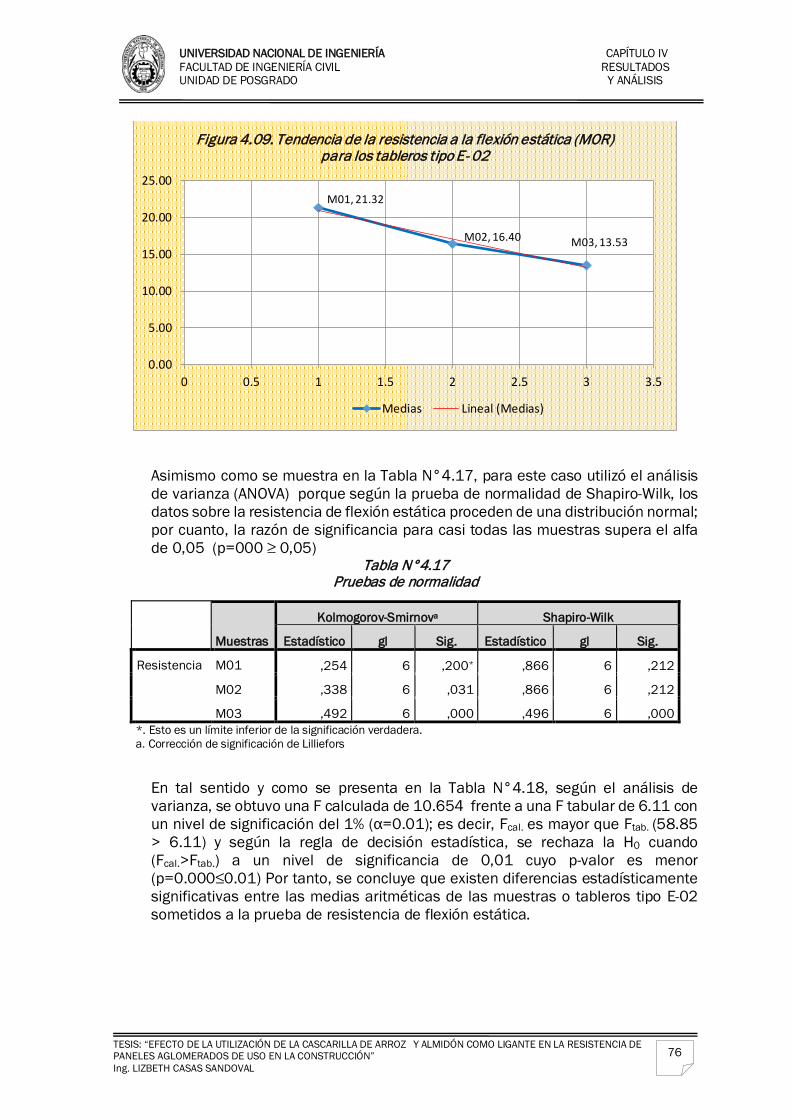
UNIVERSIDAD NACIONAL DE INGENIERÍA CAPÍTULO IV FACULTAD DE INGENIERÍA CIVIL RESULTADOS UNIDAD DE POSGRADO Y ANÁLISIS
TESIS: “EFECTO DE LA UTILIZACIÓN DE LA CASCARILLA DE ARROZ Y ALMIDÓN COMO LIGANTE EN LA RESISTENCIA DE PANELES AGLOMERADOS DE USO EN LA CONSTRUCCIÓN” Ing. LIZBETH CASAS SANDOVAL
76
Asimismo como se muestra en la Tabla N°4.17, para este caso utilizó el análisis de varianza (ANOVA) porque según la prueba de normalidad de Shapiro-Wilk, los datos sobre la resistencia de flexión estática proceden de una distribución normal; por cuanto, la razón de significancia para casi todas las muestras supera el alfa de 0,05 (p=000 ≥ 0,05)
Tabla N°4.17 Pruebas de normalidad
Muestras
Kolmogorov-Smirnova Shapiro-Wilk
Estadístico gl Sig. Estadístico gl Sig.
Resistencia M01 ,254 6 ,200* ,866 6 ,212
M02 ,338 6 ,031 ,866 6 ,212
M03 ,492 6 ,000 ,496 6 ,000 *. Esto es un límite inferior de la significación verdadera. a. Corrección de significación de Lilliefors
En tal sentido y como se presenta en la Tabla N°4.18, según el análisis de varianza, se obtuvo una F calculada de 10.654 frente a una F tabular de 6.11 con un nivel de significación del 1% (α=0.01); es decir, Fcal. es mayor que Ftab. (58.85 > 6.11) y según la regla de decisión estadística, se rechaza la H0 cuando (Fcal.>Ftab.) a un nivel de significancia de 0,01 cuyo p-valor es menor (p=0.000≤0.01) Por tanto, se concluye que existen diferencias estadísticamente significativas entre las medias aritméticas de las muestras o tableros tipo E-02 sometidos a la prueba de resistencia de flexión estática.
M01, 21.32
M02, 16.40 M03, 13.53
0.00
5.00
10.00
15.00
20.00
25.00
0 0.5 1 1.5 2 2.5 3 3.5
Figura 4.09. Tendencia de la resistencia a la flexión estática (MOR) para los tableros tipo E- 02
Medias Lineal (Medias)
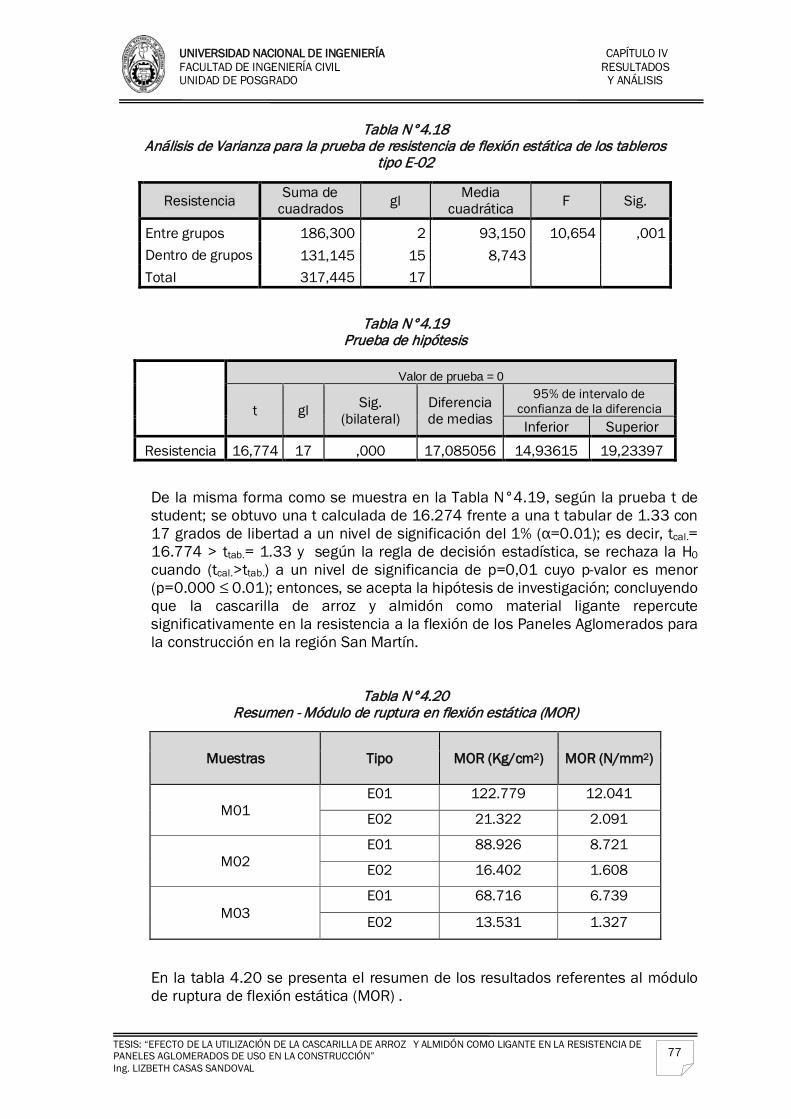
UNIVERSIDAD NACIONAL DE INGENIERÍA CAPÍTULO IV FACULTAD DE INGENIERÍA CIVIL RESULTADOS UNIDAD DE POSGRADO Y ANÁLISIS
TESIS: “EFECTO DE LA UTILIZACIÓN DE LA CASCARILLA DE ARROZ Y ALMIDÓN COMO LIGANTE EN LA RESISTENCIA DE PANELES AGLOMERADOS DE USO EN LA CONSTRUCCIÓN” Ing. LIZBETH CASAS SANDOVAL
77
Tabla N°4.18 Análisis de Varianza para la prueba de resistencia de flexión estática de los tableros
tipo E-02
Resistencia Suma de cuadrados gl Media
cuadrática F Sig.
Entre grupos 186,300 2 93,150 10,654 ,001 Dentro de grupos 131,145 15 8,743
Total 317,445 17
Tabla N°4.19
Prueba de hipótesis
Valor de prueba = 0
t gl Sig. (bilateral)
Diferencia de medias
95% de intervalo de confianza de la diferencia Inferior Superior
Resistencia 16,774 17 ,000 17,085056 14,93615 19,23397
De la misma forma como se muestra en la Tabla N°4.19, según la prueba t de student; se obtuvo una t calculada de 16.274 frente a una t tabular de 1.33 con 17 grados de libertad a un nivel de significación del 1% (α=0.01); es decir, tcal.= 16.774 > ttab.= 1.33 y según la regla de decisión estadística, se rechaza la H0 cuando (tcal.>ttab.) a un nivel de significancia de p=0,01 cuyo p-valor es menor (p=0.000 ≤ 0.01); entonces, se acepta la hipótesis de investigación; concluyendo que la cascarilla de arroz y almidón como material ligante repercute significativamente en la resistencia a la flexión de los Paneles Aglomerados para la construcción en la región San Martín.
Tabla N°4.20 Resumen - Módulo de ruptura en flexión estática (MOR)
Muestras Tipo MOR (Kg/cm2) MOR (N/mm2)
M01 E01 122.779 12.041
E02 21.322 2.091
M02 E01 88.926 8.721
E02 16.402 1.608
M03 E01 68.716 6.739
E02 13.531 1.327
En la tabla 4.20 se presenta el resumen de los resultados referentes al módulo de ruptura de flexión estática (MOR) .
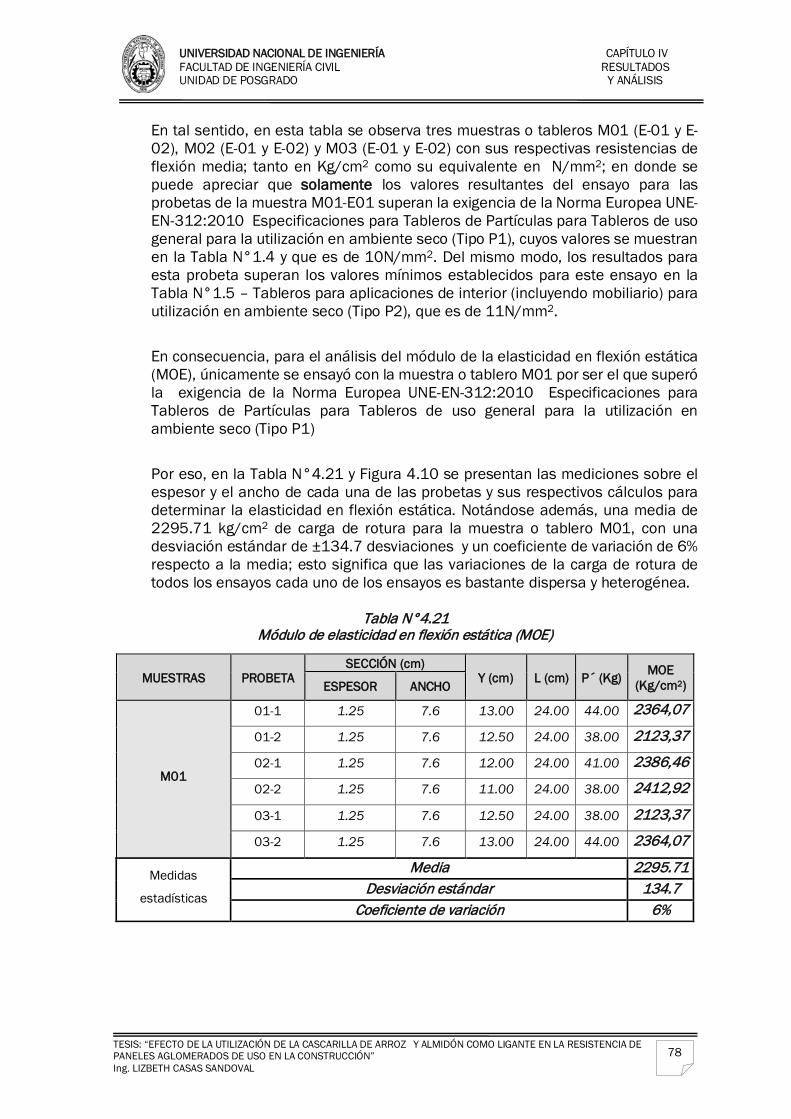
UNIVERSIDAD NACIONAL DE INGENIERÍA CAPÍTULO IV FACULTAD DE INGENIERÍA CIVIL RESULTADOS UNIDAD DE POSGRADO Y ANÁLISIS
TESIS: “EFECTO DE LA UTILIZACIÓN DE LA CASCARILLA DE ARROZ Y ALMIDÓN COMO LIGANTE EN LA RESISTENCIA DE PANELES AGLOMERADOS DE USO EN LA CONSTRUCCIÓN” Ing. LIZBETH CASAS SANDOVAL
78
En tal sentido, en esta tabla se observa tres muestras o tableros M01 (E-01 y E-02), M02 (E-01 y E-02) y M03 (E-01 y E-02) con sus respectivas resistencias de flexión media; tanto en Kg/cm2 como su equivalente en N/mm2; en donde se puede apreciar que solamente los valores resultantes del ensayo para las probetas de la muestra M01-E01 superan la exigencia de la Norma Europea UNE-EN-312:2010 Especificaciones para Tableros de Partículas para Tableros de uso general para la utilización en ambiente seco (Tipo P1), cuyos valores se muestran en la Tabla N°1.4 y que es de 10N/mm2. Del mismo modo, los resultados para esta probeta superan los valores mínimos establecidos para este ensayo en la Tabla N°1.5 – Tableros para aplicaciones de interior (incluyendo mobiliario) para utilización en ambiente seco (Tipo P2), que es de 11N/mm2.
En consecuencia, para el análisis del módulo de la elasticidad en flexión estática (MOE), únicamente se ensayó con la muestra o tablero M01 por ser el que superó la exigencia de la Norma Europea UNE-EN-312:2010 Especificaciones para Tableros de Partículas para Tableros de uso general para la utilización en ambiente seco (Tipo P1)
Por eso, en la Tabla N°4.21 y Figura 4.10 se presentan las mediciones sobre el espesor y el ancho de cada una de las probetas y sus respectivos cálculos para determinar la elasticidad en flexión estática. Notándose además, una media de 2295.71 kg/cm2 de carga de rotura para la muestra o tablero M01, con una desviación estándar de ±134.7 desviaciones y un coeficiente de variación de 6% respecto a la media; esto significa que las variaciones de la carga de rotura de todos los ensayos cada uno de los ensayos es bastante dispersa y heterogénea.
Tabla N°4.21
Módulo de elasticidad en flexión estática (MOE)
MUESTRAS PROBETA SECCIÓN (cm)
Y (cm) L (cm) P´ (Kg) MOE (Kg/cm2) ESPESOR ANCHO
M01
01-1 1.25 7.6 13.00 24.00 44.00 2364,07
01-2 1.25 7.6 12.50 24.00 38.00 2123,37
02-1 1.25 7.6 12.00 24.00 41.00 2386,46
02-2 1.25 7.6 11.00 24.00 38.00 2412,92
03-1 1.25 7.6 12.50 24.00 38.00 2123,37
03-2 1.25 7.6 13.00 24.00 44.00 2364,07
Medidas
estadísticas
Media 2295.71 Desviación estándar 134.7
Coeficiente de variación 6%
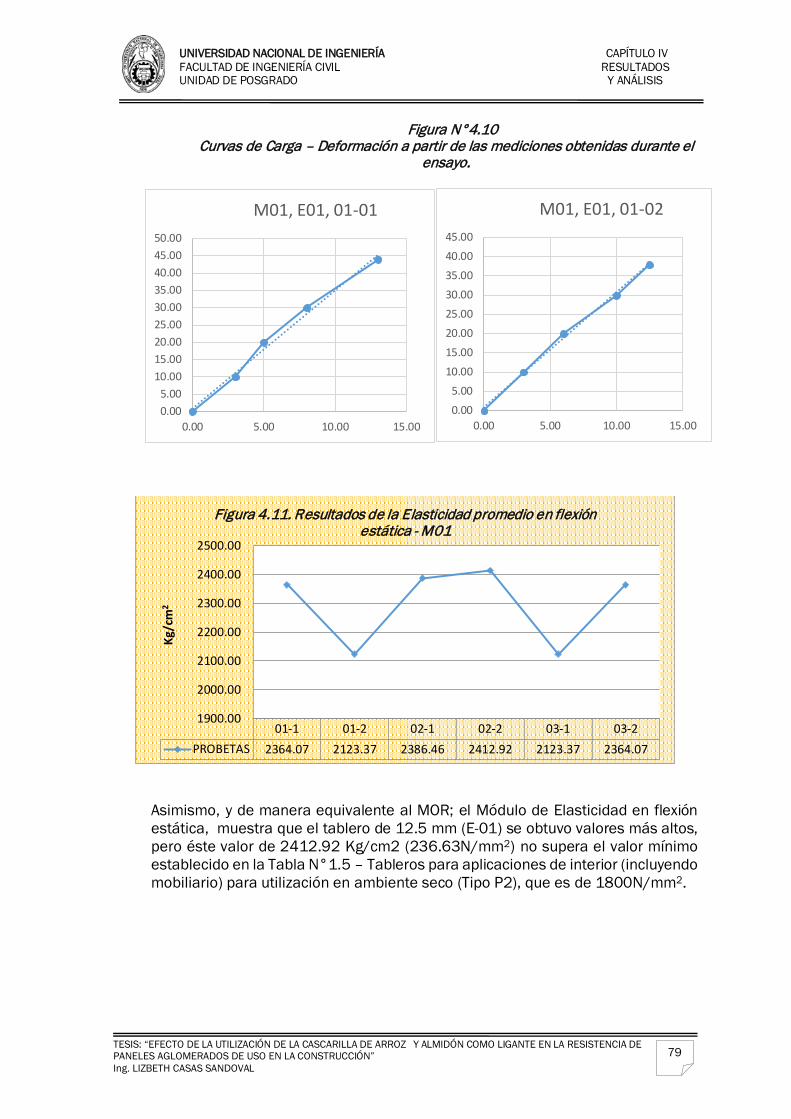
UNIVERSIDAD NACIONAL DE INGENIERÍA CAPÍTULO IV FACULTAD DE INGENIERÍA CIVIL RESULTADOS UNIDAD DE POSGRADO Y ANÁLISIS
TESIS: “EFECTO DE LA UTILIZACIÓN DE LA CASCARILLA DE ARROZ Y ALMIDÓN COMO LIGANTE EN LA RESISTENCIA DE PANELES AGLOMERADOS DE USO EN LA CONSTRUCCIÓN” Ing. LIZBETH CASAS SANDOVAL
79
Figura N°4.10 Curvas de Carga – Deformación a partir de las mediciones obtenidas durante el
ensayo.
Asimismo, y de manera equivalente al MOR; el Módulo de Elasticidad en flexión estática, muestra que el tablero de 12.5 mm (E-01) se obtuvo valores más altos, pero éste valor de 2412.92 Kg/cm2 (236.63N/mm2) no supera el valor mínimo establecido en la Tabla N°1.5 – Tableros para aplicaciones de interior (incluyendo mobiliario) para utilización en ambiente seco (Tipo P2), que es de 1800N/mm2.
01-1 01-2 02-1 02-2 03-1 03-2PROBETAS 2364.07 2123.37 2386.46 2412.92 2123.37 2364.07
1900.00
2000.00
2100.00
2200.00
2300.00
2400.00
2500.00
Kg/c
m2
Figura 4.11. Resultados de la Elasticidad promedio en flexión estática - M01
0.005.00
10.0015.0020.0025.0030.0035.0040.0045.00
0.00 5.00 10.00 15.00
M01, E01, 01-02
0.005.00
10.0015.0020.0025.0030.0035.0040.0045.0050.00
0.00 5.00 10.00 15.00
M01, E01, 01-01
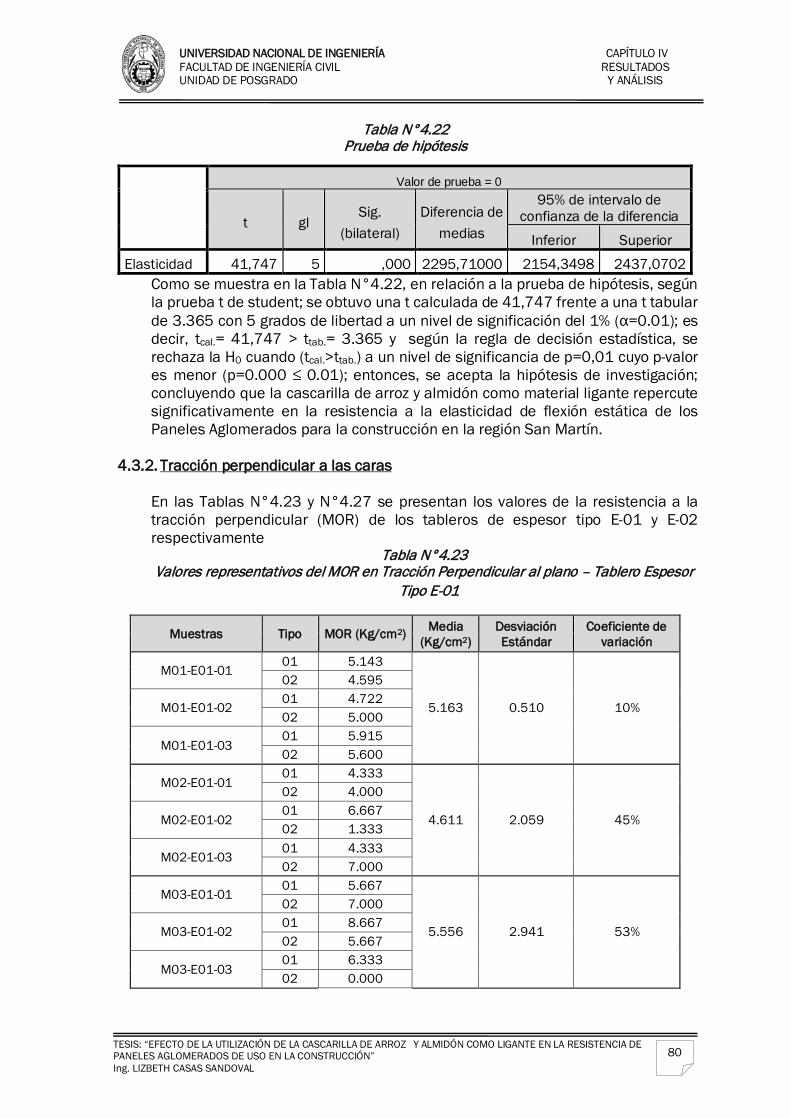
UNIVERSIDAD NACIONAL DE INGENIERÍA CAPÍTULO IV FACULTAD DE INGENIERÍA CIVIL RESULTADOS UNIDAD DE POSGRADO Y ANÁLISIS
TESIS: “EFECTO DE LA UTILIZACIÓN DE LA CASCARILLA DE ARROZ Y ALMIDÓN COMO LIGANTE EN LA RESISTENCIA DE PANELES AGLOMERADOS DE USO EN LA CONSTRUCCIÓN” Ing. LIZBETH CASAS SANDOVAL
80
Tabla N°4.22 Prueba de hipótesis
Valor de prueba = 0
t gl Sig.
(bilateral) Diferencia de
medias
95% de intervalo de confianza de la diferencia
Inferior Superior
Elasticidad 41,747 5 ,000 2295,71000 2154,3498 2437,0702 Como se muestra en la Tabla N°4.22, en relación a la prueba de hipótesis, según la prueba t de student; se obtuvo una t calculada de 41,747 frente a una t tabular de 3.365 con 5 grados de libertad a un nivel de significación del 1% (α=0.01); es decir, tcal.= 41,747 > ttab.= 3.365 y según la regla de decisión estadística, se rechaza la H0 cuando (tcal.>ttab.) a un nivel de significancia de p=0,01 cuyo p-valor es menor (p=0.000 ≤ 0.01); entonces, se acepta la hipótesis de investigación; concluyendo que la cascarilla de arroz y almidón como material ligante repercute significativamente en la resistencia a la elasticidad de flexión estática de los Paneles Aglomerados para la construcción en la región San Martín.
4.3.2. Tracción perpendicular a las caras
En las Tablas N°4.23 y N°4.27 se presentan los valores de la resistencia a la tracción perpendicular (MOR) de los tableros de espesor tipo E-01 y E-02 respectivamente
Tabla N°4.23 Valores representativos del MOR en Tracción Perpendicular al plano – Tablero Espesor
Tipo E-01
Muestras Tipo MOR (Kg/cm2) Media (Kg/cm2)
Desviación Estándar
Coeficiente de variación
M01-E01-01 01 5.143
5.163 0.510 10%
02 4.595
M01-E01-02 01 4.722 02 5.000
M01-E01-03 01 5.915 02 5.600
M02-E01-01 01 4.333
4.611 2.059 45%
02 4.000
M02-E01-02 01 6.667 02 1.333
M02-E01-03 01 4.333 02 7.000
M03-E01-01 01 5.667
5.556 2.941 53%
02 7.000
M03-E01-02 01 8.667 02 5.667
M03-E01-03 01 6.333 02 0.000
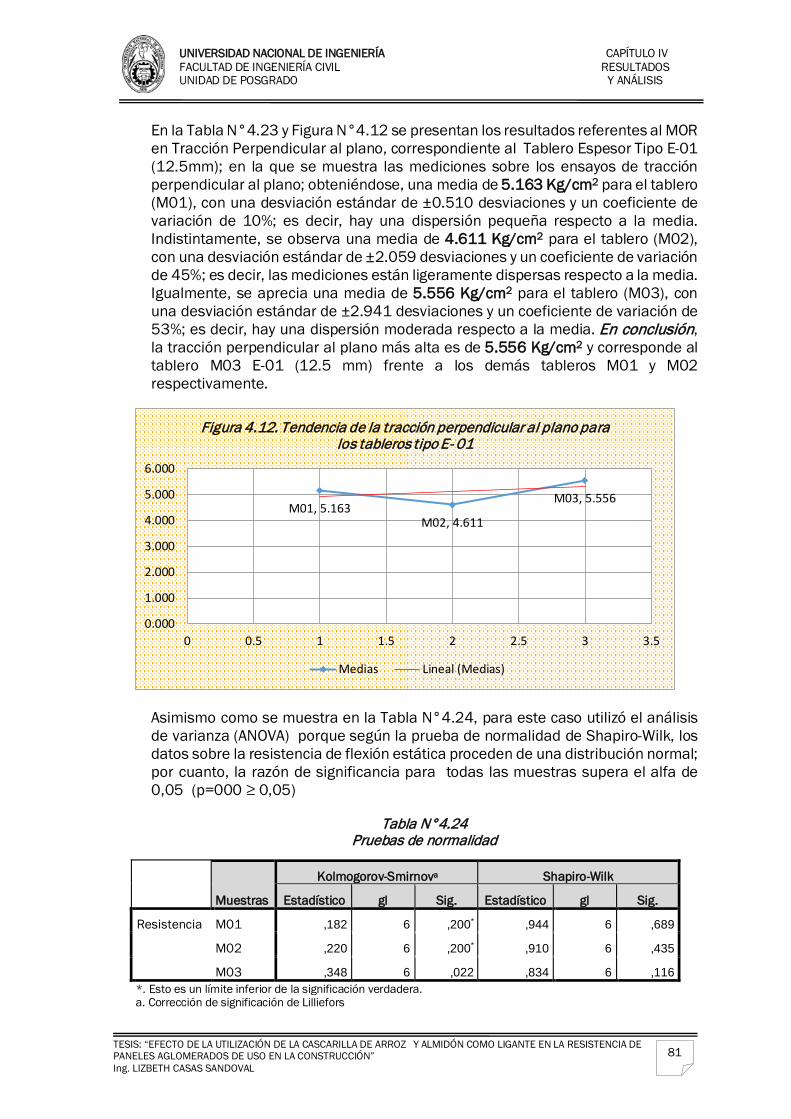
UNIVERSIDAD NACIONAL DE INGENIERÍA CAPÍTULO IV FACULTAD DE INGENIERÍA CIVIL RESULTADOS UNIDAD DE POSGRADO Y ANÁLISIS
TESIS: “EFECTO DE LA UTILIZACIÓN DE LA CASCARILLA DE ARROZ Y ALMIDÓN COMO LIGANTE EN LA RESISTENCIA DE PANELES AGLOMERADOS DE USO EN LA CONSTRUCCIÓN” Ing. LIZBETH CASAS SANDOVAL
81
En la Tabla N°4.23 y Figura N°4.12 se presentan los resultados referentes al MOR en Tracción Perpendicular al plano, correspondiente al Tablero Espesor Tipo E-01 (12.5mm); en la que se muestra las mediciones sobre los ensayos de tracción perpendicular al plano; obteniéndose, una media de 5.163 Kg/cm2 para el tablero (M01), con una desviación estándar de ±0.510 desviaciones y un coeficiente de variación de 10%; es decir, hay una dispersión pequeña respecto a la media. Indistintamente, se observa una media de 4.611 Kg/cm2 para el tablero (M02), con una desviación estándar de ±2.059 desviaciones y un coeficiente de variación de 45%; es decir, las mediciones están ligeramente dispersas respecto a la media. Igualmente, se aprecia una media de 5.556 Kg/cm2 para el tablero (M03), con una desviación estándar de ±2.941 desviaciones y un coeficiente de variación de 53%; es decir, hay una dispersión moderada respecto a la media. En conclusión, la tracción perpendicular al plano más alta es de 5.556 Kg/cm2 y corresponde al tablero M03 E-01 (12.5 mm) frente a los demás tableros M01 y M02 respectivamente.
Asimismo como se muestra en la Tabla N°4.24, para este caso utilizó el análisis de varianza (ANOVA) porque según la prueba de normalidad de Shapiro-Wilk, los datos sobre la resistencia de flexión estática proceden de una distribución normal; por cuanto, la razón de significancia para todas las muestras supera el alfa de 0,05 (p=000 ≥ 0,05)
Tabla N°4.24
Pruebas de normalidad
Muestras
Kolmogorov-Smirnova Shapiro-Wilk
Estadístico gl Sig. Estadístico gl Sig.
Resistencia M01 ,182 6 ,200* ,944 6 ,689
M02 ,220 6 ,200* ,910 6 ,435
M03 ,348 6 ,022 ,834 6 ,116 *. Esto es un límite inferior de la significación verdadera. a. Corrección de significación de Lilliefors
M01, 5.163M02, 4.611
M03, 5.556
0.000
1.000
2.000
3.000
4.000
5.000
6.000
0 0.5 1 1.5 2 2.5 3 3.5
Figura 4.12. Tendencia de la tracción perpendicular al plano para los tableros tipo E- 01
Medias Lineal (Medias)
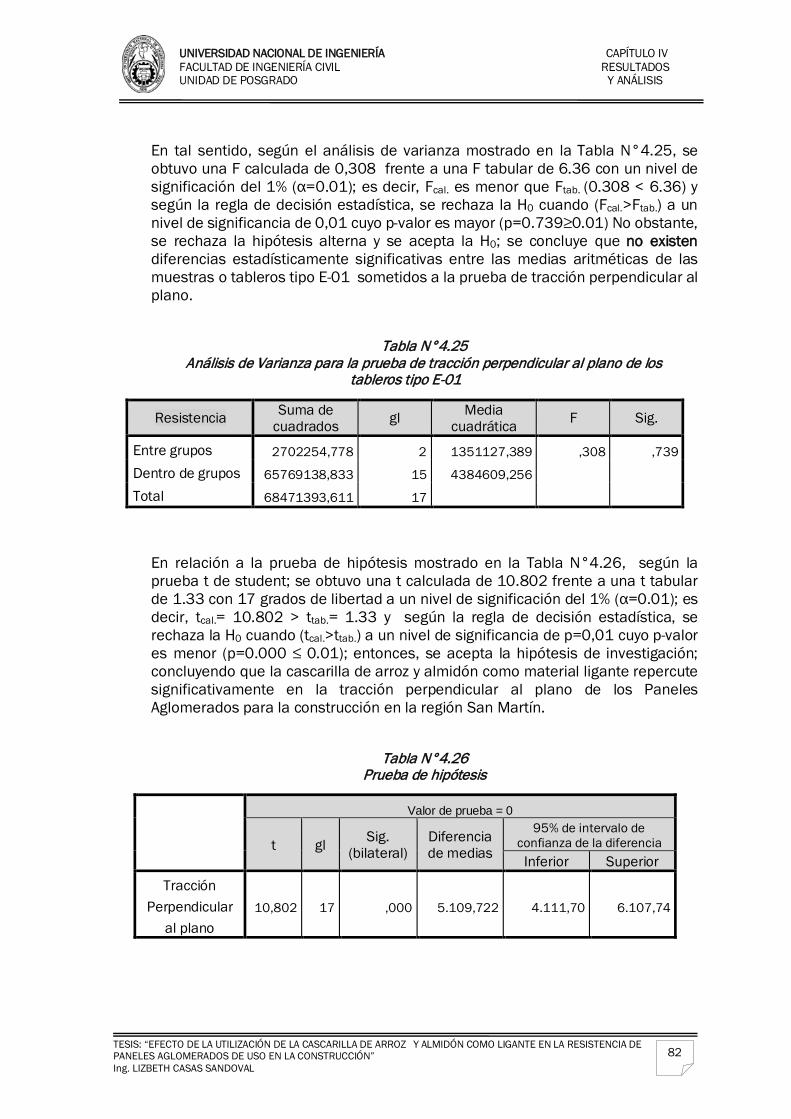
UNIVERSIDAD NACIONAL DE INGENIERÍA CAPÍTULO IV FACULTAD DE INGENIERÍA CIVIL RESULTADOS UNIDAD DE POSGRADO Y ANÁLISIS
TESIS: “EFECTO DE LA UTILIZACIÓN DE LA CASCARILLA DE ARROZ Y ALMIDÓN COMO LIGANTE EN LA RESISTENCIA DE PANELES AGLOMERADOS DE USO EN LA CONSTRUCCIÓN” Ing. LIZBETH CASAS SANDOVAL
82
En tal sentido, según el análisis de varianza mostrado en la Tabla N°4.25, se obtuvo una F calculada de 0,308 frente a una F tabular de 6.36 con un nivel de significación del 1% (α=0.01); es decir, Fcal. es menor que Ftab. (0.308 < 6.36) y según la regla de decisión estadística, se rechaza la H0 cuando (Fcal.>Ftab.) a un nivel de significancia de 0,01 cuyo p-valor es mayor (p=0.739≥0.01) No obstante, se rechaza la hipótesis alterna y se acepta la H0; se concluye que no existen diferencias estadísticamente significativas entre las medias aritméticas de las muestras o tableros tipo E-01 sometidos a la prueba de tracción perpendicular al plano.
Tabla N°4.25 Análisis de Varianza para la prueba de tracción perpendicular al plano de los
tableros tipo E-01
Resistencia Suma de cuadrados gl Media
cuadrática F Sig.
Entre grupos 2702254,778 2 1351127,389 ,308 ,739
Dentro de grupos 65769138,833 15 4384609,256
Total 68471393,611 17
En relación a la prueba de hipótesis mostrado en la Tabla N°4.26, según la prueba t de student; se obtuvo una t calculada de 10.802 frente a una t tabular de 1.33 con 17 grados de libertad a un nivel de significación del 1% (α=0.01); es decir, tcal.= 10.802 > ttab.= 1.33 y según la regla de decisión estadística, se rechaza la H0 cuando (tcal.>ttab.) a un nivel de significancia de p=0,01 cuyo p-valor es menor (p=0.000 ≤ 0.01); entonces, se acepta la hipótesis de investigación; concluyendo que la cascarilla de arroz y almidón como material ligante repercute significativamente en la tracción perpendicular al plano de los Paneles Aglomerados para la construcción en la región San Martín.
Tabla N°4.26 Prueba de hipótesis
Valor de prueba = 0
t gl Sig. (bilateral)
Diferencia de medias
95% de intervalo de confianza de la diferencia Inferior Superior
Tracción Perpendicular
al plano 10,802 17 ,000 5.109,722 4.111,70 6.107,74
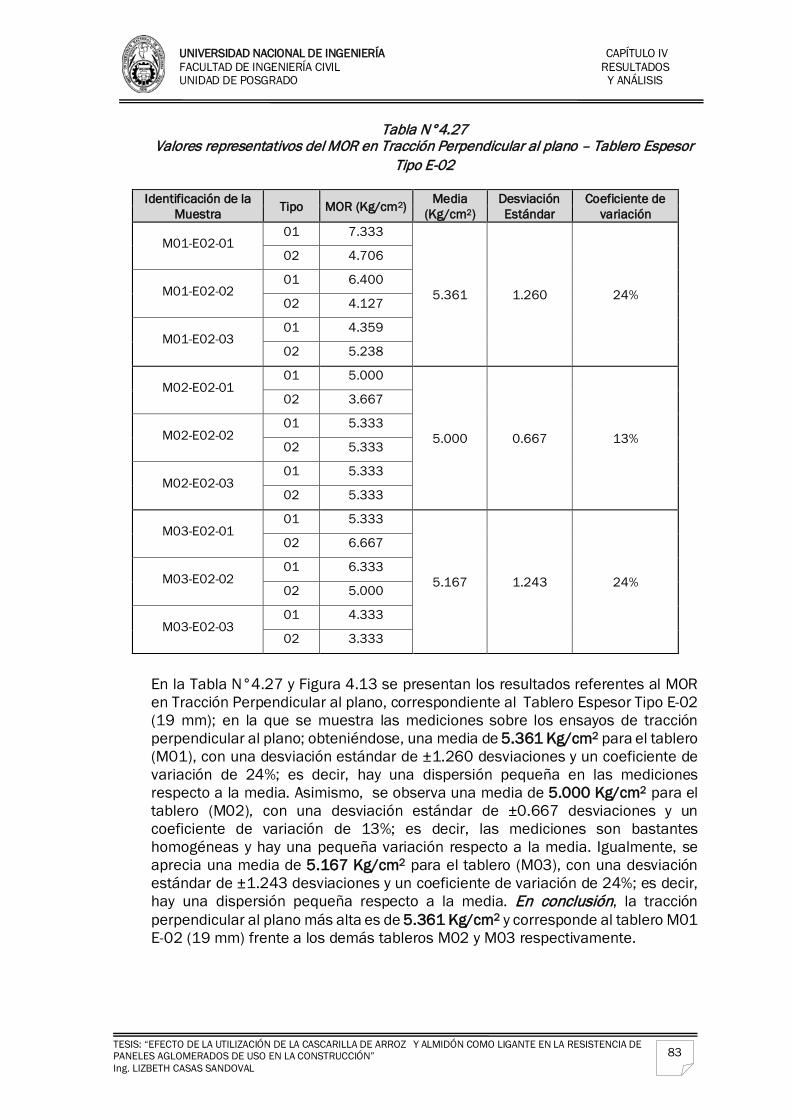
UNIVERSIDAD NACIONAL DE INGENIERÍA CAPÍTULO IV FACULTAD DE INGENIERÍA CIVIL RESULTADOS UNIDAD DE POSGRADO Y ANÁLISIS
TESIS: “EFECTO DE LA UTILIZACIÓN DE LA CASCARILLA DE ARROZ Y ALMIDÓN COMO LIGANTE EN LA RESISTENCIA DE PANELES AGLOMERADOS DE USO EN LA CONSTRUCCIÓN” Ing. LIZBETH CASAS SANDOVAL
83
Tabla N°4.27 Valores representativos del MOR en Tracción Perpendicular al plano – Tablero Espesor
Tipo E-02
Identificación de la Muestra Tipo MOR (Kg/cm2) Media
(Kg/cm2) Desviación Estándar
Coeficiente de variación
M01-E02-01 01 7.333
5.361 1.260 24%
02 4.706
M01-E02-02 01 6.400
02 4.127
M01-E02-03 01 4.359
02 5.238
M02-E02-01 01 5.000
5.000 0.667 13%
02 3.667
M02-E02-02 01 5.333
02 5.333
M02-E02-03 01 5.333
02 5.333
M03-E02-01 01 5.333
5.167 1.243 24%
02 6.667
M03-E02-02 01 6.333
02 5.000
M03-E02-03 01 4.333
02 3.333
En la Tabla N°4.27 y Figura 4.13 se presentan los resultados referentes al MOR en Tracción Perpendicular al plano, correspondiente al Tablero Espesor Tipo E-02 (19 mm); en la que se muestra las mediciones sobre los ensayos de tracción perpendicular al plano; obteniéndose, una media de 5.361 Kg/cm2 para el tablero (M01), con una desviación estándar de ±1.260 desviaciones y un coeficiente de variación de 24%; es decir, hay una dispersión pequeña en las mediciones respecto a la media. Asimismo, se observa una media de 5.000 Kg/cm2 para el tablero (M02), con una desviación estándar de ±0.667 desviaciones y un coeficiente de variación de 13%; es decir, las mediciones son bastantes homogéneas y hay una pequeña variación respecto a la media. Igualmente, se aprecia una media de 5.167 Kg/cm2 para el tablero (M03), con una desviación estándar de ±1.243 desviaciones y un coeficiente de variación de 24%; es decir, hay una dispersión pequeña respecto a la media. En conclusión, la tracción perpendicular al plano más alta es de 5.361 Kg/cm2 y corresponde al tablero M01 E-02 (19 mm) frente a los demás tableros M02 y M03 respectivamente.
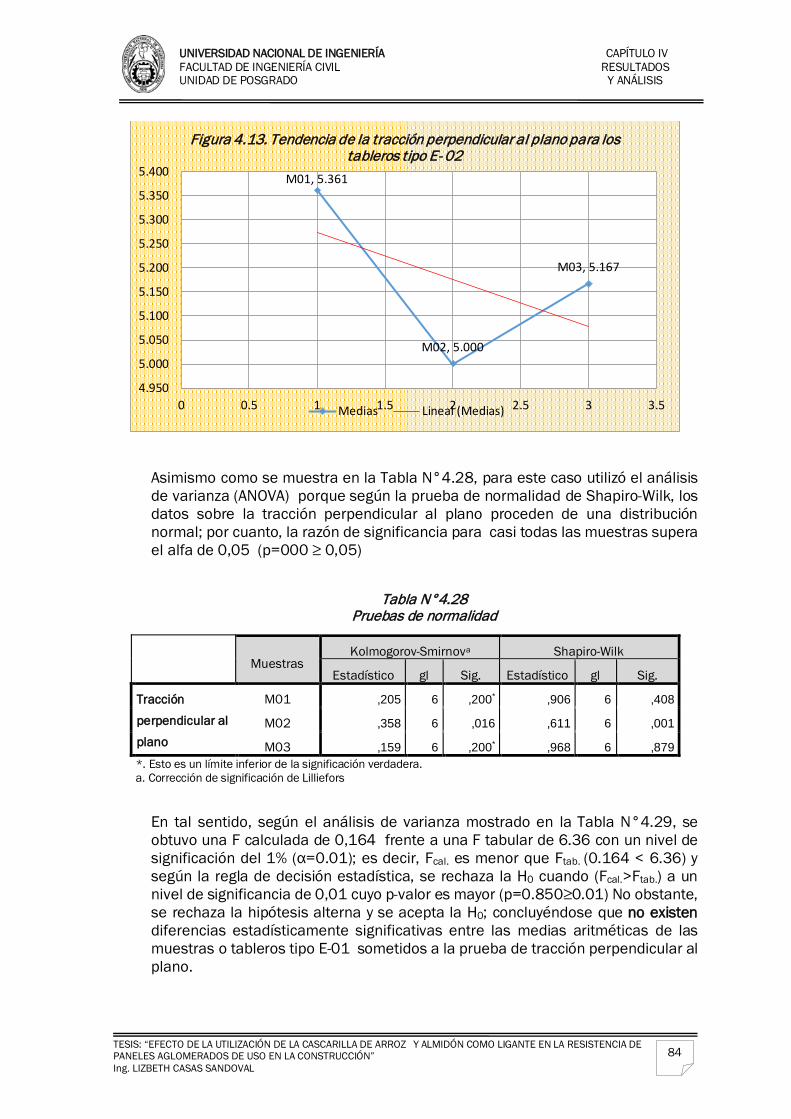
UNIVERSIDAD NACIONAL DE INGENIERÍA CAPÍTULO IV FACULTAD DE INGENIERÍA CIVIL RESULTADOS UNIDAD DE POSGRADO Y ANÁLISIS
TESIS: “EFECTO DE LA UTILIZACIÓN DE LA CASCARILLA DE ARROZ Y ALMIDÓN COMO LIGANTE EN LA RESISTENCIA DE PANELES AGLOMERADOS DE USO EN LA CONSTRUCCIÓN” Ing. LIZBETH CASAS SANDOVAL
84
Asimismo como se muestra en la Tabla N°4.28, para este caso utilizó el análisis de varianza (ANOVA) porque según la prueba de normalidad de Shapiro-Wilk, los datos sobre la tracción perpendicular al plano proceden de una distribución normal; por cuanto, la razón de significancia para casi todas las muestras supera el alfa de 0,05 (p=000 ≥ 0,05)
Tabla N°4.28
Pruebas de normalidad
Muestras
Kolmogorov-Smirnova Shapiro-Wilk
Estadístico gl Sig. Estadístico gl Sig.
Tracción perpendicular al plano
M01 ,205 6 ,200* ,906 6 ,408
M02 ,358 6 ,016 ,611 6 ,001
M03 ,159 6 ,200* ,968 6 ,879 *. Esto es un límite inferior de la significación verdadera. a. Corrección de significación de Lilliefors
En tal sentido, según el análisis de varianza mostrado en la Tabla N°4.29, se obtuvo una F calculada de 0,164 frente a una F tabular de 6.36 con un nivel de significación del 1% (α=0.01); es decir, Fcal. es menor que Ftab. (0.164 < 6.36) y según la regla de decisión estadística, se rechaza la H0 cuando (Fcal.>Ftab.) a un nivel de significancia de 0,01 cuyo p-valor es mayor (p=0.850≥0.01) No obstante, se rechaza la hipótesis alterna y se acepta la H0; concluyéndose que no existen diferencias estadísticamente significativas entre las medias aritméticas de las muestras o tableros tipo E-01 sometidos a la prueba de tracción perpendicular al plano.
M01, 5.361
M02, 5.000
M03, 5.167
4.950
5.000
5.050
5.100
5.150
5.200
5.250
5.300
5.350
5.400
0 0.5 1 1.5 2 2.5 3 3.5
Figura 4.13. Tendencia de la tracción perpendicular al plano para los tableros tipo E- 02
Medias Lineal (Medias)
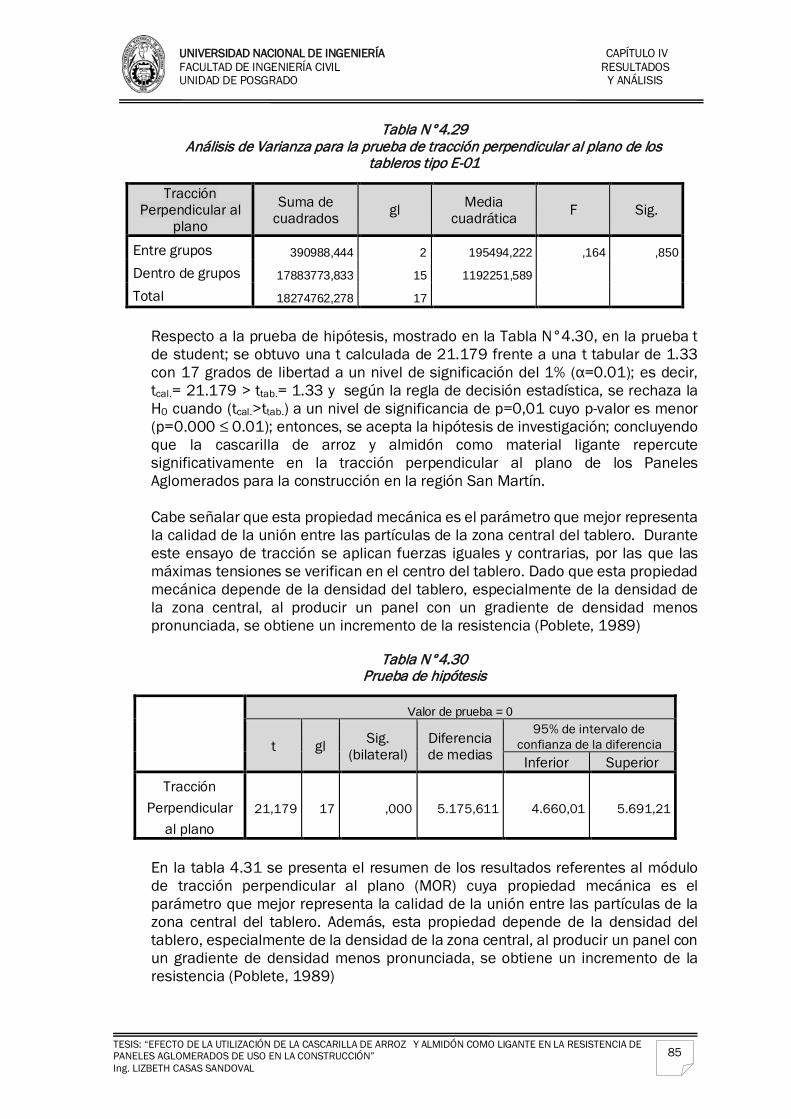
UNIVERSIDAD NACIONAL DE INGENIERÍA CAPÍTULO IV FACULTAD DE INGENIERÍA CIVIL RESULTADOS UNIDAD DE POSGRADO Y ANÁLISIS
TESIS: “EFECTO DE LA UTILIZACIÓN DE LA CASCARILLA DE ARROZ Y ALMIDÓN COMO LIGANTE EN LA RESISTENCIA DE PANELES AGLOMERADOS DE USO EN LA CONSTRUCCIÓN” Ing. LIZBETH CASAS SANDOVAL
85
Tabla N°4.29 Análisis de Varianza para la prueba de tracción perpendicular al plano de los
tableros tipo E-01
Tracción Perpendicular al
plano
Suma de cuadrados gl Media
cuadrática F Sig.
Entre grupos 390988,444 2 195494,222 ,164 ,850
Dentro de grupos 17883773,833 15 1192251,589 Total 18274762,278 17
Respecto a la prueba de hipótesis, mostrado en la Tabla N°4.30, en la prueba t de student; se obtuvo una t calculada de 21.179 frente a una t tabular de 1.33 con 17 grados de libertad a un nivel de significación del 1% (α=0.01); es decir, tcal.= 21.179 > ttab.= 1.33 y según la regla de decisión estadística, se rechaza la H0 cuando (tcal.>ttab.) a un nivel de significancia de p=0,01 cuyo p-valor es menor (p=0.000 ≤ 0.01); entonces, se acepta la hipótesis de investigación; concluyendo que la cascarilla de arroz y almidón como material ligante repercute significativamente en la tracción perpendicular al plano de los Paneles Aglomerados para la construcción en la región San Martín. Cabe señalar que esta propiedad mecánica es el parámetro que mejor representa la calidad de la unión entre las partículas de la zona central del tablero. Durante este ensayo de tracción se aplican fuerzas iguales y contrarias, por las que las máximas tensiones se verifican en el centro del tablero. Dado que esta propiedad mecánica depende de la densidad del tablero, especialmente de la densidad de la zona central, al producir un panel con un gradiente de densidad menos pronunciada, se obtiene un incremento de la resistencia (Poblete, 1989)
Tabla N°4.30
Prueba de hipótesis
Valor de prueba = 0
t gl Sig. (bilateral)
Diferencia de medias
95% de intervalo de confianza de la diferencia Inferior Superior
Tracción Perpendicular
al plano 21,179 17 ,000 5.175,611 4.660,01 5.691,21
En la tabla 4.31 se presenta el resumen de los resultados referentes al módulo de tracción perpendicular al plano (MOR) cuya propiedad mecánica es el parámetro que mejor representa la calidad de la unión entre las partículas de la zona central del tablero. Además, esta propiedad depende de la densidad del tablero, especialmente de la densidad de la zona central, al producir un panel con un gradiente de densidad menos pronunciada, se obtiene un incremento de la resistencia (Poblete, 1989)
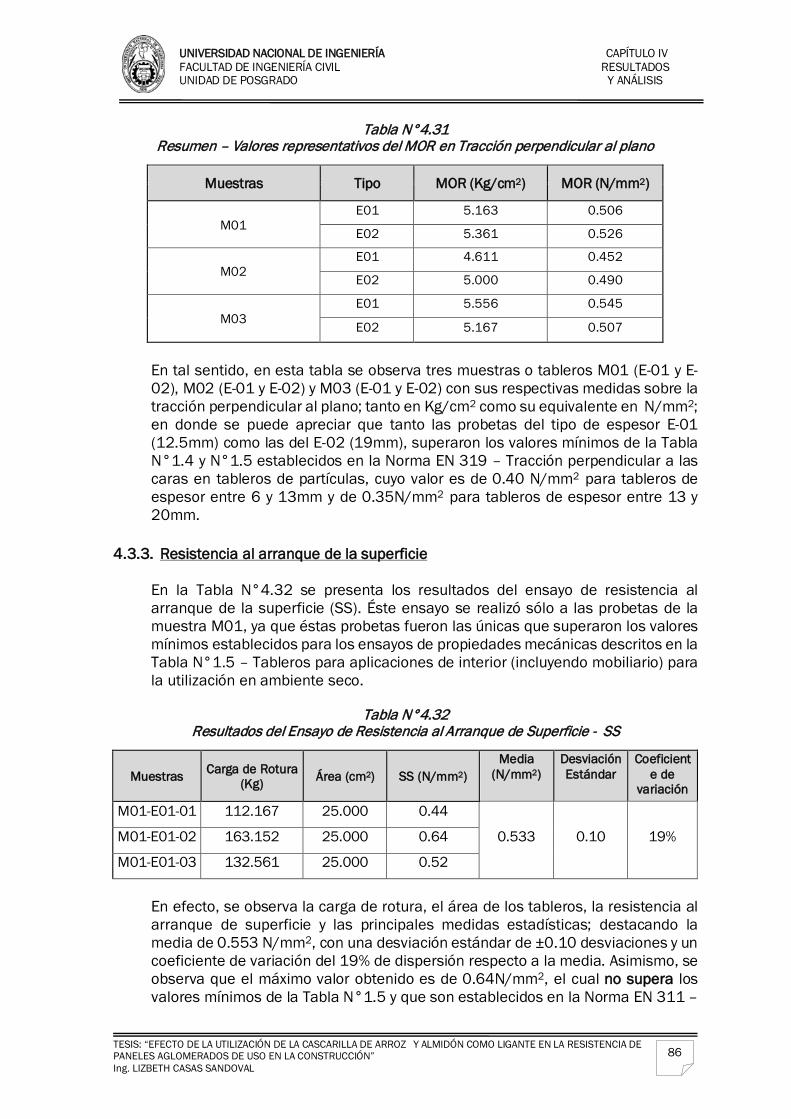
UNIVERSIDAD NACIONAL DE INGENIERÍA CAPÍTULO IV FACULTAD DE INGENIERÍA CIVIL RESULTADOS UNIDAD DE POSGRADO Y ANÁLISIS
TESIS: “EFECTO DE LA UTILIZACIÓN DE LA CASCARILLA DE ARROZ Y ALMIDÓN COMO LIGANTE EN LA RESISTENCIA DE PANELES AGLOMERADOS DE USO EN LA CONSTRUCCIÓN” Ing. LIZBETH CASAS SANDOVAL
86
Tabla N°4.31 Resumen – Valores representativos del MOR en Tracción perpendicular al plano
Muestras Tipo MOR (Kg/cm2) MOR (N/mm2)
M01 E01 5.163 0.506
E02 5.361 0.526
M02 E01 4.611 0.452
E02 5.000 0.490
M03 E01 5.556 0.545
E02 5.167 0.507
En tal sentido, en esta tabla se observa tres muestras o tableros M01 (E-01 y E-02), M02 (E-01 y E-02) y M03 (E-01 y E-02) con sus respectivas medidas sobre la tracción perpendicular al plano; tanto en Kg/cm2 como su equivalente en N/mm2; en donde se puede apreciar que tanto las probetas del tipo de espesor E-01 (12.5mm) como las del E-02 (19mm), superaron los valores mínimos de la Tabla N°1.4 y N°1.5 establecidos en la Norma EN 319 – Tracción perpendicular a las caras en tableros de partículas, cuyo valor es de 0.40 N/mm2 para tableros de espesor entre 6 y 13mm y de 0.35N/mm2 para tableros de espesor entre 13 y 20mm.
4.3.3. Resistencia al arranque de la superficie
En la Tabla N°4.32 se presenta los resultados del ensayo de resistencia al arranque de la superficie (SS). Éste ensayo se realizó sólo a las probetas de la muestra M01, ya que éstas probetas fueron las únicas que superaron los valores mínimos establecidos para los ensayos de propiedades mecánicas descritos en la Tabla N°1.5 – Tableros para aplicaciones de interior (incluyendo mobiliario) para la utilización en ambiente seco.
Tabla N°4.32
Resultados del Ensayo de Resistencia al Arranque de Superficie - SS
Muestras Carga de Rotura (Kg) Área (cm2) SS (N/mm2)
Media (N/mm2)
Desviación Estándar
Coeficiente de
variación
M01-E01-01 112.167 25.000 0.44
0.533 0.10 19% M01-E01-02 163.152 25.000 0.64
M01-E01-03 132.561 25.000 0.52
En efecto, se observa la carga de rotura, el área de los tableros, la resistencia al arranque de superficie y las principales medidas estadísticas; destacando la media de 0.553 N/mm2, con una desviación estándar de ±0.10 desviaciones y un coeficiente de variación del 19% de dispersión respecto a la media. Asimismo, se observa que el máximo valor obtenido es de 0.64N/mm2, el cual no supera los valores mínimos de la Tabla N°1.5 y que son establecidos en la Norma EN 311 –
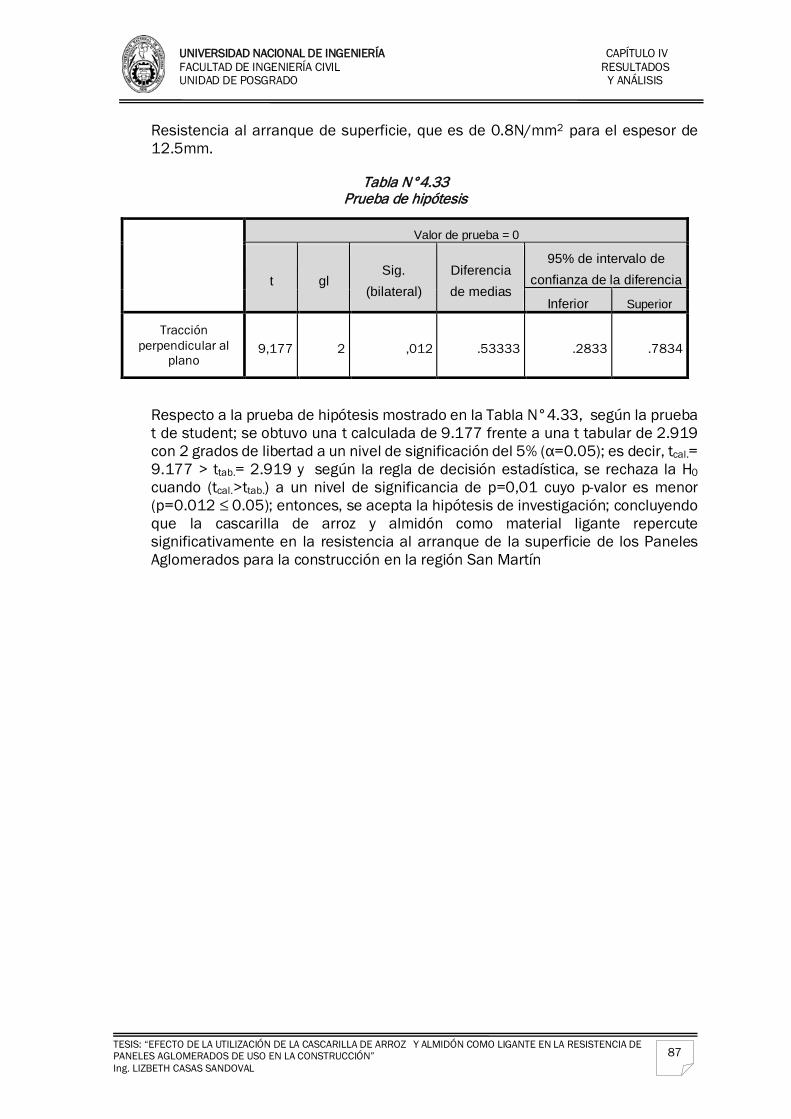
UNIVERSIDAD NACIONAL DE INGENIERÍA CAPÍTULO IV FACULTAD DE INGENIERÍA CIVIL RESULTADOS UNIDAD DE POSGRADO Y ANÁLISIS
TESIS: “EFECTO DE LA UTILIZACIÓN DE LA CASCARILLA DE ARROZ Y ALMIDÓN COMO LIGANTE EN LA RESISTENCIA DE PANELES AGLOMERADOS DE USO EN LA CONSTRUCCIÓN” Ing. LIZBETH CASAS SANDOVAL
87
Resistencia al arranque de superficie, que es de 0.8N/mm2 para el espesor de 12.5mm.
Tabla N°4.33
Prueba de hipótesis
Valor de prueba = 0
t gl Sig.
(bilateral) Diferencia de medias
95% de intervalo de confianza de la diferencia
Inferior Superior
Tracción perpendicular al
plano 9,177 2 ,012 .53333 .2833 .7834
Respecto a la prueba de hipótesis mostrado en la Tabla N°4.33, según la prueba t de student; se obtuvo una t calculada de 9.177 frente a una t tabular de 2.919 con 2 grados de libertad a un nivel de significación del 5% (α=0.05); es decir, tcal.= 9.177 > ttab.= 2.919 y según la regla de decisión estadística, se rechaza la H0 cuando (tcal.>ttab.) a un nivel de significancia de p=0,01 cuyo p-valor es menor (p=0.012 ≤ 0.05); entonces, se acepta la hipótesis de investigación; concluyendo que la cascarilla de arroz y almidón como material ligante repercute significativamente en la resistencia al arranque de la superficie de los Paneles Aglomerados para la construcción en la región San Martín
UNIVERSIDAD NACIONAL DE INGENIERIA FACULTAD DE INGENIERÍA CIVIL CONCLUSIONES UNIDAD DE POSGRADO Y RECOMENDACIONES
TESIS: “EFECTO DE LA UTILIZACIÓN DE LA CASCARILLA DE ARROZ Y ALMIDÓN COMO LIGANTE EN LA RESISTENCIA DE PANELES AGLOMERADOS DE USO EN LA CONSTRUCCIÓN” ING. LIZBETH CASAS SANDOVAL
88
CONCLUSIONES Y RECOMENDACIONES CONCLUSIONES En dimensión de los tableros en espesor; la variación no es muy
significativa, ya que los valores obtenidos se encontraron dentro de la tolerancia aceptada por la Norma EN 324-1 – Tolerancias sobre las dimensiones nominales, que es ±0.3mm.
Las densidades normales medias fueron de 0.532 gr/cm3 para las muestras de espesor tipo E-01 y de 0.512gr/cm3 para las muestras de espesor tipo E-02, las cuales los ubican en el rango de clasificación de densidad media. Estos valores son similares debido a que los tableros se encuentran conformados por el mismo tipo de partículas y bajo las mismas condiciones de fabricación.
Del perfil de densidad evaluado, se puede concluir que las zonas de
mayor densidad corresponden a la superficie del tablero, produciéndose una disminución de densidad conforme se va llegando al centro del tablero.
Los contenidos de humedad en equilibrio evaluados se encuentran
en un rango promedio de 6.071% a 8.718%. Estos resultados están dentro de los límites permitidos por la Norma EN 322 – Contenido de Humedad, que es del 5% al 13%.
La absorción de humedad que presentaron los tableros mostró que a
mayor espesor se registra mayor porcentaje de absorción.
En flexión estática, se obtuvo un valor más alto en el MOR en tableros de 12.5mm, en cuyo caso los valores superan las exigencias de la Norma Europea UNE-EN-312:2010 Especificaciones para Tableros de Partículas para Tableros de uso general para la utilización en ambiente seco (Tipo P1) y para Tableros para aplicaciones de interior (Incluyendo mobiliario) para utilización en ambiente seco (Tipo P2).
La resistencia a la tracción perpendicular a la superficie fue mayor en
los tableros de 19.0mm y menor en los tableros de 12.5mm, con valores que superan en ambos casos los mínimos exigidos por la Norma EN 319 – Tracción perpendicular a las caras en tableros de partículas, cuyo valor es de 0.40 N/mm2 para tableros de espesor entre 6 y 13mm y de 0.35N/mm2 para tableros de espesor entre 13 y 20mm.
UNIVERSIDAD NACIONAL DE INGENIERIA FACULTAD DE INGENIERÍA CIVIL CONCLUSIONES UNIDAD DE POSGRADO Y RECOMENDACIONES
TESIS: “EFECTO DE LA UTILIZACIÓN DE LA CASCARILLA DE ARROZ Y ALMIDÓN COMO LIGANTE EN LA RESISTENCIA DE PANELES AGLOMERADOS DE USO EN LA CONSTRUCCIÓN” ING. LIZBETH CASAS SANDOVAL
89
En la resistencia al arranque de la superficie, los valores obtenidos no superaron los mínimos establecidos en la Norma EN 311 – Resistencia al arranque de superficie, que es de 0.8N/mm2. CONCLUSIÓN GENERAL
Los tableros analizados cumplen los requisitos para las propiedades físicas y mecánicas especificados para los Tableros de uso general para utilización en ambiente seco (Tipo P1) y que son: Resistencia a la flexión y Cohesión interna o Tracción perpendicular a las caras. Los tableros analizados no cumplen todos los requisitos para las propiedades mecánicas especificadas para Tableros para aplicaciones de interior (Incluyendo mobiliario) para utilización en ambiente seco (Tipo P2), ya que el último ensayo (Resistencia al arranque de superficie) no alcanzó los valores mínimos que exige la Norma Europea UNE-EN-312:2010 – Especificaciones para Tableros de Partículas.
RECOMENDACIONES Se ha comprobado con este trabajo de investigación que los tableros
a base de partículas de cascarilla de arroz y almidón como ligante, tiene un comportamiento deficiente frente al agua. Se deja para posteriores investigaciones el ajuste de los procedimientos de fabricación usando el mismo material ligante para conseguir mejor unión entre las partículas, o el empleo de otro tipo de aglomerante que pueda adaptarse mejor a este tipo de material. Asimismo, logrando una mejor compactación entre las partículas, se podría aspirar a la clasificación Tipo P2, a través del ensayo de resistencia al arranque de la superficie.
UNIVERSIDAD NACIONAL DE INGENIERIA FACULTAD DE INGENIERÍA CIVIL REFERENCIAS UNIDAD DE POSGRADO BIBLIOGRÁFICAS
TESIS: “EFECTO DE LA UTILIZACIÓN DE LA CASCARILLA DE ARROZ Y ALMIDÓN COMO LIGANTE EN LA RESISTENCIA DE PANELES AGLOMERADOS DE USO EN LA CONSTRUCCIÓN” ING. LIZBETH CASAS SANDOVAL
90
REFERENCIAS BIBLIOGRÁFICAS
American Society for Testing and Material (ASTM). 1991. Norma ASTM D 1037 -
91 Methods of test for building fiberboars evaluating properties. Philadelphia, EE.UU. (6):81-100
Becerra M., J. 1976. Algunas características físicas y mecánicas de tableros de
partículas producidos en México y sus posibles usos en la construcción. Ciencia Forestal. 1(2): 33 -40 México D.F.
Cadena, C. & Bula, A. (2002). Estudio de la variación en la conductividad térmica
de la cascarilla de arroz aglomerada con fibras vegetales. Ingeniería & Desarrollo. Universidad del Norte, 12(1), 8-9.
Calero, F. & Vásconez, L. (2012). Desarrollo Experimental de un Aislante Térmico
Utilizando Cascarilla de Arroz y Aglutinantes Naturales, en Planchas Rígidas. Escuela Politécnica del Ejército, Sangolquí.
Chanchí, J., Bonilla, D., Gaviria, J. & Giraldo, J. (2008). Ensayos a compresión y
tensión diagonal sobre muretes hechos a base de papel periódico reciclado y engrudo de almidón de yuca. Universidad Nacional de Colombia – Sede Manizales, Caldas, Colombia.
Diario Gestión (2012, 13 de junio). “Multinacional de tableros Masisa planea
instalar planta en Perú”. Recuperado de: http://gestion.pe/2012/06/13/empresas/multinacional-tableros-masisa-planea-instalar-planta-peru-2005032
Dirección Regional de Agricultura San Martin, (2013). “Cultivo del arroz en
cifras”, Tomado de http://www.agrodrasam.gob.pe/sites/default/files/Cultivodearrozencifrasdiciembre%202013.pdf
Francisco Tello Perú SAC, (2009). “Oferta de biomasa de arroz”. Investigación realizada en la provincia de Tarapoto, Región San Martín.
Grupo Gloria. Recuperado de: http://www.grupogloria.com/tapesa.html Manzano, A. (2000). “Propiedades físico-mecánicas de tableros aglomerados de
partículas de 12, 16 y 19 mm de una empresa del estado de Durango”. (Tesis de licenciatura, Universidad Autónoma Chapingo, México). Tomado de: http://www.chapingo.mx/dicifo/tesislic/2000/Manzano%20Sosa%20Adelaida%202000.pdf
Medina, J. C. & Ambrogi, A. 1994. Cáscara de maní en la elaboración de
aglomerados. Rev. Quebracho (2), 47-53
UNIVERSIDAD NACIONAL DE INGENIERIA FACULTAD DE INGENIERÍA CIVIL REFERENCIAS UNIDAD DE POSGRADO BIBLIOGRÁFICAS
TESIS: “EFECTO DE LA UTILIZACIÓN DE LA CASCARILLA DE ARROZ Y ALMIDÓN COMO LIGANTE EN LA RESISTENCIA DE PANELES AGLOMERADOS DE USO EN LA CONSTRUCCIÓN” ING. LIZBETH CASAS SANDOVAL
91
Ministerio de Agricultura del Perú, (2013). “El Arroz Principales Aspectos de la Cadena Agro productiva”. Tomado de http://agroaldia.minag.gob.pe/biblioteca/download/pdf/agroeconomia/agroeconomia_arroz_final2013.pdf
Norma Europea UNE - EN 309. Tableros de Partículas, Definición y clasificación.
Noviembre, 2006. Norma Europea UNE - EN 310. Determinación de Módulo de Elasticidad en
Flexión y de Resistencia a la Flexión. Marzo, 1994. Norma Europea UNE - EN 311. Arranque de la superficie de los tableros.
Setiembre, 2002. Norma Europea UNE - EN 312. Tableros de partículas, Especificaciones.
Noviembre, 2010. Norma Europea UNE - EN 317. Determinación de la Hinchazón en Espesor
después de Inmersión en Agua. Marzo, 1994. Norma Europea UNE - EN 319. Determinación de la Resistencia a la Tracción
Perpendicular a las Caras del Tablero. Marzo, 1994. Norma Europea UNE - EN 322. Determinación del Contenido de Humedad.
Marzo, 1994. Norma Europea UNE - EN 326-1. Muestreo, despiece e inspección. Mayo,
1995. Poblete, H. 1979. Inclusión de aserrín en tableros de partículas. BOSQUE 3(1):
39-46, Valdivia, Chile. Rivarola, A., Rojo, L., Gardey, M. & Arena, A. (2006). “Materiales alternativos para
la fabricación de placas de aglomerado”. Universidad Tecnológica Nacional, San Rafael, Mendoza) Tomado de: http://www.frlp.utn.edu.ar/lemac/Publicaciones/Del%202006/DESARROLLO%20Y%20AVANCES%20TECNOLOGICOS/30%20-%20MENDOZA%20-%20Materiales%20alternativos%20para%20placas%20de%20aglomerado.pdf
Sierra, J. (2009). Alternativas de aprovechamiento de la cascarilla de arroz en
Colombia. Tapia, C., Paredes, C., Simbaña, A. & Leao, A. (2008). “Elaboración de tableros
de partícula fina a partir de residuos lignocelulósicos y resinas termoestables”
Valverde, A., Sarria, B. & Monteagudo, J. (2007). “Análisis comparativo de las características físico químicas de la cascarilla de arroz”. Universidad
UNIVERSIDAD NACIONAL DE INGENIERIA FACULTAD DE INGENIERÍA CIVIL REFERENCIAS UNIDAD DE POSGRADO BIBLIOGRÁFICAS
TESIS: “EFECTO DE LA UTILIZACIÓN DE LA CASCARILLA DE ARROZ Y ALMIDÓN COMO LIGANTE EN LA RESISTENCIA DE PANELES AGLOMERADOS DE USO EN LA CONSTRUCCIÓN” ING. LIZBETH CASAS SANDOVAL
92
Tecnológica de Pereira, Scientia et Technica 13 (37), 255-259. Tomado de http://revistas.utp.edu.co/index.php/revistaciencia/article/viewFile/4055/2213
Villegas, C. (2012). Tesis para optar el título de Maestro en Tecnología de la Construcción: “Utilización de puzolanas naturales en la elaboración de prefabricados con base cementicia destinados a la construcción de viviendas de bajo costo”, Universidad Nacional de Ingeniería. Lima, Perú
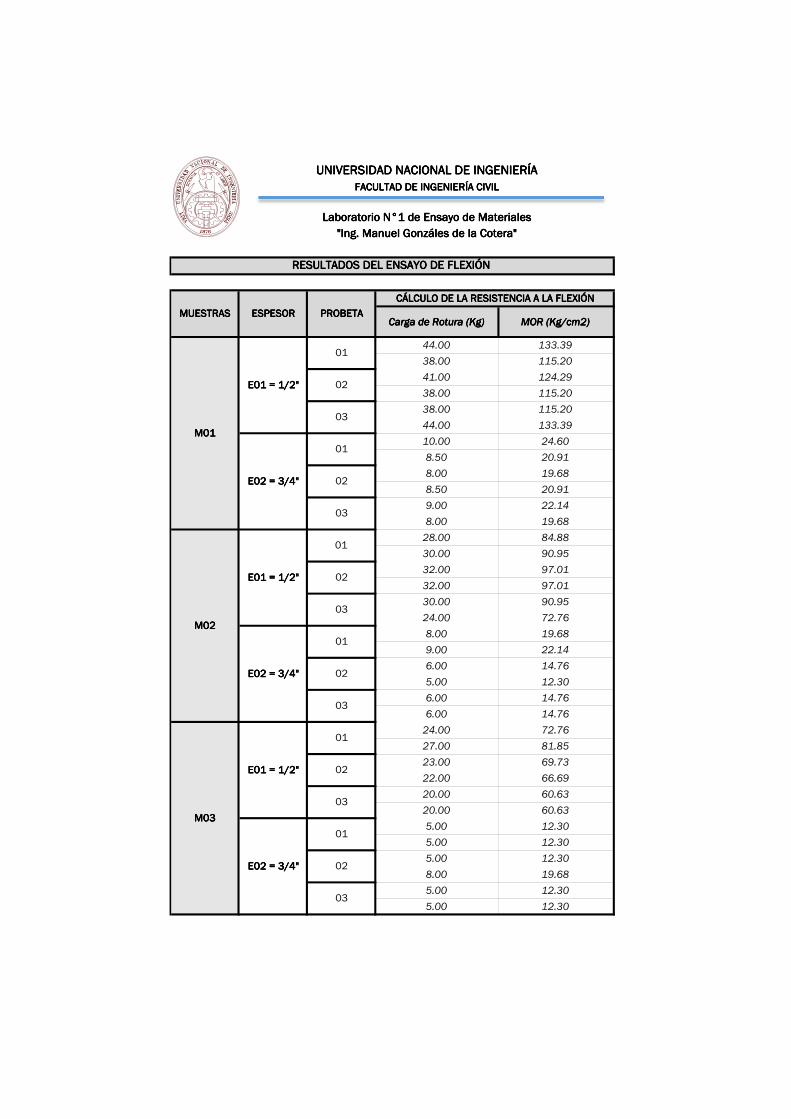
Carga de Rotura (Kg)Carga de Rotura (Kg)Carga de Rotura (Kg)Carga de Rotura (Kg) MOR (Kg/cm2)MOR (Kg/cm2)MOR (Kg/cm2)MOR (Kg/cm2)
44.00 133.39
38.00 115.20
41.00 124.29
38.00 115.20
38.00 115.20
44.00 133.39
10.00 24.60
8.50 20.91
8.00 19.68
8.50 20.91
9.00 22.14
8.00 19.68
28.00 84.88
30.00 90.95
32.00 97.01
32.00 97.01
30.00 90.95
24.00 72.76
8.00 19.68
9.00 22.14
6.00 14.76
5.00 12.30
6.00 14.76
6.00 14.76
24.00 72.76
27.00 81.85
23.00 69.73
22.00 66.69
20.00 60.63
20.00 60.63
5.00 12.30
5.00 12.30
5.00 12.30
8.00 19.68
5.00 12.30
5.00 12.30
RESULTADOS DEL ENSAYO DE FLEXIÓN RESULTADOS DEL ENSAYO DE FLEXIÓN RESULTADOS DEL ENSAYO DE FLEXIÓN RESULTADOS DEL ENSAYO DE FLEXIÓN
UNIVERSIDAD NACIONAL DE INGENIERÍAUNIVERSIDAD NACIONAL DE INGENIERÍAUNIVERSIDAD NACIONAL DE INGENIERÍAUNIVERSIDAD NACIONAL DE INGENIERÍAFACULTAD DE INGENIERÍA CIVILFACULTAD DE INGENIERÍA CIVILFACULTAD DE INGENIERÍA CIVILFACULTAD DE INGENIERÍA CIVIL
Laboratorio N°1 de Ensayo de MaterialesLaboratorio N°1 de Ensayo de MaterialesLaboratorio N°1 de Ensayo de MaterialesLaboratorio N°1 de Ensayo de Materiales
"Ing. Manuel Gonzáles de la Cotera""Ing. Manuel Gonzáles de la Cotera""Ing. Manuel Gonzáles de la Cotera""Ing. Manuel Gonzáles de la Cotera"
M03M03M03M03
E01 = 1/2"E01 = 1/2"E01 = 1/2"E01 = 1/2"
01
02
03
E02 = 3/4"E02 = 3/4"E02 = 3/4"E02 = 3/4"
01
02
03
M02M02M02M02
E01 = 1/2"E01 = 1/2"E01 = 1/2"E01 = 1/2"
01
02
03
E02 = 3/4"E02 = 3/4"E02 = 3/4"E02 = 3/4"
01
02
03
MUESTRASMUESTRASMUESTRASMUESTRAS ESPESORESPESORESPESORESPESOR PROBETAPROBETAPROBETAPROBETA
CÁLCULO DE LA RESISTENCIA A LA FLEXIÓNCÁLCULO DE LA RESISTENCIA A LA FLEXIÓNCÁLCULO DE LA RESISTENCIA A LA FLEXIÓNCÁLCULO DE LA RESISTENCIA A LA FLEXIÓN
M01M01M01M01
E01 = 1/2"E01 = 1/2"E01 = 1/2"E01 = 1/2"
01
02
03
E02 = 3/4"E02 = 3/4"E02 = 3/4"E02 = 3/4"
01
02
03
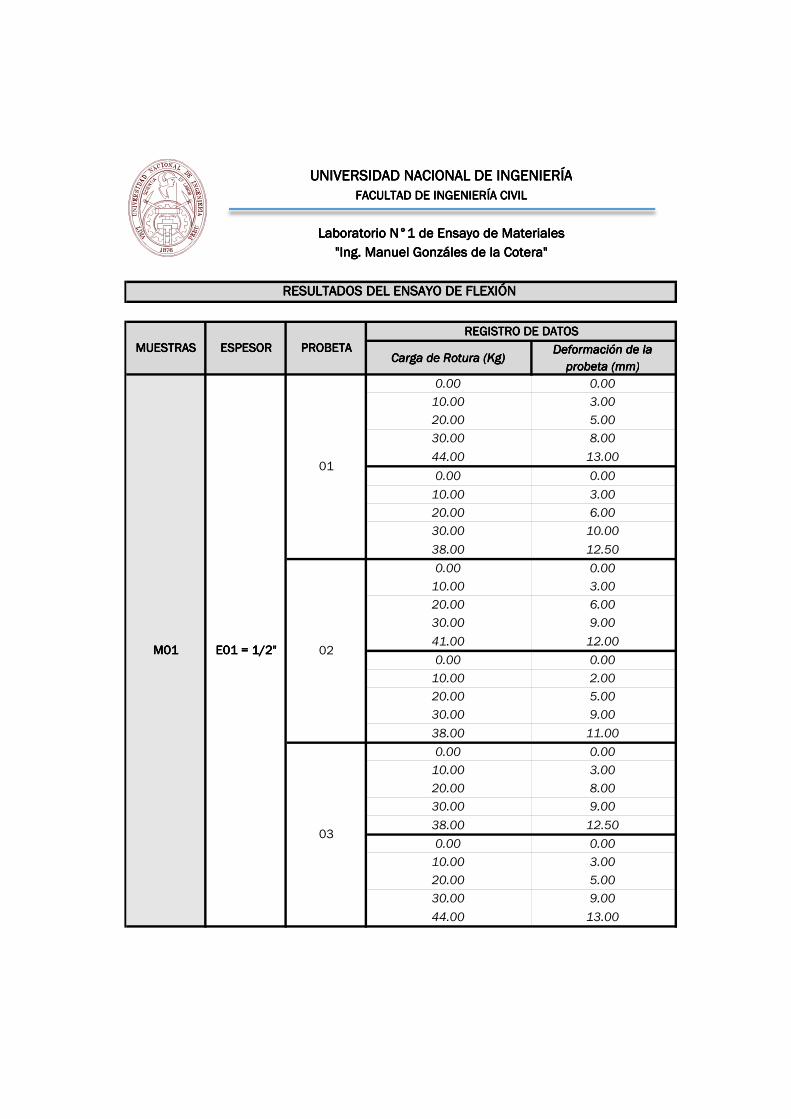
Carga de Rotura (Kg)Carga de Rotura (Kg)Carga de Rotura (Kg)Carga de Rotura (Kg)Deformación de la Deformación de la Deformación de la Deformación de la
probeta (mm)probeta (mm)probeta (mm)probeta (mm)
0.00 0.00
10.00 3.00
20.00 5.00
30.00 8.00
44.00 13.00
0.00 0.00
10.00 3.00
20.00 6.00
30.00 10.00
38.00 12.50
0.00 0.00
10.00 3.00
20.00 6.00
30.00 9.00
41.00 12.00
0.00 0.00
10.00 2.00
20.00 5.00
30.00 9.00
38.00 11.00
0.00 0.00
10.00 3.00
20.00 8.00
30.00 9.00
38.00 12.50
0.00 0.00
10.00 3.00
20.00 5.00
30.00 9.00
44.00 13.00
UNIVERSIDAD NACIONAL DE INGENIERÍAUNIVERSIDAD NACIONAL DE INGENIERÍAUNIVERSIDAD NACIONAL DE INGENIERÍAUNIVERSIDAD NACIONAL DE INGENIERÍAFACULTAD DE INGENIERÍA CIVILFACULTAD DE INGENIERÍA CIVILFACULTAD DE INGENIERÍA CIVILFACULTAD DE INGENIERÍA CIVIL
Laboratorio N°1 de Ensayo de MaterialesLaboratorio N°1 de Ensayo de MaterialesLaboratorio N°1 de Ensayo de MaterialesLaboratorio N°1 de Ensayo de Materiales
"Ing. Manuel Gonzáles de la Cotera""Ing. Manuel Gonzáles de la Cotera""Ing. Manuel Gonzáles de la Cotera""Ing. Manuel Gonzáles de la Cotera"
RESULTADOS DEL ENSAYO DE FLEXIÓN RESULTADOS DEL ENSAYO DE FLEXIÓN RESULTADOS DEL ENSAYO DE FLEXIÓN RESULTADOS DEL ENSAYO DE FLEXIÓN
M01M01M01M01
MUESTRASMUESTRASMUESTRASMUESTRAS ESPESORESPESORESPESORESPESOR PROBETAPROBETAPROBETAPROBETAREGISTRO DE DATOSREGISTRO DE DATOSREGISTRO DE DATOSREGISTRO DE DATOS
E01 = 1/2"E01 = 1/2"E01 = 1/2"E01 = 1/2"
01
02
03
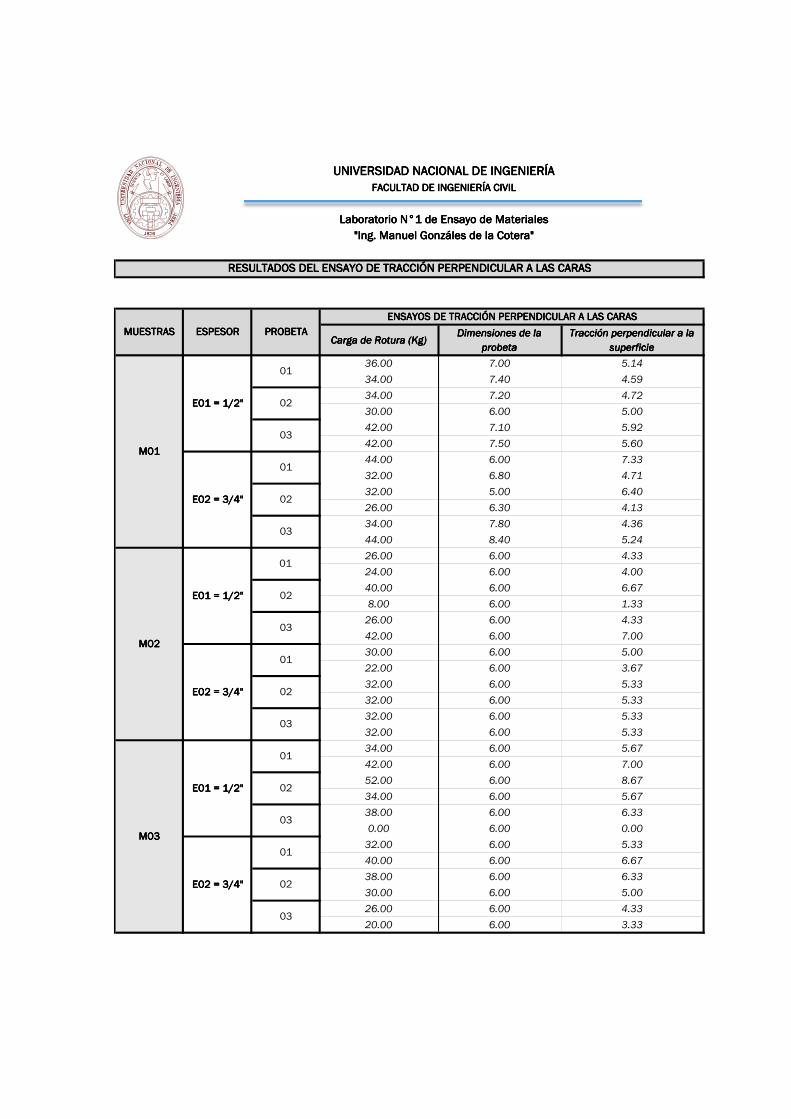
Carga de Rotura (Kg)Carga de Rotura (Kg)Carga de Rotura (Kg)Carga de Rotura (Kg)Dimensiones de la Dimensiones de la Dimensiones de la Dimensiones de la
probetaprobetaprobetaprobeta
Tracción perpendicular a la Tracción perpendicular a la Tracción perpendicular a la Tracción perpendicular a la
superficiesuperficiesuperficiesuperficie
36.00 7.00 5.14
34.00 7.40 4.59
34.00 7.20 4.72
30.00 6.00 5.00
42.00 7.10 5.92
42.00 7.50 5.60
44.00 6.00 7.33
32.00 6.80 4.71
32.00 5.00 6.40
26.00 6.30 4.13
34.00 7.80 4.36
44.00 8.40 5.24
26.00 6.00 4.33
24.00 6.00 4.00
40.00 6.00 6.67
8.00 6.00 1.33
26.00 6.00 4.33
42.00 6.00 7.00
30.00 6.00 5.00
22.00 6.00 3.67
32.00 6.00 5.33
32.00 6.00 5.33
32.00 6.00 5.33
32.00 6.00 5.33
34.00 6.00 5.67
42.00 6.00 7.00
52.00 6.00 8.67
34.00 6.00 5.67
38.00 6.00 6.33
0.00 6.00 0.00
32.00 6.00 5.33
40.00 6.00 6.67
38.00 6.00 6.33
30.00 6.00 5.00
26.00 6.00 4.33
20.00 6.00 3.33
UNIVERSIDAD NACIONAL DE INGENIERÍAUNIVERSIDAD NACIONAL DE INGENIERÍAUNIVERSIDAD NACIONAL DE INGENIERÍAUNIVERSIDAD NACIONAL DE INGENIERÍAFACULTAD DE INGENIERÍA CIVILFACULTAD DE INGENIERÍA CIVILFACULTAD DE INGENIERÍA CIVILFACULTAD DE INGENIERÍA CIVIL
Laboratorio N°1 de Ensayo de MaterialesLaboratorio N°1 de Ensayo de MaterialesLaboratorio N°1 de Ensayo de MaterialesLaboratorio N°1 de Ensayo de Materiales
"Ing. Manuel Gonzáles de la Cotera""Ing. Manuel Gonzáles de la Cotera""Ing. Manuel Gonzáles de la Cotera""Ing. Manuel Gonzáles de la Cotera"
RESULTADOS DEL ENSAYO DE TRACCIÓN PERPENDICULAR A LAS CARASRESULTADOS DEL ENSAYO DE TRACCIÓN PERPENDICULAR A LAS CARASRESULTADOS DEL ENSAYO DE TRACCIÓN PERPENDICULAR A LAS CARASRESULTADOS DEL ENSAYO DE TRACCIÓN PERPENDICULAR A LAS CARAS
03
03
02
03
E02 = 3/4"E02 = 3/4"E02 = 3/4"E02 = 3/4"
01
02
03
M03M03M03M03
E01 = 1/2"E01 = 1/2"E01 = 1/2"E01 = 1/2"
01
02
MUESTRASMUESTRASMUESTRASMUESTRAS ESPESORESPESORESPESORESPESOR PROBETAPROBETAPROBETAPROBETA
E02 = 3/4"E02 = 3/4"E02 = 3/4"E02 = 3/4"
01
02
M02M02M02M02
E01 = 1/2"E01 = 1/2"E01 = 1/2"E01 = 1/2"
01
02
03
02
03
E02 = 3/4"E02 = 3/4"E02 = 3/4"E02 = 3/4"
01
M01M01M01M01
E01 = 1/2"E01 = 1/2"E01 = 1/2"E01 = 1/2"
01
ENSAYOS DE TRACCIÓN PERPENDICULAR A LAS CARASENSAYOS DE TRACCIÓN PERPENDICULAR A LAS CARASENSAYOS DE TRACCIÓN PERPENDICULAR A LAS CARASENSAYOS DE TRACCIÓN PERPENDICULAR A LAS CARAS

Proyecto: EFECTO DE LA UTILIZACION DE LA CASCARILLA DE ARROZ Y ALMIDON COMO LIGANTE EN LA RESISTENCIA DE PANELES AGLOMERADOS DE USO EN LA CONSTRUCCIÓN
Localización del Proyecto: Muestra:
Descripción del Espécimen: Espécimen N° : 1.00
Hecho Por : Tesista. Lizbeth Casas Sandoval Muestra: M1 -E1-01 Fecha: 26/09/2015
Transporte de la Muestra : Tesista : SI Fecha de Recepción: 18/09/2015 Fecha De empiezo Ensayo : 20/09/2015
Fecha de Solicitud de ensayo: 19/09/2015 Fecha Termino Ensayo : 26/09/2015
Determinación del Contenido de Humedad en Equilibri o ASTM 2216 - N.T.P. 339.127 - UNE – EN 323: 1993 - Norma UNE – EN 322: 1993
1 2
71.92 71.35
67.82 67.25
4.10 4.10
6.05 6.10
PROMEDIO % DE HUMEDAD
Densidad Normal del tablero
1 2
69.45 70.71
137.07 135.76
0.51 0.52
PROMEDIO DENSIDAD
Perfil de Densidad del tablero
1 2 Altura de la Probeta
11.600 11.650
22.952 23.1040.505 0.504
11.580 11.560
22.952 22.9520.505 0.504
11.300 11.250
23.104 22.8000.489 0.493
11.150 11.100
22.800 22.9520.489 0.484
11.300 11.320
23.104 23.1040.489 0.490
11.580 11.590
22.952 23.1040.505 0.502
Absorción del tablero
1 2
64.42 64.25
65.45 65.30
68.45 68.56
1.60 1.636.26 6.71
PROMEDIO ABSORCIÓN %
Cambios Dimensionales
1 2
1.250 1.250
1.999 1.9962.998 2.997
ALTURA PROMEDIO DE LA PROBETA mm (24 Horas)
OBSERVACIONES:
6.07
0.51
2.00 mm
2.00 mm
2.00 mm
UNIVERSIDAD NACIONAL DE SAN MARTINESCUELA DE INGENIERIA CIVIL
LABORATORIO DE MECANICA DE SUELOSCIUDAD UNIVERSITARIA - MORALES
MORALES - PERU
PESO DEL ESPÉCIMEN SECO grs.
PESO DEL AGUA grs
% DE HUMEDAD
PESO DE LA PROBETA grs.
Muestra N°
Paneles de cascarilla de ArrozDISTRITO DE TARAPOTO
Panel Aglomerado de Cascarilla de Arroz
PESO DEL ESPÉCIMEN HUMEDO grs.
DENSIDAD DE LA PROBETA gr/cm3
DENSIDAD DE LA PROBETA gr/cm3
VOLUMEN DE LA PROBETA cm3
PESO DE LA PROBETA grs.
VOLUMEN DE LA PROBETA grs.
PESO DE LA PROBETA grs.
VOLUMEN DE LA PROBETA grs.
DENSIDAD DE LA PROBETA gr/cm3
VOLUMEN DE LA PROBETA grs.
DENSIDAD DE LA PROBETA gr/cm3
PESO DE LA PROBETA grs.
Muestra N°
VOLUMEN DE LA PROBETA grs.
DENSIDAD DE LA PROBETA gr/cm3
PESO DE LA PROBETA grs.
Muestra N°
PESO DE LA PROBETA grs.
VOLUMEN DE LA PROBETA grs.
DENSIDAD DE LA PROBETA gr/cm3
PESO DE LA PROBETA grs.
VOLUMEN DE LA PROBETA grs.
DENSIDAD DE LA PROBETA gr/cm3
Muestra N°
PESO INICIAL DE LA PROBETA grs.
PESO FINAL DE LA PROBETA (2 Horas) grs.
ABSORCIÓN DE LA PROBETA % 2 HORAS
ALTURA FINAL DE LA PROBETA mm (24 Horas)
PESO FINAL DE LA PROBETA (24 Horas) grs.
ABSORCIÓN DE LA PROBETA % 24 HORAS
Muestra N°
ALTURA INICIAL DE LA PROBETA mm
ALTURA FINAL DE LA PROBETA mm (2 Horas)
6.48
3.00
2.00 mm
2.00 mm
2.00 mm
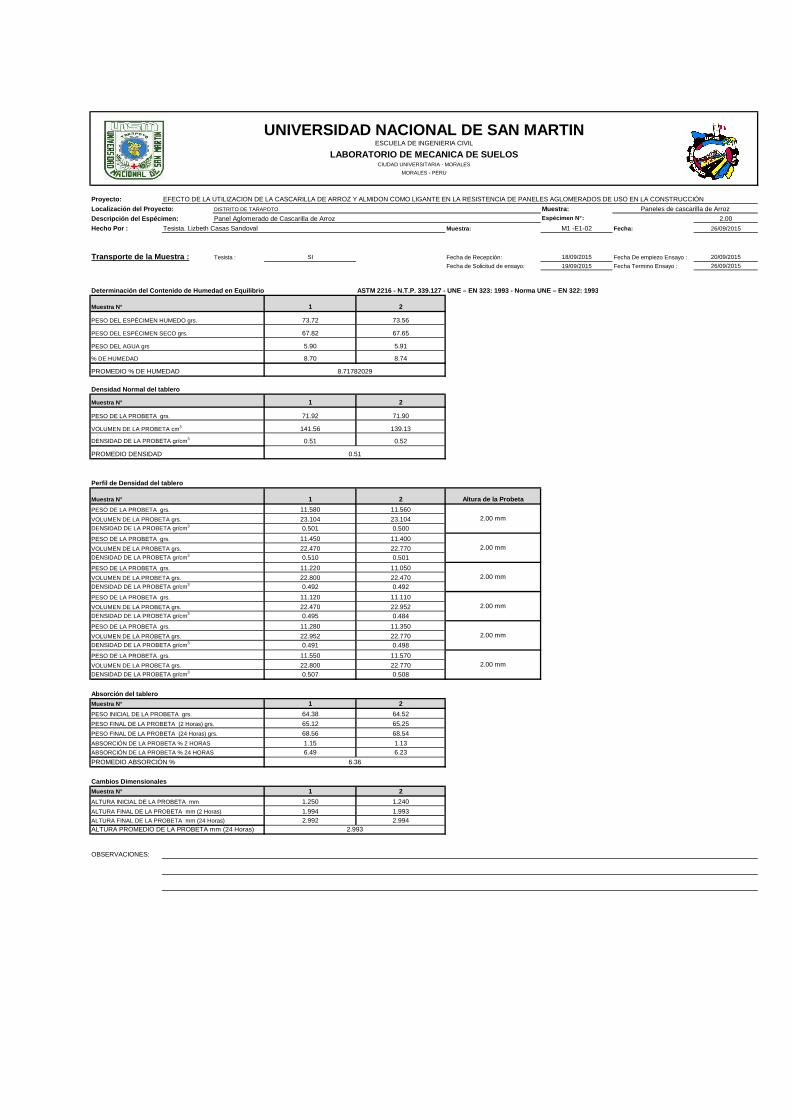
Proyecto: EFECTO DE LA UTILIZACION DE LA CASCARILLA DE ARROZ Y ALMIDON COMO LIGANTE EN LA RESISTENCIA DE PANELES AGLOMERADOS DE USO EN LA CONSTRUCCIÓN
Localización del Proyecto: Muestra:
Descripción del Espécimen: Espécimen N° : 2.00
Hecho Por : Tesista. Lizbeth Casas Sandoval Muestra: M1 -E1-02 Fecha: 26/09/2015
Transporte de la Muestra : Tesista : SI Fecha de Recepción: 18/09/2015 Fecha De empiezo Ensayo : 20/09/2015
Fecha de Solicitud de ensayo: 19/09/2015 Fecha Termino Ensayo : 26/09/2015
Determinación del Contenido de Humedad en Equilibri o ASTM 2216 - N.T.P. 339.127 - UNE – EN 323: 1993 - Norma UNE – EN 322: 1993
1 2
73.72 73.56
67.82 67.65
5.90 5.91
8.70 8.74
PROMEDIO % DE HUMEDAD
Densidad Normal del tablero
1 2
71.92 71.90
141.56 139.13
0.51 0.52
PROMEDIO DENSIDAD
Perfil de Densidad del tablero
1 2 Altura de la Probeta
11.580 11.560
23.104 23.1040.501 0.500
11.450 11.400
22.470 22.7700.510 0.501
11.220 11.050
22.800 22.4700.492 0.492
11.120 11.110
22.470 22.9520.495 0.484
11.280 11.350
22.952 22.7700.491 0.498
11.550 11.570
22.800 22.7700.507 0.508
Absorción del tablero
1 2
64.38 64.52
65.12 65.25
68.56 68.54
1.15 1.136.49 6.23
PROMEDIO ABSORCIÓN %
Cambios Dimensionales
1 2
1.250 1.240
1.994 1.9932.992 2.994
ALTURA PROMEDIO DE LA PROBETA mm (24 Horas)
OBSERVACIONES:
2.00 mm
6.36
2.993
PESO FINAL DE LA PROBETA (2 Horas) grs.
ABSORCIÓN DE LA PROBETA % 2 HORAS
ALTURA FINAL DE LA PROBETA mm (24 Horas)
PESO FINAL DE LA PROBETA (24 Horas) grs.
ABSORCIÓN DE LA PROBETA % 24 HORAS
Muestra N°
ALTURA INICIAL DE LA PROBETA mm
ALTURA FINAL DE LA PROBETA mm (2 Horas)
PESO DE LA PROBETA grs.
VOLUMEN DE LA PROBETA grs.
DENSIDAD DE LA PROBETA gr/cm3
Muestra N°
PESO INICIAL DE LA PROBETA grs.
PESO DE LA PROBETA grs.
0.51
DENSIDAD DE LA PROBETA gr/cm3
VOLUMEN DE LA PROBETA grs.
DENSIDAD DE LA PROBETA gr/cm3
2.00 mm
2.00 mm
2.00 mm
2.00 mm
2.00 mm
DENSIDAD DE LA PROBETA gr/cm3
VOLUMEN DE LA PROBETA cm3
PESO DE LA PROBETA grs.
VOLUMEN DE LA PROBETA grs.
PESO DE LA PROBETA grs.
VOLUMEN DE LA PROBETA grs.
DENSIDAD DE LA PROBETA gr/cm3
Muestra N°
VOLUMEN DE LA PROBETA grs.
DENSIDAD DE LA PROBETA gr/cm3
PESO DE LA PROBETA grs.
VOLUMEN DE LA PROBETA grs.
DENSIDAD DE LA PROBETA gr/cm3
PESO DE LA PROBETA grs.
PESO DE LA PROBETA grs.
Muestra N°
Muestra N°
Paneles de cascarilla de ArrozDISTRITO DE TARAPOTO
Panel Aglomerado de Cascarilla de Arroz
PESO DEL ESPÉCIMEN HUMEDO grs.
8.71782029
PESO DEL ESPÉCIMEN SECO grs.
PESO DEL AGUA grs
% DE HUMEDAD
UNIVERSIDAD NACIONAL DE SAN MARTINESCUELA DE INGENIERIA CIVIL
LABORATORIO DE MECANICA DE SUELOSCIUDAD UNIVERSITARIA - MORALES
MORALES - PERU
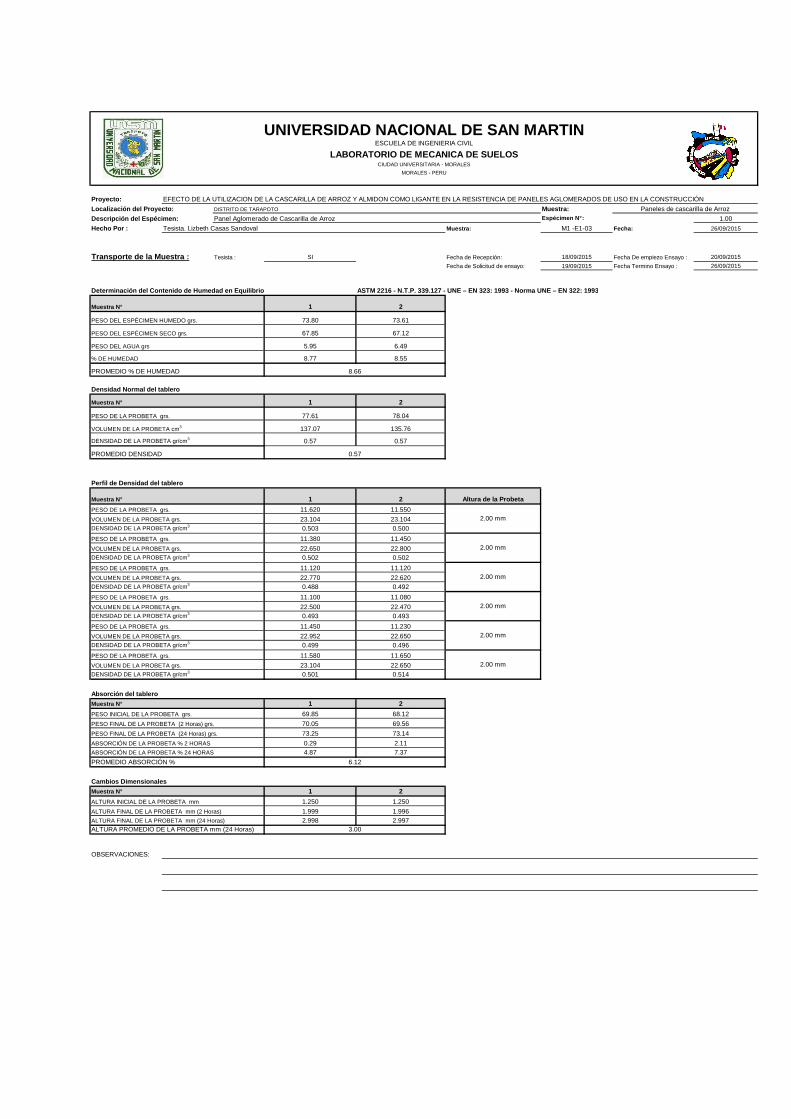
Proyecto: EFECTO DE LA UTILIZACION DE LA CASCARILLA DE ARROZ Y ALMIDON COMO LIGANTE EN LA RESISTENCIA DE PANELES AGLOMERADOS DE USO EN LA CONSTRUCCIÓN
Localización del Proyecto: Muestra:
Descripción del Espécimen: Espécimen N° : 1.00
Hecho Por : Tesista. Lizbeth Casas Sandoval Muestra: M1 -E1-03 Fecha: 26/09/2015
Transporte de la Muestra : Tesista : SI Fecha de Recepción: 18/09/2015 Fecha De empiezo Ensayo : 20/09/2015
Fecha de Solicitud de ensayo: 19/09/2015 Fecha Termino Ensayo : 26/09/2015
Determinación del Contenido de Humedad en Equilibri o ASTM 2216 - N.T.P. 339.127 - UNE – EN 323: 1993 - Norma UNE – EN 322: 1993
1 2
73.80 73.61
67.85 67.12
5.95 6.49
8.77 8.55
PROMEDIO % DE HUMEDAD
Densidad Normal del tablero
1 2
77.61 78.04
137.07 135.76
0.57 0.57
PROMEDIO DENSIDAD
Perfil de Densidad del tablero
1 2 Altura de la Probeta
11.620 11.550
23.104 23.1040.503 0.500
11.380 11.450
22.650 22.8000.502 0.502
11.120 11.120
22.770 22.6200.488 0.492
11.100 11.080
22.500 22.4700.493 0.493
11.450 11.230
22.952 22.6500.499 0.496
11.580 11.650
23.104 22.6500.501 0.514
Absorción del tablero
1 2
69.85 68.12
70.05 69.56
73.25 73.14
0.29 2.114.87 7.37
PROMEDIO ABSORCIÓN %
Cambios Dimensionales
1 2
1.250 1.250
1.999 1.9962.998 2.997
ALTURA PROMEDIO DE LA PROBETA mm (24 Horas)
OBSERVACIONES:
Paneles de cascarilla de Arroz
UNIVERSIDAD NACIONAL DE SAN MARTINESCUELA DE INGENIERIA CIVIL
LABORATORIO DE MECANICA DE SUELOSCIUDAD UNIVERSITARIA - MORALES
MORALES - PERU
PESO DE LA PROBETA grs.
VOLUMEN DE LA PROBETA grs.
2.00 mm
6.12
3.00
PESO DE LA PROBETA grs.
VOLUMEN DE LA PROBETA grs.
DENSIDAD DE LA PROBETA gr/cm3
PESO DE LA PROBETA grs.
DISTRITO DE TARAPOTO
Panel Aglomerado de Cascarilla de Arroz
PESO DEL ESPÉCIMEN HUMEDO grs.
DENSIDAD DE LA PROBETA gr/cm3
VOLUMEN DE LA PROBETA cm3
PESO DEL ESPÉCIMEN SECO grs.
PESO DEL AGUA grs
% DE HUMEDAD
PESO DE LA PROBETA grs.
8.66
Muestra N°
Muestra N°
0.57
2.00 mm
2.00 mm
2.00 mm
PESO DE LA PROBETA grs.
DENSIDAD DE LA PROBETA gr/cm3
2.00 mm
2.00 mmVOLUMEN DE LA PROBETA grs.
DENSIDAD DE LA PROBETA gr/cm3
PESO DE LA PROBETA grs.
VOLUMEN DE LA PROBETA grs.
DENSIDAD DE LA PROBETA gr/cm3
Muestra N°
VOLUMEN DE LA PROBETA grs.
DENSIDAD DE LA PROBETA gr/cm3
PESO DE LA PROBETA grs.
VOLUMEN DE LA PROBETA grs.
DENSIDAD DE LA PROBETA gr/cm3
Muestra N°
PESO INICIAL DE LA PROBETA grs.
PESO FINAL DE LA PROBETA (2 Horas) grs.
ABSORCIÓN DE LA PROBETA % 2 HORAS
ALTURA FINAL DE LA PROBETA mm (24 Horas)
PESO FINAL DE LA PROBETA (24 Horas) grs.
ABSORCIÓN DE LA PROBETA % 24 HORAS
Muestra N°
ALTURA INICIAL DE LA PROBETA mm
ALTURA FINAL DE LA PROBETA mm (2 Horas)
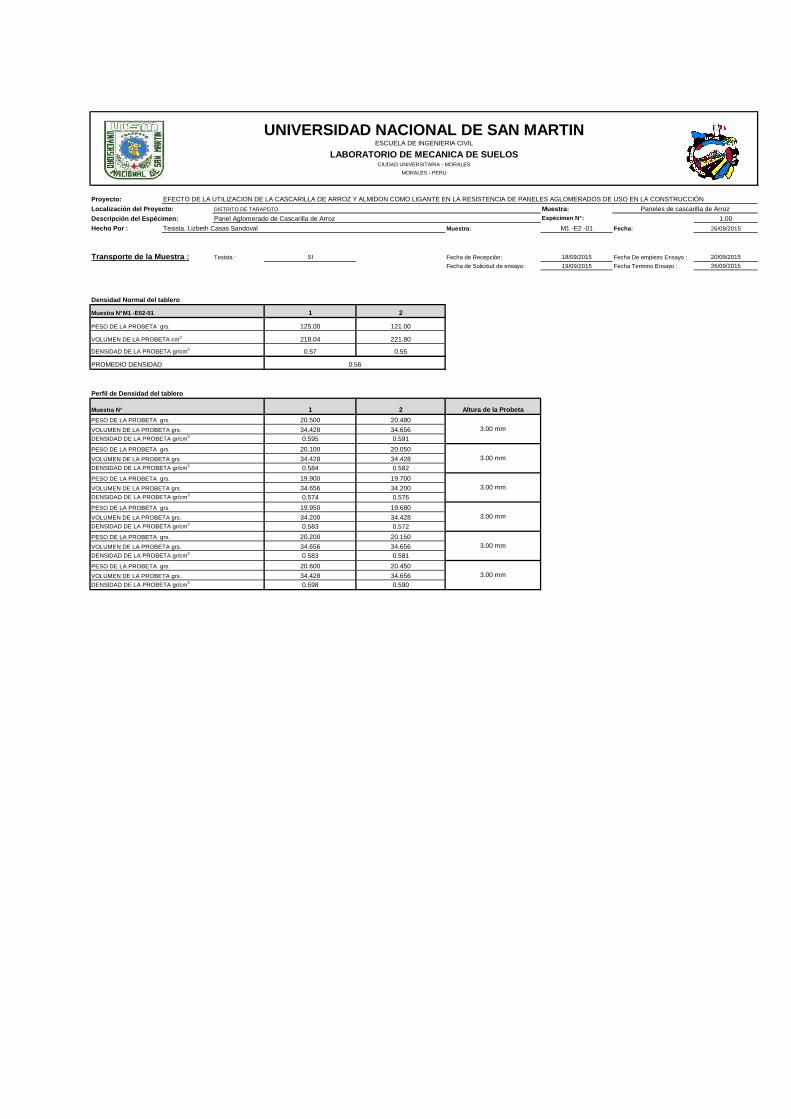
Proyecto: EFECTO DE LA UTILIZACION DE LA CASCARILLA DE ARROZ Y ALMIDON COMO LIGANTE EN LA RESISTENCIA DE PANELES AGLOMERADOS DE USO EN LA CONSTRUCCIÓN
Localización del Proyecto: Muestra:
Descripción del Espécimen: Espécimen N° : 1.00
Hecho Por : Tesista. Lizbeth Casas Sandoval Muestra: M1 -E2 -01 Fecha: 26/09/2015
Transporte de la Muestra : Tesista : SI Fecha de Recepción: 18/09/2015 Fecha De empiezo Ensayo : 20/09/2015
Fecha de Solicitud de ensayo: 19/09/2015 Fecha Termino Ensayo : 26/09/2015
Densidad Normal del tablero
1 2
125.00 121.00
218.04 221.80
0.57 0.55
PROMEDIO DENSIDAD
Perfil de Densidad del tablero
1 2 Altura de la Probeta
20.500 20.480
34.428 34.6560.595 0.591
20.100 20.050
34.428 34.4280.584 0.582
19.900 19.700
34.656 34.2000.574 0.576
19.950 19.680
34.200 34.4280.583 0.572
20.200 20.150
34.656 34.6560.583 0.581
20.600 20.450
34.428 34.6560.598 0.590
3.00 mm
3.00 mm
3.00 mm
DENSIDAD DE LA PROBETA gr/cm3
PESO DE LA PROBETA grs.
VOLUMEN DE LA PROBETA grs.
DENSIDAD DE LA PROBETA gr/cm3
PESO DE LA PROBETA grs.
VOLUMEN DE LA PROBETA grs.
Muestra N°
VOLUMEN DE LA PROBETA grs.
DENSIDAD DE LA PROBETA gr/cm3
PESO DE LA PROBETA grs.
Muestra N° M1 -E02-01
PESO DE LA PROBETA grs.
VOLUMEN DE LA PROBETA grs.
PESO DE LA PROBETA grs.
VOLUMEN DE LA PROBETA grs.
DENSIDAD DE LA PROBETA gr/cm3
VOLUMEN DE LA PROBETA grs.
DENSIDAD DE LA PROBETA gr/cm3
PESO DE LA PROBETA grs.
Paneles de cascarilla de ArrozDISTRITO DE TARAPOTO
Panel Aglomerado de Cascarilla de Arroz
DENSIDAD DE LA PROBETA gr/cm3
DENSIDAD DE LA PROBETA gr/cm3
VOLUMEN DE LA PROBETA cm3
PESO DE LA PROBETA grs.
UNIVERSIDAD NACIONAL DE SAN MARTINESCUELA DE INGENIERIA CIVIL
LABORATORIO DE MECANICA DE SUELOSCIUDAD UNIVERSITARIA - MORALES
MORALES - PERU
0.56
3.00 mm
3.00 mm
3.00 mm

Proyecto: EFECTO DE LA UTILIZACION DE LA CASCARILLA DE ARROZ Y ALMIDON COMO LIGANTE EN LA RESISTENCIA DE PANELES AGLOMERADOS DE USO EN LA CONSTRUCCIÓN
Localización del Proyecto: Muestra:
Descripción del Espécimen: Espécimen N° : 2.00
Hecho Por : Tesista. Lizbeth Casas Sandoval Muestra: M1 -E2-02 Fecha: 26/09/2015
Transporte de la Muestra : Tesista : SI Fecha de Recepción: 18/09/2015 Fecha De empiezo Ensayo : 20/09/2015
Fecha de Solicitud de ensayo: 19/09/2015 Fecha Termino Ensayo : 26/09/2015
Densidad Normal del tablero
1 2
105.00 115.00
220.91 210.67
0.48 0.55
PROMEDIO DENSIDAD
Perfil de Densidad del tablero
1 2 Altura de la Probeta
17.500 17.490
34.200 34.2000.512 0.511
17.250 17.220
34.200 34.1540.504 0.504
17.060 17.000
34.656 34.2000.492 0.497
17.050 17.020
34.200 34.6560.499 0.491
17.280 17.380
34.428 34.1540.502 0.509
17.450 17.480
34.200 34.1540.510 0.512
UNIVERSIDAD NACIONAL DE SAN MARTINESCUELA DE INGENIERIA CIVIL
LABORATORIO DE MECANICA DE SUELOSCIUDAD UNIVERSITARIA - MORALES
MORALES - PERU
PESO DE LA PROBETA grs.
Muestra N° M1 -E2-02
Paneles de cascarilla de ArrozDISTRITO DE TARAPOTO
Panel Aglomerado de Cascarilla de Arroz
DENSIDAD DE LA PROBETA gr/cm3
VOLUMEN DE LA PROBETA cm3
PESO DE LA PROBETA grs.
VOLUMEN DE LA PROBETA grs.
PESO DE LA PROBETA grs.
VOLUMEN DE LA PROBETA grs.
DENSIDAD DE LA PROBETA gr/cm3
Muestra N°
VOLUMEN DE LA PROBETA grs.
DENSIDAD DE LA PROBETA gr/cm3
PESO DE LA PROBETA grs.
VOLUMEN DE LA PROBETA grs.
DENSIDAD DE LA PROBETA gr/cm3
PESO DE LA PROBETA grs.
3.00 mm
3.00 mm
3.00 mm
3.00 mm
3.00 mmPESO DE LA PROBETA grs.
0.51
DENSIDAD DE LA PROBETA gr/cm3
VOLUMEN DE LA PROBETA grs.
DENSIDAD DE LA PROBETA gr/cm3
PESO DE LA PROBETA grs.
VOLUMEN DE LA PROBETA grs.
DENSIDAD DE LA PROBETA gr/cm3
3.00 mm

Proyecto: EFECTO DE LA UTILIZACION DE LA CASCARILLA DE ARROZ Y ALMIDON COMO LIGANTE EN LA RESISTENCIA DE PANELES AGLOMERADOS DE USO EN LA CONSTRUCCIÓN
Localización del Proyecto: Muestra:
Descripción del Espécimen: Espécimen N° : 1.00
Hecho Por : Tesista. Lizbeth Casas Sandoval Muestra: M1 -E2-03 Fecha: 26/09/2015
Transporte de la Muestra : Tesista : SI Fecha de Recepción: 18/09/2015 Fecha De empiezo Ensayo : 20/09/2015
Fecha de Solicitud de ensayo: 19/09/2015 Fecha Termino Ensayo : 26/09/2015
Densidad Normal del tablero
1 2
170.00 151.00
232.56 218.04
0.73 0.69
PROMEDIO DENSIDAD
Perfil de Densidad del tablero
1 2 Altura de la Probeta
26.100 25.300
34.656 34.6560.753 0.730
24.890 24.500
34.656 34.6560.718 0.707
23.650 23.400
34.656 34.6560.682 0.675
23.350 23.450
34.656 34.6560.674 0.677
25.200 24.700
34.656 34.4280.727 0.717
26.300 25.200
34.656 34.4280.759 0.732
0.71
3.00 mm
3.00 mm
3.00 mm
PESO DE LA PROBETA grs.
DENSIDAD DE LA PROBETA gr/cm3
3.00 mm
3.00 mmVOLUMEN DE LA PROBETA grs.
DENSIDAD DE LA PROBETA gr/cm3
PESO DE LA PROBETA grs.
VOLUMEN DE LA PROBETA grs.
DENSIDAD DE LA PROBETA gr/cm3
Muestra N°
VOLUMEN DE LA PROBETA grs.
DENSIDAD DE LA PROBETA gr/cm3
PESO DE LA PROBETA grs.
VOLUMEN DE LA PROBETA grs.
DENSIDAD DE LA PROBETA gr/cm3
PESO DE LA PROBETA grs.
DISTRITO DE TARAPOTO
Panel Aglomerado de Cascarilla de Arroz
DENSIDAD DE LA PROBETA gr/cm3
VOLUMEN DE LA PROBETA cm3
PESO DE LA PROBETA grs.
Muestra N° M1 -E2-03
PESO DE LA PROBETA grs.
VOLUMEN DE LA PROBETA grs.
3.00 mmPESO DE LA PROBETA grs.
VOLUMEN DE LA PROBETA grs.
DENSIDAD DE LA PROBETA gr/cm3
Paneles de cascarilla de Arroz
UNIVERSIDAD NACIONAL DE SAN MARTINESCUELA DE INGENIERIA CIVIL
LABORATORIO DE MECANICA DE SUELOSCIUDAD UNIVERSITARIA - MORALES
MORALES - PERU
Designation: D1037 − 12
Standard Test Methods forEvaluating Properties of Wood-Base Fiber and ParticlePanel Materials1
This standard is issued under the fixed designation D1037; the number immediately following the designation indicates the year oforiginal adoption or, in the case of revision, the year of last revision. A number in parentheses indicates the year of last reapproval. Asuperscript epsilon (´) indicates an editorial change since the last revision or reapproval.
This standard has been approved for use by agencies of the U.S. Department of Defense.
INTRODUCTION
The test methods presented herein have been developed and are presented to serve two distinctpurposes. They are divided into two parts.
Part A. General Test Methods for Evaluating the Basic Properties of Wood-Base Fiber and ParticlePanel Materials—Part A is for use in obtaining basic properties suitable for comparison studies withother materials of construction. These refined test methods are applicable for this purpose to allmaterials covered by Definitions D1554.
Part B. Acceptance and Specification Test Methods for Hardboard—Part B is for specific use inspecifications for procurement and acceptance testing of hardboard. These test methods are generallyemployed for those purposes in the industry. By confining their intended use as indicated, it has beenpossible to achieve adequate precision of results combined with economy and speed in testing, whichare desirable for specification use.
The choice between a particular test method and its alternative should be made with a fullunderstanding of the intended purpose of each, because values obtained from tests may, in some cases,differ. Of the test methods presented in both parts, some have been in generally accepted use for manyyears, some are modifications and refinements of previously developed test methods, and some aremore recent developments. Where test methods are suitable for more than one of the purposes, theyare delineated in Part A, but not repeated in Part B. It is the intent that reference to the appropriatesection of the test method shall suffice in specifications developed for the different materials.
1. Scope
1.1 Part A—General Test Methods for Evaluating the BasicProperties of Wood-Base Fiber and Particle Panel Materials.These test methods cover the determination of the properties ofwood-base fiber and particle panel materials that are producedas mat-formed panels such as particleboard, medium-densityfiberboard, hardboard, and oriented strand board.
SectionSignificance and Use 3Apparatus 4Test Specimens 5Moisture Content and Conditioning Requirements 6Accelerated Aging 7Size, Physical Properties and Appearance of Panels 8Static Bending 9Tension Parallel to Surface 10Tension Perpendicular to Surface 11Compression Parallel to Surface 12Fastener Holding Tests:
Lateral Nail Resistance 13Nail Withdrawal 14Nail-Head Pull-Through 15Direct Screw Withdrawal 16
Hardness 17Hardness Modulus 18
1 These test methods are under the jurisdiction of ASTM Committee D07 onWood and are the direct responsibility of Subcommittee D07.03 on Panel Products.
Current edition approved May 1, 2012. Published June 2012. Originallyapproved in 1949. Last previous edition approved in 2006 as D1037 – 06a. DOI:10.1520/D1037-12.
Copyright © ASTM International, 100 Barr Harbor Drive, PO Box C700, West Conshohocken, PA 19428-2959. United States
1
Copyright by ASTM Int'l (all rights reserved); Tue Aug 5 14:01:53 EDT 2014Downloaded/printed byLIZBETH SANDOVAL (JRE INGENIERIA Y SERVICIOS S.A.C.) pursuant to License Agreement. No further reproductions authorized.
SectionShear in the Plane of the Panel 19Glue-Line Shear (Block Type) 20Falling Ball Impact 21Abrasion Resistance by the U.S. Navy Wear Tester 22Moisture Tests:
Water Absorption and Thickness Swelling 23Linear Expansion with Change in Moisture Content 24
Cupping and Twisting 25Interlaminar Shear 26Edgewise Shear 27Compression-Shear 28
1.2 Part B—Acceptance and Specification Test Methods forHardboard. The methods for Part B provide test procedures formeasuring the following properties of hardboard:
SectionThickness 32Modulus of Rupture 33Tension Strength Parallel to Surface 34Tension Strength Perpendicular to Surface 35Water Absorption and Thickness Swelling 36Moisture Content and Specific Gravity 37
1.3 There are accepted basic test procedures for variousfundamental properties of materials that may be used withoutmodification for evaluating certain properties of wood-basedfiber and particle panel materials. These test methods areincluded elsewhere in the Annual Book of ASTM Standards.The pertinent ones are listed in Table 1. A few of the testmethods referenced are for construction where the wood-basematerials often are used.
1.4 The values stated in inch-pound units are to be regardedas the standard. The SI equivalents are approximate in manycases. 1 in. = 25.4 mm, 1 lbf = 4.45 N.
1.5 This standard does not purport to address all of thesafety concerns, if any, associated with its use. It is theresponsibility of the user of this standard to establish appro-priate safety and health practices and determine the applica-bility of regulatory limitations prior to use.
2. Referenced Documents
2.1 ASTM Standards:2
C273 Test Method for Shear Properties of Sandwich CoreMaterials
D143 Test Methods for Small Clear Specimens of TimberD905 Test Method for Strength Properties of Adhesive
Bonds in Shear by Compression LoadingD1554 Terminology Relating to Wood-Base Fiber and Par-
ticle Panel MaterialsD2395 Test Methods for Density and Specific Gravity (Rela-
tive Density) of Wood and Wood-Based MaterialsD2915 Practice for Sampling and Data-Analysis for Struc-
tural Wood and Wood-Based ProductsD3043 Test Methods for Structural Panels in FlexureD3501 Test Methods for Wood-Based Structural Panels in
CompressionD4442 Test Methods for Direct Moisture Content Measure-
ment of Wood and Wood-Base Materials
E4 Practices for Force Verification of Testing MachinesE691 Practice for Conducting an Interlaboratory Study to
Determine the Precision of a Test Method
PART A—GENERAL TEST METHODS FOREVALUATING THE BASIC PROPERTIES OF WOOD-BASE FIBER AND PARTICLE PANEL MATERIALS
3. Significance and Use
3.1 These test methods cover small-specimen tests forwood-base fiber and particle panel materials that are made toprovide:
3.2 Data for comparing the mechanical and physical prop-erties of various materials,
3.3 Data for determining the influence on the basic proper-ties of such factors as raw material and processing variables,post-treatments of panels, and environmental influences, and
3.4 Data for manufacturing control, product research anddevelopment, and specification acceptance.
2 For referenced ASTM standards, visit the ASTM website, www.astm.org, orcontact ASTM Customer Service at [email protected]. For Annual Book of ASTMStandards volume information, refer to the standard’s Document Summary page onthe ASTM website.
TABLE 1 Basic Test Procedures for Evaluating Properties ofWood Base-Fiber and Particle Panel Materials
ASTMDesignation
Test Methods for
C177 Steady-State Heat-Flux Measurements and Thermal TransmissionProperties by Means of the Guarded-Hot-Plate ApparatusA
C209 Cellulosic Fiber Insulating BoardA
C236 Steady-State Thermal Performance of Building Assemblies byMeans of the Guarded Hot BoxA
C384 Impedance and Absorption of Acoustical Materials by the Imped-ance Tube MethodA
C423 Sound Absorption and Sound Absorption Coefficients by the Re-verberation Room MethodA
D149 Dielectric Breakdown Voltage and Dielectric Strength of Solid Elec-trical Insulating Materials at Commercial Power FrequenciesB
D150 A-C Loss Characteristics and Permittivity (Dielectric Constant) ofSolid Electrical Insulating MaterialsB
D257 D-C Resistance or Conductance of Insulating MaterialsB
D495 High-Voltage, Low-Current, Dry Arc Resistance of Solid ElectricalInsulationB
D1666 Conducting Machining Tests of Wood and Wood-Base MaterialsC
D1761 Mechanical Fasteners in WoodC
E72 Conducting Strength Tests of Panels for Building ConstructionD
E84 Surface Burning Characteristics of Building MaterialsD
E90 Laboratory Measurement of Airborne Sound Transmission Loss ofBuilding PartitionsA
E96 Water Vapor Transmission of MaterialsA
E97 Directional Reflectance Factor, 45-deg 0-deg, of Opaque Speci-mens by Broad-Band Filter ReflectometryE
E119 Fire Tests of Building Construction and MaterialsD
E136 Behavior of Materials in a Vertical Tube Furnace at 750°CD
E152 Fire Tests of Door AssembliesD
E162 Surface Flammability of Materials Using a Radiant Heat EnergySourceD
E661 Performance of Wood and Wood-Based Floor and Roof SheathingUnder Concentrated Static and Impact LoadsD
E662 Specific Optical Density of Smoke Generated by Solid MaterialsD
E906 Heat and Visible Smoke Release Rates for Materials and Prod-uctsD
A Annual Book of ASTM Standards, Vol 04.06.B Annual Book of ASTM Standards, Vol 10.01.C Annual Book of ASTM Standards, Vol 04.10.D Annual Book of ASTM Standards, Vol 04.07.E Annual Book of ASTM Standards, Vol 14.02.
D1037 − 12
2
Copyright by ASTM Int'l (all rights reserved); Tue Aug 5 14:01:53 EDT 2014Downloaded/printed byLIZBETH SANDOVAL (JRE INGENIERIA Y SERVICIOS S.A.C.) pursuant to License Agreement. No further reproductions authorized.
3.5 Not all the tests outlined in these test methods may benecessary to evaluate any particular panel for any specified use.In each instance, therefore, it will be necessary to determinewhich tests shall be made.
4. Apparatus
4.1 Testing Machine—For strength and fastener holdingtests, any standard testing machine (see Note 1) capable ofapplying and measuring the load with an error not to exceed61.0 % shall be used as provided in Practices E4.
NOTE 1—Some testing machines operated at speeds allowed in thesetest procedures without proper damping devices or in need of adjustmentmay yield values in error because of “follow-through” due to mass inertiaeffects in the weighing system. Care must be exercised in the selection oftesting machines so that values obtained from test are not in error morethan the amount stipulated.
5. Test Specimens
5.1 The number of specimens to be chosen for test and themethod of their selection depend on the purpose of theparticular tests under consideration, so that no general rule canbe given to cover all instances. It is recommended thatwhenever possible, a sufficient number of tests be made topermit statistical treatment of the test data (see Note 2). In theevaluation of a panel material, specimens for test should beobtained from a representative number of panels. In propertiesreflecting differences due to the machine direction of the panel,specimens from each panel shall be selected both with the longdimension parallel to the long dimension of the panel, and withthe long dimension perpendicular to the long dimension of thepanel.
NOTE 2—Guidance on statistical sampling is provided in PracticeD2915.
6. Moisture Content and Conditioning Requirements
6.1 The physical and mechanical properties of buildingpanels depend on the moisture content at time of test.
6.2 The moisture conditioning selection for each test proce-dure within this standard depends upon the purpose of theparticular tests under consideration. All specimens within eachtest sample shall be conditioned as required to meet the specifictest objectives.
6.3 The following moisture conditioning regimens are com-monly employed with the test procedures of this standard:
6.3.1 Dry “As Received”—Specimens to be tested “asreceived” shall be tested without supplemental conditioning toalter the moisture content.
6.3.2 Dry “Conditioned”—Specimens to be tested air-dryshall be conditioned to a constant weight and moisture contentin a conditioning chamber maintained at a relative humidity of65 6 5 % and a temperature of 68 6 6°F (20 6 3°C) (See Note3).
NOTE 3—This conditioning regime represents a common standard forwood and wood-based materials.
6.3.3 Water Soaked—Specimens to be tested in the soakedcondition shall be submerged in water at 68 6 2°F (20 6 1°C)for 24-h (see Note 4) before the test and shall be tested within30 minutes upon removal from the water.
NOTE 4—When it is desired to obtain the effect of complete saturation,the specimens shall be soaked for a longer period.
6.3.4 Accelerated Aging—Accelerated aging cycles shall becompleted per Section 7 of this standard.
6.3.5 Other—Other conditioning methods that are designedto meet the test objectives may be employed provided that theyare clearly described in the test report.
6.4 Specimens shall be subjected to the conditioning regi-mens of section 6.3 after they have been cut to the finaldimensional sizes required for the test procedures within thisstandard.
6.5 When water soaked conditioning (section 6.3.3), accel-erated aging conditioning (section 6.3.4) or other conditioningmethod is employed to simulate an application moistureexposure:
6.5.1 The sample dimensions and weights shall be recordedbefore and after conditioning. Any computed properties shallbe reported based upon both the pre-conditioned dimensions orweight, or both, and upon the dimensions or weight, or both,after the moisture conditioning treatment.
6.5.2 If the objective is to estimate the relative change in aproperty due to the moisture conditioning treatment, a matchedset of material shall be tested in the dry (section 6.3.1 or 6.3.2)condition. The conditioning treatment selected for the matchedset shall be based upon the test objectives.
6.6 For all testing within this standard, the moisture condi-tioning method selected and resulting test sample moisturecontents shall be reported.
7. Accelerated Aging
7.1 Scope and Significance7.1.1 The accelerated aging treatment is one possible con-
ditioning treatment (see Section 6) and is used to obtain ameasure of the inherent ability of a material to withstand severeexposure conditions and maintain its mechanical and physicalproperties. Appropriate specimens shall be prepared and sub-jected to the six cycles of accelerated aging before the propertyis evaluated. The cycling exposure is a simulated conditiondeveloped to evaluate how a material will stand up under agingconditions.
NOTE 5—All of the tests listed in this standard may not be required forany specific investigation or specification. Static bending (Section 9),nail-holding (Sections 13 – 15), and water absorption and thicknessswelling (Section 23) tests are usually sufficient to evaluate the resistanceof a wood-base panel material to aging. In some instances it may bedesirable to evaluate the effect of accelerated aging on some otherproperty, including properties outside the scope of this standard.
7.2 Test Specimens7.2.1 The test specimens shall be cut to size for testing and
dimensions or weight measured, or both, as specified in thepertinent sections of this standard before being subjected to thecyclic exposure listed in section 7.3. When tests involvingfasteners are made, the fasteners shall be driven prior to theaging exposure. Corrosion-resistant fasteners shall be usedbecause extractives or other materials present will corrodeordinary steel fasteners.
7.3 Accelerated Aging Cycles
D1037 − 12
3
Copyright by ASTM Int'l (all rights reserved); Tue Aug 5 14:01:53 EDT 2014Downloaded/printed byLIZBETH SANDOVAL (JRE INGENIERIA Y SERVICIOS S.A.C.) pursuant to License Agreement. No further reproductions authorized.
7.3.1 Subject each specimen to six complete cycles ofaccelerated aging. If the cycle is to be broken, as for aweekend, the break shall be made during the freezing portionof the cycle. Each cycle shall consist of the following:
7.3.2 Immersion in water at 120 6 3°F (49 6 2°C) for 1 h,7.3.3 Exposure to steam and water vapor at 200 6 5°F (93
6 3°C) for 3 h,7.3.4 Freezing at 10 6 5°F (-12 6 3°C) for 20 h,7.3.5 Heating at 210 6 3°F (99 6 2°C) in dry air for 3 h,7.3.6 Exposure again to steam and water vapor at 200 6 5°F
(93 6 3°C) for 3 h, and7.3.7 Heating in dry air at 210 6 3°F (99 6 2°C) for 18 h.7.3.8 After the completion of the six-cycle accelerated
aging the specimens shall be conditioned at a temperature of 686 6°F (20 6 3°C) and a relative humidity of 65 6 2 % for atleast 48 h before testing.
7.4 Handling and Support of Specimens During Exposure7.4.1 The specimens shall be supported vertically in racks
during accelerated aging. One example is shown in Fig. 1.Specimens shall fit in the racks loosely with at least 1-in. (25mm) separation between specimens so as to freely permitswelling both parallel and perpendicular to the plane of thepanel of the specimen. Racks shall not appreciably shieldspecimens nor prevent draining after soaking. Further, when inthe tank during the exposure to steam and water vapor,specimens shall be placed so that jets of steam and vapor willnot erode the specimens.
7.5 Apparatus7.5.1 Tank and Controls for Soaking and Steaming:7.5.1.1 Tank or Vat—A tank or vat, such as shown in Fig. 2,
shall be used to conduct the exposures listed in 7.3.2, 7.3.3, and7.3.6 of the accelerated aging test. A unit of the size shown isadequate for specimens of the size required in this standard.For tests of larger components, units as long as 9 ft (2.7 m)have proven to be satisfactory. The essential features of thetank are as follows:
7.5.1.2 Corrosion-resistant container, because of extractivesdeveloped during these cycles and present in wood-basematerials,
7.5.1.3 A pipe to the bottom with a diffuser (perforatedT-pipe),
7.5.1.4 A drain, although for larger tanks a pump has provento be advantageous, and
7.5.1.5 A loose-fitting cover that will permit some steam toescape during steam and water vapor phase.
7.5.1.6 Supports shall be provided in the bottom of the tankto keep the specimens from direct contact with the water.
7.5.1.7 The tank may be insulated or uninsulated; but ifinsulated, the cover is to be left open during the steamingportion of the cycle. Heat loss during the soaking exposure(7.3.2) requires addition of heat by steam or the equivalent.This provides for circulation around the specimens beingsoaked and aids in maintaining the desired temperature withgreater uniformity. Heat loss during the exposure to steam andwater vapor (7.3.3 and 7.3.6) along with the escaping steamaids in providing a dynamic condition. During those steps thedrain should be open to permit condensate to drain; or as analternative method, the water level in the tank should be about2 in. (51 mm) above the perforated pipes so that the steampercolates through it.
7.5.2 Controls and Source for Soaking and Steaming—Asuitable unit for providing heat for soaking and exposure tosteam and water vapor is shown diagrammatically in Fig. 3. Inthis instance, an air-operated dry kiln controller provides thetemperature control required for either the soaking exposure(7.3.2) or the exposure to steam and water vapor (7.3.3 and7.3.6). In operation for the soaking exposure (7.3.2) the tank isfilled to the desired level by opening valves 1 and 3, afterwhich valve 3 is closed. The controller is set at 120°F (49°C)and the sensor is placed in the water at mid-depth. Valve 2 isopened and steam flows into the water until desired tempera-ture is attained and air-operated valve closes. Temperature is
FIG. 1 Specimens Supported Vertically in Rack
D1037 − 12
4
Copyright by ASTM Int'l (all rights reserved); Tue Aug 5 14:01:53 EDT 2014Downloaded/printed byLIZBETH SANDOVAL (JRE INGENIERIA Y SERVICIOS S.A.C.) pursuant to License Agreement. No further reproductions authorized.
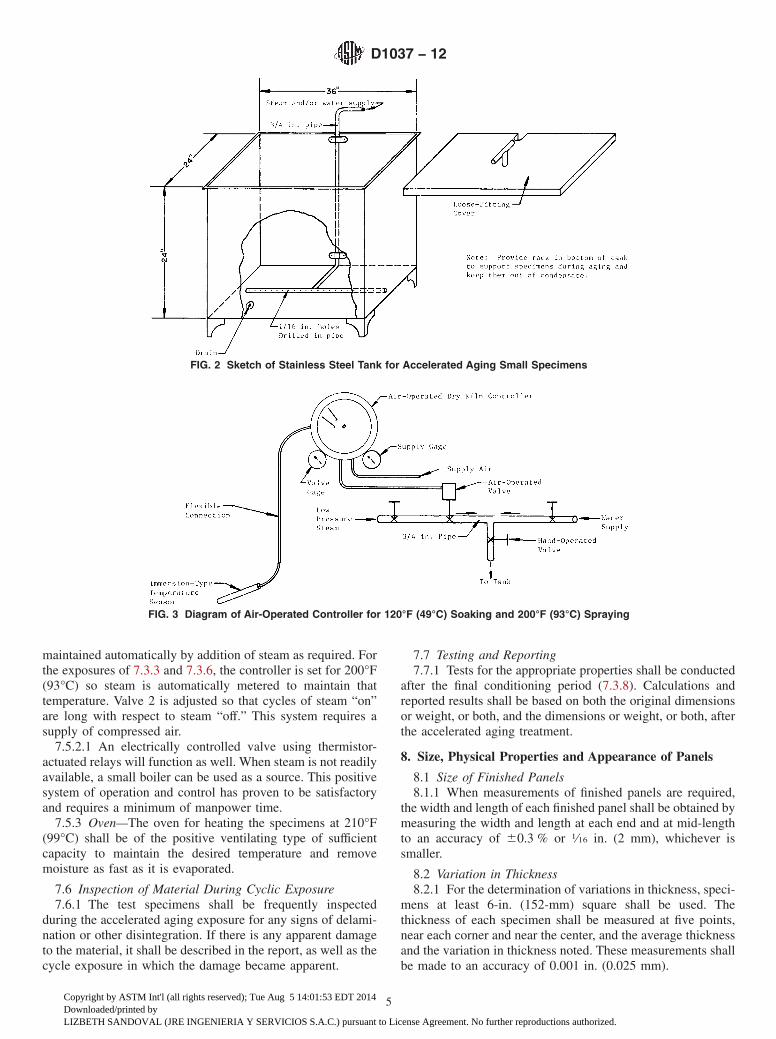
maintained automatically by addition of steam as required. Forthe exposures of 7.3.3 and 7.3.6, the controller is set for 200°F(93°C) so steam is automatically metered to maintain thattemperature. Valve 2 is adjusted so that cycles of steam “on”are long with respect to steam “off.” This system requires asupply of compressed air.
7.5.2.1 An electrically controlled valve using thermistor-actuated relays will function as well. When steam is not readilyavailable, a small boiler can be used as a source. This positivesystem of operation and control has proven to be satisfactoryand requires a minimum of manpower time.
7.5.3 Oven—The oven for heating the specimens at 210°F(99°C) shall be of the positive ventilating type of sufficientcapacity to maintain the desired temperature and removemoisture as fast as it is evaporated.
7.6 Inspection of Material During Cyclic Exposure7.6.1 The test specimens shall be frequently inspected
during the accelerated aging exposure for any signs of delami-nation or other disintegration. If there is any apparent damageto the material, it shall be described in the report, as well as thecycle exposure in which the damage became apparent.
7.7 Testing and Reporting7.7.1 Tests for the appropriate properties shall be conducted
after the final conditioning period (7.3.8). Calculations andreported results shall be based on both the original dimensionsor weight, or both, and the dimensions or weight, or both, afterthe accelerated aging treatment.
8. Size, Physical Properties and Appearance of Panels
8.1 Size of Finished Panels8.1.1 When measurements of finished panels are required,
the width and length of each finished panel shall be obtained bymeasuring the width and length at each end and at mid-lengthto an accuracy of 60.3 % or 1⁄16 in. (2 mm), whichever issmaller.
8.2 Variation in Thickness8.2.1 For the determination of variations in thickness, speci-
mens at least 6-in. (152-mm) square shall be used. Thethickness of each specimen shall be measured at five points,near each corner and near the center, and the average thicknessand the variation in thickness noted. These measurements shallbe made to an accuracy of 0.001 in. (0.025 mm).
FIG. 2 Sketch of Stainless Steel Tank for Accelerated Aging Small Specimens
FIG. 3 Diagram of Air-Operated Controller for 120°F (49°C) Soaking and 200°F (93°C) Spraying
D1037 − 12
5
Copyright by ASTM Int'l (all rights reserved); Tue Aug 5 14:01:53 EDT 2014Downloaded/printed byLIZBETH SANDOVAL (JRE INGENIERIA Y SERVICIOS S.A.C.) pursuant to License Agreement. No further reproductions authorized.
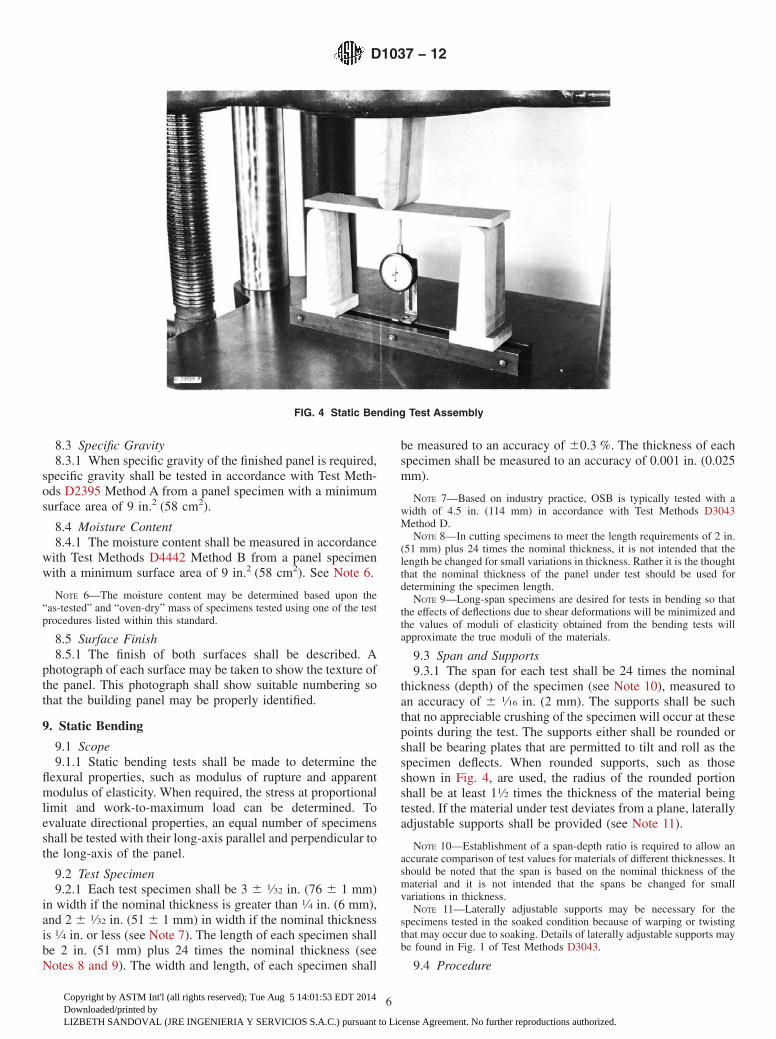
8.3 Specific Gravity8.3.1 When specific gravity of the finished panel is required,
specific gravity shall be tested in accordance with Test Meth-ods D2395 Method A from a panel specimen with a minimumsurface area of 9 in.2 (58 cm2).
8.4 Moisture Content8.4.1 The moisture content shall be measured in accordance
with Test Methods D4442 Method B from a panel specimenwith a minimum surface area of 9 in.2 (58 cm2). See Note 6.
NOTE 6—The moisture content may be determined based upon the“as-tested” and “oven-dry” mass of specimens tested using one of the testprocedures listed within this standard.
8.5 Surface Finish8.5.1 The finish of both surfaces shall be described. A
photograph of each surface may be taken to show the texture ofthe panel. This photograph shall show suitable numbering sothat the building panel may be properly identified.
9. Static Bending
9.1 Scope9.1.1 Static bending tests shall be made to determine the
flexural properties, such as modulus of rupture and apparentmodulus of elasticity. When required, the stress at proportionallimit and work-to-maximum load can be determined. Toevaluate directional properties, an equal number of specimensshall be tested with their long-axis parallel and perpendicular tothe long-axis of the panel.
9.2 Test Specimen9.2.1 Each test specimen shall be 3 6 1⁄32 in. (76 6 1 mm)
in width if the nominal thickness is greater than 1⁄4 in. (6 mm),and 2 6 1⁄32 in. (51 6 1 mm) in width if the nominal thicknessis 1⁄4 in. or less (see Note 7). The length of each specimen shallbe 2 in. (51 mm) plus 24 times the nominal thickness (seeNotes 8 and 9). The width and length, of each specimen shall
be measured to an accuracy of 60.3 %. The thickness of eachspecimen shall be measured to an accuracy of 0.001 in. (0.025mm).
NOTE 7—Based on industry practice, OSB is typically tested with awidth of 4.5 in. (114 mm) in accordance with Test Methods D3043Method D.
NOTE 8—In cutting specimens to meet the length requirements of 2 in.(51 mm) plus 24 times the nominal thickness, it is not intended that thelength be changed for small variations in thickness. Rather it is the thoughtthat the nominal thickness of the panel under test should be used fordetermining the specimen length.
NOTE 9—Long-span specimens are desired for tests in bending so thatthe effects of deflections due to shear deformations will be minimized andthe values of moduli of elasticity obtained from the bending tests willapproximate the true moduli of the materials.
9.3 Span and Supports9.3.1 The span for each test shall be 24 times the nominal
thickness (depth) of the specimen (see Note 10), measured toan accuracy of 6 1⁄16 in. (2 mm). The supports shall be suchthat no appreciable crushing of the specimen will occur at thesepoints during the test. The supports either shall be rounded orshall be bearing plates that are permitted to tilt and roll as thespecimen deflects. When rounded supports, such as thoseshown in Fig. 4, are used, the radius of the rounded portionshall be at least 11⁄2 times the thickness of the material beingtested. If the material under test deviates from a plane, laterallyadjustable supports shall be provided (see Note 11).
NOTE 10—Establishment of a span-depth ratio is required to allow anaccurate comparison of test values for materials of different thicknesses. Itshould be noted that the span is based on the nominal thickness of thematerial and it is not intended that the spans be changed for smallvariations in thickness.
NOTE 11—Laterally adjustable supports may be necessary for thespecimens tested in the soaked condition because of warping or twistingthat may occur due to soaking. Details of laterally adjustable supports maybe found in Fig. 1 of Test Methods D3043.
9.4 Procedure
FIG. 4 Static Bending Test Assembly
D1037 − 12
6
Copyright by ASTM Int'l (all rights reserved); Tue Aug 5 14:01:53 EDT 2014Downloaded/printed byLIZBETH SANDOVAL (JRE INGENIERIA Y SERVICIOS S.A.C.) pursuant to License Agreement. No further reproductions authorized.
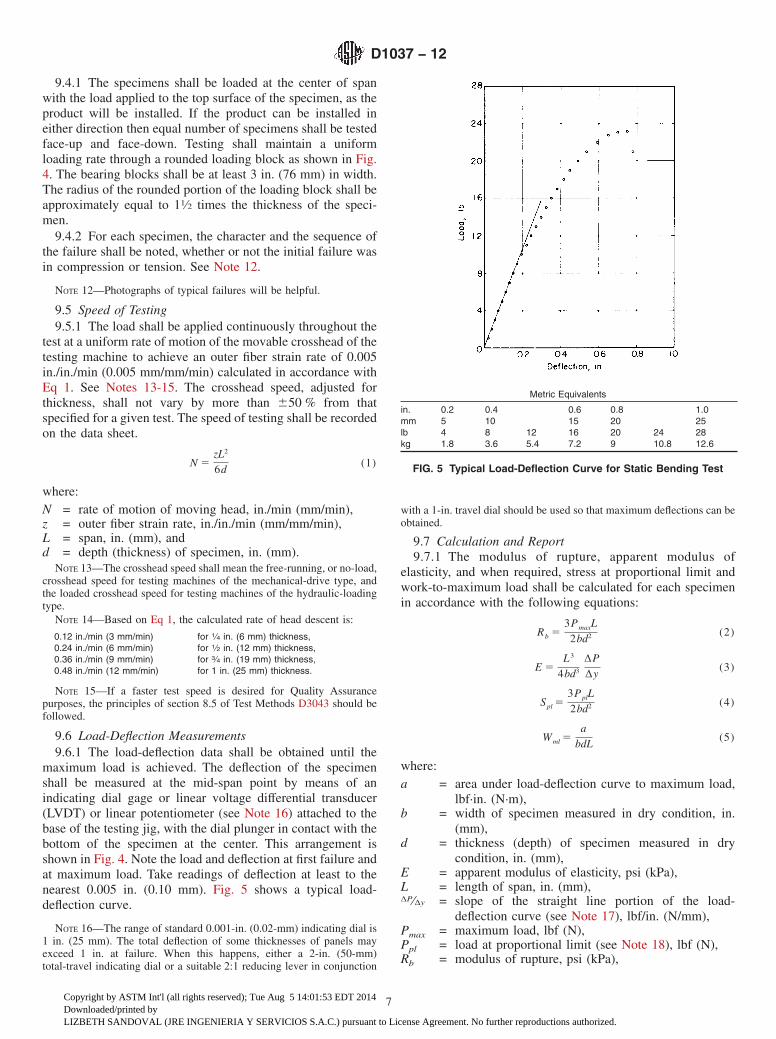
9.4.1 The specimens shall be loaded at the center of spanwith the load applied to the top surface of the specimen, as theproduct will be installed. If the product can be installed ineither direction then equal number of specimens shall be testedface-up and face-down. Testing shall maintain a uniformloading rate through a rounded loading block as shown in Fig.4. The bearing blocks shall be at least 3 in. (76 mm) in width.The radius of the rounded portion of the loading block shall beapproximately equal to 11⁄2 times the thickness of the speci-men.
9.4.2 For each specimen, the character and the sequence ofthe failure shall be noted, whether or not the initial failure wasin compression or tension. See Note 12.
NOTE 12—Photographs of typical failures will be helpful.
9.5 Speed of Testing9.5.1 The load shall be applied continuously throughout the
test at a uniform rate of motion of the movable crosshead of thetesting machine to achieve an outer fiber strain rate of 0.005in./in./min (0.005 mm/mm/min) calculated in accordance withEq 1. See Notes 13-15. The crosshead speed, adjusted forthickness, shall not vary by more than 650 % from thatspecified for a given test. The speed of testing shall be recordedon the data sheet.
N 5zL2
6d(1)
where:N = rate of motion of moving head, in./min (mm/min),z = outer fiber strain rate, in./in./min (mm/mm/min),L = span, in. (mm), andd = depth (thickness) of specimen, in. (mm).
NOTE 13—The crosshead speed shall mean the free-running, or no-load,crosshead speed for testing machines of the mechanical-drive type, andthe loaded crosshead speed for testing machines of the hydraulic-loadingtype.
NOTE 14—Based on Eq 1, the calculated rate of head descent is:
0.12 in./min (3 mm/min) for 1⁄4 in. (6 mm) thickness,0.24 in./min (6 mm/min) for 1⁄2 in. (12 mm) thickness,0.36 in./min (9 mm/min) for 3⁄4 in. (19 mm) thickness,0.48 in./min (12 mm/min) for 1 in. (25 mm) thickness.
NOTE 15—If a faster test speed is desired for Quality Assurancepurposes, the principles of section 8.5 of Test Methods D3043 should befollowed.
9.6 Load-Deflection Measurements9.6.1 The load-deflection data shall be obtained until the
maximum load is achieved. The deflection of the specimenshall be measured at the mid-span point by means of anindicating dial gage or linear voltage differential transducer(LVDT) or linear potentiometer (see Note 16) attached to thebase of the testing jig, with the dial plunger in contact with thebottom of the specimen at the center. This arrangement isshown in Fig. 4. Note the load and deflection at first failure andat maximum load. Take readings of deflection at least to thenearest 0.005 in. (0.10 mm). Fig. 5 shows a typical load-deflection curve.
NOTE 16—The range of standard 0.001-in. (0.02-mm) indicating dial is1 in. (25 mm). The total deflection of some thicknesses of panels mayexceed 1 in. at failure. When this happens, either a 2-in. (50-mm)total-travel indicating dial or a suitable 2:1 reducing lever in conjunction
with a 1-in. travel dial should be used so that maximum deflections can beobtained.
9.7 Calculation and Report9.7.1 The modulus of rupture, apparent modulus of
elasticity, and when required, stress at proportional limit andwork-to-maximum load shall be calculated for each specimenin accordance with the following equations:
Rb 53PmaxL
2bd2 (2)
E 5L3
4bd3
∆P∆y
(3)
Spl 53PplL2bd2 (4)
Wml 5a
bdL(5)
where:a = area under load-deflection curve to maximum load,
lbf·in. (N·m),b = width of specimen measured in dry condition, in.
(mm),d = thickness (depth) of specimen measured in dry
condition, in. (mm),E = apparent modulus of elasticity, psi (kPa),L = length of span, in. (mm),∆P⁄∆y = slope of the straight line portion of the load-
deflection curve (see Note 17), lbf/in. (N/mm),Pmax = maximum load, lbf (N),Ppl = load at proportional limit (see Note 18), lbf (N),Rb = modulus of rupture, psi (kPa),
Metric Equivalents
in. 0.2 0.4 0.6 0.8 1.0mm 5 10 15 20 25lb 4 8 12 16 20 24 28kg 1.8 3.6 5.4 7.2 9 10.8 12.6
FIG. 5 Typical Load-Deflection Curve for Static Bending Test
D1037 − 12
7
Copyright by ASTM Int'l (all rights reserved); Tue Aug 5 14:01:53 EDT 2014Downloaded/printed byLIZBETH SANDOVAL (JRE INGENIERIA Y SERVICIOS S.A.C.) pursuant to License Agreement. No further reproductions authorized.
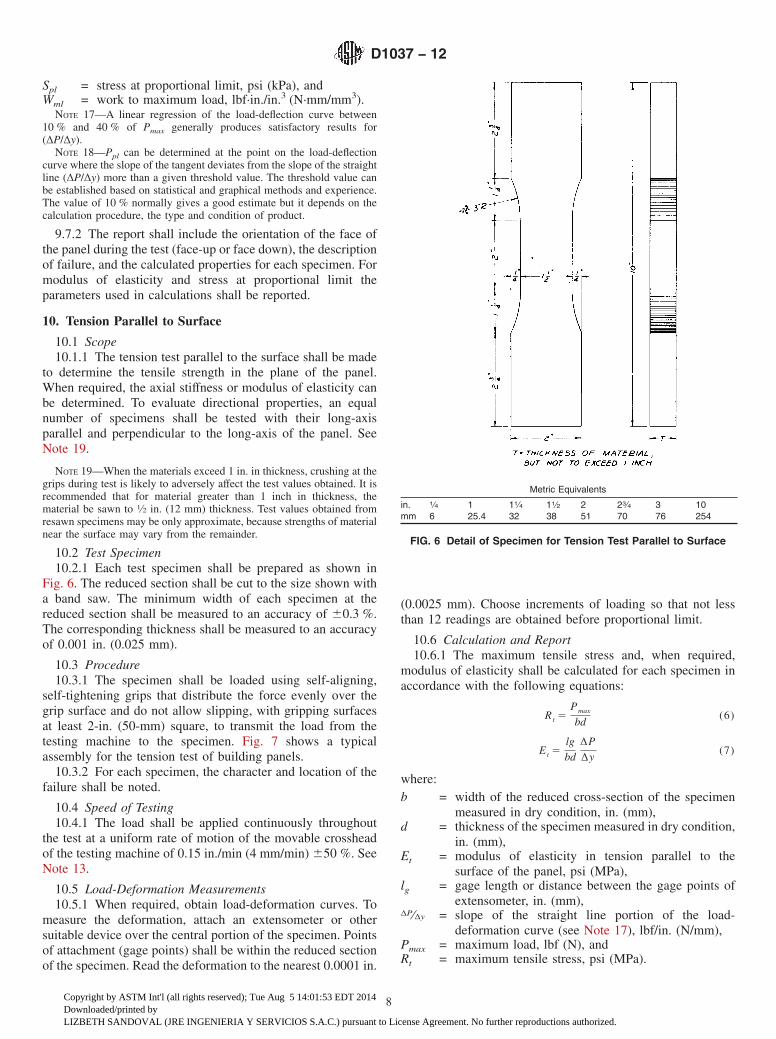
Spl = stress at proportional limit, psi (kPa), andWml = work to maximum load, lbf·in./in.3 (N·mm/mm3).
NOTE 17—A linear regression of the load-deflection curve between10 % and 40 % of Pmax generally produces satisfactory results for(∆P/∆y).
NOTE 18—Ppl can be determined at the point on the load-deflectioncurve where the slope of the tangent deviates from the slope of the straightline (∆P/∆y) more than a given threshold value. The threshold value canbe established based on statistical and graphical methods and experience.The value of 10 % normally gives a good estimate but it depends on thecalculation procedure, the type and condition of product.
9.7.2 The report shall include the orientation of the face ofthe panel during the test (face-up or face down), the descriptionof failure, and the calculated properties for each specimen. Formodulus of elasticity and stress at proportional limit theparameters used in calculations shall be reported.
10. Tension Parallel to Surface
10.1 Scope10.1.1 The tension test parallel to the surface shall be made
to determine the tensile strength in the plane of the panel.When required, the axial stiffness or modulus of elasticity canbe determined. To evaluate directional properties, an equalnumber of specimens shall be tested with their long-axisparallel and perpendicular to the long-axis of the panel. SeeNote 19.
NOTE 19—When the materials exceed 1 in. in thickness, crushing at thegrips during test is likely to adversely affect the test values obtained. It isrecommended that for material greater than 1 inch in thickness, thematerial be sawn to 1⁄2 in. (12 mm) thickness. Test values obtained fromresawn specimens may be only approximate, because strengths of materialnear the surface may vary from the remainder.
10.2 Test Specimen10.2.1 Each test specimen shall be prepared as shown in
Fig. 6. The reduced section shall be cut to the size shown witha band saw. The minimum width of each specimen at thereduced section shall be measured to an accuracy of 60.3 %.The corresponding thickness shall be measured to an accuracyof 0.001 in. (0.025 mm).
10.3 Procedure10.3.1 The specimen shall be loaded using self-aligning,
self-tightening grips that distribute the force evenly over thegrip surface and do not allow slipping, with gripping surfacesat least 2-in. (50-mm) square, to transmit the load from thetesting machine to the specimen. Fig. 7 shows a typicalassembly for the tension test of building panels.
10.3.2 For each specimen, the character and location of thefailure shall be noted.
10.4 Speed of Testing10.4.1 The load shall be applied continuously throughout
the test at a uniform rate of motion of the movable crossheadof the testing machine of 0.15 in./min (4 mm/min) 650 %. SeeNote 13.
10.5 Load-Deformation Measurements10.5.1 When required, obtain load-deformation curves. To
measure the deformation, attach an extensometer or othersuitable device over the central portion of the specimen. Pointsof attachment (gage points) shall be within the reduced sectionof the specimen. Read the deformation to the nearest 0.0001 in.
(0.0025 mm). Choose increments of loading so that not lessthan 12 readings are obtained before proportional limit.
10.6 Calculation and Report10.6.1 The maximum tensile stress and, when required,
modulus of elasticity shall be calculated for each specimen inaccordance with the following equations:
Rt 5Pmax
bd(6)
Et 5lgbd
∆P∆y
(7)
where:b = width of the reduced cross-section of the specimen
measured in dry condition, in. (mm),d = thickness of the specimen measured in dry condition,
in. (mm),Et = modulus of elasticity in tension parallel to the
surface of the panel, psi (MPa),lg = gage length or distance between the gage points of
extensometer, in. (mm),∆P⁄∆y = slope of the straight line portion of the load-
deformation curve (see Note 17), lbf/in. (N/mm),Pmax = maximum load, lbf (N), andRt = maximum tensile stress, psi (MPa).
Metric Equivalents
in. 1⁄4 1 11⁄4 11⁄2 2 23⁄4 3 10mm 6 25.4 32 38 51 70 76 254
FIG. 6 Detail of Specimen for Tension Test Parallel to Surface
D1037 − 12
8
Copyright by ASTM Int'l (all rights reserved); Tue Aug 5 14:01:53 EDT 2014Downloaded/printed byLIZBETH SANDOVAL (JRE INGENIERIA Y SERVICIOS S.A.C.) pursuant to License Agreement. No further reproductions authorized.
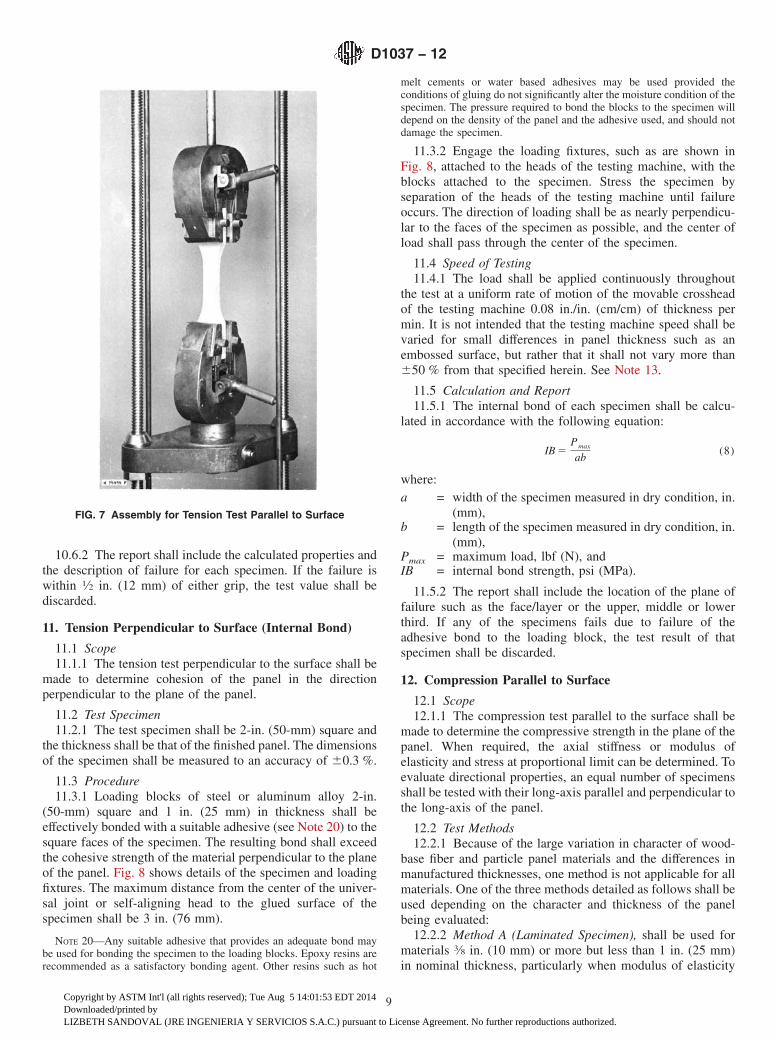
10.6.2 The report shall include the calculated properties andthe description of failure for each specimen. If the failure iswithin 1⁄2 in. (12 mm) of either grip, the test value shall bediscarded.
11. Tension Perpendicular to Surface (Internal Bond)
11.1 Scope11.1.1 The tension test perpendicular to the surface shall be
made to determine cohesion of the panel in the directionperpendicular to the plane of the panel.
11.2 Test Specimen11.2.1 The test specimen shall be 2-in. (50-mm) square and
the thickness shall be that of the finished panel. The dimensionsof the specimen shall be measured to an accuracy of 60.3 %.
11.3 Procedure11.3.1 Loading blocks of steel or aluminum alloy 2-in.
(50-mm) square and 1 in. (25 mm) in thickness shall beeffectively bonded with a suitable adhesive (see Note 20) to thesquare faces of the specimen. The resulting bond shall exceedthe cohesive strength of the material perpendicular to the planeof the panel. Fig. 8 shows details of the specimen and loadingfixtures. The maximum distance from the center of the univer-sal joint or self-aligning head to the glued surface of thespecimen shall be 3 in. (76 mm).
NOTE 20—Any suitable adhesive that provides an adequate bond maybe used for bonding the specimen to the loading blocks. Epoxy resins arerecommended as a satisfactory bonding agent. Other resins such as hot
melt cements or water based adhesives may be used provided theconditions of gluing do not significantly alter the moisture condition of thespecimen. The pressure required to bond the blocks to the specimen willdepend on the density of the panel and the adhesive used, and should notdamage the specimen.
11.3.2 Engage the loading fixtures, such as are shown inFig. 8, attached to the heads of the testing machine, with theblocks attached to the specimen. Stress the specimen byseparation of the heads of the testing machine until failureoccurs. The direction of loading shall be as nearly perpendicu-lar to the faces of the specimen as possible, and the center ofload shall pass through the center of the specimen.
11.4 Speed of Testing11.4.1 The load shall be applied continuously throughout
the test at a uniform rate of motion of the movable crossheadof the testing machine 0.08 in./in. (cm/cm) of thickness permin. It is not intended that the testing machine speed shall bevaried for small differences in panel thickness such as anembossed surface, but rather that it shall not vary more than650 % from that specified herein. See Note 13.
11.5 Calculation and Report11.5.1 The internal bond of each specimen shall be calcu-
lated in accordance with the following equation:
IB 5Pmax
ab(8)
where:a = width of the specimen measured in dry condition, in.
(mm),b = length of the specimen measured in dry condition, in.
(mm),Pmax = maximum load, lbf (N), andIB = internal bond strength, psi (MPa).
11.5.2 The report shall include the location of the plane offailure such as the face/layer or the upper, middle or lowerthird. If any of the specimens fails due to failure of theadhesive bond to the loading block, the test result of thatspecimen shall be discarded.
12. Compression Parallel to Surface
12.1 Scope12.1.1 The compression test parallel to the surface shall be
made to determine the compressive strength in the plane of thepanel. When required, the axial stiffness or modulus ofelasticity and stress at proportional limit can be determined. Toevaluate directional properties, an equal number of specimensshall be tested with their long-axis parallel and perpendicular tothe long-axis of the panel.
12.2 Test Methods12.2.1 Because of the large variation in character of wood-
base fiber and particle panel materials and the differences inmanufactured thicknesses, one method is not applicable for allmaterials. One of the three methods detailed as follows shall beused depending on the character and thickness of the panelbeing evaluated:
12.2.2 Method A (Laminated Specimen), shall be used formaterials 3⁄8 in. (10 mm) or more but less than 1 in. (25 mm)in nominal thickness, particularly when modulus of elasticity
FIG. 7 Assembly for Tension Test Parallel to Surface
D1037 − 12
9
Copyright by ASTM Int'l (all rights reserved); Tue Aug 5 14:01:53 EDT 2014Downloaded/printed byLIZBETH SANDOVAL (JRE INGENIERIA Y SERVICIOS S.A.C.) pursuant to License Agreement. No further reproductions authorized.
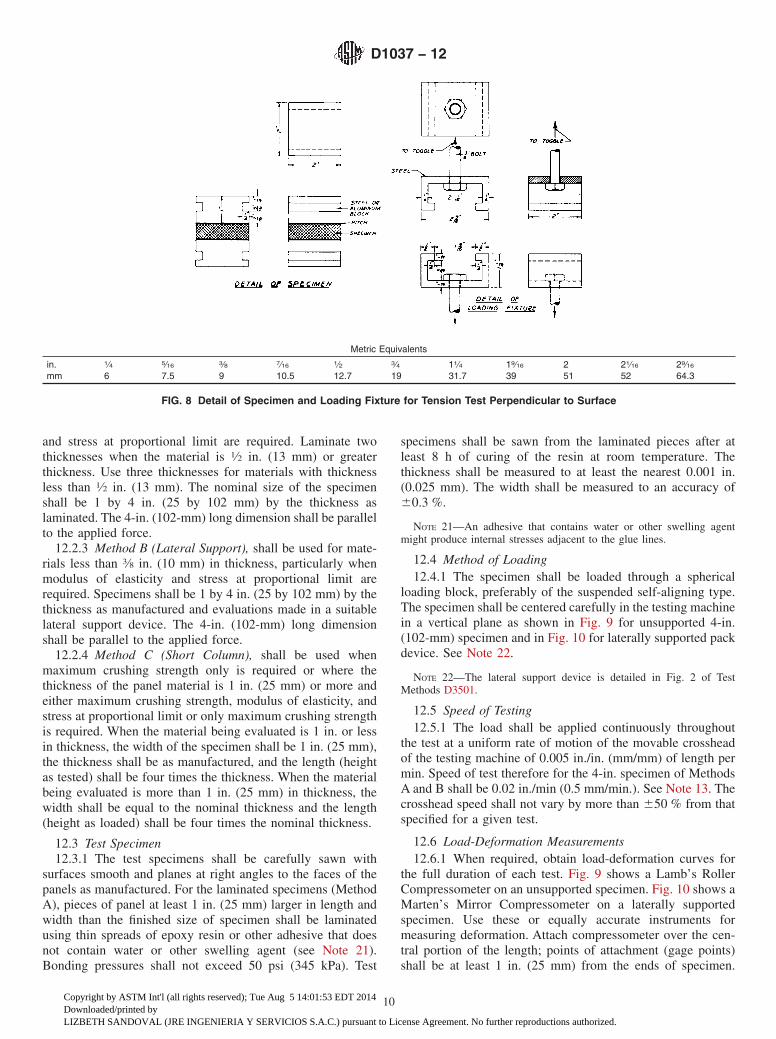
and stress at proportional limit are required. Laminate twothicknesses when the material is 1⁄2 in. (13 mm) or greaterthickness. Use three thicknesses for materials with thicknessless than 1⁄2 in. (13 mm). The nominal size of the specimenshall be 1 by 4 in. (25 by 102 mm) by the thickness aslaminated. The 4-in. (102-mm) long dimension shall be parallelto the applied force.
12.2.3 Method B (Lateral Support), shall be used for mate-rials less than 3⁄8 in. (10 mm) in thickness, particularly whenmodulus of elasticity and stress at proportional limit arerequired. Specimens shall be 1 by 4 in. (25 by 102 mm) by thethickness as manufactured and evaluations made in a suitablelateral support device. The 4-in. (102-mm) long dimensionshall be parallel to the applied force.
12.2.4 Method C (Short Column), shall be used whenmaximum crushing strength only is required or where thethickness of the panel material is 1 in. (25 mm) or more andeither maximum crushing strength, modulus of elasticity, andstress at proportional limit or only maximum crushing strengthis required. When the material being evaluated is 1 in. or lessin thickness, the width of the specimen shall be 1 in. (25 mm),the thickness shall be as manufactured, and the length (heightas tested) shall be four times the thickness. When the materialbeing evaluated is more than 1 in. (25 mm) in thickness, thewidth shall be equal to the nominal thickness and the length(height as loaded) shall be four times the nominal thickness.
12.3 Test Specimen12.3.1 The test specimens shall be carefully sawn with
surfaces smooth and planes at right angles to the faces of thepanels as manufactured. For the laminated specimens (MethodA), pieces of panel at least 1 in. (25 mm) larger in length andwidth than the finished size of specimen shall be laminatedusing thin spreads of epoxy resin or other adhesive that doesnot contain water or other swelling agent (see Note 21).Bonding pressures shall not exceed 50 psi (345 kPa). Test
specimens shall be sawn from the laminated pieces after atleast 8 h of curing of the resin at room temperature. Thethickness shall be measured to at least the nearest 0.001 in.(0.025 mm). The width shall be measured to an accuracy of60.3 %.
NOTE 21—An adhesive that contains water or other swelling agentmight produce internal stresses adjacent to the glue lines.
12.4 Method of Loading12.4.1 The specimen shall be loaded through a spherical
loading block, preferably of the suspended self-aligning type.The specimen shall be centered carefully in the testing machinein a vertical plane as shown in Fig. 9 for unsupported 4-in.(102-mm) specimen and in Fig. 10 for laterally supported packdevice. See Note 22.
NOTE 22—The lateral support device is detailed in Fig. 2 of TestMethods D3501.
12.5 Speed of Testing12.5.1 The load shall be applied continuously throughout
the test at a uniform rate of motion of the movable crossheadof the testing machine of 0.005 in./in. (mm/mm) of length permin. Speed of test therefore for the 4-in. specimen of MethodsA and B shall be 0.02 in./min (0.5 mm/min.). See Note 13. Thecrosshead speed shall not vary by more than 650 % from thatspecified for a given test.
12.6 Load-Deformation Measurements12.6.1 When required, obtain load-deformation curves for
the full duration of each test. Fig. 9 shows a Lamb’s RollerCompressometer on an unsupported specimen. Fig. 10 shows aMarten’s Mirror Compressometer on a laterally supportedspecimen. Use these or equally accurate instruments formeasuring deformation. Attach compressometer over the cen-tral portion of the length; points of attachment (gage points)shall be at least 1 in. (25 mm) from the ends of specimen.
Metric Equivalents
in. 1⁄4 5⁄16 3⁄8 7⁄16 1⁄2 3⁄4 11⁄4 19⁄16 2 21⁄16 29⁄16
mm 6 7.5 9 10.5 12.7 19 31.7 39 51 52 64.3
FIG. 8 Detail of Specimen and Loading Fixture for Tension Test Perpendicular to Surface
D1037 − 12
10
Copyright by ASTM Int'l (all rights reserved); Tue Aug 5 14:01:53 EDT 2014Downloaded/printed byLIZBETH SANDOVAL (JRE INGENIERIA Y SERVICIOS S.A.C.) pursuant to License Agreement. No further reproductions authorized.
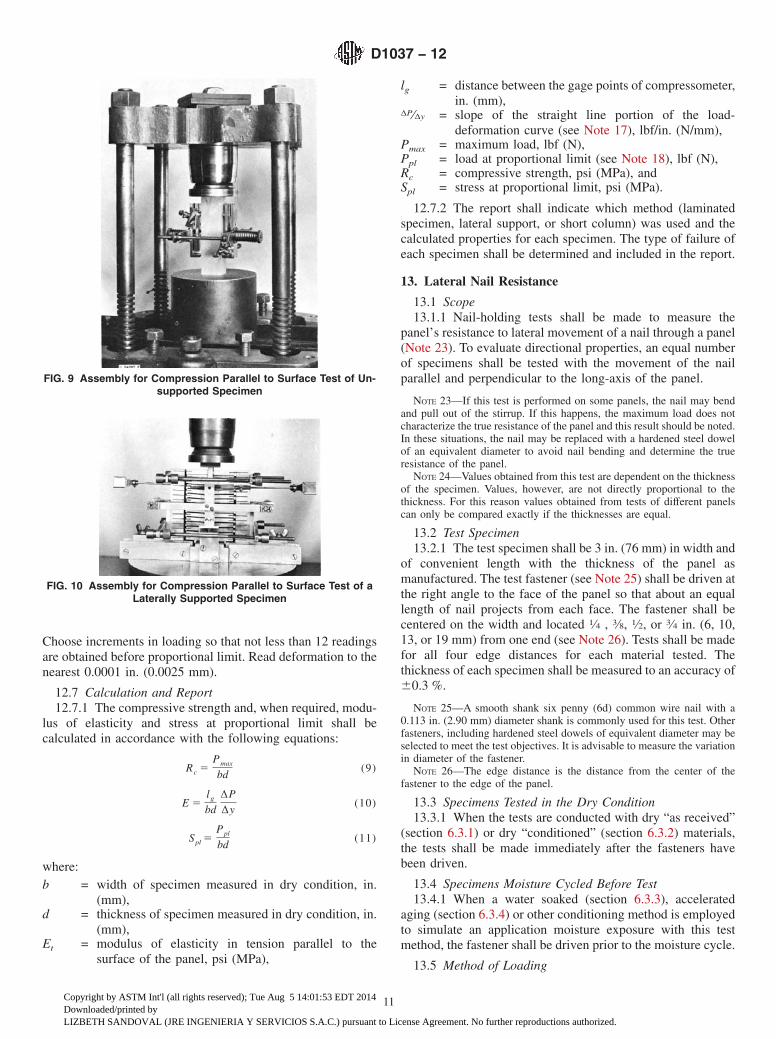
Choose increments in loading so that not less than 12 readingsare obtained before proportional limit. Read deformation to thenearest 0.0001 in. (0.0025 mm).
12.7 Calculation and Report12.7.1 The compressive strength and, when required, modu-
lus of elasticity and stress at proportional limit shall becalculated in accordance with the following equations:
Rc 5Pmax
bd(9)
E 5lg
bd∆P∆y
(10)
Spl 5Ppl
bd(11)
where:b = width of specimen measured in dry condition, in.
(mm),d = thickness of specimen measured in dry condition, in.
(mm),Et = modulus of elasticity in tension parallel to the
surface of the panel, psi (MPa),
lg = distance between the gage points of compressometer,in. (mm),
∆P⁄∆y = slope of the straight line portion of the load-deformation curve (see Note 17), lbf/in. (N/mm),
Pmax = maximum load, lbf (N),Ppl = load at proportional limit (see Note 18), lbf (N),Rc = compressive strength, psi (MPa), andSpl = stress at proportional limit, psi (MPa).
12.7.2 The report shall indicate which method (laminatedspecimen, lateral support, or short column) was used and thecalculated properties for each specimen. The type of failure ofeach specimen shall be determined and included in the report.
13. Lateral Nail Resistance
13.1 Scope13.1.1 Nail-holding tests shall be made to measure the
panel’s resistance to lateral movement of a nail through a panel(Note 23). To evaluate directional properties, an equal numberof specimens shall be tested with the movement of the nailparallel and perpendicular to the long-axis of the panel.
NOTE 23—If this test is performed on some panels, the nail may bendand pull out of the stirrup. If this happens, the maximum load does notcharacterize the true resistance of the panel and this result should be noted.In these situations, the nail may be replaced with a hardened steel dowelof an equivalent diameter to avoid nail bending and determine the trueresistance of the panel.
NOTE 24—Values obtained from this test are dependent on the thicknessof the specimen. Values, however, are not directly proportional to thethickness. For this reason values obtained from tests of different panelscan only be compared exactly if the thicknesses are equal.
13.2 Test Specimen13.2.1 The test specimen shall be 3 in. (76 mm) in width and
of convenient length with the thickness of the panel asmanufactured. The test fastener (see Note 25) shall be driven atthe right angle to the face of the panel so that about an equallength of nail projects from each face. The fastener shall becentered on the width and located 1⁄4 , 3⁄8, 1⁄2, or 3⁄4 in. (6, 10,13, or 19 mm) from one end (see Note 26). Tests shall be madefor all four edge distances for each material tested. Thethickness of each specimen shall be measured to an accuracy of60.3 %.
NOTE 25—A smooth shank six penny (6d) common wire nail with a0.113 in. (2.90 mm) diameter shank is commonly used for this test. Otherfasteners, including hardened steel dowels of equivalent diameter may beselected to meet the test objectives. It is advisable to measure the variationin diameter of the fastener.
NOTE 26—The edge distance is the distance from the center of thefastener to the edge of the panel.
13.3 Specimens Tested in the Dry Condition13.3.1 When the tests are conducted with dry “as received”
(section 6.3.1) or dry “conditioned” (section 6.3.2) materials,the tests shall be made immediately after the fasteners havebeen driven.
13.4 Specimens Moisture Cycled Before Test13.4.1 When a water soaked (section 6.3.3), accelerated
aging (section 6.3.4) or other conditioning method is employedto simulate an application moisture exposure with this testmethod, the fastener shall be driven prior to the moisture cycle.
13.5 Method of Loading
FIG. 9 Assembly for Compression Parallel to Surface Test of Un-supported Specimen
FIG. 10 Assembly for Compression Parallel to Surface Test of aLaterally Supported Specimen
D1037 − 12
11
Copyright by ASTM Int'l (all rights reserved); Tue Aug 5 14:01:53 EDT 2014Downloaded/printed byLIZBETH SANDOVAL (JRE INGENIERIA Y SERVICIOS S.A.C.) pursuant to License Agreement. No further reproductions authorized.
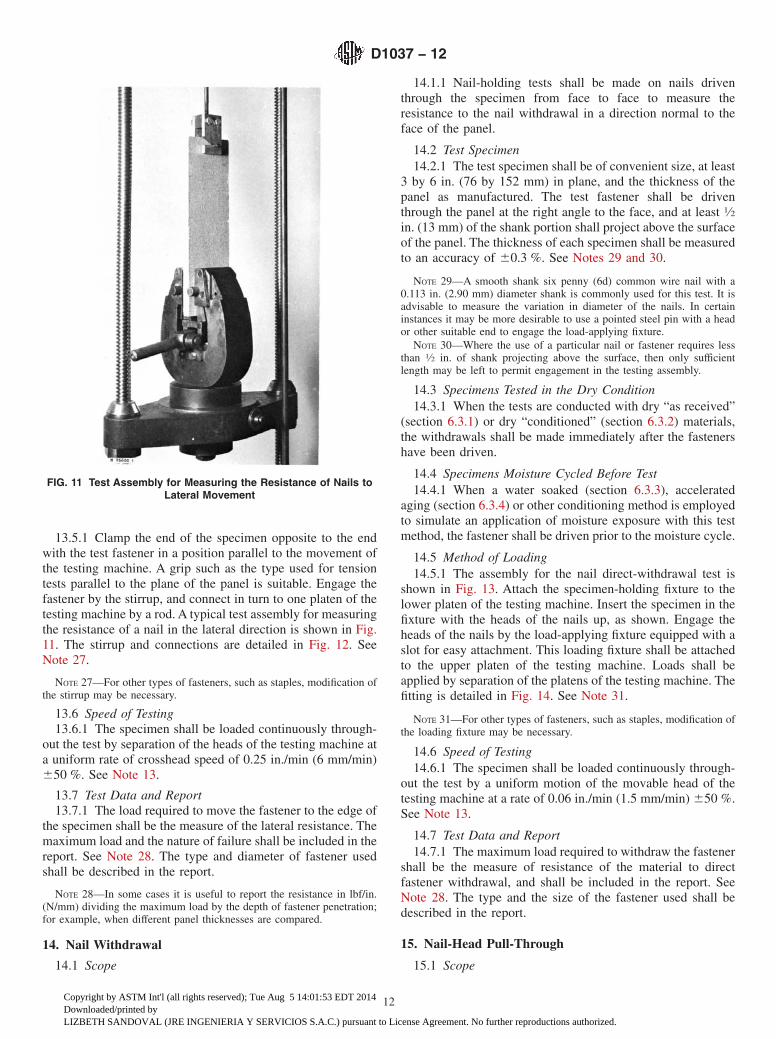
13.5.1 Clamp the end of the specimen opposite to the endwith the test fastener in a position parallel to the movement ofthe testing machine. A grip such as the type used for tensiontests parallel to the plane of the panel is suitable. Engage thefastener by the stirrup, and connect in turn to one platen of thetesting machine by a rod. A typical test assembly for measuringthe resistance of a nail in the lateral direction is shown in Fig.11. The stirrup and connections are detailed in Fig. 12. SeeNote 27.
NOTE 27—For other types of fasteners, such as staples, modification ofthe stirrup may be necessary.
13.6 Speed of Testing13.6.1 The specimen shall be loaded continuously through-
out the test by separation of the heads of the testing machine ata uniform rate of crosshead speed of 0.25 in./min (6 mm/min)650 %. See Note 13.
13.7 Test Data and Report13.7.1 The load required to move the fastener to the edge of
the specimen shall be the measure of the lateral resistance. Themaximum load and the nature of failure shall be included in thereport. See Note 28. The type and diameter of fastener usedshall be described in the report.
NOTE 28—In some cases it is useful to report the resistance in lbf/in.(N/mm) dividing the maximum load by the depth of fastener penetration;for example, when different panel thicknesses are compared.
14. Nail Withdrawal
14.1 Scope
14.1.1 Nail-holding tests shall be made on nails driventhrough the specimen from face to face to measure theresistance to the nail withdrawal in a direction normal to theface of the panel.
14.2 Test Specimen14.2.1 The test specimen shall be of convenient size, at least
3 by 6 in. (76 by 152 mm) in plane, and the thickness of thepanel as manufactured. The test fastener shall be driventhrough the panel at the right angle to the face, and at least 1⁄2in. (13 mm) of the shank portion shall project above the surfaceof the panel. The thickness of each specimen shall be measuredto an accuracy of 60.3 %. See Notes 29 and 30.
NOTE 29—A smooth shank six penny (6d) common wire nail with a0.113 in. (2.90 mm) diameter shank is commonly used for this test. It isadvisable to measure the variation in diameter of the nails. In certaininstances it may be more desirable to use a pointed steel pin with a heador other suitable end to engage the load-applying fixture.
NOTE 30—Where the use of a particular nail or fastener requires lessthan 1⁄2 in. of shank projecting above the surface, then only sufficientlength may be left to permit engagement in the testing assembly.
14.3 Specimens Tested in the Dry Condition14.3.1 When the tests are conducted with dry “as received”
(section 6.3.1) or dry “conditioned” (section 6.3.2) materials,the withdrawals shall be made immediately after the fastenershave been driven.
14.4 Specimens Moisture Cycled Before Test14.4.1 When a water soaked (section 6.3.3), accelerated
aging (section 6.3.4) or other conditioning method is employedto simulate an application of moisture exposure with this testmethod, the fastener shall be driven prior to the moisture cycle.
14.5 Method of Loading14.5.1 The assembly for the nail direct-withdrawal test is
shown in Fig. 13. Attach the specimen-holding fixture to thelower platen of the testing machine. Insert the specimen in thefixture with the heads of the nails up, as shown. Engage theheads of the nails by the load-applying fixture equipped with aslot for easy attachment. This loading fixture shall be attachedto the upper platen of the testing machine. Loads shall beapplied by separation of the platens of the testing machine. Thefitting is detailed in Fig. 14. See Note 31.
NOTE 31—For other types of fasteners, such as staples, modification ofthe loading fixture may be necessary.
14.6 Speed of Testing14.6.1 The specimen shall be loaded continuously through-
out the test by a uniform motion of the movable head of thetesting machine at a rate of 0.06 in./min (1.5 mm/min) 650 %.See Note 13.
14.7 Test Data and Report14.7.1 The maximum load required to withdraw the fastener
shall be the measure of resistance of the material to directfastener withdrawal, and shall be included in the report. SeeNote 28. The type and the size of the fastener used shall bedescribed in the report.
15. Nail-Head Pull-Through
15.1 Scope
FIG. 11 Test Assembly for Measuring the Resistance of Nails toLateral Movement
D1037 − 12
12
Copyright by ASTM Int'l (all rights reserved); Tue Aug 5 14:01:53 EDT 2014Downloaded/printed byLIZBETH SANDOVAL (JRE INGENIERIA Y SERVICIOS S.A.C.) pursuant to License Agreement. No further reproductions authorized.
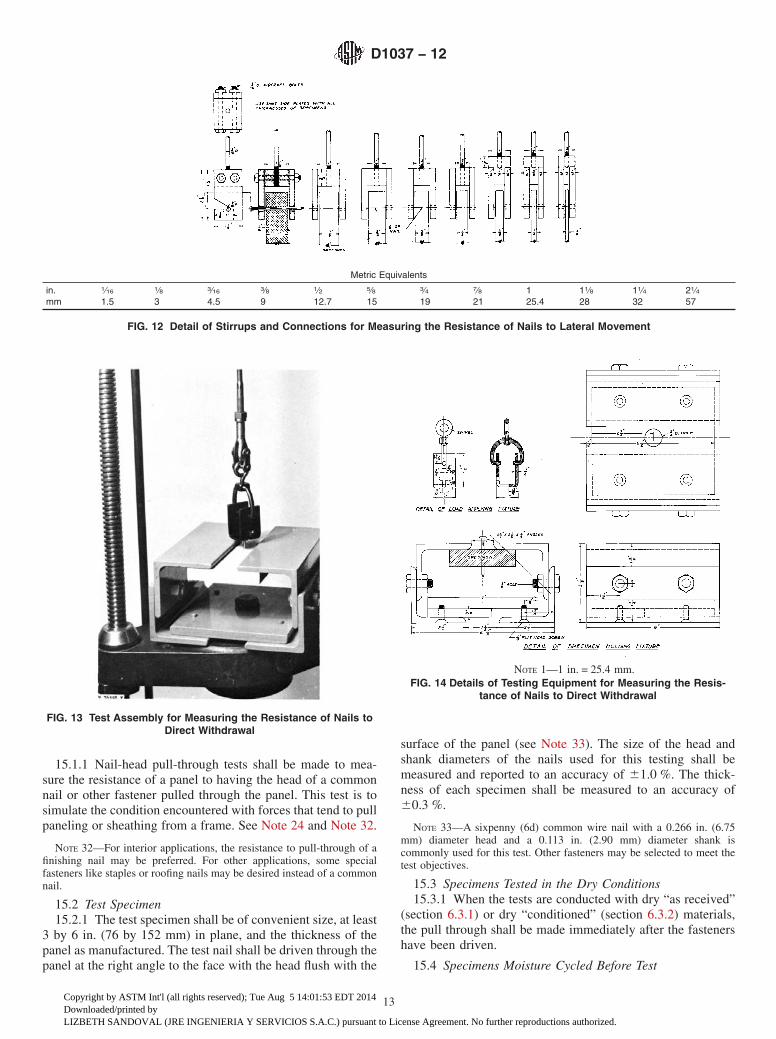
15.1.1 Nail-head pull-through tests shall be made to mea-sure the resistance of a panel to having the head of a commonnail or other fastener pulled through the panel. This test is tosimulate the condition encountered with forces that tend to pullpaneling or sheathing from a frame. See Note 24 and Note 32.
NOTE 32—For interior applications, the resistance to pull-through of afinishing nail may be preferred. For other applications, some specialfasteners like staples or roofing nails may be desired instead of a commonnail.
15.2 Test Specimen15.2.1 The test specimen shall be of convenient size, at least
3 by 6 in. (76 by 152 mm) in plane, and the thickness of thepanel as manufactured. The test nail shall be driven through thepanel at the right angle to the face with the head flush with the
surface of the panel (see Note 33). The size of the head andshank diameters of the nails used for this testing shall bemeasured and reported to an accuracy of 61.0 %. The thick-ness of each specimen shall be measured to an accuracy of60.3 %.
NOTE 33—A sixpenny (6d) common wire nail with a 0.266 in. (6.75mm) diameter head and a 0.113 in. (2.90 mm) diameter shank iscommonly used for this test. Other fasteners may be selected to meet thetest objectives.
15.3 Specimens Tested in the Dry Conditions15.3.1 When the tests are conducted with dry “as received”
(section 6.3.1) or dry “conditioned” (section 6.3.2) materials,the pull through shall be made immediately after the fastenershave been driven.
15.4 Specimens Moisture Cycled Before Test
Metric Equivalents
in. 1⁄16 1⁄8 3⁄16 3⁄8 1⁄2 5⁄8 3⁄4 7⁄8 1 11⁄8 11⁄4 21⁄4mm 1.5 3 4.5 9 12.7 15 19 21 25.4 28 32 57
FIG. 12 Detail of Stirrups and Connections for Measuring the Resistance of Nails to Lateral Movement
FIG. 13 Test Assembly for Measuring the Resistance of Nails toDirect Withdrawal
NOTE 1—1 in. = 25.4 mm.FIG. 14 Details of Testing Equipment for Measuring the Resis-
tance of Nails to Direct Withdrawal
D1037 − 12
13
Copyright by ASTM Int'l (all rights reserved); Tue Aug 5 14:01:53 EDT 2014Downloaded/printed byLIZBETH SANDOVAL (JRE INGENIERIA Y SERVICIOS S.A.C.) pursuant to License Agreement. No further reproductions authorized.
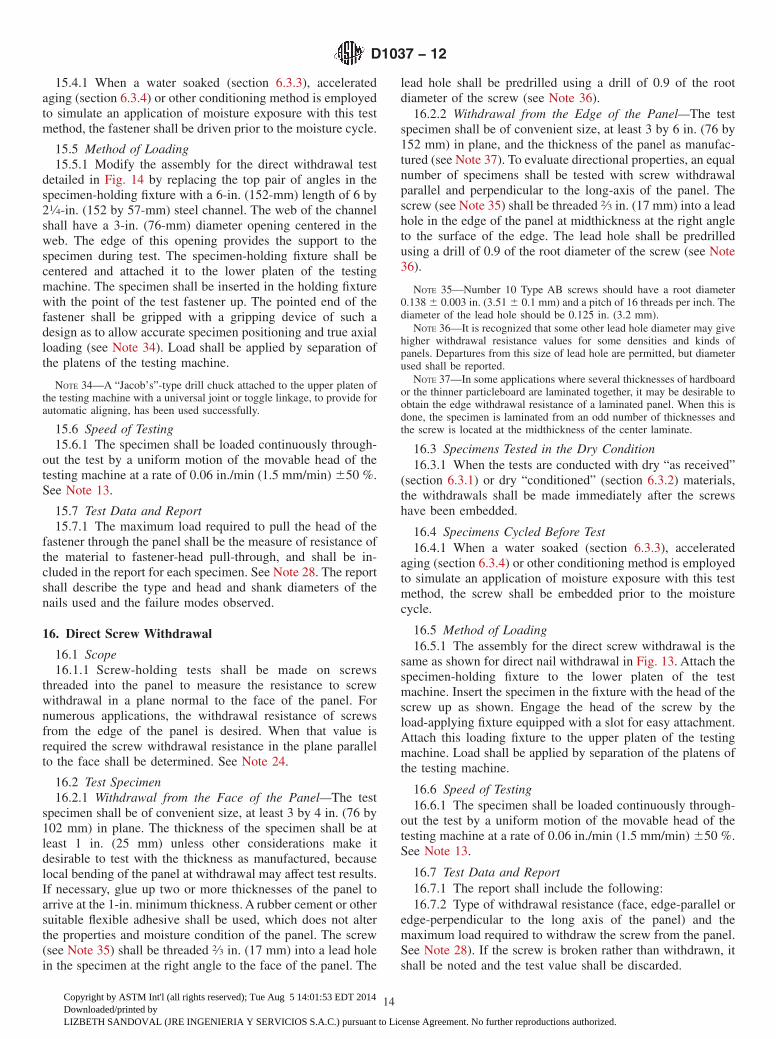
15.4.1 When a water soaked (section 6.3.3), acceleratedaging (section 6.3.4) or other conditioning method is employedto simulate an application of moisture exposure with this testmethod, the fastener shall be driven prior to the moisture cycle.
15.5 Method of Loading15.5.1 Modify the assembly for the direct withdrawal test
detailed in Fig. 14 by replacing the top pair of angles in thespecimen-holding fixture with a 6-in. (152-mm) length of 6 by21⁄4-in. (152 by 57-mm) steel channel. The web of the channelshall have a 3-in. (76-mm) diameter opening centered in theweb. The edge of this opening provides the support to thespecimen during test. The specimen-holding fixture shall becentered and attached it to the lower platen of the testingmachine. The specimen shall be inserted in the holding fixturewith the point of the test fastener up. The pointed end of thefastener shall be gripped with a gripping device of such adesign as to allow accurate specimen positioning and true axialloading (see Note 34). Load shall be applied by separation ofthe platens of the testing machine.
NOTE 34—A “Jacob’s”-type drill chuck attached to the upper platen ofthe testing machine with a universal joint or toggle linkage, to provide forautomatic aligning, has been used successfully.
15.6 Speed of Testing15.6.1 The specimen shall be loaded continuously through-
out the test by a uniform motion of the movable head of thetesting machine at a rate of 0.06 in./min (1.5 mm/min) 650 %.See Note 13.
15.7 Test Data and Report15.7.1 The maximum load required to pull the head of the
fastener through the panel shall be the measure of resistance ofthe material to fastener-head pull-through, and shall be in-cluded in the report for each specimen. See Note 28. The reportshall describe the type and head and shank diameters of thenails used and the failure modes observed.
16. Direct Screw Withdrawal
16.1 Scope16.1.1 Screw-holding tests shall be made on screws
threaded into the panel to measure the resistance to screwwithdrawal in a plane normal to the face of the panel. Fornumerous applications, the withdrawal resistance of screwsfrom the edge of the panel is desired. When that value isrequired the screw withdrawal resistance in the plane parallelto the face shall be determined. See Note 24.
16.2 Test Specimen16.2.1 Withdrawal from the Face of the Panel—The test
specimen shall be of convenient size, at least 3 by 4 in. (76 by102 mm) in plane. The thickness of the specimen shall be atleast 1 in. (25 mm) unless other considerations make itdesirable to test with the thickness as manufactured, becauselocal bending of the panel at withdrawal may affect test results.If necessary, glue up two or more thicknesses of the panel toarrive at the 1-in. minimum thickness. A rubber cement or othersuitable flexible adhesive shall be used, which does not alterthe properties and moisture condition of the panel. The screw(see Note 35) shall be threaded 2⁄3 in. (17 mm) into a lead holein the specimen at the right angle to the face of the panel. The
lead hole shall be predrilled using a drill of 0.9 of the rootdiameter of the screw (see Note 36).
16.2.2 Withdrawal from the Edge of the Panel—The testspecimen shall be of convenient size, at least 3 by 6 in. (76 by152 mm) in plane, and the thickness of the panel as manufac-tured (see Note 37). To evaluate directional properties, an equalnumber of specimens shall be tested with screw withdrawalparallel and perpendicular to the long-axis of the panel. Thescrew (see Note 35) shall be threaded 2⁄3 in. (17 mm) into a leadhole in the edge of the panel at midthickness at the right angleto the surface of the edge. The lead hole shall be predrilledusing a drill of 0.9 of the root diameter of the screw (see Note36).
NOTE 35—Number 10 Type AB screws should have a root diameter0.138 6 0.003 in. (3.51 6 0.1 mm) and a pitch of 16 threads per inch. Thediameter of the lead hole should be 0.125 in. (3.2 mm).
NOTE 36—It is recognized that some other lead hole diameter may givehigher withdrawal resistance values for some densities and kinds ofpanels. Departures from this size of lead hole are permitted, but diameterused shall be reported.
NOTE 37—In some applications where several thicknesses of hardboardor the thinner particleboard are laminated together, it may be desirable toobtain the edge withdrawal resistance of a laminated panel. When this isdone, the specimen is laminated from an odd number of thicknesses andthe screw is located at the midthickness of the center laminate.
16.3 Specimens Tested in the Dry Condition16.3.1 When the tests are conducted with dry “as received”
(section 6.3.1) or dry “conditioned” (section 6.3.2) materials,the withdrawals shall be made immediately after the screwshave been embedded.
16.4 Specimens Cycled Before Test16.4.1 When a water soaked (section 6.3.3), accelerated
aging (section 6.3.4) or other conditioning method is employedto simulate an application of moisture exposure with this testmethod, the screw shall be embedded prior to the moisturecycle.
16.5 Method of Loading16.5.1 The assembly for the direct screw withdrawal is the
same as shown for direct nail withdrawal in Fig. 13. Attach thespecimen-holding fixture to the lower platen of the testmachine. Insert the specimen in the fixture with the head of thescrew up as shown. Engage the head of the screw by theload-applying fixture equipped with a slot for easy attachment.Attach this loading fixture to the upper platen of the testingmachine. Load shall be applied by separation of the platens ofthe testing machine.
16.6 Speed of Testing16.6.1 The specimen shall be loaded continuously through-
out the test by a uniform motion of the movable head of thetesting machine at a rate of 0.06 in./min (1.5 mm/min) 650 %.See Note 13.
16.7 Test Data and Report16.7.1 The report shall include the following:16.7.2 Type of withdrawal resistance (face, edge-parallel or
edge-perpendicular to the long axis of the panel) and themaximum load required to withdraw the screw from the panel.See Note 28). If the screw is broken rather than withdrawn, itshall be noted and the test value shall be discarded.
D1037 − 12
14
Copyright by ASTM Int'l (all rights reserved); Tue Aug 5 14:01:53 EDT 2014Downloaded/printed byLIZBETH SANDOVAL (JRE INGENIERIA Y SERVICIOS S.A.C.) pursuant to License Agreement. No further reproductions authorized.
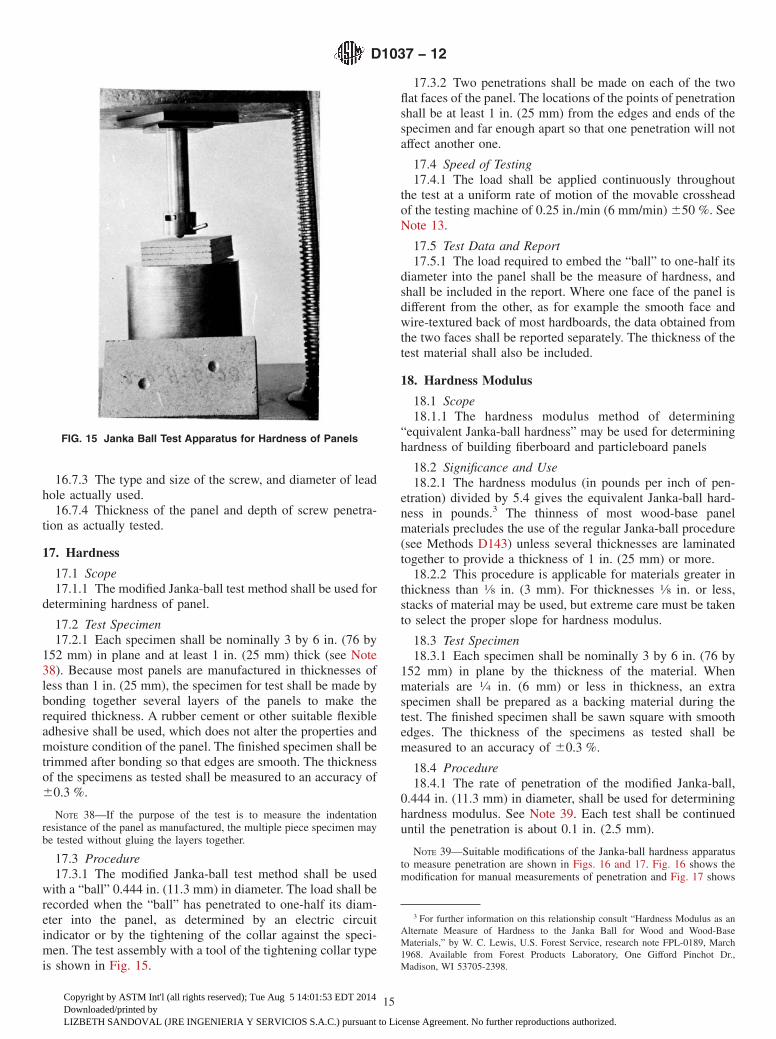
16.7.3 The type and size of the screw, and diameter of leadhole actually used.
16.7.4 Thickness of the panel and depth of screw penetra-tion as actually tested.
17. Hardness
17.1 Scope17.1.1 The modified Janka-ball test method shall be used for
determining hardness of panel.
17.2 Test Specimen17.2.1 Each specimen shall be nominally 3 by 6 in. (76 by
152 mm) in plane and at least 1 in. (25 mm) thick (see Note38). Because most panels are manufactured in thicknesses ofless than 1 in. (25 mm), the specimen for test shall be made bybonding together several layers of the panels to make therequired thickness. A rubber cement or other suitable flexibleadhesive shall be used, which does not alter the properties andmoisture condition of the panel. The finished specimen shall betrimmed after bonding so that edges are smooth. The thicknessof the specimens as tested shall be measured to an accuracy of60.3 %.
NOTE 38—If the purpose of the test is to measure the indentationresistance of the panel as manufactured, the multiple piece specimen maybe tested without gluing the layers together.
17.3 Procedure17.3.1 The modified Janka-ball test method shall be used
with a “ball” 0.444 in. (11.3 mm) in diameter. The load shall berecorded when the “ball” has penetrated to one-half its diam-eter into the panel, as determined by an electric circuitindicator or by the tightening of the collar against the speci-men. The test assembly with a tool of the tightening collar typeis shown in Fig. 15.
17.3.2 Two penetrations shall be made on each of the twoflat faces of the panel. The locations of the points of penetrationshall be at least 1 in. (25 mm) from the edges and ends of thespecimen and far enough apart so that one penetration will notaffect another one.
17.4 Speed of Testing17.4.1 The load shall be applied continuously throughout
the test at a uniform rate of motion of the movable crossheadof the testing machine of 0.25 in./min (6 mm/min) 650 %. SeeNote 13.
17.5 Test Data and Report17.5.1 The load required to embed the “ball” to one-half its
diameter into the panel shall be the measure of hardness, andshall be included in the report. Where one face of the panel isdifferent from the other, as for example the smooth face andwire-textured back of most hardboards, the data obtained fromthe two faces shall be reported separately. The thickness of thetest material shall also be included.
18. Hardness Modulus
18.1 Scope18.1.1 The hardness modulus method of determining
“equivalent Janka-ball hardness” may be used for determininghardness of building fiberboard and particleboard panels
18.2 Significance and Use18.2.1 The hardness modulus (in pounds per inch of pen-
etration) divided by 5.4 gives the equivalent Janka-ball hard-ness in pounds.3 The thinness of most wood-base panelmaterials precludes the use of the regular Janka-ball procedure(see Methods D143) unless several thicknesses are laminatedtogether to provide a thickness of 1 in. (25 mm) or more.
18.2.2 This procedure is applicable for materials greater inthickness than 1⁄8 in. (3 mm). For thicknesses 1⁄8 in. or less,stacks of material may be used, but extreme care must be takento select the proper slope for hardness modulus.
18.3 Test Specimen18.3.1 Each specimen shall be nominally 3 by 6 in. (76 by
152 mm) in plane by the thickness of the material. Whenmaterials are 1⁄4 in. (6 mm) or less in thickness, an extraspecimen shall be prepared as a backing material during thetest. The finished specimen shall be sawn square with smoothedges. The thickness of the specimens as tested shall bemeasured to an accuracy of 60.3 %.
18.4 Procedure18.4.1 The rate of penetration of the modified Janka-ball,
0.444 in. (11.3 mm) in diameter, shall be used for determininghardness modulus. See Note 39. Each test shall be continueduntil the penetration is about 0.1 in. (2.5 mm).
NOTE 39—Suitable modifications of the Janka-ball hardness apparatusto measure penetration are shown in Figs. 16 and 17. Fig. 16 shows themodification for manual measurements of penetration and Fig. 17 shows
3 For further information on this relationship consult “Hardness Modulus as anAlternate Measure of Hardness to the Janka Ball for Wood and Wood-BaseMaterials,” by W. C. Lewis, U.S. Forest Service, research note FPL-0189, March1968. Available from Forest Products Laboratory, One Gifford Pinchot Dr.,Madison, WI 53705-2398.
FIG. 15 Janka Ball Test Apparatus for Hardness of Panels
D1037 − 12
15
Copyright by ASTM Int'l (all rights reserved); Tue Aug 5 14:01:53 EDT 2014Downloaded/printed byLIZBETH SANDOVAL (JRE INGENIERIA Y SERVICIOS S.A.C.) pursuant to License Agreement. No further reproductions authorized.
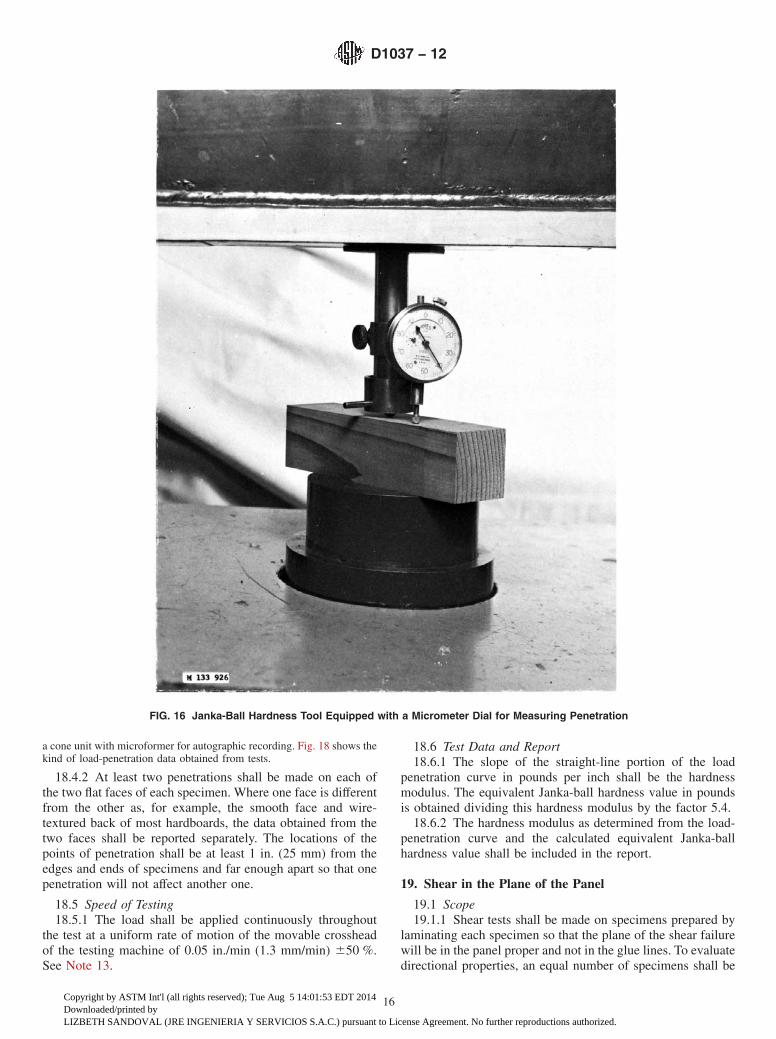
a cone unit with microformer for autographic recording. Fig. 18 shows thekind of load-penetration data obtained from tests.
18.4.2 At least two penetrations shall be made on each ofthe two flat faces of each specimen. Where one face is differentfrom the other as, for example, the smooth face and wire-textured back of most hardboards, the data obtained from thetwo faces shall be reported separately. The locations of thepoints of penetration shall be at least 1 in. (25 mm) from theedges and ends of specimens and far enough apart so that onepenetration will not affect another one.
18.5 Speed of Testing18.5.1 The load shall be applied continuously throughout
the test at a uniform rate of motion of the movable crossheadof the testing machine of 0.05 in./min (1.3 mm/min) 650 %.See Note 13.
18.6 Test Data and Report18.6.1 The slope of the straight-line portion of the load
penetration curve in pounds per inch shall be the hardnessmodulus. The equivalent Janka-ball hardness value in poundsis obtained dividing this hardness modulus by the factor 5.4.
18.6.2 The hardness modulus as determined from the load-penetration curve and the calculated equivalent Janka-ballhardness value shall be included in the report.
19. Shear in the Plane of the Panel
19.1 Scope19.1.1 Shear tests shall be made on specimens prepared by
laminating each specimen so that the plane of the shear failurewill be in the panel proper and not in the glue lines. To evaluatedirectional properties, an equal number of specimens shall be
FIG. 16 Janka-Ball Hardness Tool Equipped with a Micrometer Dial for Measuring Penetration
D1037 − 12
16
Copyright by ASTM Int'l (all rights reserved); Tue Aug 5 14:01:53 EDT 2014Downloaded/printed byLIZBETH SANDOVAL (JRE INGENIERIA Y SERVICIOS S.A.C.) pursuant to License Agreement. No further reproductions authorized.
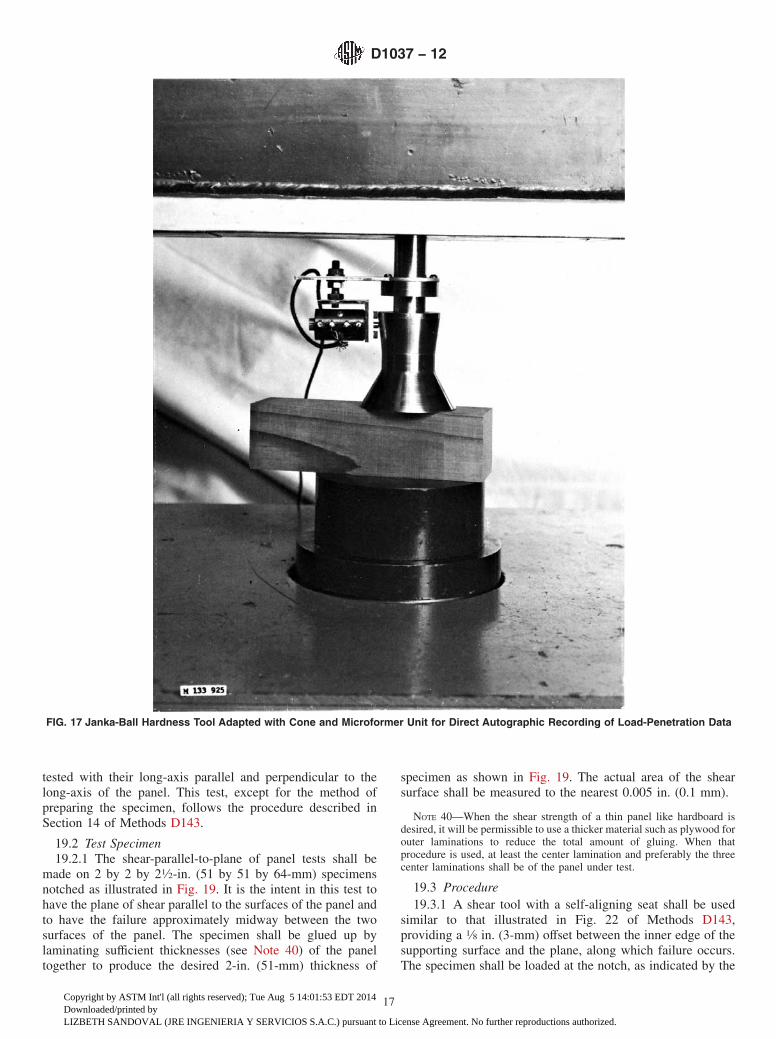
tested with their long-axis parallel and perpendicular to thelong-axis of the panel. This test, except for the method ofpreparing the specimen, follows the procedure described inSection 14 of Methods D143.
19.2 Test Specimen19.2.1 The shear-parallel-to-plane of panel tests shall be
made on 2 by 2 by 21⁄2-in. (51 by 51 by 64-mm) specimensnotched as illustrated in Fig. 19. It is the intent in this test tohave the plane of shear parallel to the surfaces of the panel andto have the failure approximately midway between the twosurfaces of the panel. The specimen shall be glued up bylaminating sufficient thicknesses (see Note 40) of the paneltogether to produce the desired 2-in. (51-mm) thickness of
specimen as shown in Fig. 19. The actual area of the shearsurface shall be measured to the nearest 0.005 in. (0.1 mm).
NOTE 40—When the shear strength of a thin panel like hardboard isdesired, it will be permissible to use a thicker material such as plywood forouter laminations to reduce the total amount of gluing. When thatprocedure is used, at least the center lamination and preferably the threecenter laminations shall be of the panel under test.
19.3 Procedure19.3.1 A shear tool with a self-aligning seat shall be used
similar to that illustrated in Fig. 22 of Methods D143,providing a 1⁄8 in. (3-mm) offset between the inner edge of thesupporting surface and the plane, along which failure occurs.The specimen shall be loaded at the notch, as indicated by the
FIG. 17 Janka-Ball Hardness Tool Adapted with Cone and Microformer Unit for Direct Autographic Recording of Load-Penetration Data
D1037 − 12
17
Copyright by ASTM Int'l (all rights reserved); Tue Aug 5 14:01:53 EDT 2014Downloaded/printed byLIZBETH SANDOVAL (JRE INGENIERIA Y SERVICIOS S.A.C.) pursuant to License Agreement. No further reproductions authorized.
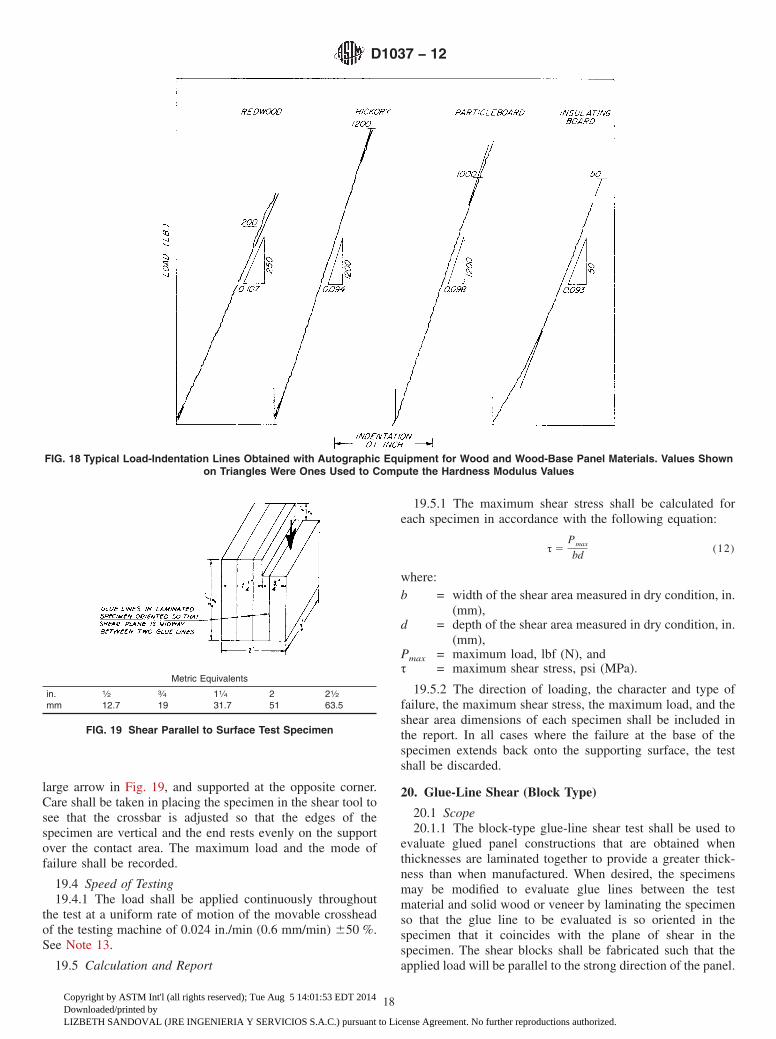
large arrow in Fig. 19, and supported at the opposite corner.Care shall be taken in placing the specimen in the shear tool tosee that the crossbar is adjusted so that the edges of thespecimen are vertical and the end rests evenly on the supportover the contact area. The maximum load and the mode offailure shall be recorded.
19.4 Speed of Testing19.4.1 The load shall be applied continuously throughout
the test at a uniform rate of motion of the movable crossheadof the testing machine of 0.024 in./min (0.6 mm/min) 650 %.See Note 13.
19.5 Calculation and Report
19.5.1 The maximum shear stress shall be calculated foreach specimen in accordance with the following equation:
τ 5Pmax
bd(12)
where:b = width of the shear area measured in dry condition, in.
(mm),d = depth of the shear area measured in dry condition, in.
(mm),Pmax = maximum load, lbf (N), andτ = maximum shear stress, psi (MPa).
19.5.2 The direction of loading, the character and type offailure, the maximum shear stress, the maximum load, and theshear area dimensions of each specimen shall be included inthe report. In all cases where the failure at the base of thespecimen extends back onto the supporting surface, the testshall be discarded.
20. Glue-Line Shear (Block Type)
20.1 Scope20.1.1 The block-type glue-line shear test shall be used to
evaluate glued panel constructions that are obtained whenthicknesses are laminated together to provide a greater thick-ness than when manufactured. When desired, the specimensmay be modified to evaluate glue lines between the testmaterial and solid wood or veneer by laminating the specimenso that the glue line to be evaluated is so oriented in thespecimen that it coincides with the plane of shear in thespecimen. The shear blocks shall be fabricated such that theapplied load will be parallel to the strong direction of the panel.
FIG. 18 Typical Load-Indentation Lines Obtained with Autographic Equipment for Wood and Wood-Base Panel Materials. Values Shownon Triangles Were Ones Used to Compute the Hardness Modulus Values
Metric Equivalents
in. 1⁄2 3⁄4 11⁄4 2 21⁄2mm 12.7 19 31.7 51 63.5
FIG. 19 Shear Parallel to Surface Test Specimen
D1037 − 12
18
Copyright by ASTM Int'l (all rights reserved); Tue Aug 5 14:01:53 EDT 2014Downloaded/printed byLIZBETH SANDOVAL (JRE INGENIERIA Y SERVICIOS S.A.C.) pursuant to License Agreement. No further reproductions authorized.
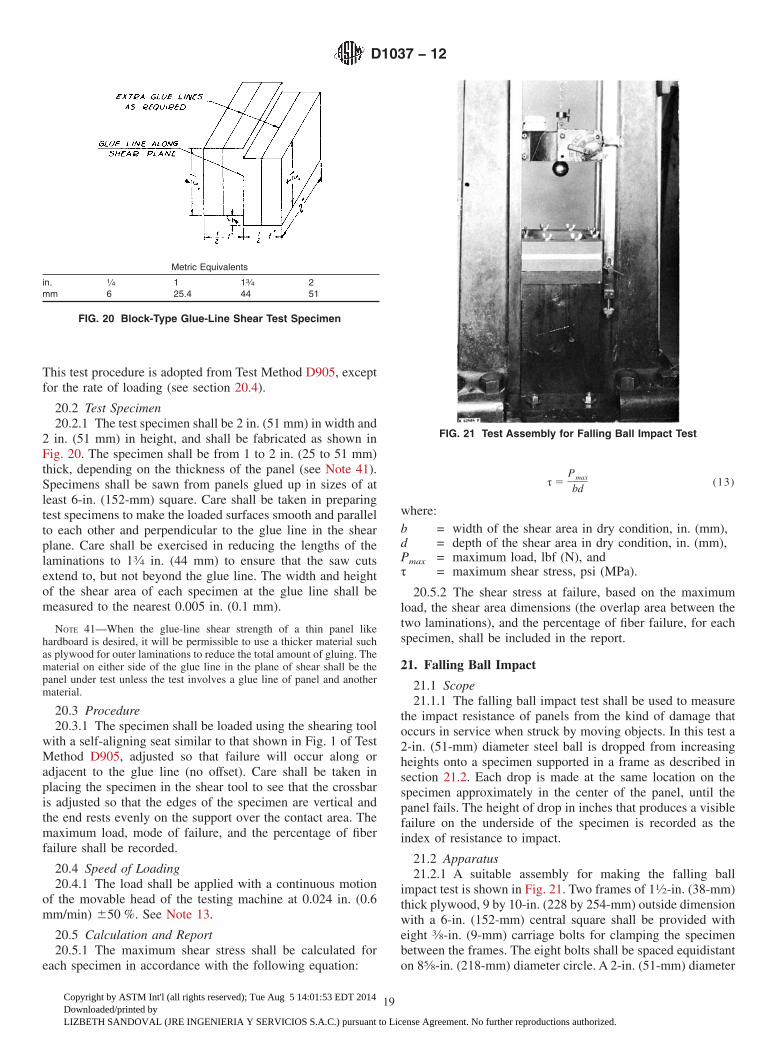
This test procedure is adopted from Test Method D905, exceptfor the rate of loading (see section 20.4).
20.2 Test Specimen20.2.1 The test specimen shall be 2 in. (51 mm) in width and
2 in. (51 mm) in height, and shall be fabricated as shown inFig. 20. The specimen shall be from 1 to 2 in. (25 to 51 mm)thick, depending on the thickness of the panel (see Note 41).Specimens shall be sawn from panels glued up in sizes of atleast 6-in. (152-mm) square. Care shall be taken in preparingtest specimens to make the loaded surfaces smooth and parallelto each other and perpendicular to the glue line in the shearplane. Care shall be exercised in reducing the lengths of thelaminations to 13⁄4 in. (44 mm) to ensure that the saw cutsextend to, but not beyond the glue line. The width and heightof the shear area of each specimen at the glue line shall bemeasured to the nearest 0.005 in. (0.1 mm).
NOTE 41—When the glue-line shear strength of a thin panel likehardboard is desired, it will be permissible to use a thicker material suchas plywood for outer laminations to reduce the total amount of gluing. Thematerial on either side of the glue line in the plane of shear shall be thepanel under test unless the test involves a glue line of panel and anothermaterial.
20.3 Procedure20.3.1 The specimen shall be loaded using the shearing tool
with a self-aligning seat similar to that shown in Fig. 1 of TestMethod D905, adjusted so that failure will occur along oradjacent to the glue line (no offset). Care shall be taken inplacing the specimen in the shear tool to see that the crossbaris adjusted so that the edges of the specimen are vertical andthe end rests evenly on the support over the contact area. Themaximum load, mode of failure, and the percentage of fiberfailure shall be recorded.
20.4 Speed of Loading20.4.1 The load shall be applied with a continuous motion
of the movable head of the testing machine at 0.024 in. (0.6mm/min) 650 %. See Note 13.
20.5 Calculation and Report20.5.1 The maximum shear stress shall be calculated for
each specimen in accordance with the following equation:
τ 5Pmax
bd(13)
where:b = width of the shear area in dry condition, in. (mm),d = depth of the shear area in dry condition, in. (mm),Pmax = maximum load, lbf (N), andτ = maximum shear stress, psi (MPa).
20.5.2 The shear stress at failure, based on the maximumload, the shear area dimensions (the overlap area between thetwo laminations), and the percentage of fiber failure, for eachspecimen, shall be included in the report.
21. Falling Ball Impact
21.1 Scope21.1.1 The falling ball impact test shall be used to measure
the impact resistance of panels from the kind of damage thatoccurs in service when struck by moving objects. In this test a2-in. (51-mm) diameter steel ball is dropped from increasingheights onto a specimen supported in a frame as described insection 21.2. Each drop is made at the same location on thespecimen approximately in the center of the panel, until thepanel fails. The height of drop in inches that produces a visiblefailure on the underside of the specimen is recorded as theindex of resistance to impact.
21.2 Apparatus21.2.1 A suitable assembly for making the falling ball
impact test is shown in Fig. 21. Two frames of 11⁄2-in. (38-mm)thick plywood, 9 by 10-in. (228 by 254-mm) outside dimensionwith a 6-in. (152-mm) central square shall be provided witheight 3⁄8-in. (9-mm) carriage bolts for clamping the specimenbetween the frames. The eight bolts shall be spaced equidistanton 85⁄8-in. (218-mm) diameter circle. A 2-in. (51-mm) diameter
Metric Equivalents
in. 1⁄4 1 13⁄4 2mm 6 25.4 44 51
FIG. 20 Block-Type Glue-Line Shear Test Specimen
FIG. 21 Test Assembly for Falling Ball Impact Test
D1037 − 12
19
Copyright by ASTM Int'l (all rights reserved); Tue Aug 5 14:01:53 EDT 2014Downloaded/printed byLIZBETH SANDOVAL (JRE INGENIERIA Y SERVICIOS S.A.C.) pursuant to License Agreement. No further reproductions authorized.
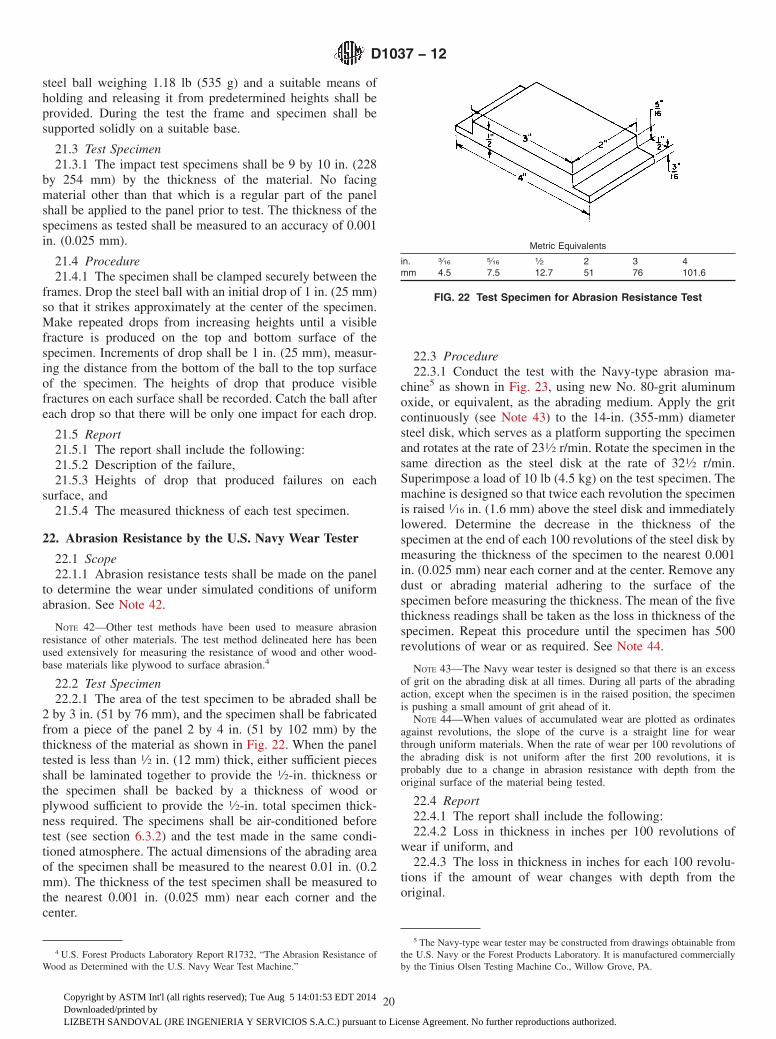
steel ball weighing 1.18 lb (535 g) and a suitable means ofholding and releasing it from predetermined heights shall beprovided. During the test the frame and specimen shall besupported solidly on a suitable base.
21.3 Test Specimen21.3.1 The impact test specimens shall be 9 by 10 in. (228
by 254 mm) by the thickness of the material. No facingmaterial other than that which is a regular part of the panelshall be applied to the panel prior to test. The thickness of thespecimens as tested shall be measured to an accuracy of 0.001in. (0.025 mm).
21.4 Procedure21.4.1 The specimen shall be clamped securely between the
frames. Drop the steel ball with an initial drop of 1 in. (25 mm)so that it strikes approximately at the center of the specimen.Make repeated drops from increasing heights until a visiblefracture is produced on the top and bottom surface of thespecimen. Increments of drop shall be 1 in. (25 mm), measur-ing the distance from the bottom of the ball to the top surfaceof the specimen. The heights of drop that produce visiblefractures on each surface shall be recorded. Catch the ball aftereach drop so that there will be only one impact for each drop.
21.5 Report21.5.1 The report shall include the following:21.5.2 Description of the failure,21.5.3 Heights of drop that produced failures on each
surface, and21.5.4 The measured thickness of each test specimen.
22. Abrasion Resistance by the U.S. Navy Wear Tester
22.1 Scope22.1.1 Abrasion resistance tests shall be made on the panel
to determine the wear under simulated conditions of uniformabrasion. See Note 42.
NOTE 42—Other test methods have been used to measure abrasionresistance of other materials. The test method delineated here has beenused extensively for measuring the resistance of wood and other wood-base materials like plywood to surface abrasion.4
22.2 Test Specimen22.2.1 The area of the test specimen to be abraded shall be
2 by 3 in. (51 by 76 mm), and the specimen shall be fabricatedfrom a piece of the panel 2 by 4 in. (51 by 102 mm) by thethickness of the material as shown in Fig. 22. When the paneltested is less than 1⁄2 in. (12 mm) thick, either sufficient piecesshall be laminated together to provide the 1⁄2-in. thickness orthe specimen shall be backed by a thickness of wood orplywood sufficient to provide the 1⁄2-in. total specimen thick-ness required. The specimens shall be air-conditioned beforetest (see section 6.3.2) and the test made in the same condi-tioned atmosphere. The actual dimensions of the abrading areaof the specimen shall be measured to the nearest 0.01 in. (0.2mm). The thickness of the test specimen shall be measured tothe nearest 0.001 in. (0.025 mm) near each corner and thecenter.
22.3 Procedure22.3.1 Conduct the test with the Navy-type abrasion ma-
chine5 as shown in Fig. 23, using new No. 80-grit aluminumoxide, or equivalent, as the abrading medium. Apply the gritcontinuously (see Note 43) to the 14-in. (355-mm) diametersteel disk, which serves as a platform supporting the specimenand rotates at the rate of 231⁄2 r/min. Rotate the specimen in thesame direction as the steel disk at the rate of 321⁄2 r/min.Superimpose a load of 10 lb (4.5 kg) on the test specimen. Themachine is designed so that twice each revolution the specimenis raised 1⁄16 in. (1.6 mm) above the steel disk and immediatelylowered. Determine the decrease in the thickness of thespecimen at the end of each 100 revolutions of the steel disk bymeasuring the thickness of the specimen to the nearest 0.001in. (0.025 mm) near each corner and at the center. Remove anydust or abrading material adhering to the surface of thespecimen before measuring the thickness. The mean of the fivethickness readings shall be taken as the loss in thickness of thespecimen. Repeat this procedure until the specimen has 500revolutions of wear or as required. See Note 44.
NOTE 43—The Navy wear tester is designed so that there is an excessof grit on the abrading disk at all times. During all parts of the abradingaction, except when the specimen is in the raised position, the specimenis pushing a small amount of grit ahead of it.
NOTE 44—When values of accumulated wear are plotted as ordinatesagainst revolutions, the slope of the curve is a straight line for wearthrough uniform materials. When the rate of wear per 100 revolutions ofthe abrading disk is not uniform after the first 200 revolutions, it isprobably due to a change in abrasion resistance with depth from theoriginal surface of the material being tested.
22.4 Report22.4.1 The report shall include the following:22.4.2 Loss in thickness in inches per 100 revolutions of
wear if uniform, and22.4.3 The loss in thickness in inches for each 100 revolu-
tions if the amount of wear changes with depth from theoriginal.
4 U.S. Forest Products Laboratory Report R1732, “The Abrasion Resistance ofWood as Determined with the U.S. Navy Wear Test Machine.”
5 The Navy-type wear tester may be constructed from drawings obtainable fromthe U.S. Navy or the Forest Products Laboratory. It is manufactured commerciallyby the Tinius Olsen Testing Machine Co., Willow Grove, PA.
Metric Equivalents
in. 3⁄16 5⁄16 1⁄2 2 3 4mm 4.5 7.5 12.7 51 76 101.6
FIG. 22 Test Specimen for Abrasion Resistance Test
D1037 − 12
20
Copyright by ASTM Int'l (all rights reserved); Tue Aug 5 14:01:53 EDT 2014Downloaded/printed byLIZBETH SANDOVAL (JRE INGENIERIA Y SERVICIOS S.A.C.) pursuant to License Agreement. No further reproductions authorized.
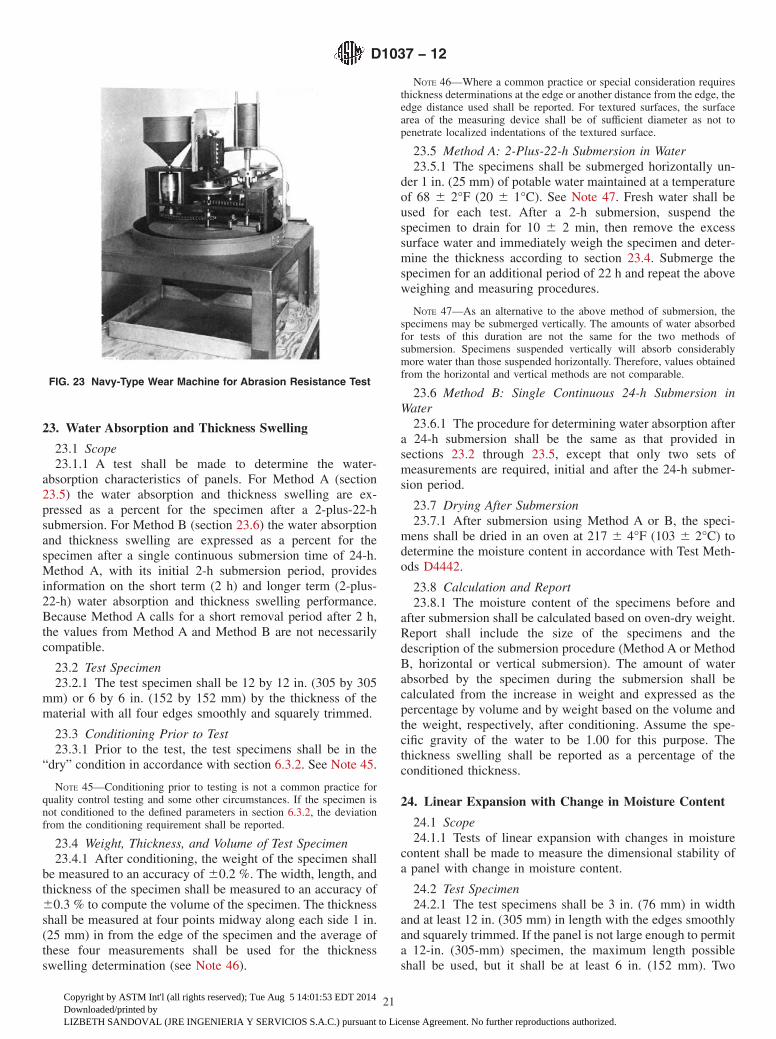
23. Water Absorption and Thickness Swelling
23.1 Scope23.1.1 A test shall be made to determine the water-
absorption characteristics of panels. For Method A (section23.5) the water absorption and thickness swelling are ex-pressed as a percent for the specimen after a 2-plus-22-hsubmersion. For Method B (section 23.6) the water absorptionand thickness swelling are expressed as a percent for thespecimen after a single continuous submersion time of 24-h.Method A, with its initial 2-h submersion period, providesinformation on the short term (2 h) and longer term (2-plus-22-h) water absorption and thickness swelling performance.Because Method A calls for a short removal period after 2 h,the values from Method A and Method B are not necessarilycompatible.
23.2 Test Specimen23.2.1 The test specimen shall be 12 by 12 in. (305 by 305
mm) or 6 by 6 in. (152 by 152 mm) by the thickness of thematerial with all four edges smoothly and squarely trimmed.
23.3 Conditioning Prior to Test23.3.1 Prior to the test, the test specimens shall be in the
“dry” condition in accordance with section 6.3.2. See Note 45.
NOTE 45—Conditioning prior to testing is not a common practice forquality control testing and some other circumstances. If the specimen isnot conditioned to the defined parameters in section 6.3.2, the deviationfrom the conditioning requirement shall be reported.
23.4 Weight, Thickness, and Volume of Test Specimen23.4.1 After conditioning, the weight of the specimen shall
be measured to an accuracy of 60.2 %. The width, length, andthickness of the specimen shall be measured to an accuracy of60.3 % to compute the volume of the specimen. The thicknessshall be measured at four points midway along each side 1 in.(25 mm) in from the edge of the specimen and the average ofthese four measurements shall be used for the thicknessswelling determination (see Note 46).
NOTE 46—Where a common practice or special consideration requiresthickness determinations at the edge or another distance from the edge, theedge distance used shall be reported. For textured surfaces, the surfacearea of the measuring device shall be of sufficient diameter as not topenetrate localized indentations of the textured surface.
23.5 Method A: 2-Plus-22-h Submersion in Water23.5.1 The specimens shall be submerged horizontally un-
der 1 in. (25 mm) of potable water maintained at a temperatureof 68 6 2°F (20 6 1°C). See Note 47. Fresh water shall beused for each test. After a 2-h submersion, suspend thespecimen to drain for 10 6 2 min, then remove the excesssurface water and immediately weigh the specimen and deter-mine the thickness according to section 23.4. Submerge thespecimen for an additional period of 22 h and repeat the aboveweighing and measuring procedures.
NOTE 47—As an alternative to the above method of submersion, thespecimens may be submerged vertically. The amounts of water absorbedfor tests of this duration are not the same for the two methods ofsubmersion. Specimens suspended vertically will absorb considerablymore water than those suspended horizontally. Therefore, values obtainedfrom the horizontal and vertical methods are not comparable.
23.6 Method B: Single Continuous 24-h Submersion inWater
23.6.1 The procedure for determining water absorption aftera 24-h submersion shall be the same as that provided insections 23.2 through 23.5, except that only two sets ofmeasurements are required, initial and after the 24-h submer-sion period.
23.7 Drying After Submersion23.7.1 After submersion using Method A or B, the speci-
mens shall be dried in an oven at 217 6 4°F (103 6 2°C) todetermine the moisture content in accordance with Test Meth-ods D4442.
23.8 Calculation and Report23.8.1 The moisture content of the specimens before and
after submersion shall be calculated based on oven-dry weight.Report shall include the size of the specimens and thedescription of the submersion procedure (Method A or MethodB, horizontal or vertical submersion). The amount of waterabsorbed by the specimen during the submersion shall becalculated from the increase in weight and expressed as thepercentage by volume and by weight based on the volume andthe weight, respectively, after conditioning. Assume the spe-cific gravity of the water to be 1.00 for this purpose. Thethickness swelling shall be reported as a percentage of theconditioned thickness.
24. Linear Expansion with Change in Moisture Content
24.1 Scope24.1.1 Tests of linear expansion with changes in moisture
content shall be made to measure the dimensional stability ofa panel with change in moisture content.
24.2 Test Specimen24.2.1 The test specimens shall be 3 in. (76 mm) in width
and at least 12 in. (305 mm) in length with the edges smoothlyand squarely trimmed. If the panel is not large enough to permita 12-in. (305-mm) specimen, the maximum length possibleshall be used, but it shall be at least 6 in. (152 mm). Two
FIG. 23 Navy-Type Wear Machine for Abrasion Resistance Test
D1037 − 12
21
Copyright by ASTM Int'l (all rights reserved); Tue Aug 5 14:01:53 EDT 2014Downloaded/printed byLIZBETH SANDOVAL (JRE INGENIERIA Y SERVICIOS S.A.C.) pursuant to License Agreement. No further reproductions authorized.
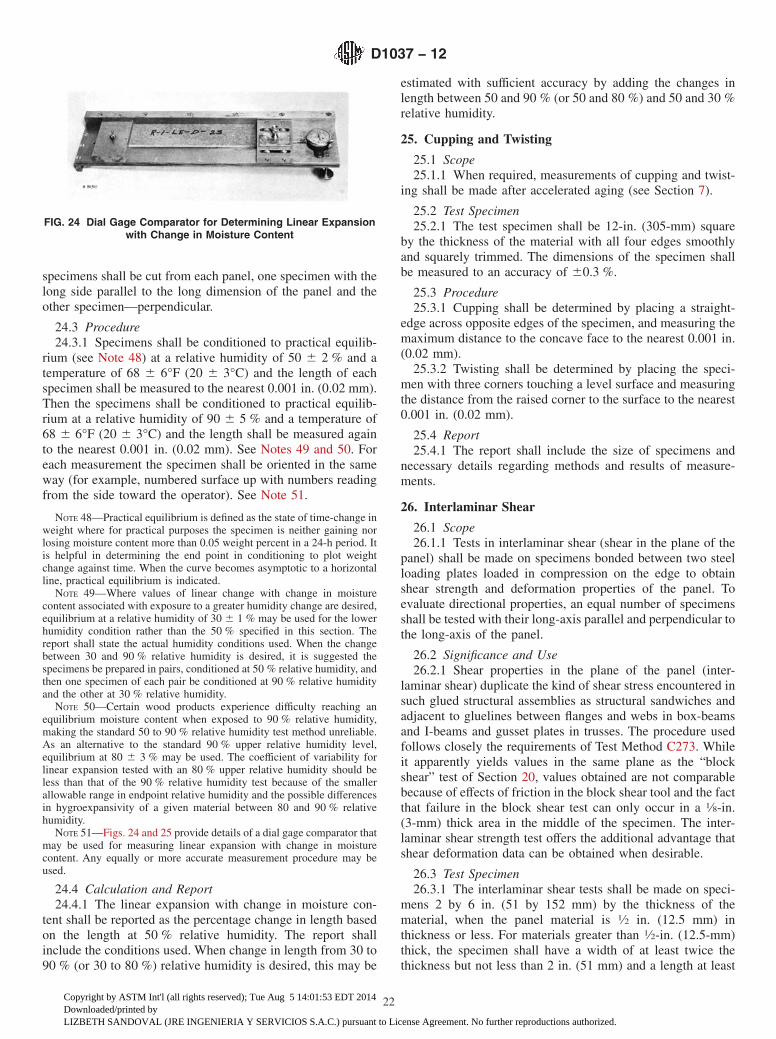
specimens shall be cut from each panel, one specimen with thelong side parallel to the long dimension of the panel and theother specimen—perpendicular.
24.3 Procedure24.3.1 Specimens shall be conditioned to practical equilib-
rium (see Note 48) at a relative humidity of 50 6 2 % and atemperature of 68 6 6°F (20 6 3°C) and the length of eachspecimen shall be measured to the nearest 0.001 in. (0.02 mm).Then the specimens shall be conditioned to practical equilib-rium at a relative humidity of 90 6 5 % and a temperature of68 6 6°F (20 6 3°C) and the length shall be measured againto the nearest 0.001 in. (0.02 mm). See Notes 49 and 50. Foreach measurement the specimen shall be oriented in the sameway (for example, numbered surface up with numbers readingfrom the side toward the operator). See Note 51.
NOTE 48—Practical equilibrium is defined as the state of time-change inweight where for practical purposes the specimen is neither gaining norlosing moisture content more than 0.05 weight percent in a 24-h period. Itis helpful in determining the end point in conditioning to plot weightchange against time. When the curve becomes asymptotic to a horizontalline, practical equilibrium is indicated.
NOTE 49—Where values of linear change with change in moisturecontent associated with exposure to a greater humidity change are desired,equilibrium at a relative humidity of 30 6 1 % may be used for the lowerhumidity condition rather than the 50 % specified in this section. Thereport shall state the actual humidity conditions used. When the changebetween 30 and 90 % relative humidity is desired, it is suggested thespecimens be prepared in pairs, conditioned at 50 % relative humidity, andthen one specimen of each pair be conditioned at 90 % relative humidityand the other at 30 % relative humidity.
NOTE 50—Certain wood products experience difficulty reaching anequilibrium moisture content when exposed to 90 % relative humidity,making the standard 50 to 90 % relative humidity test method unreliable.As an alternative to the standard 90 % upper relative humidity level,equilibrium at 80 6 3 % may be used. The coefficient of variability forlinear expansion tested with an 80 % upper relative humidity should beless than that of the 90 % relative humidity test because of the smallerallowable range in endpoint relative humidity and the possible differencesin hygroexpansivity of a given material between 80 and 90 % relativehumidity.
NOTE 51—Figs. 24 and 25 provide details of a dial gage comparator thatmay be used for measuring linear expansion with change in moisturecontent. Any equally or more accurate measurement procedure may beused.
24.4 Calculation and Report24.4.1 The linear expansion with change in moisture con-
tent shall be reported as the percentage change in length basedon the length at 50 % relative humidity. The report shallinclude the conditions used. When change in length from 30 to90 % (or 30 to 80 %) relative humidity is desired, this may be
estimated with sufficient accuracy by adding the changes inlength between 50 and 90 % (or 50 and 80 %) and 50 and 30 %relative humidity.
25. Cupping and Twisting
25.1 Scope25.1.1 When required, measurements of cupping and twist-
ing shall be made after accelerated aging (see Section 7).
25.2 Test Specimen25.2.1 The test specimen shall be 12-in. (305-mm) square
by the thickness of the material with all four edges smoothlyand squarely trimmed. The dimensions of the specimen shallbe measured to an accuracy of 60.3 %.
25.3 Procedure25.3.1 Cupping shall be determined by placing a straight-
edge across opposite edges of the specimen, and measuring themaximum distance to the concave face to the nearest 0.001 in.(0.02 mm).
25.3.2 Twisting shall be determined by placing the speci-men with three corners touching a level surface and measuringthe distance from the raised corner to the surface to the nearest0.001 in. (0.02 mm).
25.4 Report25.4.1 The report shall include the size of specimens and
necessary details regarding methods and results of measure-ments.
26. Interlaminar Shear
26.1 Scope26.1.1 Tests in interlaminar shear (shear in the plane of the
panel) shall be made on specimens bonded between two steelloading plates loaded in compression on the edge to obtainshear strength and deformation properties of the panel. Toevaluate directional properties, an equal number of specimensshall be tested with their long-axis parallel and perpendicular tothe long-axis of the panel.
26.2 Significance and Use26.2.1 Shear properties in the plane of the panel (inter-
laminar shear) duplicate the kind of shear stress encountered insuch glued structural assemblies as structural sandwiches andadjacent to gluelines between flanges and webs in box-beamsand I-beams and gusset plates in trusses. The procedure usedfollows closely the requirements of Test Method C273. Whileit apparently yields values in the same plane as the “blockshear” test of Section 20, values obtained are not comparablebecause of effects of friction in the block shear tool and the factthat failure in the block shear test can only occur in a 1⁄8-in.(3-mm) thick area in the middle of the specimen. The inter-laminar shear strength test offers the additional advantage thatshear deformation data can be obtained when desirable.
26.3 Test Specimen26.3.1 The interlaminar shear tests shall be made on speci-
mens 2 by 6 in. (51 by 152 mm) by the thickness of thematerial, when the panel material is 1⁄2 in. (12.5 mm) inthickness or less. For materials greater than 1⁄2-in. (12.5-mm)thick, the specimen shall have a width of at least twice thethickness but not less than 2 in. (51 mm) and a length at least
FIG. 24 Dial Gage Comparator for Determining Linear Expansionwith Change in Moisture Content
D1037 − 12
22
Copyright by ASTM Int'l (all rights reserved); Tue Aug 5 14:01:53 EDT 2014Downloaded/printed byLIZBETH SANDOVAL (JRE INGENIERIA Y SERVICIOS S.A.C.) pursuant to License Agreement. No further reproductions authorized.
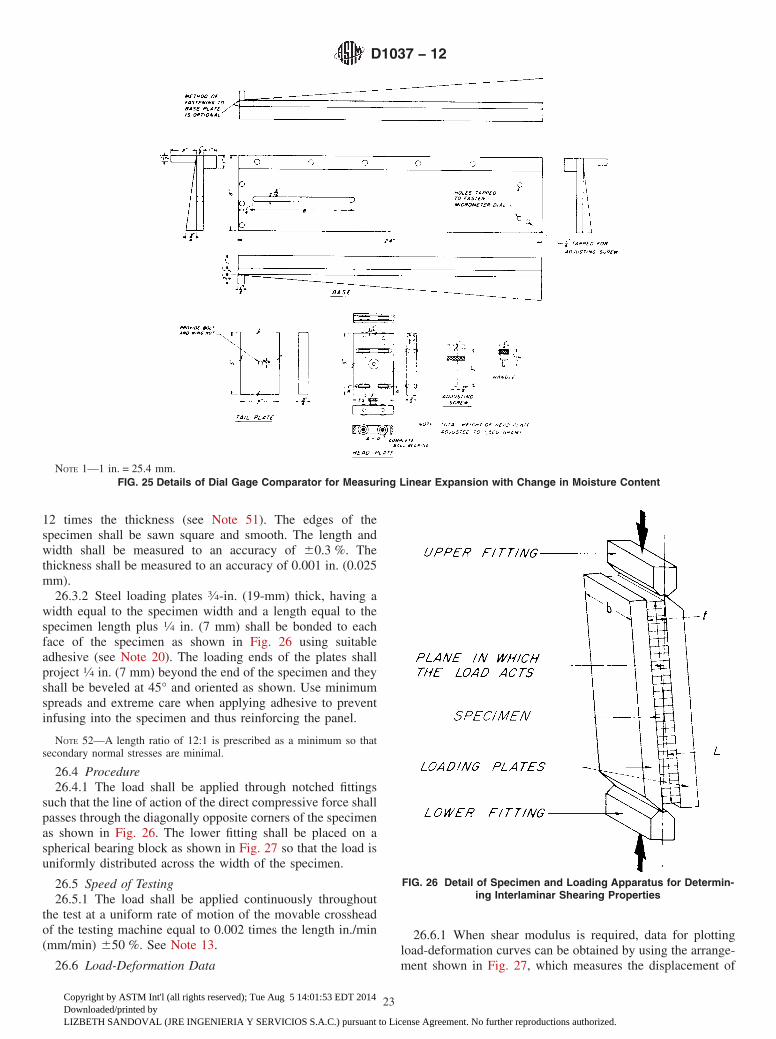
12 times the thickness (see Note 51). The edges of thespecimen shall be sawn square and smooth. The length andwidth shall be measured to an accuracy of 60.3 %. Thethickness shall be measured to an accuracy of 0.001 in. (0.025mm).
26.3.2 Steel loading plates 3⁄4-in. (19-mm) thick, having awidth equal to the specimen width and a length equal to thespecimen length plus 1⁄4 in. (7 mm) shall be bonded to eachface of the specimen as shown in Fig. 26 using suitableadhesive (see Note 20). The loading ends of the plates shallproject 1⁄4 in. (7 mm) beyond the end of the specimen and theyshall be beveled at 45° and oriented as shown. Use minimumspreads and extreme care when applying adhesive to preventinfusing into the specimen and thus reinforcing the panel.
NOTE 52—A length ratio of 12:1 is prescribed as a minimum so thatsecondary normal stresses are minimal.
26.4 Procedure26.4.1 The load shall be applied through notched fittings
such that the line of action of the direct compressive force shallpasses through the diagonally opposite corners of the specimenas shown in Fig. 26. The lower fitting shall be placed on aspherical bearing block as shown in Fig. 27 so that the load isuniformly distributed across the width of the specimen.
26.5 Speed of Testing26.5.1 The load shall be applied continuously throughout
the test at a uniform rate of motion of the movable crossheadof the testing machine equal to 0.002 times the length in./min(mm/min) 650 %. See Note 13.
26.6 Load-Deformation Data
26.6.1 When shear modulus is required, data for plottingload-deformation curves can be obtained by using the arrange-ment shown in Fig. 27, which measures the displacement of
NOTE 1—1 in. = 25.4 mm.FIG. 25 Details of Dial Gage Comparator for Measuring Linear Expansion with Change in Moisture Content
FIG. 26 Detail of Specimen and Loading Apparatus for Determin-ing Interlaminar Shearing Properties
D1037 − 12
23
Copyright by ASTM Int'l (all rights reserved); Tue Aug 5 14:01:53 EDT 2014Downloaded/printed byLIZBETH SANDOVAL (JRE INGENIERIA Y SERVICIOS S.A.C.) pursuant to License Agreement. No further reproductions authorized.
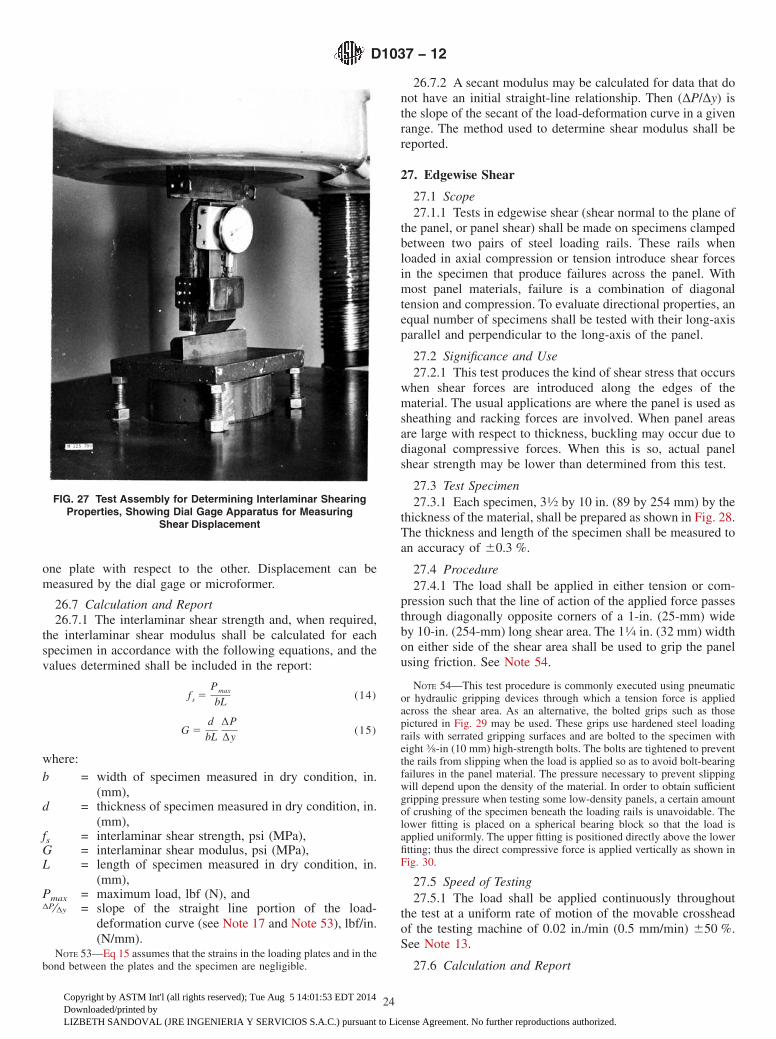
one plate with respect to the other. Displacement can bemeasured by the dial gage or microformer.
26.7 Calculation and Report26.7.1 The interlaminar shear strength and, when required,
the interlaminar shear modulus shall be calculated for eachspecimen in accordance with the following equations, and thevalues determined shall be included in the report:
f s 5Pmax
bL(14)
G 5dbL
∆P∆y
(15)
where:b = width of specimen measured in dry condition, in.
(mm),d = thickness of specimen measured in dry condition, in.
(mm),fs = interlaminar shear strength, psi (MPa),G = interlaminar shear modulus, psi (MPa),L = length of specimen measured in dry condition, in.
(mm),Pmax = maximum load, lbf (N), and∆P⁄∆y = slope of the straight line portion of the load-
deformation curve (see Note 17 and Note 53), lbf/in.(N/mm).
NOTE 53—Eq 15 assumes that the strains in the loading plates and in thebond between the plates and the specimen are negligible.
26.7.2 A secant modulus may be calculated for data that donot have an initial straight-line relationship. Then (∆P/∆y) isthe slope of the secant of the load-deformation curve in a givenrange. The method used to determine shear modulus shall bereported.
27. Edgewise Shear
27.1 Scope27.1.1 Tests in edgewise shear (shear normal to the plane of
the panel, or panel shear) shall be made on specimens clampedbetween two pairs of steel loading rails. These rails whenloaded in axial compression or tension introduce shear forcesin the specimen that produce failures across the panel. Withmost panel materials, failure is a combination of diagonaltension and compression. To evaluate directional properties, anequal number of specimens shall be tested with their long-axisparallel and perpendicular to the long-axis of the panel.
27.2 Significance and Use27.2.1 This test produces the kind of shear stress that occurs
when shear forces are introduced along the edges of thematerial. The usual applications are where the panel is used assheathing and racking forces are involved. When panel areasare large with respect to thickness, buckling may occur due todiagonal compressive forces. When this is so, actual panelshear strength may be lower than determined from this test.
27.3 Test Specimen27.3.1 Each specimen, 31⁄2 by 10 in. (89 by 254 mm) by the
thickness of the material, shall be prepared as shown in Fig. 28.The thickness and length of the specimen shall be measured toan accuracy of 60.3 %.
27.4 Procedure27.4.1 The load shall be applied in either tension or com-
pression such that the line of action of the applied force passesthrough diagonally opposite corners of a 1-in. (25-mm) wideby 10-in. (254-mm) long shear area. The 11⁄4 in. (32 mm) widthon either side of the shear area shall be used to grip the panelusing friction. See Note 54.
NOTE 54—This test procedure is commonly executed using pneumaticor hydraulic gripping devices through which a tension force is appliedacross the shear area. As an alternative, the bolted grips such as thosepictured in Fig. 29 may be used. These grips use hardened steel loadingrails with serrated gripping surfaces and are bolted to the specimen witheight 3⁄8-in (10 mm) high-strength bolts. The bolts are tightened to preventthe rails from slipping when the load is applied so as to avoid bolt-bearingfailures in the panel material. The pressure necessary to prevent slippingwill depend upon the density of the material. In order to obtain sufficientgripping pressure when testing some low-density panels, a certain amountof crushing of the specimen beneath the loading rails is unavoidable. Thelower fitting is placed on a spherical bearing block so that the load isapplied uniformly. The upper fitting is positioned directly above the lowerfitting; thus the direct compressive force is applied vertically as shown inFig. 30.
27.5 Speed of Testing27.5.1 The load shall be applied continuously throughout
the test at a uniform rate of motion of the movable crossheadof the testing machine of 0.02 in./min (0.5 mm/min) 650 %.See Note 13.
27.6 Calculation and Report
FIG. 27 Test Assembly for Determining Interlaminar ShearingProperties, Showing Dial Gage Apparatus for Measuring
Shear Displacement
D1037 − 12
24
Copyright by ASTM Int'l (all rights reserved); Tue Aug 5 14:01:53 EDT 2014Downloaded/printed byLIZBETH SANDOVAL (JRE INGENIERIA Y SERVICIOS S.A.C.) pursuant to License Agreement. No further reproductions authorized.
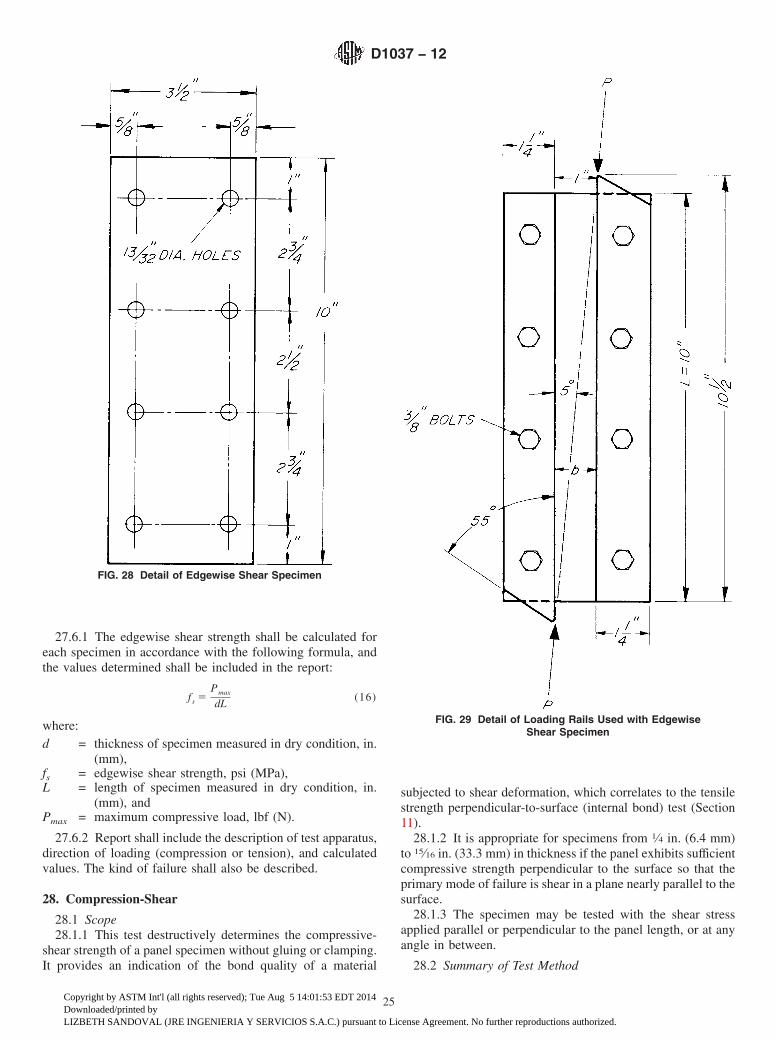
27.6.1 The edgewise shear strength shall be calculated foreach specimen in accordance with the following formula, andthe values determined shall be included in the report:
f s 5Pmax
dL(16)
where:d = thickness of specimen measured in dry condition, in.
(mm),fs = edgewise shear strength, psi (MPa),L = length of specimen measured in dry condition, in.
(mm), andPmax = maximum compressive load, lbf (N).
27.6.2 Report shall include the description of test apparatus,direction of loading (compression or tension), and calculatedvalues. The kind of failure shall also be described.
28. Compression-Shear
28.1 Scope28.1.1 This test destructively determines the compressive-
shear strength of a panel specimen without gluing or clamping.It provides an indication of the bond quality of a material
subjected to shear deformation, which correlates to the tensilestrength perpendicular-to-surface (internal bond) test (Section11).
28.1.2 It is appropriate for specimens from 1⁄4 in. (6.4 mm)to 15⁄16 in. (33.3 mm) in thickness if the panel exhibits sufficientcompressive strength perpendicular to the surface so that theprimary mode of failure is shear in a plane nearly parallel to thesurface.
28.1.3 The specimen may be tested with the shear stressapplied parallel or perpendicular to the panel length, or at anyangle in between.
28.2 Summary of Test Method
FIG. 28 Detail of Edgewise Shear Specimen
FIG. 29 Detail of Loading Rails Used with EdgewiseShear Specimen
D1037 − 12
25
Copyright by ASTM Int'l (all rights reserved); Tue Aug 5 14:01:53 EDT 2014Downloaded/printed byLIZBETH SANDOVAL (JRE INGENIERIA Y SERVICIOS S.A.C.) pursuant to License Agreement. No further reproductions authorized.
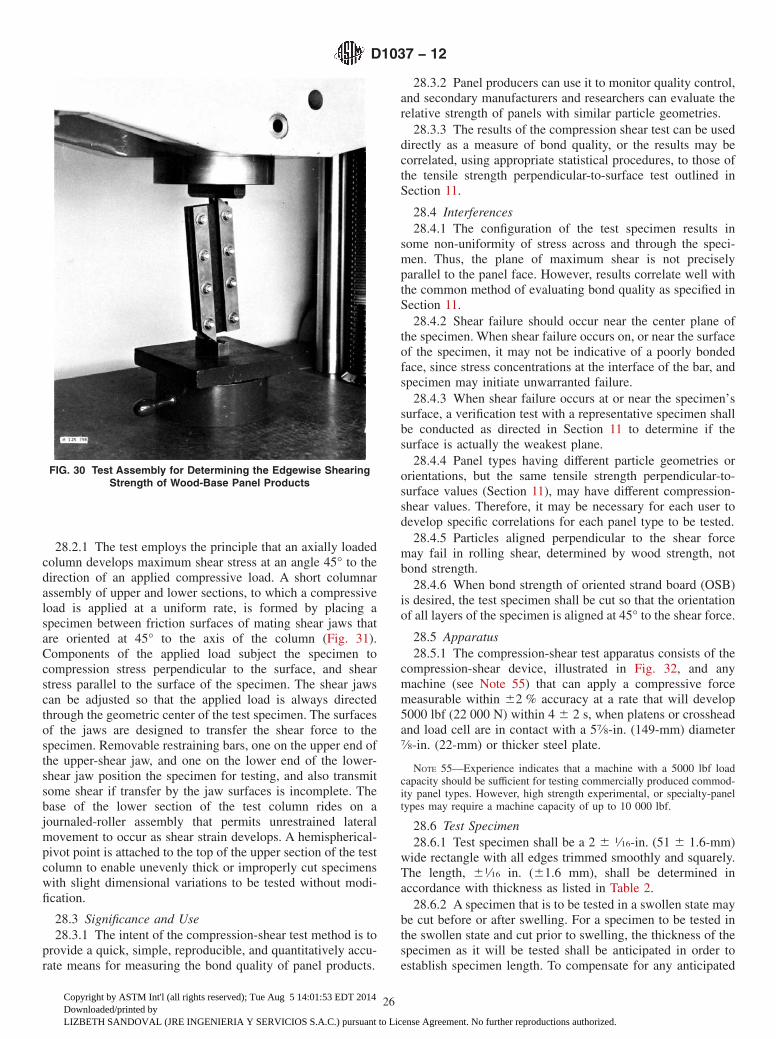
28.2.1 The test employs the principle that an axially loadedcolumn develops maximum shear stress at an angle 45° to thedirection of an applied compressive load. A short columnarassembly of upper and lower sections, to which a compressiveload is applied at a uniform rate, is formed by placing aspecimen between friction surfaces of mating shear jaws thatare oriented at 45° to the axis of the column (Fig. 31).Components of the applied load subject the specimen tocompression stress perpendicular to the surface, and shearstress parallel to the surface of the specimen. The shear jawscan be adjusted so that the applied load is always directedthrough the geometric center of the test specimen. The surfacesof the jaws are designed to transfer the shear force to thespecimen. Removable restraining bars, one on the upper end ofthe upper-shear jaw, and one on the lower end of the lower-shear jaw position the specimen for testing, and also transmitsome shear if transfer by the jaw surfaces is incomplete. Thebase of the lower section of the test column rides on ajournaled-roller assembly that permits unrestrained lateralmovement to occur as shear strain develops. A hemispherical-pivot point is attached to the top of the upper section of the testcolumn to enable unevenly thick or improperly cut specimenswith slight dimensional variations to be tested without modi-fication.
28.3 Significance and Use28.3.1 The intent of the compression-shear test method is to
provide a quick, simple, reproducible, and quantitatively accu-rate means for measuring the bond quality of panel products.
28.3.2 Panel producers can use it to monitor quality control,and secondary manufacturers and researchers can evaluate therelative strength of panels with similar particle geometries.
28.3.3 The results of the compression shear test can be useddirectly as a measure of bond quality, or the results may becorrelated, using appropriate statistical procedures, to those ofthe tensile strength perpendicular-to-surface test outlined inSection 11.
28.4 Interferences28.4.1 The configuration of the test specimen results in
some non-uniformity of stress across and through the speci-men. Thus, the plane of maximum shear is not preciselyparallel to the panel face. However, results correlate well withthe common method of evaluating bond quality as specified inSection 11.
28.4.2 Shear failure should occur near the center plane ofthe specimen. When shear failure occurs on, or near the surfaceof the specimen, it may not be indicative of a poorly bondedface, since stress concentrations at the interface of the bar, andspecimen may initiate unwarranted failure.
28.4.3 When shear failure occurs at or near the specimen’ssurface, a verification test with a representative specimen shallbe conducted as directed in Section 11 to determine if thesurface is actually the weakest plane.
28.4.4 Panel types having different particle geometries ororientations, but the same tensile strength perpendicular-to-surface values (Section 11), may have different compression-shear values. Therefore, it may be necessary for each user todevelop specific correlations for each panel type to be tested.
28.4.5 Particles aligned perpendicular to the shear forcemay fail in rolling shear, determined by wood strength, notbond strength.
28.4.6 When bond strength of oriented strand board (OSB)is desired, the test specimen shall be cut so that the orientationof all layers of the specimen is aligned at 45° to the shear force.
28.5 Apparatus28.5.1 The compression-shear test apparatus consists of the
compression-shear device, illustrated in Fig. 32, and anymachine (see Note 55) that can apply a compressive forcemeasurable within 62 % accuracy at a rate that will develop5000 lbf (22 000 N) within 4 6 2 s, when platens or crossheadand load cell are in contact with a 57⁄8-in. (149-mm) diameter7⁄8-in. (22-mm) or thicker steel plate.
NOTE 55—Experience indicates that a machine with a 5000 lbf loadcapacity should be sufficient for testing commercially produced commod-ity panel types. However, high strength experimental, or specialty-paneltypes may require a machine capacity of up to 10 000 lbf.
28.6 Test Specimen28.6.1 Test specimen shall be a 2 6 1⁄16-in. (51 6 1.6-mm)
wide rectangle with all edges trimmed smoothly and squarely.The length, 61⁄16 in. (61.6 mm), shall be determined inaccordance with thickness as listed in Table 2.
28.6.2 A specimen that is to be tested in a swollen state maybe cut before or after swelling. For a specimen to be tested inthe swollen state and cut prior to swelling, the thickness of thespecimen as it will be tested shall be anticipated in order toestablish specimen length. To compensate for any anticipated
FIG. 30 Test Assembly for Determining the Edgewise ShearingStrength of Wood-Base Panel Products
D1037 − 12
26
Copyright by ASTM Int'l (all rights reserved); Tue Aug 5 14:01:53 EDT 2014Downloaded/printed byLIZBETH SANDOVAL (JRE INGENIERIA Y SERVICIOS S.A.C.) pursuant to License Agreement. No further reproductions authorized.
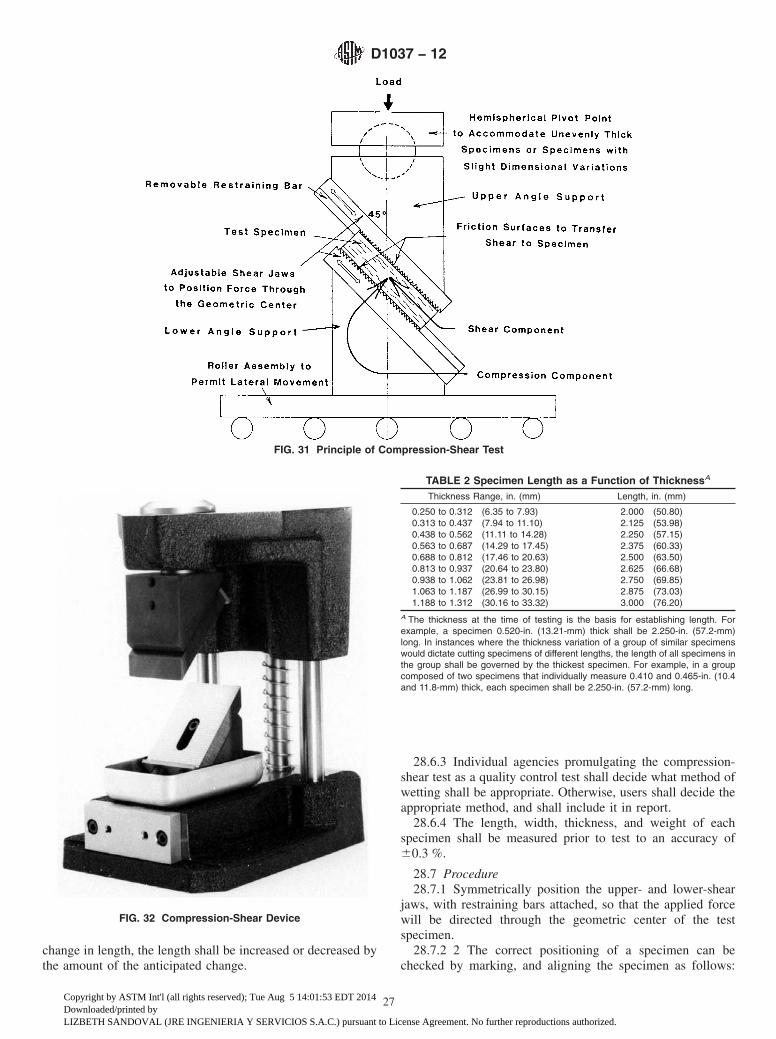
change in length, the length shall be increased or decreased bythe amount of the anticipated change.
28.6.3 Individual agencies promulgating the compression-shear test as a quality control test shall decide what method ofwetting shall be appropriate. Otherwise, users shall decide theappropriate method, and shall include it in report.
28.6.4 The length, width, thickness, and weight of eachspecimen shall be measured prior to test to an accuracy of60.3 %.
28.7 Procedure28.7.1 Symmetrically position the upper- and lower-shear
jaws, with restraining bars attached, so that the applied forcewill be directed through the geometric center of the testspecimen.
28.7.2 2 The correct positioning of a specimen can bechecked by marking, and aligning the specimen as follows:
FIG. 31 Principle of Compression-Shear Test
FIG. 32 Compression-Shear Device
TABLE 2 Specimen Length as a Function of ThicknessA
Thickness Range, in. (mm) Length, in. (mm)
0.250 to 0.312 (6.35 to 7.93) 2.000 (50.80)0.313 to 0.437 (7.94 to 11.10) 2.125 (53.98)0.438 to 0.562 (11.11 to 14.28) 2.250 (57.15)0.563 to 0.687 (14.29 to 17.45) 2.375 (60.33)0.688 to 0.812 (17.46 to 20.63) 2.500 (63.50)0.813 to 0.937 (20.64 to 23.80) 2.625 (66.68)0.938 to 1.062 (23.81 to 26.98) 2.750 (69.85)1.063 to 1.187 (26.99 to 30.15) 2.875 (73.03)1.188 to 1.312 (30.16 to 33.32) 3.000 (76.20)
A The thickness at the time of testing is the basis for establishing length. Forexample, a specimen 0.520-in. (13.21-mm) thick shall be 2.250-in. (57.2-mm)long. In instances where the thickness variation of a group of similar specimenswould dictate cutting specimens of different lengths, the length of all specimens inthe group shall be governed by the thickest specimen. For example, in a groupcomposed of two specimens that individually measure 0.410 and 0.465-in. (10.4and 11.8-mm) thick, each specimen shall be 2.250-in. (57.2-mm) long.
D1037 − 12
27
Copyright by ASTM Int'l (all rights reserved); Tue Aug 5 14:01:53 EDT 2014Downloaded/printed byLIZBETH SANDOVAL (JRE INGENIERIA Y SERVICIOS S.A.C.) pursuant to License Agreement. No further reproductions authorized.
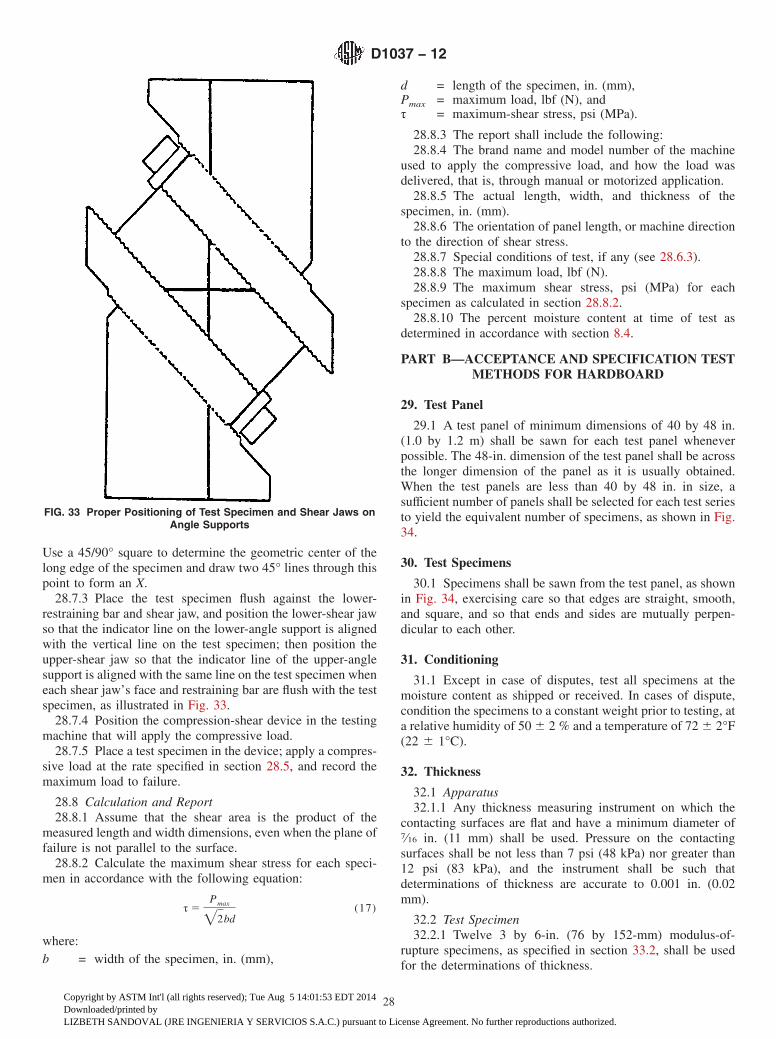
Use a 45/90° square to determine the geometric center of thelong edge of the specimen and draw two 45° lines through thispoint to form an X.
28.7.3 Place the test specimen flush against the lower-restraining bar and shear jaw, and position the lower-shear jawso that the indicator line on the lower-angle support is alignedwith the vertical line on the test specimen; then position theupper-shear jaw so that the indicator line of the upper-anglesupport is aligned with the same line on the test specimen wheneach shear jaw’s face and restraining bar are flush with the testspecimen, as illustrated in Fig. 33.
28.7.4 Position the compression-shear device in the testingmachine that will apply the compressive load.
28.7.5 Place a test specimen in the device; apply a compres-sive load at the rate specified in section 28.5, and record themaximum load to failure.
28.8 Calculation and Report28.8.1 Assume that the shear area is the product of the
measured length and width dimensions, even when the plane offailure is not parallel to the surface.
28.8.2 Calculate the maximum shear stress for each speci-men in accordance with the following equation:
τ 5Pmax
=2bd(17)
where:b = width of the specimen, in. (mm),
d = length of the specimen, in. (mm),Pmax = maximum load, lbf (N), andτ = maximum-shear stress, psi (MPa).
28.8.3 The report shall include the following:28.8.4 The brand name and model number of the machine
used to apply the compressive load, and how the load wasdelivered, that is, through manual or motorized application.
28.8.5 The actual length, width, and thickness of thespecimen, in. (mm).
28.8.6 The orientation of panel length, or machine directionto the direction of shear stress.
28.8.7 Special conditions of test, if any (see 28.6.3).28.8.8 The maximum load, lbf (N).28.8.9 The maximum shear stress, psi (MPa) for each
specimen as calculated in section 28.8.2.28.8.10 The percent moisture content at time of test as
determined in accordance with section 8.4.
PART B—ACCEPTANCE AND SPECIFICATION TESTMETHODS FOR HARDBOARD
29. Test Panel
29.1 A test panel of minimum dimensions of 40 by 48 in.(1.0 by 1.2 m) shall be sawn for each test panel wheneverpossible. The 48-in. dimension of the test panel shall be acrossthe longer dimension of the panel as it is usually obtained.When the test panels are less than 40 by 48 in. in size, asufficient number of panels shall be selected for each test seriesto yield the equivalent number of specimens, as shown in Fig.34.
30. Test Specimens
30.1 Specimens shall be sawn from the test panel, as shownin Fig. 34, exercising care so that edges are straight, smooth,and square, and so that ends and sides are mutually perpen-dicular to each other.
31. Conditioning
31.1 Except in case of disputes, test all specimens at themoisture content as shipped or received. In cases of dispute,condition the specimens to a constant weight prior to testing, ata relative humidity of 50 6 2 % and a temperature of 72 6 2°F(22 6 1°C).
32. Thickness
32.1 Apparatus32.1.1 Any thickness measuring instrument on which the
contacting surfaces are flat and have a minimum diameter of7⁄16 in. (11 mm) shall be used. Pressure on the contactingsurfaces shall be not less than 7 psi (48 kPa) nor greater than12 psi (83 kPa), and the instrument shall be such thatdeterminations of thickness are accurate to 0.001 in. (0.02mm).
32.2 Test Specimen32.2.1 Twelve 3 by 6-in. (76 by 152-mm) modulus-of-
rupture specimens, as specified in section 33.2, shall be usedfor the determinations of thickness.
FIG. 33 Proper Positioning of Test Specimen and Shear Jaws onAngle Supports
D1037 − 12
28
Copyright by ASTM Int'l (all rights reserved); Tue Aug 5 14:01:53 EDT 2014Downloaded/printed byLIZBETH SANDOVAL (JRE INGENIERIA Y SERVICIOS S.A.C.) pursuant to License Agreement. No further reproductions authorized.
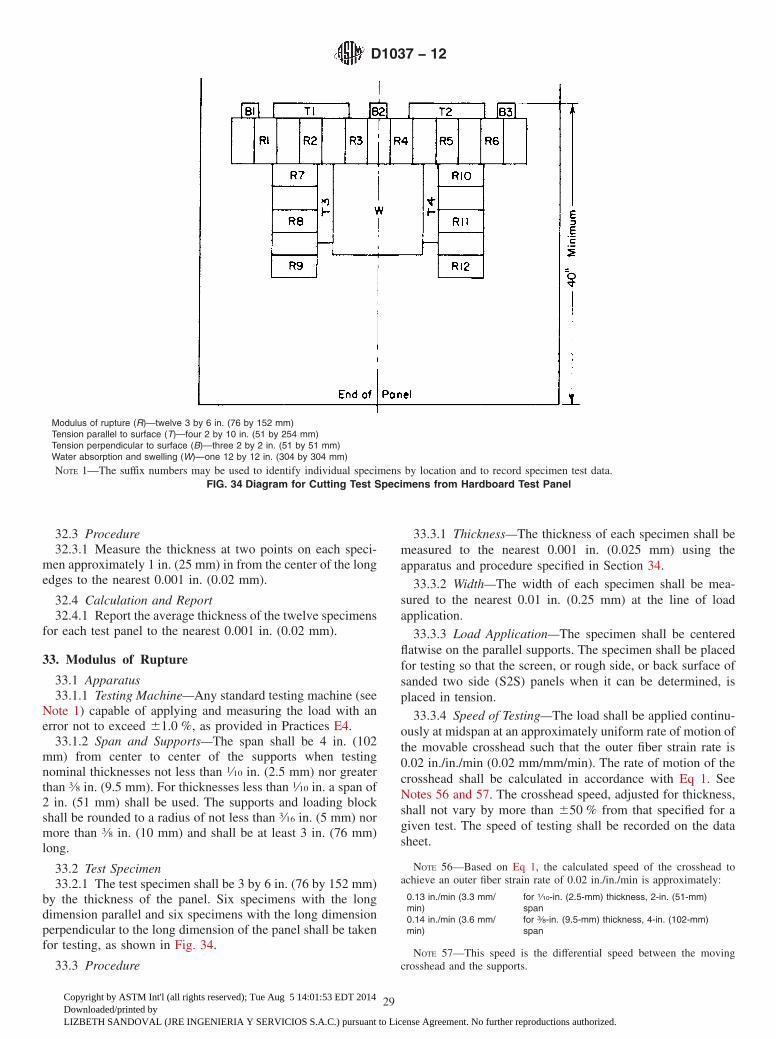
32.3 Procedure32.3.1 Measure the thickness at two points on each speci-
men approximately 1 in. (25 mm) in from the center of the longedges to the nearest 0.001 in. (0.02 mm).
32.4 Calculation and Report32.4.1 Report the average thickness of the twelve specimens
for each test panel to the nearest 0.001 in. (0.02 mm).
33. Modulus of Rupture
33.1 Apparatus33.1.1 Testing Machine—Any standard testing machine (see
Note 1) capable of applying and measuring the load with anerror not to exceed 61.0 %, as provided in Practices E4.
33.1.2 Span and Supports—The span shall be 4 in. (102mm) from center to center of the supports when testingnominal thicknesses not less than 1⁄10 in. (2.5 mm) nor greaterthan 3⁄8 in. (9.5 mm). For thicknesses less than 1⁄10 in. a span of2 in. (51 mm) shall be used. The supports and loading blockshall be rounded to a radius of not less than 3⁄16 in. (5 mm) normore than 3⁄8 in. (10 mm) and shall be at least 3 in. (76 mm)long.
33.2 Test Specimen33.2.1 The test specimen shall be 3 by 6 in. (76 by 152 mm)
by the thickness of the panel. Six specimens with the longdimension parallel and six specimens with the long dimensionperpendicular to the long dimension of the panel shall be takenfor testing, as shown in Fig. 34.
33.3 Procedure
33.3.1 Thickness—The thickness of each specimen shall bemeasured to the nearest 0.001 in. (0.025 mm) using theapparatus and procedure specified in Section 34.
33.3.2 Width—The width of each specimen shall be mea-sured to the nearest 0.01 in. (0.25 mm) at the line of loadapplication.
33.3.3 Load Application—The specimen shall be centeredflatwise on the parallel supports. The specimen shall be placedfor testing so that the screen, or rough side, or back surface ofsanded two side (S2S) panels when it can be determined, isplaced in tension.
33.3.4 Speed of Testing—The load shall be applied continu-ously at midspan at an approximately uniform rate of motion ofthe movable crosshead such that the outer fiber strain rate is0.02 in./in./min (0.02 mm/mm/min). The rate of motion of thecrosshead shall be calculated in accordance with Eq 1. SeeNotes 56 and 57. The crosshead speed, adjusted for thickness,shall not vary by more than 650 % from that specified for agiven test. The speed of testing shall be recorded on the datasheet.
NOTE 56—Based on Eq 1, the calculated speed of the crosshead toachieve an outer fiber strain rate of 0.02 in./in./min is approximately:
0.13 in./min (3.3 mm/min)
for 1⁄10-in. (2.5-mm) thickness, 2-in. (51-mm)span
0.14 in./min (3.6 mm/min)
for 3⁄8-in. (9.5-mm) thickness, 4-in. (102-mm)span
NOTE 57—This speed is the differential speed between the movingcrosshead and the supports.
Modulus of rupture (R)—twelve 3 by 6 in. (76 by 152 mm)Tension parallel to surface (T)—four 2 by 10 in. (51 by 254 mm)Tension perpendicular to surface (B)—three 2 by 2 in. (51 by 51 mm)Water absorption and swelling (W)—one 12 by 12 in. (304 by 304 mm)
NOTE 1—The suffix numbers may be used to identify individual specimens by location and to record specimen test data.FIG. 34 Diagram for Cutting Test Specimens from Hardboard Test Panel
D1037 − 12
29
Copyright by ASTM Int'l (all rights reserved); Tue Aug 5 14:01:53 EDT 2014Downloaded/printed byLIZBETH SANDOVAL (JRE INGENIERIA Y SERVICIOS S.A.C.) pursuant to License Agreement. No further reproductions authorized.

33.3.5 The load shall be applied until definite failure occurs.The maximum load shall be recorded to accuracy of the testingmachine.
33.4 Calculation and Report33.4.1 The modulus of rupture shall be calculated for each
specimen in accordance with the following equation:
Rb 53PmaxL
2bd2 (18)
where:b = width of specimen, in. (mm),d = thickness of specimen, in. (mm),L = length of span, inch (mm),P = maximum load, lbf (N), andRb = modulus of rupture, psi (MPa).
33.4.2 The average modulus of rupture of the twelve speci-mens for each test panel shall be reported to the nearest 100 psi(0.5 MPa).
34. Tension Parallel to Surface
34.1 Procedure34.1.1 The procedure for determining tension parallel to
surface shall be the same as that provided in Section 10, exceptthat the uniform rate of separation of the jaws of the tensilegrips shall be 0.15 6 0.025 in./min. (3.8 6 0.6 mm/min.).From each test panel, two specimens shall be selected with thelong dimension parallel and two specimens with the longdimension perpendicular to the long dimension of the testpanel, as shown in Fig. 34. The thickness of each specimenshall be measured to the nearest 0.001 in. (0.02 mm) and thewidth to the nearest 0.01 in. (0.2 mm).
34.2 Calculation and Report34.2.1 The tension shall be calculated for each specimen in
accordance with Eq 6.34.2.2 The average tension of the four specimens for each
test panel shall be reported to the nearest 100 psi (0.5 MPa).
35. Tension Perpendicular to Surface
35.1 Procedure35.1.1 The procedure for determining tension perpendicular
to surface shall be the same as that provided in Section 11,except that the uniform rate of separation of the heads of thetesting machine shall be 0.15 6 0.025 in./min. (3.8 6 0.6mm/min.). From each test panel, three specimens shall beselected for test as shown in Fig. 34. Saw each test specimenaccurately so that it is 2.00 6 0.01 in. (50.8 6 0.2 mm) on aside. If improper adhesion of the metal loading blocks to thespecimen is indicated by less than 95 % fiber transfer at failure,the tests shall be repeated using supplemental specimensobtained from the same general area of the test panel as theoriginal specimens.
35.2 Calculation and Report35.2.1 The tension perpendicular to surface shall be calcu-
lated for each specimen in accordance with Eq 7.35.2.2 The average tension of the three specimens from
each test panel shall be reported to the nearest 5 psi (0.05MPa).
36. Water Absorption and Thickness Swelling
36.1 Procedure36.1.1 The procedure for determining water absorption after
a 24-h immersion shall be the same as that provided in Section23, Method B on a single 12-in. (305-mm) square specimen(see Note 58), as shown in Fig. 34.
NOTE 58—A 6 by 6-in. (152 by 152-mm) specimen may be used forconvenience as an alternative size. The smaller specimen will usuallyyield slightly higher values for water absorption. In cases where dispute islikely because of amount of water absorbed, the 12-in. square specimensshould be used.
36.2 Calculation and Report36.2.1 The water absorption and average thickness swelling
values shall be calculated for each test panel, and reported tothe nearest 1 % on a weight basis.
37. Moisture Content and Specific Gravity
37.1 Moisture content and specific gravity of each modulus-of-rupture specimen shall be determined based on the volumeat test and ovendry weight in accordance with Test MethodsD4442 and D2395. The average values shall be reported foreach test panel to the nearest 0.1 % for moisture content and0.01 for specific gravity. See Note 59.
NOTE 59—For some specification purposes it may be advantageous toreport density instead of specific gravity. When this is so, report theaverage density in lb/ft3 to the nearest 1 lb/ft3.
38. Report
38.1 The data reported shall include, in addition to theactual test results and data called for specifically under eachtest, a description of the material, sampling procedure, recordof any conditioning or treatment, and notes regarding anyspecific details that may have a bearing on the test results.
39. Precision and Bias
39.1 Statements on precision and bias have not been devel-oped for these methods. Precision will be estimated in accor-dance with the interlaboratory test program prescribed byPractice E691.
40. Keywords
40.1 hardboard; medium density fiberboard; oriented strandboard; panels; particleboard; particle panel materials; wood;wood-base fiber; wood-base panel
D1037 − 12
30
Copyright by ASTM Int'l (all rights reserved); Tue Aug 5 14:01:53 EDT 2014Downloaded/printed byLIZBETH SANDOVAL (JRE INGENIERIA Y SERVICIOS S.A.C.) pursuant to License Agreement. No further reproductions authorized.
ASTM International takes no position respecting the validity of any patent rights asserted in connection with any item mentionedin this standard. Users of this standard are expressly advised that determination of the validity of any such patent rights, and the riskof infringement of such rights, are entirely their own responsibility.
This standard is subject to revision at any time by the responsible technical committee and must be reviewed every five years andif not revised, either reapproved or withdrawn. Your comments are invited either for revision of this standard or for additional standardsand should be addressed to ASTM International Headquarters. Your comments will receive careful consideration at a meeting of theresponsible technical committee, which you may attend. If you feel that your comments have not received a fair hearing you shouldmake your views known to the ASTM Committee on Standards, at the address shown below.
This standard is copyrighted by ASTM International, 100 Barr Harbor Drive, PO Box C700, West Conshohocken, PA 19428-2959,United States. Individual reprints (single or multiple copies) of this standard may be obtained by contacting ASTM at the aboveaddress or at 610-832-9585 (phone), 610-832-9555 (fax), or [email protected] (e-mail); or through the ASTM website(www.astm.org). Permission rights to photocopy the standard may also be secured from the ASTM website (www.astm.org/COPYRIGHT/).
D1037 − 12
31
Copyright by ASTM Int'l (all rights reserved); Tue Aug 5 14:01:53 EDT 2014Downloaded/printed byLIZBETH SANDOVAL (JRE INGENIERIA Y SERVICIOS S.A.C.) pursuant to License Agreement. No further reproductions authorized.