Embed Size (px)
Citation preview
Universita degli Studi di Padova
FACOLTA DI SCIENZE MATEMATICHE, FISICHE E NATURALI
Dipartimento di Fisica ”G. Galilei”
Corso di Laurea Triennale in Fisica
Tesi per il conseguimento dellaLaurea Triennale in Fisica
Compton imaging with the highly segmented
germanium detectors of AGATA
Relatore: Chiar.mo Prof. Santo Lunardi
Correlatore: Dott. Francesco Recchia
Laureando: Martino Borsato
September 13, 2010
Contents
1 Introduction 2
1.1 Gamma imaging . . . . . . . . . . . . . . . . . . . . . . . . . . . . . 21.2 Gamma-ray tracking arrays . . . . . . . . . . . . . . . . . . . . . . 3
1.2.1 Gamma-ray tracking . . . . . . . . . . . . . . . . . . . . . . 41.2.2 Pulse shape analysis . . . . . . . . . . . . . . . . . . . . . . 6
1.3 The AGATA project . . . . . . . . . . . . . . . . . . . . . . . . . . 7
2 Compton imaging with the AGATA Array 9
2.1 Description of the experimental setup . . . . . . . . . . . . . . . . . 102.2 Presort and tracking . . . . . . . . . . . . . . . . . . . . . . . . . . 112.3 Far field imaging . . . . . . . . . . . . . . . . . . . . . . . . . . . . 132.4 Near field imaging . . . . . . . . . . . . . . . . . . . . . . . . . . . 15
2.4.1 Sources of error and weighting functions . . . . . . . . . . . 162.5 Discussion of the results . . . . . . . . . . . . . . . . . . . . . . . . 18
i
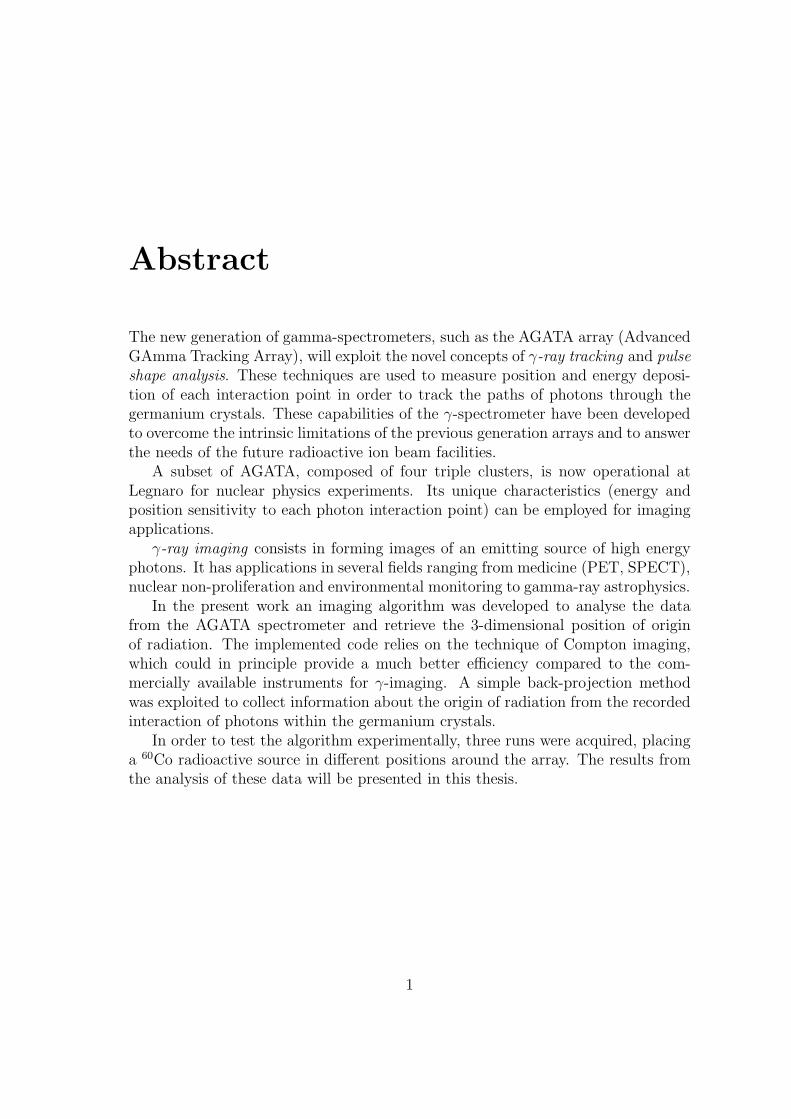
Abstract
The new generation of gamma-spectrometers, such as the AGATA array (AdvancedGAmma Tracking Array), will exploit the novel concepts of γ-ray tracking and pulseshape analysis. These techniques are used to measure position and energy deposi-tion of each interaction point in order to track the paths of photons through thegermanium crystals. These capabilities of the γ-spectrometer have been developedto overcome the intrinsic limitations of the previous generation arrays and to answerthe needs of the future radioactive ion beam facilities.
A subset of AGATA, composed of four triple clusters, is now operational atLegnaro for nuclear physics experiments. Its unique characteristics (energy andposition sensitivity to each photon interaction point) can be employed for imagingapplications.
γ-ray imaging consists in forming images of an emitting source of high energyphotons. It has applications in several fields ranging from medicine (PET, SPECT),nuclear non-proliferation and environmental monitoring to gamma-ray astrophysics.
In the present work an imaging algorithm was developed to analyse the datafrom the AGATA spectrometer and retrieve the 3-dimensional position of originof radiation. The implemented code relies on the technique of Compton imaging,which could in principle provide a much better efficiency compared to the com-mercially available instruments for γ-imaging. A simple back-projection methodwas exploited to collect information about the origin of radiation from the recordedinteraction of photons within the germanium crystals.
In order to test the algorithm experimentally, three runs were acquired, placinga 60Co radioactive source in different positions around the array. The results fromthe analysis of these data will be presented in this thesis.
1
Chapter 1
Introduction
1.1 Gamma imaging
The goal of a gamma-ray imaging detector is to retrieve information on the positionof the γ-radiation source. The energy range of interest for our instrumentation isbetween 100 keV and few MeV, namely the typical energy range of high-resolutionγ-ray spectroscopy. The interaction with matter of photons of this energy is charac-terized by discrete scatterings, therefore reflection and refraction imaging methodsare not exploitable.
So far, different approaches have been developed to track gamma-rays. Deal-ing in particular with medical functional imaging, conventional techniques are PET(Positron Emission Tomography) and SPECT (Single-Photon Emission ComputedTomography) [1].PET images β+ decaying radioisotopes by detecting the two 511 keV positron anni-hilation photons in temporal coincidence. Each event individuates the source to liesomewhere along the straight line between the two interaction points. This methodsuffers an intrinsic resolution limit due to the finite range of positron before anni-hilation.SPECT instead uses single photon events and usually exploits collimators to retrievethe γ-ray direction. This method has less efficiency, which in medical imaging even-tually means higher doses for the patient. Collimator based detectors are used alsoin astrophysics devices like the SPI spectrometer of INTEGRAL [2].
An alternative solution is Compton Imaging [3, 4], a technique still under de-velopment that uses tracking detectors and does not need collimators. This is thetechnique adopted to carry out γ-imaging through the AGATA detectors and willbe reviewed in chapter 2.
2
1.2 Gamma-ray tracking arrays
Many technical advances in gamma-ray detection devices have been carried out sofar and each of them has resulted in significant new insights into nuclear science.Following the early works using inorganic scintillators, such as NaI(Tl), the majorprogress was the employment of detectors based on semiconductor materials. Thisdevelopment eventually led to the manufacture of solid-state germanium detectors,namely Ge(Li) and HPGe. The better resolution of germanium detectors comes atthe cost of a worse response function, due to the large background generated byphoton escape after Compton scattering. This is the cause of the so-called Comp-ton continuum in the energy spectra, which can obscure low-intensity peaks. Thislimitation has been overcome by devices such as GASP, EUROGAM, EUROBALLand GAMMASPHERE through the use of Compton-suppression shields. They areveto detectors shielded from direct radiation and surrounding the germanium crys-tals. To be effective they must have high efficiency while being compact and for thisreasons BGO detectors have been the pivotal choice. Compton-suppressed HPGedetectors increased the attainable P/T ratio from 30% to 60%, but at the cost ofan intrinsic efficiency limit, due to the shields covering a large fraction of the solidangle.
This limitation in efficiency is the basic motivation for the ultimate step per-formed in the development of gamma-detection techniques. The advances in semi-conductor detector technologies of the last decade resulted in the development ofa new generation of gamma-ray detectors, namely gamma-ray tracking detectors,composed of highly segmented germanium diodes. These new detectors for gamma-radiation, bringing together the position sensitivity with the best available energyresolution, promise to drastically change the field of nuclear spectroscopy.They meet the requirements posed by the planned and under construction radioac-tive ion beam facilities, providing high efficiency also at high multiplicities and highgranularity together with sub-segment position resolution. The removal of the BGOshields yields a considerable gain in the solid angle which can be covered by germa-nium, thus increasing the detection efficiency. In order to preserve a good P/T andrecover the full energy of the photons that scatter from one crystal to another, thetrajectories of the photons have to be reconstructed, basing on the position sensi-tivity of the detectors. This task is undertaken by the newly developed techniquesof pulse shape analysis and gamma-ray tracking, which will be reviewed in the fol-lowing sections. Two major projects aim at the construction of 4π arrays based onthese novel concepts: GRETA in the USA [5] and AGATA [6] in Europe. In thefollowing, a brief description of the gamma-ray tracking principles is reported, witha particular attention to their use in the AGATA project.
3
1.2.1 Gamma-ray tracking
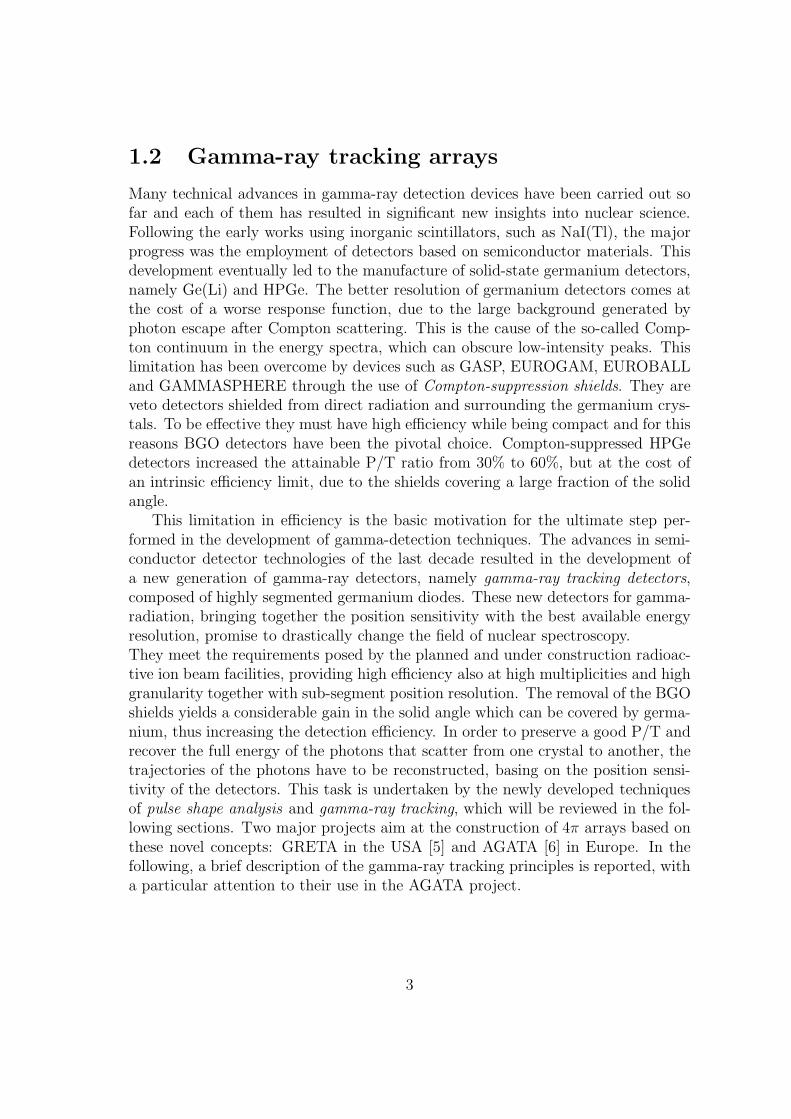
The goal of a tracking algorithm is to disentangle all the interaction points in anevent and determine the total energy as well as the emission direction of the photonswhich have been fully absorbed in the spectrometer. To this purpose, the knowledgeof energy and position of each single interaction point is needed. This information isobtained through electrical segmentation of the detectors and through pulse shapeanalysis (PSA) techniques, providing sub-segment localization, which is needed toobtain the required values of photopeak efficiency. The performance of AGATAare strongly related to the quality of the gamma-ray tracking [8]; the scientificcommunity is therefore making a strong effort to develop an algorithm with the bestachievable reconstruction efficiency. The approaches proposed so far can be dividedinto two classes: back-tracking algorithms and clusterization algorithms (or forward-tracking) [9, 10]. All of them rely on the physical properties of the interactionof photons within germanium, that is the cross sections of the possible processes(Fig. 1.1) and their kinematics. The most probable interaction process for theenergy range of interest in Nuclear Structure is the Compton scattering. Scatteringsequences that are considered as gamma candidate are then tested, basing on theCompton scattering formula (1.1) and on the Klein-Nishina angular distribution[11].
E ′γ =
Eγ
1 + Eγ
mec2(1 − cos α)
(1.1)
Also the geometry of the detector is taken into account, because the real distancetravelled in germanium between two interaction points have to be computed, in
Figure 1.1: Interaction cross sections in germanium against photon energy [7].
4
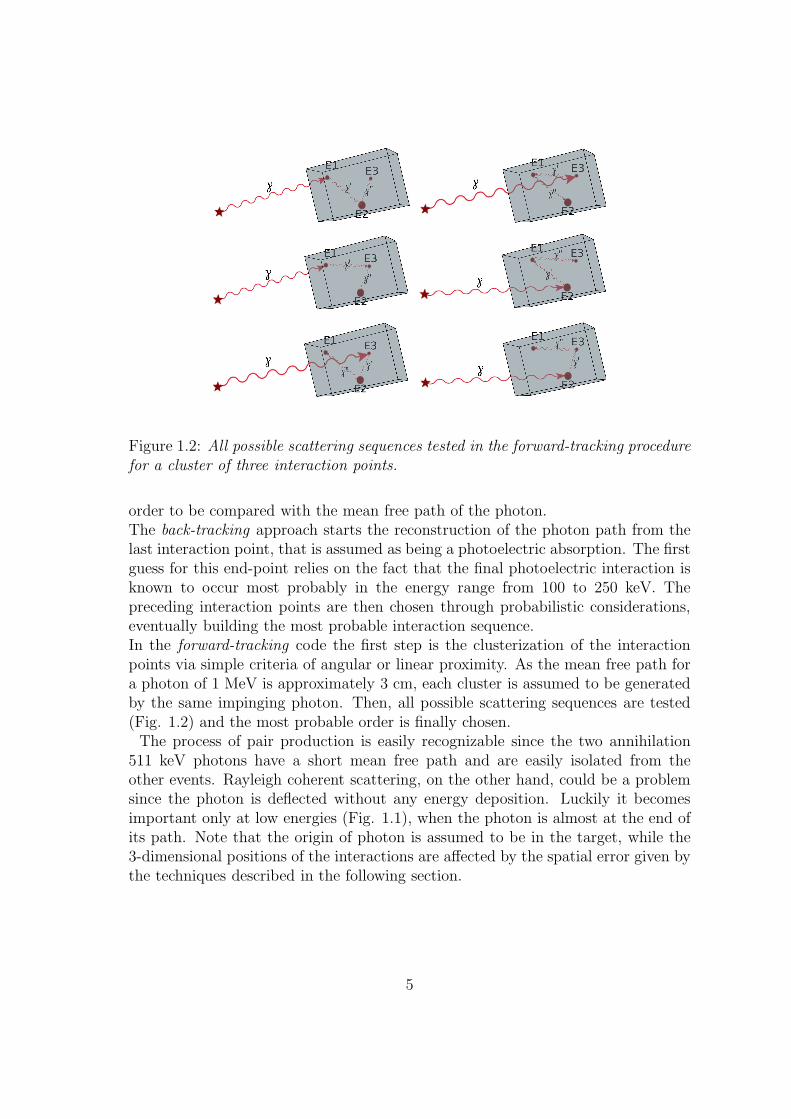
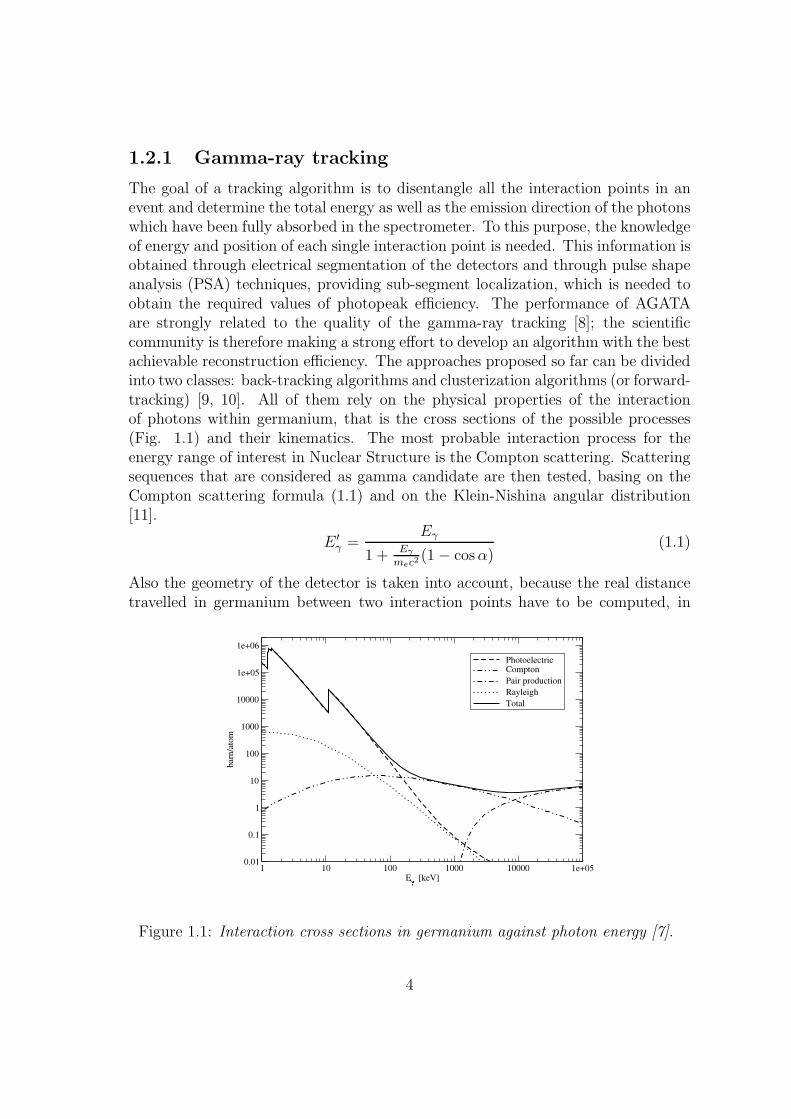
Figure 1.2: All possible scattering sequences tested in the forward-tracking procedurefor a cluster of three interaction points.
order to be compared with the mean free path of the photon.The back-tracking approach starts the reconstruction of the photon path from thelast interaction point, that is assumed as being a photoelectric absorption. The firstguess for this end-point relies on the fact that the final photoelectric interaction isknown to occur most probably in the energy range from 100 to 250 keV. Thepreceding interaction points are then chosen through probabilistic considerations,eventually building the most probable interaction sequence.In the forward-tracking code the first step is the clusterization of the interactionpoints via simple criteria of angular or linear proximity. As the mean free path fora photon of 1 MeV is approximately 3 cm, each cluster is assumed to be generatedby the same impinging photon. Then, all possible scattering sequences are tested(Fig. 1.2) and the most probable order is finally chosen.
The process of pair production is easily recognizable since the two annihilation511 keV photons have a short mean free path and are easily isolated from theother events. Rayleigh coherent scattering, on the other hand, could be a problemsince the photon is deflected without any energy deposition. Luckily it becomesimportant only at low energies (Fig. 1.1), when the photon is almost at the end ofits path. Note that the origin of photon is assumed to be in the target, while the3-dimensional positions of the interactions are affected by the spatial error given bythe techniques described in the following section.
5
1.2.2 Pulse shape analysis
As discussed previously, in order to obtain the desired values of photopeak efficiency,the γ-ray tracking algorithm should be provided with sub-segment information.To this purpose a technique has been developed, that relies on the simultaneousanalysis of the digitized signals from all the segments. The basic principle is thatthe drift of electrons and holes towards the electrodes induces a net-charge signalon the segment where the interaction took place, as well as transient signals inthe neighbouring segments (Fig. 1.3). The signals induced in the neighbouringsegments are essential to retrieve the 3-dimensional position of the interaction,since the information contained in the hit segment signal could give only the radialdistance [11].
The method of pulse shape analysis relies on a direct comparison of the mea-sured pulse shapes to a signal basis. To obtain such a reference basis, experimentalmethods as well as computational simulations have been applied and are still underdevelopment. Several experimental scanning tables were built to record signals fromdefinite interaction points. These devices employ a radioactive source together withpositional detectors and collimators in order to select a well defined interaction po-sition within the detector (see [10, 12] for a brief overview). Mathematical methodson the other hand compute the induced signals for a set of interaction points solvingnumerically the differential equations that describe the physical processes occurring
F
A
B
3 4 5
Figure 1.3: Signals (Amplitude[ADC-units] vs Time[ns]) from two different interac-tion points (red and blue). A net-charge signal is present on the hit segment labelledA4, while transients are evident in the signals from the neighbouring segments.Please, note the different vertical scale for the net-charge segment.
6
during the charge collection. Anyway, the obtained signal basis generally depend ona set of parameters that are computationally fit to the experimental results from thescanning tables. At present the interaction position is retrieved with a resolution≤ 5mm, which is good enough to perform an efficient tracking [10].
1.3 The AGATA project
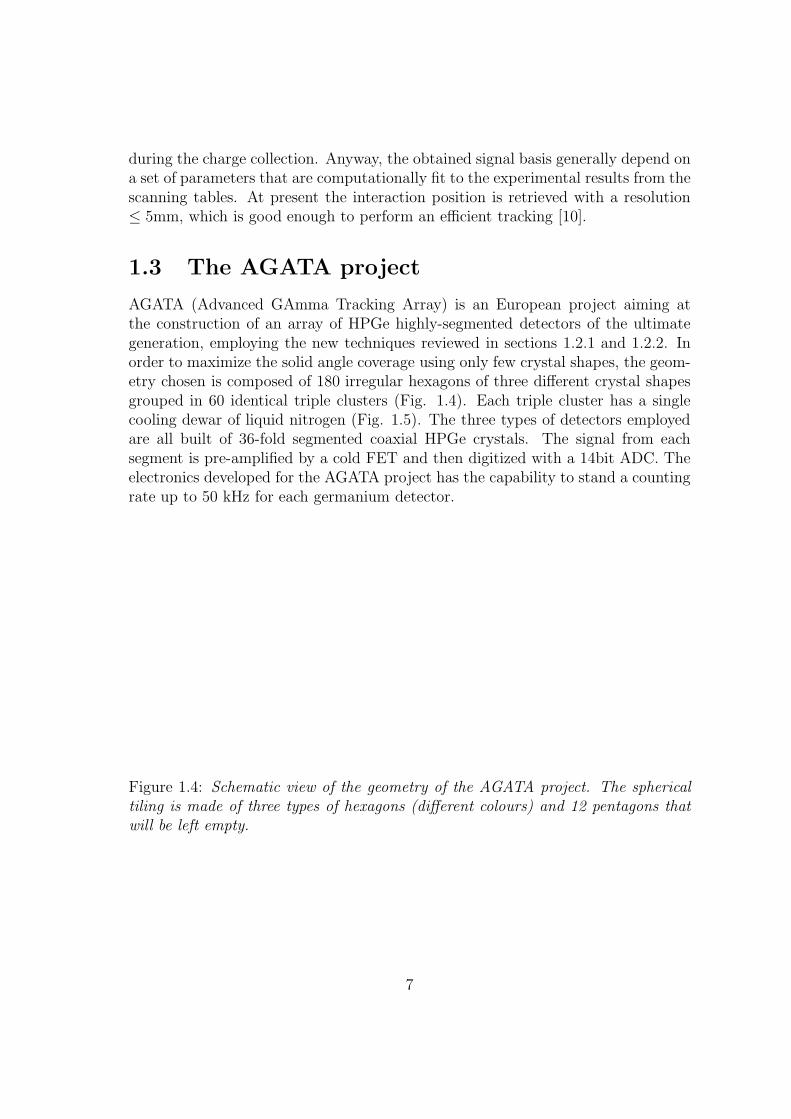
AGATA (Advanced GAmma Tracking Array) is an European project aiming atthe construction of an array of HPGe highly-segmented detectors of the ultimategeneration, employing the new techniques reviewed in sections 1.2.1 and 1.2.2. Inorder to maximize the solid angle coverage using only few crystal shapes, the geom-etry chosen is composed of 180 irregular hexagons of three different crystal shapesgrouped in 60 identical triple clusters (Fig. 1.4). Each triple cluster has a singlecooling dewar of liquid nitrogen (Fig. 1.5). The three types of detectors employedare all built of 36-fold segmented coaxial HPGe crystals. The signal from eachsegment is pre-amplified by a cold FET and then digitized with a 14bit ADC. Theelectronics developed for the AGATA project has the capability to stand a countingrate up to 50 kHz for each germanium detector.
Figure 1.4: Schematic view of the geometry of the AGATA project. The sphericaltiling is made of three types of hexagons (different colours) and 12 pentagons thatwill be left empty.
7
a b c d
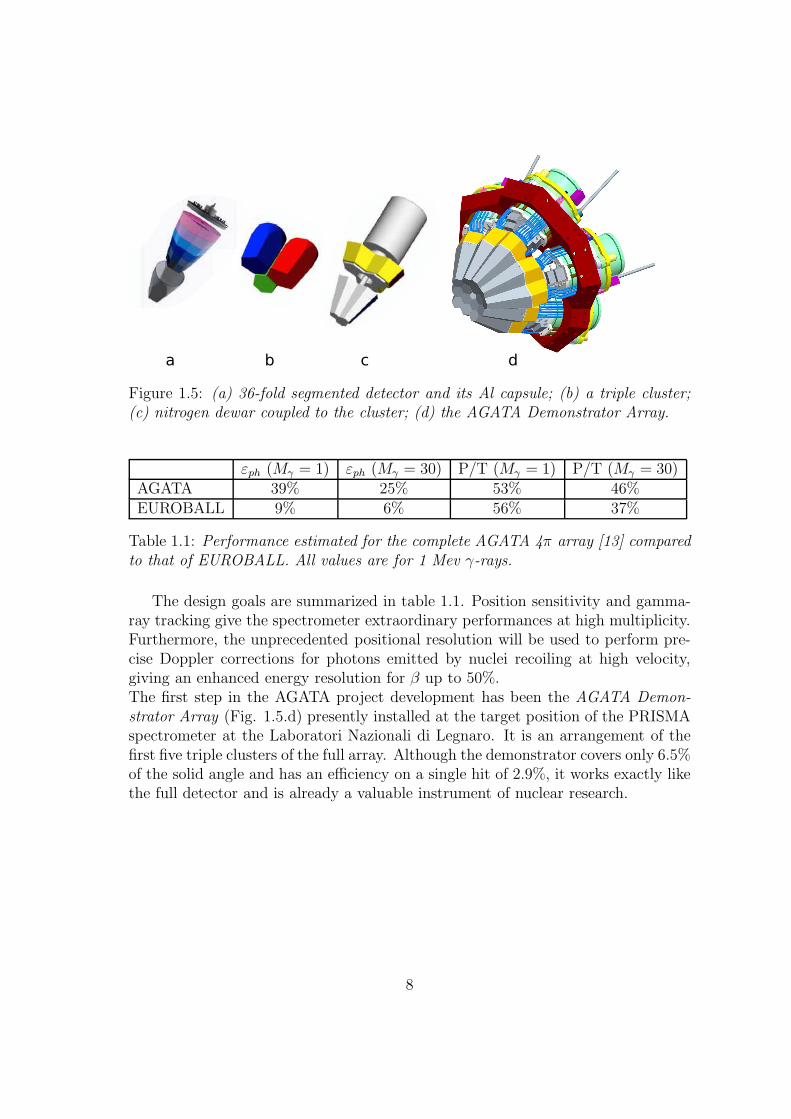
Figure 1.5: (a) 36-fold segmented detector and its Al capsule; (b) a triple cluster;(c) nitrogen dewar coupled to the cluster; (d) the AGATA Demonstrator Array.
εph (Mγ = 1) εph (Mγ = 30) P/T (Mγ = 1) P/T (Mγ = 30)AGATA 39% 25% 53% 46%EUROBALL 9% 6% 56% 37%
Table 1.1: Performance estimated for the complete AGATA 4π array [13] comparedto that of EUROBALL. All values are for 1 Mev γ-rays.
The design goals are summarized in table 1.1. Position sensitivity and gamma-ray tracking give the spectrometer extraordinary performances at high multiplicity.Furthermore, the unprecedented positional resolution will be used to perform pre-cise Doppler corrections for photons emitted by nuclei recoiling at high velocity,giving an enhanced energy resolution for β up to 50%.The first step in the AGATA project development has been the AGATA Demon-strator Array (Fig. 1.5.d) presently installed at the target position of the PRISMAspectrometer at the Laboratori Nazionali di Legnaro. It is an arrangement of thefirst five triple clusters of the full array. Although the demonstrator covers only 6.5%of the solid angle and has an efficiency on a single hit of 2.9%, it works exactly likethe full detector and is already a valuable instrument of nuclear research.
8
Chapter 2
Compton imaging with the
AGATA Array
Thanks to the position sensitivity of the AGATA germanium crystals, they could inprinciple be used as imaging detectors with both high energy and position resolution.Avoiding the use of collimators it is possible to obtain both a much higher efficiencyas well as a 4π vision gamma-camera.
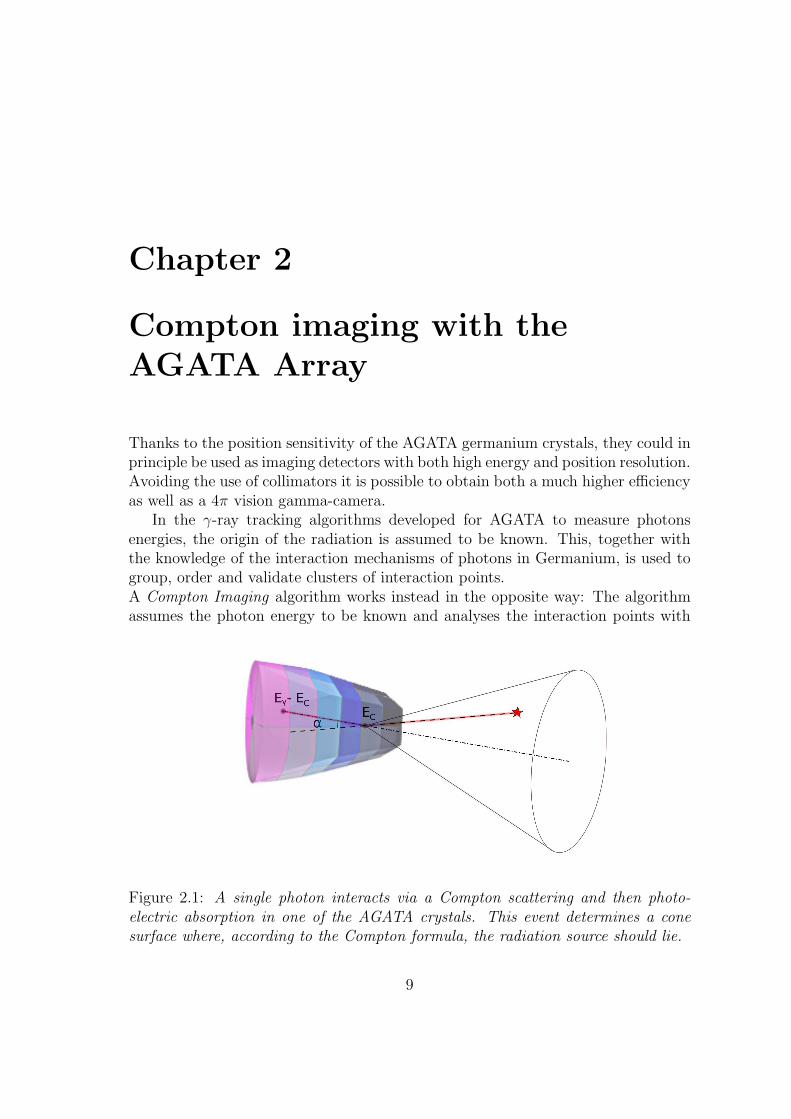
In the γ-ray tracking algorithms developed for AGATA to measure photonsenergies, the origin of the radiation is assumed to be known. This, together withthe knowledge of the interaction mechanisms of photons in Germanium, is used togroup, order and validate clusters of interaction points.A Compton Imaging algorithm works instead in the opposite way: The algorithmassumes the photon energy to be known and analyses the interaction points with
Figure 2.1: A single photon interacts via a Compton scattering and then photo-electric absorption in one of the AGATA crystals. This event determines a conesurface where, according to the Compton formula, the radiation source should lie.
9
the Compton formula to retrieve information about the direction of the incomingphoton. It assumes that one interaction point corresponds to a Compton scatteringand use the energy deposited in the interaction (EC = Eγ − E ′
γ) to estimate thescattering angle (α) via the Compton scattering formula (1.1). Therefore, for asingle γ-ray, the direction identified by the first two interaction points and theestimated scattering angle determine the origin of radiation to lie on a cone surface,as sketched in Fig. 2.1 (this is sometimes referred to as electronic collimation [4]).In order to form images the information from many events should be combinedtogether. The most direct way of doing this is simply overlapping the cones resultingfrom each individual event. The image obtained in this way is called simple back-projection [14].
2.1 Description of the experimental setup
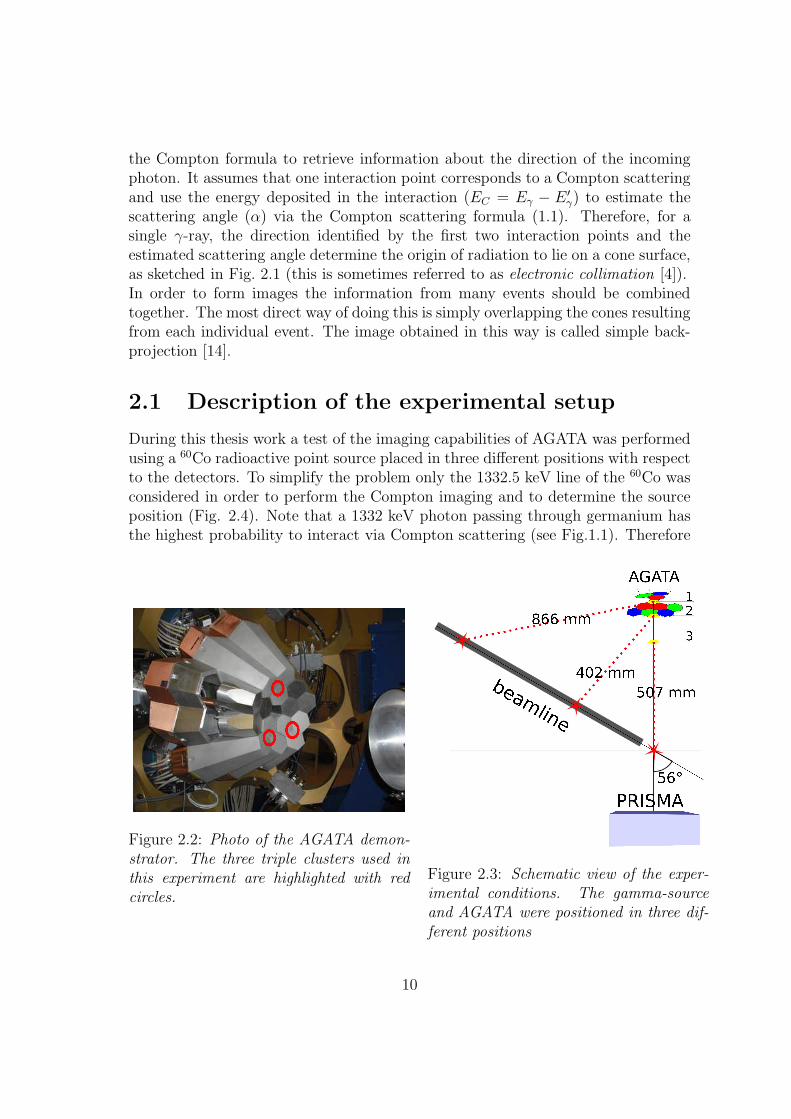
During this thesis work a test of the imaging capabilities of AGATA was performedusing a 60Co radioactive point source placed in three different positions with respectto the detectors. To simplify the problem only the 1332.5 keV line of the 60Co wasconsidered in order to perform the Compton imaging and to determine the sourceposition (Fig. 2.4). Note that a 1332 keV photon passing through germanium hasthe highest probability to interact via Compton scattering (see Fig.1.1). Therefore
Figure 2.2: Photo of the AGATA demon-strator. The three triple clusters used inthis experiment are highlighted with redcircles.
PRISMA
Figure 2.3: Schematic view of the exper-imental conditions. The gamma-sourceand AGATA were positioned in three dif-ferent positions
10
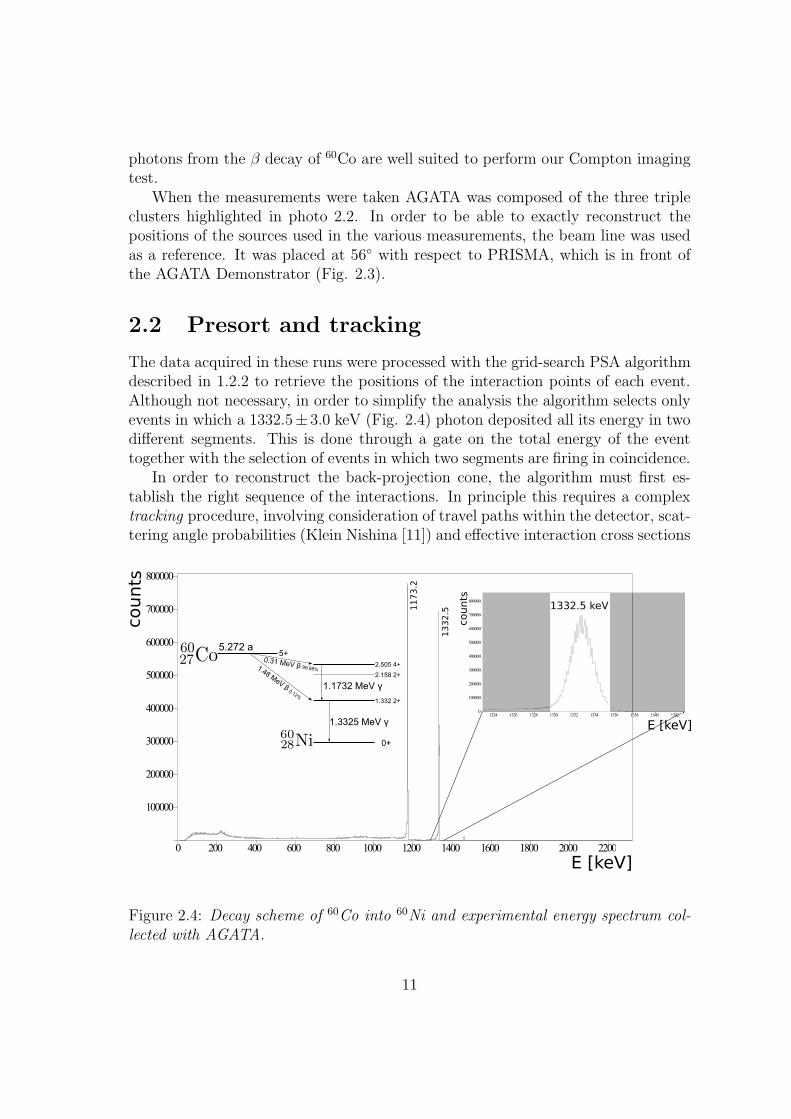
photons from the β decay of 60Co are well suited to perform our Compton imagingtest.
When the measurements were taken AGATA was composed of the three tripleclusters highlighted in photo 2.2. In order to be able to exactly reconstruct thepositions of the sources used in the various measurements, the beam line was usedas a reference. It was placed at 56◦ with respect to PRISMA, which is in front ofthe AGATA Demonstrator (Fig. 2.3).
2.2 Presort and tracking
The data acquired in these runs were processed with the grid-search PSA algorithmdescribed in 1.2.2 to retrieve the positions of the interaction points of each event.Although not necessary, in order to simplify the analysis the algorithm selects onlyevents in which a 1332.5± 3.0 keV (Fig. 2.4) photon deposited all its energy in twodifferent segments. This is done through a gate on the total energy of the eventtogether with the selection of events in which two segments are firing in coincidence.
In order to reconstruct the back-projection cone, the algorithm must first es-tablish the right sequence of the interactions. In principle this requires a complextracking procedure, involving consideration of travel paths within the detector, scat-tering angle probabilities (Klein Nishina [11]) and effective interaction cross sections
0 200 400 600 800 1000 1200 1400 1600 1800 2000 22000
100000
200000
300000
400000
500000
600000
700000
800000
E [keV]
counts
13
32
.5
11
73
.2
99.88%
0.31 MeV β
5.272 a
0.12%
1.48 MeV β 1.1732 MeV γ
1.3325 MeV γ
2.505 4+
2.158 2+
1.332 2+
0+
5+
1324 1326 1328 1330 1332 1334 1336 1338 1340 134200
100000
200000
300000
400000
500000
600000
700000
800000
E [keV]
counts
1332.5 keV
Figure 2.4: Decay scheme of 60Co into 60Ni and experimental energy spectrum col-lected with AGATA.
11
[15]. For this algorithm it was decided to rely on a simple probabilistic consider-ation (later the validity of this simplification will be justified on the basis of theexperimental results). Given that the selected events have just 2 interactions in thecrystal, we know from Monte Carlo calculations [13] that the first interaction pointcorresponds with the highest probability to the larger energy deposition. This is notphysically possible if the energy of the first interaction exceeds the back scatteringenergy Ebs = Eγ − E ′
γ|θ=π (which is the maximum energy that can be deposited inCompton scattering) and in this case the algorithm switches the interactions order.One more gate was put to reject events with two adjacent segments firing. Thisreduces the interference between the segments and excludes these complex eventsfrom our analysis.
For each event the algorithm should draw a back-projection cone in the infinite3-dimensional space in order to overlap them all and find the source position. Abinning of the 3-D space is not practical, so two simplified solutions have beenapplied in this work, which we will refer to as far field imaging and near fieldimaging.
12
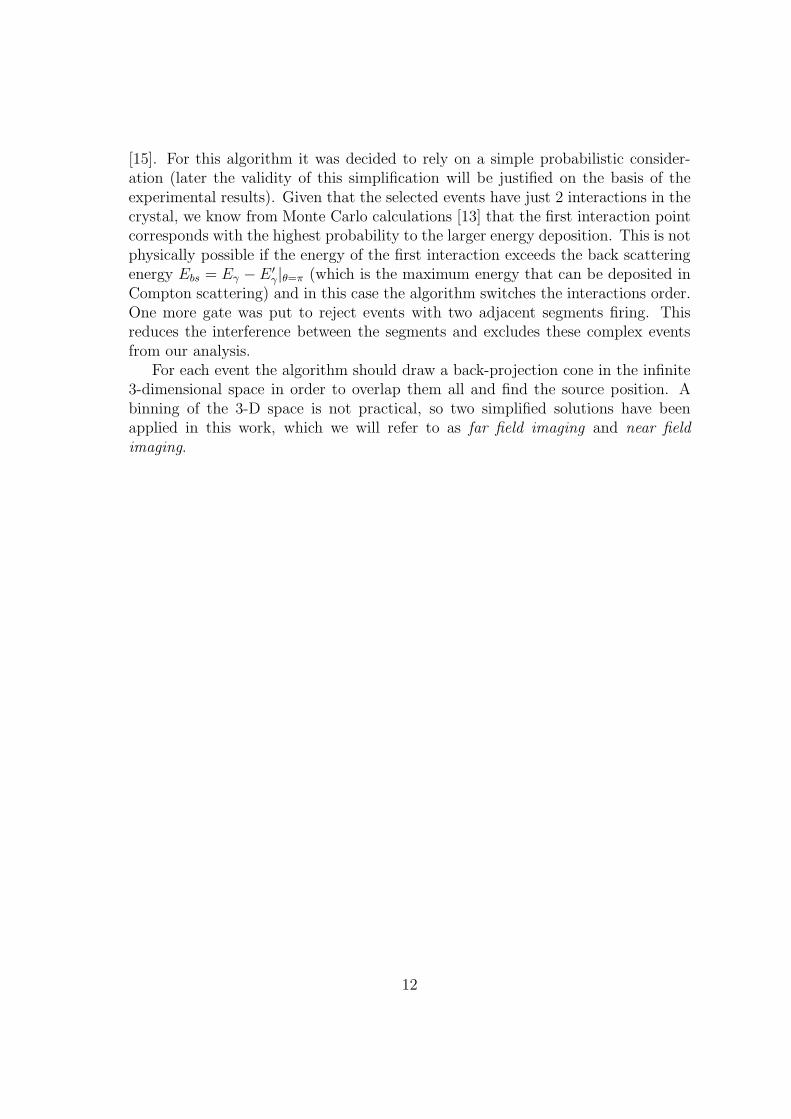
2.3 Far field imaging
This algorithm was developed for the test of the imaging capabilities of a single seg-mented crystal of AGATA [10]. In that particular case the “focus” of the imagingprojection was set to infinity and therefore parallel γ-rays were assumed as originat-ing from the same position. For this reason all the cones vertices were located at thesame point in the centre of the Germanium crystal (instead of putting them at eachCompton scattering point). In this simplified working condition it was sufficientto intersect circles on a spherical surface as sketched in Fig. 2.5, rather than conesin the 3-dimensional space. The simple algorithm developed to write the circlesparametrizes the spherical surface through two angular coordinates, θ and ϕ, andsamples it with pixels corresponding to discrete values of these angles. A 0.5◦ stepwas chosen, resulting in 360 × 720 pixels images of the 4π solid angle. As the coneaxis direction and the angular opening are computed, one of the pixels intersectedby the cone is chosen. Then, the algorithm finds out which of the neighbouringpixels is intersected by the same circle and works recursively until the full circleis closed (Fig. 2.6). Finally, for each circle a simple probability normalization iscarried out weighting the number of bins filled.
During the test described in [10], where the source was 1 m away and the detec-tor was composed of a single crystal, the assumption of this algorithm was “quite”satisfied, being the longest dimension of the detector about 10 cm. The same al-gorithm cannot be used for the analysis of the datasets of this thesis because thesource is in a closer position (866 mm, 507 mm and 402 mm) and the detector has“grown up”, being now composed of three triple clusters (9 crystals).The main error in the application of the far field imaging is the parallax due to
Figure 2.5: The far field imaging algorithm intersects cones with a detector-centredspherical surface. Then, it overlaps all the intersection circles in order to retrievethe radioactive source direction.
13
the different viewpoints of the 9 hexagonal crystals. The detectors see the sourceat different angles as they are in different positions with respect to it (Fig.2.7.a1).Actually, also considering a single crystal, each event will have a different view-point located in the first interaction point (coincident with the vertex of the back-projection cone), thus resulting both in a bias of the position reconstructed for thesource, as well as in a blur of the source image (Fig.2.7.b).
phi [deg]-180 -150 -120 -90 -60 -30 0 30 60 90 120 150 180
theta [deg]
-90
-60
-30
0
30
60
90
0
2
4
6
8
10
126
10x
(a) (b) (c) (d)
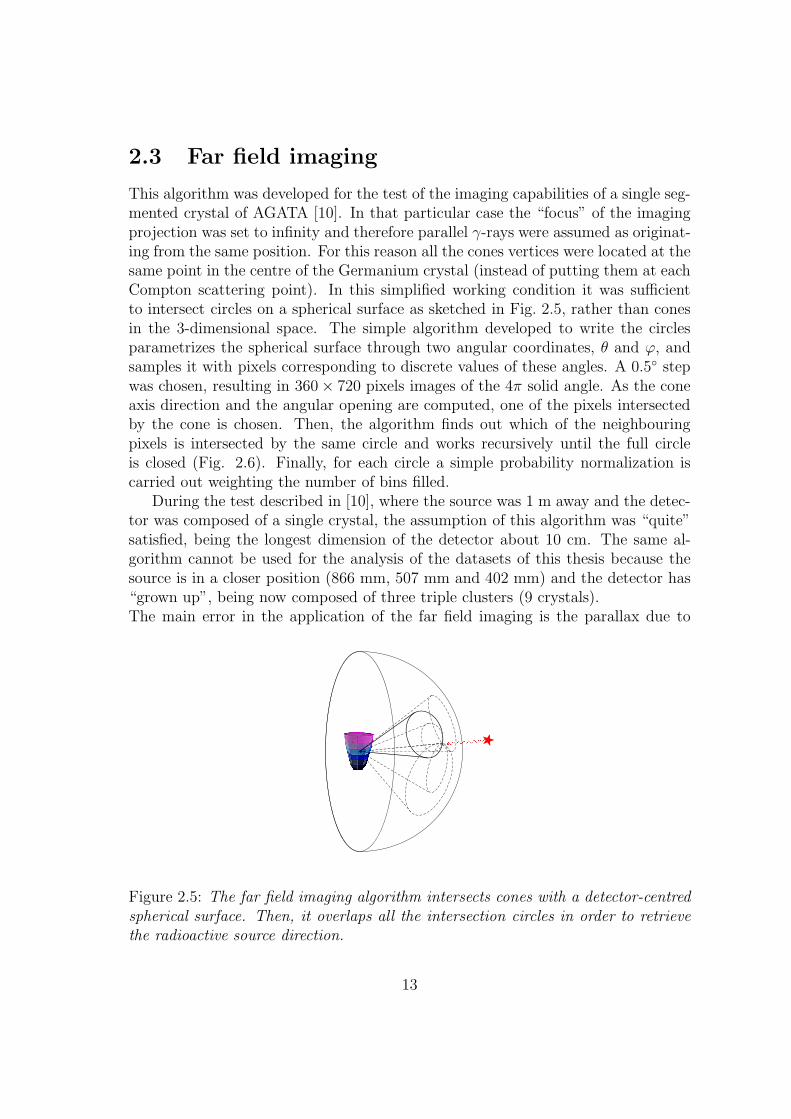
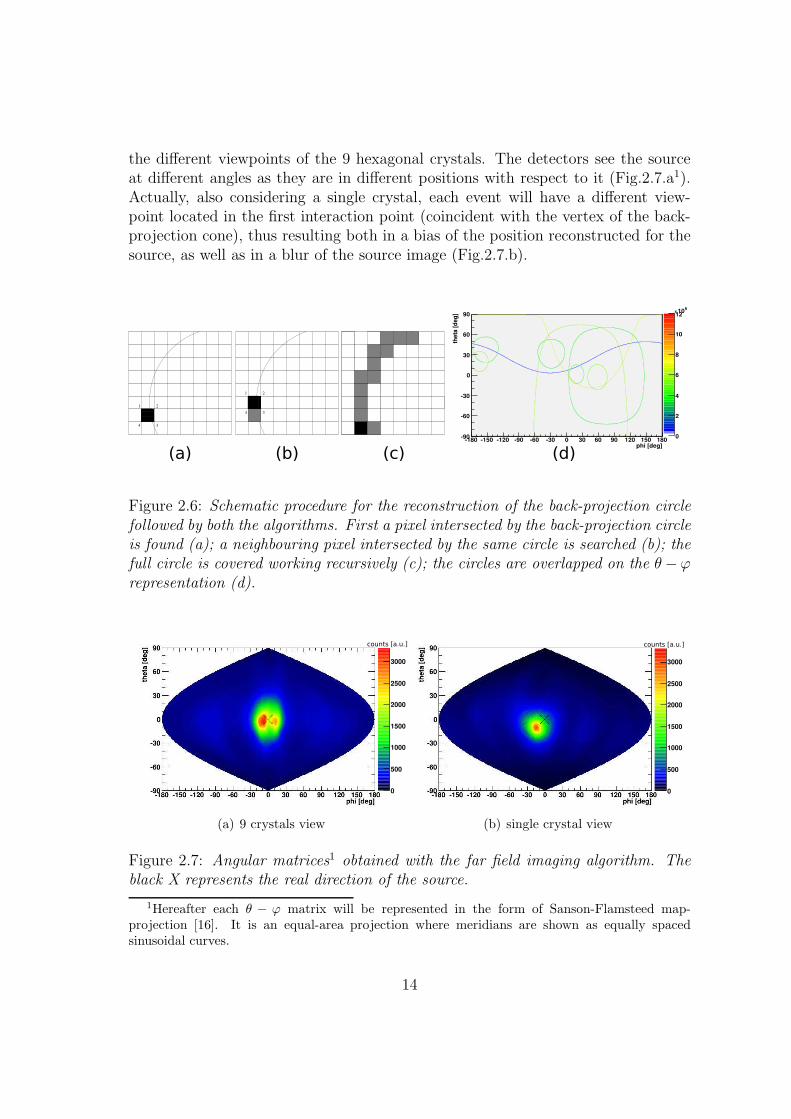
Figure 2.6: Schematic procedure for the reconstruction of the back-projection circlefollowed by both the algorithms. First a pixel intersected by the back-projection circleis found (a); a neighbouring pixel intersected by the same circle is searched (b); thefull circle is covered working recursively (c); the circles are overlapped on the θ −ϕrepresentation (d).
0
500
1000
1500
2000
2500
3000
counts [a.u.]
(a) 9 crystals view
0
500
1000
1500
2000
2500
3000
counts [a.u.]
(b) single crystal view
Figure 2.7: Angular matrices1 obtained with the far field imaging algorithm. Theblack X represents the real direction of the source.
1Hereafter each θ − ϕ matrix will be represented in the form of Sanson-Flamsteed map-projection [16]. It is an equal-area projection where meridians are shown as equally spacedsinusoidal curves.
14
2.4 Near field imaging
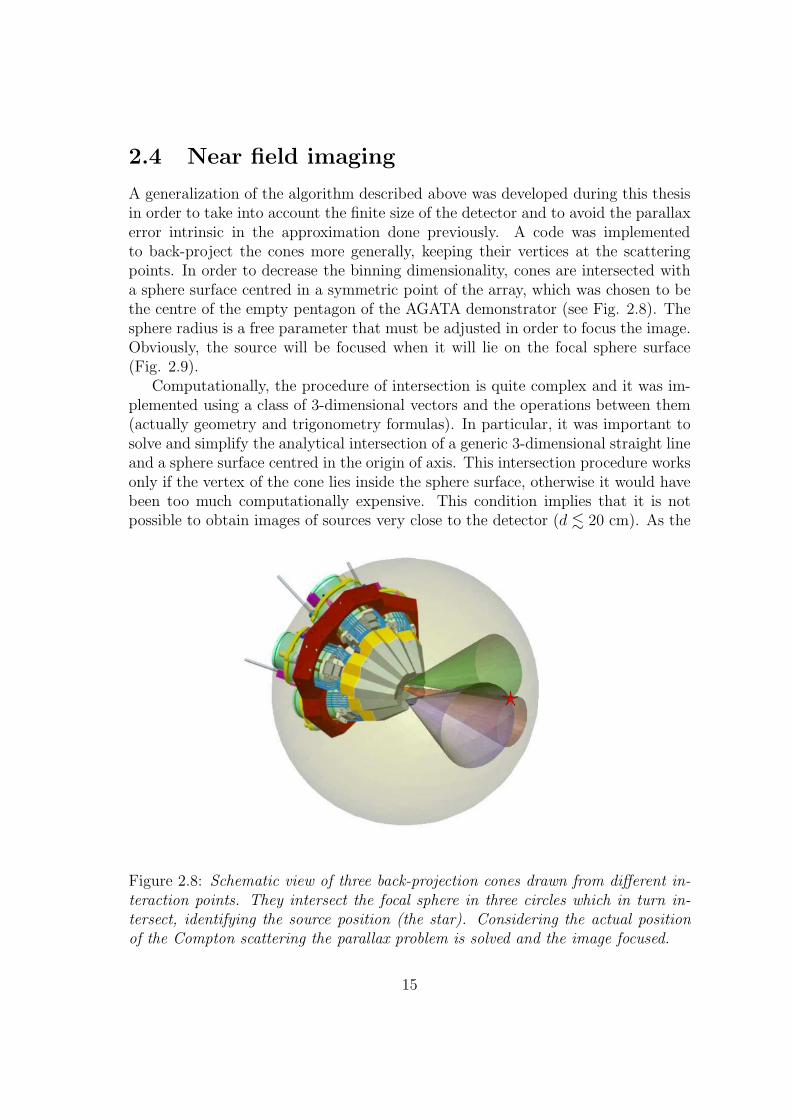
A generalization of the algorithm described above was developed during this thesisin order to take into account the finite size of the detector and to avoid the parallaxerror intrinsic in the approximation done previously. A code was implementedto back-project the cones more generally, keeping their vertices at the scatteringpoints. In order to decrease the binning dimensionality, cones are intersected witha sphere surface centred in a symmetric point of the array, which was chosen to bethe centre of the empty pentagon of the AGATA demonstrator (see Fig. 2.8). Thesphere radius is a free parameter that must be adjusted in order to focus the image.Obviously, the source will be focused when it will lie on the focal sphere surface(Fig. 2.9).
Computationally, the procedure of intersection is quite complex and it was im-plemented using a class of 3-dimensional vectors and the operations between them(actually geometry and trigonometry formulas). In particular, it was important tosolve and simplify the analytical intersection of a generic 3-dimensional straight lineand a sphere surface centred in the origin of axis. This intersection procedure worksonly if the vertex of the cone lies inside the sphere surface, otherwise it would havebeen too much computationally expensive. This condition implies that it is notpossible to obtain images of sources very close to the detector (d . 20 cm). As the
Figure 2.8: Schematic view of three back-projection cones drawn from different in-teraction points. They intersect the focal sphere in three circles which in turn in-tersect, identifying the source position (the star). Considering the actual positionof the Compton scattering the parallax problem is solved and the image focused.
15
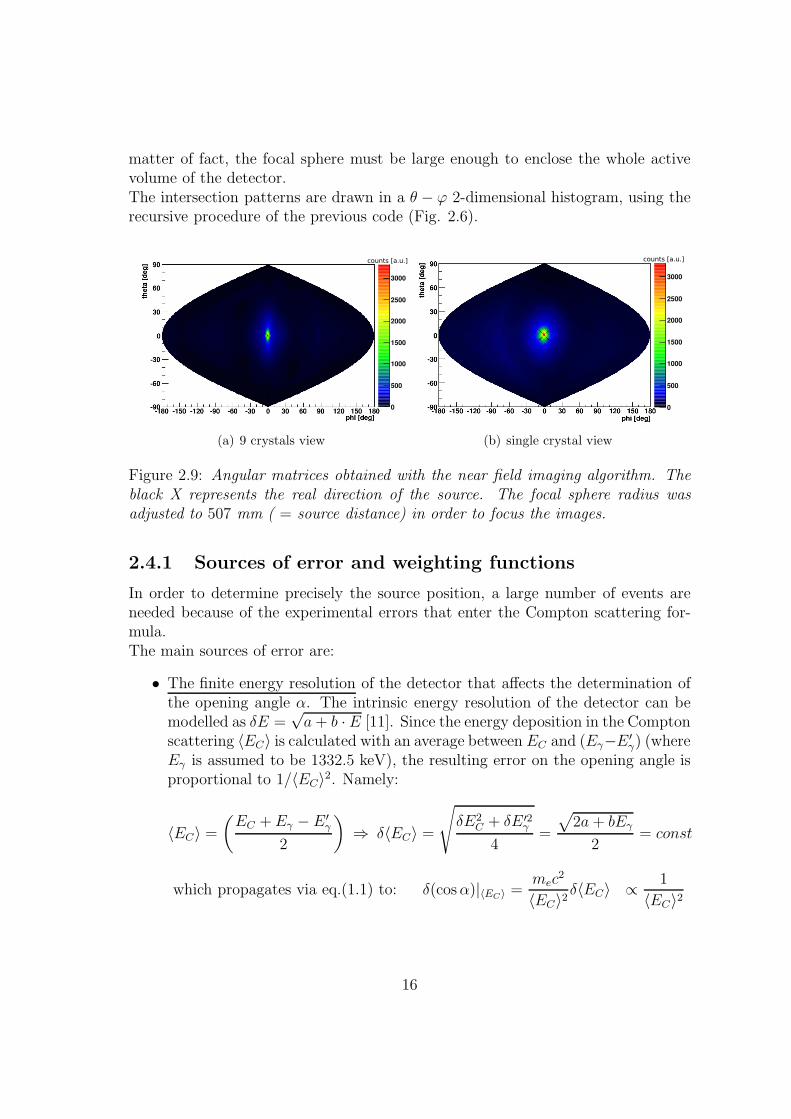
matter of fact, the focal sphere must be large enough to enclose the whole activevolume of the detector.The intersection patterns are drawn in a θ − ϕ 2-dimensional histogram, using therecursive procedure of the previous code (Fig. 2.6).
0
500
1000
1500
2000
2500
3000
counts [a.u.]
(a) 9 crystals view
0
500
1000
1500
2000
2500
3000
counts [a.u.]
(b) single crystal view
Figure 2.9: Angular matrices obtained with the near field imaging algorithm. Theblack X represents the real direction of the source. The focal sphere radius wasadjusted to 507 mm ( = source distance) in order to focus the images.
2.4.1 Sources of error and weighting functions
In order to determine precisely the source position, a large number of events areneeded because of the experimental errors that enter the Compton scattering for-mula.The main sources of error are:
• The finite energy resolution of the detector that affects the determination ofthe opening angle α. The intrinsic energy resolution of the detector can bemodelled as δE =
√a + b · E [11]. Since the energy deposition in the Compton
scattering 〈EC〉 is calculated with an average between EC and (Eγ−E ′γ) (where
Eγ is assumed to be 1332.5 keV), the resulting error on the opening angle isproportional to 1/〈EC〉2. Namely:
〈EC〉 =
(
EC + Eγ − E ′γ
2
)
⇒ δ〈EC〉 =
√
δE2C + δE ′2
γ
4=
√
2a + bEγ
2= const
which propagates via eq.(1.1) to: δ(cos α)|〈EC〉 =mec
2
〈EC〉2δ〈EC〉 ∝ 1
〈EC〉2
16
• The Doppler broadening due to the non-zero momentum of the scatterer elec-tron. The Compton formula (1.1) assumes that the scattered electron is atrest, while actually it has a finite momentum whose distribution, known asCompton profile, is characteristic of the detector material (germanium). Theenergy of the scattered electrons will thus depend on the initial momentum aswell as on the scattering angle. The use of the simple Compton formula willaffect not negligibly the determination of the scattering angle [17, 10, 15, 14].While the position and energy resolution can in principle be improved throughtechnical developments, the Doppler broadening due to the Compton profilerepresents an intrinsic limit to the attainable angular resolution with Comptonimaging.
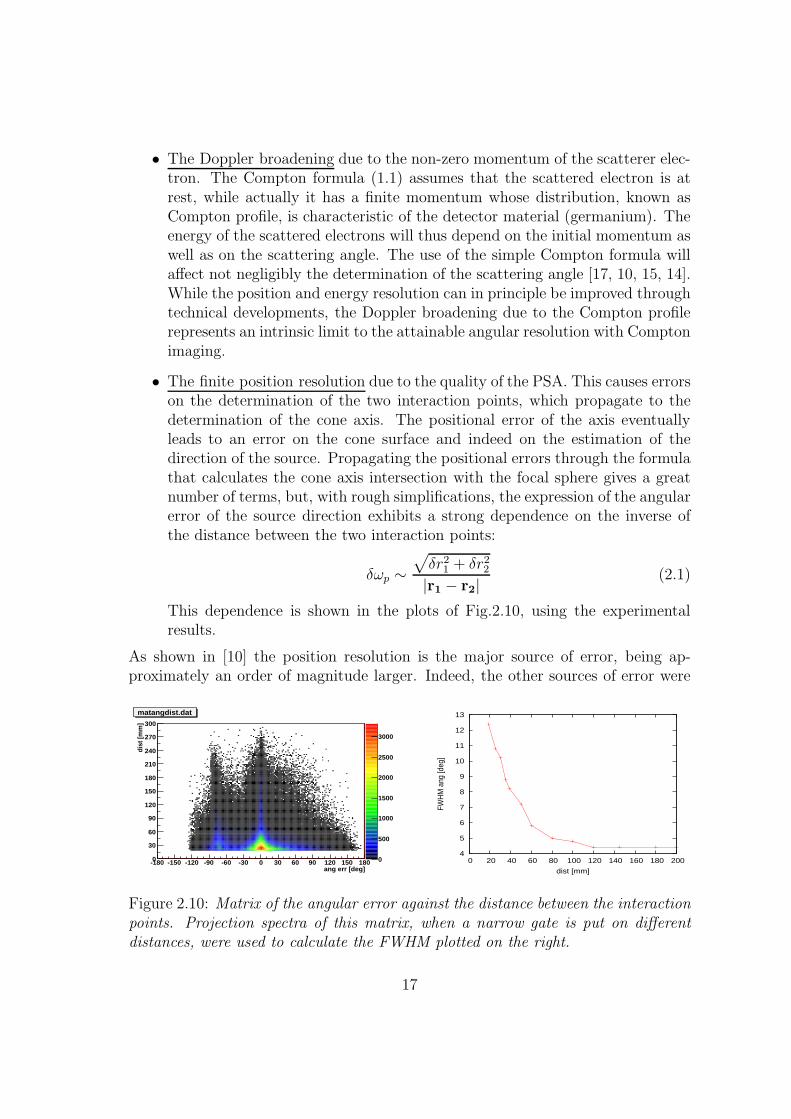
• The finite position resolution due to the quality of the PSA. This causes errorson the determination of the two interaction points, which propagate to thedetermination of the cone axis. The positional error of the axis eventuallyleads to an error on the cone surface and indeed on the estimation of thedirection of the source. Propagating the positional errors through the formulathat calculates the cone axis intersection with the focal sphere gives a greatnumber of terms, but, with rough simplifications, the expression of the angularerror of the source direction exhibits a strong dependence on the inverse ofthe distance between the two interaction points:
δωp ∼√
δr21 + δr2
2
|r1 − r2|(2.1)
This dependence is shown in the plots of Fig.2.10, using the experimentalresults.
As shown in [10] the position resolution is the major source of error, being ap-proximately an order of magnitude larger. Indeed, the other sources of error were
ang err [deg]-180 -150 -120 -90 -60 -30 0 30 60 90 120 150 180
dist
[mm
]
0
30
60
90
120
150
180
210
240
270
300
0
500
1000
1500
2000
2500
3000
matangdist.dat
4
5
6
7
8
9
10
11
12
13
0 20 40 60 80 100 120 140 160 180 200
FWH
M a
ng [d
eg]
dist [mm]
Figure 2.10: Matrix of the angular error against the distance between the interactionpoints. Projection spectra of this matrix, when a narrow gate is put on differentdistances, were used to calculate the FWHM plotted on the right.
17
neglected in filling the θ − ϕ matrix. Each circle was weighted (like in a weightedaverage) according to 1/δω2
p, that is |r1−r2|2. In this way, the algorithm takes intoaccount the “amount of information” carried by each event, and it tunes its contri-bution to the final result. Furthermore, a gate was put on the distance (d > 20 mm)to exclude from the back-projection algorithm events with low informative poten-tial.It should be reminded that δr1 and δr2 depend on the specific energy depositionsand on the quality of the PSA.
2.5 Discussion of the results
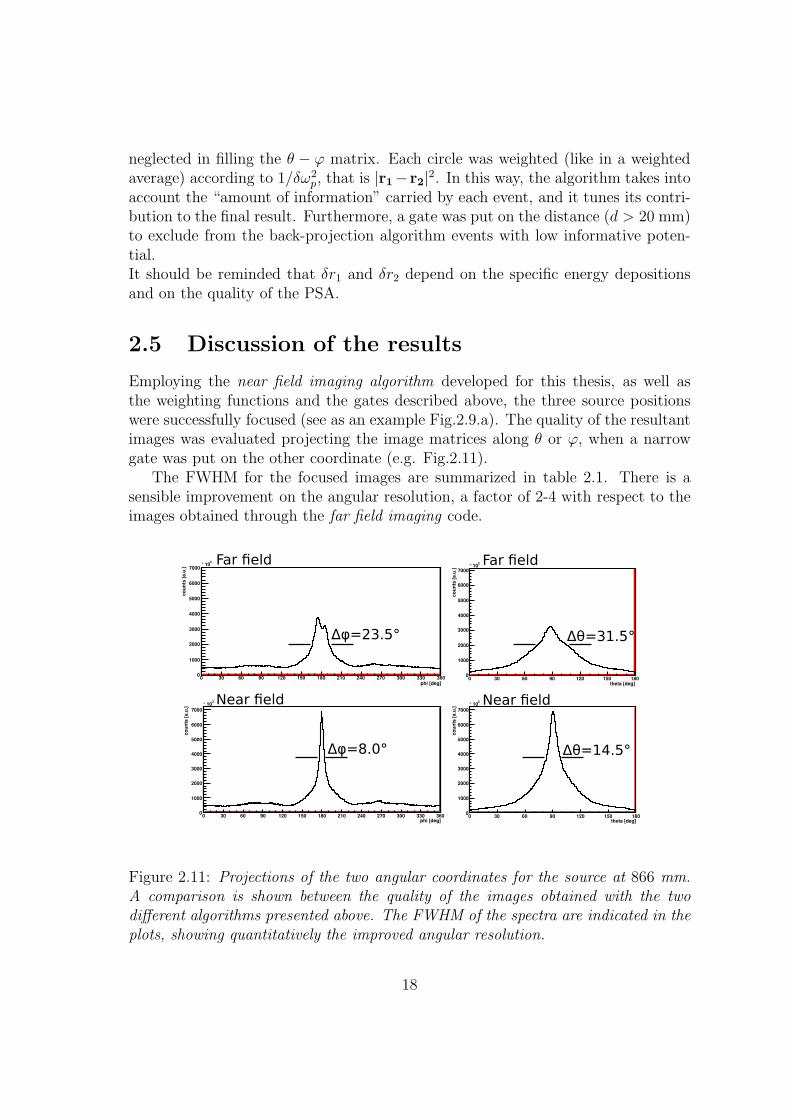
Employing the near field imaging algorithm developed for this thesis, as well asthe weighting functions and the gates described above, the three source positionswere successfully focused (see as an example Fig.2.9.a). The quality of the resultantimages was evaluated projecting the image matrices along θ or ϕ, when a narrowgate was put on the other coordinate (e.g. Fig.2.11).
The FWHM for the focused images are summarized in table 2.1. There is asensible improvement on the angular resolution, a factor of 2-4 with respect to theimages obtained through the far field imaging code.
phi [deg]0 30 60 90 120 150 180 210 240 270 300 330 360
counts [a.u.]
0
1000
2000
3000
4000
5000
6000
7000
310�
theta [deg]0 30 60 90 120 150 180
counts [a.u.]
0
1000
2000
3000
4000
5000
6000
7000
310�
phi [deg]0 30 60 90 120 150 180 210 240 270 300 330 360
counts [a.u.]
0
1000
2000
3000
4000
5000
6000
7000
310�
theta [deg]0 30 60 90 120 150 180
counts [a.u.]
0
1000
2000
3000
4000
5000
6000
7000
310�
Far field
Near field
Far field
Near field
Δφ=23.5° Δθ=31.5°
Δφ=8.0° Δθ=14.5°
Figure 2.11: Projections of the two angular coordinates for the source at 866 mm.A comparison is shown between the quality of the images obtained with the twodifferent algorithms presented above. The FWHM of the spectra are indicated in theplots, showing quantitatively the improved angular resolution.
18
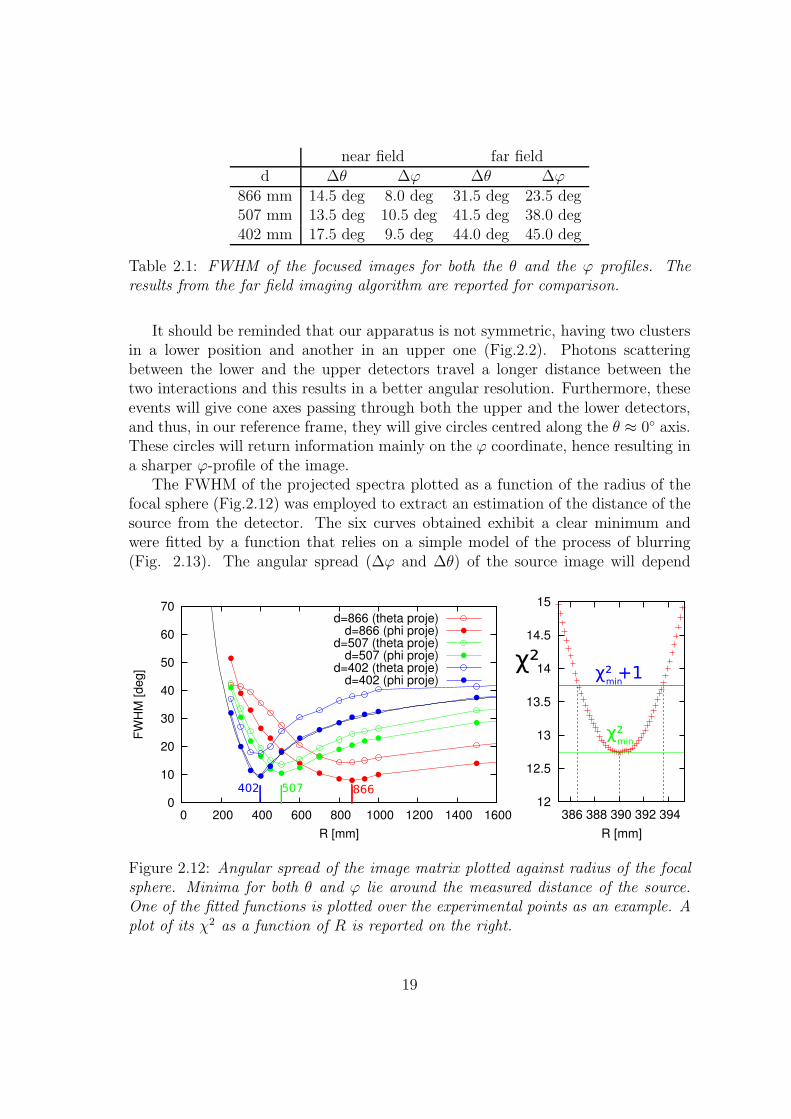
near field far fieldd ∆θ ∆ϕ ∆θ ∆ϕ
866 mm 14.5 deg 8.0 deg 31.5 deg 23.5 deg507 mm 13.5 deg 10.5 deg 41.5 deg 38.0 deg402 mm 17.5 deg 9.5 deg 44.0 deg 45.0 deg
Table 2.1: FWHM of the focused images for both the θ and the ϕ profiles. Theresults from the far field imaging algorithm are reported for comparison.
It should be reminded that our apparatus is not symmetric, having two clustersin a lower position and another in an upper one (Fig.2.2). Photons scatteringbetween the lower and the upper detectors travel a longer distance between thetwo interactions and this results in a better angular resolution. Furthermore, theseevents will give cone axes passing through both the upper and the lower detectors,and thus, in our reference frame, they will give circles centred along the θ ≈ 0◦ axis.These circles will return information mainly on the ϕ coordinate, hence resulting ina sharper ϕ-profile of the image.
The FWHM of the projected spectra plotted as a function of the radius of thefocal sphere (Fig.2.12) was employed to extract an estimation of the distance of thesource from the detector. The six curves obtained exhibit a clear minimum andwere fitted by a function that relies on a simple model of the process of blurring(Fig. 2.13). The angular spread (∆ϕ and ∆θ) of the source image will depend
0
10
20
30
40
50
60
70
0 200 400 600 800 1000 1200 1400 1600
FW
HM
[d
eg
]
R [mm]
d=866 (theta proje)d=866 (phi proje)
d=507 (theta proje)d=507 (phi proje)
d=402 (theta proje)d=402 (phi proje)
402 507 86612
12.5
13
13.5
14
14.5
15
386 388 390 392 394
R [mm]
χ²χ² +1
min
χ² min
Figure 2.12: Angular spread of the image matrix plotted against radius of the focalsphere. Minima for both θ and ϕ lie around the measured distance of the source.One of the fitted functions is plotted over the experimental points as an example. Aplot of its χ2 as a function of R is reported on the right.
19
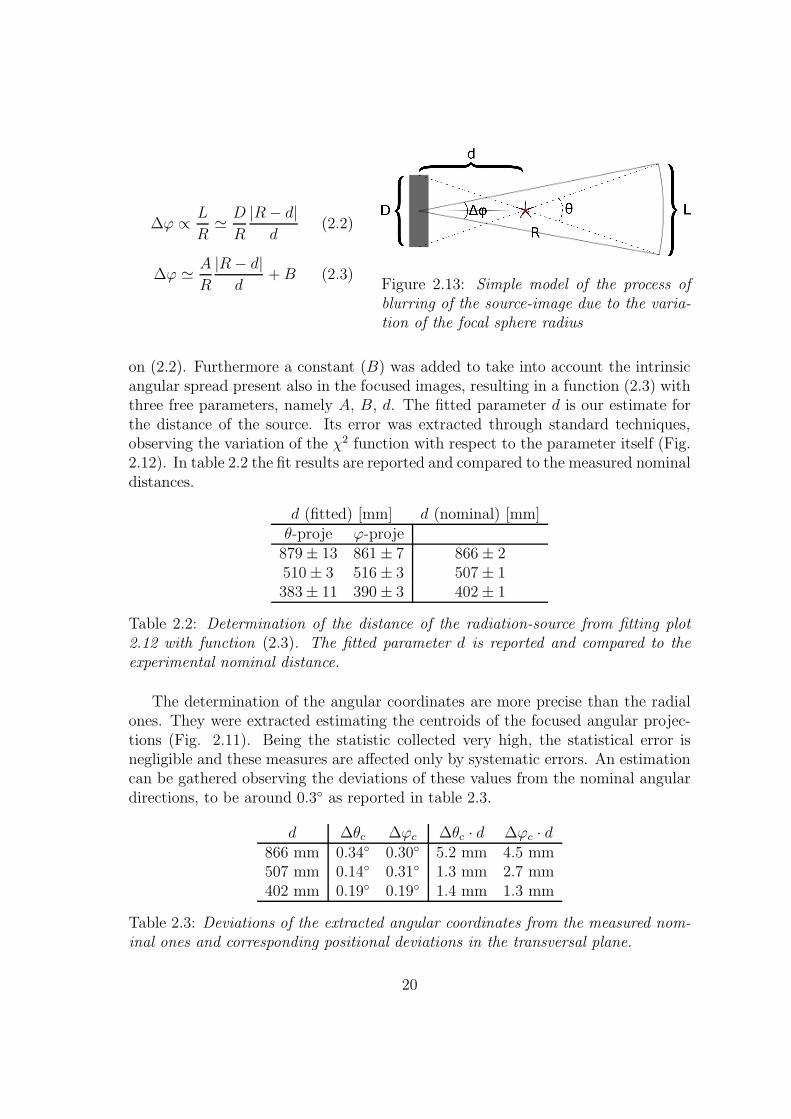
∆ϕ ∝ L
R≃ D
R
|R − d|d
(2.2)
∆ϕ ≃ A
R
|R − d|d
+ B (2.3)Figure 2.13: Simple model of the process ofblurring of the source-image due to the varia-tion of the focal sphere radius
on (2.2). Furthermore a constant (B) was added to take into account the intrinsicangular spread present also in the focused images, resulting in a function (2.3) withthree free parameters, namely A, B, d. The fitted parameter d is our estimate forthe distance of the source. Its error was extracted through standard techniques,observing the variation of the χ2 function with respect to the parameter itself (Fig.2.12). In table 2.2 the fit results are reported and compared to the measured nominaldistances.
d (fitted) [mm] d (nominal) [mm]θ-proje ϕ-proje
879 ± 13 861 ± 7 866 ± 2510 ± 3 516 ± 3 507 ± 1383 ± 11 390 ± 3 402 ± 1
Table 2.2: Determination of the distance of the radiation-source from fitting plot2.12 with function (2.3). The fitted parameter d is reported and compared to theexperimental nominal distance.
The determination of the angular coordinates are more precise than the radialones. They were extracted estimating the centroids of the focused angular projec-tions (Fig. 2.11). Being the statistic collected very high, the statistical error isnegligible and these measures are affected only by systematic errors. An estimationcan be gathered observing the deviations of these values from the nominal angulardirections, to be around 0.3◦ as reported in table 2.3.
d ∆θc ∆ϕc ∆θc · d ∆ϕc · d866 mm 0.34◦ 0.30◦ 5.2 mm 4.5 mm507 mm 0.14◦ 0.31◦ 1.3 mm 2.7 mm402 mm 0.19◦ 0.19◦ 1.4 mm 1.3 mm
Table 2.3: Deviations of the extracted angular coordinates from the measured nom-inal ones and corresponding positional deviations in the transversal plane.
20
Conclusions
The ultimate step in the evolution of γ-ray spectroscopy consists in the developmentof γ-ray tracking arrays. The detectors composing such spectrometers present bothgood energy and position resolution, thus allowing the reconstruction of the pathsof photons within the spectrometer. These characteristics allow the exploitation ofthese detectors for imaging purposes and promise applications in fields from astro-physics and nuclear medicine to nuclear safeguards.
This thesis work consisted in the study of the Compton imaging capabilities of asubset of the AGATA spectrometer composed of three triple clusters. The imagingalgorithm developed relies on a simple back-projection of the cones defined by thephotons absorbed in the spectrometer after a Compton scattering. In particular, anexisting code was generalized to solve the parallax problem due to the large dimen-sion of the detector with respect to the distance of the source. An experimental testshowed an overall gain in resolution ranging between a factor 2 to 4 with respectto the simplistic use of the far field imaging hypothesis of the previous code.Moreover a brand new sensitivity on the distance of the source was achieved usinga focusing procedure. The three-dimensional determination of the source positionresulted really accurate, being few millimetres in the transversal plane and aroundone centimetre on the longitudinal direction for sources at distances ranging in be-tween 40 and 90 cm.
Future works will be the implementation of a List Mode Maximum Likelihoodalgorithm to improve the signal-to-noise ratio in the reconstructed images usingthe methods presented by Barrett et al. [18] and the development of a Comptonimaging algorithm for in-beam Nuclear Physics experiments. This will allow the dis-crimination between different locations of the gamma-sources, hence improving theperformance of the AGATA spectrometer through the reduction of the backgroundoriginated outside the target [19].
21
Bibliography
[1] Miles N. Wernick and John N. Aarsvold. Emission tomography: the fundamen-tals of PET and SPECT. Academic Press, 2004.
[2] B. J. Teegarden and S. J. Sturner. INTEGRAL Observations of Gamma-RayBursts. In Bulletin of the American Astronomical Society, volume 31 of Bulletinof the American Astronomical Society, page 717, April 1999.
[3] RW Todd, JM Nightingale, and DB Everett. A proposed gamma camera.Nature, 251:132–134, 1974.
[4] M. Singh and D. Doria. An electrically collimated gamma camera for singlephoton computed tomography. Med Phys, 10(4):428–435, 1983.
[5] M. A. Deleplanque, I. Y. Lee, K. Vetter, G. J. Schmid, F. S. Stephens, R. M.Clark, R. M. Diamond, P. Fallon, and A. O. Macchiavelli. GRETA: utilizingnew concepts in gamma-ray detection. Nuclear Instruments and Methods inPhysics Research Section A, 430(2-3):292–310, 1999.
[6] D. Bazzacco. The Advanced Gamma Ray Tracking Array AGATA. NuclearPhysics A, 746:248–254, 2004. Proceedings of the Sixth International Confer-ence on Radioactive Nuclear Beams (RNB6).
[7] http://www.nist.gov/physlab/data/xcom/index.cfm. Technical report, NIST.
[8] D. Bazzacco, B. Cederwall, J. Cresswell, G. Duchene, J. Eberth,W. Gast, et al. AGATA Technical Proposal. URL: http://www-win.gsi.de/agata/Publications/Agata-pub-proposal.pdf.
[9] A. Lopez-Martens, K. Hauschild, A. Korichi, J. Roccaz, and JP Thibaud. γ-ray tracking algorithms: a comparison. Nuclear Instruments and Methods inPhysics Research Section A, 533(3):454–466, 2004.
[10] F. Recchia. PhD Thesis: In-Beam Test And Imaging Capabilities of theAGATA Prototype Detector. PhD thesis, University of Padova, January 2008.
22
[11] Glenn F. Knoll. Radiation Detection and Measurement. John Wiley & Sons,3rd edition, 2000.
[12] J. Simpson, J. Nyberg, W. Korten, et al. AGATA. Technical report, December2008.
[13] E. Farnea, F. Recchia, D. Bazzacco, Th. Kroll, Zs. Podolyak, B. Quintana,and A. Gadea. Conceptual design and Monte Carlo simulations of the AGATAarray. Nuclear Instruments and Methods in Physics Research Section A, 621(1-3):331–343, 2010.
[14] A. Grint. SmartPET Compton Camera Investigation. Measurement, 1:13,2006.
[15] L. Mihailescu, K.M. Vetter, M.T. Burks, E.L. Hull, and W.W. Craig. SPEIR:A Ge Compton camera. Nuclear Instruments and Methods in Physics ResearchSection A, 570(1):89–100, 2007.
[16] J.P. Snyder. Map projections–a working manual. USGPO, 1987.
[17] C.E. Ordonez, A. Bolozdynya, and W. Chang. Doppler broadening of energyspectra in Compton cameras. In 1997 IEEE Nucl. Sci. Symp, volume 2, pages1361–1365, 1998.
[18] H.H. Barrett, T. White, and L.C. Parra. List-mode likelihood. Journal of theOptical Society of America A, 14(11):2914–2923, 1997.
[19] M. Doncel, F. Recchia, B. Quintana, A. Gadea, and E. Farnea. Experimen-tal test of the background rejection, through imaging capability, of a highlysegmented AGATA germanium detector. Nuclear Instruments and Methods inPhysics Research Section A, In Press, 2010.
23


![Universit a degli Studi di Padova - Benvenuti su [email protected]](https://img.pdfslide.tips/doc/110x75/623144e01cb07c303d32a836/universit-a-degli-studi-di-padova-benvenuti-su-emailprotected.jpg)