Embed Size (px)
Citation preview
UNIVERSITI PUTRA MALAYSIA
MONITORING LAND USE CHANGES USING REMOTE SENSING AND GEOGRAPHICAL INFORMATION SYSTEM (GIS) IN GUA
MUSANG, KELANTAN, MALAYSIA
SOMKHIT SENTHAVY
FH 2000 15
MONITORING LAND US E CHANG ES USING R EMOT E S ENSING AND G EOGRAPHICAL INFORMATION S YST EM (GIS) IN GUA MUSANG ,
KELANTAN , MALA YSIA
BY
SOM KHIT S ENTHA V Y
Thesis S ubmitted in Ful filment o f the Req ui rement fo r the De gree o f Maste r o f Science in the Fac ult y o f Fo rest ry
Uni ve rsiti P ut ra Mala ysia
Decem be r 2000
11
SPECIAL DEDICATION
Utmost gratitude to my father and mother for your patience, faithfully and never ending
prayed for my success
Also to my beloved wife "Mrs. Keo Senthavy" and sons "Smith Senthavy and Sacksith
Senthavy" who are always on my side, never ending support and inspire in me
all the time.
iii
Abstract of thesis presented to the Senate of Universiti Putra Malaysia in fulfilment of the requirement for the degree of Master of Science
MONITORING LAND USE CHANGES USING REMOTE SENSING AND GEOGRAPHICAL INFORMATION SYSTEM (GIS) IN GUA MUSANG,
KELANTAN, MALAYSIA.
By
SOMKHIT SENTHA VY
December 2000
Chairman : Capt. Professor. Kamaruzaman Jusoff, Ph.D
Faculty : Forestry
The development of land use is rapidly changing due to economic
improvements. The availability of the most recent land use information is very useful
and necessary for administration, monitoring and management for decision making and
planning. With advanced technology of remote sensing (RS) and geographical
information system (GIS), the mapping process can acquire spatial information more
efficiently, timely and easy to recheck. This study was undertaken to detect land use
change by integrating RS and GIS technologies in northern part of Gua Musang district,
Kelantan state. The objective of this study was to assess the usefulness of integrating
remotely sensed data with GIS for land use change detection. The specific objective is
to quantify and map the land use change in northern part of Gua Musang district. In
order to acquire land use changes data, a set of Landsat Thematic Mapper (TM) dated
May 1 990 and July 1997 with scale of 1 : 1 50,000 in hard copies were acquired. Land
use classes were interpreted into maps and the maps were checked on the field for
ground truth. The land use map data were then transferred directly into the computer via
iv
ARC/INFO and ARCNIEW software. The land use data were digitized in ARC/INFO,
overlaid and analyzed in ARC/VIEW. Ground result showed that the total overall map
accuracy was 86.54%. Shrub (bushy/lalang) increased by 1 8 1 . 1 4 % from 1 990 to 1 997
( 13 ,757.35 ha), while newly cleared areas, rubber, and oil palm increased by 9 1 .37 %
(402.48 ha), 45 . 1 9 % (6,791 .68 ha) and 44.72 % (7,8 1 2.66 ha), respectively. On the
other hand, other land use classes such as mixed horticulture, diversified crops, urban
and paddy also increased by 38.82 % (327.27 ha), 1 1 .95 % (7 1 .95 ha), 1 0.30 % (73 .63
ha) and 4.70 % (12.79 ha) respectively. However, undisturbed and disturbed forest were
reduced by 8 . 10 % ( 19,27 1 .35 ha) and 27.70 % (9,978.45 ha) during the same period.
Shrubs significantly showed an increasing trend of land use while forest areas are
decreasing in area compared to other land use classes. Rapid land use change took place
in the northern part of Gua Musang district whereby, nearly 36 % of the changes was in
terms of shrub, oil palm and rubber land use conversions. The method used and the
results obtained strongly suggest that the integration of remote sensing and GIS offer
very promising opportunities for land use change detection and mapping.
Abstrak tesis yang dikemukakan kepada Senat Universiti Putra Malaysia sebagai memenuhi keperluan untuk ijazah Master Sains
PEMANTAUAN PERUBAHAN GUNA TANAH MENGGUNAKAN REMOTE SENSING DAN SISTEM MAKLUMAT GEOGRAFI (GIS)
DI GUA MUSANG, KELANTAN, MALAYSIA
Oleh
SOMKHIT SENTHA VY
Disember 2000
Pengerusi : Kapt. Profesor. Kamaruzaman Jusoff, Ph.D
Fakulti : Perhutanan
v
Pembangunan guna tanah sedang pesat berubah disebabkan kemajuan ekonomi.
Ketersediaan maklumat terkini tentang guna tanah adalah berguna dan perlu untuk
pentadbiran, pemantauan dan pengurusan untuk membuat keputusan dan perancangan.
Dengan teknologi maju remote sensing (RS) dan sistem maklumat geografi (GIS),
proses pemetaan boleh memperoleh maklumat reruang dengan lebih efisien, cepat serta
mudah disemak. Kajian ini telah dijalankan untuk mengesan perubahan guna tanah
dengan menggabungkan RS dan GIS untuk bahagian utara daerah Gua Musang, negeri
Kelantan. Objektif kajian ini adalah untuk meninjau kebolehgunaan penggabungan data
penderiaan jauh dengan GIS untuk pengesanan perubahan guna tanah. Objektif
khususnya adalah untuk mengira dan memeta perubahan guna tanah di bahagian utara
daerah Gua Musang. Untuk memperolehi data perubahan guna tanah, satu set Landsat
Thematic Mapper (TM) bertarikh Mei 1990 dan lulai 1 997 dan cetakan pada skala 1 :
1 50,000 telah digunakan. Kelas-kelas guna tanah telah diinterpretasikan ke dalam peta-
peta dan peta-peta berkenaan telah disemak di lapangan untuk pengesahan. Data guna
VI
tanah kemudiannya dipindahkan secara langsung ke dalam komputer menggunakan
perisian ARC/INFO dan ARCNIEW. Data guna tanah itu telah didigitalkan dalam
ARC/INFO, ditindih kemudian dianalisa dalam ARCNIEW. Keputusan lapangan
menunjukkan bahawa jumlah ketepatan keseluruhan peta adalah 86.54 %. Kawasan
belukar (semakllalang) telah meningkat sebanyak 1 8 1 . 14 % dari 1 990 ke 1 997
( 1 3 ,757.35 ha) . kawasan baru dibuka getah dan kelapa sawit telah meningkat sebanyak
9 1 .37 % (402.48 ha), 45 . 1 9 % (6,791 .68 ha) dan 44.72 % (7,8 12.66 ha) masing
masingnya. Sebaliknya pula, kelas-guna tanah seperti pertanian campur, tanaman
pelbagai, perbandaran dan padi turut meningkat masing-masingnya sebanyak 38.82 %
(327.27 ha, 1 1 .95 % (71.95 ha), 10.30 % (73 .63 ha dan 4.70 % ( 12.79 ha).
bagaimanapun, hutan dara dan telah dibalak menyusut sebanyak 8 . 10 % ( 1 9,27 1 .3 5 ha)
dan 27.70 % (9,978 .45 ha) masing-masingnya dalam jangka waktu yang sarna.
Kawasan belukar menunjukkan pola peningkatan guna tanah yang nyata sementara
kawasan hutan menyusut dalam keluasannya dibanding dengan kelas-kelas guna tanah
lain. Perubahan guna tanah yang pesat telah berlaku di utara daerah Gua Musang, di
mana hampir 36 % daripada perubahan guna tanah adalah kepada belukar, kelapa sawit
dan getah. Kaedah yang telah digunakan dan keputusan yang diperolehi menunjukkan
bahawa penggabungan penderiaan jauh dan GIS menawarkan peluang-peluang yang
cerah untuk pengesanan dan pemetaan perubahan guna tanah.
Vll
ACKNOWLEDGMENTS
First and foremost, I would like to express my most sincere and deepest gratitude
to my major supervisor Capt. Prof. Dr. Kamaruzaman lusoff for his helpful advices,
encouragement and constructive criticisms throughout the study. I am thankful for his
patience and for the knowledge that I have learnt from his comments and suggestions.
Sincere thanks are also due to my supervisory committee members, Prof. Dato'
Dr. Nik Muhamad Nik Abd. Majid, and Dr. Adzemi Bin Mat Arshad for their invaluable
and constructive criticism that substantially improved this study.
I am also grateful for the cooperation given by the Kelantan State Forestry
Department for permission to use the area of North Gua Musang district. I would like to
thank field research assistant, Mr. Abdullah Mohd Yusoff for his invaluable help during
my final round of ground truth. I would also like to extend my sincere thanks to my
friend, Mr. Iwan Setiawan for his invaluable advice on GIS.
Special appreciation also goes to the Lao Government, Lao-Swedish Forestry
Programme (Department of Forestry) for their financial support to enable completion of
my study.
Last but not least, my deepest gratitude and love to my parent and wife (Mrs. Keo
Senthavy) and sons (Smith Senthavy, Sacksith Senthavy) who not only endured without
protest the loneliness while I prepared my thesis, but also provided their love and
inspiration without which this study would not have been completed.
vi i i
I certify that an Examination Committee met on 1ih December 2000 to conduct the final examination of Somkhit Senthavy on his Master of Science thesis entitled "Monitoring Land Use Changes Using Remote Sensing and Geographic Information System (GIS) in Gua Musang, Kelantan;" Malaysia" in accordance with Universiti Pertanian Malaysia (Higher Degree) Act 1980 and Universiti Pertanian Malaysia (Higher Degree) Regulations 1981. The Committee recommends that t.he candidate be awarded the relevant degree. Members of Examination Committee are as follows:
ISMAIL ADNAN ABDUL MALEK, M.F. Lecturer, Faculty of Forestry, Universiti Putra Malaysia. (Independent Examiner)
KAMARUZAMAN JUSOFF, Ph.D Professor, Faculty of Forestry, Universiti Putra Malaysia. (Chairman)
DATO'
NIK MUHAMAD NIK ABDUL MAJID, Ph.D Professor, Faculty of Forestry, Universiti Putra Malaysia. (Member)
ADZEMI BIN MAT ARSHAD, Ph.D Faculty of Science and Technology, Kolej Universiti Terengganu. (Member)
M� �YIDm'Ph.D' ProfessorlDeputy Dean of Graduate School, Universiti Putra Malaysia.
Date: i 1 9 DEC 2000
This thesis submitted to the Senate of Universiti Putra Malaysia has been accepted as fulfilment of the requirement for the degree of Master of Science.
�<� KAMISA�.D, Assoc. Professor Dean of Graduate School, Universiti Putra Malaysia.
Date: 11 1 JAN ZOOl
IX
x
DECLARATION
I hereby declare that the thesis is based on my original work except for quotations and citations, which have been duly acknowledged. I also declare that it has not been previously or concurrently submitted for any other degree at UPM or other institutions.
so� Date: I q /12/2.0 OD
Xl
TABLE OF CONTENTS
Page
DEDICATION.............................................................................. 11
ABATRACT ................................................... .............................. 111
ABSTRAK ........................... ......... ............................................... v ACKNOWLEDGEMENTS............................................................... Vll
APPROV AL SHEETS........................ ......... . . ... . ..... ... . . . . ... ..... . . .. . . .. .. Vlll
DECLARATION FORM................................................................. x
LIST OF TABLES ................ .............................................. ........... Xlll
LIST OF FIGURES............... .................. ......... .............................. XIV
LIST OF ABBREVIATIONS .... ......... ........ ............... . . . ................. .... XVI
CHAPTER
I INTRODUCTION...... . . . . . . . . . . . . . . . . . . . . . . . . . . . . . . . . . . . . . . . . . . . . . . . . .. 1 General Background ...................................................... 1 Problem Statement . . . . . . . . . . . . . . . . . . . . . . . . . . . . . . . . . . . . . . . . . . . . . . . . . . . . . . . . 4 Objectives of Study . . . . . . . . . . . . . . . . . . . . . . . . . . . . . . . . . . . . . . . . . . . . . . . . . . . . . . . 7
II LITERATURE REVIEW.............................................. 8 Land Use and Land Cover . . . . . . . . . . . . . . . . . . . . . . . . . . . . . . . . . . . . . . . . . . . . . . . . 8 Definition of Remote Sensing . . . . . . . . . . . . . . . . . . . . . . . . . . . . . . . . . . . . . . . . . .. 9
Remote Sensing by Satellites . . . . . . . . . . . . . . . . . . . . . . . . . . . . . . . . . . . . . . . . . . . . 12 The Landsat ................................................................ 1 3
Characteristic and Products of Landsat ..................... 1 3 Visual Analysis of Landsat Imagery . . . . . . . . . . . . . . . . . . . . . . . . 1 8 Computer Aided Analysis . . . . . . . . . . . . . . . . . . . . . . . . . . . . . . . . . . . . 2 1
Landsat Thematic Mapper (TM) ...... ........... ....................... 24 Remote Sensing for Land Use and Cover Change Detection .... . . . . 28 Thematic Land Use Mapping . . . . . . . . . . . . . . . . . . . . . . . . . . . . . . . . . . . . . . . . . . . . 38 Reference Data . . . . . . . . . . . . . . . . . . . . . . . . . . . . . . . . . . . . . . . . . . . . . . . . . . . . . . . . . . . . 43 Training Area and Ground Truthing ....................... .......... ... 44 Geographical Information System (GIS) ............................... 50 Integration of Remote Sensing with Geographic Information Systems for Analysis and Detection of Land Use Changes . . . . . . . . . 56
xi i
III MATERIALS AND METHODS ...................................... 65 Description of Study Sites . . . . . . . . . . . . . . . . . . . . . . . . . . . . . . . . . . . . . . . . . . . . ... 65
Topography . . . . . . . . . . . . . . . . . . . . . .. . . . . . . . .................. ...... 69 Geology ......................................................... 70 Climate . . . . . . . . . . . . . .. ........................................... 72
Materials . . . . . .. . . ... . . . . . . . .. . . . . . . . . . . . . . . . . . . . . . . . . . . .. ..... .... . .. . .... . . 74
Methods . . . . . . . . . . . . . . . . . ..... . . . . . . . . . . . . . . . . . . . . . . . . . . . . . . . . . . . . . . . . . . .. . . 74
Image Preprocessing ... . . ... . . . . . . . . . . . . . . . . . . . . . . . . . . . . . . . . . . . 74
Image Enhancement . . . . . . . . . . . . . . . . . . . . . . . . . . . . . . . . . . . . . . . . . .. 76
Visual Interpretation .... . . ... .... . . . . . . . ... . ........... , ... .... 78 Classification Technique . . . . . . . . . . . . . . . . . . . . . . . . . . . . . . . . . . . . . . 80 Output Stage .................................................... 81 Ground Truthing . . . . . . . . . . . . . . . . . . . . . . .. .. . .. . .. . .. . .. . . . . . . ... 81 Classification and Post-Classification Map . . . . . . . . . . . . . . . . . 82 Data Input by Cartographic Digitizing . . . . . . . . . . . . . . . . . . . . .. 83
IV RESULTS AND DISCUSSION ....................................... 88 Landsat TM . . . . . . . . . . . . . . . . . . . . . . . . . . . . . . . . . . . . . . . . . . . . . . . . . . . .. . . . . . . . . . . . 88
Band Combination and Image Enhancement . . . . . . . . . . . . . . . . . . . . . . . ... 89
Area Analysis . . . .. . .. . . . . .. . .. . .. . .. . .. . . .. .. . .. . .. . .. . .. . .. . . .. . . .. . . . .... 93 Land Use Classes . , . ...... ...... ...... ...... ............ ... ... ..... .... ... 94 Land Use Changes . . . .. . . . . . . . .................. ......................... 98 Ground Truthing . . , ...... ... ......... ............ ...... ... ... ...... ... ..... 101 Classification Accuracy Assessment . . . . . . . . . . . . . . . . . . . . . . . . . . . . . . . . . . . 1 1 1 Error in Digitizing . . . . . . . . . . . . . . . . . . . . . . . . . . . . . .. . . . . . ................... 112 Change Detection Map . . . . . . . . .. . . . . .. . . . . . . . . . . . . .... . . . . . . . . . . . . . . . . . . . 113
V CONCLUSIONS AND RECOMMENDATIONS ...... .......... 117
Conclusions . . . . . . . . . . . . . . . . . . . . . . . . . . . . . . . . . . . . . . . . . . . . . . . . . . . . . . . . . . . . . . . . 117 Recommendations ...................................................... 119
REFERENCES ........................ '" ... ...... ... ............ ........ 121
APPENDI XES ............................................................ 138
VITA ................................ ........................................ 141
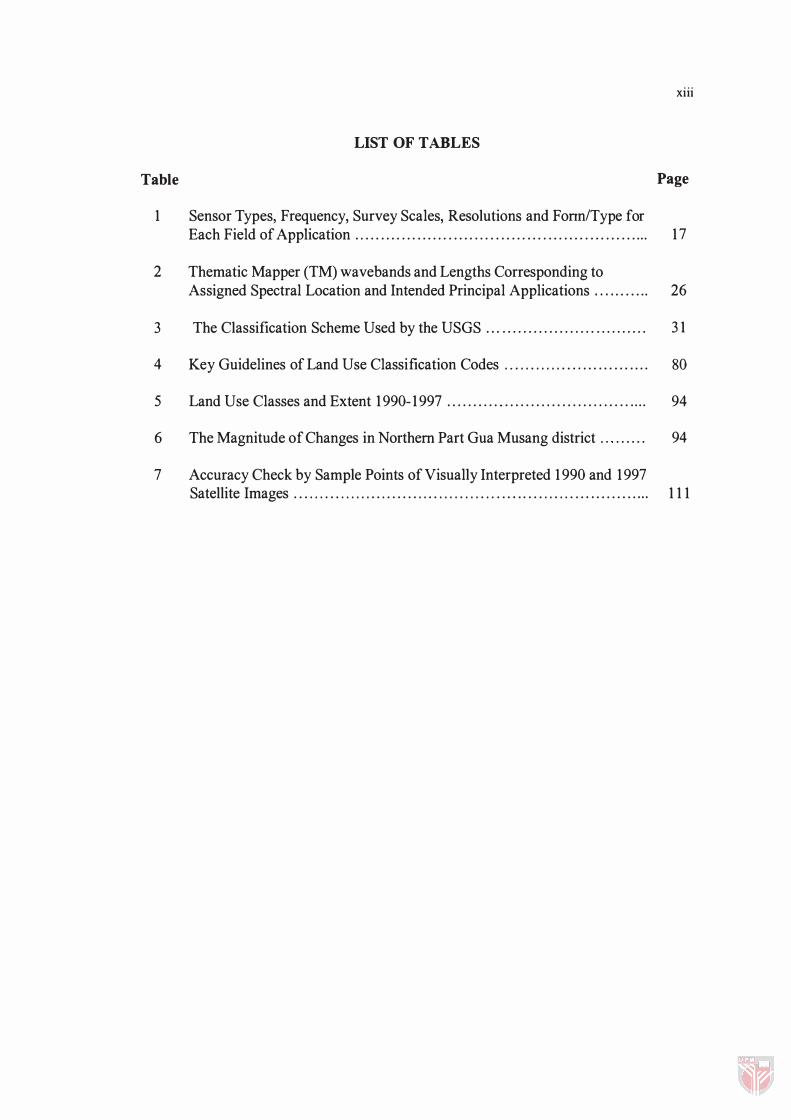
LIST OF T ABLES
Ta ble
1 Sensor Types, Frequency, Survey Scales, Resolutions and FonniType for
xi i i
Page
Each Field of Application . . . . . . . . . . . . . . . . . . . . . . . . . . . . . . . . . . . . . . . . . . . . . . . . . . . . . . ... 17
2 Thematic Mapper (TM) wavebands and Lengths Corresponding to Assigned Spectral Location and Intended Principal Applications . . . . . . . . . . . 26
3 The Classification Scheme Used by the USGS . . . ............................ 31
4 Key Guidelines of Land Use Classification Codes . . . . . . . . . . . . . . , ... ... ... .... 80
5 Land Use Classes and Extent 1990-1997 ....................................... 94
6 The Magnitude of Changes in Northern Part Gua Musang district ' " ...... 94
7 Accuracy Check by Sample Points of Visually Interpreted 1990 and 1997 Satellite Images . . . . . . . . . . . . . . . . . . . . . . . . . . . . . . . . . . . . . . . . . . . . . . . . . . . . . . . . . . . . . . . . . . ... 111
xiv
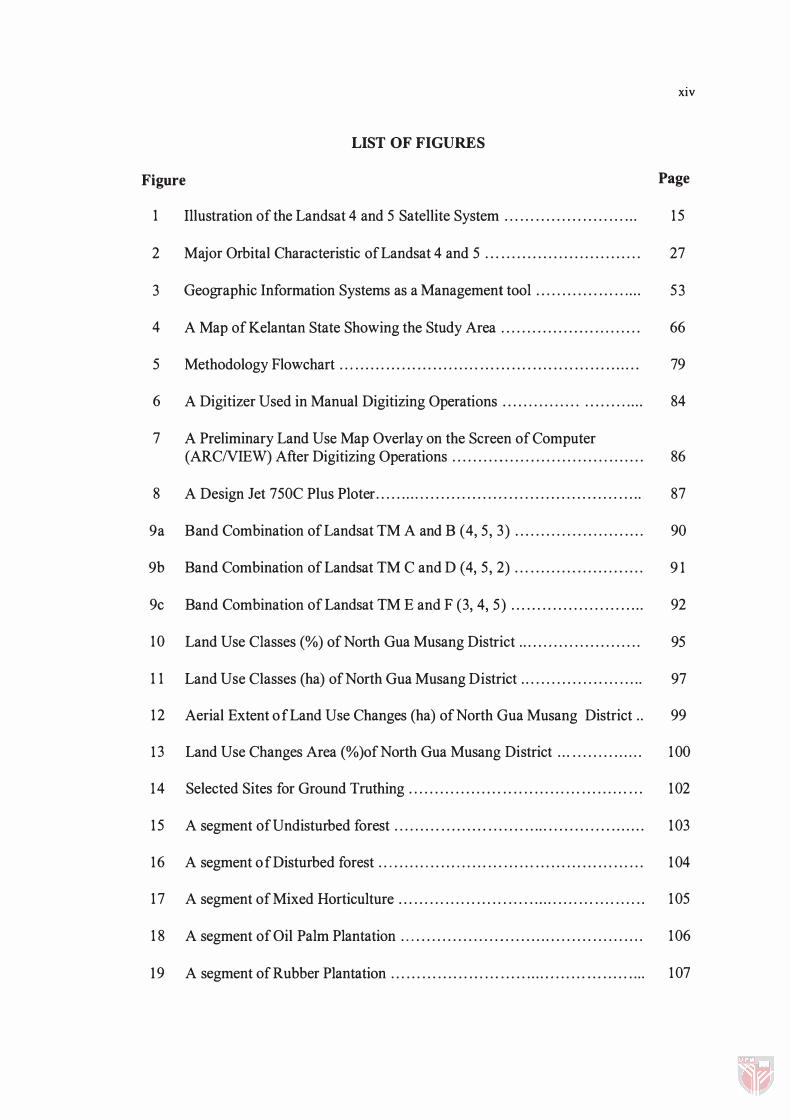
LIST OF FI GU RES
Fig ure Page
1 Illustration of the Landsat 4 and 5 Satellite System . . . . . . . . . . . . . . . . . . . . . . . . . . 1 5
2 Major Orbital Characteristic of Landsat 4 and 5 . . . . . . . . . . . . . . . . . . . . . . . . . . . . . . 27
3 Geographic Information Systems as a Management tool . . . . . . . . . . . . . . . . . . . . . 53
4 A Map of Kelantan State Showing the Study Area . . . . . . . . . . . . . . . . . . . . . . . . . . . 66
5 Methodology Flowchart . . . . . . . . . . . . . . . . . . . . . . . . . . . . . . . . . . . . . . . . . . . . . . . . . . . . . . . . . . 79
6 A Digitizer Used in Manual Digitizing Operations . . . . . . . . . . . . . . . . . . . . . . . . . . . 84
7 A Preliminary Land Use Map Overlay on the Screen of Computer (ARCNIEW) After Digitizing Operations . . . . . . . . . . . . . . . . . . . . . . . . . . . . . . . . . . . . . 86
8 A Design Jet 750C Plus Ploter. . . . . . . . . . . . . . . . . . . . . . . .. . . . . . . . . . . . . . . . . . . . . . . . . . . . 87
9a Band Combination of Landsat TM A and B (4, 5 , 3) . . . . . . . . . . . . . . . . . . . . . . . . . 90
9b Band Combination of Landsat TM C and D (4, 5 , 2) . . . . . . . . . . . . . . . . . . . . . . . . . 9 1
9c Band Combination of Landsat TM E and F (3, 4, 5) . . . . . . . . . . . . . . . . . . . . . . . . . . 92
10 Land Use Classes (%) of North Gua Musang District . . . . . . . . . . . . . . . . . . . . . . . . 95
1 1 Land Use Classes (ha) of North Gua Musang District . . . . . . . . . . . . . . . , . . . . . . . . 97
12 Aerial Extent of Land Use Changes (ha) of North Gua Musang District . . 99
1 3 Land Use Changes Area (%)ofNorth Gua Musang District . . . . . . . . . . . . . . . . . 1 00
14 Selected Sites for Ground Truthing . . . . . . . . . . . . . . . . . . . . . . . . . . . . . . . . . . . . . . . . . . . . . 1 02
1 5 A segment of Undisturbed forest . . . . . . . . . . . . . . . . . . . . . . . . . . . . . . . . . . . . . . . . . . . . . . . . . 1 03
16 A segment of Disturbed forest . . . . . . . . . . . . . . . . . . . . . . . . . . . . . . . . . . . . . . . . . . . . . . . . . . . 1 04
1 7 A segment of Mixed Horticulture . . . . . . . . . . . . . . . . . . . . . . . . . . . . . . . . . . . . . . . . . . . . . . . . 1 05
1 8 A segment of Oil Palm Plantation . . . . . . . . . . . . . . . . . . . . . . . . . . . . . . . . . . . . . . . . . . . . . . . 1 06
19 A segment of Rubber Plantation . . . . . . . . . . . . . . . . . . . . . . . . . . . . . . . . . . . . . . . . . . . . . . . . . . 1 07
xv
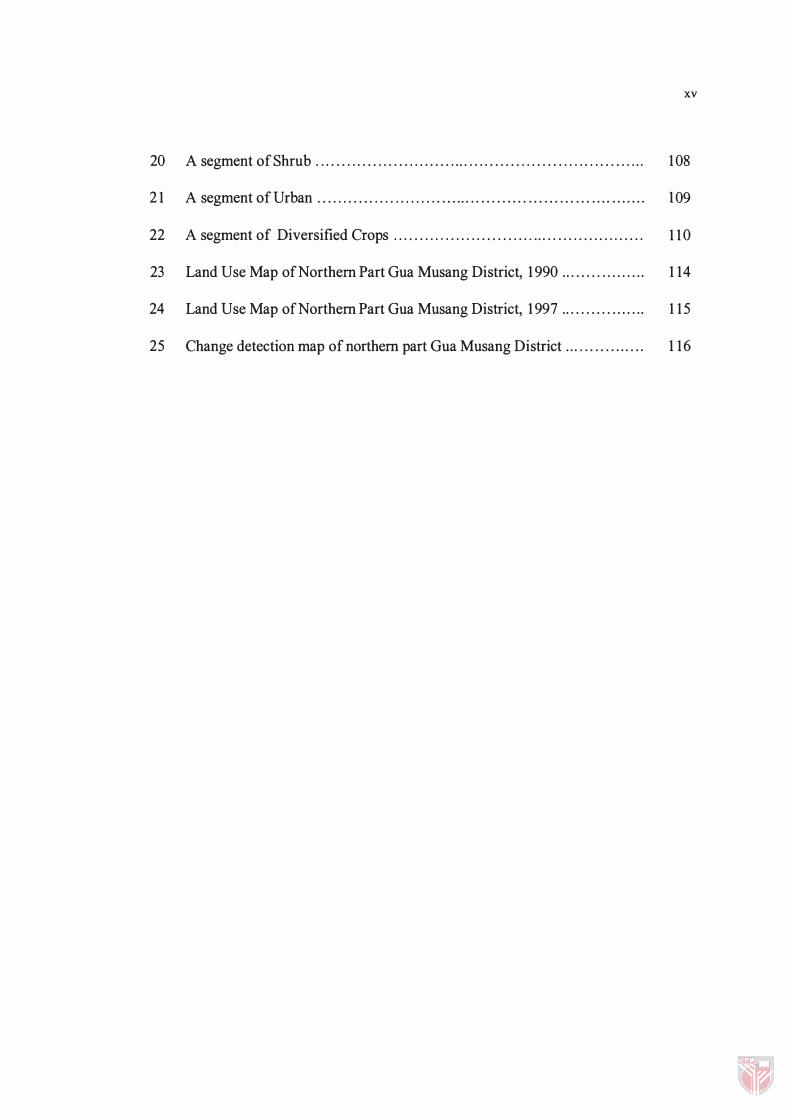
20 A segment of Shrub . . . . . . . . . . . . . . . . . . . . . . . . . . . . . . . . . . . . . . . . . . . . . . . . . . . . . . . . . . . . . . . . 108
2 1 A segment of Urban . . . . . . . . . . . . . . . . . . . . . . , . . . . . . . . . . . . . . . . . . . . . . . . . . . . . . . . . . . . . . . . . 1 09
22 A segment of Diversified Crops . . . . . . . . . . . . . . . . . . . . . . . . . . . . . . . . . . . . . . . . . . . . . . . . . 1 1 0
23 Land Use Map of Northern Part Gua Musang District, 1 990 . . . . . . . . . . . . . . . . . 1 14
24 Land Use Map of Northern Part Gua Musang District, 1 997 .. . . . . . . . . . . . . . . . 1 1 5
25 Change detection map of northern part Gua Musang District . . . . . . . . . . . . . . . . 1 16
AIFM
AVHRR
CCT
DGPS
DMSP
DOD
ERTS
FAO
FCC
GAP
GCP
GDOP
GEMS
GIS
GPS
HCMM
IFOV
ILWIS
IR
LANDSAT
MACRES
MIR
MSS
NASA
NCGIA
NDVI
NIR
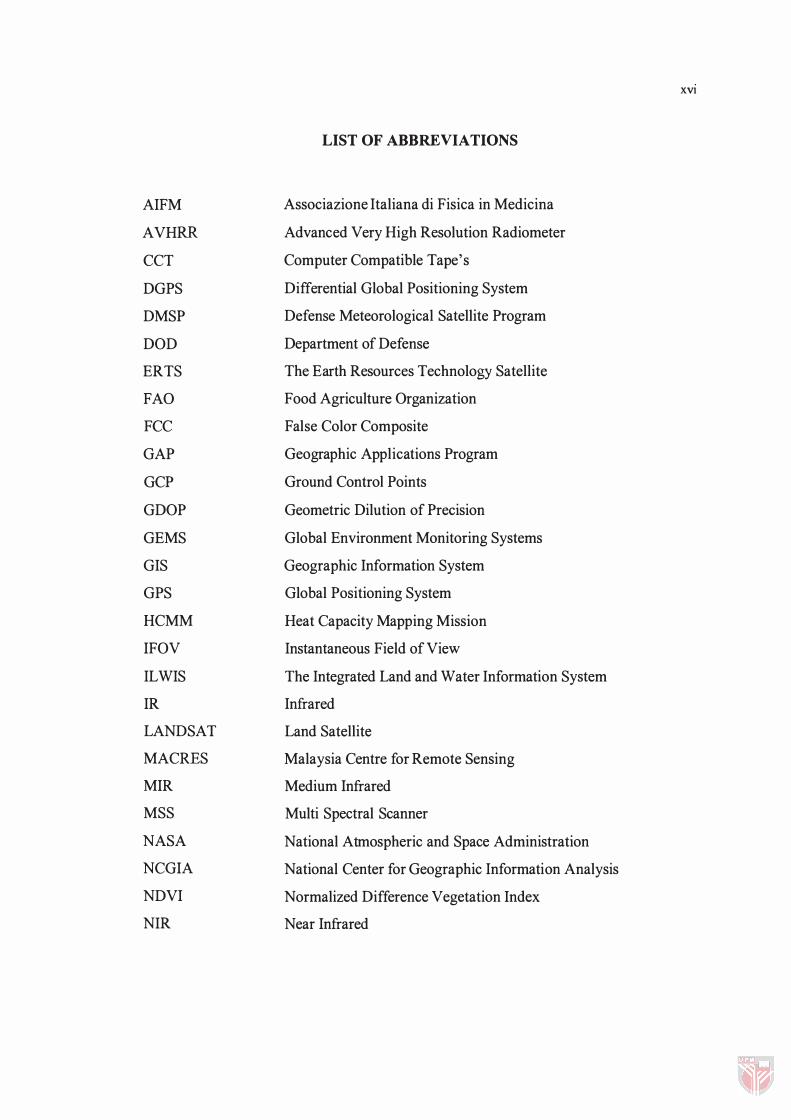
LIST OF A BBREVIATIONS
Associazione Italiana di Fisica in Medicina
Advanced Very High Resolution Radiometer
Computer Compatible Tape's
Differential Global Positioning System
Defense Meteorological Satellite Program
Department of Defense
The Earth Resources Technology Satellite
Food Agriculture Organization
False Color Composite
Geographic Applications Program
Ground Control Points
Geometric Dilution of Precision
Global Environment Monitoring Systems
Geographic Information System
Global Positioning System
Heat Capacity Mapping Mission
Instantaneous Field of View
The Integrated Land and Water Information System
Infrared
Land Satellite
Malaysia Centre for Remote Sensing
Medium Infrared
Multi Spectral Scanner
National Atmospheric and Space Administration
National Center for Geographic Information Analysis
Normalized Difference Vegetation Index
Near Infrared
XVI
NOAA
NRSA
RBV
RS
RSO
SAR
SIS
SPANS
SPOT
SVs
TIR
TM
TNGPS
TV
UNEP
UNESCO
USGS
National Oceanic and Atmospheric Administration
National Remote Sensing Agency
Return Beam Videocon
Remote Sensing
Rectified Skew Orthomorphic
Synthetic Aperture Radar
Spatial Information Systems
Spatial Analysis Systems
Satellite Probatoire d' Observation de la Terre
Space Vehicles
Thermal Infrared
Thematic Mapper
Trimble Navigator Global Positioning System
Television
United Nation Environment Program
XVll
United Nations Educational Scientific and Cultural Organization
United States Geographical Survey
C HAPTER I
Introduction
General Backgro und
The total land area of Peninsular Malaysia is approximately 1 3 .2 mil. ha, of
which 5.97 mil. ha or 45.3 percent is forested. The total area of Kelantan State is about
14,922 km2 and is situated in the north-eastern part of Peninsular Malaysia. It consists
of 10 districts and the total population is about 1 ,288,362. Gua Musang is one of the
districts with a population of about 143,258 covering a total area of 8 , 108 km2 (8 10,400
ha) .
Malaysia has achieved a significant . .
SOClO-economlC progress with the
abundance of natural land resources. However, like many other developing countries, it
still faces the processing needs to develop these resources to further improve the quality
of life in the increasing demand and population (Sixth Malaysia Plan, 1990)
The progress of research and development through remote sensing technology
has performed a new dimension of analyzing patterns of land use or mapping the land.
The use of remote sensing utility such as aerial photographs and satellite images has
2
become an essential roll in collecting land information or primary data. Remote sensing
technology can make one of the biggest and most significant contribution in the area of
land use in collecting data (Anderson et al., 1976) .
Remote sensing techniques have proven useful for gathering information about
natural resources on a large-scale basis, such as for the whole country. The Malaysian
Ministry of Agriculture has been using aerial photo interpretation for land use mapping
for Peninsular Malaysia. With the increasing availability of high resolution satellite
imagery, and as the land information handling capabilities within the country is
modernized, it is opportune to explore the potential of remote sensing and geographical
information system (GIS ) for information gathering and updating of its resources.
Change detection is a process for determining and evaluating differences in a
variety of surface phenomenon over time. Detecting, describing and understanding
changes in physical and biological processes and regulating the Earth's system is of
considerable interest to ecologists and resource managers. Change detection studies
recognize the abiotic and biotic components of the spectral and temporal changes that
are occurring within ecosystem (Mouat et al . , 1993).
The use of expert systems to detect change automatically in an image with very
little human interaction is still in its infancy. In fact, most scientists attempting to
develop such systems, employ and gathered many of the change detection algorithms.
Wang ( 1993) used a pre-processor to perform ( 1 ) image differencing, (2) create a change
mask using principal components, (3) perform automated fuzzy supervised
3
classification, and (4) extract attributes. Possible urban changes areas were then passed
to a rule based interpreter which produced a change image.
Some land cover types are static, that is, they do not change over time. But some
land cover is dynamic, changing rapidly. It is important that such changes be inventoried
accurately so that the physical and human processes at work can be more fully
understood (Jensen, 1 996). Therefore, it is not surprising that significant effort has gone
into the development of change detection methods using remotely sensed data (Jensen,
1996).
Geographical Information System (GIS) is rapidly becoming a standard tool
for the management of resource and currently, it is difficult to think of resource
planning without it. The availability of combining the utility of remote sensing and GIS
to produce a land use data, can greatly alter the important information needs for
administration, management and development in the process of decision making,
planning and monitoring.
GIS is a new technology that has became an important tool for analyzing and
transferring spatial data information from the surface of the earth to sheet of papers
(Burrough, 1 986). The spatial information data from remote sensing can be analyzed
using sophisticated GIS hardware and software computer system. This provide faster
and more efficient acquisition of such information to the users of such practices.
4
It would be expected that to use computer-assisted mapping would accompany or
be accompanied by the use of computer-assisted techniques for processing of remotely
sensed data. However the use of remote sensing techniques other than aerial
photography for land use mapping is at present still experimental. Some of the issues to
be faced, particularly in the developing countries are as follows:
(i) The utility of remotely-sensed data such as satellite imagery for land cover
mapping, particularly with respect to specificity and classification accuracy;
(ii) Registration with former maps for detection of land use changes and for related
spatial analyses on the GIS;
(iii) Availability and timeliness of remotely-sensed data for a complete coverage of
peninsular Malaysia, if not the whole country.
Pro blem Statement
The land use and land cover change are often found, including transformations
from rural land uses to residental, commercial, industrial and recreational uses. These
changes can be monitored using remotely sensed data (in combination with ground
survey), either by photo interpretation, enhanced false-color composite imagery from
different dates or by digital analysis of the imagery using change detection techniques
(Quarmby, 1989). Land use information is one of the essential tools for nearly all land
development activities efforts. Changes in the use of land are to large extent, a reflection
of how society responds to socio-economic, institutional and management practices.
5
The development of a country is usually dependent on rational utilization of their
natural resources, for economic advancement. In overall planning at the national level,
vital decisions have to be made regarding development, conservation and utilization of
available resources and for priorities investments and efforts to derive maximum
benefits. The impact on land use and land cover changes, especially in terms of changes
from forest cover to other land cover, has been one of the important issues on land use
change research. In the primitive times when there was little human population and low
level of economic activity, deforestation was not a problem because the natural
regeneration of forest was adequate to cover for any loss of forest by the human beings.
In Malaysia, land use has undergone many changes particularly after the country
achieved its independence. Land use changes were driven by a number of economical,
socio-political and biophysical factors. Over the last two decades, the evolution of land
use became drastic in the urban and rural areas. Especially, more land areas have been
displaced or converted to non-agricultural activities particularly for industry, housing
and commercial activities. Land use and land cover are continuously changing, both
under the influence of human activities and nature resulting in various kinds of impacts
on the ecosystem. These impacts have the potential to significantly affect the
sustainability of the agricultural and forest systems. The most important factor in the
modification of the land cover and its conversion is the human activities.
The knowledge of land use and land cover is important for many planning and
management activities concerned with the surface of the earth. Land use information is
one of the essential tools for nearly all land development activities. Changes in the cover
6
have important implications on a range of issues, such as biosphere-atmosphere
interactions, endangered species and genetic diversity associated with changing habitats,
soil conditions, water and sediment flows and sustainable use of natural resources in the
development process of human societies (Turner et aI. , 1 994).
Major changes in various land use categories for period prior and up to 1990 in
Peninsular Malaysia were reported by Ministry of Agriculture, Malaysia. A total of 5 .22
million ha has been opened for development of which 4.9 million ha were under
agriculture and about 7.6 million ha under forest, shrubs and swamps. The land use and
cover maps of Peninsular Malaysia produced in 1974 by the Malaysian Ministry of
Agriculture were based on visual interpretation of aerial photos. By then, the Ministry
had acquired a COMARC GIS for digitizing the interpreted maps and to serve as a data
retrieval facility whereby maps of any selected area can be plotted on demand with area
summaries (Wong, 1 976).
The use of remote sensing techniques other than aerial photography for land use
mapping is at present still experimental. The first issue would hopefully be facilitated
with the impending functioning of Malaysian Center for Remote Sensing for centralized
acquisition of remotely sensed data and the second issue in terms of research and data
acquisition effort is nevertheless important in view of a potentially growing user
community with data needs for a wide range of GIS applications. Therefore,
technologies such as remote sensing and GIS can be applied for monitoring land use
changes. The remotely sensed data of satellite images can provide timely, reliable, cost
competitive and quick information on dynamic condition of the land use, which are
7
essential in the forecasting and appraisal of land use changes which are useful in
decision making (Wan Yusoff, 1988). GIS can solve than in systems that handle just
attribute or spatial data alone, users can interrogate geographical features displayed on a
computer map and retrieve associated attribute information for display or further
analysis. Maps can be constructed by querying or analyzing attribute data and new sets
of information can be generated by performing spatial operations such as polygon
overlays on the integrated data set.
One fundamental set of tools crucial in assessmg land use and land cover
changes will be the data provided by remote sensing and data management capacity of
Geographic Information System (GIS). Current trends in this technology indicated that
remote sensing and GIS will play a greater role in land use change monitoring. Recent
advances include an increasing number of useful earth observing satellites, the advent of
radar satellites, and major improvements in our ability to manage the vast quantities of
data will be available to further monitor changes in land use and cover certain period of
time. Remote sensing will become increasingly indispensable in Malaysia for the
effective conservation, management and development of its resources (Khali, 1 99 1 )
O bjecti ve
The objective of this study is to asses the usefulness of integrating remotely
sensed data (Landsat TM) with GIS for land use change detection. The specific
objective is to quantify and map the land use change in northern part of Gua Musang
District, Kelantan State between 1 990 to 1 997.