Embed Size (px)
Citation preview

STATE FACILITY ENERGY UPGRADE ANALYSIS
AND PERFORMANCE CONTRACTING POTENTIAL
FINAL
ENERGY BENCHMARKING STUDY
VOLUME II
Appendix
Submitted to
The State of Hawaii Department of Business, Economic Development, & Tourism
Strategic Industries Division
By
Cedric D. O. Chong and Associates 828 Fort St. Mall, Ste. 500
Honolulu, HI 96813
July 15 2005

APPENDIX 1.0
UH Manoa Campus Energy Benchmarking Study Executive Summary

BBEENNCCHHMMAARRKKIINNGG STUDY
FFOORR
UUNNIIVVEERRSSIITTYY OOFF HHAAWWAAIIII AATT MMAANNOOAA CCAAMMPPUUSS
MMaarrcchh 55,, 22000044
PPRREEPPAARREEDD FFOORR::
HHAAWWAAIIIIAANN EELLEECCTTRRIICC CCOOMMPPAANNYY HHOONNOOLLUULLUU,, HHAAWWAAIIII 9966881133
PPRREEPPAARREEDD BBYY::
CCEEDDRRIICC DD..OO.. CCHHOONNGG && AASSSSOOCCIIAATTEESS,, IINNCC.. 882288 FFOORRTT SSTTRREEEETT MMAALLLL,, SSUUIITTEE 550000
HHOONNOOLLUULLUU,, HHAAWWAAIIII 9966881133
PPrree--FFiinnaall RReeppoorrtt
1
ABSTRACT
This report presents an energy benchmarking study conducted for the University of Hawaii at
Manoa Campus. A database was developed based on the campus electricity utility history,
organized by the campus building occupancy type and building age. The developed database was
evaluated against the building classification in order to identify the benchmarking trends.
According to this study, the campus buildings consume an average of 22.8 kWh per year per square
feet of occupied space. However, large variations exist between the Energy Utilization Index (EUI)
of buildings when evaluated by occupancy. EUI of laboratory type facilities was 64.3 kWh/sq.ft.-
year and dormitories was 5.1.
A detailed benchmarking analysis was conducted to identify the Energy Conservation Measures
(ECMs) that were applicable to majority of the campus buildings. Sources of data included energy
audits conducted in 2001 on 44 buildings, representing approximately 40% of the campus buildings
square footage area. Campus walkthrough audits were conducted for the buildings that had no prior
energy audits. In addition, electrical consumption data was collected using metered data from
Campus sub-meters. ECMs documented in the audit reports, integrated with additional engineering
observations, were generalized for the entire campus when applicable.
The ECMs were categorized by the energy savings potentials and payback periods. Three ECMs
were identified that were applicable to the majority of the buildings through the campus. Those
ECMs are: 1) interior and exterior lighting replacements with efficient lighting, 2) replacement of
existing exit signs with efficient LED exit signs, 3) window tinting with shading coefficient
(sc)=0.4. When extrapolated for the entire campus, it was determined that implementing the listed
ECMs would reduce the UH Manoa Campus electricity approximately 4.3 %. Eleven other ECMs
were identified that were common to a sizable number of the buildings in the campus. When the
savings for these ECMs were extrapolated for the entire campus, it was estimated that
implementing these ECMs would reduce the campus electricity another 11 percent with payback
periods ranging from 3 to 13 years. Several other ECMs were applicable only to specific buildings

ACKNOWLEDGEMENT in the campus. Therefore, they were not generalized in the benchmarking. If all evaluated ECMs
were applied throughout the campus, the campus could save up to 20 % electricity. However,
further detailed design and engineering analysis is recommended for a more precise ECM
estimates.
This study was sponsored with funding from the University of Hawaii Sea Grant Program, The
University of Hawaii Office of Sustainability, and Hawaiian Electric Company. The Hawaiian
Electric Company wishes to express its gratitude to Gordon Grau, Stephen Meder, Rodney
Sakaguchi, Kalvin Kashimoto, and Bruce Miller of UH for providing impetus and support for this
project.
The UH benchmarking project was administered by the Hawaiian Electric Company: Jim Maskrey,
Commercial Energy Efficiency Program Manager, with technical assistance provided by Tom Van
Liew, PE, Project Engineer. The report was prepared by Melek Yalcintas, PhD, PE, Cedric D.O.
Chong and Associates, Inc.
2 3

EXECUTIVE SUMMARY
5
UNIVERSITY OF HAWAII AT MANOA BUILDING SQUARE FEET AREA BY OCCUPANCY TYPE
OFFICE / LAB7.8%LAB/ CLASS/ OFFICE
14.0%
LAB/ CLASS1.5%
LIBRARY8.8%
OFFICE7.0%
FOOD/FACILITY/OFFICE3.2%
CLASS/ OFFICE22.7%
DORMITORY16.1%
OTHER18.1%
STORAGE0.8%
This benchmarking study reports electricity consumption distribution through the University of
Hawaii at Manoa Campus by building occupancy, end use and the age of a building. Additionally,
benchmarking for various Energy Conservation Measures (ECMs) and associated energy savings
potentials for the whole campus are presented in the report.
The source data for the benchmarking study consisted of reports from energy audits conducted on
various buildings, data recorded from electricity meters installed on various buildings, and
additional campus walkthrough energy audits.
The total building floor space through the UH Manoa Campus, excluding pavements, sidewalks,
courtyards and any open spaces, is about 6,122,395 square feet. The total yearly electricity
consumption by the entire campus for the year 2003 was 139,765,181 kWh. The UH Manoa has
spent approximately 12 million dollars for electricity for the year 2003. This results in an average
of 22.8 kW per square foot of occupied building space per year electricity consumption and an
average of $1.96 per square feet electricity cost.
Figure 1: University of Hawaii at Manoa Building Square Feet Area by Occupancy Type.
UNIVERSITY OF HAWAII AT MANOA ELECTRICITY CONSUMPTION BY OCCUPANCY TYPE
STORAGE0.4%
OTHER6.9%
DORMITORY3.6%
CLASS/ OFFICE21.7%
FOOD/FACILITY/OFFICE6.0%
OFFICE7.2%
LIBRARY10.8%
LAB/ CLASS4.3%
LAB/ CLASS/ OFFICE27.4%
OFFICE / LAB11.8%
The building floor area and energy use distribution by building occupancy types were determined
as part of the benchmarking study, and illustrated in Figure 1 and Figure 2.
Figure 2: University of Hawaii at Manoa Electricity Consumption by Occupancy Type.
4

The building floor area and yearly electricity usage by square foot for building occupancy type and
campus-wide percentage electricity usage are documented in the following Table 1.
The campus buildings floor area and energy use were also categorized by the year of construction.
Distribution was made by four time periods:
Table 1: University of Hawaii at Manoa Campus Building Floor Area and Yearly Electricity Use Buildings that were constructed from year: 1) 1912 to 1950, 2) 1951 to 1970, Building
Occupancy Type
Total Occupied Building
Space (sq.ft.)
% Building
Space (sq.ft.)
Total Building Electricity Use
(kWh/year)
Building Electricity Use per square foot
(kWh/sq.ft.-year)
% of Total Energy
Use
Ratio of Energy Use to Area
LAB/CLASS
94,133
2
5,964,206
64.3
4.3
2.2
LAB/CLASS
/OFFICE
855,234
14
38,263,645
44.7
27.4
2.0
FOOD/FACILITY
/OFFICE
198,762
3
8,376,420
42.1
6.0
2.0
OFFICE/LAB
476,381
8
16,487,311
34.7
11.6
1.5
LIBRARY
538,543
9
15,097,136
28.0
10.8
1.2
OFFICE
426,497
7
10,111,205
23.7
7.2
1.0
CLASS/OFFICE
1,390,020
22
30,277,275
21.8
21.7
1.0
STORAGE
51,991
1
496,084
9.5
0.4
0.4
OTHERS
1,105,426
18
9,632,147
8.7
6.9
0.4
DORMITORY
984,708
16
5,096,752
5.1
3.6
0.2
TOTAL
6,122,395
100
139,765,181
22.9 100
3) 1971 to 1990, and
4) 1991 to 2004.
The building square feet area and energy consumption are shown in the following Figure 3 and
Figure 4.
UNIVERSITY OF HAWAII AT MANOA BUILDING SQUARE FEET AREA BY YEARS OF CONSTRUCTION
Buildings that w ere built f rom 1971 to 1990
49%
Buildings that w ere built f rom 1951 to 1970
34%
Buildings that w ere built f rom 1912 to 1950
7%
Buildings that w ere built f rom 1991 to 2004
10%
Figure 3: UH Manoa Building Square Feet Area by Years of Construction.
6 7

9
UNIVERSITY OF HAWAII AT MANOA ELECTRICITY CONSUMPTION PERCENTAGE BY UTILITY
MISCELLANEOUS18%
LIGHTING30%
AIR CONDITIONING52%
UNIVERSITY OF HAWAII AT MANOA ELECTRICITY MONITORING AND ENERGY AUDIT HISTORY BY
YEAR OF CONSTRUCTION
Buildings that w ere built from 1991 to 2004
16%
Buildings that w ere built from 1912 to 1950
4%
Buildings that w ere built from 1951 to 1970
37%
Buildings that w ere built from 1971 to 1990
43%
Figure 5: UH Manoa Electricity Consumption Percentage by Utility. Figure 4: UH Manoa Electricity Monitoring and Energy Audit History by Years of Construction. According to the energy audits that were conducted on 2,303,464 square feet of building space in
year 2000 and 2001, energy savings of 10,098,284 kWh per year, or $1,037,250 per year was
estimated for the buildings covered by the audits. The estimated construction cost for
implementation of the recommended ECMs was $6,477,150, which would result in a payback of
about 6.2 years. If the energy savings predicted by the energy audits were extrapolated through the
entire campus, the campus-wide energy savings would be about 25,729,000 kWh per year, or
$2,641,160 per year, with a corresponding construction cost of $16,338,440 for the implementation
of all ECMs. This would correspond to roughly a 20 percent reduction in the campus-wide
electricity consumption.
The electricity use distribution by utility categories, including air conditioning, lighting and
miscellaneous equipment in the buildings such as computers, specialty laboratory equipment etc.,
for the entire campus was determined. Findings suggest that more than half of the campus
electricity is spent for air conditioning. Figure 5 illustrates these findings.
From the energy audit reports, a total of fourteen ECMs were identified that would produce energy
savings with a payback period of less than 15 years. In order to support the effort for a more
precise prediction of energy savings opportunities of various ECMs, three ECMs were further
categorized that were likely to apply to the majority of the buildings throughout the campus. Those
8

ECMs were: 1) interior and exterior lighting replacements with more energy efficient lighting, 2)
replacement of existing ‘Exit’ signs with efficient LED ‘Exit’ signs, and 3) window tinting, shading
coefficient (sc)=0.4. Those ECMs and the percentage energy savings are listed in the following
Table 2. Note that the estimates in the Table 2 do not cover libraries, sports arena, dormitories, and
residential units due to lack of energy audit report data for comparison.
Table 3: Energy Conservation Measures and Potential Electricity Savings with less then Seven Years Payback Period
11
Description Estimated
Construction Cost ($)
Estimated Energy/Savings (kWh/year)
Estimated Energy Cost Savings ($/year)
Simple Payback (year)
ECM-IV Chiller Retrofits
3,992,485
6,687,542
630,035
6.34
ECM-V Variable Speed Drive Utilization
1,466,828
2,923,974
287,017
5.11
ECM-VIII
Waste Heat Recovery System
59,627
249,959
24,247
2.46
ECM-X Energy Management Systems (EMS) Installation
342,724
2,655,365
257,521
1.33
ECM-X IV
Outside Air CO2 Sensor Installation
272,137
448,412
50,552
5.38
Table 2: Energy Conservation Measures I, II & III and Potential Electricity Savings
Description EstimatedConstruction Cost ($)
Estimated Energy/Savings (kWh/year)
Estimated Energy Cost Savings ($/year)
Simple Payback (year)
ECM-I Interior and exterior lighting Replacement
3,986,870
4,928,997
529,689
7.5
ECM-II LED ExitSign Installation
438,181
338,732
113,538
3.8
ECM-III Window Tinting sc=0.4
560,266
848,642
75,950
7.4
Totals 6,133,805 12,965,252 1,249,422 4.9
Totals 4,984,318 6,116,372 719,177 6.9 The remaining eleven ECMs of the identified fourteen ECMs were extrapolated for the entire
campus based on square feet energy savings potentials and associated cost by square feet. Table 3
lists energy savings potentials of the ECMs with less than seven years payback period, and Table 4
lists the ECMs with higher that seven years payback period.
Please note that while the ECMs presented in the Table 3 and Table 4 provide a rough idea on the
campus-wide energy savings potentials, a more detailed ECM study is recommended for a more
precise predictions.
10

Table 4: Energy Conservation Measures and Potential Electricity Savings with more then Seven Years Payback Period Description Estimated
Construction Cost ($)
Estimated Energy/Savings (kWh/year)
Estimated Energy Cost Savings ($/year)
Simple Payback (year)
ECM-VI OTHER(ECMs Unique to Buildings)
398,317
313,249
30,385
13.11
ECM-VII Motor Replacement with High Efficiency Motors
468,055
642,922
47,951
7.76
ECM-IX Packaged AirConditioning Replacement
415,088
466,121
45,215
9.18
ECM-XI Insulation Installation
980,079
1,257,681
124,477
7.87
ECM-XII ConvertConstant Volume to VAV System
156,018
195,997
19,011
8.21
ECM-XIII
Repair VAV Control System
212,287
93,217
17,139
12.39
Totals 2,629,844 2,969,243 284,178 9.25
12

APPENDIX 2.0
HECO Electricity Billing History for Large State Facilities on Oahu for 2003 and 2004

TABLE: STATE LARGE FACILITIES IN OAHU ELECTRICITY BILL HISTORY FOR YEAR 2003 (PROVIDED BY HECO)
ACCTNUM TARCDE REVPER RATESCH BILLDMD KW KWH NBRDAYS TOTAMT DEPARTMENT NAME9600-5614-003 1 200301 PS 1,883 1,243 457,200 32 62,117$ Convention Center SOH CONVENTION CTR AUTHORITY9600-5614-003 1 200302 PS 2,185 1,847 538,200 30 72,902$ Convention Center SOH CONVENTION CTR AUTHORITY9600-5614-003 1 200303 PS 2,251 1,980 669,000 29 87,082$ Convention Center SOH CONVENTION CTR AUTHORITY9600-5614-003 1 200304 PS 2,827 2,827 796,800 32 106,016$ Convention Center SOH CONVENTION CTR AUTHORITY9600-5614-003 1 200305 PS 2,810 2,793 626,400 29 90,507$ Convention Center SOH CONVENTION CTR AUTHORITY9600-5614-003 1 200306 PS 2,216 1,605 500,400 30 72,002$ Convention Center SOH CONVENTION CTR AUTHORITY9600-5614-003 1 200307 PS 2,191 1,555 561,000 32 75,468$ Convention Center SOH CONVENTION CTR AUTHORITY9600-5614-003 1 200308 PS 2,313 1,798 629,400 30 81,409$ Convention Center SOH CONVENTION CTR AUTHORITY9600-5614-003 1 200309 PS 3,400 3,400 982,800 32 122,277$ Convention Center SOH CONVENTION CTR AUTHORITY9600-5614-003 1 200310 PS 2,494 1,587 532,200 30 73,536$ Convention Center SOH CONVENTION CTR AUTHORITY9600-5614-003 1 200311 PS 2,795 2,190 686,400 29 89,574$ Convention Center SOH CONVENTION CTR AUTHORITY9600-5614-003 1 200312 PS 2,992 2,584 693,600 32 92,874$ Convention Center SOH CONVENTION CTR AUTHORITY
TOTAL 7,673,400 1,025,765$ 8800-6839-077 1 200301 PS5 1,460 1,360 510,000 31 61,746$ DAGS SOH DAGS8800-6839-077 1 200302 PS5 1,560 1,560 560,000 28 67,823$ DAGS SOH DAGS8800-6839-077 1 200303 PS5 1,500 1,440 612,000 32 72,867$ DAGS SOH DAGS8800-6839-077 1 200304 PS5 1,350 1,140 588,000 29 70,637$ DAGS SOH DAGS8800-6839-077 1 200305 PS5 1,520 1,480 644,000 30 78,535$ DAGS SOH DAGS8800-6839-077 1 200306 PS5 1,470 1,380 504,000 32 65,091$ DAGS SOH DAGS8800-6839-077 1 200307 PS5 1,447 1,334 464,000 29 60,061$ DAGS SOH DAGS8800-6839-077 1 200308 PS5 1,490 1,420 476,000 30 59,843$ DAGS SOH DAGS8800-6839-077 1 200309 PS5 1,470 1,380 494,000 33 60,495$ DAGS SOH DAGS8800-6839-077 1 200310 PS5 1,510 1,460 462,000 29 57,605$ DAGS SOH DAGS8800-6839-077 1 200311 PS5 1,470 1,380 522,000 30 61,968$ DAGS SOH DAGS8800-6839-077 1 200312 PS5 1,450 1,340 436,000 32 54,461$ DAGS SOH DAGS
TOTAL 6,272,000 771,132$ 8819-2839-079 1 200301 J3 576 576 182,000 30 22,349$ DAGS SOH DAGS CENTRAL SERVICES8819-2839-079 1 200302 J3 588 588 206,000 33 25,058$ DAGS SOH DAGS CENTRAL SERVICES8819-2839-079 1 200303 J3 590 590 189,000 29 24,002$ DAGS SOH DAGS CENTRAL SERVICES8819-2839-079 1 200304 J3 590 590 184,000 29 23,713$ DAGS SOH DAGS CENTRAL SERVICES8819-2839-079 1 200305 J3 562 562 186,000 29 23,873$ DAGS SOH DAGS CENTRAL SERVICES8819-2839-079 1 200306 J3 623 623 194,000 32 24,910$ DAGS SOH DAGS CENTRAL SERVICES8819-2839-079 1 200307 J3 620 620 188,000 29 23,565$ DAGS SOH DAGS CENTRAL SERVICES8819-2839-079 1 200308 J3 653 653 221,000 33 26,672$ DAGS SOH DAGS CENTRAL SERVICES8819-2839-079 1 200309 J3 629 629 205,000 30 24,677$ DAGS SOH DAGS CENTRAL SERVICES8819-2839-079 1 200310 J3 638 638 209,000 30 24,937$ DAGS SOH DAGS CENTRAL SERVICES8819-2839-079 1 200311 J3 615 615 198,000 31 23,686$ DAGS SOH DAGS CENTRAL SERVICES8819-2839-079 1 200312 J3 591 591 168,000 28 20,812$ DAGS SOH DAGS CENTRAL SERVICES
TOTAL 2,330,000 288,253$ 8819-9076-075 1 200301 J 292 205 78,000 31 10,150$ DAGS SOH DAGS8819-9076-075 1 200302 J 292 203 92,400 33 11,706$ DAGS SOH DAGS8819-9076-075 1 200303 J 311 311 106,080 28 13,571$ DAGS SOH DAGS8819-9076-075 1 200304 J 299 299 121,680 30 15,206$ DAGS SOH DAGS8819-9076-075 1 200305 J 335 335 105,360 29 13,890$ DAGS SOH DAGS8819-9076-075 1 200306 J 311 311 108,960 33 13,927$ DAGS SOH DAGS8819-9076-075 1 200307 J 318 318 99,600 29 12,617$ DAGS SOH DAGS8819-9076-075 1 200308 J 307 307 114,240 32 13,796$ DAGS SOH DAGS8819-9076-075 1 200309 J 322 322 104,160 30 12,795$ DAGS SOH DAGS8819-9076-075 1 200310 J 332 332 110,400 30 13,380$ DAGS SOH DAGS8819-9076-075 1 200311 J 339 339 106,800 31 13,077$ DAGS SOH DAGS8819-9076-075 1 200312 J 326 326 96,000 28 12,021$ DAGS SOH DAGS
TOTAL 1,243,680 156,137$ 8820-4007-075 1 200301 J3 627 627 204,000 31 25,137$ DAGS SOH DAGS8820-4007-075 1 200302 J3 631 631 230,000 33 28,041$ DAGS SOH DAGS8820-4007-075 1 200303 J3 620 620 201,000 29 25,726$ DAGS SOH DAGS8820-4007-075 1 200304 J3 616 616 198,000 29 25,644$ DAGS SOH DAGS8820-4007-075 1 200305 J3 611 611 204,000 29 26,420$ DAGS SOH DAGS8820-4007-075 1 200306 J3 617 617 229,000 33 28,802$ DAGS SOH DAGS8820-4007-075 1 200307 J3 604 604 214,000 29 26,289$ DAGS SOH DAGS8820-4007-075 1 200308 J3 649 649 227,000 33 27,528$ DAGS SOH DAGS8820-4007-075 1 200309 J3 628 628 205,000 29 24,948$ DAGS SOH DAGS8820-4007-075 1 200310 J3 626 626 220,000 30 26,195$ DAGS SOH DAGS8820-4007-075 1 200311 J3 622 622 217,000 32 25,827$ DAGS SOH DAGS8820-4007-075 1 200312 J3 609 609 175,000 27 21,847$ DAGS SOH DAGS
TOTAL 2,524,000 312,404$ 8820-5318-076 1 200301 PS5 1,401 1,397 571,200 30 66,767$ DAGS SOH DAGS8820-5318-076 1 200302 PS5 1,424 1,424 629,400 32 72,859$ DAGS SOH DAGS8820-5318-076 1 200303 PS5 1,416 1,407 573,000 29 69,648$ DAGS SOH DAGS8820-5318-076 1 200304 PS5 1,435 1,435 600,000 30 73,099$ DAGS SOH DAGS8820-5318-076 1 200305 PS5 1,424 1,412 589,800 29 72,572$ DAGS SOH DAGS8820-5318-076 1 200306 PS5 1,439 1,439 644,400 32 76,901$ DAGS SOH DAGS8820-5318-076 1 200307 PS5 1,434 1,429 619,800 30 72,270$ DAGS SOH DAGS8820-5318-076 1 200308 PS5 1,444 1,444 652,800 32 74,027$ DAGS SOH DAGS8820-5318-076 1 200309 PS5 1,445 1,445 615,600 30 70,141$ DAGS SOH DAGS8820-5318-076 1 200310 PS5 1,444 1,442 629,400 30 70,696$ DAGS SOH DAGS8820-5318-076 1 200311 PS5 1,429 1,412 612,000 31 68,991$ DAGS SOH DAGS8820-5318-076 1 200312 PS5 1,412 1,378 580,800 30 66,785$ DAGS SOH DAGS
TOTAL 7,318,200 854,756$ 8820-5319-075 1 200301 J 432 421 131,200 30 16,662$ DAGS SOH DAGS8820-5319-075 1 200302 J 457 457 144,800 32 18,391$ DAGS SOH DAGS8820-5319-075 1 200303 J 479 479 138,400 29 18,358$ DAGS SOH DAGS8820-5319-075 1 200304 J 483 483 146,000 30 19,370$ DAGS SOH DAGS8820-5319-075 1 200305 J 527 527 141,600 29 19,382$ DAGS SOH DAGS8820-5319-075 1 200306 J 497 497 158,800 32 20,762$ DAGS SOH DAGS8820-5319-075 1 200307 J 508 508 152,800 30 19,629$ DAGS SOH DAGS8820-5319-075 1 200308 J 538 538 166,800 32 20,957$ DAGS SOH DAGS8820-5319-075 1 200309 J 550 550 151,600 30 19,362$ DAGS SOH DAGS8820-5319-075 1 200310 J 479 479 148,400 30 18,330$ DAGS SOH DAGS8820-5319-075 1 200311 J 494 494 136,400 31 17,259$ DAGS SOH DAGS8820-5319-075 1 200312 J 453 453 126,800 30 16,135$ DAGS SOH DAGS
TOTAL 1,743,600 224,598$ 8824-3048-076 1 200301 J 648 648 200,800 32 25,194$ DAGS SOH DAGS8824-3048-076 1 200302 J 664 664 207,600 31 26,284$ DAGS SOH DAGS8824-3048-076 1 200303 J 691 691 188,000 28 25,140$ DAGS SOH DAGS8824-3048-076 1 200304 J 692 692 194,800 29 26,055$ DAGS SOH DAGS8824-3048-076 1 200305 J 689 689 210,400 32 27,871$ DAGS SOH DAGS8824-3048-076 1 200306 J 708 708 207,600 30 27,395$ DAGS SOH DAGS8824-3048-076 1 200307 J 688 688 202,000 29 25,883$ DAGS SOH DAGS8824-3048-076 1 200308 J 732 732 225,200 33 28,178$ DAGS SOH DAGS8824-3048-076 1 200309 J 708 708 203,600 29 25,600$ DAGS SOH DAGS8824-3048-076 1 200310 J 724 724 222,400 32 27,363$ DAGS SOH DAGS8824-3048-076 1 200311 J 675 675 195,600 29 24,362$ DAGS SOH DAGS8824-3048-076 1 200312 J 549 492 185,200 28 22,556$ DAGS SOH DAGS
TOTAL 2,443,200 311,882$ 8824-4189-078 1 200301 J 427 427 203,520 32 23,599$ DAGS SOH DAGS8824-4189-078 1 200302 J 509 509 202,800 31 24,776$ DAGS SOH DAGS8824-4189-078 1 200303 J 516 516 186,720 28 23,818$ DAGS SOH DAGS8824-4189-078 1 200304 J 490 490 216,480 29 26,721$ DAGS SOH DAGS8824-4189-078 1 200305 J 518 518 215,520 32 27,177$ DAGS SOH DAGS8824-4189-078 1 200306 J 523 523 202,560 30 25,589$ DAGS SOH DAGS8824-4189-078 1 200307 J 444 444 200,640 29 23,776$ DAGS SOH DAGS8824-4189-078 1 200308 J 518 518 226,080 33 26,590$ DAGS SOH DAGS8824-4189-078 1 200309 J 456 456 193,680 29 22,701$ DAGS SOH DAGS

TABLE: STATE LARGE FACILITIES IN OAHU ELECTRICITY BILL HISTORY FOR YEAR 2003 (PROVIDED BY HECO)
ACCTNUM TARCDE REVPER RATESCH BILLDMD KW KWH NBRDAYS TOTAMT DEPARTMENT NAME8824-4189-078 1 200310 J 463 463 219,120 32 24,860$ DAGS SOH DAGS8824-4189-078 1 200311 J 499 499 189,120 29 22,526$ DAGS SOH DAGS8824-4189-078 1 200312 J 473 473 174,240 28 21,045$ DAGS SOH DAGS
TOTAL 2,430,480 293,178$ 8824-4781-075 1 200301 J 371 371 118,640 31 14,907$ DAGS SOH DAGS8824-4781-075 1 200302 J 378 378 127,120 33 15,968$ DAGS SOH DAGS8824-4781-075 1 200303 J 381 381 108,560 28 14,468$ DAGS SOH DAGS8824-4781-075 1 200304 J 380 380 114,720 30 15,237$ DAGS SOH DAGS8824-4781-075 1 200305 J 370 370 112,560 29 15,039$ DAGS SOH DAGS8824-4781-075 1 200306 J 418 418 124,080 33 16,471$ DAGS SOH DAGS8824-4781-075 1 200307 J 406 406 115,120 29 14,986$ DAGS SOH DAGS8824-4781-075 1 200308 J 384 384 132,480 33 16,336$ DAGS SOH DAGS8824-4781-075 1 200309 J 396 396 119,440 29 14,989$ DAGS SOH DAGS8824-4781-075 1 200310 J 382 382 127,840 30 15,581$ DAGS SOH DAGS8824-4781-075 1 200311 J 366 366 123,200 31 14,998$ DAGS SOH DAGS8824-4781-075 1 200312 J 357 357 112,000 28 13,949$ DAGS SOH DAGS
TOTAL 1,435,760 182,931$ 8824-8557-076 1 200301 J 1,076 1,076 324,000 31 40,818$ DAGS SOH DAGS8824-8557-076 1 200302 J 1,104 1,104 356,400 33 44,734$ DAGS SOH DAGS8824-8557-076 1 200303 J 1,168 1,168 330,800 28 43,770$ DAGS SOH DAGS8824-8557-076 1 200304 J 1,168 1,168 354,400 30 46,648$ DAGS SOH DAGS8824-8557-076 1 200305 J 1,132 1,132 350,800 29 46,282$ DAGS SOH DAGS8824-8557-076 1 200306 J 1,140 1,140 377,600 33 48,648$ DAGS SOH DAGS8824-8557-076 1 200307 J 1,124 1,124 333,200 29 42,586$ DAGS SOH DAGS8824-8557-076 1 200308 J 1,124 1,124 375,600 33 46,163$ DAGS SOH DAGS8824-8557-076 1 200309 J 1,120 1,120 331,200 29 41,334$ DAGS SOH DAGS8824-8557-076 1 200310 J 1,192 1,192 365,600 30 44,941$ DAGS SOH DAGS8824-8557-076 1 200311 J 1,172 1,172 338,400 31 42,104$ DAGS SOH DAGS8824-8557-076 1 200312 J 1,084 1,084 294,400 28 37,445$ DAGS SOH DAGS
TOTAL 4,132,400 525,473$ 8824-8619-075 1 200301 J5 440 440 119,000 32 15,400$ DAGS SOH DAGS8824-8619-075 1 200302 J5 420 420 125,500 31 16,059$ DAGS SOH DAGS8824-8619-075 1 200303 J5 410 410 110,500 28 14,833$ DAGS SOH DAGS8824-8619-075 1 200304 J5 425 425 114,000 29 15,434$ DAGS SOH DAGS8824-8619-075 1 200305 J5 405 405 122,500 32 16,284$ DAGS SOH DAGS8824-8619-075 1 200306 J5 400 400 128,500 30 16,661$ DAGS SOH DAGS8824-8619-075 1 200307 J5 430 430 127,500 29 16,301$ DAGS SOH DAGS8824-8619-075 1 200308 J5 415 415 140,500 33 17,256$ DAGS SOH DAGS8824-8619-075 1 200309 J5 435 435 116,000 29 14,849$ DAGS SOH DAGS8824-8619-075 1 200310 J5 415 415 138,500 32 16,768$ DAGS SOH DAGS8824-8619-075 1 200311 J5 405 405 117,500 29 14,656$ DAGS SOH DAGS
TOTAL 1,360,000 174,500$ 9800-1977-002 1 200301 J 767 767 255,200 33 31,458$ DAGS SOH DAGS9800-1977-002 1 200302 J 781 781 227,200 29 29,058$ DAGS SOH DAGS9800-1977-002 1 200303 J 808 808 242,400 31 31,252$ DAGS SOH DAGS9800-1977-002 1 200304 J 858 858 219,200 28 29,876$ DAGS SOH DAGS9800-1977-002 1 200305 J 866 866 236,800 31 32,003$ DAGS SOH DAGS9800-1977-002 1 200306 J 848 848 241,600 30 32,516$ DAGS SOH DAGS9800-1977-002 1 200307 J 868 868 236,000 29 31,517$ DAGS SOH DAGS9800-1977-002 1 200308 J 852 852 259,600 32 32,880$ DAGS SOH DAGS9800-1977-002 1 200309 J 867 867 257,600 31 32,434$ DAGS SOH DAGS9800-1977-002 1 200310 J 853 853 247,600 29 31,073$ DAGS SOH DAGS9800-1977-002 1 200311 J 864 864 241,200 28 30,343$ DAGS SOH DAGS9800-1977-002 1 200312 J 841 841 256,000 33 31,645$ DAGS SOH DAGS
TOTAL 2,920,400 376,055$ 8819-4960-078 1 200301 J 99 90 19,200 30 2,777$ DBEDT SOH FOREIGN TRADE8819-4960-078 1 200302 J 99 92 20,800 32 2,971$ DBEDT SOH FOREIGN TRADE8819-4960-078 1 200303 J 99 89 21,760 29 3,137$ DBEDT SOH FOREIGN TRADE8819-4960-078 1 200304 J 106 106 23,360 30 3,390$ DBEDT SOH FOREIGN TRADE8819-4960-078 1 200305 J 102 102 24,000 29 3,451$ DBEDT SOH FOREIGN TRADE8819-4960-078 1 200306 J 110 110 28,160 32 3,917$ DBEDT SOH FOREIGN TRADE8819-4960-078 1 200307 J 115 115 28,800 30 3,920$ DBEDT SOH FOREIGN TRADE8819-4960-078 1 200308 J 104 104 31,680 32 4,060$ DBEDT SOH FOREIGN TRADE8819-4960-078 1 200309 J 119 119 29,120 30 3,887$ DBEDT SOH FOREIGN TRADE8819-4960-078 1 200310 J 122 122 30,080 30 3,977$ DBEDT SOH FOREIGN TRADE8819-4960-078 1 200311 J 124 124 25,920 31 3,582$ DBEDT SOH FOREIGN TRADE8819-4960-078 1 200312 J 104 104 22,400 30 3,107$ DBEDT SOH FOREIGN TRADE
TOTAL 305,280 42,175$ 0000-3507-002 1 200301 J 351 351 110,400 30 13,909$ Dept of Defense KAPALAMA MILITARY RESERVATION0000-3507-002 1 200302 J 346 346 117,600 33 14,779$ Dept of Defense KAPALAMA MILITARY RESERVATION0000-3507-002 1 200303 J 353 353 109,800 29 14,366$ Dept of Defense KAPALAMA MILITARY RESERVATION0000-3507-002 1 200304 J 353 353 108,000 29 14,299$ Dept of Defense KAPALAMA MILITARY RESERVATION0000-3507-002 1 200305 J 363 363 111,000 28 14,802$ Dept of Defense KAPALAMA MILITARY RESERVATION0000-3507-002 1 200306 J 379 379 124,800 30 16,158$ Dept of Defense KAPALAMA MILITARY RESERVATION0000-3507-002 1 200307 J 382 382 132,600 32 16,489$ Dept of Defense KAPALAMA MILITARY RESERVATION0000-3507-002 1 200308 J 371 371 127,200 30 15,631$ Dept of Defense KAPALAMA MILITARY RESERVATION0000-3507-002 1 200309 J 392 392 132,600 32 16,196$ Dept of Defense KAPALAMA MILITARY RESERVATION0000-3507-002 1 200310 J 391 391 135,600 31 16,350$ Dept of Defense KAPALAMA MILITARY RESERVATION0000-3507-002 1 200311 J 373 373 128,400 32 15,551$ Dept of Defense KAPALAMA MILITARY RESERVATION0000-3507-002 1 200312 J 349 349 103,800 29 13,057$ Dept of Defense KAPALAMA MILITARY RESERVATION
TOTAL 1,441,800 181,585$ 8811-6162-076 1 200301 J 246 246 91,200 31 11,138$ Dept of Defense SOH DEPT OF DEFENSE8811-6162-076 1 200302 J 252 252 83,040 28 10,471$ Dept of Defense SOH DEPT OF DEFENSE8811-6162-076 1 200303 J 259 259 95,600 32 12,035$ Dept of Defense SOH DEPT OF DEFENSE8811-6162-076 1 200304 J 266 266 94,000 29 12,118$ Dept of Defense SOH DEPT OF DEFENSE8811-6162-076 1 200305 J 262 262 97,120 30 12,506$ Dept of Defense SOH DEPT OF DEFENSE8811-6162-076 1 200306 J 279 279 107,200 32 13,652$ Dept of Defense SOH DEPT OF DEFENSE8811-6162-076 1 200307 J 282 282 109,280 30 13,530$ Dept of Defense SOH DEPT OF DEFENSE8811-6162-076 1 200308 J 280 280 120,080 32 14,245$ Dept of Defense SOH DEPT OF DEFENSE8811-6162-076 1 200309 J 278 278 111,520 30 13,295$ Dept of Defense SOH DEPT OF DEFENSE8811-6162-076 1 200310 J 283 283 110,400 30 13,136$ Dept of Defense SOH DEPT OF DEFENSE8811-6162-076 1 200311 J 276 276 103,360 31 12,354$ Dept of Defense SOH DEPT OF DEFENSE8811-6162-076 1 200312 J 270 270 96,560 30 11,714$ Dept of Defense SOH DEPT OF DEFENSE
TOTAL 1,219,360 150,195$ 8808-7404-076 1 200301 PP3 683 641 351,600 32 38,538$ Dept of Health SOH DEPT OF HEALTH8808-7404-076 1 200302 PP3 668 612 320,400 29 36,117$ Dept of Health SOH DEPT OF HEALTH8808-7404-076 1 200303 PP3 673 620 356,400 31 40,105$ Dept of Health SOH DEPT OF HEALTH8808-7404-076 1 200304 PP3 680 636 370,800 31 42,307$ Dept of Health SOH DEPT OF HEALTH8808-7404-076 1 200305 PP3 685 646 344,400 29 40,289$ Dept of Health SOH DEPT OF HEALTH8808-7404-076 1 200306 PP3 697 670 394,800 31 44,877$ Dept of Health SOH DEPT OF HEALTH8808-7404-076 1 200307 PP3 691 658 393,600 31 43,499$ Dept of Health SOH DEPT OF HEALTH8808-7404-076 1 200308 PP3 721 718 384,000 29 41,913$ Dept of Health SOH DEPT OF HEALTH8808-7404-076 1 200309 PP3 722 719 400,800 31 42,896$ Dept of Health SOH DEPT OF HEALTH8808-7404-076 1 200310 PP3 711 703 428,400 32 44,626$ Dept of Health SOH DEPT OF HEALTH8808-7404-076 1 200311 PP3 712 706 387,600 30 41,078$ Dept of Health SOH DEPT OF HEALTH8808-7404-076 1 200312 PP3 686 653 345,600 29 37,525$ Dept of Health SOH DEPT OF HEALTH
TOTAL 4,478,400 493,770$ 8808-7405-075 1 200301 J3 293 293 126,800 43 15,550$ Dept of Health SOH DEPT OF HEALTH8808-7405-076 1 200302 J3 309 309 84,600 18 9,797$ Dept of Health SOH DEPT OF HEALTH8808-7405-076 1 200303 J3 313 313 119,400 31 14,630$ Dept of Health SOH DEPT OF HEALTH8808-7405-076 1 200304 J3 338 338 124,600 31 15,648$ Dept of Health SOH DEPT OF HEALTH8808-7405-076 1 200305 J3 325 325 117,600 29 14,919$ Dept of Health SOH DEPT OF HEALTH8808-7405-076 1 200306 J3 331 331 128,200 31 16,039$ Dept of Health SOH DEPT OF HEALTH

TABLE: STATE LARGE FACILITIES IN OAHU ELECTRICITY BILL HISTORY FOR YEAR 2003 (PROVIDED BY HECO)
ACCTNUM TARCDE REVPER RATESCH BILLDMD KW KWH NBRDAYS TOTAMT DEPARTMENT NAME8808-7405-076 1 200307 J3 334 334 131,400 31 15,999$ Dept of Health SOH DEPT OF HEALTH8808-7405-076 1 200308 J3 330 330 132,000 29 15,652$ Dept of Health SOH DEPT OF HEALTH8808-7405-076 1 200309 J3 319 319 133,800 31 15,521$ Dept of Health SOH DEPT OF HEALTH8808-7405-076 1 200310 J3 314 314 138,800 32 15,749$ Dept of Health SOH DEPT OF HEALTH8808-7405-076 1 200311 J3 314 314 127,200 30 14,687$ Dept of Health SOH DEPT OF HEALTH8808-7405-076 1 200312 J3 272 272 109,200 29 12,713$ Dept of Health SOH DEPT OF HEALTH
TOTAL 1,473,600 176,904$ 8813-6833-076 1 200301 J 482 482 124,800 33 16,373$ Dept of Health SOH DEPT OF HEALTH8813-6833-076 1 200302 J 511 511 117,120 30 15,991$ Dept of Health SOH DEPT OF HEALTH8813-6833-076 1 200303 J 439 439 125,760 29 16,633$ Dept of Health SOH DEPT OF HEALTH8813-6833-076 1 200304 J 470 470 129,120 32 17,452$ Dept of Health SOH DEPT OF HEALTH8813-6833-076 1 200305 J 463 463 138,240 29 18,525$ Dept of Health SOH DEPT OF HEALTH8813-6833-076 1 200306 J 466 466 133,920 30 17,927$ Dept of Health SOH DEPT OF HEALTH8813-6833-076 1 200307 J 463 463 128,160 29 16,863$ Dept of Health SOH DEPT OF HEALTH8813-6833-076 1 200308 J 478 478 146,880 33 18,518$ Dept of Health SOH DEPT OF HEALTH8813-6833-076 1 200309 J 502 502 128,880 29 16,752$ Dept of Health SOH DEPT OF HEALTH8813-6833-076 1 200310 J 475 475 142,080 32 17,705$ Dept of Health SOH DEPT OF HEALTH8813-6833-076 1 200311 J 478 478 134,160 30 16,913$ Dept of Health SOH DEPT OF HEALTH8813-6833-076 1 200312 J 490 490 119,520 29 15,681$ Dept of Health SOH DEPT OF HEALTH
TOTAL 1,568,640 205,334$ 8813-6841-075 1 200301 PP3 665 613 254,400 33 29,929$ Dept of Health SOH DEPT OF HEALTH8813-6841-075 1 200302 PP3 665 614 229,200 30 28,037$ Dept of Health SOH DEPT OF HEALTH8813-6841-075 1 200303 PP3 676 635 232,400 29 29,072$ Dept of Health SOH DEPT OF HEALTH8813-6841-075 1 200304 PP3 678 638 252,800 32 31,384$ Dept of Health SOH DEPT OF HEALTH8813-6841-075 1 200305 PP3 673 630 243,200 29 30,686$ Dept of Health SOH DEPT OF HEALTH8813-6841-075 1 200306 PP3 700 684 261,200 30 32,391$ Dept of Health SOH DEPT OF HEALTH8813-6841-075 1 200307 PP3 699 681 260,400 29 31,446$ Dept of Health SOH DEPT OF HEALTH8813-6841-075 1 200308 PP3 716 715 303,200 33 34,661$ Dept of Health SOH DEPT OF HEALTH8813-6841-075 1 200309 PP3 714 712 270,800 29 31,528$ Dept of Health SOH DEPT OF HEALTH8813-6841-075 1 200310 PP3 717 717 297,600 32 33,544$ Dept of Health SOH DEPT OF HEALTH8813-6841-075 1 200311 PP3 704 691 270,400 30 31,047$ Dept of Health SOH DEPT OF HEALTH8813-6841-075 1 200312 PP3 672 627 242,800 29 28,584$ Dept of Health SOH DEPT OF HEALTH
TOTAL 3,118,400 372,309$ 8821-2602-075 1 200301 PP3 404 385 196,800 31 21,891$ Dept of Health SOH MALUHIA HOSP8821-2602-075 1 200302 PP3 407 391 211,200 33 23,438$ Dept of Health SOH MALUHIA HOSP8821-2602-075 1 200303 PP3 411 398 193,200 29 22,586$ Dept of Health SOH MALUHIA HOSP8821-2602-075 1 200304 PP3 424 424 210,000 32 24,476$ Dept of Health SOH MALUHIA HOSP8821-2602-075 1 200305 PP3 416 408 194,400 29 23,164$ Dept of Health SOH MALUHIA HOSP8821-2602-075 1 200306 PP3 425 425 201,600 29 23,577$ Dept of Health SOH MALUHIA HOSP8821-2602-075 1 200307 PP3 425 425 211,200 30 23,660$ Dept of Health SOH MALUHIA HOSP8821-2602-075 1 200308 PP3 439 439 236,400 33 25,566$ Dept of Health SOH MALUHIA HOSP8821-2602-075 1 200309 PP3 443 443 216,000 30 23,644$ Dept of Health SOH MALUHIA HOSP8821-2602-075 1 200310 PP3 443 443 223,200 31 24,033$ Dept of Health SOH MALUHIA HOSP8821-2602-075 1 200311 PP3 431 420 211,200 30 22,901$ Dept of Health SOH MALUHIA HOSP8821-2602-075 1 200312 PP3 431 419 200,400 30 22,217$ Dept of Health SOH MALUHIA HOSP
TOTAL 2,505,600 281,154$ 9300-8875-002 1 200301 PS 1,231 1,231 538,800 31 61,500$ Dept of Health SOH DEPT OF HEALTH9300-8875-002 1 200302 PS 1,104 977 469,200 28 54,588$ Dept of Health SOH DEPT OF HEALTH9300-8875-002 1 200303 PS 1,095 959 558,000 33 63,073$ Dept of Health SOH DEPT OF HEALTH9300-8875-002 1 200304 PS 1,117 1,003 531,000 29 62,506$ Dept of Health SOH DEPT OF HEALTH9300-8875-002 1 200305 PS 1,118 1,006 503,400 29 60,531$ Dept of Health SOH DEPT OF HEALTH9300-8875-002 1 200306 PS 1,100 970 565,200 32 66,392$ Dept of Health SOH DEPT OF HEALTH9300-8875-002 1 200307 PS 1,203 1,175 533,400 29 63,593$ Dept of Health SOH DEPT OF HEALTH9300-8875-002 1 200308 PS 1,274 1,274 573,000 30 65,799$ Dept of Health SOH DEPT OF HEALTH9300-8875-002 1 200309 PS 1,264 1,255 634,800 33 70,060$ Dept of Health SOH DEPT OF HEALTH9300-8875-002 1 200310 PS 1,153 1,033 565,200 29 62,226$ Dept of Health SOH DEPT OF HEALTH9300-8875-002 1 200311 PS 1,163 1,052 610,800 31 65,659$ Dept of Health SOH DEPT OF HEALTH9300-8875-002 1 200312 PS 1,151 1,028 567,600 31 62,048$ Dept of Health SOH DEPT OF HEALTH
TOTAL 6,650,400 757,975$ 8803-9993-076 1 200301 J3 300 300 121,000 32 14,209$ Dept of Public Safety SOH WAIAWA CORRECT FACILITY8803-9993-076 1 200302 J3 290 290 110,000 29 13,183$ Dept of Public Safety SOH WAIAWA CORRECT FACILITY8803-9993-076 1 200303 J3 280 280 111,000 31 13,414$ Dept of Public Safety SOH WAIAWA CORRECT FACILITY8803-9993-076 1 200304 J3 280 280 110,000 31 13,617$ Dept of Public Safety SOH WAIAWA CORRECT FACILITY8803-9993-076 1 200305 J3 270 270 104,000 29 13,024$ Dept of Public Safety SOH WAIAWA CORRECT FACILITY8803-9993-076 1 200306 J3 280 280 112,000 31 13,983$ Dept of Public Safety SOH WAIAWA CORRECT FACILITY8803-9993-076 1 200307 J3 280 280 109,000 31 13,393$ Dept of Public Safety SOH WAIAWA CORRECT FACILITY8803-9993-076 1 200308 J3 290 290 92,000 29 11,422$ Dept of Public Safety SOH WAIAWA CORRECT FACILITY8803-9993-076 1 200309 J3 290 290 119,000 31 13,901$ Dept of Public Safety SOH WAIAWA CORRECT FACILITY8803-9993-076 1 200310 J3 310 310 122,000 32 14,243$ Dept of Public Safety SOH WAIAWA CORRECT FACILITY8803-9993-076 1 200311 J3 320 320 117,000 31 13,748$ Dept of Public Safety SOH WAIAWA CORRECT FACILITY8803-9993-076 1 200312 J3 280 280 110,000 31 12,809$ Dept of Public Safety SOH WAIAWA CORRECT FACILITY
TOTAL 1,337,000 160,946$ 8823-3657-076 1 200301 J 206 199 97,680 29 11,387$ Dept of Public Safety SOH-DEPT OF PUBLIC SAFETY8823-3657-076 1 200302 J 206 192 102,240 30 11,918$ Dept of Public Safety SOH-DEPT OF PUBLIC SAFETY8823-3657-076 1 200303 J 206 201 105,120 29 12,517$ Dept of Public Safety SOH-DEPT OF PUBLIC SAFETY8823-3657-076 1 200304 J 220 220 125,760 32 14,770$ Dept of Public Safety SOH-DEPT OF PUBLIC SAFETY8823-3657-076 1 200305 J 266 266 113,520 30 14,273$ Dept of Public Safety SOH-DEPT OF PUBLIC SAFETY8823-3657-076 1 200306 J 206 201 108,960 29 12,892$ Dept of Public Safety SOH-DEPT OF PUBLIC SAFETY8823-3657-076 1 200307 J 209 209 122,400 32 13,730$ Dept of Public Safety SOH-DEPT OF PUBLIC SAFETY8823-3657-076 1 200308 J 207 207 116,160 30 12,946$ Dept of Public Safety SOH-DEPT OF PUBLIC SAFETY8823-3657-076 1 200309 J 206 206 121,680 32 13,294$ Dept of Public Safety SOH-DEPT OF PUBLIC SAFETY8823-3657-076 1 200310 J 201 201 111,840 30 12,259$ Dept of Public Safety SOH-DEPT OF PUBLIC SAFETY8823-3657-076 1 200311 J 200 198 107,280 30 11,866$ Dept of Public Safety SOH-DEPT OF PUBLIC SAFETY8823-3657-076 1 200312 J 200 185 109,200 32 12,164$ Dept of Public Safety SOH-DEPT OF PUBLIC SAFETY
TOTAL 1,341,840 154,016$ 8823-3672-076 1 200301 PS 874 857 400,800 30 45,593$ Dept of Public Safety SOH-DEPT OF PUBLIC SAFETY8823-3672-076 1 200302 PS 882 874 442,800 33 49,966$ Dept of Public Safety SOH-DEPT OF PUBLIC SAFETY8823-3672-076 1 200303 PS 887 883 396,600 29 47,218$ Dept of Public Safety SOH-DEPT OF PUBLIC SAFETY8823-3672-076 1 200304 PS 874 862 402,000 29 47,990$ Dept of Public Safety SOH-DEPT OF PUBLIC SAFETY8823-3672-076 1 200305 PS 902 902 396,600 28 48,206$ Dept of Public Safety SOH-DEPT OF PUBLIC SAFETY8823-3672-076 1 200306 PS 896 890 427,200 30 50,144$ Dept of Public Safety SOH-DEPT OF PUBLIC SAFETY8823-3672-076 1 200307 PS 892 881 448,800 32 50,300$ Dept of Public Safety SOH-DEPT OF PUBLIC SAFETY8823-3672-076 1 200308 PS 887 871 450,000 31 49,624$ Dept of Public Safety SOH-DEPT OF PUBLIC SAFETY8823-3672-076 1 200309 PS 883 864 459,600 32 49,889$ Dept of Public Safety SOH-DEPT OF PUBLIC SAFETY8823-3672-076 1 200310 PS 896 890 424,800 29 46,722$ Dept of Public Safety SOH-DEPT OF PUBLIC SAFETY8823-3672-076 1 200311 PS 875 847 411,000 30 45,343$ Dept of Public Safety SOH-DEPT OF PUBLIC SAFETY8823-3672-076 1 200312 PS 868 833 434,400 32 47,717$ Dept of Public Safety SOH-DEPT OF PUBLIC SAFETY
TOTAL 5,094,600 578,712$ 8823-8291-076 1 200301 PP3 972 917 517,200 31 56,185$ Dept of Public Safety SOH OCCC8823-8291-076 1 200302 PP3 994 960 526,800 31 57,960$ Dept of Public Safety SOH OCCC8823-8291-076 1 200303 PP3 972 917 504,000 29 57,409$ Dept of Public Safety SOH OCCC8823-8291-076 1 200304 PP3 974 922 536,400 31 60,953$ Dept of Public Safety SOH OCCC8823-8291-076 1 200305 PP3 994 960 532,800 30 61,353$ Dept of Public Safety SOH OCCC8823-8291-076 1 200306 PP3 994 960 536,400 30 60,704$ Dept of Public Safety SOH OCCC8823-8291-076 1 200307 PP3 994 960 565,200 31 61,106$ Dept of Public Safety SOH OCCC8823-8291-076 1 200308 PP3 991 970 600,000 31 63,040$ Dept of Public Safety SOH OCCC8823-8291-076 1 200309 PP3 989 965 538,800 28 57,262$ Dept of Public Safety SOH OCCC8823-8291-076 1 200310 PP3 1,018 1,018 651,600 33 66,421$ Dept of Public Safety SOH OCCC8823-8291-076 1 200311 PP3 1,018 1,018 546,000 29 57,737$ Dept of Public Safety SOH OCCC8823-8291-076 1 200312 PP3 994 970 586,800 33 61,465$ Dept of Public Safety SOH OCCC
TOTAL 6,642,000 721,594$ 9300-5247-002 1 200301 J 254 254 126,480 30 14,503$ Dept of Public Safety SOH DEPT OF PUBLIC SAFETY9300-5247-002 1 200302 J 248 248 120,000 29 13,998$ Dept of Public Safety SOH DEPT OF PUBLIC SAFETY

TABLE: STATE LARGE FACILITIES IN OAHU ELECTRICITY BILL HISTORY FOR YEAR 2003 (PROVIDED BY HECO)
ACCTNUM TARCDE REVPER RATESCH BILLDMD KW KWH NBRDAYS TOTAMT DEPARTMENT NAME9300-5247-002 1 200303 J 246 246 134,000 32 15,595$ Dept of Public Safety SOH DEPT OF PUBLIC SAFETY9300-5247-002 1 200304 J 252 252 128,720 29 15,425$ Dept of Public Safety SOH DEPT OF PUBLIC SAFETY9300-5247-002 1 200305 J 244 244 130,720 30 15,656$ Dept of Public Safety SOH DEPT OF PUBLIC SAFETY9300-5247-002 1 200306 J 259 259 150,560 33 17,661$ Dept of Public Safety SOH DEPT OF PUBLIC SAFETY9300-5247-002 1 200307 J 271 271 140,560 29 16,379$ Dept of Public Safety SOH DEPT OF PUBLIC SAFETY9300-5247-002 1 200308 J 289 289 148,400 29 16,947$ Dept of Public Safety SOH DEPT OF PUBLIC SAFETY9300-5247-002 1 200309 J 278 278 168,480 33 18,415$ Dept of Public Safety SOH DEPT OF PUBLIC SAFETY9300-5247-002 1 200310 J 299 299 156,320 30 17,431$ Dept of Public Safety SOH DEPT OF PUBLIC SAFETY9300-5247-002 1 200311 J 290 290 159,920 32 17,581$ Dept of Public Safety SOH DEPT OF PUBLIC SAFETY9300-5247-002 1 200312 J 265 265 139,120 30 15,567$ Dept of Public Safety SOH DEPT OF PUBLIC SAFETY
TOTAL 1,703,280 195,158$ 0000-3209-004 1 200301 J 1,088 1,088 314,800 31 40,554$ DOE SOH DEPARTMENT OF EDUCATION0000-3209-004 1 200302 J 847 609 198,400 30 23,957$ DOE SOH DEPARTMENT OF EDUCATION0000-3209-004 1 200303 J 847 598 216,400 30 29,172$ DOE SOH DEPARTMENT OF EDUCATION0000-3209-004 1 200304 J 847 789 246,800 29 33,048$ DOE SOH DEPARTMENT OF EDUCATION0000-3209-004 1 200305 J 1,198 1,198 364,000 32 48,809$ DOE SOH DEPARTMENT OF EDUCATION0000-3209-004 1 200306 J 1,119 1,119 362,800 30 48,220$ DOE SOH DEPARTMENT OF EDUCATION0000-3209-004 1 200307 J 953 953 260,800 29 35,180$ DOE SOH DEPARTMENT OF EDUCATION0000-3209-004 1 200308 J 1,011 1,011 316,800 32 40,298$ DOE SOH DEPARTMENT OF EDUCATION0000-3209-004 1 200309 J 1,043 1,043 358,000 31 44,153$ DOE SOH DEPARTMENT OF EDUCATION0000-3209-004 1 200310 J 981 981 318,000 29 39,392$ DOE SOH DEPARTMENT OF EDUCATION0000-3209-004 1 200311 J 1,008 1,008 332,800 32 40,809$ DOE SOH DEPARTMENT OF EDUCATION0000-3209-004 1 200312 J 1,100 1,100 311,600 30 39,608$ DOE SOH DEPARTMENT OF EDUCATION
TOTAL 3,601,200 463,200$ 0100-2579-004 1 200301 J 446 446 79,440 32 11,472$ DOE SOH DEPARTMENT OF EDUCATION0100-2579-004 1 200302 J 443 443 101,520 29 13,821$ DOE SOH DEPARTMENT OF EDUCATION0100-2579-004 1 200303 J 461 461 108,480 30 14,908$ DOE SOH DEPARTMENT OF EDUCATION0100-2579-004 1 200304 J 477 477 91,440 29 13,477$ DOE SOH DEPARTMENT OF EDUCATION0100-2579-004 1 200305 J 470 470 120,000 32 16,580$ DOE SOH DEPARTMENT OF EDUCATION0100-2579-004 1 200306 J 474 474 114,000 31 15,941$ DOE SOH DEPARTMENT OF EDUCATION0100-2579-004 1 200307 J 378 335 81,840 31 11,570$ DOE SOH DEPARTMENT OF EDUCATION0100-2579-004 1 200308 J 456 456 92,160 29 12,969$ DOE SOH DEPARTMENT OF EDUCATION0100-2579-004 1 200309 J 472 472 119,280 31 15,638$ DOE SOH DEPARTMENT OF EDUCATION0100-2579-004 1 200310 J 473 473 118,320 32 15,439$ DOE SOH DEPARTMENT OF EDUCATION0100-2579-004 1 200311 J 464 464 112,320 29 14,717$ DOE SOH DEPARTMENT OF EDUCATION0100-2579-004 1 200312 J 435 435 105,840 30 13,906$ DOE SOH DEPARTMENT OF EDUCATION
TOTAL 1,244,640 170,439$ 0100-2966-002 1 200301 J 584 584 170,400 32 21,702$ DOE SOH DEPARTMENT OF EDUCATION0100-2966-002 1 200302 J 572 572 145,200 28 19,256$ DOE SOH DEPARTMENT OF EDUCATION0100-2966-002 1 200303 J 582 582 188,400 33 24,002$ DOE SOH DEPARTMENT OF EDUCATION0100-2966-002 1 200304 J 582 582 152,880 29 20,846$ DOE SOH DEPARTMENT OF EDUCATION0100-2966-002 1 200305 J 592 592 175,920 29 23,495$ DOE SOH DEPARTMENT OF EDUCATION0100-2966-002 1 200306 J 590 590 191,760 32 25,286$ DOE SOH DEPARTMENT OF EDUCATION0100-2966-002 1 200307 J 566 566 144,960 29 19,836$ DOE SOH DEPARTMENT OF EDUCATION0100-2966-002 1 200308 J 491 491 147,360 30 18,917$ DOE SOH DEPARTMENT OF EDUCATION0100-2966-002 1 200309 J 636 636 210,240 33 26,045$ DOE SOH DEPARTMENT OF EDUCATION0100-2966-002 1 200310 J 647 647 195,840 29 24,477$ DOE SOH DEPARTMENT OF EDUCATION0100-2966-002 1 200311 J 618 618 200,400 33 24,543$ DOE SOH DEPARTMENT OF EDUCATION0100-2966-002 1 200312 J 610 610 177,600 30 22,283$ DOE SOH DEPARTMENT OF EDUCATION
TOTAL 2,100,960 270,688$ 8801-3223-078 1 200301 J3 566 508 133,200 31 17,401$ DOE SOH DEPARTMENT OF EDUCATION8801-3223-078 1 200302 J3 619 619 123,000 28 16,948$ DOE SOH DEPARTMENT OF EDUCATION8801-3223-078 1 200303 J3 513 513 155,400 33 19,579$ DOE SOH DEPARTMENT OF EDUCATION8801-3223-078 1 200304 J3 501 501 114,000 29 15,702$ DOE SOH DEPARTMENT OF EDUCATION8801-3223-078 1 200305 J3 520 520 133,800 29 18,012$ DOE SOH DEPARTMENT OF EDUCATION8801-3223-078 1 200306 J3 525 525 148,200 32 19,660$ DOE SOH DEPARTMENT OF EDUCATION8801-3223-078 1 200307 J3 479 479 99,600 29 14,015$ DOE SOH DEPARTMENT OF EDUCATION8801-3223-078 1 200308 J3 481 481 108,600 30 14,527$ DOE SOH DEPARTMENT OF EDUCATION8801-3223-078 1 200309 J3 685 685 170,400 33 21,935$ DOE SOH DEPARTMENT OF EDUCATION8801-3223-078 1 200310 J3 541 541 171,600 29 20,749$ DOE SOH DEPARTMENT OF EDUCATION8801-3223-078 1 200311 J3 556 556 162,600 31 19,865$ DOE SOH DEPARTMENT OF EDUCATION8801-3223-078 1 200312 J3 556 556 148,800 31 18,573$ DOE SOH DEPARTMENT OF EDUCATION
TOTAL 1,669,200 216,967$ 8801-5001-077 1 200301 J 464 248 54,000 32 8,713$ DOE SOH DEPARTMENT OF EDUCATCLOSED
8803-0106-077 1 200301 J3 518 518 114,600 33 15,381$ DOE SOH DEPARTMENT OF EDUCATION8803-0106-077 1 200302 J3 508 508 112,800 29 15,216$ DOE SOH DEPARTMENT OF EDUCATION8803-0106-077 1 200303 J3 518 518 140,400 31 18,295$ DOE SOH DEPARTMENT OF EDUCATION8803-0106-077 1 200304 J3 516 516 106,200 28 15,122$ DOE SOH DEPARTMENT OF EDUCATION8803-0106-077 1 200305 J3 517 517 139,200 31 18,728$ DOE SOH DEPARTMENT OF EDUCATION8803-0106-077 1 200306 J3 538 538 149,400 31 20,029$ DOE SOH DEPARTMENT OF EDUCATION8803-0106-077 1 200307 J3 488 488 94,800 32 13,708$ DOE SOH DEPARTMENT OF EDUCATION8803-0106-077 1 200308 J3 497 497 84,600 28 12,270$ DOE SOH DEPARTMENT OF EDUCATION8803-0106-077 1 200309 J3 541 541 144,600 31 18,467$ DOE SOH DEPARTMENT OF EDUCATION8803-0106-077 1 200310 J3 550 550 147,600 32 18,614$ DOE SOH DEPARTMENT OF EDUCATION8803-0106-077 1 200311 J3 536 536 129,600 30 16,694$ DOE SOH DEPARTMENT OF EDUCATION8803-0106-077 1 200312 J3 520 520 126,600 30 16,296$ DOE SOH DEPARTMENT OF EDUCATION
TOTAL 1,490,400 198,819$ 8803-9117-078 1 200301 J 358 358 84,000 33 11,361$ DOE SOH DEPARTMENT OF EDUCATION8803-9117-078 1 200302 J 351 351 80,640 28 11,022$ DOE SOH DEPARTMENT OF EDUCATION8803-9117-078 1 200303 J 350 350 99,120 33 13,081$ DOE SOH DEPARTMENT OF EDUCATION8803-9117-078 1 200304 J 361 361 80,160 29 11,451$ DOE SOH DEPARTMENT OF EDUCATION8803-9117-078 1 200305 J 359 359 95,760 29 13,160$ DOE SOH DEPARTMENT OF EDUCATION8803-9117-078 1 200306 J 355 355 105,840 33 14,213$ DOE SOH DEPARTMENT OF EDUCATION8803-9117-078 1 200307 J 289 252 73,440 29 10,064$ DOE SOH DEPARTMENT OF EDUCATION8803-9117-078 1 200308 J 346 346 91,200 29 12,058$ DOE SOH DEPARTMENT OF EDUCATION8803-9117-078 1 200309 J 373 373 119,040 33 14,896$ DOE SOH DEPARTMENT OF EDUCATION8803-9117-078 1 200310 J 377 377 108,480 29 13,768$ DOE SOH DEPARTMENT OF EDUCATION8803-9117-078 1 200311 J 376 376 117,840 30 14,598$ DOE SOH DEPARTMENT OF EDUCATION8803-9117-078 1 200312 J 351 351 116,400 33 14,314$ DOE SOH DEPARTMENT OF EDUCATION
TOTAL 1,171,920 153,985$ 8806-1340-077 1 200301 J3 563 563 110,400 30 15,228$ DOE SOH DEPARTMENT OF EDUCATION8806-1340-077 1 200302 J3 534 534 138,000 29 17,852$ DOE SOH DEPARTMENT OF EDUCATION8806-1340-077 1 200303 J3 547 547 154,800 32 19,937$ DOE SOH DEPARTMENT OF EDUCATION8806-1340-077 1 200304 J3 557 557 127,200 29 17,567$ DOE SOH DEPARTMENT OF EDUCATION8806-1340-077 1 200305 J3 568 568 156,000 30 20,787$ DOE SOH DEPARTMENT OF EDUCATION8806-1340-077 1 200306 J3 607 607 160,800 32 21,595$ DOE SOH DEPARTMENT OF EDUCATION8806-1340-077 1 200307 J3 455 408 81,600 30 11,866$ DOE SOH DEPARTMENT OF EDUCATION8806-1340-077 1 200308 J3 539 539 105,600 29 14,690$ DOE SOH DEPARTMENT OF EDUCATION8806-1340-077 1 200309 J3 605 605 175,200 33 21,810$ DOE SOH DEPARTMENT OF EDUCATION8806-1340-077 1 200310 J3 600 600 156,000 29 19,741$ DOE SOH DEPARTMENT OF EDUCATION8806-1340-077 1 200311 J3 710 710 152,400 30 20,141$ DOE SOH DEPARTMENT OF EDUCATION8806-1340-077 1 200312 J3 586 586 147,600 32 18,789$ DOE SOH DEPARTMENT OF EDUCATION
TOTAL 1,665,600 220,004$ 8806-3539-079 1 200301 J 85 85 3,920 30 987$ DOE SOH DEPARTMENT OF EDUCATION8806-3539-079 1 200302 J 92 92 5,680 29 1,226$ DOE SOH DEPARTMENT OF EDUCATION8806-3539-079 1 200303 J 93 93 6,000 32 1,284$ DOE SOH DEPARTMENT OF EDUCATION8806-3539-079 1 200304 J 96 96 4,480 29 1,138$ DOE SOH DEPARTMENT OF EDUCATION8806-3539-079 1 200305 J 90 90 5,680 30 1,250$ DOE SOH DEPARTMENT OF EDUCATION8806-3539-079 1 200306 J 88 88 5,680 32 1,237$ DOE SOH DEPARTMENT OF EDUCATION8806-3539-079 1 200307 J 81 34 3,040 29 875$ DOE SOH DEPARTMENT OF EDUCATION8806-3539-079 1 200308 J 90 90 3,760 30 996$ DOE SOH DEPARTMENT OF EDUCATION8806-3539-079 1 200309 J 90 90 6,080 32 1,250$ DOE SOH DEPARTMENT OF EDUCATION

TABLE: STATE LARGE FACILITIES IN OAHU ELECTRICITY BILL HISTORY FOR YEAR 2003 (PROVIDED BY HECO)
ACCTNUM TARCDE REVPER RATESCH BILLDMD KW KWH NBRDAYS TOTAMT DEPARTMENT NAME8806-3539-079 1 200310 J 102 102 5,760 30 1,276$ DOE SOH DEPARTMENT OF EDUCATION8806-3539-079 1 200311 J 89 88 5,760 30 1,194$ DOE SOH DEPARTMENT OF EDUCATION8806-3539-079 1 200312 J 77 74 5,360 32 1,086$ DOE SOH DEPARTMENT OF EDUCATION
TOTAL 61,200 13,798$ 8809-2020-077 1 200301 J3 370 370 94,400 32 12,223$ DOE SOH DEPARTMENT OF EDUCATION8809-2020-077 1 200302 J3 375 375 101,600 29 13,064$ DOE SOH DEPARTMENT OF EDUCATION8809-2020-077 1 200303 J3 386 386 110,400 31 14,279$ DOE SOH DEPARTMENT OF EDUCATION8809-2020-077 1 200304 J3 397 397 98,800 31 13,417$ DOE SOH DEPARTMENT OF EDUCATION8809-2020-077 1 200305 J3 407 407 113,400 30 15,120$ DOE SOH DEPARTMENT OF EDUCATION8809-2020-077 1 200306 J3 409 409 116,400 31 15,405$ DOE SOH DEPARTMENT OF EDUCATION8809-2020-077 1 200307 J3 307 240 84,600 30 11,063$ DOE SOH DEPARTMENT OF EDUCATION8809-2020-077 1 200308 J3 307 250 81,000 30 10,478$ DOE SOH DEPARTMENT OF EDUCATION8809-2020-077 1 200309 J3 409 409 121,800 30 15,109$ DOE SOH DEPARTMENT OF EDUCATION8809-2020-077 1 200310 J3 422 422 142,200 32 17,035$ DOE SOH DEPARTMENT OF EDUCATION8809-2020-077 1 200311 J3 415 415 136,800 31 16,400$ DOE SOH DEPARTMENT OF EDUCATION8809-2020-077 1 200312 J3 415 415 114,000 29 14,285$ DOE SOH DEPARTMENT OF EDUCATION
TOTAL 1,315,400 167,877$ 8809-6595-077 1 200301 J 370 370 83,840 33 11,434$ DOE SOH DEPARTMENT OF EDUCATION8809-6595-077 1 200302 J 370 370 94,960 30 12,606$ DOE SOH DEPARTMENT OF EDUCATION8809-6595-077 1 200303 J 366 366 104,560 32 13,799$ DOE SOH DEPARTMENT OF EDUCATION8809-6595-077 1 200304 J 378 378 89,280 29 12,514$ DOE SOH DEPARTMENT OF EDUCATION8809-6595-077 1 200305 J 385 385 93,520 29 13,096$ DOE SOH DEPARTMENT OF EDUCATION8809-6595-077 1 200306 J 390 390 100,240 33 13,829$ DOE SOH DEPARTMENT OF EDUCATION8809-6595-077 1 200307 J 292 201 64,560 29 9,111$ DOE SOH DEPARTMENT OF EDUCATION8809-6595-077 1 200308 J 292 212 58,400 29 8,317$ DOE SOH DEPARTMENT OF EDUCATION8809-6595-077 1 200309 J 384 384 102,240 33 13,244$ DOE SOH DEPARTMENT OF EDUCATION8809-6595-077 1 200310 J 393 393 105,440 29 13,512$ DOE SOH DEPARTMENT OF EDUCATION8809-6595-077 1 200311 J 387 387 112,480 31 14,092$ DOE SOH DEPARTMENT OF EDUCATION8809-6595-077 1 200312 J 379 379 96,320 31 12,552$ DOE SOH DEPARTMENT OF EDUCATION
TOTAL 1,105,840 148,107$ 8811-3369-078 1 200301 J3 484 484 112,800 31 15,148$ DOE SOH DEPARTMENT OF EDUCATION8811-3369-078 1 200302 J3 457 457 122,400 29 15,991$ DOE SOH DEPARTMENT OF EDUCATION8811-3369-078 1 200303 J3 457 457 135,600 32 17,660$ DOE SOH DEPARTMENT OF EDUCATION8811-3369-078 1 200304 J3 467 467 115,200 29 15,892$ DOE SOH DEPARTMENT OF EDUCATION8811-3369-078 1 200305 J3 464 464 123,600 30 16,864$ DOE SOH DEPARTMENT OF EDUCATION8811-3369-078 1 200306 J3 464 464 129,600 32 17,422$ DOE SOH DEPARTMENT OF EDUCATION8811-3369-078 1 200307 J3 420 420 105,600 29 14,219$ DOE SOH DEPARTMENT OF EDUCATION8811-3369-078 1 200308 J3 439 439 100,800 33 13,658$ DOE SOH DEPARTMENT OF EDUCATION8811-3369-078 1 200309 J3 473 473 127,200 29 16,274$ DOE SOH DEPARTMENT OF EDUCATION8811-3369-078 1 200310 J3 487 487 148,800 30 18,333$ DOE SOH DEPARTMENT OF EDUCATION8811-3369-078 1 200312 J3 479 479 265,200 61 33,466$ DOE SOH DEPARTMENT OF EDUCATION
TOTAL 1,486,800 194,926$ 8812-7930-077 1 200301 J 138 138 37,680 30 4,941$ DOE SOH DEPARTMENT OF EDUCATION8812-7930-077 1 200302 J 149 149 51,200 32 6,446$ DOE SOH DEPARTMENT OF EDUCATION8812-7930-077 1 200303 J 141 141 47,760 29 6,169$ DOE SOH DEPARTMENT OF EDUCATION8812-7930-077 1 200304 J 139 138 41,120 29 5,526$ DOE SOH DEPARTMENT OF EDUCATION8812-7930-077 1 200305 J 140 140 49,440 32 6,465$ DOE SOH DEPARTMENT OF EDUCATION8812-7930-077 1 200306 J 143 143 46,400 31 6,121$ DOE SOH DEPARTMENT OF EDUCATION8812-7930-077 1 200307 J 125 113 41,200 29 5,289$ DOE SOH DEPARTMENT OF EDUCATION8812-7930-077 1 200308 J 147 147 47,280 33 5,973$ DOE SOH DEPARTMENT OF EDUCATION8812-7930-077 1 200309 J 149 149 49,600 29 6,166$ DOE SOH DEPARTMENT OF EDUCATION8812-7930-077 1 200310 J 142 142 50,560 32 6,150$ DOE SOH DEPARTMENT OF EDUCATION8812-7930-077 1 200311 J 143 143 49,920 30 6,084$ DOE SOH DEPARTMENT OF EDUCATION8812-7930-077 1 200312 J 146 146 45,600 29 5,723$ DOE SOH DEPARTMENT OF EDUCATION
TOTAL 557,760 71,053$ 8814-6868-077 1 200301 J3 546 546 158,000 32 19,969$ DOE SOH DEPARTMENT OF EDUCATION8814-6868-077 1 200302 J3 578 578 185,200 31 23,076$ DOE SOH DEPARTMENT OF EDUCATION8814-6868-077 1 200303 J3 566 566 184,400 29 23,425$ DOE SOH DEPARTMENT OF EDUCATION8814-6868-077 1 200304 J3 562 562 177,200 32 22,958$ DOE SOH DEPARTMENT OF EDUCATION8814-6868-077 1 200305 J3 565 565 179,200 29 23,372$ DOE SOH DEPARTMENT OF EDUCATION8814-6868-077 1 200306 J3 562 562 170,000 30 22,203$ DOE SOH DEPARTMENT OF EDUCATION8814-6868-077 1 200307 J3 445 408 141,200 31 17,815$ DOE SOH DEPARTMENT OF EDUCATION8814-6868-077 1 200308 J3 454 454 136,400 31 17,107$ DOE SOH DEPARTMENT OF EDUCATION8814-6868-077 1 200309 J3 592 592 169,200 29 21,163$ DOE SOH DEPARTMENT OF EDUCATION8814-6868-077 1 200310 J3 588 588 191,600 32 23,124$ DOE SOH DEPARTMENT OF EDUCATION8814-6868-077 1 200311 J3 591 591 180,000 30 21,982$ DOE SOH DEPARTMENT OF EDUCATION8814-6868-077 1 200312 J3 577 577 162,400 29 20,337$ DOE SOH DEPARTMENT OF EDUCATION
TOTAL 2,034,800 256,532$ 8818-8260-078 1 200301 J 352 352 76,800 30 10,540$ DOE SOH DEPARTMENT OF EDUCATION8818-8260-078 1 200302 J 377 377 100,800 30 13,237$ DOE SOH DEPARTMENT OF EDUCATION8818-8260-078 1 200303 J 382 382 105,600 31 14,069$ DOE SOH DEPARTMENT OF EDUCATION8818-8260-078 1 200304 J 389 389 96,600 30 13,347$ DOE SOH DEPARTMENT OF EDUCATION8818-8260-078 1 200305 J 394 394 102,600 29 14,106$ DOE SOH DEPARTMENT OF EDUCATION8818-8260-078 1 200306 J 397 397 98,400 32 13,580$ DOE SOH DEPARTMENT OF EDUCATION8818-8260-078 1 200307 J 300 244 70,200 30 9,595$ DOE SOH DEPARTMENT OF EDUCATION8818-8260-078 1 200308 J 319 319 66,600 30 9,252$ DOE SOH DEPARTMENT OF EDUCATION8818-8260-078 1 200309 J 408 408 117,600 32 14,847$ DOE SOH DEPARTMENT OF EDUCATION8818-8260-078 1 200310 J 414 414 122,400 30 15,232$ DOE SOH DEPARTMENT OF EDUCATION8818-8260-078 1 200311 J 410 410 109,200 29 13,900$ DOE SOH DEPARTMENT OF EDUCATION8818-8260-078 1 200312 J 379 379 103,200 32 13,182$ DOE SOH DEPARTMENT OF EDUCATION
TOTAL 1,170,000 154,886$ 8819-7510-077 1 200301 J 650 650 149,600 30 20,316$ DOE SOH DEPARTMENT OF EDUCATION8819-7510-077 1 200302 J 679 679 196,000 33 25,404$ DOE SOH DEPARTMENT OF EDUCATION8819-7510-077 1 200303 J 688 688 174,800 29 23,875$ DOE SOH DEPARTMENT OF EDUCATION8819-7510-077 1 200304 J 752 752 199,200 30 27,224$ DOE SOH DEPARTMENT OF EDUCATION8819-7510-077 1 200305 J 728 728 207,600 28 28,098$ DOE SOH DEPARTMENT OF EDUCATION8819-7510-077 1 200306 J 753 753 194,000 32 26,625$ DOE SOH DEPARTMENT OF EDUCATION8819-7510-077 1 200307 J 628 453 157,200 30 21,168$ DOE SOH DEPARTMENT OF EDUCATION8819-7510-077 1 200308 J 732 732 237,200 33 29,608$ DOE SOH DEPARTMENT OF EDUCATION8819-7510-077 1 200309 J 772 772 218,000 29 27,747$ DOE SOH DEPARTMENT OF EDUCATION8819-7510-077 1 200310 J 798 798 225,600 31 28,500$ DOE SOH DEPARTMENT OF EDUCATION8819-7510-077 1 200311 J 732 732 208,000 30 26,206$ DOE SOH DEPARTMENT OF EDUCATION8819-7510-077 1 200312 J 732 732 177,200 28 23,379$ DOE SOH DEPARTMENT OF EDUCATION
TOTAL 2,344,400 308,149$ 8821-9443-077 1 200301 J 397 - - 15 1,171$ DOE SOH DEPARTMENT OF EDUCATCLOSED
8822-5334-078 1 200301 J 515 515 128,400 29 17,059$ DOE SOH DEPARTMENT OF EDUCATION8822-5334-078 1 200302 J 511 511 157,840 31 20,151$ DOE SOH DEPARTMENT OF EDUCATION8822-5334-078 1 200303 J 542 542 142,560 31 19,374$ DOE SOH DEPARTMENT OF EDUCATION8822-5334-078 1 200304 J 543 543 150,880 29 20,384$ DOE SOH DEPARTMENT OF EDUCATION8822-5334-078 1 200305 J 550 550 161,520 30 21,716$ DOE SOH DEPARTMENT OF EDUCATION8822-5334-078 1 200306 J 455 455 120,560 32 16,418$ DOE SOH DEPARTMENT OF EDUCATION8822-5334-078 1 200307 J 421 323 107,680 29 14,322$ DOE SOH DEPARTMENT OF EDUCATION8822-5334-078 1 200308 J 546 546 167,920 31 21,077$ DOE SOH DEPARTMENT OF EDUCATION8822-5334-078 1 200309 J 569 569 174,160 31 21,691$ DOE SOH DEPARTMENT OF EDUCATION8822-5334-078 1 200310 J 566 566 168,480 30 20,948$ DOE SOH DEPARTMENT OF EDUCATION8822-5334-078 1 200312 J 544 544 282,080 62 36,468$ DOE SOH DEPARTMENT OF EDUCATION
TOTAL 1,762,080 229,608$ 9600-2562-003 1 200301 J 423 413 118,320 32 15,265$ DOE SOH DEPARTMENT OF EDUCATION9600-2562-003 1 200302 J 425 425 111,360 28 14,693$ DOE SOH DEPARTMENT OF EDUCATION9600-2562-003 1 200303 J 487 487 130,080 33 17,320$ DOE SOH DEPARTMENT OF EDUCATION9600-2562-003 1 200304 J 559 559 125,280 29 17,768$ DOE SOH DEPARTMENT OF EDUCATION9600-2562-003 1 200305 J 557 557 128,880 29 18,259$ DOE SOH DEPARTMENT OF EDUCATION

TABLE: STATE LARGE FACILITIES IN OAHU ELECTRICITY BILL HISTORY FOR YEAR 2003 (PROVIDED BY HECO)
ACCTNUM TARCDE REVPER RATESCH BILLDMD KW KWH NBRDAYS TOTAMT DEPARTMENT NAME9600-2562-003 1 200306 J 569 569 145,920 32 20,269$ DOE SOH DEPARTMENT OF EDUCATION9600-2562-003 1 200307 J 552 552 145,440 29 19,741$ DOE SOH DEPARTMENT OF EDUCATION9600-2562-003 1 200308 J 636 636 150,960 30 20,400$ DOE SOH DEPARTMENT OF EDUCATION9600-2562-003 1 200309 J 583 583 161,760 33 20,837$ DOE SOH DEPARTMENT OF EDUCATION9600-2562-003 1 200310 J 478 478 149,280 30 18,602$ DOE SOH DEPARTMENT OF EDUCATION9600-2562-003 1 200311 J 477 473 152,160 31 18,775$ DOE SOH DEPARTMENT OF EDUCATION9600-2562-003 1 200312 J 477 458 132,720 31 16,903$ DOE SOH DEPARTMENT OF EDUCATION
TOTAL 1,652,160 218,834$ 9800-2018-003 1 200301 J 627 627 124,800 32 17,699$ DOE SOH DEPARTMENT OF EDUCATION9800-2018-003 1 200302 J 680 680 141,200 29 19,886$ DOE SOH DEPARTMENT OF EDUCATION9800-2018-003 1 200303 J 598 598 170,800 30 22,536$ DOE SOH DEPARTMENT OF EDUCATION9800-2018-003 1 200304 J 672 672 174,000 31 23,942$ DOE SOH DEPARTMENT OF EDUCATION9800-2018-003 1 200305 J 678 678 180,400 30 24,845$ DOE SOH DEPARTMENT OF EDUCATION9800-2018-003 1 200306 J 668 668 184,000 30 25,200$ DOE SOH DEPARTMENT OF EDUCATION9800-2018-003 1 200307 J 699 699 194,800 32 26,077$ DOE SOH DEPARTMENT OF EDUCATION9800-2018-003 1 200308 J 754 754 209,600 29 27,323$ DOE SOH DEPARTMENT OF EDUCATION9800-2018-003 1 200309 J 766 766 224,000 33 28,576$ DOE SOH DEPARTMENT OF EDUCATION9800-2018-003 1 200310 J 719 719 206,800 29 26,245$ DOE SOH DEPARTMENT OF EDUCATION9800-2018-003 1 200311 J 724 724 209,600 30 26,440$ DOE SOH DEPARTMENT OF EDUCATION9800-2018-003 1 200312 J 736 736 194,400 32 25,142$ DOE SOH DEPARTMENT OF EDUCATION
TOTAL 2,214,400 293,910$ 9900-0148-003 1 200301 J 535 535 123,360 31 16,837$ DOE SOH DEPARTMENT OF EDUCATION9900-0148-003 1 200302 J 514 514 124,080 30 16,872$ DOE SOH DEPARTMENT OF EDUCATION9900-0148-003 1 200303 J 504 504 131,280 30 17,737$ DOE SOH DEPARTMENT OF EDUCATION9900-0148-003 1 200304 J 547 547 140,400 29 19,399$ DOE SOH DEPARTMENT OF EDUCATION9900-0148-003 1 200305 J 535 535 151,680 32 20,677$ DOE SOH DEPARTMENT OF EDUCATION9900-0148-003 1 200306 J 547 546 147,360 30 20,371$ DOE SOH DEPARTMENT OF EDUCATION9900-0148-003 1 200307 J 563 563 137,520 29 19,132$ DOE SOH DEPARTMENT OF EDUCATION9900-0148-003 1 200308 J 559 558 162,000 32 21,053$ DOE SOH DEPARTMENT OF EDUCATION9900-0148-003 1 200309 J 590 590 168,000 31 21,642$ DOE SOH DEPARTMENT OF EDUCATION9900-0148-003 1 200310 J 541 540 163,680 29 20,641$ DOE SOH DEPARTMENT OF EDUCATION9900-0148-003 1 200311 J 589 589 169,200 32 21,443$ DOE SOH DEPARTMENT OF EDUCATION9900-0148-003 1 200312 J 636 636 169,920 30 21,949$ DOE SOH DEPARTMENT OF EDUCATION
TOTAL 1,788,480 237,752$ 8800-6352-076 1 200301 PP3 1,900 1,640 1,080,000 31 113,634$ DOT-Airport Division SOH DOT AIRPORT8800-6352-076 1 200302 PP3 1,920 1,680 1,000,000 28 108,255$ DOT-Airport Division SOH DOT AIRPORT8800-6352-076 1 200303 PP3 1,920 1,680 1,164,000 33 124,165$ DOT-Airport Division SOH DOT AIRPORT8800-6352-076 1 200304 PP3 1,880 1,600 960,000 29 108,830$ DOT-Airport Division SOH DOT AIRPORT8800-6352-076 1 200305 PP3 2,060 1,960 960,000 29 112,046$ DOT-Airport Division SOH DOT AIRPORT8800-6352-076 1 200306 PP3 1,880 1,600 1,060,000 32 119,531$ DOT-Airport Division SOH DOT AIRPORT8800-6352-076 1 200307 PP3 1,900 1,640 1,068,000 31 118,150$ DOT-Airport Division SOH DOT AIRPORT8800-6352-076 1 200308 PP3 1,900 1,640 976,000 28 106,386$ DOT-Airport Division SOH DOT AIRPORT8800-6352-076 1 200309 PP3 1,920 1,680 1,188,000 33 123,131$ DOT-Airport Division SOH DOT AIRPORT8800-6352-076 1 200310 PP3 1,840 1,720 1,040,000 29 108,695$ DOT-Airport Division SOH DOT AIRPORT8800-6352-076 1 200311 PP3 1,820 1,680 1,068,000 29 109,881$ DOT-Airport Division SOH DOT AIRPORT8800-6352-076 1 200312 PP3 1,780 1,600 1,176,000 33 118,487$ DOT-Airport Division SOH DOT AIRPORT
TOTAL 12,740,000 1,371,190$ 8800-6353-076 1 200303 PP3 650 624 1,025,000 92 111,454$ DOT-Airport Division SOH DOT AIRPORT8800-6353-076 1 200304 PP3 616 580 341,000 29 38,275$ DOT-Airport Division SOH DOT AIRPORT8800-6353-076 1 200305 PP3 612 572 331,000 29 37,673$ DOT-Airport Division SOH DOT AIRPORT8800-6353-076 1 200306 PP3 600 548 362,000 32 40,578$ DOT-Airport Division SOH DOT AIRPORT8800-6353-076 1 200307 PP3 600 548 355,000 31 39,111$ DOT-Airport Division SOH DOT AIRPORT8800-6353-076 1 200308 PP3 610 568 325,000 28 35,388$ DOT-Airport Division SOH DOT AIRPORT8800-6353-076 1 200309 PP3 612 572 387,000 33 40,124$ DOT-Airport Division SOH DOT AIRPORT8800-6353-076 1 200310 PP3 610 588 341,000 29 35,899$ DOT-Airport Division SOH DOT AIRPORT8800-6353-076 1 200311 PP3 602 580 345,000 29 35,837$ DOT-Airport Division SOH DOT AIRPORT8800-6353-076 1 200312 PP3 600 576 378,000 33 38,559$ DOT-Airport Division SOH DOT AIRPORT
TOTAL 4,190,000 452,899$ 8800-6356-075 1 200301 J3 164 164 91,200 31 10,045$ DOT-Airport Division SOH DOT AIRPORT8800-6356-075 1 200302 J3 192 192 105,600 28 11,757$ DOT-Airport Division SOH DOT AIRPORT8800-6356-075 1 200303 J3 191 191 104,400 33 11,814$ DOT-Airport Division SOH DOT AIRPORT8800-6356-075 1 200304 J3 199 199 115,200 29 13,238$ DOT-Airport Division SOH DOT AIRPORT8800-6356-075 1 200305 J3 194 194 98,400 29 11,705$ DOT-Airport Division SOH DOT AIRPORT8800-6356-075 1 200306 J3 192 192 121,200 32 13,925$ DOT-Airport Division SOH DOT AIRPORT8800-6356-075 1 200307 J3 190 190 100,800 31 11,711$ DOT-Airport Division SOH DOT AIRPORT8800-6356-075 1 200308 J3 192 192 91,200 28 10,511$ DOT-Airport Division SOH DOT AIRPORT8800-6356-075 1 200309 J3 188 188 100,800 33 11,182$ DOT-Airport Division SOH DOT AIRPORT8800-6356-075 1 200310 J3 191 191 106,800 29 11,626$ DOT-Airport Division SOH DOT AIRPORT8800-6356-075 1 200311 J3 154 154 86,400 29 9,334$ DOT-Airport Division SOH DOT AIRPORT8800-6356-075 1 200312 J3 188 188 118,800 33 12,559$ DOT-Airport Division SOH DOT AIRPORT
TOTAL 1,240,800 139,407$ 8800-6357-075 1 200301 J4 238 238 138,960 31 15,105$ DOT-Airport Division SOH DOT AIRPORT8800-6357-075 1 200302 J4 234 234 131,280 28 14,518$ DOT-Airport Division SOH DOT AIRPORT8800-6357-075 1 200303 J4 230 230 166,000 33 17,842$ DOT-Airport Division SOH DOT AIRPORT8800-6357-075 1 200304 J4 227 227 147,280 29 16,555$ DOT-Airport Division SOH DOT AIRPORT8800-6357-075 1 200305 J4 222 222 143,280 29 16,269$ DOT-Airport Division SOH DOT AIRPORT8800-6357-075 1 200306 J4 216 216 128,320 32 14,881$ DOT-Airport Division SOH DOT AIRPORT8800-6357-075 1 200307 J4 215 215 123,120 31 14,095$ DOT-Airport Division SOH DOT AIRPORT8800-6357-075 1 200308 J4 209 209 104,800 28 11,928$ DOT-Airport Division SOH DOT AIRPORT8800-6357-075 1 200309 J4 206 206 123,520 33 13,390$ DOT-Airport Division SOH DOT AIRPORT8800-6357-075 1 200310 J4 207 207 115,440 29 12,563$ DOT-Airport Division SOH DOT AIRPORT8800-6357-075 1 200311 J4 208 208 113,360 29 12,294$ DOT-Airport Division SOH DOT AIRPORT8800-6357-075 1 200312 J4 203 203 125,920 33 13,339$ DOT-Airport Division SOH DOT AIRPORT
TOTAL 1,561,280 172,780$ 8800-6358-076 1 200301 PP3 1,636 1,610 1,068,000 31 109,359$ DOT-Airport Division SOH DOT AIRPORT8800-6358-076 1 200302 PP3 1,628 1,596 960,000 28 101,313$ DOT-Airport Division SOH DOT AIRPORT8800-6358-076 1 200303 PP3 1,645 1,630 1,068,000 33 112,464$ DOT-Airport Division SOH DOT AIRPORT8800-6358-076 1 200304 PP3 1,537 1,414 871,200 29 96,795$ DOT-Airport Division SOH DOT AIRPORT8800-6358-076 1 200305 PP3 1,649 1,637 974,400 29 108,309$ DOT-Airport Division SOH DOT AIRPORT8800-6358-076 1 200306 PP3 1,652 1,644 1,132,800 32 123,551$ DOT-Airport Division SOH DOT AIRPORT8800-6358-076 1 200307 PP3 1,670 1,670 1,065,600 31 115,136$ DOT-Airport Division SOH DOT AIRPORT8800-6358-076 1 200308 PP3 1,669 1,668 991,200 28 104,883$ DOT-Airport Division SOH DOT AIRPORT8800-6358-076 1 200309 PP3 1,692 1,692 1,176,000 33 119,241$ DOT-Airport Division SOH DOT AIRPORT8800-6358-076 1 200310 PP3 1,673 1,654 1,032,000 29 105,857$ DOT-Airport Division SOH DOT AIRPORT8800-6358-076 1 200311 PP3 1,662 1,632 1,020,000 29 103,869$ DOT-Airport Division SOH DOT AIRPORT8800-6358-076 1 200312 PP3 1,663 1,634 1,154,400 33 115,064$ DOT-Airport Division SOH DOT AIRPORT
TOTAL 12,513,600 1,315,839$ 8800-6359-076 1 200301 PP3 930 924 633,000 31 64,650$ DOT-Airport Division SOH DOT AIRPORT8800-6359-076 1 200302 PP3 930 924 564,000 28 59,552$ DOT-Airport Division SOH DOT AIRPORT8800-6359-076 1 200303 PP3 936 936 681,000 33 70,646$ DOT-Airport Division SOH DOT AIRPORT8800-6359-076 1 200304 PP3 930 924 582,000 29 63,802$ DOT-Airport Division SOH DOT AIRPORT8800-6359-076 1 200305 PP3 930 924 591,000 29 65,206$ DOT-Airport Division SOH DOT AIRPORT8800-6359-076 1 200306 PP3 930 924 660,000 32 71,963$ DOT-Airport Division SOH DOT AIRPORT8800-6359-076 1 200307 PP3 918 900 624,000 31 67,077$ DOT-Airport Division SOH DOT AIRPORT8800-6359-076 1 200308 PP3 930 924 561,000 28 59,658$ DOT-Airport Division SOH DOT AIRPORT8800-6359-076 1 200309 PP3 936 936 681,000 33 68,974$ DOT-Airport Division SOH DOT AIRPORT8800-6359-076 1 200310 PP3 930 924 594,000 29 60,918$ DOT-Airport Division SOH DOT AIRPORT8800-6359-076 1 200311 PP3 936 936 594,000 29 60,432$ DOT-Airport Division SOH DOT AIRPORT8800-6359-076 1 200312 PP3 912 888 636,000 33 63,631$ DOT-Airport Division SOH DOT AIRPORT
TOTAL 7,401,000 776,509$ 8800-6360-075 1 200301 PP3 1,056 996 609,000 31 63,863$ DOT-Airport Division SOH DOT AIRPORT8800-6360-075 1 200302 PP3 1,056 996 525,000 28 57,453$ DOT-Airport Division SOH DOT AIRPORT8800-6360-075 1 200303 PP3 1,038 960 618,000 33 66,132$ DOT-Airport Division SOH DOT AIRPORT

TABLE: STATE LARGE FACILITIES IN OAHU ELECTRICITY BILL HISTORY FOR YEAR 2003 (PROVIDED BY HECO)
ACCTNUM TARCDE REVPER RATESCH BILLDMD KW KWH NBRDAYS TOTAMT DEPARTMENT NAME8800-6360-075 1 200304 PP3 1,062 1,008 573,000 29 64,208$ DOT-Airport Division SOH DOT AIRPORT8800-6360-075 1 200305 PP3 1,050 984 567,000 29 64,153$ DOT-Airport Division SOH DOT AIRPORT8800-6360-075 1 200306 PP3 1,074 1,032 648,000 32 72,192$ DOT-Airport Division SOH DOT AIRPORT8800-6360-075 1 200307 PP3 1,086 1,056 648,000 31 70,817$ DOT-Airport Division SOH DOT AIRPORT8800-6360-075 1 200308 PP3 1,098 1,080 609,000 28 65,282$ DOT-Airport Division SOH DOT AIRPORT8800-6360-075 1 200309 PP3 1,104 1,104 714,000 33 73,256$ DOT-Airport Division SOH DOT AIRPORT8800-6360-075 1 200310 PP3 1,284 1,284 639,000 29 68,458$ DOT-Airport Division SOH DOT AIRPORT8800-6360-075 1 200311 PP3 1,194 1,104 642,000 29 67,084$ DOT-Airport Division SOH DOT AIRPORT8800-6360-075 1 200312 PP3 1,164 1,044 699,000 33 71,421$ DOT-Airport Division SOH DOT AIRPORT
TOTAL 7,491,000 804,319$ 8800-6364-076 1 200301 PP3 958 907 480,000 31 52,074$ DOT-Airport Division SOH DOT AIRPORT8800-6364-076 1 200302 PP3 938 869 434,400 28 48,521$ DOT-Airport Division SOH DOT AIRPORT8800-6364-076 1 200303 PP3 989 970 514,800 33 56,796$ DOT-Airport Division SOH DOT AIRPORT8800-6364-076 1 200304 PP3 1,027 1,027 475,200 29 55,299$ DOT-Airport Division SOH DOT AIRPORT8800-6364-076 1 200305 PP3 1,020 1,013 477,600 29 55,912$ DOT-Airport Division SOH DOT AIRPORT8800-6364-076 1 200306 PP3 1,061 1,061 522,000 32 60,787$ DOT-Airport Division SOH DOT AIRPORT8800-6364-076 1 200307 PP3 1,044 1,027 507,600 31 58,079$ DOT-Airport Division SOH DOT AIRPORT8800-6364-076 1 200308 PP3 1,025 989 451,200 28 51,196$ DOT-Airport Division SOH DOT AIRPORT8800-6364-076 1 200309 PP3 1,039 1,018 538,800 33 58,047$ DOT-Airport Division SOH DOT AIRPORT8800-6364-076 1 200310 PP3 1,027 994 463,200 29 51,085$ DOT-Airport Division SOH DOT AIRPORT8800-6364-076 1 200311 PP3 1,042 1,022 470,400 29 51,448$ DOT-Airport Division SOH DOT AIRPORT8800-6364-076 1 200312 PP3 1,032 1,003 524,400 33 55,825$ DOT-Airport Division SOH DOT AIRPORT
TOTAL 5,859,600 655,070$ 8800-6365-075 1 200301 PP3 2,280 2,100 1,272,000 31 134,149$ DOT-Airport Division SOH DOT AIRPORT8800-6365-075 1 200302 PP3 2,400 2,340 1,110,000 28 123,112$ DOT-Airport Division SOH DOT AIRPORT8800-6365-075 1 200303 PP3 2,310 2,160 1,254,000 33 136,494$ DOT-Airport Division SOH DOT AIRPORT8800-6365-075 1 200304 PP3 2,340 2,220 1,326,000 29 146,808$ DOT-Airport Division SOH DOT AIRPORT8800-6365-075 1 200306 PP3 2,367 2,274 2,790,000 61 310,564$ DOT-Airport Division SOH DOT AIRPORT8800-6365-075 1 200307 PP3 2,352 2,244 1,470,000 31 159,052$ DOT-Airport Division SOH DOT AIRPORT8800-6365-075 1 200308 PP3 2,313 2,286 1,338,000 28 141,962$ DOT-Airport Division SOH DOT AIRPORT8800-6365-075 1 200309 PP3 2,514 2,514 1,680,000 33 171,065$ DOT-Airport Division SOH DOT AIRPORT8800-6365-075 1 200310 PP3 2,544 2,544 1,470,000 29 152,056$ DOT-Airport Division SOH DOT AIRPORT8800-6365-075 1 200311 PP3 2,523 2,502 1,452,000 29 149,199$ DOT-Airport Division SOH DOT AIRPORT8800-6365-075 1 200312 PP3 2,514 2,484 1,566,000 33 158,821$ DOT-Airport Division SOH DOT AIRPORT
TOTAL 16,728,000 1,783,282$ 9201-0482-002 1 200301 PP3 1,996 1,622 952,800 31 104,277$ DOT-Airport Division SOH DOT AIRPORT9201-0482-002 1 200302 PP3 1,976 1,584 804,000 28 92,525$ DOT-Airport Division SOH DOT AIRPORT9201-0482-002 1 200303 PP3 1,934 1,500 967,200 33 107,602$ DOT-Airport Division SOH DOT AIRPORT9201-0482-002 1 200304 PP3 1,974 1,579 955,200 29 109,766$ DOT-Airport Division SOH DOT AIRPORT9201-0482-002 1 200305 PP3 1,986 1,603 900,000 29 105,857$ DOT-Airport Division SOH DOT AIRPORT9201-0482-002 1 200306 PP3 1,960 1,550 1,065,600 32 121,363$ DOT-Airport Division SOH DOT AIRPORT9201-0482-002 1 200307 PP3 1,964 1,577 1,075,200 31 119,769$ DOT-Airport Division SOH DOT AIRPORT9201-0482-002 1 200308 PP3 1,628 1,596 969,600 28 102,982$ DOT-Airport Division SOH DOT AIRPORT9201-0482-002 1 200309 PP3 1,624 1,586 1,173,600 33 118,735$ DOT-Airport Division SOH DOT AIRPORT9201-0482-002 1 200310 PP3 2,386 2,386 1,036,800 29 114,546$ DOT-Airport Division SOH DOT AIRPORT9201-0482-002 1 200311 PP3 2,040 1,694 1,111,200 29 115,951$ DOT-Airport Division SOH DOT AIRPORT9201-0482-002 1 200312 PP3 2,036 1,687 1,161,600 33 120,321$ DOT-Airport Division SOH DOT AIRPORT
TOTAL 12,172,800 1,333,694$ 9300-0115-002 1 200301 PS 1,570 1,555 1,017,600 31 106,042$ DOT-Airport Division SOH DOT AIRPORT9300-0115-002 1 200302 PS 1,570 1,555 912,000 28 98,095$ DOT-Airport Division SOH DOT AIRPORT9300-0115-002 1 200303 PS 1,560 1,536 1,099,200 33 115,939$ DOT-Airport Division SOH DOT AIRPORT9300-0115-002 1 200304 PS 1,579 1,574 969,600 29 107,770$ DOT-Airport Division SOH DOT AIRPORT9300-0115-002 1 200305 PS 1,541 1,498 940,800 29 105,680$ DOT-Airport Division SOH DOT AIRPORT9300-0115-002 1 200306 PS 1,541 1,498 1,027,200 32 114,329$ DOT-Airport Division SOH DOT AIRPORT9300-0115-002 1 200307 PS 1,560 1,536 1,008,000 31 110,412$ DOT-Airport Division SOH DOT AIRPORT9300-0115-002 1 200308 PS 1,546 1,517 907,200 28 97,850$ DOT-Airport Division SOH DOT AIRPORT9300-0115-002 1 200309 PS 1,565 1,555 1,089,600 33 112,300$ DOT-Airport Division SOH DOT AIRPORT9300-0115-002 1 200310 PS 1,574 1,574 969,600 29 101,090$ DOT-Airport Division SOH DOT AIRPORT9300-0115-002 1 200311 PS 1,574 1,574 950,400 29 98,662$ DOT-Airport Division SOH DOT AIRPORT9300-0115-002 1 200312 PS 1,574 1,574 1,036,800 33 106,076$ DOT-Airport Division SOH DOT AIRPORT
TOTAL 11,928,000 1,274,246$ 9300-4842-002 1 200301 PP3 378 360 223,200 31 23,686$ DOT-Airport Division SOH DOT AIRPORT9300-4842-002 1 200302 PP3 396 396 203,400 28 22,482$ DOT-Airport Division SOH DOT AIRPORT9300-4842-002 1 200303 PP3 396 396 232,200 33 25,314$ DOT-Airport Division SOH DOT AIRPORT9300-4842-002 1 200304 PP3 396 396 212,400 29 24,238$ DOT-Airport Division SOH DOT AIRPORT9300-4842-002 1 200305 PP3 369 342 196,200 29 22,636$ DOT-Airport Division SOH DOT AIRPORT9300-4842-002 1 200306 PP3 378 360 225,000 32 25,509$ DOT-Airport Division SOH DOT AIRPORT9300-4842-002 1 200307 PP3 369 342 219,600 31 24,390$ DOT-Airport Division SOH DOT AIRPORT9300-4842-002 1 200308 PP3 387 378 201,600 28 22,281$ DOT-Airport Division SOH DOT AIRPORT9300-4842-002 1 200309 PP3 396 396 246,600 33 25,870$ DOT-Airport Division SOH DOT AIRPORT9300-4842-002 1 200310 PP3 387 378 212,400 29 22,671$ DOT-Airport Division SOH DOT AIRPORT9300-4842-002 1 200311 PP3 396 396 208,800 29 22,306$ DOT-Airport Division SOH DOT AIRPORT9300-4842-002 1 200312 PP3 378 360 235,800 33 24,343$ DOT-Airport Division SOH DOT AIRPORT
TOTAL 2,617,200 285,726$ 8811-0340-077 1 200301 J 188 161 66,800 33 8,253$ DOT-Highway Division SOH DOT HIGHWAY DIVISION (-)8811-0340-077 1 200302 J 188 161 59,280 29 7,575$ DOT-Highway Division SOH DOT HIGHWAY DIVISION (-)8811-0340-077 1 200303 J 188 187 73,920 32 9,240$ DOT-Highway Division SOH DOT HIGHWAY DIVISION (-)8811-0340-077 1 200304 J 188 176 68,880 29 8,860$ DOT-Highway Division SOH DOT HIGHWAY DIVISION (-)8811-0340-077 1 200305 J 177 176 71,440 29 9,103$ DOT-Highway Division SOH DOT HIGHWAY DIVISION (-)8811-0340-077 1 200306 J 177 172 82,720 33 10,144$ DOT-Highway Division SOH DOT HIGHWAY DIVISION (-)8811-0340-077 1 200307 J 172 172 71,680 29 8,797$ DOT-Highway Division SOH DOT HIGHWAY DIVISION (-)8811-0340-077 1 200308 J 183 182 69,520 29 8,505$ DOT-Highway Division SOH DOT HIGHWAY DIVISION (-)8811-0340-077 1 200309 J 185 185 77,840 33 9,217$ DOT-Highway Division SOH DOT HIGHWAY DIVISION (-)8811-0340-077 1 200310 J 170 170 67,440 30 8,042$ DOT-Highway Division SOH DOT HIGHWAY DIVISION (-)8811-0340-077 1 200311 J 169 169 65,040 30 7,771$ DOT-Highway Division SOH DOT HIGHWAY DIVISION (-)8811-0340-077 1 200312 J 168 168 62,400 31 7,542$ DOT-Highway Division SOH DOT HIGHWAY DIVISION (-)
TOTAL 836,960 103,048$ 8824-9624-058 1 200301 J3 262 262 118,400 32 13,578$ DOT-Highway Division SOH DOT HIGHWAY DIVISION (-)8824-9624-058 1 200302 J3 262 262 92,800 29 11,318$ DOT-Highway Division SOH DOT HIGHWAY DIVISION (-)8824-9624-058 1 200303 J3 266 266 115,200 30 13,723$ DOT-Highway Division SOH DOT HIGHWAY DIVISION (-)8824-9624-058 1 200304 J3 262 262 110,400 29 13,505$ DOT-Highway Division SOH DOT HIGHWAY DIVISION (-)8824-9624-058 1 200305 J3 254 254 121,600 32 14,573$ DOT-Highway Division SOH DOT HIGHWAY DIVISION (-)8824-9624-058 1 200306 J3 264 264 123,200 31 14,806$ DOT-Highway Division SOH DOT HIGHWAY DIVISION (-)8824-9624-058 1 200307 J3 267 267 121,600 31 14,322$ DOT-Highway Division SOH DOT HIGHWAY DIVISION (-)8824-9624-058 1 200308 J3 270 270 110,400 29 13,026$ DOT-Highway Division SOH DOT HIGHWAY DIVISION (-)8824-9624-058 1 200309 J3 275 275 118,400 31 13,644$ DOT-Highway Division SOH DOT HIGHWAY DIVISION (-)8824-9624-058 1 200310 J3 267 267 131,200 32 14,529$ DOT-Highway Division SOH DOT HIGHWAY DIVISION (-)8824-9624-058 1 200311 J3 258 258 115,200 29 12,981$ DOT-Highway Division SOH DOT HIGHWAY DIVISION (-)8824-9624-058 1 200312 J3 262 262 110,400 30 12,686$ DOT-Highway Division SOH DOT HIGHWAY DIVISION (-)
TOTAL 1,388,800 162,691$ 9400-4323-001 1 200301 J3 1,833 1,609 342,000 30 47,377$ DOT-Highway Division SOH DOT HIGHWAY DIVISION (-)9400-4323-001 1 200302 J3 1,933 1,933 390,000 31 53,537$ DOT-Highway Division SOH DOT HIGHWAY DIVISION (-)9400-4323-001 1 200303 J3 1,833 1,231 330,000 30 47,211$ DOT-Highway Division SOH DOT HIGHWAY DIVISION (-)9400-4323-001 1 200304 J3 1,833 1,264 336,000 29 48,662$ DOT-Highway Division SOH DOT HIGHWAY DIVISION (-)9400-4323-001 1 200305 J3 1,833 1,616 366,000 32 52,477$ DOT-Highway Division SOH DOT HIGHWAY DIVISION (-)9400-4323-001 1 200306 J3 1,833 1,548 378,000 31 53,688$ DOT-Highway Division SOH DOT HIGHWAY DIVISION (-)9400-4323-001 1 200307 J3 1,833 1,015 318,000 29 45,953$ DOT-Highway Division SOH DOT HIGHWAY DIVISION (-)9400-4323-001 1 200308 J3 1,833 1,156 354,000 31 48,947$ DOT-Highway Division SOH DOT HIGHWAY DIVISION (-)9400-4323-001 1 200309 J3 1,833 1,451 342,000 31 47,169$ DOT-Highway Division SOH DOT HIGHWAY DIVISION (-)9400-4323-001 1 200310 J3 2,675 2,675 354,000 29 52,722$ DOT-Highway Division SOH DOT HIGHWAY DIVISION (-)9400-4323-001 1 200311 J3 2,006 1,350 366,000 31 50,100$ DOT-Highway Division SOH DOT HIGHWAY DIVISION (-)9400-4323-001 1 200312 J3 2,006 1,116 342,000 31 48,420$ DOT-Highway Division SOH DOT HIGHWAY DIVISION (-)
TOTAL 4,218,000 596,263$

TABLE: STATE LARGE FACILITIES IN OAHU ELECTRICITY BILL HISTORY FOR YEAR 2003 (PROVIDED BY HECO)
ACCTNUM TARCDE REVPER RATESCH BILLDMD KW KWH NBRDAYS TOTAMT DEPARTMENT NAME8819-5909-075 1 200301 PP3 350 346 170,000 31 19,091$ HCDCH HCDCH - 1308819-5909-075 1 200302 PP3 349 342 179,500 32 20,093$ HCDCH HCDCH - 1308819-5909-075 1 200303 PP3 346 337 160,000 29 18,906$ HCDCH HCDCH - 1308819-5909-075 1 200304 PP3 344 334 163,500 30 19,408$ HCDCH HCDCH - 1308819-5909-075 1 200305 PP3 343 331 158,500 29 19,070$ HCDCH HCDCH - 1308819-5909-075 1 200306 PP3 343 331 180,500 33 20,836$ HCDCH HCDCH - 1308819-5909-075 1 200307 PP3 340 324 158,000 29 18,151$ HCDCH HCDCH - 1308819-5909-075 1 200308 PP3 347 338 180,000 33 19,805$ HCDCH HCDCH - 1308819-5909-075 1 200309 PP3 350 344 158,500 29 17,856$ HCDCH HCDCH - 1308819-5909-076 1 200310 PP3 337 337 172,000 31 18,660$ HCDCH HCDCH8819-5909-076 1 200311 PP3 346 346 172,000 31 18,739$ HCDCH HCDCH8819-5909-076 1 200312 PP3 350 350 157,500 28 17,772$ HCDCH HCDCH
TOTAL 2,010,000 228,385$ 8823-1584-076 1 200301 PP3 445 422 184,800 30 21,442$ HCDCH HCDCH - 1308823-1584-076 1 200302 PP3 449 430 205,200 33 23,540$ HCDCH HCDCH - 1308823-1584-076 1 200303 PP3 456 445 183,600 29 22,343$ HCDCH HCDCH - 1308823-1584-076 1 200304 PP3 444 421 180,600 29 22,114$ HCDCH HCDCH - 1308823-1584-076 1 200305 PP3 444 421 175,200 28 21,780$ HCDCH HCDCH - 1308823-1584-076 1 200306 PP3 432 396 192,000 30 22,792$ HCDCH HCDCH - 1308823-1584-076 1 200307 PP3 450 433 209,400 32 23,762$ HCDCH HCDCH - 1308823-1584-076 1 200308 PP3 470 470 206,400 31 23,398$ HCDCH HCDCH - 1308823-1584-076 1 200309 PP3 461 451 206,400 32 23,072$ HCDCH HCDCH - 1308823-1584-077 1 200310 PP3 446 446 199,200 29 22,087$ HCDCH HCDCH8823-1584-077 1 200311 PP3 565 565 205,200 30 23,975$ HCDCH HCDCH8823-1584-077 1 200312 PP3 554 542 228,000 32 26,032$ HCDCH HCDCH
TOTAL 2,376,000 276,337$ 9400-2851-001 1 200301 J 222 222 103,120 31 11,921$ HCDCH SOH HCDCH *9400-2851-001 1 200302 J 222 222 102,240 31 11,978$ HCDCH SOH HCDCH *9400-2851-001 1 200303 J 222 222 97,920 29 11,913$ HCDCH SOH HCDCH *9400-2851-001 1 200304 J 219 219 104,320 32 12,587$ HCDCH SOH HCDCH *9400-2851-001 1 200305 J 219 219 95,440 29 11,837$ HCDCH SOH HCDCH *9400-2851-001 1 200306 J 217 217 97,200 29 11,795$ HCDCH SOH HCDCH *9400-2851-001 1 200307 J 217 217 104,640 32 12,102$ HCDCH SOH HCDCH *9400-2851-001 1 200308 J 225 225 104,000 31 11,954$ HCDCH SOH HCDCH *9400-2851-001 1 200309 J 234 234 97,520 28 11,377$ HCDCH SOH HCDCH *9400-2851-001 1 200310 J 228 228 115,760 33 12,805$ HCDCH SOH HCDCH *9400-2851-001 1 200311 J 226 226 107,680 31 12,069$ HCDCH SOH HCDCH *9400-2851-001 1 200312 J 233 233 110,320 31 12,515$ HCDCH SOH HCDCH *
TOTAL 1,240,160 144,853$ 9400-2852-001 1 200301 J 232 232 111,040 31 12,743$ HCDCH SOH HCDCH *9400-2852-001 1 200302 J 229 229 110,880 31 12,837$ HCDCH SOH HCDCH *9400-2852-001 1 200303 J 226 226 104,240 29 12,544$ HCDCH SOH HCDCH *9400-2852-001 1 200304 J 226 226 113,040 32 13,500$ HCDCH SOH HCDCH *9400-2852-001 1 200305 J 220 220 101,840 29 12,460$ HCDCH SOH HCDCH *9400-2852-001 1 200306 J 214 214 102,880 29 12,301$ HCDCH SOH HCDCH *9400-2852-001 1 200307 J 220 220 114,480 32 13,029$ HCDCH SOH HCDCH *9400-2852-001 1 200308 J 233 233 117,040 31 13,204$ HCDCH SOH HCDCH *9400-2852-001 1 200309 J 234 234 104,880 28 12,030$ HCDCH SOH HCDCH *9400-2852-001 1 200310 J 235 235 121,840 33 13,418$ HCDCH SOH HCDCH *9400-2852-001 1 200311 J 236 236 114,400 31 12,775$ HCDCH SOH HCDCH *9400-2852-001 1 200312 J 243 243 117,760 31 13,292$ HCDCH SOH HCDCH *
TOTAL 1,334,320 154,133$ 8819-9077-077 1 200301 PS 885 842 304,400 30 37,254$ Judiciary SOH JUDICIARY *8819-9077-077 1 200302 PS 890 852 330,800 32 40,067$ Judiciary SOH JUDICIARY *8819-9077-077 1 200303 PS 883 837 318,400 29 39,907$ Judiciary SOH JUDICIARY *8819-9077-077 1 200304 PS 882 836 328,000 30 41,219$ Judiciary SOH JUDICIARY *8819-9077-077 1 200305 PS 895 870 335,200 29 42,358$ Judiciary SOH JUDICIARY *8819-9077-077 1 200306 PS 897 874 370,800 32 45,209$ Judiciary SOH JUDICIARY *8819-9077-077 1 200307 PS 888 864 356,800 30 42,522$ Judiciary SOH JUDICIARY *8819-9077-077 1 200308 PS 900 887 381,600 32 44,051$ Judiciary SOH JUDICIARY *8819-9077-077 1 200309 PS 885 882 349,600 30 40,717$ Judiciary SOH JUDICIARY *8819-9077-077 1 200310 PS 894 894 364,400 30 41,752$ Judiciary SOH JUDICIARY *8819-9077-077 1 200311 PS 894 894 352,800 31 40,693$ Judiciary SOH JUDICIARY *8819-9077-077 1 200312 PS 881 868 329,200 30 38,863$ Judiciary SOH JUDICIARY *
TOTAL 4,122,000 494,613$ 8824-2360-078 1 200301 PS 1,075 1,013 410,000 29 48,519$ Judiciary SOH JUDICIARY *8824-2360-078 1 200302 PS 1,070 1,003 443,000 32 51,928$ Judiciary SOH JUDICIARY *8824-2360-078 1 200303 PS 1,106 1,075 420,000 29 51,621$ Judiciary SOH JUDICIARY *8824-2360-078 1 200304 PS 1,046 956 424,000 30 51,879$ Judiciary SOH JUDICIARY *8824-2360-078 1 200305 PS 1,037 937 464,000 32 55,752$ Judiciary SOH JUDICIARY *8824-2360-078 1 200306 PS 1,040 944 471,000 31 55,638$ Judiciary SOH JUDICIARY *8824-2360-078 1 200307 PS 1,042 947 403,000 28 47,927$ Judiciary SOH JUDICIARY *8824-2360-078 1 200308 PS 1,052 967 463,000 32 52,527$ Judiciary SOH JUDICIARY *8824-2360-078 1 200309 PS 1,052 1,010 447,000 30 50,657$ Judiciary SOH JUDICIARY *8824-2360-078 1 200310 PS 1,035 976 483,000 32 53,010$ Judiciary SOH JUDICIARY *8824-2360-078 1 200311 PS 1,030 966 424,000 29 48,040$ Judiciary SOH JUDICIARY *8824-2360-078 1 200312 PS 993 911 421,000 31 47,797$ Judiciary SOH JUDICIARY *
TOTAL 5,273,000 615,293$ 8824-4780-075 1 200301 J5 349 349 130,080 31 15,966$ Judiciary SOH JUDICIARY *8824-4780-075 1 200302 J5 357 357 139,440 33 17,160$ Judiciary SOH JUDICIARY *8824-4780-075 1 200303 J5 357 357 128,640 28 16,457$ Judiciary SOH JUDICIARY *8824-4780-075 1 200304 J5 358 358 137,280 30 17,543$ Judiciary SOH JUDICIARY *8824-4780-075 1 200305 J5 362 362 139,920 29 17,983$ Judiciary SOH JUDICIARY *8824-4780-075 1 200306 J5 370 370 155,520 33 19,435$ Judiciary SOH JUDICIARY *8824-4780-075 1 200307 J5 371 371 138,480 29 17,170$ Judiciary SOH JUDICIARY *8824-4780-075 1 200308 J5 372 372 163,680 33 19,310$ Judiciary SOH JUDICIARY *8824-4780-075 1 200309 J5 369 369 146,400 29 17,513$ Judiciary SOH JUDICIARY *8824-4780-075 1 200310 J5 373 372 155,280 30 18,219$ Judiciary SOH JUDICIARY *8824-4780-075 1 200311 J5 373 373 149,520 31 17,720$ Judiciary SOH JUDICIARY *8824-4780-075 1 200312 J5 361 361 128,160 28 15,645$ Judiciary SOH JUDICIARY *
TOTAL 1,712,400 210,122$ 8820-3139-077 1 200301 J 410 410 128,880 31 16,237$ Public Libraries SOH HSPLS8820-3139-077 1 200302 J 401 401 123,120 33 15,726$ Public Libraries SOH HSPLS8820-3139-077 1 200303 J 442 442 122,160 29 16,361$ Public Libraries SOH HSPLS8820-3139-077 1 200304 J 440 440 105,600 30 14,748$ Public Libraries SOH HSPLS8820-3139-077 1 200305 J 420 420 99,600 28 14,033$ Public Libraries SOH HSPLS8820-3139-077 1 200306 J 423 423 95,280 33 13,470$ Public Libraries SOH HSPLS8820-3139-077 1 200307 J 438 438 87,120 29 12,391$ Public Libraries SOH HSPLS8820-3139-077 1 200308 J 447 447 99,120 33 13,493$ Public Libraries SOH HSPLS8820-3139-077 1 200309 J 443 443 94,560 29 12,901$ Public Libraries SOH HSPLS8820-3139-077 1 200310 J 436 436 102,000 30 13,490$ Public Libraries SOH HSPLS8820-3139-077 1 200311 J 452 452 97,920 32 13,203$ Public Libraries SOH HSPLS8820-3139-077 1 200312 J 452 452 87,120 28 12,206$ Public Libraries SOH HSPLS
TOTAL 1,242,480 168,261$ 8820-3139-077 1 200301 J 410 410 128,880 31 16,237$ Public Libraries 16,237$ 4 SOH HSPLS8820-3139-077 1 200302 J 401 401 123,120 33 15,726$ Public Libraries 15,726$ 4 SOH HSPLS8820-3139-077 1 200303 J 442 442 122,160 29 16,361$ Public Libraries 16,361$ 4 SOH HSPLS8820-3139-077 1 200304 J 440 440 105,600 30 14,748$ Public Libraries 14,748$ 4 SOH HSPLS8820-3139-077 1 200305 J 420 420 99,600 28 14,033$ Public Libraries 14,033$ 4 SOH HSPLS8820-3139-077 1 200306 J 423 423 95,280 33 13,470$ Public Libraries 13,470$ 4 SOH HSPLS8820-3139-077 1 200307 J 438 438 87,120 29 12,391$ Public Libraries 12,391$ 4 SOH HSPLS8820-3139-077 1 200308 J 447 447 99,120 33 13,493$ Public Libraries 13,493$ 4 SOH HSPLS8820-3139-077 1 200309 J 443 443 94,560 29 12,901$ Public Libraries 12,901$ 4 SOH HSPLS

TABLE: STATE LARGE FACILITIES IN OAHU ELECTRICITY BILL HISTORY FOR YEAR 2003 (PROVIDED BY HECO)
ACCTNUM TARCDE REVPER RATESCH BILLDMD KW KWH NBRDAYS TOTAMT DEPARTMENT NAME8820-3139-077 1 200310 J 436 436 102,000 30 13,490$ Public Libraries 13,490$ 4 SOH HSPLS8820-3139-077 1 200311 J 452 452 97,920 32 13,203$ Public Libraries 13,203$ 4 SOH HSPLS8820-3139-077 1 200312 J 452 452 87,120 28 12,206$ Public Libraries 12,206$ 4 SOH HSPLS
TOTAL 1,242,480 168,261$ 8823-4938-076 1 200301 J3 2,023 2,023 217,800 30 35,180$ Stadium Authority STADIUM AUTHORITY *8823-4938-076 1 200302 J3 1,658 1,001 279,000 33 40,288$ Stadium Authority STADIUM AUTHORITY *8823-4938-076 1 200303 J3 1,658 1,224 268,200 28 39,905$ Stadium Authority STADIUM AUTHORITY *8823-4938-076 1 200304 J3 1,658 770 208,800 29 33,349$ Stadium Authority STADIUM AUTHORITY *8823-4938-076 1 200305 J3 1,658 1,310 228,600 30 35,852$ Stadium Authority STADIUM AUTHORITY *8823-4938-076 1 200306 J3 1,658 1,318 271,800 32 40,378$ Stadium Authority STADIUM AUTHORITY *8823-4938-076 1 200307 J3 1,658 1,058 246,600 30 36,469$ Stadium Authority STADIUM AUTHORITY *8823-4938-076 1 200308 J3 1,658 1,462 275,400 30 39,216$ Stadium Authority STADIUM AUTHORITY *8823-4938-076 1 200309 J3 2,153 2,153 358,200 31 50,677$ Stadium Authority STADIUM AUTHORITY *8823-4938-076 1 200310 J3 2,146 2,146 356,400 31 50,067$ Stadium Authority STADIUM AUTHORITY *8823-4938-076 1 200311 J3 2,059 2,059 354,600 32 49,339$ Stadium Authority STADIUM AUTHORITY *8823-4938-076 1 200312 J3 2,138 2,138 315,000 30 45,941$ Stadium Authority STADIUM AUTHORITY *
TOTAL 3,380,400 496,661$ 8813-7302-075 1 200301 J 150 150 85,360 33 9,559$ UH Manoa UH SCHOOL OF MEDICINE8813-7302-075 1 200302 J 149 149 92,000 30 10,257$ UH Manoa UH SCHOOL OF MEDICINE8813-7302-075 1 200303 J 178 178 64,720 29 8,239$ UH Manoa UH SCHOOL OF MEDICINE8813-7302-075 1 200304 J 161 161 87,840 32 10,415$ UH Manoa UH SCHOOL OF MEDICINE8813-7302-075 1 200305 J 159 159 81,520 29 9,871$ UH Manoa UH SCHOOL OF MEDICINE8813-7302-075 1 200306 J 160 160 86,640 30 10,284$ UH Manoa UH SCHOOL OF MEDICINE8813-7302-075 1 200307 J 168 168 86,640 29 10,097$ UH Manoa UH SCHOOL OF MEDICINE8813-7302-075 1 200308 J 167 167 101,680 33 11,233$ UH Manoa UH SCHOOL OF MEDICINE8813-7302-075 1 200309 J 166 166 86,800 29 9,769$ UH Manoa UH SCHOOL OF MEDICINE8813-7302-075 1 200310 J 162 162 95,920 32 10,437$ UH Manoa UH SCHOOL OF MEDICINE8813-7302-075 1 200311 J 167 167 88,400 30 9,819$ UH Manoa UH SCHOOL OF MEDICINE8813-7302-075 1 200312 J 166 166 78,000 29 8,953$ UH Manoa UH SCHOOL OF MEDICINE
TOTAL 1,035,520 118,933$ 8815-4443-075 1 200301 J 216 216 117,600 33 13,190$ UH Manoa UH WAIKIKI AQUARIUM8815-4443-075 1 200302 J 213 213 110,880 31 12,702$ UH Manoa UH WAIKIKI AQUARIUM8815-4443-075 1 200303 J 215 215 112,800 31 13,235$ UH Manoa UH WAIKIKI AQUARIUM8815-4443-075 1 200304 J 213 213 103,680 29 12,521$ UH Manoa UH WAIKIKI AQUARIUM8815-4443-075 1 200305 J 213 213 102,960 29 12,530$ UH Manoa UH WAIKIKI AQUARIUM8815-4443-075 1 200306 J 217 217 120,960 33 14,182$ UH Manoa UH WAIKIKI AQUARIUM8815-4443-075 1 200307 J 219 219 111,120 29 12,850$ UH Manoa UH WAIKIKI AQUARIUM8815-4443-075 1 200308 J 221 221 114,480 30 12,954$ UH Manoa UH WAIKIKI AQUARIUM8815-4443-075 1 200309 J 216 216 120,240 32 13,263$ UH Manoa UH WAIKIKI AQUARIUM8815-4443-075 1 200310 J 216 216 112,320 30 12,465$ UH Manoa UH WAIKIKI AQUARIUM8815-4443-075 1 200311 J 214 214 113,760 31 12,549$ UH Manoa UH WAIKIKI AQUARIUM8815-4443-075 1 200312 J 207 207 105,600 30 11,846$ UH Manoa UH WAIKIKI AQUARIUM
TOTAL 1,346,400 154,286$ 8816-2141-076 1 200301 J 196 196 87,520 32 10,310$ UH Manoa UH FACILITIES MANAGEMENT8816-2141-076 1 200302 J 198 198 86,800 31 10,384$ UH Manoa UH FACILITIES MANAGEMENT8816-2141-076 1 200303 J 197 197 87,120 31 10,662$ UH Manoa UH FACILITIES MANAGEMENT8816-2141-076 1 200304 J 191 191 82,080 30 10,241$ UH Manoa UH FACILITIES MANAGEMENT8816-2141-076 1 200305 J 196 196 77,760 28 9,956$ UH Manoa UH FACILITIES MANAGEMENT8816-2141-076 1 200306 J 183 183 87,040 33 10,593$ UH Manoa UH FACILITIES MANAGEMENT8816-2141-076 1 200307 J 177 177 77,280 29 9,302$ UH Manoa UH FACILITIES MANAGEMENT8816-2141-076 1 200308 J 193 193 83,360 31 9,890$ UH Manoa UH FACILITIES MANAGEMENT8816-2141-076 1 200309 J 218 218 88,640 32 10,567$ UH Manoa UH FACILITIES MANAGEMENT8816-2141-076 1 200310 J 233 233 88,480 30 10,599$ UH Manoa UH FACILITIES MANAGEMENT8816-2141-076 1 200311 J 236 236 87,040 29 10,456$ UH Manoa UH FACILITIES MANAGEMENT8816-2141-076 1 200312 J 231 231 90,880 31 10,883$ UH Manoa UH FACILITIES MANAGEMENT
TOTAL 1,024,000 123,843$ 8816-2154-076 1 200301 PP3 19,886 18,579 10,129,200 32 1,072,942$ UH Manoa UH FACILITIES MANAGEMENT8816-2154-076 1 200302 PP3 20,570 19,946 10,166,400 30 1,096,878$ UH Manoa UH FACILITIES MANAGEMENT8816-2154-076 1 200303 PP3 20,595 19,995 10,368,000 29 1,143,504$ UH Manoa UH FACILITIES MANAGEMENT8816-2154-076 1 200304 PP3 20,677 20,159 11,136,000 32 1,230,259$ UH Manoa UH FACILITIES MANAGEMENT8816-2154-076 1 200305 PP3 20,783 20,372 10,466,400 29 1,181,378$ UH Manoa UH FACILITIES MANAGEMENT8816-2154-076 1 200306 PP3 20,173 19,152 10,346,400 30 1,151,868$ UH Manoa UH FACILITIES MANAGEMENT8816-2154-076 1 200307 PP3 20,288 19,381 11,139,600 32 1,185,555$ UH Manoa UH FACILITIES MANAGEMENT8816-2154-076 1 200308 PP3 20,691 20,187 10,833,600 30 1,141,289$ UH Manoa UH FACILITIES MANAGEMENT8816-2154-076 1 200309 PP3 21,130 21,130 11,931,600 32 1,225,812$ UH Manoa UH FACILITIES MANAGEMENT8816-2154-076 1 200310 PP3 21,475 21,475 11,703,600 30 1,198,993$ UH Manoa UH FACILITIES MANAGEMENT8816-2154-076 1 200311 PP3 21,205 20,935 10,903,200 29 1,128,271$ UH Manoa UH FACILITIES MANAGEMENT8816-2154-076 1 200312 PP3 20,811 20,147 11,257,200 32 1,162,780$ UH Manoa UH FACILITIES MANAGEMENT
TOTAL 130,381,200 13,919,528$ 8817-7690-076 1 200301 PP3 318 295 163,800 33 17,981$ UH Manoa UH FACILITIES MANAGEMENT8817-7690-076 1 200302 PP3 332 322 173,400 33 19,191$ UH Manoa UH FACILITIES MANAGEMENT8817-7690-076 1 200303 PP3 334 328 164,400 29 18,981$ UH Manoa UH FACILITIES MANAGEMENT8817-7690-076 1 200304 PP3 343 343 165,000 29 19,358$ UH Manoa UH FACILITIES MANAGEMENT8817-7690-076 1 200305 PP3 326 310 163,800 29 19,188$ UH Manoa UH FACILITIES MANAGEMENT8817-7690-076 1 200306 PP3 338 334 183,600 32 20,891$ UH Manoa UH FACILITIES MANAGEMENT8817-7690-076 1 200307 PP3 351 351 177,000 30 19,806$ UH Manoa UH FACILITIES MANAGEMENT8817-7690-076 1 200308 PP3 353 353 166,800 30 18,648$ UH Manoa UH FACILITIES MANAGEMENT8817-7690-076 1 200309 PP3 356 356 217,800 32 22,689$ UH Manoa UH FACILITIES MANAGEMENT8817-7690-076 1 200310 PP3 356 356 192,000 30 20,369$ UH Manoa UH FACILITIES MANAGEMENT8817-7690-076 1 200311 PP3 364 364 190,200 30 20,298$ UH Manoa UH FACILITIES MANAGEMENT8817-7690-076 1 200312 PP3 360 357 189,600 31 20,391$ UH Manoa UH FACILITIES MANAGEMENT
TOTAL 2,147,400 237,789$ 9800-2426-001 1 200301 J 262 262 156,720 32 17,306$ UH Manoa UH HIMB9800-2426-001 1 200302 J 265 265 130,640 29 15,172$ UH Manoa UH HIMB9800-2426-001 1 200303 J 278 278 146,800 31 17,163$ UH Manoa UH HIMB9800-2426-001 1 200304 J 292 292 149,360 28 17,942$ UH Manoa UH HIMB9800-2426-001 1 200305 J 300 300 171,280 32 20,239$ UH Manoa UH HIMB9800-2426-001 1 200306 J 323 323 192,400 31 22,527$ UH Manoa UH HIMB9800-2426-001 1 200307 J 330 330 190,080 31 21,819$ UH Manoa UH HIMB9800-2426-001 1 200308 J 328 328 181,440 29 20,484$ UH Manoa UH HIMB9800-2426-001 1 200309 J 341 341 196,160 31 21,714$ UH Manoa UH HIMB9800-2426-001 1 200310 J 332 332 204,320 32 22,116$ UH Manoa UH HIMB9800-2426-001 1 200311 J 330 330 185,680 29 20,364$ UH Manoa UH HIMB9800-2426-001 1 200312 J 308 308 170,720 30 18,878$ UH Manoa UH HIMB
TOTAL 2,075,600 235,724$ 8801-5005-075 1 200301 PP3 1,397 1,363 456,000 32 55,046$ UH-Community College LEEWARD COMMUNITY COLLEGE8801-5005-075 1 200302 PP3 1,354 1,277 394,800 28 49,712$ UH-Community College LEEWARD COMMUNITY COLLEGE8801-5005-075 1 200303 PP3 1,354 1,277 518,400 33 61,531$ UH-Community College LEEWARD COMMUNITY COLLEGE8801-5005-075 1 200304 PP3 1,378 1,325 466,800 29 58,653$ UH-Community College LEEWARD COMMUNITY COLLEGE8801-5005-075 1 200305 PP3 1,382 1,334 480,000 29 60,547$ UH-Community College LEEWARD COMMUNITY COLLEGE8801-5005-075 1 200306 PP3 1,363 1,296 475,200 32 60,246$ UH-Community College LEEWARD COMMUNITY COLLEGE8801-5005-075 1 200307 PP3 1,284 1,138 457,200 29 56,719$ UH-Community College LEEWARD COMMUNITY COLLEGE8801-5005-075 1 200308 PP3 1,289 1,147 468,000 30 55,933$ UH-Community College LEEWARD COMMUNITY COLLEGE8801-5005-075 1 200309 PP3 1,373 1,315 516,000 33 60,336$ UH-Community College LEEWARD COMMUNITY COLLEGE8801-5005-075 1 200310 PP3 1,416 1,402 524,400 29 60,978$ UH-Community College LEEWARD COMMUNITY COLLEGE8801-5005-075 1 200311 PP3 1,421 1,421 572,400 32 64,779$ UH-Community College LEEWARD COMMUNITY COLLEGE8801-5005-075 1 200312 PP3 1,366 1,310 495,600 30 57,783$ UH-Community College LEEWARD COMMUNITY COLLEGE
TOTAL 5,824,800 702,264$ 8814-8544-076 1 200301 J3 1,714 1,714 513,000 33 64,766$ UH-Community College UH KAP COMM COLLEGE BUSINESS8814-8544-076 1 200302 J3 1,823 1,823 631,800 30 78,114$ UH-Community College UH KAP COMM COLLEGE BUSINESS8814-8544-076 1 200303 J3 1,838 1,838 630,000 29 79,756$ UH-Community College UH KAP COMM COLLEGE BUSINESS8814-8544-076 1 200304 J3 1,895 1,895 653,400 32 83,694$ UH-Community College UH KAP COMM COLLEGE BUSINESS8814-8544-076 1 200305 J3 1,858 1,858 633,600 29 81,950$ UH-Community College UH KAP COMM COLLEGE BUSINESS

TABLE: STATE LARGE FACILITIES IN OAHU ELECTRICITY BILL HISTORY FOR YEAR 2003 (PROVIDED BY HECO)
ACCTNUM TARCDE REVPER RATESCH BILLDMD KW KWH NBRDAYS TOTAMT DEPARTMENT NAME8814-8544-076 1 200306 J3 1,744 1,744 586,800 30 75,463$ UH-Community College UH KAP COMM COLLEGE BUSINESS8814-8544-076 1 200307 J3 1,838 1,838 615,600 31 77,104$ UH-Community College UH KAP COMM COLLEGE BUSINESS8814-8544-076 1 200308 J3 1,766 1,766 693,000 31 82,794$ UH-Community College UH KAP COMM COLLEGE BUSINESS8814-8544-076 1 200309 J3 2,070 2,070 700,200 29 85,028$ UH-Community College UH KAP COMM COLLEGE BUSINESS8814-8544-076 1 200310 J3 2,047 2,047 802,800 32 94,125$ UH-Community College UH KAP COMM COLLEGE BUSINESS8814-8544-076 1 200311 J3 2,030 2,030 757,800 30 89,436$ UH-Community College UH KAP COMM COLLEGE BUSINESS8814-8544-076 1 200312 J3 1,831 1,831 621,000 29 75,212$ UH-Community College UH KAP COMM COLLEGE BUSINESS
TOTAL 7,839,000 967,444$ 8823-6252-075 1 200301 PP3 1,327 1,244 374,000 32 47,321$ UH-Community College UH HONOLULU COMMUNITY COLLEGE8823-6252-075 1 200302 PP3 1,307 1,204 412,000 31 50,975$ UH-Community College UH HONOLULU COMMUNITY COLLEGE8823-6252-075 1 200303 PP3 1,350 1,290 362,000 28 48,246$ UH-Community College UH HONOLULU COMMUNITY COLLEGE8823-6252-075 1 200304 PP3 1,353 1,296 412,000 31 53,258$ UH-Community College UH HONOLULU COMMUNITY COLLEGE8823-6252-075 1 200305 PP3 1,352 1,294 416,000 31 54,022$ UH-Community College UH HONOLULU COMMUNITY COLLEGE8823-6252-075 1 200306 PP3 1,249 1,088 364,000 29 47,345$ UH-Community College UH HONOLULU COMMUNITY COLLEGE8823-6252-075 1 200307 PP3 1,276 1,142 388,000 31 48,362$ UH-Community College UH HONOLULU COMMUNITY COLLEGE8823-6252-075 1 200308 PP3 1,406 1,402 428,000 31 52,537$ UH-Community College UH HONOLULU COMMUNITY COLLEGE8823-6252-075 1 200309 PP3 1,405 1,400 448,000 29 53,758$ UH-Community College UH HONOLULU COMMUNITY COLLEGE8823-6252-075 1 200310 PP3 1,404 1,404 508,000 33 58,411$ UH-Community College UH HONOLULU COMMUNITY COLLEGE8823-6252-075 1 200311 PP3 1,387 1,370 432,000 30 51,798$ UH-Community College UH HONOLULU COMMUNITY COLLEGE8823-6252-075 1 200312 PP3 1,354 1,304 376,000 31 47,169$ UH-Community College UH HONOLULU COMMUNITY COLLEGE
TOTAL 4,920,000 613,202$ 9500-5803-001 1 200301 PS 928 928 430,800 32 48,843$ UH-Community College SOH WINDWARD COMMUNITY COLLEGE9500-5803-001 1 200302 PS 963 963 406,200 29 47,669$ UH-Community College SOH WINDWARD COMMUNITY COLLEGE9500-5803-001 1 200303 PS 914 866 432,600 31 50,358$ UH-Community College SOH WINDWARD COMMUNITY COLLEGE9500-5803-001 1 200304 PS 933 904 447,000 31 52,885$ UH-Community College SOH WINDWARD COMMUNITY COLLEGE9500-5803-001 1 200305 PS 942 922 436,200 29 52,439$ UH-Community College SOH WINDWARD COMMUNITY COLLEGE9500-5803-001 1 200306 PS 912 860 436,800 31 51,985$ UH-Community College SOH WINDWARD COMMUNITY COLLEGE9500-5803-001 1 200307 PS 926 888 464,400 31 53,277$ UH-Community College SOH WINDWARD COMMUNITY COLLEGE9500-5803-001 1 200308 PS 925 887 436,200 29 49,575$ UH-Community College SOH WINDWARD COMMUNITY COLLEGE9500-5803-001 1 200309 PS 960 957 493,200 31 54,278$ UH-Community College SOH WINDWARD COMMUNITY COLLEGE9500-5803-001 1 200310 PS 1,028 1,028 514,200 32 56,400$ UH-Community College SOH WINDWARD COMMUNITY COLLEGE9500-5803-001 1 200311 PS 1,001 973 481,200 30 53,063$ UH-Community College SOH WINDWARD COMMUNITY COLLEGE9500-5803-001 1 200312 PS 1,003 978 432,600 29 49,201$ UH-Community College SOH WINDWARD COMMUNITY COLLEGE
TOTAL 5,411,400 619,973$

TABLE: STATE LARGE FACILITIES IN OAHU ELECTRICITY BILL HISTORY FOR YEAR 2004 (PROVIDED BY HECO)
ACCTNUM TARCDE REVPER METRNBR RATESCH BILLDMD MDM KWH NBRDAYS TOTAMT DEPARTMENT NAME9600-5614-003 1 200401 441972 PS 2,975 2,551 576,600 31 84,382$ Convention Center SOH CONVENTION CTR AUTHORITY9600-5614-003 1 200402 441972 PS 3,003 2,606 788,400 32 104,918$ Convention Center SOH CONVENTION CTR AUTHORITY9600-5614-003 1 200403 441972 PS 2,983 2,566 768,000 29 103,585$ Convention Center SOH CONVENTION CTR AUTHORITY9600-5614-003 1 200404 441972 PS 2,852 2,304 671,400 30 93,382$ Convention Center SOH CONVENTION CTR AUTHORITY9600-5614-003 1 200405 441972 PS 2,552 1,703 615,000 29 86,077$ Convention Center SOH CONVENTION CTR AUTHORITY9600-5614-003 1 200406 441972 PS 2,670 1,939 662,400 32 91,891$ Convention Center SOH CONVENTION CTR AUTHORITY9600-5614-003 1 200407 441972 PS 3,061 2,721 657,000 30 94,979$ Convention Center SOH CONVENTION CTR AUTHORITY9600-5614-003 1 200408 441972 PS 3,152 2,905 778,800 32 108,359$ Convention Center SOH CONVENTION CTR AUTHORITY9600-5614-003 1 200409 441972 PS 2,294 1,683 575,400 30 82,628$ Convention Center SOH CONVENTION CTR AUTHORITY9600-5614-003 1 200410 441972 PS 2,789 2,673 663,600 29 99,292$ Convention Center SOH CONVENTION CTR AUTHORITY9600-5614-003 1 200411 441972 PS 2,615 2,324 648,000 30 98,752$ Convention Center SOH CONVENTION CTR AUTHORITY9600-5614-003 1 200412 441972 PS 2,392 1,878 489,600 31 80,983$ Convention Center SOH CONVENTION CTR AUTHORITY
TOTAL 7,894,200 1,129,227 8803-9993-076 1 200401 440494 J3 250 250 98,000 31 11,628$ Corrections SOH WAIAWA CORRECT FACILITY8803-9993-076 1 200402 440494 J3 260 260 91,000 28 11,301$ Corrections SOH WAIAWA CORRECT FACILITY8803-9993-076 1 200403 440494 J3 260 260 106,000 32 12,866$ Corrections SOH WAIAWA CORRECT FACILITY8803-9993-076 1 200404 440494 J3 260 260 96,000 30 11,944$ Corrections SOH WAIAWA CORRECT FACILITY8803-9993-076 1 200405 440494 J3 250 250 102,000 30 12,487$ Corrections SOH WAIAWA CORRECT FACILITY8803-9993-076 1 200406 440494 J3 290 290 112,000 31 14,001$ Corrections SOH WAIAWA CORRECT FACILITY8803-9993-076 1 200407 440494 J3 260 260 108,000 31 13,254$ Corrections SOH WAIAWA CORRECT FACILITY8803-9993-076 1 200408 440494 J3 260 260 100,000 29 12,501$ Corrections SOH WAIAWA CORRECT FACILITY8803-9993-076 1 200409 440494 J3 260 260 112,000 32 13,949$ Corrections SOH WAIAWA CORRECT FACILITY8803-9993-076 1 200412 440494 J3 250 250 308,000 90 41,527$ Corrections SOH WAIAWA CORRECT FACILITY
TOTAL 1,233,000 155,458 8823-8291-076 1 200401 441637 PP3 984 950 504,000 29 56,486$ Corrections SOH OCCC8823-8291-076 1 200402 441637 PP3 984 950 556,800 31 61,342$ Corrections SOH OCCC8823-8291-076 1 200403 441637 PP3 965 912 534,000 31 59,804$ Corrections SOH OCCC8823-8291-076 1 200404 441637 PP3 972 926 532,800 30 59,644$ Corrections SOH OCCC8823-8291-076 1 200405 441637 PP3 1,003 989 529,200 29 60,676$ Corrections SOH OCCC8823-8291-076 1 200406 441637 PP3 1,001 984 616,800 33 68,216$ Corrections SOH OCCC8823-8291-076 1 200407 441637 PP3 1,018 1,018 597,600 30 66,606$ Corrections SOH OCCC8823-8291-076 1 200408 441637 PP3 1,018 1,018 648,000 32 72,351$ Corrections SOH OCCC8823-8291-076 1 200409 441637 PP3 1,006 994 604,800 30 70,881$ Corrections SOH OCCC8823-8291-076 1 200411 441637 PP3 1,008 998 1,198,800 61 149,015$ Corrections SOH OCCC8823-8291-076 1 200412 441637 PP3 972 926 526,800 29 69,007$ Corrections SOH OCCC
TOTAL 6,849,600 794,028 8800-6839-077 1 200401 441662 PS5 1,450 1,340 468,000 31 57,920$ DAGS SOH DAGS8800-6839-077 1 200402 441662 PS5 1,520 1,520 556,000 31 68,591$ DAGS SOH DAGS8800-6839-077 1 200403 441662 PS5 1,510 1,500 592,000 30 72,027$ DAGS SOH DAGS8800-6839-077 1 200404 441662 PS5 1,460 1,400 558,000 29 69,024$ DAGS SOH DAGS8800-6839-077 1 200405 441662 PS5 1,450 1,380 666,000 32 78,706$ DAGS SOH DAGS8800-6839-077 1 200406 441662 PS5 1,470 1,420 470,000 29 61,648$ DAGS SOH DAGS8800-6839-077 1 200407 441662 PS5 1,400 1,280 450,000 30 58,695$ DAGS SOH DAGS8800-6839-077 1 200408 441662 PS5 1,470 1,420 478,000 32 62,092$ DAGS SOH DAGS8800-6839-077 1 200409 441662 PS5 1,470 1,420 478,000 30 63,017$ DAGS SOH DAGS8800-6839-077 1 200410 441662 PS5 1,470 1,420 486,000 30 65,971$ DAGS SOH DAGS8800-6839-077 1 200411 441662 PS5 1,430 1,340 508,000 31 70,169$ DAGS SOH DAGS8800-6839-077 1 200412 441662 PS5 1,470 1,420 416,000 30 62,758$ DAGS SOH DAGS
TOTAL 6,126,000 790,618 8819-2839-079 1 200401 486866 J3 590 590 173,000 31 21,838$ DAGS SOH DAGS CENTRAL SERVICES8819-2839-079 1 200402 486866 J3 625 625 196,000 33 24,670$ DAGS SOH DAGS CENTRAL SERVICES8819-2839-079 1 200403 486866 J3 625 625 184,000 31 23,669$ DAGS SOH DAGS CENTRAL SERVICES8819-2839-079 1 200404 486866 J3 625 625 178,000 31 23,033$ DAGS SOH DAGS CENTRAL SERVICES8819-2839-079 1 200405 486866 J3 634 634 180,000 29 23,627$ DAGS SOH DAGS CENTRAL SERVICES8819-2839-079 1 200406 486866 J3 615 615 190,000 32 24,455$ DAGS SOH DAGS CENTRAL SERVICES8819-2839-079 1 200407 486866 J3 623 623 195,000 31 24,994$ DAGS SOH DAGS CENTRAL SERVICES8819-2839-079 1 200408 486866 J3 633 633 195,000 29 25,390$ DAGS SOH DAGS CENTRAL SERVICES8819-2839-079 1 200409 486866 J3 626 626 205,000 30 27,172$ DAGS SOH DAGS CENTRAL SERVICES8819-2839-079 1 200410 486866 J3 623 623 193,000 31 26,761$ DAGS SOH DAGS CENTRAL SERVICES8819-2839-079 1 200411 486866 J3 612 612 190,000 30 27,210$ DAGS SOH DAGS CENTRAL SERVICES8819-2839-079 1 200412 486866 J3 611 611 164,000 28 24,536$ DAGS SOH DAGS CENTRAL SERVICES
TOTAL 2,243,000 297,353 8819-9076-075 1 200401 486828 J 333 333 104,640 32 13,263$ DAGS SOH DAGS8819-9076-075 1 200402 486828 J 339 339 108,000 33 13,797$ DAGS SOH DAGS8819-9076-075 1 200403 486828 J 305 305 96,000 30 12,407$ DAGS SOH DAGS8819-9076-075 1 200404 486828 J 302 302 95,040 31 12,284$ DAGS SOH DAGS8819-9076-075 1 200405 486828 J 310 310 96,960 29 12,704$ DAGS SOH DAGS8819-9076-075 1 200406 486828 J 328 328 107,280 31 13,902$ DAGS SOH DAGS8819-9076-075 1 200407 486828 J 319 319 106,560 31 13,732$ DAGS SOH DAGS8819-9076-075 1 200408 486828 J 343 342 113,760 31 14,850$ DAGS SOH DAGS8819-9076-075 1 200409 486828 J 325 325 106,800 29 14,405$ DAGS SOH DAGS8819-9076-075 1 200410 486828 J 341 341 115,920 32 16,072$ DAGS SOH DAGS8819-9076-075 1 200411 486828 J 349 349 96,480 28 14,353$ DAGS SOH DAGS8819-9076-075 1 200412 486828 J 327 327 100,080 29 14,819$ DAGS SOH DAGS
TOTAL 1,247,520 166,588 8820-4007-075 1 200401 484529 J3 614 614 210,000 33 25,989$ DAGS SOH DAGS8820-4007-075 1 200402 484529 J3 658 658 219,000 33 27,509$ DAGS SOH DAGS8820-4007-075 1 200403 484529 J3 612 612 180,000 28 23,393$ DAGS SOH DAGS8820-4007-075 1 200404 484529 J3 623 623 217,000 32 27,291$ DAGS SOH DAGS8820-4007-075 1 200405 484529 J3 635 635 207,000 30 26,682$ DAGS SOH DAGS8820-4007-075 1 200406 484529 J3 640 640 202,000 30 26,130$ DAGS SOH DAGS8820-4007-075 1 200407 484529 J3 644 644 224,000 32 28,411$ DAGS SOH DAGS8820-4007-075 1 200408 484529 J3 666 666 223,000 30 28,868$ DAGS SOH DAGS8820-4007-075 1 200409 484529 J3 661 661 231,000 32 30,606$ DAGS SOH DAGS8820-4007-075 1 200410 484529 J3 641 641 216,000 29 29,877$ DAGS SOH DAGS8820-4007-075 1 200411 484529 J3 636 636 203,000 29 29,220$ DAGS SOH DAGS8820-4007-075 1 200412 484529 J3 610 610 202,000 29 29,386$ DAGS SOH DAGS
TOTAL 2,534,000 333,361 8820-5318-076 1 200401 486837 PS5 1,417 1,389 612,000 33 71,616$ DAGS SOH DAGS8820-5318-076 1 200402 486837 PS5 1,415 1,384 580,800 30 69,480$ DAGS SOH DAGS8820-5318-076 1 200403 486837 PS5 1,397 1,349 540,600 29 66,256$ DAGS SOH DAGS8820-5318-076 1 200404 486837 PS5 1,403 1,360 607,200 32 72,287$ DAGS SOH DAGS8820-5318-076 1 200405 486837 PS5 1,410 1,375 557,400 29 68,866$ DAGS SOH DAGS8820-5318-076 1 200406 486837 PS5 1,405 1,365 579,000 30 70,547$ DAGS SOH DAGS8820-5318-076 1 200407 486837 PS5 1,409 1,373 637,800 32 75,844$ DAGS SOH DAGS8820-5318-076 1 200408 486837 PS5 1,418 1,391 595,800 30 73,073$ DAGS SOH DAGS8820-5318-076 1 200409 486837 PS5 1,422 1,402 603,000 30 76,136$ DAGS SOH DAGS8820-5318-076 1 200410 486837 PS5 1,392 1,372 600,000 31 78,383$ DAGS SOH DAGS8820-5318-076 1 200411 486837 PS5 1,372 1,343 535,200 29 73,932$ DAGS SOH DAGS8820-5318-076 1 200412 486837 PS5 1,371 1,340 588,600 30 81,088$ DAGS SOH DAGS
TOTAL 7,037,400 877,507 8820-5319-075 1 200401 484505 J 460 460 126,800 33 16,637$ DAGS SOH DAGS8820-5319-075 1 200402 484505 J 451 451 129,600 30 16,977$ DAGS SOH DAGS8820-5319-075 1 200403 484505 J 492 492 118,800 29 16,323$ DAGS SOH DAGS8820-5319-075 1 200404 484505 J 436 436 133,600 32 17,416$ DAGS SOH DAGS8820-5319-075 1 200405 484505 J 462 462 126,400 29 17,095$ DAGS SOH DAGS8820-5319-075 1 200406 484505 J 467 467 139,200 30 18,449$ DAGS SOH DAGS8820-5319-075 1 200407 484505 J 465 465 152,000 32 19,747$ DAGS SOH DAGS8820-5319-075 1 200408 484505 J 484 484 146,400 30 19,535$ DAGS SOH DAGS8820-5319-075 1 200409 484505 J 483 483 147,200 30 20,188$ DAGS SOH DAGS8820-5319-075 1 200410 484505 J 506 506 145,200 31 20,841$ DAGS SOH DAGS8820-5319-075 1 200411 484505 J 466 466 130,800 29 19,462$ DAGS SOH DAGS8820-5319-075 1 200412 484505 J 444 444 135,200 30 20,143$ DAGS SOH DAGS

TABLE: STATE LARGE FACILITIES IN OAHU ELECTRICITY BILL HISTORY FOR YEAR 2004 (PROVIDED BY HECO)
ACCTNUM TARCDE REVPER METRNBR RATESCH BILLDMD MDM KWH NBRDAYS TOTAMT DEPARTMENT NAMETOTAL 1,631,200 222,814
8824-3048-076 1 200401 441750 J 653 653 200,000 31 25,486$ DAGS SOH DAGS8824-3048-076 1 200402 441750 J 676 676 213,200 33 27,269$ DAGS SOH DAGS8824-3048-076 1 200403 441750 J 638 638 200,400 30 25,913$ DAGS SOH DAGS8824-3048-076 1 200404 441750 J 640 640 206,000 32 26,478$ DAGS SOH DAGS8824-3048-076 1 200405 441750 J 702 702 200,800 29 26,803$ DAGS SOH DAGS8824-3048-076 1 200406 441750 J 672 672 202,000 30 26,610$ DAGS SOH DAGS8824-3048-076 1 200407 441750 J 682 682 231,600 33 29,748$ DAGS SOH DAGS8824-3048-076 1 200408 441750 J 675 675 210,400 30 28,003$ DAGS SOH DAGS8824-3048-076 1 200409 441750 J 697 697 221,600 32 30,353$ DAGS SOH DAGS8824-3048-076 1 200410 441750 J 695 695 217,200 30 30,935$ DAGS SOH DAGS8824-3048-076 1 200411 441750 J 684 684 194,800 29 29,102$ DAGS SOH DAGS8824-3048-076 1 200412 441750 J 648 648 204,400 32 30,437$ DAGS SOH DAGS
TOTAL 2,502,400 337,136 8824-4189-078 1 200401 359183 J 482 482 192,240 31 23,548$ DAGS SOH DAGS8824-4189-078 1 200402 359183 J 499 499 222,000 33 26,752$ DAGS SOH DAGS8824-4189-078 1 200403 359183 J 425 425 202,080 30 24,234$ DAGS SOH DAGS8824-4189-078 1 200404 359183 J 425 425 212,640 32 25,214$ DAGS SOH DAGS8824-4189-078 1 200405 359183 J 427 427 197,280 29 24,143$ DAGS SOH DAGS8824-4189-078 1 200406 359183 J 418 418 205,680 30 24,757$ DAGS SOH DAGS8824-4189-078 1 200407 359183 J 509 509 218,640 32 27,047$ DAGS SOH DAGS8824-4189-078 1 200408 359183 J 509 509 216,720 31 27,223$ DAGS SOH DAGS8824-4189-078 1 200409 359183 J 475 475 223,200 32 28,374$ DAGS SOH DAGS8824-4189-078 1 200410 359183 J 432 432 229,200 30 29,627$ DAGS SOH DAGS8824-4189-078 1 200411 359183 J 420 420 215,280 29 28,959$ DAGS SOH DAGS8824-4189-078 1 200412 359183 J 418 418 232,080 32 31,311$ DAGS SOH DAGS
TOTAL 2,567,040 321,188 8824-4781-075 1 200401 441419 J 351 351 112,160 31 14,275$ DAGS SOH DAGS8824-4781-075 1 200402 441419 J 380 380 131,600 33 16,664$ DAGS SOH DAGS8824-4781-075 1 200403 441419 J 365 364 120,800 30 15,563$ DAGS SOH DAGS8824-4781-075 1 200404 441419 J 400 400 128,080 32 16,601$ DAGS SOH DAGS8824-4781-075 1 200405 441419 J 358 358 114,080 29 15,012$ DAGS SOH DAGS8824-4781-075 1 200406 441419 J 348 348 125,040 31 16,053$ DAGS SOH DAGS8824-4781-075 1 200407 441419 J 386 386 123,520 31 16,160$ DAGS SOH DAGS8824-4781-075 1 200408 441419 J 378 378 132,480 31 17,252$ DAGS SOH DAGS8824-4781-075 1 200409 441419 J 375 374 133,200 32 17,842$ DAGS SOH DAGS8824-4781-075 1 200410 441419 J 360 360 121,200 29 16,996$ DAGS SOH DAGS8824-4781-075 1 200411 441419 J 360 360 116,880 29 16,996$ DAGS SOH DAGS8824-4781-075 1 200412 441419 J 383 383 112,720 29 16,943$ DAGS SOH DAGS
TOTAL 1,471,760 196,359 8824-8557-076 1 200401 359551 J 1,120 1,120 313,200 31 40,572$ DAGS SOH DAGS8824-8557-076 1 200402 359551 J 1,112 1,112 366,000 33 46,352$ DAGS SOH DAGS8824-8557-076 1 200403 359551 J 1,088 1,088 334,800 30 43,345$ DAGS SOH DAGS8824-8557-076 1 200404 359551 J 1,096 1,096 360,000 32 46,048$ DAGS SOH DAGS8824-8557-076 1 200405 359551 J 1,136 1,136 351,600 29 46,082$ DAGS SOH DAGS8824-8557-076 1 200406 359551 J 1,132 1,132 377,200 31 48,626$ DAGS SOH DAGS8824-8557-076 1 200407 359551 J 1,148 1,148 354,400 31 46,252$ DAGS SOH DAGS8824-8557-076 1 200408 359551 J 1,148 1,148 370,800 31 48,593$ DAGS SOH DAGS8824-8557-076 1 200409 359551 J 1,128 1,128 367,600 32 49,560$ DAGS SOH DAGS8824-8557-076 1 200410 359551 J 1,112 1,112 355,600 29 49,914$ DAGS SOH DAGS8824-8557-076 1 200411 359551 J 1,096 1,096 312,400 29 46,113$ DAGS SOH DAGS8824-8557-076 1 200412 359551 J 1,104 1,104 311,200 29 46,756$ DAGS SOH DAGS
TOTAL 4,174,800 558,214 8824-8619-075 1 200401 333056 J5 330 255 71,500 59 11,732$ DAGS SOH DAGS8824-8619-075 1 200403 333056 J5 326 55 12,000 33 3,312$ DAGS SOH DAGS8824-8619-075 1 200404 333056 J5 435 70 9,500 62 5,151$ DAGS SOH DAGS8824-8619-075 1 200405 333056 J5 440 10 500 29 2,550$ DAGS SOH DAGSCLOSED8824-8619-077 1 200409 333056 J5 25 20 13,500 63 1,981$ DAGS SOH DAGS
TOTAL 107,000 24,725 9800-1977-002 1 200401 441420 J 830 830 242,400 33 30,667$ DAGS SOH DAGS9800-1977-002 1 200402 441420 J 805 805 226,000 29 29,613$ DAGS SOH DAGS9800-1977-002 1 200403 441420 J 809 809 250,800 31 32,301$ DAGS SOH DAGS9800-1977-002 1 200404 441420 J 804 804 253,600 33 32,806$ DAGS SOH DAGS9800-1977-002 1 200405 441420 J 860 860 238,000 29 31,669$ DAGS SOH DAGS9800-1977-002 1 200406 441420 J 856 856 246,000 29 32,839$ DAGS SOH DAGS9800-1977-002 1 200407 441420 J 852 852 270,400 33 35,240$ DAGS SOH DAGS9800-1977-002 1 200408 441420 J 852 852 244,800 28 32,598$ DAGS SOH DAGS9800-1977-002 1 200409 441420 J 857 857 269,600 30 35,807$ DAGS SOH DAGS9800-1977-002 1 200410 441420 J 850 850 298,000 33 40,265$ DAGS SOH DAGS9800-1977-002 1 200411 441420 J 858 858 275,200 30 39,048$ DAGS SOH DAGS9800-1977-002 1 200412 441420 J 843 843 235,600 28 35,254$ DAGS SOH DAGS
TOTAL 3,050,400 408,107 0000-3507-002 1 200401 493935 J 337 337 100,200 29 13,021$ Dept of Defense KAPALAMA MILITARY RESERVATION0000-3507-002 1 200402 493935 J 347 347 119,400 33 15,121$ Dept of Defense KAPALAMA MILITARY RESERVATION0000-3507-002 1 200403 493935 J 338 338 108,000 30 14,006$ Dept of Defense KAPALAMA MILITARY RESERVATION0000-3507-002 1 200404 493935 J 349 349 111,000 30 14,363$ Dept of Defense KAPALAMA MILITARY RESERVATION0000-3507-002 1 200405 493935 J 367 367 109,200 28 14,537$ Dept of Defense KAPALAMA MILITARY RESERVATION0000-3507-002 1 200406 493935 J 371 371 120,600 32 15,703$ Dept of Defense KAPALAMA MILITARY RESERVATION0000-3507-002 1 200407 493935 J 389 389 121,800 30 15,949$ Dept of Defense KAPALAMA MILITARY RESERVATION0000-3507-002 1 200408 493935 J 382 382 130,800 32 17,071$ Dept of Defense KAPALAMA MILITARY RESERVATION0000-3507-002 1 200409 493935 J 403 403 123,600 30 17,024$ Dept of Defense KAPALAMA MILITARY RESERVATION0000-3507-002 1 200410 493935 J 391 391 126,000 30 17,778$ Dept of Defense KAPALAMA MILITARY RESERVATION0000-3507-002 1 200411 493935 J 383 383 115,200 31 16,989$ Dept of Defense KAPALAMA MILITARY RESERVATION0000-3507-002 1 200412 493935 J 354 354 105,600 30 15,831$ Dept of Defense KAPALAMA MILITARY RESERVATION
TOTAL 1,391,400 187,393 8811-6162-076 1 200401 494955 J 254 254 101,920 33 12,416$ Dept of Defense SOH DEPT OF DEFENSE8811-6162-076 1 200402 494955 J 267 267 101,360 30 12,648$ Dept of Defense SOH DEPT OF DEFENSE8811-6162-076 1 200403 494955 J 269 269 96,160 29 12,213$ Dept of Defense SOH DEPT OF DEFENSE8811-6162-076 1 200404 494955 J 269 269 104,800 32 13,147$ Dept of Defense SOH DEPT OF DEFENSE8811-6162-076 1 200405 494955 J 272 272 103,680 29 13,170$ Dept of Defense SOH DEPT OF DEFENSE8811-6162-076 1 200406 494955 J 284 284 114,960 30 14,479$ Dept of Defense SOH DEPT OF DEFENSE8811-6162-076 1 200407 488053 J 284 284 123,680 32 15,270$ Dept of Defense SOH DEPT OF DEFENSE8811-6162-076 1 200408 488053 J 282 282 116,640 29 14,691$ Dept of Defense SOH DEPT OF DEFENSE8811-6162-076 1 200409 488053 J 292 292 119,600 31 15,489$ Dept of Defense SOH DEPT OF DEFENSE8811-6162-076 1 200410 488053 J 278 278 115,920 31 15,505$ Dept of Defense SOH DEPT OF DEFENSE8811-6162-076 1 200411 488053 J 283 283 107,680 30 15,135$ Dept of Defense SOH DEPT OF DEFENSE8811-6162-076 1 200412 488053 J 268 268 98,800 29 14,254$ Dept of Defense SOH DEPT OF DEFENSE
TOTAL 1,305,200 168,418 8808-7404-076 1 200401 441721 PP3 659 600 370,800 33 40,188$ Dept of Health SOH DEPT OF HEALTH8808-7404-076 1 200402 441721 PP3 701 683 345,600 30 39,362$ Dept of Health SOH DEPT OF HEALTH8808-7404-076 1 200403 441721 PP3 716 713 366,000 32 41,683$ Dept of Health SOH DEPT OF HEALTH8808-7404-076 1 200404 441721 PP3 681 643 352,800 30 40,266$ Dept of Health SOH DEPT OF HEALTH8808-7404-076 1 200405 441721 PP3 715 710 348,000 29 40,531$ Dept of Health SOH DEPT OF HEALTH8808-7404-076 1 200406 441721 PP3 715 710 421,200 32 47,322$ Dept of Health SOH DEPT OF HEALTH8808-7404-076 1 200407 441721 PP3 708 697 406,800 30 45,797$ Dept of Health SOH DEPT OF HEALTH8808-7404-076 1 200408 441721 PP3 743 743 404,400 29 46,319$ Dept of Health SOH DEPT OF HEALTH8808-7404-076 1 200409 441721 PP3 740 737 454,800 33 52,273$ Dept of Health SOH DEPT OF HEALTH8808-7404-076 1 200410 441721 PP3 733 724 439,200 33 52,906$ Dept of Health SOH DEPT OF HEALTH8808-7404-076 1 200411 441721 PP3 730 716 391,200 31 50,000$ Dept of Health SOH DEPT OF HEALTH8808-7404-076 1 200412 441721 PP3 730 716 331,200 27 44,789$ Dept of Health SOH DEPT OF HEALTH
TOTAL 4,632,000 541,435 8808-7405-076 1 200401 441724 J3 254 251 110,200 33 12,863$ Dept of Health SOH DEPT OF HEALTH8808-7405-076 1 200402 441724 J3 280 280 108,400 30 13,239$ Dept of Health SOH DEPT OF HEALTH

TABLE: STATE LARGE FACILITIES IN OAHU ELECTRICITY BILL HISTORY FOR YEAR 2004 (PROVIDED BY HECO)
ACCTNUM TARCDE REVPER METRNBR RATESCH BILLDMD MDM KWH NBRDAYS TOTAMT DEPARTMENT NAME8808-7405-076 1 200403 441724 J3 285 285 117,600 32 14,278$ Dept of Health SOH DEPT OF HEALTH8808-7405-076 1 200404 441724 J3 278 278 106,800 30 13,198$ Dept of Health SOH DEPT OF HEALTH8808-7405-076 1 200405 441724 J3 290 290 109,600 29 13,665$ Dept of Health SOH DEPT OF HEALTH8808-7405-076 1 200406 441724 J3 289 289 121,600 32 14,922$ Dept of Health SOH DEPT OF HEALTH8808-7405-076 1 200407 441724 J3 295 295 120,600 30 14,845$ Dept of Health SOH DEPT OF HEALTH8808-7405-076 1 200408 441724 J3 288 288 120,000 29 14,804$ Dept of Health SOH DEPT OF HEALTH8808-7405-076 1 200409 441724 J3 299 299 137,200 33 16,991$ Dept of Health SOH DEPT OF HEALTH8808-7405-076 1 200410 441724 J3 288 288 132,800 33 17,099$ Dept of Health SOH DEPT OF HEALTH8808-7405-076 1 200411 441724 J3 279 279 117,400 31 15,984$ Dept of Health SOH DEPT OF HEALTH8808-7405-076 1 200412 441724 J3 267 267 92,800 27 13,333$ Dept of Health SOH DEPT OF HEALTH
TOTAL 1,395,000 175,222 8813-6833-076 1 200401 314114 J 444 444 117,840 33 15,505$ Dept of Health SOH DEPT OF HEALTH8813-6833-076 1 200402 314114 J 458 458 132,960 31 17,387$ Dept of Health SOH DEPT OF HEALTH8813-6833-076 1 200403 314114 J 468 468 116,400 29 15,873$ Dept of Health SOH DEPT OF HEALTH8813-6833-076 1 200404 314114 J 468 468 126,720 32 16,971$ Dept of Health SOH DEPT OF HEALTH8813-6833-076 1 200405 314114 J 468 468 121,680 28 16,600$ Dept of Health SOH DEPT OF HEALTH8813-6833-076 1 200406 314114 J 502 502 138,240 33 18,639$ Dept of Health SOH DEPT OF HEALTH8813-6833-076 1 200407 314114 J 470 470 142,320 30 18,773$ Dept of Health SOH DEPT OF HEALTH8813-6833-076 1 200408 314114 J 478 478 142,080 29 18,978$ Dept of Health SOH DEPT OF HEALTH8813-6833-076 1 200409 314114 J 502 502 139,440 32 19,370$ Dept of Health SOH DEPT OF HEALTH8813-6833-076 1 200410 314114 J 480 480 144,480 30 20,454$ Dept of Health SOH DEPT OF HEALTH8813-6833-076 1 200411 314114 J 502 502 126,960 29 19,181$ Dept of Health SOH DEPT OF HEALTH8813-6833-076 1 200412 314114 J 444 444 129,360 28 19,403$ Dept of Health SOH DEPT OF HEALTH
TOTAL 1,578,480 217,135 8813-6841-075 1 200401 441759 PP3 675 634 254,400 33 30,392$ Dept of Health SOH DEPT OF HEALTH8813-6841-075 1 200402 441759 PP3 670 623 262,000 31 31,455$ Dept of Health SOH DEPT OF HEALTH8813-6841-075 1 200403 441759 PP3 677 637 236,800 29 29,482$ Dept of Health SOH DEPT OF HEALTH8813-6841-075 1 200404 441759 PP3 691 664 265,600 32 32,316$ Dept of Health SOH DEPT OF HEALTH8813-6841-075 1 200405 441759 PP3 689 660 247,600 28 30,958$ Dept of Health SOH DEPT OF HEALTH8813-6841-075 1 200406 441759 PP3 700 684 298,000 33 35,748$ Dept of Health SOH DEPT OF HEALTH8813-6841-075 1 200407 441759 PP3 709 700 284,400 30 34,515$ Dept of Health SOH DEPT OF HEALTH8813-6841-075 1 200408 441759 PP3 715 713 277,600 29 34,302$ Dept of Health SOH DEPT OF HEALTH8813-6841-075 1 200409 441759 PP3 730 730 307,200 32 38,280$ Dept of Health SOH DEPT OF HEALTH8813-6841-075 1 200410 441759 PP3 721 712 289,600 30 37,921$ Dept of Health SOH DEPT OF HEALTH8813-6841-075 1 200411 441759 PP3 708 687 259,600 29 35,876$ Dept of Health SOH DEPT OF HEALTH
TOTAL 2,982,800 371,246 8821-2602-075 1 200401 485646 PP3 423 403 205,200 32 23,262$ Dept of Health SOH MALUHIA HOSP8821-2602-075 1 200402 485646 PP3 419 395 205,200 31 23,389$ Dept of Health SOH MALUHIA HOSP8821-2602-075 1 200403 485646 PP3 418 392 198,000 31 22,989$ Dept of Health SOH MALUHIA HOSP8821-2602-075 1 200404 485646 PP3 415 386 196,800 30 22,827$ Dept of Health SOH MALUHIA HOSP8821-2602-075 1 200405 485646 PP3 432 421 195,600 29 23,298$ Dept of Health SOH MALUHIA HOSP8821-2602-075 1 200406 485646 PP3 419 396 214,800 32 24,745$ Dept of Health SOH MALUHIA HOSP8821-2602-075 1 200407 485646 PP3 425 408 206,400 30 24,050$ Dept of Health SOH MALUHIA HOSP8821-2602-075 1 200408 485646 PP3 435 427 205,200 29 24,412$ Dept of Health SOH MALUHIA HOSP8821-2602-075 1 200409 485646 PP3 444 444 229,200 32 27,623$ Dept of Health SOH MALUHIA HOSP8821-2602-075 1 200410 485646 PP3 442 439 208,800 29 26,692$ Dept of Health SOH MALUHIA HOSP8821-2602-075 1 200411 485646 PP3 434 425 201,600 29 26,748$ Dept of Health SOH MALUHIA HOSP8821-2602-075 1 200412 485646 PP3 425 407 219,600 33 29,018$ Dept of Health SOH MALUHIA HOSP
TOTAL 2,486,400 299,054 9300-8875-002 1 200401 441977 PS 1,157 1,039 552,000 31 61,617$ Dept of Health SOH DEPT OF HEALTH9300-8875-002 1 200402 441977 PS 1,137 1,000 548,400 31 63,186$ Dept of Health SOH DEPT OF HEALTH9300-8875-002 1 200403 441977 PS 1,171 1,069 547,800 30 63,759$ Dept of Health SOH DEPT OF HEALTH9300-8875-002 1 200404 441977 PS 1,138 1,003 526,800 30 62,074$ Dept of Health SOH DEPT OF HEALTH9300-8875-002 1 200405 441977 PS 1,153 1,033 570,600 32 66,156$ Dept of Health SOH DEPT OF HEALTH9300-8875-002 1 200406 441977 PS 1,182 1,090 543,600 29 64,995$ Dept of Health SOH DEPT OF HEALTH9300-8875-002 1 200407 441977 PS 1,156 1,037 575,400 30 67,155$ Dept of Health SOH DEPT OF HEALTH9300-8875-002 1 200408 441977 PS 1,175 1,094 601,800 31 69,870$ Dept of Health SOH DEPT OF HEALTH9300-8875-002 1 200409 441977 PS 1,243 1,243 603,600 30 71,982$ Dept of Health SOH DEPT OF HEALTH9300-8875-002 1 200410 441977 PS 1,199 1,155 594,000 30 73,270$ Dept of Health SOH DEPT OF HEALTH9300-8875-002 1 200411 441977 PS 1,176 1,109 612,600 31 77,718$ Dept of Health SOH DEPT OF HEALTH9300-8875-002 1 200412 441977 PS 1,161 1,080 568,800 30 75,623$ Dept of Health SOH DEPT OF HEALTH
6,845,400 817,406 8823-3657-076 1 200401 441847 J 265 264 97,680 30 12,240$ Dept of Public Safety SOH-DEPT OF PUBLIC SAFETY8823-3657-076 1 200402 441847 J 200 186 108,000 32 12,541$ Dept of Public Safety SOH-DEPT OF PUBLIC SAFETY8823-3657-076 1 200403 441847 J 200 181 94,080 29 11,361$ Dept of Public Safety SOH-DEPT OF PUBLIC SAFETY8823-3657-076 1 200404 441847 J 200 198 102,480 30 12,126$ Dept of Public Safety SOH-DEPT OF PUBLIC SAFETY8823-3657-076 1 200405 441847 J 210 210 106,560 29 12,822$ Dept of Public Safety SOH-DEPT OF PUBLIC SAFETY8823-3657-076 1 200406 441847 J 206 206 124,080 32 14,357$ Dept of Public Safety SOH-DEPT OF PUBLIC SAFETY8823-3657-076 1 200407 441847 J 212 212 121,200 30 14,143$ Dept of Public Safety SOH-DEPT OF PUBLIC SAFETY8823-3657-076 1 200408 441847 J 212 212 131,280 32 15,343$ Dept of Public Safety SOH-DEPT OF PUBLIC SAFETY8823-3657-076 1 200409 441847 J 210 210 126,240 30 15,396$ Dept of Public Safety SOH-DEPT OF PUBLIC SAFETY8823-3657-076 1 200410 441847 J 208 208 116,400 29 14,923$ Dept of Public Safety SOH-DEPT OF PUBLIC SAFETY8823-3657-076 1 200411 441847 J 205 205 119,520 32 15,740$ Dept of Public Safety SOH-DEPT OF PUBLIC SAFETY8823-3657-076 1 200412 441847 J 198 196 107,760 30 14,633$ Dept of Public Safety SOH-DEPT OF PUBLIC SAFETY
TOTAL 1,355,280 165,624 8823-3672-076 1 200401 441645 PS 862 821 393,600 30 45,801$ Dept of Public Safety SOH-DEPT OF PUBLIC SAFETY8823-3672-076 1 200402 441645 PS 886 869 434,400 32 49,878$ Dept of Public Safety SOH-DEPT OF PUBLIC SAFETY8823-3672-076 1 200403 441645 PS 886 869 403,800 30 47,668$ Dept of Public Safety SOH-DEPT OF PUBLIC SAFETY8823-3672-076 1 200404 441645 PS 907 907 400,800 29 47,514$ Dept of Public Safety SOH-DEPT OF PUBLIC SAFETY8823-3672-076 1 200405 441645 PS 881 854 416,400 29 49,394$ Dept of Public Safety SOH-DEPT OF PUBLIC SAFETY8823-3672-076 1 200406 441645 PS 882 857 452,400 32 52,396$ Dept of Public Safety SOH-DEPT OF PUBLIC SAFETY8823-3672-076 1 200407 441645 PS 874 840 451,200 31 52,155$ Dept of Public Safety SOH-DEPT OF PUBLIC SAFETY8823-3672-076 1 200408 441645 PS 900 893 454,200 31 53,625$ Dept of Public Safety SOH-DEPT OF PUBLIC SAFETY8823-3672-076 1 200409 441645 PS 886 864 454,800 31 55,505$ Dept of Public Safety SOH-DEPT OF PUBLIC SAFETY8823-3672-076 1 200410 441645 PS 876 845 451,200 32 57,282$ Dept of Public Safety SOH-DEPT OF PUBLIC SAFETY8823-3672-076 1 200411 441645 PS 862 816 397,800 29 53,429$ Dept of Public Safety SOH-DEPT OF PUBLIC SAFETY8823-3672-076 1 200412 441645 PS 871 835 386,400 29 53,078$ Dept of Public Safety SOH-DEPT OF PUBLIC SAFETY
TOTAL 5,097,000 617,725 9300-5247-002 1 200401 417468 J 275 275 151,440 33 17,210$ Dept of Public Safety SOH DEPT OF PUBLIC SAFETY9300-5247-002 1 200402 417468 J 275 275 137,840 30 16,231$ Dept of Public Safety SOH DEPT OF PUBLIC SAFETY9300-5247-002 1 200403 417468 J 258 258 125,040 28 14,934$ Dept of Public Safety SOH DEPT OF PUBLIC SAFETY9300-5247-002 1 200404 417468 J 261 261 148,800 33 17,245$ Dept of Public Safety SOH DEPT OF PUBLIC SAFETY9300-5247-002 1 200405 417468 J 264 264 126,960 28 15,376$ Dept of Public Safety SOH DEPT OF PUBLIC SAFETY9300-5247-002 1 200406 417468 J 266 266 160,480 32 18,618$ Dept of Public Safety SOH DEPT OF PUBLIC SAFETY9300-5247-002 1 200407 417468 J 278 278 143,840 28 17,133$ Dept of Public Safety SOH DEPT OF PUBLIC SAFETY9300-5247-002 1 200408 417468 J 295 295 171,120 32 20,107$ Dept of Public Safety SOH DEPT OF PUBLIC SAFETY9300-5247-002 1 200409 417468 J 282 282 160,960 30 19,493$ Dept of Public Safety SOH DEPT OF PUBLIC SAFETY9300-5247-002 1 200410 417468 J 283 283 177,360 33 22,018$ Dept of Public Safety SOH DEPT OF PUBLIC SAFETY9300-5247-002 1 200411 417468 J 284 284 156,240 30 20,568$ Dept of Public Safety SOH DEPT OF PUBLIC SAFETY9300-5247-002 1 200412 417468 J 257 257 121,040 27 16,735$ Dept of Public Safety SOH DEPT OF PUBLIC SAFETY
TOTAL 1,781,120 215,668 0000-3209-004 1 200401 484491 J 899 888 302,800 33 37,739$ DOE SOH DEPARTMENT OF EDUCATION0000-3209-004 1 200402 484491 J 899 743 266,800 29 34,924$ DOE SOH DEPARTMENT OF EDUCATION0000-3209-004 1 200403 484491 J 899 769 296,000 30 38,019$ DOE SOH DEPARTMENT OF EDUCATION0000-3209-004 1 200404 484491 J 899 736 266,000 31 35,255$ DOE SOH DEPARTMENT OF EDUCATION0000-3209-004 1 200405 484491 J 839 766 289,200 30 37,157$ DOE SOH DEPARTMENT OF EDUCATION0000-3209-004 1 200406 484491 J 979 979 301,200 29 40,020$ DOE SOH DEPARTMENT OF EDUCATION0000-3209-004 1 200407 484491 J 825 736 288,400 33 37,337$ DOE SOH DEPARTMENT OF EDUCATION0000-3209-004 1 200408 484491 J 1,082 1,082 281,600 29 38,682$ DOE SOH DEPARTMENT OF EDUCATION0000-3209-004 1 200409 484491 J 1,036 1,036 342,400 30 45,520$ DOE SOH DEPARTMENT OF EDUCATION0000-3209-004 1 200410 484491 J 1,091 1,091 349,200 32 48,405$ DOE SOH DEPARTMENT OF EDUCATION0000-3209-004 1 200411 484491 J 1,063 1,063 317,200 30 45,959$ DOE SOH DEPARTMENT OF EDUCATION0000-3209-004 1 200412 484491 J 942 942 308,400 29 45,302$ DOE SOH DEPARTMENT OF EDUCATION

TABLE: STATE LARGE FACILITIES IN OAHU ELECTRICITY BILL HISTORY FOR YEAR 2004 (PROVIDED BY HECO)
ACCTNUM TARCDE REVPER METRNBR RATESCH BILLDMD MDM KWH NBRDAYS TOTAMT DEPARTMENT NAME3,609,200 484,320
0100-2579-004 1 200401 488472 J 409 409 73,440 33 10,659$ DOE SOH DEPARTMENT OF EDUCATION0100-2579-004 1 200402 488472 J 431 431 100,800 29 13,888$ DOE SOH DEPARTMENT OF EDUCATION0100-2579-004 1 200403 488472 J 439 439 111,840 32 15,161$ DOE SOH DEPARTMENT OF EDUCATION0100-2579-004 1 200404 488472 J 422 422 89,040 30 12,731$ DOE SOH DEPARTMENT OF EDUCATION0100-2579-004 1 200405 488472 J 429 429 106,080 29 14,620$ DOE SOH DEPARTMENT OF EDUCATION0100-2579-004 1 200406 488472 J 449 449 111,600 32 15,460$ DOE SOH DEPARTMENT OF EDUCATION0100-2579-004 1 200407 488472 J 356 356 86,400 30 12,050$ DOE SOH DEPARTMENT OF EDUCATION0100-2579-004 1 200408 488472 J 433 433 101,040 29 14,266$ DOE SOH DEPARTMENT OF EDUCATION0100-2579-004 1 200409 488472 J 452 452 116,160 33 16,367$ DOE SOH DEPARTMENT OF EDUCATION0100-2579-004 1 200410 488472 J 460 460 106,800 30 15,915$ DOE SOH DEPARTMENT OF EDUCATION0100-2579-004 1 200411 488472 J 457 457 106,080 29 16,276$ DOE SOH DEPARTMENT OF EDUCATION0100-2579-004 1 200412 488472 J 435 435 100,800 31 15,850$ DOE SOH DEPARTMENT OF EDUCATION
TOTAL 1,210,080 173,242 0100-2966-002 1 200401 488040 J 573 573 148,800 32 19,498$ DOE SOH DEPARTMENT OF EDUCATION0100-2966-002 1 200402 488040 J 564 564 146,160 28 19,625$ DOE SOH DEPARTMENT OF EDUCATION0100-2966-002 1 200403 488040 J 576 576 178,800 30 23,132$ DOE SOH DEPARTMENT OF EDUCATION0100-2966-002 1 200404 488040 J 567 567 155,040 31 20,812$ DOE SOH DEPARTMENT OF EDUCATION0100-2966-002 1 200405 488040 J 572 572 169,680 30 22,355$ DOE SOH DEPARTMENT OF EDUCATION0100-2966-002 1 200406 488040 J 601 601 182,400 30 24,219$ DOE SOH DEPARTMENT OF EDUCATION0100-2966-002 1 200407 488040 J 583 583 143,040 30 19,881$ DOE SOH DEPARTMENT OF EDUCATION0100-2966-002 1 200408 488040 J 590 590 148,800 32 20,589$ DOE SOH DEPARTMENT OF EDUCATION0100-2966-002 1 200409 488040 J 599 599 202,080 30 26,603$ DOE SOH DEPARTMENT OF EDUCATION0100-2966-002 1 200410 488040 J 615 615 202,320 32 27,724$ DOE SOH DEPARTMENT OF EDUCATION0100-2966-002 1 200411 488040 J 617 617 194,640 30 27,778$ DOE SOH DEPARTMENT OF EDUCATION0100-2966-002 1 200412 488040 J 610 610 177,360 29 26,452$ DOE SOH DEPARTMENT OF EDUCATION
TOTAL 2,049,120 278,670 8801-3223-078 1 200401 488053 J3 558 558 140,400 31 17,989$ DOE SOH DEPARTMENT OF EDUCATION8801-3223-078 1 200402 488053 J3 558 558 129,000 31 17,385$ DOE SOH DEPARTMENT OF EDUCATION8801-3223-078 1 200403 488053 J3 558 558 144,600 30 19,011$ DOE SOH DEPARTMENT OF EDUCATION8801-3223-078 1 200404 488053 J3 558 558 114,600 30 16,119$ DOE SOH DEPARTMENT OF EDUCATION8801-3223-078 1 200405 488053 J3 558 558 139,200 32 18,620$ DOE SOH DEPARTMENT OF EDUCATION8801-3223-078 1 200406 488053 J3 558 558 134,400 29 18,357$ DOE SOH DEPARTMENT OF EDUCATION8801-3223-078 1 200407 488053 J3 558 558 109,200 30 15,672$ DOE SOH DEPARTMENT OF EDUCATION8801-3223-078 1 200408 467276 J3 514 503 121,200 31 16,605$ DOE SOH DEPARTMENT OF EDUCATION8801-3223-078 1 200409 467276 J3 536 536 154,200 30 20,458$ DOE SOH DEPARTMENT OF EDUCATION8801-3223-078 1 200410 467276 J3 506 506 162,600 30 21,824$ DOE SOH DEPARTMENT OF EDUCATION8801-3223-078 1 200411 467276 J3 527 527 146,400 31 20,926$ DOE SOH DEPARTMENT OF EDUCATION8801-3223-078 1 200412 467276 J3 527 527 140,400 30 20,858$ DOE SOH DEPARTMENT OF EDUCATION
TOTAL 1,636,200 223,823 8803-0106-077 1 200401 417841 J3 501 501 105,000 33 14,347$ DOE SOH DEPARTMENT OF EDUCATION8803-0106-077 1 200402 417841 J3 501 501 111,000 29 15,244$ DOE SOH DEPARTMENT OF EDUCATION8803-0106-077 1 200403 417841 J3 509 509 136,200 32 17,920$ DOE SOH DEPARTMENT OF EDUCATION8803-0106-077 1 200404 417841 J3 484 484 102,600 29 14,430$ DOE SOH DEPARTMENT OF EDUCATION8803-0106-077 1 200405 417841 J3 518 518 130,200 30 17,537$ DOE SOH DEPARTMENT OF EDUCATION8803-0106-077 1 200406 417841 J3 530 530 132,000 29 18,001$ DOE SOH DEPARTMENT OF EDUCATION8803-0106-077 1 200407 498307 J3 486 486 106,200 33 14,942$ DOE SOH DEPARTMENT OF EDUCATION8803-0106-077 1 200408 498307 J3 536 536 103,800 29 15,055$ DOE SOH DEPARTMENT OF EDUCATION8803-0106-077 1 200409 498307 J3 553 553 148,800 33 20,222$ DOE SOH DEPARTMENT OF EDUCATION8803-0106-077 1 200410 498307 J3 562 562 144,600 29 20,498$ DOE SOH DEPARTMENT OF EDUCATION8803-0106-077 1 200411 498307 J3 551 551 136,200 30 20,116$ DOE SOH DEPARTMENT OF EDUCATION8803-0106-077 1 200412 498307 J3 537 537 125,400 31 19,283$ DOE SOH DEPARTMENT OF EDUCATION
TOTAL 1,482,000 207,595 8803-9117-078 1 200401 486912 J 354 354 87,120 30 11,663$ DOE SOH DEPARTMENT OF EDUCATION8803-9117-078 1 200402 486912 J 355 354 99,600 29 13,199$ DOE SOH DEPARTMENT OF EDUCATION8803-9117-078 1 200403 486912 J 364 364 114,720 32 14,901$ DOE SOH DEPARTMENT OF EDUCATION8803-9117-078 1 200404 486912 J 372 372 92,640 29 12,761$ DOE SOH DEPARTMENT OF EDUCATION8803-9117-078 1 200405 486912 J 379 379 111,600 30 14,808$ DOE SOH DEPARTMENT OF EDUCATION8803-9117-078 1 200406 486912 J 403 402 124,320 32 16,489$ DOE SOH DEPARTMENT OF EDUCATION8803-9117-078 1 200407 486912 J 333 333 99,840 31 13,314$ DOE SOH DEPARTMENT OF EDUCATION8803-9117-078 1 200408 486912 J 387 387 115,440 31 15,436$ DOE SOH DEPARTMENT OF EDUCATION8803-9117-078 1 200409 486912 J 394 394 122,640 30 16,546$ DOE SOH DEPARTMENT OF EDUCATION8803-9117-078 1 200410 486912 J 389 389 108,480 29 15,470$ DOE SOH DEPARTMENT OF EDUCATION8803-9117-078 1 200411 486912 J 418 418 125,280 32 18,179$ DOE SOH DEPARTMENT OF EDUCATION8803-9117-078 1 200412 486912 J 402 402 111,600 29 16,873$ DOE SOH DEPARTMENT OF EDUCATION
TOTAL 1,313,280 179,640 8806-1340-077 1 200401 484482 J3 533 512 78,000 31 11,543$ DOE SOH DEPARTMENT OF EDUCATION8806-1340-077 1 200402 484482 J3 534 534 150,000 31 19,370$ DOE SOH DEPARTMENT OF EDUCATION8806-1340-077 1 200404 498305 J3 586 586 261,600 59 35,487$ DOE SOH DEPARTMENT OF EDUCATION8806-1340-077 1 200405 498305 J3 571 571 157,200 32 20,670$ DOE SOH DEPARTMENT OF EDUCATION8806-1340-077 1 200406 498305 J3 700 700 150,000 29 21,125$ DOE SOH DEPARTMENT OF EDUCATION8806-1340-077 1 200407 498305 J3 548 548 109,200 31 15,664$ DOE SOH DEPARTMENT OF EDUCATION8806-1340-077 1 200408 498305 J3 572 572 126,000 31 17,640$ DOE SOH DEPARTMENT OF EDUCATION8806-1340-077 1 200409 498305 J3 654 654 182,400 31 24,594$ DOE SOH DEPARTMENT OF EDUCATION8806-1340-077 1 200410 498305 J3 695 695 163,200 29 23,616$ DOE SOH DEPARTMENT OF EDUCATION8806-1340-077 1 200411 498305 J3 629 629 166,800 31 24,259$ DOE SOH DEPARTMENT OF EDUCATION8806-1340-077 1 200412 498305 J3 604 604 151,200 30 22,851$ DOE SOH DEPARTMENT OF EDUCATION
TOTAL 1,695,600 236,818 8806-3539-079 1 200401 491770 J 103 103 4,080 33 1,105$ DOE SOH DEPARTMENT OF EDUCATION8806-3539-079 1 200402 491770 J 92 92 5,040 28 1,166$ DOE SOH DEPARTMENT OF EDUCATION8806-3539-079 1 200403 491770 J 88 88 6,160 31 1,275$ DOE SOH DEPARTMENT OF EDUCATION8806-3539-079 1 200404 491770 J 88 88 4,560 32 1,094$ DOE SOH DEPARTMENT OF EDUCATION8806-3539-079 1 200405 491770 J 93 93 5,200 29 1,200$ DOE SOH DEPARTMENT OF EDUCATION8806-3539-079 1 200406 491770 J 91 91 5,680 30 1,248$ DOE SOH DEPARTMENT OF EDUCATION8806-3539-079 1 200407 491770 J 77 59 3,600 32 925$ DOE SOH DEPARTMENT OF EDUCATION8806-3539-079 1 200408 491770 J 77 59 4,320 30 1,010$ DOE SOH DEPARTMENT OF EDUCATION8806-3539-079 1 200409 491770 J 79 79 5,440 30 1,166$ DOE SOH DEPARTMENT OF EDUCATION8806-3539-079 1 200410 491770 J 77 75 5,520 33 1,193$ DOE SOH DEPARTMENT OF EDUCATION8806-3539-079 1 200411 491770 J 77 73 5,040 28 1,156$ DOE SOH DEPARTMENT OF EDUCATION8806-3539-079 1 200412 491770 J 80 80 5,120 29 1,200$ DOE SOH DEPARTMENT OF EDUCATION
59,760 13,736 8809-2020-077 1 200401 495992 J3 376 376 96,600 33 12,563$ DOE SOH DEPARTMENT OF EDUCATION8809-2020-077 1 200402 495992 J3 387 387 104,400 29 13,645$ DOE SOH DEPARTMENT OF EDUCATION8809-2020-077 1 200403 495992 J3 382 382 112,800 32 14,546$ DOE SOH DEPARTMENT OF EDUCATION8809-2020-077 1 200404 495992 J3 393 393 100,800 30 13,467$ DOE SOH DEPARTMENT OF EDUCATION8809-2020-077 1 200405 495992 J3 398 398 111,000 29 14,631$ DOE SOH DEPARTMENT OF EDUCATION8809-2020-077 1 200406 495992 J3 414 414 114,000 32 15,159$ DOE SOH DEPARTMENT OF EDUCATION8809-2020-077 1 200407 495992 J3 316 254 87,000 30 11,577$ DOE SOH DEPARTMENT OF EDUCATION8809-2020-077 1 200408 495992 J3 316 235 77,400 29 10,649$ DOE SOH DEPARTMENT OF EDUCATION8809-2020-077 1 200409 495992 J3 425 425 131,400 33 17,528$ DOE SOH DEPARTMENT OF EDUCATION8809-2020-077 1 200410 495992 J3 426 426 141,600 31 19,297$ DOE SOH DEPARTMENT OF EDUCATION8809-2020-077 1 200411 495992 J3 425 425 126,600 31 18,212$ DOE SOH DEPARTMENT OF EDUCATION8809-2020-077 1 200412 495992 J3 404 404 110,400 28 16,498$ DOE SOH DEPARTMENT OF EDUCATION
TOTAL 1,314,000 177,772 8809-6595-077 1 200401 483982 J 374 374 80,960 32 11,240$ DOE SOH DEPARTMENT OF EDUCATION8809-6595-077 1 200402 483982 J 385 385 103,840 32 13,824$ DOE SOH DEPARTMENT OF EDUCATION8809-6595-077 1 200403 483982 J 386 386 100,080 29 13,519$ DOE SOH DEPARTMENT OF EDUCATION8809-6595-077 1 200404 483982 J 373 373 88,960 30 12,331$ DOE SOH DEPARTMENT OF EDUCATION8809-6595-077 1 200405 483982 J 383 383 92,720 28 12,859$ DOE SOH DEPARTMENT OF EDUCATION8809-6595-077 1 200406 483982 J 388 388 98,160 33 13,557$ DOE SOH DEPARTMENT OF EDUCATION8809-6595-077 1 200407 483982 J 295 214 59,520 30 8,767$ DOE SOH DEPARTMENT OF EDUCATION8809-6595-077 1 200408 483982 J 295 224 55,440 28 8,343$ DOE SOH DEPARTMENT OF EDUCATION8809-6595-077 1 200409 483982 J 400 400 105,440 33 14,791$ DOE SOH DEPARTMENT OF EDUCATION

TABLE: STATE LARGE FACILITIES IN OAHU ELECTRICITY BILL HISTORY FOR YEAR 2004 (PROVIDED BY HECO)
ACCTNUM TARCDE REVPER METRNBR RATESCH BILLDMD MDM KWH NBRDAYS TOTAMT DEPARTMENT NAME8809-6595-077 1 200410 483982 J 398 398 112,080 30 16,006$ DOE SOH DEPARTMENT OF EDUCATION8809-6595-077 1 200411 483982 J 413 413 103,040 31 15,592$ DOE SOH DEPARTMENT OF EDUCATION8809-6595-077 1 200412 483982 J 388 388 94,000 29 14,618$ DOE SOH DEPARTMENT OF EDUCATION
TOTAL 1,094,240 155,445 8811-3369-078 1 200401 441774 J3 437 437 108,000 31 14,413$ DOE SOH DEPARTMENT OF EDUCATION8811-3369-078 1 200402 441774 J3 469 469 139,200 33 18,040$ DOE SOH DEPARTMENT OF EDUCATION8811-3369-078 1 200403 441774 J3 467 467 123,600 29 16,535$ DOE SOH DEPARTMENT OF EDUCATION8811-3369-078 1 200404 441774 J3 462 462 123,600 32 16,562$ DOE SOH DEPARTMENT OF EDUCATION8811-3369-078 1 200405 441774 J3 541 541 124,800 29 17,442$ DOE SOH DEPARTMENT OF EDUCATION8811-3369-078 1 200406 441774 J3 458 458 117,600 30 16,099$ DOE SOH DEPARTMENT OF EDUCATION8811-3369-078 1 200407 441774 J3 406 342 104,400 32 14,296$ DOE SOH DEPARTMENT OF EDUCATION8811-3369-078 1 200408 441774 J3 406 353 88,800 28 12,765$ DOE SOH DEPARTMENT OF EDUCATION8811-3369-078 1 200409 441774 J3 500 500 139,200 31 19,209$ DOE SOH DEPARTMENT OF EDUCATION8811-3369-078 1 200410 441774 J3 468 468 159,600 33 21,913$ DOE SOH DEPARTMENT OF EDUCATION8811-3369-078 1 200411 441774 J3 484 484 118,800 28 17,975$ DOE SOH DEPARTMENT OF EDUCATION8811-3369-078 1 200412 441774 J3 464 464 122,400 29 18,600$ DOE SOH DEPARTMENT OF EDUCATION
TOTAL 1,470,000 203,849 8812-7930-077 1 200401 487700 J 136 136 40,960 33 5,306$ DOE SOH DEPARTMENT OF EDUCATION8812-7930-077 1 200402 487700 J 138 138 48,160 31 6,138$ DOE SOH DEPARTMENT OF EDUCATION8812-7930-077 1 200403 487700 J 144 144 44,320 29 5,838$ DOE SOH DEPARTMENT OF EDUCATION8812-7930-077 1 200404 487700 J 144 144 45,440 32 5,965$ DOE SOH DEPARTMENT OF EDUCATION8812-7930-077 1 200405 487700 J 139 139 45,600 30 5,998$ DOE SOH DEPARTMENT OF EDUCATION8812-7930-077 1 200406 487700 J 139 138 41,680 29 5,585$ DOE SOH DEPARTMENT OF EDUCATION8812-7930-077 1 200407 487700 J 112 106 42,320 31 5,427$ DOE SOH DEPARTMENT OF EDUCATION8812-7930-077 1 200408 487700 J 146 146 45,040 29 6,041$ DOE SOH DEPARTMENT OF EDUCATION8812-7930-077 1 200409 487700 J 145 145 50,480 30 6,779$ DOE SOH DEPARTMENT OF EDUCATION8812-7930-077 1 200410 487700 J 145 145 - 0 -$ DOE SOH DEPARTMENT OF EDUCATION8812-7930-077 1 200412 487700 J 208 208 162,240 90 19,162$ DOE SOH DEPARTMENT OF EDUCATION
TOTAL 566,240 72,239 8814-6868-077 1 200401 472614 J3 578 578 170,400 33 21,694$ DOE SOH DEPARTMENT OF EDUCATION8814-6868-077 1 200402 472614 J3 574 574 214,000 33 26,336$ DOE SOH DEPARTMENT OF EDUCATION8814-6868-077 1 200403 472614 J3 582 582 172,400 28 22,338$ DOE SOH DEPARTMENT OF EDUCATION8814-6868-077 1 200404 472614 J3 584 584 188,800 31 24,071$ DOE SOH DEPARTMENT OF EDUCATION8814-6868-077 1 200405 472614 J3 590 590 190,000 30 24,505$ DOE SOH DEPARTMENT OF EDUCATION8814-6868-077 1 200406 472614 J3 590 590 183,200 31 23,811$ DOE SOH DEPARTMENT OF EDUCATION8814-6868-077 1 200407 472614 J3 444 408 159,600 30 20,193$ DOE SOH DEPARTMENT OF EDUCATION8814-6868-077 1 200408 472614 J3 513 513 158,800 32 20,899$ DOE SOH DEPARTMENT OF EDUCATION8814-6868-077 1 200409 472614 J3 626 626 187,600 29 25,425$ DOE SOH DEPARTMENT OF EDUCATION8814-6868-077 1 200410 472614 J3 618 618 207,600 30 28,500$ DOE SOH DEPARTMENT OF EDUCATION8814-6868-077 1 200411 472614 J3 625 625 182,800 29 26,566$ DOE SOH DEPARTMENT OF EDUCATION8814-6868-077 1 200412 472614 J3 581 581 188,400 29 27,367$ DOE SOH DEPARTMENT OF EDUCATION
TOTAL 2,203,600 291,705 8818-8260-078 1 200401 483958 J 374 374 82,800 31 11,451$ DOE SOH DEPARTMENT OF EDUCATION8818-8260-078 1 200402 483958 J 386 386 110,400 32 14,462$ DOE SOH DEPARTMENT OF EDUCATION8818-8260-078 1 200403 483958 J 376 376 92,400 29 12,641$ DOE SOH DEPARTMENT OF EDUCATION8818-8260-078 1 200404 483958 J 376 376 114,000 33 14,873$ DOE SOH DEPARTMENT OF EDUCATION8818-8260-078 1 200405 483958 J 397 397 108,000 29 14,601$ DOE SOH DEPARTMENT OF EDUCATION8818-8260-078 1 200406 483958 J 391 391 87,000 29 12,338$ DOE SOH DEPARTMENT OF EDUCATION8818-8260-078 1 200407 483958 J 311 209 63,600 30 9,251$ DOE SOH DEPARTMENT OF EDUCATION8818-8260-078 1 200408 483958 J 311 309 73,200 32 10,357$ DOE SOH DEPARTMENT OF EDUCATION8818-8260-078 1 200409 483958 J 410 410 123,000 31 16,878$ DOE SOH DEPARTMENT OF EDUCATION8818-8260-078 1 200410 483958 J 419 419 105,600 28 15,538$ DOE SOH DEPARTMENT OF EDUCATION8818-8260-078 1 200411 483958 J 399 399 107,400 31 16,055$ DOE SOH DEPARTMENT OF EDUCATION8818-8260-078 1 200412 483958 J 371 371 98,400 30 15,032$ DOE SOH DEPARTMENT OF EDUCATION
TOTAL 1,165,800 163,478 8819-7510-077 1 200401 495986 J 598 596 168,000 33 22,009$ DOE SOH DEPARTMENT OF EDUCATION8819-7510-077 1 200402 495986 J 694 694 198,400 32 26,063$ DOE SOH DEPARTMENT OF EDUCATION8819-7510-077 1 200403 495986 J 690 690 182,400 29 24,588$ DOE SOH DEPARTMENT OF EDUCATION8819-7510-077 1 200404 495986 J 686 686 204,800 33 26,923$ DOE SOH DEPARTMENT OF EDUCATION8819-7510-077 1 200405 495986 J 734 734 212,400 29 28,448$ DOE SOH DEPARTMENT OF EDUCATION8819-7510-077 1 200406 495986 J 708 708 194,400 30 26,300$ DOE SOH DEPARTMENT OF EDUCATION8819-7510-077 1 200407 495986 J 614 614 178,000 31 23,810$ DOE SOH DEPARTMENT OF EDUCATION8819-7510-077 1 200408 495986 J 753 753 230,000 30 30,697$ DOE SOH DEPARTMENT OF EDUCATION8819-7510-077 1 200409 495986 J 821 821 236,000 30 32,804$ DOE SOH DEPARTMENT OF EDUCATION8819-7510-077 1 200410 495986 J 794 794 222,000 31 32,129$ DOE SOH DEPARTMENT OF EDUCATION8819-7510-077 1 200411 495986 J 737 737 194,000 29 29,281$ DOE SOH DEPARTMENT OF EDUCATION8819-7510-077 1 200412 495986 J 725 725 181,200 29 28,103$ DOE SOH DEPARTMENT OF EDUCATION
TOTAL 2,401,600 331,155 8822-5334-078 1 200401 467349 J 508 508 128,240 29 17,282$ DOE SOH DEPARTMENT OF EDUCATION8822-5334-078 1 200402 467349 J 539 539 162,800 31 21,106$ DOE SOH DEPARTMENT OF EDUCATION8822-5334-078 1 200403 467349 J 535 535 139,440 31 18,876$ DOE SOH DEPARTMENT OF EDUCATION8822-5334-078 1 200404 467349 J 539 539 162,400 31 21,248$ DOE SOH DEPARTMENT OF EDUCATION8822-5334-078 1 200405 467349 J 550 550 152,240 29 20,580$ DOE SOH DEPARTMENT OF EDUCATION8822-5334-078 1 200406 467349 J 427 321 116,800 32 15,855$ DOE SOH DEPARTMENT OF EDUCATION8822-5334-078 1 200407 467349 J 427 322 104,160 29 14,488$ DOE SOH DEPARTMENT OF EDUCATION8822-5334-078 1 200408 467349 J 549 549 161,280 30 21,678$ DOE SOH DEPARTMENT OF EDUCATION8822-5334-078 1 200409 467349 J 565 565 183,040 32 24,875$ DOE SOH DEPARTMENT OF EDUCATION8822-5334-078 1 200410 467349 J 569 569 165,760 29 23,825$ DOE SOH DEPARTMENT OF EDUCATION8822-5334-078 1 200411 467349 J 565 565 155,520 32 23,313$ DOE SOH DEPARTMENT OF EDUCATION8822-5334-078 1 200412 467349 J 537 537 118,320 30 18,898$ DOE SOH DEPARTMENT OF EDUCATION
TOTAL 1,750,000 242,024 9600-2562-003 1 200401 440532 J 477 458 118,080 33 15,737$ DOE SOH DEPARTMENT OF EDUCATION9600-2562-003 1 200402 440532 J 477 418 114,960 28 15,767$ DOE SOH DEPARTMENT OF EDUCATION9600-2562-003 1 200403 440532 J 477 406 125,760 30 16,934$ DOE SOH DEPARTMENT OF EDUCATION9600-2562-003 1 200404 440532 J 571 571 131,040 32 18,391$ DOE SOH DEPARTMENT OF EDUCATION9600-2562-003 1 200405 440532 J 477 434 128,640 30 17,381$ DOE SOH DEPARTMENT OF EDUCATION9600-2562-003 1 200406 440532 J 542 542 136,560 29 18,954$ DOE SOH DEPARTMENT OF EDUCATION9600-2562-003 1 200407 440532 J 477 377 147,840 33 19,548$ DOE SOH DEPARTMENT OF EDUCATION9600-2562-003 1 200408 440532 J 550 550 136,080 28 18,903$ DOE SOH DEPARTMENT OF EDUCATION9600-2562-003 1 200409 440532 J 550 550 157,440 30 21,466$ DOE SOH DEPARTMENT OF EDUCATION9600-2562-003 1 200410 440532 J 550 550 171,120 32 23,743$ DOE SOH DEPARTMENT OF EDUCATION9600-2562-003 1 200411 440532 J 538 538 156,000 30 22,682$ DOE SOH DEPARTMENT OF EDUCATION9600-2562-003 1 200412 440532 J 559 559 133,920 28 20,829$ DOE SOH DEPARTMENT OF EDUCATION
TOTAL 1,657,440 230,333 9800-2018-003 1 200401 493932 J 675 675 168,800 31 22,507$ DOE SOH DEPARTMENT OF EDUCATION9800-2018-003 1 200402 493932 J 769 769 184,800 29 25,410$ DOE SOH DEPARTMENT OF EDUCATION9800-2018-003 1 200403 493932 J 742 742 205,200 32 27,428$ DOE SOH DEPARTMENT OF EDUCATION9800-2018-003 1 200404 493932 J 664 664 173,600 29 23,650$ DOE SOH DEPARTMENT OF EDUCATION9800-2018-003 1 200405 493932 J 707 707 194,800 30 26,275$ DOE SOH DEPARTMENT OF EDUCATION9800-2018-003 1 200406 493932 J 688 688 199,200 31 26,860$ DOE SOH DEPARTMENT OF EDUCATION9800-2018-003 1 200407 493932 J 751 751 214,400 31 28,841$ DOE SOH DEPARTMENT OF EDUCATION9800-2018-003 1 200408 493932 J 777 777 210,800 29 28,734$ DOE SOH DEPARTMENT OF EDUCATION9800-2018-003 1 200409 493932 J 739 739 225,200 33 30,590$ DOE SOH DEPARTMENT OF EDUCATION9800-2018-003 1 200410 493932 J 749 749 196,800 29 28,446$ DOE SOH DEPARTMENT OF EDUCATION9800-2018-003 1 200411 493932 J 770 770 205,600 30 30,546$ DOE SOH DEPARTMENT OF EDUCATION9800-2018-003 1 200412 493932 J 701 701 185,600 31 28,436$ DOE SOH DEPARTMENT OF EDUCATION
TOTAL 2,364,800 327,725 9900-0148-003 1 200401 467278 J 597 597 148,080 33 19,823$ DOE SOH DEPARTMENT OF EDUCATION9900-0148-003 1 200402 467278 J 556 556 144,720 29 19,602$ DOE SOH DEPARTMENT OF EDUCATION9900-0148-003 1 200403 467278 J 553 553 183,840 30 23,704$ DOE SOH DEPARTMENT OF EDUCATION9900-0148-003 1 200404 467278 J 503 503 133,440 31 18,209$ DOE SOH DEPARTMENT OF EDUCATION9900-0148-003 1 200405 467278 J 484 484 147,600 30 19,533$ DOE SOH DEPARTMENT OF EDUCATION9900-0148-003 1 200406 467278 J 504 504 173,280 29 22,655$ DOE SOH DEPARTMENT OF EDUCATION

TABLE: STATE LARGE FACILITIES IN OAHU ELECTRICITY BILL HISTORY FOR YEAR 2004 (PROVIDED BY HECO)
ACCTNUM TARCDE REVPER METRNBR RATESCH BILLDMD MDM KWH NBRDAYS TOTAMT DEPARTMENT NAME9900-0148-003 1 200407 467278 J 521 521 198,960 33 25,421$ DOE SOH DEPARTMENT OF EDUCATION9900-0148-003 1 200408 467278 J 576 576 169,200 29 22,724$ DOE SOH DEPARTMENT OF EDUCATION9900-0148-003 1 200409 467278 J 596 596 197,040 30 26,261$ DOE SOH DEPARTMENT OF EDUCATION9900-0148-003 1 200410 467278 J 591 591 216,000 32 29,306$ DOE SOH DEPARTMENT OF EDUCATION9900-0148-003 1 200411 467278 J 591 591 196,320 30 27,986$ DOE SOH DEPARTMENT OF EDUCATION9900-0148-003 1 200412 467278 J 577 577 185,520 29 27,396$ DOE SOH DEPARTMENT OF EDUCATION
TOTAL 2,094,000 282,619 8800-6352-076 1 200401 359793 PP3 1,780 1,600 1,092,000 31 113,166$ DOT-Airport Division SOH DOT AIRPORT8800-6352-076 1 200402 359793 PP3 1,760 1,560 1,124,000 33 119,962$ DOT-Airport Division SOH DOT AIRPORT8800-6352-076 1 200403 359793 PP3 1,960 1,960 968,000 28 108,948$ DOT-Airport Division SOH DOT AIRPORT8800-6352-076 1 200404 359793 PP3 1,800 1,640 1,012,000 29 112,105$ DOT-Airport Division SOH DOT AIRPORT8800-6352-076 1 200405 359793 PP3 1,800 1,640 1,104,000 32 120,211$ DOT-Airport Division SOH DOT AIRPORT8800-6352-076 1 200406 359793 PP3 1,800 1,640 1,036,000 29 116,006$ DOT-Airport Division SOH DOT AIRPORT8800-6352-076 1 200407 359793 PP3 1,800 1,640 1,108,000 31 121,622$ DOT-Airport Division SOH DOT AIRPORT8800-6352-076 1 200408 359793 PP3 1,800 1,640 1,112,000 31 122,264$ DOT-Airport Division SOH DOT AIRPORT8800-6352-076 1 200409 359793 PP3 1,800 1,640 1,088,000 30 122,198$ DOT-Airport Division SOH DOT AIRPORT8800-6352-076 1 200410 359793 PP3 1,820 1,680 1,092,000 30 126,995$ DOT-Airport Division SOH DOT AIRPORT8800-6352-076 1 200411 359793 PP3 1,820 1,680 1,132,000 31 136,050$ DOT-Airport Division SOH DOT AIRPORT8800-6352-076 1 200412 359793 PP3 1,780 1,600 1,068,000 30 133,978$ DOT-Airport Division SOH DOT AIRPORT
TOTAL 12,936,000 1,453,504 8800-6353-076 1 200401 441630 PP3 616 608 347,000 31 36,724$ DOT-Airport Division SOH DOT AIRPORT8800-6353-076 1 200402 441630 PP3 604 600 370,000 33 39,921$ DOT-Airport Division SOH DOT AIRPORT8800-6353-076 1 200403 441630 PP3 588 568 317,000 28 35,240$ DOT-Airport Division SOH DOT AIRPORT8800-6353-076 1 200404 441630 PP3 628 628 325,000 29 36,780$ DOT-Airport Division SOH DOT AIRPORT8800-6353-076 1 200405 441630 PP3 600 572 365,000 32 39,954$ DOT-Airport Division SOH DOT AIRPORT8800-6353-076 1 200406 441630 PP3 598 568 332,000 29 37,607$ DOT-Airport Division SOH DOT AIRPORT8800-6353-076 1 200407 441630 PP3 600 572 357,000 31 39,590$ DOT-Airport Division SOH DOT AIRPORT8800-6353-076 1 200408 441630 PP3 602 576 363,000 31 40,210$ DOT-Airport Division SOH DOT AIRPORT8800-6353-076 1 200409 441630 PP3 618 608 358,000 30 40,644$ DOT-Airport Division SOH DOT AIRPORT8800-6353-076 1 200410 441630 PP3 616 604 362,000 30 42,611$ DOT-Airport Division SOH DOT AIRPORT8800-6353-076 1 200411 441630 PP3 610 592 353,000 31 43,385$ DOT-Airport Division SOH DOT AIRPORT8800-6353-076 1 200412 441630 PP3 600 572 347,000 30 44,199$ DOT-Airport Division SOH DOT AIRPORT
TOTAL 4,196,000 476,865 8800-6356-075 1 200401 488489 J3 184 184 92,400 31 10,356$ DOT-Airport Division SOH DOT AIRPORT8800-6356-075 1 200402 488489 J3 185 185 110,400 33 12,378$ DOT-Airport Division SOH DOT AIRPORT8800-6356-075 1 200403 488489 J3 178 178 82,800 28 9,792$ DOT-Airport Division SOH DOT AIRPORT8800-6356-075 1 200404 488489 J3 179 179 91,200 29 10,683$ DOT-Airport Division SOH DOT AIRPORT8800-6356-075 1 200405 488489 J3 157 157 93,600 32 10,642$ DOT-Airport Division SOH DOT AIRPORT8800-6356-075 1 200406 488489 J3 157 157 87,600 29 10,239$ DOT-Airport Division SOH DOT AIRPORT8800-6356-075 1 200407 488489 J3 161 161 92,400 31 10,664$ DOT-Airport Division SOH DOT AIRPORT8800-6356-075 1 200408 488489 J3 163 163 97,200 31 11,158$ DOT-Airport Division SOH DOT AIRPORT8800-6356-075 1 200409 488489 J3 164 164 97,200 30 11,360$ DOT-Airport Division SOH DOT AIRPORT8800-6356-075 1 200410 488489 J3 167 167 98,400 30 11,945$ DOT-Airport Division SOH DOT AIRPORT8800-6356-075 1 200412 488489 J3 215 215 260,400 61 33,255$ DOT-Airport Division SOH DOT AIRPORT
TOTAL 1,203,600 142,471 8800-6357-075 1 200401 359548 J4 205 205 118,800 31 12,916$ DOT-Airport Division SOH DOT AIRPORT8800-6357-075 1 200402 359548 J4 205 205 122,240 33 13,701$ DOT-Airport Division SOH DOT AIRPORT8800-6357-075 1 200403 359548 J4 199 199 101,200 28 11,851$ DOT-Airport Division SOH DOT AIRPORT8800-6357-075 1 200404 359548 J4 195 195 102,960 29 12,082$ DOT-Airport Division SOH DOT AIRPORT8800-6357-075 1 200405 359548 J4 186 186 117,280 32 13,312$ DOT-Airport Division SOH DOT AIRPORT8800-6357-075 1 200406 359548 J4 188 188 123,120 29 14,099$ DOT-Airport Division SOH DOT AIRPORT8800-6357-075 1 200407 359548 J4 192 192 133,520 31 15,033$ DOT-Airport Division SOH DOT AIRPORT8800-6357-075 1 200408 359548 J4 189 189 133,680 31 15,031$ DOT-Airport Division SOH DOT AIRPORT8800-6357-075 1 200409 359548 J4 190 190 128,880 30 14,833$ DOT-Airport Division SOH DOT AIRPORT8800-6357-075 1 200410 359548 J4 186 186 126,720 30 15,154$ DOT-Airport Division SOH DOT AIRPORT8800-6357-075 1 200411 359548 J4 186 186 129,280 31 16,019$ DOT-Airport Division SOH DOT AIRPORT8800-6357-075 1 200412 359548 J4 231 231 147,040 30 18,944$ DOT-Airport Division SOH DOT AIRPORT
TOTAL 1,484,720 172,975 8800-6358-076 1 200401 486902 PP3 1,670 1,649 1,092,000 31 111,700$ DOT-Airport Division SOH DOT AIRPORT8800-6358-076 1 200402 486902 PP3 1,662 1,632 1,152,000 33 120,975$ DOT-Airport Division SOH DOT AIRPORT8800-6358-076 1 200403 486902 PP3 1,632 1,572 945,600 28 102,810$ DOT-Airport Division SOH DOT AIRPORT8800-6358-076 1 200404 486902 PP3 1,622 1,553 988,800 29 107,601$ DOT-Airport Division SOH DOT AIRPORT8800-6358-076 1 200405 486902 PP3 1,631 1,570 1,092,000 32 116,761$ DOT-Airport Division SOH DOT AIRPORT8800-6358-076 1 200406 486902 PP3 1,637 1,582 993,600 29 109,876$ DOT-Airport Division SOH DOT AIRPORT8800-6358-076 1 200407 486902 PP3 1,634 1,577 1,075,200 31 116,409$ DOT-Airport Division SOH DOT AIRPORT8800-6358-076 1 200408 486902 PP3 1,632 1,572 1,077,600 31 116,796$ DOT-Airport Division SOH DOT AIRPORT8800-6358-076 1 200409 486902 PP3 1,614 1,574 1,032,000 30 114,492$ DOT-Airport Division SOH DOT AIRPORT8800-6358-076 1 200410 486902 PP3 1,614 1,579 1,020,000 30 117,890$ DOT-Airport Division SOH DOT AIRPORT8800-6358-076 1 200411 486902 PP3 1,621 1,594 1,092,000 31 130,178$ DOT-Airport Division SOH DOT AIRPORT8800-6358-076 1 200412 486902 PP3 1,625 1,601 1,056,000 30 131,344$ DOT-Airport Division SOH DOT AIRPORT
TOTAL 12,616,800 1,396,833 8800-6359-076 1 200401 441628 PP3 918 900 618,000 31 63,176$ DOT-Airport Division SOH DOT AIRPORT8800-6359-076 1 200402 441628 PP3 918 900 657,000 33 68,967$ DOT-Airport Division SOH DOT AIRPORT8800-6359-076 1 200403 441628 PP3 912 888 549,000 28 59,794$ DOT-Airport Division SOH DOT AIRPORT8800-6359-076 1 200404 441628 PP3 912 888 558,000 29 60,902$ DOT-Airport Division SOH DOT AIRPORT8800-6359-076 1 200405 441628 PP3 870 804 567,000 32 61,240$ DOT-Airport Division SOH DOT AIRPORT8800-6359-076 1 200406 441628 PP3 924 912 555,000 29 61,812$ DOT-Airport Division SOH DOT AIRPORT8800-6359-076 1 200407 441628 PP3 918 900 624,000 31 67,504$ DOT-Airport Division SOH DOT AIRPORT8800-6359-076 1 200408 441628 PP3 918 900 627,000 31 67,889$ DOT-Airport Division SOH DOT AIRPORT8800-6359-076 1 200409 441628 PP3 924 912 615,000 30 68,069$ DOT-Airport Division SOH DOT AIRPORT8800-6359-076 1 200410 441628 PP3 936 936 621,000 30 71,551$ DOT-Airport Division SOH DOT AIRPORT8800-6359-076 1 200411 441628 PP3 960 960 639,000 31 76,563$ DOT-Airport Division SOH DOT AIRPORT8800-6359-076 1 200412 441628 PP3 960 960 606,000 30 75,965$ DOT-Airport Division SOH DOT AIRPORT
TOTAL 7,236,000 803,431 8800-6360-075 1 200401 441679 PP3 1,146 1,008 636,000 31 66,995$ DOT-Airport Division SOH DOT AIRPORT8800-6360-075 1 200402 441679 PP3 1,146 1,008 675,000 33 72,839$ DOT-Airport Division SOH DOT AIRPORT8800-6360-075 1 200403 441679 PP3 1,146 1,008 561,000 28 63,141$ DOT-Airport Division SOH DOT AIRPORT8800-6360-075 1 200404 441679 PP3 1,140 996 573,000 29 64,761$ DOT-Airport Division SOH DOT AIRPORT8800-6360-075 1 200405 441679 PP3 1,152 1,020 624,000 32 69,360$ DOT-Airport Division SOH DOT AIRPORT8800-6360-075 1 200406 441679 PP3 1,176 1,068 609,000 29 69,407$ DOT-Airport Division SOH DOT AIRPORT8800-6360-075 1 200407 441679 PP3 1,188 1,092 684,000 31 75,741$ DOT-Airport Division SOH DOT AIRPORT8800-6360-075 1 200408 441679 PP3 1,188 1,092 684,000 31 75,856$ DOT-Airport Division SOH DOT AIRPORT8800-6360-075 1 200409 441679 PP3 1,182 1,080 660,000 30 74,912$ DOT-Airport Division SOH DOT AIRPORT8800-6360-075 1 200410 441679 PP3 1,098 1,092 663,000 30 77,164$ DOT-Airport Division SOH DOT AIRPORT8800-6360-075 1 200411 441679 PP3 1,092 1,092 675,000 31 81,455$ DOT-Airport Division SOH DOT AIRPORT8800-6360-075 1 200412 441679 PP3 1,074 1,056 609,000 30 77,349$ DOT-Airport Division SOH DOT AIRPORT
TOTAL 7,653,000 868,980 8800-6364-076 1 200401 441633 PP3 1,061 1,061 499,200 31 54,834$ DOT-Airport Division SOH DOT AIRPORT8800-6364-076 1 200402 441633 PP3 1,027 994 524,400 33 58,516$ DOT-Airport Division SOH DOT AIRPORT8800-6364-076 1 200403 441633 PP3 991 922 387,600 28 46,425$ DOT-Airport Division SOH DOT AIRPORT8800-6364-076 1 200404 441633 PP3 1,013 965 450,000 29 52,888$ DOT-Airport Division SOH DOT AIRPORT8800-6364-076 1 200405 441633 PP3 1,022 984 499,200 32 57,349$ DOT-Airport Division SOH DOT AIRPORT8800-6364-076 1 200406 441633 PP3 1,018 974 445,200 29 53,314$ DOT-Airport Division SOH DOT AIRPORT8800-6364-076 1 200407 441633 PP3 1,025 989 492,000 31 57,098$ DOT-Airport Division SOH DOT AIRPORT8800-6364-076 1 200408 441633 PP3 998 936 499,200 31 57,327$ DOT-Airport Division SOH DOT AIRPORT8800-6364-076 1 200409 441633 PP3 1,001 941 471,600 30 55,748$ DOT-Airport Division SOH DOT AIRPORT8800-6364-076 1 200410 441633 PP3 1,001 941 469,200 30 57,634$ DOT-Airport Division SOH DOT AIRPORT8800-6364-076 1 200411 441633 PP3 998 936 484,800 31 61,413$ DOT-Airport Division SOH DOT AIRPORT8800-6364-076 1 200412 441633 PP3 1,008 955 472,800 30 62,491$ DOT-Airport Division SOH DOT AIRPORT
TOTAL 5,695,200 675,038 8800-6365-075 1 200401 486873 PP3 2,451 2,358 1,410,000 31 147,331$ DOT-Airport Division SOH DOT AIRPORT8800-6365-075 1 200402 486873 PP3 2,463 2,382 1,428,000 33 154,485$ DOT-Airport Division SOH DOT AIRPORT8800-6365-075 1 200403 486873 PP3 2,481 2,418 1,284,000 28 142,430$ DOT-Airport Division SOH DOT AIRPORT

TABLE: STATE LARGE FACILITIES IN OAHU ELECTRICITY BILL HISTORY FOR YEAR 2004 (PROVIDED BY HECO)
ACCTNUM TARCDE REVPER METRNBR RATESCH BILLDMD MDM KWH NBRDAYS TOTAMT DEPARTMENT NAME8800-6365-075 1 200404 486873 PP3 2,364 2,184 1,212,000 29 136,164$ DOT-Airport Division SOH DOT AIRPORT8800-6365-075 1 200405 486873 PP3 2,328 2,112 1,308,000 32 144,106$ DOT-Airport Division SOH DOT AIRPORT8800-6365-075 1 200406 486873 PP3 2,484 2,424 1,350,000 29 151,865$ DOT-Airport Division SOH DOT AIRPORT8800-6365-075 1 200407 486873 PP3 2,409 2,274 1,500,000 31 163,264$ DOT-Airport Division SOH DOT AIRPORT8800-6365-075 1 200408 486873 PP3 2,415 2,286 1,512,000 31 164,799$ DOT-Airport Division SOH DOT AIRPORT8800-6365-075 1 200409 486873 PP3 2,484 2,424 1,518,000 30 169,030$ DOT-Airport Division SOH DOT AIRPORT8800-6365-075 1 200410 486873 PP3 2,466 2,430 1,494,000 30 173,332$ DOT-Airport Division SOH DOT AIRPORT8800-6365-075 1 200411 486873 PP3 2,433 2,382 1,524,000 31 183,114$ DOT-Airport Division SOH DOT AIRPORT8800-6365-075 1 200412 486873 PP3 2,415 2,400 1,392,000 30 175,836$ DOT-Airport Division SOH DOT AIRPORT
TOTAL 16,932,000 1,905,754 9201-0482-002 1 200401 441881 PP3 2,039 1,692 1,020,000 31 110,164$ DOT-Airport Division SOH DOT AIRPORT9201-0482-002 1 200402 441881 PP3 2,026 1,666 979,200 33 110,463$ DOT-Airport Division SOH DOT AIRPORT9201-0482-002 1 200403 441881 PP3 1,972 1,558 844,800 28 98,378$ DOT-Airport Division SOH DOT AIRPORT9201-0482-002 1 200404 441881 PP3 1,970 1,555 808,800 29 96,101$ DOT-Airport Division SOH DOT AIRPORT9201-0482-002 1 200405 441881 PP3 1,996 1,606 950,400 32 108,943$ DOT-Airport Division SOH DOT AIRPORT9201-0482-002 1 200406 441881 PP3 2,000 1,615 972,000 29 112,576$ DOT-Airport Division SOH DOT AIRPORT9201-0482-002 1 200407 441881 PP3 2,002 1,618 1,077,600 31 121,312$ DOT-Airport Division SOH DOT AIRPORT9201-0482-002 1 200408 441881 PP3 2,003 1,620 1,120,800 31 125,394$ DOT-Airport Division SOH DOT AIRPORT9201-0482-002 1 200409 441881 PP3 2,042 1,699 1,144,800 30 130,115$ DOT-Airport Division SOH DOT AIRPORT9201-0482-002 1 200410 441881 PP3 1,769 1,769 1,132,800 30 131,066$ DOT-Airport Division SOH DOT AIRPORT9201-0482-002 1 200411 441881 PP3 1,742 1,716 1,116,000 31 134,461$ DOT-Airport Division SOH DOT AIRPORT9201-0482-002 1 200412 441881 PP3 1,732 1,694 1,017,600 30 129,038$ DOT-Airport Division SOH DOT AIRPORT
TOTAL 12,184,800 1,408,012 9300-0115-002 1 200401 495965 PS 1,546 1,517 979,200 31 102,306$ DOT-Airport Division SOH DOT AIRPORT9300-0115-002 1 200402 495965 PS 1,555 1,536 1,032,000 33 110,949$ DOT-Airport Division SOH DOT AIRPORT9300-0115-002 1 200403 495965 PS 1,651 1,651 921,600 28 102,590$ DOT-Airport Division SOH DOT AIRPORT9300-0115-002 1 200404 495965 PS 1,603 1,555 955,200 29 106,035$ DOT-Airport Division SOH DOT AIRPORT9300-0115-002 1 200405 495965 PS 1,622 1,594 1,022,400 32 112,297$ DOT-Airport Division SOH DOT AIRPORT9300-0115-002 1 200406 495965 PS 1,622 1,594 945,600 29 107,073$ DOT-Airport Division SOH DOT AIRPORT9300-0115-002 1 200407 495965 PS 1,642 1,632 1,046,400 31 115,589$ DOT-Airport Division SOH DOT AIRPORT9300-0115-002 1 200408 495965 PS 1,670 1,670 1,060,800 31 117,487$ DOT-Airport Division SOH DOT AIRPORT9300-0115-002 1 200409 495965 PS 1,670 1,670 1,041,600 30 117,664$ DOT-Airport Division SOH DOT AIRPORT9300-0115-002 1 200410 495965 PS 1,661 1,651 1,003,200 30 118,489$ DOT-Airport Division SOH DOT AIRPORT9300-0115-002 1 200411 495965 PS 1,651 1,632 1,032,000 31 126,100$ DOT-Airport Division SOH DOT AIRPORT9300-0115-002 1 200412 495965 PS 1,651 1,632 1,003,200 30 127,682$ DOT-Airport Division SOH DOT AIRPORT
TOTAL 12,043,200 1,364,261 9300-4842-002 1 200401 417651 PP3 396 396 228,600 31 24,292$ DOT-Airport Division SOH DOT AIRPORT9300-4842-002 1 200402 417651 PP3 396 396 246,600 33 26,764$ DOT-Airport Division SOH DOT AIRPORT9300-4842-002 1 200403 417651 PP3 378 360 208,800 28 23,336$ DOT-Airport Division SOH DOT AIRPORT9300-4842-002 1 200404 417651 PP3 396 396 214,200 29 24,257$ DOT-Airport Division SOH DOT AIRPORT9300-4842-002 1 200405 417651 PP3 378 360 228,600 32 25,310$ DOT-Airport Division SOH DOT AIRPORT9300-4842-002 1 200406 417651 PP3 387 378 214,200 29 24,527$ DOT-Airport Division SOH DOT AIRPORT9300-4842-002 1 200407 417651 PP3 414 414 234,000 31 26,446$ DOT-Airport Division SOH DOT AIRPORT9300-4842-002 1 200408 417651 PP3 387 360 225,000 31 25,338$ DOT-Airport Division SOH DOT AIRPORT9300-4842-002 1 200409 417651 PP3 378 342 214,200 30 24,670$ DOT-Airport Division SOH DOT AIRPORT9300-4842-002 1 200410 417651 PP3 378 342 205,200 30 24,800$ DOT-Airport Division SOH DOT AIRPORT9300-4842-002 1 200411 417651 PP3 369 324 212,400 31 26,392$ DOT-Airport Division SOH DOT AIRPORT9300-4842-002 1 200412 417651 PP3 405 396 207,000 30 27,229$ DOT-Airport Division SOH DOT AIRPORT
TOTAL 2,638,800 303,361 8811-0340-077 1 200401 484718 J 168 168 64,640 32 7,941$ DOT-Highway Division SOH DOT HIGHWAY DIVISION (-)8811-0340-077 1 200402 484718 J 166 166 65,280 32 8,131$ DOT-Highway Division SOH DOT HIGHWAY DIVISION (-)8811-0340-077 1 200403 484718 J 182 182 62,000 29 7,974$ DOT-Highway Division SOH DOT HIGHWAY DIVISION (-)8811-0340-077 1 200404 484718 J 169 169 63,280 30 8,027$ DOT-Highway Division SOH DOT HIGHWAY DIVISION (-)8811-0340-077 1 200405 484718 J 167 167 72,800 31 9,011$ DOT-Highway Division SOH DOT HIGHWAY DIVISION (-)8811-0340-077 1 200406 484718 J 165 165 70,320 31 8,795$ DOT-Highway Division SOH DOT HIGHWAY DIVISION (-)8811-0340-077 1 200407 484718 J 165 164 69,360 29 8,666$ DOT-Highway Division SOH DOT HIGHWAY DIVISION (-)8811-0340-077 1 200408 484718 J 184 184 71,360 31 9,139$ DOT-Highway Division SOH DOT HIGHWAY DIVISION (-)8811-0340-077 1 200409 484718 J 188 188 72,400 31 9,517$ DOT-Highway Division SOH DOT HIGHWAY DIVISION (-)8811-0340-077 1 200410 484718 J 172 172 70,240 33 9,484$ DOT-Highway Division SOH DOT HIGHWAY DIVISION (-)8811-0340-077 1 200411 484718 J 169 168 53,440 29 7,792$ DOT-Highway Division SOH DOT HIGHWAY DIVISION (-)8811-0340-077 1 200412 484718 J 169 168 53,520 27 7,958$ DOT-Highway Division SOH DOT HIGHWAY DIVISION (-)
TOTAL 788,640 102,437 8824-9624-058 1 200401 487217 J3 264 264 123,200 33 14,130$ DOT-Highway Division SOH DOT HIGHWAY DIVISION (-)8824-9624-058 1 200402 487217 J3 261 261 108,800 29 13,081$ DOT-Highway Division SOH DOT HIGHWAY DIVISION (-)8824-9624-058 1 200403 487217 J3 270 270 118,400 32 14,161$ DOT-Highway Division SOH DOT HIGHWAY DIVISION (-)8824-9624-058 1 200404 487217 J3 266 266 113,600 30 13,713$ DOT-Highway Division SOH DOT HIGHWAY DIVISION (-)8824-9624-058 1 200405 487217 J3 266 266 115,200 29 13,958$ DOT-Highway Division SOH DOT HIGHWAY DIVISION (-)8824-9624-058 1 200406 487217 J3 269 269 131,200 32 15,589$ DOT-Highway Division SOH DOT HIGHWAY DIVISION (-)8824-9624-058 1 200407 487217 J3 266 266 118,400 30 14,293$ DOT-Highway Division SOH DOT HIGHWAY DIVISION (-)8824-9624-058 1 200408 487217 J3 262 262 115,200 29 14,045$ DOT-Highway Division SOH DOT HIGHWAY DIVISION (-)8824-9624-058 1 200409 487217 J3 261 261 123,200 33 15,154$ DOT-Highway Division SOH DOT HIGHWAY DIVISION (-)8824-9624-058 1 200410 487217 J3 258 258 107,200 30 14,081$ DOT-Highway Division SOH DOT HIGHWAY DIVISION (-)8824-9624-058 1 200411 487217 J3 250 250 100,800 29 13,779$ DOT-Highway Division SOH DOT HIGHWAY DIVISION (-)8824-9624-058 1 200412 487217 J3 245 245 97,600 31 13,720$ DOT-Highway Division SOH DOT HIGHWAY DIVISION (-)
TOTAL 1,372,800 169,706 9400-4323-001 1 200401 441877 J3 2,006 1,246 366,000 33 51,180$ DOT-Highway Division SOH DOT HIGHWAY DIVISION (-)9400-4323-001 1 200402 441877 J3 2,006 1,717 330,000 29 48,108$ DOT-Highway Division SOH DOT HIGHWAY DIVISION (-)9400-4323-001 1 200403 441877 J3 2,006 1,458 342,000 30 49,680$ DOT-Highway Division SOH DOT HIGHWAY DIVISION (-)9400-4323-001 1 200404 441877 J3 2,006 904 336,000 32 49,223$ DOT-Highway Division SOH DOT HIGHWAY DIVISION (-)9400-4323-001 1 200405 441877 J3 2,006 788 324,000 29 48,078$ DOT-Highway Division SOH DOT HIGHWAY DIVISION (-)9400-4323-001 1 200406 441877 J3 2,006 1,048 318,000 29 48,736$ DOT-Highway Division SOH DOT HIGHWAY DIVISION (-)9400-4323-001 1 200407 441877 J3 2,006 655 348,000 33 50,978$ DOT-Highway Division SOH DOT HIGHWAY DIVISION (-)9400-4323-001 1 200408 441877 J3 2,006 716 312,000 29 47,087$ DOT-Highway Division SOH DOT HIGHWAY DIVISION (-)9400-4323-001 1 200409 441877 J3 2,006 785 372,000 33 55,044$ DOT-Highway Division SOH DOT HIGHWAY DIVISION (-)9400-4323-001 1 200410 441877 J3 1,908 1,908 324,000 30 50,390$ DOT-Highway Division SOH DOT HIGHWAY DIVISION (-)9400-4323-001 1 200411 441877 J3 1,431 1,260 300,000 28 45,953$ DOT-Highway Division SOH DOT HIGHWAY DIVISION (-)9400-4323-001 1 200412 441877 J3 1,431 1,296 312,000 30 48,503$ DOT-Highway Division SOH DOT HIGHWAY DIVISION (-)
TOTAL 3,984,000 592,960 8819-5909-076 1 200401 486827 PP3 349 348 168,000 30 19,175$ HCDCH HCDCH8819-5909-076 1 200402 486827 PP3 350 350 184,000 33 20,803$ HCDCH HCDCH8819-5909-076 1 200403 486827 PP3 348 345 168,500 30 19,607$ HCDCH HCDCH8819-5909-076 1 200404 486827 PP3 351 351 175,000 32 20,218$ HCDCH HCDCH8819-5909-076 1 200405 486827 PP3 339 327 155,500 29 18,612$ HCDCH HCDCH8819-5909-076 1 200406 486827 PP3 339 328 159,000 30 18,877$ HCDCH HCDCH8819-5909-076 1 200407 486827 PP3 340 329 171,500 32 19,980$ HCDCH HCDCH8819-5909-076 1 200408 486827 PP3 341 332 162,500 30 19,451$ HCDCH HCDCH8819-5909-076 1 200409 486827 PP3 340 330 161,000 30 19,930$ HCDCH HCDCH8819-5909-076 1 200410 486827 PP3 342 334 165,000 31 21,115$ HCDCH HCDCH8819-5909-076 1 200411 486827 PP3 347 344 162,500 30 21,661$ HCDCH HCDCH8819-5909-076 1 200412 486827 PP3 343 336 153,000 28 20,989$ HCDCH HCDCH
TOTAL 1,985,500 240,419 8823-1584-077 1 200401 486800 PP3 637 637 214,200 30 26,606$ HCDCH HCDCH8823-1584-077 1 200402 486800 PP3 637 637 221,400 32 27,368$ HCDCH HCDCH8823-1584-077 1 200403 486800 PP3 637 637 208,200 30 26,436$ HCDCH HCDCH8823-1584-077 1 200404 486800 PP3 544 452 197,400 29 24,402$ HCDCH HCDCH8823-1584-077 1 200405 486800 PP3 543 449 199,200 29 24,938$ HCDCH HCDCH8823-1584-077 1 200406 486800 PP3 547 458 220,200 32 26,794$ HCDCH HCDCH8823-1584-077 1 200407 486800 PP3 548 460 218,400 31 26,622$ HCDCH HCDCH8823-1584-077 1 200408 486800 PP3 575 513 221,400 31 27,591$ HCDCH HCDCH8823-1584-077 1 200409 486800 PP3 575 513 222,000 31 28,623$ HCDCH HCDCH8823-1584-077 1 200410 486800 PP3 575 513 231,600 32 30,737$ HCDCH HCDCH8823-1584-077 1 200411 486800 PP3 569 502 215,400 29 29,960$ HCDCH HCDCH8823-1584-077 1 200412 486800 PP3 567 498 210,000 29 29,743$ HCDCH HCDCH

TABLE: STATE LARGE FACILITIES IN OAHU ELECTRICITY BILL HISTORY FOR YEAR 2004 (PROVIDED BY HECO)
ACCTNUM TARCDE REVPER METRNBR RATESCH BILLDMD MDM KWH NBRDAYS TOTAMT DEPARTMENT NAMETOTAL 2,579,400 329,819
9400-2851-001 1 200401 417930 J 228 228 101,040 29 12,038$ HCDCH SOH HCDCH *9400-2851-001 1 200402 417930 J 228 228 107,920 31 12,724$ HCDCH SOH HCDCH *9400-2851-001 1 200403 417930 J 225 225 105,040 31 12,549$ HCDCH SOH HCDCH *9400-2851-001 1 200404 417930 J 228 228 101,680 30 12,255$ HCDCH SOH HCDCH *9400-2851-001 1 200405 417930 J 230 230 100,400 29 12,350$ HCDCH SOH HCDCH *9400-2851-001 1 200406 417930 J 229 229 105,920 32 12,797$ HCDCH SOH HCDCH *9400-2851-001 1 200407 417930 J 240 240 120,160 31 14,262$ HCDCH SOH HCDCH *9400-2851-001 1 200408 417930 J 240 240 106,480 29 13,159$ HCDCH SOH HCDCH *9400-2851-001 1 200409 417930 J 239 239 119,280 32 14,864$ HCDCH SOH HCDCH *9400-2851-001 1 200410 417930 J 254 254 111,920 29 14,858$ HCDCH SOH HCDCH *9400-2851-001 1 200411 417930 J 251 251 116,480 30 15,811$ HCDCH SOH HCDCH *9400-2851-001 1 200412 417930 J 248 248 122,320 32 16,694$ HCDCH SOH HCDCH *
TOTAL 1,318,640 164,363 9400-2852-001 1 200401 417924 J 223 223 102,720 29 12,135$ HCDCH SOH HCDCH *9400-2852-001 1 200402 417924 J 226 226 109,600 31 12,860$ HCDCH SOH HCDCH *9400-2852-001 1 200403 417924 J 226 226 105,040 31 12,559$ HCDCH SOH HCDCH *9400-2852-001 1 200404 417924 J 223 223 103,600 30 12,377$ HCDCH SOH HCDCH *9400-2852-001 1 200405 417924 J 232 232 103,520 29 12,665$ HCDCH SOH HCDCH *9400-2852-001 1 200406 417924 J 228 228 108,560 32 13,036$ HCDCH SOH HCDCH *9400-2852-001 1 200407 417924 J 230 230 122,000 31 14,311$ HCDCH SOH HCDCH *9400-2852-001 1 200408 417924 J 234 234 107,680 29 13,198$ HCDCH SOH HCDCH *9400-2852-001 1 200409 417924 J 238 238 120,720 32 14,989$ HCDCH SOH HCDCH *9400-2852-001 1 200410 417924 J 243 243 112,240 29 14,767$ HCDCH SOH HCDCH *9400-2852-001 1 200411 417924 J 243 243 116,880 30 15,760$ HCDCH SOH HCDCH *9400-2852-001 1 200412 417924 J 243 243 125,360 32 16,977$ HCDCH SOH HCDCH *
TOTAL 1,337,920 165,635 8819-9077-077 1 200401 486862 PS 860 826 347,200 33 41,400$ Judiciary SOH JUDICIARY *8819-9077-077 1 200402 486862 PS 864 833 328,400 30 40,110$ Judiciary SOH JUDICIARY *8819-9077-077 1 200403 486862 PS 844 793 298,800 29 37,546$ Judiciary SOH JUDICIARY *8819-9077-077 1 200404 486862 PS 826 758 317,200 32 39,046$ Judiciary SOH JUDICIARY *8819-9077-077 1 200405 486862 PS 802 709 303,200 29 37,987$ Judiciary SOH JUDICIARY *8819-9077-077 1 200406 486862 PS 795 696 324,800 30 39,793$ Judiciary SOH JUDICIARY *8819-9077-077 1 200407 486862 PS 763 632 362,400 32 42,720$ Judiciary SOH JUDICIARY *8819-9077-077 1 200408 486862 PS 783 672 342,000 30 41,626$ Judiciary SOH JUDICIARY *8819-9077-077 1 200409 486862 PS 795 695 344,000 30 43,201$ Judiciary SOH JUDICIARY *8819-9077-077 1 200410 486862 PS 807 720 352,400 31 45,789$ Judiciary SOH JUDICIARY *8819-9077-077 1 200411 486862 PS 761 654 310,800 29 42,474$ Judiciary SOH JUDICIARY *8819-9077-077 1 200412 486862 PS 735 636 314,800 30 43,338$ Judiciary SOH JUDICIARY *
TOTAL 3,946,000 495,030 8824-2360-078 1 200401 491861 PS 965 854 400,000 32 47,164$ Judiciary SOH JUDICIARY *8824-2360-078 1 200402 491861 PS 968 860 387,000 30 46,402$ Judiciary SOH JUDICIARY *8824-2360-078 1 200403 491861 PS 927 844 359,000 29 43,862$ Judiciary SOH JUDICIARY *8824-2360-078 1 200404 491861 PS 925 840 388,000 32 46,391$ Judiciary SOH JUDICIARY *8824-2360-078 1 200405 491861 PS 933 855 365,000 29 45,043$ Judiciary SOH JUDICIARY *8824-2360-078 1 200406 491861 PS 929 848 393,000 30 47,395$ Judiciary SOH JUDICIARY *8824-2360-078 1 200407 491861 PS 932 853 420,000 32 49,844$ Judiciary SOH JUDICIARY *8824-2360-078 1 200408 491861 PS 930 850 407,000 30 49,321$ Judiciary SOH JUDICIARY *8824-2360-078 1 200409 491861 PS 912 848 412,000 32 51,189$ Judiciary SOH JUDICIARY *8824-2360-078 1 200410 491861 PS 909 851 382,000 29 50,200$ Judiciary SOH JUDICIARY *8824-2360-078 1 200411 491861 PS 871 830 369,000 29 50,011$ Judiciary SOH JUDICIARY *8824-2360-078 1 200412 491861 PS 845 830 401,000 33 54,026$ Judiciary SOH JUDICIARY *
4,683,000 580,849 8824-4780-075 1 200401 483812 J5 348 348 131,520 31 16,302$ Judiciary SOH JUDICIARY *8824-4780-075 1 200402 483812 J5 366 366 145,440 33 18,075$ Judiciary SOH JUDICIARY *8824-4780-075 1 200403 483812 J5 366 366 136,080 30 17,247$ Judiciary SOH JUDICIARY *8824-4780-075 1 200404 483812 J5 357 357 142,320 32 17,840$ Judiciary SOH JUDICIARY *8824-4780-075 1 200405 483812 J5 343 343 128,640 29 16,512$ Judiciary SOH JUDICIARY *8824-4780-075 1 200406 483812 J5 344 344 138,720 31 17,542$ Judiciary SOH JUDICIARY *8824-4780-075 1 200407 483812 J5 341 341 135,840 31 17,203$ Judiciary SOH JUDICIARY *8824-4780-075 1 200408 483812 J5 353 353 141,600 31 18,115$ Judiciary SOH JUDICIARY *8824-4780-075 1 200409 483812 J5 362 362 148,320 32 19,482$ Judiciary SOH JUDICIARY *8824-4780-075 1 200410 483812 J5 357 357 136,320 29 18,820$ Judiciary SOH JUDICIARY *8824-4780-075 1 200411 483812 J5 357 357 129,120 29 18,536$ Judiciary SOH JUDICIARY *8824-4780-075 1 200412 483812 J5 344 344 125,760 29 18,318$ Judiciary SOH JUDICIARY *
TOTAL 1,639,680 213,991 88203139077 1 200401 494972 J 433 433 96,240 31 13,307$ Public Libraries SOH HSPLS88203139077 1 200402 494972 J 422 422 100,080 33 13,743$ Public Libraries SOH HSPLS88203139077 1 200403 494972 J 451 451 89,520 29 12,971$ Public Libraries SOH HSPLS88203139077 1 200404 494972 J 448 448 98,880 32 13,924$ Public Libraries SOH HSPLS88203139077 1 200406 494972 J 454 454 186,720 60 27,039$ Public Libraries SOH HSPLS88203139077 1 200408 500621 J 442 442 209,040 61 29,318$ Public Libraries SOH HSPLS88203139077 1 200409 500621 J 443 443 104,880 30 15,210$ Public Libraries SOH HSPLS88203139077 1 200410 500621 J 443 443 106,080 32 15,849$ Public Libraries SOH HSPLS88203139077 1 200411 500621 J 430 430 92,880 29 14,657$ Public Libraries SOH HSPLS88203139077 1 200412 500621 J 424 424 87,120 28 14,123$ Public Libraries SOH HSPLS
TOTAL 1,171,440 170,141 8819-4960-078 1 200401 487117 J 93 71 22,080 33 3,060$ SOH - Other SOH FOREIGN TRADE8819-4960-078 1 200402 487117 J 115 115 22,400 30 3,291$ SOH - Other SOH FOREIGN TRADE8819-4960-078 1 200403 487117 J 110 110 19,840 29 2,989$ SOH - Other SOH FOREIGN TRADE8819-4960-078 1 200404 487117 J 115 115 24,000 32 3,485$ SOH - Other SOH FOREIGN TRADE8819-4960-078 1 200405 487117 J 117 117 23,360 29 3,476$ SOH - Other SOH FOREIGN TRADE8819-4960-078 1 200406 487117 J 118 118 26,560 30 3,821$ SOH - Other SOH FOREIGN TRADE8819-4960-078 1 200407 487117 J 119 119 32,320 32 4,426$ SOH - Other SOH FOREIGN TRADE8819-4960-078 1 200408 487117 J 125 125 28,160 30 4,078$ SOH - Other SOH FOREIGN TRADE8819-4960-078 1 200409 487117 J 125 125 28,480 30 4,225$ SOH - Other SOH FOREIGN TRADE8819-4960-078 1 200410 487117 J 122 122 27,840 31 4,258$ SOH - Other SOH FOREIGN TRADE8819-4960-078 1 200411 487117 J 97 97 24,960 29 3,839$ SOH - Other SOH FOREIGN TRADE8819-4960-078 1 200412 487117 J 99 99 23,360 30 3,719$ SOH - Other SOH FOREIGN TRADE
TOTAL 303,360 44,666 8823-4938-076 1 200401 487216 J3 2,138 2,138 217,800 29 36,357$ Stadium Authority STADIUM AUTHORITY *8823-4938-076 1 200402 487216 J3 2,052 2,052 327,600 32 48,275$ Stadium Authority STADIUM AUTHORITY *8823-4938-076 1 200403 487216 J3 1,615 1,145 273,600 30 40,084$ Stadium Authority STADIUM AUTHORITY *8823-4938-076 1 200404 487216 J3 1,615 1,159 255,600 30 37,970$ Stadium Authority STADIUM AUTHORITY *8823-4938-076 1 200405 487216 J3 1,615 1,354 234,000 28 35,961$ Stadium Authority STADIUM AUTHORITY *8823-4938-076 1 200406 487216 J3 1,615 1,289 291,600 33 42,499$ Stadium Authority STADIUM AUTHORITY *8823-4938-076 1 200407 487216 J3 1,615 850 244,800 30 37,098$ Stadium Authority STADIUM AUTHORITY *8823-4938-076 1 200408 487216 J3 1,692 1,692 271,800 31 41,124$ Stadium Authority STADIUM AUTHORITY *8823-4938-076 1 200409 487216 J3 2,124 2,124 313,200 31 49,726$ Stadium Authority STADIUM AUTHORITY *8823-4938-076 1 200410 487216 J3 2,153 2,153 322,200 29 52,558$ Stadium Authority STADIUM AUTHORITY *8823-4938-076 1 200411 487216 J3 2,102 2,102 376,200 32 60,647$ Stadium Authority STADIUM AUTHORITY *8823-4938-076 1 200412 487216 J3 2,160 2,160 288,000 29 50,106$ Stadium Authority STADIUM AUTHORITY *
TOTAL 3,416,400 532,406 8801-5005-075 1 200401 441203 PP3 1,356 1,291 476,400 33 57,012$ UH-Hawai‘i LEEWARD COMMUNITY COLLEGE8801-5005-075 1 200402 441203 PP3 1,349 1,277 421,200 28 53,418$ UH-Hawai‘i LEEWARD COMMUNITY COLLEGE8801-5005-075 1 200403 441203 PP3 1,409 1,397 494,400 30 60,803$ UH-Hawai‘i LEEWARD COMMUNITY COLLEGE8801-5005-075 1 200404 441203 PP3 1,344 1,267 459,600 30 57,451$ UH-Hawai‘i LEEWARD COMMUNITY COLLEGE8801-5005-075 1 200405 441203 PP3 1,368 1,315 532,800 33 64,476$ UH-Hawai‘i LEEWARD COMMUNITY COLLEGE8801-5005-075 1 200406 441203 PP3 1,301 1,181 422,400 29 54,340$ UH-Hawai‘i LEEWARD COMMUNITY COLLEGE8801-5005-075 1 200407 441203 PP3 1,267 1,114 482,400 33 59,225$ UH-Hawai‘i LEEWARD COMMUNITY COLLEGE8801-5005-075 1 200408 441203 PP3 1,255 1,090 432,000 28 54,477$ UH-Hawai‘i LEEWARD COMMUNITY COLLEGE8801-5005-075 1 200409 441203 PP3 1,375 1,330 490,800 30 62,200$ UH-Hawai‘i LEEWARD COMMUNITY COLLEGE8801-5005-075 1 200410 441203 PP3 1,387 1,354 554,400 32 70,986$ UH-Hawai‘i LEEWARD COMMUNITY COLLEGE

TABLE: STATE LARGE FACILITIES IN OAHU ELECTRICITY BILL HISTORY FOR YEAR 2004 (PROVIDED BY HECO)
ACCTNUM TARCDE REVPER METRNBR RATESCH BILLDMD MDM KWH NBRDAYS TOTAMT DEPARTMENT NAME8801-5005-075 1 200411 441203 PP3 1,382 1,368 524,400 30 70,365$ UH-Hawai‘i LEEWARD COMMUNITY COLLEGE8801-5005-075 1 200412 441203 PP3 1,358 1,320 462,000 29 65,465$ UH-Hawai‘i LEEWARD COMMUNITY COLLEGE
TOTAL 5,752,800 730,218 8813-7302-075 1 200401 239293 J 156 156 81,200 33 9,361$ UH-Hawai‘i UH SCHOOL OF MEDICINE8813-7302-075 1 200402 239293 J 161 161 80,720 31 9,519$ UH-Hawai‘i UH SCHOOL OF MEDICINE8813-7302-075 1 200403 239293 J 161 161 74,640 29 9,026$ UH-Hawai‘i UH SCHOOL OF MEDICINE8813-7302-075 1 200404 239293 J 152 152 84,400 32 9,855$ UH-Hawai‘i UH SCHOOL OF MEDICINE8813-7302-075 1 200405 239293 J 158 158 75,040 28 9,135$ UH-Hawai‘i UH SCHOOL OF MEDICINE8813-7302-075 1 200406 239293 J 162 162 94,320 33 11,036$ UH-Hawai‘i UH SCHOOL OF MEDICINE8813-7302-075 1 200407 239293 J 161 161 88,320 30 10,427$ UH-Hawai‘i UH SCHOOL OF MEDICINE8813-7302-075 1 200408 239293 J 166 166 87,200 29 10,488$ UH-Hawai‘i UH SCHOOL OF MEDICINE8813-7302-075 1 200409 239293 J 161 161 84,320 32 10,443$ UH-Hawai‘i UH SCHOOL OF MEDICINE8813-7302-075 1 200410 239293 J 173 173 74,880 30 10,008$ UH-Hawai‘i UH SCHOOL OF MEDICINE8813-7302-075 1 200411 239293 J 161 161 78,960 29 10,641$ UH-Hawai‘i UH SCHOOL OF MEDICINE8813-7302-075 1 200412 503097 J 178 178 68,720 28 9,902$ UH-Hawai‘i UH SCHOOL OF MEDICINE
TOTAL 972,720 119,840 8814-8544-076 1 200401 484522 J3 1,660 1,660 534,600 33 67,160$ UH-Hawai‘i UH KAP COMM COLLEGE BUSINESS8814-8544-076 1 200402 484522 J3 1,823 1,823 738,000 33 89,994$ UH-Hawai‘i UH KAP COMM COLLEGE BUSINESS8814-8544-076 1 200403 484522 J3 1,751 1,751 579,600 28 73,913$ UH-Hawai‘i UH KAP COMM COLLEGE BUSINESS8814-8544-076 1 200404 484522 J3 1,825 1,825 676,800 32 84,606$ UH-Hawai‘i UH KAP COMM COLLEGE BUSINESS8814-8544-076 1 200405 484522 J3 1,836 1,836 635,400 29 81,317$ UH-Hawai‘i UH KAP COMM COLLEGE BUSINESS8814-8544-076 1 200406 484522 J3 1,719 1,719 649,800 31 81,931$ UH-Hawai‘i UH KAP COMM COLLEGE BUSINESS8814-8544-076 1 200407 484522 J3 1,724 1,724 664,200 30 83,313$ UH-Hawai‘i UH KAP COMM COLLEGE BUSINESS8814-8544-076 1 200408 484522 J3 1,728 1,728 604,800 28 77,951$ UH-Hawai‘i UH KAP COMM COLLEGE BUSINESS8814-8544-076 1 200409 484522 J3 2,124 2,124 842,400 33 109,144$ UH-Hawai‘i UH KAP COMM COLLEGE BUSINESS8814-8544-076 1 200410 484522 J3 2,050 2,050 820,800 31 110,224$ UH-Hawai‘i UH KAP COMM COLLEGE BUSINESS8814-8544-076 1 200411 484522 J3 1,982 1,982 671,400 29 95,718$ UH-Hawai‘i UH KAP COMM COLLEGE BUSINESS8814-8544-076 1 200412 484522 J3 1,872 1,872 651,600 30 94,322$ UH-Hawai‘i UH KAP COMM COLLEGE BUSINESS
TOTAL 8,069,400 1,049,593 8815-4443-075 1 200401 483823 J 199 198 107,280 31 12,301$ UH-Hawai‘i UH WAIKIKI AQUARIUM8815-4443-075 1 200402 483823 J 209 209 114,960 32 13,232$ UH-Hawai‘i UH WAIKIKI AQUARIUM8815-4443-075 1 200403 483823 J 210 210 101,280 29 12,085$ UH-Hawai‘i UH WAIKIKI AQUARIUM8815-4443-075 1 200404 483823 J 211 211 112,800 31 13,184$ UH-Hawai‘i UH WAIKIKI AQUARIUM8815-4443-075 1 200405 483823 J 219 219 103,200 28 12,522$ UH-Hawai‘i UH WAIKIKI AQUARIUM8815-4443-075 1 200406 483823 J 215 215 120,000 32 14,069$ UH-Hawai‘i UH WAIKIKI AQUARIUM8815-4443-075 1 200407 483823 J 216 216 112,320 30 13,327$ UH-Hawai‘i UH WAIKIKI AQUARIUM8815-4443-075 1 200408 483823 J 221 221 123,360 32 14,605$ UH-Hawai‘i UH WAIKIKI AQUARIUM8815-4443-075 1 200409 483823 J 221 221 114,240 30 14,145$ UH-Hawai‘i UH WAIKIKI AQUARIUM8815-4443-075 1 200410 483823 J 218 218 106,080 30 13,791$ UH-Hawai‘i UH WAIKIKI AQUARIUM8815-4443-075 1 200411 483823 J 212 212 110,160 31 14,664$ UH-Hawai‘i UH WAIKIKI AQUARIUM8815-4443-075 1 200412 483823 J 214 214 101,280 28 13,985$ UH-Hawai‘i UH WAIKIKI AQUARIUM
TOTAL 1,326,960 161,912 8816-2141-076 1 200401 473513 J 220 220 91,280 31 11,105$ UH-Hawai‘i UH FACILITIES MANAGEMENT8816-2141-076 1 200402 473513 J 223 223 92,800 33 11,416$ UH-Hawai‘i UH FACILITIES MANAGEMENT8816-2141-076 1 200403 473513 J 215 215 80,480 29 10,204$ UH-Hawai‘i UH FACILITIES MANAGEMENT8816-2141-076 1 200404 473513 J 215 215 66,320 24 8,261$ UH-Hawai‘i UH FACILITIES MANAGEMENT CLOSED
TOTAL 330,880 40,987 8816-2154-076 1 200401 440980 PP3 20,447 19,418 10,078,800 31 1,093,888$ UH-Hawai‘i UH FACILITIES MANAGEMENT8816-2154-076 1 200402 440980 PP3 20,624 19,773 11,295,600 32 1,214,287$ UH-Hawai‘i UH FACILITIES MANAGEMENT8816-2154-076 1 200403 440980 PP3 20,601 19,727 9,993,600 29 1,111,206$ UH-Hawai‘i UH FACILITIES MANAGEMENT8816-2154-076 1 200404 440980 PP3 20,657 19,839 10,549,200 30 1,161,521$ UH-Hawai‘i UH FACILITIES MANAGEMENT8816-2154-076 1 200405 440980 PP3 20,791 20,107 10,557,600 29 1,178,246$ UH-Hawai‘i UH FACILITIES MANAGEMENT8816-2154-076 1 200406 440980 PP3 20,466 19,457 11,192,400 32 1,231,208$ UH-Hawai‘i UH FACILITIES MANAGEMENT8816-2154-076 1 200407 440980 PP3 20,683 19,891 10,867,200 30 1,202,797$ UH-Hawai‘i UH FACILITIES MANAGEMENT8816-2154-076 1 200408 440980 PP3 20,959 20,443 11,816,400 32 1,307,185$ UH-Hawai‘i UH FACILITIES MANAGEMENT8816-2154-076 1 200409 440980 PP3 22,290 22,290 12,046,800 30 1,388,790$ UH-Hawai‘i UH FACILITIES MANAGEMENT8816-2154-076 1 200410 440980 PP3 21,879 21,469 11,682,000 29 1,404,009$ UH-Hawai‘i UH FACILITIES MANAGEMENT8816-2154-076 1 200411 440980 PP3 22,282 22,275 9,690,000 30 1,252,797$ UH-Hawai‘i UH FACILITIES MANAGEMENT8816-2154-076 1 200412 440980 PP3 20,153 18,015 9,530,400 31 1,240,680$ UH-Hawai‘i UH FACILITIES MANAGEMENT
TOTAL 129,300,000 14,786,615 8817-7690-076 1 200401 486886 PP3 356 349 190,800 32 21,090$ UH-Hawai‘i UH FACILITIES MANAGEMENT8817-7690-076 1 200402 486886 PP3 356 349 200,400 32 22,157$ UH-Hawai‘i UH FACILITIES MANAGEMENT8817-7690-076 1 200403 486886 PP3 371 371 162,600 28 19,229$ UH-Hawai‘i UH FACILITIES MANAGEMENT8817-7690-076 1 200404 486886 PP3 381 381 198,000 31 22,476$ UH-Hawai‘i UH FACILITIES MANAGEMENT8817-7690-076 1 200405 486886 PP3 381 381 201,000 30 23,049$ UH-Hawai‘i UH FACILITIES MANAGEMENT8817-7690-076 1 200406 486886 PP3 380 380 198,600 31 22,778$ UH-Hawai‘i UH FACILITIES MANAGEMENT8817-7690-076 1 200407 486886 PP3 374 368 189,000 29 21,814$ UH-Hawai‘i UH FACILITIES MANAGEMENT8817-7690-076 1 200408 486886 PP3 379 376 207,000 32 23,768$ UH-Hawai‘i UH FACILITIES MANAGEMENT8817-7690-076 1 200409 486886 PP3 382 382 197,400 30 23,714$ UH-Hawai‘i UH FACILITIES MANAGEMENT8817-7690-076 1 200410 486886 PP3 374 367 196,200 29 24,419$ UH-Hawai‘i UH FACILITIES MANAGEMENT8817-7690-076 1 200411 486886 PP3 378 373 195,600 31 25,264$ UH-Hawai‘i UH FACILITIES MANAGEMENT8817-7690-076 1 200412 486886 PP3 380 379 178,800 29 24,044$ UH-Hawai‘i UH FACILITIES MANAGEMENT
TOTAL 2,315,400 273,801 8823-6252-075 1 200401 483790 PP3 1,315 1,226 346,000 29 45,544$ UH-Hawai‘i UH HONOLULU COMMUNITY COLLEGE8823-6252-075 1 200402 483790 PP3 1,357 1,310 448,000 31 55,346$ UH-Hawai‘i UH HONOLULU COMMUNITY COLLEGE8823-6252-075 1 200403 483790 PP3 1,326 1,248 396,000 32 50,822$ UH-Hawai‘i UH HONOLULU COMMUNITY COLLEGE8823-6252-075 1 200404 483790 PP3 1,357 1,310 424,000 30 53,625$ UH-Hawai‘i UH HONOLULU COMMUNITY COLLEGE8823-6252-075 1 200405 483790 PP3 1,356 1,308 394,000 29 51,641$ UH-Hawai‘i UH HONOLULU COMMUNITY COLLEGE8823-6252-075 1 200406 483790 PP3 1,266 1,128 390,000 32 50,075$ UH-Hawai‘i UH HONOLULU COMMUNITY COLLEGE8823-6252-075 1 200407 483790 PP3 1,247 1,090 392,000 30 50,002$ UH-Hawai‘i UH HONOLULU COMMUNITY COLLEGE8823-6252-075 1 200408 483790 PP3 1,442 1,442 448,000 32 58,045$ UH-Hawai‘i UH HONOLULU COMMUNITY COLLEGE8823-6252-075 1 200409 483790 PP3 1,474 1,474 482,000 30 63,725$ UH-Hawai‘i UH HONOLULU COMMUNITY COLLEGE8823-6252-075 1 200410 483790 PP3 1,468 1,462 486,000 30 66,369$ UH-Hawai‘i UH HONOLULU COMMUNITY COLLEGE8823-6252-075 1 200411 483790 PP3 1,417 1,360 414,000 31 60,245$ UH-Hawai‘i UH HONOLULU COMMUNITY COLLEGE8823-6252-075 1 200412 483790 PP3 1,391 1,308 386,000 29 57,788$ UH-Hawai‘i UH HONOLULU COMMUNITY COLLEGE
TOTAL 5,006,000 663,227 9500-5803-001 1 200401 472628 PS 1,001 974 444,600 33 51,288$ UH-Hawai‘i SOH WINDWARD COMMUNITY COLLEGE9500-5803-001 1 200402 472628 PS 1,046 1,046 475,200 30 55,667$ UH-Hawai‘i SOH WINDWARD COMMUNITY COLLEGE9500-5803-001 1 200403 472628 PS 1,041 1,036 493,800 32 57,728$ UH-Hawai‘i SOH WINDWARD COMMUNITY COLLEGE9500-5803-001 1 200404 472628 PS 1,023 999 457,800 30 54,375$ UH-Hawai‘i SOH WINDWARD COMMUNITY COLLEGE9500-5803-001 1 200405 472628 PS 1,002 958 458,400 29 54,597$ UH-Hawai‘i SOH WINDWARD COMMUNITY COLLEGE9500-5803-001 1 200406 472628 PS 993 940 489,600 32 57,727$ UH-Hawai‘i SOH WINDWARD COMMUNITY COLLEGE9500-5803-001 1 200407 472628 PS 1,001 955 456,600 30 54,641$ UH-Hawai‘i SOH WINDWARD COMMUNITY COLLEGE9500-5803-001 1 200408 472628 PS 999 952 453,600 29 54,733$ UH-Hawai‘i SOH WINDWARD COMMUNITY COLLEGE9500-5803-001 1 200409 472628 PS 1,080 1,080 525,000 33 63,890$ UH-Hawai‘i SOH WINDWARD COMMUNITY COLLEGE9500-5803-001 1 200410 472628 PS 1,154 1,154 519,000 33 66,846$ UH-Hawai‘i SOH WINDWARD COMMUNITY COLLEGE9500-5803-001 1 200411 472628 PS 1,076 998 474,600 31 63,688$ UH-Hawai‘i SOH WINDWARD COMMUNITY COLLEGE9500-5803-001 1 200412 472628 PS 1,057 959 402,000 27 56,922$ UH-Hawai‘i SOH WINDWARD COMMUNITY COLLEGE
TOTAL 5,650,200 692,104 9800-2426-001 1 200401 441963 J 270 270 152,080 33 17,134$ UH-Hawai‘i UH HIMB9800-2426-001 1 200402 441963 J 276 276 147,360 29 17,151$ UH-Hawai‘i UH HIMB9800-2426-001 1 200403 441963 J 256 250 139,600 32 16,291$ UH-Hawai‘i UH HIMB9800-2426-001 1 200404 441963 J 256 245 146,160 30 16,949$ UH-Hawai‘i UH HIMB9800-2426-001 1 200405 441963 J 256 238 134,320 29 15,956$ UH-Hawai‘i UH HIMB9800-2426-001 1 200406 441963 J 256 231 122,160 32 14,957$ UH-Hawai‘i UH HIMB9800-2426-001 1 200407 441963 J 306 306 137,040 30 16,910$ UH-Hawai‘i UH HIMB9800-2426-001 1 200408 441963 J 292 292 138,320 29 16,952$ UH-Hawai‘i UH HIMB9800-2426-001 1 200409 441963 J 293 293 148,480 33 18,392$ UH-Hawai‘i UH HIMB9800-2426-001 1 200410 441963 J 252 252 128,720 30 16,534$ UH-Hawai‘i UH HIMB9800-2426-001 1 200411 441963 J 271 271 129,040 29 17,365$ UH-Hawai‘i UH HIMB9800-2426-001 1 200412 441963 J 242 242 135,440 31 18,180$ UH-Hawai‘i UH HIMB
TOTAL 1,658,720 202,771

APPENDIX 2.1
HECO Rebate History for All State Facilities on Oahu from 1997 through 2004

TABLE: STATE LARGE FACILITIES IN OAHU REBATE HISTORY SINCE YEAR 1997 (PROVIDED BY HECO)
NAME CUSTNBR DSM DSM TARCDE CUS CUS REBATAMT REBAMTPD ACCTNUM INSENDDT EQUIP PAYYRPGMID SEQNO KWSV KWHSV
HCDCH - 130 88222776 RNC 10738 OAHU 0.565 2,227 750 750 0400-0237-001 4/1/2004 WATERHT 2004HCDCH - 130 88222776 RNC 10739 OAHU 0.565 2,227 750 750 0400-0238-001 4/1/2004 WATERHT 2004HCDCH - 130 88222776 RNC 10740 OAHU 0.565 2,227 750 750 0400-0239-001 4/1/2004 WATERHT 2004HCDCH - 130 88222776 RNC 10741 OAHU 0.565 2,227 750 750 0400-0240-001 4/1/2004 WATERHT 2004HCDCH - 130 88222776 RNC 10742 OAHU 0.565 2,227 750 750 0400-0241-001 4/1/2004 WATERHT 2004HCDCH - 130 88222776 RNC 10743 OAHU 0.565 2,227 750 750 0400-0242-001 4/1/2004 WATERHT 2004HCDCH - 130 88222776 RNC 10744 OAHU 0.565 2,227 750 750 0400-0243-001 4/1/2004 WATERHT 2004HCDCH - 130 88222776 RNC 10745 OAHU 0.565 2,227 750 750 0400-0244-001 4/1/2004 WATERHT 2004HCDCH - 130 88222776 RNC 10752 OAHU 0.565 2,227 750 750 0400-1755-001 4/1/2004 WATERHT 2004HCDCH - 130 88222776 RNC 10753 OAHU 0.565 2,227 750 750 0400-1756-001 4/1/2004 WATERHT 2004HCDCH - 130 88222776 RNC 10755 OAHU 0.565 2,227 750 750 0400-1758-001 4/1/2004 WATERHT 2004HCDCH - 130 88222776 RNC 10756 OAHU 0.565 2,227 750 750 0400-1759-001 4/1/2004 WATERHT 2004HCDCH - 130 88222776 RNC 10757 OAHU 0.565 2,227 750 750 0400-1760-001 4/1/2004 WATERHT 2004HCDCH - 130 88222776 RNC 10746 OAHU 0.565 2,227 750 750 0400-1761-001 4/1/2004 WATERHT 2004HCDCH - 130 88222776 RNC 10747 OAHU 0.565 2,227 750 750 0400-1762-001 4/1/2004 WATERHT 2004HCDCH - 130 88222776 RNC 10748 OAHU 0.565 2,227 750 750 0400-1763-001 4/1/2004 WATERHT 2004HCDCH - 130 88222776 RNC 10749 OAHU 0.565 2,227 750 750 0400-1764-001 4/1/2004 WATERHT 2004HCDCH - 130 88222776 RNC 10750 OAHU 0.565 2,227 750 750 0400-1765-001 4/1/2004 WATERHT 2004HCDCH - 130 88222776 RNC 10751 OAHU 0.565 2,227 750 750 0400-1766-001 4/1/2004 WATERHT 2004HCDCH - 130 88222776 RWH 88350 OAHU 0.99 4,172 800 800 8807-4224-010 10/19/1998 WATERHT 1999HCDCH **** 98041058 RNC 9723 OAHU 0.565 2,227 750 750 0300-8422-001 1/8/2004 WATERHT 2004HCDCH **** 98041058 RNC 9724 OAHU 0.565 2,227 750 750 0300-8423-001 1/8/2004 WATERHT 2004HCDCH **** 98041058 RNC 9725 OAHU 0.565 2,227 750 750 0300-8424-001 1/8/2004 WATERHT 2004HCDCH **** 98041058 RNC 9726 OAHU 0.565 2,227 750 750 0300-8425-001 1/8/2004 WATERHT 2004HCDCH **** 98041058 RNC 9727 OAHU 0.565 2,227 750 750 0300-8426-001 1/8/2004 WATERHT 2004HCDCH **** 98041058 RNC 9728 OAHU 0.565 2,227 750 750 0300-8427-001 1/8/2004 WATERHT 2004HCDCH **** 98041058 RNC 9729 OAHU 0.565 2,227 750 750 0300-8428-001 1/8/2004 WATERHT 2004HCDCH **** 98041058 RNC 9730 OAHU 0.565 2,227 750 750 0300-8429-001 1/8/2004 WATERHT 2004HCDCH **** 98041058 RNC 9731 OAHU 0.565 2,227 750 750 0300-8430-001 1/8/2004 WATERHT 2004HCDCH **** 98041058 RNC 9732 OAHU 0.565 2,227 750 750 0300-8436-001 1/8/2004 WATERHT 2004HCDCH **** 98041058 RNC 9733 OAHU 0.565 2,227 750 750 0300-8437-001 1/8/2004 WATERHT 2004HCDCH **** 98041058 RNC 9734 OAHU 0.565 2,227 750 750 0300-8438-001 1/8/2004 WATERHT 2004HCDCH **** 98041058 RNC 9735 OAHU 0.565 2,227 750 750 0300-8439-001 1/8/2004 WATERHT 2004HCDCH **** 98041058 RNC 9736 OAHU 0.565 2,227 750 750 0300-8440-001 1/8/2004 WATERHT 2004HCDCH **** 98041058 RNC 9737 OAHU 0.565 2,227 750 750 0300-8441-001 1/8/2004 WATERHT 2004HCDCH **** 98041058 RNC 9738 OAHU 0.565 2,227 750 750 0300-8442-001 1/8/2004 WATERHT 2004HCDCH **** 98041058 RNC 9739 OAHU 0.565 2,227 750 750 0300-8443-001 1/8/2004 WATERHT 2004HCDCH **** 98041058 RNC 9740 OAHU 0.565 2,227 750 750 0300-8444-001 1/8/2004 WATERHT 2004HCDCH **** 98041058 RNC 9741 OAHU 0.565 2,227 750 750 0300-8445-001 1/8/2004 WATERHT 2004HCDCH **** 98041058 RNC 9742 OAHU 0.565 2,227 750 750 0300-8446-001 1/8/2004 WATERHT 2004HCDCH **** 98041058 RNC 9743 OAHU 0.565 2,227 750 750 0300-8447-001 1/8/2004 WATERHT 2004HCDCH **** 98041058 RNC 9744 OAHU 0.565 2,227 750 750 0300-8448-001 1/8/2004 WATERHT 2004HCDCH **** 98041058 RNC 9745 OAHU 0.565 2,227 750 750 0300-8449-001 1/8/2004 WATERHT 2004HCDCH **** 98041058 RNC 9746 OAHU 0.565 2,227 750 750 0300-8450-001 1/8/2004 WATERHT 2004HCDCH **** 98041058 RNC 9747 OAHU 0.565 2,227 750 750 0300-8451-001 1/8/2004 WATERHT 2004HCDCH **** 98041058 RNC 9748 OAHU 0.565 2,227 750 750 0300-8452-001 1/8/2004 WATERHT 2004HCDCH **** 98041058 RNC 9749 OAHU 0.565 2,227 750 750 0300-8453-001 1/8/2004 WATERHT 2004HCDCH **** 98041058 RNC 9750 OAHU 0.565 2,227 750 750 0300-8454-001 1/7/2004 WATERHT 2004HCDCH **** 98041058 RNC 9751 OAHU 0.565 2,227 750 750 0300-8455-001 1/7/2004 WATERHT 2004HCDCH **** 98041058 RNC 9752 OAHU 0.565 2,227 750 750 0300-8456-001 1/7/2004 WATERHT 2004HCDCH **** 98041058 RNC 9753 OAHU 0.565 2,227 750 750 0300-8457-001 1/7/2004 WATERHT 2004HCDCH **** 98041058 RNC 9754 OAHU 0.565 2,227 750 750 0300-8458-001 1/7/2004 WATERHT 2004HCDCH **** 98041058 RNC 9755 OAHU 0.565 2,227 750 750 0300-8459-001 1/7/2004 WATERHT 2004HCDCH **** 98041058 RNC 9756 OAHU 0.565 2,227 750 750 0300-8460-001 1/7/2004 WATERHT 2004HCDCH **** 98041058 RNC 9757 OAHU 0.565 2,227 750 750 0300-8461-001 1/7/2004 WATERHT 2004HCDCH **** 98041058 RNC 9758 OAHU 0.565 2,227 750 750 0300-8462-001 1/7/2004 WATERHT 2004HCDCH **** 98041058 RNC 9759 OAHU 0.565 2,227 750 750 0300-8464-001 1/7/2004 WATERHT 2004HCDCH **** 98041058 RNC 9760 OAHU 0.565 2,227 750 750 0300-8465-001 1/7/2004 WATERHT 2004HCDCH **** 98041058 RNC 9761 OAHU 0.565 2,227 750 750 0300-8466-001 1/7/2004 WATERHT 2004HCDCH **** 98041058 RNC 9762 OAHU 0.565 2,227 750 750 0300-8468-001 1/7/2004 WATERHT 2004HCDCH **** 98041058 RNC 9763 OAHU 0.565 2,227 750 750 0300-8469-001 1/7/2004 WATERHT 2004HCDCH **** 98041058 RNC 9764 OAHU 0.565 2,227 750 750 0300-8470-001 1/7/2004 WATERHT 2004HCDCH **** 98041058 RNC 9765 OAHU 0.565 2,227 750 750 0300-8472-001 1/7/2004 WATERHT 2004HCDCH **** 98041058 RNC 9766 OAHU 0.565 2,227 750 750 0300-8473-001 1/7/2004 WATERHT 2004HCDCH **** 98041058 RNC 9767 OAHU 0.565 2,227 750 750 0300-8474-001 1/7/2004 WATERHT 2004HCDCH **** 98041058 RNC 9768 OAHU 0.565 2,227 750 750 0300-8476-001 1/7/2004 WATERHT 2004HCDCH **** 98041058 RNC 9769 OAHU 0.565 2,227 750 750 0300-8477-001 1/7/2004 WATERHT 2004HCDCH **** 98041058 RNC 9770 OAHU 0.565 2,227 750 750 0300-8478-001 1/7/2004 WATERHT 2004HCDCH **** 98041058 RNC 9771 OAHU 0.565 2,227 750 750 0300-8479-001 1/7/2004 WATERHT 2004HCDCH **** 98041058 RNC 9772 OAHU 0.565 2,227 750 750 0300-8480-001 1/7/2004 WATERHT 2004HCDCH **** 98041058 RNC 9773 OAHU 0.565 2,227 750 750 0300-8481-001 1/7/2004 WATERHT 2004HCDCH **** 98041058 RNC 9774 OAHU 0.565 2,227 750 750 0300-8482-001 1/7/2004 WATERHT 2004HCDCH **** 98041058 RNC 9775 OAHU 0.565 2,227 750 750 0300-8483-001 1/7/2004 WATERHT 2004HCDCH **** 98041058 RNC 9776 OAHU 0.565 2,227 750 750 0300-8484-001 1/7/2004 WATERHT 2004HCDCH **** 98041058 RNC 10641 OAHU 0.565 2,227 750 750 0300-8485-001 1/8/2004 WATERHT 2004HCDCH **** 98041058 RNC 10642 OAHU 0.565 2,227 750 750 0300-8486-001 1/8/2004 WATERHT 2004HCDCH **** 98041058 RNC 10643 OAHU 0.565 2,227 750 750 0300-8487-001 1/8/2004 WATERHT 2004HCDCH **** 98041058 RNC 10644 OAHU 0.565 2,227 750 750 0300-8488-001 1/8/2004 WATERHT 2004HCDCH **** 98041058 RNC 10645 OAHU 0.565 2,227 750 750 0300-8489-001 1/8/2004 WATERHT 2004HCDCH **** 98041058 RNC 11596 OAHU 0.565 2,227 750 750 0300-8490-001 11/1/2004 WATERHT 2004HCDCH **** 98041058 RNC 11597 OAHU 0.565 2,227 750 750 0300-8491-001 11/1/2004 WATERHT 2004HCDCH **** 98041058 RNC 11598 OAHU 0.565 2,227 750 750 0300-8492-001 11/1/2004 WATERHT 2004HCDCH **** 98041058 RNC 11599 OAHU 0.565 2,227 750 750 0300-8493-001 11/1/2004 WATERHT 2004SOH-HOUSING & COMMUNITY 99002152 RNC 2521 OAHU 0.99 4,172 1,500 1500 8802-8819-003 11/10/1999 WATERHT 1999SOH-HOUSING & COMMUNITY 99002152 RNC 2530 OAHU 0.99 4,172 1,500 1500 8802-8820-003 11/10/1999 WATERHT 1999SOH-HOUSING & COMMUNITY 99002152 RNC 2520 OAHU 0.99 4,172 1,500 1500 8802-8822-003 11/10/1999 WATERHT 1999SOH-HOUSING & COMMUNITY 99002152 RNC 2531 OAHU 0.99 4,172 1,500 1500 8802-8823-003 11/10/1999 WATERHT 1999SOH-HOUSING & COMMUNITY 99002152 RNC 2518 OAHU 0.99 4,172 1,500 1500 8802-8824-003 11/10/1999 WATERHT 1999SOH-HOUSING & COMMUNITY 99002152 RNC 2533 OAHU 0.99 4,172 1,500 1500 8802-8825-003 11/10/1999 WATERHT 1999SOH-HOUSING & COMMUNITY 99002152 RNC 2519 OAHU 0.99 4,172 1,500 1500 8802-8826-003 11/10/1999 WATERHT 1999SOH-HOUSING & COMMUNITY 99002152 RNC 2532 OAHU 0.99 4,172 1,500 1500 8802-8827-003 11/10/1999 WATERHT 1999SOH-HOUSING & COMMUNITY 99002152 RNC 2525 OAHU 0.99 4,172 1,500 1500 8802-8828-003 11/10/1999 WATERHT 1999SOH-HOUSING & COMMUNITY 99002152 RNC 2524 OAHU 0.99 4,172 1,500 1500 8802-8829-003 11/10/1999 WATERHT 1999SOH-HOUSING & COMMUNITY 99002152 RNC 2528 OAHU 0.99 4,172 1,500 1500 8802-8830-003 11/10/1999 WATERHT 1999SOH-HOUSING & COMMUNITY 99002152 RNC 2523 OAHU 0.99 4,172 1,500 1500 8802-8832-003 11/10/1999 WATERHT 1999SOH-HOUSING & COMMUNITY 99002152 RNC 2526 OAHU 0.99 4,172 1,500 1500 8802-8833-003 11/10/1999 WATERHT 1999SOH-HOUSING & COMMUNITY 99002152 RNC 2529 OAHU 0.99 4,172 1,500 1500 8802-8836-003 11/10/1999 WATERHT 1999SOH-HOUSING & COMMUNITY 99002152 RNC 2535 OAHU 0.99 4,172 1,500 1500 8802-8942-004 11/10/1999 WATERHT 1999SOH-HOUSING & COMMUNITY 99002152 RNC 2522 OAHU 0.99 4,172 1,500 1500 9900-3153-002 11/10/1999 WATERHT 1999SOH-HOUSING & COMMUNITY 99002152 RNC 2517 OAHU 0.99 4,172 1,500 1500 9900-4155-002 11/10/1999 WATERHT 1999SOH-HOUSING & COMMUNITY 99002152 RNC 2527 OAHU 0.99 4,172 1,500 1500 9900-4721-002 11/10/1999 WATERHT 1999SOH-HOUSING & COMMUNITY 99002152 RNC 2536 OAHU 0.99 4,172 1,500 1500 9900-4722-002 11/10/1999 WATERHT 1999SOH HCDCH HOOKIPA KAHALUU-172* 94015179 RWH 88363 OAHU 0.99 4,172 800 800 8807-4233-004 10/22/1998 WATERHT 1999
Sub-TOTA 270,226 91,600SOH HCDCH 3014505 CINC 1666 OAHU 7.38 32,042 2,808 2808 0200-6184-002 4/17/2003 LIGHTING 2003SOH FOREIGN TRADE 88200785 CIEE 1323 OAHU 9.968 54,183 3,528 3528 8819-4961-076 4/15/1999 LIGHTING 1999SOH CONVENTION CTR AUTHORITY 96030543 CINC 25 OAHU 178.812 743,385 124,998 124998 9600-5614-003 10/15/1997 LIGHTING 1997
Sub-TOTA 829,610 131,334SOH HCDCH 3014505 CINC 1787 OAHU 0.19 978 100 100 0200-6184-002 4/17/2003 MOTOR 2003SOH CONVENTION CTR AUTHORITY 96030543 CIEE 1174 OAHU 0.085 511 50 50 9600-5614-003 2/22/1999 MOTOR 1999SOH CONVENTION CTR AUTHORITY 96030543 CIEE 1349 OAHU 1.19 7,147 450 450 9600-5614-003 7/29/1999 MOTOR 1999SOH CONVENTION CTR AUTHORITY 96030543 CINC 180 OAHU 4.25 17,850 1 1 9600-5614-003 10/15/1997 MOTOR 1997
Sub-TOTA 26,486 601SOH HCAP 88241853 CICR 173 OAHU 4.5 2,106 668 668 8803-9119-001 4/29/1998 CUSTOM 1998SOH HCDCH 3014505 CINC 1667 OAHU 4.5 33,750 2,250 2250 0200-6184-002 4/17/2003 CUSTOM 2003SOH CONVENTION CTR AUTHORITY 96030543 CINC 179 OAHU 30.7 554,012 1 1 9600-5614-003 10/15/1997 CUSTOM 1997
Sub-TOTA 589,868 2,919SOH CONVENTION CTR AUTHORITY 96030543 CIEE 3768 OAHU 17.2 59,280 16,650 16650 9600-5614-003 9/1/2004 SPACCOOL 2004SOH CONVENTION CTR AUTHORITY 96030543 CINC 26 OAHU 334.84 1,156,720 125,000 125000 9600-5614-003 10/15/1997 SPACCOOL 1997
Sub-TOTA 1,216,000 141,650
TOTAL 2,932,189 368,104
SOH DAGS 88263561 CIEE 3287 OAHU 38.577 171,726 9,954 9954 0300-4383-003 11/20/2003 LIGHTING 2004SOH DAGS 88071307 CIEE 1414 OAHU 0.525 2,460 420 420 8800-6839-077 7/15/1999 LIGHTING 1999SOH DAGS 88263561 CIEE 163 OAHU 33.696 153,504 7,440 7440 8819-9076-075 11/20/1996 LIGHTING 1996SOH DAGS 88263561 CIEE 2378 OAHU 8.652 46,535 2,330 2330 8820-3136-075 12/5/2001 LIGHTING 2001SOH DAGS 88263561 CIEE 2062 OAHU 44.66 240,207 13,331 13331 8820-4007-075 6/13/2001 LIGHTING 2001SOH DAGS 88263561 CIEE 85 OAHU 36.35 165,810 6,980 6980 8820-5318-076 7/27/1996 LIGHTING 1996SOH DAGS 88263561 CIEE 1707 OAHU 0.518 2,427 440 440 8820-5318-076 5/19/2000 LIGHTING 2000SOH DAGS 88263561 CIEE 3642 OAHU 7.296 34,474 1,703 1703 8820-5318-076 4/30/2004 LIGHTING 2004SOH DAGS 88263561 CIEE 2515 OAHU 20.244 108,884 6,345 6345 8820-6927-075 4/29/2002 LIGHTING 2002SOH DAGS 88263561 CIEE 2516 OAHU 26.376 141,865 6,480 6480 8823-1077-076 6/15/2002 LIGHTING 2002SOH DAGS 88263561 CIEE 2345 OAHU 27.16 146,082 7,810 7810 8824-2361-079 10/15/2001 LIGHTING 2002SOH DAGS 88263561 CIEE 2314 OAHU 55.44 298,188 13,572 13572 8824-3048-076 9/15/2001 LIGHTING 2001SOH DAGS 88263561 CIEE 3236 OAHU 20.3 109,185 7,123 7123 8824-4189-078 8/1/2003 LIGHTING 2003SOH DAGS 88263561 CIEE 3542 OAHU 31.416 168,973 10,330 10330 8824-4781-075 3/7/2004 LIGHTING 2004SOH DAGS 88263561 CIEE 1588 OAHU 0.175 820 500 500 8824-8557-076 8/18/1999 LIGHTING 2000SOH DAGS 88263561 CIEE 1783 OAHU 22.792 122,588 6,671 6671 8824-8557-076 3/15/2001 LIGHTING 2001SOH DAGS 88263561 CIEE 1784 OAHU 121.128 651,496 24,226 24226 8824-8557-076 2/5/2001 LIGHTING 2001SOH DAGS 88263561 CIEE 1587 OAHU 0.133 623 380 380 8824-8619-075 8/18/1999 LIGHTING 2000SOH DAGS 88263561 CIEE 3100 OAHU 27.944 150,299 7,423 7423 9300-0640-002 5/11/2003 LIGHTING 2003SOH DAGS 88263561 CINC 258 OAHU 68.188 307,559 17,619 17619 9800-1977-002 8/1/1998 LIGHTING 1998SOH DAGS CENTRAL SERVICES 93028504 CIEE 2936 OAHU 89.404 480,866 17,881 17881 8819-2839-079 3/31/2003 LIGHTING 2003
Sub-TOTA 3,504,571 168,958SOH DAGS 88263561 CIEE 3289 OAHU 1.395 8,006 745 745 0300-4383-003 12/1/2003 MOTOR 2004SOH DAGS 88263561 CIEE 3675 OAHU 0.875 5,013 1,070 1070 8819-9076-075 12/15/2004 MOTOR 2005

TABLE: STATE LARGE FACILITIES IN OAHU REBATE HISTORY SINCE YEAR 1997 (PROVIDED BY HECO)
NAME CUSTNBR DSM DSM TARCDE CUS CUS REBATAMT REBAMTPD ACCTNUM INSENDDT EQUIP PAYYRPGMID SEQNO KWSV KWHSV
SOH DAGS CENTRAL SERVICES 93028504 CIEE 800 OAHU 0.05 211 50 50 8819-2839-079 4/28/1998 MOTOR 1998Sub-TOTA 13,229 1,865
SOH DAGS 88263561 CICR 1136 OAHU 5.25 39,375 2,625 2625 0300-4383-003 12/1/2003 CUSTOM 2004SOH DAGS 88263561 CICR 1264 OAHU 6 65,000 4,000 4000 0300-4383-003 11/30/2003 CUSTOM 2004SOH DAGS 88263561 CICR 1306 OAHU 7.5 56,250 3,750 3750 8819-9076-075 12/15/2004 CUSTOM 2005SOH DAGS 88263561 CICR 1307 OAHU 3.6 39,000 2,400 2400 8819-9076-075 12/15/2004 CUSTOM 2005SOH DAGS 88263561 CICR 418 OAHU 0 2,830 223 223 8824-4781-075 8/18/1999 CUSTOM 2001
Sub-TOTA 202,455 12,998SOH DAGS 88263561 CIEE 3288 OAHU 25.8 88,920 15,075 15075 0300-4383-003 11/20/2003 SPACCOOL 2004SOH DAGS 88263561 CIEE 3676 OAHU 46.986 208,805 16,667 16667 8819-9076-075 12/15/2004 SPACCOOL 2005SOH DAGS 88263561 CIEE 623 OAHU 37.35 167,535 23,220 23220 8820-5318-076 10/28/1998 SPACCOOL 1998SOH DAGS 88263561 CIEE 901 OAHU 15.438 69,248 5,152 5152 8824-4781-075 7/29/1998 SPACCOOL 1998SOH DAGS 88263561 CINC 257 OAHU 33.2 148,920 21,200 21200 9800-1977-002 9/1/1998 SPACCOOL 1998
Sub-TOTA 683,428 81,314
TOTAL 4,403,683 265,135
SOH DEPT OF DEFENSE 92043214 CIEE 701 OAHU 6.33 26,143 1,655 1655 9500-4908-001 11/10/1997 LIGHTING 1998Sub-TOTA 26,143 1,655
SOH DEPT OF DEFENSE 92043214 CIEE 734 OAHU 0.342 1,195 153 153 9500-4908-001 11/10/1997 SPACCOOL 1998Sub-TOTA 1,195 153
TOTAL 27,338 1,808
SOH MALUHIA HOSP 88218449 CIEE 1076 OAHU 26.988 182,602 8,276 8276 8821-2602-075 11/20/1998 LIGHTING 1998SOH DEPT OF HEALTH 88145757 CIEE 1077 OAHU 43.751 343,398 18,427 18427 8813-6841-075 3/12/1999 LIGHTING 1999
TOTAL 526,000 26,703
SOH DOE 1014685 CIEE 2493 OAHU 21.504 87,898 6,541 6541 0000-1024-002 7/31/2002 LIGHTING 2002SOH DOE 1014685 CINC 700 OAHU 11.696 58,858 3,599 3599 0000-3209-004 12/30/2000 LIGHTING 2001SOH DOE 1014685 CINC 1221 OAHU 31.53 135,568 10,400 10400 0000-3209-004 8/1/2003 LIGHTING 2003SOH DOE 1014685 CIEE 3207 OAHU 39.24 160,394 11,889 11889 0100-2579-004 5/22/2003 LIGHTING 2003SOH DOE 1014685 CINC 1942 OAHU 16.596 62,650 6,293 6293 0300-1631-003 1/30/2004 LIGHTING 2004SOH DOE 1014685 CINC 1941 OAHU 15.996 70,382 6,229 6229 0300-4042-002 3/9/2004 LIGHTING 2005SOH DOE 1014685 CIEE 2625 OAHU 5.928 24,231 2,050 2050 8800-4858-077 11/23/2001 LIGHTING 2002SOH DOE 1014685 CIEE 1841 OAHU 6.024 24,623 1,412 1412 8800-5071-078 6/30/2002 LIGHTING 2002SOH DOE 1014685 CIEE 2318 OAHU 12.408 50,718 2,980 2980 8800-5071-078 9/30/2001 LIGHTING 2002SOH DOE 1014685 CIEE 2487 OAHU 10.104 41,300 2,375 2375 8800-6706-077 10/25/2002 LIGHTING 2002SOH DOE 1014685 CIEE 3439 OAHU 31.728 129,688 8,207 8207 8800-8734-077 12/9/2003 LIGHTING 2004SOH DOE 1014685 CIEE 2774 OAHU 13.368 54,642 3,120 3120 8801-3172-077 3/21/2003 LIGHTING 2003SOH DOE 1014685 CIEE 1956 OAHU 3.88 23,915 4,316 4316 8801-5001-077 9/7/2001 LIGHTING 2002SOH DOE 1014685 CIEE 3387 OAHU 18.816 76,910 5,900 5900 8801-9582-077 9/30/2003 LIGHTING 2003SOH DOE 1014685 CIEE 2775 OAHU 26.4 107,910 6,277 6277 8802-6027-077 3/21/2003 LIGHTING 2003SOH DOE 1014685 CIEE 3209 OAHU 13.224 54,053 5,836 5836 8802-8958-077 5/22/2003 LIGHTING 2003SOH DOE 1014685 CIEE 1948 OAHU 1.608 6,573 555 555 8803-6359-077 9/22/2000 LIGHTING 2002SOH DOE 1014685 CINC 1490 OAHU 1.488 5,617 508 508 8803-6359-077 1/26/2002 LIGHTING 2003SOH DOE 1014685 CIEE 3386 OAHU 11.904 48,658 4,654 4654 8803-6418-077 10/30/2003 LIGHTING 2003SOH DOE 1014685 CIEE 3396 OAHU 13.488 55,132 3,646 3646 8804-1194-077 8/30/2003 LIGHTING 2003SOH DOE 1014685 CIEE 2488 OAHU 21.672 88,584 5,533 5533 8804-8426-077 9/9/2002 LIGHTING 2002SOH DOE 1014685 CIEE 2276 OAHU 2.16 8,829 969 969 8805-0060-077 7/15/2001 LIGHTING 2002SOH DOE 1014685 CIEE 3438 OAHU 51.384 210,032 15,087 15087 8806-1340-077 12/8/2003 LIGHTING 2004SOH DOE 1014685 CIEE 3650 OAHU 19.872 81,227 4,856 4856 8806-1340-077 6/30/2004 LIGHTING 2004SOH DOE 1014685 CIEE 2841 OAHU 13.824 56,506 3,624 3624 8806-3540-077 11/25/2003 LIGHTING 2003SOH DOE 1014685 CIEE 3651 OAHU 29.76 121,644 7,930 7930 8806-3540-077 6/30/2004 LIGHTING 2004SOH DOE 1014685 CIEE 1847 OAHU 5.76 23,544 1,344 1344 8806-3995-077 9/19/2001 LIGHTING 2001SOH DOE 1014685 CIEE 2483 OAHU 21.072 86,132 4,951 4951 8806-3995-077 3/21/2003 LIGHTING 2003SOH DOE 1014685 CIEE 2481 OAHU 22.536 92,116 6,144 6144 8806-7581-077 8/14/2002 LIGHTING 2002SOH DOE 1014685 CIEE 2275 OAHU 1.56 6,377 628 628 8806-7625-077 7/15/2001 LIGHTING 2002SOH DOE 1014685 CIEE 2777 OAHU 21.696 88,682 6,659 6659 8806-8422-077 8/30/2003 LIGHTING 2003SOH DOE 1014685 CIEE 2267 OAHU 8.04 32,864 1,864 1864 8806-9207-077 7/15/2001 LIGHTING 2002SOH DOE 1014685 CIEE 2321 OAHU 2.736 11,183 639 639 8808-0535-077 11/1/2001 LIGHTING 2002SOH DOE 1014685 CIEE 2626 OAHU 1.728 7,063 404 404 8808-0535-077 10/30/2001 LIGHTING 2002SOH DOE 1014685 CIEE 3352 OAHU 43.536 177,953 16,649 16649 8808-1036-077 11/26/2003 LIGHTING 2003SOH DOE 1014685 CIEE 3649 OAHU 6.912 28,253 1,622 1622 8808-1036-077 6/30/2004 LIGHTING 2004SOH DOE 1014685 CIEE 2320 OAHU 2.544 10,399 594 594 8808-4514-077 10/26/2001 LIGHTING 2002SOH DOE 1014685 CIEE 2492 OAHU 68.16 278,604 15,904 15904 8809-2020-077 8/23/2002 LIGHTING 2002SOH DOE 1014685 CIEE 2269 OAHU 7.848 32,079 1,902 1902 8809-2426-077 3/15/2001 LIGHTING 2001SOH DOE 1014685 CIEE 2322 OAHU 1.008 4,120 471 471 8809-5090-078 11/6/2001 LIGHTING 2002SOH DOE 1014685 CIEE 2189 OAHU 0.576 2,354 247 247 8809-6595-077 9/30/2000 LIGHTING 2001SOH DOE 1014685 CIEE 3752 OAHU 23.472 95,942 6,211 6211 8810-6936-003 5/7/2004 LIGHTING 2004SOH DOE 1014685 CIEE 2782 OAHU 38.424 157,058 17,388 17388 8810-7431-077 3/21/2003 LIGHTING 2003SOH DOE 1014685 CIEE 3437 OAHU 22.128 90,448 6,104 6104 8810-9031-077 12/10/2003 LIGHTING 2004SOH DOE 1014685 CIEE 1955 OAHU 1.656 6,769 634 634 8811-3052-077 8/15/2001 LIGHTING 2002SOH DOE 1014685 CIEE 2490 OAHU 30.768 125,764 8,770 8770 8811-3052-077 7/31/2002 LIGHTING 2002SOH DOE 1014685 CIEE 1951 OAHU 7.632 31,196 1,743 1743 8811-5563-077 8/10/2001 LIGHTING 2002SOH DOE 1014685 CIEE 3208 OAHU 9.648 39,436 4,066 4066 8811-5563-077 5/22/2003 LIGHTING 2003SOH DOE 1014685 CIEE 2624 OAHU 5.28 21,582 1,232 1232 8811-7270-077 12/12/2001 LIGHTING 2002SOH DOE 1014685 CIEE 2820 OAHU 14.112 57,683 3,943 3943 8811-7270-077 9/25/2003 LIGHTING 2004SOH DOE 1014685 CIEE 2746 OAHU 2.28 9,320 896 896 8811-7633-077 4/30/2002 LIGHTING 2002SOH DOE 1014685 CIEE 2623 OAHU 1.224 5,003 488 488 8812-1152-077 1/19/2002 LIGHTING 2002SOH DOE 1014685 CIEE 2471 OAHU 26.04 106,439 6,121 6121 8812-6818-077 1/1/2003 LIGHTING 2003SOH DOE 1014685 CIEE 2478 OAHU 17.016 69,553 7,056 7056 8812-7386-077 7/31/2002 LIGHTING 2002SOH DOE 1014685 CIEE 1846 OAHU 4.216 27,221 5,166 5166 8812-7930-077 8/3/2001 LIGHTING 2002SOH DOE 1014685 CIEE 2822 OAHU 23.496 96,040 10,265 10265 8812-7930-077 11/30/2003 LIGHTING 2003SOH DOE 1014685 CIEE 3655 OAHU 2.88 11,772 700 700 8812-7930-077 6/30/2004 LIGHTING 2004SOH DOE 1014685 CIEE 2823 OAHU 21.408 87,505 5,617 5617 8813-4640-077 6/30/2004 LIGHTING 2004SOH DOE 1014685 CIEE 2476 OAHU 30.24 123,606 8,775 8775 8813-5725-077 4/6/2003 LIGHTING 2003SOH DOE 1014685 CIEE 1849 OAHU 0.624 2,551 180 180 8813-7441-077 6/30/2003 LIGHTING 2003SOH DOE 1014685 CIEE 2473 OAHU 12 49,050 2,856 2856 8814-2825-077 6/22/2002 LIGHTING 2002SOH DOE 1014685 CIEE 2816 OAHU 23.448 95,844 7,196 7196 8814-3845-077 5/19/2004 LIGHTING 2004SOH DOE 1014685 CIEE 2817 OAHU 19.536 79,853 5,788 5788 8814-4463-077 10/1/2003 LIGHTING 2003SOH DOE 1014685 CIEE 1845 OAHU 2.856 18,440 3,503 3503 8814-6868-077 7/24/2001 LIGHTING 2002SOH DOE 1014685 CIEE 2842 OAHU 13.752 56,211 3,377 3377 8814-6953-077 5/30/2004 LIGHTING 2004SOH DOE 1014685 CIEE 2843 OAHU 27.024 110,461 6,628 6628 8815-4918-078 9/30/2003 LIGHTING 2003SOH DOE 1014685 CIEE 2818 OAHU 17.328 70,828 4,727 4727 8816-3610-077 10/30/2003 LIGHTING 2003SOH DOE 1014685 CIEE 1958 OAHU 4.32 17,658 1,008 1008 8816-7193-077 6/20/2001 LIGHTING 2001SOH DOE 1014685 CIEE 2477 OAHU 38.496 157,352 9,369 9369 8817-4232-077 10/31/2002 LIGHTING 2002SOH DOE 1014685 CIEE 1952 OAHU 5.712 23,348 1,333 1333 8817-7689-077 7/2/2001 LIGHTING 2001SOH DOE 1014685 CIEE 2474 OAHU 19.2 78,480 7,213 7213 8818-0054-077 11/6/2002 LIGHTING 2003SOH DOE 1014685 CIEE 2824 OAHU 12.6 51,503 4,744 4744 8818-2480-077 5/22/2003 LIGHTING 2003SOH DOE 1014685 CIEE 2479 OAHU 33.696 137,732 11,088 11088 8818-8260-078 10/31/2002 LIGHTING 2002SOH DOE 1014685 CIEE 2622 OAHU 3.144 12,851 762 762 8818-9733-077 11/17/2001 LIGHTING 2002SOH DOE 1014685 CIEE 2815 OAHU 38.4 156,960 9,123 9123 8818-9733-077 8/1/2003 LIGHTING 2003SOH DOE 1014685 CIEE 2475 OAHU 31.464 128,609 8,406 8406 8820-1314-077 10/4/2002 LIGHTING 2002SOH DOE 1014685 CIEE 3751 OAHU 18.288 74,752 4,973 4973 8820-4596-078 5/20/2004 LIGHTING 2004SOH DOE 1014685 CIEE 1654 OAHU 2.524 12,715 1,063 1063 8821-0755-077 5/17/2000 LIGHTING 2002SOH DOE 1014685 CIEE 2825 OAHU 8.328 34,041 2,868 2868 8821-1742-077 5/22/2003 LIGHTING 2003SOH DOE 1014685 CIEE 2469 OAHU 20.4 83,385 4,760 4760 8821-9443-077 7/27/2002 LIGHTING 2002SOH DOE 1014685 CIEE 2470 OAHU 16.728 68,376 3,904 3904 8821-9701-077 8/23/2002 LIGHTING 2002SOH DOE 1014685 CIEE 2274 OAHU 9.264 37,867 2,162 2162 8822-5334-078 9/15/2001 LIGHTING 2002SOH DOE 1014685 CIEE 2272 OAHU 8.28 33,845 1,932 1932 8822-6205-077 8/12/2001 LIGHTING 2002SOH DOE 1014685 CIEE 2338 OAHU 35.112 144,883 3,612 3612 8822-6205-077 10/30/2003 LIGHTING 2003SOH DOE 1014685 CIEE 2144 OAHU 30.768 125,764 8,148 8148 8822-7214-077 8/17/2001 LIGHTING 2002SOH DOE 1014685 CIEE 1953 OAHU 16.368 66,904 3,820 3820 8823-0071-078 8/27/2001 LIGHTING 2001SOH DOE 1014685 CIEE 2273 OAHU 3.24 13,244 958 958 8823-0071-078 9/15/2001 LIGHTING 2002SOH DOE 1014685 CIEE 2277 OAHU 1.824 7,456 740 740 8823-4771-077 9/15/2001 LIGHTING 2002SOH DOE 1014685 CIEE 2485 OAHU 13.464 55,034 4,172 4172 8823-4771-077 12/20/2002 LIGHTING 2003SOH DOE 1014685 CIEE 2486 OAHU 18.96 77,499 4,424 4424 8823-4933-077 11/8/2002 LIGHTING 2002SOH DOE 1014685 CIEE 2143 OAHU 46.92 191,786 11,536 11536 8823-8216-078 8/15/2001 LIGHTING 2002SOH DOE 1014685 CIEE 2270 OAHU 4.824 19,718 1,126 1126 8823-9020-077 7/29/2001 LIGHTING 2002SOH DOE 1014685 CIEE 2747 OAHU 3.192 13,047 745 745 8823-9020-077 4/30/2002 LIGHTING 2002SOH DOE 1014685 CIEE 2821 OAHU 9.36 38,259 2,660 2660 8823-9020-077 5/12/2003 LIGHTING 2003SOH DOE 1014685 CIEE 2319 OAHU 6.744 27,566 1,574 1574 8824-0008-003 9/29/2001 LIGHTING 2002SOH DOE 1014685 CIEE 3281 OAHU 20.4 83,385 5,026 5026 8824-6751-077 10/30/2003 LIGHTING 2003SOH DOE 1014685 CIEE 3654 OAHU 0.864 3,532 404 404 8824-6751-077 6/30/2004 LIGHTING 2004SOH DOE 1014685 CIEE 1957 OAHU 8.784 35,905 2,050 2050 8824-8183-077 8/27/2001 LIGHTING 2001SOH DOE 1014685 CIEE 2271 OAHU 7.296 29,822 1,787 1787 8824-8183-077 7/19/2001 LIGHTING 2002SOH DOE 1014685 CIEE 2472 OAHU 14.496 59,252 4,655 4655 8824-8594-077 8/31/2002 LIGHTING 2002SOH DOE 1014685 CIEE 2484 OAHU 10.032 41,006 3,635 3635 8824-8924-077 11/1/2002 LIGHTING 2003SOH DOE 1014685 CIEE 1954 OAHU 4.56 18,639 1,400 1400 8825-5514-077 7/19/2001 LIGHTING 2001SOH DOE 1014685 CIEE 3385 OAHU 18.936 77,401 5,866 5866 8825-5514-077 10/31/2003 LIGHTING 2003SOH DOE 1014685 CIEE 3397 OAHU 14.376 58,762 5,948 5948 8825-5797-077 11/30/2003 LIGHTING 2003SOH DOE 1014685 CIEE 1848 OAHU 14.376 58,762 3,355 3355 8825-7503-079 7/19/2001 LIGHTING 2001SOH DOE 1014685 CIEE 2482 OAHU 21 85,838 6,900 6900 8825-7503-079 3/21/2003 LIGHTING 2003SOH DOE 1014685 CIEE 2489 OAHU 58.776 240,247 15,437 15437 9400-6862-004 3/21/2003 LIGHTING 2003SOH DOE 1014685 CIEE 2776 OAHU 32.064 131,062 8,552 8552 9600-4840-002 3/21/2003 LIGHTING 2003SOH DOE 1014685 CIEE 2491 OAHU 48.72 199,143 14,294 14294 9900-3612-002 3/21/2003 LIGHTING 2003SOH DOE AIEA HIGH 95022268 CINC 519 OAHU 2.668 12,024 775 775 8825-7503-078 3/29/1999 LIGHTING 2000SOH DOE AIKAHI 95021603 CINC 418 OAHU 2.826 9,983 893 893 8809-6631-076 7/31/1997 LIGHTING 1998SOH DOE ALIAMANU INTER 95027177 CIEE 699 OAHU 4.47 15,958 1,036 1036 8823-4771-076 8/10/1998 LIGHTING 1998SOH DOE ALIAMANU INTER 95027177 CIEE 744 OAHU 5.52 19,706 1,546 1546 8823-4771-076 8/10/1998 LIGHTING 1998SOH DOE CAMPBELL HIGH 90002673 CIEE 1192 OAHU 2.416 14,653 1,230 1230 8801-5195-076 8/11/1999 LIGHTING 2000SOH DOE CAMPBELL HIGH 90002673 CINC 177 OAHU 2.211 7,800 597 597 8801-5195-076 7/27/1998 LIGHTING 1998SOH DOE CASTLE HIGH 95021588 CINC 128 OAHU 4.468 15,842 3,769 3769 8809-2020-076 4/1/1998 LIGHTING 1998SOH DOE CASTLE HIGH 95021588 CINC 518 OAHU 6.096 35,197 1,583 1583 8809-2020-076 4/28/1999 LIGHTING 1999

TABLE: STATE LARGE FACILITIES IN OAHU REBATE HISTORY SINCE YEAR 1997 (PROVIDED BY HECO)
NAME CUSTNBR DSM DSM TARCDE CUS CUS REBATAMT REBAMTPD ACCTNUM INSENDDT EQUIP PAYYRPGMID SEQNO KWSV KWHSV
SOH DOE EWA BEACH 90001937 CIEE 695 OAHU 0.72 2,976 168 168 8801-9582-076 7/27/1998 LIGHTING 1999SOH DOE HAUULA 95022311 CIEE 871 OAHU 0.84 3,472 392 392 8808-0535-076 12/2/1998 LIGHTING 1999SOH DOE HOLOMUA ELEMENTARY 96027961 CINC 136 OAHU 24.161 85,509 10,069 10069 9600-2562-002 10/9/1996 LIGHTING 1997SOH DOE HOLOMUA ELEMENTARY 96027961 CINC 152 OAHU 9.221 32,627 3,796 3796 9600-2562-002 7/31/1997 LIGHTING 1997SOH DOE IROQUOIS POINT 95022236 CINC 145 OAHU 2.427 8,581 713 713 8801-4331-076 8/31/1997 LIGHTING 1997SOH DOE KAILUA INTER 95022272 CIEE 1103 OAHU 1.896 7,837 443 443 8810-7431-076 7/26/1999 LIGHTING 2000SOH DOE KALANI HIGH 95021951 CINC 521 OAHU 0.48 1,984 64 64 8812-7930-076 11/2/1998 LIGHTING 1999SOH DOE KALEIOPUU 95022399 CINC 146 OAHU 4.064 14,353 1,346 1346 8806-9441-077 9/23/1997 LIGHTING 1998SOH DOE KAMAILE 95022256 CINC 144 OAHU 4.949 17,503 2,539 2539 8804-5988-077 9/1/1997 LIGHTING 1997SOH DOE KANOELANI 95022253 CINC 350 OAHU 4.393 15,506 1,055 1055 8804-3873-078 1/5/1998 LIGHTING 1998SOH DOE KAPALAMA 95022249 CIEE 482 OAHU 8.445 30,157 2,544 2544 8822-1175-076 8/30/1997 LIGHTING 1998SOH DOE KAPOLEI ELEMENTARY 97025114 CINC 153 OAHU 10.988 38,838 3,992 3992 9300-6344-003 10/30/1997 LIGHTING 1997SOH DOE KAPOLEI HIGH SCHOOL 21126 CINC 697 OAHU 36.088 168,225 10,172 10172 0000-3209-003 7/24/2000 LIGHTING 2000SOH DOE KAPOLEI MIDDLE SCHOOL 99015773 CINC 480 OAHU 81.52 403,366 15,322 15322 9900-0148-002 6/2/1999 LIGHTING 1999SOH DOE KING INTERMEDIATE 95021585 CIEE 1052 OAHU 2.064 18,848 3,318 3318 8808-7023-076 7/22/1999 LIGHTING 1999SOH DOE LEIHOKU 95022270 CINC 377 OAHU 4.589 16,219 1,468 1468 8804-8154-077 10/21/1998 LIGHTING 1998SOH DOE LEILEHUA HIGH 95022277 CIEE 1729 OAHU 20.904 86,403 9,313 9313 8804-9734-076 12/2/1999 LIGHTING 2000SOH DOE LEILEHUA HIGH 95022277 CINC 378 OAHU 4.627 16,328 1,099 1099 8804-9734-076 7/18/1997 LIGHTING 1998SOH DOE MAKAHA 95022247 CIEE 1296 OAHU 1.608 6,646 980 980 8804-1194-076 7/15/1999 LIGHTING 2000SOH DOE MAKAKILO 95022295 CIEE 1185 OAHU 2.28 9,424 1,059 1059 8803-1285-076 7/2/1999 LIGHTING 1999SOH DOE MAKALAPA 95027157 CIEE 1108 OAHU 0.216 893 51 51 8823-4935-076 8/1/1999 LIGHTING 1999SOH DOE MAKALAPA 95027157 CINC 444 OAHU 2.864 12,996 516 516 8823-4935-076 7/26/1999 LIGHTING 1999SOH DOE MCKINLEY HIGH SCHOOL 98010916 CIEE 522 OAHU 12.739 45,476 3,575 3575 8819-7510-076 3/1/1998 LIGHTING 1998SOH DOE MILILANI HIGH 95022367 CIEE 795 OAHU 0.144 595 34 34 8806-1340-076 1/5/1999 LIGHTING 1999SOH DOE MILILANI HIGH 95022367 CINC 419 OAHU 4.704 19,443 800 800 8806-1340-076 12/31/1998 LIGHTING 1999SOH DOE MILILANI INTERMEDIATE 98023529 CINC 429 OAHU 32.496 172,141 6,747 6747 9800-2018-002 7/20/1998 LIGHTING 1999SOH DOE MILILANI INTERMEDIATE 98023529 CINC 430 OAHU 32.868 174,854 6,426 6426 9800-2018-002 7/8/1999 LIGHTING 1999SOH DOE MOANALUA HIGH 95022260 CIEE 689 OAHU 1.54 18,032 1,340 1340 8822-5334-077 7/31/1998 LIGHTING 1999SOH DOE MOANALUA HIGH 95022260 CINC 389 OAHU 4.776 30,057 1,394 1394 8822-5335-077 11/15/1999 LIGHTING 1999SOH DOE NANAKULI 95022284 CIEE 523 OAHU 1.394 4,964 514 514 8802-7712-077 8/1/1998 LIGHTING 1998SOH DOE NANAKULI 95022284 CINC 175 OAHU 4.618 16,314 1,819 1819 8802-7712-077 5/15/1998 LIGHTING 1998SOH DOE NANAKULI HIGH & INTER 95022292 CIEE 1380 OAHU 7.584 31,347 2,655 2655 8803-0106-076 7/25/2000 LIGHTING 2000SOH DOE PALISADES 95022491 CIEE 1138 OAHU 10.56 43,648 4,777 4777 8800-1467-076 8/2/1999 LIGHTING 1999SOH DOE PEARL CITY HIGH 95022233 CIEE 1926 OAHU 4.752 42,973 8,100 8100 8801-3223-077 8/14/2000 LIGHTING 2001SOH DOE PEARL CITY HIGHLANDS 95022232 CIEE 1581 OAHU 0.192 794 68 68 8801-3172-076 1/13/2000 LIGHTING 2000SOH DOE PEARL CITY HIGHLANDS 95022232 CIEE 1599 OAHU 0.552 2,282 152 152 8801-3172-076 2/11/2000 LIGHTING 2000SOH DOE PEARLRIDGE 95022259 CINC 524 OAHU 2.968 13,554 781 781 8825-5578-076 2/4/2000 LIGHTING 2000SOH DOE ROYAL ELEMENTARY 95022238 CINC 554 OAHU 3.966 18,693 1,440 1440 8820-5546-076 8/15/2000 LIGHTING 2000SOH DOE WAIALAE 95022067 CIEE 1610 OAHU 7.968 32,934 3,696 3696 8813-7591-076 3/31/2000 LIGHTING 2000SOH DOE WAIALUA HIGH 95022369 CIEE 640 OAHU 2.666 9,495 1,293 1293 8806-3540-076 1/1/1998 LIGHTING 1998SOH DOE WAIAU 95022229 CINC 571 OAHU 4.768 25,357 1,146 1146 8800-8414-077 12/31/1998 LIGHTING 1999SOH DOE WAIKELE ELEMENTARY 98016666 CINC 425 OAHU 9.132 32,250 2,608 2608 9800-1286-002 7/1/1998 LIGHTING 1998SOH DOE WAIKELE ELEMENTARY 98016666 CINC 468 OAHU 13.896 59,423 2,323 2323 9800-1286-002 5/28/1999 LIGHTING 1999SOH DOE WAIPAHU HIGH 95022239 CIEE 1646 OAHU 4.352 51,394 10,200 10200 8801-5001-076 4/14/2000 LIGHTING 2000SOH DOE WAIPAHU HIGH 95022239 CINC 424 OAHU 3.798 13,417 1,437 1437 8801-5002-077 2/20/1998 LIGHTING 1998SOH DOE WAIPAHU INTER 95022237 CINC 95 OAHU 4.576 16,176 1,248 1248 8801-4719-077 9/10/1996 LIGHTING 1997SOH DOE WHEELER ELEMENTARY 95022400 CINC 129 OAHU 3.244 11,457 1,482 1482 8807-3734-076 10/31/1997 LIGHTING 1998SOH HSPLS 87016933 CINC 1577 OAHU 5.888 19,928 2,517 2517 0100-6313-002 1/1/2003 LIGHTING 2004SOH HSPLS 87016933 CIEE 3594 OAHU 4.752 19,424 1,916 1916 8810-9012-075 12/30/2003 LIGHTING 2004SOH HSPLS 87016933 CIEE 3637 OAHU 13.032 62,812 3,176 3176 8811-3338-001 9/11/2004 LIGHTING 2004SOH HSPLS 87016933 CIEE 1652 OAHU 8.496 34,727 2,850 2850 8814-7285-075 9/1/2000 LIGHTING 2003
Sub-TOTA 9,541,043 680,132SOH DOE 1014685 CINC 1987 OAHU 1.52 7,824 680 680 0300-1631-003 1/30/2004 MOTOR 2004SOH DOE 1014685 CINC 2122 OAHU 1.168 6,697 1,513 1513 0300-4042-002 3/28/2004 MOTOR 2005SOH DOE KAPOLEI HIGH SCHOOL 21126 CINC 699 OAHU 3.717 19,098 1,230 1230 0000-3209-003 7/1/2000 MOTOR 2000SOH DOE KAPOLEI MIDDLE SCHOOL 99015773 CINC 481 OAHU 1.785 10,721 810 810 9900-0148-002 6/2/1999 MOTOR 1999SOH HSPLS 87016933 CIEE 1859 OAHU 0.085 511 50 50 8817-7696-001 8/4/2000 MOTOR 2000
Sub-TOTA 44,850 4,283SOH DOE 1014685 CINC 1989 OAHU 3.6 39,000 2,400 2400 0300-1631-003 1/30/2004 CUSTOM 2004SOH DOE 1014685 CINC 2030 OAHU 5.3 39,750 2,650 2650 0300-1631-003 1/30/2004 CUSTOM 2004SOH DOE 1014685 CINC 2124 OAHU 7.2 78,000 4,800 4800 0300-4042-002 3/28/2004 CUSTOM 2005SOH DOE 1014685 CINC 2125 OAHU 6.5 48,750 3,250 3250 0300-4042-002 3/28/2004 CUSTOM 2005
Sub-TOTA 205,500 13,100SOH DOE 1014685 CINC 1988 OAHU 23.4 53,550 15,075 15075 0300-1631-003 1/30/2004 SPACCOOL 2004SOH DOE 1014685 CINC 2123 OAHU 55.2 125,760 7,847 7847 0300-4042-002 3/28/2004 SPACCOOL 2005SOH DOE 1014685 CIEE 2001 OAHU 4.9 11,134 1,560 1560 8801-5195-077 9/28/2001 SPACCOOL 2002SOH DOE 1014685 CIEE 2002 OAHU 12.25 27,835 3,600 3600 8803-9117-078 7/20/2001 SPACCOOL 2002SOH DOE 1014685 CIEE 2000 OAHU 4.41 10,021 1,680 1680 8809-6631-077 10/16/2001 SPACCOOL 2002SOH DOE 1014685 CIEE 1965 OAHU 6.125 13,918 1,275 1275 8823-4935-077 5/1/2003 SPACCOOL 2003SOH DOE ALIIOLANI 95022304 CIEE 2033 OAHU 9.856 22,411 2,268 2268 8814-4463-076 8/15/2000 SPACCOOL 2001SOH DOE CAMPBELL HIGH 90002673 CIEE 810 OAHU 2.873 6,523 1,236 1236 8801-5195-076 7/23/1998 SPACCOOL 1998SOH DOE CAMPBELL HIGH 90002673 CINC 176 OAHU 0.663 1,505 198 198 8801-5195-076 6/18/1998 SPACCOOL 1998SOH DOE HEEIA 95021583 CINC 155 OAHU 1.547 3,514 546 546 8808-4514-076 8/29/1997 SPACCOOL 1997SOH DOE HOLOMUA ELEMENTARY 96027961 CINC 132 OAHU 57.6 131,600 19,000 19000 9600-2562-002 10/9/1996 SPACCOOL 1997SOH DOE KALANI HIGH 95021951 CIEE 697 OAHU 1.666 3,782 585 585 8812-7930-076 7/31/1998 SPACCOOL 1999SOH DOE KALANI HIGH 95021951 CIEE 700 OAHU 5.304 12,043 1,676 1676 8812-7930-076 7/24/1998 SPACCOOL 1998SOH DOE KALIHI KAI 95027158 CINC 629 OAHU 5.474 12,427 2,208 2208 8823-8198-076 9/30/1998 SPACCOOL 1999SOH DOE KAPOLEI ELEMENTARY 97025114 CINC 154 OAHU 8.84 20,080 2,534 2534 9300-6344-003 10/30/1997 SPACCOOL 1997SOH DOE KAPOLEI HIGH SCHOOL 21126 CINC 698 OAHU 158.67 361,374 70,356 70356 0000-3209-003 7/24/2000 SPACCOOL 2000SOH DOE KAPOLEI MIDDLE SCHOOL 99015773 CINC 479 OAHU 95.89 218,397 22,790 22790 9900-0148-002 6/2/1999 SPACCOOL 1999SOH DOE KUHIO 95022214 CIEE 1137 OAHU 2.856 6,484 900 900 8816-5560-076 8/27/1999 SPACCOOL 1999SOH DOE MCKINLEY HIGH SCHOOL 98010916 CIEE 1053 OAHU 2.431 5,520 720 720 8819-7510-076 8/3/1998 SPACCOOL 1998SOH DOE MOANALUA INTER 95022279 CIEE 811 OAHU 2.38 5,403 810 810 8822-8058-076 8/7/1998 SPACCOOL 1999SOH DOE SALT LAKE 95022300 CIEE 690 OAHU 1.105 2,509 510 510 8823-0071-077 7/10/1998 SPACCOOL 1998SOH DOE WAHIAWA INTER 95022395 CIEE 934 OAHU 8.092 18,370 2,056 2056 8805-2477-076 1/8/1999 SPACCOOL 1999SOH DOE WAIKELE ELEMENTARY 98016666 CINC 417 OAHU 41.405 94,710 16,940 16940 9800-1286-002 7/1/1998 SPACCOOL 1998SOH DOE WAILUPE 95021946 CINC 572 OAHU 2.856 6,484 750 750 8812-7482-003 1/11/1999 SPACCOOL 1999SOH HSPLS 87016933 CIEE 1860 OAHU 7.14 16,209 1,629 1629 8814-7287-075 9/11/2000 SPACCOOL 2000
Sub-TOTA 1,191,563 178,749
TOTAL 10,982,955 876,264
SOH DOT AIRPORT 88001207 CICR 429 OAHU 33.9 281,921 18,331 18331 8800-6364-076 4/19/2001 CUSTOM 2001Sub-TOTA 281,921 18,331
SOH DOT AIRPORT 88001207 CIEE 141 OAHU 75.33 311,834 18,390 18390 8800-6352-076 3/28/1997 LIGHTING 1997SOH DOT AIRPORT 88001207 CIEE 147 OAHU 19.648 81,829 12,478 12478 8800-6353-076 4/29/1997 LIGHTING 1997SOH DOT AIRPORT 88001207 CIEE 143 OAHU 185.028 765,243 35,244 35244 8800-6358-076 3/1/1997 LIGHTING 1997SOH DOT AIRPORT 88001207 CIEE 146 OAHU 22.37 93,199 14,370 14370 8800-6360-075 4/29/1997 LIGHTING 1997SOH DOT AIRPORT 88001207 CIEE 145 OAHU 25.41 105,028 3,629 3629 8800-6364-076 4/21/1997 LIGHTING 1997SOH DOT AIRPORT 88001207 CIEE 142 OAHU 12.87 53,196 3,220 3220 8800-6365-075 4/21/1997 LIGHTING 1997SOH DOT AIRPORT 88001207 CIEE 144 OAHU 55.29 228,532 8,104 8104 9300-0115-002 4/29/1997 LIGHTING 1997SOH DOT HARBORS DIVISION 94027617 CINC 2194 OAHU 4.2 48,745 1,890 1890 0100-0072-001 3/18/2005 LIGHTING 2005SOH DOT HARBORS DIVISION 88206076 CIEE 1804 OAHU 5.546 87,296 8,850 8850 8819-4970-078 5/23/2000 LIGHTING 2000SOH DOT HARBORS DIVISION 88206076 CIEE 1834 OAHU 1.232 6,697 392 392 8819-4971-001 7/30/2000 LIGHTING 2000SOH DOT HARBORS DIVISION 88206076 CIEE 3430 OAHU 19.144 103,637 4,761 4761 8824-0613-075 12/1/2003 LIGHTING 2004
Sub-TOTA 1,885,236 111,328
TOTAL 2,167,157 129,659
SOH JUDICIARY * 88205405 CICR 1284 OAHU 47.9 171,038 14,540 14540 8819-9077-077 5/21/2004 CUSTOM 2004SOH JUDICIARY * 88205405 CICR 1361 OAHU 4.9 42,771 2,751 2751 8819-9077-077 5/21/2004 CUSTOM 2004SOH JUDICIARY * 88205405 CICR 1283 OAHU 43.7 175,450 14,230 14230 8824-2360-078 5/21/2004 CUSTOM 2004SOH JUDICIARY * 88205405 CICR 1369 OAHU 5.5 48,467 3,117 3117 8824-2360-078 5/21/2004 CUSTOM 2004SOH JUDICIARY * 88205405 CICR 1282 OAHU 4.28 12,362 1,154 1154 8824-4780-075 5/21/2004 CUSTOM 2004SOH JUDICIARY * 88205405 CICR 1360 OAHU 3.1 9,535 690 690 8824-4780-075 5/21/2004 CUSTOM 2004SOH JUDICIARY * 88205405 CICR 1370 OAHU 1.4 12,615 812 812 8824-4780-075 5/21/2004 CUSTOM 2004
Sub-TOTA 472,238 37,294SOH JUDICIARY * 88205405 CIEE 3631 OAHU 75.744 379,610 21,305 21305 8819-9077-077 5/21/2004 LIGHTING 2004SOH JUDICIARY * 88205405 CIEE 3632 OAHU 110.292 553,527 21,826 21826 8824-2360-078 5/21/2004 LIGHTING 2004SOH JUDICIARY * 88205405 CIEE 3630 OAHU 30.192 151,469 4,964 4964 8824-4780-075 5/21/2004 LIGHTING 2004SOH JUDICIARY DEPT 2041071 CINC 1636 OAHU 7.157 34,401 2,530 2530 0200-5634-002 3/25/2003 LIGHTING 2003SOH JUDICIARY DEPT 88001947 CIEE 502 OAHU 4.104 18,696 1,322 1322 8800-1926-075 8/7/1997 LIGHTING 1997
Sub-TOTA 1,137,703 51,947
TOTAL 1,609,941 89,241
SOH-DEPT OF PUBLIC SAFETY 88239864 CIEE 3056 OAHU 0.027 155 23 23 8823-3672-076 2/18/2003 MOTOR 2003
TOTAL 155 23
UH FACILITIES MANAGEMENT 88167592 CIEE 137 OAHU 12.276 43,560 6,930 6930 8816-2154-075 10/17/1996 LIGHTING 1996UH FACILITIES MANAGEMENT 88167592 CIEE 138 OAHU 2.88 11,904 672 672 8816-2154-075 1/8/1999 LIGHTING 1999UH FACILITIES MANAGEMENT 88167592 CIEE 905 OAHU 17.31 71,433 3,279 3279 8816-2154-075 10/15/1998 LIGHTING 1998UH FACILITIES MANAGEMENT 88167592 CINC 186 OAHU 1.922 6,808 1,445 1445 8816-2154-075 12/3/1998 LIGHTING 1998UH FACILITIES MANAGEMENT 88167592 CIEE 957 OAHU 12.499 60,071 2,858 2858 8816-2154-076 10/1/1999 LIGHTING 2000UH FACILITIES MANAGEMENT 88167592 CIEE 1382 OAHU 11.712 55,925 3,408 3408 8816-2154-076 2/24/2000 LIGHTING 2000UH FACILITIES MANAGEMENT 88167592 CIEE 1695 OAHU 64.704 308,962 14,753 14753 8816-2154-076 5/22/2000 LIGHTING 2000UH FACILITIES MANAGEMENT 88167592 CIEE 2212 OAHU 10.07 47,960 2,890 2890 8816-2154-076 9/1/2002 LIGHTING 2002UH FACILITIES MANAGEMENT 88167592 CIEE 2263 OAHU 2.169 8,797 761 761 8816-2154-076 8/27/2001 LIGHTING 2002UH FACILITIES MANAGEMENT 88167592 CIEE 3969 OAHU 12.864 218,326 14,340 14340 8816-2154-076 3/18/2005 LIGHTING 2005UH FACILITIES MANAGEMENT 88167592 CINC 597 OAHU 42.26 218,862 10,535 10535 8816-2154-076 10/28/1999 LIGHTING 1999UH FACILITIES MANAGEMENT 88167592 CINC 724 OAHU 38.66 220,209 10,916 10916 8816-2154-076 1/5/2001 LIGHTING 2001UH FACILITIES MANAGEMENT 88167592 CINC 988 OAHU 6.416 35,729 1,856 1856 8816-2154-076 8/1/2000 LIGHTING 2001UH FACILITIES MANAGEMENT 88167592 CINC 1186 OAHU 3.78 22,124 890 890 8816-2154-076 7/1/2002 LIGHTING 2002UH FACILITIES MANAGEMENT 88167592 CINC 1197 OAHU 15.522 50,649 5,356 5356 8816-2154-076 12/28/2002 LIGHTING 2003UH FACILITIES MANAGEMENT 88167592 CIEE 449 OAHU 58.438 207,376 43,412 43412 9400-7374-001 4/30/1997 LIGHTING 1997

TABLE: STATE LARGE FACILITIES IN OAHU REBATE HISTORY SINCE YEAR 1997 (PROVIDED BY HECO)
NAME CUSTNBR DSM DSM TARCDE CUS CUS REBATAMT REBAMTPD ACCTNUM INSENDDT EQUIP PAYYRPGMID SEQNO KWSV KWHSV
UH FACILITIES MANAGEMENT 88167592 CIEE 647 OAHU 4.05 16,713 756 756 9400-7374-001 5/1/1998 LIGHTING 1998UH FED CREDIT UNION 88245366 CINC 123 OAHU 5.238 23,871 4,158 4158 9700-0159-002 3/17/1997 LIGHTING 1997UH HIMB 88093074 CINC 470 OAHU 9.065 60,209 2,621 2621 8808-8598-075 5/1/1999 LIGHTING 1999
Sub-TOTA 1,689,486 131,836UH FACILITIES MANAGEMENT 88167592 CIEE 594 OAHU 0.675 2,835 575 575 8816-2154-075 10/1/1997 MOTOR 1997UH FACILITIES MANAGEMENT 88167592 CINC 211 OAHU 2.85 11,970 1,890 1890 8816-2154-075 10/1/1997 MOTOR 1997UH FACILITIES MANAGEMENT 88167592 CINC 738 OAHU 1.53 9,189 760 760 8816-2154-076 10/28/1999 MOTOR 1999UH WAIKIKI AQUARIUM 88159897 CIEE 1670 OAHU 0.51 3,063 210 210 8815-4443-075 3/30/2000 MOTOR 2000
Sub-TOTA 27,057 3,435UH FACILITIES MANAGEMENT 88167592 CICR 8 OAHU 0 21,896 1,645 1645 8816-2154-075 3/19/1997 CUSTOM 1997UH FACILITIES MANAGEMENT 88167592 CICR 243 OAHU 19.8 78,845 6,417 6417 8816-2154-075 11/1/1998 CUSTOM 1998UH FACILITIES MANAGEMENT 88167592 CICR 133 OAHU 0.7 19,011 1,277 1277 9400-7374-001 1/15/1998 CUSTOM 1998UH HIMB 88093074 CICR 204 OAHU 4.5 6,224 874 874 8808-8598-075 7/9/1998 CUSTOM 1998
Sub-TOTA 125,976 10,213UH FACILITIES MANAGEMENT 88167592 CIEE 189 OAHU 1.547 3,514 338 338 8816-2154-075 9/10/1996 SPACCOOL 1996UH FACILITIES MANAGEMENT 88167592 CINC 187 OAHU 96.8 334,400 32,384 32384 8816-2154-075 10/1/1996 SPACCOOL 1997UH FACILITIES MANAGEMENT 88167592 CIEE 2621 OAHU 49.02 168,948 24,339 24339 8816-2154-076 12/20/2002 SPACCOOL 2003UH FACILITIES MANAGEMENT 88167592 CINC 310 OAHU 31.45 108,244 10,786 10786 8816-2154-076 10/28/1999 SPACCOOL 1999UH FACILITIES MANAGEMENT 88167592 CINC 723 OAHU 136.125 465,438 77,660 77660 8816-2154-076 1/5/2001 SPACCOOL 2001UH FACILITIES MANAGEMENT 88167592 CINC 987 OAHU 16.473 57,630 3,948 3948 8816-2154-076 8/1/2000 SPACCOOL 2001UH FACILITIES MANAGEMENT 88167592 CIEE 1051 OAHU 1.288 4,503 585 585 8817-1865-076 9/10/1998 SPACCOOL 1999
Sub-TOTA 1,142,676 150,040UH HIMB KEWALO DOCK 88198895 RWH 93125 OAHU 0.06 278 40 40 8819-3080-075 6/16/1999 WATERHT 1999
Sub-TOTA 278 40
TOTAL 2,985,473 295,564
SOH WINDWARD COMMUNITY COLLEGE 95032200 CIEE 1361 OAHU 29.976 143,740 10,115 10115 9500-5803-001 9/17/1999 LIGHTING 1999SOH WINDWARD COMMUNITY COLLEGE 95032200 CINC 406 OAHU 11.351 38,938 3,540 3540 9500-5803-001 6/3/2002 LIGHTING 2002SOH WINDWARD COMMUNITY COLLEGE 95032200 CINC 1129 OAHU 8.572 45,430 2,599 2599 9500-5803-001 2/15/2002 LIGHTING 2004
Sub-TOTA 228,108 16,254SOH WINDWARD COMMUNITY COLLEGE 95032200 CINC 1130 OAHU 1.9 9,780 800 800 9500-5803-001 2/15/2002 MOTOR 2004SOH WINDWARD COMMUNITY COLLEGE 95032200 CINC 1450 OAHU 1.14 5,868 540 540 9500-5803-001 6/3/2002 MOTOR 2002
Sub-TOTA 15,648 1,340SOH WINDWARD COMMUNITY COLLEGE 95032200 CINC 520 OAHU 14.52 49,755 9,414 9414 9500-5803-001 6/3/2002 SPACCOOL 2002SOH WINDWARD COMMUNITY COLLEGE 95032200 CINC 2000 OAHU 47.168 161,792 18,090 18090 9500-5803-001 1/1/2004 SPACCOOL 2005
Sub-TOTA 211,547 27,504
TOTAL 477,427 45,988
UH HONOLULU COMMUNITY COLLEGE 88245561 CICR 331 OAHU 12 92,000 5,600 5600 8823-6252-075 1/15/2003 CUSTOM 2003UH HONOLULU COMMUNITY COLLEGE 88245561 CICR 1146 OAHU 16.8 126,000 8,400 8400 8823-6252-075 9/26/2003 CUSTOM 2003
Sub-TOTA 218,000 14,000UH HONOLULU COMMUNITY COLLEGE 88245561 CIEE 1388 OAHU 98.4 336,640 37,280 37280 8823-6252-075 1/12/2001 SPACCOOL 2001
Sub-TOTA 336,640 37,280UH HONOLULU COMMUNITY COLLEGE 88245561 CIEE 1389 OAHU 224.352 1,076,832 60,695 60695 8823-6252-075 9/5/2000 LIGHTING 2000UH HONOLULU COMMUNITY COLLEGE 88245561 CIEE 786 OAHU 2.226 10,358 821 821 8823-9022-001 8/28/1998 LIGHTING 1999
Sub-TOTA 1,087,190 61,516
TOTAL 1,645,344 113,134
UH KAP COMM COLLEGE BUSINESS 88204379 CIEE 892 OAHU 207.01 856,448 46,319 46319 8814-8544-076 9/17/1998 LIGHTING 1998Sub-TOTA 856,448 46,319
UH KAP COMM COLLEGE BUSINESS 88204379 CIEE 2078 OAHU 2.646 9,279 1,158 1158 8814-8544-076 6/15/2001 SPACCOOL 2004Sub-TOTA 9,279 1,158
TOTAL 865,727 47,477
LEEWARD COMMUNITY COLLEGE 88015311 CIEE 1027 OAHU 1.384 6,387 574 574 8801-5005-075 10/15/1999 LIGHTING 1999LEEWARD COMMUNITY COLLEGE 88015311 CIEE 1391 OAHU 146.8 696,349 43,609 43609 8801-5005-075 3/23/2001 LIGHTING 2001
Sub-TOTA 702,737 44,183LEEWARD COMMUNITY COLLEGE 88015311 CIEE 4018 OAHU 1.295 7,419 1,290 1290 8801-5005-075 3/24/2005 MOTOR 2005
Sub-TOTA 7,419 1,290LEEWARD COMMUNITY COLLEGE 88015311 CICR 330 OAHU 9.6 104,000 6,400 6400 8801-5005-075 3/24/2005 CUSTOM 2005LEEWARD COMMUNITY COLLEGE 88015311 CICR 1463 OAHU 4 30,000 2,000 2000 8801-5005-075 3/24/2005 CUSTOM 2005
Sub-TOTA 134,000 8,400LEEWARD COMMUNITY COLLEGE 88015311 CIEE 1033 OAHU 3.57 8,105 1,215 1215 8801-5005-075 10/19/1999 SPACCOOL 1999LEEWARD COMMUNITY COLLEGE 88015311 CIEE 1390 OAHU 43.344 149,386 28,241 28241 8801-5005-075 12/16/2004 SPACCOOL 2004
Sub-TOTA 157,490 29,456
TOTAL 1,001,645 83,329
SOH DLNR DIV OF BOATING 93007897 CIEE 3512 OAHU 1.768 8,517 389 389 8823-8780-031 2/24/2004 LIGHTING 2004
TOTAL 8,517 389

APPENDIX 3.0
Summary of Existing Energy Audit/Survey Results Presented in “Task 1-a-1 Report”

IISSLLAANNDD OOFF OOAAHHUU SSTTAATTEE FFAACCIILLIITTIIEESS BBEENNCCHHMMAARRKKIINNGG
STUDY
TTaasskk 11--aa
PPRREEPPAARREEDD FFOORR::
SSTTAATTEE OOFF HHAAWWAAIIII DDEEPPAARRTTMMEENNTT OOFF BBUUSSIINNEESSSS,, EECCOONNOOMMIICC DDEEVVEELLOOPPMMEENNTT,, AANNDD
TTOOUURRIISSMM SSTTRRAATTEEGGIICC IINNDDUUSSTTRRIIEESS DDIIVVIISSIIOONN EENNEERRGGYY BBRRAANNCCHH
MMaarrcchh 2255,, 22000055
PPRREEPPAARREEDD BBYY:: CCEEDDRRIICC DD..OO.. CCHHOONNGG && AASSSSOOCCIIAATTEESS,, IINNCC..
882288 FFOORRTT SSTTRREEEETT MMAALLLL,, SSUUIITTEE 550000 HHOONNOOLLUULLUU,, HHAAWWAAIIII 9966881133
PPrrooggrreessss SSuubbmmiittttaall
EXECUTIVE SUMMARY This Task 1-a progress report summarizes the previously developed reports, energy audits and spreadsheets under the earlier conducted “State Facility Energy Upgrade Analysis and Performance Contracting Potential Phase I and II” study by the Washington State Department of General Administration, for the State of Hawaii, Department of Business, Economic Development, & Tourism (DBEDT), in year 2003-2004. The details of this progress report include data on the surveyed buildings’ total square footage, yearly electricity consumption, typical building usage, operation schedule, building-renovation equipment retrofit history, and potential Energy Conservation Measures (ECM). Surveyed building indoor air quality related findings and future scheduled improvements (if any) were also included in the report. Additionally, reviews from earlier conducted Energy Performance Contract evaluations were included in the report to provide insight into potential benchmarking ECMs. The Task 1-a progress report also provides an overview of the currently available data and insight in the future directions of the benchmarking study. The findings of this progress report are summarized as follows:
1- A total of five buildings were selected for the survey due to their relatively large sizes and electricity consumption rates within the state facilities. Four of those buildings’ lighting was already retrofitted. Therefore, no ECM savings related to lighting retrofits were quantified. However lighting related ECM is crucial information in the surveys because of its common occurrence in the other facilities. Since this information is missing in the surveys, either we have the option of going back and recovering the actual energy savings from the already accomplished retrofits, or conduct additional energy surveys on new set of buildings that has not undergone major retrofits.
1
2- Our experience with energy benchmarking studies shows that in order to develop an accurate benchmarking, a good size of buildings in the set should have earlier conducted through energy audits (Reference: UH Manoa Benchmarking Study). The current available information on the State Facilities energy usage characteristics is not sufficient for a through benchmarking. Therefore, we recommend that we limit the ECMs considered in the benchmarking to the most common ECMs, such as lighting retrofits, EXIT sign retrofits and window tinting retrofits. Quantifications and generalizing of the listed ECMs can be achieved by combining new energy survey studies from 5 to 10 other state buildings that had no recent retrofit history with the already conducted energy survey results. This will produce data from homogenized set of buildings, sufficient enough for the benchmarking for the three listed ECMs.

1.0 HIGHLIGHTS OF THE “STATE FACILITY ENERGY UPGRADE ANALYSIS AND PERFORMANCE CONTRACTING POTENTIAL PHASE I AND PHASE II” PROJECT
TABLE OF CONTENTS PAGE
EXECUTIVE SUMMARY ......................................................................................... 1 The study “State Facility Energy Upgrade Analysis and Performance Contracting Potential”
project that was conducted by the Washington State Department of General Administration, for the State of Hawaii, Department of Business, Economic Development, & Tourism (DBEDT), in year 2003-2004 consisted of two phases. The first phase investigated the general standing of state buildings energy usage characteristics, electricity usage by state agency, by island, and electricity bill size.
TABLE OF CONTENTS............................................................................................. 2
1.0 HIGHLIGHTS OF THE “STATE FACILITY ENERGY UPGRADE ANALYSIS
AND PERFORMANCE CONTRACTING POTENTIAL PHASE I AND PHASE II” PROJECT ..................................................................................................... 3 Rebate records on the energy conservation projects, obtained from the utility companies
including HECO, HELCO, MECO and KIUC were used to identify the state buildings’ current electricity usage characteristics.
2.0 SUMMARY OF ENERGY SURVEY RESULTS UNDER “STATE FACILITY
ENERGY UPGRADE ANALYSIS AND PERFORMANCE CONTRACTING POTENTIAL PHASE II” PROJECT.................................................................. 5
The second phase of the project dealt with generalizing the Phase I findings with the input from walk through energy surveys on selected state buildings that helped to identify the energy consumption levels and energy cost of typical office buildings. A total of five buildings were identified for the walk through surveys according to their size and electricity consumption rate. More specifically four Department of Accounting and General Services (DAGS) buildings (Queen Liliuokalani, Kinau Hale, Kekuanaoa, Keelikolani & Hale Auhau) and one DBEDT building (Foreign Trade Zone 9) were included in the walk through energy surveys. Also energy audit reports from two Energy Performance Contracting (EPC) projects, conducted on five State Judiciary Facilities and a total of 16 Department of Defense Hawaii Army National Guard (DOD HIARNG) were used in generalizing the potential Energy Conservation Measures (ECMs) for the entire State of Hawaii occupied buildings.
2.1 KINAU HALE BUILDING..................................................................... ..5 2.2 QUEEN LILIUOKALANI BUILDING.................................................... 7 2.3 KEKUANAOA BUILDING...................................................................... 9 2.4 KEELIKOLANI AND HALE AUHAU BUILDINGS ........................... 11 2.5 FOREIGN TRADE ZONE # 9 WAREHOUSE AND OFFICE.............. 13 2.6 STATE JUDICIARY BUILDINGS ........................................................ 15 2.7 HIARNG ENERGY EFFICIENCY MEASURES .................................. 17 3.0 LIST OF BUILDING INFORMATION REQUIRED FOR THE
BENCHMARKING STUDY............................................................................ 19 The summary of the energy savings estimates with associates cost and payback calculations for
the most promising ECMs, as a result of the walk-through energy survey for the five state buildings, are shown in Table 1.
4.0 LETTER OF REQUEST FOR DOE BUILDINGS ENERGY USAGE .......... 20 Table 1: Summary of Energy Survey Findings
3
FACILITY ANNUAL KWHCONSUMPTION
EST. KWH SAVINGS
EST. $ SAVINGS
EST. $ COST
EST. % SAVINGS
QUEEN LILIUOKALANI
2,495,000 126,940 $16,170 $26,000 5.1 %
KINAU HALE 1,826,600 7,000 $880 $1,880 0.4 %KEKUANAOA 1,464,920 396,460 $57,000 $216,300 27.1 %KEELIKOLANI/ HALE AUHAU
4,342,600 317 200 $40,600 $64,640 7.3 %
FTZ No. 9 OFFICE 323,840 49,600 $6,240 $8,440 15.3 %FTZ No. 9 WAREHOUSE
750,720 -0- -0- -0- -0-
TOTALS 11,203,680 897,200 $120,890 $317,260 8.0 %
2

2.0 SUMMARY OF ENERGY SURVEY RESULTS UNDER “STATE FACILITY ENERGY UPGRADE ANALYSIS AND PERFORMANCE CONTRACTING POTENTIAL PHASE II” PROJECT
Table 2 lists the generalized results of the Table 1 with an extrapolation process integrated with the findings from the Phase I part of the project for the entire State of Hawaii large and medium size buildings electricity consumption.
2.1 KINAU HALE BUILDING
Table 2: Overall Findings General Information Kinau Hale is located at 1250 Punchbowl St. Honolulu, HI. The facility is a single building office type facility, occupied by the Department of Health (DOH) and owned by the Department of Accounting and General Services (DAGS). The building was built on 1961, occupies 66,951 square feet space. Building envelope includes single fixed projection windows with overhangs and vertical shading devices. The walls have fiberglass insulation. The building is cooled by a central air conditioning system. Water cooled chilled plant is attached to the west side of the building. The building is equipped with an energy management system.
AGENCY/DESC. DAGS DOH DOD JUDICIARY PSDANNUAL ENERGY CONSUMPTION
43,379,420 42,097,000 8,535,510 12,535,260 21,427,440
ANNUAL ENERGY COST
$5,258,500 $5,424,600 $1,093,501 $1,520,807 $2,519,900
ESTIMATED KWH SAVINGS
11,463,400 10,096,900 2,497,477 1,939,360 5,313,200
ESTIMATED $ SAVINGS
$1,423,450 $1,296,600 $333,600 $198,623 $672,190
ESTIMATED % SAVINGS
26.4 % 23.98 % 28.9 % 23.9 % 24.8 %
BLDG. TYPE Office Health Care
Office Office Secure Lodging
# OF BLDGS. 23 14 29 5 10AVG. SQ. FT. 92,450 121,100 25,600 111,220 88,500
Building Occupancy and Electricity Usage The average occupancy rate of the building during the weekdays is 270 people, and Saturdays is 27 people. The building operation schedule is Monday through Friday 6:00 am to 5:00 pm, and Saturdays 7:00 am to 2:00 pm. The building has consumed 1,820,400 kWh per year electricity with an electricity cost of $232,324 in year 2003, according to the records from the Hawaiian Electric Company (HECO). This converts to 26.02kWh per year per square feet of electricity consumption and $3.32 per square feet electricity cost for the Kinau Hale.
Building and Equipment Renovations the Past Five Years 1- Chiller replacement, cooling tower replacement. Additional recommendations on the implementations of the ECMs are listed as follows: 2- Fourth floor major renovation. 3- First and third floor minor renovations.
1- Develop an overall plan to bring facilities up to an acceptable level of energy consumption and comfort conditions. An acceptable level of energy consumption would be achieved by meeting or exceeding the requirements of the existing Hawaii energy code.
4- Lighting system upgrades. Other Ongoing Renovation
1- Existing Energy Management System was being upgrades at the time of the survey in year 2003-2004. 2- Focus on the larger facilities to maximize the amount of conservation that can be
achieved with the minimum number of facilities. Identify smaller facilities that can receive an energy upgrade and bundled as part of the larger facility project.
2- Existing air handlers were scheduled for upgrades at the time of the survey in year 2003-2004.
3- Use existing utility DSM programs to assist with the conservation efforts. 4- Develop and use methods to make smaller projects more cost-effective.
Indoor Air Quality Concerns
1- First and third floor walls have asbestos. Asbestos has to be removed before any other renovations. A detailed description of the ECMs and buildings included in the walk through energy audit
survey, as well as available other energy audit reports are described in the following section. 2- Building is under negative pressure. Retro-commission the energy systems in the building when the building retrofit is completed.
3- Restrooms have jalousie windows which allow outside air into the building. The jalousie windows need to be replaced with fixed windows.
5 4
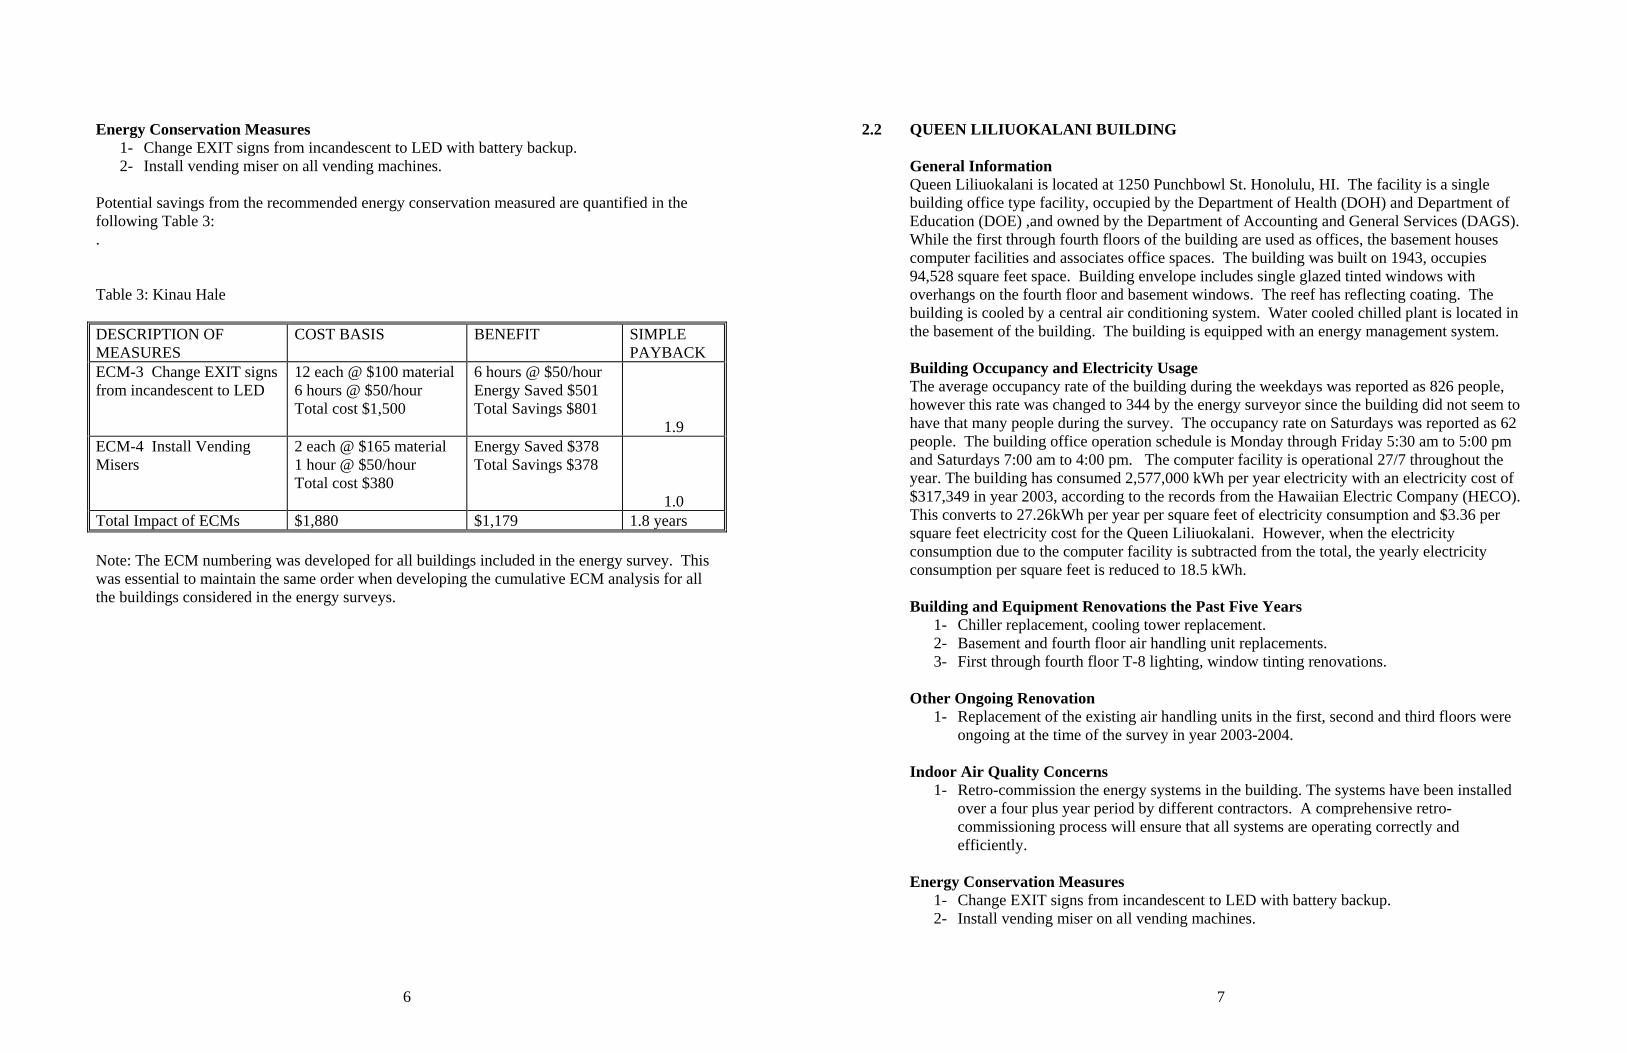
2.2 QUEEN LILIUOKALANI BUILDING Energy Conservation Measures 1- Change EXIT signs from incandescent to LED with battery backup. General Information 2- Install vending miser on all vending machines.
Queen Liliuokalani is located at 1250 Punchbowl St. Honolulu, HI. The facility is a single building office type facility, occupied by the Department of Health (DOH) and Department of Education (DOE) ,and owned by the Department of Accounting and General Services (DAGS). While the first through fourth floors of the building are used as offices, the basement houses computer facilities and associates office spaces. The building was built on 1943, occupies 94,528 square feet space. Building envelope includes single glazed tinted windows with overhangs on the fourth floor and basement windows. The reef has reflecting coating. The building is cooled by a central air conditioning system. Water cooled chilled plant is located in the basement of the building. The building is equipped with an energy management system.
Potential savings from the recommended energy conservation measured are quantified in the following Table 3: . Table 3: Kinau Hale DESCRIPTION OF MEASURES
COST BASIS BENEFIT SIMPLE PAYBACK
ECM-3 Change EXIT signs from incandescent to LED
12 each @ $100 material 6 hours @ $50/hour Total cost $1,500
6 hours @ $50/hour Energy Saved $501 Total Savings $801
1.9 ECM-4 Install Vending Misers
2 each @ $165 material 1 hour @ $50/hour Total cost $380
Energy Saved $378 Total Savings $378
1.0 Total Impact of ECMs $1,880 $1,179 1.8 years
Building Occupancy and Electricity Usage The average occupancy rate of the building during the weekdays was reported as 826 people, however this rate was changed to 344 by the energy surveyor since the building did not seem to have that many people during the survey. The occupancy rate on Saturdays was reported as 62 people. The building office operation schedule is Monday through Friday 5:30 am to 5:00 pm and Saturdays 7:00 am to 4:00 pm. The computer facility is operational 27/7 throughout the year. The building has consumed 2,577,000 kWh per year electricity with an electricity cost of $317,349 in year 2003, according to the records from the Hawaiian Electric Company (HECO). This converts to 27.26kWh per year per square feet of electricity consumption and $3.36 per square feet electricity cost for the Queen Liliuokalani. However, when the electricity consumption due to the computer facility is subtracted from the total, the yearly electricity consumption per square feet is reduced to 18.5 kWh.
Note: The ECM numbering was developed for all buildings included in the energy survey. This was essential to maintain the same order when developing the cumulative ECM analysis for all the buildings considered in the energy surveys.
Building and Equipment Renovations the Past Five Years 1- Chiller replacement, cooling tower replacement. 2- Basement and fourth floor air handling unit replacements. 3- First through fourth floor T-8 lighting, window tinting renovations.
Other Ongoing Renovation 1- Replacement of the existing air handling units in the first, second and third floors were ongoing at the time of the survey in year 2003-2004.
Indoor Air Quality Concerns 1- Retro-commission the energy systems in the building. The systems have been installed over a four plus year period by different contractors. A comprehensive retro-commissioning process will ensure that all systems are operating correctly and efficiently.
Energy Conservation Measures 1- Change EXIT signs from incandescent to LED with battery backup. 2- Install vending miser on all vending machines.
7 6

2.3 KEKUANAOA BUILDING Potential savings from the recommended energy conservation measured are quantified in the
following Table 4. General Information Kekuanaoa Building is located at 485 South King St. Honolulu, HI. The facility is a single building office type facility, occupied by seven different agencies and owned by the Department of Accounting and General Services (DAGS). The building occupies 65,075 square feet space. Its original construction date is not known. Building envelope includes double hang single glaze windows with drapes. No insulation layer on the walls or roof exists. The building is cooled by a central air conditioning system. The building does not have energy management system.
Table 4: Queen Liliuokalani Building DESCRIPTION OF MEASURES
COST BASIS BENEFIT SIMPLE PAYBACK
ECM-3 Change EXIT signs from incandescent to LED
16 each @$100 material 8 hours @ $50/hour Total cost $2,000
8 hours @ $50/hour Energy Saved $669 Total Savings $1,069
1.9
ECM-4 Install Vending Misers
2 each @ $165 material 1 hour @ $50/ hour Total cost $380
Energy Saved $378 Total Savings $378
1.0
ECM-5 Retro-commission $0.25 x 94,528 = $23,632 Productivity gain $18,900 one time Energy saved $15,125 per year
Total Impact of ECMs $26,012 $35,472 first year $16,572 thereafter
< 1 year total or 1.6 year energy only
Building Occupancy and Electricity Usage The average occupancy rate of the building during the weekdays is 250 people; no occupancy in the weekends. The building operation schedule is Monday through Friday 7:30 am to 4:30 pm. The building has consumed 1,457,680 kWh per year electricity with an electricity cost of $185,048 in year 2003, according to the records from the Hawaiian Electric Company (HECO). This converts to 22.55 kWh per year per square feet of electricity consumption and $2.84 per square feet electricity cost for the Kekuanaoa Building. Building and Equipment Renovations the Past Five Years
1- Chiller replacement. Other Ongoing Renovation
1- Cooling tower and chilled water pumping was scheduled for upgrades at the time of the survey in year 2003-2004.
Indoor Air Quality Concerns Note: The ECM numbering was developed for all buildings included in the energy survey. This was essential to maintain the same order when developing the cumulative ECM analysis for all the buildings considered in the energy surveys.
1- Copy machines have been installed in individual rooms in the office areas. There is no exhaust system to remove the contaminated air. This could cause an indoor air quality problem. Recommend the installation of an exhaust system to remove the air from the copy rooms.
2- The elevator is starting to malfunction. The elevator system needs a retrofit to avoid further problems.
3- Retro-commission the building when the cooling tower has been replaced and the lighting systems have been upgraded.
Energy Conservation Measures 1- Change EXIT signs from incandescent to LED with battery backup. 2- Install vending miser on all vending machines. 3- Existing lighting system needs to be upgraded to T-8 fluorescent with electronic ballasts. 4- The first floor SE corner is a high bay area with Metal Halide lamps. One of the lamps
has been replaced with a High Pressure Sodium Lamp. Metal Halide lamps should be stocked to avoid this problem.
9 8

2.4 KEELIKOLANI AND HALE AUHAU BUILDINGS Potential savings from the recommended energy conservation measured are quantified in the following Table 5.
General Information . Keelikolani and Hale Auhau Buildings are served of the same electric meter and same chiller plant. Therefore their energy survey results and energy conservation measures are presented together. Keelikolani building is located at 830 Punchbowl St. and Hale Auhau Building is located across the street from the Keelikolani, on 425 Queen St. in Honolulu, HI. Both facilities are office type facilities, owned by the Department of Accounting and General Services (DAGS). The Keelikolani is occupied by the Department Labor and Industrial Relations (DLIR), and the Hale Auhau is occupied by the Department of Taxation (DOTaxation). The Keelikolani was built on 1949, occupies 230,066 square feet space. The Hale Auhau was built on 1931, occupies 48,573 square feet space. Keelikolani building envelope includes window walls and vertical shades in place. Hale Auhau building envelope includes double hang windows with drapes. Both buildings are cooled by a single central air conditioning system, located in the Keelikolani. No energy management system exists in either buildings.
Table 5: Kekuanaoa Building DESCRIPTION OF MEASURES
COST BASIS BENEFIT SIMPLE PAYBACK
ECM-1 Change 2 lamp to T-8 w/ electronic ballasts
330 each @ $35 material 165 hours @ $100/hour Total cost $28,050
Energy Saved $15.22 Total Savings $5,023
5.6
ECM-2a Change to 2 lamp lighting system
750 each @ $75 mtl. 750 hours @ $150/hour Total cost $168,750
Energy Saved $52.63 Total Saved $39,470
4.3
ECM-3 Change EXIT signs from incandescent to LED
20 each @ $100 material 10 hours @ $50/hour Total cost $2,500
10 hours @ $50/hour Energy Saved $836 Total Savings $1,336
1.9
ECM-4 Install Vending Misers
4 each @ $165 material 2 hours @ $50/hour Total cost $ 760
Energy Saved $756 1
ECM-5 Retro-commission $0.25 x 65,075 = $16,300 Productivity gain $13,000 one time Energy saved $10,412 per year
0.7
Total Impact of ECMs $216,360 $69,997 first year $56,997 thereafter
3.6 years or 3.8 energy
Building Occupancy and Electricity Usage The average occupancy rate of the Keelikolani building during the weekdays is 625 people, and Saturdays is 60 people. The average occupancy rate of the Hale Auhau building during the weekdays is 170 people, and Saturdays is 20 people. Both buildings operation schedule is identical, which is Monday through Friday 6:30 am to 5:00 pm, and Saturdays 7:00 am to 4:00 pm. Both building together has consumed 4,248,400 kWh per year electricity with an electricity cost of $535,534 in year 2003, according to the records from the Hawaiian Electric Company (HECO). This converts to 14.92 kWh per year per square feet of electricity consumption and $1.88 per square feet electricity cost for the Keelikolani and Hale Auhau Buildings. Building and Equipment Renovations the Past Five Years
1- Two of the existing three chillers have been replaced . 2- Cooling towers and pumps have been upgraded. 3- Existing lamps and ballasts have been replaced to T-8 lamps with electronic ballasts.
Other Ongoing Renovation
1- Project on providing outside air to the air handlers through roof top vents was ongoing at the time of the survey in year 2003-2004.
Note: The ECM numbering was developed for all buildings included in the energy survey. This was essential to maintain the same order when developing the cumulative ECM analysis for all the buildings considered in the energy surveys. Future Renovations Considered 1- DAGS was planning to replace the 39 air handlers in the Hale Auhau Building with one
air handler per floor with pre-coolers and to provide fresh air at the rate of 20 cfm/person at the time of the survey in year 2003-2004. They also planed to increase the size of chiller No. 3 in the Keelikolani Building when replacement is necessary in order to handle the increased fresh air load from the Hale Auhau upgrade.
2- DAGS has been unable to obtain capital funding to upgrade the control system in
Keelikolani Building at the time of the survey in year 2003-2004. The original surveyors have recommend evaluating the cost-effectiveness of providing a direct digital control
11 10

2.5 FOREIGN TRADE ZONE # 9 WAREHOUSE AND OFFICE system and variable frequency drives to reduce energy consumption and increase comfort levels. However, no electricity savings or associates cost estimates were provided on this item by the surveyor.
General Information Foreign Trade Zone # 9 Office and Warehouse Building is located at OFT Armstrong Pier 2, Honolulu, HI. The facility is a single building, majority warehouse with a small area used for office space. The building is owned and occupied by the Department of Business, Economic Development, & Tourism (DBEDT). The original construction date of the building is not known. The total building square footage is 320,752, of which 286,001 sq.ft. is occupied by the warehouse, 14,451 sq.ft. is occupied by the offices and 20,300 sq.ft. is used as tenant lease space. Building envelope includes projection windows and overhang shading. No insulation recording was mode on the walls or roof. The building is cooled by a central air conditioning system. Water cooled chilled plant is attached to the east side of the building. The building is equipped with an energy management system.
Indoor Air Quality Concerns 1- No air quality problem was recorded.
Energy Conservation Measures 1- Change EXIT signs from incandescent or fluorescent to LED with battery backup 2- Install Vending Misers on all vending machines. 3- Retro-commission and rebalance the air distribution system in Keelikolani Building. The
existing system is dependent on an out of date control system. It failed at different stages and current air distribution patterns do not provide uniform temperature conditions.
Building Occupancy and Electricity Usage Potential savings from the recommended energy conservation measured are quantified in the
following Table 6. The average occupancy rate of the building during the weekdays is 50 people, and during the weekends is 10 people. The building operation schedule is Monday through Friday 6:10 am to 4:30 pm, Saturdays 6:40 am to 3:00 pm, and Sundays and Holidays 6:40 am to 12:00 noon. The warehouse is served by a separate meter, and has consumed 303,360 kWh per year electricity with an electricity cost of $41,727 in year 2003, according to the records from the Hawaiian Electric Company (HECO). This converts to 1.06 kWh per year per square feet of electricity consumption and $0.15 per square feet electricity cost for the Foreign Trade Zone # 9 Warehouse. The tenant lease space electricity is served from the office meter. The combined electricity usage of both the tenant lease space and the office was 792,960 kWh per year electricity with an electricity cost of $98,659 in year 2003, according to the records from the HECO. This converted to 22.82 kWh per year per square feet of electricity consumption and $2.84 per square feet electricity cost for the Foreign Trade Zone # 9 Office and Tenant Lease Space.
. Table 6: Keelikolani and Hale Auhau Buildings DESCRIPTION OF MEASURES
COST BASIS BENEFIT SIMPLE PAYBACK
ECM-2 Change EXIT signs from incandescent to LED
32 each @ $100 material 16 hours @ $50/hour Total cost $4,000
16 hours @ $50/hour Energy Saved $1,337 Total Savings $2,137
1.9
ECM-4 Install Vending Misers
6 each @ $165 material 3 hours @ $50/hour Total cost $1,140
Energy Saved $1,134 1.0
ECM-5 Retro-commission Keelikolani Building only
$0.25 x 238,066 = $59,500
Productivity gain $47,613 one time Energy saved $38,090 per year
1.5
Total Impact of ECMs $64,640 $88,974 first year $41,361 thereafter
< 1 year total or 1.6 energy
Building and Equipment Renovations the Past Five Years
1- Two chillers have been replaced. 2- Cooling tower and pumps have been upgraded. 3- Existing lamps and ballasts have been replaced to T-8 lamps with electronic ballasts.
Other Ongoing Renovation
1- None identified.
Note: Retro-commissioning of Hale Auhau Building should be delayed until VAC upgrade is completed. Future Renovations Considered
1- An addition to the office space of approximately 12,000 square feet was planned at the time of the survey in year 2003-2004.
Note: The ECM numbering was developed for all buildings included in the energy survey. This was essential to maintain the same order when developing the cumulative ECM analysis for all the buildings considered in the energy surveys. Indoor Air Quality Concerns
1- None Identified.
13 12

2.6 STATE JUDICIARY BUILDINGS Energy Conservation Measures 1- Change EXIT signs from incandescent to LED with battery backup. General Information 2- Install vending miser on all vending machines. The State Judiciary Buildings’ lighting energy surveys and potential retrofits were evaluated earlier under Energy Performance Contracts (EPC). A total of five buildings were evaluated under the EPC. The estimated potential energy savings by the lighting retrofits for those buildings estimated in year 2002 are listed in Table 8.
3- Retro-commission the chiller plant and office space. The existing system is controlled in a time clock fashion. An updated control system may allow the chillers and ventilation system to operate on an “as needed” basis.
Potential savings from the recommended energy conservation measured are quantified in the
following Table 7. Table 8: Summary of Judiciary Energy Savings Estimates by Facility .
Table 7: Foreign Trade Zone # 9 Office and Warehouse Building
15
FACILITY CONSUMPTION KWHSAVINGS
$ SAVINGS Simple Payback
Kauikeaouli Hale 5,432,000 966,200 $90,653 6.9 years Kaahumanu Hale 4,052,400 639,800 $62,209 8.8 years
Aliiolani Hale 1,727,760 172,100 $18,993 7.5 years Hoapili Hale 1,291,400 160,200 $25,579 9.1 years
Lahaina Dis. Crt. 31,700 1,060 $189 74.5 years Sub-total 12,535,260 1,939,360 $198,623 7.9 years
Utility Rebate - - $100,652 - Totals 12,535,260 1,939,360 - 7.4 years
DESCRIPTION OF MEASURES
COST BASIS BENEFIT SIMPLE PAYBACK
ECM-3 Change EXIT signs from incandescent to LED
14 each @$100 material 7 hours @ $50/hour Total cost $1,750
7 hours @ $50/hour Energy Saved $585 Total Savings $935
1.9
ECM-4 Install Vending Misers
1 each @ $165 material 1/2 hour @ $50/ hour Total cost $190
Energy Saved $189 Total Savings $189
1.0
ECM-5 Retro-commission $0.25 x 34,751 = $8,690 Energy saved $5,470 per year
Total Impact of ECMs $8,440 $6,594 1.3 years
Following is a description of the occupancy type for the areas proposed for upgrades in 2002 along with a general description of the types of improvements being proposed:
Note: The ECM numbering was developed for all buildings included in the energy survey. This was essential to maintain the same order when developing the cumulative ECM analysis for all the buildings considered in the energy surveys.
1- Courtrooms, offices, hallways, public areas, elevator lobbies, bathrooms, and parking
structures: • Replace T-12 fluorescent lamps and magnetic ballasts with T-8 fluorescent lamps and
electronic ballasts. • Replace incandescent floodlights with compact fluorescent lamps. • Install occupancy sensors to automatically shut off lights when courtrooms or offices
are vacant. • De-lamp over lit areas.
2- Plaza and loading dock:
• Re-lamp and re-ballast existing 70-watt High Pressure Sodium (HPS) fixtures with new 70-watt HPS.
3- Holding Cell:
• Replace existing incandescent and fluorescent fixtures with “security/vandal proof” fixtures.
14

2.7 HIARNG ENERGY EFFICIENCY MEASURES 4- General: • Replace Incandescent EXIT signs with new LED EXIT signs. General Information • Replace Mercury lamps in recessed cans with compact fluorescent lamps in atrium
halls. The Department of Defense Hawaii Army National Guard (DOD HIARNG) Buildings’ energy surveys and potential retrofits were evaluated by Energy Performance Contracts (EPC) in 2002 . A total of 16 buildings statewide were evaluated under the EPC. The estimated potential energy savings for those buildings estimated in year 2002 are listed in Table 9.
• Replace glaring Metal Halide fixtures with T-5 fluorescent in atrium halls. • Lighting in Historical Register Building, Aliiolani Hale, will only be upgraded where
historical fixtures will not be disturbed.
The total savings attributable to lighting upgrades is approximately 15.5% of electricity consumption in these facilities at the time of the study. Table 9: Summary of HIARNG Energy Savings by Facility in Oahu.
FACILITY CONSUMPTION KWH SAVINGS $ SAVINGS SPB
Ft. Ruger 300 Armory 160,200 10,410 $1,330 16.10 yr. Ft. Ruger 306/ 306A Arm 1,260,000 348,710 $44,140 13.65 yr.
Ft. Ruger 407 Admin 122,800 12,600 $1,530 3.70 yr. Kalealoa 1784-1788 165,600 60,000 $7,200 89.06 yr. Kalealoa 1898 Hdq 1,332,000 357,880 $42,910 14.98 yr.
Kalealoa 19 Mess Facility 480,000 19,330 $2,320 14.7 yr. Kalealoa 282 Hanger 1,644,000 1,031,030 $139,710 3.63 yr. Kalealoa 46 Enlisted 744,000 33,330 $4,000 7.79 yr.
Wahiawa 1,2&4 A&M 653,760 178,000 $21,360 21.30 yr. Waiawa 1&23101 Armory 550,680 86,450 $10,390 7.91 yr. Waiawa 21&23317 I&M 196,500 26,540 $3,190 12.60 yr. Wheeler AFB 829&833 475,000 192,900 $23,150 3.70 est.
Hanapepe 1 Armory 161,040 15,800 $2,530 12.01 yr. Hanapepe 27 Maintenance 26,890 2,690 $430 6.26 yr.
Kapaa 1 Armory 68,440 6,100 $1,160 9.62 yr. Hilo 618 & 621 497,600 84,650 $15,040 3.03 est.
Sub-Total 8,538,510 2,461,420 $320,390 11.6 yr.Utility Rebate - - $167,160 -
Total 8,538,510 2,461,420 - 11.1 yr.
The current status of the listed energy conservation measures should be determined and findings should be included in the current benchmarking study. Note: Since the current benchmarking study is limited to the Island of Oahu, only the buildings
in Oahu should be considered in the future phases of the benchmarking study. Following is a description of the occupancy type for the areas where lighting was upgraded along
with a general description of the types of improvements were proposed in 2002: 1- Offices, classrooms, hallways, public areas, bathrooms, and computer rooms: • Replace T-12 fluorescent lamps and magnetic ballasts with T-8 fluorescent lamps and
electronic ballasts. • Replace incandescent lights with compact fluorescent lamps.
17 16

3.0 LIST OF BUILDING INFORMATION REQUIRED FOR THE BENCHMARKING STUDY
• Install Specular Reflectors in fixtures that the lighting is being changed from four lamps to 2 lamp fixtures.
• Install occupancy sensors to turn off lighting in areas that occupants are not present all the time.
In addition to a new set of the walk through surveys, some information will be required from the participating state buildings in order to conduct the “State Facility Benchmarking Study.” The list of the requested information is listed in the following Table 10.
• Replace existing EXIT signs with new LED EXIT signs.
2- Hangers • Retrofit Hangers with Inductively Coupled Electrodeless Lamps and remove HID
lamps. Table 10: The list of information required for the Benchmarking Study. • Install Day lighting Control in areas where skylights allow daylight to penetrate the
space.
BENCHMARK INPUT
Operation Hours Total Building Percentage Area Cooled Building Age Is Lighting Retrofitted? Percentage Occupancy Rate Other Equipment Retrofits in the Past Five Years Total Number of PC in the Building Are Windows Tinted? Percentage Building total Square Footage Total Number of Floors Type of Cooling Equipment Yearly Electricity Consumption
The Air-Conditioning system was being upgraded in six of the facilities in 2002:
1- The upgrades in Ft. Ruger 306/306a, Kalaeloa 1898, Wahiawa 1, and Wheeler 829 were primarily being made because the existing equipment was reaching the end of its maximum useful life.
2- In the case of Kalaeloa 1784-1788 the equipment failed and a rental machine was brought in to provide the necessary cooling.
3- In the case of Hilo 618 the existing system was ready to fail and the control system has already become non-functional.
As noted previously, since the current benchmarking study is limited to the Island of Oahu only,
the buildings in Oahu should be extracted from this referenced ECO study in the future phases of the benchmarking study.
Additionally, current implementation status of the listed energy conservation measures should be
determined and findings should be included in the current benchmarking study.
19 18
APPENDIX 4.0
State of Hawaii Electricity Consumption by State Agencies and Percentage Electricity Consumed for Fiscal Year 2002 Summarized from
“Hawaii State Facility Energy Upgrade Analysis & Performance Contracting Potential Phase I and Phase II Reports”

TABLE 2 STATE OF HAWAII AGENCY ELECTRICAL CONSUMPTION
CUSTOMER AGENCY TARIFF APPROX ANNUAL % TOTAL ANNUALNUMBER CODE # METERS kWh CONSUMPTION COST
9603-0543 SOH CONV CTR AUTH 1 1 7,524,000 909,670.21$ CONVENTION CENTER TOTAL 1 7,524,000 1.13% 909,670.21$
8807-1307 SOH DAGS 1 43 41,569,803 4,747,477.07$ 8603-4435 SOH DAGS 2 16 1,721,793 328,285.16$ 8700-0217 SOH DAGS 3 8 1,491,115 260,223.17$ 9204-5346 SOH DAGS 5 3 422,490 89,298.28$
A SOH DAGS 6 7 1,560,054 385,930.98$ DAGS TOTAL 77 46,765,255 7.00% 5,811,214.66$
8814-1379 SOH DBEDT 1 11 1,414,286 186,864.38$ 9801-4502 SOH DBEDT 5 1 - 212.70$
DBEDT TOTAL 12 1,414,286 0.21% 187,077.08$
8820-1034 SOH DOA 1 15 1,268,475 169,453.05$ 8603-5946 SOH DOA 2 7 132,535 30,356.54$ 9204-2009 SOH DOA 5 4 1,071,280 209,108.59$
B SOH DOA 6 1 10,900 5,869.79$ DEPT OF AGRICULTURE TOTAL 27 2,483,190 0.37% 414,787.97$
C SOH ATG 6 1 32,190 7,816.79$ DEPT OF ATTORNEY GENERAL TOTAL 1 32,190 0.005% 7,816.79$
9204-3214 SOH DOD 1 17 4,082,567 481,973.33$ 8602-9330 SOH DOD 2 33 1,377,213 271,240.46$ 9204-3214 SOH DOD 3 6 446,558 80,797.15$ 9501-1255 SOH DOD 5 2 31,680 9,605.49$
E SOH DOD 6 1 156,160 35,103.58$ DEPT OF DEFENSE TOTAL 59 6,094,178 0.91% 878,720.01$
0101-4685 SOH DOE 1 296 92,732,273 11,944,413.29$ 0101-8269 SOH DOE 2 137 16,305,101 3,285,604.99$ 0101-5653 SOH DOE 3 59 11,211,582 2,052,221.16$ 0101-5653 SOH DOE 4 2 450,720 119,923.79$ 0101-5653 SOH DOE 5 16 1,249,813 293,424.94$
F SOH DOE 6 44 6,348,419 1,610,021.73$ DEPT OF EDUCATION TOTAL 554 128,297,908 19.19% 19,305,609.90$
9301-1976 SOH DOHHL 1 20 68,836 8,767.97$ 9703-6269 SOH DOHHL 2 10 62,058 17,265.81$ 0103-6662 SOH DOHHL 3 3 9,605 2,022.85$ 9301-1976 SOH DOHHL 5 8 1,503,491 238,763.35$
H SOH DOHHL 6 1 93,040 25,768.21$ DEPT OF HAWIIAN HOME LANDS TOTAL 42 1,737,030 0.26% 292,588.19$
9502-1446 SOH DOH 1 48 22,419,959 2,435,205.02$ 8603-6561 SOH DOH 2 37 14,195,299 2,262,192.00$ 8700-1032 SOH DOH 3 44 9,586,021 1,373,855.21$ 8703-6225 SOH DOH 4 2 200,683 48,984.73$ 9204-2979 SOH DOH 5 1 1,188,000 231,870.36$
I SOH DOH 6 3 32,842 8,484.86$ DEPT OF HEALTH TOTAL 135 47,622,804 7.12% 6,360,592.18$
8811-8347 SOH DOHS 1 65 2,985,569 376,990.51$ 9402-3824 SOH DOHS 2 17 533,195 116,348.02$ 8700-1090 SOH DOHS 3 8 155,532 30,840.47$
K SOH DOHS 6 10 189,249 47,172.08$ DEPT OF HUMAN SERVICES TOTAL 100 3,863,545 0.58% 571,351.08$
8809-6280 SOH DOLIR 1 5 122,953 17,406.60$ 8602-9149 SOH DOLIR 2 12 312,299 76,484.35$
N SOH DOLIR 6 2 39,100 9,704.69$ DEPT OF LABOR & IND RELATIONS TOTAL 19 474,352 0.07% 103,595.64$
8807-7879 SOH DOL&NR 1 90 2,215,366 290,054.41$ 9201-8358 SOH DOL&NR 2 42 707,805 156,738.68$ 8702-4781 SOH DOL&NR 3 37 252,198 52,586.19$ 8702-4781 SOH DOL&NR 4 2 12,000 3,048.82$ 9204-4602 SOH DOL&NR 5 5 33,435 10,131.19$
O SOH DOL&NR 6 22 291,899 74,297.67$ DEPT OF LAND & NAT RES TOTAL 198 3,512,703 0.53% 586,856.96$
9401-3209 SOH PSD 1 10 16,762,902 1,708,410.37$ 8603-9236 SOH PSD 2 15 2,541,991 437,712.49$ 8700-2210 SOH PSD 3 2 2,203,910 328,144.40$
Q SOH PSD 6 7 859,093 194,619.96$ DEPT OF PUBLIC SAFETY TOTAL 34 22,367,896 3.35% 2,668,887.22$
8800-1207 SOH DOT AIR DIV 1 60 104,775,202 10,291,989.82$ 8604-9500 SOH DOT AIR DIV 2 28 9,736,183 1,515,170.48$ 0101-5653 SOH DOT AIR DIV 3 4 10,497,460 1,527,209.14$ 8700-9409 SOH DOT AIR DIV 4 1 523,200 131,384.58$ 8700-9409 SOH DOT AIR DIV 5 2 106,701 24,213.64$
R SOH DOT AIR DIV 6 12 4,508,581 981,152.88$ DOT AIRPORTS DIVISION TOTAL 107 130,147,327 19.47% 14,471,120.54$
8820-6076 SOH DOT HAR DIV 1 66 4,559,658 603,618.88$ 8600-2215 SOH DOT HAR DIV 2 11 84,481 23,461.90$ 9102-5682 SOH DOT HAR DIV 3 10 410,487 80,573.71$

TABLE 2 STATE OF HAWAII AGENCY ELECTRICAL CONSUMPTION
CUSTOMER AGENCY TARIFF APPROX ANNUAL % TOTAL ANNUALNUMBER CODE # METERS kWh CONSUMPTION COST
9102-5682 SOH DOT HAR DIV 5 1 13,137 3,895.18$ S SOH DOT HAR DIV 6 11 312,006 81,875.74$
DOT HARBORS DIVISION TOTAL 99 5,379,769 0.80% 793,425.41$
8801-5441 SOH DOT HWY DIV 1 454 26,423,316 3,267,727.21$ 8602-1234 SOH DOT HWY DIV 2 98 1,246,898 282,302.92$ 8701-8331 SOH DOT HWY DIV 3 225 1,727,015 381,012.96$ 8701-8331 SOH DOT HWY DIV 4 3 1,476 860.64$ 9204-1732 SOH DOT HWY DIV 5 11 150,304 44,898.82$
T SOH DOT HWY DIV 6 36 393,868 101,346.07$ DOT HIGHWAYS DIVISION TOTAL 827 29,942,877 4.48% 4,078,148.62$
8822-2776 SOH HCDCH 1 785 19,429,529 2,329,589.58$ 8600-2366 SOH HCDCH 2 345 1,196,518 296,193.42$ 8807-8210 SOH HCDCH 3 131 867,422 160,119.06$ 9400-0679 SOH HCDCH 5 8 24,004 7,286.12$
J SOH HCDCH 6 23 387,202 95,833.99$ HOUSING & COMM DEV CORP OF HAW TOTAL 1,292 21,904,675 3.28% 2,889,022.17$
8820-5405 JUDICIARY DEPT 1 19 12,057,449 1,321,154.73$ 9400-6716 JUDICIARY DEPT 2 9 266,482 59,297.25$ 9202-2806 JUDICIARY DEPT 3 1 10,840 2,352.97$
L JUDICIARY DEPT 6 10 151,917 38,276.99$ JUDICIARY DEPT TOTAL 39 12,486,688 1.87% 1,421,081.94$
9202-6207 NELHA 2 6 3,498,125 554,542.63$ NAT ENERGY LAB OF HAW TOTAL 6 3,498,125 0.52% 554,542.63$
8800-5226 SOH OFF LT. GOV 1 2 120,309 16,710.04$ OFFICE OF LT GOVERNOR TOTAL 2 120,309 0.02% 16,710.04$
8701-6933 SOH HSPLS 1 45 6,767,094 857,530.01$ 8604-7371 SOH HSPLS 2 12 633,397 134,698.58$ 8701-6933 SOH HSPLS 3 5 587,730 106,947.90$ 8701-6933 SOH HSPLS 4 1 79,360 22,612.75$ 8701-6933 SOH HSPLS 5 2 40,851 10,313.99$
P SOH HSPLS 6 4 597,280 148,432.23$ HAW STATE PUBLIC LIBRARIES SYS TOTAL 69 8,705,712 1.30% 1,280,535.46$
8820-2530 SOH - OTHER 1 6 1,438,947 163,052.66$ 8604-9277 SOH - OTHER 2 8 60,216 15,873.96$ 0100-5035 SOH - OTHER 3 8 233,249 44,235.67$ 8701-5117 SOH - OTHER 4 1 90,979 23,501.78$
SOH OTHER FACILITIES TOTAL 23 1,823,391 0.27% 246,664.07$
8824-1170 SOH STADIUM AUTH 1 4 3,544,412 480,163.83$ STADIUM AUTHORITY TOTAL 4 3,544,412 0.53% 480,163.83$
8816-7592 U OF H MANOA 1 128 136,648,607 13,341,627.19$ 8603-6037 U OF H MANOA 2 1 1,268 861.93$ 8801-3683 U OF H WEST OAHU 1 1 43,564 6,068.39$ 8603-6037 U OF H HAWAI'I 2 58 11,486,642 2,018,030.43$ 8701-4964 U OF H MAUI 3 13 530,172 92,622.25$
U U OF H HAWAI'I 6 3 6,864 2,439.18$ UNIVERSITY OF HAWAII TOTAL 204 148,717,117 22.25% 15,461,649.37$
8824-5561 U OF H COMM COLL 1 18 22,848,884 2,584,922.70$ 8700-8959 U OF H COMM COLL 3 6 4,948,494 753,031.73$ 8701-6938 U OF H COMM COLL 4 1 26,716 6,628.84$ 9204-1172 U OF H COMM COLL 5 3 203,620 47,083.85$
U OF H COMM COLL 6 3 1,962,205 463,532.29$ COMMUNITY COLLEGE TOTAL 31 29,989,919 4.49% 3,855,199.41$
ISLAND OF OAHU TOTAL 1 2,209 531,823,960 79.56% 58,540,841.25$
ISLAND OF HAWAII TOTAL 2 902 66,099,499 9.89% 11,882,662.20$
ISLAND OF MAUI TOTAL 3 570 45,169,390 6.76% 7,328,795.99$
ISLAND OF MOLOKAI TOTAL 4 13 1,385,134 0.21% 356,945.93$
ISLAND OF LANAI TOTAL 5 67 6,038,806 0.90% 1,220,106.51$
ISLAND OF KAUAI TOTAL 6 201 17,932,869 2.68% 4,317,679.71$
SOH AGENCY ELECTRICAL CONSUMPTION TOTAL 3,962 668,449,658 100.00% 83,647,031.59$
LEGEND:
TARIFF CODE 1 = HAWAIIAN ELECTRIC COMPANY (HECO) CONSUMPTION DATA FOR 1-JUL-01 THROUGH 30-JUN-022 = HAWAII ELECTRIC COMPANY (HELCO) CONSUMPTION DATA FOR 1-JUL-01 THROUGH 30-JUN-023, 4, & 5 = MAUI ELECTRIC COMPANY (MECO) CONSUMPTION DATA FOR 1-JUL-01 THROUGH 30-JUN-026 = KAUAI ISLAND UTILITY COOPERATIVE (KIUC) CONSUMPTION DATA FOR 1-JAN-01 THROUGH 31-DEC-01
CONSUMPTION INCLUDES TOTAL ELECTRICAL CONSUMPTION BY ISLAND AND STATEWIDE FOR EACH AGENCY

APPENDIX 4.1
Large and Medium Size State Facilities on Oahu Electricity Consumption History for Fiscal Year 2002 Reported in “Hawaii State Facility Energy Upgrade Analysis & Performance Contracting Potential Phase I and Phase II Reports”

TABLE 4 STATE OF HAWAII AGENCY LARGE FACILITY ELECTRICAL CONSUMPTION
ACCOUNT AGENCY FACILITY LOCATION RATE TARIFF NUMBER ANNUAL ANNUALNUMBER SCHEDULE CODE READINGS KWH $ COST
8800-6839-077 SOH DAGS 400 S HOTEL ST (STATE CAPITOL) PS5 1 12 6,304,000 $706,862.618819-2839-079 SOH DAGS 919 ALA MOANA BLVD (AAFES) J3 1 12 2,473,000 $276,003.388819-9076-075 SOH DAGS 869 PUNCHBOWL ST (TRANSPORTATION) J 1 24 1,731,520 $202,070.888820-4007-075 SOH DAGS 1390 MILLER ST (QUEEN LILIOLULANI) J3 1 12 2,455,000 $278,499.028820-5318-076 SOH DAGS 1151 PUNCHBOWL ST (KALANIMOKU) PS5 1 12 7,090,200 $748,490.388820-5319-075 SOH DAGS 1250 PUNCHBOWL ST (KINAU HALE) J 1 12 1,809,600 $212,507.918824-3048-076 SOH DAGS 235 S BERETANIA ST (OFFICE TOWER) J 1 12 2,455,600 $286,963.658824-4189-078 SOH DAGS 250 S HOTEL ST (NO. 1-DISTRICT BLDG) J 1 12 2,312,400 $254,055.908824-4781-075 SOH DAGS 465 S KING ST (KEKUANAO'A BLDG) J 1 12 1,455,200 $169,776.648824-8557-076 SOH DAGS 830 PUNCHBOWL ST (OFFICE BLDG #2) J 1 12 4,431,600 $505,809.198824-8619-075 SOH DAGS 1010 RICHARDS ST (KAMAMALU) J5 1 12 1,504,000 $176,553.139800-1977-002 SOH DAGS 601 KAMOKILA BV (KAKUIHEIWA KAPOLEI) J 1 12 2,818,000 $330,470.168823-4938-076 SOH DAGS 99500 SALT LAKE BV (STADIUM AUTHORITY) J3 1 20 3,520,200 $476,567.80
TOTAL SOH DAGS LARGE FACILITIES 13 Facilities 40,360,320 $4,624,630.65
9600-5614-003 SOH DBEDT 1777 KAPIOLANI BV (HCC) PS 1 12 7,524,000 $909,670.218819-4960-078 SOH DBEDT 0 FT ARMSTRONG PIER 2 (FTZ) J 1 24 1,054,720 $125,325.738819-5909-075 SOH DBEDT 1541 KALAKAUA AV (HCDCH) PP3 1 12 1,931,000 $199,992.008823-1584-076 SOH DBEDT 99132 KOHOMUA ST (HCDCH) PP3 1 12 2,146,200 $227,696.489400-2851-001 SOH DBEDT 1545 LINAPUNI ST #BLDG B (HCDCH HHA) J 1 12 1,131,680 $121,062.119400-2852-001 SOH DBEDT 1475 LINAPUNI ST #BLDG (HCDCH HHA) J 1 12 1,233,120 $129,018.68
TOTAL SOH DBEDT LARGE FACILITIES 6 Facilities 15,020,720 $1,712,765.21
8811-6162-076 SOH DOD 3949 DIAMOND HEAD RD J 1 36 1,530,720 $174,952.23
TOTAL SOH DODEFENSE LARGE FACILITIES 1 Facility 1,530,720 $174,952.23
0000-3209-004 SOH DOE 915007 KAPOLEI PKWY J 1 12 2,290,000 $272,433.630100-2579-004 SOH DOE 46155 KAMEHAMEHA HY J 1 11 1,190,880 $150,604.950100-2966-002 SOH DOE 91884 FT WEAVER RD J 1 29 2,320,000 $294,370.908801-3223-078 SOH DOE 2460 WAIMANO HOME RD (PEARL CITY HIGH) J3 1 12 1,494,600 $182,507.288801-5001-077 SOH DOE 941211 FARRINGTON HY (WAIPAHU HIGH) J 1 24 1,659,200 $220,988.348803-0106-077 SOH DOE 89980 NANAKULI AV (NANAKULI HIGH & INTER) J3 1 12 1,302,600 $170,626.068803-9117-078 SOH DOE 85271 FARRINGTON HY (WAIANAE HIGH) J 1 12 1,074,080 $133,017.758806-1340-077 SOH DOE 951200 MEHEULA PARKWAY(MILILANI HIGH) J3 1 12 1,576,800 $190,820.598806-3539-079 SOH DOE 67160 FARRINGTON HY (WAIALUA HIGH) J 1 48 1,081,360 $149,799.078809-2020-077 SOH DOE 45386 KANEOHE BAY DR (CASTLE HIGH) J3 1 58 1,752,195 $214,752.158809-6595-077 SOH DOE 760 ILIAINA ST (KALAHEO) J 1 12 1,082,880 $132,615.458811-3369-078 SOH DOE 511 LUNALILO HOME RD (KAISER HIGH) J3 1 24 1,610,160 $200,481.538812-7930-077 SOH DOE 4680 KALANIANAOLE HY (KALANI HIGH) J 1 36 1,028,632 $124,411.168814-6868-077 SOH DOE 2705 KAIMUKI AVE (KAIMUKI HIGH) J3 1 24 2,159,820 $248,180.348818-8260-078 SOH DOE 1120 NEHOA ST (ROOSEVELT HIGH) J 1 24 1,321,800 $168,822.398819-7510-077 SOH DOE 1039 S KING ST (MCKINLEY HIGH) J 1 23 2,429,760 $293,098.068821-9443-077 SOH DOE 1564 N KING ST (FARRINGTON HIGH) J 1 72 1,812,520 $229,096.628822-5334-078 SOH DOE 1185 ALA NAPUNANI ST (MOANALUA HIGH) J 1 47 2,035,520 $254,202.659600-2562-003 SOH DOE 911561 KEAUNUI RD HOLOMUA ELEMENTARY) J 1 12 1,508,400 $185,101.089800-2018-003 SOH DOE 951140 LEHIWA DR (MILILANI INTERMED) J 1 12 2,058,800 $250,897.789900-0148-003 SOH DOE 915335 KAPOLEI PKWY (KAPOLEI MID SCH) J 1 12 1,589,520 $194,643.558820-3139-077 SOH HSPLS 478 S KING ST (HAWAII STATE LIBRARY) J 1 12 1,592,160 $187,214.88
TOTAL SOT DOEDUCATION LARGE FACILITIES 22 Facilities 35,971,687 $4,448,686.21
8808-7404-076 SOH DOH 45747 KEAAHALA RD (HAWAII STATE HOSP) PP3 1 12 4,162,800 $417,400.898808-7405-075 SOH DOH 45633 KEAAHALA RD J3 1 12 1,073,600 $121,437.398813-6833-076 SOH DOH 3627 KILAUEA AV (ADMIN SRVC OFF) J 1 12 1,604,400 $191,076.408813-6841-075 SOH DOH 3675 KILAUEA AV PP3 1 12 2,898,000 $316,966.068821-2602-075 SOH DOH 1103 HALA DR (MALUHIA HOSP) PP3 1 12 2,395,200 $241,526.239300-8875-002 SOH DOH 2725 WAIMANO HOME RD (ADMIN OFF) PS 1 12 6,542,400 $661,633.24
TOTAL SOH DOHEALTH LARGE FACILITIES 6 Facilities 18,676,400 $1,950,040.21
8803-9993-076 SOH PSD 94560 KAMEHAMEHA HY (WAIAWA CORR FAC) J3 1 12 1,270,000 $139,010.068823-3657-076 SOH PSD 5100 MOANALUA RD J 1 12 1,400,880 $144,947.438823-3672-076 SOH PSD 99902 MOANALUA RD (HALAWA PRISON) PS 1 12 5,276,400 $534,958.568823-8291-076 SOH PSD 2199 KAMEHAMEHA HY (OCCC & HSE CORR) PP3 1 12 6,709,200 $663,983.529300-5247-002 SOH PSD 42477 KALANIANAOLE HY J 1 12 1,667,280 $173,746.61
TOTAL SOH DEPT OF PUBLIC SAFETY LARGE FACILITIES 5 Facilities 16,323,760 $1,656,646.18
0000-3507-001 SOH DOT - AIR DIV 40 PIER (KAPALAMA MIL RES) J 1 18 3,658,000 $439,698.288800-6352-076 SOH DOT - AIR DIV 302 RODGERS BV #344 (IAB VAULT "B") PP3 1 12 13,664,000 $1,314,747.508800-6359-076 SOH DOT - AIR DIV 302 RODGERS BV #342 (SVC CRT VLT "C") PP3 1 12 7,488,000 $704,534.838800-6365-075 SOH DOT - AIR DIV 302 RODGERS BV #336 (OST VLT "N") PP3 1 12 16,932,000 $1,603,470.228800-6353-076 SOH DOT - AIR DIV 304 RODGERS BV #360 (EWA VLT "1E") PP3 1 12 4,598,000 $442,388.078800-6356-075 SOH DOT - AIR DIV 300 RODGERS BV (COMM TERM ELEC) J3 1 12 1,269,600 $128,209.008800-6357-075 SOH DOT - AIR DIV 300 RODGERS BV #355 (OSPARK VLT "A") J4 1 12 1,848,240 $184,599.418800-6358-076 SOH DOT - AIR DIV 301 RODGERS BV #A (DIA HD EXT) PP3 1 12 11,793,600 $1,118,490.178800-6364-076 SOH DOT - AIR DIV 301 RODGERS BV (CEN CONC VLT "Y") PP3 1 12 5,667,600 $565,778.848800-6360-075 SOH DOT - AIR DIV 303 RODGERS BV #373 (DIA HD VLT "1D") PP3 1 11 7,524,000 $720,394.519201-0482-002 SOH DOT - AIR DIV 3651 AOLELE ST (EWA CHILLER PLT) PP3 1 12 11,959,200 $1,204,785.439300-0115-002 SOH DOT - AIR DIV 3650 AOLELE ST (NEW INTERISLE TERM) PS 1 12 12,211,200 $1,171,502.489300-4842-002 SOH DOT - AIR DIV 3661 AOLELE ST (EWA CONC GATES) PP3 1 12 2,311,200 $230,294.048811-0340-076 SOH DOT HWY DIV 2 PALI HY (PRIMECO & ST LTS) J3 1 11 1,016,720 $104,055.048824-9624-058 SOH DOT HWY DIV 0 WILSON TUNNEL J3 1 12 1,379,200 $143,007.659400-4323-001 SOH DOT HWY DIV 0 H-3 TUNNEL HAIKU IB PORTAL (HE INT) J3 1 12 4,146,000 $527,091.28
TOTAL SOH DOTRANSPORTATION LARGE FACILITIES 16 Facilities 107,466,560 $10,603,046.75
8819-9077-077 SOH JUDICIARY 777 PUNCHBOWL ST (KAAHUMANU HALE) PS 1 12 4,061,600 $445,705.938824-2360-078 SOH JUDICIARY 1111 ALAKEA ST (KAUIKEAOULI DIS CT 1ST C) PS 1 12 5,164,000 $536,807.668824-4780-075 SOH JUDICIARY 417 S KING ST (ALIIOLANE HALE) J5 1 12 1,693,440 $192,289.61
TOTAL SOH JUDICIARY LARGE FACILITIES 3 Facilities 10,919,040 $1,174,803.20
8813-7302-075 UH MANOA 650 MAKAPUU AV (SCHOOL OF MEDICINE) J 1 12 1,035,920 $108,285.288815-4443-075 UH MANOA 2777 KALAKAUA AV (WAIKIKI AQUARIUM) J 1 12 1,292,880 $133,874.40

TABLE 4 STATE OF HAWAII AGENCY LARGE FACILITY ELECTRICAL CONSUMPTION
ACCOUNT AGENCY FACILITY LOCATION RATE TARIFF NUMBER ANNUAL ANNUALNUMBER SCHEDULE CODE READINGS KWH $ COST
8816-2141-076 UH MANOA 2445 DOLE ST (FACILITIES MGMT) J 1 24 1,409,920 $160,564.798816-2154-076 UH MANOA 1701 EAST WEST RD (FACILITIES MGMT) PP3 1 12 121,201,200 $11,585,576.898817-7690-076 UH MANOA 2680 WOODLAWN DR (ASTRONOMY FAC) PP3 1 12 2,075,400 $211,407.179800-2426-001 UH MANOA 46007 LILIPUNA RD (HIMB) J 1 12 1,736,240 $177,047.56
TOTAL UH MANOA LARGE FACILITIES 6 Facilities 128,751,560 $12,376,756.09
8801-5005-075 UH COMM COLL 96045 ALAIKE ST (LEEWARD) PP3 1 12 5,355,600 $601,529.918814-8544-076 UH COMM COLL 655 MAKAPUU AV (KAPIOLANI BUSINESS) J3 1 12 7,930,800 $888,040.038823-6252-075 UH COMM COLL 874 DILLINGHAM BV (HONOLULU) PP3 1 36 4,915,590 $563,697.219500-5803-001 UH COMM COLL 45720 KEAAHALA RD (HALE IMILOA) PS 1 12 3,447,600 $369,203.18
TOTAL UH COMMUNITY COLLEGES LARGE FACILITIES 4 Facilities 21,649,590 $2,422,470.33
TOTAL OAHU SOH LARGE FACILITIES 82 Facilities 396,670,357 $41,144,797.06
TOTAL ALL OAHU SOH FACILITIES 531,823,960 $58,540,841.25
8603-9132-001 SH DAGS 75 AUPUNI ST J3 2 12 1,103,200 $197,756.94
TOTAL SH DAGS LARGE FACILITIES 1 Facility 1,103,200 $197,756.94
8600-1704-001 SH DBEDT KEAHOLE #OTEC CABINET (NELHA) J3 2 12 2,001,600 $309,638.15
TOTAL SH DBEDT - NELHA LARGE FACILITIES 1 Facility 2,001,600 $309,638.15
8604-2844-003 SH DOE/HELCO WAIAKEA HIGH SCHOOL J3 2 12 1,203,000 $217,265.189700-1291-003 SH DOE/HELCO KEALAKEHE #HIGH SCHOOL J 2 12 1,198,400 $223,069.579800-2311-002 SH DOE/HELCO KEAAU PAHOA RD-ELEMENTARY II J 2 11 1,120,660 $211,799.129900-0545-003 SH DOE/HELCO KEAAU HIGH SCHOOL J 2 12 2,024,400 $379,311.24
TOTAL SH DOEDUCATION/HELCO LARGE FACILITIES 4 Facilities 5,546,460 $1,031,445.11
8602-4929-001 SH DOH KEALAKEKUA (KONA HOSP) P3 2 12 3,328,800 $490,876.280000-0000-022 SH DOH 1190 WAIANUENUE AV (HILO MED CTR) P 2 12 7,804,200 $1,197,069.009400-6479-001 SH DOH HONOKAA (HAMA HOOLA HAMAKUA) J 2 12 1,350,000 $234,807.77
TOTAL SH DOHEALTH LARGE FACILITIES 3 Facilities 12,483,000 $1,922,753.05
9700-3316-002 SH PSD STAINBACK HY (CORRECTIONAL DIV) P 2 12 1,152,400 $196,470.35
TOTAL SH DEPT OF PUBLIC SAFETY LARGE FACILITIES 1 Facility 1,152,400 $196,470.35
8600-1960-001 SH DOT AIR DIV KEAHOLE AIRPORT P3 2 12 5,348,400 $790,953.858604-3528-001 SH DOT AIR DIV LYMAN FIELD P3 2 12 3,696,000 $575,646.03
TOTAL SH DOTRANSPORTATION LARGE FACILITIES 2 Facilities 9,044,400 $1,366,599.88
9600-2104-001 SH UH-HAWAI'I 1175 MANONO ST (COMMUNITY COLL) J3 2 12 1,224,720 $218,355.089900-2035-002 SH UH-HAWAI'I NOWELO ST - MAIN SW GEAR P3 2 12 5,633,100 $927,075.17
TOTAL SH UH HAWAI'I LARGE FACILITIES 2 Facilities 6,857,820 $1,145,430.25
TOTAL BIG ISLAND (HAWAI'I) SOH LARGE FACILITIES 14 Facilities 38,188,880 $6,170,093.73
TOTAL ALL BIG ISLAND (HAWAI'I) SOH FACILITIES 66,099,499 $11,882,662.20
8701-2872-002 SOH DOE LONO AV (MAUI HIGH) J3 3 12 1,407,000 $243,823.369500-3543-003 SOH DOE KULA HY (KING KEKAULIKE SCH) J 3 12 1,183,000 $211,856.52
TOTAL SOH DOEDUCATION LARGE FACILITIES 2 Facilities 2,590,000 $455,679.88
9700-1019-003 SOH DOH MAHALANI ST (MAUI MEM MED CTR) P 3 12 8,451,000 $1,183,936.34
TOTAL SOH DOHEALTH LARGE FACILITIES 1 Facility 8,451,000 $1,183,936.34
9300-9041-001 SOH PSD 600 WAIALE RD (NEW JAILHOUSE) P 3 12 2,187,000 $324,724.06
TOTAL SOH DEPT OF PUBLIC SAFETY LARGE FACILITIES 1 Facility 2,187,000 $324,724.06
8700-8946-001 SOH DOT AIR DIV KAHULUI AIRPORT RD (A/C NEW TERM BLD) P3 3 12 9,499,200 $1,339,541.89
TOTAL SOH DOTRANSPORTATION LARGE FACILITIES 1 Facility 9,499,200 $1,339,541.89
8700-8296-001 UH-COMM COLL KAAHUMANU AV (MAUI COMM COLL) P3 3 12 4,894,000 $742,090.58
TOTAL UH HAWAII COMMUNITY COLLEGES LARGE FACILITIES 1 Facility 4,894,000 $742,090.58
TOTAL MAUI SOH LARGE FACILITIES 6 Facilities 27,621,200 $4,045,972.75
TOTAL ALL MAUI SOH FACILITIES 45,169,390 $7,328,795.99
9200-7384-001 SOH DOA PUULUAHINE P3 5 12 1,019,000 $192,044.69
TOTAL SOH DOAGRICULTURE LARGE FACILITIES 1 Facility 1,019,000 $192,044.69
9200-7387-001 SOH DHHL KALAE WATER SYSTEM P0 5 12 1,476,576 $229,473.29
TOTAL SOH DOHAWAIIAN HOME LANDS LARGE FACILITIES 1 Facility 1,476,576 $229,473.29
TOTAL LANAI SOH LARGE FACILITIES 2 Facilities 2,495,576 $421,517.98
TOTAL ALL LANAI & MOLOKAI SOH FACILITIES 7,423,940 $1,577,052.44
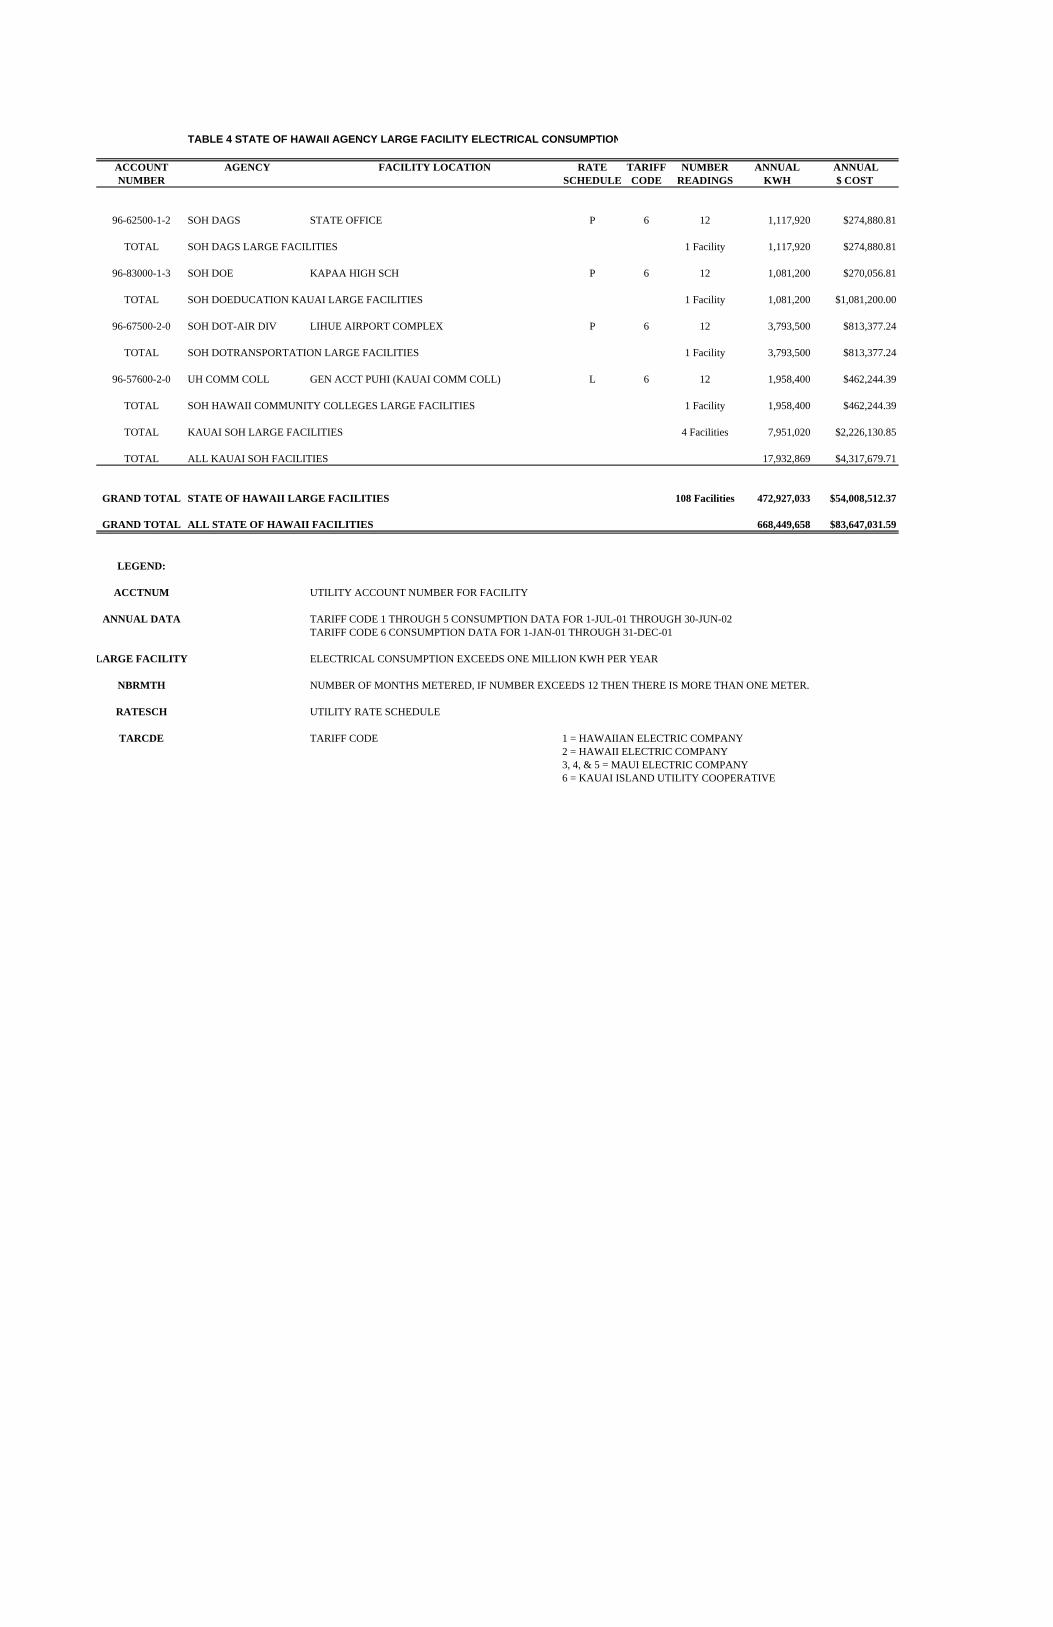
TABLE 4 STATE OF HAWAII AGENCY LARGE FACILITY ELECTRICAL CONSUMPTION
ACCOUNT AGENCY FACILITY LOCATION RATE TARIFF NUMBER ANNUAL ANNUALNUMBER SCHEDULE CODE READINGS KWH $ COST
96-62500-1-2 SOH DAGS STATE OFFICE P 6 12 1,117,920 $274,880.81
TOTAL SOH DAGS LARGE FACILITIES 1 Facility 1,117,920 $274,880.81
96-83000-1-3 SOH DOE KAPAA HIGH SCH P 6 12 1,081,200 $270,056.81
TOTAL SOH DOEDUCATION KAUAI LARGE FACILITIES 1 Facility 1,081,200 $1,081,200.00
96-67500-2-0 SOH DOT-AIR DIV LIHUE AIRPORT COMPLEX P 6 12 3,793,500 $813,377.24
TOTAL SOH DOTRANSPORTATION LARGE FACILITIES 1 Facility 3,793,500 $813,377.24
96-57600-2-0 UH COMM COLL GEN ACCT PUHI (KAUAI COMM COLL) L 6 12 1,958,400 $462,244.39
TOTAL SOH HAWAII COMMUNITY COLLEGES LARGE FACILITIES 1 Facility 1,958,400 $462,244.39
TOTAL KAUAI SOH LARGE FACILITIES 4 Facilities 7,951,020 $2,226,130.85
TOTAL ALL KAUAI SOH FACILITIES 17,932,869 $4,317,679.71
GRAND TOTAL STATE OF HAWAII LARGE FACILITIES 108 Facilities 472,927,033 $54,008,512.37
GRAND TOTAL ALL STATE OF HAWAII FACILITIES 668,449,658 $83,647,031.59
LEGEND:
ACCTNUM UTILITY ACCOUNT NUMBER FOR FACILITY
ANNUAL DATA TARIFF CODE 1 THROUGH 5 CONSUMPTION DATA FOR 1-JUL-01 THROUGH 30-JUN-02TARIFF CODE 6 CONSUMPTION DATA FOR 1-JAN-01 THROUGH 31-DEC-01
LARGE FACILITY ELECTRICAL CONSUMPTION EXCEEDS ONE MILLION KWH PER YEAR
NBRMTH NUMBER OF MONTHS METERED, IF NUMBER EXCEEDS 12 THEN THERE IS MORE THAN ONE METER.
RATESCH UTILITY RATE SCHEDULE
TARCDE TARIFF CODE 1 = HAWAIIAN ELECTRIC COMPANY 2 = HAWAII ELECTRIC COMPANY 3, 4, & 5 = MAUI ELECTRIC COMPANY6 = KAUAI ISLAND UTILITY COOPERATIVE
APPENDIX 5.0
State Facilities on Oahu Building Area Square Footage Data Provided by DAGS Under ”Incomplete” Status

STATE FACILITIES IN OAHU BUILDING AREA SQUATE FOOTAGE DATA PROVIDED BY DAGS IN 2001 (INCOMPLETE)
Statewide inventory 2001 (Approximate & Incomplete)STATE BUILDINGS (INVENTORY MANAGEMENT)
DESCRIPTION - BUILDING ADDRESS LOCATION TAX KEYAREA SQ
FT ISLAND DEPTDOA MAIN COMPLEX ANNEX BUILDING D 1428 S. KING ST - HONOLULU, OAHU 96814 PAWAA-KING STREET 2-4-05:18 10,010 OAHU AGRICDOA MAIN COMPLEX BIO-CONTROL FACILITY 1428 S. KING ST - HONOLULU, OAHU 96814 PAWAA-KING STREET 2-4-05:18 0 OAHU AGRICDOA MAIN COMPLEX BUILDING A 1428 S. KING ST - HONOLULU, OAHU 96814 PAWAA-KING STREET 2-4-05:18 0 OAHU AGRICDOA MAIN COMPLEX BUILDING B 1428 S. KING ST - HONOLULU, OAHU 96814 PAWAA-KING STREET 2-4-05:18 0 OAHU AGRICDOA MAIN COMPLEX BUILDING C 1428 S. KING ST - HONOLULU, OAHU 96814 PAWAA-KING STREET 2-4-05:18 0 OAHU AGRICDOA MAIN COMPLEX GARAGE 1428 S. KING ST - HONOLULU, OAHU 96814 PAWAA-KING STREET 2-4-05:18 1,344 OAHU AGRICDOA MAIN COMPLEX HALE WAIOLAMA 1428 S. KING ST - HONOLULU, OAHU 96814 PAWAA-KING STREET 2-4-05:18 1,170 OAHU AGRICDOA MAIN COMPLEX PROPAGATION INSECTARY 1428 S. KING ST - HONOLULU, OAHU 96814 PAWAA-KING STREET 2-4-05:18 1,440 OAHU AGRICDOA MAIN COMPLEX QUARANTINE INSECTARY 1428 S. KING ST - HONOLULU, OAHU 96814 PAWAA-KING STREET 2-4-05:18 1,471 OAHU AGRICHAQS BLIND PERSON'S COTTAGE 99-762 MOANALUA RD - AIEA, OAHU 96701 HALAWA 9-9-10:34 850 OAHU AGRICHAQS CONFERENCE/LUNCH ROOM 99-762 MOANALUA RD - AIEA, OAHU 96701 HALAWA 9-9-10:34 1,386 OAHU AGRICHAQS COTTAGE #1 99-762 MOANALUA RD - AIEA, OAHU 96701 HALAWA 9-9-10:34 850 OAHU AGRICHAQS COTTAGE #2 99-762 MOANALUA RD - AIEA, OAHU 96701 HALAWA 9-9-10:34 850 OAHU AGRICHAQS COTTAGE D 99-770 MOANALUA RD - AIEA, OAHU 96701 HALAWA 9-9-10:34 1,700 OAHU AGRICHAQS MAINTENANCE SHOP 99-770 MOANALUA RD - AIEA, OAHU 96701 HALAWA 9-9-10:34 7,300 OAHU AGRICHAQS OFFICES, RESTROOMS, STORAGE 99-762 MOANALUA RD - AIEA, OAHU 96701 HALAWA 9-9-10:34 11,165 OAHU AGRICKANAHOAHOA BUILDING 99-762 MOANALUA RD - AIEA, OAHU 96701 HALAWA 9-9-10:34 20,000 OAHU AGRICLIVESTOCK DISEASE CONTROL-LARGE BUILDING 99-762 MOANALUA RD - AIEA, OAHU 96701 HALAWA 9-9-10:34 5,134 OAHU AGRICLIVESTOCK DISEASE CONTROL-SMALL BUILDING 99-762 MOANALUA RD - AIEA, OAHU 96701 HALAWA 9-9-10:34 2,278 OAHU AGRICNECROPSY BUILDING 99-770 MOANALUA RD - AIEA, OAHU 96701 HALAWA 9-9-10:34 3,000 OAHU AGRICPLANT QUARANTINE STATION 701 ILALO ST - HONOLULU, OAHU 96813 KAKAAKO 2-1-60:10 9,760 OAHU AGRICPRINCESS NAHIENAENA 725 ILALO ST - HONOLULU, OAHU 96813 KAKAAKO 2-1-60:10 6,400 OAHU AGRICSEWAGE TREATMENT PLANT 99-762 MOANALUA RD - AIEA, OAHU 96701 HALAWA 9-9-10:34 0 OAHU AGRICWAIMANALO IRRIGATION OFFICE 41-645 MOKULAMA ST - WAIMANALO, OAHU 96795 WAIMANALO 4-1-24:68 320 OAHU AGRIC
86,428CONTAINER ENGINEERING MAINTENANCE BUILDING 521 ALA MOANA BLVD - HONOLULU, OAHU 96813 FOREIGN TRADE ZONE 2-1-15:30 35,870 OAHU DBEDT-FTZCONTAINER FREIGHT STATION #3 521 ALA MOANA BLVD - HONOLULU, OAHU 96813 FOREIGN TRADE ZONE 2-1-15:30 72,861 OAHU DBEDT-FTZDIAMOND HEAD TERMINAL 521 ALA MOANA BLVD - HONOLULU, OAHU 96813 FOREIGN TRADE ZONE 2-1-15:30 191,721 OAHU DBEDT-FTZHAWAII CONVENTION CENTER 1801 KALALAUA AVE.HONOLULU, OAHU 96815 HONOLULU 2-3-35:1 OAHU DBEDT-TOURISMMANOA INNOVATION CENTER 2900 WOODLAWN DR.HONOLULU, OAHU 96822 MANOA 2-9-26:3 OAHU DBEDT-HTECAAFES BUILDING 919 ALA MOANA BLVDHONOLULU, OAHU 96814 HONOLULU 2-1-58:06 OAHU DBEDT-HCDAWAIAKA 827 WAIAKA RD - HONOLULU, OAHU 96822 MOILIILI 2-7-27:14 3,750 OAHU DEBT HCDCHBANYAN TREE 41-520 POALIMA ST - WAIMANALO, OAHU 96795 WAIMANALO 4-1-08:86-89 4,144 OAHU DEBT HCDCHHHA ADMINISTRATION BUILDING A 1002 N. SCHOOL ST - HONOLULU, OAHU 96817 PALAMA 1-6-09:3 0 OAHU DEBT HCDCHHHA ADMINISTRATION BUILDING B 1002 N. SCHOOL ST - HONOLULU, OAHU 96817 PALAMA 1-6-09:3 0 OAHU DEBT HCDCHHHA ADMINISTRATION BUILDING C 1002 N. SCHOOL ST - HONOLULU, OAHU 96817 PALAMA 1-6-09:3 0 OAHU DEBT HCDCHHHA ADMINISTRATION BUILDING D 1002 N. SCHOOL ST - HONOLULU, OAHU 96817 PALAMA 1-6-09:3 0 OAHU DEBT HCDCHHHA ADMINISTRATION BUILDING E 1002 N. SCHOOL ST - HONOLULU, OAHU 96817 PALAMA 1-6-09:3 0 OAHU DEBT HCDCHHHA ADMINISTRATION BUILDING F 1002 N. SCHOOL ST - HONOLULU, OAHU 96817 PALAMA 1-6-09:3 0 OAHU DEBT HCDCHSTATE CAPITOL 415 S BERETANIA ST - HONOLULU, OAHU 96813 CAPITOL DISTRICT 2-1-24:1,8 300,000 OAHU DAGSAUTOMOTIVE MGMT DIV. - VINEYARD STREET PARKING 1418 PUNCHBOWL ST - HONOLULU, OAHU 96813 CAPITOL DISTRICT 2-1-18:11 159,890 OAHU DAGSAUTOMOTIVE MGMT DIV. -SOUTH STREET GARAGE 564 POHUKAINA ST - HONOLULU, OAHU 96813 CAPITOL DISTRICT 2-1-30:3 207,230 OAHU DAGSAUTOMOTIVE MGMT DIV.- PARKING GARAGE #1 OFFICE 869-A PUNCHBOWL ST - HONOLULU, OAHU 96813 CAPITOL DISTRICT 2-1-31:12 589 OAHU DAGSAUTOMOTIVE MGMT - DIVISION OFFICE 869-A PUNCHBOWL ST - HONOLULU, OAHU 96813 CAPITOL DISTRICT 2-1-31:12 1,904 OAHU DAGSHALE AUHAU 425 QUEEN ST - HONOLULU, OAHU 96813 CAPITOL DISTRICT 2-1-27:22 46,573 OAHU DAGSKALANIMOKU BUILDING 1151 PUNCHBOWL ST - HONOLULU, OAHU 96813 CAPITOL DISTRICT 2-1-33:25 203,000 OAHU DAGSKAMAMALU BUILDING 1010 RICHARDS ST - HONOLULU, OAHU 96813 CAPITOL DISTRICT 2-1-17:10 124,000 OAHU DAGSKAPUAIWA BUILDING 426 QUEEN ST - HONOLULU, OAHU 96813 CAPITOL DISTRICT 2-1-25:3 24,000 OAHU DAGSKEELIKOLANI BUILDING 830 PUNCHBOWL ST - HONOLULU, OAHU 96813 CAPITOL DISTRICT 2-1-26:22 238,000 OAHU DAGSKEKAULUOHI BUILDING 364 S. KING ST - HONOLULU, OAHU 96813 CAPITOL DISTRICT 2-1-25:2 16,300 OAHU DAGSKEKUANAOA BUILDING 465 S. KING ST - HONOLULU, OAHU 96813 CAPITOL DISTRICT 2-1-25:3 65,000 OAHU DAGSLILIUOKALANI BUILDING 1390 MILLER ST - HONOLULU, OAHU 96813 CAPITOL DISTRICT 2-1-18:16 95,000 OAHU DAGSKEONI ANA (CAPITOL CENTER BUILDING) 1177 ALAKEA ST - HONOLULU, OAHU 96813 CAPITOL DISTRICT 2-1-15:5 51,450 OAHU DAGSLEIOPAPA A KAM (SOT BUILDING) 236 S. BERETANIA ST - HONOLULU, OAHU 96813 CAPITOL DISTRICT 2-1-17:19 15 Flrs OAHU DAGSNO. 1 CAPITOL DISTRICT BLDG 250 SOUTH HOTEL ST. HONOLULU, OAHU CAPITOL DISTRICT 119,316 OAHU DAGSWASHINGTON PLACE BUILDING #1 320 S. BERETANIA ST - HONOLULU, OAHU 96813 CAPITOL DISTRICT 2-1-18:1 16,300 OAHU DAGSWASHINGTON PLACE COTTAGE 320 S. BERETANIA ST - HONOLULU, OAHU 96813 CAPITOL DISTRICT 2-1-18:1 552 OAHU DAGSWASHINGTON PLACE GARAGE 320 S. BERETANIA ST - HONOLULU, OAHU 96813 CAPITOL DISTRICT 2-1-18:1 3,000 OAHU DAGSKAM V BUILDING - POST OFFICE 901 BETHEL ST - HONOLULU, OAHU 96813 DOWN-TOWN HONOLULU 2-1-02:12 8,600 OAHU DAGSALOHA STADIUM 99-500 SALT LAKE BLVD - HONOLULU, OAHU 96818 HALAWA 9-9-03:69 300,000 OAHU DAGSAAFES (ARMY/AIR FORCE EXCHANGE SERVICE) BLDG 919 ALA MOANA BLVD HONOLULU, OAHU HONOLULU 108,000 OAHU DAGSOR&L ANNEX 355 N. KING ST - HONOLULU, OAHU 96817 IWILEI 1-5-07:64 2,300 OAHU DAGSOR&L MAIN BUILDING 333 N. KING ST - HONOLULU, OAHU 96817 IWILEI 1-5-07:64 0 OAHU DAGSKOULA STREET WAREHOUSE 205 KOULA ST - HONOLULU, OAHU 96814 KAKAAKO 2-1-59:1 800 OAHU DAGSKANEOHE CIVIC CENTER 45-260 WAIKALUA RD - KANEOHE, OAHU 96744 KANEOHE 4-5-18:3 6,130 OAHU DAGSKAKUHIHEWA (KAPOLEI) BUILDING 601 KAMOKILA BLVD KAPOLEI, OAHU KAPOLEI 213,887 OAHU DAGSHO'OPONO ANNEX 1901 BACHELOT ST - HONOLULU, OAHU 96817 LILIHA 1-7-15:2 0 OAHU DAGSHO'OPONO BLDG B 1901 BACHELOT ST - HONOLULU, OAHU 96817 LILIHA 1-7-15:2 16,187 OAHU DAGSHAWAII STATE SENIOR CENTER 1640 LANAKILA AVE - HONOLULU, OAHU 96817 PALAMA 1-6-09:7 6,000 OAHU DAGSPEARL CITY CIVIC CENTER 870 FOURTH ST., PEARL CITY, OAHU 96782 PEARL CITY 9-7-22:1 OAHU DAGSEWA DISTRICT COURTHOUSE (PEARL CITY) 870 FOURTH ST - PEARL CITY, OAHU 96782 PEARL CITY 9-7-22:1 6,100 OAHU DAGSCENTRAL SERVICES -FURNITURE STORAGE BUILDING 729 KAKOI ST - HONOLULU, OAHU 96819 SHAFTER FLATS 1-1-64:25 23,000 OAHU DAGSCENTRAL SERVICES DIV. - ADMINISTRATION OFFICE 729 KAKOI ST - HONOLULU, OAHU 96819 SHAFTER FLATS 1-1-64:25 4,000 OAHU DAGSCENTRAL SERVICES DIV. - MAINTENANCE STORAGE BUILDING 729 KAKOI ST - HONOLULU, OAHU 96819 SHAFTER FLATS 1-1-64:25 34,000 OAHU DAGSCENTRAL SERVICES DIV. -GROUNDS MAINTENANCE BUILDING 729 KAKOI ST - HONOLULU, OAHU 96819 SHAFTER FLATS 1-1-64:25 3,000 OAHU DAGSFEDERAL SURPLUS WAREHOUSE 729 KAKOI ST - HONOLULU, OAHU 96819 SHAFTER FLATS 1-1-64:25 15,000 OAHU DAGSRECORDS/ARCHIVE STORAGE 729 KAKOI ST - HONOLULU, OAHU 96819 SHAFTER FLATS 1-1-64:25 12,000 OAHU DAGSWAHIAWA CIVIC CENTER 910 CALIFORNIA AVE - WAHIAWA, OAHU 96786 WAHIAWA 7-4-06:12 8,700 OAHU DAGSWAIPAHU CIVIC CENTER 94-275 MOKULA ST - WAIPAHU, OAHU 96797 WAIPAHU 9-4-17:01 34,000 OAHU DAGS
LAHAINA DISTRICT COURT 1870 HONOPILANI HWY, LAHAINA, MAUI 96761 LAHAINA MAUI DAGSMAUI DISTRICT OFFICE ADMINISTRATION BLDG KAHULUI, MAUI 96732 KAHULUI 3-8-01:19 5,520 MAUI DAGSMAUI DISTRICT OFFICE MAINTENANCE BLDG KAHULUI, MAUI 96732 KAHULUI 3-8-01:19 16,768 MAUI DAGSMAUI DISTRICT OFFICE STORAGE BLDG KAHULUI, MAUI 96732 KAHULUI 3-8-01:19 12,600 MAUI DAGSMAUI DISTRICT OFFICE CARPORTS 1 AND 2 KAHULUI, MAUI 96732 KAHULUI 3-8-01:09 5,080 MAUI DAGSMAUI DISTRICT OFFICE MOTOR POOL BLDG KAHULUI, MAUI 96732 KAHULUI 3-8-01:09 2,560 MAUI DAGSMAINTENANCE FACILITY 179 KAAHUMANU AVE - KAHULUI, MAUI 96732 KAHULUI 3-7-04:3 7,700 MAUI DAGSMAINTENANCE FACILITY OFFICE 179 KAAHUMANU AVE- KAHULUI, MAUI 96732 KAHULUI 3-7-04:3 8,850 MAUI DAGSOLD LIHIKAI SCHOOL 153 KAAHUMANU AVE - KAHULUI, MAUI 96732 KAHULUI 3-7-04:3 13,680 MAUI DAGSOLD DISTRICT COURT 2264 AUPUNI ST - WAILUKU, MAUI 96793 WAILUKU 3-4-14:1 6,866 MAUI DAGSWAILUKU STATE OFFICE BUILDING #2 54 HIGH ST - WAILUKU, MAUI 96793 WAILUKU 3-4-13:13 29,340 MAUI DAGSWAILUKU STATE OFFICE BUILDING #1 54 HIGH ST - WAILUKU, MAUI 96793 WAILUKU 3-4-13:13 139,172 MAUI DAGS
STATE TAX OFFICE BUILDING (KULANA NAAUA) 41 KEAWE ST - HILO, HAWAII 96720 HILO 2-3-05:4 8,500 HAWAII DAGSDAGS BASEYARD 50 BRIG RD - HILO, HAWAII 96720 HILO 2-1-12:9 10 BLDGS HAWAII DAGSHILO STATE OFFICE BUILDING 75 AUPUNI ST - HILO, HAWAII 96720 HILO 2-2-14:72 108,000 HAWAII DAGSDAGS MAINTENANCE BUILDING 45-3180 OHIA ST - HONOKAA, HAWAII 96727 HONOKAA 4-5-21:1 2,400 HAWAII DAGSHAMAKUA STATE OFFICE BUILDING 45-3380 MAMANE ST - HONOKAA, HAWAII 96727 HONOKAA 4-5-06:3 3,400 HAWAII DAGSDEPARTMENT OF HEALTH BUILDING 45-3380 MAMANE ST - HONOKAA, HAWAII 96727 HONOKAA 4-5-06:3 2,514 HAWAII DAGSHONOKAA HEALTH LAB OFFICE 45-3380 MAMANE ST - HONOKAA, HAWAII 96727 HONOKAA 4-5-06:3 2,913 HAWAII DAGSHAMAKUA DISTRICT COURT 45-3380 MAMANE ST - HONOKAA, HAWAII 96727 HONOKAA 4-5-06:3 2,050 HAWAII DAGSHAMAKUA STATE OFFICE BUILDING #2 45-3380 MAMANE ST - HONOKAA, HAWAII 96727 HONOKAA 4-5-06:3 2,050 HAWAII DAGSSOUTH KOHALA STATE OFFICE BUILDING 67-5175 KAMAMALU ST - KAMUELA, HAWAII 96743 WAIMEA 6-7-02:11 5,300 HAWAII DAGSKAMUELA TAX OFFICE MAMALAHOA HWY - KAMUELA, HAWAII 96743 WAIMEA 6-7-02:25 0 HAWAII DAGSNORTH KOHALA STATE OFFICE BUILDING 54-3900 GOVT MAIN RD - KAPAAU, HAWAII 96755 KAPPAU 5-3-05:30 3,480 HAWAII DAGSKONA OFFICE/SHOP 83-5775 NAPOOPOO RD - KEALAKEKUA, HAWAII 96750 KEALAKEKUA 8-3-03:5 0 HAWAII DAGSKEAKEALANI BLDG (OLD KONA HOSPITAL) PO BOX P - KEALAKEKUA, HAWAII 96750 KEALAKEKUA 7-9-10:81 23,925 HAWAII DAGSKOHALA OFFICE/WORKSHOP 54-3611 HAWI-NIULII RD - KAPAAU, HAWAII 96755 KOHALA 5-5-11:7 0 HAWAII DAGSKONA CIVIC CENTER BUILDING #1 82-6130 MAMALAHOA HWY - CAPT COOK, HAWAII 96704 KONA CAPTAIN COOK 8-2-01:84 2,200 HAWAII DAGSKONA CIVIC CENTER BUILDING #2 82-6130 MAMALAHOA HWY - CAPT COOK, HAWAII 96704 KONA CAPTAIN COOK 8-2-01:84 3,685 HAWAII DAGSKONA CIVIC CENTER BUILDING #3 (SAME AS 60109001) 82-6130 MAMALAHOA HWY - CAPT COOK, HAWAII 96704 KONA CAPTAIN COOK 8-2-04:84 2,315 HAWAII DAGSKAU SHOP 955-5545 MAMALAHOA HWY - NAALEHU, HAWAII 96772 NAALEHU 9-5-09:6 0 HAWAII DAGSNAALEHU STATE BLDG 95-5669 MAMALAHOA HWY - NAALEHU, 96772 NAALEHU HAWAII DAGS
LIHUE STATE OFFICE BUILDING 3060 EIWA ST - LIHUE, KAUAI 96766 LIHUE 3-6-05:11 58,204 KAUAI DAGSBASEYARD OFFICE BUILDING E 2820 WEHE RD - LIHUE, KAUAI 96766 LIHUE 3-8-05:1 890 KAUAI DAGSBASEYARD PAINT STORAGE BUILDING 2820 WEHE RD - LIHUE, KAUAI 96766 LIHUE 3-8-05:1 570 KAUAI DAGSBASEYARD CARPENTER SHOP BUILDING 003 2820 WEHE RD - LIHUE, KAUAI 96766 LIHUE 3-8-05:1 2,300 KAUAI DAGSKOLOA CIVIC CENTER 3461 WELIWELI RD - KOLOA, KAUAI 96756 KOLOA 2-8-08:17 2,500 KAUAI DAGS
KAUNAKAKAI CIVIC CENTER KAUNAKAKAI MOLOKAI 96748 KAUNAKAKAI 5-3-05:12,14 11,621 MOLOKAI DAGSTAX OFFICE 101 ALAMALAMA ST - KAUNAKAKAI, MOLOKAI 96748 KAUNAKAKAI 5-3-05:12 1,000 MOLOKAI DAGSIRWIN HEALTH CENTER KAM V HWY - PUKOO, KAUNAKAKAI, MOLOKAI 96748 PUKOO 5-7-07:16 1,900 MOLOKAI DAGS
AIEA PUBLIC LIBRARY 99-143 MOANALUA RD - AIEA, OAHU 96701 AIEA 9-9-40:1 10724 OAHU STATE LIBRARY SYSAINA HAINA PUBLIC LIBRARY 5246 KALANIANAOLE HWY - HONOLULU, OAHU 96821 AINA HAINA 3-6-08:50 11086 OAHU STATE LIBRARY SYSHAWAII STATE LIBRARY 478 S. KING ST - HONOLULU, OAHU 96813 CAPITOL DISTRICT 2-1-25:1 63151 OAHU STATE LIBRARY SYS

STATE FACILITIES IN OAHU BUILDING AREA SQUATE FOOTAGE DATA PROVIDED BY DAGS IN 2001 (INCOMPLETE)
Statewide inventory 2001 (Approximate & Incomplete)STATE BUILDINGS (INVENTORY MANAGEMENT)
DESCRIPTION - BUILDING ADDRESS LOCATION TAX KEYAREA SQ
FT ISLAND DEPTEWA BEACH PUBLIC AND SCHOOL LIBRARY 91-950 NORTH RD - EWA BEACH, OAHU 96706 EWA BEACH 9-1-01:2 23200 OAHU STATE LIBRARY SYSHAWAII KAI PUBLIC LIBRARY 249 LUNALILO HOME RD - HONOLULU, OAHU 96825 HAWAII KAI 3-9-40:11 12540 OAHU STATE LIBRARY SYSKAHUKU PUBLIC AND SCHOOL LIBRARY 56-490 KAMEHAMEHA HWY - KAHUKU, OAHU 96731 KAHUKU 5-6-06:3 8464 OAHU STATE LIBRARY SYSKAILUA PUBLIC LIBRARY 239 KUULEI RD - KAILUA, OAHU 96734 KAILUA 4-3-56:12 9542 OAHU STATE LIBRARY SYSKAIMUKI PUBLIC LIBRARY 1041 KOKO HEAD AVE - HONOLULU, OAHU 96816 KAIMUKI 3-2-42:20 19600 OAHU STATE LIBRARY SYSCENTRALIZED PROCESSING CENTER 690 POHUKAINA ST - HONOLULU, OAHU 96813 KAKAAKO 2-1-51:3 11700 OAHU STATE LIBRARY SYSKALIHI-PALAMA PUBLIC LIBRARY 1325 KALIHI ST - HONOLULU, OAHU 96817 KALIHI 1-6-24:3 11880 OAHU STATE LIBRARY SYSKANEOHE PUBLIC LIBRARY 45-829 KAMEHAMEHA HWY - KANEOHE, OAHU 96744 KANEOHE 4-5-18:52 0 OAHU STATE LIBRARY SYSLILIHA PUBLIC LIBRARY 1515 LILIHA ST - HONOLULU, OAHU 96817 LILIHA 1-7-23:43 21150 OAHU STATE LIBRARY SYSMANOA PUBLIC LIBRARY 2716 WOODLAWN DR - HONOLULU, OAHU 96822 MANOA 2-9-23:25 5940 OAHU STATE LIBRARY SYSMcCULLY-MOILIILI PUBLIC LIBRARY 2211 S. KING ST - HONOLULU, OAHU 96814 McCULLY-MOILIILI 2-7-07:1 16600 OAHU STATE LIBRARY SYSMILILANI PUBLIC LIBRARY 95-450 MAKAIMOIMO ST -MILILANI TOWN, OAHU 96789 MILILANI 9-5-48:52 29000 OAHU STATE LIBRARY SYSPEARL CITY PUBLIC LIBRARY 1138 WAIMANO HOME RD - PEARL CITY, OAHU 96782 PEARL CITY 9-7-94:26 35000 OAHU STATE LIBRARY SYSWAHIAWA PUBLIC LIBRARY 820 CALIFORNIA AVE - WAHIAWA, OAHU 96786 WAHIAWA 7-4-04:70 12000 OAHU STATE LIBRARY SYSWAIALUA PUBLIC LIBRARY 67-068 KEALOHANUI ST - WAIALUA, OAHU 96791 WAIALUA 6-7-16:2 3500 OAHU STATE LIBRARY SYSWAIANAE PUBLIC LIBRARY 85-625 FARRINGTON HWY - WAIANAE, OAHU 96792 WAIANAE 8-5-2-:42 10246 OAHU STATE LIBRARY SYSLIBRARY FOR THE BLIND & PHYSICALLY HANDICAPPED 402 KAPAHULU AVE - HONOLULU, OAHU 96815 WAIKIKI 2-7-36:6 0 OAHU STATE LIBRARY SYSWAIKIKI-KAPAHULU PUBLIC LIBRARY 400 KAPAHULU AVE - HONOLULU, OAHU 96815 WAIKIKI-KAPAHULU 2-7-36:6 9020 OAHU STATE LIBRARY SYS
324343ALOHA MAIN TERMINAL BUILDING HONOLULU, OAHU 96819 HONOLULU INT. AIRPORT 1-1-03:79 35,200 OAHU DOT AIRPORTSAUTOMOBILE PARKING STRUCTURE HONOLULU, OAHU 96819 HONOLULU INT. AIRPORT 1-1-03:61 0 OAHU DOT AIRPORTSB332 CONCOURSE B-DOMESTIC HONOLULU, OAHU 96819 HONOLULU INT. AIRPORT 1-1-03:57 79,977 OAHU DOT AIRPORTSB336 ADMINISTRATION TOWER HONOLULU, OAHU 96819 HONOLULU INT. AIRPORT 1-1-03:55 73,000 OAHU DOT AIRPORTSB339 CONCOURSE A-DOMESTIC HONOLULU, OAHU 96819 HONOLULU INT. AIRPORT 1-1-03:53 106,795 OAHU DOT AIRPORTSB342 WAITING LOBBY WLB HONOLULU, OAHU 96819 HONOLULU INT. AIRPORT 1-1-03:51 223,302 OAHU DOT AIRPORTSB346 INTERNATIONAL ARRIVALS HONOLULU, OAHU 96819 HONOLULU INT. AIRPORT 1-1-03:59 262,184 OAHU DOT AIRPORTSB350 CENTRAL CONCOURSE HONOLULU, OAHU 96819 HONOLULU INT. AIRPORT 1-1-03:50 212,063 OAHU DOT AIRPORTSB360 EWA CONCOURSE HONOLULU, OAHU 96819 HONOLULU INT. AIRPORT 1-1-03:66 264,787 OAHU DOT AIRPORTSB360 EWA CONCOURSE HONOLULU, OAHU 96819 HONOLULU INT. AIRPORT 1-1-03:161 278,473 OAHU DOT AIRPORTSB373 DIAMOND HEAD CONCOURSE HONOLULU, OAHU 96819 HONOLULU INT. AIRPORT 1-1-03:65 247,112 OAHU DOT AIRPORTSCONTROL TOWER HONOLULU, OAHU 96819 HONOLULU INT. AIRPORT 1-1-03: X 0 OAHU DOT AIRPORTSCRASH/FIRE/RESCUE BLDG 1 HONOLULU, OAHU 96819 HONOLULU INT. AIRPORT 1-1-03: X 0 OAHU DOT AIRPORTSCRASH/FIRE/RESCUE BLDG 2 HONOLULU, OAHU 96819 HONOLULU INT. AIRPORT 1-1-03: X 0 OAHU DOT AIRPORTSDIAMOND HEAD EXTENSION HONOLULU, OAHU 96819 HONOLULU INT. AIRPORT 1-1-03:42 135,450 OAHU DOT AIRPORTSINTERISLAND GATE BUILDING HONOLULU, OAHU 96819 HONOLULU INT. AIRPORT 1-1-03:179 10,000 OAHU DOT AIRPORTSLEI STANDS HONOLULU, OAHU 96819 HONOLULU INT. AIRPORT 1-1-03:82 4,480 OAHU DOT AIRPORTSMAINTENANCE BASE HONOLULU, OAHU 96819 HONOLULU INT. AIRPORT 1-1-03: X 0 OAHU DOT AIRPORTSMAINTENANCE SHED HONOLULU, OAHU 96819 HONOLULU INT. AIRPORT 1-1-03: X 0 OAHU DOT AIRPORTSMAINTENANCE STORAGE HONOLULU, OAHU 96819 HONOLULU INT. AIRPORT 1-1-03: X 0 OAHU DOT AIRPORTSNOSEDOCK HANGER 1 HONOLULU, OAHU 96819 HONOLULU INT. AIRPORT 1-1-03: X 0 OAHU DOT AIRPORTSNOSEDOCK HANGER 2 HONOLULU, OAHU 96819 HONOLULU INT. AIRPORT 1-1-03: X 0 OAHU DOT AIRPORTSOLD HAWAIIAN TERMINAL HONOLULU, OAHU 96819 HONOLULU INT. AIRPORT 1-1-03:73 80,000 OAHU DOT AIRPORTSPAINT SHOP HONOLULU, OAHU 96819 HONOLULU INT. AIRPORT 1-1-03: X 0 OAHU DOT AIRPORTSPARKING TOLL BOOTHS HONOLULU, OAHU 96819 HONOLULU INT. AIRPORT 1-1-03:60 0 OAHU DOT AIRPORTSPUMPHOUSE HONOLULU, OAHU 96819 HONOLULU INT. AIRPORT 1-1-03: X 0 OAHU DOT AIRPORTSRESTAURANT (INTERISLAND TERMINAL) HONOLULU, OAHU 96819 HONOLULU INT. AIRPORT 1-1-03:70 3,200 OAHU DOT AIRPORTSSAILPLANE HANGER HONOLULU, OAHU 96819 HONOLULU INT. AIRPORT 1-1-03: X 0 OAHU DOT AIRPORTST-HANGERS HONOLULU, OAHU 96819 HONOLULU INT. AIRPORT 1-1-03: X 0 OAHU DOT AIRPORTST-HANGERS BLDG 1 HONOLULU, OAHU 96819 HONOLULU INT. AIRPORT 1-1-03: X 0 OAHU DOT AIRPORTST-HANGERS BLDG 2 HONOLULU, OAHU 96819 HONOLULU INT. AIRPORT 1-1-03: X 0 OAHU DOT AIRPORTSWAREHOUSE 1 HONOLULU, OAHU 96819 HONOLULU INT. AIRPORT 1-1-03: X 0 OAHU DOT AIRPORTSWAREHOUSE 2 HONOLULU, OAHU 96819 HONOLULU INT. AIRPORT 1-1-03: X 0 OAHU DOT AIRPORTSWIKI WIKI HONOLULU, OAHU 96819 HONOLULU INT. AIRPORT 1-1-03: X 0 OAHU DOT AIRPORTSDILLINGHAM FIELD HUT 69-102 FARRINGTON HWY - WAIALUA, OAHU 96791 MOKULEIA 6-8-14:1 3,120 OAHU DOT AIRPORTS
2,019,143ALOHA TOWER 103 ALA MOANA BLVD - HONOLULU, OAHU 96813 HONOLULU HARBOR 2-1-01:13 9,700 OAHU DOT HARBORSCFS #2 MAIN BUILDING 599 ALA MOANA BLVD - HONOLULU, OAHU 96813 HONOLULU HARBOR 2-1-15:2 78,000 OAHU DOT HARBORSCFS #2 OFFICE 599 ALA MOANA BLVD - HONOLULU, OAHU 96813 HONOLULU HARBOR 2-1-15:26 2,260 OAHU DOT HARBORSCFS #2 SCALE HOUSE 599 ALA MOANA BLVD - HONOLULU, OAHU 96813 HONOLULU HARBOR 2-1-15:28 272 OAHU DOT HARBORSCFS #2 TOWER 599 ALA MOANA BLVD - HONOLULU, OAHU 96813 HONOLULU HARBOR 2-1-15:36 2,300 OAHU DOT HARBORSCUSTOMS A 79 S. NIMITZ HWY - HONOLULU, OAHU 96813 HONOLULU HARBOR 2-1-01:1 28,350 OAHU DOT HARBORSCUSTOMS B 79 S. NIMITZ HWY - HONOLULU, OAHU 96813 HONOLULU HARBOR 2-1-01:1 24,600 OAHU DOT HARBORSDIAMOND HEAD MAIN TERMINAL 521 ALA MOANA BLVD - HONOLULU, OAHU 96813 HONOLULU HARBOR 2-1-15:30 169,000 OAHU DOT HARBORSHAR-OM BASEYARD CARPENTER DOCK BLDG 48 SAND ISLAND RD - HONOLULU, OAHU 96819 HONOLULU HARBOR 1-2-25:22 6,223 OAHU DOT HARBORSHAR-OM BASEYARD CARPENTER OFFICE BLDG 48 SAND ISLAND RD - HONOLULU, OAHU 96819 HONOLULU HARBOR 1-2-25:22 2,136 OAHU DOT HARBORSHAR-OM BASEYARD CARPENTER SHOP BUILDING #1 48 SAND ISLAND RD - HONOLULU, OAHU 96819 HONOLULU HARBOR 1-2-25:22 9,638 OAHU DOT HARBORSHAR-OM BASEYARD CARPENTER SHOP/STOREROOM 48 SAND ISLAND RD - HONOLULU, OAHU 96819 HONOLULU HARBOR 1-2-25:22 9,000 OAHU DOT HARBORSHARBOR ADMINISTRATION BUILDING 604 FORT ST - HONOLULU, OAHU 96813 HONOLULU HARBOR 2-1-01:5 26,500 OAHU DOT HARBORSHARBOR WAREHOUSE #6 NIMITZ HWY - HONOLULU, OAHU 96817 HONOLULU HARBOR 1-5-39:26 132,089 OAHU DOT HARBORSHARBOR WAREHOUSE #8 NIMITZ HWY - HONOLULU, OAHU 96817 HONOLULU HARBOR 1-5-39:29 19,308 OAHU DOT HARBORSIRWIN PARK COMFORT STATION 610 BISHOP ST - HONOLULU, OAHU 96813 HONOLULU HARBOR 2-1-13:7 288 OAHU DOT HARBORSPIER 10 SHED 79 S. NIMITZ HWY - HONOLULU, OAHU 96813 HONOLULU HARBOR 2-1-01:1 64,700 OAHU DOT HARBORSPIER 11 79 S. NIMITZ HWY - HONOLULU, OAHU 96813 HONOLULU HARBOR 2-1-01:1 6,570 OAHU DOT HARBORSPIER 11 SHED BLDG A 608 FORT STREET MALL - HONOLULU, OAHU 96813 HONOLULU HARBOR 2-1-01:5 36,500 OAHU DOT HARBORSPIER 13-14 SHED NIMITZ HWY - HONOLULU, OAHU 96817 HONOLULU HARBOR 2-1-01:47 27,638 OAHU DOT HARBORSPIER 15 SHED NIMITZ HWY - HONOLULU, OAHU 96817 HONOLULU HARBOR 2-1-01:44 4,325 OAHU DOT HARBORSPIER 18 SHED NIMITZ HWY - HONOLULU, OAHU 96817 HONOLULU HARBOR 1-5-39:30 5,200 OAHU DOT HARBORSPIER 19 COMFORT STATION NIMITZ HWY - HONOLULU, OAHU 96817 HONOLULU HARBOR 1-5-39:60 450 OAHU DOT HARBORSPIER 19 OFFICE NIMITZ HWY - HONOLULU, OAHU 96817 HONOLULU HARBOR 1-5-39:28 2,258 OAHU DOT HARBORSPIER 19 SHED NIMITZ HWY - HONOLULU, OAHU 96817 HONOLULU HARBOR 1-5-39:63 122,820 OAHU DOT HARBORSPIER 21 MACHINE SHOP NIMITZ HWY - HONOLULU, OAHU 96817 HONOLULU HARBOR 1-5-39:35 13,124 OAHU DOT HARBORSPIER 22 CARPENTER SHOP NIMITZ HWY - HONOLULU, OAHU 96817 HONOLULU HARBOR 1-5-39:34 7,154 OAHU DOT HARBORSPIER 23 BUILDING #24 NIMITZ HWY - HONOLULU, OAHU 96817 HONOLULU HARBOR 1-5-39:25 28,340 OAHU DOT HARBORSPIER 24 MARITIME BLDG NIMITZ HWY - HONOLULU, OAHU 96817 HONOLULU HARBOR 1-5-38:9 2,680 OAHU DOT HARBORSPIER 24 OFFICE BUILDING #25 NIMITZ HWY - HONOLULU, OAHU 96817 HONOLULU HARBOR 1-5-38:19 8,340 OAHU DOT HARBORSPIER 24 SHED NIMITZ HWY - HONOLULU, OAHU 96817 HONOLULU HARBOR 1-5-38:43 75,760 OAHU DOT HARBORSPIER 25 SHED NIMITZ HWY - HONOLULU, OAHU 96817 HONOLULU HARBOR 1-5-38:7 18,560 OAHU DOT HARBORSPIER 26 SHED NIMITZ HWY - HONOLULU, OAHU 96817 HONOLULU HARBOR 1-5-38:42 35,000 OAHU DOT HARBORSPIER 27-28 SHED NIMITZ HWY - HONOLULU, OAHU 96817 HONOLULU HARBOR 1-5-38:1 62,304 OAHU DOT HARBORSPIER 29 SHED NIMITZ HWY - HONOLULU, OAHU 96817 HONOLULU HARBOR 1-5-38:36 101,560 OAHU DOT HARBORSPIER 31-33 SHED NIMITZ HWY - HONOLULU, OAHU 96817 HONOLULU HARBOR 1-5-36:9 275,331 OAHU DOT HARBORSPIER 39 SHED NIMITZ HWY - HONOLULU, OAHU 96817 HONOLULU HARBOR 1-5-32:17 180,171 OAHU DOT HARBORSPIER 40 SHED NIMITZ HWY - HONOLULU, OAHU 96817 HONOLULU HARBOR 1-5-32:8 133,340 OAHU DOT HARBORSPIER 51-53 CFS SHED SAND ISLAND ACCESS RD - HONOLULU, OAHU 96819 HONOLULU HARBOR 1-5-41:225 51,480 OAHU DOT HARBORSPIER 8 SHED 79 S. NIMITZ HWY - HONOLULU, OAHU 96813 HONOLULU HARBOR 2-1-01:1 74,000 OAHU DOT HARBORSPIER 9 SHED 79 S. NIMITZ HWY - HONOLULU, OAHU 96813 HONOLULU HARBOR 2-1-01:1 147,000 OAHU DOT HARBORSCHARTER BOAT BUILDING 1125B1 ALA MOANA BLVD - HONOLULU,OAHU 96814 KEWALO BASIN 2-1-58:43 2,736 OAHU DOT HARBORSNATIONAL FISHERIES BUILDING 1125B1 ALA MOANA BLVD - HONOLULU,OAHU 96814 KEWALO BASIN 2-1-58:64 7,280 OAHU DOT HARBORSNEW NET DRYING SHED 1125B1 ALA MOANA BLVD - HONOLULU,OAHU 96814 KEWALO BASIN 2-1-58:1 8,400 OAHU DOT HARBORSOLD NET DRYING SHED 1125B1 ALA MOANA BLVD - HONOLULU,OAHU 96814 KEWALO BASIN 2-1-58:68 12,320 OAHU DOT HARBORSALIIAIMOKU HALE 869 PUNCHBOWL ST - HONOLULU, OAHU 96813 CAPITOL DISTRICT 2-1-31:12 55,854 OAHU DOT HIGHWAYSBASEYARD OFFICE 54-310 HAUULA HOMESTEAD RD - HAUULA, OAHU 96717 HAUULA 5-4-02:12 360 OAHU DOT HIGHWAYSMATERIALS TESTING & RESEARCH LABORATORY 2530 LIKE LIKE HWY - HONOLULU, OAHU 96819 KALIHI VALLEY 1-4-22:14 16,540 OAHU DOT HIGHWAYSBASEYARD OFFICE 45-349 KAMEHAMEHA HWY - KANEOHE, OAHU 96744 KANEOHE 4-5-33:2 360 OAHU DOT HIGHWAYSBASEYARD WAREHOUSE 45-349 KAMEHAMEHA HWY - KANEOHE, OAHU 96744 KANEOHE 4-5-33:2 1,440 OAHU DOT HIGHWAYSBASEYARD OFFICE SECOND ST - PEARL CITY, OAHU 96782 PEARL CITY 9-7-18:13 1,440 OAHU DOT HIGHWAYSHIGHWAYS DIVISION ADMINISTRATION BUILDING 727 KAKOI ST - HONOLULU, OAHU 96819 SHAFTER FLATS 1-1-64:26 6,096 OAHU DOT HIGHWAYSHIGHWAYS DIVISION MAINTENANCE OFFICE AND SHOP 727 KAKOI ST - HONOLULU, OAHU 96819 SHAFTER FLATS 1-1-64:26 6,339 OAHU DOT HIGHWAYSHIGHWAYS DIVISION MOTOR POOL BUILDING 727 KAKOI ST - HONOLULU, OAHU 96819 SHAFTER FLATS 1-1-64:26 5,600 OAHU DOT HIGHWAYSHIGHWAYS DIVISION WAREHOUSE 727 KAKOI ST - HONOLULU, OAHU 96819 SHAFTER FLATS 1-1-64:26 7,980 OAHU DOT HIGHWAYSBASEYARD OFFICE 155 CALIFORNIA AVE - WAHIAWA, OAHU 96786 WAHIAWA 7-3-07:5 360 OAHU DOT HIGHWAYSBASEYARD BUILDING A 85-630 FARRINGTON HWY - WAIANAE, OAHU 96792 WAIANAE 8-5-28:42 456 OAHU DOT HIGHWAYSBASEYARD BUILDING B 85-630 FARRINGTON HWY - WAIANAE, OAHU 96792 WAIANAE 8-5-28:42 180 OAHU DOT HIGHWAYSBASEYARD BUILDING C 85-630 FARRINGTON HWY - WAIANAE, OAHU 96792 WAIANAE 8-5-28:42 180 OAHU DOT HIGHWAYS
COURT HOUSE (3 FLOORS) 66-207 KAMEHAMEHA HWY - HALEIWA, OAHU 96712 HALEIWA 6-6-09:23 5,754 OAHU DLNR LAND MGTHALEIWA ELEMENTARY SCHOOL TEACHER'S COTTAGE A 66-490 HALEIWA RD - HALEIWA, OAHU 96712 HALEIWA 6-6-11:13 1,967 OAHU DLNR LAND MGTHALEIWA ELEMENTARY SCHOOL TEACHER'S COTTAGE B 66-490 HALEIWA RD - HALEIWA, OAHU 96712 HALEIWA 6-6-11:13 1,910 OAHU DLNR LAND MGTHALEIWA ELEMENTARY SCHOOL TEACHER'S COTTAGE C 66-490 HALEIWA RD - HALEIWA, OAHU 96712 HALEIWA 6-6-11:13 986 OAHU DLNR LAND MGTHALEIWA ELEMENTARY SCHOOL TEACHER'S COTTAGE D 66-490 HALEIWA RD - HALEIWA, OAHU 96712 HALEIWA 6-6-11:13 1,364 OAHU DLNR LAND MGTHALEIWA ELEMENTARY SCHOOL TEACHER'S COTTAGE E 66-490 HALEIWA RD - HALEIWA, OAHU 96712 HALEIWA 6-6-11:13 2,296 OAHU DLNR LAND MGTKUNIA SCHOOL BUILDING A 92-1750 KUNIA DR - KUNIA, OAHU 96759 KUNIA 9-2-05:12 1,320 OAHU DLNR LAND MGTKUNIA SCHOOL BUILDING B, UNIT 1 92-1750 KUNIA DR - KUNIA, OAHU 96759 KUNIA 9-2-05:12 2,821 OAHU DLNR LAND MGTKUNIA SCHOOL BUILDING B, UNIT 2 92-1750 KUNIA DR - KUNIA, OAHU 96759 KUNIA 9-2-05:12 3,680 OAHU DLNR LAND MGTKUNIA SCHOOL BUILDING B, UNIT 3 92-1750 KUNIA DR - KUNIA, OAHU 96759 KUNIA 9-2-05:12 2,821 OAHU DLNR LAND MGTKUNIA SCHOOL BUILDING B-2 92-1750 KUNIA DR - KUNIA, OAHU 96759 KUNIA 9-2-05:12 3,680 OAHU DLNR LAND MGTKUNIA SCHOOL BUILDING B-3 92-1750 KUNIA DR - KUNIA, OAHU 96759 KUNIA 9-2-05:12 2,821 OAHU DLNR LAND MGTKEAIWA HEIAU CARETAKER'S HOME 849 AIEA HEIGHTS DR - AIEA, OAHU 96701 AIEA HEIGHTS 9-9-11:3 1,536 OAHU DLNR PARKS

STATE FACILITIES IN OAHU BUILDING AREA SQUATE FOOTAGE DATA PROVIDED BY DAGS IN 2001 (INCOMPLETE)
Statewide inventory 2001 (Approximate & Incomplete)STATE BUILDINGS (INVENTORY MANAGEMENT)
DESCRIPTION - BUILDING ADDRESS LOCATION TAX KEYAREA SQ
FT ISLAND DEPTAINA MOANA - EQUIPMENT SHED 1365 ALA MOANA BLVD - HONOLULU, OAHU 96814 MAGIC ISLAND 2-3-37:25 576 OAHU DLNR PARKSWAAHILA RIDGE STATE REC AREA RESTROOM 1600 RUTH PL - HONOLULU, OAHU 96816 SAINT LOUIS HEIGHTS 3-4-10:3 280 OAHU DLNR PARKSPUU UALAKAA WAYSIDE COMFORT STATION 3286 ROUND TOP DR - HONOLULU, OAHU 96822 TANTALUS 2-5-19:3 676 OAHU DLNR PARKSWAHIAWA FRESHWATER ST REC AREA CARETAKER'S HOME 380 WALKER AVE - WAHIAWA, OAHU 96786 WAHIAWA 7-6-01:6 1,536 OAHU DLNR PARKSWAIMANALO STATE REC AREA RESTROOM #1, 2 & 3 41-1055 KALANIANAOLE HWY-WAIMANALO, OAHU 96795 WAIMANALO 4-1-15:15 4,350 OAHU DLNR PARKSWAIMANALO STATE REC AREA ENFORCEMENT OFCR HOUSE 41-1055 KALANIANAOLE HWY-WAIMANALO, OAHU 96795 WAIMANALO 4-1-15:15 1,225 OAHU DLNR PARKSSAND ISLAND STATE PARK RESTROOM #1 THROUGH 6 10 SAND ISLAND ACCESS RD - HONOLULU,OAHU 96819 SAND ISLAND 1-5-41:6 675 OAHU DLNR PARKSSAND ISLAND STATE PARK PICNIC SHELTER #1 THROUGH 14 10 SAND ISLAND ACCESS RD - HONOLULU,OAHU 96819 SAND ISLAND 1-5-41:6 0 OAHU DLNR PARKSSAND ISLAND STATE PARK MAINT SHOP & OFFICE BLDG A - C 10 SAND ISLAND ACCESS RD - HONOLULU,OAHU 96819 SAND ISLAND 1-5-41:6 0 OAHU DLNR PARKSSAND ISLAND STATE PARK CARETAKER'S HOUSE BLDG B 10 SAND ISLAND ACCESS RD - HONOLULU,OAHU 96819 SAND ISLAND 1-5-41:6 1,520 OAHU DLNR PARKSHEEIA STATE PARK CARETAKER'S HOUSE 46-461 KAMEHAMEHA HWY - KANEOHE, OAHU 96744 HEEIA KEA 4-6-05:9 1,296 OAHU DLNR PARKSHEEIA STATE PARK PICNIC SHELTER #1/RESTROOM 46-461 KAMEHAMEHA HWY - KANEOHE, OAHU 96744 HEEIA KEA 4-6-05:9 2,926 OAHU DLNR PARKSHEEIA STATE PARK VISITOR CENTER 46-461 KAMEHAMEHA HWY - KANEOHE, OAHU 96744 HEEIA KEA 4-6-05:9 3,600 OAHU DLNR PARKSHONOLULU STADIUM STATE PARK RESTROOM/STORAGE 2237 S. KING ST - HONOLULU, OAHU 96814 MOILIILI 2-7-08:2 4,500 OAHU DLNR PARKSMAKUA-KAENA RESTROOM 81-601 FARRINGTON HWY - WAIANAE, OAHU 96792 YOKOHAMA BAY 8-1-01:7 576 OAHU DLNR PARKSKAIAKA STATE REC AREA RESTROOM 66-449 HALEIWA RD - HALEIWA, OAHU 96712 HALEIWA 6-6-07:7 784 OAHU DLNR PARKSMALAEKAHANA STATE REC AREA RESIDENCE/SHELTER 53-291 KAMEHAMEHA HWY - KAHUKU, OAHU 96731 KAHUKU 5-6-01:4 2,500 OAHU DLNR PARKSMALAEKAHANA STATE REC AREA RESTROOMS 53-291 KAMEHAMEHA HWY - KAHUKU, OAHU 96731 KAHUKU 5-6-01:4 400 OAHU DLNR PARKSKAHANA VALLEY STATE PARK ORIENTATION BUILDING 52-266 KAMEHAMEHA HWY - HAUULA, OAHU 96717 KAHANA VALLEY 5-2-02:1 1,700 OAHU DLNR PARKSKAHANA VALLEY STATE PARK PICNIC SHELTERS #1 & 2 52-266 KAMEHAMEHA HWY - HAUULA, OAHU 96717 KAHANA VALLEY 5-2-02:1 0 OAHU DLNR PARKSFORT RUGER MAINTENANCE SHOP 3949 DIAMOND HEAD RD - HONOLULU, OAHU 96816 KAIMUKI 3-1-42:20 10,600 OAHU DLNR PARKSMAKIKI HEIGHTS RESTROOM 2131 MAKIKI HEIGHTS DR - HONOLULU, OAHU 96822 MAKIKI 2-5-19:8 400 OAHU DLNR PARKSDIAMOND HEAD MONUMENT COMFORT STATION 4204 DIAMOND HEAD RD - HONOLULU, OAHU 96816 DIAMOND HEAD 3-1-42:6 400 OAHU DLNR PARKSIOLANI PALACE COMPLEX - IOLANI PALACE 417 S. KING ST - HONOLULU, OAHU 96813 CAPITOL DISTRICT 2-1-25:2 55,800 OAHU DLNR PARKSIOLANI PALACE COMPLEX - BARRACKS 417 S. KING ST - HONOLULU, OAHU 96813 CAPITOL DISTRICT 2-1-25:2 8,500 OAHU DLNR PARKSIOLANI PALACE COMPLEX - BANDSTAND 417 S. KING ST - HONOLULU, OAHU 96813 CAPITOL DISTRICT 2-1-25:2 800 OAHU DLNR PARKSIOLANI PALACE COMPLEX - KANAINA BLDG 417 S. KING ST - HONOLULU, OAHU 96813 CAPITOL DISTRICT 2-1-25:2 10,000 OAHU DLNR PARKSIOLANI PALACE COMPLEX - MAINTENANCE BUILDING 417 S. KING ST - HONOLULU, OAHU 96813 CAPITOL DISTRICT 2-1-25:2 900 OAHU DLNR PARKSROYAL MAUSOLEUM CHAPEL 2261 NUUANU AVE - HONOLULU, OAHU 96817 NUUANU 2-2-21:12 3,000 OAHU DLNR PARKSROYAL MAUSOLEUM CARETAKER COTTAGE 2261 NUUANU AVE - HONOLULU, OAHU 96817 NUUANU 2-2-21:12 750 OAHU DLNR PARKSFUEL STORAGE 2135 MAKIKI HTS DR - HONOLULU, OAHU 96822 MAKIKI 2-5-19:8 144 OAHU DLNR FORESTRYCARPENTER SHOP 2135 MAKIKI HTS DR - HONOLULU, OAHU 96822 MAKIKI 2-5-19:8 1,200 OAHU DLNR FORESTRYGREEN HOUSE 2135 MAKIKI HTS DR - HONOLULU, OAHU 96822 MAKIKI 2-5-19:8 437 OAHU DLNR FORESTRYGAS SHACK 2135 MAKIKI HTS DR - HONOLULU, OAHU 96822 MAKIKI 2-5-19:8 18 OAHU DLNR FORESTRYFIRE TOOL SHED 2135 MAKIKI HTS DR - HONOLULU, OAHU 96822 MAKIKI 2-5-19:8 80 OAHU DLNR FORESTRYBASEYARD OFFICE 2135 MAKIKI HTS DR - HONOLULU, OAHU 96822 MAKIKI 2-5-19:8 593 OAHU DLNR FORESTRYWAREHOUSE/STORAGE 2135 MAKIKI HTS DR - HONOLULU, OAHU 96822 MAKIKI 2-5-19:8 1,650 OAHU DLNR FORESTRYEQUIPMENT SHED 2135 MAKIKI HTS DR - HONOLULU, OAHU 96822 MAKIKI 2-5-19:8 108 OAHU DLNR FORESTRYFORESTER'S RESIDENCE 2135 MAKIKI HTS DR - HONOLULU, OAHU 96822 MAKIKI 2-5-19:8 1,860 OAHU DLNR FORESTRYFORESTER'S GARAGE 2135 MAKIKI HTS DR - HONOLULU, OAHU 96822 MAKIKI 2-5-19:8 600 OAHU DLNR FORESTRYHOTHOUSE [DEMOLISHED] 2135 MAKIKI HTS DR - HONOLULU, OAHU 96822 MAKIKI 2-5-19:8 370 OAHU DLNR FORESTRYGAZEBO 2135 MAKIKI HTS DR - HONOLULU, OAHU 96822 MAKIKI 2-5-19:8 220 OAHU DLNR FORESTRYWILDLIFE WORKSHOP WAREHOUSE 2135 MAKIKI HTS DR - HONOLULU, OAHU 96822 MAKIKI 2-5-19:8 625 OAHU DLNR FORESTRYPAN ABODE SHELTER ABOVE HALEMANO RD - WAHIAWA, OAHU 96786 POAMOHO TRAIL 7-2-01:6 144 OAHU DLNR FORESTRY6 POLE SHELTER ABOVE ALANI DR - HONOLULU, OAHU 96822 MANOA VALLEY 2-9-51:2 180 OAHU DLNR FORESTRY6 POLE SHELTER 68-436 FARRINGTON HWY - WAIALUA, OAHU 96791 MOKULEIA 6-8-01:3 180 OAHU DLNR FORESTRYFIRE TOOL SHED 1 PALEHUA RD - EWA BEACH, OAHU 96706 PALEHUA 9-2-05:13 105 OAHU DLNR FORESTRYKAWAILOA FIRE TOOL SHED OPAELUA RD - HALEIWA, OAHU 96712 OPAELUA 6-2-11:1 21 OAHU DLNR FORESTRYNIKE SITE ADMINISTRATION BUILDING MOKULEIA - WAIALUA, OAHU 96791 MOKULEIA 6-8-01:4 2,781 OAHU DLNR FORESTRYNIKE SITE EQUIPMENT STORAGE 1 MOKULEIA - WAIALUA, OAHU 96791 MOKULEIA 6-8-01:4 144 OAHU DLNR FORESTRYNIKE SITE EQUIPMENT STORAGE 2 MOKULEIA - WAIALUA, OAHU 96791 MOKULEIA 6-8-01:4 144 OAHU DLNR FORESTRYNIKE SITE PERSONNEL BARRACKS MOKULEIA - WAIALUA, OAHU 96791 MOKULEIA 6-8-01:4 3,103 OAHU DLNR FORESTRYALA WAI BOAT HARBOR ATTENDANT'S OFFICE 1651 ALA MOANA BLVD - HONOLULU, OAHU 96815 ALA WAI 2-6-10:5 1,200 OAHU DLNR BOATINGALA WAI BOAT HARBOR COMFORT STATION #1 MOLE A 1651 ALA MOANA BLVD - HONOLULU, OAHU 96815 ALA WAI 2-6-10:5 704 OAHU DLNR BOATINGALA WAI BOAT HARBOR COMFORT STATION #2 MOLE B 1651 ALA MOANA BLVD - HONOLULU, OAHU 96815 ALA WAI 2-6-10:5 841 OAHU DLNR BOATINGALA WAI BOAT HARBOR NEW COMFORT STATION MOLE A 1651 ALA MOANA BLVD - HONOLULU, OAHU 96815 ALA WAI 2-6-10:5 721 OAHU DLNR BOATINGHALEIWA BOAT HARBOR ATTENDANT'S OFFICE 66-105 HALEIWA RD - HALEIWA, OAHU 96712 HALEIWA 6-6-02:4 2,288 OAHU DLNR BOATINGHALEIWA BOAT HARBOR RESTROOM 66-105 HALEIWA RD - HALEIWA, OAHU 96712 HALEIWA 6-6-02:4 100 OAHU DLNR BOATINGHEEIA KEA BOAT HARBOR COMFORT STATION #1 (OLD) 46-499 KAMEHAMEHA HWY - KANEOHE, OAHU 67944 HEEIA KEA 4-6-06:2 50 OAHU DLNR BOATINGHEEIA KEA BOAT HARBOR COMFORT STATION #2 46-499 KAMEHAMEHA HWY - KANEOHE, OAHU 67944 HEEIA KEA 4-6-06:2 413 OAHU DLNR BOATINGKEEHI HARBOR ATTENDANT'S OFFICE 4 SAND ISLAND RD - HONOLULU, OAHU 96819 KALIHI KAI 1-2-25:25 880 OAHU DLNR BOATINGKEEHI HARBOR COMFORT STATION 4 SAND ISLAND RD - HONOLULU, OAHU 96819 KALIHI KAI 1-2-25:41 880 OAHU DLNR BOATINGWAIANAE BOAT HARBOR ATTENDANT'S OFFICE 83-371 FARRINGTON HWY - WAIANAE, OAHU 96792 WAIANAE 8-5-02:44 2,640 OAHU DLNR BOATING
178,650HAWAII YOUTH COR FACILITY AUTO MAINTENANCE SHOP 42-455 KALAIANAOLE HWY - KAILUA, OAHU 96734 KAILUA 4-2-03:4 0 OAHU DHSHAWAII YOUTH COR FACILITY FARM QUONSET 42-455 KALAIANAOLE HWY - KAILUA, OAHU 96734 KAILUA 4-2-03:4 0 OAHU DHSHAWAII YOUTH COR FACILITY GYMNASIUM 42-455 KALAIANAOLE HWY - KAILUA, OAHU 96734 KAILUA 4-2-03:4 0 OAHU DHSHAWAII YOUTH COR FACILITY HILLTOP COTTAGE 42-455 KALAIANAOLE HWY - KAILUA, OAHU 96734 KAILUA 4-2-03:4 0 OAHU DHSHAWAII YOUTH COR FACILITY INDUSTRIAL BUILDING 42-455 KALAIANAOLE HWY - KAILUA, OAHU 96734 KAILUA 4-2-03:4 0 OAHU DHSHAWAII YOUTH COR FACILITY KAALA COTTAGE 42-455 KALAIANAOLE HWY - KAILUA, OAHU 96734 KAILUA 4-2-03:4 0 OAHU DHSHAWAII YOUTH COR FACILITY MAUNAWILA 42-455 KALAIANAOLE HWY - KAILUA, OAHU 96734 KAILUA 4-2-03:4 0 OAHU DHSHAWAII YOUTH COR FACILITY OLAMANA 42-455 KALAIANAOLE HWY - KAILUA, OAHU 96734 KAILUA 4-2-03:4 0 OAHU DHSHALAWA HIGH SECURITY FACILITY 99-762 MOANALUA RD - AIEA, OAHU 96701 HALAWA 9-9-10:30 0 OAHU PSDWOMEN COM COR CTR CANOE HOUSE CHAPEL 42-470 KALAIANAOLE HWY - KAILUA, OAHU 96734 KAILUA 4-2-06:2 0 OAHU PSDWOMEN COM COR CTR CENTRAL CONTROL 42-470 KALAIANAOLE HWY - KAILUA, OAHU 96734 KAILUA 4-2-06:2 0 OAHU PSDWOMEN COM COR CTR CLASSROOM BUILDING 42-470 KALAIANAOLE HWY - KAILUA, OAHU 96734 KAILUA 4-2-06:2 0 OAHU PSDWOMEN COM COR CTR HOOPIKA 42-470 KALAIANAOLE HWY - KAILUA, OAHU 96734 KAILUA 4-2-06:2 0 OAHU PSDWOMEN COM COR CTR INTERMIN ROOM 42-470 KALAIANAOLE HWY - KAILUA, OAHU 96734 KAILUA 4-2-06:2 0 OAHU PSDWOMEN COM COR CTR MALUHIA WOMENS FACILITY 42-470 KALAIANAOLE HWY - KAILUA, OAHU 96734 KAILUA 4-2-06:2 0 OAHU PSDWOMEN COM COR CTR P. C. COTTAGE 42-470 KALAIANAOLE HWY - KAILUA, OAHU 96734 KAILUA 4-2-06:2 0 OAHU PSDOAHU COM COR CENTER KEEHI ANNEX 2109 KAMEHAMEHA HWY - HONOLULU, OAHU 96819 KALIHI KAI 1-2-13:2 0 OAHU PSDOAHU COM COR CENTER MODULES 2109 KAMEHAMEHA HWY - HONOLULU, OAHU 96819 KALIHI KAI 1-2-13:2 0 OAHU PSDOAHU COM COR CENTER OLD ADMINISTRATION BUILDING 2109 KAMEHAMEHA HWY - HONOLULU, OAHU 96819 KALIHI KAI 1-2-13:2 0 OAHU PSDOAHU COM COR CENTER OLD CELL BLOCK 2109 KAMEHAMEHA HWY - HONOLULU, OAHU 96819 KALIHI KAI 1-2-13:2 0 OAHU PSDWAIAWA CORRECTIONAL FACIL KITCHEN/DINING BLDG 94-560 KAMEHAMEHA HWY - PEARL CITY,HAWAII 96782 WAIAWA 9-4-06:10 0 OAHU PSDWAIAWA CORRECTIONAL FACIL LIBRARY-EDUCATION BLDG 94-560 KAMEHAMEHA HWY - PEARL CITY,HAWAII 96782 WAIAWA 9-4-06:10 0 OAHU PSDWAIAWA CORRECTIONAL FACILITY BUILDING 4 94-560 KAMEHAMEHA HWY - PEARL CITY,HAWAII 96782 WAIAWA 9-4-06:10 0 OAHU PSDWAIAWA CORRECTIONAL FACILITY BUILDING 5 94-560 KAMEHAMEHA HWY - PEARL CITY,HAWAII 96782 WAIAWA 9-4-06:10 0 OAHU PSDWAIAWA CORRECTIONAL FACILITY BUILDING 6 94-560 KAMEHAMEHA HWY - PEARL CITY,HAWAII 96782 WAIAWA 9-4-06:10 0 OAHU PSDWAIAWA CORRECTIONAL FACILITY CHAPEL 94-560 KAMEHAMEHA HWY - PEARL CITY,HAWAII 96782 WAIAWA 9-4-06:10 0 OAHU PSDWAIAWA CORRECTIONAL FACILITY LAUNDRY BUILDING 3 94-560 KAMEHAMEHA HWY - PEARL CITY,HAWAII 96782 WAIAWA 9-4-06:10 0 OAHU PSDWAIAWA CORRECTIONAL FACILITY MEDICAL BUILDING 94-560 KAMEHAMEHA HWY - PEARL CITY,HAWAII 96782 WAIAWA 9-4-06:10 0 OAHU PSDWAIAWA CORRECTIONAL FACILITY ADMIN BUILDING 94-560 KAMEHAMEHA HWY - PEARL CITY,HAWAII 96782 WAIAWA 9-4-06:10 0 OAHU PSDWAIAWA CORRECTIONAL FACILITY MAINT/TUNNEL SYSTEM 94-560 KAMEHAMEHA HWY - PEARL CITY,HAWAII 96782 WAIAWA 9-4-06:10 0 OAHU PSDFAMILY DETENTION CENTER 902 ALDER ST - HONOLULU, OAHU 96814 HONOLULU 2-3-12:19 41,700 OAHU JUDICIARYWAIALUA DISTRICT COURTHOUSE (WAHIAWA) 1034 KILANI AVE - WAHIAWA, OAHU 96786 WAHIAWA 7-4-07:2 1,800 OAHU JUDICIARY
DIAMOND HEAD HEALTH CENTER 3627 KILAUEA AVE - HONOLULU, OAHU 96816 KAIMUKI 3-2-31:15 53,000 OAHU DOHLEAHI HOSPITAL A & R YOUNG CHILDREN'S BUILDING 3675 KILAUEA AVE - HONOLULU, OAHU 96816 KAIMUKI 3-2-31:1 5,000 OAHU DOHLEAHI HOSPITAL ADMINISTRATION BUILDING 3675 KILAUEA AVE - HONOLULU, OAHU 96816 KAIMUKI 3-2-31:1 14,800 OAHU DOHLEAHI HOSPITAL ATHERTON BUILDING 3675 KILAUEA AVE - HONOLULU, OAHU 96816 KAIMUKI 3-2-31:1 15,970 OAHU DOHLEAHI HOSPITAL MAINTENANCE BUILDING 3675 KILAUEA AVE - HONOLULU, OAHU 96816 KAIMUKI 3-2-31:1 9,600 OAHU DOHLEAHI HOSPITAL SINCLAIR BUILDING 3675 KILAUEA AVE - HONOLULU, OAHU 96816 KAIMUKI 3-2-31:1 27,000 OAHU DOHLEAHI HOSPITAL TROTTER BUILDING 3675 KILAUEA AVE - HONOLULU, OAHU 96816 KAIMUKI 3-2-31:1 17,000 OAHU DOHLEAHI HOSPITAL YOUNG BUILDING 3675 KILAUEA AVE - HONOLULU, OAHU 96816 KAIMUKI 3-2-31:1 68,400 OAHU DOH
210,770ALA MOANA HEALTH CENTER ANNEX 591 ALA MOANA BLVD - HONOLULU, OAHU 96813 KAKAAKO 2-1-15:19 0 OAHU DOHALA MOANA HEALTH CENTER BUILDING #1 591 ALA MOANA BLVD - HONOLULU, OAHU 96813 KAKAAKO 2-1-15:19 19,000 OAHU DOHHAW STATE HOSP. - AKAHI BUILDING 45-710 KEAAHALA RD - KANEOHE, OAHU 96744 KANEOHE 4-5-23:2 7,691 OAHU DOHHAW STATE HOSP. - BISHOP BUILDING 45-710 KEAAHALA RD - KANEOHE, OAHU 96744 KANEOHE 4-5-23:2 7,691 OAHU DOHHAW STATE HOSP. - BOILER HOUSE [DEMOLISHED] 45-710 KEAAHALA RD - KANEOHE, OAHU 96744 KANEOHE 4-5-23:2 1,280 OAHU DOHHAW STATE HOSP. - CENTRAL KITCHEN BUILDING 45-710 KEAAHALA RD - KANEOHE, OAHU 96744 KANEOHE 4-5-23:2 17,548 OAHU DOHHAW STATE HOSP. - COOKE BUILDING 003 45-710 KEAAHALA RD - KANEOHE, OAHU 96744 KANEOHE 4-5-23:2 7,434 OAHU DOHHAW STATE HOSP. - GARAGE REPAIR SHOP (NO REPORT) 45-710 KEAAHALA RD - KANEOHE, OAHU 96744 KANEOHE 4-5-23:2 0 OAHU DOHHAW STATE HOSP. - GODDARD BUILDING 45-710 KEAAHALA RD - KANEOHE, OAHU 96744 KANEOHE 4-5-23:2 112,475 OAHU DOHHAW STATE HOSP. - GUENSBURG BUILDING 45-710 KEAAHALA RD - KANEOHE, OAHU 96744 KANEOHE 4-5-23:2 50,205 OAHU DOHHAW STATE HOSP. - HALE AWA (ALSO INSP IN PH II) 45-710 KEAAHALA RD - KANEOHE, OAHU 96744 KANEOHE 4-5-23:2 2,414 OAHU DOHHAW STATE HOSP. - HALE AWA (SEE 20502001) 45-710 KEAAHALA RD - KANEOHE, OAHU 96744 KANEOHE 4-5-23:2 11,246 OAHU DOHHAW STATE HOSP. - LAUND/BOILER ROOM [DEMOLISHED] 45-710 KEAAHALA RD - KANEOHE, OAHU 96744 KANEOHE 4-5-23:2 2,017 OAHU DOHHAW STATE HOSP. - LAUNDRY BUILDING 45-710 KEAAHALA RD - KANEOHE, OAHU 96744 KANEOHE 4-5-23:2 9,800 OAHU DOHHAW STATE HOSP. - LOKAI BUILDING 45-710 KEAAHALA RD - KANEOHE, OAHU 96744 KANEOHE 4-5-23:2 7,434 OAHU DOHHAW STATE HOSP. - MAINTENANCE OFFICE 45-710 KEAAHALA RD - KANEOHE, OAHU 96744 KANEOHE 4-5-23:2 3,264 OAHU DOHHAW STATE HOSP. - MAINTENANCE SHOPS (NO REPORT) 45-710 KEAAHALA RD - KANEOHE, OAHU 96744 KANEOHE 4-5-23:2 0 OAHU DOHHAW STATE HOSP. - MED DIRECTOR'S QTRS, BLDG 3 45-710 KEAAHALA RD - KANEOHE, OAHU 96744 KANEOHE 4-5-23:2 2,964 OAHU DOHHAW STATE HOSP. - MEDICAL STAFF QTRS, UNIT #10 45-710 KEAAHALA RD - KANEOHE, OAHU 96744 KANEOHE 4-5-23:2 1,100 OAHU DOHHAW STATE HOSP. - MEDICAL STAFF QTRS, UNIT #11 45-710 KEAAHALA RD - KANEOHE, OAHU 96744 KANEOHE 4-5-23:2 1,412 OAHU DOHHAW STATE HOSP. - MEDICAL STAFF QTRS, UNIT #12 45-710 KEAAHALA RD - KANEOHE, OAHU 96744 KANEOHE 4-5-23:2 1,412 OAHU DOHHAW STATE HOSP. - MEDICAL STAFF QTRS, UNIT #13 45-710 KEAAHALA RD - KANEOHE, OAHU 96744 KANEOHE 4-5-23:2 1,100 OAHU DOH
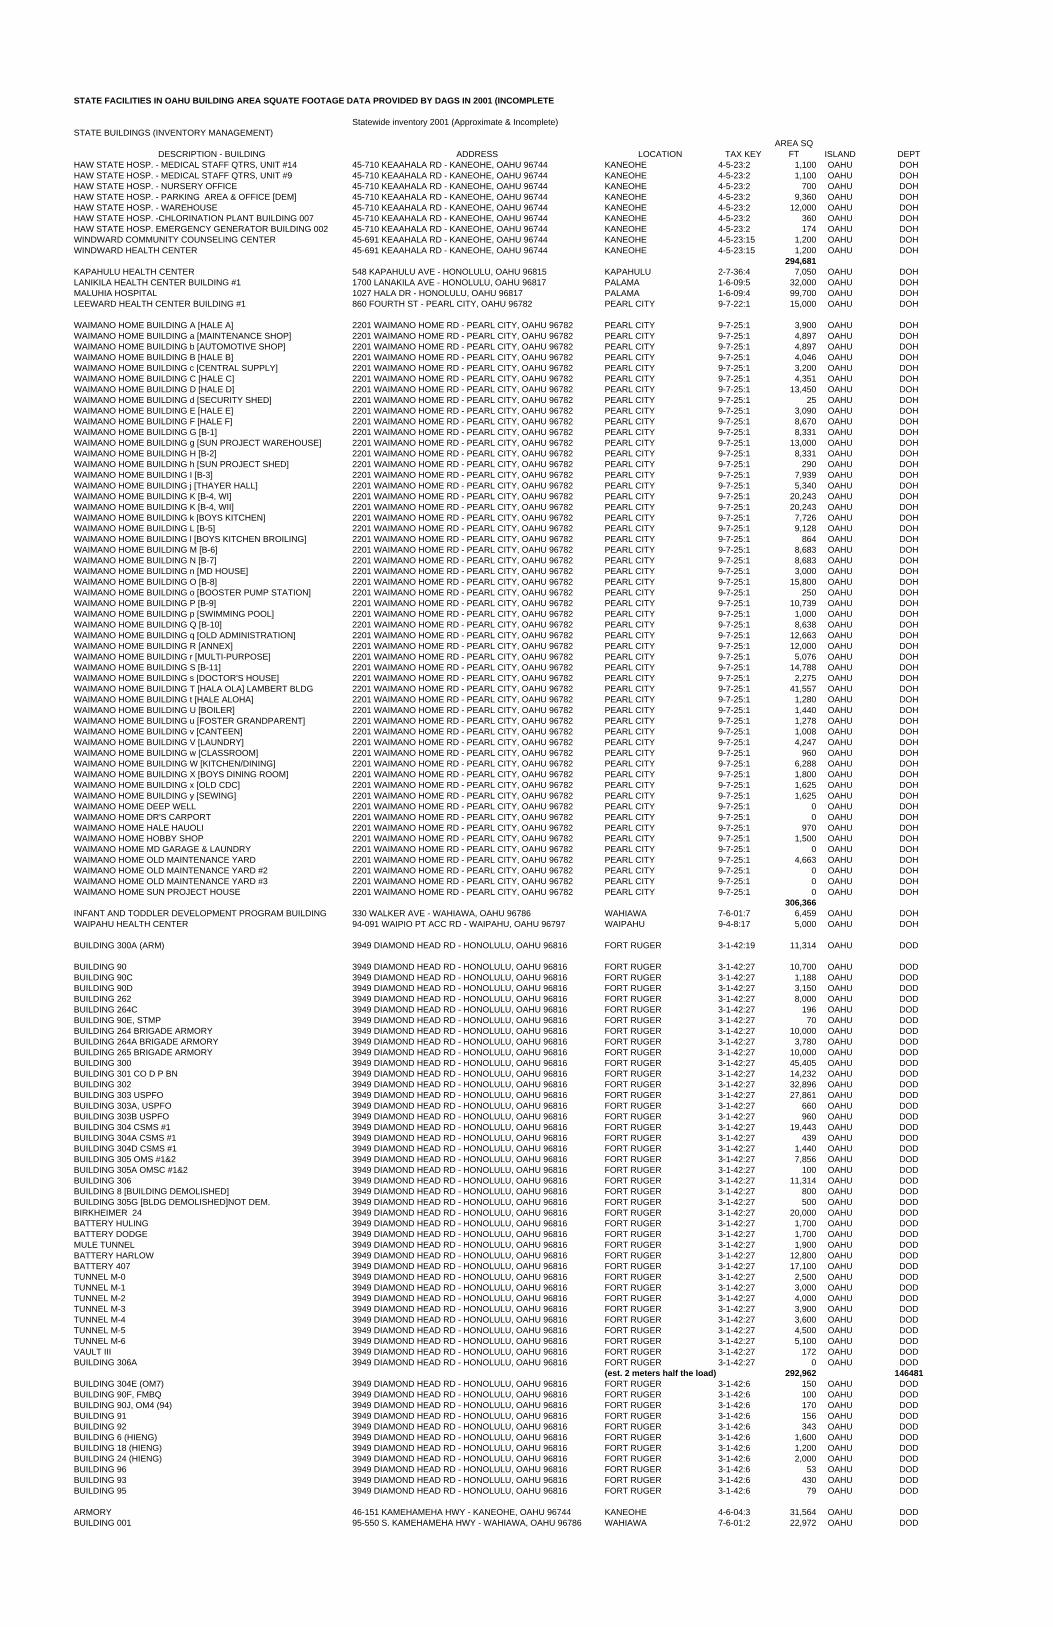
STATE FACILITIES IN OAHU BUILDING AREA SQUATE FOOTAGE DATA PROVIDED BY DAGS IN 2001 (INCOMPLETE)
Statewide inventory 2001 (Approximate & Incomplete)STATE BUILDINGS (INVENTORY MANAGEMENT)
DESCRIPTION - BUILDING ADDRESS LOCATION TAX KEYAREA SQ
FT ISLAND DEPTHAW STATE HOSP. - MEDICAL STAFF QTRS, UNIT #14 45-710 KEAAHALA RD - KANEOHE, OAHU 96744 KANEOHE 4-5-23:2 1,100 OAHU DOHHAW STATE HOSP. - MEDICAL STAFF QTRS, UNIT #9 45-710 KEAAHALA RD - KANEOHE, OAHU 96744 KANEOHE 4-5-23:2 1,100 OAHU DOHHAW STATE HOSP. - NURSERY OFFICE 45-710 KEAAHALA RD - KANEOHE, OAHU 96744 KANEOHE 4-5-23:2 700 OAHU DOHHAW STATE HOSP. - PARKING AREA & OFFICE [DEM] 45-710 KEAAHALA RD - KANEOHE, OAHU 96744 KANEOHE 4-5-23:2 9,360 OAHU DOHHAW STATE HOSP. - WAREHOUSE 45-710 KEAAHALA RD - KANEOHE, OAHU 96744 KANEOHE 4-5-23:2 12,000 OAHU DOHHAW STATE HOSP. -CHLORINATION PLANT BUILDING 007 45-710 KEAAHALA RD - KANEOHE, OAHU 96744 KANEOHE 4-5-23:2 360 OAHU DOHHAW STATE HOSP. EMERGENCY GENERATOR BUILDING 002 45-710 KEAAHALA RD - KANEOHE, OAHU 96744 KANEOHE 4-5-23:2 174 OAHU DOHWINDWARD COMMUNITY COUNSELING CENTER 45-691 KEAAHALA RD - KANEOHE, OAHU 96744 KANEOHE 4-5-23:15 1,200 OAHU DOHWINDWARD HEALTH CENTER 45-691 KEAAHALA RD - KANEOHE, OAHU 96744 KANEOHE 4-5-23:15 1,200 OAHU DOH
294,681KAPAHULU HEALTH CENTER 548 KAPAHULU AVE - HONOLULU, OAHU 96815 KAPAHULU 2-7-36:4 7,050 OAHU DOHLANIKILA HEALTH CENTER BUILDING #1 1700 LANAKILA AVE - HONOLULU, OAHU 96817 PALAMA 1-6-09:5 32,000 OAHU DOHMALUHIA HOSPITAL 1027 HALA DR - HONOLULU, OAHU 96817 PALAMA 1-6-09:4 99,700 OAHU DOHLEEWARD HEALTH CENTER BUILDING #1 860 FOURTH ST - PEARL CITY, OAHU 96782 PEARL CITY 9-7-22:1 15,000 OAHU DOH
WAIMANO HOME BUILDING A [HALE A] 2201 WAIMANO HOME RD - PEARL CITY, OAHU 96782 PEARL CITY 9-7-25:1 3,900 OAHU DOHWAIMANO HOME BUILDING a [MAINTENANCE SHOP] 2201 WAIMANO HOME RD - PEARL CITY, OAHU 96782 PEARL CITY 9-7-25:1 4,897 OAHU DOHWAIMANO HOME BUILDING b [AUTOMOTIVE SHOP] 2201 WAIMANO HOME RD - PEARL CITY, OAHU 96782 PEARL CITY 9-7-25:1 4,897 OAHU DOHWAIMANO HOME BUILDING B [HALE B] 2201 WAIMANO HOME RD - PEARL CITY, OAHU 96782 PEARL CITY 9-7-25:1 4,046 OAHU DOHWAIMANO HOME BUILDING c [CENTRAL SUPPLY] 2201 WAIMANO HOME RD - PEARL CITY, OAHU 96782 PEARL CITY 9-7-25:1 3,200 OAHU DOHWAIMANO HOME BUILDING C [HALE C] 2201 WAIMANO HOME RD - PEARL CITY, OAHU 96782 PEARL CITY 9-7-25:1 4,351 OAHU DOHWAIMANO HOME BUILDING D [HALE D] 2201 WAIMANO HOME RD - PEARL CITY, OAHU 96782 PEARL CITY 9-7-25:1 13,450 OAHU DOHWAIMANO HOME BUILDING d [SECURITY SHED] 2201 WAIMANO HOME RD - PEARL CITY, OAHU 96782 PEARL CITY 9-7-25:1 25 OAHU DOHWAIMANO HOME BUILDING E [HALE E] 2201 WAIMANO HOME RD - PEARL CITY, OAHU 96782 PEARL CITY 9-7-25:1 3,090 OAHU DOHWAIMANO HOME BUILDING F [HALE F] 2201 WAIMANO HOME RD - PEARL CITY, OAHU 96782 PEARL CITY 9-7-25:1 8,670 OAHU DOHWAIMANO HOME BUILDING G [B-1] 2201 WAIMANO HOME RD - PEARL CITY, OAHU 96782 PEARL CITY 9-7-25:1 8,331 OAHU DOHWAIMANO HOME BUILDING g [SUN PROJECT WAREHOUSE] 2201 WAIMANO HOME RD - PEARL CITY, OAHU 96782 PEARL CITY 9-7-25:1 13,000 OAHU DOHWAIMANO HOME BUILDING H [B-2] 2201 WAIMANO HOME RD - PEARL CITY, OAHU 96782 PEARL CITY 9-7-25:1 8,331 OAHU DOHWAIMANO HOME BUILDING h [SUN PROJECT SHED] 2201 WAIMANO HOME RD - PEARL CITY, OAHU 96782 PEARL CITY 9-7-25:1 290 OAHU DOHWAIMANO HOME BUILDING I [B-3] 2201 WAIMANO HOME RD - PEARL CITY, OAHU 96782 PEARL CITY 9-7-25:1 7,939 OAHU DOHWAIMANO HOME BUILDING j [THAYER HALL] 2201 WAIMANO HOME RD - PEARL CITY, OAHU 96782 PEARL CITY 9-7-25:1 5,340 OAHU DOHWAIMANO HOME BUILDING K [B-4, WI] 2201 WAIMANO HOME RD - PEARL CITY, OAHU 96782 PEARL CITY 9-7-25:1 20,243 OAHU DOHWAIMANO HOME BUILDING K [B-4, WII] 2201 WAIMANO HOME RD - PEARL CITY, OAHU 96782 PEARL CITY 9-7-25:1 20,243 OAHU DOHWAIMANO HOME BUILDING k [BOYS KITCHEN] 2201 WAIMANO HOME RD - PEARL CITY, OAHU 96782 PEARL CITY 9-7-25:1 7,726 OAHU DOHWAIMANO HOME BUILDING L [B-5] 2201 WAIMANO HOME RD - PEARL CITY, OAHU 96782 PEARL CITY 9-7-25:1 9,128 OAHU DOHWAIMANO HOME BUILDING l [BOYS KITCHEN BROILING] 2201 WAIMANO HOME RD - PEARL CITY, OAHU 96782 PEARL CITY 9-7-25:1 864 OAHU DOHWAIMANO HOME BUILDING M [B-6] 2201 WAIMANO HOME RD - PEARL CITY, OAHU 96782 PEARL CITY 9-7-25:1 8,683 OAHU DOHWAIMANO HOME BUILDING N [B-7] 2201 WAIMANO HOME RD - PEARL CITY, OAHU 96782 PEARL CITY 9-7-25:1 8,683 OAHU DOHWAIMANO HOME BUILDING n [MD HOUSE] 2201 WAIMANO HOME RD - PEARL CITY, OAHU 96782 PEARL CITY 9-7-25:1 3,000 OAHU DOHWAIMANO HOME BUILDING O [B-8] 2201 WAIMANO HOME RD - PEARL CITY, OAHU 96782 PEARL CITY 9-7-25:1 15,800 OAHU DOHWAIMANO HOME BUILDING o [BOOSTER PUMP STATION] 2201 WAIMANO HOME RD - PEARL CITY, OAHU 96782 PEARL CITY 9-7-25:1 250 OAHU DOHWAIMANO HOME BUILDING P [B-9] 2201 WAIMANO HOME RD - PEARL CITY, OAHU 96782 PEARL CITY 9-7-25:1 10,739 OAHU DOHWAIMANO HOME BUILDING p [SWIMMING POOL] 2201 WAIMANO HOME RD - PEARL CITY, OAHU 96782 PEARL CITY 9-7-25:1 1,000 OAHU DOHWAIMANO HOME BUILDING Q [B-10] 2201 WAIMANO HOME RD - PEARL CITY, OAHU 96782 PEARL CITY 9-7-25:1 8,638 OAHU DOHWAIMANO HOME BUILDING q [OLD ADMINISTRATION] 2201 WAIMANO HOME RD - PEARL CITY, OAHU 96782 PEARL CITY 9-7-25:1 12,663 OAHU DOHWAIMANO HOME BUILDING R [ANNEX] 2201 WAIMANO HOME RD - PEARL CITY, OAHU 96782 PEARL CITY 9-7-25:1 12,000 OAHU DOHWAIMANO HOME BUILDING r [MULTI-PURPOSE] 2201 WAIMANO HOME RD - PEARL CITY, OAHU 96782 PEARL CITY 9-7-25:1 5,076 OAHU DOHWAIMANO HOME BUILDING S [B-11] 2201 WAIMANO HOME RD - PEARL CITY, OAHU 96782 PEARL CITY 9-7-25:1 14,788 OAHU DOHWAIMANO HOME BUILDING s [DOCTOR'S HOUSE] 2201 WAIMANO HOME RD - PEARL CITY, OAHU 96782 PEARL CITY 9-7-25:1 2,275 OAHU DOHWAIMANO HOME BUILDING T [HALA OLA] LAMBERT BLDG 2201 WAIMANO HOME RD - PEARL CITY, OAHU 96782 PEARL CITY 9-7-25:1 41,557 OAHU DOHWAIMANO HOME BUILDING t [HALE ALOHA] 2201 WAIMANO HOME RD - PEARL CITY, OAHU 96782 PEARL CITY 9-7-25:1 1,280 OAHU DOHWAIMANO HOME BUILDING U [BOILER] 2201 WAIMANO HOME RD - PEARL CITY, OAHU 96782 PEARL CITY 9-7-25:1 1,440 OAHU DOHWAIMANO HOME BUILDING u [FOSTER GRANDPARENT] 2201 WAIMANO HOME RD - PEARL CITY, OAHU 96782 PEARL CITY 9-7-25:1 1,278 OAHU DOHWAIMANO HOME BUILDING v [CANTEEN] 2201 WAIMANO HOME RD - PEARL CITY, OAHU 96782 PEARL CITY 9-7-25:1 1,008 OAHU DOHWAIMANO HOME BUILDING V [LAUNDRY] 2201 WAIMANO HOME RD - PEARL CITY, OAHU 96782 PEARL CITY 9-7-25:1 4,247 OAHU DOHWAIMANO HOME BUILDING w [CLASSROOM] 2201 WAIMANO HOME RD - PEARL CITY, OAHU 96782 PEARL CITY 9-7-25:1 960 OAHU DOHWAIMANO HOME BUILDING W [KITCHEN/DINING] 2201 WAIMANO HOME RD - PEARL CITY, OAHU 96782 PEARL CITY 9-7-25:1 6,288 OAHU DOHWAIMANO HOME BUILDING X [BOYS DINING ROOM] 2201 WAIMANO HOME RD - PEARL CITY, OAHU 96782 PEARL CITY 9-7-25:1 1,800 OAHU DOHWAIMANO HOME BUILDING x [OLD CDC] 2201 WAIMANO HOME RD - PEARL CITY, OAHU 96782 PEARL CITY 9-7-25:1 1,625 OAHU DOHWAIMANO HOME BUILDING y [SEWING] 2201 WAIMANO HOME RD - PEARL CITY, OAHU 96782 PEARL CITY 9-7-25:1 1,625 OAHU DOHWAIMANO HOME DEEP WELL 2201 WAIMANO HOME RD - PEARL CITY, OAHU 96782 PEARL CITY 9-7-25:1 0 OAHU DOHWAIMANO HOME DR'S CARPORT 2201 WAIMANO HOME RD - PEARL CITY, OAHU 96782 PEARL CITY 9-7-25:1 0 OAHU DOHWAIMANO HOME HALE HAUOLI 2201 WAIMANO HOME RD - PEARL CITY, OAHU 96782 PEARL CITY 9-7-25:1 970 OAHU DOHWAIMANO HOME HOBBY SHOP 2201 WAIMANO HOME RD - PEARL CITY, OAHU 96782 PEARL CITY 9-7-25:1 1,500 OAHU DOHWAIMANO HOME MD GARAGE & LAUNDRY 2201 WAIMANO HOME RD - PEARL CITY, OAHU 96782 PEARL CITY 9-7-25:1 0 OAHU DOHWAIMANO HOME OLD MAINTENANCE YARD 2201 WAIMANO HOME RD - PEARL CITY, OAHU 96782 PEARL CITY 9-7-25:1 4,663 OAHU DOHWAIMANO HOME OLD MAINTENANCE YARD #2 2201 WAIMANO HOME RD - PEARL CITY, OAHU 96782 PEARL CITY 9-7-25:1 0 OAHU DOHWAIMANO HOME OLD MAINTENANCE YARD #3 2201 WAIMANO HOME RD - PEARL CITY, OAHU 96782 PEARL CITY 9-7-25:1 0 OAHU DOHWAIMANO HOME SUN PROJECT HOUSE 2201 WAIMANO HOME RD - PEARL CITY, OAHU 96782 PEARL CITY 9-7-25:1 0 OAHU DOH
306,366INFANT AND TODDLER DEVELOPMENT PROGRAM BUILDING 330 WALKER AVE - WAHIAWA, OAHU 96786 WAHIAWA 7-6-01:7 6,459 OAHU DOHWAIPAHU HEALTH CENTER 94-091 WAIPIO PT ACC RD - WAIPAHU, OAHU 96797 WAIPAHU 9-4-8:17 5,000 OAHU DOH
BUILDING 300A (ARM) 3949 DIAMOND HEAD RD - HONOLULU, OAHU 96816 FORT RUGER 3-1-42:19 11,314 OAHU DOD
BUILDING 90 3949 DIAMOND HEAD RD - HONOLULU, OAHU 96816 FORT RUGER 3-1-42:27 10,700 OAHU DODBUILDING 90C 3949 DIAMOND HEAD RD - HONOLULU, OAHU 96816 FORT RUGER 3-1-42:27 1,188 OAHU DODBUILDING 90D 3949 DIAMOND HEAD RD - HONOLULU, OAHU 96816 FORT RUGER 3-1-42:27 3,150 OAHU DODBUILDING 262 3949 DIAMOND HEAD RD - HONOLULU, OAHU 96816 FORT RUGER 3-1-42:27 8,000 OAHU DODBUILDING 264C 3949 DIAMOND HEAD RD - HONOLULU, OAHU 96816 FORT RUGER 3-1-42:27 196 OAHU DODBUILDING 90E, STMP 3949 DIAMOND HEAD RD - HONOLULU, OAHU 96816 FORT RUGER 3-1-42:27 70 OAHU DODBUILDING 264 BRIGADE ARMORY 3949 DIAMOND HEAD RD - HONOLULU, OAHU 96816 FORT RUGER 3-1-42:27 10,000 OAHU DODBUILDING 264A BRIGADE ARMORY 3949 DIAMOND HEAD RD - HONOLULU, OAHU 96816 FORT RUGER 3-1-42:27 3,780 OAHU DODBUILDING 265 BRIGADE ARMORY 3949 DIAMOND HEAD RD - HONOLULU, OAHU 96816 FORT RUGER 3-1-42:27 10,000 OAHU DODBUILDING 300 3949 DIAMOND HEAD RD - HONOLULU, OAHU 96816 FORT RUGER 3-1-42:27 45,405 OAHU DODBUILDING 301 CO D P BN 3949 DIAMOND HEAD RD - HONOLULU, OAHU 96816 FORT RUGER 3-1-42:27 14,232 OAHU DODBUILDING 302 3949 DIAMOND HEAD RD - HONOLULU, OAHU 96816 FORT RUGER 3-1-42:27 32,896 OAHU DODBUILDING 303 USPFO 3949 DIAMOND HEAD RD - HONOLULU, OAHU 96816 FORT RUGER 3-1-42:27 27,861 OAHU DODBUILDING 303A, USPFO 3949 DIAMOND HEAD RD - HONOLULU, OAHU 96816 FORT RUGER 3-1-42:27 660 OAHU DODBUILDING 303B USPFO 3949 DIAMOND HEAD RD - HONOLULU, OAHU 96816 FORT RUGER 3-1-42:27 960 OAHU DODBUILDING 304 CSMS #1 3949 DIAMOND HEAD RD - HONOLULU, OAHU 96816 FORT RUGER 3-1-42:27 19,443 OAHU DODBUILDING 304A CSMS #1 3949 DIAMOND HEAD RD - HONOLULU, OAHU 96816 FORT RUGER 3-1-42:27 439 OAHU DODBUILDING 304D CSMS #1 3949 DIAMOND HEAD RD - HONOLULU, OAHU 96816 FORT RUGER 3-1-42:27 1,440 OAHU DODBUILDING 305 OMS #1&2 3949 DIAMOND HEAD RD - HONOLULU, OAHU 96816 FORT RUGER 3-1-42:27 7,856 OAHU DODBUILDING 305A OMSC #1&2 3949 DIAMOND HEAD RD - HONOLULU, OAHU 96816 FORT RUGER 3-1-42:27 100 OAHU DODBUILDING 306 3949 DIAMOND HEAD RD - HONOLULU, OAHU 96816 FORT RUGER 3-1-42:27 11,314 OAHU DODBUILDING 8 [BUILDING DEMOLISHED] 3949 DIAMOND HEAD RD - HONOLULU, OAHU 96816 FORT RUGER 3-1-42:27 800 OAHU DODBUILDING 305G [BLDG DEMOLISHED]NOT DEM. 3949 DIAMOND HEAD RD - HONOLULU, OAHU 96816 FORT RUGER 3-1-42:27 500 OAHU DODBIRKHEIMER 24 3949 DIAMOND HEAD RD - HONOLULU, OAHU 96816 FORT RUGER 3-1-42:27 20,000 OAHU DODBATTERY HULING 3949 DIAMOND HEAD RD - HONOLULU, OAHU 96816 FORT RUGER 3-1-42:27 1,700 OAHU DODBATTERY DODGE 3949 DIAMOND HEAD RD - HONOLULU, OAHU 96816 FORT RUGER 3-1-42:27 1,700 OAHU DODMULE TUNNEL 3949 DIAMOND HEAD RD - HONOLULU, OAHU 96816 FORT RUGER 3-1-42:27 1,900 OAHU DODBATTERY HARLOW 3949 DIAMOND HEAD RD - HONOLULU, OAHU 96816 FORT RUGER 3-1-42:27 12,800 OAHU DODBATTERY 407 3949 DIAMOND HEAD RD - HONOLULU, OAHU 96816 FORT RUGER 3-1-42:27 17,100 OAHU DODTUNNEL M-0 3949 DIAMOND HEAD RD - HONOLULU, OAHU 96816 FORT RUGER 3-1-42:27 2,500 OAHU DODTUNNEL M-1 3949 DIAMOND HEAD RD - HONOLULU, OAHU 96816 FORT RUGER 3-1-42:27 3,000 OAHU DODTUNNEL M-2 3949 DIAMOND HEAD RD - HONOLULU, OAHU 96816 FORT RUGER 3-1-42:27 4,000 OAHU DODTUNNEL M-3 3949 DIAMOND HEAD RD - HONOLULU, OAHU 96816 FORT RUGER 3-1-42:27 3,900 OAHU DODTUNNEL M-4 3949 DIAMOND HEAD RD - HONOLULU, OAHU 96816 FORT RUGER 3-1-42:27 3,600 OAHU DODTUNNEL M-5 3949 DIAMOND HEAD RD - HONOLULU, OAHU 96816 FORT RUGER 3-1-42:27 4,500 OAHU DODTUNNEL M-6 3949 DIAMOND HEAD RD - HONOLULU, OAHU 96816 FORT RUGER 3-1-42:27 5,100 OAHU DODVAULT III 3949 DIAMOND HEAD RD - HONOLULU, OAHU 96816 FORT RUGER 3-1-42:27 172 OAHU DODBUILDING 306A 3949 DIAMOND HEAD RD - HONOLULU, OAHU 96816 FORT RUGER 3-1-42:27 0 OAHU DOD
(est. 2 meters half the load) 292,962 146481BUILDING 304E (OM7) 3949 DIAMOND HEAD RD - HONOLULU, OAHU 96816 FORT RUGER 3-1-42:6 150 OAHU DODBUILDING 90F, FMBQ 3949 DIAMOND HEAD RD - HONOLULU, OAHU 96816 FORT RUGER 3-1-42:6 100 OAHU DODBUILDING 90J, OM4 (94) 3949 DIAMOND HEAD RD - HONOLULU, OAHU 96816 FORT RUGER 3-1-42:6 170 OAHU DODBUILDING 91 3949 DIAMOND HEAD RD - HONOLULU, OAHU 96816 FORT RUGER 3-1-42:6 156 OAHU DODBUILDING 92 3949 DIAMOND HEAD RD - HONOLULU, OAHU 96816 FORT RUGER 3-1-42:6 343 OAHU DODBUILDING 6 (HIENG) 3949 DIAMOND HEAD RD - HONOLULU, OAHU 96816 FORT RUGER 3-1-42:6 1,600 OAHU DODBUILDING 18 (HIENG) 3949 DIAMOND HEAD RD - HONOLULU, OAHU 96816 FORT RUGER 3-1-42:6 1,200 OAHU DODBUILDING 24 (HIENG) 3949 DIAMOND HEAD RD - HONOLULU, OAHU 96816 FORT RUGER 3-1-42:6 2,000 OAHU DODBUILDING 96 3949 DIAMOND HEAD RD - HONOLULU, OAHU 96816 FORT RUGER 3-1-42:6 53 OAHU DODBUILDING 93 3949 DIAMOND HEAD RD - HONOLULU, OAHU 96816 FORT RUGER 3-1-42:6 430 OAHU DODBUILDING 95 3949 DIAMOND HEAD RD - HONOLULU, OAHU 96816 FORT RUGER 3-1-42:6 79 OAHU DOD
ARMORY 46-151 KAMEHAMEHA HWY - KANEOHE, OAHU 96744 KANEOHE 4-6-04:3 31,564 OAHU DODBUILDING 001 95-550 S. KAMEHAMEHA HWY - WAHIAWA, OAHU 96786 WAHIAWA 7-6-01:2 22,972 OAHU DOD

STATE FACILITIES IN OAHU BUILDING AREA SQUATE FOOTAGE DATA PROVIDED BY DAGS IN 2001 (INCOMPLETE)
Statewide inventory 2001 (Approximate & Incomplete)STATE BUILDINGS (INVENTORY MANAGEMENT)
DESCRIPTION - BUILDING ADDRESS LOCATION TAX KEYAREA SQ
FT ISLAND DEPTBUILDING 002 MAINTENANCE 95-550 S. KAMEHAMEHA HWY - WAHIAWA, OAHU 96786 WAHIAWA 7-6-01:2 1,952 OAHU DODBUILDING 003 POL 95-550 S. KAMEHAMEHA HWY - WAHIAWA, OAHU 96786 WAHIAWA 7-6-01:2 196 OAHU DODBUILDING 004 291ST CONCRETE BUILDING 95-550 S. KAMEHAMEHA HWY - WAHIAWA, OAHU 96786 WAHIAWA 7-6-01:2 1,543 OAHU DODBUILDING 005 CLASSROOM 95-550 S. KAMEHAMEHA HWY - WAHIAWA, OAHU 96786 WAHIAWA 7-6-01:2 1,024 OAHU DODBUILDING 001 ARMORY 96-1176 WAIHONA ST - PEARL CITY, OAHU 96782 WAIAWA 9-6-4:15 0 OAHU DODMESS HALL 96-1176 WAIHONA ST - PEARL CITY, OAHU 96782 WAIAWA 9-6-4:15 0 OAHU DODBUILDING 013 STORAGE SHED 96-1176 WAIHONA ST - PEARL CITY, OAHU 96782 WAIAWA 9-6-4:15 26,176 OAHU DODBUILDING 021 ADMIN/WORK BAY 96-1176 WAIHONA ST - PEARL CITY, OAHU 96782 WAIAWA 9-6-4:15 7,056 OAHU DODBUILDING 022 ADMINISTRATION/WORK BAY 96-1176 WAIHONA ST - PEARL CITY, OAHU 96782 WAIAWA 9-6-4:15 10,919 OAHU DODBUILDING 022A PETROLEUM STORAGE 96-1176 WAIHONA ST - PEARL CITY, OAHU 96782 WAIAWA 9-6-4:15 400 OAHU DODBUILDING 025 TRAILER STORAGE 96-1176 WAIHONA ST - PEARL CITY, OAHU 96782 WAIAWA 9-6-4:15 19,565 OAHU DODBUILDING 027 VEHICLE & EQUIPMENT 96-1176 WAIHONA ST - PEARL CITY, OAHU 96782 WAIAWA 9-6-4:15 32,851 OAHU DODBUILDING 028 GROUND SUPPORT & EQUIPMENT 96-1176 WAIHONA ST - PEARL CITY, OAHU 96782 WAIAWA 9-6-4:15 19,747 OAHU DODBUILDING 030 WAREHOUSE 96-1176 WAIHONA ST - PEARL CITY, OAHU 96782 WAIAWA 9-6-4:15 4,500 OAHU DODBUILDING 030A WAREHOUSE 96-1176 WAIHONA ST - PEARL CITY, OAHU 96782 WAIAWA 9-6-4:15 2,275 OAHU DODBUILDING 063 VEHICLE & EQUIPMENT 96-1176 WAIHONA ST - PEARL CITY, OAHU 96782 WAIAWA 9-6-4:15 19,747 OAHU DODBUILDING 065 ALL VEHICLES 96-1176 WAIHONA ST - PEARL CITY, OAHU 96782 WAIAWA 9-6-4:15 19,747 OAHU DODBUILDING 804 WHITEMAN RD - WAIMANALO, OAHU 96795 WAIMANALO 4-1-04:3 3,235 OAHU DODBUILDING 806 ADMINISTRATION WHITEMAN RD - WAIMANALO, OAHU 96795 WAIMANALO 4-1-04:3 2,947 OAHU DODBUILDING 808 WHITEMAN RD - WAIMANALO, OAHU 96795 WAIMANALO 4-1-04:3 3,837 OAHU DODBUILDING 827 1 WILIKINA DR. - WHEELER AFB WAHIAWA,OAHU 96786 WHEELER 7-7-01:2 1,068 OAHU DODBUILDING 829 1 WILIKINA DR. - WHEELER AFB WAHIAWA,OAHU 96786 WHEELER 7-7-01:2 44,125 OAHU DODBUILDING 832 1 WILIKINA DR. - WHEELER AFB WAHIAWA,OAHU 96786 WHEELER 7-7-01:2 17,692 OAHU DOD
295,138

APPENDIX 6.0
Large State Facilities on Oahu Energy Survey Form and Responses to the Survey

STATE BUILDINGS ENERGY SURVEY FORM
GENERAL INFORMATION State Department Name: D.A.G.S.
Building Name: No. 1 Capitol District Building
Building Address: 250 South Hotel Street Contact Person name, Telephone, and E-mail: James Hisano, 831-6734, [email protected] HECO Account Number(s) 8824-4189-078
BUILDING INFORMATION Building Operation Hours: Weekdays: 7:45-4:30 Saturday: Sunday: Holiday: Building type of occupancy: Office X School Warehouse Other (describe) Building Year of Construction: ? Building Occupied (Sq.Ft.) Area (excluding building perimeter and any parking area): 120,000 Building Gross (Sq.Ft.) Area (including any parking area): 129,000 Is there an attached parking garage/lot that you provide electricity? Yes If yes, what is the parking garage/lot square footage? 9,300 Number of Floors: 4 Number of Occupants/Workers: 230 Number of Personal Computers: 220 Are windows tinted with solar reflective material? No If Yes, What Percentage?
EQUIPMENT INFORMATION Type of Lighting and Percentage: Incandescent 5% Fluorescent 95% Has the Lighting been Retrofitted in the Last Five Years? (yes/no) No If Yes, What Type, What Percentage? Will There be Lighting Retrofits in the Next Five Years: No Total Building Percentage Area Cooled 100% Type of Main Air Conditioning Equipment Chilled Water A/C System Has the Air Conditioning been Retrofitted in the Last Five years? (yes/no) Yes If Yes, Describe Retrofit Details: Part of First and Most of Second floor remodeled for Art Gallery, New AHUs Only Will There be Air Conditioning Retrofits in the Next Five Years: Maybe Any Other Large Miscellaneous Equipment Electric Loads and Capacities?
Other comments
STATE BUILDINGS ENERGY SURVEY FORM
GENERAL INFORMATION State Department Name: D.A.G.S.
Building Name: Kakuhihewa, Kapolei State Building
Building Address: 601 Kamokila Boulevard Contact Person name, Telephone, and E-mail: James Hisano, 831-6734, [email protected] HECO Account Number(s) 9800-1977-002
BUILDING INFORMATION Building Operation Hours: Weekdays: 7:45-4:30 Saturday: Sunday: Holiday: Building type of occupancy: Office X School Warehouse Other (describe) Building Year of Construction: 1998 Building Occupied (Sq.Ft.) Area (excluding building perimeter and any parking area): 222,000 Building Gross (Sq.Ft.) Area (including any parking area): 408,000 Is there an attached parking garage/lot that you provide electricity? Yes If yes, what is the parking garage/lot square footage? 186,000 Number of Floors: 16 Number of Occupants/Workers: 1,000 Number of Personal Computers: 7900 Are windows tinted with solar reflective material? Yes If Yes, What Percentage? 100%
EQUIPMENT INFORMATION Type of Lighting and Percentage: Incandescent 1% Fluorescent 99% Has the Lighting been Retrofitted in the Last Five Years? (yes/no) No If Yes, What Type, What Percentage? Will There be Lighting Retrofits in the Next Five Years: No Total Building Percentage Area Cooled 100% Type of Main Air Conditioning Equipment Chilled Water A/C System Has the Air Conditioning been Retrofitted in the Last Five years? (yes/no) No If Yes, Describe Retrofit Details: Will There be Air Conditioning Retrofits in the Next Five Years: No Any Other Large Miscellaneous Equipment Electric Loads and Capacities?
Other comments

STATE BUILDINGS ENERGY SURVEY FORM
GENERAL INFORMATION State Department Name: D.A.G.S.
Building Name: Leiopapa, State Office Tower
Building Address: 235 South Beretania Street Contact Person name, Telephone, and E-mail: James Hisano, 831-6734, [email protected] HECO Account Number(s) 8824-3048-076
BUILDING INFORMATION Building Operation Hours: Weekdays: 7:45-4:30 Saturday: Sunday: Holiday: Building type of occupancy: Office X School Warehouse Other (describe) Building Year of Construction: 1991 Building Occupied (Sq.Ft.) Area (excluding building perimeter and any parking area): 172,000 Building Gross (Sq.Ft.) Area (including any parking area): 188,000 Is there an attached parking garage/lot that you provide electricity? Yes If yes, what is the parking garage/lot square footage? 16,000 Number of Floors: 16 Number of Occupants/Workers: 365 Number of Personal Computers: 325 Are windows tinted with solar reflective material? No If Yes, What Percentage?
EQUIPMENT INFORMATION Type of Lighting and Percentage: Incandescent 5% Fluorescent 95% Has the Lighting been Retrofitted in the Last Five Years? (yes/no) No If Yes, What Type, What Percentage? Will There be Lighting Retrofits in the Next Five Years: No Total Building Percentage Area Cooled 100% Type of Main Air Conditioning Equipment Chilled Water A/C System Has the Air Conditioning been Retrofitted in the Last Five years? (yes/no) No If Yes, Describe Retrofit Details: Will There be Air Conditioning Retrofits in the Next Five Years: Maybe Any Other Large Miscellaneous Equipment Electric Loads and Capacities?
Other comments
STATE BUILDINGS ENERGY SURVEY FORM
GENERAL INFORMATION State Department Name: D.A.G.S.
Building Name: State Capitol
Building Address: 415 South Beretania Contact Person name, Telephone, and E-mail: James Hisano, 831-6734, [email protected] HECO Account Number(s) 8800-6839-077
BUILDING INFORMATION Building Operation Hours: Weekdays: 7:45-4:30 Saturday: Sunday: Holiday: Building type of occupancy: Office X School Warehouse Other (describe) Building Year of Construction: 1969 Building Occupied (Sq.Ft.) Area (excluding building perimeter and any parking area): 300,000 Building Gross (Sq.Ft.) Area (including any parking area): 460,000 Is there an attached parking garage/lot that you provide electricity? Yes If yes, what is the parking garage/lot square footage? 160,000 Number of Floors: 6 Number of Occupants/Workers: 750 Number of Personal Computers: 700 Are windows tinted with solar reflective material? No If Yes, What Percentage?
EQUIPMENT INFORMATION Type of Lighting and Percentage: Incandescent 2% Fluorescent 98% Has the Lighting been Retrofitted in the Last Five Years? (yes/no) No If Yes, What Type, What Percentage? Will There be Lighting Retrofits in the Next Five Years: No Total Building Percentage Area Cooled 100% Type of Main Air Conditioning Equipment Chilled Water A/C System Has the Air Conditioning been Retrofitted in the Last Five years? (yes/no) No If Yes, Describe Retrofit Details: Will There be Air Conditioning Retrofits in the Next Five Years: No Any Other Large Miscellaneous Equipment Electric Loads and Capacities?
Other comments

STATE BUILDINGS ENERGY SURVEY FORM
GENERAL INFORMATION State Department Name: D.A.G.S.
Building Name: AAFES
Building Address: 919 Ala Moana Boulevard Contact Person name, Telephone, and E-mail: James Hisano, 831-6734, [email protected] HECO Account Number(s) 8819-2839-079
BUILDING INFORMATION Building Operation Hours: Weekdays: 7:45-4:30 Saturday: Sunday: Holiday: Building type of occupancy: Office X School Warehouse Other (describe) Building Year of Construction: ? Building Occupied (Sq.Ft.) Area (excluding building perimeter and any parking area): 108,000 Building Gross (Sq.Ft.) Area (including any parking area): 169,000 Is there an attached parking garage/lot that you provide electricity? Yes If yes, what is the parking garage/lot square footage? 61,000 Number of Floors: 5 Number of Occupants/Workers: 200 Number of Personal Computers: 175 Are windows tinted with solar reflective material? No If Yes, What Percentage?
EQUIPMENT INFORMATION Type of Lighting and Percentage: Incandescent 5% Fluorescent 95% Has the Lighting been Retrofitted in the Last Five Years? (yes/no) Yes If Yes, What Type, What Percentage? Will There be Lighting Retrofits in the Next Five Years: No Total Building Percentage Area Cooled 100% Type of Main Air Conditioning Equipment Chilled Water A/C System Has the Air Conditioning been Retrofitted in the Last Five years? (yes/no) No If Yes, Describe Retrofit Details: Will There be Air Conditioning Retrofits in the Next Five Years: Maybe Any Other Large Miscellaneous Equipment Electric Loads and Capacities?
Other comments
STATE BUILDINGS ENERGY SURVEY FORM
GENERAL INFORMATION State Department Name: D.A.G.S.
Building Name: Kalanimoku
Building Address: 1151 Punchbowl Street Contact Person name, Telephone, and E-mail: James Hisano, 831-6734, [email protected] HECO Account Number(s) 8820-5318-076
BUILDING INFORMATION Building Operation Hours: Weekdays: 7:45-4:30 Saturday: Sunday: Holiday: Building type of occupancy: Office X School Warehouse Other (describe) Building Year of Construction: 1976 Building Occupied (Sq.Ft.) Area (excluding building perimeter and any parking area): 203,000 Building Gross (Sq.Ft.) Area (including any parking area): 301,500 Is there an attached parking garage/lot that you provide electricity? Yes If yes, what is the parking garage/lot square footage? 98,500 Number of Floors: 5 Number of Occupants/Workers: 400 Number of Personal Computers: 350 Are windows tinted with solar reflective material? No If Yes, What Percentage?
EQUIPMENT INFORMATION Type of Lighting and Percentage: Incandescent 5% Fluorescent 95% Has the Lighting been Retrofitted in the Last Five Years? (yes/no) No If Yes, What Type, What Percentage? Will There be Lighting Retrofits in the Next Five Years: No Total Building Percentage Area Cooled 100% Type of Main Air Conditioning Equipment Chilled Water A/C System Has the Air Conditioning been Retrofitted in the Last Five years? (yes/no) Yes If Yes, Describe Retrofit Details: Replaced Chiller, Cooling Towers and Outside Air Pre-cooler AHU Will There be Air Conditioning Retrofits in the Next Five Years: Maybe Any Other Large Miscellaneous Equipment Electric Loads and Capacities?
Other comments

STATE BUILDINGS ENERGY SURVEY FORM
GENERAL INFORMATION State Department Name: Department of Transportation Building Name: Kapalama Military Reserves (40 Pier) Building Address: Contact Person name, Telephone, and E-mail: Manuel Lanuevo, 838-8804, HECO Account Number(s) ________________________0000-3507-002__________________ _______
BUILDING INFORMATION METER DISCONNECTED Building Operation Hours: Weekdays: Saturday: Sunday: Holiday: Building type of occupancy: Office School Warehouse Other (describe) Building Year of Construction: Building Occupied (Sq.Ft.) Area (excluding building perimeter and any parking area): Building Gross (Sq.Ft.) Area (including any parking area): Is there an attached parking garage/lot that you provide electricity? If yes, what is the parking garage/lot square footage? Number of Floors: Number of Occupants/Workers: Number of Personal Computers: Are windows tinted with solar reflective material? If Yes, What Percentage?
EQUIPMENT INFORMATION Type of Lighting and Percentage: Incandescent Fluorescent Has the Lighting been Retrofitted in the Last Five Years? (yes/no) If Yes, What Type, What Percentage? Will There be Lighting Retrofits in the Next Five Years: Total Building Percentage Area Cooled Type of Main Air Conditioning Equipment Has the Air Conditioning been Retrofitted in the Last Five years? (yes/no) If Yes, Describe Retrofit Details: Will There be Air Conditioning Retrofits in the Next Five Years: Any Other Large Miscellaneous Equipment Electric Loads and Capacities? Other comments
STATE BUILDINGS ENERGY SURVEY FORM
GENERAL INFORMATION
State Department Name: Department of Transportation Building Name: Central Concourse Vlt “Y” Building Address: 301 Rodgers BV Contact Person name, Telephone, and E-mail: Manuel Lanuevo, 838-8804, HECO Account Number(s) ________________________8800-6364-076 _________________ _______
BUILDING INFORMATION Building Operation Hours: Weekdays: XX Saturday: XX Sunday: XX Holiday: XX Building type of occupancy: Office School Warehouse Other (describe) Airport Building Year of Construction: ____over 20 years Building Occupied (Sq.Ft.) Area (excluding building perimeter and any parking area): 446,860___ Building Gross (Sq.Ft.) Area (including any parking area): same as above Is there an attached parking garage/lot that you provide electricity? no If yes, what is the parking garage/lot square footage? Number of Floors: 2 levels Number of Occupants/Workers: unknown Number of Personal Computers: unknown Are windows tinted with solar reflective material? No If Yes, What Percentage?
EQUIPMENT INFORMATION Type of Lighting and Percentage: Incandescent 40% Fluorescent 60% Has the Lighting been Retrofitted in the Last Five Years? (yes/no) Yes If Yes, What Type, What Percentage? T-8, 32 w, Will There be Lighting Retrofits in the Next Five Years: Not sure Total Building Percentage Area Cooled 85% Type of Main Air Conditioning Equipment Chill water system, Air handling Units Has the Air Conditioning been Retrofitted in the Last Five years? (yes/no) No If Yes, Describe Retrofit Details: Will There be Air Conditioning Retrofits in the Next Five Years: Yes in planning Any Other Large Miscellaneous Equipment Electric Loads and Capacities? Elevators and Escalators Other comments:

STATE BUILDINGS ENERGY SURVEY FORM
GENERAL INFORMATION
State Department Name: Department of Transportation Building Name: Ewa Chiller Plant Building Address: 3651 Aolele Street Contact Person name, Telephone, and E-mail: Manuel Lanuevo, 838-8804, HECO Account Number(s) ________________________9201-0482-002 _________________ _______
BUILDING INFORMATION Building Operation Hours: Weekdays: XX Saturday: XX Sunday: XX Holiday: XX Building type of occupancy: Office School Warehouse Other (describe) Airport Building Year of Construction: ____over 20 years Building Occupied (Sq.Ft.) Area (excluding building perimeter and any parking area): 62,590___ Building Gross (Sq.Ft.) Area (including any parking area): same as above Is there an attached parking garage/lot that you provide electricity? no If yes, what is the parking garage/lot square footage? Number of Floors: 1 levels Number of Occupants/Workers: unknown Number of Personal Computers: unknown Are windows tinted with solar reflective material? No If Yes, What Percentage?
EQUIPMENT INFORMATION Type of Lighting and Percentage: Incandescent 0% Fluorescent 100% Has the Lighting been Retrofitted in the Last Five Years? (yes/no) Yes If Yes, What Type, What Percentage? T-8, 32 w, Will There be Lighting Retrofits in the Next Five Years: Not sure Total Building Percentage Area Cooled 0% Type of Main Air Conditioning Equipment Chill water system, Air handling Units Has the Air Conditioning been Retrofitted in the Last Five years? (yes/no) No If Yes, Describe Retrofit Details: Will There be Air Conditioning Retrofits in the Next Five Years: Yes in planning Any Other Large Miscellaneous Equipment Electric Loads and Capacities? None Other comments:
STATE BUILDINGS ENERGY SURVEY FORM
GENERAL INFORMATION
State Department Name: Department of Transportation Building Name: Commuter Terminal Building Building Address: 300 Rodgers BV Contact Person name, Telephone, and E-mail: Manuel Lanuevo, 838-8804, HECO Account Number(s) ________________________8800-6365-075 _________________ _______
BUILDING INFORMATION Building Operation Hours: Weekdays: XX Saturday: XX Sunday: XX Holiday: XX Building type of occupancy: Office School Warehouse Other (describe) Airport Building Year of Construction: ____over 15 years Building Occupied (Sq.Ft.) Area (excluding building perimeter and any parking area): 87,510 __ Building Gross (Sq.Ft.) Area (including any parking area): same as above Is there an attached parking garage/lot that you provide electricity? no If yes, what is the parking garage/lot square footage? Number of Floors: 2 levels Number of Occupants/Workers: unknown Number of Personal Computers: unknown Are windows tinted with solar reflective material? No If Yes, What Percentage?
EQUIPMENT INFORMATION Type of Lighting and Percentage: Incandescent 40% Fluorescent 60% Has the Lighting been Retrofitted in the Last Five Years? (yes/no) Yes If Yes, What Type, What Percentage? T-8, 32 w, Will There be Lighting Retrofits in the Next Five Years: Not sure Total Building Percentage Area Cooled 55% Type of Main Air Conditioning Equipment Chill water system, Air handling Units Has the Air Conditioning been Retrofitted in the Last Five years? (yes/no) No If Yes, Describe Retrofit Details: Will There be Air Conditioning Retrofits in the Next Five Years: Yes in planning Any Other Large Miscellaneous Equipment Electric Loads and Capacities? No Other comments:

STATE BUILDINGS ENERGY SURVEY FORM
GENERAL INFORMATION
State Department Name: Department of Transportation Building Name: Diamond Head Concourse Building Address: 303 Rodgers BV #373 Contact Person name, Telephone, and E-mail: Manuel Lanuevo, 838-8804, HECO Account Number(s) ________________________8800-6360-075 _________________ _______
BUILDING INFORMATION Building Operation Hours: Weekdays: XX Saturday: XX Sunday: XX Holiday: XX Building type of occupancy: Office School Warehouse Other (describe) Airport Building Year of Construction: ____over 20 years Building Occupied (Sq.Ft.) Area (excluding building perimeter and any parking area): 619,860___ Building Gross (Sq.Ft.) Area (including any parking area): same as above Is there an attached parking garage/lot that you provide electricity? no If yes, what is the parking garage/lot square footage? Number of Floors: 3 levels Number of Occupants/Workers: unknown Number of Personal Computers: unknown Are windows tinted with solar reflective material? No If Yes, What Percentage?
EQUIPMENT INFORMATION Type of Lighting and Percentage: Incandescent 40% Fluorescent 60% Has the Lighting been Retrofitted in the Last Five Years? (yes/no) Yes If Yes, What Type, What Percentage? T-8, 32 w, Will There be Lighting Retrofits in the Next Five Years: Not sure Total Building Percentage Area Cooled 80% Type of Main Air Conditioning Equipment Chill water system, Air handling Units Has the Air Conditioning been Retrofitted in the Last Five years? (yes/no) No If Yes, Describe Retrofit Details: Will There be Air Conditioning Retrofits in the Next Five Years: Yes in planning Any Other Large Miscellaneous Equipment Electric Loads and Capacities? Elevators and Escalators Other comments:
STATE BUILDINGS ENERGY SURVEY FORM
GENERAL INFORMATION
State Department Name: Department of Transportation Building Name: Diamond Head Extension Building Address: 301 Rodgers BV#A Contact Person name, Telephone, and E-mail: Manuel Lanuevo, 838-8804, HECO Account Number(s) ________________________8800-6358-076 _________________ _______
BUILDING INFORMATION Building Operation Hours: Weekdays: XX Saturday: XX Sunday: XX Holiday: XX Building type of occupancy: Office School Warehouse Other (describe) Airport Building Year of Construction: ____over 15 years Building Occupied (Sq.Ft.) Area (excluding building perimeter and any parking area): 1,253,240 __ Building Gross (Sq.Ft.) Area (including any parking area): 0 Is there an attached parking garage/lot that you provide electricity? No If yes, what is the parking garage/lot square footage? 0 Number of Floors: 3 levels and basement Number of Occupants/Workers: unknown Number of Personal Computers: unknown Are windows tinted with solar reflective material? No If Yes, What Percentage?
EQUIPMENT INFORMATION Type of Lighting and Percentage: Incandescent 40% Fluorescent 60% Has the Lighting been Retrofitted in the Last Five Years? (yes/no) Yes If Yes, What Type, What Percentage? T-8, 32 w, Will There be Lighting Retrofits in the Next Five Years: Not sure Total Building Percentage Area Cooled 25% Type of Main Air Conditioning Equipment Chill water system, Air handling Units Has the Air Conditioning been Retrofitted in the Last Five years? (yes/no) No If Yes, Describe Retrofit Details: Will There be Air Conditioning Retrofits in the Next Five Years: Yes, in planning Any Other Large Miscellaneous Equipment Electric Loads and Capacities? Elevators and Escalators Other comments:

STATE BUILDINGS ENERGY SURVEY FORM
GENERAL INFORMATION
State Department Name: Department of Transportation Building Name: Ewa Concourse Gates Building Address: 3661 Aolele Street Contact Person name, Telephone, and E-mail: Manuel Lanuevo, 838-8804, HECO Account Number(s) ________________________9300-4842-002 _________________ _______
BUILDING INFORMATION Building Operation Hours: Weekdays: XX Saturday: XX Sunday: XX Holiday: XX Building type of occupancy: Office School Warehouse Other (describe) Airport Building Year of Construction: ____over 20 years Building Occupied (Sq.Ft.) Area (excluding building perimeter and any parking area): 333,000___ Building Gross (Sq.Ft.) Area (including any parking area): same as above Is there an attached parking garage/lot that you provide electricity? No If yes, what is the parking garage/lot square footage? Number of Floors: 3 levels Number of Occupants/Workers: unknown Number of Personal Computers: unknown Are windows tinted with solar reflective material? No If Yes, What Percentage?
EQUIPMENT INFORMATION Type of Lighting and Percentage: Incandescent 40% Fluorescent 60% Has the Lighting been Retrofitted in the Last Five Years? (yes/no) Yes If Yes, What Type, What Percentage? T-8, 32 w, Will There be Lighting Retrofits in the Next Five Years: Not sure Total Building Percentage Area Cooled 75% Type of Main Air Conditioning Equipment Chill water system, Air handling Units Has the Air Conditioning been Retrofitted in the Last Five years? (yes/no) No If Yes, Describe Retrofit Details: Will There be Air Conditioning Retrofits in the Next Five Years: Yes in planning Any Other Large Miscellaneous Equipment Electric Loads and Capacities? Elevators and Escalators Other comments:
STATE BUILDINGS ENERGY SURVEY FORM
GENERAL INFORMATION
State Department Name: Department of Transportation Building Name: IAB VAULT “B” Building Address: 302 Rodgers BV#344 Contact Person name, Telephone, and E-mail: Manuel Lanuevo, 838-8804, HECO Account Number(s) ________________________8800-6352-076 _________________ _______
BUILDING INFORMATION Building Operation Hours: Weekdays: XX Saturday: XX Sunday: XX Holiday: XX Building type of occupancy: Office School Warehouse Other (describe) Airport Building Year of Construction: ____over 30 years Building Occupied (Sq.Ft.) Area (excluding building perimeter and any parking area): 1,129,200___ Building Gross (Sq.Ft.) Area (including any parking area): same as above Is there an attached parking garage/lot that you provide electricity? no If yes, what is the parking garage/lot square footage? Number of Floors: 3 level and basement Number of Occupants/Workers: unknown Number of Personal Computers: unknown Are windows tinted with solar reflective material? No If Yes, What Percentage?
EQUIPMENT INFORMATION Type of Lighting and Percentage: Incandescent 40% Fluorescent 60% Has the Lighting been Retrofitted in the Last Five Years? (yes/no) Yes If Yes, What Type, What Percentage? T-8, 32 w, Will There be Lighting Retrofits in the Next Five Years: Not sure Total Building Percentage Area Cooled 60% Type of Main Air Conditioning Equipment Chill water system, Air handling Units Has the Air Conditioning been Retrofitted in the Last Five years? (yes/no) No If Yes, Describe Retrofit Details: Will There be Air Conditioning Retrofits in the Next Five Years: Yes in planning Any Other Large Miscellaneous Equipment Electric Loads and Capacities? Elevators and Escalators Other comments:

STATE BUILDINGS ENERGY SURVEY FORM
GENERAL INFORMATION State Department Name: Department of Transportation Building Name: Inter - Island Terminal Building Building Address: 3650 Aolele Street Contact Person name, Telephone, and E-mail: Manuel Lanuevo, 838-8804, HECO Account Number(s) ________________________9300-0115-002 _________________ _______
BUILDING INFORMATION Building Operation Hours: Weekdays: XX Saturday: XX Sunday: XX Holiday: XX Building type of occupancy: Office School Warehouse Other (describe) Airport Building Year of Construction: ____over 10 years Building Occupied (Sq.Ft.) Area (excluding building perimeter and any parking area): 692,041___ Building Gross (Sq.Ft.) Area (including any parking area): 1,384,082 Is there an attached parking garage/lot that you provide electricity? yes If yes, what is the parking garage/lot square footage? 692,041 Number of Floors: 7 levels Number of Occupants/Workers: unknown Number of Personal Computers: unknown Are windows tinted with solar reflective material? No If Yes, What Percentage?
EQUIPMENT INFORMATION Type of Lighting and Percentage: Incandescent 30% Fluorescent 70% Has the Lighting been Retrofitted in the Last Five Years? (yes/no) Yes If Yes, What Type, What Percentage? T-8, 32 w, Will There be Lighting Retrofits in the Next Five Years: Not sure Total Building Percentage Area Cooled 35% Type of Main Air Conditioning Equipment Chill water system, Air handling Units Has the Air Conditioning been Retrofitted in the Last Five years? (yes/no) No If Yes, Describe Retrofit Details: Will There be Air Conditioning Retrofits in the Next Five Years: Yes in planning Any Other Large Miscellaneous Equipment Electric Loads and Capacities? Elevators and Escalators Other comments:
STATE BUILDINGS ENERGY SURVEY FORM
GENERAL INFORMATION State Department Name: Department of Transportation Building Name: SVC CRT VLT “C” Building Address: 302 Rodgers BV#342 Contact Person name, Telephone, and E-mail: Manuel Lanuevo, 838-8804, HECO Account Number(s) ________________________8800-6359-076 _________________ _______
BUILDING INFORMATION Building Operation Hours: Weekdays: XX Saturday: XX Sunday: XX Holiday: XX Building type of occupancy: Office School Warehouse Other (describe) Airport Building Year of Construction: ____over 30 years Building Occupied (Sq.Ft.) Area (excluding building perimeter and any parking area): 342,414___ Building Gross (Sq.Ft.) Area (including any parking area): same as above Is there an attached parking garage/lot that you provide electricity? no If yes, what is the parking garage/lot square footage? Number of Floors: 3 levels Number of Occupants/Workers: unknown Number of Personal Computers: unknown Are windows tinted with solar reflective material? No If Yes, What Percentage?
EQUIPMENT INFORMATION Type of Lighting and Percentage: Incandescent 40% Fluorescent 60% Has the Lighting been Retrofitted in the Last Five Years? (yes/no) Yes If Yes, What Type, What Percentage? T-8, 32 w, Will There be Lighting Retrofits in the Next Five Years: Not sure Total Building Percentage Area Cooled 30% Type of Main Air Conditioning Equipment Chill water system, Air handling Units Has the Air Conditioning been Retrofitted in the Last Five years? (yes/no) No If Yes, Describe Retrofit Details: Will There be Air Conditioning Retrofits in the Next Five Years: Yes in planning Any Other Large Miscellaneous Equipment Electric Loads and Capacities? Elevators and Escalators Other comments:

STATE BUILDINGS ENERGY SURVEY FORM
GENERAL INFORMATION
State Department Name: Department of Transportation Building Name: Ewa VLT “ E” Building Address: 304 Rodgers BV#360 Contact Person name, Telephone, and E-mail: Manuel Lanuevo, 838-8804, HECO Account Number(s) ________________________8800-6353-076 _________________ _______
BUILDING INFORMATION Building Operation Hours: Weekdays: XX Saturday: XX Sunday: XX Holiday: XX Building type of occupancy: Office School Warehouse Other (describe) Airport Building Year of Construction: ____over 30 years Building Occupied (Sq.Ft.) Area (excluding building perimeter and any parking area): 651,060__ Building Gross (Sq.Ft.) Area (including any parking area): same as above Is there an attached parking garage/lot that you provide electricity? no If yes, what is the parking garage/lot square footage? Number of Floors: 3 levels Number of Occupants/Workers: unknown Number of Personal Computers: unknown Are windows tinted with solar reflective material? No If Yes, What Percentage?
EQUIPMENT INFORMATION Type of Lighting and Percentage: Incandescent 40% Fluorescent 60% Has the Lighting been Retrofitted in the Last Five Years? (yes/no) Yes If Yes, What Type, What Percentage? T-8, 32 w, Will There be Lighting Retrofits in the Next Five Years: Not sure Total Building Percentage Area Cooled 86 % Type of Main Air Conditioning Equipment Chill water system, Air handling Units Has the Air Conditioning been Retrofitted in the Last Five years? (yes/no) No If Yes, Describe Retrofit Details: Will There be Air Conditioning Retrofits in the Next Five Years: Yes in planning Any Other Large Miscellaneous Equipment Electric Loads and Capacities? Elevators and Escalators Other comments:
STATE BUILDINGS ENERGY SURVEY FORM
GENERAL INFORMATION
State Department Name: Department of Transportation Building Name: OST VLT “N” Building Address: 302 Rodgers BV#336 Contact Person name, Telephone, and E-mail: Manuel Lanuevo, 838-8804, HECO Account Number(s) ________________________8800-6365-075 _________________ _______
BUILDING INFORMATION Building Operation Hours: Weekdays: XX Saturday: XX Sunday: XX Holiday: XX Building type of occupancy: Office School Warehouse Other (describe) Airport Building Year of Construction: ____over 30 years Building Occupied (Sq.Ft.) Area (excluding building perimeter and any parking area): 531,516__ Building Gross (Sq.Ft.) Area (including any parking area): same as above Is there an attached parking garage/lot that you provide electricity? no If yes, what is the parking garage/lot square footage? Number of Floors: 1 to 3 levels and 11 floors tower with basement Number of Occupants/Workers: unknown Number of Personal Computers: unknown Are windows tinted with solar reflective material? No If Yes, What Percentage?
EQUIPMENT INFORMATION Type of Lighting and Percentage: Incandescent 40% Fluorescent 60% Has the Lighting been Retrofitted in the Last Five Years? (yes/no) Yes If Yes, What Type, What Percentage? T-8, 32 w, Will There be Lighting Retrofits in the Next Five Years: Not sure Total Building Percentage Area Cooled 30% Type of Main Air Conditioning Equipment Chill water system, Air handling Units Has the Air Conditioning been Retrofitted in the Last Five years? (yes/no) No If Yes, Describe Retrofit Details: Will There be Air Conditioning Retrofits in the Next Five Years: Yes in planning Any Other Large Miscellaneous Equipment Electric Loads and Capacities? Elevators and Escalators Other comments:

STATE BUILDINGS ENERGY SURVEY FORM
GENERAL INFORMATION
State Department Name: Department of Transportation Building Name: Overseas Terminal Parking Structure Building Address: 300 Rodgers BV#355 Contact Person name, Telephone, and E-mail: Manuel Lanuevo, 838-8804, HECO Account Number(s) ________________________8800-6357-075 _________________ _______
BUILDING INFORMATION Building Operation Hours: Weekdays: XX Saturday: XX Sunday: XX Holiday: XX Building type of occupancy: Office School Warehouse Other (describe) Airport Building Year of Construction: ____over 30 years Building Occupied (Sq.Ft.) Area (excluding building perimeter and any parking area): 0 __ Building Gross (Sq.Ft.) Area (including any parking area): 950,000 Is there an attached parking garage/lot that you provide electricity? Yes If yes, what is the parking garage/lot square footage? 950,000__ Number of Floors: 5 levels Number of Occupants/Workers: unknown Number of Personal Computers: unknown Are windows tinted with solar reflective material? No If Yes, What Percentage?
EQUIPMENT INFORMATION Type of Lighting and Percentage: Incandescent 40% Fluorescent 60% Has the Lighting been Retrofitted in the Last Five Years? (yes/no) Yes If Yes, What Type, What Percentage? T-8, 32 w, Will There be Lighting Retrofits in the Next Five Years: Not sure Total Building Percentage Area Cooled 0% Type of Main Air Conditioning Equipment Has the Air Conditioning been Retrofitted in the Last Five years? (yes/no) No If Yes, Describe Retrofit Details: Will There be Air Conditioning Retrofits in the Next Five Years: _____________ Any Other Large Miscellaneous Equipment Electric Loads and Capacities? Other comments:

APPENDIX 7.0
UH Manoa Campus Energy Benchmarking Study ECM Spreadsheet Analysis

ECM I, II & III ECM I, II & III ECM I, II & IIIAUDIT AUDIT AUDIT
Oper. Est. Energy Est. Cost Est. Construction Payback Est. Energy Est. Cost Est. Construction Payback Est. Energy Est. Cost Est. Construction Payback Const. Const.Building Name Building Schd. Year- Area Savings (kWh/sf.ft. Savings ($/sq.ft. Costs ($/sq.ft. Savings (kWh/sf.ft. Savings ($/sq.ft. Costs ($/sq.ft. Savings (kWh/sf.ft. Savings ($/sq.ft. Costs ($/sq.ft. (kWh/sf.ft. ($/sq.ft. Cost Cost/sf. Payback
Type hr Built (sq.ft.) (kWh/year) -year) ($/year) -year) ($) -year) (year) (kWh/year) -year) ($/year) -year) ($) -year) (year) (kWh/year) -year) ($/year) -year) ($) -year) (year) kWh/year -year) $/year -year) $ $/sq.ft. year
LAB/ CLASSENERGY AUDIT and ELECTRICITY METER AVAILABLEBilger Addition lab/class 24 1975 55,745 97,565 1.75 9,173 0.16 105,203 1.89 11.47 14,249 0.26 3,911 0.07 9,914 0.18 2.53 ▬ ▬ ▬ ▬ ▬ ▬ ▬ 111,814 2.01 13,084 0.23 118,156 2.12 9.03Sherman Lab lab/class 24 1985 38,388 68,158 1.78 6,286 0.16 54,694 1.42 8.70 1,852 0.05 344 0.01 1,163 0.03 3.38 ▬ ▬ ▬ ▬ ▬ ▬ ▬ 70,010 1.82 6,630 0.17 118,156 3.08 17.82
Sub-TOTAL 94,133 165,723 1.76 15,459 0.16 159,897 1.70 10.34 16,101 0.17 4,255 0.05 11,077 0.12 2.60 181,824 1.93 19,714 0.21 236,312 2.51 11.99
ONLY ENERGY AUDIT AVAILABLENONE
94,133
ONLY ELECTRICITY METER AVAILABLENONE
NO ELECTRICITY METER or ENERGY AUDIT AVAILABLENONE
TOTAL 94,133 165,723 1.76 15,459 0.16 159,897 1.70 10.34 16,101 0.17 4,255 0.05 11,077 0.12 2.60 181,824 1.93 19,714 0.21 236,312 2.51 11.99
UNIVERSITY OF HAWAII AT MANOA ENERGY BENCHMARK ANALYSIS
ECM I ECM II ECM III
Interior and exterior lighting replacement LED exit sign Installation Window Tinting sc=0.4
ECM I, II & III SavingsAUDIT

ECM I, II & III ECM I, II & III ECM I, II & IIIAUDIT AUDIT AUDIT
Oper. Est. Energy Est. Cost Est. Construction Payback Est. Energy Est. Cost Est. Construction Payback Est. Energy Est. Cost Est. Construction Payback Const. Const.Building Name Building Schd. Year- Area Savings (kWh/sf.ft. Savings ($/sq.ft. Costs ($/sq.ft. Savings (kWh/sf.ft. Savings ($/sq.ft. Costs ($/sq.ft. Savings (kWh/sf.ft. Savings ($/sq.ft. Costs ($/sq.ft. (kWh/sf.ft. ($/sq.ft. Cost Cost/sf. Payback
Type hr Built (sq.ft.) (kWh/year) -year) ($/year) -year) ($) -year) (year) (kWh/year) -year) ($/year) -year) ($) -year) (year) (kWh/year) -year) ($/year) -year) ($) -year) (year) kWh/year -year) $/year -year) $ $/sq.ft. year
UNIVERSITY OF HAWAII AT MANOA ENERGY BENCHMARK ANALYSIS
ECM I ECM II ECM III
Interior and exterior lighting replacement LED exit sign Installation Window Tinting sc=0.4
ECM I, II & III SavingsAUDIT
LAB/ CLASS/ OFFICEENERGY AUDIT and ELECTRICITY METER AVAILABLEWatanabe Hall lab/class/office 24 1972 52,609 77,403 1.47 9,589 0.18 111,075 2.11 11.58 10,178 0.19 2,780 0.05 7,081 0.13 2.55 ▬ ▬ ▬ ▬ ▬ ▬ ▬ 87,581 1.66 12,369 0.24 118,156 2.25 9.55Art Building lab/class/office 24 1974 65,020 115,451 1.78 11,287 0.17 128,029 1.97 11.34 10,287 0.16 1,911 0.03 14,163 0.22 7.41 ▬ ▬ ▬ ▬ ▬ ▬ ▬ 125,738 1.93 13,198 0.20 142,192 2.19 10.77Holmes Hall lab/class/office 24 1972 93,016 183,245 1.97 32,177 0.35 218,465 2.35 6.79 ▬ ▬ ▬ ▬ ▬ ▬ ▬ 84,296 0.91 5,143 0.06 16,640 0.18 3.24 267,541 2.88 37,320 0.40 235,105 2.53 6.30Bilger Hall lab/class/office 24 1952 51,750 99,402 1.92 11,410 0.22 89,458 1.73 7.84 6,885 0.13 2,835 0.05 8,781 0.17 3.10 ▬ ▬ ▬ ▬ ▬ ▬ ▬ 106,287 2.05 14,245 0.28 98,239 1.90 6.90St.John Lab (Building A+B) lab/class/office 24 1967 101,300 116,699 1.15 11,732 0.12 139,400 1.38 11.88 3,109 0.03 1,054 0.01 3,966 0.04 3.76 ▬ ▬ ▬ ▬ ▬ ▬ ▬ 119,808 1.18 12,786 0.13 143,366 1.42 11.21Snyder Hall lab/class/office 24 1962 51,000 116,332 2.28 11,063 0.22 95,794 1.88 8.66 2,759 0.05 633 0.01 2,883 0.06 4.55 36,529 0.72 3,543 0.07 4,946 0.10 1.40 155,620 3.05 15,239 0.30 103,623 2.03 6.80Post Buidling lab/class/office 24 1996 190,000 ▬ ▬ ▬ ▬ ▬ ▬ ▬ ▬ ▬ ▬ ▬ ▬ ▬ ▬ 47,343 0.25 4,592 0.02 49,782 0.26 10.84 47,343 0.25 4,592 0.02 49,782 0.26 10.84Geophysics. Inst. Buidling lab/class/office 24 1963 65,000 723,696 11.13 89,283 1.37 178,071 2.74 1.99 557 0.01 161 0.00 567 0.01 3.52 10,819 0.17 1,049 0.02 8,992 0.14 8.57 735,072 11.31 90,493 1.39 187,630 2.89 2.07Gilmore Hall lab/class/office 24 1978 64,500 82,974 1.29 7,913 0.12 89,031 1.38 11.25 2,218 0.03 3,173 0.05 10,032 0.16 3.16 18,000 0.28 1,769 0.03 7,022 0.11 3.97 103,192 1.60 12,855 0.20 106,085 1.64 8.25Physical Science B.D lab/class/office 24 1960 42,873 ▬ ▬ ▬ ▬ ▬ ▬ ▬ 4,692 0.11 765 0.02 2,905 0.07 3.80 ▬ ▬ ▬ ▬ ▬ ▬ ▬ 4,692 0.11 765 0.02 2,905 0.07 3.80
Sub-TOTAL 777,068 1,515,202 1.95 184,454 0.24 1,049,323 1.35 5.69 40,685 0.05 13,312 0.02 50,378 0.06 3.78 196,987 0.25 16,096 0.02 87,382 0.11 5.43 1,752,874 2.26 213,862 0.28 1,187,083 1.53 5.55
ONLY ENERGY AUDIT AVAILABLEEdmonson Building lab/class/office 24 1963 43,840 107,525 2.45 11,470 0.26 87,750 2.00 7.65 3,312 0.08 1,197 0.03 3,399 0.08 2.84 ▬ ▬ ▬ ▬ ▬ ▬ ▬ 110,837 2.53 12,667 0.29 91,149 2.08 7.20
Sub-TOTAL 43,840 107,525 2.45 11,470 0.26 87,750 2.00 7.65 3,312 0.08 1,197 0.03 3,399 0.08 2.84 110,837 2.53 12,667 0.29 91,149 2.08 7.20820,908
ONLY ELECTRICITY METER AVAILABLEHemmenway Hall lab/class/office 24 1939 34,326
Sub-TOTAL 34,326
NO ELECTRICITY METER or ENERGY AUDIT AVAILABLENONE
TOTAL 855,234 1,622,727 1.90 195,924 0.23 1,137,073 1.33 5.80 43,997 0.05 14,509 0.02 53,777 0.06 3.71 196,987 0.23 16,096 0.02 87,382 0.10 5.43 1,863,711 2.18 226,529 0.26 1,278,232 5.64 5.64
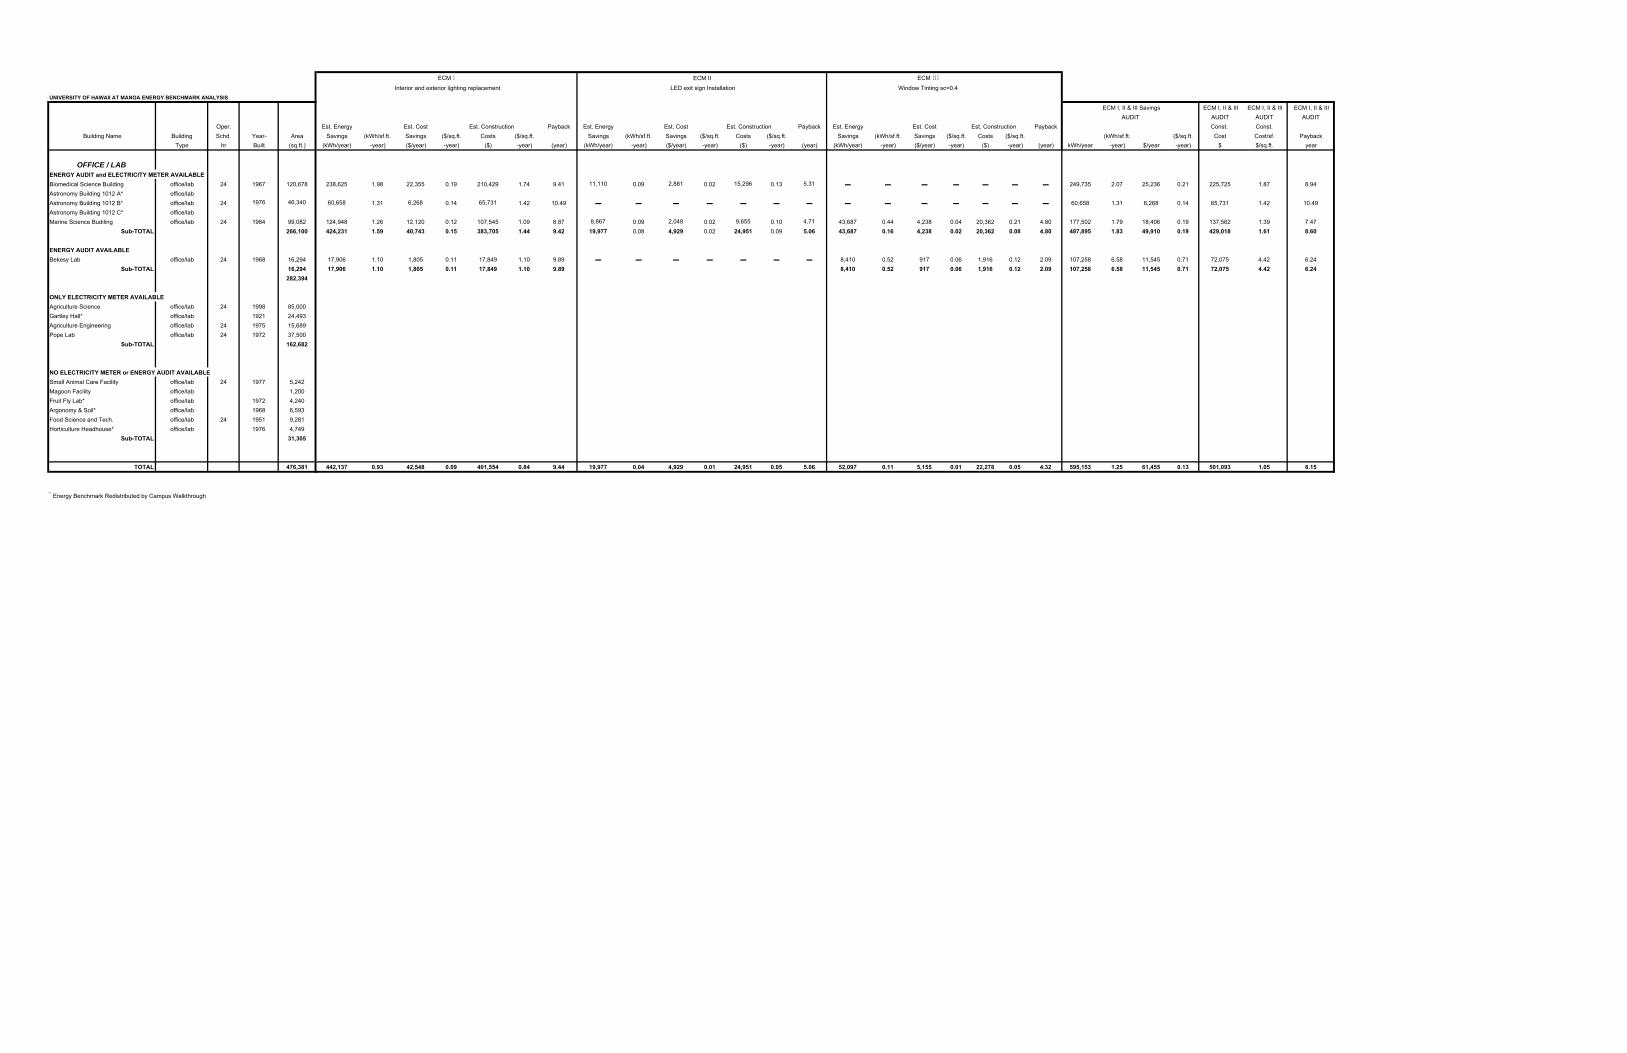
ECM I, II & III ECM I, II & III ECM I, II & IIIAUDIT AUDIT AUDIT
Oper. Est. Energy Est. Cost Est. Construction Payback Est. Energy Est. Cost Est. Construction Payback Est. Energy Est. Cost Est. Construction Payback Const. Const.Building Name Building Schd. Year- Area Savings (kWh/sf.ft. Savings ($/sq.ft. Costs ($/sq.ft. Savings (kWh/sf.ft. Savings ($/sq.ft. Costs ($/sq.ft. Savings (kWh/sf.ft. Savings ($/sq.ft. Costs ($/sq.ft. (kWh/sf.ft. ($/sq.ft. Cost Cost/sf. Payback
Type hr Built (sq.ft.) (kWh/year) -year) ($/year) -year) ($) -year) (year) (kWh/year) -year) ($/year) -year) ($) -year) (year) (kWh/year) -year) ($/year) -year) ($) -year) (year) kWh/year -year) $/year -year) $ $/sq.ft. year
UNIVERSITY OF HAWAII AT MANOA ENERGY BENCHMARK ANALYSIS
ECM I ECM II ECM III
Interior and exterior lighting replacement LED exit sign Installation Window Tinting sc=0.4
ECM I, II & III SavingsAUDIT
OFFICE / LABENERGY AUDIT and ELECTRICITY METER AVAILABLEBiomedical Science Building office/lab 24 1967 120,678 238,625 1.98 22,355 0.19 210,429 1.74 9.41 11,110 0.09 2,881 0.02 15,296 0.13 5.31 ▬ ▬ ▬ ▬ ▬ ▬ ▬ 249,735 2.07 25,236 0.21 225,725 1.87 8.94Astronomy Building 1012 A* office/labAstronomy Building 1012 B* office/lab 24 60,658 1.31 6,268 0.14 65,731 1.42 10.49 ▬ ▬ ▬ ▬ ▬ ▬ ▬ ▬ ▬ ▬ ▬ ▬ ▬ ▬ 60,658 1.31 6,268 0.14 65,731 1.42 10.49Astronomy Building 1012 C* office/labMarine Science Budiling office/lab 24 1984 99,082 124,948 1.26 12,120 0.12 107,545 1.09 8.87 8,867 0.09 2,048 0.02 9,655 0.10 4.71 43,687 0.44 4,238 0.04 20,362 0.21 4.80 177,502 1.79 18,406 0.19 137,562 1.39 7.47
Sub-TOTAL 266,100 424,231 1.59 40,743 0.15 383,705 1.44 9.42 19,977 0.08 4,929 0.02 24,951 0.09 5.06 43,687 0.16 4,238 0.02 20,362 0.08 4.80 487,895 1.83 49,910 0.19 429,018 1.61 8.60
ENERGY AUDIT AVAILABLEBekesy Lab office/lab 24 1968 16,294 17,906 1.10 1,805 0.11 17,849 1.10 9.89 ▬ ▬ ▬ ▬ ▬ ▬ ▬ 8,410 0.52 917 0.06 1,916 0.12 2.09 107,258 6.58 11,545 0.71 72,075 4.42 6.24
Sub-TOTAL 16,294 17,906 1.10 1,805 0.11 17,849 1.10 9.89 8,410 0.52 917 0.06 1,916 0.12 2.09 107,258 6.58 11,545 0.71 72,075 4.42 6.24282,394
ONLY ELECTRICITY METER AVAILABLEAgriculture Science office/lab 24 1998 85,000Gartley Hall* office/lab 1921 24,493Agriculture Engineering office/lab 24 1975 15,689Pope Lab office/lab 24 1972 37,500
Sub-TOTAL 162,682
NO ELECTRICITY METER or ENERGY AUDIT AVAILABLESmall Animal Care Facility office/lab 24 1977 5,242Magoon Facility office/lab 1,200Fruit Fly Lab* office/lab 1972 4,240Argonomy & Soil* office/lab 1968 6,593Food Science and Tech. office/lab 24 1951 9,281Horticulture Headhouse* office/lab 1976 4,749
Sub-TOTAL 31,305
TOTAL 476,381 442,137 0.93 42,548 0.09 401,554 0.84 9.44 19,977 0.04 4,929 0.01 24,951 0.05 5.06 52,097 0.11 5,155 0.01 22,278 0.05 4.32 595,153 1.25 61,455 0.13 501,093 1.05 8.15
* Energy Benchmark Redistributed by Campus Walkthrough
1976 46,340

ECM I, II & III ECM I, II & III ECM I, II & IIIAUDIT AUDIT AUDIT
Oper. Est. Energy Est. Cost Est. Construction Payback Est. Energy Est. Cost Est. Construction Payback Est. Energy Est. Cost Est. Construction Payback Const. Const.Building Name Building Schd. Year- Area Savings (kWh/sf.ft. Savings ($/sq.ft. Costs ($/sq.ft. Savings (kWh/sf.ft. Savings ($/sq.ft. Costs ($/sq.ft. Savings (kWh/sf.ft. Savings ($/sq.ft. Costs ($/sq.ft. (kWh/sf.ft. ($/sq.ft. Cost Cost/sf. Payback
Type hr Built (sq.ft.) (kWh/year) -year) ($/year) -year) ($) -year) (year) (kWh/year) -year) ($/year) -year) ($) -year) (year) (kWh/year) -year) ($/year) -year) ($) -year) (year) kWh/year -year) $/year -year) $ $/sq.ft. year
UNIVERSITY OF HAWAII AT MANOA ENERGY BENCHMARK ANALYSIS
ECM I ECM II ECM III
Interior and exterior lighting replacement LED exit sign Installation Window Tinting sc=0.4
ECM I, II & III SavingsAUDIT
CLASS/ OFFICEENERGY AUDIT and ELECTRICITY METER AVAILABLESpeech Pathology Bldg-171E* class/office 12 1976 7,615 4,302 0.56 401 0.05 6,510 0.85 16.24 ▬ ▬ ▬ ▬ ▬ ▬ ▬ ▬ ▬ ▬ ▬ ▬ ▬ ▬ 4,302 0.56 401 0.05 6,510 0.85 16.24Keller Hall class/office 24 1959 49,193 64,654 1.31 6,086 0.12 54,286 1.10 8.92 1,787 0.04 276 0.01 1,666 0.03 6.04 ▬ ▬ ▬ ▬ ▬ ▬ ▬ 66,441 1.35 6,362 0.13 55,952 1.14 8.79Business Admin. class/office 24 1972 129,143 168,689 1.31 16,454 0.13 172,509 1.34 10.48 ▬ ▬ ▬ ▬ ▬ ▬ ▬ ▬ ▬ ▬ ▬ ▬ ▬ ▬ 168,689 1.31 16,454 0.13 172,509 1.34 10.48Architecture School class/office 24 1993 50,020 74,063 1.48 7,222 0.14 46,350 0.93 6.42 ▬ ▬ ▬ ▬ ▬ ▬ ▬ ▬ ▬ ▬ ▬ ▬ ▬ ▬ 74,063 1.48 7,222 0.14 46,350 0.93 6.42Webster Hall class/office 24 1961 59,559 ▬ ▬ ▬ ▬ ▬ ▬ ▬ ▬ ▬ ▬ ▬ ▬ ▬ ▬ ▬ ▬ ▬ ▬ ▬ ▬ ▬ ▬ ▬ ▬ ▬ ▬ ▬ ▬Speech Pathology Bldg-171F* class/office 12 1976 6,650 24,604 3.70 2,279 0.34 38,953 5.86 17.10 ▬ ▬ ▬ ▬ ▬ ▬ ▬ ▬ ▬ ▬ ▬ ▬ ▬ ▬ 24,604 3.70 2,279 0.34 38,953 5.86 17.10Sakamaki Hall class/office 12 1974 58,230 128,179 2.20 14,984 0.26 137,186 2.36 9.16 ▬ ▬ ▬ ▬ ▬ ▬ ▬ 77,625 1.33 4,736 0.08 33,728 0.58 7.12 205,804 3.53 19,720 0.34 170,914 2.94 8.67Social Science class/office 15 1973 126,738 ▬ ▬ ▬ ▬ ▬ ▬ ▬ ▬ ▬ ▬ ▬ ▬ ▬ ▬ ▬ ▬ ▬ ▬ ▬ ▬ ▬ ▬ ▬ ▬ ▬ ▬ ▬ ▬Miller Hall* class/office 24 1939 19,273 13,644 0.71 971 0.05 10,752 0.56 11.07 ▬ ▬ ▬ ▬ ▬ ▬ ▬ ▬ ▬ ▬ ▬ ▬ ▬ ▬ 13,644 0.71 971 0.05 10,752 0.56 11.07Physical Education class/office 10 1970 45,238 78,322 1.73 7,597 0.17 77,729 1.72 10.23 ▬ ▬ ▬ ▬ ▬ ▬ ▬ ▬ ▬ ▬ ▬ ▬ ▬ ▬ 78,322 1.73 7,597 0.17 77,729 1.72 10.23Moore Hall* class/office 24 1966 80,882 192,741 2.38 18,461 0.23 140,687 1.74 7.62 13,374 0.17 5,840 0.07 18,411 0.23 3.15 ▬ ▬ ▬ ▬ ▬ ▬ ▬ 206,115 2.55 24,301 0.30 159,098 1.97 6.55Law School* class/office 24 1985 53,100 36,263 0.68 3,418 0.06 40,044 0.75 11.72 ▬ ▬ ▬ ▬ ▬ ▬ ▬ ▬ ▬ ▬ ▬ ▬ ▬ ▬ 36,263 0.68 3,418 0.06 40,044 0.75 11.72Music Bldg #1 (1093A )* class/office 10 1959 5,840 10,708 1.83 1,393 0.24 11,431 1.96 8.21 ▬ ▬ ▬ ▬ ▬ ▬ ▬ ▬ ▬ ▬ ▬ ▬ ▬ ▬ 10,708 1.83 1,393 0.24 11,431 1.96 8.21Kuykendall Hall class/office 10 1964 86,492 130,690 1.51 13,468 0.16 69,107 0.80 5.13 8,382 0.10 3,050 0.04 9,064 0.10 2.97 3,995 0.05 388 0.00 2,656 0.03 6.85 143,067 1.65 16,906 0.20 80,827 0.93 4.78Music Bldg #3 (1093C)* class/office 10 1959 1,950 5,925 3.04 981 0.50 3,650 1.87 3.72 ▬ ▬ ▬ ▬ ▬ ▬ ▬ ▬ ▬ ▬ ▬ ▬ ▬ ▬ 5,925 3.04 981 0.50 3,650 1.87 3.72Music Bldg #2 (1093B)* class/office 10 1959 1,120 2,196 1.96 290 0.26 1,168 1.04 4.03 ▬ ▬ ▬ ▬ ▬ ▬ ▬ ▬ ▬ ▬ ▬ ▬ ▬ ▬ 2,196 1.96 290 0.26 1,168 1.04 4.03Orvis Auditorium* class/office 10 1962 7,432 12,811 1.72 1,316 0.18 9,915 1.33 7.53 ▬ ▬ ▬ ▬ ▬ ▬ ▬ ▬ ▬ ▬ ▬ ▬ ▬ ▬ 12,811 1.72 1,316 0.18 9,915 1.33 7.53
Sub-TOTAL 788,475 947,791 1.20 95,320 0.12 820,278 1.04 8.61 23,543 0.03 9,166 0.01 29,141 0.04 3.18 81,620 0.10 5,124 0.01 36,384 0.05 7.10 1,052,954 1.34 109,610 0.14 885,803 1.12 8.08
ONLY ENERGY AUDIT AVAILABLENONE
788,475
ONLY ELECTRICITY METER AVAILABLEWist Hall class/office 1930 24,591Wist Hall Annex Addition class/office 1979 20,625University High School #3* class/office 1957 27,241Wist Annex 1, University High S. 1 & 2* class/office 1943 26,292Burns Hall class/office 55,000George Hall class/office 1922 47,761Hawaiian Studies class/office 1996 22,100Dean Hall* class/office 1989 18,764Lincoln Hall class/office 1959 43,538Jefferson Hall class/office 1963 61,558Klum Gym. class/office 1958 23,884Spalding Hall class/office 1961 33,012Crawford Hall class/office 1938 24,663New Music Building class/office 1973 49,970Dance Building* class/office 1978 4,188Kennedy Theatre class/office 1963 46,752
Sub-TOTAL 529,939
NO ELECTRICITY METER or ENERGY AUDIT AVAILABLEEast West Building # 1,5,6,3,7 class/office 1977 5,1501881 East West PB # 1,2 class/office 1995 8,000University Elementary School* class/office 1939 20,099Makai Campus Portable Classrooms class/office 1977 4,100Lunalili Freeway Building 2 class/office 1977 1,773Newman Center* class/office 4,000Castle Memorial* class/office 1941 28,484
Sub-TOTAL 71,606
TOTAL 1,390,020 947,791 0.68 95,320 0.07 820,278 0.59 8.61 23,543 0.02 9,166 0.01 29,141 0.02 3.18 81,620 0.06 5,124 0.00 36,384 0.03 7.10 1,052,954 0.76 109,610 0.08 885,803 0.64 8.08
* Energy Benchmark Redistributed by Campus Walkthrough

ECM I, II & III ECM I, II & III ECM I, II & IIIAUDIT AUDIT AUDIT
Oper. Est. Energy Est. Cost Est. Construction Payback Est. Energy Est. Cost Est. Construction Payback Est. Energy Est. Cost Est. Construction Payback Const. Const.Building Name Building Schd. Year- Area Savings (kWh/sf.ft. Savings ($/sq.ft. Costs ($/sq.ft. Savings (kWh/sf.ft. Savings ($/sq.ft. Costs ($/sq.ft. Savings (kWh/sf.ft. Savings ($/sq.ft. Costs ($/sq.ft. (kWh/sf.ft. ($/sq.ft. Cost Cost/sf. Payback
Type hr Built (sq.ft.) (kWh/year) -year) ($/year) -year) ($) -year) (year) (kWh/year) -year) ($/year) -year) ($) -year) (year) (kWh/year) -year) ($/year) -year) ($) -year) (year) kWh/year -year) $/year -year) $ $/sq.ft. year
UNIVERSITY OF HAWAII AT MANOA ENERGY BENCHMARK ANALYSIS
ECM I ECM II ECM III
Interior and exterior lighting replacement LED exit sign Installation Window Tinting sc=0.4
ECM I, II & III SavingsAUDIT
OFFICEENERGY AUDIT and ELECTRICITY METER AVAILABLEStudent Services Center office 24 1994 80,000 ▬ ▬ ▬ ▬ ▬ ▬ ▬ ▬ ▬ ▬ ▬ ▬ ▬ ▬ 20,756 0.26 2,554 0.03 30,800 0.39 12.06 20,756 0.26 2,554 0.03 30,800 0.39 12.06Bachman Hall and Annexes office 12 1977 28,070 32,295 1.15 3,974 0.14 19,959 0.71 5.02 ▬ ▬ ▬ ▬ ▬ ▬ ▬ ▬ ▬ ▬ ▬ ▬ ▬ ▬ 32,295 ▬ 3,974 0.14 19,959 0.71 5.02Sinclair Hall office 12 1956 3,687 9,076 2.46 907 0.25 7,220 1.96 7.96 ▬ ▬ ▬ ▬ ▬ ▬ ▬ ▬ ▬ ▬ ▬ ▬ ▬ ▬ 9,076 ▬ 907 0.25 7,220 1.96 7.96Henke Hall office 10 1957 20,686 68,244 3.30 7,715 0.37 56,557 2.73 7.33 ▬ ▬ ▬ ▬ ▬ ▬ ▬ 6,044 0.29 586 0.03 3,008 0.15 5.13 74,288 3.59 8,301 0.40 59,565 2.88 7.18
Sub-TOTAL 132,443 109,615 0.83 12,596 0.10 83,736 0.63 6.65 26,800 0.20 3,140 0.02 33,808 0.26 10.77 136,415 1.03 15,736 0.12 117,544 0.89 7.47
ONLY ENERGY AUDIT AVAILABLE
Krauss Hall and Annexes 1 & 2 office 14 1971 21,611 34,414 1.59 3,477 0.16 21,808 1.01 6.27 ▬ ▬ ▬ ▬ ▬ ▬ ▬ ▬ ▬ ▬ ▬ ▬ ▬ ▬ ▬ ▬ ▬ ▬ ▬ ▬ ▬ROTC Building office 10 1992 5,178 7,694 1.49 736 0.14 6,734 1.30 9.15 ▬ ▬ ▬ ▬ ▬ ▬ ▬ ▬ ▬ ▬ ▬ ▬ ▬ ▬ ▬ ▬ ▬ ▬ ▬ ▬ ▬
Sub-TOTAL 26,789 42,108 1.57 4,213 0.16 28,542 1.07 6.78159,232
ONLY ELECTRICITY METER AVAILABLEWeather Bureau office 1963 22,000Building 37 office 1931 3,655Center for Korean Studies office 1980 16,569Engineering Quad A+B office 1928 7,007Bilger Annex # 1 & 2 office 1971 3,624
Sub-TOTAL 52,855
NO ELECTRICITY METER or ENERGY AUDIT AVAILABLEMakai Campus Portable offices office 1977 12,430Hawaii Hall office 1912 36,849Financial Management B office 1992 710Financial Management C office 1922 710Fiscal Service A office 1992 710Fiscal Service Office office 1977 1,303PPMO/Accounting office 1977 7,945Contracts and Grants office 1977 1,470Keypunch Section office 1977 1,295Lunalili Freeway Building 1 office 1977 1,757Lower Campus Portables office 1976 7,768Air Force ROTC office 1977 3,769National Marine Fisheries Srvc Office 4,100Lincoln Annexes 1&2 office 1971 3,530Physical Plant Annex # 1, 2 office 1970 3,880Physical Plant Building office 1963 4,302Maile Way Annexes office 1967 1,859Campus Security office 1977 1,741Diving Safety Program office 700Environmental Health and Safety Office office 1995 2,530Landscaping* office 400Transportation Service* office 1984 1,400Environmental Protection Service office 1,300Federal Credit Union office 1914 1,309Energy House* office 1978 1,800Maintenance Service Building* office 1970 3,900Parasitology Lab office 1930 1,816Castle Memorial Caretakers Cottage* office 1941 1,678Miller Hall Annex office 1948 1,348High School Locker Building* office 1959 2,436Center for Student Development office 1952 13,733Castle Annex* office 1945 3,488UH Press office 1977 12,536KITV office 1973 20,803Dole St. Offices office 1940 7,400Frear office 1952 32,711University Avenue Annexes office 1977 6,994
Sub-TOTAL 214,410
TOTAL 426,497 151,723 0.36 16,809 0.04 112,278 0.26 6.68 26,800 0.06 3,140 0.01 33,808 0.08 0.08 136,415 0.32 15,736 1.27 117,544 9.46 7.47
* Energy Benchmark Redistributed by Campus Walkthrough
** Building year data was not available, the listed date is astimate.
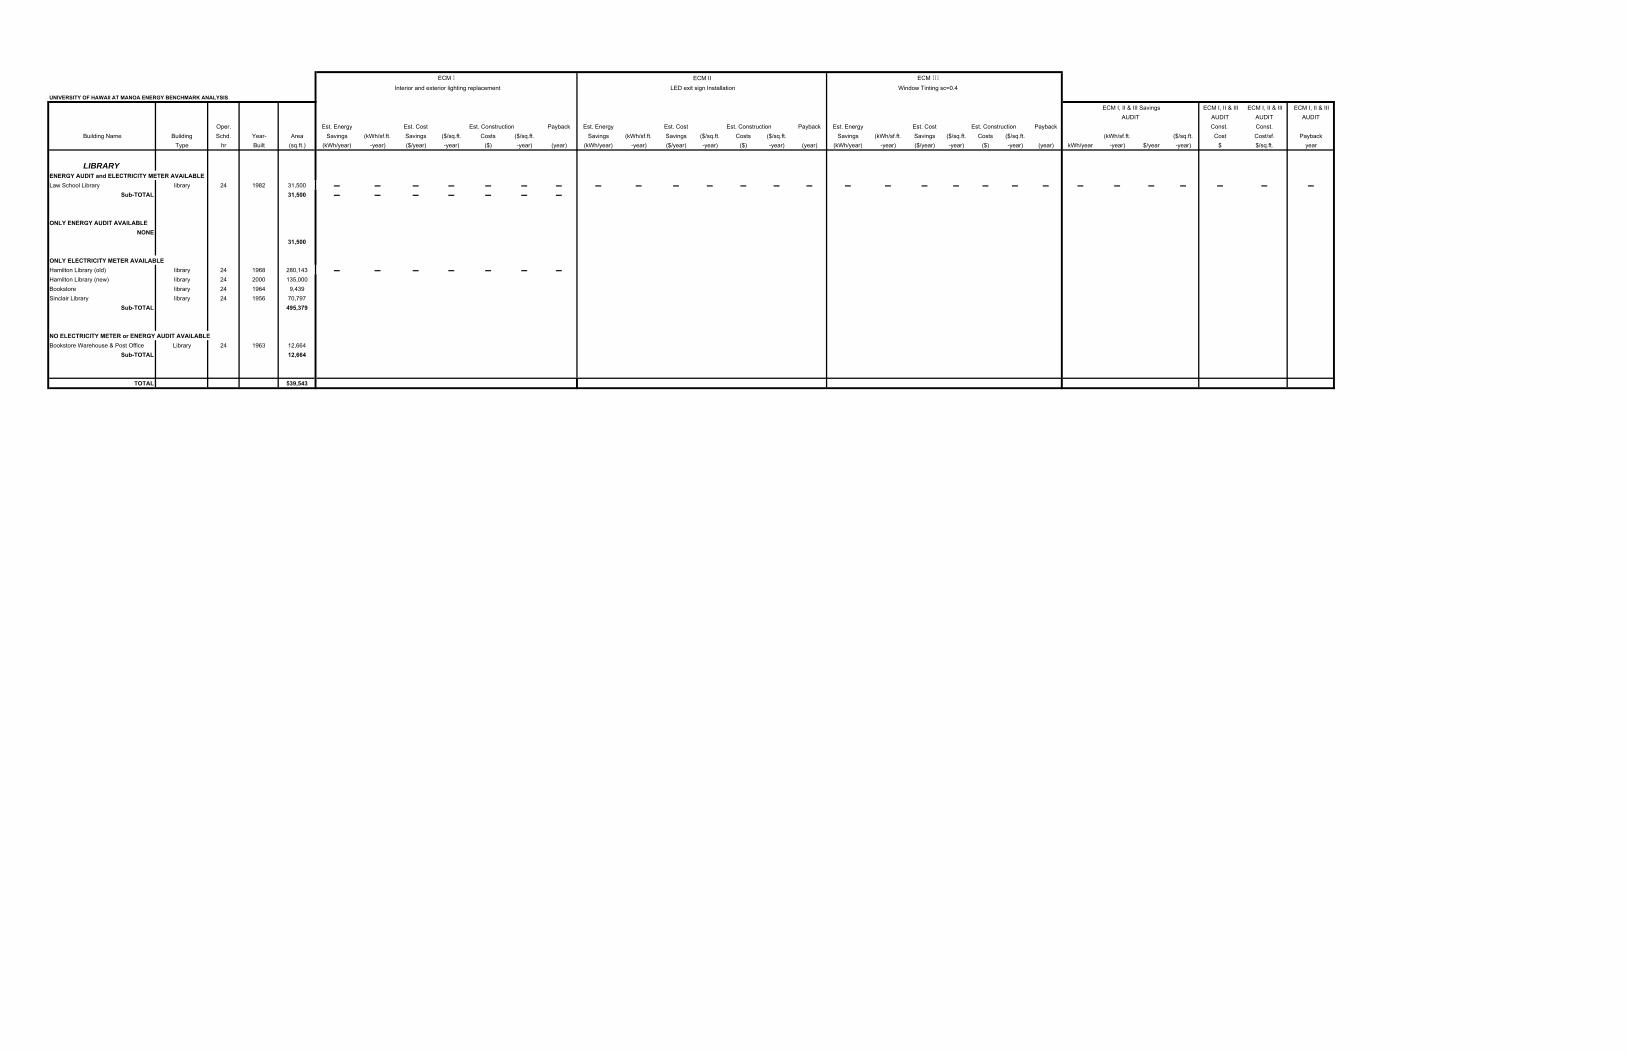
ECM I, II & III ECM I, II & III ECM I, II & IIIAUDIT AUDIT AUDIT
Oper. Est. Energy Est. Cost Est. Construction Payback Est. Energy Est. Cost Est. Construction Payback Est. Energy Est. Cost Est. Construction Payback Const. Const.Building Name Building Schd. Year- Area Savings (kWh/sf.ft. Savings ($/sq.ft. Costs ($/sq.ft. Savings (kWh/sf.ft. Savings ($/sq.ft. Costs ($/sq.ft. Savings (kWh/sf.ft. Savings ($/sq.ft. Costs ($/sq.ft. (kWh/sf.ft. ($/sq.ft. Cost Cost/sf. Payback
Type hr Built (sq.ft.) (kWh/year) -year) ($/year) -year) ($) -year) (year) (kWh/year) -year) ($/year) -year) ($) -year) (year) (kWh/year) -year) ($/year) -year) ($) -year) (year) kWh/year -year) $/year -year) $ $/sq.ft. year
UNIVERSITY OF HAWAII AT MANOA ENERGY BENCHMARK ANALYSIS
ECM I ECM II ECM III
Interior and exterior lighting replacement LED exit sign Installation Window Tinting sc=0.4
ECM I, II & III SavingsAUDIT
LIBRARYENERGY AUDIT and ELECTRICITY METER AVAILABLELaw School Library library 24 1982 31,500 ▬ ▬ ▬ ▬ ▬ ▬ ▬ ▬ ▬ ▬ ▬ ▬ ▬ ▬ ▬ ▬ ▬ ▬ ▬ ▬ ▬ ▬ ▬ ▬ ▬ ▬ ▬ ▬
Sub-TOTAL 31,500 ▬ ▬ ▬ ▬ ▬ ▬ ▬
ONLY ENERGY AUDIT AVAILABLENONE
31,500
ONLY ELECTRICITY METER AVAILABLEHamilton Library (old) library 24 1968 280,143 ▬ ▬ ▬ ▬ ▬ ▬ ▬Hamilton Library (new) library 24 2000 135,000Bookstore library 24 1964 9,439Sinclair Library library 24 1956 70,797
Sub-TOTAL 495,379
NO ELECTRICITY METER or ENERGY AUDIT AVAILABLEBookstore Warehouse & Post Office Library 24 1963 12,664
Sub-TOTAL 12,664
TOTAL 539,543

ECM I, II & III ECM I, II & III ECM I, II & IIIAUDIT AUDIT AUDIT
Oper. Est. Energy Est. Cost Est. Construction Payback Est. Energy Est. Cost Est. Construction Payback Est. Energy Est. Cost Est. Construction Payback Const. Const.Building Name Building Schd. Year- Area Savings (kWh/sf.ft. Savings ($/sq.ft. Costs ($/sq.ft. Savings (kWh/sf.ft. Savings ($/sq.ft. Costs ($/sq.ft. Savings (kWh/sf.ft. Savings ($/sq.ft. Costs ($/sq.ft. (kWh/sf.ft. ($/sq.ft. Cost Cost/sf. Payback
Type hr Built (sq.ft.) (kWh/year) -year) ($/year) -year) ($) -year) (year) (kWh/year) -year) ($/year) -year) ($) -year) (year) (kWh/year) -year) ($/year) -year) ($) -year) (year) kWh/year -year) $/year -year) $ $/sq.ft. year
UNIVERSITY OF HAWAII AT MANOA ENERGY BENCHMARK ANALYSIS
ECM I ECM II ECM III
Interior and exterior lighting replacement LED exit sign Installation Window Tinting sc=0.4
ECM I, II & III SavingsAUDIT
DORMITORYENERGY AUDIT and ELECTRICITY METER AVAILABLE
NONE
ONLY ENERGY AUDIT AVAILABLENONE
0
ONLY ELECTRICITY METER AVAILABLELaulima dorm 1968 38,446Kahawaii dorm 1963 37,578Gateway dorm 1963 65,283Johnson Hall A dorm 1962 26,830Johnson Hall B dorm 1958 22,951Hale Aloha Lahua dorm 1978 71,381Hale Aloha Ilima dorm 1977 71,315Hale Aloha Mokihana dorm 1978 71,315Hale Aloha Lokelani dorm 1978 71,381Neolani dorm 1978 107,800Wainani dorm 1978 203,361Hale Kuahine dorm 1963 31,752Hale Manoa dorm 1963 152,651
Sub-TOTAL 972,044
NO ELECTRICITY METER or ENERGY AUDIT AVAILABLEHale Anuenue dorm 1963 12,664
Sub-TOTAL 12,664
TOTAL 984,708

ECM I, II & III ECM I, II & III ECM I, II & IIIAUDIT AUDIT AUDIT
Oper. Est. Energy Est. Cost Est. Construction Payback Est. Energy Est. Cost Est. Construction Payback Est. Energy Est. Cost Est. Construction Payback Const. Const.Building Name Building Schd. Year- Area Savings (kWh/sf.ft. Savings ($/sq.ft. Costs ($/sq.ft. Savings (kWh/sf.ft. Savings ($/sq.ft. Costs ($/sq.ft. Savings (kWh/sf.ft. Savings ($/sq.ft. Costs ($/sq.ft. (kWh/sf.ft. ($/sq.ft. Cost Cost/sf. Payback
Type hr Built (sq.ft.) (kWh/year) -year) ($/year) -year) ($) -year) (year) (kWh/year) -year) ($/year) -year) ($) -year) (year) (kWh/year) -year) ($/year) -year) ($) -year) (year) kWh/year -year) $/year -year) $ $/sq.ft. year
UNIVERSITY OF HAWAII AT MANOA ENERGY BENCHMARK ANALYSIS
ECM I ECM II ECM III
Interior and exterior lighting replacement LED exit sign Installation Window Tinting sc=0.4
ECM I, II & III SavingsAUDIT
FOOD/FACILITY/OFFICEENERGY AUDIT and ELECTRICITY METER AVAILABLEFOOD/FACILITY/OFFICEAuxilary Services Buidling food/faclty/offc 24 1962 12,652 11,765 0.93 1,119 0.09 11,041 0.87 9.87 1,852 0.15 344 0.03 2,549 0.20 7.41 ▬ ▬ ▬ ▬ ▬ ▬ ▬ 13,617 1.08 1,463 0.12 13,590 1.07 9.29
Sub-TOTAL 12,652 11,765 0.93 1,119 0.09 11,041 0.87 9.87 1,852 0.15 344 0.03 2,549 0.20 7.41 13,617 1.08 1,463 0.12 13,590 1.07 9.29
ONLY ENERGY AUDIT AVAILABLENONE
12,652
ONLY ELECTRICITY METER AVAILABLECampus Center food/faclty/offc 1974 133,342Gateway Café food/faclty/offc 1963 10,000Café Hale Aloha food/faclty/offc 1978 20,665Paradise Palm food/faclty/offc 1964 9,439Multipurpose Building food/faclty/offc 1963 12,664
Sub-TOTAL 186,110
TOTAL 198,762 11,765 0.06 1,119 0.01 11,041 0.06 9.87 1,852 0.01 344 0.00 2,549 0.01 7.41 13,617 0.07 1,463 0.01 13,590 0.07 9.29

ECM I, II & III ECM I, II & III ECM I, II & IIIAUDIT AUDIT AUDIT
Oper. Est. Energy Est. Cost Est. Construction Payback Est. Energy Est. Cost Est. Construction Payback Est. Energy Est. Cost Est. Construction Payback Const. Const.Building Name Building Schd. Year- Area Savings (kWh/sf.ft. Savings ($/sq.ft. Costs ($/sq.ft. Savings (kWh/sf.ft. Savings ($/sq.ft. Costs ($/sq.ft. Savings (kWh/sf.ft. Savings ($/sq.ft. Costs ($/sq.ft. (kWh/sf.ft. ($/sq.ft. Cost Cost/sf. Payback
Type hr Built (sq.ft.) (kWh/year) -year) ($/year) -year) ($) -year) (year) (kWh/year) -year) ($/year) -year) ($) -year) (year) (kWh/year) -year) ($/year) -year) ($) -year) (year) kWh/year -year) $/year -year) $ $/sq.ft. year
UNIVERSITY OF HAWAII AT MANOA ENERGY BENCHMARK ANALYSIS
ECM I ECM II ECM III
Interior and exterior lighting replacement LED exit sign Installation Window Tinting sc=0.4
ECM I, II & III SavingsAUDIT
OTHERENERGY AUDIT and ELECTRICITY METER AVAILABLEOTHERStan Sherriff Multi Purpose Arena arena 10 1977 190,000 ▬ ▬ ▬ ▬ ▬ ▬ ▬ ▬ ▬ ▬ ▬ ▬ ▬ ▬ ▬ ▬ ▬ ▬ ▬ ▬ ▬ ▬ ▬ ▬ ▬ ▬ ▬ ▬Student Health B.D clinic 10 1963 10,793 18,587 1.72 1,998 0.19 12,211 1.13 6.11 2,025 0.19 756 0.07 2,778 0.26 3.67 3,942 0.37 382 0.04 3,134 0.29 8.20 24,554 2.27 3,136 0.29 18,123 1.68 5.78
Sub-TOTAL 200,793 18,587 0.09 1,998 0.01 12,211 0.06 6.11 2,025 0.19 756 0.07 2,778 0.26 3.67 3,942 0.37 382 0.04 3,134 0.29 8.20 24,554 0.12 3,136 0.02 18,123 0.09 5.78
ONLY ENERGY AUDIT AVAILABLENONE
200,793
ONLY ELECTRICITY METER AVAILABLEUH Baseball (Murakami Stadium) Stadium 1987 75,170UH Parking parking 1974 735,000
Sub-TOTAL 810,170
NO ELECTRICITY METER or ENERGY AUDIT AVAILABLECottages 1, 3 and 4 residential 1914 3,465College Hill residential 1963 10,220Waahila Ridge Housing residential 1944 80,478
Sub-TOTAL 94,163
TOTAL 1,105,126 18,587 0.02 1,998 0.00 12,211 0.01 6.11 2,025 0.00 756 0.00 2,778 0.00 3.67 3,942 0.00 382 0.00 3,134 0.00 8.20 24,554 0.02 3,136 0.00 18,123 0.02 5.78

ECM I, II & III ECM I, II & III ECM I, II & IIIAUDIT AUDIT AUDIT
Oper. Est. Energy Est. Cost Est. Construction Payback Est. Energy Est. Cost Est. Construction Payback Est. Energy Est. Cost Est. Construction Payback Const. Const.Building Name Building Schd. Year- Area Savings (kWh/sf.ft. Savings ($/sq.ft. Costs ($/sq.ft. Savings (kWh/sf.ft. Savings ($/sq.ft. Costs ($/sq.ft. Savings (kWh/sf.ft. Savings ($/sq.ft. Costs ($/sq.ft. (kWh/sf.ft. ($/sq.ft. Cost Cost/sf. Payback
Type hr Built (sq.ft.) (kWh/year) -year) ($/year) -year) ($) -year) (year) (kWh/year) -year) ($/year) -year) ($) -year) (year) (kWh/year) -year) ($/year) -year) ($) -year) (year) kWh/year -year) $/year -year) $ $/sq.ft. year
UNIVERSITY OF HAWAII AT MANOA ENERGY BENCHMARK ANALYSIS
ECM I ECM II ECM III
Interior and exterior lighting replacement LED exit sign Installation Window Tinting sc=0.4
ECM I, II & III SavingsAUDIT
STORAGEENERGY AUDIT and ELECTRICITY METER AVAILABLE
NONE
ONLY ENERGY AUDIT AVAILABLENONE
ONLY ELECTRICITY METER AVAILABLEEngineering Quad storage 1915 3,646
Sub-TOTAL 3,6463,646
NO ELECTRICITY METER or ENERGY AUDIT AVAILABLECooke Field storage 1982 4,160Warehouse storage 1963 25,445Warehouse Annexes storage 1963 1,0501171H Store Room storage 1977 3,210Cooke Field Equipment Storage storage 1979 4,160Motor Pool Maintenance storage 1983 1,400Football Storage storage 2000 2,400Maintenance Garage and Storage storage 1963 6,520
Sub-TOTAL 48,345
TOTAL 51,991

ECO IV, V, VI & VIIAUDIT AUDIT AUDIT
Oper. Est. Energy Est. Cost Est. Construction Payback Est. Energy Est. Cost Est. Construction Payback Est. Energy Est. Cost Est. Construction Payback Est. Energy Est. Cost Est. Construction Payback Const. Const.Building Name Building Schd. Year- Area Savings (kWh/sf.ft. Savings ($/sq.ft. Costs ($/sq.ft. Savings (kWh/sf.ft. Savings ($/sq.ft. Costs ($/sq.ft. Savings (kWh/sf.ft. Savings ($/sq.ft. Costs ($/sq.ft. Savings (kWh/sf.ft. Savings ($/sq.ft. Costs ($/sq.ft. (kWh/sf.ft. ($/sq.ft. Cost Cost/sf. Payback
Type hr Built (sq.ft.) (kWh/year) -year) ($/year) -year) ($) -year) (year) (kWh/year) -year) ($/year) -year) ($) -year) (year) (kWh/year) -year) ($/year) -year) ($) -year) (year) (kWh/year) -year) ($/year) -year) ($) -year) (year) kWh/year -year) $/year -year) $ $/sq.ft. year
LAB/ CLASSENERGY AUDIT and ELECTRICITY METER AVAILABLEBilger Addition lab/class 24 1975 55,745 ▬ ▬ ▬ ▬ ▬ ▬ ▬ ▬ ▬ ▬ ▬ ▬ ▬ ▬ ▬ ▬ ▬ ▬ ▬ ▬ ▬ ▬ ▬ ▬ ▬ ▬ ▬ ▬ ▬ ▬ ▬ ▬ ▬ ▬ ▬Sherman Lab lab/class 24 1985 38,388 ▬ ▬ ▬ ▬ ▬ ▬ ▬ ▬ ▬ ▬ ▬ ▬ ▬ ▬ ▬ ▬ ▬ ▬ ▬ ▬ ▬ ▬ ▬ ▬ ▬ ▬ ▬ ▬ ▬ ▬ ▬ ▬ ▬ ▬ ▬
Sub-TOTAL 94,133
ONLY ENERGY AUDIT AVAILABLENONE
94,133
ONLY ELECTRICITY METER AVAILABLENONE
NO ELECTRICITY METER or ENERGY AUDIT AVAILABLENONE
TOTAL 94,133
ECO IV, V, VI & VII Const CostECO IV, V, VI & VII SavingsAUDIT
ECM VI ECM VII
Chiller Retrofits Variable Speed Drive Utilization OTHER Motor Replacement with High Efficiency - Pumps+FansUNIVERSITY OF HAWAII AT MANOA ENERGY BENCHMARK ANALYSIS
ECM IV ECM V

ECO IV, V, VI & VIIAUDIT AUDIT AUDIT
Oper. Est. Energy Est. Cost Est. Construction Payback Est. Energy Est. Cost Est. Construction Payback Est. Energy Est. Cost Est. Construction Payback Est. Energy Est. Cost Est. Construction Payback Const. Const.Building Name Building Schd. Year- Area Savings (kWh/sf.ft. Savings ($/sq.ft. Costs ($/sq.ft. Savings (kWh/sf.ft. Savings ($/sq.ft. Costs ($/sq.ft. Savings (kWh/sf.ft. Savings ($/sq.ft. Costs ($/sq.ft. Savings (kWh/sf.ft. Savings ($/sq.ft. Costs ($/sq.ft. (kWh/sf.ft. ($/sq.ft. Cost Cost/sf. Payback
Type hr Built (sq.ft.) (kWh/year) -year) ($/year) -year) ($) -year) (year) (kWh/year) -year) ($/year) -year) ($) -year) (year) (kWh/year) -year) ($/year) -year) ($) -year) (year) (kWh/year) -year) ($/year) -year) ($) -year) (year) kWh/year -year) $/year -year) $ $/sq.ft. year
ECO IV, V, VI & VII Const CostECO IV, V, VI & VII SavingsAUDIT
ECM VI ECM VII
Chiller Retrofits Variable Speed Drive Utilization OTHER Motor Replacement with High Efficiency - Pumps+FansUNIVERSITY OF HAWAII AT MANOA ENERGY BENCHMARK ANALYSIS
ECM IV ECM V
LAB/ CLASS/ OFFICEENERGY AUDIT and ELECTRICITY METER AVAILABLEWatanabe Hall lab/class/office 24 1972 52,609 ▬ ▬ ▬ ▬ ▬ ▬ ▬ ▬ ▬ ▬ ▬ ▬ ▬ ▬ ▬ ▬ ▬ ▬ ▬ ▬ ▬ ▬ ▬ ▬ ▬ ▬ ▬ ▬ ▬ ▬ ▬ ▬ ▬ ▬ ▬Art Building lab/class/office 24 1974 65,020 ▬ ▬ ▬ ▬ ▬ ▬ ▬ ▬ ▬ ▬ ▬ ▬ ▬ ▬ ▬ ▬ ▬ ▬ ▬ ▬ ▬ ▬ ▬ ▬ ▬ ▬ ▬ ▬ ▬ ▬ ▬ ▬ ▬ ▬ ▬Holmes Hall lab/class/office 24 1972 93,016 ▬ ▬ ▬ ▬ ▬ ▬ ▬ ▬ ▬ ▬ ▬ ▬ ▬ ▬ ▬ ▬ ▬ ▬ ▬ ▬ ▬ 156,622 1.68 9,555 0.10 103,000 1.11 10.8 156,622 1.68 9,555 0.10 103,000 1.11 10.8Bilger Hall lab/class/office 24 1952 51,750 ▬ ▬ ▬ ▬ ▬ ▬ ▬ ▬ ▬ ▬ ▬ ▬ ▬ ▬ ▬ ▬ ▬ ▬ ▬ ▬ ▬ ▬ ▬ ▬ ▬ ▬ ▬ ▬ ▬ ▬ ▬ ▬ ▬ ▬ ▬St.John Lab (Building A+B) lab/class/office 24 1967 101,300 ▬ ▬ ▬ ▬ ▬ ▬ ▬ ▬ ▬ ▬ ▬ ▬ ▬ ▬ ▬ ▬ ▬ ▬ ▬ ▬ ▬ ▬ ▬ ▬ ▬ ▬ ▬ ▬ ▬ ▬ ▬ ▬ ▬ ▬ ▬Snyder Hall lab/class/office 24 1962 51,000 ▬ ▬ ▬ ▬ ▬ ▬ ▬ ▬ ▬ ▬ ▬ ▬ ▬ ▬ ▬ ▬ ▬ ▬ ▬ ▬ ▬ ▬ ▬ ▬ ▬ ▬ ▬ ▬ ▬ ▬ ▬ ▬ ▬ ▬ ▬Post Buidling lab/class/office 24 1996 190,000 ▬ ▬ ▬ ▬ ▬ ▬ ▬ 201,168 1.06 19,513 0.10 75,000 0.39 3.84 ▬ ▬ ▬ ▬ ▬ ▬ ▬ ▬ ▬ ▬ ▬ ▬ ▬ ▬ 201,168 1.06 19,513 0.10 75,000 0.39 3.8Geophysics. Inst. Buidling lab/class/office 24 1963 65,000 ▬ ▬ ▬ ▬ ▬ ▬ ▬ ▬ ▬ ▬ ▬ ▬ ▬ ▬ ▬ ▬ ▬ ▬ ▬ ▬ ▬ ▬ ▬ ▬ ▬ ▬ ▬ ▬ ▬ ▬ ▬ ▬ ▬ ▬ ▬Gilmore Hall lab/class/office 24 1978 64,500 454,586 7.05 44,095 0.68 180,000 2.79 4.08 78,545 1.22 7,619 0.12 20,000 0.31 2.63 ▬ ▬ ▬ ▬ ▬ ▬ ▬ 15,653 0.24 1,518 0.02 14,500 0.22 9.6 548,784 8.51 53,232 0.83 214,500 3.33 4.0Physical Science B.D lab/class/office 24 1960 42,873 ▬ ▬ ▬ ▬ ▬ ▬ ▬ ▬ ▬ ▬ ▬ ▬ ▬ ▬ ▬ ▬ ▬ ▬ ▬ ▬ ▬ ▬ ▬ ▬ ▬ ▬ ▬ ▬ ▬ ▬ ▬ ▬ ▬ ▬ ▬
Sub-TOTAL 777,068 454,586 0.59 44,095 0.06 180,000 0.23 4.08 279,713 0.36 27,132 0.03 95,000 0.12 3.50 172,275 0.22 11,073 0.01 117,500 0.15 10.61 906,574 0.74 82,300 0.07 392,500 0.32 4.8
ONLY ENERGY AUDIT AVAILABLEEdmonson Building lab/class/office 24 1963 43,840 ▬ ▬ ▬ ▬ ▬ ▬ ▬ ▬ ▬ ▬ ▬ ▬ ▬ ▬ ▬ ▬ ▬ ▬ ▬ ▬ ▬ ▬ ▬ ▬ ▬ ▬ ▬ ▬ ▬ ▬ ▬ ▬ ▬ ▬ ▬
Sub-TOTAL 43,840820,908
ONLY ELECTRICITY METER AVAILABLEHemmenway Hall lab/class/office 24 1939 34,326
Sub-TOTAL 34,326
NO ELECTRICITY METER or ENERGY AUDIT AVAILABLENONE
TOTAL 855,234 454,586 0.53 44,095 0.05 180,000 0.21047 4.08 279,713 0.33 27,132 0.03 95,000 0.11 3.50 172,275 0.20 11,073 0.01 117,500 0.137389 10.61 906,574 1.06 82,300 0.10 392,500 0.46 4.77

ECO IV, V, VI & VIIAUDIT AUDIT AUDIT
Oper. Est. Energy Est. Cost Est. Construction Payback Est. Energy Est. Cost Est. Construction Payback Est. Energy Est. Cost Est. Construction Payback Est. Energy Est. Cost Est. Construction Payback Const. Const.Building Name Building Schd. Year- Area Savings (kWh/sf.ft. Savings ($/sq.ft. Costs ($/sq.ft. Savings (kWh/sf.ft. Savings ($/sq.ft. Costs ($/sq.ft. Savings (kWh/sf.ft. Savings ($/sq.ft. Costs ($/sq.ft. Savings (kWh/sf.ft. Savings ($/sq.ft. Costs ($/sq.ft. (kWh/sf.ft. ($/sq.ft. Cost Cost/sf. Payback
Type hr Built (sq.ft.) (kWh/year) -year) ($/year) -year) ($) -year) (year) (kWh/year) -year) ($/year) -year) ($) -year) (year) (kWh/year) -year) ($/year) -year) ($) -year) (year) (kWh/year) -year) ($/year) -year) ($) -year) (year) kWh/year -year) $/year -year) $ $/sq.ft. year
ECO IV, V, VI & VII Const CostECO IV, V, VI & VII SavingsAUDIT
ECM VI ECM VII
Chiller Retrofits Variable Speed Drive Utilization OTHER Motor Replacement with High Efficiency - Pumps+FansUNIVERSITY OF HAWAII AT MANOA ENERGY BENCHMARK ANALYSIS
ECM IV ECM V
OFFICE / LABENERGY AUDIT and ELECTRICITY METER AVAILABLEBiomedical Science Building office/lab 24 1967 120,678 ▬ ▬ ▬ ▬ ▬ ▬ ▬ ▬ ▬ ▬ ▬ ▬ ▬ ▬ ▬ ▬ ▬ ▬ ▬ ▬ ▬ ▬ ▬ ▬ ▬ ▬ ▬ ▬ ▬ ▬ ▬ ▬ ▬ ▬ ▬Astronomy Building 1012 A* office/labAstronomy Building 1012 B* office/lab 24 337,330 7.28 32,721 0.71 289,000 6.24 8.83 ▬ ▬ ▬ ▬ ▬ ▬ ▬ ▬ ▬ ▬ ▬ ▬ ▬ ▬ ▬ ▬ ▬ ▬ ▬ ▬ ▬ 337,330 7.28 32,721 0.71 289,000 6.24 8.8Astronomy Building 1012 C* office/labMarine Science Budiling office/lab 24 1984 99,082 622,698 6.28 60,428 0.61 500,000 5.05 8.27 370,749 3.74 35,963 0.36 108,000 1.09 3.00 ▬ ▬ ▬ ▬ ▬ ▬ ▬ 79,116 0.80 7,675 0.08 65,500 0.7 8.5 1,072,563 10.83 104,066 1.05 673,500 5.12 6.5
Sub-TOTAL 266,100 960,028 3.61 93,149 0.35 789,000 2.97 8.47 370,749 1.39 35,963 0.14 108,000 0.41 3.00 79,116 0.30 7,675 0.03 65,500 0.25 8.53 1,409,893 5.30 136,787 0.51 962,500 2.30 7.0
ENERGY AUDIT AVAILABLEBekesy Lab office/lab 24 1968 16,294 ▬ ▬ ▬ ▬ ▬ ▬ ▬ ▬ ▬ ▬ ▬ ▬ ▬ ▬ ▬ ▬ ▬ ▬ ▬ ▬ ▬ ▬ ▬ ▬ ▬ ▬ ▬ ▬ ▬ ▬ ▬ ▬ ▬ ▬ ▬
Sub-TOTAL 16,294282,394
ONLY ELECTRICITY METER AVAILABLEAgriculture Science office/lab 24 1998 85,000Gartley Hall* office/lab 1921 24,493Agriculture Engineering office/lab 24 1975 15,689Pope Lab office/lab 24 1972 37,500
Sub-TOTAL 162,682
NO ELECTRICITY METER or ENERGY AUDIT AVAILABLESmall Animal Care Facility office/lab 24 1977 5,242Magoon Facility office/lab 1,200Fruit Fly Lab* office/lab 1972 4,240Argonomy & Soil* office/lab 1968 6,593Food Science and Tech. office/lab 24 1951 9,281Horticulture Headhouse* office/lab 1976 4,749
Sub-TOTAL 31,305
TOTAL 476,381 960,028 2.02 93,149 0.20 789,000 1.65624 8.47 370,749 0.78 35,963 0.08 108,000 0.23 3.00 79,116 0.17 7,675 0.02 65,500 0.14 8.53 1,409,893 2.96 136,787 0.29 962,500 2.02 7.04
* Energy Benchmark Redistributed by Campus Walkthrough
46,3401976

ECO IV, V, VI & VIIAUDIT AUDIT AUDIT
Oper. Est. Energy Est. Cost Est. Construction Payback Est. Energy Est. Cost Est. Construction Payback Est. Energy Est. Cost Est. Construction Payback Est. Energy Est. Cost Est. Construction Payback Const. Const.Building Name Building Schd. Year- Area Savings (kWh/sf.ft. Savings ($/sq.ft. Costs ($/sq.ft. Savings (kWh/sf.ft. Savings ($/sq.ft. Costs ($/sq.ft. Savings (kWh/sf.ft. Savings ($/sq.ft. Costs ($/sq.ft. Savings (kWh/sf.ft. Savings ($/sq.ft. Costs ($/sq.ft. (kWh/sf.ft. ($/sq.ft. Cost Cost/sf. Payback
Type hr Built (sq.ft.) (kWh/year) -year) ($/year) -year) ($) -year) (year) (kWh/year) -year) ($/year) -year) ($) -year) (year) (kWh/year) -year) ($/year) -year) ($) -year) (year) (kWh/year) -year) ($/year) -year) ($) -year) (year) kWh/year -year) $/year -year) $ $/sq.ft. year
ECO IV, V, VI & VII Const CostECO IV, V, VI & VII SavingsAUDIT
ECM VI ECM VII
Chiller Retrofits Variable Speed Drive Utilization OTHER Motor Replacement with High Efficiency - Pumps+FansUNIVERSITY OF HAWAII AT MANOA ENERGY BENCHMARK ANALYSIS
ECM IV ECM V
CLASS/ OFFICEENERGY AUDIT and ELECTRICITY METER AVAILABLESpeech Pathology Bldg-171E* class/office 12 1976 7,615 ▬ ▬ ▬ ▬ ▬ ▬ ▬ ▬ ▬ ▬ ▬ ▬ ▬ ▬ ▬ ▬ ▬ ▬ ▬ ▬ ▬ ▬ ▬ ▬ ▬ ▬ ▬ ▬ ▬ ▬ ▬ ▬ ▬ ▬ ▬Keller Hall class/office 24 1959 49,193 564,810 11.48 54,787 1.11 420,000 8.54 7.67 ▬ ▬ ▬ ▬ ▬ ▬ ▬ ▬ ▬ ▬ ▬ ▬ ▬ ▬ ▬ ▬ ▬ ▬ ▬ ▬ ▬ 564,810 11.48 54,787 1.11 420,000 8.54 7.7Business Admin. class/office 24 1972 129,143 ▬ ▬ ▬ ▬ ▬ ▬ ▬ 141,584 1.10 14,322 0.11 36,000 0.28 2.51 ▬ ▬ ▬ ▬ ▬ ▬ ▬ ▬ ▬ ▬ ▬ ▬ ▬ ▬ 141,584 1.10 14,322 0.11 36,000 0.28 2.5Architecture School class/office 24 1993 50,020 ▬ ▬ ▬ ▬ ▬ ▬ ▬ 198,859 3.98 20,027 0.40 222,500 4.45 11.11 ▬ ▬ ▬ ▬ ▬ ▬ ▬ ▬ ▬ ▬ ▬ ▬ ▬ ▬ 198,859 3.98 20,027 0.40 222,500 4.45 11.1Webster Hall class/office 24 1961 59,559 ▬ ▬ ▬ ▬ ▬ ▬ ▬ 96,036 1.61 9,315 0.16 54,000 0.91 5.80 ▬ ▬ ▬ ▬ ▬ ▬ ▬ ▬ ▬ ▬ ▬ ▬ ▬ ▬ 96,036 1.61 9,315 0.16 54,000 0.91 5.8Speech Pathology Bldg-171F* class/office 12 1976 6,650 ▬ ▬ ▬ ▬ ▬ ▬ ▬ ▬ ▬ ▬ ▬ ▬ ▬ ▬ ▬ ▬ ▬ ▬ ▬ ▬ ▬ ▬ ▬ ▬ ▬ ▬ ▬ ▬ ▬ ▬ ▬ ▬ ▬ ▬ ▬Sakamaki Hall class/office 12 1974 58,230 203,370 3.49 12,407 0.21 10,000 0.17 0.81 ▬ ▬ ▬ ▬ ▬ ▬ ▬ ▬ ▬ ▬ ▬ ▬ ▬ ▬ ▬ ▬ ▬ ▬ ▬ ▬ ▬ 203,370 3.49 12,407 0.21 10,000 0.17 0.8Social Science class/office 15 1973 126,738 ▬ ▬ ▬ ▬ ▬ ▬ ▬ 56,274 0.44 5,459 0.04 58,000 0.46 10.62 ▬ ▬ ▬ ▬ ▬ ▬ ▬ ▬ ▬ ▬ ▬ ▬ ▬ ▬ 56,274 0.44 5,459 0.04 58,000 0.46 10.6Miller Hall* class/office 24 1939 19,273 ▬ ▬ ▬ ▬ ▬ ▬ ▬ ▬ ▬ ▬ ▬ ▬ ▬ ▬ ▬ ▬ ▬ ▬ ▬ ▬ ▬ ▬ ▬ ▬ ▬ ▬ ▬ ▬ ▬ ▬ ▬ ▬ ▬ ▬ ▬Physical Education class/office 10 1970 45,238 195,336 4.32 18,948 0.42 71,981 1.59 3.80 ▬ ▬ ▬ ▬ ▬ ▬ ▬ ▬ ▬ ▬ ▬ ▬ ▬ ▬ ▬ ▬ ▬ ▬ ▬ ▬ ▬ 195,336 4.32 18,948 0.42 71,981 1.59 3.8Moore Hall* class/office 24 1966 80,882 ▬ ▬ ▬ ▬ ▬ ▬ ▬ ▬ ▬ ▬ ▬ ▬ ▬ ▬ ▬ ▬ ▬ ▬ ▬ ▬ ▬ ▬ ▬ ▬ ▬ ▬ ▬ ▬ ▬ ▬ ▬ ▬ ▬ ▬ ▬Law School* class/office 24 1985 53,100 ▬ ▬ ▬ ▬ ▬ ▬ ▬ ▬ ▬ ▬ ▬ ▬ ▬ ▬ 122,474 2.3 11,880 0.2 155,734 3 13.1 ▬ ▬ ▬ ▬ ▬ ▬ ▬ 122,474 2.31 11,880 0.22 155,734 2.93 13.1Music Bldg #1 (1093A )* class/office 10 1959 5,840 ▬ ▬ ▬ ▬ ▬ ▬ ▬ ▬ ▬ ▬ ▬ ▬ ▬ ▬ ▬ ▬ ▬ ▬ ▬ ▬ ▬ ▬ ▬ ▬ ▬ ▬ ▬ ▬ ▬ ▬ ▬ ▬ ▬ ▬ ▬Kuykendall Hall class/office 10 1964 86,492 ▬ ▬ ▬ ▬ ▬ ▬ ▬ ▬ ▬ ▬ ▬ ▬ ▬ ▬ ▬ ▬ ▬ ▬ ▬ ▬ ▬ ▬ ▬ ▬ ▬ ▬ ▬ ▬ ▬ ▬ ▬ ▬ ▬ ▬ ▬Music Bldg #3 (1093C)* class/office 10 1959 1,950 ▬ ▬ ▬ ▬ ▬ ▬ ▬ ▬ ▬ ▬ ▬ ▬ ▬ ▬ ▬ ▬ ▬ ▬ ▬ ▬ ▬ ▬ ▬ ▬ ▬ ▬ ▬ ▬ ▬ ▬ ▬ ▬Music Bldg #2 (1093B)* class/office 10 1959 1,120 ▬ ▬ ▬ ▬ ▬ ▬ ▬ ▬ ▬ ▬ ▬ ▬ ▬ ▬ ▬ ▬ ▬ ▬ ▬ ▬ ▬ ▬ ▬ ▬ ▬ ▬ ▬ ▬ ▬ ▬ ▬ ▬ ▬ ▬ ▬Orvis Auditorium* class/office 10 1962 7,432 ▬ ▬ ▬ ▬ ▬ ▬ ▬ ▬ ▬ ▬ ▬ ▬ ▬ ▬ ▬ ▬ ▬ ▬ ▬ ▬ ▬ ▬ ▬ ▬ ▬ ▬ ▬ ▬ ▬ ▬ ▬ ▬ ▬ ▬ ▬
Sub-TOTAL 788,475 963,516 1.22 86,142 0.11 501,981 0.64 5.83 492,753 0.62 49,123 0.06 370,500 0.47 7.54 122,474 0.16 11,880 0.02 155,734 0.20 13.11 1,578,743 2.57 147,145 0.24 1,028,215 1.68 7.0
ONLY ENERGY AUDIT AVAILABLENONE
788,475
ONLY ELECTRICITY METER AVAILABLEWist Hall class/office 1930 24,591Wist Hall Annex Addition class/office 1979 20,625University High School #3* class/office 1957 27,241Wist Annex 1, University High S. 1 & 2* class/office 1943 26,292Burns Hall class/office 55,000George Hall class/office 1922 47,761Hawaiian Studies class/office 1996 22,100Dean Hall* class/office 1989 18,764Lincoln Hall class/office 1959 43,538Jefferson Hall class/office 1963 61,558Klum Gym. class/office 1958 23,884Spalding Hall class/office 1961 33,012Crawford Hall class/office 1938 24,663New Music Building class/office 1973 49,970Dance Building* class/office 1978 4,188Kennedy Theatre class/office 1963 46,752
Sub-TOTAL 529,939
NO ELECTRICITY METER or ENERGY AUDIT AVAILABLEEast West Building # 1,5,6,3,7 class/office 1977 5,1501881 East West PB # 1,2 class/office 1995 8,000University Elementary School* class/office 1939 20,099Makai Campus Portable Classrooms class/office 1977 4,100Lunalili Freeway Building 2 class/office 1977 1,773Newman Center* class/office 4,000Castle Memorial* class/office 1941 28,484
Sub-TOTAL 71,606
TOTAL 1,390,020 963,516 0.69 86,142 0.06 501,981 0.36 5.83 492,753 0.35 49,123 0.04 370,500 0.27 7.54 122,474 0.09 11,880 0.01 155,734 0.11 13.11 1,578,743 1.14 147,145 0.11 1,028,215 0.74 6.99
* Energy Benchmark Redistributed by Campus Walkthrough

ECO IV, V, VI & VIIAUDIT AUDIT AUDIT
Oper. Est. Energy Est. Cost Est. Construction Payback Est. Energy Est. Cost Est. Construction Payback Est. Energy Est. Cost Est. Construction Payback Est. Energy Est. Cost Est. Construction Payback Const. Const.Building Name Building Schd. Year- Area Savings (kWh/sf.ft. Savings ($/sq.ft. Costs ($/sq.ft. Savings (kWh/sf.ft. Savings ($/sq.ft. Costs ($/sq.ft. Savings (kWh/sf.ft. Savings ($/sq.ft. Costs ($/sq.ft. Savings (kWh/sf.ft. Savings ($/sq.ft. Costs ($/sq.ft. (kWh/sf.ft. ($/sq.ft. Cost Cost/sf. Payback
Type hr Built (sq.ft.) (kWh/year) -year) ($/year) -year) ($) -year) (year) (kWh/year) -year) ($/year) -year) ($) -year) (year) (kWh/year) -year) ($/year) -year) ($) -year) (year) (kWh/year) -year) ($/year) -year) ($) -year) (year) kWh/year -year) $/year -year) $ $/sq.ft. year
ECO IV, V, VI & VII Const CostECO IV, V, VI & VII SavingsAUDIT
ECM VI ECM VII
Chiller Retrofits Variable Speed Drive Utilization OTHER Motor Replacement with High Efficiency - Pumps+FansUNIVERSITY OF HAWAII AT MANOA ENERGY BENCHMARK ANALYSIS
ECM IV ECM V
OFFICEENERGY AUDIT and ELECTRICITY METER AVAILABLEStudent Services Center office 24 1994 80,000 236,564 2.96 22,945 0.29 90,000 1.13 3.92 ▬ ▬ ▬ ▬ ▬ ▬ ▬ ▬ ▬ ▬ ▬ ▬ ▬ ▬ ▬ ▬ ▬ ▬ ▬ ▬ ▬ 236,564 2.96 22,945 0.29 90,000 1.13 3.9Bachman Hall and Annexes office 12 1977 28,070 ▬ ▬ ▬ ▬ ▬ ▬ ▬ ▬ ▬ ▬ ▬ ▬ ▬ ▬ ▬ ▬ ▬ ▬ ▬ ▬ ▬ ▬ ▬ ▬ ▬ ▬ ▬ ▬ ▬ ▬ ▬ ▬ ▬ ▬ ▬Sinclair Hall office 12 1956 3,687 ▬ ▬ ▬ ▬ ▬ ▬ ▬ ▬ ▬ ▬ ▬ ▬ ▬ ▬ ▬ ▬ ▬ ▬ ▬ ▬ ▬ ▬ ▬ ▬ ▬ ▬ ▬ ▬ ▬ ▬ ▬ ▬ ▬ ▬ ▬Henke Hall office 10 1957 20,686 ▬ ▬ ▬ ▬ ▬ ▬ ▬ ▬ ▬ ▬ ▬ ▬ ▬ ▬ ▬ ▬ ▬ ▬ ▬ ▬ ▬ ▬ ▬ ▬ ▬ ▬ ▬ ▬ ▬ ▬ ▬ ▬ ▬ ▬ ▬
Sub-TOTAL 132,443 236,564 1.79 22,945 0.17 90,000 0.68 3.92 236,564 1.60 22,945 0.16 90,000 0.61 3.9
ONLY ENERGY AUDIT AVAILABLE
Krauss Hall and Annexes 1 & 2 office 14 1971 21,611 ▬ ▬ ▬ ▬ ▬ ▬ ▬ ▬ ▬ ▬ ▬ ▬ ▬ ▬ ▬ ▬ ▬ ▬ ▬ ▬ ▬ ▬ ▬ ▬ ▬ ▬ ▬ ▬ ▬ ▬ ▬ ▬ ▬ ▬ ▬ROTC Building office 10 1992 5,178 ▬ ▬ ▬ ▬ ▬ ▬ ▬ ▬ ▬ ▬ ▬ ▬ ▬ ▬ ▬ ▬ ▬ ▬ ▬ ▬ ▬ ▬ ▬ ▬ ▬ ▬ ▬ ▬ ▬ ▬ ▬ ▬ ▬ ▬ ▬
Sub-TOTAL 26,789159,232
ONLY ELECTRICITY METER AVAILABLEWeather Bureau office 1963 22,000Building 37 office 1931 3,655Center for Korean Studies office 1980 16,569Engineering Quad A+B office 1928 7,007Bilger Annex # 1 & 2 office 1971 3,624
Sub-TOTAL 52,855
NO ELECTRICITY METER or ENERGY AUDIT AVAILABLEMakai Campus Portable offices office 1977 12,430Hawaii Hall office 1912 36,849Financial Management B office 1992 710Financial Management C office 1922 710Fiscal Service A office 1992 710Fiscal Service Office office 1977 1,303PPMO/Accounting office 1977 7,945Contracts and Grants office 1977 1,470Keypunch Section office 1977 1,295Lunalili Freeway Building 1 office 1977 1,757Lower Campus Portables office 1976 7,768Air Force ROTC office 1977 3,769National Marine Fisheries Srvc Office 4,100Lincoln Annexes 1&2 office 1971 3,530Physical Plant Annex # 1, 2 office 1970 3,880Physical Plant Building office 1963 4,302Maile Way Annexes office 1967 1,859Campus Security office 1977 1,741Diving Safety Program office 700Environmental Health and Safety Office office 1995 2,530Landscaping* office 400Transportation Service* office 1984 1,400Environmental Protection Service office 1,300Federal Credit Union office 1914 1,309Energy House* office 1978 1,800Maintenance Service Building* office 1970 3,900Parasitology Lab office 1930 1,816Castle Memorial Caretakers Cottage* office 1941 1,678Miller Hall Annex office 1948 1,348High School Locker Building* office 1959 2,436Center for Student Development office 1952 13,733Castle Annex* office 1945 3,488UH Press office 1977 12,536KITV office 1973 20,803Dole St. Offices office 1940 7,400Frear office 1952 32,711University Avenue Annexes office 1977 6,994
Sub-TOTAL 214,410
TOTAL 426,497 236,564 0.55 22,945 0.05 90,000 0.21 3.92 236,564 0.55 22,945 0.05 90,000 0.21 3.92
* Energy Benchmark Redistributed by Campus Walkthrough
** Building year data was not available, the listed date is astimate.

ECO IV, V, VI & VIIAUDIT AUDIT AUDIT
Oper. Est. Energy Est. Cost Est. Construction Payback Est. Energy Est. Cost Est. Construction Payback Est. Energy Est. Cost Est. Construction Payback Est. Energy Est. Cost Est. Construction Payback Const. Const.Building Name Building Schd. Year- Area Savings (kWh/sf.ft. Savings ($/sq.ft. Costs ($/sq.ft. Savings (kWh/sf.ft. Savings ($/sq.ft. Costs ($/sq.ft. Savings (kWh/sf.ft. Savings ($/sq.ft. Costs ($/sq.ft. Savings (kWh/sf.ft. Savings ($/sq.ft. Costs ($/sq.ft. (kWh/sf.ft. ($/sq.ft. Cost Cost/sf. Payback
Type hr Built (sq.ft.) (kWh/year) -year) ($/year) -year) ($) -year) (year) (kWh/year) -year) ($/year) -year) ($) -year) (year) (kWh/year) -year) ($/year) -year) ($) -year) (year) (kWh/year) -year) ($/year) -year) ($) -year) (year) kWh/year -year) $/year -year) $ $/sq.ft. year
ECO IV, V, VI & VII Const CostECO IV, V, VI & VII SavingsAUDIT
ECM VI ECM VII
Chiller Retrofits Variable Speed Drive Utilization OTHER Motor Replacement with High Efficiency - Pumps+FansUNIVERSITY OF HAWAII AT MANOA ENERGY BENCHMARK ANALYSIS
ECM IV ECM V
LIBRARYENERGY AUDIT and ELECTRICITY METER AVAILABLELaw School Library library 24 1982 31,500 ▬ ▬ ▬ ▬ ▬ ▬ ▬ ▬ ▬ ▬ ▬ ▬ ▬ ▬ ▬ ▬ ▬ ▬ ▬ ▬ ▬ ▬ ▬ ▬ ▬ ▬ ▬ ▬ ▬ ▬ ▬ ▬ ▬ ▬ ▬
Sub-TOTAL 31,500
ONLY ENERGY AUDIT AVAILABLENONE
31,500
ONLY ELECTRICITY METER AVAILABLEHamilton Library (old) library 24 1968 280,143Hamilton Library (new) library 24 2000 135,000Bookstore library 24 1964 9,439Sinclair Library library 24 1956 70,797
Sub-TOTAL 495,379
NO ELECTRICITY METER or ENERGY AUDIT AVAILABLEBookstore Warehouse & Post Office Library 24 1963 12,664
Sub-TOTAL 12,664
TOTAL 539,543

ECO IV, V, VI & VIIAUDIT AUDIT AUDIT
Oper. Est. Energy Est. Cost Est. Construction Payback Est. Energy Est. Cost Est. Construction Payback Est. Energy Est. Cost Est. Construction Payback Est. Energy Est. Cost Est. Construction Payback Const. Const.Building Name Building Schd. Year- Area Savings (kWh/sf.ft. Savings ($/sq.ft. Costs ($/sq.ft. Savings (kWh/sf.ft. Savings ($/sq.ft. Costs ($/sq.ft. Savings (kWh/sf.ft. Savings ($/sq.ft. Costs ($/sq.ft. Savings (kWh/sf.ft. Savings ($/sq.ft. Costs ($/sq.ft. (kWh/sf.ft. ($/sq.ft. Cost Cost/sf. Payback
Type hr Built (sq.ft.) (kWh/year) -year) ($/year) -year) ($) -year) (year) (kWh/year) -year) ($/year) -year) ($) -year) (year) (kWh/year) -year) ($/year) -year) ($) -year) (year) (kWh/year) -year) ($/year) -year) ($) -year) (year) kWh/year -year) $/year -year) $ $/sq.ft. year
ECO IV, V, VI & VII Const CostECO IV, V, VI & VII SavingsAUDIT
ECM VI ECM VII
Chiller Retrofits Variable Speed Drive Utilization OTHER Motor Replacement with High Efficiency - Pumps+FansUNIVERSITY OF HAWAII AT MANOA ENERGY BENCHMARK ANALYSIS
ECM IV ECM V
DORMITORYENERGY AUDIT and ELECTRICITY METER AVAILABLE
NONE
ONLY ENERGY AUDIT AVAILABLENONE
0
ONLY ELECTRICITY METER AVAILABLELaulima dorm 1968 38,446Kahawaii dorm 1963 37,578Gateway dorm 1963 65,283Johnson Hall A dorm 1962 26,830Johnson Hall B dorm 1958 22,951Hale Aloha Lahua dorm 1978 71,381Hale Aloha Ilima dorm 1977 71,315Hale Aloha Mokihana dorm 1978 71,315Hale Aloha Lokelani dorm 1978 71,381Neolani dorm 1978 107,800Wainani dorm 1978 203,361Hale Kuahine dorm 1963 31,752Hale Manoa dorm 1963 152,651
Sub-TOTAL 972,044
NO ELECTRICITY METER or ENERGY AUDIT AVAILABLEHale Anuenue dorm 1963 12,664
Sub-TOTAL 12,664
TOTAL 984,708

ECO IV, V, VI & VIIAUDIT AUDIT AUDIT
Oper. Est. Energy Est. Cost Est. Construction Payback Est. Energy Est. Cost Est. Construction Payback Est. Energy Est. Cost Est. Construction Payback Est. Energy Est. Cost Est. Construction Payback Const. Const.Building Name Building Schd. Year- Area Savings (kWh/sf.ft. Savings ($/sq.ft. Costs ($/sq.ft. Savings (kWh/sf.ft. Savings ($/sq.ft. Costs ($/sq.ft. Savings (kWh/sf.ft. Savings ($/sq.ft. Costs ($/sq.ft. Savings (kWh/sf.ft. Savings ($/sq.ft. Costs ($/sq.ft. (kWh/sf.ft. ($/sq.ft. Cost Cost/sf. Payback
Type hr Built (sq.ft.) (kWh/year) -year) ($/year) -year) ($) -year) (year) (kWh/year) -year) ($/year) -year) ($) -year) (year) (kWh/year) -year) ($/year) -year) ($) -year) (year) (kWh/year) -year) ($/year) -year) ($) -year) (year) kWh/year -year) $/year -year) $ $/sq.ft. year
ECO IV, V, VI & VII Const CostECO IV, V, VI & VII SavingsAUDIT
ECM VI ECM VII
Chiller Retrofits Variable Speed Drive Utilization OTHER Motor Replacement with High Efficiency - Pumps+FansUNIVERSITY OF HAWAII AT MANOA ENERGY BENCHMARK ANALYSIS
ECM IV ECM V
FOOD/FACILITY/OFFICEENERGY AUDIT and ELECTRICITY METER AVAILABLEFOOD/FACILITY/OFFICEAuxilary Services Buidling food/faclty/offc 24 1962 12,652 ▬ ▬ ▬ ▬ ▬ ▬ ▬ ▬ ▬ ▬ ▬ ▬ ▬ ▬ ▬ ▬ ▬ ▬ ▬ ▬ ▬ ▬ ▬ ▬ ▬ ▬ ▬ ▬ ▬ ▬ ▬ ▬ ▬ ▬ ▬
Sub-TOTAL 12,652 ▬ ▬ ▬ ▬ ▬ ▬ ▬
ONLY ENERGY AUDIT AVAILABLENONE
12,652
ONLY ELECTRICITY METER AVAILABLECampus Center food/faclty/offc 1974 133,342Gateway Café food/faclty/offc 1963 10,000Café Hale Aloha food/faclty/offc 1978 20,665Paradise Palm food/faclty/offc 1964 9,439Multipurpose Building food/faclty/offc 1963 12,664
Sub-TOTAL 186,110
TOTAL 198,762

ECO IV, V, VI & VIIAUDIT AUDIT AUDIT
Oper. Est. Energy Est. Cost Est. Construction Payback Est. Energy Est. Cost Est. Construction Payback Est. Energy Est. Cost Est. Construction Payback Est. Energy Est. Cost Est. Construction Payback Const. Const.Building Name Building Schd. Year- Area Savings (kWh/sf.ft. Savings ($/sq.ft. Costs ($/sq.ft. Savings (kWh/sf.ft. Savings ($/sq.ft. Costs ($/sq.ft. Savings (kWh/sf.ft. Savings ($/sq.ft. Costs ($/sq.ft. Savings (kWh/sf.ft. Savings ($/sq.ft. Costs ($/sq.ft. (kWh/sf.ft. ($/sq.ft. Cost Cost/sf. Payback
Type hr Built (sq.ft.) (kWh/year) -year) ($/year) -year) ($) -year) (year) (kWh/year) -year) ($/year) -year) ($) -year) (year) (kWh/year) -year) ($/year) -year) ($) -year) (year) (kWh/year) -year) ($/year) -year) ($) -year) (year) kWh/year -year) $/year -year) $ $/sq.ft. year
ECO IV, V, VI & VII Const CostECO IV, V, VI & VII SavingsAUDIT
ECM VI ECM VII
Chiller Retrofits Variable Speed Drive Utilization OTHER Motor Replacement with High Efficiency - Pumps+FansUNIVERSITY OF HAWAII AT MANOA ENERGY BENCHMARK ANALYSIS
ECM IV ECM V
OTHERENERGY AUDIT and ELECTRICITY METER AVAILABLEOTHERStan Sherriff Multi Purpose Arena arena 10 1977 190,000 ▬ ▬ ▬ ▬ ▬ ▬ ▬ ▬ ▬ ▬ ▬ ▬ ▬ ▬ ▬ ▬ ▬ ▬ ▬ ▬ ▬ ▬ ▬ ▬ ▬ ▬ ▬ ▬ ▬ ▬ ▬ ▬ ▬ ▬ ▬Student Health B.D clinic 10 1963 10,793 ▬ ▬ ▬ ▬ ▬ ▬ ▬ ▬ ▬ ▬ ▬ ▬ ▬ ▬ ▬ ▬ ▬ ▬ ▬ ▬ ▬ ▬ ▬ ▬ ▬ ▬ ▬ ▬ ▬ ▬ ▬ ▬ ▬ ▬ ▬
Sub-TOTAL 200,793 ▬ ▬ ▬ ▬ ▬ ▬ ▬
ONLY ENERGY AUDIT AVAILABLENONE
200,793
ONLY ELECTRICITY METER AVAILABLEUH Baseball (Murakami Stadium) Stadium 1987 75,170UH Parking parking 1974 735,000
Sub-TOTAL 810,170
NO ELECTRICITY METER or ENERGY AUDIT AVAILABLECottages 1, 3 and 4 residential 1914 3,465College Hill residential 1963 10,220Waahila Ridge Housing residential 1944 80,478
Sub-TOTAL 94,163
TOTAL 1,105,126

ECO IV, V, VI & VIIAUDIT AUDIT AUDIT
Oper. Est. Energy Est. Cost Est. Construction Payback Est. Energy Est. Cost Est. Construction Payback Est. Energy Est. Cost Est. Construction Payback Est. Energy Est. Cost Est. Construction Payback Const. Const.Building Name Building Schd. Year- Area Savings (kWh/sf.ft. Savings ($/sq.ft. Costs ($/sq.ft. Savings (kWh/sf.ft. Savings ($/sq.ft. Costs ($/sq.ft. Savings (kWh/sf.ft. Savings ($/sq.ft. Costs ($/sq.ft. Savings (kWh/sf.ft. Savings ($/sq.ft. Costs ($/sq.ft. (kWh/sf.ft. ($/sq.ft. Cost Cost/sf. Payback
Type hr Built (sq.ft.) (kWh/year) -year) ($/year) -year) ($) -year) (year) (kWh/year) -year) ($/year) -year) ($) -year) (year) (kWh/year) -year) ($/year) -year) ($) -year) (year) (kWh/year) -year) ($/year) -year) ($) -year) (year) kWh/year -year) $/year -year) $ $/sq.ft. year
ECO IV, V, VI & VII Const CostECO IV, V, VI & VII SavingsAUDIT
ECM VI ECM VII
Chiller Retrofits Variable Speed Drive Utilization OTHER Motor Replacement with High Efficiency - Pumps+FansUNIVERSITY OF HAWAII AT MANOA ENERGY BENCHMARK ANALYSIS
ECM IV ECM V
STORAGEENERGY AUDIT and ELECTRICITY METER AVAILABLE
NONE
ONLY ENERGY AUDIT AVAILABLENONE
0
ONLY ELECTRICITY METER AVAILABLEEngineering Quad storage 1915 3,646
Sub-TOTAL 3,6463,646
NO ELECTRICITY METER or ENERGY AUDIT AVAILABLECooke Field storage 1982 4,160Warehouse storage 1963 25,445Warehouse Annexes storage 1963 1,0501171H Store Room storage 1977 3,210Cooke Field Equipment Storage storage 1979 4,160Motor Pool Maintenance storage 1983 1,400Football Storage storage 2000 2,400Maintenance Garage and Storage storage 1963 6,520
Sub-TOTAL 48,345
TOTAL 51,991
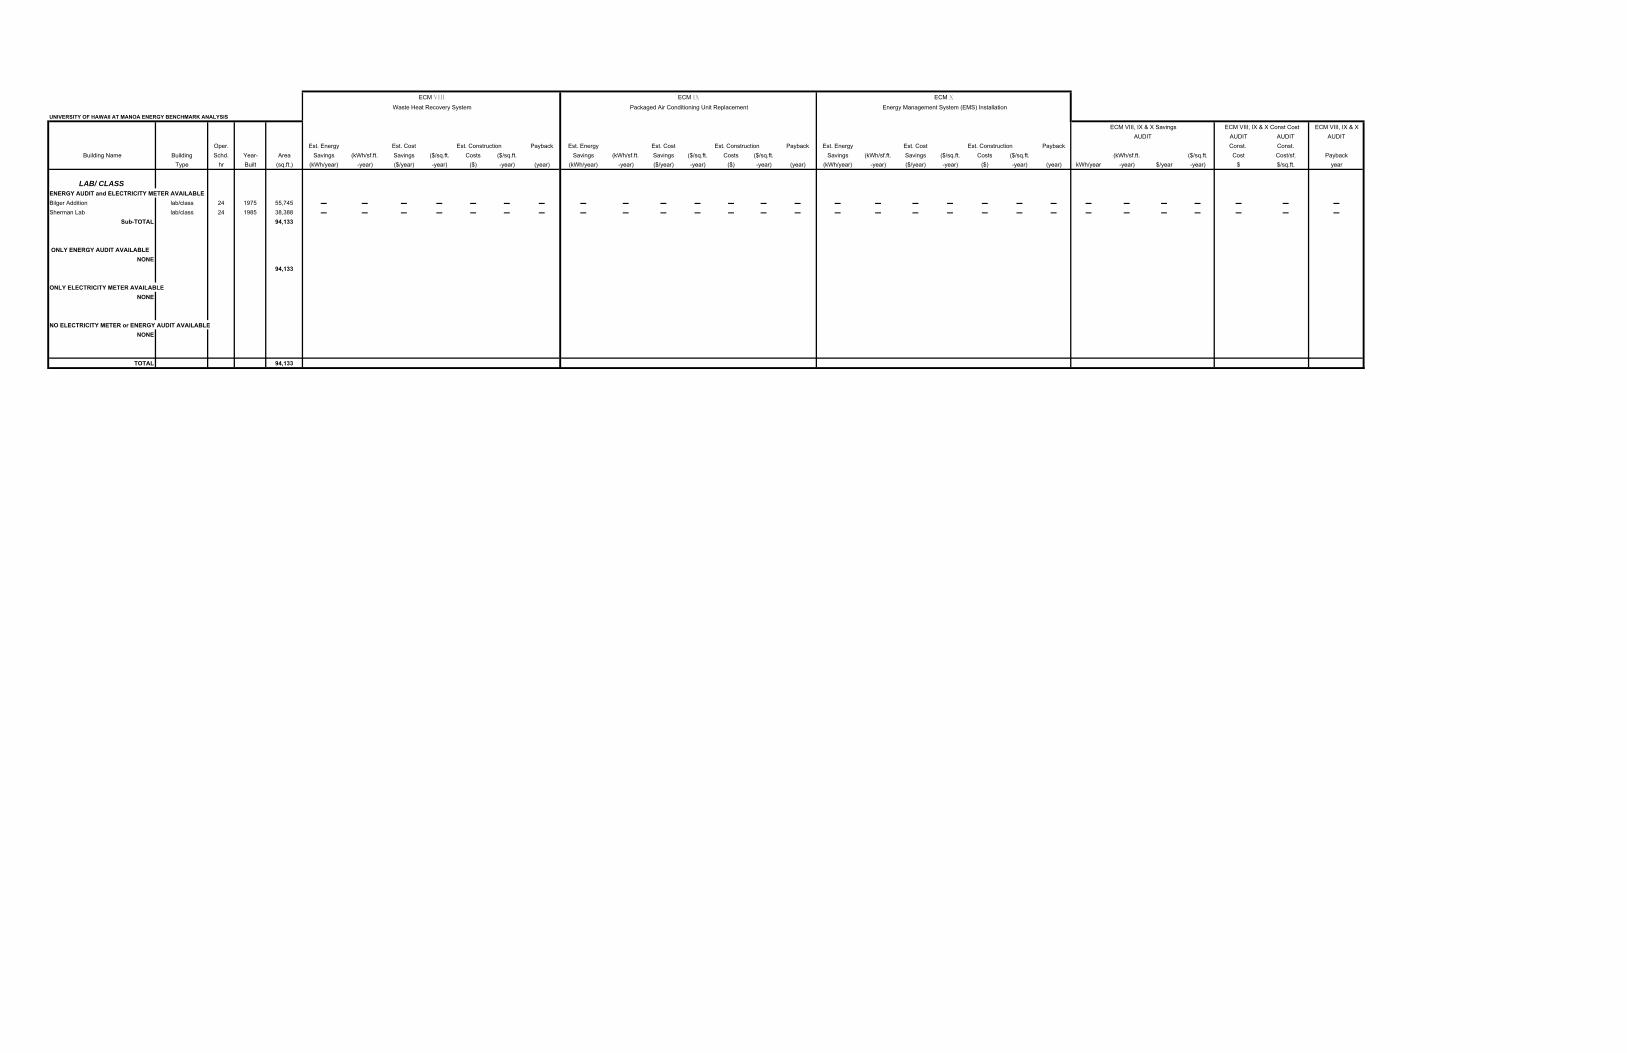
ECM VIII, IX & XAUDIT AUDIT AUDIT
Oper. Est. Energy Est. Cost Est. Construction Payback Est. Energy Est. Cost Est. Construction Payback Est. Energy Est. Cost Est. Construction Payback Const. Const.Building Name Building Schd. Year- Area Savings (kWh/sf.ft. Savings ($/sq.ft. Costs ($/sq.ft. Savings (kWh/sf.ft. Savings ($/sq.ft. Costs ($/sq.ft. Savings (kWh/sf.ft. Savings ($/sq.ft. Costs ($/sq.ft. (kWh/sf.ft. ($/sq.ft. Cost Cost/sf. Payback
Type hr Built (sq.ft.) (kWh/year) -year) ($/year) -year) ($) -year) (year) (kWh/year) -year) ($/year) -year) ($) -year) (year) (kWh/year) -year) ($/year) -year) ($) -year) (year) kWh/year -year) $/year -year) $ $/sq.ft. year
LAB/ CLASSENERGY AUDIT and ELECTRICITY METER AVAILABLEBilger Addition lab/class 24 1975 55,745 ▬ ▬ ▬ ▬ ▬ ▬ ▬ ▬ ▬ ▬ ▬ ▬ ▬ ▬ ▬ ▬ ▬ ▬ ▬ ▬ ▬ ▬ ▬ ▬ ▬ ▬ ▬ ▬Sherman Lab lab/class 24 1985 38,388 ▬ ▬ ▬ ▬ ▬ ▬ ▬ ▬ ▬ ▬ ▬ ▬ ▬ ▬ ▬ ▬ ▬ ▬ ▬ ▬ ▬ ▬ ▬ ▬ ▬ ▬ ▬ ▬
Sub-TOTAL 94,133
ONLY ENERGY AUDIT AVAILABLENONE
94,133
ONLY ELECTRICITY METER AVAILABLENONE
NO ELECTRICITY METER or ENERGY AUDIT AVAILABLENONE
TOTAL 94,133
ECM VIII, IX & X SavingsAUDIT
UNIVERSITY OF HAWAII AT MANOA ENERGY BENCHMARK ANALYSIS
Waste Heat Recovery System Packaged Air Conditioning Unit Replacement Energy Management System (EMS) Installation
ECM VIII
ECM VIII, IX & X Const Cost
ECM IX ECM X

ECM VIII, IX & XAUDIT AUDIT AUDIT
Oper. Est. Energy Est. Cost Est. Construction Payback Est. Energy Est. Cost Est. Construction Payback Est. Energy Est. Cost Est. Construction Payback Const. Const.Building Name Building Schd. Year- Area Savings (kWh/sf.ft. Savings ($/sq.ft. Costs ($/sq.ft. Savings (kWh/sf.ft. Savings ($/sq.ft. Costs ($/sq.ft. Savings (kWh/sf.ft. Savings ($/sq.ft. Costs ($/sq.ft. (kWh/sf.ft. ($/sq.ft. Cost Cost/sf. Payback
Type hr Built (sq.ft.) (kWh/year) -year) ($/year) -year) ($) -year) (year) (kWh/year) -year) ($/year) -year) ($) -year) (year) (kWh/year) -year) ($/year) -year) ($) -year) (year) kWh/year -year) $/year -year) $ $/sq.ft. year
ECM VIII, IX & X SavingsAUDIT
UNIVERSITY OF HAWAII AT MANOA ENERGY BENCHMARK ANALYSIS
Waste Heat Recovery System Packaged Air Conditioning Unit Replacement Energy Management System (EMS) Installation
ECM VIII
ECM VIII, IX & X Const Cost
ECM IX ECM X
LAB/ CLASS/ OFFICEENERGY AUDIT and ELECTRICITY METER AVAILABLEWatanabe Hall lab/class/office 24 1972 52,609 ▬ ▬ ▬ ▬ ▬ ▬ ▬ ▬ ▬ ▬ ▬ ▬ ▬ ▬ ▬ ▬ ▬ ▬ ▬ ▬ ▬ ▬ ▬ ▬ ▬ ▬ ▬ ▬Art Building lab/class/office 24 1974 65,020 ▬ ▬ ▬ ▬ ▬ ▬ ▬ ▬ ▬ ▬ ▬ ▬ ▬ ▬ ▬ ▬ ▬ ▬ ▬ ▬ ▬ ▬ ▬ ▬ ▬ ▬ ▬ ▬Holmes Hall lab/class/office 24 1972 93,016 ▬ ▬ ▬ ▬ ▬ ▬ ▬ ▬ ▬ ▬ ▬ ▬ ▬ ▬ ▬ ▬ ▬ ▬ ▬ ▬ ▬ ▬ ▬ ▬ ▬ ▬ ▬ ▬Bilger Hall lab/class/office 24 1952 51,750 ▬ ▬ ▬ ▬ ▬ ▬ ▬ ▬ ▬ ▬ ▬ ▬ ▬ ▬ ▬ ▬ ▬ ▬ ▬ ▬ ▬ ▬ ▬ ▬ ▬ ▬ ▬ ▬St.John Lab (Building A+B) lab/class/office 24 1967 101,300 ▬ ▬ ▬ ▬ ▬ ▬ ▬ ▬ ▬ ▬ ▬ ▬ ▬ ▬ ▬ ▬ ▬ ▬ ▬ ▬ ▬ ▬ ▬ ▬ ▬ ▬ ▬ ▬Snyder Hall lab/class/office 24 1962 51,000 ▬ ▬ ▬ ▬ ▬ ▬ ▬ ▬ ▬ ▬ ▬ ▬ ▬ ▬ ▬ ▬ ▬ ▬ ▬ ▬ ▬ ▬ ▬ ▬ ▬ ▬ ▬ ▬Post Buidling lab/class/office 24 1996 190,000 ▬ ▬ ▬ ▬ ▬ ▬ ▬ ▬ ▬ ▬ ▬ ▬ ▬ ▬ 419,348 8 40,677 0.77 0 0.00 0.00 419,348 2.21 40,677 0.21 0 0.00 0.0Geophysics. Inst. Buidling lab/class/office 24 1963 65,000 ▬ ▬ ▬ ▬ ▬ ▬ ▬ 133,782 2.06 12,977 0.20 121,333 1.87 9.35 ▬ ▬ ▬ ▬ ▬ ▬ ▬ 133,782 2.06 12,977 0.20 121,333 1.87 9.35Gilmore Hall lab/class/office 24 1978 64,500 ▬ ▬ ▬ ▬ ▬ ▬ ▬ ▬ ▬ ▬ ▬ ▬ ▬ ▬ 161,050 2 15,622 0.17 96,000 1.03 6.15 161,050 2.50 15,622 0.24 96,000 1.49 6.1Physical Science B.D lab/class/office 24 1960 42,873 ▬ ▬ ▬ ▬ ▬ ▬ ▬ ▬ ▬ ▬ ▬ ▬ ▬ ▬ ▬ ▬ ▬ ▬ ▬ ▬ ▬ ▬ ▬ ▬ ▬ ▬ ▬ ▬
Sub-TOTAL 777,068 133,782 0.172162539 12,977 0.0167 121,333 0.156142 9.34984973 580,398 0.74690761 56,299 0.0724505 96,000 0.1235413 1.7051813 714,180 0.92 69,276 0.09 217,333 0.28 3.1
ONLY ENERGY AUDIT AVAILABLEEdmonson Building lab/class/office 24 1963 43,840 ▬ ▬ ▬ ▬ ▬ ▬ ▬ ▬ ▬ ▬ ▬ ▬ ▬ ▬ ▬ ▬ ▬ ▬ ▬ ▬ ▬ ▬ ▬ ▬ ▬ ▬ ▬ ▬
Sub-TOTAL 43,840820,908
ONLY ELECTRICITY METER AVAILABLEHemmenway Hall lab/class/office 24 1939 34,326
Sub-TOTAL 34,326
NO ELECTRICITY METER or ENERGY AUDIT AVAILABLENONE
TOTAL 855,234 133,782 0.156427364 12,977 0.015174 121,333 0.141871 9.34984973 580,398 0.67864234 56,299 0.0658288 96,000 0.11225 1.7051813 714,180 0.84 69,276 0.08 217,333 0.25 3.14

ECM VIII, IX & XAUDIT AUDIT AUDIT
Oper. Est. Energy Est. Cost Est. Construction Payback Est. Energy Est. Cost Est. Construction Payback Est. Energy Est. Cost Est. Construction Payback Const. Const.Building Name Building Schd. Year- Area Savings (kWh/sf.ft. Savings ($/sq.ft. Costs ($/sq.ft. Savings (kWh/sf.ft. Savings ($/sq.ft. Costs ($/sq.ft. Savings (kWh/sf.ft. Savings ($/sq.ft. Costs ($/sq.ft. (kWh/sf.ft. ($/sq.ft. Cost Cost/sf. Payback
Type hr Built (sq.ft.) (kWh/year) -year) ($/year) -year) ($) -year) (year) (kWh/year) -year) ($/year) -year) ($) -year) (year) (kWh/year) -year) ($/year) -year) ($) -year) (year) kWh/year -year) $/year -year) $ $/sq.ft. year
ECM VIII, IX & X SavingsAUDIT
UNIVERSITY OF HAWAII AT MANOA ENERGY BENCHMARK ANALYSIS
Waste Heat Recovery System Packaged Air Conditioning Unit Replacement Energy Management System (EMS) Installation
ECM VIII
ECM VIII, IX & X Const Cost
ECM IX ECM X
OFFICE / LABENERGY AUDIT and ELECTRICITY METER AVAILABLEBiomedical Science Building office/lab 24 1967 120,678 ▬ ▬ ▬ ▬ ▬ ▬ ▬ ▬ ▬ ▬ ▬ ▬ ▬ ▬ ▬ ▬ ▬ ▬ ▬ ▬ ▬ ▬ ▬ ▬ ▬ ▬ ▬ ▬Astronomy Building 1012 A* office/labAstronomy Building 1012 B* office/lab 24 7,234 0.2 702 0.02 8,000 0.17 11.4 ▬ ▬ ▬ ▬ ▬ ▬ ▬ ▬ ▬ ▬ ▬ ▬ ▬ ▬ 7,234 0.16 702 0.02 8,000 0.17 11.4Astronomy Building 1012 C* office/labMarine Science Budiling office/lab 24 1984 99,082 ▬ ▬ ▬ ▬ ▬ ▬ ▬ ▬ ▬ ▬ ▬ ▬ ▬ ▬ 457,796 5 44,406 0.45 38,000 0.38 0.86 457,796 4.62 44,406 0.45 38,000 0.38 0.9
Sub-TOTAL 266,100 7,234 0.03 702 0.00 8,000 0.03 11.40 457,796 1.72 44,406 0.17 38,000 0.14 0.86 465,030 1.75 45,108 0.17 46,000 0.17 1.0
ENERGY AUDIT AVAILABLEBekesy Lab office/lab 24 1968 16,294 ▬ ▬ ▬ ▬ ▬ ▬ ▬ ▬ ▬ ▬ ▬ ▬ ▬ ▬ ▬ ▬ ▬ ▬ ▬ ▬ ▬ ▬ ▬ ▬ ▬ ▬ ▬ ▬
Sub-TOTAL 16,294282,394
ONLY ELECTRICITY METER AVAILABLEAgriculture Science office/lab 24 1998 85,000Gartley Hall* office/lab 1921 24,493Agriculture Engineering office/lab 24 1975 15,689Pope Lab office/lab 24 1972 37,500
Sub-TOTAL 162,682
NO ELECTRICITY METER or ENERGY AUDIT AVAILABLESmall Animal Care Facility office/lab 24 1977 5,242Magoon Facility office/lab 1,200Fruit Fly Lab* office/lab 1972 4,240Argonomy & Soil* office/lab 1968 6,593Food Science and Tech. office/lab 24 1951 9,281Horticulture Headhouse* office/lab 1976 4,749
Sub-TOTAL 31,305
TOTAL 476,381 7,234 0.02 702 0.00 8,000 0.02 11.40 457,796 0.96 44,406 0.09 38,000 0.08 0.86 465,030 0.98 45,108 0.09 46,000 0.10 1.02
* Energy Benchmark Redistributed by Campus Walkthrough
1976 46,340

ECM VIII, IX & XAUDIT AUDIT AUDIT
Oper. Est. Energy Est. Cost Est. Construction Payback Est. Energy Est. Cost Est. Construction Payback Est. Energy Est. Cost Est. Construction Payback Const. Const.Building Name Building Schd. Year- Area Savings (kWh/sf.ft. Savings ($/sq.ft. Costs ($/sq.ft. Savings (kWh/sf.ft. Savings ($/sq.ft. Costs ($/sq.ft. Savings (kWh/sf.ft. Savings ($/sq.ft. Costs ($/sq.ft. (kWh/sf.ft. ($/sq.ft. Cost Cost/sf. Payback
Type hr Built (sq.ft.) (kWh/year) -year) ($/year) -year) ($) -year) (year) (kWh/year) -year) ($/year) -year) ($) -year) (year) (kWh/year) -year) ($/year) -year) ($) -year) (year) kWh/year -year) $/year -year) $ $/sq.ft. year
ECM VIII, IX & X SavingsAUDIT
UNIVERSITY OF HAWAII AT MANOA ENERGY BENCHMARK ANALYSIS
Waste Heat Recovery System Packaged Air Conditioning Unit Replacement Energy Management System (EMS) Installation
ECM VIII
ECM VIII, IX & X Const Cost
ECM IX ECM X
CLASS/ OFFICEENERGY AUDIT and ELECTRICITY METER AVAILABLESpeech Pathology Bldg-171E* class/office 12 1976 7,615 ▬ ▬ ▬ ▬ ▬ ▬ ▬ ▬ ▬ ▬ ▬ ▬ ▬ ▬ ▬ ▬ ▬ ▬ ▬ ▬ ▬ ▬ ▬ ▬ ▬ ▬ ▬ ▬Keller Hall class/office 24 1959 49,193 ▬ ▬ ▬ ▬ ▬ ▬ ▬ ▬ ▬ ▬ ▬ ▬ ▬ ▬ ▬ ▬ ▬ ▬ ▬ ▬ ▬ ▬ ▬ ▬ ▬ ▬ ▬ ▬Business Admin. class/office 24 1972 129,143 ▬ ▬ ▬ ▬ ▬ ▬ ▬ ▬ ▬ ▬ ▬ ▬ ▬ ▬ ▬ ▬ ▬ ▬ ▬ ▬ ▬ ▬ ▬ ▬ ▬ ▬ ▬ ▬Architecture School class/office 24 1993 50,020 ▬ ▬ ▬ ▬ ▬ ▬ ▬ ▬ ▬ ▬ ▬ ▬ ▬ ▬ ▬ ▬ ▬ ▬ ▬ ▬ ▬ ▬ ▬ ▬ ▬ ▬ ▬ ▬Webster Hall class/office 24 1961 59,559 ▬ ▬ ▬ ▬ ▬ ▬ ▬ ▬ ▬ ▬ ▬ ▬ ▬ ▬ ▬ ▬ ▬ ▬ ▬ ▬ ▬ ▬ ▬ ▬ ▬ ▬ ▬ ▬Speech Pathology Bldg-171F* class/office 12 1976 6,650 ▬ ▬ ▬ ▬ ▬ ▬ ▬ ▬ ▬ ▬ ▬ ▬ ▬ ▬ ▬ ▬ ▬ ▬ ▬ ▬ ▬ ▬ ▬ ▬ ▬ ▬ ▬ ▬Sakamaki Hall class/office 12 1974 58,230 ▬ ▬ ▬ ▬ ▬ ▬ ▬ ▬ ▬ ▬ ▬ ▬ ▬ ▬ ▬ ▬ ▬ ▬ ▬ ▬ ▬ ▬ ▬ ▬ ▬ ▬ ▬ ▬Social Science class/office 15 1973 126,738 ▬ ▬ ▬ ▬ ▬ ▬ ▬ ▬ ▬ ▬ ▬ ▬ ▬ ▬ ▬ ▬ ▬ ▬ ▬ ▬ ▬ ▬ ▬ ▬ ▬ ▬ ▬ ▬Miller Hall* class/office 24 1939 19,273 ▬ ▬ ▬ ▬ ▬ ▬ ▬ ▬ ▬ ▬ ▬ ▬ ▬ ▬ ▬ ▬ ▬ ▬ ▬ ▬ ▬ ▬ ▬ ▬ ▬ ▬ ▬ ▬Physical Education class/office 10 1970 45,238 90,495 2.0 8,778 0.2 15,313 0.3 1.7 ▬ ▬ ▬ ▬ ▬ ▬ ▬ ▬ ▬ ▬ ▬ ▬ ▬ ▬ 90,495 2.00 8,778 0.19 15,313 0.34 1.7Moore Hall* class/office 24 1966 80,882 ▬ ▬ ▬ ▬ ▬ ▬ ▬ ▬ ▬ ▬ ▬ ▬ ▬ ▬ ▬ ▬ ▬ ▬ ▬ ▬ ▬ ▬ ▬ ▬ ▬ ▬ ▬ ▬Law School* class/office 24 1985 53,100 ▬ ▬ ▬ ▬ ▬ ▬ ▬ ▬ ▬ ▬ ▬ ▬ ▬ ▬ ▬ ▬ ▬ ▬ ▬ ▬ ▬ ▬ ▬ ▬ ▬ ▬ ▬ ▬Music Bldg #1 (1093A )* class/office 10 1959 5,840 ▬ ▬ ▬ ▬ ▬ ▬ ▬ ▬ ▬ ▬ ▬ ▬ ▬ ▬ ▬ ▬ ▬ ▬ ▬ ▬ ▬ ▬ ▬ ▬ ▬ ▬ ▬ ▬Kuykendall Hall class/office 10 1964 86,492 ▬ ▬ ▬ ▬ ▬ ▬ ▬ ▬ ▬ ▬ ▬ ▬ ▬ ▬ ▬ ▬ ▬ ▬ ▬ ▬ ▬ ▬ ▬ ▬ ▬ ▬ ▬ ▬Music Bldg #3 (1093C)* class/office 10 1959 1,950 ▬ ▬ ▬ ▬ ▬ ▬ ▬ ▬ ▬ ▬ ▬ ▬ ▬ ▬ ▬ ▬ ▬ ▬ ▬ ▬ ▬ ▬ ▬ ▬ ▬Music Bldg #2 (1093B)* class/office 10 1959 1,120 ▬ ▬ ▬ ▬ ▬ ▬ ▬ ▬ ▬ ▬ ▬ ▬ ▬ ▬ ▬ ▬ ▬ ▬ ▬ ▬ ▬ ▬ ▬ ▬ ▬ ▬ ▬ ▬Orvis Auditorium* class/office 10 1962 7,432 ▬ ▬ ▬ ▬ ▬ ▬ ▬ ▬ ▬ ▬ ▬ ▬ ▬ ▬ ▬ ▬ ▬ ▬ ▬ ▬ ▬ ▬ ▬ ▬ ▬ ▬ ▬ ▬
Sub-TOTAL 788,475 90,495 0.11 8,778 0.01 15,313 0.02 1.74 90,495 0.11 8,778 0.01 15,313 0.02 1.7
ONLY ENERGY AUDIT AVAILABLENONE
788,475
ONLY ELECTRICITY METER AVAILABLEWist Hall class/office 1930 24,591Wist Hall Annex Addition class/office 1979 20,625University High School #3* class/office 1957 27,241Wist Annex 1, University High S. 1 & 2* class/office 1943 26,292Burns Hall class/office 55,000George Hall class/office 1922 47,761Hawaiian Studies class/office 1996 22,100Dean Hall* class/office 1989 18,764Lincoln Hall class/office 1959 43,538Jefferson Hall class/office 1963 61,558Klum Gym. class/office 1958 23,884Spalding Hall class/office 1961 33,012Crawford Hall class/office 1938 24,663New Music Building class/office 1973 49,970Dance Building* class/office 1978 4,188Kennedy Theatre class/office 1963 46,752
Sub-TOTAL 529,939
NO ELECTRICITY METER or ENERGY AUDIT AVAILABLEEast West Building # 1,5,6,3,7 class/office 1977 5,1501881 East West PB # 1,2 class/office 1995 8,000University Elementary School* class/office 1939 20,099Makai Campus Portable Classrooms class/office 1977 4,100Lunalili Freeway Building 2 class/office 1977 1,773Newman Center* class/office 4,000Castle Memorial* class/office 1941 28,484
Sub-TOTAL 71,606
TOTAL 1,390,020 90,495 0.07 8,778 0.01 15,313 0.01 1.74 90,495 0.07 8,778 0.01 15,313 0.01 1.74
* Energy Benchmark Redistributed by Campus Walkthrough

ECM VIII, IX & XAUDIT AUDIT AUDIT
Oper. Est. Energy Est. Cost Est. Construction Payback Est. Energy Est. Cost Est. Construction Payback Est. Energy Est. Cost Est. Construction Payback Const. Const.Building Name Building Schd. Year- Area Savings (kWh/sf.ft. Savings ($/sq.ft. Costs ($/sq.ft. Savings (kWh/sf.ft. Savings ($/sq.ft. Costs ($/sq.ft. Savings (kWh/sf.ft. Savings ($/sq.ft. Costs ($/sq.ft. (kWh/sf.ft. ($/sq.ft. Cost Cost/sf. Payback
Type hr Built (sq.ft.) (kWh/year) -year) ($/year) -year) ($) -year) (year) (kWh/year) -year) ($/year) -year) ($) -year) (year) (kWh/year) -year) ($/year) -year) ($) -year) (year) kWh/year -year) $/year -year) $ $/sq.ft. year
ECM VIII, IX & X SavingsAUDIT
UNIVERSITY OF HAWAII AT MANOA ENERGY BENCHMARK ANALYSIS
Waste Heat Recovery System Packaged Air Conditioning Unit Replacement Energy Management System (EMS) Installation
ECM VIII
ECM VIII, IX & X Const Cost
ECM IX ECM X
OFFICEENERGY AUDIT and ELECTRICITY METER AVAILABLEStudent Services Center office 24 1994 80,000 ▬ ▬ ▬ ▬ ▬ ▬ ▬ ▬ ▬ ▬ ▬ ▬ ▬ ▬ ▬ ▬ ▬ ▬ ▬ ▬ ▬ ▬ ▬ ▬ ▬ ▬ ▬ ▬Bachman Hall and Annexes office 12 1977 28,070 ▬ ▬ ▬ ▬ ▬ ▬ ▬ ▬ ▬ ▬ ▬ ▬ ▬ ▬ ▬ ▬ ▬ ▬ ▬ ▬ ▬ ▬ ▬ ▬ ▬ ▬ ▬ ▬Sinclair Hall office 12 1956 3,687 ▬ ▬ ▬ ▬ ▬ ▬ ▬ ▬ ▬ ▬ ▬ ▬ ▬ ▬ ▬ ▬ ▬ ▬ ▬ ▬ ▬ ▬ ▬ ▬ ▬ ▬ ▬ ▬Henke Hall office 10 1957 20,686 ▬ ▬ ▬ ▬ ▬ ▬ ▬ ▬ ▬ ▬ ▬ ▬ ▬ ▬ ▬ ▬ ▬ ▬ ▬ ▬ ▬ ▬ ▬ ▬ ▬ ▬ ▬ ▬
Sub-TOTAL 132,443 ▬ ▬ ▬ ▬ ▬ ▬ ▬
ONLY ENERGY AUDIT AVAILABLE
Krauss Hall and Annexes 1 & 2 office 14 1971 21,611 ▬ ▬ ▬ ▬ ▬ ▬ ▬ ▬ ▬ ▬ ▬ ▬ ▬ ▬ ▬ ▬ ▬ ▬ ▬ ▬ ▬ ▬ ▬ ▬ ▬ ▬ ▬ ▬ROTC Building office 10 1992 5,178 ▬ ▬ ▬ ▬ ▬ ▬ ▬ ▬ ▬ ▬ ▬ ▬ ▬ ▬ ▬ ▬ ▬ ▬ ▬ ▬ ▬ ▬ ▬ ▬ ▬ ▬ ▬ ▬
Sub-TOTAL 26,789159,232
ONLY ELECTRICITY METER AVAILABLEWeather Bureau office 1963 22,000Building 37 office 1931 3,655Center for Korean Studies office 1980 16,569Engineering Quad A+B office 1928 7,007Bilger Annex # 1 & 2 office 1971 3,624
Sub-TOTAL 52,855
NO ELECTRICITY METER or ENERGY AUDIT AVAILABLEMakai Campus Portable offices office 1977 12,430Hawaii Hall office 1912 36,849Financial Management B office 1992 710Financial Management C office 1922 710Fiscal Service A office 1992 710Fiscal Service Office office 1977 1,303PPMO/Accounting office 1977 7,945Contracts and Grants office 1977 1,470Keypunch Section office 1977 1,295Lunalili Freeway Building 1 office 1977 1,757Lower Campus Portables office 1976 7,768Air Force ROTC office 1977 3,769National Marine Fisheries Srvc Office 4,100Lincoln Annexes 1&2 office 1971 3,530Physical Plant Annex # 1, 2 office 1970 3,880Physical Plant Building office 1963 4,302Maile Way Annexes office 1967 1,859Campus Security office 1977 1,741Diving Safety Program office 700Environmental Health and Safety Office office 1995 2,530Landscaping* office 400Transportation Service* office 1984 1,400Environmental Protection Service office 1,300Federal Credit Union office 1914 1,309Energy House* office 1978 1,800Maintenance Service Building* office 1970 3,900Parasitology Lab office 1930 1,816Castle Memorial Caretakers Cottage* office 1941 1,678Miller Hall Annex office 1948 1,348High School Locker Building* office 1959 2,436Center for Student Development office 1952 13,733Castle Annex* office 1945 3,488UH Press office 1977 12,536KITV office 1973 20,803Dole St. Offices office 1940 7,400Frear office 1952 32,711University Avenue Annexes office 1977 6,994
Sub-TOTAL 214,410
TOTAL 426,497
* Energy Benchmark Redistributed by Campus Walkthrough
** Building year data was not available, the listed date is astimate.
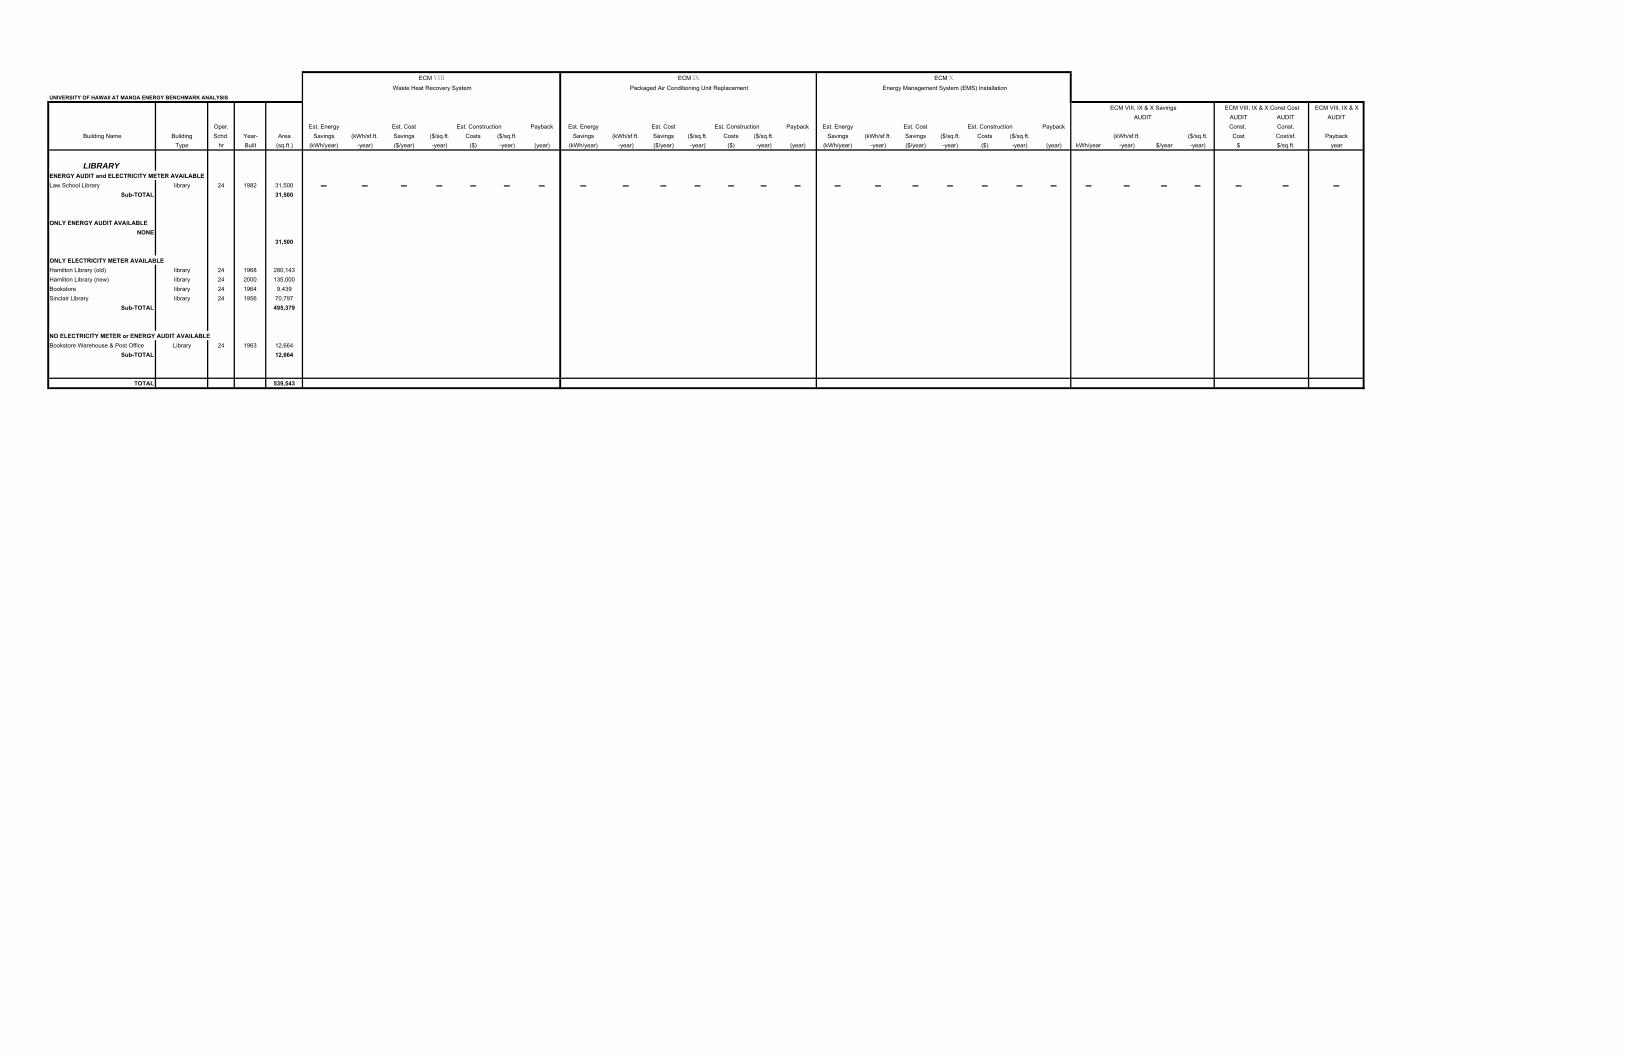
ECM VIII, IX & XAUDIT AUDIT AUDIT
Oper. Est. Energy Est. Cost Est. Construction Payback Est. Energy Est. Cost Est. Construction Payback Est. Energy Est. Cost Est. Construction Payback Const. Const.Building Name Building Schd. Year- Area Savings (kWh/sf.ft. Savings ($/sq.ft. Costs ($/sq.ft. Savings (kWh/sf.ft. Savings ($/sq.ft. Costs ($/sq.ft. Savings (kWh/sf.ft. Savings ($/sq.ft. Costs ($/sq.ft. (kWh/sf.ft. ($/sq.ft. Cost Cost/sf. Payback
Type hr Built (sq.ft.) (kWh/year) -year) ($/year) -year) ($) -year) (year) (kWh/year) -year) ($/year) -year) ($) -year) (year) (kWh/year) -year) ($/year) -year) ($) -year) (year) kWh/year -year) $/year -year) $ $/sq.ft. year
ECM VIII, IX & X SavingsAUDIT
UNIVERSITY OF HAWAII AT MANOA ENERGY BENCHMARK ANALYSIS
Waste Heat Recovery System Packaged Air Conditioning Unit Replacement Energy Management System (EMS) Installation
ECM VIII
ECM VIII, IX & X Const Cost
ECM IX ECM X
LIBRARYENERGY AUDIT and ELECTRICITY METER AVAILABLELaw School Library library 24 1982 31,500 ▬ ▬ ▬ ▬ ▬ ▬ ▬ ▬ ▬ ▬ ▬ ▬ ▬ ▬ ▬ ▬ ▬ ▬ ▬ ▬ ▬ ▬ ▬ ▬ ▬ ▬ ▬ ▬
Sub-TOTAL 31,500
ONLY ENERGY AUDIT AVAILABLENONE
31,500
ONLY ELECTRICITY METER AVAILABLEHamilton Library (old) library 24 1968 280,143Hamilton Library (new) library 24 2000 135,000Bookstore library 24 1964 9,439Sinclair Library library 24 1956 70,797
Sub-TOTAL 495,379
NO ELECTRICITY METER or ENERGY AUDIT AVAILABLEBookstore Warehouse & Post Office Library 24 1963 12,664
Sub-TOTAL 12,664
TOTAL 539,543

ECM VIII, IX & XAUDIT AUDIT AUDIT
Oper. Est. Energy Est. Cost Est. Construction Payback Est. Energy Est. Cost Est. Construction Payback Est. Energy Est. Cost Est. Construction Payback Const. Const.Building Name Building Schd. Year- Area Savings (kWh/sf.ft. Savings ($/sq.ft. Costs ($/sq.ft. Savings (kWh/sf.ft. Savings ($/sq.ft. Costs ($/sq.ft. Savings (kWh/sf.ft. Savings ($/sq.ft. Costs ($/sq.ft. (kWh/sf.ft. ($/sq.ft. Cost Cost/sf. Payback
Type hr Built (sq.ft.) (kWh/year) -year) ($/year) -year) ($) -year) (year) (kWh/year) -year) ($/year) -year) ($) -year) (year) (kWh/year) -year) ($/year) -year) ($) -year) (year) kWh/year -year) $/year -year) $ $/sq.ft. year
ECM VIII, IX & X SavingsAUDIT
UNIVERSITY OF HAWAII AT MANOA ENERGY BENCHMARK ANALYSIS
Waste Heat Recovery System Packaged Air Conditioning Unit Replacement Energy Management System (EMS) Installation
ECM VIII
ECM VIII, IX & X Const Cost
ECM IX ECM X
DORMITORYENERGY AUDIT and ELECTRICITY METER AVAILABLE
NONE
ONLY ENERGY AUDIT AVAILABLENONE
0
ONLY ELECTRICITY METER AVAILABLELaulima dorm 1968 38,446Kahawaii dorm 1963 37,578Gateway dorm 1963 65,283Johnson Hall A dorm 1962 26,830Johnson Hall B dorm 1958 22,951Hale Aloha Lahua dorm 1978 71,381Hale Aloha Ilima dorm 1977 71,315Hale Aloha Mokihana dorm 1978 71,315Hale Aloha Lokelani dorm 1978 71,381Neolani dorm 1978 107,800Wainani dorm 1978 203,361Hale Kuahine dorm 1963 31,752Hale Manoa dorm 1963 152,651
Sub-TOTAL 972,044
NO ELECTRICITY METER or ENERGY AUDIT AVAILABLEHale Anuenue dorm 1963 12,664
Sub-TOTAL 12,664
TOTAL 984,708

ECM VIII, IX & XAUDIT AUDIT AUDIT
Oper. Est. Energy Est. Cost Est. Construction Payback Est. Energy Est. Cost Est. Construction Payback Est. Energy Est. Cost Est. Construction Payback Const. Const.Building Name Building Schd. Year- Area Savings (kWh/sf.ft. Savings ($/sq.ft. Costs ($/sq.ft. Savings (kWh/sf.ft. Savings ($/sq.ft. Costs ($/sq.ft. Savings (kWh/sf.ft. Savings ($/sq.ft. Costs ($/sq.ft. (kWh/sf.ft. ($/sq.ft. Cost Cost/sf. Payback
Type hr Built (sq.ft.) (kWh/year) -year) ($/year) -year) ($) -year) (year) (kWh/year) -year) ($/year) -year) ($) -year) (year) (kWh/year) -year) ($/year) -year) ($) -year) (year) kWh/year -year) $/year -year) $ $/sq.ft. year
ECM VIII, IX & X SavingsAUDIT
UNIVERSITY OF HAWAII AT MANOA ENERGY BENCHMARK ANALYSIS
Waste Heat Recovery System Packaged Air Conditioning Unit Replacement Energy Management System (EMS) Installation
ECM VIII
ECM VIII, IX & X Const Cost
ECM IX ECM X
FOOD/FACILITY/OFFICEENERGY AUDIT and ELECTRICITY METER AVAILABLEFOOD/FACILITY/OFFICEAuxilary Services Buidling food/faclty/offc 24 1962 12,652 ▬ ▬ ▬ ▬ ▬ ▬ ▬ 48,462 3.83 4,701 0.37 40,958 3.24 8.71 ▬ ▬ ▬ ▬ ▬ ▬ ▬ 48,462 3.83 4,701 0.37 40,958 3.24 8.7
Sub-TOTAL 12,652 48,462 3.83 4,701 0.37 40,958 3.24 8.71 48,462 3.83 4,701 0.37 40,958 3.24 8.7
ONLY ENERGY AUDIT AVAILABLENONE
12,652
ONLY ELECTRICITY METER AVAILABLECampus Center food/faclty/offc 1974 133,342Gateway Café food/faclty/offc 1963 10,000Café Hale Aloha food/faclty/offc 1978 20,665Paradise Palm food/faclty/offc 1964 9,439Multipurpose Building food/faclty/offc 1963 12,664
Sub-TOTAL 186,110
TOTAL 198,762 48,462 0.24 4,701 0.02 40,958 0.21 8.71 48,462 0.24 4,701 0.02 40,958 0.21 8.71

ECM VIII, IX & XAUDIT AUDIT AUDIT
Oper. Est. Energy Est. Cost Est. Construction Payback Est. Energy Est. Cost Est. Construction Payback Est. Energy Est. Cost Est. Construction Payback Const. Const.Building Name Building Schd. Year- Area Savings (kWh/sf.ft. Savings ($/sq.ft. Costs ($/sq.ft. Savings (kWh/sf.ft. Savings ($/sq.ft. Costs ($/sq.ft. Savings (kWh/sf.ft. Savings ($/sq.ft. Costs ($/sq.ft. (kWh/sf.ft. ($/sq.ft. Cost Cost/sf. Payback
Type hr Built (sq.ft.) (kWh/year) -year) ($/year) -year) ($) -year) (year) (kWh/year) -year) ($/year) -year) ($) -year) (year) (kWh/year) -year) ($/year) -year) ($) -year) (year) kWh/year -year) $/year -year) $ $/sq.ft. year
ECM VIII, IX & X SavingsAUDIT
UNIVERSITY OF HAWAII AT MANOA ENERGY BENCHMARK ANALYSIS
Waste Heat Recovery System Packaged Air Conditioning Unit Replacement Energy Management System (EMS) Installation
ECM VIII
ECM VIII, IX & X Const Cost
ECM IX ECM X
OTHERENERGY AUDIT and ELECTRICITY METER AVAILABLEOTHERStan Sherriff Multi Purpose Arena arena 10 1977 190,000 ▬ ▬ ▬ ▬ ▬ ▬ ▬ ▬ ▬ ▬ ▬ ▬ ▬ ▬ ▬ ▬ ▬ ▬ ▬ ▬ ▬ ▬ ▬ ▬ ▬ ▬ ▬ ▬Student Health B.D clinic 10 1963 10,793 ▬ ▬ ▬ ▬ ▬ ▬ ▬ ▬ ▬ ▬ ▬ ▬ ▬ ▬ ▬ ▬ ▬ ▬ ▬ ▬ ▬ ▬ ▬ ▬ ▬ ▬ ▬ ▬
Sub-TOTAL 200,793 ▬ ▬ ▬ ▬ ▬ ▬ ▬
ONLY ENERGY AUDIT AVAILABLENONE
200,793
ONLY ELECTRICITY METER AVAILABLEUH Baseball (Murakami Stadium) Stadium 1987 75,170UH Parking parking 1974 735,000
Sub-TOTAL 810,170
NO ELECTRICITY METER or ENERGY AUDIT AVAILABLECottages 1, 3 and 4 residential 1914 3,465College Hill residential 1963 10,220Waahila Ridge Housing residential 1944 80,478
Sub-TOTAL 94,163
TOTAL 1,105,126

ECM VIII, IX & XAUDIT AUDIT AUDIT
Oper. Est. Energy Est. Cost Est. Construction Payback Est. Energy Est. Cost Est. Construction Payback Est. Energy Est. Cost Est. Construction Payback Const. Const.Building Name Building Schd. Year- Area Savings (kWh/sf.ft. Savings ($/sq.ft. Costs ($/sq.ft. Savings (kWh/sf.ft. Savings ($/sq.ft. Costs ($/sq.ft. Savings (kWh/sf.ft. Savings ($/sq.ft. Costs ($/sq.ft. (kWh/sf.ft. ($/sq.ft. Cost Cost/sf. Payback
Type hr Built (sq.ft.) (kWh/year) -year) ($/year) -year) ($) -year) (year) (kWh/year) -year) ($/year) -year) ($) -year) (year) (kWh/year) -year) ($/year) -year) ($) -year) (year) kWh/year -year) $/year -year) $ $/sq.ft. year
ECM VIII, IX & X SavingsAUDIT
UNIVERSITY OF HAWAII AT MANOA ENERGY BENCHMARK ANALYSIS
Waste Heat Recovery System Packaged Air Conditioning Unit Replacement Energy Management System (EMS) Installation
ECM VIII
ECM VIII, IX & X Const Cost
ECM IX ECM X
STORAGEENERGY AUDIT and ELECTRICITY METER AVAILABLE
NONE
ONLY ENERGY AUDIT AVAILABLENONE
0
ONLY ELECTRICITY METER AVAILABLEEngineering Quad storage 1915 3,646
Sub-TOTAL 3,6463,646
NO ELECTRICITY METER or ENERGY AUDIT AVAILABLECooke Field storage 1982 4,160Warehouse storage 1963 25,445Warehouse Annexes storage 1963 1,0501171H Store Room storage 1977 3,210Cooke Field Equipment Storage storage 1979 4,160Motor Pool Maintenance storage 1983 1,400Football Storage storage 2000 2,400Maintenance Garage and Storage storage 1963 6,520
Sub-TOTAL 48,345
TOTAL 51,991

ECM XI, XII, XIII & XIV AUDIT AUDIT AUDIT
Oper. Est. Energy Est. Cost Est. Construction Payback Est. Energy Est. Cost Est. Construction Payback Est. Energy Est. Cost Est. Construction Payback Est. Energy Est. Cost Est. Construction Payback Const. Const.Building Name Building Schd. Year- Area Savings (kWh/sf.ft. Savings ($/sq.ft. Costs ($/sq.ft. Savings (kWh/sf.ft. Savings ($/sq.ft. Costs ($/sq.ft. Savings (kWh/sf.ft. Savings ($/sq.ft. Costs ($/sq.ft. Savings (kWh/sf.ft. Savings ($/sq.ft. Costs ($/sq.ft. (kWh/sf.ft. ($/sq.ft. Cost Cost/sf. Payback
Type hr Built (sq.ft.) (kWh/year) -year) ($/year) -year) ($) -year) (year) (kWh/year) -year) ($/year) -year) ($) -year) (year) (kWh/year) -year) ($/year) -year) ($) -year) (year) (kWh/year) -year) ($/year) -year) ($) -year) (year) kWh/year -year) $/year -year) $ $/sq.ft. year
LAB/ CLASSENERGY AUDIT and ELECTRICITY METER AVAILABLEBilger Addition lab/class 24 1975 55,745 ▬ ▬ ▬ ▬ ▬ ▬ ▬ ▬ ▬ ▬ ▬ ▬ ▬ ▬ ▬ ▬ ▬ ▬ ▬ ▬ ▬ ▬ ▬ ▬ ▬ ▬ ▬ ▬ ▬ ▬ ▬ ▬ ▬ ▬ ▬Sherman Lab lab/class 24 1985 38,388 ▬ ▬ ▬ ▬ ▬ ▬ ▬ ▬ ▬ ▬ ▬ ▬ ▬ ▬ ▬ ▬ ▬ ▬ ▬ ▬ ▬ ▬ ▬ ▬ ▬ ▬ ▬ ▬ ▬ ▬ ▬ ▬ ▬ ▬ ▬
Sub-TOTAL 94,133
ONLY ENERGY AUDIT AVAILABLENONE
94,133
ONLY ELECTRICITY METER AVAILABLENONE
NO ELECTRICITY METER or ENERGY AUDIT AVAILABLENONE
TOTAL 94,133
ECM XI, XII, XIII & XIV Const CostECM XI, XII, XIII & XIV Savings
Repair VAV Control System Install outside-air carbon dioxide sensors controlling outside-air dampers
ECM XIII ECM XIV
UNIVERSITY OF HAWAII AT MANOA ENERGY BENCHMARK ANALYSIS
ECM XI
AUDIT
ECM XII
Insulation Installation Convert Constant-Volume to VAV system

ECM XI, XII, XIII & XIV AUDIT AUDIT AUDIT
Oper. Est. Energy Est. Cost Est. Construction Payback Est. Energy Est. Cost Est. Construction Payback Est. Energy Est. Cost Est. Construction Payback Est. Energy Est. Cost Est. Construction Payback Const. Const.Building Name Building Schd. Year- Area Savings (kWh/sf.ft. Savings ($/sq.ft. Costs ($/sq.ft. Savings (kWh/sf.ft. Savings ($/sq.ft. Costs ($/sq.ft. Savings (kWh/sf.ft. Savings ($/sq.ft. Costs ($/sq.ft. Savings (kWh/sf.ft. Savings ($/sq.ft. Costs ($/sq.ft. (kWh/sf.ft. ($/sq.ft. Cost Cost/sf. Payback
Type hr Built (sq.ft.) (kWh/year) -year) ($/year) -year) ($) -year) (year) (kWh/year) -year) ($/year) -year) ($) -year) (year) (kWh/year) -year) ($/year) -year) ($) -year) (year) (kWh/year) -year) ($/year) -year) ($) -year) (year) kWh/year -year) $/year -year) $ $/sq.ft. year
ECM XI, XII, XIII & XIV Const CostECM XI, XII, XIII & XIV Savings
Repair VAV Control System Install outside-air carbon dioxide sensors controlling outside-air dampers
ECM XIII ECM XIV
UNIVERSITY OF HAWAII AT MANOA ENERGY BENCHMARK ANALYSIS
ECM XI
AUDIT
ECM XII
Insulation Installation Convert Constant-Volume to VAV system
LAB/ CLASS/ OFFICEENERGY AUDIT and ELECTRICITY METER AVAILABLEWatanabe Hall lab/class/office 24 1972 52,609 ▬ ▬ ▬ ▬ ▬ ▬ ▬ ▬ ▬ ▬ ▬ ▬ ▬ ▬ ▬ ▬ ▬ ▬ ▬ ▬ ▬ ▬ ▬ ▬ ▬ ▬ ▬ ▬ ▬ ▬ ▬ ▬ ▬ ▬ ▬Art Building lab/class/office 24 1974 65,020 ▬ ▬ ▬ ▬ ▬ ▬ ▬ ▬ ▬ ▬ ▬ ▬ ▬ ▬ ▬ ▬ ▬ ▬ ▬ ▬ ▬ ▬ ▬ ▬ ▬ ▬ ▬ ▬ ▬ ▬ ▬ ▬ ▬ ▬ ▬Holmes Hall lab/class/office 24 1972 93,016 ▬ ▬ ▬ ▬ ▬ ▬ ▬ ▬ ▬ ▬ ▬ ▬ ▬ ▬ ▬ ▬ ▬ ▬ ▬ ▬ ▬ ▬ ▬ ▬ ▬ ▬ ▬ ▬ ▬ ▬ ▬ ▬ ▬ ▬ ▬Bilger Hall lab/class/office 24 1952 51,750 ▬ ▬ ▬ ▬ ▬ ▬ ▬ ▬ ▬ ▬ ▬ ▬ ▬ ▬ ▬ ▬ ▬ ▬ ▬ ▬ ▬ ▬ ▬ ▬ ▬ ▬ ▬ ▬ ▬ ▬ ▬ ▬ ▬ ▬ ▬St.John Lab (Building A+B) lab/class/office 24 1967 101,300 ▬ ▬ ▬ ▬ ▬ ▬ ▬ ▬ ▬ ▬ ▬ ▬ ▬ ▬ ▬ ▬ ▬ ▬ ▬ ▬ ▬ ▬ ▬ ▬ ▬ ▬ ▬ ▬ ▬ ▬ ▬ ▬ ▬ ▬ ▬Snyder Hall lab/class/office 24 1962 51,000 145,065 2.84 14,071 0.28 116,621 2.29 8.29 ▬ ▬ ▬ ▬ ▬ ▬ ▬ ▬ ▬ ▬ ▬ ▬ ▬ ▬ ▬ ▬ ▬ ▬ ▬ ▬ ▬ 145,065 2.84 14,071 0.28 116,621 2.29 8.29Post Buidling lab/class/office 24 1996 190,000 ▬ ▬ ▬ ▬ ▬ ▬ ▬ ▬ ▬ ▬ ▬ ▬ ▬ ▬ ▬ ▬ ▬ ▬ ▬ ▬ ▬ ▬ ▬ ▬ ▬ ▬ ▬ ▬ ▬ ▬ ▬ ▬ ▬ ▬ ▬Geophysics. Inst. Buidling lab/class/office 24 1963 65,000 ▬ ▬ ▬ ▬ ▬ ▬ ▬ ▬ ▬ ▬ ▬ ▬ ▬ ▬ ▬ ▬ ▬ ▬ ▬ ▬ ▬ ▬ ▬ ▬ ▬ ▬ ▬ ▬ ▬ ▬ ▬ ▬ ▬ ▬ ▬Gilmore Hall lab/class/office 24 1978 64,500 ▬ ▬ ▬ ▬ ▬ ▬ ▬ ▬ ▬ ▬ ▬ ▬ ▬ ▬ ▬ ▬ ▬ ▬ ▬ ▬ ▬ ▬ ▬ ▬ ▬ ▬ ▬ ▬ ▬ ▬ ▬ ▬ ▬ ▬ ▬Physical Science B.D lab/class/office 24 1960 42,873 ▬ ▬ ▬ ▬ ▬ ▬ ▬ ▬ ▬ ▬ ▬ ▬ ▬ ▬ ▬ ▬ ▬ ▬ ▬ ▬ ▬ ▬ ▬ ▬ ▬ ▬ ▬ ▬ ▬ ▬ ▬ ▬ ▬ ▬ ▬
Sub-TOTAL 777,068 145,065 0.19 14,071 0.02 116,621 0.15 8.29 145,065 0.22 14,071 0.02 116,621 0.18 8.29
ONLY ENERGY AUDIT AVAILABLEEdmonson Building lab/class/office 24 1963 43,840 197,249 3.06 19,133 0.30 124,800 1.93 6.52 ▬ ▬ ▬ ▬ ▬ ▬ ▬ ▬ ▬ ▬ ▬ ▬ ▬ ▬ ▬ ▬ ▬ ▬ ▬ ▬ ▬ 197,249 4.50 19,133 0.44 124,800 2.85 6.52
Sub-TOTAL 43,840 197,249 3.06 19,133 0.30 124,800 1.93 6.52 197,249 4.50 19,133 0.44 124,800 2.85 6.52820,908
ONLY ELECTRICITY METER AVAILABLEHemmenway Hall lab/class/office 24 1939 34,326
Sub-TOTAL 34,326
NO ELECTRICITY METER or ENERGY AUDIT AVAILABLENONE
TOTAL 855,234 342,314 0.40 33,204 0.04 241,421 0.28 7.27 342,314 0.40 33,204 0.04 241,421 0.28 7.27

ECM XI, XII, XIII & XIV AUDIT AUDIT AUDIT
Oper. Est. Energy Est. Cost Est. Construction Payback Est. Energy Est. Cost Est. Construction Payback Est. Energy Est. Cost Est. Construction Payback Est. Energy Est. Cost Est. Construction Payback Const. Const.Building Name Building Schd. Year- Area Savings (kWh/sf.ft. Savings ($/sq.ft. Costs ($/sq.ft. Savings (kWh/sf.ft. Savings ($/sq.ft. Costs ($/sq.ft. Savings (kWh/sf.ft. Savings ($/sq.ft. Costs ($/sq.ft. Savings (kWh/sf.ft. Savings ($/sq.ft. Costs ($/sq.ft. (kWh/sf.ft. ($/sq.ft. Cost Cost/sf. Payback
Type hr Built (sq.ft.) (kWh/year) -year) ($/year) -year) ($) -year) (year) (kWh/year) -year) ($/year) -year) ($) -year) (year) (kWh/year) -year) ($/year) -year) ($) -year) (year) (kWh/year) -year) ($/year) -year) ($) -year) (year) kWh/year -year) $/year -year) $ $/sq.ft. year
ECM XI, XII, XIII & XIV Const CostECM XI, XII, XIII & XIV Savings
Repair VAV Control System Install outside-air carbon dioxide sensors controlling outside-air dampers
ECM XIII ECM XIV
UNIVERSITY OF HAWAII AT MANOA ENERGY BENCHMARK ANALYSIS
ECM XI
AUDIT
ECM XII
Insulation Installation Convert Constant-Volume to VAV system
OFFICE / LABENERGY AUDIT and ELECTRICITY METER AVAILABLEBiomedical Science Building office/lab 24 1967 120,678 ▬ ▬ ▬ ▬ ▬ ▬ ▬ ▬ ▬ ▬ ▬ ▬ ▬ ▬ ▬ ▬ ▬ ▬ ▬ ▬ ▬ ▬ ▬ ▬ ▬ ▬ ▬ ▬ ▬ ▬ ▬ ▬ ▬ ▬ ▬Astronomy Building 1012 A* office/labAstronomy Building 1012 B* office/lab 24 ▬ ▬ ▬ ▬ ▬ ▬ ▬ ▬ ▬ ▬ ▬ ▬ ▬ ▬ ▬ ▬ ▬ ▬ ▬ ▬ ▬ ▬ ▬ ▬ ▬ ▬ ▬ ▬ ▬ ▬ ▬ ▬ ▬ ▬ ▬Astronomy Building 1012 C* office/labMarine Science Budiling office/lab 24 1984 99,082 ▬ ▬ ▬ ▬ ▬ ▬ ▬ ▬ ▬ ▬ ▬ ▬ ▬ ▬ ▬ ▬ ▬ ▬ ▬ ▬ ▬ ▬ ▬ ▬ ▬ ▬ ▬ ▬ ▬ ▬ ▬ ▬ ▬ ▬ ▬
Sub-TOTAL 266,100 ▬ ▬ ▬ ▬ ▬ ▬ ▬
ENERGY AUDIT AVAILABLEBekesy Lab office/lab 24 1968 16,294 80,942 4.97 8,823 0.54 52,310 3.21 5.93 ▬ ▬ ▬ ▬ ▬ ▬ ▬ ▬ ▬ ▬ ▬ ▬ ▬ ▬ ▬ ▬ ▬ ▬ ▬ ▬ ▬ 80,942 4.97 8,823 0.54 52,310 3.21 5.93
Sub-TOTAL 16,294 80,942 4.97 8,823 0.54 52,310 3.21 5.93 80,942 4.97 8,823 0.54 52,310 3.21 5.93282,394
ONLY ELECTRICITY METER AVAILABLEAgriculture Science office/lab 24 1998 85,000Gartley Hall* office/lab 1921 24,493Agriculture Engineering office/lab 24 1975 15,689Pope Lab office/lab 24 1972 37,500
Sub-TOTAL 162,682
NO ELECTRICITY METER or ENERGY AUDIT AVAILABLESmall Animal Care Facility office/lab 24 1977 5,242Magoon Facility office/lab 1,200Fruit Fly Lab* office/lab 1972 4,240Argonomy & Soil* office/lab 1968 6,593Food Science and Tech. office/lab 24 1951 9,281Horticulture Headhouse* office/lab 1976 4,749
Sub-TOTAL 31,305
TOTAL 476,381 80,942 4.97 8,823 0.54 52,310 3.21 5.93 80,942 0.17 8,823 0.02 52,310 0.11 5.93
* Energy Benchmark Redistributed by Campus Walkthrough
1976 46,340

ECM XI, XII, XIII & XIV AUDIT AUDIT AUDIT
Oper. Est. Energy Est. Cost Est. Construction Payback Est. Energy Est. Cost Est. Construction Payback Est. Energy Est. Cost Est. Construction Payback Est. Energy Est. Cost Est. Construction Payback Const. Const.Building Name Building Schd. Year- Area Savings (kWh/sf.ft. Savings ($/sq.ft. Costs ($/sq.ft. Savings (kWh/sf.ft. Savings ($/sq.ft. Costs ($/sq.ft. Savings (kWh/sf.ft. Savings ($/sq.ft. Costs ($/sq.ft. Savings (kWh/sf.ft. Savings ($/sq.ft. Costs ($/sq.ft. (kWh/sf.ft. ($/sq.ft. Cost Cost/sf. Payback
Type hr Built (sq.ft.) (kWh/year) -year) ($/year) -year) ($) -year) (year) (kWh/year) -year) ($/year) -year) ($) -year) (year) (kWh/year) -year) ($/year) -year) ($) -year) (year) (kWh/year) -year) ($/year) -year) ($) -year) (year) kWh/year -year) $/year -year) $ $/sq.ft. year
ECM XI, XII, XIII & XIV Const CostECM XI, XII, XIII & XIV Savings
Repair VAV Control System Install outside-air carbon dioxide sensors controlling outside-air dampers
ECM XIII ECM XIV
UNIVERSITY OF HAWAII AT MANOA ENERGY BENCHMARK ANALYSIS
ECM XI
AUDIT
ECM XII
Insulation Installation Convert Constant-Volume to VAV system
CLASS/ OFFICEENERGY AUDIT and ELECTRICITY METER AVAILABLESpeech Pathology Bldg-171E* class/office 12 1976 7,615 ▬ ▬ ▬ ▬ ▬ ▬ ▬ ▬ ▬ ▬ ▬ ▬ ▬ ▬ ▬ ▬ ▬ ▬ ▬ ▬ ▬ ▬ ▬ ▬ ▬ ▬ ▬ ▬ ▬ ▬ ▬ ▬ ▬ ▬ ▬Keller Hall class/office 24 1959 49,193 ▬ ▬ ▬ ▬ ▬ ▬ ▬ ▬ ▬ ▬ ▬ ▬ ▬ ▬ ▬ ▬ ▬ ▬ ▬ ▬ ▬ ▬ ▬ ▬ ▬ ▬ ▬ ▬ ▬ ▬ ▬ ▬ ▬ ▬ ▬Business Admin. class/office 24 1972 129,143 ▬ ▬ ▬ ▬ ▬ ▬ ▬ ▬ ▬ ▬ ▬ ▬ ▬ ▬ ▬ ▬ ▬ ▬ ▬ ▬ ▬ ▬ ▬ ▬ ▬ ▬ ▬ ▬ ▬ ▬ ▬ ▬ ▬ ▬ ▬Architecture School class/office 24 1993 50,020 ▬ ▬ ▬ ▬ ▬ ▬ ▬ ▬ ▬ ▬ ▬ ▬ ▬ ▬ ▬ ▬ ▬ ▬ ▬ ▬ ▬ 22,960 0.46 2,619 0.05 14,900 0.30 5.7 22,960 0.46 2,619 0.05 14,900 0.30 5.7Webster Hall class/office 24 1961 59,559 ▬ ▬ ▬ ▬ ▬ ▬ ▬ ▬ ▬ ▬ ▬ ▬ ▬ ▬ ▬ ▬ ▬ ▬ ▬ ▬ ▬ 74,742 1.25 8,247 0.14 52,800 0.89 6.4 74,742 1.25 8,247 0.14 52,800 0.89 6.4Speech Pathology Bldg-171F* class/office 12 1976 6,650 ▬ ▬ ▬ ▬ ▬ ▬ ▬ ▬ ▬ ▬ ▬ ▬ ▬ ▬ ▬ ▬ ▬ ▬ ▬ ▬ ▬ ▬ ▬ ▬ ▬ ▬ ▬ ▬ ▬ ▬ ▬ ▬ ▬ ▬ ▬Sakamaki Hall class/office 12 1974 58,230 ▬ ▬ ▬ ▬ ▬ ▬ ▬ ▬ ▬ ▬ ▬ ▬ ▬ ▬ ▬ ▬ ▬ ▬ ▬ ▬ ▬ ▬ ▬ ▬ ▬ ▬ ▬ ▬ ▬ ▬ ▬ ▬ ▬ ▬ ▬Social Science class/office 15 1973 126,738 ▬ ▬ ▬ ▬ ▬ ▬ ▬ ▬ ▬ ▬ ▬ ▬ ▬ ▬ ▬ ▬ ▬ ▬ ▬ ▬ ▬ ▬ ▬ ▬ ▬ ▬ ▬ ▬ ▬ ▬ ▬ ▬ ▬ ▬ ▬Miller Hall* class/office 24 1939 19,273 ▬ ▬ ▬ ▬ ▬ ▬ ▬ ▬ ▬ ▬ ▬ ▬ ▬ ▬ ▬ ▬ ▬ ▬ ▬ ▬ ▬ ▬ ▬ ▬ ▬ ▬ ▬ ▬ ▬ ▬ ▬ ▬ ▬ ▬ ▬Physical Education class/office 10 1970 45,238 ▬ ▬ ▬ ▬ ▬ ▬ ▬ ▬ ▬ ▬ ▬ ▬ ▬ ▬ ▬ ▬ ▬ ▬ ▬ ▬ ▬ ▬ ▬ ▬ ▬ ▬ ▬ ▬ ▬ ▬ ▬ ▬ ▬ ▬ ▬Moore Hall* class/office 24 1966 80,882 ▬ ▬ ▬ ▬ ▬ ▬ ▬ ▬ ▬ ▬ ▬ ▬ ▬ ▬ ▬ ▬ ▬ ▬ ▬ ▬ ▬ ▬ ▬ ▬ ▬ ▬ ▬ ▬ ▬ ▬ ▬ ▬ ▬ ▬ ▬Law School* class/office 24 1985 53,100 ▬ ▬ ▬ ▬ ▬ ▬ ▬ ▬ ▬ ▬ ▬ ▬ ▬ ▬ ▬ ▬ ▬ ▬ ▬ ▬ ▬ ▬ ▬ ▬ ▬ ▬ ▬ ▬ ▬ ▬ ▬ ▬ ▬ ▬ ▬Music Bldg #1 (1093A )* class/office 10 1959 5,840 ▬ ▬ ▬ ▬ ▬ ▬ ▬ ▬ ▬ ▬ ▬ ▬ ▬ ▬ ▬ ▬ ▬ ▬ ▬ ▬ ▬ ▬ ▬ ▬ ▬ ▬ ▬ ▬ ▬ ▬ ▬ ▬ ▬ ▬ ▬Kuykendall Hall class/office 10 1964 86,492 ▬ ▬ ▬ ▬ ▬ ▬ ▬ ▬ ▬ ▬ ▬ ▬ ▬ ▬ ▬ ▬ ▬ ▬ ▬ ▬ ▬ ▬ ▬ ▬ ▬ ▬ ▬ ▬ ▬ ▬ ▬ ▬ ▬ ▬ ▬Music Bldg #3 (1093C)* class/office 10 1959 1,950 ▬ ▬ ▬ ▬ ▬ ▬ ▬ ▬ ▬ ▬ ▬ ▬ ▬ ▬ ▬ ▬ ▬ ▬ ▬ ▬ ▬ ▬ ▬ ▬ ▬ ▬ ▬ ▬ ▬ ▬ ▬Music Bldg #2 (1093B)* class/office 10 1959 1,120 ▬ ▬ ▬ ▬ ▬ ▬ ▬ ▬ ▬ ▬ ▬ ▬ ▬ ▬ ▬ ▬ ▬ ▬ ▬ ▬ ▬ ▬ ▬ ▬ ▬ ▬ ▬ ▬ ▬ ▬ ▬ ▬ ▬ ▬ ▬Orvis Auditorium* class/office 10 1962 7,432 ▬ ▬ ▬ ▬ ▬ ▬ ▬ ▬ ▬ ▬ ▬ ▬ ▬ ▬ ▬ ▬ ▬ ▬ ▬ ▬ ▬ ▬ ▬ ▬ ▬ ▬ ▬ ▬ ▬ ▬ ▬ ▬ ▬ ▬ ▬
Sub-TOTAL 788,475 97,702 0.12 10,866 0.01 67,700 0.09 6.23 97,702 7,242.76 10,866 805.51 67,700 5,018.68 6.2
ONLY ENERGY AUDIT AVAILABLENONE
788,475
ONLY ELECTRICITY METER AVAILABLEWist Hall class/office 1930 24,591Wist Hall Annex Addition class/office 1979 20,625University High School #3* class/office 1957 27,241Wist Annex 1, University High S. 1 & 2* class/office 1943 26,292Burns Hall class/office 55,000George Hall class/office 1922 47,761Hawaiian Studies class/office 1996 22,100Dean Hall* class/office 1989 18,764Lincoln Hall class/office 1959 43,538Jefferson Hall class/office 1963 61,558Klum Gym. class/office 1958 23,884Spalding Hall class/office 1961 33,012Crawford Hall class/office 1938 24,663New Music Building class/office 1973 49,970Dance Building* class/office 1978 4,188Kennedy Theatre class/office 1963 46,752
Sub-TOTAL 529,939
NO ELECTRICITY METER or ENERGY AUDIT AVAILABLEEast West Building # 1,5,6,3,7 class/office 1977 4,0061881 East West PB # 1,2 class/office 1995 6,223University Elementary School* class/office 1939 7,008Makai Campus Portable Classrooms class/office 1977 3,189Lunalili Freeway Building 2 class/office 1977 1,379Newman Center* class/office 1,395Castle Memorial* class/office 1941 9,931
Sub-TOTAL 33,129
TOTAL 1,351,543 97,702 0.07 10,866 0.01 67,700 0.05 6.23 97,702 0.07 10,866 0.01 67,700 0.05 6.23
* Energy Benchmark Redistributed by Campus Walkthrough

ECM XI, XII, XIII & XIV AUDIT AUDIT AUDIT
Oper. Est. Energy Est. Cost Est. Construction Payback Est. Energy Est. Cost Est. Construction Payback Est. Energy Est. Cost Est. Construction Payback Est. Energy Est. Cost Est. Construction Payback Const. Const.Building Name Building Schd. Year- Area Savings (kWh/sf.ft. Savings ($/sq.ft. Costs ($/sq.ft. Savings (kWh/sf.ft. Savings ($/sq.ft. Costs ($/sq.ft. Savings (kWh/sf.ft. Savings ($/sq.ft. Costs ($/sq.ft. Savings (kWh/sf.ft. Savings ($/sq.ft. Costs ($/sq.ft. (kWh/sf.ft. ($/sq.ft. Cost Cost/sf. Payback
Type hr Built (sq.ft.) (kWh/year) -year) ($/year) -year) ($) -year) (year) (kWh/year) -year) ($/year) -year) ($) -year) (year) (kWh/year) -year) ($/year) -year) ($) -year) (year) (kWh/year) -year) ($/year) -year) ($) -year) (year) kWh/year -year) $/year -year) $ $/sq.ft. year
ECM XI, XII, XIII & XIV Const CostECM XI, XII, XIII & XIV Savings
Repair VAV Control System Install outside-air carbon dioxide sensors controlling outside-air dampers
ECM XIII ECM XIV
UNIVERSITY OF HAWAII AT MANOA ENERGY BENCHMARK ANALYSIS
ECM XI
AUDIT
ECM XII
Insulation Installation Convert Constant-Volume to VAV system
OFFICEENERGY AUDIT and ELECTRICITY METER AVAILABLEStudent Services Center office 24 1994 80,000 ▬ ▬ ▬ ▬ ▬ ▬ ▬ ▬ ▬ ▬ ▬ ▬ ▬ ▬ 36,446 0.46 6,701 0.08 83,000 1.04 12 77,618 0.97 8,899 0.11 38,700 0.48 4.3 114,064 1.43 15,600 0.20 121,700 1.52 7.80Bachman Hall and Annexes office 12 1977 28,070 ▬ ▬ ▬ ▬ ▬ ▬ ▬ ▬ ▬ ▬ ▬ ▬ ▬ ▬ ▬ ▬ ▬ ▬ ▬ ▬ ▬ ▬ ▬ ▬ ▬ ▬ ▬ ▬ ▬ ▬ ▬ ▬ ▬ ▬ ▬Sinclair Hall office 12 1956 3,687 ▬ ▬ ▬ ▬ ▬ ▬ ▬ ▬ ▬ ▬ ▬ ▬ ▬ ▬ ▬ ▬ ▬ ▬ ▬ ▬ ▬ ▬ ▬ ▬ ▬ ▬ ▬ ▬ ▬ ▬ ▬ ▬ ▬ ▬ ▬Henke Hall office 10 1957 20,686 ▬ ▬ ▬ ▬ ▬ ▬ ▬ ▬ ▬ ▬ ▬ ▬ ▬ ▬ ▬ ▬ ▬ ▬ ▬ ▬ ▬ ▬ ▬ ▬ ▬ ▬ ▬ ▬ ▬ ▬ ▬ ▬ ▬ ▬ ▬
Sub-TOTAL 132,443 36,446 0.28 6,701 0.05 83,000 0.63 12.39 77,618 0.59 8,899 0.07 38,700 0.29 4.35 114,064 0.86 15,600 0.12 121,700 0.92 7.80
ONLY ENERGY AUDIT AVAILABLE
Krauss Hall and Annexes 1 & 2 office 14 1971 21,611 ▬ ▬ ▬ ▬ ▬ ▬ ▬ 76,631 3.55 7,433 0.34 61,000 2.82 8.21 ▬ ▬ ▬ ▬ ▬ ▬ ▬ ▬ ▬ ▬ ▬ ▬ ▬ ▬ 76,631 3.55 7,433 0.34 61,000 2.82 8.21ROTC Building office 10 1992 5,178 ▬ ▬ ▬ ▬ ▬ ▬ ▬ ▬ ▬ ▬ ▬ ▬ ▬ ▬ ▬ ▬ ▬ ▬ ▬ ▬ ▬ ▬ ▬ ▬ ▬ ▬ ▬ ▬ ▬ ▬ ▬ ▬ ▬ ▬ ▬
Sub-TOTAL 26,789 76,631 2.86 7,433 0.28 61,000 2.28 8.21 76,631 2.86 7,433 0.28 61,000 2.28 8.21159,232
ONLY ELECTRICITY METER AVAILABLEWeather Bureau office 1963 22,000Building 37 office 1931 3,655Center for Korean Studies office 1980 16,569Engineering Quad A+B office 1928 7,007Bilger Annex # 1 & 2 office 1971 3,624
Sub-TOTAL 52,855
NO ELECTRICITY METER or ENERGY AUDIT AVAILABLEMakai Campus Portable offices office 1977 12,430Hawaii Hall office 1912 36,849Financial Management B office 1992 710Financial Management C office 1922 710Fiscal Service A office 1992 710Fiscal Service Office office 1977 1,303PPMO/Accounting office 1977 7,945Contracts and Grants office 1977 1,470Keypunch Section office 1977 1,295Lunalili Freeway Building 1 office 1977 1,757Lower Campus Portables office 1976 7,768Air Force ROTC office 1977 3,769National Marine Fisheries Srvc Office 4,100Lincoln Annexes 1&2 office 1971 3,530Physical Plant Annex # 1, 2 office 1970 3,880Physical Plant Building office 1963 4,302Maile Way Annexes office 1967 1,859Campus Security office 1977 1,741Diving Safety Program office 700Environmental Health and Safety Office office 1995 2,530Landscaping* office 400Transportation Service* office 1984 1,400Environmental Protection Service office 1,300Federal Credit Union office 1914 1,309Energy House* office 1978 1,800Maintenance Service Building* office 1970 3,900Parasitology Lab office 1930 1,816Castle Memorial Caretakers Cottage* office 1941 1,678Miller Hall Annex office 1948 1,348High School Locker Building* office 1959 2,436Center for Student Development office 1952 13,733Castle Annex* office 1945 3,488UH Press office 1977 12,536KITV office 1973 20,803Dole St. Offices office 1940 7,400Frear office 1952 32,711University Avenue Annexes office 1977 6,994
Sub-TOTAL 214,410
TOTAL 426,497 76,631 0.18 7,433 0.02 61,000 0.14 8.21 36,446 0.09 6,701 0.02 83,000 0.19 12.39 77,618 0.18 8,899 0.02 38,700 0.09 4.35 190,695 0.45 23,033 0.05 182,700 0.43 7.93
* Energy Benchmark Redistributed by Campus Walkthrough
** Building year data was not available, the listed date is astimate.

ECM XI, XII, XIII & XIV AUDIT AUDIT AUDIT
Oper. Est. Energy Est. Cost Est. Construction Payback Est. Energy Est. Cost Est. Construction Payback Est. Energy Est. Cost Est. Construction Payback Est. Energy Est. Cost Est. Construction Payback Const. Const.Building Name Building Schd. Year- Area Savings (kWh/sf.ft. Savings ($/sq.ft. Costs ($/sq.ft. Savings (kWh/sf.ft. Savings ($/sq.ft. Costs ($/sq.ft. Savings (kWh/sf.ft. Savings ($/sq.ft. Costs ($/sq.ft. Savings (kWh/sf.ft. Savings ($/sq.ft. Costs ($/sq.ft. (kWh/sf.ft. ($/sq.ft. Cost Cost/sf. Payback
Type hr Built (sq.ft.) (kWh/year) -year) ($/year) -year) ($) -year) (year) (kWh/year) -year) ($/year) -year) ($) -year) (year) (kWh/year) -year) ($/year) -year) ($) -year) (year) (kWh/year) -year) ($/year) -year) ($) -year) (year) kWh/year -year) $/year -year) $ $/sq.ft. year
ECM XI, XII, XIII & XIV Const CostECM XI, XII, XIII & XIV Savings
Repair VAV Control System Install outside-air carbon dioxide sensors controlling outside-air dampers
ECM XIII ECM XIV
UNIVERSITY OF HAWAII AT MANOA ENERGY BENCHMARK ANALYSIS
ECM XI
AUDIT
ECM XII
Insulation Installation Convert Constant-Volume to VAV system
LIBRARYENERGY AUDIT and ELECTRICITY METER AVAILABLELaw School Library library 24 1982 31,500 ▬ ▬ ▬ ▬ ▬ ▬ ▬ ▬ ▬ ▬ ▬ ▬ ▬ ▬ ▬ ▬ ▬ ▬ ▬ ▬ ▬ ▬ ▬ ▬ ▬ ▬ ▬ ▬ ▬ ▬ ▬ ▬ ▬ ▬ ▬
Sub-TOTAL 31,500
ONLY ENERGY AUDIT AVAILABLENONE
31,500
ONLY ELECTRICITY METER AVAILABLEHamilton Library (old) library 24 1968 280,143Hamilton Library (new) library 24 2000 135,000Bookstore library 24 1964 9,439Sinclair Library library 24 1956 70,797
Sub-TOTAL 495,379
NO ELECTRICITY METER or ENERGY AUDIT AVAILABLEBookstore Warehouse & Post Office Library 24 1963 12,664
Sub-TOTAL 12,664
TOTAL 539,543

ECM XI, XII, XIII & XIV AUDIT AUDIT AUDIT
Oper. Est. Energy Est. Cost Est. Construction Payback Est. Energy Est. Cost Est. Construction Payback Est. Energy Est. Cost Est. Construction Payback Est. Energy Est. Cost Est. Construction Payback Const. Const.Building Name Building Schd. Year- Area Savings (kWh/sf.ft. Savings ($/sq.ft. Costs ($/sq.ft. Savings (kWh/sf.ft. Savings ($/sq.ft. Costs ($/sq.ft. Savings (kWh/sf.ft. Savings ($/sq.ft. Costs ($/sq.ft. Savings (kWh/sf.ft. Savings ($/sq.ft. Costs ($/sq.ft. (kWh/sf.ft. ($/sq.ft. Cost Cost/sf. Payback
Type hr Built (sq.ft.) (kWh/year) -year) ($/year) -year) ($) -year) (year) (kWh/year) -year) ($/year) -year) ($) -year) (year) (kWh/year) -year) ($/year) -year) ($) -year) (year) (kWh/year) -year) ($/year) -year) ($) -year) (year) kWh/year -year) $/year -year) $ $/sq.ft. year
ECM XI, XII, XIII & XIV Const CostECM XI, XII, XIII & XIV Savings
Repair VAV Control System Install outside-air carbon dioxide sensors controlling outside-air dampers
ECM XIII ECM XIV
UNIVERSITY OF HAWAII AT MANOA ENERGY BENCHMARK ANALYSIS
ECM XI
AUDIT
ECM XII
Insulation Installation Convert Constant-Volume to VAV system
DORMITORYENERGY AUDIT and ELECTRICITY METER AVAILABLE
NONE
ONLY ENERGY AUDIT AVAILABLENONE
0
ONLY ELECTRICITY METER AVAILABLELaulima dorm 1968 38,446Kahawaii dorm 1963 37,578Gateway dorm 1963 65,283Johnson Hall A dorm 1962 26,830Johnson Hall B dorm 1958 22,951Hale Aloha Lahua dorm 1978 71,381Hale Aloha Ilima dorm 1977 71,315Hale Aloha Mokihana dorm 1978 71,315Hale Aloha Lokelani dorm 1978 71,381Neolani dorm 1978 107,800Wainani dorm 1978 203,361Hale Kuahine dorm 1963 31,752Hale Manoa dorm 1963 152,651
Sub-TOTAL 972,044
NO ELECTRICITY METER or ENERGY AUDIT AVAILABLEHale Anuenue dorm 1963 12,664
Sub-TOTAL 12,664
TOTAL 984,708

ECM XI, XII, XIII & XIV AUDIT AUDIT AUDIT
Oper. Est. Energy Est. Cost Est. Construction Payback Est. Energy Est. Cost Est. Construction Payback Est. Energy Est. Cost Est. Construction Payback Est. Energy Est. Cost Est. Construction Payback Const. Const.Building Name Building Schd. Year- Area Savings (kWh/sf.ft. Savings ($/sq.ft. Costs ($/sq.ft. Savings (kWh/sf.ft. Savings ($/sq.ft. Costs ($/sq.ft. Savings (kWh/sf.ft. Savings ($/sq.ft. Costs ($/sq.ft. Savings (kWh/sf.ft. Savings ($/sq.ft. Costs ($/sq.ft. (kWh/sf.ft. ($/sq.ft. Cost Cost/sf. Payback
Type hr Built (sq.ft.) (kWh/year) -year) ($/year) -year) ($) -year) (year) (kWh/year) -year) ($/year) -year) ($) -year) (year) (kWh/year) -year) ($/year) -year) ($) -year) (year) (kWh/year) -year) ($/year) -year) ($) -year) (year) kWh/year -year) $/year -year) $ $/sq.ft. year
ECM XI, XII, XIII & XIV Const CostECM XI, XII, XIII & XIV Savings
Repair VAV Control System Install outside-air carbon dioxide sensors controlling outside-air dampers
ECM XIII ECM XIV
UNIVERSITY OF HAWAII AT MANOA ENERGY BENCHMARK ANALYSIS
ECM XI
AUDIT
ECM XII
Insulation Installation Convert Constant-Volume to VAV system
FOOD/FACILITY/OFFICEENERGY AUDIT and ELECTRICITY METER AVAILABLEFOOD/FACILITY/OFFICEAuxilary Services Buidling food/faclty/offc 24 1962 12,652 ▬ ▬ ▬ ▬ ▬ ▬ ▬ ▬ ▬ ▬ ▬ ▬ ▬ ▬ ▬ ▬ ▬ ▬ ▬ ▬ ▬ ▬ ▬ ▬ ▬ ▬ ▬ ▬ ▬ ▬ ▬ ▬ ▬ ▬ ▬
Sub-TOTAL 12,652 ▬ ▬ ▬ ▬ ▬ ▬ ▬
ONLY ENERGY AUDIT AVAILABLENONE
12,652
ONLY ELECTRICITY METER AVAILABLECampus Center food/faclty/offc 1974 133,342Gateway Café food/faclty/offc 1963 10,000Café Hale Aloha food/faclty/offc 1978 20,665Paradise Palm food/faclty/offc 1964 9,439Multipurpose Building food/faclty/offc 1963 12,664
Sub-TOTAL 186,110
TOTAL 198,762

ECM XI, XII, XIII & XIV AUDIT AUDIT AUDIT
Oper. Est. Energy Est. Cost Est. Construction Payback Est. Energy Est. Cost Est. Construction Payback Est. Energy Est. Cost Est. Construction Payback Est. Energy Est. Cost Est. Construction Payback Const. Const.Building Name Building Schd. Year- Area Savings (kWh/sf.ft. Savings ($/sq.ft. Costs ($/sq.ft. Savings (kWh/sf.ft. Savings ($/sq.ft. Costs ($/sq.ft. Savings (kWh/sf.ft. Savings ($/sq.ft. Costs ($/sq.ft. Savings (kWh/sf.ft. Savings ($/sq.ft. Costs ($/sq.ft. (kWh/sf.ft. ($/sq.ft. Cost Cost/sf. Payback
Type hr Built (sq.ft.) (kWh/year) -year) ($/year) -year) ($) -year) (year) (kWh/year) -year) ($/year) -year) ($) -year) (year) (kWh/year) -year) ($/year) -year) ($) -year) (year) (kWh/year) -year) ($/year) -year) ($) -year) (year) kWh/year -year) $/year -year) $ $/sq.ft. year
ECM XI, XII, XIII & XIV Const CostECM XI, XII, XIII & XIV Savings
Repair VAV Control System Install outside-air carbon dioxide sensors controlling outside-air dampers
ECM XIII ECM XIV
UNIVERSITY OF HAWAII AT MANOA ENERGY BENCHMARK ANALYSIS
ECM XI
AUDIT
ECM XII
Insulation Installation Convert Constant-Volume to VAV system
OTHERENERGY AUDIT and ELECTRICITY METER AVAILABLEOTHERStan Sherriff Multi Purpose Arena arena 10 1977 190,000 ▬ ▬ ▬ ▬ ▬ ▬ ▬ ▬ ▬ ▬ ▬ ▬ ▬ ▬ ▬ ▬ ▬ ▬ ▬ ▬ ▬ ▬ ▬ ▬ ▬ ▬ ▬ ▬ ▬ ▬ ▬ ▬ ▬ ▬ ▬Student Health B.D clinic 10 1963 10,793 68,472 6.34 6,641 0.62 89,460 8.29 13.47 ▬ ▬ ▬ ▬ ▬ ▬ ▬ ▬ ▬ ▬ ▬ ▬ ▬ ▬ ▬ ▬ ▬ ▬ ▬ ▬ ▬ 68,472 6.34 6,641 0.62 89,460 8.29 13.47
Sub-TOTAL 200,793 68,472 6.34 6,641 0.62 89,460 8.29 13.47 68,472 0.34 6,641 0.03 89,460 0.45 13.47
ONLY ENERGY AUDIT AVAILABLENONE
200,793
ONLY ELECTRICITY METER AVAILABLEUH Baseball (Murakami Stadium) Stadium 1987 43,369UH Parking parking 1974 735,000
Sub-TOTAL 778,369
NO ELECTRICITY METER or ENERGY AUDIT AVAILABLECottages 1, 3 and 4 residential 1914 3,465College Hill residential 1963 10,220Waahila Ridge Housing residential 1944 80,478
Sub-TOTAL 94,163
TOTAL 1,073,325 68,472 6.34 6,641 0.62 89,460 8.29 13.47 68,472 0.06 6,641 0.01 89,460 0.08 13.47

ECM XI, XII, XIII & XIV AUDIT AUDIT AUDIT
Oper. Est. Energy Est. Cost Est. Construction Payback Est. Energy Est. Cost Est. Construction Payback Est. Energy Est. Cost Est. Construction Payback Est. Energy Est. Cost Est. Construction Payback Const. Const.Building Name Building Schd. Year- Area Savings (kWh/sf.ft. Savings ($/sq.ft. Costs ($/sq.ft. Savings (kWh/sf.ft. Savings ($/sq.ft. Costs ($/sq.ft. Savings (kWh/sf.ft. Savings ($/sq.ft. Costs ($/sq.ft. Savings (kWh/sf.ft. Savings ($/sq.ft. Costs ($/sq.ft. (kWh/sf.ft. ($/sq.ft. Cost Cost/sf. Payback
Type hr Built (sq.ft.) (kWh/year) -year) ($/year) -year) ($) -year) (year) (kWh/year) -year) ($/year) -year) ($) -year) (year) (kWh/year) -year) ($/year) -year) ($) -year) (year) (kWh/year) -year) ($/year) -year) ($) -year) (year) kWh/year -year) $/year -year) $ $/sq.ft. year
ECM XI, XII, XIII & XIV Const CostECM XI, XII, XIII & XIV Savings
Repair VAV Control System Install outside-air carbon dioxide sensors controlling outside-air dampers
ECM XIII ECM XIV
UNIVERSITY OF HAWAII AT MANOA ENERGY BENCHMARK ANALYSIS
ECM XI
AUDIT
ECM XII
Insulation Installation Convert Constant-Volume to VAV system
STORAGEENERGY AUDIT and ELECTRICITY METER AVAILABLE
NONE
ONLY ENERGY AUDIT AVAILABLENONE
0
ONLY ELECTRICITY METER AVAILABLEEngineering Quad storage 1915 3,646
Sub-TOTAL 3,6463,646
NO ELECTRICITY METER or ENERGY AUDIT AVAILABLECooke Field storage 1982 4,160Warehouse storage 1963 25,445Warehouse Annexes storage 1963 1,0501171H Store Room storage 1977 3,210Cooke Field Equipment Storage storage 1979 4,160Motor Pool Maintenance storage 1983 1,400Football Storage storage 2000 2,400Maintenance Garage and Storage storage 1963 6,520
Sub-TOTAL 48,345
TOTAL 51,991

APPENDIX 8.0
Baseline Benchmark Analysis Electricity Use

STATE OF HAWAII FACILITIES IN OAHU ENERGY BENCHMARK BASELINE
OperatingBuilding Name Building Schedule Year Area kWh/sq.ft. Savings kWh/sq.ft. kWh/sq.ft. kWh/sq.ft. kWh/sq.ft. kWh/sq.ft.
Type hr. Built (sq.ft.) kWh/year -year $/year $/sq.ft.-year kWh/year -year kWh/year -year kWh/year -year kWh/year -year kWh/year -year
DAGS
LARGE FACILITIES (BUILDING AREA KNOWN) 400 SOUTH BERETANIA (STATE CAPITOL) Office 10 1969 300,000 6,126,000 20.4 790,618 2.6 919 ALA MOANA BLVD (AAFES) Office 10 108,000 2,243,000 20.8 297,353 2.8 1390 MILLER ST (QUEEN LILIOLULANI) Office 11.5 1943 94,528 2,534,000 26.8 333,361 3.5 1151 PUNCHBOWL ST (KALANIMOKU) Office 10 1976 203,000 7,037,400 34.7 877,507 4.3 1250 PUNCHBOWL ST (KINAU HALE) Office 11 1961 66,951 1,631,200 24.4 222,814 3.3 250 S HOTEL ST (NO. 1-DISTRICT BLDG) Office 10 120,000 2,567,040 21.4 321,188 2.7 465 S KING ST (KEKUANAO'A BLDG) Office 11 65,075 1,471,760 22.6 196,359 3.0 235 S BERETANIA ST (OFFICE TOWER) Office 10 1991 172,000 2,502,400 14.5 337,136 2.0 830 PUNCHBOWL ST (KEELIKOLANI & AUHAU) Office 12 1949 278,639 4,174,800 15.0 558,214 2.0 601 KAMOKILA BV (KAKUIHEIWA KAPOLEI) Office 10 1998 222,000 3,050,400 13.7 408,107 1.8 99500 SALT LAKE BV (STADIUM AUTHORITY) Stadium 300,000 3,416,400 11.4 532,406 1.8
Sub-TOTAL 1,930,193 36,754,400 19.0 4,875,063 2.5
MEDIUM AND SMALL FACILITIES (BUILDING AREA ESTIMATED) 1
Sub-TOTAL Office 407,072 7,751,400 19.0 1,129,000 2.5
Sub-TOTAL
TOTAL 2,337,265 44,505,800 19.0 6,004,063 2.6 3,504,571 1.50 13,229 0.01 683,428 0.29 202,455
1 Medium and small facilities electricity consumption is considered 17.4% of the corresponding department's total electricity consumption.1 Medium and small facilities electricity consumption cost is considered 18.8% of the corresponding department's total electricity consumption.NOTE: "MEDIUM AND SMALL FACILITIES" Area (sq.ft.) were estimated from their kWh/year divided by "LARGE FACILITIES (BUILDING AREA KNOWN)" kWh/sq.ft.-year.
Energy Savings Projects in the Past Eight Years
Space Cooling Retrofits Custom Rebate
Energy Use
Motor ReplacementWater HeatingLighting
STATE OF HAWAII FACILITIES IN OAHU ENERGY BENCHMARK ANALYSIS
OperatingBuilding Name Building Schedule Year Area kWh/sq.ft. Savings kWh/sq.ft. kWh/sq.ft. kWh/sq.ft. kWh/sq.ft. kWh/sq.ft.
Type hr. Built (sq.ft.) kWh/year -year $/year $/sq.ft.-year kWh/year -year kWh/year -year kWh/year -year kWh/year -year kWh/year -year
JUDICIARY
LARGE FACILITIES (BUILDING AREA KNOWN) 777 PUNCHBOWL ST (KAAHUMANU HALE) Office 212,000 3,946,000 18.6 495,030 2.3 1111 ALAKEA ST (KAUIKEAOULI DIS CT 1ST C) Office 187,000 4,683,000 25.0 580,849 3.1 417 S KING ST (ALIIOLANE HALE) Office 62,200 1,639,680 26.4 213,991 3.4
Sub-TOTAL 461,200 10,268,680 22.3 1,289,870 2.8
MEDIUM AND SMALL FACILITIES (BUILDING AREA ESTIMATED) 1
Sub-TOTAL Office 75,639 1,684,117 22.3 245,294 2.8
Sub-TOTAL
TOTAL 536,839 11,952,797 22.3 1,535,164 2.9 1,137,700 2.12 472,238 0.88
1 Medium and small facilities electricity consumption is considered 14.1% of the corresponding department's total electricity consumption.1 Medium and small facilities electricity consumption cost is considered15.97% of the corresponding department's total electricity consumption.NOTE: "MEDIUM AND SMALL FACILITIES" Area (sq.ft.) were estimated from their kWh/year divided by "LARGE FACILITIES (BUILDING AREA KNOWN)" kWh/sq.ft.-year.
Space Cooling Retrofits Custom RebateWater Heating Motor ReplacementLighting
Energy Use Energy Savings Projects in the Past Eight Years

STATE OF HAWAII FACILITIES IN OAHU ENERGY BENCHMARK ANALYSIS
OperatingBuilding Name Building Schedule Year Area kWh/sq.ft. Savings kWh/sq.ft. kWh/sq.ft. kWh/sq.ft. kWh/sq.ft. kWh/sq.ft.
Type hr. Built (sq.ft.) kWh/year -year $/year $/sq.ft.-year kWh/year -year kWh/year -year kWh/year -year kWh/year -year kWh/year -year
DBEDT
LARGE FACILITIES (BUILDING AREA ESTIMATED) 1777 KAPIOLANI BV (HCC) Conv. Centr. 354,554 7,894,200 22.3 1,129,227 3.2
Sub-TOTAL 354,554 7,894,200 22.3 1,129,227 3.2
MEDIUM AND SMALL FACILITIES (BUILDING AREA ESTIMATED) 1
Sub-TOTAL Office 265,489 5,911,140 22.3 860,965 3.2
Sub-TOTAL
TOTAL 620,043 13,805,340 22.3 1,990,192 3.2 797,568 0 25,508 1,216,000 554,012
1 Medium and small facilities electricity consumption is considered 42.8% of the corresponding department's total electricity consumption.1 Medium and small facilities electricity consumption cost is considered 43.3% of the corresponding department's total electricity consumption.NOTE: " LARGE FACILITIES" and "MEDIUM AND SMALL FACILITIES" Area (sq.ft.) were estimated from their kWh/year divided by "JUDUCIARY" kWh/sq.ft.-year.
Lighting Water Heating Space Cooling Retrofits Custom RebateMotor Replacement
Energy Use Energy Savings Projects in the Past Eight Years
STATE OF HAWAII FACILITIES IN OAHU ENERGY BENCHMARK ANALYSIS
OperatingBuilding Name Building Schedule Year Area kWh/sq.ft. Savings kWh/sq.ft. kWh/sq.ft. kWh/sq.ft. kWh/sq.ft. kWh/sq.ft.
Type hr. Built (sq.ft.) kWh/year -year $/year $/sq.ft.-year kWh/year -year kWh/year -year kWh/year -year kWh/year -year kWh/year -year
DHS
LARGE FACILITIES (BUILDING AREA ESTIMATED) 99132 KOHOMUA ST (HCDCH) Office 115,849 2,579,400 22.3 329,819 2.8 1541 KALAKAUA AV (HCDCH) Office 89,175 1,985,500 22.3 240,419 2.7 1545 LINAPUNI ST #BLDG B (HCDCH HHA) Office 59,224 1,318,640 22.3 164,363 2.8 1475 LINAPUNI ST #BLDG (HCDCH HHA) Office 60,090 1,337,920 22.3 165,635 2.8
Sub-TOTAL 324,339 7,221,460 22.3 900,236 2.8
MEDIUM AND SMALL FACILITIES (BUILDING AREA ESTIMATED) 1
Sub-TOTAL Office 253,717 5,649,042 22.3 822,790 2.8
Sub-TOTAL
TOTAL 578,056 12,870,502 22.3 1,723,026 3.0 32,042 270,226 978 0 35,856
1 Medium and small facilities electricity consumption is considered 43.9% of the corresponding department's total electricity consumption.1 Medium and small facilities electricity consumption cost is considered 47.8% of the corresponding department's total electricity consumption.NOTE: " LARGE FACILITIES" and "MEDIUM AND SMALL FACILITIES" Area (sq.ft.) were estimated from their kWh/year divided by "JUDUCIARY" kWh/sq.ft.-year.
Energy Savings Projects in the Past Eight Years
Custom RebateSpace Cooling RetrofitsMotor ReplacementWater HeatingLighting
Energy Use

STATE OF HAWAII FACILITIES IN OAHU ENERGY BENCHMARK ANALYSIS
OperatingBuilding Name Building Schedule Year Area kWh/sq.ft. Savings kWh/sq.ft. kWh/sq.ft. kWh/sq.ft. kWh/sq.ft. kWh/sq.ft.
Type hr. Built (sq.ft.) kWh/year -year $/year $/sq.ft.-year kWh/year -year kWh/year -year kWh/year -year kWh/year -year kWh/year -year
DOD
LARGE FACILITIES (BUILDING AREA KNOWN) 3949 DIAMOND HEAD RD Office 140,000 1,305,200 9.3 168,418 1.2
Sub-TOTAL 140,000 1,305,200 9.3 168,418 1.2
MEDIUM AND SMALL FACILITIES (BUILDING AREA ESTIMATED) 1
Sub-TOTAL Office 388,803 3,624,756 9.3 527,950 1.2
Sub-TOTAL
TOTAL 528,803 4,929,956 9.3 696,368 1.3 26,143 0.05 1,195 0.00
1 Medium and small facilities electricity consumption is considered 73.5% of the corresponding department's total electricity consumption.1 Medium and small facilities electricity consumption cost is considered 75.8% of the corresponding department's total electricity consumption.NOTE: "MEDIUM AND SMALL FACILITIES" Area (sq.ft.) were estimated from their kWh/year divided by "LARGE FACILITIES" kWh/sq.ft.-year.
Lighting Water Heating Space Cooling Retrofits Custom RebateMotor Replacement
Energy Use Energy Savings Projects in the Past Eight Years
STATE OF HAWAII FACILITIES IN OAHU ENERGY BENCHMARK ANALYSIS
OperatingBuilding Name Building Schedule Year Area kWh/sq.ft. Savings kWh/sq.ft. kWh/sq.ft. kWh/sq.ft. kWh/sq.ft. kWh/sq.ft.
Type hr. Built (sq.ft.) kWh/year -year $/year $/sq.ft.-year kWh/year -year kWh/year -year kWh/year -year kWh/year -year kWh/year -year
DOE
LARGE FACILITIES (BUILDING AREA ESTIMATED) 915007 KAPOLEI PKWY Classroom/Office 240,613 3,609,200 15.0 484,320 2.0 46155 KAMEHAMEHA HY Classroom/Office 80,672 1,210,080 15.0 173,242 2.1 91884 FT WEAVER RD Classroom/Office 136,608 2,049,120 15.0 278,670 2.0 2460 WAIMANO HOME RD (PEARL CITY HIGH) Classroom/Office 109,080 1,636,200 15.0 223,823 2.1 89980 NANAKULI AV (NANAKULI HIGH & INTER) Classroom/Office 98,800 1,482,000 15.0 207,595 2.1 85271 FARRINGTON HY (WAIANAE HIGH) Classroom/Office 87,552 1,313,280 15.0 179,640 2.1 951200 MEHEULA PARKWAY(MILILANI HIGH) Classroom/Office 113,040 1,695,600 15.0 236,818 2.1 45386 KANEOHE BAY DR (CASTLE HIGH) Classroom/Office 87,600 1,314,000 15.0 177,772 2.0 760 ILIAINA ST (KALAHEO) Classroom/Office 72,949 1,094,240 15.0 155,445 2.1 511 LUNALILO HOME RD (KAISER HIGH) Classroom/Office 98,000 1,470,000 15.0 203,849 2.1 4680 KALANIANAOLE HY (KALANI HIGH) Classroom/Office 37,749 566,240 15.0 72,239 1.9 2705 KAIMUKI AVE (KAIMUKI HIGH) Classroom/Office 146,907 2,203,600 15.0 291,705 2.0 1120 NEHOA ST (ROOSEVELT HIGH) Classroom/Office 77,720 1,165,800 15.0 163,478 2.1 1039 S KING ST (MCKINLEY HIGH) Classroom/Office 160,107 2,401,600 15.0 331,155 2.1 1185 ALA NAPUNANI ST (MOANALUA HIGH) Classroom/Office 116,667 1,750,000 15.0 242,024 2.1 911561 KEAUNUI RD HOLOMUA ELEMENTARY) Classroom/Office 110,496 1,657,440 15.0 230,333 2.1 951140 LEHIWA DR (MILILANI INTERMED) Classroom/Office 157,653 2,364,800 15.0 327,725 2.1 915335 KAPOLEI PKWY (KAPOLEI MID SCH) Classroom/Office 139,600 2,094,000 15.0 282,619 2.0 478 S KING ST (HAWAII STATE LIBRARY) Classroom/Office 63,151 1,171,440 18.5 170,141 2.7
Sub-TOTAL 2,134,964 32,248,640 15.1 4,432,593 2.1
MEDIUM AND SMALL FACILITIES (BUILDING AREA ESTIMATED) 1
Sub-TOTAL Classroom/Office 5,694,686 86,018,235 15.1 12,528,661 2.1
Sub-TOTAL
TOTAL 7,829,650 118,266,875 15.1 16,961,254 2.2 9,541,043 1.22 0 0 44,850 0.01 1,191,563 0.15 205,500 0.03
1 Medium and small facilities electricity consumption is considered 72.7% of the corresponding department's total electricity consumption.1 Medium and small facilities electricity consumption cost is considered 73.9% of the corresponding department's total electricity consumption.NOTE: " LARGE FACILITIES" and "MEDIUM AND SMALL FACILITIES" Area (sq.ft.) were estimated from their kWh/year divided by an estimated 15 kWh/sq.ft.-year.
Lighting Water Heating Space Cooling Retrofits Custom RebateMotor Replacement
Energy Use Energy Savings Projects in the Past Eight Years

STATE OF HAWAII FACILITIES IN OAHU ENERGY BENCHMARK ANALYSIS
OperatingBuilding Name Building Schedule Year Area kWh/sq.ft. Savings kWh/sq.ft. kWh/sq.ft. kWh/sq.ft. kWh/sq.ft. kWh/sq.ft.
Type hr. Built (sq.ft.) kWh/year -year $/year $/sq.ft.-year kWh/year -year kWh/year -year kWh/year -year kWh/year -year kWh/year -year
DOH
LARGE FACILITIES (BUILDING AREA KNOWN) 45747 KEAAHALA RD (HAWAII STATE HOSP) Hospital 226,475 4,632,000 20.5 541,435 2.4 45633 KEAAHALA RD Hospital 68,206 1,395,000 20.5 175,222 2.6 3627 KILAUEA AV (ADMIN SRVC OFF) Hospital 72,940 1,578,480 21.6 217,135 3.0 3675 KILAUEA AV Hospital 137,830 2,982,800 21.6 371,246 2.7 1103 HALA DR (MALUHIA HOSP) Hospital 99,700 2,486,400 24.9 299,056 3.0 2725 WAIMANO HOME RD (ADMIN OFF) Hospital 306,366 6,845,400 22.3 817,416 2.7
Sub-TOTAL 911,517 19,920,080 21.9 2,421,510 2.7
MEDIUM AND SMALL FACILITIES (BUILDING AREA ESTIMATED) 1
Sub-TOTAL Hospital 695,353 15,196,091 21.9 2,213,329 2.7
Sub-TOTAL
TOTAL 1,606,870 35,116,171 21.9 4,634,839 2.9 526,000 0.33
1 Medium and small facilities electricity consumption is considered 43.3% of the corresponding department's total electricity consumption.1 Medium and small facilities electricity consumption cost is considered 47.8% of the corresponding department's total electricity consumption.NOTE: "MEDIUM AND SMALL FACILITIES" Area (sq.ft.) were estimated from their kWh/year divided by "LARGE FACILITIES (BUILDING AREA KNOWN)" kWh/sq.ft.-year.
Lighting Custom RebateMotor ReplacementWater Heating Space Cooling Retrofits
Energy Use Energy Savings Projects in the Past Eight Years
STATE OF HAWAII FACILITIES IN OAHU ENERGY BENCHMARK ANALYSIS
OperatingBuilding Name Building Schedule Year Area kWh/sq.ft. Savings kWh/sq.ft. kWh/sq.ft. kWh/sq.ft. kWh/sq.ft. kWh/sq.ft.
Type hr. Built (sq.ft.) kWh/year -year $/year $/sq.ft.-year kWh/year -year kWh/year -year kWh/year -year kWh/year -year kWh/year -year
PSD
LARGE FACILITIES (BUILDING AREA ESTIMATED) 94560 KAMEHAMEHA HY (WAIAWA CORR FAC) Corr Fac 82,200 1,233,000 15.0 155,458 1.9 5100 MOANALUA RD Corr Fac 90,352 1,355,280 15.0 165,624 1.8 99902 MOANALUA RD (HALAWA PRISON) Corr Fac 339,800 5,097,000 15.0 617,725 1.8 2199 KAMEHAMEHA HY (OCCC & HSE CORR) Corr Fac 456,640 6,849,600 15.0 794,028 1.7 42477 KALANIANAOLE HY Corr Fac 118,741 1,781,120 15.0 215,668 1.8
Sub-TOTAL 1,087,733 16,316,000 15.0 1,948,503 1.8
MEDIUM AND SMALL FACILITIES (BUILDING AREA ESTIMATED) 1
Sub-TOTAL Corr Fac 0 0 0.0 0 -
Sub-TOTAL
TOTAL 1,087,733 16,316,000 15.0 1,948,503 1.8 155 0.00
NOTE: " LARGE FACILITIES " and "MEDIUM AND SMALL FACILITIES" Area (sq.ft.) were estimated from their kWh/year divided by "DOH" kWh/sq.ft.-year.
Custom RebateMotor ReplacementLighting Water Heating Space Cooling Retrofits
Energy Use Energy Savings Projects in the Past Eight Years

STATE OF HAWAII FACILITIES IN OAHU ENERGY BENCHMARK ANALYSIS
OperatingBuilding Name Building Schedule Year Area kWh/sq.ft. Savings kWh/sq.ft. kWh/sq.ft. kWh/sq.ft. kWh/sq.ft. kWh/sq.ft.
Type hr. Built (sq.ft.) kWh/year -year $/year $/sq.ft.-year kWh/year -year kWh/year -year kWh/year -year kWh/year -year kWh/year -year
DOT
LARGE FACILITIES (BUILDING AREA KNOWN) 40 PIER (KAPALAMA MIL RES) Military Reserve 133,340 1,391,400 10.4 187,393 1.4 869 PUNCHBOWL ST (TRANSPORTATION) Office 55,854 1,247,520 22.3 166,588 3.0 302 RODGERS BV #344 (IAB VAULT "B") Airport Terminal 269,775 12,936,000 48.0 1,453,504 5.4 302 RODGERS BV #342 (SVC CRT VLT "C") Airport Terminal 150,904 7,236,000 48.0 803,431 5.3 302 RODGERS BV #336 (OST VLT "N") Airport Terminal 353,110 16,932,000 48.0 1,905,754 5.4 304 RODGERS BV #360 (EWA VLT "1E") Airport Terminal 87,506 4,196,000 48.0 476,875 5.4 300 RODGERS BV (COMM TERM ELEC) Airport Terminal 25,101 1,203,600 48.0 142,471 5.7 300 RODGERS BV #355 (OSPARK VLT "A") Airport Terminal 30,963 1,484,720 48.0 172,975 5.6 301 RODGERS BV #A (DIA HD EXT) Airport Terminal 263,118 12,616,800 48.0 1,396,833 5.3 301 RODGERS BV (CEN CONC VLT "Y") Airport Terminal 118,771 5,695,200 48.0 675,038 5.7 303 RODGERS BV #373 (DIA HD VLT "1D") Airport Terminal 159,600 7,653,000 48.0 868,980 5.4 3651 AOLELE ST (EWA CHILLER PLT) Airport Terminal 254,109 12,184,800 48.0 1,408,012 5.5 3650 AOLELE ST (NEW INTERISLE TERM) Airport Terminal 251,156 12,043,200 48.0 1,364,261 5.4 3661 AOLELE ST (EWA CONC GATES) Airport Terminal 55,031 2,638,800 48.0 303,361 5.5
Sub-TOTAL 2,208,338 99,459,040 45.0 11,325,476 5.1
LARGE FACILITIES (BUILDING AREA ESTIMATED) 2 PALI HY (PRIMECO & ST LTS) Highway Tunnel 17,511 788,640 45.0 102,437 5.9 0 WILSON TUNNEL Highway Tunnel 30,481 1,372,800 45.0 169,706 5.6 0 H-3 TUNNEL HAIKU IB PORTAL (HE INT) Highway Tunnel 88,459 3,984,000 45.0 592,960 6.7
Sub-TOTAL 136,450 6,145,440 45.0 865,103 6.3
MEDIUM AND SMALL FACILITIES (BUILDING AREA ESTIMATED) 1
Sub-TOTAL Highway Tunnel 196,129 8,833,250 45.0 1,286,573 6.3
Sub-TOTAL
TOTAL 2,540,917 114,437,730 45.0 13,477,152 5.3 2,167,157 0.85
1 Medium and small facilities electricity consumption is considered 7.7% of the corresponding department's total electricity consumption.1 Medium and small facilities electricity consumption cost is considered 9.5% of the corresponding department's total electricity consumption.NOTE: " LARGE FACILITIES (BUILDING AREA ESTIMATED)" and "MEDIUM AND SMALL FACILITIES" Area (sq.ft.) were estimated from their kWh/year divided by "LARGE FACILITIES (BUILDING AREA KNOWN)" kWh/sq.ft.-year.
Energy Use Energy Savings Projects in the Past Eight Years
Lighting Water Heating Space Cooling Retrofits Custom RebateMotor Replacement
STATE OF HAWAII FACILITIES IN OAHU ENERGY BENCHMARK ANALYSIS
OperatingBuilding Name Building Schedule Year Area kWh/sq.ft. Savings kWh/sq.ft. kWh/sq.ft. kWh/sq.ft. kWh/sq.ft. kWh/sq.ft.
Type hr. Built (sq.ft.) kWh/year -year $/year $/sq.ft.-year kWh/year -year kWh/year -year kWh/year -year kWh/year -year kWh/year -year
UH MANOA
LARGE FACILITIES (BUILDING AREA KNOWN) 1701 EAST WEST RD (FACILITIES MGMT) Class/Office 6,122,395 129,300,000 21.1 14,786,615 2.4 2680 WOODLAWN DR (ASTRONOMY FAC) Class/Office 46,340 2,315,400 50.0 273,801 5.9
Sub-TOTAL 6,168,735 131,615,400 21.3 15,060,416 2.4
LARGE FACILITIES (BUILDING AREA ESTIMATED) 2777 KALAKAUA AV (WAIKIKI AQUARIUM) Aquarium 62,194 1,326,960 21.3 161,912 2.6 46007 LILIPUNA RD (HIMB) Class/Office 77,709 1,658,000 21.3 202,771 2.6
Sub-TOTAL 139,903 2,984,960 21.3 364,683 2.6
MEDIUM AND SMALL FACILITIES (BUILDING AREA ESTIMATED) 1
Sub-TOTAL Class/Office 200,470 4,277,211 21.3 622,982 2.4
Sub-TOTAL
TOTAL 6,509,109 138,877,571 21.3 16,048,081 2.5 27,057 0.00 142,676 0.02 125,976 0.02
1 Medium and small facilities electricity consumption is considered 3.1% of the corresponding department's total electricity consumption.1 Medium and small facilities electricity consumption cost is considered 3.9% of the corresponding department's total electricity consumption.NOTE: " LARGE FACILITIES (BUILDING AREA ESTIMATED)" and "MEDIUM AND SMALL FACILITIES" Area (sq.ft.) were estimated from their kWh/year divided by "LARGE FACILITIES (BUILDING AREA KNOWN)" kWh/sq.ft.-year.
Energy Use Energy Savings Projects in the Past Eight Years
Custom RebateMotor ReplacementLighting Water Heating Space Cooling Retrofits

STATE OF HAWAII FACILITIES IN OAHU ENERGY BENCHMARK ANALYSIS
OperatingBuilding Name Building Schedule Year Area kWh/sq.ft. Savings kWh/sq.ft. kWh/sq.ft. kWh/sq.ft. kWh/sq.ft. kWh/sq.ft.
Type hr. Built (sq.ft.) kWh/year -year $/year $/sq.ft.-year kWh/year -year kWh/year -year kWh/year -year kWh/year -year kWh/year -year
COMM COLL
LARGE FACILITIES (BUILDING AREA ESTIMATED) 96045 ALAIKE ST (LEEWARD) Class/Office 269,630 5,752,800 21.3 730,218 2.7 655 MAKAPUU AV (KAPIOLANI BUSINESS) Class/Office 378,208 8,069,400 21.3 1,049,593 2.8 874 DILLINGHAM BV (HONOLULU) Class/Office 234,628 5,006,000 21.3 663,227 2.8 45720 KEAAHALA RD (HALE IMILOA) Class/Office 264,821 5,650,200 21.3 692,104 2.6
Sub-TOTAL 1,147,288 24,478,400 21.3 3,135,142 2.7
MEDIUM AND SMALL FACILITIES (BUILDING AREA ESTIMATED) 1
Sub-TOTAL Class/Office 73,445 1,567,010 21.3 228,237 2.7
Sub-TOTAL
TOTAL 1,220,733 26,045,410 21.3 3,363,379 2.8 2,874,483 2.35 23,067 0.02 714,956 0.59 352,000 0.29
1 Medium and small facilities electricity consumption is considered 6.0 % of the corresponding department's total electricity consumption.1 Medium and small facilities electricity consumption cost is considered 6.8% of the corresponding department's total electricity consumption.NOTE: " LARGE FACILITIES" and "MEDIUM AND SMALL FACILITIES" Area (sq.ft.) were estimated from their kWh/year divided by "UH MANOA" kWh/sq.ft.-year.
Energy Use Energy Savings Projects in the Past Eight Years
Lighting Water Heating Space Cooling Retrofits Custom RebateMotor Replacement
STATE OF HAWAII FACILITIES IN OAHU ENERGY BENCHMARK ANALYSIS
OperatingBuilding Name Building Schedule Year Area kWh/sq.ft. Savings kWh/sq.ft. kWh/sq.ft. kWh/sq.ft. kWh/sq.ft. kWh/sq.ft.
Type hr. Built (sq.ft.) kWh/year -year $/year $/sq.ft.-year kWh/year -year kWh/year -year kWh/year -year kWh/year -year kWh/year -year
OTHER
LARGE FACILITIES DOES NOT EXIST
MEDIUM AND SMALL FACILITIES (BUILDING AREA ESTIMATED) 1
Sub-TOTAL Office 971,908 20,530,537 21.1 2,990,298 3.1
Sub-TOTAL
TOTAL 971,908 20,530,537 21.1 2,990,298 3.1 8,517 0.01
NOTE:"MEDIUM AND SMALL FACILITIES" Area (sq.ft.) were estimated from their kWh/year divided by "AVERAGE kWh/sq.ft.-year OF REST OF THE SOH FACILITIES".* OTHER: Department of Attorney General Department of Labor and Industrial Relations Department of Land and Natural Resources Department of Hawaiian Homelands Department pf Agriculture Other Facilities
Energy Use Energy Savings Projects in the Past Eight Years
Custom RebateMotor ReplacementLighting Water Heating Space Cooling Retrofits

APPENDIX 9.0
Baseline Benchmark Analysis by End Use Electricity

STATE OF HAWAII FACILITIES IN OAHU ENERGY BENCHMARK ANALYSIS BY END USE
OperatingBuilding Name Building Schedule Year Area kWh/sq.ft. kWh/sq.ft. kWh/sq.ft. kWh/sq.ft.
Type hr. Built (sq.ft.) kWh/year -year $/year $/sq.ft.-year kWh/year -year kWh/year -year kWh/year -year
DAGS
LARGE FACILITIES (BUILDING AREA KNOWN) 400 SOUTH BERETANIA (STATE CAPITOL) Office 10 1969 300,000 6,126,000 20.4 790,618 2.6 3,185,520 10.62 1,837,800 6.13 1,102,680 3.68 919 ALA MOANA BLVD (AAFES) Office 10 108,000 2,243,000 20.8 297,353 2.8 1,166,360 10.80 672,900 6.23 403,740 3.74 1390 MILLER ST (QUEEN LILIOLULANI) Office 11.5 1943 94,528 2,534,000 26.8 333,361 3.5 1,317,680 13.94 760,200 8.04 456,120 4.83 1151 PUNCHBOWL ST (KALANIMOKU) Office 10 1976 203,000 7,037,400 34.7 877,507 4.3 3,659,448 18.03 2,111,220 10.40 1,266,732 6.24 1250 PUNCHBOWL ST (KINAU HALE) Office 11 1961 66,951 1,631,200 24.4 222,814 3.3 848,224 12.67 489,360 7.31 293,616 4.39 250 S HOTEL ST (NO. 1-DISTRICT BLDG) Office 10 120,000 2,567,040 21.4 321,188 2.7 1,334,861 11.12 770,112 6.42 462,067 3.85 465 S KING ST (KEKUANAO'A BLDG) Office 11 65,075 1,471,760 22.6 196,359 3.0 765,315 11.76 441,528 6.78 264,917 4.07 235 S BERETANIA ST (OFFICE TOWER) Office 10 1991 172,000 2,502,400 14.5 337,136 2.0 1,301,248 7.57 750,720 4.36 450,432 2.62 830 PUNCHBOWL ST (KEELIKOLANI & AUHAU) Office 12 1949 278,639 4,174,800 15.0 558,214 2.0 2,170,896 7.79 1,252,440 4.49 751,464 2.70 601 KAMOKILA BV (KAKUIHEIWA KAPOLEI) Office 10 1998 222,000 3,050,400 13.7 408,107 1.8 1,586,208 7.15 915,120 4.12 549,072 2.47 99500 SALT LAKE BV (STADIUM AUTHORITY) Stadium 300,000 3,416,400 11.4 532,406 1.8 1,776,528 5.92 1,024,920 3.42 614,952 2.05
Sub-TOTAL 1,930,193 36,754,400 19.0 4,875,063 2.5 19,112,288 9.90 11,026,320 5.71 6,615,792 3.43
MEDIUM AND SMALL FACILITIES (BUILDING AREA ESTIMATED) 1
Sub-TOTAL Office 407,072 7,751,400 19.0 1,129,000 2.5 4,030,728 9.90 2,325,420 5.71 1,395,252 3.43
Sub-TOTAL
TOTAL 2,337,265 44,505,800 19.0 6,004,063 2.6 23,143,016 9.90 13,351,740 5.71 8,011,044 3.43
1 Medium and small facilities electricity consumption is considered 17.4% of the corresponding department's total electricity consumption.1 Medium and small facilities electricity consumption cost is considered 18.8% of the corresponding department's total electricity consumption.NOTE: "MEDIUM AND SMALL FACILITIES" Area (sq.ft.) were estimated from their kWh/year divided by "LARGE FACILITIES (BUILDING AREA KNOWN)" kWh/sq.ft.-year.
Energy Use Energy Use Distribution by Utility
HVAC LIGHTING MISCELLANEOUS
STATE OF HAWAII FACILITIES IN OAHU ENERGY BENCHMARK ANALYSIS BY END USE
OperatingBuilding Name Building Schedule Year Area kWh/sq.ft. kWh/sq.ft. kWh/sq.ft. kWh/sq.ft.
Type hr. Built (sq.ft.) kWh/year -year $/year $/sq.ft.-year kWh/year -year kWh/year -year kWh/year -year
JUDICIARY
LARGE FACILITIES (BUILDING AREA KNOWN) 777 PUNCHBOWL ST (KAAHUMANU HALE) Office 212,000 3,946,000 18.6 495,030 2.3 2,051,920 9.68 1,183,800 5.58 710,280 3.35 1111 ALAKEA ST (KAUIKEAOULI DIS CT 1ST C) Office 187,000 4,683,000 25.0 580,849 3.1 2,435,160 13.02 1,404,900 7.51 842,940 4.51 417 S KING ST (ALIIOLANE HALE) Office 62,200 1,639,680 26.4 213,991 3.4 852,634 13.71 491,904 7.91 295,142 4.75
Sub-TOTAL 461,200 10,268,680 22.3 1,289,870 2.8 5,339,714 11.58 3,080,604 6.68 1,848,362 4.01
MEDIUM AND SMALL FACILITIES (BUILDING AREA ESTIMATED) 1
Sub-TOTAL Office 75,639 1,684,117 22.3 245,294 2.8 875,741 11.58 505,235 6.68 303,141 4.01
Sub-TOTAL
TOTAL 536,839 11,952,797 22.3 1,535,164 2.9 6,215,455 11.58 3,585,839 6.68 2,151,503 4.01
1 Medium and small facilities electricity consumption is considered 14.1% of the corresponding department's total electricity consumption.1 Medium and small facilities electricity consumption cost is considered 15.97% of the corresponding department's total electricity consumption.NOTE: "MEDIUM AND SMALL FACILITIES" Area (sq.ft.) were estimated from their kWh/year divided by "LARGE FACILITIES (BUILDING AREA KNOWN)" kWh/sq.ft.-year.
Energy Use Energy Use Distribution by Utility
HVAC LIGHTING MISCELLANEOUS
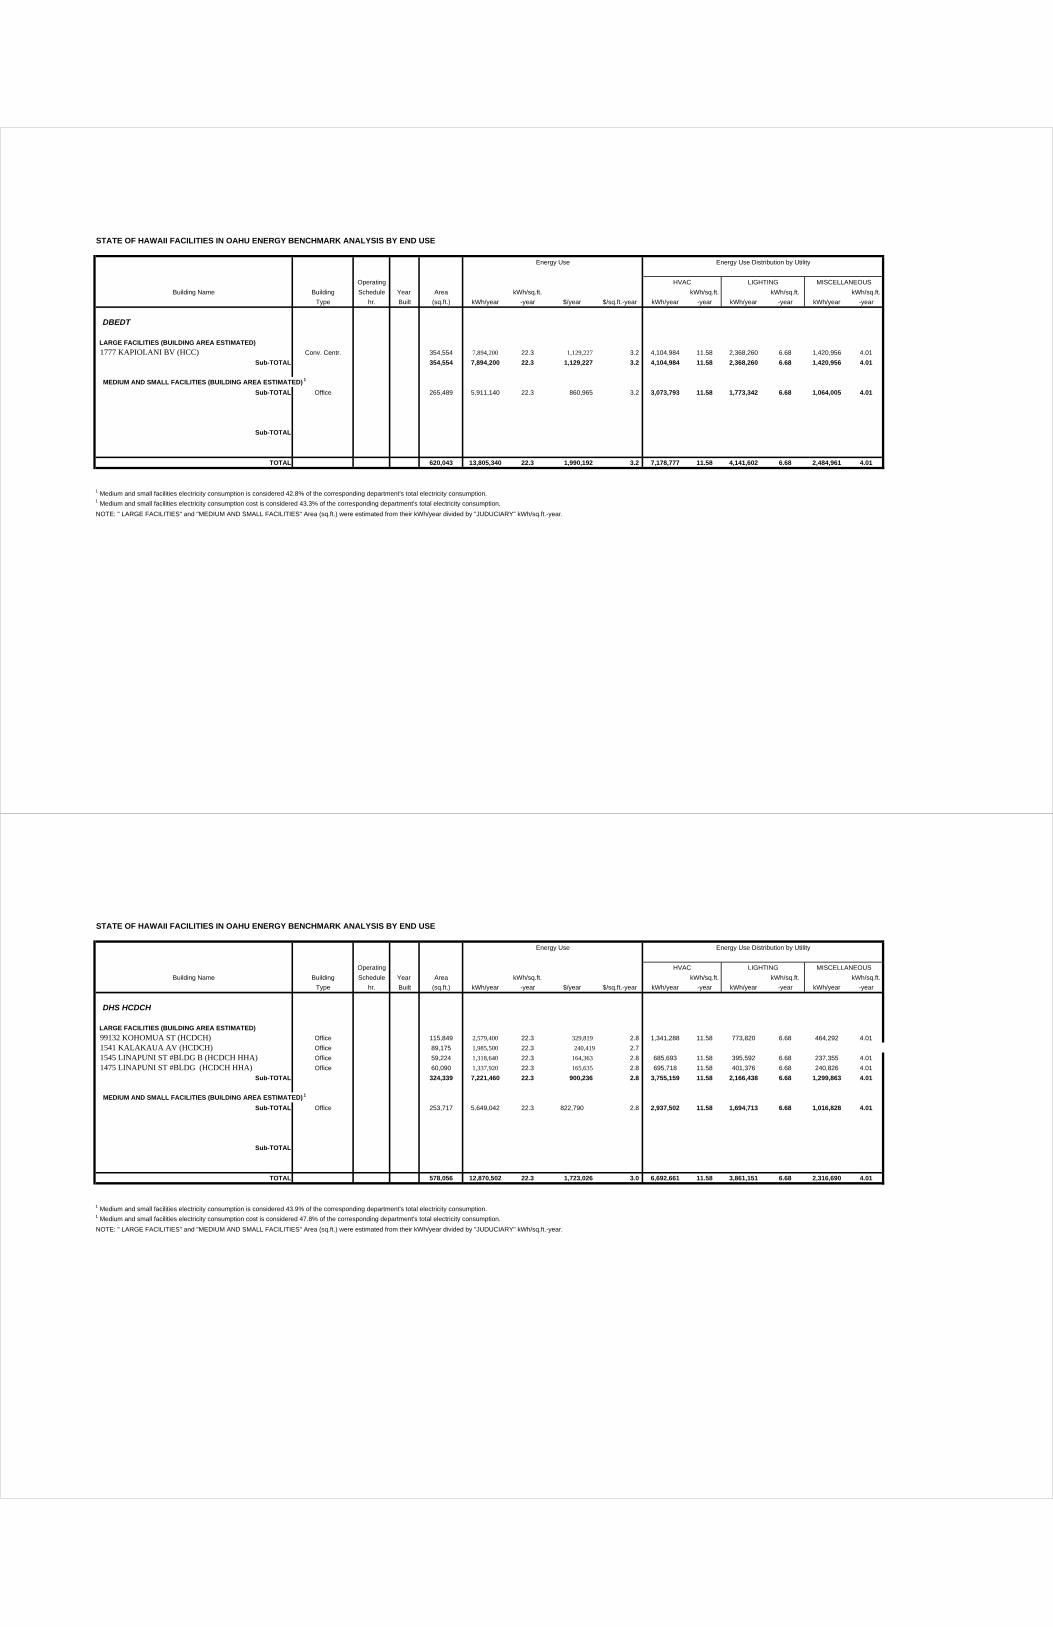
STATE OF HAWAII FACILITIES IN OAHU ENERGY BENCHMARK ANALYSIS BY END USE
OperatingBuilding Name Building Schedule Year Area kWh/sq.ft. kWh/sq.ft. kWh/sq.ft. kWh/sq.ft.
Type hr. Built (sq.ft.) kWh/year -year $/year $/sq.ft.-year kWh/year -year kWh/year -year kWh/year -year
DBEDT
LARGE FACILITIES (BUILDING AREA ESTIMATED) 1777 KAPIOLANI BV (HCC) Conv. Centr. 354,554 7,894,200 22.3 1,129,227 3.2 4,104,984 11.58 2,368,260 6.68 1,420,956 4.01
Sub-TOTAL 354,554 7,894,200 22.3 1,129,227 3.2 4,104,984 11.58 2,368,260 6.68 1,420,956 4.01
MEDIUM AND SMALL FACILITIES (BUILDING AREA ESTIMATED) 1
Sub-TOTAL Office 265,489 5,911,140 22.3 860,965 3.2 3,073,793 11.58 1,773,342 6.68 1,064,005 4.01
Sub-TOTAL
TOTAL 620,043 13,805,340 22.3 1,990,192 3.2 7,178,777 11.58 4,141,602 6.68 2,484,961 4.01
1 Medium and small facilities electricity consumption is considered 42.8% of the corresponding department's total electricity consumption.1 Medium and small facilities electricity consumption cost is considered 43.3% of the corresponding department's total electricity consumption.NOTE: " LARGE FACILITIES" and "MEDIUM AND SMALL FACILITIES" Area (sq.ft.) were estimated from their kWh/year divided by "JUDUCIARY" kWh/sq.ft.-year.
Energy Use Energy Use Distribution by Utility
HVAC LIGHTING MISCELLANEOUS
STATE OF HAWAII FACILITIES IN OAHU ENERGY BENCHMARK ANALYSIS BY END USE
OperatingBuilding Name Building Schedule Year Area kWh/sq.ft. kWh/sq.ft. kWh/sq.ft. kWh/sq.ft.
Type hr. Built (sq.ft.) kWh/year -year $/year $/sq.ft.-year kWh/year -year kWh/year -year kWh/year -year
DHS HCDCH
LARGE FACILITIES (BUILDING AREA ESTIMATED) 99132 KOHOMUA ST (HCDCH) Office 115,849 2,579,400 22.3 329,819 2.8 1,341,288 11.58 773,820 6.68 464,292 4.01 1541 KALAKAUA AV (HCDCH) Office 89,175 1,985,500 22.3 240,419 2.7 1545 LINAPUNI ST #BLDG B (HCDCH HHA) Office 59,224 1,318,640 22.3 164,363 2.8 685,693 11.58 395,592 6.68 237,355 4.01 1475 LINAPUNI ST #BLDG (HCDCH HHA) Office 60,090 1,337,920 22.3 165,635 2.8 695,718 11.58 401,376 6.68 240,826 4.01
Sub-TOTAL 324,339 7,221,460 22.3 900,236 2.8 3,755,159 11.58 2,166,438 6.68 1,299,863 4.01
MEDIUM AND SMALL FACILITIES (BUILDING AREA ESTIMATED) 1
Sub-TOTAL Office 253,717 5,649,042 22.3 822,790 2.8 2,937,502 11.58 1,694,713 6.68 1,016,828 4.01
Sub-TOTAL
TOTAL 578,056 12,870,502 22.3 1,723,026 3.0 6,692,661 11.58 3,861,151 6.68 2,316,690 4.01
1 Medium and small facilities electricity consumption is considered 43.9% of the corresponding department's total electricity consumption.1 Medium and small facilities electricity consumption cost is considered 47.8% of the corresponding department's total electricity consumption.NOTE: " LARGE FACILITIES" and "MEDIUM AND SMALL FACILITIES" Area (sq.ft.) were estimated from their kWh/year divided by "JUDUCIARY" kWh/sq.ft.-year.
Energy Use Energy Use Distribution by Utility
HVAC LIGHTING MISCELLANEOUS

STATE OF HAWAII FACILITIES IN OAHU ENERGY BENCHMARK ANALYSIS BY END USE
OperatingBuilding Name Building Schedule Year Area kWh/sq.ft. kWh/sq.ft. kWh/sq.ft. kWh/sq.ft.
Type hr. Built (sq.ft.) kWh/year -year $/year $/sq.ft.-year kWh/year -year kWh/year -year kWh/year -year
DOD
LARGE FACILITIES (BUILDING AREA KNOWN) 3949 DIAMOND HEAD RD Office 140,000 1,305,200 9.3 168,418 1.2 261,040 1.86 809,224 5.78 234,936 1.68
Sub-TOTAL 140,000 1,305,200 9.3 168,418 1.2 261,040 1.86 809,224 5.78 234,936 1.68
MEDIUM AND SMALL FACILITIES (BUILDING AREA ESTIMATED) 1
Sub-TOTAL Office 388,803 3,624,756 9.3 527,950 1.2 724,951 1.86 2,247,348 5.78 652,456 1.68
Sub-TOTAL
TOTAL 528,803 4,929,956 9.3 696,368 1.3 985,991 1.86 3,056,572 5.78 887,392 1.68
1 Medium and small facilities electricity consumption is considered 73.5% of the corresponding department's total electricity consumption.1 Medium and small facilities electricity consumption cost is considered 75.8% of the corresponding department's total electricity consumption.NOTE: "MEDIUM AND SMALL FACILITIES" Area (sq.ft.) were estimated from their kWh/year divided by "LARGE FACILITIES (BUILDING AREA KNOWN)" kWh/sq.ft.-year.
Energy Use Energy Use Distribution by Utility
HVAC LIGHTING MISCELLANEOUS
STATE OF HAWAII FACILITIES IN OAHU ENERGY BENCHMARK ANALYSIS BY END USE
OperatingBuilding Name Building Schedule Year Area kWh/sq.ft. kWh/sq.ft. kWh/sq.ft. kWh/sq.ft.
Type hr. Built (sq.ft.) kWh/year -year $/year $/sq.ft.-year kWh/year -year kWh/year -year kWh/year -year
DOE
LARGE FACILITIES (BUILDING AREA ESTIMATED) 915007 KAPOLEI PKWY Classroom/Office 240,613 3,609,200 15.0 484,320 2.0 721,840 3.00 2,237,704 9.30 649,656 2.70 46155 KAMEHAMEHA HY Classroom/Office 80,672 1,210,080 15.0 173,242 2.1 242,016 3.00 750,250 9.30 217,814 2.70 91884 FT WEAVER RD Classroom/Office 136,608 2,049,120 15.0 278,670 2.0 409,824 3.00 1,270,454 9.30 368,842 2.70 2460 WAIMANO HOME RD (PEARL CITY HIGH) Classroom/Office 109,080 1,636,200 15.0 223,823 2.1 327,240 3.00 1,014,444 9.30 294,516 2.70 89980 NANAKULI AV (NANAKULI HIGH & INTER) Classroom/Office 98,800 1,482,000 15.0 207,595 2.1 296,400 3.00 918,840 9.30 266,760 2.70 85271 FARRINGTON HY (WAIANAE HIGH) Classroom/Office 87,552 1,313,280 15.0 179,640 2.1 262,656 3.00 814,234 9.30 236,390 2.70 951200 MEHEULA PARKWAY(MILILANI HIGH) Classroom/Office 113,040 1,695,600 15.0 236,818 2.1 339,120 3.00 1,051,272 9.30 305,208 2.70 45386 KANEOHE BAY DR (CASTLE HIGH) Classroom/Office 87,600 1,314,000 15.0 177,772 2.0 262,800 3.00 814,680 9.30 236,520 2.70 760 ILIAINA ST (KALAHEO) Classroom/Office 72,949 1,094,240 15.0 155,445 2.1 218,848 3.00 678,429 9.30 196,963 2.70 511 LUNALILO HOME RD (KAISER HIGH) Classroom/Office 98,000 1,470,000 15.0 203,849 2.1 294,000 3.00 911,400 9.30 264,600 2.70 4680 KALANIANAOLE HY (KALANI HIGH) Classroom/Office 37,749 566,240 15.0 72,239 1.9 113,248 3.00 351,069 9.30 101,923 2.70 2705 KAIMUKI AVE (KAIMUKI HIGH) Classroom/Office 146,907 2,203,600 15.0 291,705 2.0 440,720 3.00 1,366,232 9.30 396,648 2.70 1120 NEHOA ST (ROOSEVELT HIGH) Classroom/Office 77,720 1,165,800 15.0 163,478 2.1 233,160 3.00 722,796 9.30 209,844 2.70 1039 S KING ST (MCKINLEY HIGH) Classroom/Office 160,107 2,401,600 15.0 331,155 2.1 480,320 3.00 1,488,992 9.30 432,288 2.70 1185 ALA NAPUNANI ST (MOANALUA HIGH) Classroom/Office 116,667 1,750,000 15.0 242,024 2.1 350,000 3.00 1,085,000 9.30 315,000 2.70 911561 KEAUNUI RD HOLOMUA ELEMENTARY) Classroom/Office 110,496 1,657,440 15.0 230,333 2.1 331,488 3.00 1,027,613 9.30 298,339 2.70 951140 LEHIWA DR (MILILANI INTERMED) Classroom/Office 157,653 2,364,800 15.0 327,725 2.1 472,960 3.00 1,466,176 9.30 425,664 2.70 915335 KAPOLEI PKWY (KAPOLEI MID SCH) Classroom/Office 139,600 2,094,000 15.0 282,619 2.0 418,800 3.00 1,298,280 9.30 376,920 2.70 478 S KING ST (HAWAII STATE LIBRARY) Classroom/Office 63,151 1,171,440 18.5 170,141 2.7 234,288 3.71 726,293 11.50 210,859 3.34
Sub-TOTAL 2,134,964 32,248,640 15.1 4,432,593 2.1 6,449,728 3.02 19,994,157 9.37 5,804,755 2.72
MEDIUM AND SMALL FACILITIES (BUILDING AREA ESTIMATED) 1
Sub-TOTAL Classroom/Office 5,694,686 86,018,235 15.1 12,528,661 2.1 17,203,647 3.02 53,331,305 9.37 15,483,282 2.72
Sub-TOTAL
TOTAL 7,829,650 118,266,875 15.1 16,961,254 2.2 23,653,375 3.02 73,325,462 9.37 21,288,037 2.72
1 Medium and small facilities electricity consumption is considered 72.7% of the corresponding department's total electricity consumption.1 Medium and small facilities electricity consumption cost is considered 73.9% of the corresponding department's total electricity consumption.NOTE: " LARGE FACILITIES" and "MEDIUM AND SMALL FACILITIES" Area (sq.ft.) were estimated from their kWh/year divided by an estimated 15 kWh/sq.ft.-year.
Energy Use Energy Use Distribution by Utility
HVAC LIGHTING MISCELLANEOUS

STATE OF HAWAII FACILITIES IN OAHU ENERGY BENCHMARK ANALYSIS BY END USE
OperatingBuilding Name Building Schedule Year Area kWh/sq.ft. kWh/sq.ft. kWh/sq.ft. kWh/sq.ft.
Type hr. Built (sq.ft.) kWh/year -year $/year $/sq.ft.-year kWh/year -year kWh/year -year kWh/year -year
DOH
LARGE FACILITIES (BUILDING AREA KNOWN) 45747 KEAAHALA RD (HAWAII STATE HOSP) Hospital 226,475 4,632,000 20.5 541,435 2.4 2,408,640 10.64 1,389,600 6.14 833,760 3.68 45633 KEAAHALA RD Hospital 68,206 1,395,000 20.5 175,222 2.6 725,400 10.64 418,500 6.14 251,100 3.68 3627 KILAUEA AV (ADMIN SRVC OFF) Hospital 72,940 1,578,480 21.6 217,135 3.0 820,810 11.25 473,544 6.49 284,126 3.90 3675 KILAUEA AV Hospital 137,830 2,982,800 21.6 371,246 2.7 1,551,056 11.25 894,840 6.49 536,904 3.90 1103 HALA DR (MALUHIA HOSP) Hospital 99,700 2,486,400 24.9 299,056 3.0 1,292,928 12.97 745,920 7.48 447,552 4.49 2725 WAIMANO HOME RD (ADMIN OFF) Hospital 306,366 6,845,400 22.3 817,416 2.7 3,559,608 11.62 2,053,620 6.70 1,232,172 4.02
Sub-TOTAL 911,517 19,920,080 21.9 2,421,510 2.7 10,358,442 11.36 5,976,024 6.56 3,585,614 3.93
MEDIUM AND SMALL FACILITIES (BUILDING AREA ESTIMATED) 1
Sub-TOTAL Hospital 695,353 15,196,091 21.9 2,213,329 2.7 7,901,967 11.36 4,558,827 6.56 2,735,296 3.93
Sub-TOTAL
TOTAL 1,606,870 35,116,171 21.9 4,634,839 2.9 18,260,409 11.36 10,534,851 6.56 6,320,911 3.93
1 Medium and small facilities electricity consumption is considered 43.3% of the corresponding department's total electricity consumption.1 Medium and small facilities electricity consumption cost is considered 47.7% of the corresponding department's total electricity consumption.NOTE: "MEDIUM AND SMALL FACILITIES" Area (sq.ft.) were estimated from their kWh/year divided by "LARGE FACILITIES (BUILDING AREA KNOWN)" kWh/sq.ft.-year.
Energy Use Energy Use Distribution by Utility
HVAC LIGHTING MISCELLANEOUS
STATE OF HAWAII FACILITIES IN OAHU ENERGY BENCHMARK ANALYSIS BY END USE
OperatingBuilding Name Building Schedule Year Area kWh/sq.ft. kWh/sq.ft. kWh/sq.ft. kWh/sq.ft.
Type hr. Built (sq.ft.) kWh/year -year $/year $/sq.ft.-year kWh/year -year kWh/year -year kWh/year -year
PSD
LARGE FACILITIES (BUILDING AREA ESTIMATED) 94560 KAMEHAMEHA HY (WAIAWA CORR FAC) Corr Fac 82,200 1,233,000 15.0 155,458 1.9 246,600 3.00 764,460 9.30 221,940 2.70 5100 MOANALUA RD Corr Fac 90,352 1,355,280 15.0 165,624 1.8 271,056 3.00 840,274 9.30 243,950 2.70 99902 MOANALUA RD (HALAWA PRISON) Corr Fac 339,800 5,097,000 15.0 617,725 1.8 1,019,400 3.00 3,160,140 9.30 917,460 2.70 2199 KAMEHAMEHA HY (OCCC & HSE CORR) Corr Fac 456,640 6,849,600 15.0 794,028 1.7 1,369,920 3.00 4,246,752 9.30 1,232,928 2.70 42477 KALANIANAOLE HY Corr Fac 118,741 1,781,120 15.0 215,668 1.8 356,224 3.00 1,104,294 9.30 320,602 2.70
Sub-TOTAL 1,087,733 16,316,000 15.0 1,948,503 1.8 3,263,200 3.00 10,115,920 9.30 2,936,880 2.70
MEDIUM AND SMALL FACILITIES (BUILDING AREA ESTIMATED) 1
Sub-TOTAL Corr Fac 0 0 0.0 - - 0 0.00 0 0.00 0 0.00
Sub-TOTAL
TOTAL 1,087,733 16,316,000 15.0 1,948,503 1.8 3,263,200 3.00 10,115,920 9.30 2,936,880 2.70
NOTE: " LARGE FACILITIES " and "MEDIUM AND SMALL FACILITIES" Area (sq.ft.) were estimated from their kWh/year divided by "DOH" kWh/sq.ft.-year.
Energy Use Energy Use Distribution by Utility
HVAC LIGHTING MISCELLANEOUS

STATE OF HAWAII FACILITIES IN OAHU ENERGY BENCHMARK ANALYSIS BY END USE
OperatingBuilding Name Building Schedule Year Area kWh/sq.ft. kWh/sq.ft. kWh/sq.ft. kWh/sq.ft.
Type hr. Built (sq.ft.) kWh/year -year $/year $/sq.ft.-year kWh/year -year kWh/year -year kWh/year -year
DOT
LARGE FACILITIES (BUILDING AREA KNOWN) 40 PIER (KAPALAMA MIL RES) Military Reserve 133,340 1,391,400 10.4 187,393 1.4 723,528 5.43 417,420 3.13 250,452 1.88 869 PUNCHBOWL ST (TRANSPORTATION) Office 55,854 1,247,520 22.3 166,588 3.0 648,710 11.61 374,256 6.70 224,554 4.02 302 RODGERS BV #344 (IAB VAULT "B") Airport Terminal 269,775 12,936,000 48.0 1,453,504 5.4 6,726,720 24.93 3,880,800 14.39 2,328,480 8.63 302 RODGERS BV #342 (SVC CRT VLT "C") Airport Terminal 150,904 7,236,000 48.0 803,431 5.3 3,762,720 24.93 2,170,800 14.39 1,302,480 8.63 302 RODGERS BV #336 (OST VLT "N") Airport Terminal 353,110 16,932,000 48.0 1,905,754 5.4 8,804,640 24.93 5,079,600 14.39 3,047,760 8.63 304 RODGERS BV #360 (EWA VLT "1E") Airport Terminal 87,506 4,196,000 48.0 476,875 5.4 2,181,920 24.93 1,258,800 14.39 755,280 8.63 300 RODGERS BV (COMM TERM ELEC) Airport Terminal 25,101 1,203,600 48.0 142,471 5.7 625,872 24.93 361,080 14.39 216,648 8.63 300 RODGERS BV #355 (OSPARK VLT "A") Airport Terminal 30,963 1,484,720 48.0 172,975 5.6 772,054 24.93 445,416 14.39 267,250 8.63 301 RODGERS BV #A (DIA HD EXT) Airport Terminal 263,118 12,616,800 48.0 1,396,833 5.3 6,560,736 24.93 3,785,040 14.39 2,271,024 8.63 301 RODGERS BV (CEN CONC VLT "Y") Airport Terminal 118,771 5,695,200 48.0 675,038 5.7 2,961,504 24.93 1,708,560 14.39 1,025,136 8.63 303 RODGERS BV #373 (DIA HD VLT "1D") Airport Terminal 159,600 7,653,000 48.0 868,980 5.4 3,979,560 24.93 2,295,900 14.39 1,377,540 8.63 3651 AOLELE ST (EWA CHILLER PLT) Airport Terminal 254,109 12,184,800 48.0 1,408,012 5.5 6,336,096 24.93 3,655,440 14.39 2,193,264 8.63 3650 AOLELE ST (NEW INTERISLE TERM) Airport Terminal 251,156 12,043,200 48.0 1,364,261 5.4 6,262,464 24.93 3,612,960 14.39 2,167,776 8.63 3661 AOLELE ST (EWA CONC GATES) Airport Terminal 55,031 2,638,800 48.0 303,361 5.5 1,372,176 24.93 791,640 14.39 474,984 8.63
Sub-TOTAL 2,208,338 99,459,040 45.0 11,325,476 5.1 51,718,701 23.42 29,837,712 13.51 17,902,627 8.11
LARGE FACILITIES (BUILDING AREA ESTIMATED) 2 PALI HY (PRIMECO & ST LTS) Highway Tunnel 17,511 788,640 45.0 102,437 5.9 410,093 23.42 236,592 13.51 141,955 8.11 0 WILSON TUNNEL Highway Tunnel 30,481 1,372,800 45.0 169,706 5.6 713,856 23.42 411,840 13.51 247,104 8.11 0 H-3 TUNNEL HAIKU IB PORTAL (HE INT) Highway Tunnel 88,459 3,984,000 45.0 592,960 6.7 2,071,680 23.42 1,195,200 13.51 717,120 8.11
Sub-TOTAL 136,450 6,145,440 45.0 865,103 6.3 3,195,629 23.42 1,843,632 13.51 1,106,179 8.11
MEDIUM AND SMALL FACILITIES (BUILDING AREA ESTIMATED) 1
Sub-TOTAL Highway Tunnel 196,129 8,833,250 45.0 1,286,573 6.3 4,593,290 23.42 2,649,975 13.51 1,589,985 8.11
Sub-TOTAL
TOTAL 2,540,917 114,437,730 45.0 13,477,152 5.3 59,507,620 23.42 34,331,319 13.51 20,598,791 8.11
1 Medium and small facilities electricity consumption is considered 7.7% of the corresponding department's total electricity consumption.1 Medium and small facilities electricity consumption cost is considered 9.5% of the corresponding department's total electricity consumption.NOTE: " LARGE FACILITIES (BUILDING AREA ESTIMATED)" and "MEDIUM AND SMALL FACILITIES" Area (sq.ft.) were estimated from their kWh/year divided by "LARGE FACILITIES (BUILDING AREA KNOWN)" kWh/sq.ft.-year.
Energy Use Energy Use Distribution by Utility
HVAC LIGHTING MISCELLANEOUS
STATE OF HAWAII FACILITIES IN OAHU ENERGY BENCHMARK ANALYSIS BY END USE
OperatingBuilding Name Building Schedule Year Area kWh/sq.ft. kWh/sq.ft. kWh/sq.ft. kWh/sq.ft.
Type hr. Built (sq.ft.) kWh/year -year $/year $/sq.ft.-year kWh/year -year kWh/year -year kWh/year -year
UH MANOA
LARGE FACILITIES (BUILDING AREA KNOWN) 1701 EAST WEST RD (FACILITIES MGMT) Class/Office 6,122,395 129,300,000 21.1 14,786,615 2.4 67,236,000 10.98 38,790,000 6.34 23,274,000 3.80 2680 WOODLAWN DR (ASTRONOMY FAC) Class/Office 46,340 2,315,400 50.0 273,801 5.9 1,204,008 25.98 694,620 14.99 416,772 8.99
Sub-TOTAL 6,168,735 131,615,400 21.3 15,060,416 2.4 68,440,008 11.09 39,484,620 6.40 23,690,772 3.84
LARGE FACILITIES (BUILDING AREA ESTIMATED) 2777 KALAKAUA AV (WAIKIKI AQUARIUM) Aquarium 62,194 1,326,960 21.3 161,912 2.6 690,019 11.09 398,088 6.40 238,853 3.84 46007 LILIPUNA RD (HIMB) Class/Office 77,709 1,658,000 21.3 202,771 2.6 862,160 11.09 497,400 6.40 298,440 3.84
Sub-TOTAL 139,903 2,984,960 21.3 364,683 2.6 1,552,179 11.09 895,488 6.40 537,293 3.84
MEDIUM AND SMALL FACILITIES (BUILDING AREA ESTIMATED) 1
Sub-TOTAL Class/Office 200,470 4,277,211 21.3 622,982 2.4 2,224,150 11.09 1,283,163 6.40 769,898 3.84
Sub-TOTAL
TOTAL 6,509,109 138,877,571 21.3 16,048,081 2.5 72,216,337 11.09 41,663,271 6.40 24,997,963 3.84
1 Medium and small facilities electricity consumption is considered 3.1% of the corresponding department's total electricity consumption.1 Medium and small facilities electricity consumption cost is considered 3.9% of the corresponding department's total electricity consumption.NOTE: " LARGE FACILITIES (BUILDING AREA ESTIMATED)" and "MEDIUM AND SMALL FACILITIES" Area (sq.ft.) were estimated from their kWh/year divided by "LARGE FACILITIES (BUILDING AREA KNOWN)" kWh/sq.ft.-year.
Energy Use Energy Use Distribution by Utility
HVAC LIGHTING MISCELLANEOUS

STATE OF HAWAII FACILITIES IN OAHU ENERGY BENCHMARK ANALYSIS BY END USE
OperatingBuilding Name Building Schedule Year Area kWh/sq.ft. kWh/sq.ft. kWh/sq.ft. kWh/sq.ft.
Type hr. Built (sq.ft.) kWh/year -year $/year $/sq.ft.-year kWh/year -year kWh/year -year kWh/year -year
DOE COMM COLL
LARGE FACILITIES (BUILDING AREA ESTIMATED) 96045 ALAIKE ST (LEEWARD) Class/Office 269,630 5,752,800 21.3 $730,218.00 2.7 2,991,456 11.09 1,725,840 6.40 1,035,504 3.84 655 MAKAPUU AV (KAPIOLANI BUSINESS) Class/Office 378,208 8,069,400 21.3 $1,049,593.00 2.8 4,196,088 11.09 2,420,820 6.40 1,452,492 3.84 874 DILLINGHAM BV (HONOLULU) Class/Office 234,628 5,006,000 21.3 $663,227.00 2.8 2,603,120 11.09 1,501,800 6.40 901,080 3.84 45720 KEAAHALA RD (HALE IMILOA) Class/Office 264,821 5,650,200 21.3 $692,104.00 2.6 2,938,104 11.09 1,695,060 6.40 1,017,036 3.84
Sub-TOTAL 1,147,288 24,478,400 21.3 3,135,142 2.7 12,728,768 11.09 7,343,520 6.40 4,406,112 3.84
MEDIUM AND SMALL FACILITIES (BUILDING AREA ESTIMATED) 1
Sub-TOTAL Class/Office 73,445 1,567,010 21.3 228,237 2.7 814,845 11.09 470,103 6.40 282,062 3.84
Sub-TOTAL
TOTAL 1,220,733 26,045,410 21.3 3,363,379 2.8 13,543,613 11.09 7,813,623 6.40 4,688,174 3.84
1 Medium and small facilities electricity consumption is considered 6.0 % of the corresponding department's total electricity consumption.1 Medium and small facilities electricity consumption cost is considered 6.8% of the corresponding department's total electricity consumption.NOTE: " LARGE FACILITIES" and "MEDIUM AND SMALL FACILITIES" Area (sq.ft.) were estimated from their kWh/year divided by "UH MANOA" kWh/sq.ft.-year.
Energy Use Energy Use Distribution by Utility
HVAC LIGHTING MISCELLANEOUS
STATE OF HAWAII FACILITIES IN OAHU ENERGY BENCHMARK ANALYSIS BY END USE
OperatingBuilding Name Building Schedule Year Area kWh/sq.ft. kWh/sq.ft. kWh/sq.ft. kWh/sq.ft.
Type hr. Built (sq.ft.) kWh/year -year $/year $/sq.ft.-year kWh/year -year kWh/year -year kWh/year -year
OTHER
LARGE FACILITIES DOES NOT EXIST
MEDIUM AND SMALL FACILITIES (BUILDING AREA ESTIMATED) 1
Sub-TOTAL Office 971,908 20,530,537 21.1 2,990,298 3.1 10,675,879 10.98 6,159,161 6.34 3,695,497 3.80
Sub-TOTAL
TOTAL 971,908 20,530,537 21.1 2,990,298 3.1 10,675,879 10.98 6,159,161 6.34 3,695,497 3.80
NOTE:"MEDIUM AND SMALL FACILITIES" Area (sq.ft.) were estimated from their kWh/year divided by "AVERAGE kWh/sq.ft.-year OF REST OF THE SOH FACILITIES".
* OTHER: Department of Attorney General Department of Labor and Industrial Relations Department of Land and Natural Resources Department of Hawaiian Homelands Department pf Agriculture Other Facilities
Energy Use Energy Use Distribution by Utility
HVAC LIGHTING MISCELLANEOUS

APPENDIX 10.0
Energy Conservation Measure Benchmark Analysis

ENERGY CONSERVATION MEASURESTATE OF HAWAII FACILITIES IN OAHU ENERGY ECM BENCHMARK
Operating Est. Energy Est. Cost Est. Construction Payback Est. Energy Est. Cost Est. Construction Payback Est. Energy Est. Cost Est. Construction PaybackBuilding Name Building Schedule Year- Area Savings (kWh/sf.ft. Savings ($/sq.ft. Costs ($/sq.ft. Savings (kWh/sf.ft. Savings ($/sq.ft. Costs ($/sq.ft. Savings (kWh/sf.ft. Savings ($/sq.ft. Costs ($/sq.ft.
Type hr. Built (sq.ft.) (kWh/year) -year) ($/year) -year) ($) -year) (year) (kWh/year) -year) ($/year) -year) ($) -year) (year) (kWh/year) -year) ($/year) -year) ($) -year) (year)
DAGS
LARGE FACILITIES (BUILDING AREA KNOWN) 415 SOUTH BERETANIA (STATE CAPITOL) Office 10 1969 300,000 284,700 0.949 40,800 0.136 276,300 0.921 6.8 16,500 0.055 6,300 0.021 25,500 0.085 4.0 41,700 0.139 5,400 0.018 33,000 0.110 6.1 919 ALA MOANA BLVD (AAFES) Office 10 108,000 102,492 0.949 14,688 0.136 99,468 0.921 6.8 5,940 0.055 2,268 0.021 9,180 0.085 4.0 15,012 0.139 1,944 0.018 11,880 0.110 6.1 1390 MILLER ST (QUEEN LILIOLULANI) Office 11.5 1943 94,528 0 0.000 0 0.000 0 0.000 0.0 5,199 0.055 1,985 0.021 8,035 0.085 4.0 13,139 0.139 1,702 0.018 10,398 0.110 6.1 1151 PUNCHBOWL ST (KALANIMOKU) Office 10 1976 203,000 192,647 0.949 27,608 0.136 186,963 0.921 6.8 11,165 0.055 4,263 0.021 17,255 0.085 4.0 28,217 0.139 3,654 0.018 22,330 0.110 6.1 1250 PUNCHBOWL ST (KINAU HALE) Office 11 1961 66,951 0 0.000 0 0.000 0 0.000 0.0 3,682 0.055 1,406 0.021 5,691 0.085 4.0 9,306 0.139 1,205 0.018 7,365 0.110 6.1 250 S HOTEL ST (NO. 1-DISTRICT BLDG) Office 10 120,000 113,880 0.949 16,320 0.136 110,520 0.921 6.8 6,600 0.055 2,520 0.021 10,200 0.085 4.0 16,680 0.139 2,160 0.018 13,200 0.110 6.1 465 S KING ST (KEKUANAO'A BLDG) Office 11 65,075 61,756 0.949 8,850 0.136 59,934 0.921 6.8 3,579 0.055 1,367 0.021 5,531 0.085 4.0 9,045 0.139 1,171 0.018 7,158 0.110 6.1 235 S BERETANIA ST (OFFICE TOWER) Office 10 1991 172,000 163,228 0.949 23,392 0.136 158,412 0.921 6.8 9,460 0.055 3,612 0.021 14,620 0.085 4.0 23,908 0.139 3,096 0.018 18,920 0.110 6.1 830 PUNCHBOWL ST (KEELIKOLANI & AUHAU) Office 12 1949 278,639 0 0.000 0 0.000 0 0.000 0.0 15,325 0.055 5,851 0.021 23,684 0.085 4.0 38,731 0.139 5,016 0.018 30,650 0.110 6.1 601 KAMOKILA BV (KAKUIHEIWA KAPOLEI) Office 10 1998 222,000 210,678 0.949 30,192 0.136 204,462 0.921 6.8 12,210 0.055 4,662 0.021 18,870 0.085 4.0 30,858 0.139 3,996 0.018 24,420 0.110 6.1 99500 SALT LAKE BV (STADIUM AUTHORITY) Stadium 300,000 284,700 0.949 40,800 0.136 276,300 0.921 6.8 16,500 0.055 6,300 0.021 25,500 0.085 4.0 41,700 0.139 5,400 0.018 33,000 0.110 6.1
Sub-TOTAL 1,930,193 1,414,081 0.733 202,650 0.105 1,372,359 0.711 6.8 106,161 0.055 40,534 0.021 164,066 0.085 4.0 268,297 0.139 34,743 0.018 212,321 0.110 6.1
MEDIUM AND SMALL FACILITIES (BUILDING AREA ESTIMATED)Sub-TOTAL Office 407,072 298,226 0.733 42,738 0.105 289,427 0.711 6.8 22,389 0.055 8,549 0.021 34,601 0.085 4.0 56,583 0.139 7,327 0.018 44,778 0.110 6.1
Sub-TOTAL
TOTAL 2,337,265 1,712,307 0.733 245,389 0.105 1,661,786 0.711 6.8 128,550 0.055 49,083 0.021 198,668 0.085 4.0 324,880 0.139 42,071 0.018 257,099 0.110 6.1
NOTES:Energy savings per sq.ft.-year, energy savings cost $ per sq.ft.-year, and consrtuction cost $ per sq.ft.-year are based on UH Energy Benchmarking Study with modifications and re-adjustments.Zero ECM savings in the table indicate that the ECM has already been implemented. HECO Rebate history from 1997 through 2004, and ESPC upgrade analysis conducted in 2004 were used to identify buildings with already implemented ECMs.Refer to the State Energy Benchmarking Study text Section 5.0 for a detailed discussion.
ECM I ECM II ECM IIIInterior and exterior lighting replacement LED exit sign Installation Relfective Solar Window Tinting

ENERGY CONSERVATION MEASURESTATE OF HAWAII FACILITIES IN OAHU ENERGY ECM BENCHMARK
Operating Est. Energy Est. Cost Est. Construction Payback Est. Energy Est. Cost Est. Construction Payback Est. Energy Est. Cost Est. Construction PaybackBuilding Name Building Schedule Year- Area Savings (kWh/sf.ft. Savings ($/sq.ft. Costs ($/sq.ft. Savings (kWh/sf.ft. Savings ($/sq.ft. Costs ($/sq.ft. Savings (kWh/sf.ft. Savings ($/sq.ft. Costs ($/sq.ft.
Type hr. Built (sq.ft.) (kWh/year) -year) ($/year) -year) ($) -year) (year) (kWh/year) -year) ($/year) -year) ($) -year) (year) (kWh/year) -year) ($/year) -year) ($) -year) (year)
JUDICIARY
LARGE FACILITIES (BUILDING AREA KNOWN) 777 PUNCHBOWL ST (KAAHUMANU HALE) Office 212,000 0 0.000 0 0.000 0 0.000 0.0 11,660 0.055 4,452 0.021 18,020 0.085 4.0 29,468 0.139 3,816 0.018 23,320 0.110 6.1 1111 ALAKEA ST (KAUIKEAOULI DIS CT 1ST C) Office 187,000 0 0.000 0 0.000 0 0.000 0.0 10,285 0.055 3,927 0.021 15,895 0.085 4.0 25,993 0.139 3,366 0.018 20,570 0.110 6.1 417 S KING ST (ALIIOLANE HALE) Office 62,200 0 0.000 0 0.000 0 0.000 0.0 3,421 0.055 1,306 0.021 5,287 0.085 4.0 8,646 0.139 1,120 0.018 6,842 0.110 6.1
Sub-TOTAL 461,200 0 0.000 0 0.000 0 0.000 0.0 25,366 0.055 9,685 0.021 39,202 0.085 4.0 64,107 0.139 8,302 0.018 50,732 0.110 6.1
MEDIUM AND SMALL FACILITIES (BUILDING AREA ESTIMATED)Sub-TOTAL Office 75,639 0 0.000 0 0.000 0 0.000 0.0 4,160 0.055 1,588 0.021 6,429 0.085 4.0 10,514 0.139 1,362 0.018 8,320 0.110 6.1
Sub-TOTAL
TOTAL 536,839 0 0.000 0 0.000 0 0.000 0.0 29,526 0.055 11,274 0.021 45,631 0.085 4.0 74,621 0.139 9,663 0.018 59,052 0.110 6.1
NOTES:Energy savings per sq.ft.-year, energy savings cost $ per sq.ft.-year, and consrtuction cost $ per sq.ft.-year are based on UH Energy Benchmarking Study with modifications and re-adjustments.Zero ECM savings in the table indicate that the ECM has already been implemented. HECO Rebate history from 1997 through 2004, and ESPC upgrade analysis conducted in 2004 were used to identify buildings with already implemented ECMs.Refer to the State Energy Benchmarking Study text Section 5.0 for a detailed discussion.
ECM I ECM II ECM IIIInterior and exterior lighting replacement LED exit sign Installation Relfective Solar Window Tinting

ENERGY CONSERVATION MEASURESTATE OF HAWAII FACILITIES IN OAHU ENERGY ECM BENCHMARK
Operating Est. Energy Est. Cost Est. Construction Payback Est. Energy Est. Cost Est. Construction Payback Est. Energy Est. Cost Est. Construction PaybackBuilding Name Building Schedule Year- Area Savings (kWh/sf.ft. Savings ($/sq.ft. Costs ($/sq.ft. Savings (kWh/sf.ft. Savings ($/sq.ft. Costs ($/sq.ft. Savings (kWh/sf.ft. Savings ($/sq.ft. Costs ($/sq.ft.
Type hr. Built (sq.ft.) (kWh/year) -year) ($/year) -year) ($) -year) (year) (kWh/year) -year) ($/year) -year) ($) -year) (year) (kWh/year) -year) ($/year) -year) ($) -year) (year)
DBEDT
LARGE FACILITIES (BUILDING AREA ESTIMATED) 1777 KAPIOLANI BV (HCC) Conv. Centr. 354,554 0 0.000 0 0.000 0 0.000 0.0 19,500 0.055 7,446 0.021 30,137 0.085 4.0 49,283 0.139 6,382 0.018 39,001 0.110 6.1
Sub-TOTAL 354,554 0 0.000 0 0.000 0 0.000 0.0 19,500 0.055 7,446 0.021 30,137 0.085 4.0 49,283 0.139 6,382 0.018 39,001 0.110 6.1
MEDIUM AND SMALL FACILITIES (BUILDING AREA ESTIMATED)Sub-TOTAL Office 265,489 251,949 0.949 36,106 0.136 244,515 0.921 6.8 14,602 0.055 5,575 0.021 22,567 0.085 4.0 36,903 0.139 4,779 0.018 29,204 0.110 6.1
Sub-TOTAL
TOTAL 620,043 251,949 0.406 36,106 0.058 244,515 0.394 6.8 34,102 0.055 13,021 0.021 52,704 0.085 4.0 86,186 0.139 11,161 0.018 68,205 0.110 6.1
NOTES:Energy savings per sq.ft.-year, energy savings cost $ per sq.ft.-year, and consrtuction cost $ per sq.ft.-year are based on UH Energy Benchmarking Study with modifications and re-adjustments.Zero ECM savings in the table indicate that the ECM has already been implemented. HECO Rebate history from 1997 through 2004, and ESPC upgrade analysis conducted in 2004 were used to identify buildings with already implemented ECMs.Refer to the State Energy Benchmarking Study text Section 5.0 for a detailed discussion.
ECM I ECM II ECM IIIInterior and exterior lighting replacement LED exit sign Installation Relfective Solar Window Tinting
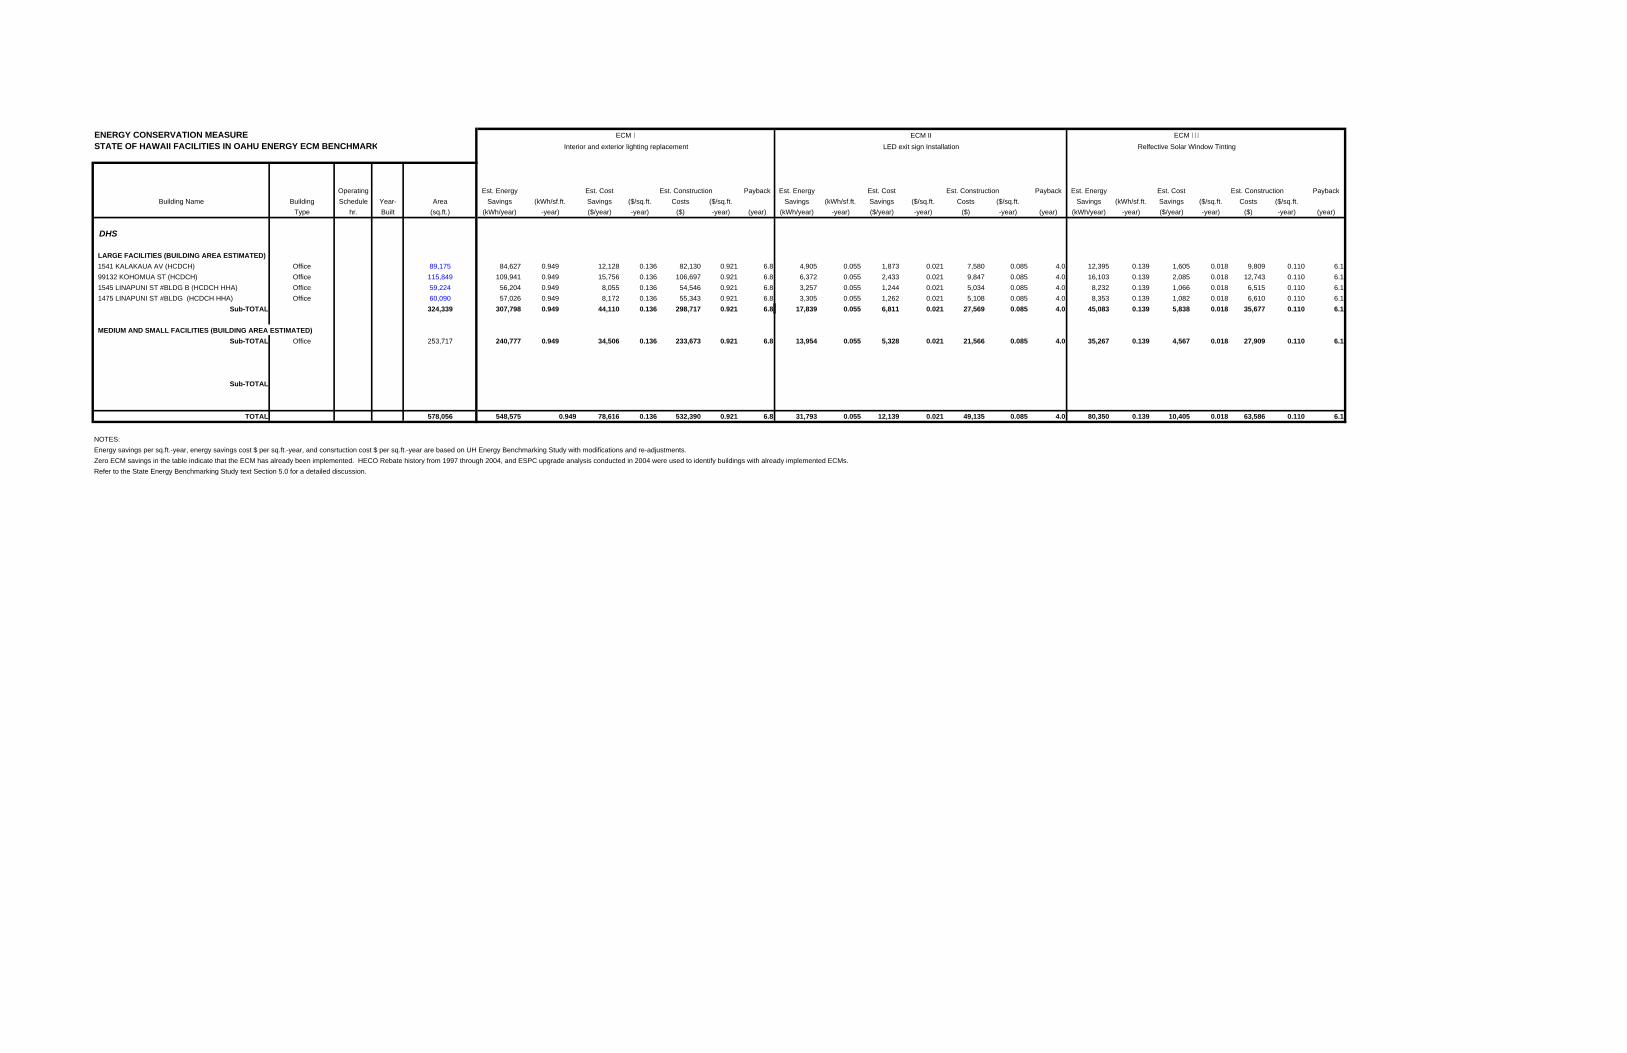
ENERGY CONSERVATION MEASURESTATE OF HAWAII FACILITIES IN OAHU ENERGY ECM BENCHMARK
Operating Est. Energy Est. Cost Est. Construction Payback Est. Energy Est. Cost Est. Construction Payback Est. Energy Est. Cost Est. Construction PaybackBuilding Name Building Schedule Year- Area Savings (kWh/sf.ft. Savings ($/sq.ft. Costs ($/sq.ft. Savings (kWh/sf.ft. Savings ($/sq.ft. Costs ($/sq.ft. Savings (kWh/sf.ft. Savings ($/sq.ft. Costs ($/sq.ft.
Type hr. Built (sq.ft.) (kWh/year) -year) ($/year) -year) ($) -year) (year) (kWh/year) -year) ($/year) -year) ($) -year) (year) (kWh/year) -year) ($/year) -year) ($) -year) (year)
DHS
LARGE FACILITIES (BUILDING AREA ESTIMATED) 1541 KALAKAUA AV (HCDCH) Office 89,175 84,627 0.949 12,128 0.136 82,130 0.921 6.8 4,905 0.055 1,873 0.021 7,580 0.085 4.0 12,395 0.139 1,605 0.018 9,809 0.110 6.1 99132 KOHOMUA ST (HCDCH) Office 115,849 109,941 0.949 15,756 0.136 106,697 0.921 6.8 6,372 0.055 2,433 0.021 9,847 0.085 4.0 16,103 0.139 2,085 0.018 12,743 0.110 6.1 1545 LINAPUNI ST #BLDG B (HCDCH HHA) Office 59,224 56,204 0.949 8,055 0.136 54,546 0.921 6.8 3,257 0.055 1,244 0.021 5,034 0.085 4.0 8,232 0.139 1,066 0.018 6,515 0.110 6.1 1475 LINAPUNI ST #BLDG (HCDCH HHA) Office 60,090 57,026 0.949 8,172 0.136 55,343 0.921 6.8 3,305 0.055 1,262 0.021 5,108 0.085 4.0 8,353 0.139 1,082 0.018 6,610 0.110 6.1
Sub-TOTAL 324,339 307,798 0.949 44,110 0.136 298,717 0.921 6.8 17,839 0.055 6,811 0.021 27,569 0.085 4.0 45,083 0.139 5,838 0.018 35,677 0.110 6.1
MEDIUM AND SMALL FACILITIES (BUILDING AREA ESTIMATED)Sub-TOTAL Office 253,717 240,777 0.949 34,506 0.136 233,673 0.921 6.8 13,954 0.055 5,328 0.021 21,566 0.085 4.0 35,267 0.139 4,567 0.018 27,909 0.110 6.1
Sub-TOTAL
TOTAL 578,056 548,575 0.949 78,616 0.136 532,390 0.921 6.8 31,793 0.055 12,139 0.021 49,135 0.085 4.0 80,350 0.139 10,405 0.018 63,586 0.110 6.1
NOTES:Energy savings per sq.ft.-year, energy savings cost $ per sq.ft.-year, and consrtuction cost $ per sq.ft.-year are based on UH Energy Benchmarking Study with modifications and re-adjustments.Zero ECM savings in the table indicate that the ECM has already been implemented. HECO Rebate history from 1997 through 2004, and ESPC upgrade analysis conducted in 2004 were used to identify buildings with already implemented ECMs.Refer to the State Energy Benchmarking Study text Section 5.0 for a detailed discussion.
Interior and exterior lighting replacement LED exit sign Installation Relfective Solar Window TintingECM I ECM II ECM III

ENERGY CONSERVATION MEASURESTATE OF HAWAII FACILITIES IN OAHU ENERGY ECM BENCHMARK
Operating Est. Energy Est. Cost Est. Construction Payback Est. Energy Est. Cost Est. Construction Payback Est. Energy Est. Cost Est. Construction PaybackBuilding Name Building Schedule Year- Area Savings (kWh/sf.ft. Savings ($/sq.ft. Costs ($/sq.ft. Savings (kWh/sf.ft. Savings ($/sq.ft. Costs ($/sq.ft. Savings (kWh/sf.ft. Savings ($/sq.ft. Costs ($/sq.ft.
Type hr. Built (sq.ft.) (kWh/year) -year) ($/year) -year) ($) -year) (year) (kWh/year) -year) ($/year) -year) ($) -year) (year) (kWh/year) -year) ($/year) -year) ($) -year) (year)
DOD
LARGE FACILITIES (BUILDING AREA KNOWN) 3949 DIAMOND HEAD RD Office 140,000 132,860 0.949 19,040 0.136 128,940 0.921 6.8 7,700 0.055 2,940 0.021 11,900 0.085 4.0 19,460 0.139 2,520 0.018 15,400 0.110 6.1
Sub-TOTAL 140,000 132,860 0.949 19,040 0.136 128,940 0.921 6.8 7,700 0.055 2,940 0.021 11,900 0.085 4.0 19,460 0.139 2,520 0.018 15,400 0.110 6.1
MEDIUM AND SMALL FACILITIES (BUILDING AREA ESTIMATED)Sub-TOTAL Office 388,803 368,974 0.949 52,877 0.136 358,088 0.921 6.8 21,384 0.055 8,165 0.021 33,048 0.085 4.0 54,044 0.139 6,998 0.018 42,768 0.110 6.1
Sub-TOTAL
TOTAL 528,803 501,834 0.949 71,917 0.136 487,028 0.921 6.8 29,084 0.055 11,105 0.021 44,948 0.085 4.0 73,504 0.139 9,518 0.018 58,168 0.110 6.1
NOTES:Energy savings per sq.ft.-year, energy savings cost $ per sq.ft.-year, and consrtuction cost $ per sq.ft.-year are based on UH Energy Benchmarking Study with modifications and re-adjustments.Zero ECM savings in the table indicate that the ECM has already been implemented. HECO Rebate history from 1997 through 2004, and ESPC upgrade analysis conducted in 2004 were used to identify buildings with already implemented ECMs.Refer to the State Energy Benchmarking Study text Section 5.0 for a detailed discussion.
ECM I ECM II ECM IIIInterior and exterior lighting replacement LED exit sign Installation Relfective Solar Window Tinting

ENERGY CONSERVATION MEASURESTATE OF HAWAII FACILITIES IN OAHU ENERGY ECM BENCHMARK
Operating Est. Energy Est. Cost Est. Construction Payback Est. Energy Est. Cost Est. Construction Payback Est. Energy Est. Cost Est. Construction PaybackBuilding Name Building Schedule Year- Area Savings (kWh/sf.ft. Savings ($/sq.ft. Costs ($/sq.ft. Savings (kWh/sf.ft. Savings ($/sq.ft. Costs ($/sq.ft. Savings (kWh/sf.ft. Savings ($/sq.ft. Costs ($/sq.ft.
Type hr. Built (sq.ft.) (kWh/year) -year) ($/year) -year) ($) -year) (year) (kWh/year) -year) ($/year) -year) ($) -year) (year) (kWh/year) -year) ($/year) -year) ($) -year) (year)
DOE
LARGE FACILITIES (BUILDING AREA ESTIMATED) 915007 KAPOLEI PKWY Classroom/Office 240,613 0 0.000 0 0.000 0 0.000 0.0 13,234 0.055 5,053 0.021 20,452 0.085 4.0 33,445 0.139 4,331 0.018 26,467 0.110 6.1 46155 KAMEHAMEHA HY Classroom/Office 80,672 0 0.000 0 0.000 0 0.000 0.0 4,437 0.055 1,694 0.021 6,857 0.085 4.0 11,213 0.139 1,452 0.018 8,874 0.110 6.1 91884 FT WEAVER RD Classroom/Office 136,608 129,641 0.949 18,579 0.136 125,816 0.921 6.8 7,513 0.055 2,869 0.021 11,612 0.085 4.0 18,989 0.139 2,459 0.018 15,027 0.110 6.1 2460 WAIMANO HOME RD (PEARL CITY HIGH) Classroom/Office 109,080 103,517 0.949 14,835 0.136 100,463 0.921 6.8 5,999 0.055 2,291 0.021 9,272 0.085 4.0 15,162 0.139 1,963 0.018 11,999 0.110 6.1 89980 NANAKULI AV (NANAKULI HIGH & INTER) Classroom/Office 98,800 93,761 0.949 13,437 0.136 90,995 0.921 6.8 5,434 0.055 2,075 0.021 8,398 0.085 4.0 13,733 0.139 1,778 0.018 10,868 0.110 6.1 85271 FARRINGTON HY (WAIANAE HIGH) Classroom/Office 87,552 83,087 0.949 11,907 0.136 80,635 0.921 6.8 4,815 0.055 1,839 0.021 7,442 0.085 4.0 12,170 0.139 1,576 0.018 9,631 0.110 6.1 951200 MEHEULA PARKWAY(MILILANI HIGH) Classroom/Office 113,040 0 0.000 0 0.000 0 0.000 0.0 6,217 0.055 2,374 0.021 9,608 0.085 4.0 15,713 0.139 2,035 0.018 12,434 0.110 6.1 45386 KANEOHE BAY DR (CASTLE HIGH) Classroom/Office 87,600 0 0.000 0 0.000 0 0.000 0.0 4,818 0.055 1,840 0.021 7,446 0.085 4.0 12,176 0.139 1,577 0.018 9,636 0.110 6.1 760 ILIAINA ST (KALAHEO) Classroom/Office 72,949 69,229 0.949 9,921 0.136 67,186 0.921 6.8 4,012 0.055 1,532 0.021 6,201 0.085 4.0 10,140 0.139 1,313 0.018 8,024 0.110 6.1 511 LUNALILO HOME RD (KAISER HIGH) Classroom/Office 98,000 93,002 0.949 13,328 0.136 90,258 0.921 6.8 5,390 0.055 2,058 0.021 8,330 0.085 4.0 13,622 0.139 1,764 0.018 10,780 0.110 6.1 4680 KALANIANAOLE HY (KALANI HIGH) Classroom/Office 37,749 0 0.000 0 0.000 0 0.000 0.0 2,076 0.055 793 0.021 3,209 0.085 4.0 5,247 0.139 679 0.018 4,152 0.110 6.1 2705 KAIMUKI AVE (KAIMUKI HIGH) Classroom/Office 146,907 139,414 0.949 19,979 0.136 135,301 0.921 6.8 8,080 0.055 3,085 0.021 12,487 0.085 4.0 20,420 0.139 2,644 0.018 16,160 0.110 6.1 1120 NEHOA ST (ROOSEVELT HIGH) Classroom/Office 77,720 0 0.000 0 0.000 0 0.000 0.0 4,275 0.055 1,632 0.021 6,606 0.085 4.0 10,803 0.139 1,399 0.018 8,549 0.110 6.1 1039 S KING ST (MCKINLEY HIGH) Classroom/Office 160,107 151,941 0.949 21,775 0.136 147,458 0.921 6.8 8,806 0.055 3,362 0.021 13,609 0.085 4.0 22,255 0.139 2,882 0.018 17,612 0.110 6.1 1185 ALA NAPUNANI ST (MOANALUA HIGH) Classroom/Office 116,667 110,717 0.949 15,867 0.136 107,450 0.921 6.8 6,417 0.055 2,450 0.021 9,917 0.085 4.0 16,217 0.139 2,100 0.018 12,833 0.110 6.1 911561 KEAUNUI RD HOLOMUA ELEMENTARY) Classroom/Office 110,496 0 0.000 0 0.000 0 0.000 0.0 6,077 0.055 2,320 0.021 9,392 0.085 4.0 15,359 0.139 1,989 0.018 12,155 0.110 6.1 951140 LEHIWA DR (MILILANI INTERMED) Classroom/Office 157,653 0 0.000 0 0.000 0 0.000 0.0 8,671 0.055 3,311 0.021 13,401 0.085 4.0 21,914 0.139 2,838 0.018 17,342 0.110 6.1 915335 KAPOLEI PKWY (KAPOLEI MID SCH) Classroom/Office 139,600 0 0.000 0 0.000 0 0.000 0.0 7,678 0.055 2,932 0.021 11,866 0.085 4.0 19,404 0.139 2,513 0.018 15,356 0.110 6.1 478 S KING ST (HAWAII STATE LIBRARY) Classroom/Office 63,151 59,930 0.949 8,589 0.136 58,162 0.921 6.8 3,473 0.055 1,326 0.021 5,368 0.085 4.0 8,778 0.139 1,137 0.018 6,947 0.110 6.1
Sub-TOTAL 2,134,964 1,034,239 0.484 148,216 0.069 1,003,725 0.470 6.8 117,423 0.055 44,834 0.021 181,472 0.085 4.0 296,760 0.139 38,429 0.018 234,846 0.110 6.1
MEDIUM AND SMALL FACILITIES (BUILDING AREA ESTIMATED)Sub-TOTAL Classroom/Office 5,694,686 2,758,673 0.484 395,342 0.069 2,677,279 0.470 6.8 313,208 0.055 119,588 0.021 484,048 0.085 4.0 791,561 0.139 102,504 0.018 626,415 0.110 6.1
Sub-TOTAL
TOTAL 7,829,650 3,792,913 0.484 543,558 0.069 3,681,004 0.470 6.8 430,631 0.055 164,423 0.021 665,520 0.085 4.0 1,088,321 0.139 140,934 0.018 861,261 0.110 6.1
NOTES:Energy savings per sq.ft.-year, energy savings cost $ per sq.ft.-year, and consrtuction cost $ per sq.ft.-year are based on UH Energy Benchmarking Study with modifications and re-adjustments.Zero ECM savings in the table indicate that the ECM has already been implemented. HECO Rebate history from 1997 through 2004, and ESPC upgrade analysis conducted in 2004 were used to identify buildings with already implemented ECMs.Refer to the State Energy Benchmarking Study text Section 5.0 for a detailed discussion.
ECM I ECM II ECM IIIInterior and exterior lighting replacement LED exit sign Installation Relfective Solar Window Tinting

ENERGY CONSERVATION MEASURESTATE OF HAWAII FACILITIES IN OAHU ENERGY ECM BENCHMARK
Operating Est. Energy Est. Cost Est. Construction Payback Est. Energy Est. Cost Est. Construction Payback Est. Energy Est. Cost Est. Construction PaybackBuilding Name Building Schedule Year- Area Savings (kWh/sf.ft. Savings ($/sq.ft. Costs ($/sq.ft. Savings (kWh/sf.ft. Savings ($/sq.ft. Costs ($/sq.ft. Savings (kWh/sf.ft. Savings ($/sq.ft. Costs ($/sq.ft.
Type hr. Built (sq.ft.) (kWh/year) -year) ($/year) -year) ($) -year) (year) (kWh/year) -year) ($/year) -year) ($) -year) (year) (kWh/year) -year) ($/year) -year) ($) -year) (year)
DOH
LARGE FACILITIES (BUILDING AREA KNOWN) 45747 KEAAHALA RD (HAWAII STATE HOSP) Hospital 226,475 214,925 0.949 30,801 0.136 208,583 0.921 6.8 12,456 0.055 4,756 0.021 19,250 0.085 4.0 31,480 0.139 4,077 0.018 24,912 0.110 6.1 45633 KEAAHALA RD Hospital 68,206 64,727 0.949 9,276 0.136 62,818 0.921 6.8 3,751 0.055 1,432 0.021 5,798 0.085 4.0 9,481 0.139 1,228 0.018 7,503 0.110 6.1 3627 KILAUEA AV (ADMIN SRVC OFF) Hospital 72,940 69,220 0.949 9,920 0.136 67,178 0.921 6.8 4,012 0.055 1,532 0.021 6,200 0.085 4.0 10,139 0.139 1,313 0.018 8,023 0.110 6.1 3675 KILAUEA AV Hospital 137,830 0 0.000 0 0.000 0 0.000 0.0 7,581 0.055 2,894 0.021 11,716 0.085 4.0 19,158 0.139 2,481 0.018 15,161 0.110 6.1 1103 HALA DR (MALUHIA HOSP) Hospital 99,700 0 0.000 0 0.000 0 0.000 0.0 5,484 0.055 2,094 0.021 8,475 0.085 4.0 13,858 0.139 1,795 0.018 10,967 0.110 6.1 2725 WAIMANO HOME RD (ADMIN OFF) Hospital 306,366 290,741 0.949 41,666 0.136 282,163 0.921 6.8 16,850 0.055 6,434 0.021 26,041 0.085 4.0 42,585 0.139 5,515 0.018 33,700 0.110 6.1
Sub-TOTAL 911,517 639,614 0.702 91,662 0.101 620,742 0.681 6.8 50,133 0.055 19,142 0.021 77,479 0.085 4.0 126,701 0.139 16,407 0.018 100,267 0.110 6.1
MEDIUM AND SMALL FACILITIES (BUILDING AREA ESTIMATED)Sub-TOTAL Hospital 695,353 487,931 0.702 69,925 0.101 473,535 0.681 6.8 38,244 0.055 14,602 0.021 59,105 0.085 4.0 96,654 0.139 12,516 0.018 76,489 0.110 6.1
Sub-TOTAL
TOTAL 1,606,870 1,127,545 0.702 161,587 0.101 1,094,277 0.681 6.8 88,378 0.055 33,744 0.021 136,584 0.085 4.0 223,355 0.139 28,924 0.018 176,756 0.110 6.1
NOTES:Energy savings per sq.ft.-year, energy savings cost $ per sq.ft.-year, and consrtuction cost $ per sq.ft.-year are based on UH Energy Benchmarking Study with modifications and re-adjustments.Zero ECM savings in the table indicate that the ECM has already been implemented. HECO Rebate history from 1997 through 2004, and ESPC upgrade analysis conducted in 2004 were used to identify buildings with already implemented ECMs.Refer to the State Energy Benchmarking Study text Section 5.0 for a detailed discussion.
ECM I ECM II ECM IIIInterior and exterior lighting replacement LED exit sign Installation Relfective Solar Window Tinting

ENERGY CONSERVATION MEASURESTATE OF HAWAII FACILITIES IN OAHU ENERGY ECM BENCHMARK
Operating Est. Energy Est. Cost Est. Construction Payback Est. Energy Est. Cost Est. Construction Payback Est. Energy Est. Cost Est. Construction PaybackBuilding Name Building Schedule Year- Area Savings (kWh/sf.ft. Savings ($/sq.ft. Costs ($/sq.ft. Savings (kWh/sf.ft. Savings ($/sq.ft. Costs ($/sq.ft. Savings (kWh/sf.ft. Savings ($/sq.ft. Costs ($/sq.ft.
Type hr. Built (sq.ft.) (kWh/year) -year) ($/year) -year) ($) -year) (year) (kWh/year) -year) ($/year) -year) ($) -year) (year) (kWh/year) -year) ($/year) -year) ($) -year) (year)
PSD
LARGE FACILITIES (BUILDING AREA ESTIMATED) 94560 KAMEHAMEHA HY (WAIAWA CORR FAC) Corr Fac 82,200 78,008 0.949 11,179 0.136 75,706 0.921 6.8 4,521 0.055 1,726 0.021 6,987 0.085 4.0 11,426 0.139 1,480 0.018 9,042 0.110 6.1 5100 MOANALUA RD Corr Fac 90,352 85,744 0.949 12,288 0.136 83,214 0.921 6.8 4,969 0.055 1,897 0.021 7,680 0.085 4.0 12,559 0.139 1,626 0.018 9,939 0.110 6.1 99902 MOANALUA RD (HALAWA PRISON) Corr Fac 339,800 322,470 0.949 46,213 0.136 312,956 0.921 6.8 18,689 0.055 7,136 0.021 28,883 0.085 4.0 47,232 0.139 6,116 0.018 37,378 0.110 6.1 2199 KAMEHAMEHA HY (OCCC & HSE CORR) Corr Fac 456,640 433,351 0.949 62,103 0.136 420,565 0.921 6.8 25,115 0.055 9,589 0.021 38,814 0.085 4.0 63,473 0.139 8,220 0.018 50,230 0.110 6.1 42477 KALANIANAOLE HY Corr Fac 118,741 112,686 0.949 16,149 0.136 109,361 0.921 6.8 6,531 0.055 2,494 0.021 10,093 0.085 4.0 16,505 0.139 2,137 0.018 13,062 0.110 6.1
Sub-TOTAL 1,087,733 1,032,259 0.949 147,932 0.136 1,001,802 0.921 6.8 59,825 0.055 22,842 0.021 92,457 0.085 4.0 151,195 0.139 19,579 0.018 119,651 0.110 6.1
MEDIUM AND SMALL FACILITIES (BUILDING AREA ESTIMATED)Sub-TOTAL Corr Fac 0 0 0.000 0 0.000 0 0.000 0.0 0 0.000 0 0.000 0 0.000 0.0 0 0.000 0 0.000 0 0.000 0.0
Sub-TOTAL
TOTAL 1,087,733 1,032,259 0.949 147,932 0.136 1,001,802 0.921 6.8 59,825 0.055 22,842 0.021 92,457 0.085 4.0 151,195 0.139 19,579 0.018 119,651 0.110 6.1
NOTES:Energy savings per sq.ft.-year, energy savings cost $ per sq.ft.-year, and consrtuction cost $ per sq.ft.-year are based on UH Energy Benchmarking Study with modifications and re-adjustments.Zero ECM savings in the table indicate that the ECM has already been implemented. HECO Rebate history from 1997 through 2004, and ESPC upgrade analysis conducted in 2004 were used to identify buildings with already implemented ECMs.Refer to the State Energy Benchmarking Study text Section 5.0 for a detailed discussion.
ECM I ECM II ECM IIIInterior and exterior lighting replacement LED exit sign Installation Relfective Solar Window Tinting

ENERGY CONSERVATION MEASURESTATE OF HAWAII FACILITIES IN OAHU ENERGY ECM BENCHMARK
Operating Est. Energy Est. Cost Est. Construction Payback Est. Energy Est. Cost Est. Construction Payback Est. Energy Est. Cost Est. Construction PaybackBuilding Name Building Schedule Year- Area Savings (kWh/sf.ft. Savings ($/sq.ft. Costs ($/sq.ft. Savings (kWh/sf.ft. Savings ($/sq.ft. Costs ($/sq.ft. Savings (kWh/sf.ft. Savings ($/sq.ft. Costs ($/sq.ft.
Type hr. Built (sq.ft.) (kWh/year) -year) ($/year) -year) ($) -year) (year) (kWh/year) -year) ($/year) -year) ($) -year) (year) (kWh/year) -year) ($/year) -year) ($) -year) (year)
DOT
LARGE FACILITIES (BUILDING AREA KNOWN) 40 PIER (KAPALAMA MIL RES) Military Reserve 133,340 126,540 0.949 18,134 0.136 122,806 0.921 6.8 7,334 0.055 2,800 0.021 11,334 0.085 4.0 18,534 0.139 2,400 0.018 14,667 0.110 6.1 869 PUNCHBOWL ST (TRANSPORTATION) Office 55,854 0 0.000 0 0.000 0 0.000 0.0 3,072 0.055 1,173 0.021 4,748 0.085 4.0 7,764 0.139 1,005 0.018 6,144 0.110 6.1 302 RODGERS BV #344 (IAB VAULT "B") Airport Terminal 269,775 0 0.000 0 0.000 0 0.000 0.0 14,838 0.055 5,665 0.021 22,931 0.085 4.0 37,499 0.139 4,856 0.018 29,675 0.110 6.1 302 RODGERS BV #342 (SVC CRT VLT "C") Airport Terminal 150,904 143,208 0.949 20,523 0.136 138,983 0.921 6.8 8,300 0.055 3,169 0.021 12,827 0.085 4.0 20,976 0.139 2,716 0.018 16,599 0.110 6.1 302 RODGERS BV #336 (OST VLT "N") Airport Terminal 353,110 335,101 0.949 48,023 0.136 325,214 0.921 6.8 19,421 0.055 7,415 0.021 30,014 0.085 4.0 49,082 0.139 6,356 0.018 38,842 0.110 6.1 304 RODGERS BV #360 (EWA VLT "1E") Airport Terminal 87,506 0 0.000 0 0.000 0 0.000 0.0 4,813 0.055 1,838 0.021 7,438 0.085 4.0 12,163 0.139 1,575 0.018 9,626 0.110 6.1 300 RODGERS BV (COMM TERM ELEC) Airport Terminal 25,101 23,821 0.949 3,414 0.136 23,118 0.921 6.8 1,381 0.055 527 0.021 2,134 0.085 4.0 3,489 0.139 452 0.018 2,761 0.110 6.1 300 RODGERS BV #355 (OSPARK VLT "A") Airport Terminal 30,963 29,384 0.949 4,211 0.136 28,517 0.921 6.8 1,703 0.055 650 0.021 2,632 0.085 4.0 4,304 0.139 557 0.018 3,406 0.110 6.1 301 RODGERS BV #A (DIA HD EXT) Airport Terminal 263,118 249,699 0.949 35,784 0.136 242,332 0.921 6.8 14,471 0.055 5,525 0.021 22,365 0.085 4.0 36,573 0.139 4,736 0.018 28,943 0.110 6.1 301 RODGERS BV (CEN CONC VLT "Y") Airport Terminal 118,771 0 0.000 0 0.000 0 0.000 0.0 6,532 0.055 2,494 0.021 10,096 0.085 4.0 16,509 0.139 2,138 0.018 13,065 0.110 6.1 303 RODGERS BV #373 (DIA HD VLT "1D") Airport Terminal 159,600 0 0.000 0 0.000 0 0.000 0.0 8,778 0.055 3,352 0.021 13,566 0.085 4.0 22,184 0.139 2,873 0.018 17,556 0.110 6.1 3651 AOLELE ST (EWA CHILLER PLT) Airport Terminal 254,109 241,149 0.949 34,559 0.136 234,034 0.921 6.8 13,976 0.055 5,336 0.021 21,599 0.085 4.0 35,321 0.139 4,574 0.018 27,952 0.110 6.1 3650 AOLELE ST (NEW INTERISLE TERM) Airport Terminal 251,156 0 0.000 0 0.000 0 0.000 0.0 13,814 0.055 5,274 0.021 21,348 0.085 4.0 34,911 0.139 4,521 0.018 27,627 0.110 6.1 3661 AOLELE ST (EWA CONC GATES) Airport Terminal 55,031 52,224 0.949 7,484 0.136 50,684 0.921 6.8 3,027 0.055 1,156 0.021 4,678 0.085 4.0 7,649 0.139 991 0.018 6,053 0.110 6.1
Sub-TOTAL 2,208,338 596,278 0.270 82,038 0.037 555,567 0.252 6.8 121,459 0.055 46,375 0.021 187,709 0.085 4.0 306,959 0.139 39,750 0.018 242,917 0.110 6.1
LARGE FACILITIES (BUILDING AREA ESTIMATED) 2 PALI HY (PRIMECO & ST LTS) Highway Tunnel 17,511 16,618 0.949 2,381 0.136 16,127 0.921 6.8 963 0.055 368 0.021 1,488 0.085 4.0 2,434 0.139 315 0.018 1,926 0.110 6.1 0 WILSON TUNNEL Highway Tunnel 30,481 28,926 0.949 4,145 0.136 28,073 0.921 6.8 1,676 0.055 640 0.021 2,591 0.085 4.0 4,237 0.139 549 0.018 3,353 0.110 6.1 0 H-3 TUNNEL HAIKU IB PORTAL (HE INT) Highway Tunnel 88,459 83,947 0.949 12,030 0.136 81,470 0.921 6.8 4,865 0.055 1,858 0.021 7,519 0.085 4.0 12,296 0.139 1,592 0.018 9,730 0.110 6.1
Sub-TOTAL 136,450 129,491 0.949 18,557 0.136 125,671 0.921 6.8 7,505 0.055 2,865 0.021 11,598 0.085 4.0 18,967 0.139 2,456 0.018 15,010 0.110 6.1
MEDIUM AND SMALL FACILITIES (BUILDING AREA ESTIMATED)Sub-TOTAL Highway Tunnel 196,129 186,126 0.949 26,674 0.136 180,635 0.921 6.8 10,787 0.055 4,119 0.021 16,671 0.085 4.0 27,262 0.139 3,530 0.018 21,574 0.110 6.1
Sub-TOTAL
TOTAL 2,540,917 911,895 0.359 127,269 0.050 861,872 0.339 6.8 139,750 0.055 53,359 0.021 215,978 0.085 4.0 353,187 0.139 45,737 0.018 279,501 0.110 6.1
NOTES:Energy savings per sq.ft.-year, energy savings cost $ per sq.ft.-year, and consrtuction cost $ per sq.ft.-year are based on UH Energy Benchmarking Study with modifications and re-adjustments.Zero ECM savings in the table indicate that the ECM has already been implemented. HECO Rebate history from 1997 through 2004, and ESPC upgrade analysis conducted in 2004 were used to identify buildings with already implemented ECMs.Refer to the State Energy Benchmarking Study text Section 5.0 for a detailed discussion.
ECM I ECM II ECM IIIInterior and exterior lighting replacement LED exit sign Installation Relfective Solar Window Tinting

ENERGY CONSERVATION MEASURESTATE OF HAWAII FACILITIES IN OAHU ENERGY ECM BENCHMARK
Operating Est. Energy Est. Cost Est. Construction Payback Est. Energy Est. Cost Est. Construction Payback Est. Energy Est. Cost Est. Construction PaybackBuilding Name Building Schedule Year- Area Savings (kWh/sf.ft. Savings ($/sq.ft. Costs ($/sq.ft. Savings (kWh/sf.ft. Savings ($/sq.ft. Costs ($/sq.ft. Savings (kWh/sf.ft. Savings ($/sq.ft. Costs ($/sq.ft.
Type hr. Built (sq.ft.) (kWh/year) -year) ($/year) -year) ($) -year) (year) (kWh/year) -year) ($/year) -year) ($) -year) (year) (kWh/year) -year) ($/year) -year) ($) -year) (year)
UH MANOA
LARGE FACILITIES (BUILDING AREA KNOWN) 1701 EAST WEST RD (FACILITIES MGMT) Class/Office 6,122,395 5,810,153 0.949 832,646 0.136 5,638,726 0.921 6.8 336,732 0.055 128,570 0.021 520,404 0.085 4.0 851,013 0.139 110,203 0.018 673,463 0.110 6.1 2680 WOODLAWN DR (ASTRONOMY FAC) Class/Office 46,340 43,977 0.949 6,302 0.136 42,679 0.921 6.8 2,549 0.055 973 0.021 3,939 0.085 4.0 6,441 0.139 834 0.018 5,097 0.110 6.1
Sub-TOTAL 6,168,735 5,854,130 0.949 838,948 0.136 5,681,405 0.921 6.8 339,280 0.055 129,543 0.021 524,342 0.085 4.0 857,454 0.139 111,037 0.018 678,561 0.110 6.1
LARGE FACILITIES (BUILDING AREA ESTIMATED) 2777 KALAKAUA AV (WAIKIKI AQUARIUM) Aquarium 62,194 59,022 0.949 8,458 0.136 57,281 0.921 6.8 3,421 0.055 1,306 0.021 5,286 0.085 4.0 8,645 0.139 1,119 0.018 6,841 0.110 6.1 46007 LILIPUNA RD (HIMB) Class/Office 77,709 73,746 0.949 10,568 0.136 71,570 0.921 6.8 4,274 0.055 1,632 0.021 6,605 0.085 4.0 10,802 0.139 1,399 0.018 8,548 0.110 6.1
Sub-TOTAL 139,903 132,768 0.949 19,027 0.136 128,851 0.921 6.8 7,695 0.055 2,938 0.021 11,892 0.085 4.0 19,447 0.139 2,518 0.018 15,389 0.110 6.1
MEDIUM AND SMALL FACILITIES (BUILDING AREA ESTIMATED)Sub-TOTAL Class/Office 200,470 190,246 0.949 27,264 0.136 184,633 0.921 6.8 11,026 0.055 4,210 0.021 17,040 0.085 4.0 27,865 0.139 3,608 0.018 22,052 0.110 6.1
Sub-TOTAL
TOTAL 6,509,109 6,177,144 0.949 885,239 0.136 5,994,889 0.921 6.8 358,001 0.055 136,691 0.021 553,274 0.085 4.0 904,766 0.139 117,164 0.018 716,002 0.110 6.1
NOTES:Energy savings per sq.ft.-year, energy savings cost $ per sq.ft.-year, and consrtuction cost $ per sq.ft.-year are based on UH Energy Benchmarking Study with modifications and re-adjustments.Zero ECM savings in the table indicate that the ECM has already been implemented. HECO Rebate history from 1997 through 2004, and ESPC upgrade analysis conducted in 2004 were used to identify buildings with already implemented ECMs.Refer to the State Energy Benchmarking Study text Section 5.0 for a detailed discussion.
ECM I ECM II ECM IIIInterior and exterior lighting replacement LED exit sign Installation Relfective Solar Window Tinting

ENERGY CONSERVATION MEASURESTATE OF HAWAII FACILITIES IN OAHU ENERGY ECM BENCHMARK
Operating Est. Energy Est. Cost Est. Construction Payback Est. Energy Est. Cost Est. Construction Payback Est. Energy Est. Cost Est. Construction PaybackBuilding Name Building Schedule Year- Area Savings (kWh/sf.ft. Savings ($/sq.ft. Costs ($/sq.ft. Savings (kWh/sf.ft. Savings ($/sq.ft. Costs ($/sq.ft. Savings (kWh/sf.ft. Savings ($/sq.ft. Costs ($/sq.ft.
Type hr. Built (sq.ft.) (kWh/year) -year) ($/year) -year) ($) -year) (year) (kWh/year) -year) ($/year) -year) ($) -year) (year) (kWh/year) -year) ($/year) -year) ($) -year) (year)
COMM COLL
LARGE FACILITIES (BUILDING AREA ESTIMATED) 96045 ALAIKE ST (LEEWARD) Class/Office 269,630 0 0.000 0 0.000 0 0.000 0.0 14,830 0.055 5,662 0.021 22,919 0.085 4.0 37,479 0.139 4,853 0.018 29,659 0.110 6.1 655 MAKAPUU AV (KAPIOLANI BUSINESS) Class/Office 378,208 0 0.000 0 0.000 0 0.000 0.0 20,801 0.055 7,942 0.021 32,148 0.085 4.0 52,571 0.139 6,808 0.018 41,603 0.110 6.1 874 DILLINGHAM BV (HONOLULU) Class/Office 234,628 0 0.000 0 0.000 0 0.000 0.0 12,905 0.055 4,927 0.021 19,943 0.085 4.0 32,613 0.139 4,223 0.018 25,809 0.110 6.1 45720 KEAAHALA RD (HALE IMILOA) Class/Office 264,821 0 0.000 0 0.000 0 0.000 0.0 14,565 0.055 5,561 0.021 22,510 0.085 4.0 36,810 0.139 4,767 0.018 29,130 0.110 6.1
Sub-TOTAL 1,147,288 0 0.000 0 0.000 0 0.000 0.0 63,101 0.055 24,093 0.021 97,519 0.085 4.0 159,473 0.139 20,651 0.018 126,202 0.110 6.1
MEDIUM AND SMALL FACILITIES (BUILDING AREA ESTIMATED)Sub-TOTAL Class/Office 73,445 69,699 0.949 9,988 0.136 67,643 0.921 6.8 4,039 0.055 1,542 0.021 6,243 0.085 4.0 10,209 0.139 1,322 0.018 8,079 0.110 6.1
Sub-TOTAL
TOTAL 1,220,733 69,699 0.057 9,988 0.008 67,643 0.055 6.8 67,140 0.055 25,635 0.021 103,762 0.085 4.0 169,682 0.139 21,973 0.018 134,281 0.110 6.1
NOTES:Energy savings per sq.ft.-year, energy savings cost $ per sq.ft.-year, and consrtuction cost $ per sq.ft.-year are based on UH Energy Benchmarking Study with modifications and re-adjustments.Zero ECM savings in the table indicate that the ECM has already been implemented. HECO Rebate history from 1997 through 2004, and ESPC upgrade analysis conducted in 2004 were used to identify buildings with already implemented ECMs.Refer to the State Energy Benchmarking Study text Section 5.0 for a detailed discussion.
ECM I ECM II ECM IIIInterior and exterior lighting replacement LED exit sign Installation Relfective Solar Window Tinting

ENERGY CONSERVATION MEASURESTATE OF HAWAII FACILITIES IN OAHU ENERGY ECM BENCHMARK
Operating Est. Energy Est. Cost Est. Construction Payback Est. Energy Est. Cost Est. Construction Payback Est. Energy Est. Cost Est. Construction PaybackBuilding Name Building Schedule Year- Area Savings (kWh/sf.ft. Savings ($/sq.ft. Costs ($/sq.ft. Savings (kWh/sf.ft. Savings ($/sq.ft. Costs ($/sq.ft. Savings (kWh/sf.ft. Savings ($/sq.ft. Costs ($/sq.ft.
Type hr. Built (sq.ft.) (kWh/year) -year) ($/year) -year) ($) -year) (year) (kWh/year) -year) ($/year) -year) ($) -year) (year) (kWh/year) -year) ($/year) -year) ($) -year) (year)
OTHER
LARGE FACILITIES DOES NOT EXIST
MEDIUM AND SMALL FACILITIES (BUILDING AREA ESTIMATED)Sub-TOTAL Office 971,908 922,340 0.949 132,179 0.136 895,127 0.921 6.8 53,455 0.055 20,410 0.021 82,612 0.085 4.0 135,095 0.139 17,494 0.018 106,910 0.110 6.1
Sub-TOTAL
TOTAL 971,908 922,340 0.949 132,179 0.136 895,127 0.921 6.8 53,455 0.055 20,410 0.021 82,612 0.085 4.0 135,095 0.139 17,494 0.018 106,910 0.110 6.1
NOTES:Energy savings per sq.ft.-year, energy savings cost $ per sq.ft.-year, and consrtuction cost $ per sq.ft.-year are based on UH Energy Benchmarking Study with modifications and re-adjustments.Zero ECM savings in the table indicate that the ECM has already been implemented. HECO Rebate history from 1997 through 2004, and ESPC upgrade analysis conducted in 2004 were used to identify buildings with already implemented ECMs.Refer to the State Energy Benchmarking Study text Section 5.0 for a detailed discussion.
ECM I ECM II ECM IIIInterior and exterior lighting replacement LED exit sign Installation Relfective Solar Window Tinting

ENERGY CONSERVATION MEASURESTATE OF HAWAII FACILITIES IN OAHU ENERGY ECM BENCHMARK
Operating Est. Energy Est. Cost Est. Construction Payback Est. Energy Est. Cost Est. Construction Payback Est. Energy Est. Cost Est. Construction Payback Est. Energy Est. Cost Est. Construction PaybackBuilding Name Building Schedule Year- Area Savings (kWh/sf.ft. Savings ($/sq.ft. Costs ($/sq.ft. Savings (kWh/sf.ft. Savings ($/sq.ft. Costs ($/sq.ft. Savings (kWh/sf.ft. Savings ($/sq.ft. Costs ($/sq.ft. Savings (kWh/sf.ft. Savings ($/sq.ft. Costs ($/sq.ft.
Type hr. Built (sq.ft.) (kWh/year) -year) ($/year) -year) ($) -year) (year) (kWh/year) -year) ($/year) -year) ($) -year) (year) (kWh/year) -year) ($/year) -year) ($) -year) (year) (kWh/year) -year) ($/year) -year) ($) -year) (year)
DAGS
LARGE FACILITIES (BUILDING AREA KNOWN) 415 SOUTH BERETANIA (STATE CAPITOL) Office 10 1969 300,000 502,500 1.675 64,200 0.214 858,000 2.860 13.4 219,600 0.732 28,200 0.094 131,700 0.439 4.7 40,500 0.135 5,100 0.017 35,400 0.118 6.9 16,560 0.055 2,130 0.007 4,800 0.016 2.3 919 ALA MOANA BLVD (AAFES) Office 10 108,000 180,900 1.675 23,112 0.214 308,880 2.860 13.4 79,056 0.732 10,152 0.094 47,412 0.439 4.7 0 0.000 0 0.000 0 0.000 0.0 5,962 0.055 767 0.007 1,728 0.016 2.3 1390 MILLER ST (QUEEN LILIOLULANI) Office 11.5 1943 94,528 0 0.000 0 0.000 0 0.000 0.0 0 0.000 0 0.000 0 0.000 0.0 12,761 0.135 1,607 0.017 11,154 0.118 6.9 5,218 0.055 671 0.007 1,512 0.016 2.3 1151 PUNCHBOWL ST (KALANIMOKU) Office 10 1976 203,000 340,025 1.675 43,442 0.214 580,580 2.860 13.4 148,596 0.732 19,082 0.094 89,117 0.439 4.7 27,405 0.135 3,451 0.017 23,954 0.118 6.9 11,206 0.055 1,441 0.007 3,248 0.016 2.3 1250 PUNCHBOWL ST (KINAU HALE) Office 11 1961 66,951 0 0.000 0 0.000 0 0.000 0.0 0 0.000 0 0.000 0 0.000 0.0 9,038 0.135 1,138 0.017 7,900 0.118 6.9 3,696 0.055 475 0.007 1,071 0.016 2.3 250 S HOTEL ST (NO. 1-DISTRICT BLDG) Office 10 120,000 201,000 1.675 25,680 0.214 343,200 2.860 13.4 87,840 0.732 11,280 0.094 52,680 0.439 4.7 16,200 0.135 2,040 0.017 14,160 0.118 6.9 6,624 0.055 852 0.007 1,920 0.016 2.3 465 S KING ST (KEKUANAO'A BLDG) Office 11 65,075 0 0.000 0 0.000 0 0.000 0.0 0 0.000 0 0.000 0 0.000 0.0 8,785 0.135 1,106 0.017 7,679 0.118 6.9 3,592 0.055 462 0.007 1,041 0.016 2.3 235 S BERETANIA ST (OFFICE TOWER) Office 10 1991 172,000 288,100 1.675 36,808 0.214 491,920 2.860 13.4 125,904 0.732 16,168 0.094 75,508 0.439 4.7 23,220 0.135 2,924 0.017 20,296 0.118 6.9 9,494 0.055 1,221 0.007 2,752 0.016 2.3 830 PUNCHBOWL ST (KEELIKOLANI & AUHAU) Office 12 1949 278,639 0 0.000 0 0.000 0 0.000 0.0 0 0.000 0 0.000 0 0.000 0.0 37,616 0.135 4,737 0.017 32,879 0.118 6.9 15,381 0.055 1,978 0.007 4,458 0.016 2.3 601 KAMOKILA BV (KAKUIHEIWA KAPOLEI) Office 10 1998 222,000 371,850 1.675 47,508 0.214 634,920 2.860 13.4 162,504 0.732 20,868 0.094 97,458 0.439 4.7 29,970 0.135 3,774 0.017 26,196 0.118 6.9 12,254 0.055 1,576 0.007 3,552 0.016 2.3 99500 SALT LAKE BV (STADIUM AUTHORITY) Stadium 300,000 502,500 1.675 64,200 0.214 858,000 2.860 13.4 219,600 0.732 28,200 0.094 131,700 0.439 4.7 40,500 0.135 5,100 0.017 35,400 0.118 6.9 16,560 0.055 2,130 0.007 4,800 0.016 2.3
Sub-TOTAL 1,930,193 2,386,875 1.237 304,950 0.158 4,075,500 2.111 13.4 1,043,100 0.540 133,950 0.069 625,575 0.324 4.7 245,996 0.127 30,977 0.016 215,019 0.111 6.9 106,547 0.055 13,704 0.007 30,883 0.016 2.3
MEDIUM AND SMALL FACILITIES (BUILDING AREA ESTIMATED)Sub-TOTAL Office 407,072 0 0.000 0 0.000 0 0.000 0.0 219,987 0.540 28,250 0.069 131,932 0.324 4.7 51,880 0.127 6,533 0.016 45,347 0.111 6.9 22,470 0.055 2,890 0.007 6,513 0.016 2.3
Sub-TOTAL
TOTAL 2,337,265 2,386,875 1.021 304,950 0.130 4,075,500 1.744 13.4 1,263,087 0.540 162,200 0.069 757,507 0.086 4.7 297,876 0.127 37,510 0.016 260,366 0.111 6.9 129,017 0.055 16,595 0.007 37,396 0.016 2.3
NOTES:Energy savings per sq.ft.-year, energy savings cost $ per sq.ft.-year, and consrtuction cost $ per sq.ft.-year are based on UH Energy Benchmarking Study with modifications and re-adjustments.Zero ECO savings in the table indicate that the ECO has already been implemented. HECO Rebate history from 1997 through 2004, and ESPC upgrade analysis conducted in 2004 were used to identify buildings with already implemented ECOs.Refer to the State Energy Benchmarking Study text Section 5.0 for a detailed discussion.
ECM IV ECM V ECM VI ECM VIIChiller Retrofits Variable Speed Drive Utilization Motor Replacement with High Efficiency - Pumps+Fans Waste Heat Recovery System

ENERGY CONSERVATION MEASURESTATE OF HAWAII FACILITIES IN OAHU ENERGY ECM BENCHMARK
Operating Est. Energy Est. Cost Est. Construction Payback Est. Energy Est. Cost Est. Construction Payback Est. Energy Est. Cost Est. Construction Payback Est. Energy Est. Cost Est. Construction PaybackBuilding Name Building Schedule Year- Area Savings (kWh/sf.ft. Savings ($/sq.ft. Costs ($/sq.ft. Savings (kWh/sf.ft. Savings ($/sq.ft. Costs ($/sq.ft. Savings (kWh/sf.ft. Savings ($/sq.ft. Costs ($/sq.ft. Savings (kWh/sf.ft. Savings ($/sq.ft. Costs ($/sq.ft.
Type hr. Built (sq.ft.) (kWh/year) -year) ($/year) -year) ($) -year) (year) (kWh/year) -year) ($/year) -year) ($) -year) (year) (kWh/year) -year) ($/year) -year) ($) -year) (year) (kWh/year) -year) ($/year) -year) ($) -year) (year)
JUDICIARY
LARGE FACILITIES (BUILDING AREA KNOWN) 777 PUNCHBOWL ST (KAAHUMANU HALE) Office 212,000 0 0.000 0 0.000 0 0.000 0.0 0 0.000 0 0.000 0 0.000 0.0 28,620 0.135 3,604 0.017 25,016 0.118 6.9 11,702 0.055 1,505 0.007 3,392 0.016 2.3 1111 ALAKEA ST (KAUIKEAOULI DIS CT 1ST C) Office 187,000 0 0.000 0 0.000 0 0.000 0.0 0 0.000 0 0.000 0 0.000 0.0 25,245 0.135 3,179 0.017 22,066 0.118 6.9 10,322 0.055 1,328 0.007 2,992 0.016 2.3 417 S KING ST (ALIIOLANE HALE) Office 62,200 104,185 1.675 13,311 0.214 177,892 2.860 13.4 45,530 0.732 5,847 0.094 27,306 0.439 4.7 8,397 0.135 1,057 0.017 7,340 0.118 6.9 3,433 0.055 442 0.007 995 0.016 2.3
Sub-TOTAL 461,200 104,185 0.226 13,311 0.029 177,892 0.386 13.4 45,530 0.099 5,847 0.013 27,306 0.059 4.7 62,262 0.135 7,840 0.017 54,422 0.118 6.9 25,458 0.055 3,275 0.007 7,379 0.016 2.3
MEDIUM AND SMALL FACILITIES (BUILDING AREA ESTIMATED)Sub-TOTAL Office 75,639 0 0.000 0 0.000 0 0.000 0.0 7,467 0.099 959 0.013 4,478 0.059 4.7 10,211 0.135 1,286 0.017 8,925 0.118 6.9 4,175 0.055 537 0.007 1,210 0.016 2.3
Sub-TOTAL
TOTAL 536,839 104,185 0.194 13,311 0.025 177,892 0.331 13.4 52,998 0.099 6,806 0.013 31,784 0.059 4.7 72,473 0.135 9,126 0.017 63,347 0.118 6.9 29,634 0.055 3,812 0.007 8,589 0.016 2.3
NOTES:Energy savings per sq.ft.-year, energy savings cost $ per sq.ft.-year, and consrtuction cost $ per sq.ft.-year are based on UH Energy Benchmarking Study with modifications and re-adjustments.Zero ECO savings in the table indicate that the ECO has already been implemented. HECO Rebate history from 1997 through 2004, and ESPC upgrade analysis conducted in 2004 were used to identify buildings with already implemented ECOs.Refer to the State Energy Benchmarking Study text Section 5.0 for a detailed discussion.
ECM IV ECM V ECM VI ECM VIIChiller Retrofits Variable Speed Drive Utilization Motor Replacement with High Efficiency - Pumps+Fans Waste Heat Recovery System

ENERGY CONSERVATION MEASURESTATE OF HAWAII FACILITIES IN OAHU ENERGY ECM BENCHMARK
Operating Est. Energy Est. Cost Est. Construction Payback Est. Energy Est. Cost Est. Construction Payback Est. Energy Est. Cost Est. Construction Payback Est. Energy Est. Cost Est. Construction PaybackBuilding Name Building Schedule Year- Area Savings (kWh/sf.ft. Savings ($/sq.ft. Costs ($/sq.ft. Savings (kWh/sf.ft. Savings ($/sq.ft. Costs ($/sq.ft. Savings (kWh/sf.ft. Savings ($/sq.ft. Costs ($/sq.ft. Savings (kWh/sf.ft. Savings ($/sq.ft. Costs ($/sq.ft.
Type hr. Built (sq.ft.) (kWh/year) -year) ($/year) -year) ($) -year) (year) (kWh/year) -year) ($/year) -year) ($) -year) (year) (kWh/year) -year) ($/year) -year) ($) -year) (year) (kWh/year) -year) ($/year) -year) ($) -year) (year)
DBEDT
LARGE FACILITIES (BUILDING AREA ESTIMATED) 1777 KAPIOLANI BV (HCC) Conv. Centr. 354,554 0 0.000 0 0.000 0 0.000 0.0 0 0.000 0 0.000 0 0.000 0.0 0 0.000 0 0.000 0 0.000 0.0 19,571 0.055 2,517 0.007 5,673 0.016 2.3
Sub-TOTAL 354,554 0 0.000 0 0.000 0 0.000 0.0 0 0.000 0 0.000 0 0.000 0.0 0 0.000 0 0.000 0 0.000 0.0 19,571 0.055 2,517 0.007 5,673 0.016 2.3
MEDIUM AND SMALL FACILITIES (BUILDING AREA ESTIMATED)Sub-TOTAL Office 265,489 0 0.000 0 0.000 0 0.000 0.0 194,338 0.732 24,956 0.094 116,550 0.439 4.7 35,841 0.135 4,513 0.017 31,328 0.118 6.9 14,655 0.055 1,885 0.007 4,248 0.016 2.3
Sub-TOTAL
TOTAL 620,043 0 0.000 0 0.000 0 0.000 #DIV/0! 194,338 0.313 24,956 0.040 116,550 0.188 4.7 35,841 0.058 4,513 0.007 31,328 0.051 6.9 34,226 0.055 4,402 0.007 9,921 0.016 2.3
NOTES:Energy savings per sq.ft.-year, energy savings cost $ per sq.ft.-year, and consrtuction cost $ per sq.ft.-year are based on UH Energy Benchmarking Study with modifications and re-adjustments.Zero ECO savings in the table indicate that the ECO has already been implemented. HECO Rebate history from 1997 through 2004, and ESPC upgrade analysis conducted in 2004 were used to identify buildings with already implemented ECOs.Refer to the State Energy Benchmarking Study text Section 5.0 for a detailed discussion.
ECM IV ECM V ECM VI ECM VIIChiller Retrofits Variable Speed Drive Utilization Motor Replacement with High Efficiency - Pumps+Fans Waste Heat Recovery System

ENERGY CONSERVATION MEASURESTATE OF HAWAII FACILITIES IN OAHU ENERGY ECM BENCHMARK
Operating Est. Energy Est. Cost Est. Construction Payback Est. Energy Est. Cost Est. Construction Payback Est. Energy Est. Cost Est. Construction Payback Est. Energy Est. Cost Est. Construction PaybackBuilding Name Building Schedule Year- Area Savings (kWh/sf.ft. Savings ($/sq.ft. Costs ($/sq.ft. Savings (kWh/sf.ft. Savings ($/sq.ft. Costs ($/sq.ft. Savings (kWh/sf.ft. Savings ($/sq.ft. Costs ($/sq.ft. Savings (kWh/sf.ft. Savings ($/sq.ft. Costs ($/sq.ft.
Type hr. Built (sq.ft.) (kWh/year) -year) ($/year) -year) ($) -year) (year) (kWh/year) -year) ($/year) -year) ($) -year) (year) (kWh/year) -year) ($/year) -year) ($) -year) (year) (kWh/year) -year) ($/year) -year) ($) -year) (year)
DHS
LARGE FACILITIES (BUILDING AREA ESTIMATED) 1541 KALAKAUA AV (HCDCH) Office 89,175 149,369 1.675 19,084 0.214 255,041 2.860 13.4 65,276 0.732 8,382 0.094 39,148 0.439 4.7 12,039 0.135 1,516 0.017 10,523 0.118 6.9 4,922 0.055 633 0.007 1,427 0.016 2.3 99132 KOHOMUA ST (HCDCH) Office 115,849 194,048 1.675 24,792 0.214 331,329 2.860 13.4 84,802 0.732 10,890 0.094 50,858 0.439 4.7 15,640 0.135 1,969 0.017 13,670 0.118 6.9 6,395 0.055 823 0.007 1,854 0.016 2.3 1545 LINAPUNI ST #BLDG B (HCDCH HHA) Office 59,224 99,201 1.675 12,674 0.214 169,382 2.860 13.4 43,352 0.732 5,567 0.094 26,000 0.439 4.7 7,995 0.135 1,007 0.017 6,988 0.118 6.9 3,269 0.055 420 0.007 948 0.016 2.3 1475 LINAPUNI ST #BLDG (HCDCH HHA) Office 60,090 100,651 1.675 12,859 0.214 171,858 2.860 13.4 43,986 0.732 5,648 0.094 26,380 0.439 4.7 8,112 0.135 1,022 0.017 7,091 0.118 6.9 3,317 0.055 427 0.007 961 0.016 2.3
Sub-TOTAL 324,339 543,268 1.675 69,409 0.214 927,611 2.860 13.4 237,416 0.732 30,488 0.094 142,385 0.439 4.7 43,786 0.135 5,514 0.017 38,272 0.118 6.9 17,904 0.055 2,303 0.007 5,189 0.016 2.3
MEDIUM AND SMALL FACILITIES (BUILDING AREA ESTIMATED)Sub-TOTAL Office 253,717 0 0.000 0 0.000 0 0.000 0.0 185,721 0.732 23,849 0.094 111,382 0.439 4.7 34,252 0.135 4,313 0.017 29,939 0.118 6.9 14,005 0.055 1,801 0.007 4,059 0.016 2.3
Sub-TOTAL
TOTAL 578,056 543,268 0.940 69,409 0.120 927,611 1.605 13.4 423,137 0.732 54,337 0.094 253,767 0.439 4.7 78,038 0.135 9,827 0.017 68,211 0.118 6.9 31,909 0.055 4,104 0.007 9,249 0.016 2.3
NOTES:Energy savings per sq.ft.-year, energy savings cost $ per sq.ft.-year, and consrtuction cost $ per sq.ft.-year are based on UH Energy Benchmarking Study with modifications and re-adjustments.Zero ECO savings in the table indicate that the ECO has already been implemented. HECO Rebate history from 1997 through 2004, and ESPC upgrade analysis conducted in 2004 were used to identify buildings with already implemented ECOs.Refer to the State Energy Benchmarking Study text Section 5.0 for a detailed discussion.
Chiller Retrofits Variable Speed Drive Utilization Motor Replacement with High Efficiency - Pumps+Fans Waste Heat Recovery SystemECM V ECM VI ECM VIIECM IV

ENERGY CONSERVATION MEASURESTATE OF HAWAII FACILITIES IN OAHU ENERGY ECM BENCHMARK
Operating Est. Energy Est. Cost Est. Construction Payback Est. Energy Est. Cost Est. Construction Payback Est. Energy Est. Cost Est. Construction Payback Est. Energy Est. Cost Est. Construction PaybackBuilding Name Building Schedule Year- Area Savings (kWh/sf.ft. Savings ($/sq.ft. Costs ($/sq.ft. Savings (kWh/sf.ft. Savings ($/sq.ft. Costs ($/sq.ft. Savings (kWh/sf.ft. Savings ($/sq.ft. Costs ($/sq.ft. Savings (kWh/sf.ft. Savings ($/sq.ft. Costs ($/sq.ft.
Type hr. Built (sq.ft.) (kWh/year) -year) ($/year) -year) ($) -year) (year) (kWh/year) -year) ($/year) -year) ($) -year) (year) (kWh/year) -year) ($/year) -year) ($) -year) (year) (kWh/year) -year) ($/year) -year) ($) -year) (year)
DOD
LARGE FACILITIES (BUILDING AREA KNOWN) 3949 DIAMOND HEAD RD Office 140,000 234,500 1.675 29,960 0.214 400,400 2.860 13.4 102,480 0.732 13,160 0.094 61,460 0.439 4.7 18,900 0.135 2,380 0.017 16,520 0.118 6.9 7,728 0.055 994 0.007 2,240 0.016 2.3
Sub-TOTAL 140,000 234,500 1.675 29,960 0.214 400,400 2.860 13.4 102,480 0.732 13,160 0.094 61,460 0.439 4.7 18,900 0.135 2,380 0.017 16,520 0.118 6.9 7,728 0.055 994 0.007 2,240 0.016 2.3
MEDIUM AND SMALL FACILITIES (BUILDING AREA ESTIMATED)Sub-TOTAL Office 388,803 0 0.000 0 0.000 0 0.000 0.0 284,604 0.732 36,547 0.094 170,685 0.439 4.7 52,488 0.135 6,610 0.017 45,879 0.118 6.9 21,462 0.055 2,761 0.007 6,221 0.016 2.3
Sub-TOTAL
TOTAL 528,803 234,500 0.443 29,960 0.057 400,400 0.757 13.4 387,084 0.732 49,707 0.094 232,145 0.439 4.7 71,388 0.135 8,990 0.017 62,399 0.118 6.9 29,190 0.055 3,755 0.007 8,461 0.016 2.3
NOTES:Energy savings per sq.ft.-year, energy savings cost $ per sq.ft.-year, and consrtuction cost $ per sq.ft.-year are based on UH Energy Benchmarking Study with modifications and re-adjustments.Zero ECO savings in the table indicate that the ECO has already been implemented. HECO Rebate history from 1997 through 2004, and ESPC upgrade analysis conducted in 2004 were used to identify buildings with already implemented ECOs.Refer to the State Energy Benchmarking Study text Section 5.0 for a detailed discussion.
ECM IV ECM V ECM VI ECM VIIChiller Retrofits Variable Speed Drive Utilization Motor Replacement with High Efficiency - Pumps+Fans Waste Heat Recovery System

ENERGY CONSERVATION MEASURESTATE OF HAWAII FACILITIES IN OAHU ENERGY ECM BENCHMARK
Operating Est. Energy Est. Cost Est. Construction Payback Est. Energy Est. Cost Est. Construction Payback Est. Energy Est. Cost Est. Construction Payback Est. Energy Est. Cost Est. Construction PaybackBuilding Name Building Schedule Year- Area Savings (kWh/sf.ft. Savings ($/sq.ft. Costs ($/sq.ft. Savings (kWh/sf.ft. Savings ($/sq.ft. Costs ($/sq.ft. Savings (kWh/sf.ft. Savings ($/sq.ft. Costs ($/sq.ft. Savings (kWh/sf.ft. Savings ($/sq.ft. Costs ($/sq.ft.
Type hr. Built (sq.ft.) (kWh/year) -year) ($/year) -year) ($) -year) (year) (kWh/year) -year) ($/year) -year) ($) -year) (year) (kWh/year) -year) ($/year) -year) ($) -year) (year) (kWh/year) -year) ($/year) -year) ($) -year) (year)
DOE
LARGE FACILITIES (BUILDING AREA ESTIMATED) 915007 KAPOLEI PKWY Classroom/Office 240,613 0 0.000 0 0.000 0 0.000 0.0 0 0.000 0 0.000 0 0.000 0.0 0 0.000 0 0.000 0 0.000 0.0 0 0.000 0 0.000 0 0.000 0.0 46155 KAMEHAMEHA HY Classroom/Office 80,672 0 0.000 0 0.000 0 0.000 0.0 0 0.000 0 0.000 0 0.000 0.0 10,891 0.135 1,371 0.017 9,519 0.118 6.9 0 0.000 0 0.000 0 0.000 0.0 91884 FT WEAVER RD Classroom/Office 136,608 0 0.000 0 0.000 0 0.000 0.0 0 0.000 0 0.000 0 0.000 0.0 18,442 0.135 2,322 0.017 16,120 0.118 6.9 0 0.000 0 0.000 0 0.000 0.0 2460 WAIMANO HOME RD (PEARL CITY HIGH) Classroom/Office 109,080 0 0.000 0 0.000 0 0.000 0.0 0 0.000 0 0.000 0 0.000 0.0 14,726 0.135 1,854 0.017 12,871 0.118 6.9 0 0.000 0 0.000 0 0.000 0.0 89980 NANAKULI AV (NANAKULI HIGH & INTER) Classroom/Office 98,800 0 0.000 0 0.000 0 0.000 0.0 0 0.000 0 0.000 0 0.000 0.0 13,338 0.135 1,680 0.017 11,658 0.118 6.9 0 0.000 0 0.000 0 0.000 0.0 85271 FARRINGTON HY (WAIANAE HIGH) Classroom/Office 87,552 0 0.000 0 0.000 0 0.000 0.0 0 0.000 0 0.000 0 0.000 0.0 11,820 0.135 1,488 0.017 10,331 0.118 6.9 0 0.000 0 0.000 0 0.000 0.0 951200 MEHEULA PARKWAY(MILILANI HIGH) Classroom/Office 113,040 0 0.000 0 0.000 0 0.000 0.0 0 0.000 0 0.000 0 0.000 0.0 15,260 0.135 1,922 0.017 13,339 0.118 6.9 0 0.000 0 0.000 0 0.000 0.0 45386 KANEOHE BAY DR (CASTLE HIGH) Classroom/Office 87,600 0 0.000 0 0.000 0 0.000 0.0 0 0.000 0 0.000 0 0.000 0.0 11,826 0.135 1,489 0.017 10,337 0.118 6.9 0 0.000 0 0.000 0 0.000 0.0 760 ILIAINA ST (KALAHEO) Classroom/Office 72,949 0 0.000 0 0.000 0 0.000 0.0 0 0.000 0 0.000 0 0.000 0.0 9,848 0.135 1,240 0.017 8,608 0.118 6.9 0 0.000 0 0.000 0 0.000 0.0 511 LUNALILO HOME RD (KAISER HIGH) Classroom/Office 98,000 0 0.000 0 0.000 0 0.000 0.0 0 0.000 0 0.000 0 0.000 0.0 13,230 0.135 1,666 0.017 11,564 0.118 6.9 0 0.000 0 0.000 0 0.000 0.0 4680 KALANIANAOLE HY (KALANI HIGH) Classroom/Office 37,749 0 0.000 0 0.000 0 0.000 0.0 0 0.000 0 0.000 0 0.000 0.0 5,096 0.135 642 0.017 4,454 0.118 6.9 0 0.000 0 0.000 0 0.000 0.0 2705 KAIMUKI AVE (KAIMUKI HIGH) Classroom/Office 146,907 0 0.000 0 0.000 0 0.000 0.0 0 0.000 0 0.000 0 0.000 0.0 19,832 0.135 2,497 0.017 17,335 0.118 6.9 0 0.000 0 0.000 0 0.000 0.0 1120 NEHOA ST (ROOSEVELT HIGH) Classroom/Office 77,720 0 0.000 0 0.000 0 0.000 0.0 0 0.000 0 0.000 0 0.000 0.0 10,492 0.135 1,321 0.017 9,171 0.118 6.9 0 0.000 0 0.000 0 0.000 0.0 1039 S KING ST (MCKINLEY HIGH) Classroom/Office 160,107 0 0.000 0 0.000 0 0.000 0.0 0 0.000 0 0.000 0 0.000 0.0 21,614 0.135 2,722 0.017 18,893 0.118 6.9 0 0.000 0 0.000 0 0.000 0.0 1185 ALA NAPUNANI ST (MOANALUA HIGH) Classroom/Office 116,667 0 0.000 0 0.000 0 0.000 0.0 0 0.000 0 0.000 0 0.000 0.0 15,750 0.135 1,983 0.017 13,767 0.118 6.9 0 0.000 0 0.000 0 0.000 0.0 911561 KEAUNUI RD HOLOMUA ELEMENTARY) Classroom/Office 110,496 0 0.000 0 0.000 0 0.000 0.0 0 0.000 0 0.000 0 0.000 0.0 14,917 0.135 1,878 0.017 13,039 0.118 6.9 0 0.000 0 0.000 0 0.000 0.0 951140 LEHIWA DR (MILILANI INTERMED) Classroom/Office 157,653 0 0.000 0 0.000 0 0.000 0.0 0 0.000 0 0.000 0 0.000 0.0 21,283 0.135 2,680 0.017 18,603 0.118 6.9 0 0.000 0 0.000 0 0.000 0.0 915335 KAPOLEI PKWY (KAPOLEI MID SCH) Classroom/Office 139,600 0 0.000 0 0.000 0 0.000 0.0 0 0.000 0 0.000 0 0.000 0.0 0 0.000 0 0.000 0 0.000 0.0 0 0.000 0 0.000 0 0.000 0.0 478 S KING ST (HAWAII STATE LIBRARY) Classroom/Office 63,151 0 0.000 0 0.000 0 0.000 0.0 0 0.000 0 0.000 0 0.000 0.0 8,525 0.135 1,074 0.017 7,452 0.118 6.9 0 0.000 0 0.000 0 0.000 0.0
Sub-TOTAL 2,134,964 0 0.000 0 0.000 0 0.000 0.0 0 0.000 0 0.000 0 0.000 0.0 236,891 0.111 29,831 0.014 207,061 0.097 6.9 0 0.000 0 0.000 0 0.000 0.0
MEDIUM AND SMALL FACILITIES (BUILDING AREA ESTIMATED)Sub-TOTAL Classroom/Office 5,694,686 0 0.000 0 0.000 0 0.000 0.0 0 0.000 0 0.000 0 0.000 0.0 631,871 0.111 79,569 0.014 552,302 0.097 6.9 0 0.000 0 0.000 0 0.000 0.0
Sub-TOTAL
TOTAL 7,829,650 0 0.000 0 0.000 0 0.000 0.0 0 0.000 0 0.000 0 0.000 0.0 868,762 0.111 109,400 0.014 759,363 0.097 6.9 0 0.000 0 0.000 0 0.000 0.0
NOTES:Energy savings per sq.ft.-year, energy savings cost $ per sq.ft.-year, and consrtuction cost $ per sq.ft.-year are based on UH Energy Benchmarking Study with modifications and re-adjustments.Zero ECO savings in the table indicate that the ECO has already been implemented. HECO Rebate history from 1997 through 2004, and ESPC upgrade analysis conducted in 2004 were used to identify buildings with already implemented ECOs.Refer to the State Energy Benchmarking Study text Section 5.0 for a detailed discussion.
ECM IV ECM V ECM VI ECM VIIChiller Retrofits Variable Speed Drive Utilization Motor Replacement with High Efficiency - Pumps+Fans Waste Heat Recovery System

ENERGY CONSERVATION MEASURESTATE OF HAWAII FACILITIES IN OAHU ENERGY ECM BENCHMARK
Operating Est. Energy Est. Cost Est. Construction Payback Est. Energy Est. Cost Est. Construction Payback Est. Energy Est. Cost Est. Construction Payback Est. Energy Est. Cost Est. Construction PaybackBuilding Name Building Schedule Year- Area Savings (kWh/sf.ft. Savings ($/sq.ft. Costs ($/sq.ft. Savings (kWh/sf.ft. Savings ($/sq.ft. Costs ($/sq.ft. Savings (kWh/sf.ft. Savings ($/sq.ft. Costs ($/sq.ft. Savings (kWh/sf.ft. Savings ($/sq.ft. Costs ($/sq.ft.
Type hr. Built (sq.ft.) (kWh/year) -year) ($/year) -year) ($) -year) (year) (kWh/year) -year) ($/year) -year) ($) -year) (year) (kWh/year) -year) ($/year) -year) ($) -year) (year) (kWh/year) -year) ($/year) -year) ($) -year) (year)
DOH
LARGE FACILITIES (BUILDING AREA KNOWN) 45747 KEAAHALA RD (HAWAII STATE HOSP) Hospital 226,475 379,346 1.675 48,466 0.214 647,719 2.860 13.4 165,780 0.732 21,289 0.094 99,423 0.439 4.7 30,574 0.135 3,850 0.017 26,724 0.118 6.9 12,501 0.055 1,608 0.007 3,624 0.016 2.3 45633 KEAAHALA RD Hospital 68,206 114,245 1.675 14,596 0.214 195,069 2.860 13.4 49,927 0.732 6,411 0.094 29,942 0.439 4.7 9,208 0.135 1,160 0.017 8,048 0.118 6.9 3,765 0.055 484 0.007 1,091 0.016 2.3 3627 KILAUEA AV (ADMIN SRVC OFF) Hospital 72,940 122,175 1.675 15,609 0.214 208,608 2.860 13.4 53,392 0.732 6,856 0.094 32,021 0.439 4.7 9,847 0.135 1,240 0.017 8,607 0.118 6.9 4,026 0.055 518 0.007 1,167 0.016 2.3 3675 KILAUEA AV Hospital 137,830 230,865 1.675 29,496 0.214 394,194 2.860 13.4 100,892 0.732 12,956 0.094 60,507 0.439 4.7 18,607 0.135 2,343 0.017 16,264 0.118 6.9 7,608 0.055 979 0.007 2,205 0.016 2.3 1103 HALA DR (MALUHIA HOSP) Hospital 99,700 166,998 1.675 21,336 0.214 285,142 2.860 13.4 72,980 0.732 9,372 0.094 43,768 0.439 4.7 13,460 0.135 1,695 0.017 11,765 0.118 6.9 5,503 0.055 708 0.007 1,595 0.016 2.3 2725 WAIMANO HOME RD (ADMIN OFF) Hospital 306,366 513,163 1.675 65,562 0.214 876,207 2.860 13.4 224,260 0.732 28,798 0.094 134,495 0.439 4.7 41,359 0.135 5,208 0.017 36,151 0.118 6.9 16,911 0.055 2,175 0.007 4,902 0.016 2.3
Sub-TOTAL 911,517 1,526,791 1.675 195,065 0.214 2,606,939 2.860 13.4 667,230 0.732 85,683 0.094 400,156 0.439 4.7 123,055 0.135 15,496 0.017 107,559 0.118 6.9 50,316 0.055 6,472 0.007 14,584 0.016 2.3
MEDIUM AND SMALL FACILITIES (BUILDING AREA ESTIMATED)Sub-TOTAL Hospital 695,353 0 0.000 0 0.000 0 0.000 0.0 508,999 0.732 65,363 0.094 305,260 0.439 4.7 93,873 0.135 11,821 0.017 82,052 0.118 6.9 38,384 0.055 4,937 0.007 11,126 0.016 2.3
Sub-TOTAL
TOTAL 1,606,870 1,526,791 0.950 195,065 0.121 2,606,939 1.622 13.4 1,176,229 0.732 151,046 0.094 705,416 0.439 4.7 216,928 0.135 27,317 0.017 189,611 0.118 6.9 88,699 0.055 11,409 0.007 25,710 0.016 2.3
NOTES:Energy savings per sq.ft.-year, energy savings cost $ per sq.ft.-year, and consrtuction cost $ per sq.ft.-year are based on UH Energy Benchmarking Study with modifications and re-adjustments.Zero ECO savings in the table indicate that the ECO has already been implemented. HECO Rebate history from 1997 through 2004, and ESPC upgrade analysis conducted in 2004 were used to identify buildings with already implemented ECOs.Refer to the State Energy Benchmarking Study text Section 5.0 for a detailed discussion.
ECM IV ECM V ECM VI ECM VIIChiller Retrofits Variable Speed Drive Utilization Motor Replacement with High Efficiency - Pumps+Fans Waste Heat Recovery System

ENERGY CONSERVATION MEASURESTATE OF HAWAII FACILITIES IN OAHU ENERGY ECM BENCHMARK
Operating Est. Energy Est. Cost Est. Construction Payback Est. Energy Est. Cost Est. Construction Payback Est. Energy Est. Cost Est. Construction Payback Est. Energy Est. Cost Est. Construction PaybackBuilding Name Building Schedule Year- Area Savings (kWh/sf.ft. Savings ($/sq.ft. Costs ($/sq.ft. Savings (kWh/sf.ft. Savings ($/sq.ft. Costs ($/sq.ft. Savings (kWh/sf.ft. Savings ($/sq.ft. Costs ($/sq.ft. Savings (kWh/sf.ft. Savings ($/sq.ft. Costs ($/sq.ft.
Type hr. Built (sq.ft.) (kWh/year) -year) ($/year) -year) ($) -year) (year) (kWh/year) -year) ($/year) -year) ($) -year) (year) (kWh/year) -year) ($/year) -year) ($) -year) (year) (kWh/year) -year) ($/year) -year) ($) -year) (year)
PSD
LARGE FACILITIES (BUILDING AREA ESTIMATED) 94560 KAMEHAMEHA HY (WAIAWA CORR FAC) Corr Fac 82,200 0 0.000 0 0.000 0 0.000 0.0 0 0.000 0 0.000 0 0.000 0.0 11,097 0.135 1,397 0.017 9,700 0.118 6.9 0 0.000 0 0.000 0 0.000 0.0 5100 MOANALUA RD Corr Fac 90,352 0 0.000 0 0.000 0 0.000 0.0 0 0.000 0 0.000 0 0.000 0.0 12,198 0.135 1,536 0.017 10,662 0.118 6.9 0 0.000 0 0.000 0 0.000 0.0 99902 MOANALUA RD (HALAWA PRISON) Corr Fac 339,800 0 0.000 0 0.000 0 0.000 0.0 0 0.000 0 0.000 0 0.000 0.0 45,873 0.135 5,777 0.017 40,096 0.118 6.9 0 0.000 0 0.000 0 0.000 0.0 2199 KAMEHAMEHA HY (OCCC & HSE CORR) Corr Fac 456,640 0 0.000 0 0.000 0 0.000 0.0 0 0.000 0 0.000 0 0.000 0.0 61,646 0.135 7,763 0.017 53,884 0.118 6.9 0 0.000 0 0.000 0 0.000 0.0 42477 KALANIANAOLE HY Corr Fac 118,741 0 0.000 0 0.000 0 0.000 0.0 0 0.000 0 0.000 0 0.000 0.0 16,030 0.135 2,019 0.017 14,011 0.118 6.9 0 0.000 0 0.000 0 0.000 0.0
Sub-TOTAL 1,087,733 0 0.000 0 0.000 0 0.000 0.0 0 0.000 0 0.000 0 0.000 0.0 146,844 0.135 18,491 0.017 128,353 0.118 6.9 0 0.000 0 0.000 0 0.000 0.0
MEDIUM AND SMALL FACILITIES (BUILDING AREA ESTIMATED)Sub-TOTAL Corr Fac 0 0 0.000 0 0.000 0 0.000 0.0 0 0.000 0 0.000 0 0.000 0.0 0 0.000 0 0.000 0 0.000 0.0 0 0.000 0 0.000 0 0.000 0.0
Sub-TOTAL
TOTAL 1,087,733 0 0.000 0 0.000 0 0.000 0.0 0 0.000 0 0.000 0 0.000 0.0 146,844 0.135 18,491 0.017 128,353 0.118 6.9 0 0.000 0 0.000 0 0.000 0.0
NOTES:Energy savings per sq.ft.-year, energy savings cost $ per sq.ft.-year, and consrtuction cost $ per sq.ft.-year are based on UH Energy Benchmarking Study with modifications and re-adjustments.Zero ECO savings in the table indicate that the ECO has already been implemented. HECO Rebate history from 1997 through 2004, and ESPC upgrade analysis conducted in 2004 were used to identify buildings with already implemented ECOs.Refer to the State Energy Benchmarking Study text Section 5.0 for a detailed discussion.
ECM IV ECM V ECM VI ECM VIIChiller Retrofits Variable Speed Drive Utilization Motor Replacement with High Efficiency - Pumps+Fans Waste Heat Recovery System

ENERGY CONSERVATION MEASURESTATE OF HAWAII FACILITIES IN OAHU ENERGY ECM BENCHMARK
Operating Est. Energy Est. Cost Est. Construction Payback Est. Energy Est. Cost Est. Construction Payback Est. Energy Est. Cost Est. Construction Payback Est. Energy Est. Cost Est. Construction PaybackBuilding Name Building Schedule Year- Area Savings (kWh/sf.ft. Savings ($/sq.ft. Costs ($/sq.ft. Savings (kWh/sf.ft. Savings ($/sq.ft. Costs ($/sq.ft. Savings (kWh/sf.ft. Savings ($/sq.ft. Costs ($/sq.ft. Savings (kWh/sf.ft. Savings ($/sq.ft. Costs ($/sq.ft.
Type hr. Built (sq.ft.) (kWh/year) -year) ($/year) -year) ($) -year) (year) (kWh/year) -year) ($/year) -year) ($) -year) (year) (kWh/year) -year) ($/year) -year) ($) -year) (year) (kWh/year) -year) ($/year) -year) ($) -year) (year)
DOT
LARGE FACILITIES (BUILDING AREA KNOWN) 40 PIER (KAPALAMA MIL RES) Military Reserve 133,340 223,345 1.675 28,535 0.214 381,352 2.860 13.4 97,605 0.732 12,534 0.094 58,536 0.439 4.7 18,001 0.135 2,267 0.017 15,734 0.118 6.9 7,360 0.055 947 0.007 2,133 0.016 2.3 869 PUNCHBOWL ST (TRANSPORTATION) Office 55,854 93,555 1.675 11,953 0.214 159,742 2.860 13.4 40,885 0.732 5,250 0.094 24,520 0.439 4.7 7,540 0.135 950 0.017 6,591 0.118 6.9 3,083 0.055 397 0.007 894 0.016 2.3 302 RODGERS BV #344 (IAB VAULT "B") Airport Terminal 269,775 451,873 1.675 57,732 0.214 771,557 2.860 13.4 197,475 0.732 25,359 0.094 118,431 0.439 4.7 36,420 0.135 4,586 0.017 31,833 0.118 6.9 14,892 0.055 1,915 0.007 4,316 0.016 2.3 302 RODGERS BV #342 (SVC CRT VLT "C") Airport Terminal 150,904 252,764 1.675 32,293 0.214 431,585 2.860 13.4 110,462 0.732 14,185 0.094 66,247 0.439 4.7 20,372 0.135 2,565 0.017 17,807 0.118 6.9 8,330 0.055 1,071 0.007 2,414 0.016 2.3 302 RODGERS BV #336 (OST VLT "N") Airport Terminal 353,110 591,459 1.675 75,566 0.214 1,009,895 2.860 13.4 258,477 0.732 33,192 0.094 155,015 0.439 4.7 47,670 0.135 6,003 0.017 41,667 0.118 6.9 19,492 0.055 2,507 0.007 5,650 0.016 2.3 304 RODGERS BV #360 (EWA VLT "1E") Airport Terminal 87,506 146,573 1.675 18,726 0.214 250,267 2.860 13.4 64,054 0.732 8,226 0.094 38,415 0.439 4.7 11,813 0.135 1,488 0.017 10,326 0.118 6.9 4,830 0.055 621 0.007 1,400 0.016 2.3 300 RODGERS BV (COMM TERM ELEC) Airport Terminal 25,101 42,044 1.675 5,372 0.214 71,789 2.860 13.4 18,374 0.732 2,359 0.094 11,019 0.439 4.7 3,389 0.135 427 0.017 2,962 0.118 6.9 1,386 0.055 178 0.007 402 0.016 2.3 300 RODGERS BV #355 (OSPARK VLT "A") Airport Terminal 30,963 51,863 1.675 6,626 0.214 88,554 2.860 13.4 22,665 0.732 2,911 0.094 13,593 0.439 4.7 4,180 0.135 526 0.017 3,654 0.118 6.9 1,709 0.055 220 0.007 495 0.016 2.3 301 RODGERS BV #A (DIA HD EXT) Airport Terminal 263,118 440,723 1.675 56,307 0.214 752,517 2.860 13.4 192,602 0.732 24,733 0.094 115,509 0.439 4.7 35,521 0.135 4,473 0.017 31,048 0.118 6.9 14,524 0.055 1,868 0.007 4,210 0.016 2.3 301 RODGERS BV (CEN CONC VLT "Y") Airport Terminal 118,771 198,941 1.675 25,417 0.214 339,685 2.860 13.4 86,940 0.732 11,164 0.094 52,140 0.439 4.7 16,034 0.135 2,019 0.017 14,015 0.118 6.9 6,556 0.055 843 0.007 1,900 0.016 2.3 303 RODGERS BV #373 (DIA HD VLT "1D") Airport Terminal 159,600 267,330 1.675 34,154 0.214 456,456 2.860 13.4 116,827 0.732 15,002 0.094 70,064 0.439 4.7 21,546 0.135 2,713 0.017 18,833 0.118 6.9 8,810 0.055 1,133 0.007 2,554 0.016 2.3 3651 AOLELE ST (EWA CHILLER PLT) Airport Terminal 254,109 425,633 1.675 54,379 0.214 726,752 2.860 13.4 186,008 0.732 23,886 0.094 111,554 0.439 4.7 34,305 0.135 4,320 0.017 29,985 0.118 6.9 14,027 0.055 1,804 0.007 4,066 0.016 2.3 3650 AOLELE ST (NEW INTERISLE TERM) Airport Terminal 251,156 420,686 1.675 53,747 0.214 718,306 2.860 13.4 183,846 0.732 23,609 0.094 110,257 0.439 4.7 33,906 0.135 4,270 0.017 29,636 0.118 6.9 13,864 0.055 1,783 0.007 4,018 0.016 2.3 3661 AOLELE ST (EWA CONC GATES) Airport Terminal 55,031 92,177 1.675 11,777 0.214 157,389 2.860 13.4 40,283 0.732 5,173 0.094 24,159 0.439 4.7 7,429 0.135 936 0.017 6,494 0.118 6.9 3,038 0.055 391 0.007 880 0.016 2.3
Sub-TOTAL 2,208,338 3,698,966 1.675 472,584 0.214 6,315,847 2.860 13.4 1,616,503 0.732 207,584 0.094 969,460 0.439 4.7 298,126 0.135 37,542 0.017 260,584 0.118 6.9 121,900 0.055 15,679 0.007 35,333 0.016 2.3
LARGE FACILITIES (BUILDING AREA ESTIMATED) 2 PALI HY (PRIMECO & ST LTS) Highway Tunnel 17,511 0 0.000 0 0.000 0 0.000 0.0 0 0.000 0 0.000 0 0.000 0.0 2,364 0.135 298 0.017 2,066 0.118 6.9 0 0.000 0 0.000 0 0.000 0.0 0 WILSON TUNNEL Highway Tunnel 30,481 0 0.000 0 0.000 0 0.000 0.0 0 0.000 0 0.000 0 0.000 0.0 4,115 0.135 518 0.017 3,597 0.118 6.9 0 0.000 0 0.000 0 0.000 0.0 0 H-3 TUNNEL HAIKU IB PORTAL (HE INT) Highway Tunnel 88,459 0 0.000 0 0.000 0 0.000 0.0 0 0.000 0 0.000 0 0.000 0.0 11,942 0.135 1,504 0.017 10,438 0.118 6.9 0 0.000 0 0.000 0 0.000 0.0
Sub-TOTAL 136,450 0 0.000 0 0.000 0 0.000 0.0 0 0.000 0 0.000 0 0.000 0.0 18,421 0.135 2,320 0.017 16,101 0.118 6.9 0 0.000 0 0.000 0 0.000 0.0
MEDIUM AND SMALL FACILITIES (BUILDING AREA ESTIMATED)Sub-TOTAL Highway Tunnel 196,129 0 0.000 0 0.000 0 0.000 0.0 0 0.000 0 0.000 0 0.000 0.0 26,477 0.135 3,334 0.017 23,143 0.118 6.9 0 0.000 0 0.000 0 0.000 0.0
Sub-TOTAL
TOTAL 2,540,917 3,698,966 1.456 472,584 0.186 6,315,847 2.486 13.4 1,616,503 0.636 207,584 0.082 969,460 0.382 4.7 343,024 0.135 43,196 0.017 299,828 0.118 6.9 121,900 0.048 15,679 0.006 35,333 0.014 2.3
NOTES:Energy savings per sq.ft.-year, energy savings cost $ per sq.ft.-year, and consrtuction cost $ per sq.ft.-year are based on UH Energy Benchmarking Study with modifications and re-adjustments.Zero ECO savings in the table indicate that the ECO has already been implemented. HECO Rebate history from 1997 through 2004, and ESPC upgrade analysis conducted in 2004 were used to identify buildings with already implemented ECOs.Refer to the State Energy Benchmarking Study text Section 5.0 for a detailed discussion.
ECM IV ECM V ECM VI ECM VIIChiller Retrofits Variable Speed Drive Utilization Motor Replacement with High Efficiency - Pumps+Fans Waste Heat Recovery System

ENERGY CONSERVATION MEASURESTATE OF HAWAII FACILITIES IN OAHU ENERGY ECM BENCHMARK
Operating Est. Energy Est. Cost Est. Construction Payback Est. Energy Est. Cost Est. Construction Payback Est. Energy Est. Cost Est. Construction Payback Est. Energy Est. Cost Est. Construction PaybackBuilding Name Building Schedule Year- Area Savings (kWh/sf.ft. Savings ($/sq.ft. Costs ($/sq.ft. Savings (kWh/sf.ft. Savings ($/sq.ft. Costs ($/sq.ft. Savings (kWh/sf.ft. Savings ($/sq.ft. Costs ($/sq.ft. Savings (kWh/sf.ft. Savings ($/sq.ft. Costs ($/sq.ft.
Type hr. Built (sq.ft.) (kWh/year) -year) ($/year) -year) ($) -year) (year) (kWh/year) -year) ($/year) -year) ($) -year) (year) (kWh/year) -year) ($/year) -year) ($) -year) (year) (kWh/year) -year) ($/year) -year) ($) -year) (year)
UH MANOA
LARGE FACILITIES (BUILDING AREA KNOWN) 1701 EAST WEST RD (FACILITIES MGMT) Class/Office 6,122,395 10,255,012 1.675 1,310,193 0.214 17,510,050 2.860 13.4 4,481,593 0.732 575,505 0.094 2,687,731 0.439 4.7 0 0.000 0 0.000 0 0.000 0.0 337,956 0.055 43,469 0.007 97,958 0.016 2.3 2680 WOODLAWN DR (ASTRONOMY FAC) Class/Office 46,340 77,620 1.675 9,917 0.214 132,532 2.860 13.4 33,921 0.732 4,356 0.094 20,343 0.439 4.7 0 0.000 0 0.000 0 0.000 0.0 2,558 0.055 329 0.007 741 0.016 2.3
Sub-TOTAL 6,168,735 10,332,631 1.675 1,320,109 0.214 17,642,582 2.860 13.4 4,515,514 0.732 579,861 0.094 2,708,075 0.439 4.7 0 0.000 0 0.000 0 0.000 0.0 340,514 0.055 43,798 0.007 98,700 0.016 2.3
LARGE FACILITIES (BUILDING AREA ESTIMATED) 2777 KALAKAUA AV (WAIKIKI AQUARIUM) Aquarium 62,194 104,175 1.675 13,309 0.214 177,874 2.860 13.4 45,526 0.732 5,846 0.094 27,303 0.439 4.7 8,396 0.135 1,057 0.017 7,339 0.118 6.9 3,433 0.055 442 0.007 995 0.016 2.3 46007 LILIPUNA RD (HIMB) Class/Office 77,709 130,163 1.675 16,630 0.214 222,249 2.860 13.4 56,883 0.732 7,305 0.094 34,114 0.439 4.7 10,491 0.135 1,321 0.017 9,170 0.118 6.9 4,290 0.055 552 0.007 1,243 0.016 2.3
Sub-TOTAL 139,903 234,338 1.675 29,939 0.214 400,123 2.860 13.4 102,409 0.732 13,151 0.094 61,418 0.439 4.7 18,887 0.135 2,378 0.017 16,509 0.118 6.9 7,723 0.055 993 0.007 2,238 0.016 2.3
MEDIUM AND SMALL FACILITIES (BUILDING AREA ESTIMATED)Sub-TOTAL Class/Office 200,470 0 0.000 0 0.000 0 0.000 0.0 146,744 0.732 18,844 0.094 88,006 0.439 4.7 27,063 0.135 3,408 0.017 23,655 0.118 6.9 11,066 0.055 1,423 0.007 3,208 0.016 2.3
Sub-TOTAL
TOTAL 6,509,109 10,566,969 1.623 1,350,049 0.207 18,042,706 2.772 13.4 4,764,668 0.732 611,856 0.094 2,857,499 0.439 4.7 45,950 0.007 5,786 0.001 40,164 0.006 6.9 359,303 0.055 46,215 0.007 104,146 0.016 2.3
NOTES:Energy savings per sq.ft.-year, energy savings cost $ per sq.ft.-year, and consrtuction cost $ per sq.ft.-year are based on UH Energy Benchmarking Study with modifications and re-adjustments.Zero ECO savings in the table indicate that the ECO has already been implemented. HECO Rebate history from 1997 through 2004, and ESPC upgrade analysis conducted in 2004 were used to identify buildings with already implemented ECOs.Refer to the State Energy Benchmarking Study text Section 5.0 for a detailed discussion.
ECM IV ECM V ECM VI ECM VIIChiller Retrofits Variable Speed Drive Utilization Motor Replacement with High Efficiency - Pumps+Fans Waste Heat Recovery System

ENERGY CONSERVATION MEASURESTATE OF HAWAII FACILITIES IN OAHU ENERGY ECM BENCHMARK
Operating Est. Energy Est. Cost Est. Construction Payback Est. Energy Est. Cost Est. Construction Payback Est. Energy Est. Cost Est. Construction Payback Est. Energy Est. Cost Est. Construction PaybackBuilding Name Building Schedule Year- Area Savings (kWh/sf.ft. Savings ($/sq.ft. Costs ($/sq.ft. Savings (kWh/sf.ft. Savings ($/sq.ft. Costs ($/sq.ft. Savings (kWh/sf.ft. Savings ($/sq.ft. Costs ($/sq.ft. Savings (kWh/sf.ft. Savings ($/sq.ft. Costs ($/sq.ft.
Type hr. Built (sq.ft.) (kWh/year) -year) ($/year) -year) ($) -year) (year) (kWh/year) -year) ($/year) -year) ($) -year) (year) (kWh/year) -year) ($/year) -year) ($) -year) (year) (kWh/year) -year) ($/year) -year) ($) -year) (year)
COMM COLL
LARGE FACILITIES (BUILDING AREA ESTIMATED) 96045 ALAIKE ST (LEEWARD) Class/Office 269,630 451,631 1.675 57,701 0.214 771,143 2.860 13.4 197,369 0.732 25,345 0.094 118,368 0.439 4.7 0 0.000 0 0.000 0 0.000 0.0 14,884 0.055 1,914 0.007 4,314 0.016 2.3 655 MAKAPUU AV (KAPIOLANI BUSINESS) Class/Office 378,208 633,498 1.675 80,937 0.214 1,081,675 2.860 13.4 276,848 0.732 35,552 0.094 166,033 0.439 4.7 51,058 0.135 6,430 0.017 44,629 0.118 6.9 20,877 0.055 2,685 0.007 6,051 0.016 2.3 874 DILLINGHAM BV (HONOLULU) Class/Office 234,628 0 0.000 0 0.000 0 0.000 0.0 0 0.000 0 0.000 0 0.000 0.0 31,675 0.135 3,989 0.017 27,686 0.118 6.9 12,951 0.055 1,666 0.007 3,754 0.016 2.3 45720 KEAAHALA RD (HALE IMILOA) Class/Office 264,821 443,576 1.675 56,672 0.214 757,389 2.860 13.4 193,849 0.732 24,893 0.094 116,257 0.439 4.7 0 0.000 0 0.000 0 0.000 0.0 14,618 0.055 1,880 0.007 4,237 0.016 2.3
Sub-TOTAL 1,147,288 1,528,705 1.332 195,309 0.170 2,610,207 2.275 13.4 668,067 0.582 85,790 0.075 400,658 0.349 4.7 82,733 0.072 10,418 0.009 72,315 0.063 6.9 63,330 0.055 8,146 0.007 18,357 0.016 2.3
MEDIUM AND SMALL FACILITIES (BUILDING AREA ESTIMATED)Sub-TOTAL Class/Office 73,445 0 0.000 0 0.000 0 0.000 0.0 42,767 0.582 5,492 0.075 25,649 0.349 4.7 5,296 0.072 667 0.009 4,629 0.063 6.9 4,054 0.055 521 0.007 1,175 0.016 2.3
Sub-TOTAL
TOTAL 1,220,733 1,528,705 1.252 195,309 0.160 2,610,207 2.138 13.4 710,834 0.582 91,282 0.075 426,306 0.349 4.7 88,029 0.072 11,085 0.009 76,944 0.063 6.9 67,384 0.055 8,667 0.007 19,532 0.016 2.3
NOTES:Energy savings per sq.ft.-year, energy savings cost $ per sq.ft.-year, and consrtuction cost $ per sq.ft.-year are based on UH Energy Benchmarking Study with modifications and re-adjustments.Zero ECO savings in the table indicate that the ECO has already been implemented. HECO Rebate history from 1997 through 2004, and ESPC upgrade analysis conducted in 2004 were used to identify buildings with already implemented ECOs.Refer to the State Energy Benchmarking Study text Section 5.0 for a detailed discussion.
ECM IV ECM V ECM VI ECM VIIChiller Retrofits Variable Speed Drive Utilization Motor Replacement with High Efficiency - Pumps+Fans Waste Heat Recovery System

ENERGY CONSERVATION MEASURESTATE OF HAWAII FACILITIES IN OAHU ENERGY ECM BENCHMARK
Operating Est. Energy Est. Cost Est. Construction Payback Est. Energy Est. Cost Est. Construction Payback Est. Energy Est. Cost Est. Construction Payback Est. Energy Est. Cost Est. Construction PaybackBuilding Name Building Schedule Year- Area Savings (kWh/sf.ft. Savings ($/sq.ft. Costs ($/sq.ft. Savings (kWh/sf.ft. Savings ($/sq.ft. Costs ($/sq.ft. Savings (kWh/sf.ft. Savings ($/sq.ft. Costs ($/sq.ft. Savings (kWh/sf.ft. Savings ($/sq.ft. Costs ($/sq.ft.
Type hr. Built (sq.ft.) (kWh/year) -year) ($/year) -year) ($) -year) (year) (kWh/year) -year) ($/year) -year) ($) -year) (year) (kWh/year) -year) ($/year) -year) ($) -year) (year) (kWh/year) -year) ($/year) -year) ($) -year) (year)
OTHER
LARGE FACILITIES DOES NOT EXIST
MEDIUM AND SMALL FACILITIES (BUILDING AREA ESTIMATED)Sub-TOTAL Office 971,908 0 0.000 0 0.000 0 0.000 0.0 711,436 0.732 91,359 0.094 426,667 0.439 4.7 131,208 0.135 16,522 0.017 114,685 0.118 6.9 53,649 0.055 6,901 0.007 15,551 0.016 2.3
Sub-TOTAL
TOTAL 971,908 0 0.000 0 0.000 0 0.000 0.0 711,436 0.732 91,359 0.094 426,667 0.439 4.7 131,208 0.135 16,522 0.017 114,685 0.118 6.9 53,649 0.055 6,901 0.007 15,551 0.016 2.3
NOTES:Energy savings per sq.ft.-year, energy savings cost $ per sq.ft.-year, and consrtuction cost $ per sq.ft.-year are based on UH Energy Benchmarking Study with modifications and re-adjustments.Zero ECO savings in the table indicate that the ECO has already been implemented. HECO Rebate history from 1997 through 2004, and ESPC upgrade analysis conducted in 2004 were used to identify buildings with already implemented ECOs.Refer to the State Energy Benchmarking Study text Section 5.0 for a detailed discussion.
ECM IV ECM V ECM VI ECM VIIChiller Retrofits Variable Speed Drive Utilization Motor Replacement with High Efficiency - Pumps+Fans Waste Heat Recovery System

ENERGY CONSERVATION MEASURESTATE OF HAWAII FACILITIES IN OAHU ENERGY ECM BENCHMARK
(Convert Constant-Volume to VAV system, Repair VAV Control System,
Install outside-air carbon dioxide sensors controlling outside-air dampers)
Operating Est. Energy Est. Cost Est. Construction Payback Est. Energy Est. Cost Est. Construction Payback Est. Energy Est. Cost Est. Construction Payback Est. Energy Est. Cost Est. Construction PaybackBuilding Name Building Schedule Year- Area Savings (kWh/sf.ft. Savings ($/sq.ft. Costs ($/sq.ft. Savings (kWh/sf.ft. Savings ($/sq.ft. Costs ($/sq.ft. Savings (kWh/sf.ft. Savings ($/sq.ft. Costs ($/sq.ft. Savings (kWh/sf.ft. Savings ($/sq.ft. Costs ($/sq.ft.
Type hr. Built (sq.ft.) (kWh/year) -year) ($/year) -year) ($) -year) (year) (kWh/year) -year) ($/year) -year) ($) -year) (year) (kWh/year) -year) ($/year) -year) ($) -year) (year) (kWh/year) -year) ($/year) -year) ($) -year) (year)
DAGS
LARGE FACILITIES (BUILDING AREA KNOWN) 415 SOUTH BERETANIA (STATE CAPITOL) Office 10 1969 300,000 0 0.000 0 0.000 0 0.000 0.0 130,200 0.434 16,800 0.056 20,100 0.067 1.2 61,620 0.205 7,800 0.026 57,600 0.192 7.4 75,600 0.252 9,600 0.032 89,700 0.299 9.3 919 ALA MOANA BLVD (AAFES) Office 10 108,000 0 0.000 0 0.000 0 0.000 0.0 46,872 0.434 6,048 0.056 7,236 0.067 1.2 22,183 0.205 2,808 0.026 20,736 0.192 7.4 27,216 0.252 3,456 0.032 32,292 0.299 9.3 1390 MILLER ST (QUEEN LILIOLULANI) Office 11.5 1943 94,528 0 0.000 0 0.000 0 0.000 0.0 41,025 0.434 5,294 0.056 6,333 0.067 1.2 19,416 0.205 2,458 0.026 18,149 0.192 7.4 23,821 0.252 3,025 0.032 28,264 0.299 9.3 1151 PUNCHBOWL ST (KALANIMOKU) Office 10 1976 203,000 0 0.000 0 0.000 0 0.000 0.0 88,102 0.434 11,368 0.056 13,601 0.067 1.2 41,696 0.205 5,278 0.026 38,976 0.192 7.4 51,156 0.252 6,496 0.032 60,697 0.299 9.3 1250 PUNCHBOWL ST (KINAU HALE) Office 11 1961 66,951 0 0.000 0 0.000 0 0.000 0.0 29,057 0.434 3,749 0.056 4,486 0.067 1.2 13,752 0.205 1,741 0.026 12,855 0.192 7.4 16,872 0.252 2,142 0.032 20,018 0.299 9.3 250 S HOTEL ST (NO. 1-DISTRICT BLDG) Office 10 120,000 0 0.000 0 0.000 0 0.000 0.0 52,080 0.434 6,720 0.056 8,040 0.067 1.2 24,648 0.205 3,120 0.026 23,040 0.192 7.4 30,240 0.252 3,840 0.032 35,880 0.299 9.3 465 S KING ST (KEKUANAO'A BLDG) Office 11 65,075 0 0.000 0 0.000 0 0.000 0.0 28,243 0.434 3,644 0.056 4,360 0.067 1.2 13,366 0.205 1,692 0.026 12,494 0.192 7.4 16,399 0.252 2,082 0.032 19,457 0.299 9.3 235 S BERETANIA ST (OFFICE TOWER) Office 10 1991 172,000 0 0.000 0 0.000 0 0.000 0.0 74,648 0.434 9,632 0.056 11,524 0.067 1.2 35,329 0.205 4,472 0.026 33,024 0.192 7.4 43,344 0.252 5,504 0.032 51,428 0.299 9.3 830 PUNCHBOWL ST (KEELIKOLANI & AUHAU) Office 12 1949 278,639 0 0.000 0 0.000 0 0.000 0.0 120,929 0.434 15,604 0.056 18,669 0.067 1.2 57,232 0.205 7,245 0.026 53,499 0.192 7.4 70,217 0.252 8,916 0.032 83,313 0.299 9.3 601 KAMOKILA BV (KAKUIHEIWA KAPOLEI) Office 10 1998 222,000 0 0.000 0 0.000 0 0.000 0.0 96,348 0.434 12,432 0.056 14,874 0.067 1.2 45,599 0.205 5,772 0.026 42,624 0.192 7.4 55,944 0.252 7,104 0.032 66,378 0.299 9.3 99500 SALT LAKE BV (STADIUM AUTHORITY) Stadium 300,000 0 0.000 0 0.000 0 0.000 0.0 130,200 0.434 16,800 0.056 20,100 0.067 1.2 61,620 0.205 7,800 0.026 57,600 0.192 7.4 75,600 0.252 9,600 0.032 89,700 0.299 9.3
Sub-TOTAL 1,930,193 0 0.000 0 0.000 0 0.000 0.0 837,704 0.434 108,091 0.056 129,323 0.067 1.2 396,462 0.205 50,185 0.026 370,597 0.192 7.4 410,809 0.213 61,766 0.032 577,128 0.299 9.3
MEDIUM AND SMALL FACILITIES (BUILDING AREA ESTIMATED)Sub-TOTAL Office 407,072 48,035 0.118 6,106 0.015 51,291 0.126 8.4 176,669 0.434 22,796 0.056 27,274 0.067 1.2 83,613 0.205 10,584 0.026 78,158 0.192 7.4 0 0.000 0 0.000 0 0.000 0.0
Sub-TOTAL
TOTAL 2,337,265 48,035 0.021 6,106 0.003 51,291 0.022 8.4 1,014,373 0.434 130,887 0.056 156,597 0.067 1.2 480,074 0.205 60,769 0.026 448,755 0.192 7.4 410,809 0.176 61,766 0.026 577,128 0.247 9.3
NOTES:Energy savings per sq.ft.-year, energy savings cost $ per sq.ft.-year, and consrtuction cost $ per sq.ft.-year are based on UH Energy Benchmarking Study with modifications and re-adjustments.Zero ECO savings in the table indicate that the ECO has already been implemented. HECO Rebate history from 1997 through 2004, and ESPC upgrade analysis conducted in 2004 were used to identify buildings with already implemented ECOs.Refer to the State Energy Benchmarking Study text Section 5.0 for a detailed discussion.
ECM VIII ECM IX ECM X ECM XIPackaged Air Conditioning Unit Replacement Facility Management System (FMS) Installation Insulation Installation Other

ENERGY CONSERVATION MEASURESTATE OF HAWAII FACILITIES IN OAHU ENERGY ECM BENCHMARK
(Convert Constant-Volume to VAV system, Repair VAV Control System,
Install outside-air carbon dioxide sensors controlling outside-air dampers)
Operating Est. Energy Est. Cost Est. Construction Payback Est. Energy Est. Cost Est. Construction Payback Est. Energy Est. Cost Est. Construction Payback Est. Energy Est. Cost Est. Construction PaybackBuilding Name Building Schedule Year- Area Savings (kWh/sf.ft. Savings ($/sq.ft. Costs ($/sq.ft. Savings (kWh/sf.ft. Savings ($/sq.ft. Costs ($/sq.ft. Savings (kWh/sf.ft. Savings ($/sq.ft. Costs ($/sq.ft. Savings (kWh/sf.ft. Savings ($/sq.ft. Costs ($/sq.ft.
Type hr. Built (sq.ft.) (kWh/year) -year) ($/year) -year) ($) -year) (year) (kWh/year) -year) ($/year) -year) ($) -year) (year) (kWh/year) -year) ($/year) -year) ($) -year) (year) (kWh/year) -year) ($/year) -year) ($) -year) (year)
JUDICIARY
LARGE FACILITIES (BUILDING AREA KNOWN) 777 PUNCHBOWL ST (KAAHUMANU HALE) Office 212,000 0 0.000 0 0.000 0 0.000 0.0 92,008 0.434 11,872 0.056 14,204 0.067 1.2 43,545 0.205 5,512 0.026 40,704 0.192 7.4 53,424 0.252 6,784 0.032 63,388 0.299 9.3 1111 ALAKEA ST (KAUIKEAOULI DIS CT 1ST C) Office 187,000 0 0.000 0 0.000 0 0.000 0.0 81,158 0.434 10,472 0.056 12,529 0.067 1.2 38,410 0.205 4,862 0.026 35,904 0.192 7.4 47,124 0.252 5,984 0.032 55,913 0.299 9.3 417 S KING ST (ALIIOLANE HALE) Office 62,200 0 0.000 0 0.000 0 0.000 0.0 26,995 0.434 3,483 0.056 4,167 0.067 1.2 12,776 0.205 1,617 0.026 11,942 0.192 7.4 15,674 0.252 1,990 0.032 18,598 0.299 9.3
Sub-TOTAL 461,200 0 0.000 0 0.000 0 0.000 0.0 200,161 0.434 25,827 0.056 30,900 0.067 1.2 94,730 0.205 11,991 0.026 88,550 0.192 7.4 116,222 0.252 14,758 0.032 137,899 0.299 9.3
MEDIUM AND SMALL FACILITIES (BUILDING AREA ESTIMATED)Sub-TOTAL Office 75,639 8,925 0.118 1,135 0.015 9,531 0.126 8.4 32,827 0.434 4,236 0.056 5,068 0.067 1.2 15,536 0.205 1,967 0.026 14,523 0.192 7.4 0 0.000 0 0.000 0 0.000 0.0
Sub-TOTAL
TOTAL 536,839 8,925 0.017 1,135 0.002 9,531 0.018 8.4 232,988 0.434 30,063 0.056 35,968 0.067 1.2 110,267 0.205 13,958 0.026 103,073 0.192 7.4 116,222 0.216 14,758 0.027 137,899 0.257 9.3
NOTES:Energy savings per sq.ft.-year, energy savings cost $ per sq.ft.-year, and consrtuction cost $ per sq.ft.-year are based on UH Energy Benchmarking Study with modifications and re-adjustments.Zero ECO savings in the table indicate that the ECO has already been implemented. HECO Rebate history from 1997 through 2004, and ESPC upgrade analysis conducted in 2004 were used to identify buildings with already implemented ECOs.Refer to the State Energy Benchmarking Study text Section 5.0 for a detailed discussion.
ECM VIII ECM IX ECM X ECM XIPackaged Air Conditioning Unit Replacement Facility Management System (FMS) Installation Insulation Installation Other

ENERGY CONSERVATION MEASURESTATE OF HAWAII FACILITIES IN OAHU ENERGY ECM BENCHMARK
(Convert Constant-Volume to VAV system, Repair VAV Control System,
Install outside-air carbon dioxide sensors controlling outside-air dampers)
Operating Est. Energy Est. Cost Est. Construction Payback Est. Energy Est. Cost Est. Construction Payback Est. Energy Est. Cost Est. Construction Payback Est. Energy Est. Cost Est. Construction PaybackBuilding Name Building Schedule Year- Area Savings (kWh/sf.ft. Savings ($/sq.ft. Costs ($/sq.ft. Savings (kWh/sf.ft. Savings ($/sq.ft. Costs ($/sq.ft. Savings (kWh/sf.ft. Savings ($/sq.ft. Costs ($/sq.ft. Savings (kWh/sf.ft. Savings ($/sq.ft. Costs ($/sq.ft.
Type hr. Built (sq.ft.) (kWh/year) -year) ($/year) -year) ($) -year) (year) (kWh/year) -year) ($/year) -year) ($) -year) (year) (kWh/year) -year) ($/year) -year) ($) -year) (year) (kWh/year) -year) ($/year) -year) ($) -year) (year)
DBEDT
LARGE FACILITIES (BUILDING AREA ESTIMATED) 1777 KAPIOLANI BV (HCC) Conv. Centr. 354,554 0 0.000 0 0.000 0 0.000 0.0 153,877 0.434 19,855 0.056 23,755 0.067 1.2 72,825 0.205 9,218 0.026 68,074 0.192 7.4 89,348 0.252 11,346 0.032 106,012 0.299 9.3
Sub-TOTAL 354,554 0 0.000 0 0.000 0 0.000 0.0 153,877 0.434 19,855 0.056 23,755 0.067 1.2 72,825 0.205 9,218 0.026 68,074 0.192 7.4 89,348 0.252 11,346 0.032 106,012 0.299 9.3
MEDIUM AND SMALL FACILITIES (BUILDING AREA ESTIMATED)Sub-TOTAL Office 265,489 31,328 0.118 3,982 0.015 33,452 0.126 8.4 115,222 0.434 14,867 0.056 17,788 0.067 1.2 54,425 0.205 6,903 0.026 50,974 0.192 7.4 0 0.000 0 0.000 0 0.000 0.0
Sub-TOTAL
TOTAL 620,043 31,328 0.051 3,982 0.006 33,452 0.054 8.4 269,099 0.434 34,722 0.056 41,543 0.067 1.2 127,251 0.205 16,121 0.026 119,048 0.192 7.4 89,348 0.144 11,346 0.018 106,012 0.171 9.3
NOTES:Energy savings per sq.ft.-year, energy savings cost $ per sq.ft.-year, and consrtuction cost $ per sq.ft.-year are based on UH Energy Benchmarking Study with modifications and re-adjustments.Zero ECO savings in the table indicate that the ECO has already been implemented. HECO Rebate history from 1997 through 2004, and ESPC upgrade analysis conducted in 2004 were used to identify buildings with already implemented ECOs.Refer to the State Energy Benchmarking Study text Section 5.0 for a detailed discussion.
ECM VIII ECM IX ECM X ECM XIPackaged Air Conditioning Unit Replacement Facility Management System (FMS) Installation Insulation Installation Other

ENERGY CONSERVATION MEASURESTATE OF HAWAII FACILITIES IN OAHU ENERGY ECM BENCHMARK
(Convert Constant-Volume to VAV system, Repair VAV Control System,
Install outside-air carbon dioxide sensors controlling outside-air dampers)
Operating Est. Energy Est. Cost Est. Construction Payback Est. Energy Est. Cost Est. Construction Payback Est. Energy Est. Cost Est. Construction Payback Est. Energy Est. Cost Est. Construction PaybackBuilding Name Building Schedule Year- Area Savings (kWh/sf.ft. Savings ($/sq.ft. Costs ($/sq.ft. Savings (kWh/sf.ft. Savings ($/sq.ft. Costs ($/sq.ft. Savings (kWh/sf.ft. Savings ($/sq.ft. Costs ($/sq.ft. Savings (kWh/sf.ft. Savings ($/sq.ft. Costs ($/sq.ft.
Type hr. Built (sq.ft.) (kWh/year) -year) ($/year) -year) ($) -year) (year) (kWh/year) -year) ($/year) -year) ($) -year) (year) (kWh/year) -year) ($/year) -year) ($) -year) (year) (kWh/year) -year) ($/year) -year) ($) -year) (year)
DHS
LARGE FACILITIES (BUILDING AREA ESTIMATED) 1541 KALAKAUA AV (HCDCH) Office 89,175 0 0.000 0 0.000 0 0.000 0.0 38,702 0.434 4,994 0.056 5,975 0.067 1.2 18,317 0.205 2,319 0.026 17,122 0.192 7.4 22,472 0.252 2,854 0.032 26,663 0.299 9.3 99132 KOHOMUA ST (HCDCH) Office 115,849 0 0.000 0 0.000 0 0.000 0.0 50,279 0.434 6,488 0.056 7,762 0.067 1.2 23,795 0.205 3,012 0.026 22,243 0.192 7.4 29,194 0.252 3,707 0.032 34,639 0.299 9.3 1545 LINAPUNI ST #BLDG B (HCDCH HHA) Office 59,224 0 0.000 0 0.000 0 0.000 0.0 25,703 0.434 3,317 0.056 3,968 0.067 1.2 12,165 0.205 1,540 0.026 11,371 0.192 7.4 14,925 0.252 1,895 0.032 17,708 0.299 9.3 1475 LINAPUNI ST #BLDG (HCDCH HHA) Office 60,090 0 0.000 0 0.000 0 0.000 0.0 26,079 0.434 3,365 0.056 4,026 0.067 1.2 12,343 0.205 1,562 0.026 11,537 0.192 7.4 15,143 0.252 1,923 0.032 17,967 0.299 9.3
Sub-TOTAL 324,339 0 0.000 0 0.000 0 0.000 0.0 140,763 0.434 18,163 0.056 21,731 0.067 1.2 66,619 0.205 8,433 0.026 62,273 0.192 7.4 81,734 0.252 10,379 0.032 96,977 0.299 9.3
MEDIUM AND SMALL FACILITIES (BUILDING AREA ESTIMATED)Sub-TOTAL Office 253,717 29,939 0.118 3,806 0.015 31,968 0.126 8.4 110,113 0.434 14,208 0.056 16,999 0.067 1.2 52,113 0.205 6,597 0.026 48,714 0.192 7.4 0 0.000 0 0.000 0 0.000 0.0
Sub-TOTAL
TOTAL 578,056 29,939 0.052 3,806 0.007 31,968 0.055 8.4 250,876 0.434 32,371 0.056 38,730 0.067 1.2 118,733 0.205 15,029 0.026 110,987 0.192 7.4 81,734 0.141 10,379 0.018 96,977 0.168 9.3
NOTES:Energy savings per sq.ft.-year, energy savings cost $ per sq.ft.-year, and consrtuction cost $ per sq.ft.-year are based on UH Energy Benchmarking Study with modifications and re-adjustments.Zero ECO savings in the table indicate that the ECO has already been implemented. HECO Rebate history from 1997 through 2004, and ESPC upgrade analysis conducted in 2004 were used to identify buildings with already implemented ECOs.Refer to the State Energy Benchmarking Study text Section 5.0 for a detailed discussion.
Packaged Air Conditioning Unit Replacement Facility Management System (FMS) Installation Insulation Installation OtherECM IX ECM X ECM XIECM VIII

ENERGY CONSERVATION MEASURESTATE OF HAWAII FACILITIES IN OAHU ENERGY ECM BENCHMARK
(Convert Constant-Volume to VAV system, Repair VAV Control System,
Install outside-air carbon dioxide sensors controlling outside-air dampers)
Operating Est. Energy Est. Cost Est. Construction Payback Est. Energy Est. Cost Est. Construction Payback Est. Energy Est. Cost Est. Construction Payback Est. Energy Est. Cost Est. Construction PaybackBuilding Name Building Schedule Year- Area Savings (kWh/sf.ft. Savings ($/sq.ft. Costs ($/sq.ft. Savings (kWh/sf.ft. Savings ($/sq.ft. Costs ($/sq.ft. Savings (kWh/sf.ft. Savings ($/sq.ft. Costs ($/sq.ft. Savings (kWh/sf.ft. Savings ($/sq.ft. Costs ($/sq.ft.
Type hr. Built (sq.ft.) (kWh/year) -year) ($/year) -year) ($) -year) (year) (kWh/year) -year) ($/year) -year) ($) -year) (year) (kWh/year) -year) ($/year) -year) ($) -year) (year) (kWh/year) -year) ($/year) -year) ($) -year) (year)
DOD
LARGE FACILITIES (BUILDING AREA KNOWN) 3949 DIAMOND HEAD RD Office 140,000 0 0.000 0 0.000 0 0.000 0.0 60,760 0.434 7,840 0.056 9,380 0.067 1.2 28,756 0.205 3,640 0.026 26,880 0.192 7.4 35,280 0.252 4,480 0.032 41,860 0.299 9.3
Sub-TOTAL 140,000 0 0.000 0 0.000 0 0.000 0.0 60,760 0.434 7,840 0.056 9,380 0.067 1.2 28,756 0.205 3,640 0.026 26,880 0.192 7.4 35,280 0.252 4,480 0.032 41,860 0.299 9.3
MEDIUM AND SMALL FACILITIES (BUILDING AREA ESTIMATED)Sub-TOTAL Office 388,803 45,879 0.118 5,832 0.015 48,989 0.126 8.4 168,741 0.434 21,773 0.056 26,050 0.067 1.2 79,860 0.205 10,109 0.026 74,650 0.192 7.4 0 0.000 0 0.000 0 0.000 0.0
Sub-TOTAL
TOTAL 528,803 45,879 0.087 5,832 0.011 48,989 0.093 8.4 229,501 0.434 29,613 0.056 35,430 0.067 1.2 108,616 0.205 13,749 0.026 101,530 0.192 7.4 35,280 0.067 4,480 0.008 41,860 0.079 9.3
NOTES:Energy savings per sq.ft.-year, energy savings cost $ per sq.ft.-year, and consrtuction cost $ per sq.ft.-year are based on UH Energy Benchmarking Study with modifications and re-adjustments.Zero ECO savings in the table indicate that the ECO has already been implemented. HECO Rebate history from 1997 through 2004, and ESPC upgrade analysis conducted in 2004 were used to identify buildings with already implemented ECOs.Refer to the State Energy Benchmarking Study text Section 5.0 for a detailed discussion.
ECM VIII ECM IX ECM X ECM XIPackaged Air Conditioning Unit Replacement Facility Management System (FMS) Installation Insulation Installation Other

ENERGY CONSERVATION MEASURESTATE OF HAWAII FACILITIES IN OAHU ENERGY ECM BENCHMARK
(Convert Constant-Volume to VAV system, Repair VAV Control System,
Install outside-air carbon dioxide sensors controlling outside-air dampers)
Operating Est. Energy Est. Cost Est. Construction Payback Est. Energy Est. Cost Est. Construction Payback Est. Energy Est. Cost Est. Construction Payback Est. Energy Est. Cost Est. Construction PaybackBuilding Name Building Schedule Year- Area Savings (kWh/sf.ft. Savings ($/sq.ft. Costs ($/sq.ft. Savings (kWh/sf.ft. Savings ($/sq.ft. Costs ($/sq.ft. Savings (kWh/sf.ft. Savings ($/sq.ft. Costs ($/sq.ft. Savings (kWh/sf.ft. Savings ($/sq.ft. Costs ($/sq.ft.
Type hr. Built (sq.ft.) (kWh/year) -year) ($/year) -year) ($) -year) (year) (kWh/year) -year) ($/year) -year) ($) -year) (year) (kWh/year) -year) ($/year) -year) ($) -year) (year) (kWh/year) -year) ($/year) -year) ($) -year) (year)
DOE
LARGE FACILITIES (BUILDING AREA ESTIMATED) 915007 KAPOLEI PKWY Classroom/Office 240,613 28,392 0.118 3,609 0.015 30,317 0.126 8.4 104,426 0.434 13,474 0.056 16,121 0.067 1.2 49,422 0.205 6,256 0.026 46,198 0.192 7.4 0 0.000 0 0.000 0 0.000 0.0 46155 KAMEHAMEHA HY Classroom/Office 80,672 9,519 0.118 1,210 0.015 10,165 0.126 8.4 35,012 0.434 4,518 0.056 5,405 0.067 1.2 16,570 0.205 2,097 0.026 15,489 0.192 7.4 0 0.000 0 0.000 0 0.000 0.0 91884 FT WEAVER RD Classroom/Office 136,608 16,120 0.118 2,049 0.015 17,213 0.126 8.4 59,288 0.434 7,650 0.056 9,153 0.067 1.2 28,059 0.205 3,552 0.026 26,229 0.192 7.4 0 0.000 0 0.000 0 0.000 0.0 2460 WAIMANO HOME RD (PEARL CITY HIGH) Classroom/Office 109,080 12,871 0.118 1,636 0.015 13,744 0.126 8.4 47,341 0.434 6,108 0.056 7,308 0.067 1.2 22,405 0.205 2,836 0.026 20,943 0.192 7.4 0 0.000 0 0.000 0 0.000 0.0 89980 NANAKULI AV (NANAKULI HIGH & INTER) Classroom/Office 98,800 11,658 0.118 1,482 0.015 12,449 0.126 8.4 42,879 0.434 5,533 0.056 6,620 0.067 1.2 20,294 0.205 2,569 0.026 18,970 0.192 7.4 0 0.000 0 0.000 0 0.000 0.0 85271 FARRINGTON HY (WAIANAE HIGH) Classroom/Office 87,552 0 0.000 0 0.000 0 0.000 0.0 37,998 0.434 4,903 0.056 5,866 0.067 1.2 17,983 0.205 2,276 0.026 16,810 0.192 7.4 0 0.000 0 0.000 0 0.000 0.0 951200 MEHEULA PARKWAY(MILILANI HIGH) Classroom/Office 113,040 13,339 0.118 1,696 0.015 14,243 0.126 8.4 49,059 0.434 6,330 0.056 7,574 0.067 1.2 23,218 0.205 2,939 0.026 21,704 0.192 7.4 0 0.000 0 0.000 0 0.000 0.0 45386 KANEOHE BAY DR (CASTLE HIGH) Classroom/Office 87,600 10,337 0.118 1,314 0.015 11,038 0.126 8.4 38,018 0.434 4,906 0.056 5,869 0.067 1.2 17,993 0.205 2,278 0.026 16,819 0.192 7.4 0 0.000 0 0.000 0 0.000 0.0 760 ILIAINA ST (KALAHEO) Classroom/Office 72,949 8,608 0.118 1,094 0.015 9,192 0.126 8.4 31,660 0.434 4,085 0.056 4,888 0.067 1.2 14,984 0.205 1,897 0.026 14,006 0.192 7.4 0 0.000 0 0.000 0 0.000 0.0 511 LUNALILO HOME RD (KAISER HIGH) Classroom/Office 98,000 11,564 0.118 1,470 0.015 12,348 0.126 8.4 42,532 0.434 5,488 0.056 6,566 0.067 1.2 20,129 0.205 2,548 0.026 18,816 0.192 7.4 0 0.000 0 0.000 0 0.000 0.0 4680 KALANIANAOLE HY (KALANI HIGH) Classroom/Office 37,749 4,454 0.118 566 0.015 4,756 0.126 8.4 16,383 0.434 2,114 0.056 2,529 0.067 1.2 7,754 0.205 981 0.026 7,248 0.192 7.4 0 0.000 0 0.000 0 0.000 0.0 2705 KAIMUKI AVE (KAIMUKI HIGH) Classroom/Office 146,907 17,335 0.118 2,204 0.015 18,510 0.126 8.4 63,757 0.434 8,227 0.056 9,843 0.067 1.2 30,175 0.205 3,820 0.026 28,206 0.192 7.4 0 0.000 0 0.000 0 0.000 0.0 1120 NEHOA ST (ROOSEVELT HIGH) Classroom/Office 77,720 9,171 0.118 1,166 0.015 9,793 0.126 8.4 33,730 0.434 4,352 0.056 5,207 0.067 1.2 15,964 0.205 2,021 0.026 14,922 0.192 7.4 0 0.000 0 0.000 0 0.000 0.0 1039 S KING ST (MCKINLEY HIGH) Classroom/Office 160,107 0 0.000 0 0.000 0 0.000 0.0 69,486 0.434 8,966 0.056 10,727 0.067 1.2 32,886 0.205 4,163 0.026 30,740 0.192 7.4 0 0.000 0 0.000 0 0.000 0.0 1185 ALA NAPUNANI ST (MOANALUA HIGH) Classroom/Office 116,667 13,767 0.118 1,750 0.015 14,700 0.126 8.4 50,633 0.434 6,533 0.056 7,817 0.067 1.2 23,963 0.205 3,033 0.026 22,400 0.192 7.4 0 0.000 0 0.000 0 0.000 0.0 911561 KEAUNUI RD HOLOMUA ELEMENTARY) Classroom/Office 110,496 0 0.000 0 0.000 0 0.000 0.0 47,955 0.434 6,188 0.056 7,403 0.067 1.2 22,696 0.205 2,873 0.026 21,215 0.192 7.4 0 0.000 0 0.000 0 0.000 0.0 951140 LEHIWA DR (MILILANI INTERMED) Classroom/Office 157,653 18,603 0.118 2,365 0.015 19,864 0.126 8.4 68,422 0.434 8,829 0.056 10,563 0.067 1.2 32,382 0.205 4,099 0.026 30,269 0.192 7.4 0 0.000 0 0.000 0 0.000 0.0 915335 KAPOLEI PKWY (KAPOLEI MID SCH) Classroom/Office 139,600 0 0.000 0 0.000 0 0.000 0.0 60,586 0.434 7,818 0.056 9,353 0.067 1.2 28,674 0.205 3,630 0.026 26,803 0.192 7.4 0 0.000 0 0.000 0 0.000 0.0 478 S KING ST (HAWAII STATE LIBRARY) Classroom/Office 63,151 7,452 0.118 947 0.015 7,957 0.126 8.4 27,408 0.434 3,536 0.056 4,231 0.067 1.2 12,971 0.205 1,642 0.026 12,125 0.192 7.4 0 0.000 0 0.000 0 0.000 0.0
Sub-TOTAL 2,134,964 193,191 0.090 24,558 0.012 206,288 0.097 8.4 926,575 0.434 119,558 0.056 143,043 0.067 1.2 438,522 0.205 55,509 0.026 409,913 0.192 7.4 0 0.000 0 0.000 0 0.000 0.0
MEDIUM AND SMALL FACILITIES (BUILDING AREA ESTIMATED)Sub-TOTAL Classroom/Office 5,694,686 515,306 0.090 65,505 0.012 550,242 0.097 8.4 2,471,494 0.434 318,902 0.056 381,544 0.067 1.2 1,169,688 0.205 148,062 0.026 1,093,380 0.192 7.4 0 0.000 0 0.000 0 0.000 0.0
Sub-TOTAL
TOTAL 7,829,650 708,497 0.090 90,063 0.012 756,531 0.097 8.4 3,398,068 0.434 438,460 0.056 524,587 0.067 1.2 1,608,210 0.205 203,571 0.026 1,503,293 0.192 7.4 0 0.000 0 0.000 0 0.000 0.0
NOTES:Energy savings per sq.ft.-year, energy savings cost $ per sq.ft.-year, and consrtuction cost $ per sq.ft.-year are based on UH Energy Benchmarking Study with modifications and re-adjustments.Zero ECO savings in the table indicate that the ECO has already been implemented. HECO Rebate history from 1997 through 2004, and ESPC upgrade analysis conducted in 2004 were used to identify buildings with already implemented ECOs.Refer to the State Energy Benchmarking Study text Section 5.0 for a detailed discussion.
ECM VIII ECM IX ECM X ECM XIPackaged Air Conditioning Unit Replacement Facility Management System (FMS) Installation Insulation Installation Other

ENERGY CONSERVATION MEASURESTATE OF HAWAII FACILITIES IN OAHU ENERGY ECM BENCHMARK
(Convert Constant-Volume to VAV system, Repair VAV Control System,
Install outside-air carbon dioxide sensors controlling outside-air dampers)
Operating Est. Energy Est. Cost Est. Construction Payback Est. Energy Est. Cost Est. Construction Payback Est. Energy Est. Cost Est. Construction Payback Est. Energy Est. Cost Est. Construction PaybackBuilding Name Building Schedule Year- Area Savings (kWh/sf.ft. Savings ($/sq.ft. Costs ($/sq.ft. Savings (kWh/sf.ft. Savings ($/sq.ft. Costs ($/sq.ft. Savings (kWh/sf.ft. Savings ($/sq.ft. Costs ($/sq.ft. Savings (kWh/sf.ft. Savings ($/sq.ft. Costs ($/sq.ft.
Type hr. Built (sq.ft.) (kWh/year) -year) ($/year) -year) ($) -year) (year) (kWh/year) -year) ($/year) -year) ($) -year) (year) (kWh/year) -year) ($/year) -year) ($) -year) (year) (kWh/year) -year) ($/year) -year) ($) -year) (year)
DOH
LARGE FACILITIES (BUILDING AREA KNOWN) 45747 KEAAHALA RD (HAWAII STATE HOSP) Hospital 226,475 0 0.000 0 0.000 0 0.000 0.0 98,290 0.434 12,683 0.056 15,174 0.067 1.2 46,518 0.205 5,888 0.026 43,483 0.192 7.4 57,072 0.252 7,247 0.032 67,716 0.299 9.3 45633 KEAAHALA RD Hospital 68,206 0 0.000 0 0.000 0 0.000 0.0 29,601 0.434 3,820 0.056 4,570 0.067 1.2 14,010 0.205 1,773 0.026 13,096 0.192 7.4 17,188 0.252 2,183 0.032 20,394 0.299 9.3 3627 KILAUEA AV (ADMIN SRVC OFF) Hospital 72,940 0 0.000 0 0.000 0 0.000 0.0 31,656 0.434 4,085 0.056 4,887 0.067 1.2 14,982 0.205 1,896 0.026 14,004 0.192 7.4 18,381 0.252 2,334 0.032 21,809 0.299 9.3 3675 KILAUEA AV Hospital 137,830 0 0.000 0 0.000 0 0.000 0.0 59,818 0.434 7,718 0.056 9,235 0.067 1.2 28,310 0.205 3,584 0.026 26,463 0.192 7.4 34,733 0.252 4,411 0.032 41,211 0.299 9.3 1103 HALA DR (MALUHIA HOSP) Hospital 99,700 0 0.000 0 0.000 0 0.000 0.0 43,270 0.434 5,583 0.056 6,680 0.067 1.2 20,478 0.205 2,592 0.026 19,142 0.192 7.4 25,124 0.252 3,190 0.032 29,810 0.299 9.3 2725 WAIMANO HOME RD (ADMIN OFF) Hospital 306,366 0 0.000 0 0.000 0 0.000 0.0 132,963 0.434 17,156 0.056 20,527 0.067 1.2 62,928 0.205 7,966 0.026 58,822 0.192 7.4 77,204 0.252 9,804 0.032 91,603 0.299 9.3
Sub-TOTAL 911,517 0 0.000 0 0.000 0 0.000 0.0 395,598 0.434 51,045 0.056 61,072 0.067 1.2 187,226 0.205 23,699 0.026 175,011 0.192 7.4 229,702 0.252 29,169 0.032 272,544 0.299 9.3
MEDIUM AND SMALL FACILITIES (BUILDING AREA ESTIMATED)Sub-TOTAL Hospital 695,353 82,052 0.118 10,430 0.015 87,615 0.126 8.4 301,783 0.434 38,940 0.056 46,589 0.067 1.2 142,826 0.205 18,079 0.026 133,508 0.192 7.4 0 0.000 0 0.000 0 0.000 0.0
Sub-TOTAL
TOTAL 1,606,870 82,052 0.051 10,430 0.006 87,615 0.055 8.4 697,382 0.434 89,985 0.056 107,660 0.067 1.2 330,051 0.205 41,779 0.026 308,519 0.192 7.4 229,702 0.143 29,169 0.018 272,544 0.170 9.3
NOTES:Energy savings per sq.ft.-year, energy savings cost $ per sq.ft.-year, and consrtuction cost $ per sq.ft.-year are based on UH Energy Benchmarking Study with modifications and re-adjustments.Zero ECO savings in the table indicate that the ECO has already been implemented. HECO Rebate history from 1997 through 2004, and ESPC upgrade analysis conducted in 2004 were used to identify buildings with already implemented ECOs.Refer to the State Energy Benchmarking Study text Section 5.0 for a detailed discussion.
ECM VIII ECM IX ECM X ECM XIPackaged Air Conditioning Unit Replacement Facility Management System (FMS) Installation Insulation Installation Other

ENERGY CONSERVATION MEASURESTATE OF HAWAII FACILITIES IN OAHU ENERGY ECM BENCHMARK
(Convert Constant-Volume to VAV system, Repair VAV Control System,
Install outside-air carbon dioxide sensors controlling outside-air dampers)
Operating Est. Energy Est. Cost Est. Construction Payback Est. Energy Est. Cost Est. Construction Payback Est. Energy Est. Cost Est. Construction Payback Est. Energy Est. Cost Est. Construction PaybackBuilding Name Building Schedule Year- Area Savings (kWh/sf.ft. Savings ($/sq.ft. Costs ($/sq.ft. Savings (kWh/sf.ft. Savings ($/sq.ft. Costs ($/sq.ft. Savings (kWh/sf.ft. Savings ($/sq.ft. Costs ($/sq.ft. Savings (kWh/sf.ft. Savings ($/sq.ft. Costs ($/sq.ft.
Type hr. Built (sq.ft.) (kWh/year) -year) ($/year) -year) ($) -year) (year) (kWh/year) -year) ($/year) -year) ($) -year) (year) (kWh/year) -year) ($/year) -year) ($) -year) (year) (kWh/year) -year) ($/year) -year) ($) -year) (year)
PSD
LARGE FACILITIES (BUILDING AREA ESTIMATED) 94560 KAMEHAMEHA HY (WAIAWA CORR FAC) Corr Fac 82,200 9,700 0.118 1,233 0.015 10,357 0.126 8.4 35,675 0.434 4,603 0.056 5,507 0.067 1.2 16,884 0.205 2,137 0.026 15,782 0.192 7.4 0 0.000 0 0.000 0 0.000 0.0 5100 MOANALUA RD Corr Fac 90,352 10,662 0.118 1,355 0.015 11,384 0.126 8.4 39,213 0.434 5,060 0.056 6,054 0.067 1.2 18,558 0.205 2,349 0.026 17,348 0.192 7.4 0 0.000 0 0.000 0 0.000 0.0 99902 MOANALUA RD (HALAWA PRISON) Corr Fac 339,800 40,096 0.118 5,097 0.015 42,815 0.126 8.4 147,473 0.434 19,029 0.056 22,767 0.067 1.2 69,795 0.205 8,835 0.026 65,242 0.192 7.4 0 0.000 0 0.000 0 0.000 0.0 2199 KAMEHAMEHA HY (OCCC & HSE CORR) Corr Fac 456,640 53,884 0.118 6,850 0.015 57,537 0.126 8.4 198,182 0.434 25,572 0.056 30,595 0.067 1.2 93,794 0.205 11,873 0.026 87,675 0.192 7.4 0 0.000 0 0.000 0 0.000 0.0 42477 KALANIANAOLE HY Corr Fac 118,741 14,011 0.118 1,781 0.015 14,961 0.126 8.4 51,534 0.434 6,650 0.056 7,956 0.067 1.2 24,389 0.205 3,087 0.026 22,798 0.192 7.4 0 0.000 0 0.000 0 0.000 0.0
Sub-TOTAL 1,087,733 128,353 0.118 16,316 0.015 137,054 0.126 8.4 472,076 0.434 60,913 0.056 72,878 0.067 1.2 223,420 0.205 28,281 0.026 208,845 0.192 7.4 0 0.000 0 0.000 0 0.000 0.0
MEDIUM AND SMALL FACILITIES (BUILDING AREA ESTIMATED)Sub-TOTAL Corr Fac 0 0 0.000 0 0.000 0 0.000 0.0 0 0.000 0 0.000 0 0.000 0.0 0 0.000 0 0.000 0 0.000 0.0 0 0.000 0 0.000 0 0.000 0.0
Sub-TOTAL
TOTAL 1,087,733 128,353 0.118 16,316 0.015 137,054 0.126 #DIV/0! 472,076 0.434 60,913 0.056 72,878 0.067 1.2 223,420 0.205 28,281 0.026 208,845 0.192 7.4 0 0.000 0 0.000 0 0.000 0.0
NOTES:Energy savings per sq.ft.-year, energy savings cost $ per sq.ft.-year, and consrtuction cost $ per sq.ft.-year are based on UH Energy Benchmarking Study with modifications and re-adjustments.Zero ECO savings in the table indicate that the ECO has already been implemented. HECO Rebate history from 1997 through 2004, and ESPC upgrade analysis conducted in 2004 were used to identify buildings with already implemented ECOs.Refer to the State Energy Benchmarking Study text Section 5.0 for a detailed discussion.
ECM VIII ECM IX ECM X ECM XIPackaged Air Conditioning Unit Replacement Facility Management System (FMS) Installation Insulation Installation Other

ENERGY CONSERVATION MEASURESTATE OF HAWAII FACILITIES IN OAHU ENERGY ECM BENCHMARK
(Convert Constant-Volume to VAV system, Repair VAV Control System,
Install outside-air carbon dioxide sensors controlling outside-air dampers)
Operating Est. Energy Est. Cost Est. Construction Payback Est. Energy Est. Cost Est. Construction Payback Est. Energy Est. Cost Est. Construction Payback Est. Energy Est. Cost Est. Construction PaybackBuilding Name Building Schedule Year- Area Savings (kWh/sf.ft. Savings ($/sq.ft. Costs ($/sq.ft. Savings (kWh/sf.ft. Savings ($/sq.ft. Costs ($/sq.ft. Savings (kWh/sf.ft. Savings ($/sq.ft. Costs ($/sq.ft. Savings (kWh/sf.ft. Savings ($/sq.ft. Costs ($/sq.ft.
Type hr. Built (sq.ft.) (kWh/year) -year) ($/year) -year) ($) -year) (year) (kWh/year) -year) ($/year) -year) ($) -year) (year) (kWh/year) -year) ($/year) -year) ($) -year) (year) (kWh/year) -year) ($/year) -year) ($) -year) (year)
DOT
LARGE FACILITIES (BUILDING AREA KNOWN) 40 PIER (KAPALAMA MIL RES) Military Reserve 133,340 0 0.000 0 0.000 0 0.000 0.000 57,870 0.434 7,467 0.056 8,934 0.067 1.2 27,388 0.205 3,467 0.026 25,601 0.192 7.4 33,602 0.252 4,267 0.032 39,869 0.299 9.3 869 PUNCHBOWL ST (TRANSPORTATION) Office 55,854 0 0.000 0 0.000 0 0.000 0.000 24,241 0.434 3,128 0.056 3,742 0.067 1.2 11,472 0.205 1,452 0.026 10,724 0.192 7.4 14,075 0.252 1,787 0.032 16,700 0.299 9.3 302 RODGERS BV #344 (IAB VAULT "B") Airport Terminal 269,775 0 0.000 0 0.000 0 0.000 0.000 117,082 0.434 15,107 0.056 18,075 0.067 1.2 55,412 0.205 7,014 0.026 51,797 0.192 7.4 67,983 0.252 8,633 0.032 80,663 0.299 9.3 302 RODGERS BV #342 (SVC CRT VLT "C") Airport Terminal 150,904 0 0.000 0 0.000 0 0.000 0.000 65,492 0.434 8,451 0.056 10,111 0.067 1.2 30,996 0.205 3,924 0.026 28,974 0.192 7.4 38,028 0.252 4,829 0.032 45,120 0.299 9.3 302 RODGERS BV #336 (OST VLT "N") Airport Terminal 353,110 0 0.000 0 0.000 0 0.000 0.000 153,250 0.434 19,774 0.056 23,658 0.067 1.2 72,529 0.205 9,181 0.026 67,797 0.192 7.4 88,984 0.252 11,300 0.032 105,580 0.299 9.3 304 RODGERS BV #360 (EWA VLT "1E") Airport Terminal 87,506 0 0.000 0 0.000 0 0.000 0.000 37,978 0.434 4,900 0.056 5,863 0.067 1.2 17,974 0.205 2,275 0.026 16,801 0.192 7.4 22,052 0.252 2,800 0.032 26,164 0.299 9.3 300 RODGERS BV (COMM TERM ELEC) Airport Terminal 25,101 0 0.000 0 0.000 0 0.000 0.000 10,894 0.434 1,406 0.056 1,682 0.067 1.2 5,156 0.205 653 0.026 4,819 0.192 7.4 6,325 0.252 803 0.032 7,505 0.299 9.3 300 RODGERS BV #355 (OSPARK VLT "A") Airport Terminal 30,963 0 0.000 0 0.000 0 0.000 0.000 13,438 0.434 1,734 0.056 2,075 0.067 1.2 6,360 0.205 805 0.026 5,945 0.192 7.4 7,803 0.252 991 0.032 9,258 0.299 9.3 301 RODGERS BV #A (DIA HD EXT) Airport Terminal 263,118 0 0.000 0 0.000 0 0.000 0.000 114,193 0.434 14,735 0.056 17,629 0.067 1.2 54,044 0.205 6,841 0.026 50,519 0.192 7.4 66,306 0.252 8,420 0.032 78,672 0.299 9.3 301 RODGERS BV (CEN CONC VLT "Y") Airport Terminal 118,771 0 0.000 0 0.000 0 0.000 0.000 51,547 0.434 6,651 0.056 7,958 0.067 1.2 24,396 0.205 3,088 0.026 22,804 0.192 7.4 29,930 0.252 3,801 0.032 35,513 0.299 9.3 303 RODGERS BV #373 (DIA HD VLT "1D") Airport Terminal 159,600 0 0.000 0 0.000 0 0.000 0.000 69,266 0.434 8,938 0.056 10,693 0.067 1.2 32,782 0.205 4,150 0.026 30,643 0.192 7.4 40,219 0.252 5,107 0.032 47,720 0.299 9.3 3651 AOLELE ST (EWA CHILLER PLT) Airport Terminal 254,109 0 0.000 0 0.000 0 0.000 0.000 110,283 0.434 14,230 0.056 17,025 0.067 1.2 52,194 0.205 6,607 0.026 48,789 0.192 7.4 64,035 0.252 8,131 0.032 75,979 0.299 9.3 3650 AOLELE ST (NEW INTERISLE TERM) Airport Terminal 251,156 0 0.000 0 0.000 0 0.000 0.000 109,002 0.434 14,065 0.056 16,827 0.067 1.2 51,587 0.205 6,530 0.026 48,222 0.192 7.4 63,291 0.252 8,037 0.032 75,096 0.299 9.3 3661 AOLELE ST (EWA CONC GATES) Airport Terminal 55,031 0 0.000 0 0.000 0 0.000 0.000 23,883 0.434 3,082 0.056 3,687 0.067 1.2 11,303 0.205 1,431 0.026 10,566 0.192 7.4 13,868 0.252 1,761 0.032 16,454 0.299 9.3
Sub-TOTAL 2,208,338 0 0.000 0 0.000 0 0.000 0.0 958,419 0.434 123,667 0.056 147,959 0.067 1.2 453,593 0.205 57,417 0.026 424,001 0.192 7.4 556,501 0.252 70,667 0.032 660,293 0.299 9.3
LARGE FACILITIES (BUILDING AREA ESTIMATED) 2 PALI HY (PRIMECO & ST LTS) Highway Tunnel 17,511 0 0.000 0 0.000 0 0.000 0.0 7,600 0.434 981 0.056 1,173 0.067 1.2 3,597 0.205 455 0.026 3,362 0.192 7.4 0 0.000 0 0.000 0 0.000 0.0 0 WILSON TUNNEL Highway Tunnel 30,481 0 0.000 0 0.000 0 0.000 0.0 13,229 0.434 1,707 0.056 2,042 0.067 1.2 6,261 0.205 793 0.026 5,852 0.192 7.4 0 0.000 0 0.000 0 0.000 0.0 0 H-3 TUNNEL HAIKU IB PORTAL (HE INT) Highway Tunnel 88,459 0 0.000 0 0.000 0 0.000 0.0 38,391 0.434 4,954 0.056 5,927 0.067 1.2 18,169 0.205 2,300 0.026 16,984 0.192 7.4 0 0.000 0 0.000 0 0.000 0.0
Sub-TOTAL 136,450 0 0.000 0 0.000 0 0.000 0.0 59,219 0.434 7,641 0.056 9,142 0.067 1.2 28,027 0.205 3,548 0.026 26,198 0.192 7.4 0 0.000 0 0.000 0 0.000 0.0
MEDIUM AND SMALL FACILITIES (BUILDING AREA ESTIMATED)Sub-TOTAL Highway Tunnel 196,129 23,143 0.118 2,942 0.015 24,712 0.126 8.4 85,120 0.434 10,983 0.056 13,141 0.067 1.2 40,285 0.205 5,099 0.026 37,657 0.192 7.4 0 0.000 0 0.000 0 0.000 0.0
Sub-TOTAL
TOTAL 2,540,917 23,143 0.009 2,942 0.001 24,712 0.010 8.4 1,102,758 0.434 142,291 0.056 170,241 0.067 1.2 521,904 0.205 66,064 0.026 487,856 0.192 7.4 556,501 0.219 70,667 0.028 660,293 0.260 9.3
NOTES:Energy savings per sq.ft.-year, energy savings cost $ per sq.ft.-year, and consrtuction cost $ per sq.ft.-year are based on UH Energy Benchmarking Study with modifications and re-adjustments.Zero ECO savings in the table indicate that the ECO has already been implemented. HECO Rebate history from 1997 through 2004, and ESPC upgrade analysis conducted in 2004 were used to identify buildings with already implemented ECOs.Refer to the State Energy Benchmarking Study text Section 5.0 for a detailed discussion.
ECM VIII ECM IX ECM X ECM XIPackaged Air Conditioning Unit Replacement Facility Management System (FMS) Installation Insulation Installation Other

ENERGY CONSERVATION MEASURESTATE OF HAWAII FACILITIES IN OAHU ENERGY ECM BENCHMARK
(Convert Constant-Volume to VAV system, Repair VAV Control System,
Install outside-air carbon dioxide sensors controlling outside-air dampers)
Operating Est. Energy Est. Cost Est. Construction Payback Est. Energy Est. Cost Est. Construction Payback Est. Energy Est. Cost Est. Construction Payback Est. Energy Est. Cost Est. Construction PaybackBuilding Name Building Schedule Year- Area Savings (kWh/sf.ft. Savings ($/sq.ft. Costs ($/sq.ft. Savings (kWh/sf.ft. Savings ($/sq.ft. Costs ($/sq.ft. Savings (kWh/sf.ft. Savings ($/sq.ft. Costs ($/sq.ft. Savings (kWh/sf.ft. Savings ($/sq.ft. Costs ($/sq.ft.
Type hr. Built (sq.ft.) (kWh/year) -year) ($/year) -year) ($) -year) (year) (kWh/year) -year) ($/year) -year) ($) -year) (year) (kWh/year) -year) ($/year) -year) ($) -year) (year) (kWh/year) -year) ($/year) -year) ($) -year) (year)
UH MANOA
LARGE FACILITIES (BUILDING AREA KNOWN) 1701 EAST WEST RD (FACILITIES MGMT) Class/Office 6,122,395 0 0.000 0 0.000 0 0.000 0.000 2,657,119 0.434 342,854 0.056 410,200 0.067 1.2 1,257,540 0.205 159,182 0.026 1,175,500 0.192 7.4 1,542,844 0.252 195,917 0.032 1,830,596 0.299 9.3 2680 WOODLAWN DR (ASTRONOMY FAC) Class/Office 46,340 0 0.000 0 0.000 0 0.000 0.000 20,112 0.434 2,595 0.056 3,105 0.067 1.2 9,518 0.205 1,205 0.026 8,897 0.192 7.4 11,678 0.252 1,483 0.032 13,856 0.299 9.3
Sub-TOTAL 6,168,735 0 0.000 0 0.000 0 0.000 0.0 2,677,231 0.434 345,449 0.056 413,305 0.067 1.2 1,267,058 0.205 160,387 0.026 1,184,397 0.192 7.4 1,554,521 0.252 197,400 0.032 1,844,452 0.299 9.3
LARGE FACILITIES (BUILDING AREA ESTIMATED) 2777 KALAKAUA AV (WAIKIKI AQUARIUM) Aquarium 62,194 0 0.000 0 0.000 0 0.000 0.000 26,992 0.434 3,483 0.056 4,167 0.067 1.2 12,775 0.205 1,617 0.026 11,941 0.192 7.4 15,673 0.252 1,990 0.032 18,596 0.299 9.3 46007 LILIPUNA RD (HIMB) Class/Office 77,709 0 0.000 0 0.000 0 0.000 0.000 33,726 0.434 4,352 0.056 5,207 0.067 1.2 15,962 0.205 2,020 0.026 14,920 0.192 7.4 19,583 0.252 2,487 0.032 23,235 0.299 9.3
Sub-TOTAL 139,903 0 0.000 0 0.000 0 0.000 0.0 60,718 0.434 7,835 0.056 9,374 0.067 1.2 28,736 0.205 3,637 0.026 26,861 0.192 7.4 35,256 0.252 4,477 0.032 41,831 0.299 9.3
MEDIUM AND SMALL FACILITIES (BUILDING AREA ESTIMATED)Sub-TOTAL Class/Office 200,470 23,655 0.118 3,007 0.015 25,259 0.126 8.4 87,004 0.434 11,226 0.056 13,432 0.067 1.2 41,177 0.205 5,212 0.026 38,490 0.192 7.4 0 0.000 0 0.000 0 0.000 0.0
Sub-TOTAL
TOTAL 6,509,109 23,655 0.004 3,007 0.000 25,259 0.004 8.4 2,824,953 0.434 364,510 0.056 436,110 0.067 1.2 1,336,971 0.205 169,237 0.026 1,249,749 0.192 7.4 1,589,777 0.244 201,876 0.031 1,886,283 0.290 9.3
NOTES:Energy savings per sq.ft.-year, energy savings cost $ per sq.ft.-year, and consrtuction cost $ per sq.ft.-year are based on UH Energy Benchmarking Study with modifications and re-adjustments.Zero ECO savings in the table indicate that the ECO has already been implemented. HECO Rebate history from 1997 through 2004, and ESPC upgrade analysis conducted in 2004 were used to identify buildings with already implemented ECOs.Refer to the State Energy Benchmarking Study text Section 5.0 for a detailed discussion.
ECM VIII ECM IX ECM X ECM XIPackaged Air Conditioning Unit Replacement Facility Management System (FMS) Installation Insulation Installation Other

ENERGY CONSERVATION MEASURESTATE OF HAWAII FACILITIES IN OAHU ENERGY ECM BENCHMARK
(Convert Constant-Volume to VAV system, Repair VAV Control System,
Install outside-air carbon dioxide sensors controlling outside-air dampers)
Operating Est. Energy Est. Cost Est. Construction Payback Est. Energy Est. Cost Est. Construction Payback Est. Energy Est. Cost Est. Construction Payback Est. Energy Est. Cost Est. Construction PaybackBuilding Name Building Schedule Year- Area Savings (kWh/sf.ft. Savings ($/sq.ft. Costs ($/sq.ft. Savings (kWh/sf.ft. Savings ($/sq.ft. Costs ($/sq.ft. Savings (kWh/sf.ft. Savings ($/sq.ft. Costs ($/sq.ft. Savings (kWh/sf.ft. Savings ($/sq.ft. Costs ($/sq.ft.
Type hr. Built (sq.ft.) (kWh/year) -year) ($/year) -year) ($) -year) (year) (kWh/year) -year) ($/year) -year) ($) -year) (year) (kWh/year) -year) ($/year) -year) ($) -year) (year) (kWh/year) -year) ($/year) -year) ($) -year) (year)
COMM COLL
LARGE FACILITIES (BUILDING AREA ESTIMATED) 96045 ALAIKE ST (LEEWARD) Class/Office 269,630 0 0.000 0 0.000 0 0.000 0.000 117,020 0.434 15,099 0.056 18,065 0.067 1.2 55,382 0.205 7,010 0.026 51,769 0.192 7.4 67,947 0.252 8,628 0.032 80,619 0.299 9.3 655 MAKAPUU AV (KAPIOLANI BUSINESS) Class/Office 378,208 0 0.000 0 0.000 0 0.000 0.000 164,142 0.434 21,180 0.056 25,340 0.067 1.2 77,684 0.205 9,833 0.026 72,616 0.192 7.4 95,308 0.252 12,103 0.032 113,084 0.299 9.3 874 DILLINGHAM BV (HONOLULU) Class/Office 234,628 0 0.000 0 0.000 0 0.000 0.000 101,829 0.434 13,139 0.056 15,720 0.067 1.2 48,193 0.205 6,100 0.026 45,049 0.192 7.4 59,126 0.252 7,508 0.032 70,154 0.299 9.3 45720 KEAAHALA RD (HALE IMILOA) Class/Office 264,821 0 0.000 0 0.000 0 0.000 0.000 114,933 0.434 14,830 0.056 17,743 0.067 1.2 54,394 0.205 6,885 0.026 50,846 0.192 7.4 66,735 0.252 8,474 0.032 79,182 0.299 9.3
Sub-TOTAL 1,147,288 0 0.000 0 0.000 0 0.000 0.0 497,923 0.434 64,248 0.056 76,868 0.067 1.2 235,653 0.205 29,829 0.026 220,279 0.192 7.4 289,117 0.252 36,713 0.032 343,039 0.299 9.3
MEDIUM AND SMALL FACILITIES (BUILDING AREA ESTIMATED)Sub-TOTAL Class/Office 73,445 8,666 0.118 1,102 0.015 9,254 0.126 8.4 31,875 0.434 4,113 0.056 4,921 0.067 1.2 15,086 0.205 1,910 0.026 14,101 0.192 7.4 0 0.000 0 0.000 0 0.000 0.0
Sub-TOTAL
TOTAL 1,220,733 8,666 0.007 1,102 0.001 9,254 0.008 8.4 529,798 0.434 68,361 0.056 81,789 0.067 1.2 250,739 0.205 31,739 0.026 234,381 0.192 7.4 289,117 0.237 36,713 0.030 343,039 0.281 9.3
NOTES:Energy savings per sq.ft.-year, energy savings cost $ per sq.ft.-year, and consrtuction cost $ per sq.ft.-year are based on UH Energy Benchmarking Study with modifications and re-adjustments.Zero ECO savings in the table indicate that the ECO has already been implemented. HECO Rebate history from 1997 through 2004, and ESPC upgrade analysis conducted in 2004 were used to identify buildings with already implemented ECOs.Refer to the State Energy Benchmarking Study text Section 5.0 for a detailed discussion.
ECM VIII ECM IX ECM X ECM XIPackaged Air Conditioning Unit Replacement Facility Management System (FMS) Installation Insulation Installation Other

ENERGY CONSERVATION MEASURESTATE OF HAWAII FACILITIES IN OAHU ENERGY ECM BENCHMARK
(Convert Constant-Volume to VAV system, Repair VAV Control System,
Install outside-air carbon dioxide sensors controlling outside-air dampers)
Operating Est. Energy Est. Cost Est. Construction Payback Est. Energy Est. Cost Est. Construction Payback Est. Energy Est. Cost Est. Construction Payback Est. Energy Est. Cost Est. Construction PaybackBuilding Name Building Schedule Year- Area Savings (kWh/sf.ft. Savings ($/sq.ft. Costs ($/sq.ft. Savings (kWh/sf.ft. Savings ($/sq.ft. Costs ($/sq.ft. Savings (kWh/sf.ft. Savings ($/sq.ft. Costs ($/sq.ft. Savings (kWh/sf.ft. Savings ($/sq.ft. Costs ($/sq.ft.
Type hr. Built (sq.ft.) (kWh/year) -year) ($/year) -year) ($) -year) (year) (kWh/year) -year) ($/year) -year) ($) -year) (year) (kWh/year) -year) ($/year) -year) ($) -year) (year) (kWh/year) -year) ($/year) -year) ($) -year) (year)
OTHER
LARGE FACILITIES DOES NOT EXIST
MEDIUM AND SMALL FACILITIES (BUILDING AREA ESTIMATED)Sub-TOTAL Office 971,908 114,685 0.118 14,579 0.015 122,460 0.126 8.4 421,808 0.434 54,427 0.056 65,118 0.067 1.2 199,241 0.205 25,270 0.026 186,606 0.192 7.4 0 0.000 0 0.000 0 0.000 0.0
Sub-TOTAL
TOTAL 971,908 114,685 0.118 14,579 0.015 122,460 0.126 8.4 421,808 0.434 54,427 0.056 65,118 0.067 1.2 199,241 0.205 25,270 0.026 186,606 0.192 7.4 0 0.000 0 0.000 0 0.000 0.0
NOTES:Energy savings per sq.ft.-year, energy savings cost $ per sq.ft.-year, and consrtuction cost $ per sq.ft.-year are based on UH Energy Benchmarking Study with modifications and re-adjustments.Zero ECO savings in the table indicate that the ECO has already been implemented. HECO Rebate history from 1997 through 2004, and ESPC upgrade analysis conducted in 2004 were used to identify buildings with already implemented ECOs.Refer to the State Energy Benchmarking Study text Section 5.0 for a detailed discussion.
ECM VIII ECM IX ECM X ECM XIPackaged Air Conditioning Unit Replacement Facility Management System (FMS) Installation Insulation Installation Other