Embed Size (px)
Citation preview
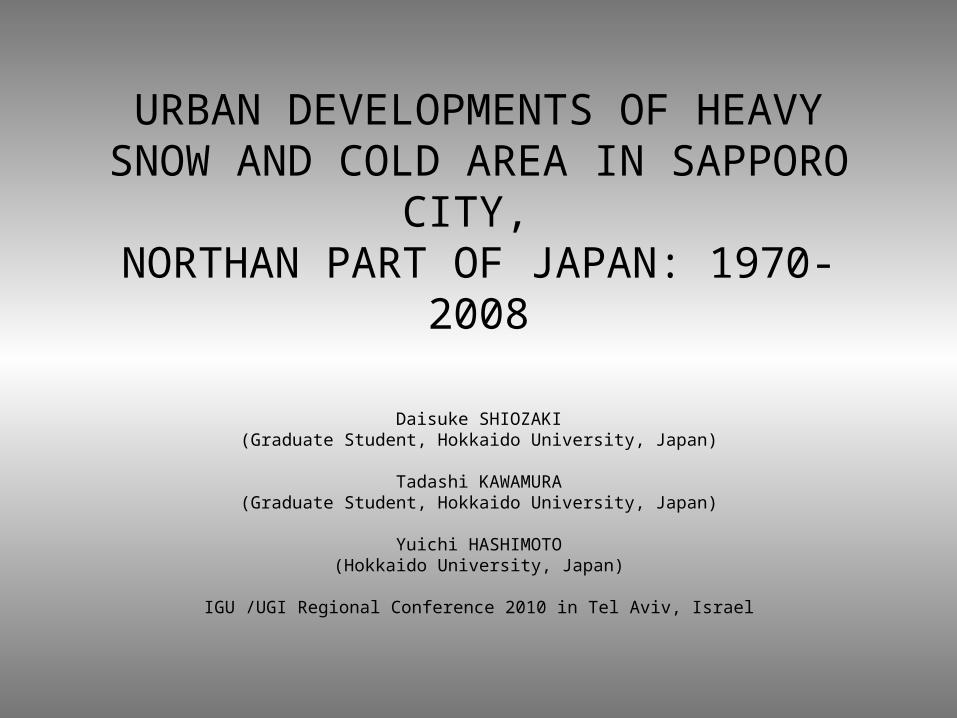
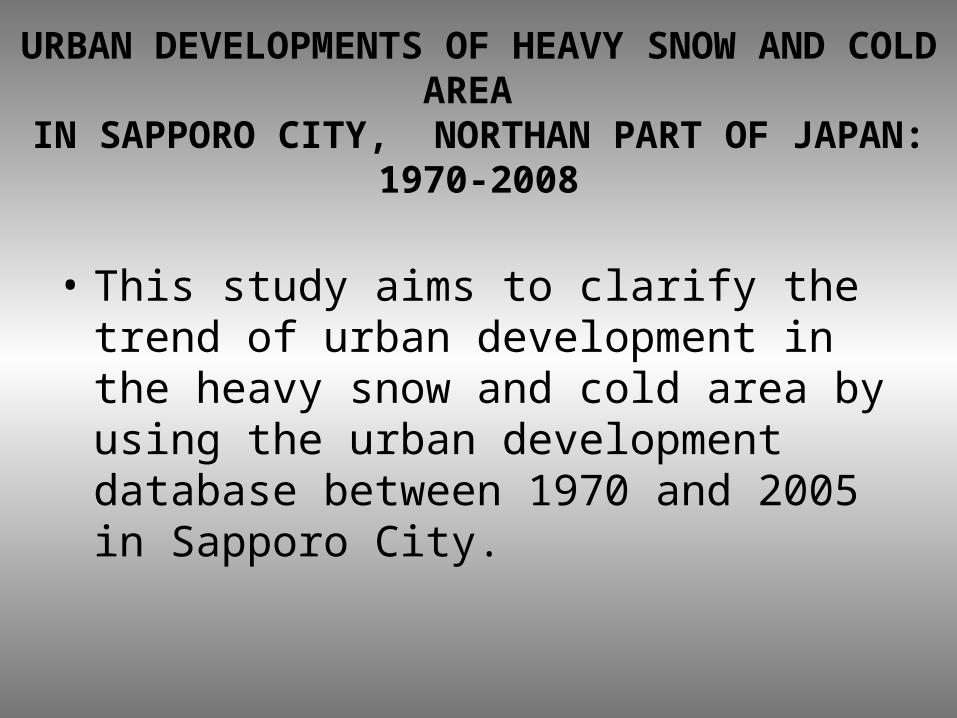
URBAN DEVELOPMENTS OF HEAVY SNOW AND COLD AREA IN SAPPORO CITY,
NORTHAN PART OF JAPAN: 1970-2008
Daisuke SHIOZAKI(Graduate Student, Hokkaido University, Japan)
Tadashi KAWAMURA(Graduate Student, Hokkaido University, Japan)
Yuichi HASHIMOTO(Hokkaido University, Japan)
IGU /UGI Regional Conference 2010 in Tel Aviv, Israel
URBAN DEVELOPMENTS OF HEAVY SNOW AND COLD AREA IN SAPPORO CITY, NORTHAN PART OF JAPAN: 1970-2008
• This study aims to clarify the trend of urban development in the heavy snow and cold area by using the urban development database between 1970 and 2005 in Sapporo City.
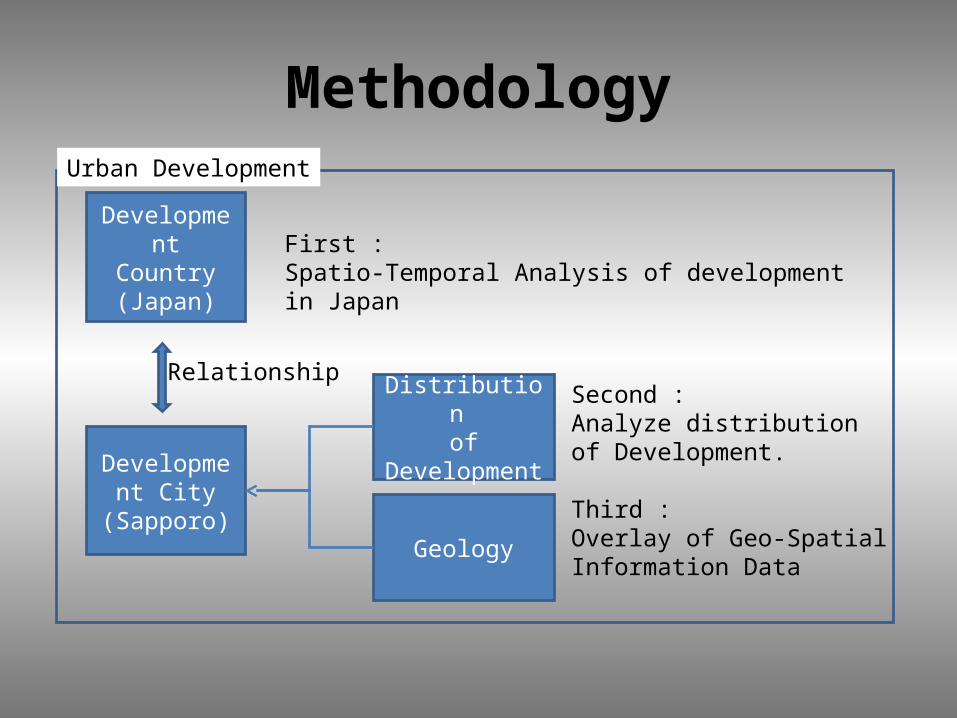
Methodology
Development City
(Sapporo)
Relationship
First :Spatio-Temporal Analysis of development in Japan
Distribution of
Development
Geology
Second :Analyze distribution of Development.
Third :Overlay of Geo-Spatial Information Data
Urban Development
Development Country(Japan)
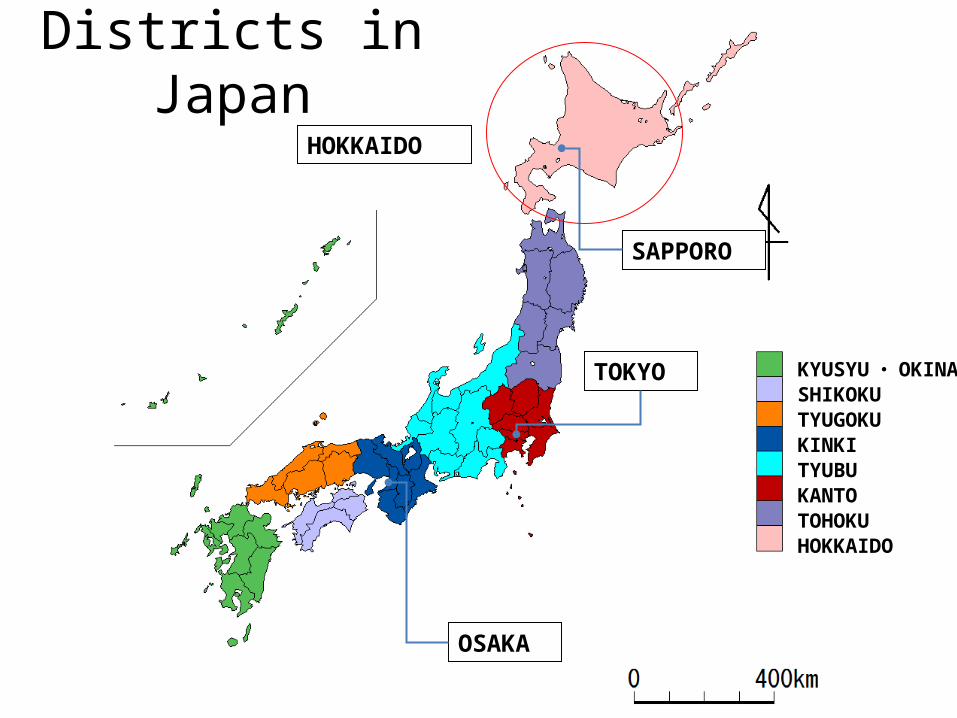
Districts in Japan
KYUSYU ・ OKINAWASHIKOKUTYUGOKUKINKITYUBUKANTOTOHOKUHOKKAIDO
TOKYO
SAPPORO
OSAKA
HOKKAIDO
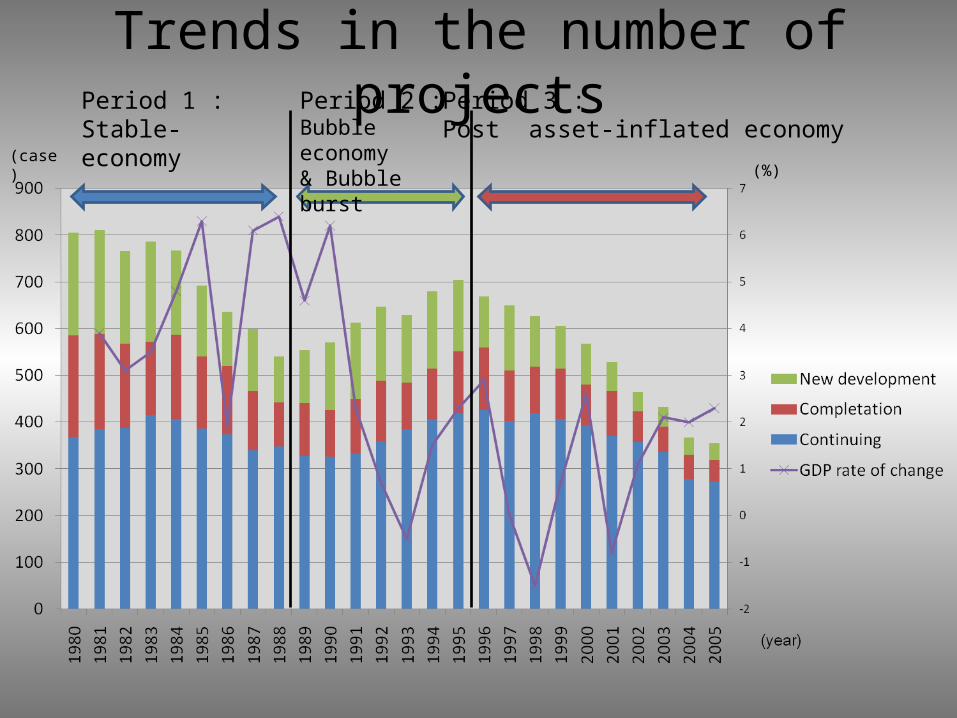
Trends in the number of projectsPeriod 1 :Stable-economy
Period 3 :Post asset-inflated economy
Period 2 :Bubble economy& Bubble burst(case)
(%)
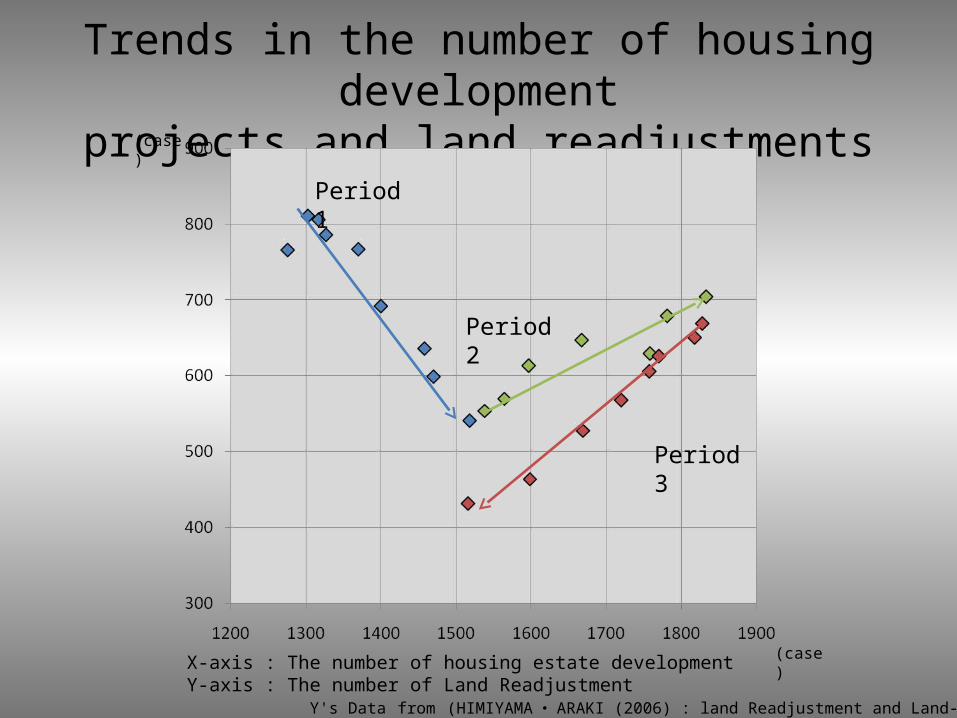
Trends in the number of housing developmentprojects and land readjustments
(case)
(case)
Period 1
Period 2
Period 3
X-axis : The number of housing estate developmentY-axis : The number of Land Readjustment Y's Data from (HIMIYAMA ・ ARAKI (2006) : land Readjustment and Land-Use Change in Japan since 1980 )
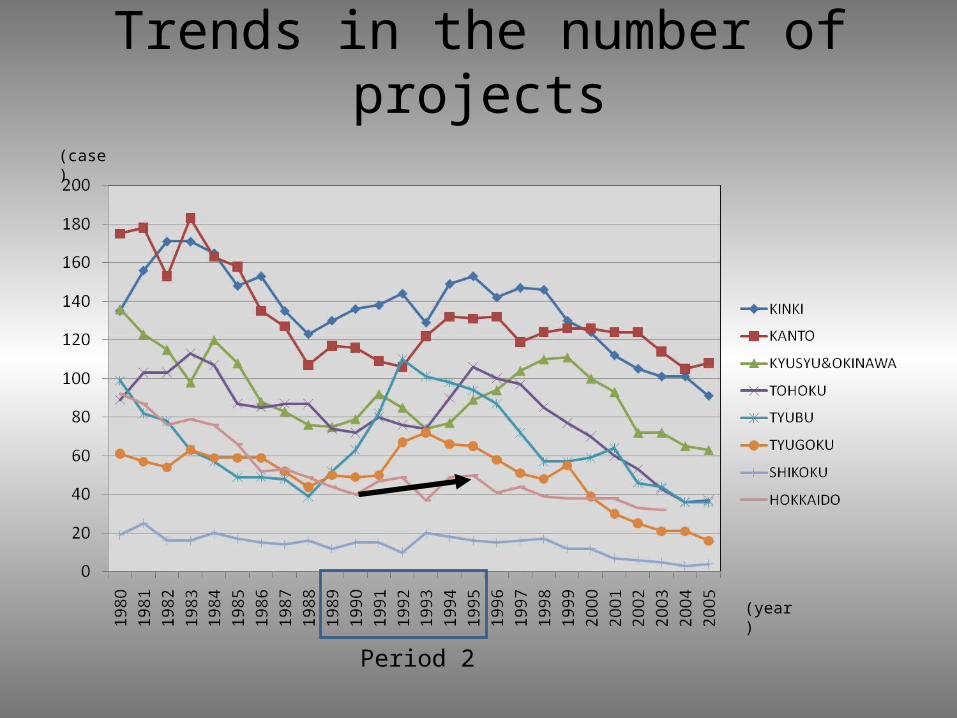
Trends in the number of projects(case)
Period 2
(year)
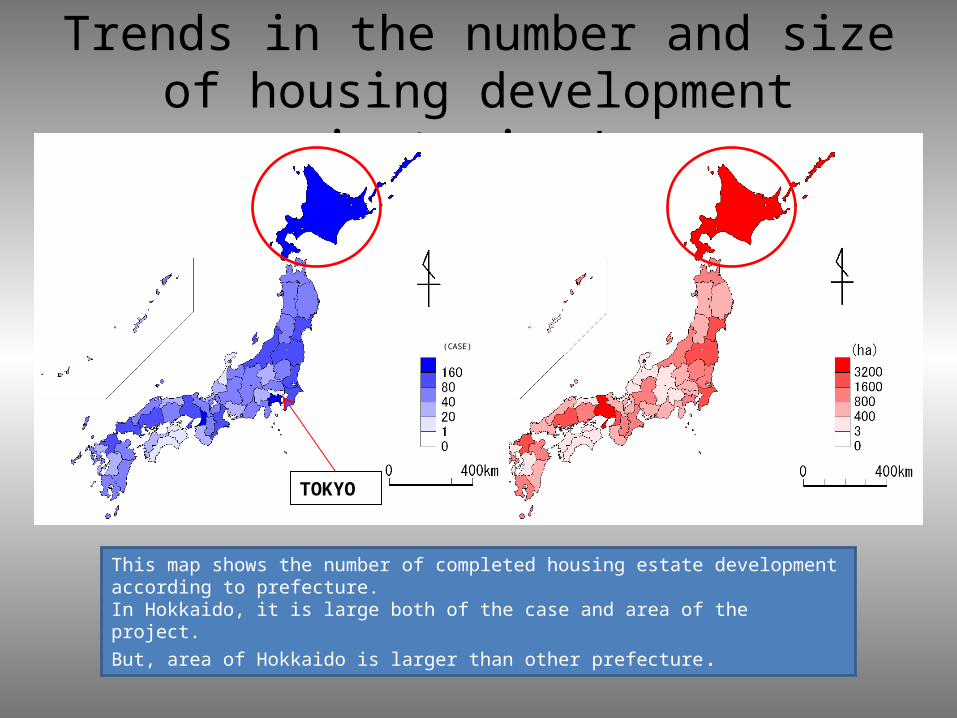
Trends in the number and size of housing development projects in Japan
This map shows the number of completed housing estate development according to prefecture.In Hokkaido, it is large both of the case and area of the project.
But, area of Hokkaido is larger than other prefecture.
(CASE)
TOKYO
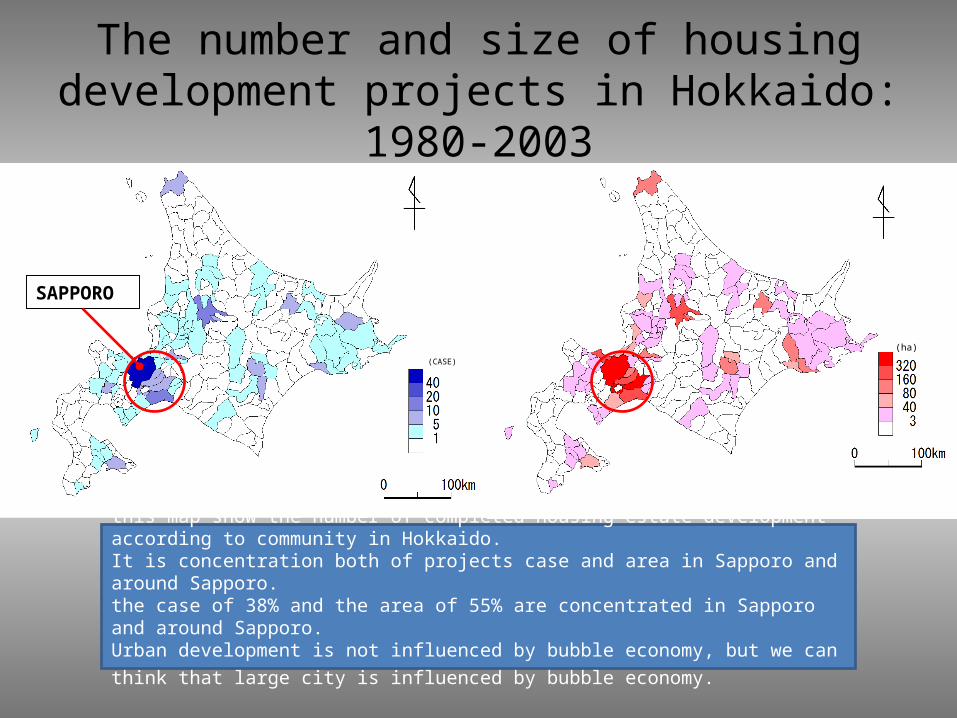
The number and size of housing development projects in Hokkaido: 1980-2003
this map show the number of completed housing estate development according to community in Hokkaido.It is concentration both of projects case and area in Sapporo and around Sapporo.the case of 38% and the area of 55% are concentrated in Sapporo and around Sapporo.Urban development is not influenced by bubble economy, but we can think that large city
is influenced by bubble economy.
(CASE)
(ha)
SAPPORO
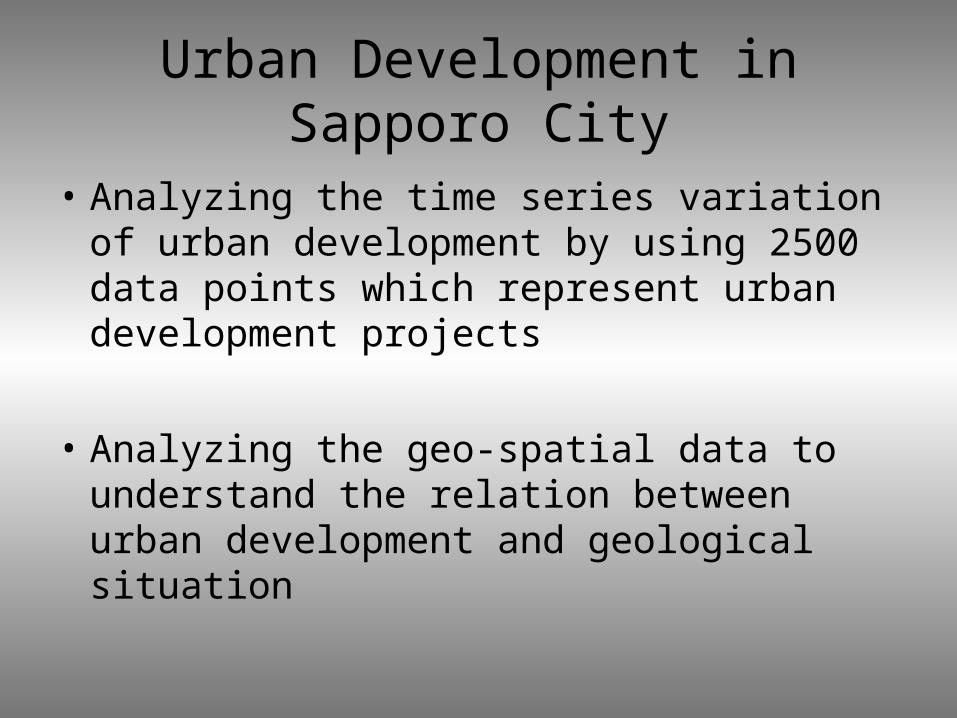
Urban Development in Sapporo City
• Analyzing the time series variation of urban development by using 2500 data points which represent urban development projects
• Analyzing the geo-spatial data to understand the relation between urban development and geological situation
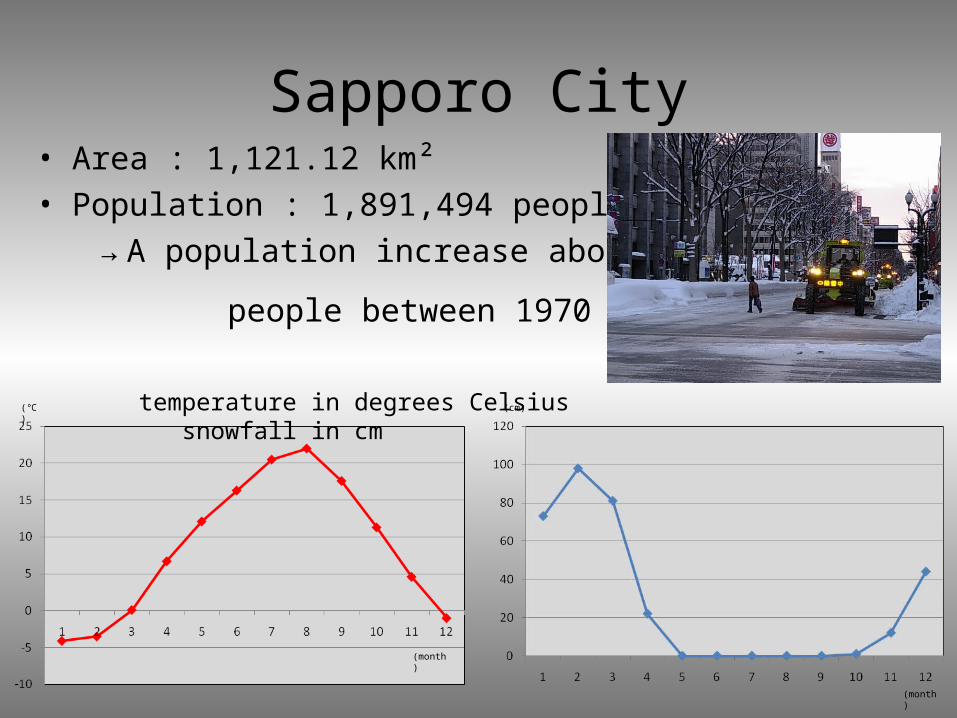
Sapporo City• Area : 1,121.12 km²• Population : 1,891,494 people → A population increase about 900,000
people between 1970 to 2009
(℃) (cm)
(month)
(month)
temperature in degrees Celsius snowfall in cm
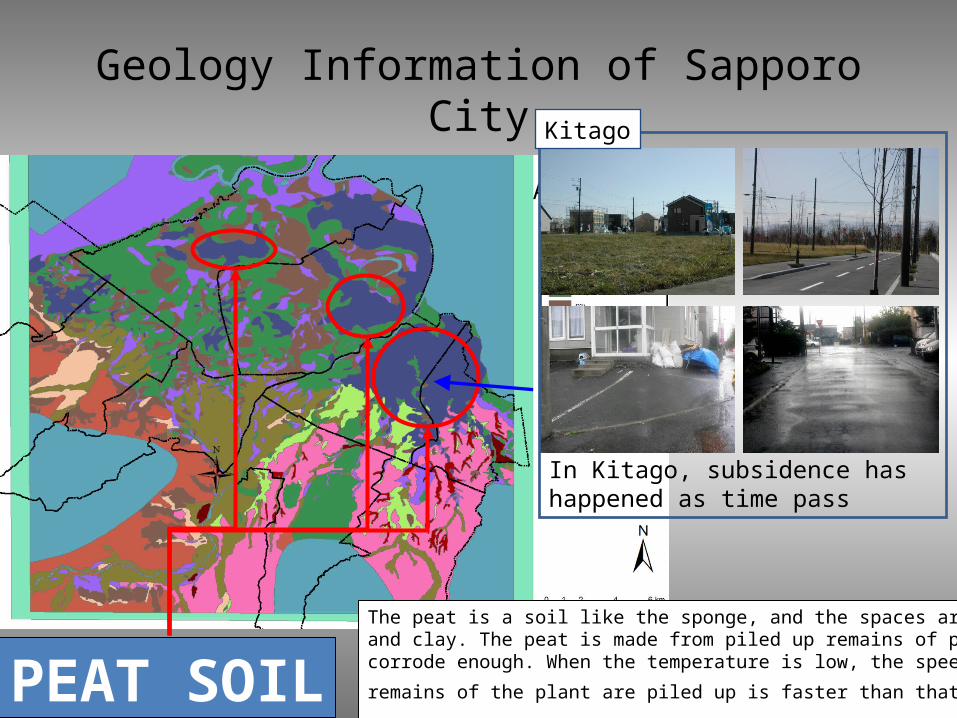
Geology Information of Sapporo City
Atsubetu kita
In Kitago, subsidence has happened as time pass
Kitago
PEAT SOILThe peat is a soil like the sponge, and the spaces are larger than sand and clay. The peat is made from piled up remains of plant that doesn't corrode enough. When the temperature is low, the speed which
remains of the plant are piled up is faster than that of corrosion.
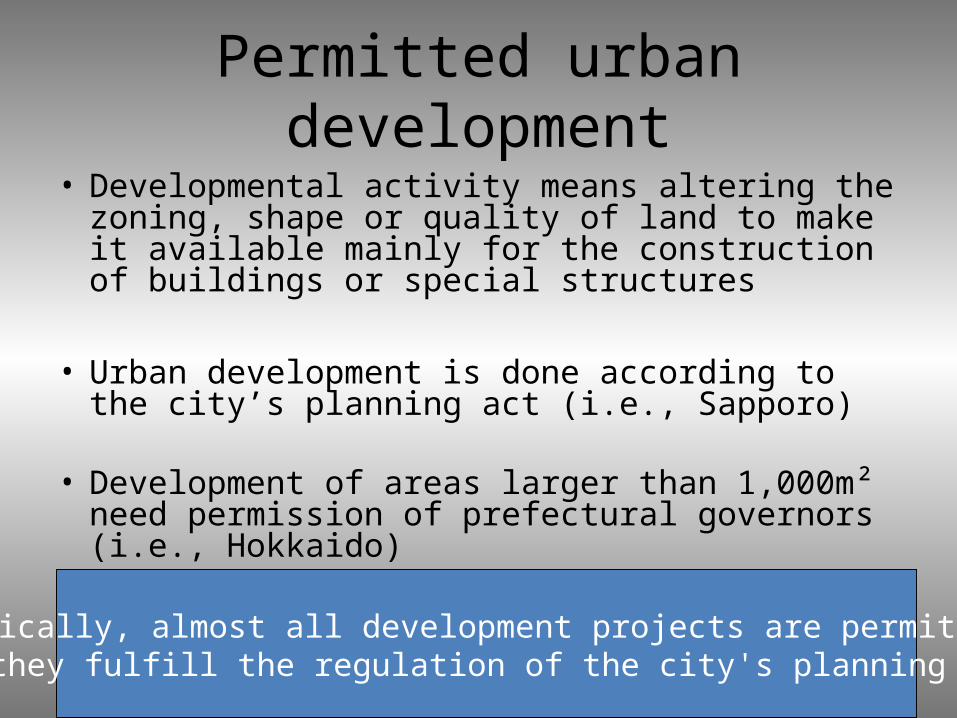
Permitted urban development• Developmental activity means altering the zoning,
shape or quality of land to make it available mainly for the construction of buildings or special structures
• Urban development is done according to the city’s planning act (i.e., Sapporo)
• Development of areas larger than 1,000m² need permission of prefectural governors (i.e., Hokkaido)
Basically, almost all development projects are permitted if they fulfill the regulation of the city's planning Act.
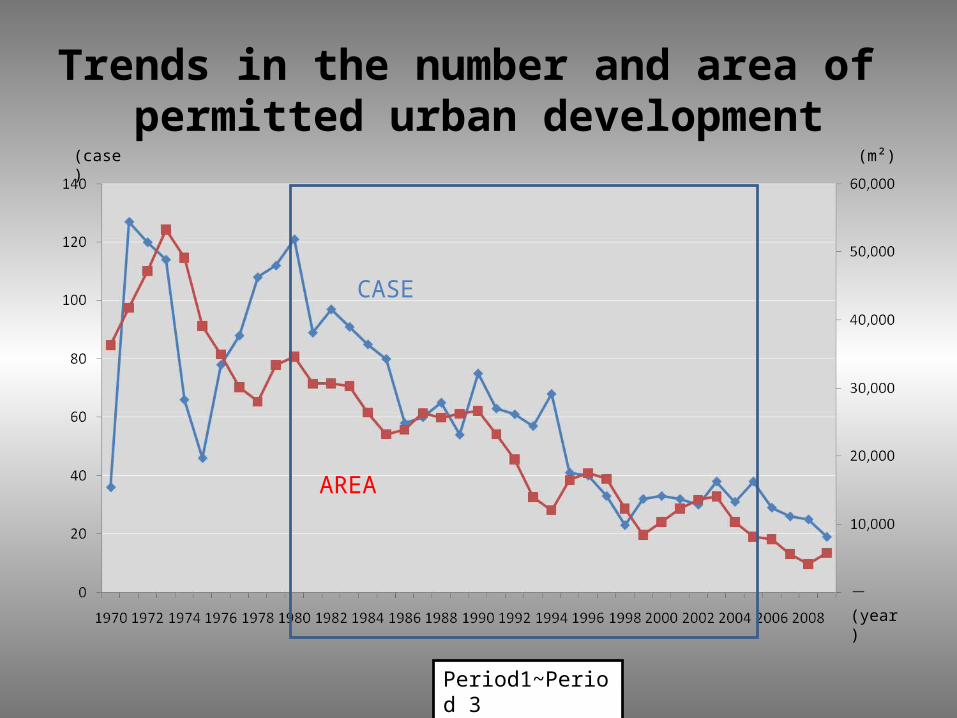
Trends in the number and area of permitted urban development
(case) (m²)
(year)
AREA
CASE
Period1~Period 3
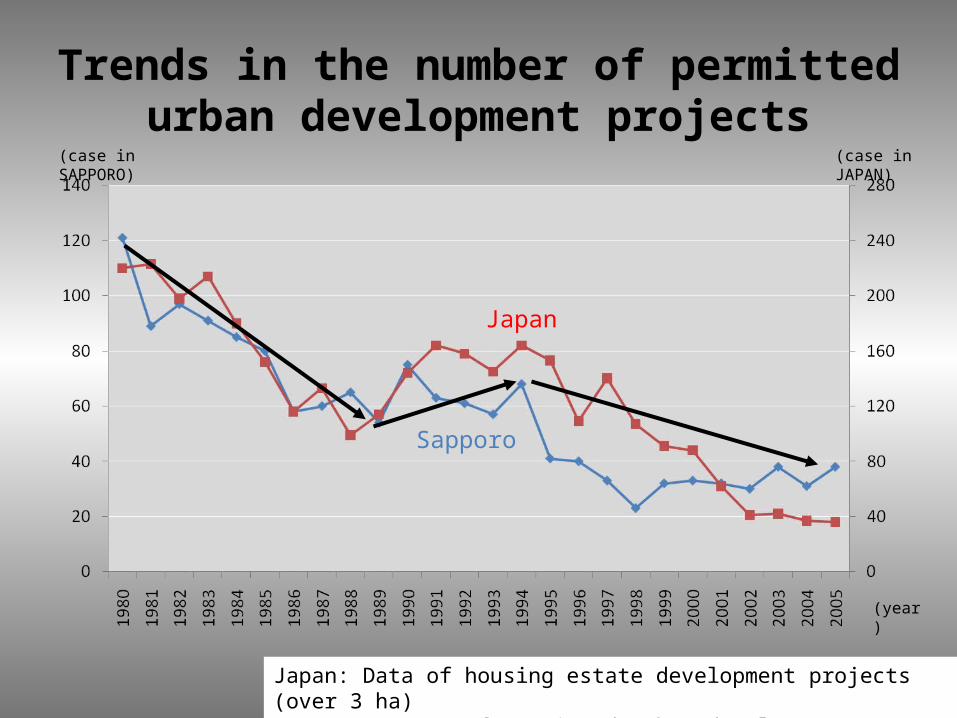
Trends in the number of permitted urban development projects
(case in SAPPORO) (case in JAPAN)
(year)
Japan
Sapporo
Japan: Data of housing estate development projects (over 3 ha)Sapporo : Data of permitted urban development projects (over 1000 ㎡ )

1980-84
Sapporo station
Planning area in Sapporo CityPeat soil
Period 1
Size ( ㎡)
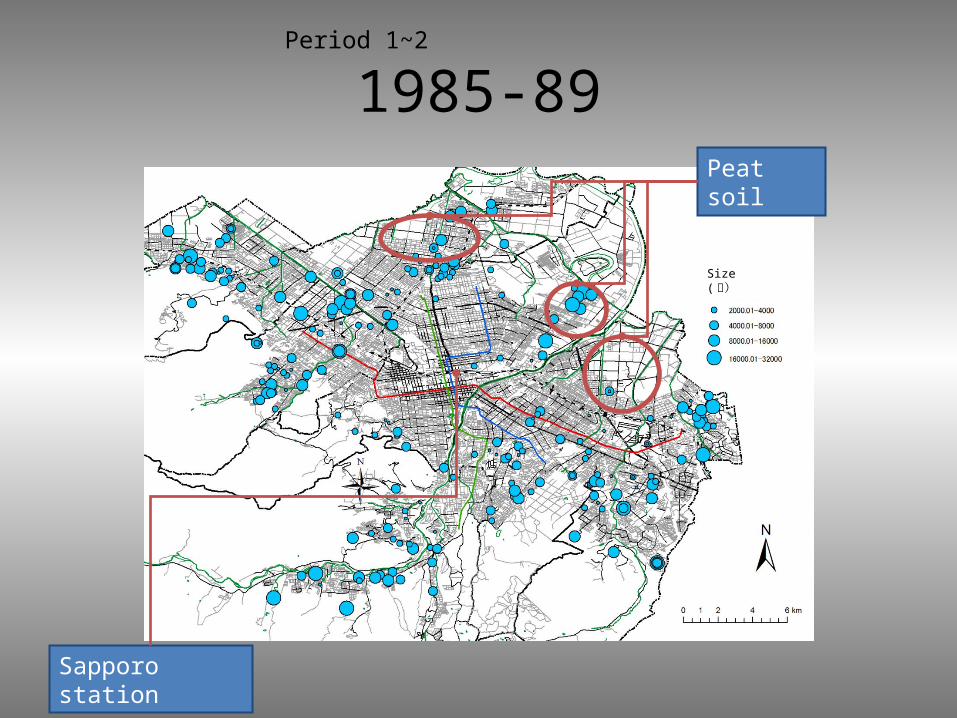
1985-89
Sapporo station
Peat soil
Period 1~2
Size ( ㎡)
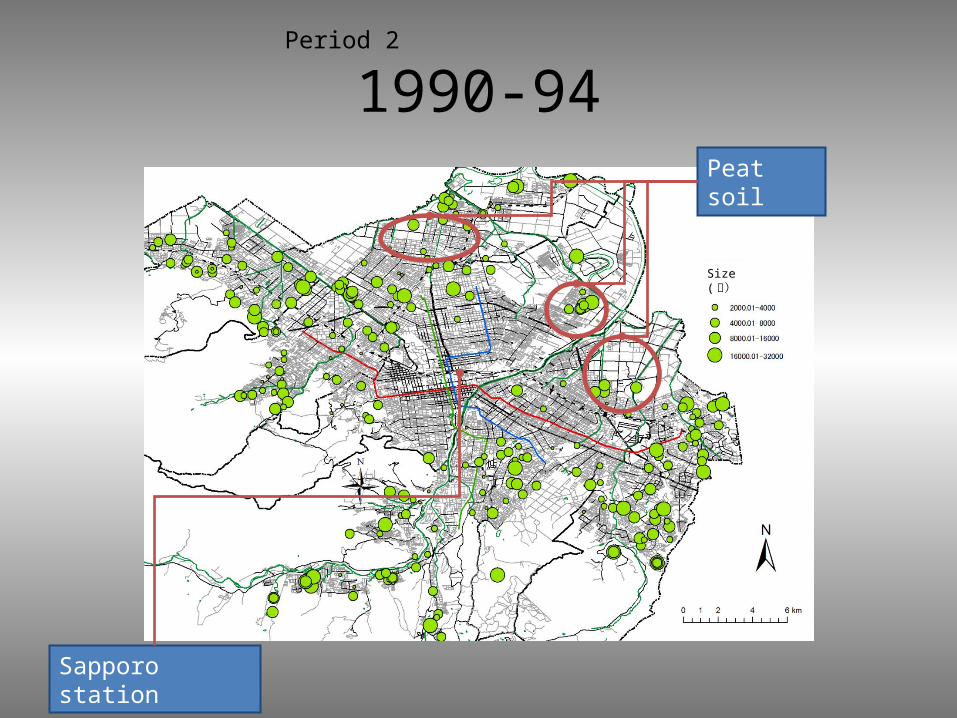
1990-94
Sapporo station
Peat soil
Period 2
Size ( ㎡)
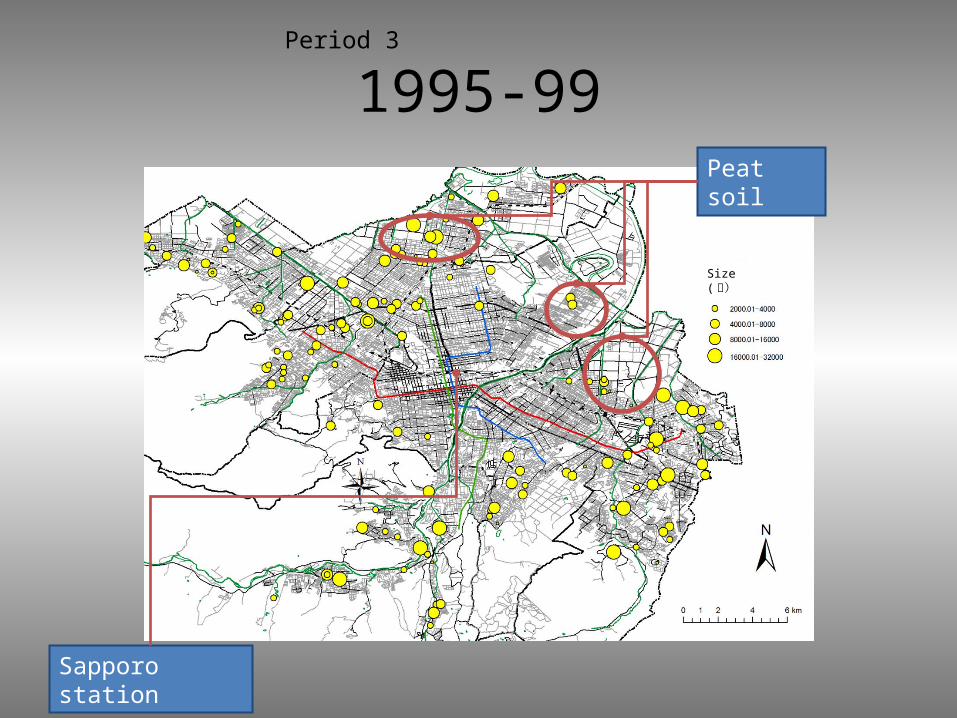
1995-99
Sapporo station
Peat soil
Period 3
Size ( ㎡)

2000-04
Sapporo station
Peat soil
Period 3
Size ( ㎡)
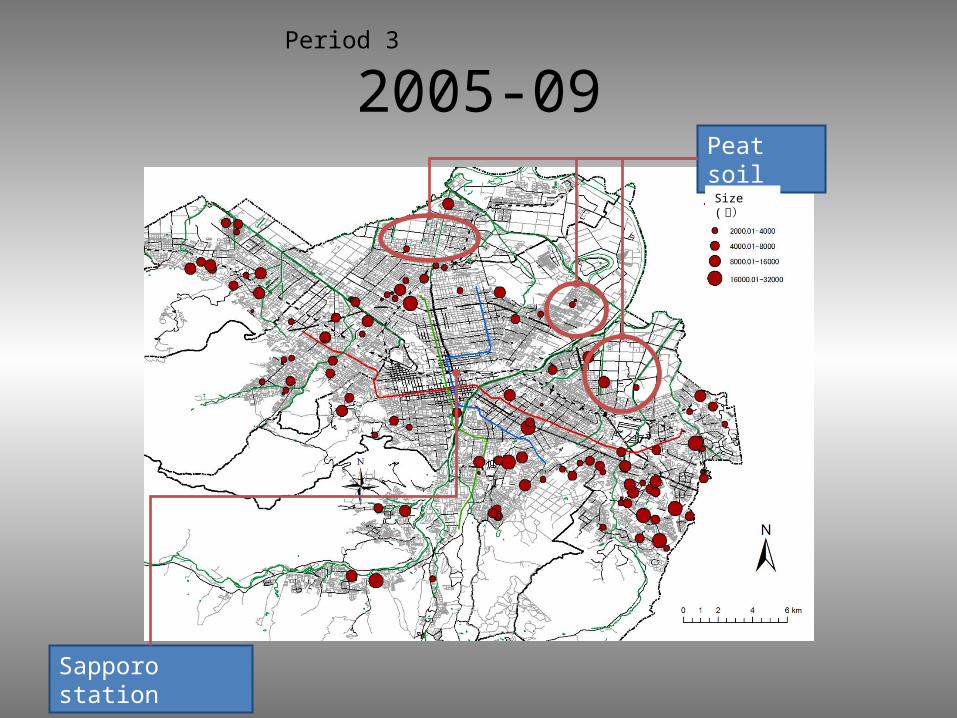
2005-09
Sapporo station
Peat soil
Period 3
Size ( ㎡)
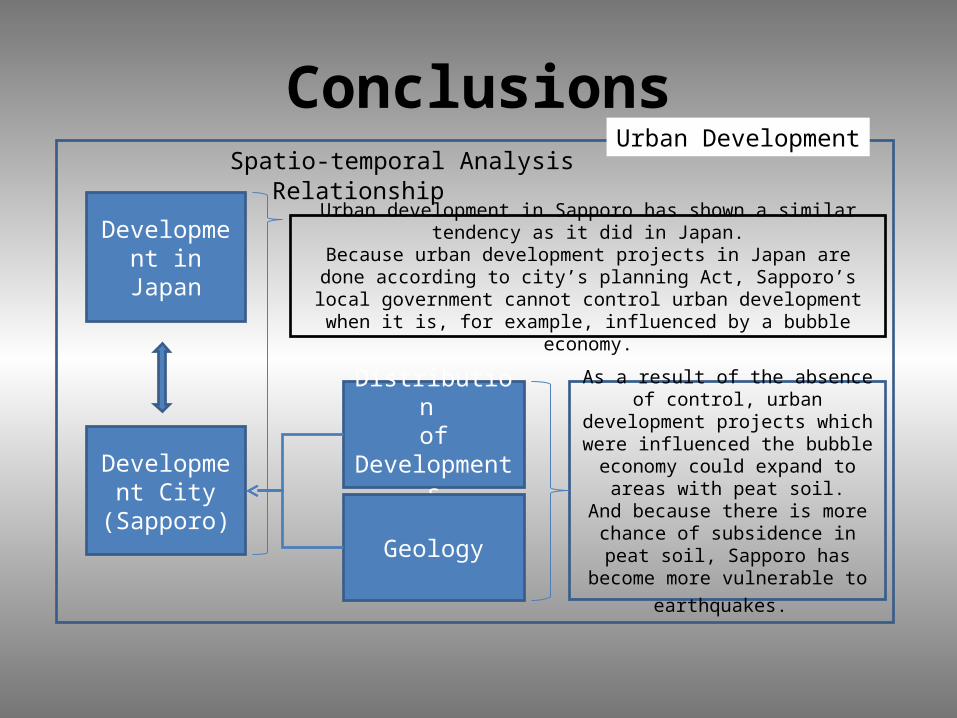
Conclusions
Development in Japan
Relationship
Distribution of
Developments
Geology
Urban Development
Urban development in Sapporo has shown a similar tendency as it did in Japan.
Because urban development projects in Japan are done according to city’s planning Act, Sapporo’s local government cannot control urban
development when it is, for example, influenced by a bubble economy.
As a result of the absence of control, urban development projects
which were influenced the bubble economy could expand to areas
with peat soil.And because there is more chance of subsidence in peat soil, Sapporo
has become more vulnerable to
earthquakes.
Spatio-temporal Analysis
Development City
(Sapporo)
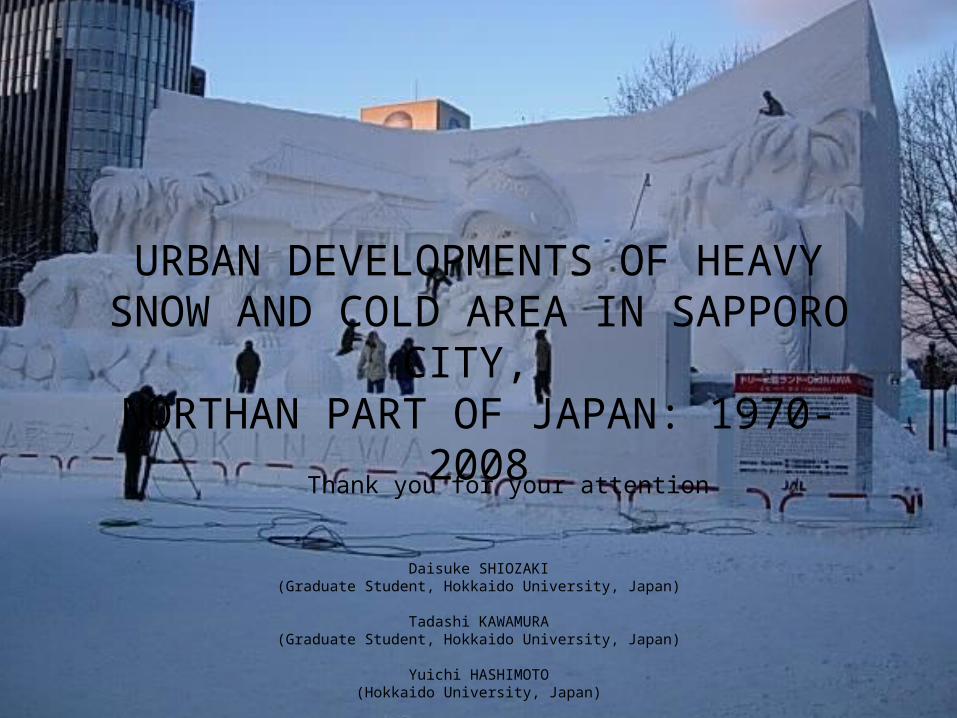
URBAN DEVELOPMENTS OF HEAVY SNOW AND COLD AREA IN SAPPORO CITY,
NORTHAN PART OF JAPAN: 1970-2008
Daisuke SHIOZAKI(Graduate Student, Hokkaido University, Japan)
Tadashi KAWAMURA(Graduate Student, Hokkaido University, Japan)
Yuichi HASHIMOTO(Hokkaido University, Japan)
IGU /UGI Regional Conference 2010 in Tel Aviv, Israel
Thank you for your attention