Embed Size (px)
Citation preview
Uric acid secretion from mouse adipose tissue
1
Uric acid secretion from adipose tissue and its increase in obesity*
Yu Tsushima
1, 2, Hitoshi Nishizawa
1, Yoshihiro Tochino
1, Hideaki Nakatsuji
1, Ryohei Sekimoto
1,
Hirofumi Nagao1, Takashi Shirakura
2, Kenta Kato
2, Keiichiro Imaizumi
3, Hiroyuki Takahashi
2,
Mizuho Tamura2, Norikazu Maeda
1, Tohru Funahashi
4, and Iichiro Shimomura
1
1 Department of Metabolic Medicine, Graduate School of Medicine, Osaka University, Suita, Osaka, Japan 565-0871 2 Teijin Institute for Bio-medical Research, Teijin Pharma Limited, Hino, Tokyo, Japan 191-8512 3 Kondo Laboratory, Teijin Limited, Hino, Tokyo, Japan 191-8512 4 Department of Metabolism and Atherosclerosis, Graduate School of Medicine, Osaka University, Suita, Osaka, Japan 565-0871
*Running title: Uric acid secretion from mouse adipose tissue
To whom correspondence should be addressed: Hitoshi Nishizawa, Department of Metabolic Medicine, Graduate School of Medicine, Osaka University, 2-2-B5, Yamada-oka, Suita, Osaka 565-0871, Japan. Tel.: +81-6-6879-3732; Fax: +81-6-6879-3739. E-mail; [email protected] Key words: Uric acid, Obesity, Adipocyte, Adipose tissue metabolism, Metabolic diseases Background: Purine metabolism in adipose tissue is largely unknown. Results: Adipose tissue had abundant xanthine oxidoreductase activity. Uric acid was secreted from adipose tissues and cells, and the secretion was augmented in obese mice. Conclusion: Adipose tissue can secrete uric acid in mouse. Significance: Dysfunction of obese adipose tissue could be related to overproduction of uric acid.
ABSTRUCT
Obesity is often accompanied by
hyperuricemia. However, purine metabolism in
various tissues, especially on uric acid
production, has not been fully elucidated. Here
we report using mouse models that adipose
tissue could produce and secrete uric acid
through xanthine oxidoreductase (XOR), and
the production was enhanced in obesity. Plasma
uric acid was elevated in obese mice and
attenuated by administration of XOR inhibitor,
febuxostat. Adipose tissue was one of major
organs which had abundant expressions and
activities of XOR, and adipose tissues in obese
mice had higher XOR activities than those of
control mice. 3T3-L1 and mouse primary
mature adipocytes produced and secreted uric
acid into culture media. The secretion was
inhibited by febuxostat in a dose-dependent
manner or gene knockdown of XOR. Surgical
ischemia in adipose tissue increased local uric
acid production and secretion via XOR, with
subsequent increase in circulating uric acid
levels. Uric acid secretion from whole adipose
tissue was increased in obese mice, and uric
acid secretion from 3T3-L1 adipocytes was
increased under hypoxia. Our results suggest
that purine catabolism in adipose tissue could
be enhanced in obesity.
Uric acid is a product of metabolic breakdown of purine nucleotides. In humans, uric acid is the final oxidation product of purine catabolism (1). Elevated serum uric acid (hyperuricemia) is closely associated with visceral far accumulation (2-4) and various metabolic disorders such as glucose intolerance, elevated blood pressure, dyslipidemia and atherosclerotic cardiovascular diseases, conceptualized as the metabolic syndrome (5-10). The level of serum uric acid is determined by a balance between purine dietary uptake and production and excretion of uric acid. It is thought that uric acid is mainly produced in the liver and almost excreted through the urinary tract. However, there is little or no information about purine metabolism in various tissues, especially purine production.
Our group has reported previously the presence of low uric acid clearance in obese
http://www.jbc.org/cgi/doi/10.1074/jbc.M113.485094The latest version is at JBC Papers in Press. Published on August 2, 2013 as Manuscript M113.485094
Copyright 2013 by The American Society for Biochemistry and Molecular Biology, Inc.
by guest on May 21, 2018
http://ww
w.jbc.org/
Dow
nloaded from
Uric acid secretion from mouse adipose tissue
2
subjects relative to non-obese subjects (11). Among obese subjects, the subjects with visceral fat obesity showed higher urinary urate excretion, compared to those with subcutaneous fat obesity (12). Based on the above data, it seems that visceral fat obesity is relatively associated with overproduction type of hyperuricemia. Furthermore, we reported recently that reduction in visceral fat was associate with significant falls in serum uric acid level, and that both serum adiponectin concentration and visceral fat area were significant correlates with serum uric acid level (3). The results suggested the possible involvement of excess visceral fat per se in purine and uric acid metabolism.
Xanthine oxidoreductase (XOR) is an enzyme known to catalyze purines, such as xanthine and hypoxanthine, to uric acid. XOR is also a pharmacological target of antihyperuricemic agents; allopurinol and febuxostat. Recently, Cheung et al. reported that XOR plays a role in adipocyte differentiation (13). In that report, Xor mRNA expression was elevated in adipose tissue of obese mice. However, to date, there has been no study to compare the enzymatic activity of XOR in adipose tissues and other tissues, and analyze uric acid production in obese adipose tissues.
The aim of the present study was to clarify a role of adipose tissue for production of uric acid, and investigate the change with obesity, special focused on XOR. We demonstrate for the first time that adipose tissue produces and secretes uric acid through XOR, and the production of uric acid is augmented in obesity, using mouse models. EXPERIMENTAL PROCEDURES
Animals and experimental protocol. Male B6.V-Lepob/J (ob/ob) and their respective lean control male C57BL/6J (C57) mice were purchased from Charles River Laboratories (Charles River Japan, Inc., Yokohama, Japan). In XOR tissue distribution analysis and tissue uric acid content analysis, 8-week-old male C57 and ob/ob mice were sacrificed after 4-hour fasting (n=4, each). In febuxostat studies, 8-week-old male C57 and ob/ob mice were treated with or without febuxostat for 3 weeks (n=6, each). Febuxostat is known as a non-purine selective inhibitor of XOR, which has no effect on several enzymes in purine and pyrimidine metabolism (14). Mice of the febuxostat group were treated
with febuxostat, which was to drinking water (50 mg/L; the dose was based on previous report (15)). The dose of febuxostat was 6-8 mg/kg/day for C57 mice and 3-7 mg/kg/day for ob/ob mice. Mice of the vehicle group were provided with tap water. Samples of blood and tissues were obtained at the age of 11 weeks after 4-hour fasting. For studies on diet-induced obesity (DIO) mice (16), C57 male mice were purchased from CLEA Japan (CLEA Japan, Inc., Tokyo). At 6-week-old, mice were randomly divided into two groups (n=8, each). Mice of the DIO group were fed high-fat/high-sucrose diet (F2HFHSD; Oriental Yeast Co., Tokyo), while mice of the control group were fed regular diet (CRF-1; Oriental Yeast Co.) for 16 weeks. All mice were sacrificed at the age of 22 weeks after 4-hour fasting. Mice were kept in rooms set at 22°C with a 12-12h dark-light cycle (light cycle, 8 a.m. to 8 p.m.). All experimental protocols described in this report were approved by the Ethics Review Committee for Animal Experimentation of Osaka University School of Medicine.
All blood samples were immediately mixed with 100 μM allopurinol to avoid XOR enzyme reactions in collected blood, and heparinized plasma was prepared by centrifugation for 20 min at 2300 × g at 4°C. Plasma (10 µL) was added to 100 or 200 µL of a mixed solution of acetonitrile and methanol. This solution was mixed thoroughly on a vortex mixer for 5 sec and centrifuged for 15 min at 20400 x g at 20°C. The supernatants were used for measurement of uric acid level. Tissue samples (liver: 50 mg, Mes WAT: 100 mg, Epi and Sub WAT: 250 mg) were homogenized in 1 mL of 0.2 M perchloric acid, and centrifuged at 20,000 ×g for 15 min at 4°C. The supernatants were filtered through 0.22 μm filter (AmiconUltrafree-MC UFC30GV00; Merck KGaA, Darmstadt, Germany), before measurement of uric acid level.
Cell Culture. All cells were maintained at 37°C in a humidified atmosphere of 5% CO2. 3T3-L1 and AML12 cells were obtained from ATCC (Manassas, VA). 3T3-L1 cells were maintained in DMEM with 4.5 g/L glucose, 100 units/mL penicillin, 100 μg/mL streptomycin and 10% FBS, and differentiated as previously described (17). 3T3-L1 cells that were maintained two days after reaching confluence were used as pre-adipocytes, and 3T3-L1 cells on day 8 after
by guest on May 21, 2018
http://ww
w.jbc.org/
Dow
nloaded from
Uric acid secretion from mouse adipose tissue
3
differentiation were used as mature adipocytes. AML12 cells were maintained in DMEM/Ham’s F12 medium supplemented with 10 μg/mL insulin, 5 μg/mL transferrin, 6.7 ng/mL selenium, 40 ng/mL dexamethasone, 100 units/mL penicillin and 100 μg/mL streptomycin and 10% FBS.
Isolation, culture, and differentiation of stromal vascular cells (SVCs) were performed as described previously (18). Briefly, subcutaneous adipose tissues (inguinal region) were dissected out from 8-week-old C57 male mice, and SVCs were obtained by using collagenase digestion procedure. Adipose tissues were incubated with digestion medium (DMEM containing 1 mg/mL type II collagenase (C6885; Sigma-Aldrich Co., St Louis, MO)) for 60 min in shaking water bath at 37°C. After filtration and centrifugation, the pellet SVCs were seeded in 6-well plates with collagen I (Asahi Glass Co., Tokyo), and cultured until confluence in the culture medium (DMEM containing 10% FBS and 200 μM ascorbic acid). Two days after confluence (day 0), the medium was switched to differentiation medium (culture medium plus 5 μM pioglitazone, 0.25 nM dexamethasone, 0.5 mM 3-isobutyl-1-metyl-xanthin, and 5 μg/ml insulin). Two days later, the differentiation medium was switched to maintenance medium (culture medium plus 5 μg/ml insulin). At day 8, SVCs were differentiated into adipocytes (Figure 4A). Isolated hepatocytes were obtained from mice by the two-step perfusion collagenase method (19). Briefly, liver of 8-week-old C57 male mice was perfused in situ through the portal vein with Liver Perfusion Medium (Life Technologies, Carlsbad, CA) at 37°C for 10 min. Then it was perfused with Liver Digestion Medium (Life Technologies) at 37°C for 15 min. Then, the liver was excised, transferred to a dish, and suspended. The resulting cell suspension was filtered and centrifuged at 50 × g for 3 min. Precipitated cells were used as hepatocytes. The viability of the isolated hepatocytes was more than 85%, as determined by the trypan blue exclusion test. The hepatocytes were plated at density of 1.0 × 10⁶ cells in 6-well plates with collagen I in DMEM with 1.0 g/L glucose, containing 100 units/ml penicillin, 100 μg/ml streptomycin, 250 ng/mL amphotericin B. After a 4-h attachment period, the cells were used for experiments.
All cells were maintained in DMEM with 10% FBS, and treated with the indicated concentrations of either febuxostat dissolved in DMSO, or oxonic acid (Tokyo Chemical Industry Co., Tokyo) dissolved in sodium hydroxide. The cells were harvested after 24 hours treatment, and the culture media were analyzed for uric acid. In the hypoxia study (Figure 6C and D), cells were cultured in multi-gas incubator (MCO-5M; Panasonic, Tokyo) for 24 hours under 1% or 10% O2. The culture medium (100 μL) was mixed with 400 μL of methanol, 100 μL of chloroform, and 300 μL of Milli-Q water, and the samples were thoroughly mixed and centrifuged at 20,000 × g for 10 min. The upper aqueous layer was dehydrated with vacuum dryer and dissolved in 100 μL of 74 mM phosphate buffer (pH 2.2), and filtered through 0.22 μm filter, and subjected for measurement of uric acid. Uric acid was diluted with DMEM and 10% FBS to generate a series of standard solutions (10-3000 μg/dL), and those were handled in the same way.
Knockdown of XOR in 3T3-L1 mature adipocytes. On day 7 after the induction of differentiation, 3T3-L1 adipocytes were transfected with siRNA for XOR (XOR siRNA #132003 MSS238716; Life Technologies) using Lipofectamine RNAiMAX reagent (Life Technologies) according to the protocol recommended by the manufacturer. The transfected cells were incubated for 48 hours and then the cells were used for experiments. Allstars negative control siRNA (QIAGEN, Valencia, CA) was used as a control.
Organ culture of mouse adipose tissue. Adipose tissue organ culture was prepared as described previously (20, 21). Briefly, epididymal white adipose tissue (Epi WAT), mesenteric white adipose tissue (Mes WAT), and subcutaneous white adipose tissues (Sub WAT) were obtained from 8-week-old C57 and ob/ob male mice (n=4, each). The respective mean wet weights of the tissues (±SEM) were as follows: Epi WAT; 185.8±7.9 and 1848.4±49.3 mg, Mes WAT; 164.8±19.0 and 1059.8±50.9 mg, Sub WAT; 190.0±8.0 and 2106.6±53.7 mg. Each tissue was placed onto a Φ3 cm-dish filled with 1 mL DMEM and 10% FBS. The whole tissues were minced into small pieces, and the medium was removed and washed with 1 mL of calcium- and magnesium-free PBS, incubated at 37°C in 5%
by guest on May 21, 2018
http://ww
w.jbc.org/
Dow
nloaded from
Uric acid secretion from mouse adipose tissue
4
CO2 with 1 mL DMEM and 10% FBS containing 1 μM febuxostat dissolved in DMSO or DMSO only. After 1- to 6-hour culture, the culture media was collected and subjected to measurement of uric acid levels by HPLC.
Measurement of uric acid level. Plasma levels of uric acid were measured by LC-MS/MS. The chromatographic system was Agilent 1100 (Agilent Technologies, Inc., CA), using a ZIC-pHILIC column (Merck KGaA, Darmstadt, Germany). The column oven was maintained at 30°C, the flow rate was 0.8 mL/min and injection volume was 5 μL. Separation was performed using a gradient solvent system (solvent A = water, solvent B = 100 mM ammonium acetate, and C = acetonitrile). The gradient condition was as follows: Solvent B was maintained to 5%. The gradient started at 4% solvent A, and increased to 45% from 0.5 to 5 min, which was held until 5.5 min. The column was reconditioned with the initial condition for 3.5 min. Electrospray mass spectrometric analyses were performed on an API 3000 (AB Sciex, MA) equipped with a TurboIonSpray source operated in multiple reaction monitoring (MRM) under negative ion mode. The MRM transition pairs were 166.965 >123.5 for uric acid and 168.925 >124.8 for uric acid-1, 3-15N2. For internal standard solution, 400 or 800 nM of uric acid-1, 3-15N2 solution diluted with water was used. For standard solutions, 10-100,000 nM of uric acid solution diluted with a mixed solution of acetonitrile and methanol was used. All samples and standards were mixed with the same volume of internal standard solution, and the mixture was subjected to LC-MS/MS analysis. Calibration curves based on internal standard calibration were obtained by weighted (1/x, x = concentration) linear regression for the peak area ratio of the analyte to the internal standard against the analyte concentration. The concentrations of the analyte in unknown samples were obtained from the regression curve.
Uric acid contents in tissues, culture media or dialysates were measured by the HPLC-UV method (22). The chromatographic system was a NanoSpace SI-2 (Shiseido, Tokyo), using a capcellpak C18 MGIII column (Shiseido). Separation was performed at room temperature using a gradient solvent system (solvent A = 74 mM phosphate buffer (pH 2.2), and solvent B = 50% Methanol / 37mM sodium phosphate buffer
(pH 2.2)). The gradient conditions were as follows: The initial percentage of solvent B was 0%, which was increased to 10% in 8 min, to clean up the column the percentage of solvent B was increased to 100% in 2 min and maintained for 3 min, then lowered to 0% in 0.1 min, after which it was kept constant for 15 min to re-equilibrate the column prior to the next injection. The flow rate was set at 200 μL/min, and the injection volume was 10 μl. Uric acid was detected at A284 nm. For standard solution, 3-3000 μg/dL of uric acid solution diluted with 0.2 M perchloric acid or saline was used. For the measurement of uric acid level in culture media, other standard solutions described in the above sections were used. The sample absorbance area under the curve was calculated and the concentration was calibrated by the standard linear regression. Uric acid contents were given by multiplying the concentrations by the sample volume.
Fractionation of mouse adipose tissue. Epi WAT, Mes WAT and Sub WAT from 8-week-old C57 male mice were fractionated, as described previously (23). Adipose tissues were minced in Krebs–Ringer bicarbonate HEPES buffer, which contained 120 mmol/L NaCl, 4 mmol/L KH2PO4, 1 mmol/L MgSO4, 1 mmol/L CaCl2, 10 mmol/L NaHCO3, 30 mmol/L HEPES, 20 μmol/L adenosine, and 4% (wt/vol) bovine serum albumin (Calbiochem, San Diego, CA). Tissue suspensions were centrifuged at 500 × g for 5 min to remove erythrocytes and free leukocytes. Collagenase was added to a final concentration of 2 mg/mL and incubated at 37°C for 30 min under continuous shaking. The cell suspension was filtered through a 250 μm filter and then spun at 300 × g for 1 min to separate floating mature adipocytes fraction (MAF) from the stromal vascular cell fraction (SVF) pellet. The fractionation and washing procedures were repeated twice with Krebs–Ringer bicarbonate HEPES buffer. Finally, both fractions were washed with PBS, and subjected for mRNA analysis.
Quantification of mRNA levels. Total RNA was isolated from mouse tissues by using RNA STAT-60 (Tel-Test, Inc., Friendswood, TX) according to the protocol supplied by the manufacturer. The quality and quantity of total RNA were determined by using ND-1000
by guest on May 21, 2018
http://ww
w.jbc.org/
Dow
nloaded from
Uric acid secretion from mouse adipose tissue
5
spectrophotometer (Nano Drop Technologies, Wilmington, DE). First-strand cDNA was synthesized from 160 ng of total RNA using Transcriptor First Strand cDNA Synthesis Kit (Roche Applied Science, Upper Bavaria, Germany). Real-time quantitative PCR amplification was conducted with the LightCycler 1.5 (Roche Applied Science) using Light Cycler-FastStart DNA Master SYBR Green I (Roche Applied Science), according to the protocol recommended by the manufacturer. The sequences of primers used for real-time PCR were as follows: Xor, 5'-TCTGCCCTCTAACACAGCCT-3' and 5'-TGACAGCGACCTCACTCATC-3', Uox, 5'-GGTGGAGCAGATGAGAAACG-3' and 5'-GGAACCCTTCAAACCCAGAC-3'.
Western blot analysis. Tissue lysates (5 μg of protein) were resuspended in Laemmli buffer. Proteins were separated by SDS-PAGE, transferred to nitrocellulose membranes, blocked with 5% nonfat milk, washed with TBS-T (10 mM Tris-HCl, 100 mM NaCl, and 0.02% Tween 20), and incubated overnight at 4°C with the primary antibodies. The antibody against XOR was diluted 1:1000 (sc-20991; Santa Cruz Biotechnology, Inc., Santa Cruz, CA). Membranes were washed with TBS-T and incubated with the anti-rabbit IgG horseradish peroxidase-conjugated secondary antibodies (NA934; GE Healthcare, Buckinghamshire, UK, diluted 1:4000). Proteins were visualized by enhanced chemiluminescence and quantified by densitometry.
XOR activity measurement. XOR activity in tissue homogenates and cell lysates was determined using a fluorometric assay measuring the conversion of pterin to isoxanthopterin (IXP) (24-26). Tissues or cultured cells were homogenized in 50 mM Tris-HCl (pH 7.5), 0.1% Triton X-100, and complete protease inhibitor cocktail (Roche Applied Science), and centrifuged at 20,000 × g for 15 min at 4°C. Protein concentrations were determined by using the BCA protein assay (Thermo Fisher Scientific Inc., Waltham, MA). To measure xanthine oxidase (XO) activity, lysates were incubated under aerobic condition at room temperature for 30 min with 25 μM pterin, and fluorescence intensity at Ex/Em = 355 nm/405 nm was measured every 5 min. To measure the activities of both XO and xanthine dehydrogenase (XDH) (XOR activity),
lysates were incubated 25 μM pterin and 200 μM methylen blue under the same condition. The reaction rate was determined from the slope of the intensity-versus-time plots. For calibration, the step change in fluorescence intensity upon addition of a standard concentration (0.1 – 30 μM) of IXP was measured. Values are expressed as nmols IXP/min/μg protein.
Microdialysis studies. The effects of ischemia reperfusion injury on uric acid level in Epi WAT and blood were measured by microdialysis (27, 28). In all microdialysis studies, 8-week-old C57 male mice were used after 4-hour fasting. During the experiments, mice were anesthetized and warmed with heating pads to maintain body temperature. The microdialysis probes were custom-made (150 mm × I.D. 0.2 mm, 70,000 molecular weight cut-off) and their structures are displayed in Figures 5A and 5B. The recovery rate of uric acid in the probes was calculated in preliminary in vitro experiments (single-lumen probe; 67.6±5.9%, double-lumen probe; 66.0±15.8%, mean±SD). During dialysis, the probe and catheter were connected to a microinfusion pump (CFV-3100, Nihon Kohden, Tokyo) and perfused with saline (2 μL/min).
In Epi WAT studies, mice of the febuxostat group were given single oral administration of 6 mg/kg febuxostat (0.6 mg/mL suspended in tap water), while mice of the vehicle group were given equal amount of tap water (n=4, each). After 2 hours, single-lumen probes (Figure 5A) were implanted into the both Epi WATs. After a 60-min equilibration period, fractions were collected every 10 min. After the end of the third fraction period, ischemia of the right Epi WAT was induced by surgical occlusion of the right testicular artery and vein, and the following three fractions were collected.
In intravenous studies, mice of the ischemia/reperfusion group and control group (n=9, each) were injected intravenously with 1000 units/kg heparin (Novo-Heparin, Mochida Pharmaceutical Co., Tokyo) to prevent the adhesion of blood clots to the probe. Double-lumen probes (Figure 5B) were introduced from the right external jugular vein up to 15 mm. It was considered that the head of the probe was located near the superior vena cava. After a 60-min equilibration period, fractions were collected every 10 min. At the end of the third
by guest on May 21, 2018
http://ww
w.jbc.org/
Dow
nloaded from
Uric acid secretion from mouse adipose tissue
6
fraction period, mice of ischemia/reperfusion group were subjected to bilateral ischemia of Epi WAT by reversible occlusion of the testicular artery and vein using vascular clips, and the following three fractions were collected. Then, the clip was removed to initiate reperfusion of Epi WAT, and three other fractions were collected. Mice of the control group underwent sham-operation. The collected 10 μL of each dialysate was used for measurement of uric acid.
Statistical analysis. Results were expressed as mean±SEM. Repeated measure-based parameters were analyzed using two-way ANOVA test with repeated measures followed by unpaired Student’s t-test for individual pairs. Differences based on febuxostat concentrations were analyzed by the Kruskal-Wallis test. Other comparisons were conducted using the unpaired Student’s t-test or one-way ANOVA test followed by Dunnett’s or Tukey’s post hoc. In all cases, differences were considered significant when p values <0.05. All analyses were performed using the JMP Statistical Discovery Software 9.0 (SAS Institute, Cary, NC).
RESULTS Obese mice have hyperuricemia, and XOR
inhibitor treatment reduces plasma uric acid
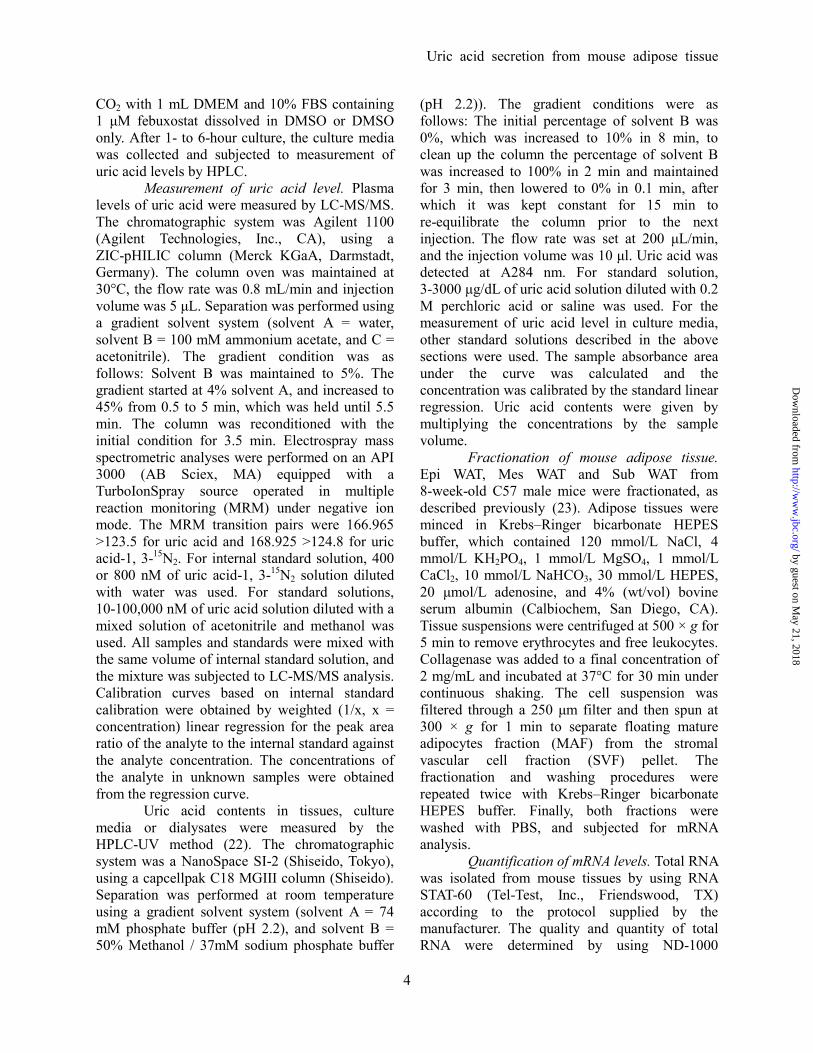
levels of obese mice. At first, we analyzed plasma uric acid levels in obese mice and the effect of febuxostat, a XOR inhibitor (Figure 1). Febuxostat is a new drug used for the treatment of gout and hyperuricemia based on inhibition of XOR-mediated production of uric acid during purine catabolism. As reported previously (13, 29), plasma uric acid level in 11-week-old ob/ob mice was significantly higher than in age-matched control C57BL/6J (C57) mice (Figure 1A). Treatment with febuxostat for 3 weeks decreased the level of plasma uric acid in ob/ob, but had no effect in control mice. Treatment with febuxostat had no effect on body weight, food intake and Epi WAT weight in control and ob/ob mice (data not shown). The decrease in plasma uric acid level by febuxostat demonstrated that the high plasma uric acid level was substantially caused by XOR-mediated overproduction of uric acid.
In mammals, XOR can exist in two enzymatic forms: xanthine dehydrogenase (XDH; EC 1.1.3.204) and xanthine oxidase (XO; EC 1.1.3.22). XDH utilizes NAD+ as an electron
acceptor, while XO utilizes O2 as an electron acceptor (30). To examine the effect of obesity on XOR enzymatic activity and confirm the effect of febuxostat, we measured XO and XOR activities (combined activity of XO and XDH) in liver and adipose tissue (Figure 1B). In the liver of ob/ob mice, XO activities were significantly higher, but XOR activities tended to be higher (p=0.0672), relative to those of control mice. On the other hand, in Epi WAT of ob/ob mice, both XO and XOR activities were markedly higher than those of control mice. Treatment with febuxostat inhibited both XO and XOR activities in the liver and Epi WAT of ob/ob and control mice. The increased XO and XOR activities in the Epi WAT of ob/ob suggested enhancement of purine catabolism in adipose tissue in obese mice.
We also analyzed plasma uric acid levels in diet-induced obesity (DIO) mice. In mice of DIO group which were fed high-fat/high-sucrose diet for 16 weeks, the body weights were significantly heavier (data not shown), and the levels of plasma uric acid were significantly higher (Figure 1C) than those in mice of control group. XO and XOR activities in the liver were significantly higher in DIO mice than control mice. Furthermore, XO activities in Epi WAT tended to be higher (p=0.0665) and XOR activities were significantly higher in DIO mice than control mice (Figure 1D). XO and XOR activities in adipose tissue were equivalent to those in the liver, in both ob/ob and DIO mice (Figure 1B and 1D).
Adipose tissue is one of the major organs
which have abundant expressions and activities
of XOR, and obese adipose tissues have higher
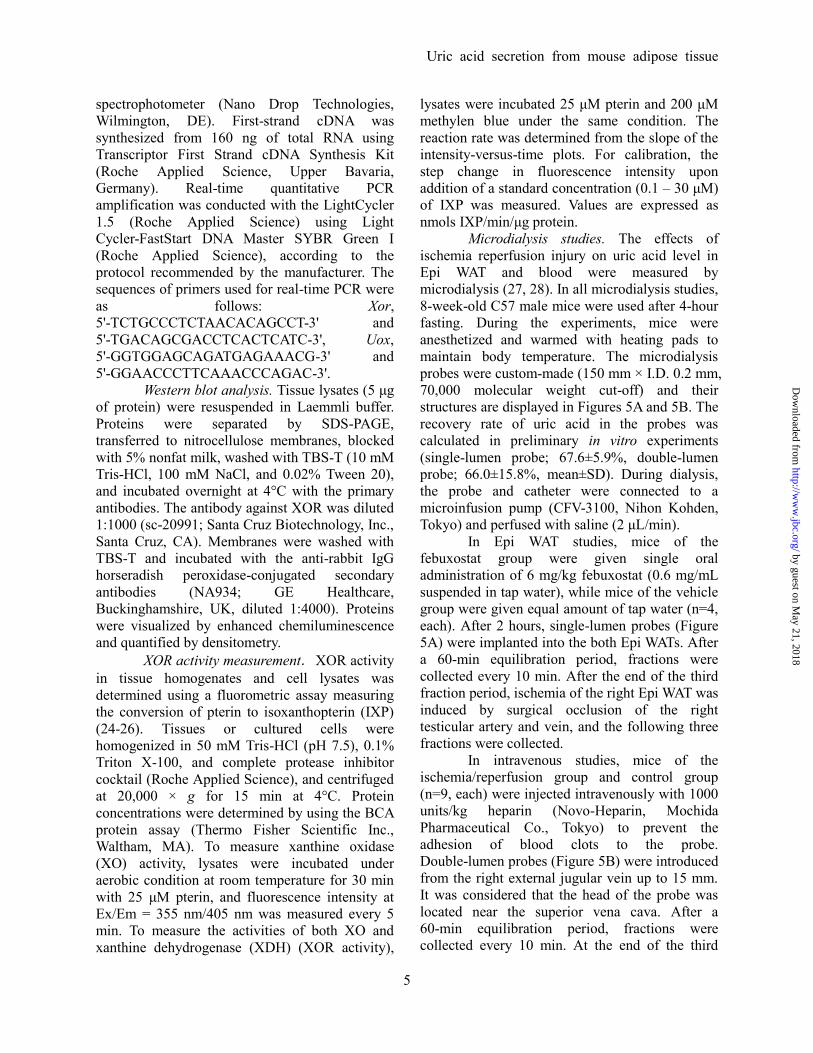
XOR activities. In the above experiments, we demonstrated that XOR activity in Epi WAT were increased with obesity, and that such increase was suppressed following treatment with febuxostat. Xor gene expression in adipose tissue had been reported previously in only one study using microarray analysis, which demonstrated Xor expression in several tissues (13). Here, we conducted comprehensive analysis of Xor gene expression, protein expression and enzymatic activity in various tissues in ob/ob obese mice and control mice. The analyzed tissues included Epi WAT, Mes WAT and Sub WAT (Figure 2). In lean C57 mice, Xor mRNA expression levels were more abundant in Epi WAT and small intestine than in other tissues, while the levels in Mes WAT,
by guest on May 21, 2018
http://ww
w.jbc.org/
Dow
nloaded from
Uric acid secretion from mouse adipose tissue
7
Sub WAT, liver, lung and heart ranked second to those in Epi WAT and small intestine. Relatively low levels of Xor mRNA were detected in the brain, spleen, kidney, testis, colon, aorta and muscle (Figure 2A). These results indicated that adipose tissues were major organs which have abundant Xor mRNA expression. Xor mRNA level in Mes WAT was significantly higher in ob/ob mice than in C57. There were no significant differences in Xor mRNA levels in other tissues between ob/ob and C57.
Next, we examined the protein expression levels of XOR using western blotting. In the homogenates of liver, lung, small intestine, Epi WAT, Mes WAT and Sub WAT obtained from C57 and ob/ob, relatively more abundant expression were detected (Figure 2B). The quantitative analysis indicated that XOR protein levels of Mes WAT in ob/ob were significantly higher than that in C57 (Figure 2C).
XO and XOR (XO + XDH) enzymatic activities were also measured by fluorometric assay using pterin substrate (24-26). In C57 mice, both XO and XOR activities were highest in the small intestine, followed by the liver, lung, Epi WAT, Mes WAT and Sub WAT (Figure 2D). These findings are almost consistent with those described in a previous study, although that study did not examine the activities in adipose tissue and skeletal muscle (31). Further analysis showed higher XO activities in Epi WAT, Mes WAT, heart, spleen, kidney, colon and muscle (p<0.05), and higher XOR activities in Epi WAT, Mes WAT, heart and spleen (p<0.05) of ob/ob than C57 mice. We demonstrated for the first time that adipose tissue is one of the major organs have abundant expressions and activities of XOR in mice, and obese adipose tissues have higher XOR activities. These findings suggested purine catabolism in adipose tissue was accelerated with obesity.
Mature adipocytes produce and secrete
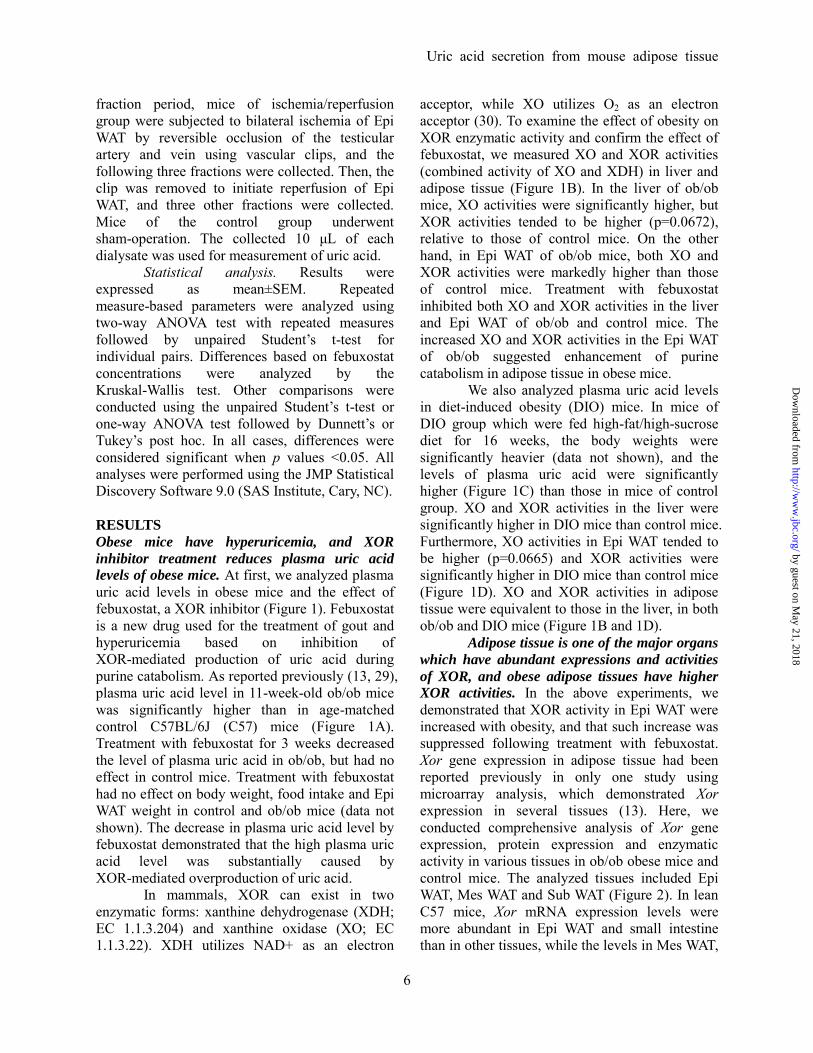
uric acid via XOR. To identify which cell type preferentially contributed to the observed XOR levels, mature adipocyte fraction (MAF) and stromal vascular fraction (SVF) were isolated from adipose tissues (Figure 3A). Xor mRNA levels were markedly higher in MAF of Epi WAT, Mes WAT and Sub WAT, compared with in SVF.
Next, we investigated whether mature adipocytes can produce and secrete uric acid. For this purpose, we examined the level of uric acid in
culture media of mouse 3T3-L1 adipocytes, as well as the enzymatic activity of XOR in the cell lysates. We examined the accumulation of uric acid in media per 24 hours in 3T3-L1 cells each day after differentiation. Uric acid became detectable from day 1 after differentiation, and increased in a time-dependent manner (Figure 3B). Intracellular XOR activity also increased during differentiation up to day 29. In other experiments, uric acid level in culture media of 3T3-L1 mature adipocytes (Day 8) was significantly higher than in that of pre-adipocytes (Day 0) (Figure 3C). Furthermore, the addition of febuxostat significantly decreased uric acid level in culture media and the effect was dose-dependent. This decrement was associated with inhibition of intracellular XOR activity (Figure 3D). These results suggest that 3T3-L1 mature adipocytes produce and secrete uric acid via XOR. In the culture media of AML-12 which is mouse hepatocyte cell line, accumulation of uric acid was also detected and suppressed by febuxostat in a dose-dependent manner (Figure 3C and 3D). To confirm XOR-dependent uric acid production from mature adipocytes, we performed XOR gene knockdown experiments using 3T3-L1 mature adipocytes. After 48 hours of XOR-siRNA transfection, XOR mRNA levels were decreased by an average of 57% (data not shown), and intracellular XOR activities were significantly decreased compared with those of control siRNA (Figure 3E). From this point, transfected adipocytes were cultured for 12 h and 24 h, and accumulated uric acid in culture media was compared. The uric acid level in culture media of XOR knockdown adipocytes was significantly lower than in that of control-siRNA transfected adipocytes (Figure 3F). These results suggest that the uric acid production from 3T3-L1 mature adipocytes depend on XOR activity.
We also measured uric acid levels in culture media of primary stromal vascular cells (SVCs) (18) and primary hepatocytes (19) obtained from 8-weeks-old C57 male mice (after differentiation of SVCs into adipocytes). Adipocyte differentiation was confirmed by accumulation of lipid droplets. Uric acid levels in culture media of primary mature adipocytes (Day 8) were significantly higher than in that of primary pre-adipocytes (Day 0) (Figure 4A), although the addition of febuxostat abrogated the high level in
by guest on May 21, 2018
http://ww
w.jbc.org/
Dow
nloaded from
Uric acid secretion from mouse adipose tissue
8
mature adipocytes. In contrast, uric acid was not detected in media of primary hepatocytes, despite positive XOR activity. It is known that urate oxidase (EC 1.7.3.3) is abundantly expressed in the mouse liver to catalyze the oxidation of uric acid to allantoin (32). To prevent uric acid catabolism, we treated primary hepatocytes with oxonate, a urate oxidase inhibitor. Such treatment resulted in accumulation of uric acid in media, and such increase was not associated with any change in XOR activity (Figure 4B). Treatment with oxonate neither changed uric acid level in culture media of primary adipocytes nor XOR activity in these cells. In Epi WAT, Mes WAT and Sub WAT, Uox mRNA levels were extremely low and no urate oxidase activities were observed (Data not shown). Considered together, these results suggest that mature adipocytes produce and secrete uric acid via XOR, presumably as well as hepatocytes.
Adipose tissue produces and secretes uric
acid in vivo. Next, to test whether adipose tissue produces and secretes uric acid in vivo, we performed microdialysis experiments using mouse adipose tissue. Uric acid was detected in dialysate obtained from steady-state Epi WAT of C57 mice, and its level decreased significantly after treatment with febuxostat (Figure 5A and 5C).
Previous studies reported that ischemia-reperfusion injury accelerates purine nucleotide degradation and intracellular accumulation of oxypurines in various tissues (33-38). To identify whether the uric acid contained in dialysate was secreted from Epi WAT rather than from peripheral blood, we examined the effects of ischemia of Epi WAT. The experimental scheme is shown in Figure 5D. Intravenous injection of Evans Blue dye confirmed the induction of ischemia in Epi WAT on the right side in each mouse (Figure 5E). Ischemia resulted in a significant rise in uric acid level in dialysate of Epi WAT derived from the ischemic side (closed squares in Figure 5F), compared with the lack of change on the control side (no ischemia, open squares in Figure 5F). Furthermore, treatment of mice with febuxostat completely abrogated the rise in uric acid level during ischemia (open versus closed triangles in Figure 5F). These results indicate that ischemia increases regional production and secretion of uric acid in Epi WAT through XOR activity, and that
the source of the high uric acid levels is the adipose tissue rather than peripheral blood.
We next asked whether the ischemia-induced increase in uric acid secretion from Epi WAT results in increase of circulating uric acid level. For this purpose, intravenous microdialysis was performed as shown in Figure 5B and 5G, and the effect of ischemia-reperfusion of Epi WAT was investigated. Since the dialysate through the intravenous probe reflects the concentrations of circulating metabolites, this method can analyze serial changes in circulating uric acid without withdrawal of blood samples. In mice of the ischemia-reperfusion group, uric acid levels in the dialysate increased during ischemia, and increased significantly during reperfusion period, compared with those of mice of the control group (Figure 5H). These results suggested that the uric acid produced in Epi WAT had impact on the elevation of circulating uric acid.
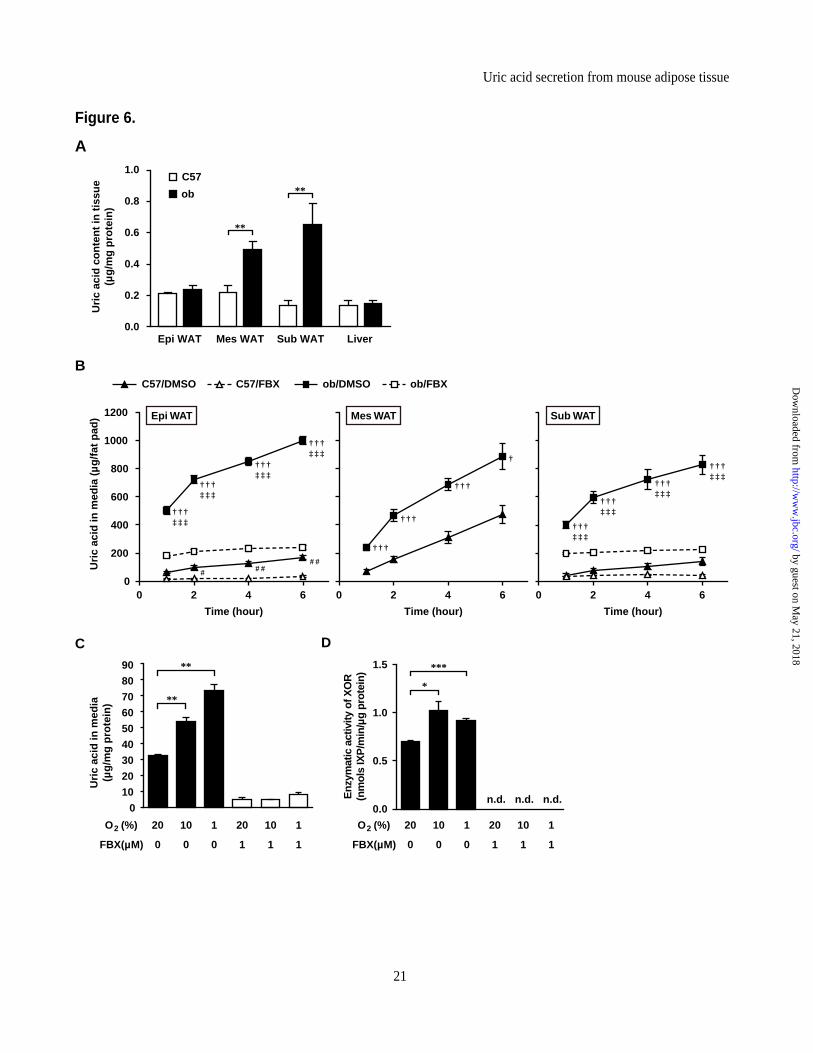
Production and secretion of uric acid is
augmented in obese adipose tissue. Since XOR activity is elevated in obese adipose tissues (Figure 1B, 1D and Figure 2D), we compared the uric acid tissue contents in ob/ob and C57 mice (Figure 6A). Uric acid contents in Mes WAT and Sub WAT were significantly higher in ob/ob mice than C57 mice. Next, to investigate the difference in amount of uric acid secreted by adipose tissues between obese and lean mice, we performed organ culture experiments using various adipose tissues obtained from ob/ob and C57 mice. Whole adipose tissues from C57 and ob/ob mice were minced and incubated from 1 to 6 hours, and uric acid accumulations in culture media were measured. As demonstrated in Figure 6B, uric acid secreted by each adipose tissue of C57 and ob/ob mice was accumulated in media during the experiments (closed triangles and closed squares respectively in Figure 6B). In each time point, the accumulation of uric acid derived from each minced adipose tissues of ob/ob mice were significantly more than those of C57 mice. The high uric acid levels in both C57 and ob/ob mice were reduced following the addition of febuxostat (open triangles and open squares, respectively in Figure 6B). Thus, these findings suggested that the secreted uric acid by whole adipose tissues were increased with obesity.
Recent studies have revealed that obese adipose tissues are locally hypoxic (39-41).
by guest on May 21, 2018
http://ww
w.jbc.org/
Dow
nloaded from
Uric acid secretion from mouse adipose tissue
9
Exposure of various cultured cells to hypoxia has been reported to increase endogenous XOR activity (42-44). Based on these studies, we examined the effects of hypoxia on the regulation of XOR enzymatic activity and uric acid production in adipocytes. In vitro experiments using 3T3-L1 mature adipocytes (Day 8) exposed to 1% O2 for 24 h showed that uric acid accumulation into culture media was significantly higher than those under normoxia (20% O2) (Figure 6C). Exposure to 10% O2, which is more moderate hypoxic condition, also increased uric acid accumulation significantly. Hypoxia also increased intracellular XOR activity (Figure 6D). Under these conditions, febuxostat (i.e., blockade of XOR activities) completely canceled uric acid accumulation in the media (Figure 6C and D).
DISCUSSION
A XOR inhibitor, febuxostat reduced plasma uric acid levels in ob/ob mice as well as XOR activities in Epi WAT (Figure 1). These results suggest that XOR in adipose tissue and liver is the possible target of XOR inhibitors. Based on this finding, we examined the role of adipose tissue per se in the production of uric acid, with a special focus on XOR. The results demonstrated for the first time that adipose tissue is a major organ which had abundant activity of XOR, similar to the small intestine, liver and other organs (Figure 2). Furthermore, mature adipocytes and adipose tissue produced and secreted uric acid (Figures 3, 4 and 5). Obesity was associated with further increase in XOR activity and uric acid secretion by adipose tissue (Figures 1, 2 and 6).
What is the mechanism of augmented uric acid production in obese adipose tissue? One explanation may be related to hypoxia of obese adipose tissue. We and others have reported that obese adipose tissue is hypoxic and that hypoxia induces dysfunction of adipose tissue, such as dysregulation of adipocytokines and chronic low-grade inflammation (39-41, 45). Hypoxic-induced increase in XOR activity has been reported in various cultured cells (42-44). Consistent with these reports, we found that local tissue hypoxia up-regulated intracellular XOR activity and increased uric acid production by 3T3-L1 mature adipocytes (Figure 6). Therefore, it is suggested that local hypoxia is a potential upstream factor responsible for increased uric acid
production in obese adipose tissue. Previous reports showed that hypoxia up-regulates XOR activity at pre- and post-translational levels (25, 43). In this study, the enzymatic activity of XOR was higher in Epi WAT and Sub WAT of ob/ob, even though their mRNA and protein levels were not changed (Figure 2A, 2C and 2D). Therefore, XOR activities in obese adipose tissues could possibly be increased, in part, by post-translational regulation.
Another mechanism may relate to lipogenesis and/or lipolysis. Obese adipose tissue is characterized by active fatty acid synthesis (46). It is presumed that fatty acid synthesis is closely associated with de novo purine synthesis through the activation of pentose phosphate pathway (PPP) (47). Furthermore, XOR-null mice have low serum level of fatty acid and lipid accumulation in mammary epithelium and renal tubules (13, 48, 49), suggesting possible involvement of XOR in lipid homeostasis. In adipocytes, PPP is reported to be activated during fatty acids synthesis (50, 51). Our experiments using 3T3-L1 adipocytes showed up-regulated secretion of uric acid during adipocyte differentiation, which was accompanied by intracellular accumulation of triglyceride (Figure 3B, and data not shown). Therefore, it is possible that activation of the PPP related to active synthesis of fatty acids may be associated with abundant activity of XOR, resulting in the production and secretion of uric acid. On the other hand, obesity is also associated with up-regulated lipolysis in adipose tissue (52). Evidence suggests that activation of lipolysis in adipocytes by beta-adrenergic stimulation may be associated with turnover of cAMP, which is an intracellular messenger of catecholamines (53). Hydrolysis of cAMP yields AMP, which is the first substrate of the catabolic reaction of purine production. Therefore, lipolysis could also relate to uric acid production in obese adipose tissues. Thus, the high XOR activity and uric acid production by adipose tissue may relate to active lipid metabolism. Further research is required to elucidate these hypotheses.
The microdialysis experiments in mice provided new findings that surgical ischemia of adipose tissue increased local uric acid production and increased plasma uric acid levels. These data suggest that production of uric acid by adipose tissue can potentially increase circulating uric acid
by guest on May 21, 2018
http://ww
w.jbc.org/
Dow
nloaded from
Uric acid secretion from mouse adipose tissue
10
levels in mice. Furthermore, experiments involving organ culture indicated significantly higher production of uric acid from whole adipose tissue of ob/ob than C57 mice. These results suggest that in mice, increased uric acid production in obese adipose tissue could contribute to the observed hyperuricemia. On the other hand, treatment of febuxostat in C57 control mice had no effect on the plasma levels of uric acid (Figure 1A). The plasma levels of xanthine, which is precursor of uric acid, increased in those mice (data not shown). The decrease of uric acid production in C57 mice could be possibly compensated by uric acid extraction through urinary tract or other metabolic pathways.
In conclusion, this study provides the first evidence using mouse models that adipose tissue can secrete uric acid, and that the production of uric acid is augmented in obesity. Recent studies have demonstrated that monosodium urate crystals act as alermin, which can initiate immune response in noninfectious inflammatory response (32, 54, 55). Further studies are needed to explore the relation between accelerated purine catabolism and dysfunction of adipose tissue in obesity such as dysregulation of adipocytokines and chronic inflammation.
REFERENCES
1. Wu XW, Lee CC, Muzny DM, Caskey CT. (1989) Urate oxidase: primary structure and evolutionary implications. Proc Natl Acad Sci U S A. 86, 9412-9416
2. Hikita M, Ohno I, Mori Y, Ichida K, Yokose T, Hosoya T. (2007) Relationship between hyperuricemia and body fat distribution. Intern Med. 46, 1353-1358
3. Tamba S, Nishizawa H, Funahashi T, Okauchi Y, Ogawa T, Noguchi M, Fujita K, Ryo M, Kihara S, Iwahashi H, Yamagata K, Nakamura T, Shimomura I, Matsuzawa Y. (2008) Relationship between the serum uric acid level, visceral fat accumulation and serum adiponectin concentration in Japanese men. Intern Med. 47, 1175-1180
4. Kim TH, Lee SS, Yoo JH, Kim SR, Yoo SJ, Song HC, Kim YS, Choi EJ, Kim YK. (2012) The relationship between the regional abdominal adipose tissue distribution and the serum uric acid levels in people with type 2 diabetes mellitus. Diabetol Metab Syndr. 4: 3
5. Rathmann W, Haastert B, Icks A, Giani G, Roseman JM. (2007) Ten-year change in serum uric acid and its relation to changes in other metabolic risk factors in young black and white adults: the CARDIA study. Eur J Epidemiol. 22, 439-445
6. Coutinho Tde A, Turner ST, Peyser PA, Bielak LF, Sheedy PF 2nd, Kullo IJ. (2007) Associations of serum uric acid with markers of inflammation, metabolic syndrome, and subclinical coronary atherosclerosis. Am J Hypertens. 20, 83-89
7. Lin SD, Tsai DH, Hsu SR. (2006) Association between serum uric acid level and components of the metabolic syndrome. J Chin Med Assoc. 69, 512-516
8. Teramoto T, Sasaki J, Ueshima H, Egusa G, Kinoshita M, Shimamoto K, Daida H, Biro S, Hirobe K, Funahashi T, Yokote K, Yokode M. (2008) Metabolic syndrome. J Atheroscler Thromb. 15, 1-5
9. Alberti KG, Eckel RH, Grundy SM, Zimmet PZ, Cleeman JI, Donato KA, Fruchart JC, James WP, Loria CM, Smith SC Jr. (2009) Harmonizing the metabolic syndrome: a joint interim statement of the International Diabetes Federation Task Force on Epidemiology and Prevention; National Heart, Lung, and Blood Institute; American Heart Association; World Heart Federation; International Atherosclerosis Society; and International Association for the Study of Obesity. Circulation. 120, 1640-1645
10. Matsuzawa Y, Funahashi T, Nakamura T. (2011) The concept of metabolic syndrome: contribution of visceral fat accumulation and its molecular mechanism. J Atheroscler Thromb. 18, 629-639
11. Yamashita S, Matsuzawa Y, Tokunaga K, Fujioka S, Tarui S. (1986) Studies on the impaired metabolism of uric acid in obese subjects: marked reduction of renal urate excretion and its improvement by a low-calorie diet. Int J Obes. 10, 255-264
12. Matsuura F, Yamashita S, Nakamura T, Nishida M, Nozaki S, Funahashi T, Matsuzawa Y. (1998) Effect of visceral fat accumulation on uric acid metabolism in male obese subjects: visceral fat
by guest on May 21, 2018
http://ww
w.jbc.org/
Dow
nloaded from
Uric acid secretion from mouse adipose tissue
11
obesity is linked more closely to overproduction of uric acid than subcutaneous fat obesity. Metabolism. 47, 929-933
13. Cheung KJ, Tzameli I, Pissios P, Rovira I, Gavrilova O, Ohtsubo T, Chen Z, Finkel T, Flier JS, Friedman JM. (2007) Xanthine oxidoreductase is a regulator of adipogenesis and PPARgamma activity. Cell Metab. 5, 115-128
14. Takano Y, Hase-Aoki K, Horiuchi H, Zhao L, Kasahara Y, Kondo S, Becker MA. (2005) Selectivity of febuxostat, a novel non-purine inhibitor of xanthine oxidase/xanthine dehydrogenase. Life Sci. 76, 1835-1847
15. Sanchez-Lozada LG, Tapia E, Bautista-Garcia P, Soto V, Avila-Casado C, Vega-Campos IP, Nakagawa T, Zhao L, Franco M, Johnson RJ. (2008) Effects of febuxostat on metabolic and renal alterations in rats with fructose-induced metabolic syndrome. Am J Physiol Renal Physiol. 294, F710-718
16. Maeda N, Shimomura I, Kishida K, Nishizawa H, Matsuda M, Nagaretani H, Furuyama N, Kondo H, Takahashi M, Arita Y, Komuro R, Ouchi N, Kihara S, Tochino Y, Okutomi K, Horie M, Takeda S, Aoyama T, Funahashi T, Matsuzawa Y. (2002) Diet-induced insulin resistance in mice lacking adiponectin/ACRP30. Nat Med. 8, 731-737
17. Maeda N, Takahashi M, Funahashi T, Kihara S, Nishizawa H, Kishida K, Nagaretani H, Matsuda M, Komuro R, Ouchi N, Kuriyama H, Hotta K, Nakamura T, Shimomura I, Matsuzawa Y. (2001) PPARgamma ligands increase expression and plasma concentrations of adiponectin, an adipose-derived protein. Diabetes. 50, 2094-2099
18. Kurata A, Nishizawa H, Kihara S, Maeda N, Sonoda M, Okada T, Ohashi K, Hibuse T, Fujita K, Yasui A, Hiuge A, Kumada M, Kuriyama H, Shimomura I, Funahashi T. (2006) Blockade of Angiotensin II type-1 receptor reduces oxidative stress in adipose tissue and ameliorates adipocytokine dysregulation. Kidney Int. 70, 1717-1724
19. Nakatani T, Tsuboyama-Kasaoka N, Takahashi M, Miura S, Ezaki O. (2002) Mechanism for peroxisome proliferator-activated receptor-alpha activator-induced up-regulation of UCP2 mRNA in rodent hepatocytes. J Biol Chem. 277, 9562-9569
20. Frederich RC Jr, Kahn BB, Peach MJ, Flier JS. (1992) Tissue-specific nutritional regulation of angiotensinogen in adipose tissue. Hypertension. 19, 339-344
21. Nakagawa Y, Kishida K, Kihara S, Yoshida R, Funahashi T, Shimomura I. (2011) Nocturnal falls of adiponectin levels in sleep apnea with abdominal obesity and impact of hypoxia-induced dysregulated adiponectin production in obese murine mesenteric adipose tissue. J Atheroscler Thromb. 18, 240-247
22. Aoki T, Yoshiura M, Iwamoto T, Iriyama K. (1984) Postmortem changes of uric acid in various rat tissues: determination of uric acid by reversed-phase high-performance liquid chromatography with electrochemical detection. Anal Biochem. 143, 113-118
23. Sekimoto R, Kishida K, Nakatsuji H, Nakagawa T, Funahashi T, Shimomura I. (2012) High circulating levels of S100A8/A9 complex (calprotectin) in male Japanese with abdominal adiposity and dysregulated expression of S100A8 and S100A9 in adipose tissues of obese mice. Biochem Biophys Res Commun. 419, 782-789
24. Beckman JS, Parks DA, Pearson JD, Marshall PA, Freeman BA. (1989) A sensitive fluorometric assay for measuring xanthine dehydrogenase and oxidase in tissues. Free Radic Biol Med. 6, 607-615
25. Kayyali US, Donaldson C, Huang H, Abdelnour R, Hassoun PM. (2001) Phosphorylation of xanthine dehydrogenase/oxidase in hypoxia. J Biol Chem. 276, 14359-14365
26. Tsuda H, Kawada N, Kaimori JY, Kitamura H, Moriyama T, Rakugi H, Takahara S, Isaka Y. (2012) Febuxostat suppressed renal ischemia-reperfusion injury via reduced oxidative stress. Biochem Biophys Res Commun. 427, 266-272
27. Kishida K, Kuriyama H, Funahashi T, Shimomura I, Kihara S, Ouchi N, Nishida M, Nishizawa H, Matsuda M, Takahashi M, Hotta K, Nakamura T, Yamashita S, Tochino Y, Matsuzawa Y. (2000) Aquaporin adipose, a putative glycerol channel in adipocytes. J Biol Chem. 275, 20896-20902
by guest on May 21, 2018
http://ww
w.jbc.org/
Dow
nloaded from
Uric acid secretion from mouse adipose tissue
12
28. Evrard PA, Deridder G, Verbeeck RK. (1996) Intravenous microdialysis in the mouse and the rat: development and pharmacokinetic application of a new probe. Pharm Res. 13, 12-17
29. García-Ruiz I, Rodríguez-Juan C, Díaz-Sanjuan T, del Hoyo P, Colina F, Muñoz-Yagüe T, Solís-Herruzo JA. (2006) Uric acid and anti-TNF antibody improve mitochondrial dysfunction in ob/ob mice. Hepatology. 44, 581-591
30. Nishino T, Okamoto K, Eger BT, Pai EF, Nishino T. (2008) Mammalian xanthine oxidoreductase - mechanism of transition from xanthine dehydrogenase to xanthine oxidase. FEBS J. 275, 3278-3289
31. Kurosaki M, Li Calzi M, Scanziani E, Garattini E, Terao M. (1995) Tissue- and cell-specific expression of mouse xanthine oxidoreductase gene in vivo: regulation by bacterial lipopolysaccharide. Biochem J. 306 , 225-234
32. Kono H, Chen CJ, Ontiveros F, Rock KL. (2010) Uric acid promotes an acute inflammatory response to sterile cell death in mice. J Clin Invest. 120, 1939-1949
33. Kamiike W, Watanabe F, Hashimoto T, Tagawa K, Ikeda Y, Nakao K, Kawashima Y. (1982) Changes in cellular levels of ATP and its catabolites in ischemic rat liver. J Biochem. 91, 1349-1356
34. Van Bilsen M, van der Vusse GJ, Coumans WA, de Groot MJ, Willemsen PH, Reneman RS. (1989) Degradation of adenine nucleotides in ischemic and reperfused rat heart. Am J Physiol. 257, H47-54
35. Idström JP, Soussi B, Elander A, Bylund-Fellenius AC. (1990) Purine metabolism after in vivo ischemia and reperfusion in rat skeletal muscle. Am J Physiol. 258, H1668-1673
36. Zager RA. (1991) Adenine nucleotide changes in kidney, liver, and small intestine during different forms of ischemic injury. Circ Res. 68, 185-196
37. Lazzarino G, Vagnozzi R, Tavazzi B, Pastore FS, Di Pierro D, Siragusa P, Belli A, Giuffré R, Giardina B. (1992) MDA, oxypurines, and nucleosides relate to reperfusion in short-term incomplete cerebral ischemia in the rat. Free Radic Biol Med. 13, 489-498
38. De Leyn P, Lerut T, Schreinemakers H, van Belle H, Lauwerijns J, van Lommel F, Verbeken E, Flameng W. (1993) Adenine nucleotide degradation in ischemic rabbit lung tissue. Am J Physiol. 264, L329-337
39. Hosogai N, Fukuhara A, Oshima K, Miyata Y, Tanaka S, Segawa K, Furukawa S, Tochino Y, Komuro R, Matsuda M, Shimomura I. (2007) Adipose tissue hypoxia in obesity and its impact on adipocytokine dysregulation. Diabetes. 56, 901-911
40. Ye J, Gao Z, Yin J, He Q. (2007) Hypoxia is a potential risk factor for chronic inflammation and adiponectin reduction in adipose tissue of ob/ob and dietary obese mice. Am J Physiol Endocrinol Metab. 293, E1118-1128
41. Goossens GH, Blaak EE. (2012) Adipose tissue oxygen tension: implications for chronic metabolic and inflammatory diseases. Curr Opin Clin Nutr Metab Care. 15, 539-546
42. Terada LS, Guidot DM, Leff JA, Willingham IR, Hanley ME, Piermattei D, Repine JE. (1992) Hypoxia injures endothelial cells by increasing endogenous xanthine oxidase activity. Proc Natl Acad Sci U S A. 89, 3362-3366
43. Kelley EE, Hock T, Khoo NK, Richardson GR, Johnson KK, Powell PC, Giles GI, Agarwal A, Lancaster JR Jr, Tarpey MM. (2006) Moderate hypoxia induces xanthine oxidoreductase activity in arterial endothelial cells. Free Radic Biol Med. 40, 952-959
44. Wang G, Qian P, Jackson FR, Qian G, Wu G. (2008) Sequential activation of JAKs, STATs and xanthine dehydrogenase/oxidase by hypoxia in lung microvascular endothelial cells. Int J Biochem Cell Biol. 40, 461-470
45. Sun K, Kusminski CM, Scherer PE. (2011) Adipose tissue remodeling and obesity. J Clin Invest. 121, 2094-2101
46. Spiegelman BM, Flier JS. (1996) Adipogenesis and obesity: rounding out the big picture. Cell. 87, 377-389
47. Leyva F, Wingrove CS, Godsland IF, Stevenson JC. (1998) The glycolytic pathway to coronary heart disease: a hypothesis. Metabolism. 47, 657-662
48. Vorbach C, Scriven A, Capecchi MR. (2002) The housekeeping gene xanthine oxidoreductase is necessary for milk fat droplet enveloping and secretion: gene sharing in the lactating mammary
by guest on May 21, 2018
http://ww
w.jbc.org/
Dow
nloaded from
Uric acid secretion from mouse adipose tissue
13
gland. Genes Dev. 16, 3223-3235 49. Ohtsubo T, Matsumura K, Sakagami K, Fujii K, Tsuruya K, Noguchi H, Rovira II, Finkel T, Iida M.
(2009) Xanthine oxidoreductase depletion induces renal interstitial fibrosis through aberrant lipid and purine accumulation in renal tubules. Hypertension. 54, 868-876
50. Kather H, Rivera M, Brand K. (1972) Interrelationship and control of glucose metabolism and lipogenesis in isolated fat-cells. Effect of the amount of glucose uptake on the rates of the pentose phosphate cycle and of fatty acid synthesis. Biochem J. 128, 1089-1096
51. Park J, Rho HK, Kim KH, Choe SS, Lee YS, Kim JB. (2005) Overexpression of glucose-6-phosphate dehydrogenase is associated with lipid dysregulation and insulin resistance in obesity. Mol Cell Biol. 25, 5146-5157
52. Greenberg AS, Coleman RA, Kraemer FB, McManaman JL, Obin MS, Puri V, Yan QW, Miyoshi H, Mashek DG. (2011) The role of lipid droplets in metabolic disease in rodents and humans. J Clin Invest. 121, 2102-2110
53. Kather H. (1990) Beta-adrenergic stimulation of adenine nucleotide catabolism and purine release in human adipocytes. J Clin Invest. 85, 106-114
54. Martinon F, Pétrilli V, Mayor A, Tardivel A, Tschopp J. (2006) Gout-associated uric acid crystals activate the NALP3 inflammasome. Nature. 440, 237-241
55. Foell D, Wittkowski H, Roth J. (2007) Mechanisms of disease: a 'DAMP' view of inflammatory arthritis. Nat Clin Pract Rheumatol. 3, 382-390
Acknowledgments - We are grateful to Ikuo Mineo, Ken Kishida, Takuya Mori for the helpful discussion and technical advice. We also thank Miyuki Nakamura, Takami Hayashi and Chieko Matsui-Watanabe for technical assistance, and the Center of Medical Research and Education, Graduate School of Medicine, Osaka University for technical support. We thank all members of the Adiposcience Laboratory at the Department of Metabolic Medicine, Graduate School of Medicine, Osaka University, for the helpful discussion and suggestions. In this work, Osaka University’s academia-industry collaboration policy position the collaboration between Osaka University and Teijin Pharma Ltd..
FOOT NOTE
*This work was supported in part by Grants-in-Aid for Scientific Research (C) (#24591351, to HN, and #22590979 to NM), and Scientific Research on Innovative Areas (#22126008, to TF). 1 Conflict of interest: Yu Tsushima, Takashi Shirakura, Kenta Kato, Hiroyuki Takahashi and Mizuho Tamura are employees of Teijin Pharma Limited. Keiichiro Imaizumi is employee of Teijin Limited. Tohru Funahashi is a member of the “Department of Metabolism and Atherosclerosis”, a sponsored course endowed by Kowa Co. Ltd.. The company has a scientific officer who oversees the program. All other authors have declared that no conflict of interest exists. 2 The abbreviations used are: XOR, xanthine oxidoreductase; ob/ob, B6.V-Lepob/J; C57, C57BL/6J; DIO, diet induced obesity; SVCs, stromal vascular cells; Epi WAT, epididymal white adipose tissue; Mes WAT, mesenteric white adipose tissue; Sub WAT, subcutaneous white adipose tissue; MRM, multiple reaction monitoring; MAF, mature adipocyte fraction; SVF, stromal vascular fraction; IXP, isoxanthopterin; XO, xanthine oxidase; XDH, xanthine dehydrogenase; PPP, pentose phosphate pathway; FBX, febuxostat; Vehi, vehicle; OXO, oxonate.
FIGURE LEGEND
Figure 1. High plasma uric acid levels in obese mice, and their suppression by XOR inhibitor. (A) Plasma uric acid level and (B) XO and XOR (XO + XDH) activities in tissue homogenates of C57 and ob/ob (ob) mice, treated with febuxostat (FBX) or vehicle (Vehi) for 3 weeks (n=6, each). (C) Plasma uric acid level and (D) XO and XOR activities in tissue homogenates of control and DIO mice (control: n=8, DIO; n=7). Data are mean±SEM. *p<0.05, **p<0.01, ***p<0.001. Figure 2. Adipose tissue is one of the major organs which have abundant XOR expression level and
by guest on May 21, 2018
http://ww
w.jbc.org/
Dow
nloaded from
Uric acid secretion from mouse adipose tissue
14
enzymatic activity, and obesity is associated with high XOR enzymatic activity in adipose tissues. (A) Xor mRNA expression levels in various tissues of C57 and ob mice. The Xor mRNA level in the liver of C57 mice was set at 1 while those in other tissues were set relative to the Xor mRNA level in the liver of C57 mice. (B) Western blot analysis of XOR protein in tissue homogenates obtained from C57 and ob mice (n=3-4 pooled samples). (C) Quantitative analysis of relative XOR protein contents by western blotting (n=3-4, each). Data represent fold change relative to C57 mice. (D) Tissue distribution of XO and XOR activities in C57 and ob mice. Data are mean±SEM. *p<0.05, **p<0.01, ***p<0.001. n.d.: not detected. Figure 3. 3T3-L1 mature adipocytes produce and secrete uric acid via XOR. (A) Xor mRNA expression levels in MAF and SVF of Epi WAT, Mes WAT and Sub WAT of 8-week-old C57 male mice (MAF: n=8-9, SVF: n=6). (B) Time course of uric acid accumulation in culture media and intracellular XOR activities during differentiation of 3T3-L1 cells. The indicated values represent those of the day after the induction of differentiation. (C) Uric acid levels in culture media and (D) XOR activity in cell lysates of 3T3-L1 pre-adipocytes, mature adipocytes and AML12 hepatocytes, treated with or without febuxostat (FBX) (n=3, each). In both experiments, the medium was changed and compound was added for 24 h prior to harvest. (E) XOR activity in cell lysate and (F) uric acid levels in culture media of 3T3-L1 mature adipocytes transfected with siRNAs. 3T3-L1 mature adipocytes were transfected with XOR-siRNA or control (Ctrl)-siRNA on day 7, and XOR activity was measured on day9. The medium was changed on day9 and cultured for 12 h or 24 h to measure uric acid level. Data are mean±SEM. *p<0.05, **p<0.01, ***p<0.001. n.d.: not detected. Figure 4. Primary mature adipocytes from mouse produce and secrete uric acid via XOR. (A) Uric acid levels in culture media and (B) XOR activity in cell lysates of primary pre-adipocytes, mature adipocytes and hepatocytes isolated from 8-week-old C57 male mice, treated with or without FBX and/or oxonate (OXO) (n=3, each). SVCs at two days after confluence were pre-adipocytes, and differentiated adipocytes derived from SVCs (day8) were primary mature adipocytes. Photographs are representative images of primary mature adipocytes and hepatocytes. The medium was changed and compound was added for 24 h prior to harvest. Data are mean±SEM. n.d.: not detected. Figure 5. Adipose tissue produces and secretes uric acid via XOR in vivo. (A-B) Schematic illustration of the microdialysis probes. (A) A single-lumen probe was used in the Epi WAT study. This probe was implanted into Epi WAT using a syringe needle. (B) A double-lumen probe was used in the intravenous study. (C-F) Microdialysis analysis of Epi WAT. (C) Uric acid level in dialysate through the microdialysis probe planted in Epi WAT of FBX- and Vehi-treated C57 mice (n=8, each). (D) Schema of the experiment. C57 mice were treated with FBX or Vehi (n=4, each), and implanted with single-lumen probes in both Epi WAT. After the collection of steady-state dialysates (0 to 30 min), surgical ischemia of right Epi WAT was induced, and dialysates were collected during the ischemia period (30 to 60 min). (E) After the collection of all fractions, ischemia of the right Epi WAT was confirmed by intravascular injection of 100 μL of 0.5% Evans Blue. (F) Uric acid levels in each fractions of dialysate. (G-H) Microdialysis study using intravenous probe. (G) Schematic diagram of the experiment. C57 mice were implanted with double-lumen probes in a peripheral vein. After the collection of steady-state dialysates, surgical ischemia in both Epi WAT was induced, and dialysates were collected during ischemia. Subsequently, reperfusion was performed, and dialysates were collected during the reperfusion period (60 to 90 min). Control mice were sham-operated (n=9). (H) Changes in uric acid in dialysate. Each value of individual mouse was normalized to the value at 0 to 10 min, respectively. Values are expressed as mean±SEM. *p<0.05, **p<0.01, ***p<0.001. #p<0.05, ##p<0.01, ###p<0.001 vs. Vehi-control group. Figure 6. High production and secretion of uric acid in obese adipose tissues. (A) Uric acid content in tissues of C57 and ob mice (n=4, each). (B) Uric acid in culture media collected from ex vivo organ culture of whole adipose tissues. Epi WAT, Mes WAT and Sub WAT were obtained from 8-week-old C57
by guest on May 21, 2018
http://ww
w.jbc.org/
Dow
nloaded from
Uric acid secretion from mouse adipose tissue
15
and ob male mice, treated with or without febuxostat (FBX) (n=4, each). Aliquots of media were collected at the indicated times and analyzed for uric acid. (C) Changes in uric acid in culture media and (D) XOR activity in cell lysates of 3T3-L1 adipocytes following exposure to 20, 10 or 1% O2 for 24 hour, and treated with or without FBX (n=3, each). The condition under 20% O2 was normoxic and control condition. The culture medium was changed and compound was added for 24 hour prior to harvest. Data are mean±SEM. *p<0.05, **p<0.01, ***p<0.001. †p<0.05, †††p<0.001 vs. DMSO group of C57 mice. #p<0.05, ##p<0.01 vs. FBX group of C57 mice. ‡‡‡p<0.001 vs. FBX group of ob mice. n.d.: not detected.
by guest on May 21, 2018
http://ww
w.jbc.org/
Dow
nloaded from
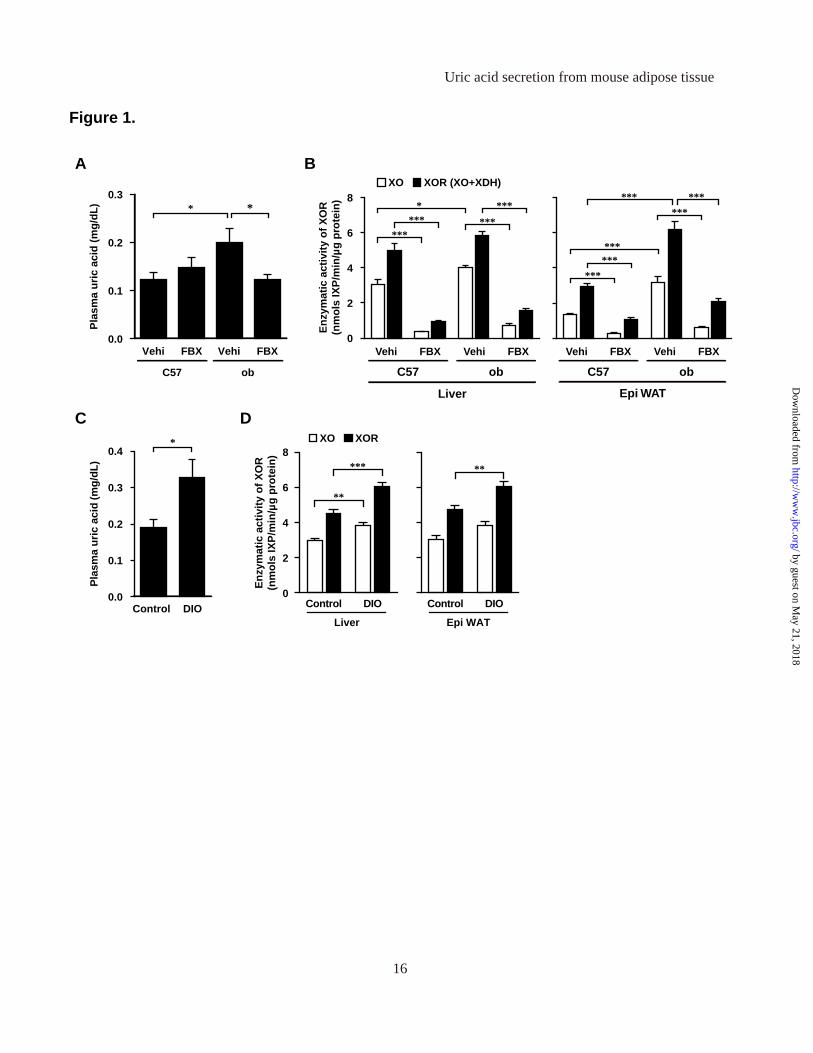
Figure 1.
Uric acid secretion from mouse adipose tissue
16
Control DIO
Epi WAT
**
0
2
4
6
8
Control DIO
Liver
**
***
En
zym
atic
act
ivit
y o
f X
OR
(nm
ols
IXP
/min
/µg
pro
tein
)
DXO XOR
C
Pla
sma
uri
c ac
id (m
g/d
L)
0.3
0.4
0.2
0.1
0.0Control DIO
*
Epi WAT
C57 ob
Vehi FBX Vehi FBX
******
******
***
***
Liver
XO XOR (XO+XDH)
C57 ob
Vehi FBX Vehi FBX
8
6
4
2
0E
nzy
mat
ic a
ctiv
ity
of
XO
R(n
mo
ls IX
P/m
in/µ
g p
rote
in)
****** ***
****
BA
Pla
sma
uri
c ac
id (
mg
/dL
)
0.3
0.2
0.1
0.0
C57
Vehi FBX
ob
Vehi FBX
* *
by guest on May 21, 2018
http://ww
w.jbc.org/
Dow
nloaded from
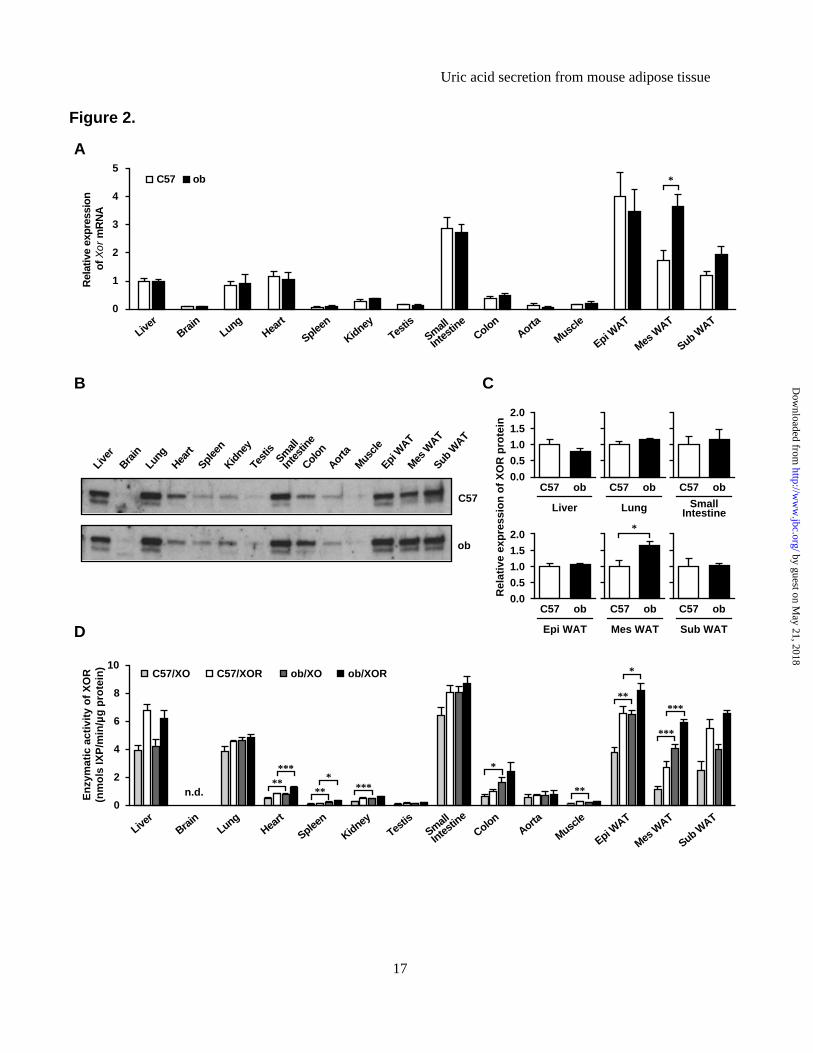
Figure 2.
Uric acid secretion from mouse adipose tissue
17
D
10
En
zym
atic
act
ivit
y o
f X
OR
(nm
ols
IXP
/min
/µg
pro
tein
)
0
2
4
6
8
C57/XO C57/XOR ob/XO ob/XOR
Liver
Brain
LungHea
rt
Spleen
KidneyTes
tisSmall
Intestin
e
ColonAorta
Muscle
Epi WAT
Mes W
AT
Sub WAT
n.d.**
***
***
***
*
**
**
*
***
***
C57 ob
Sub WAT
C57 ob
Mes WAT
C57 ob
Epi WAT
2.0
0.0
0.5
1.0
1.5
C57 ob
SmallIntestine
C57 ob
Lung
C57 ob
Liver
2.0
0.0
0.5
1.0
1.5
Rel
ativ
e ex
pre
ssio
n o
f X
OR
pro
tein
C
*
Live
rBra
inLu
ngHea
rtSpl
een
Kidne
yTe
stis
Small
Inte
stin
eCol
onAor
taMus
cleEpi
WAT
Mes W
ATSub
WAT
C57
ob
B
A
Rel
ativ
e ex
pres
sion
of
Xor
mR
NA
5
4
3
2
1
0
C57 ob
Liver
Brain
LungHea
rt
Spleen
KidneyTes
tisSmall
Intestin
eColon
Aorta
Muscle
Epi WAT
Mes W
AT
Sub WAT
*
by guest on May 21, 2018
http://ww
w.jbc.org/
Dow
nloaded from
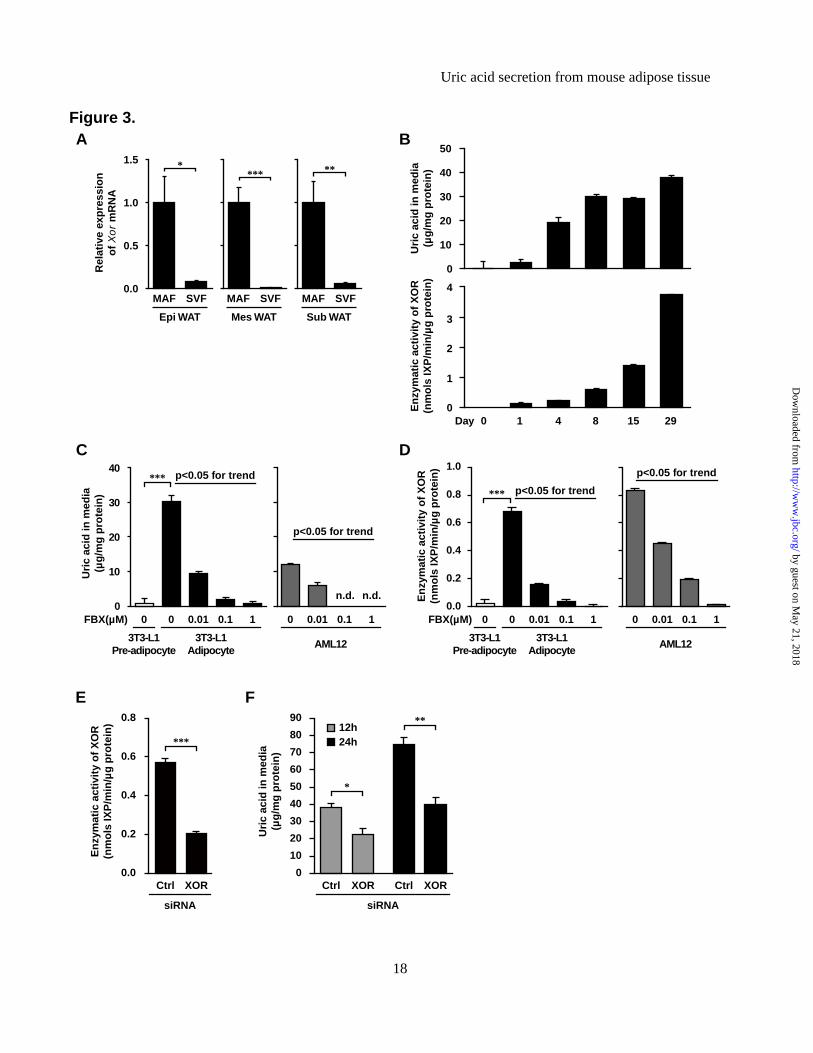
Figure 3.
Uric acid secretion from mouse adipose tissue
18
F
Uri
c ac
id in
med
ia(µ
g/m
g p
rote
in)
0
10
20
30
40
50
60
70
80
90 **
*
Ctrl XOR Ctrl XOR
siRNA
12h24h
E
En
zym
atic
act
ivit
y o
f X
OR
(nm
ols
IXP
/min
/µg
pro
tein
)
0.0
0.2
0.4
0.6
0.8
Ctrl XOR
siRNA
***
0.0
1.0
0.8
0.6
0.4
0.2
En
zym
atic
act
ivit
y o
f X
OR
(nm
ols
IXP
/min
/µg
pro
tein
)
FBX(µM) 0 0 0.01 0.1 1 0 0.01 0.1 1
3T3-L1Adipocyte
3T3-L1Pre-adipocyte
AML12
D
p<0.05 for trend
p<0.05 for trend
***
0 0.01 0.1 1
AML12
p<0.05 for trend
C
Uri
c ac
id in
med
ia(µ
g/m
g p
rote
in)
40
30
20
10
00 0 0.01 0.1 1
3T3-L1Adipocyte
3T3-L1Pre-adipocyte
p<0.05 for trend***
FBX(µM)
n.d. n.d.
4
0Day0
1
2
3
1 4 8 15 29E
nzy
mat
ic a
ctiv
ity
of
XO
R(n
mo
ls IX
P/m
in/µ
g p
rote
in)
0
10
20
30
50
40
Uri
c ac
id in
med
ia(µ
g/m
g p
rote
in)
B1.5
1.0
0.5
0.0
Epi WAT
MAF SVF
*
Mes WAT
MAF SVF
Rel
ativ
e ex
pre
ssio
no
f X
or
mR
NA
***
Sub WAT
MAF SVF
**
A
by guest on May 21, 2018
http://ww
w.jbc.org/
Dow
nloaded from
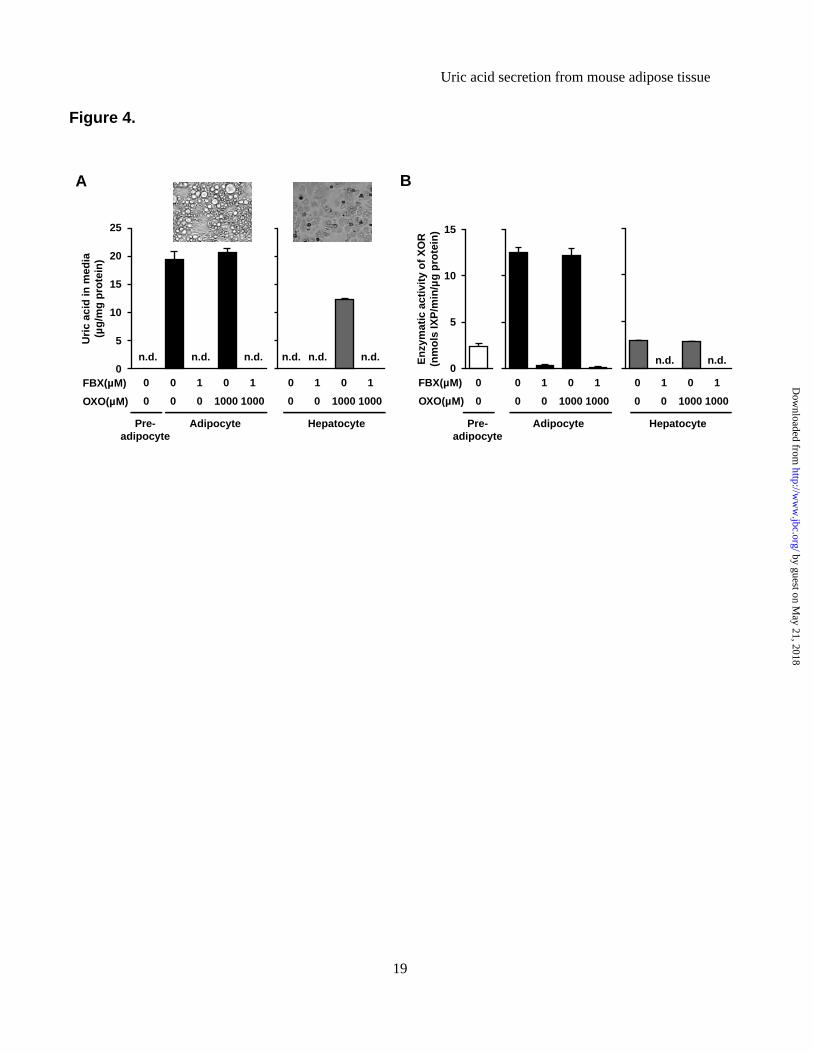
Figure 4.
Uric acid secretion from mouse adipose tissue
19
0
5
10
15
En
zym
atic
act
ivit
y o
f X
OR
(nm
ols
IXP
/min
/µg
pro
tein
)
FBX(µM)
OXO(µM)
B
0 1 0 1
Hepatocyte
0 0 1000 1000
n.d. n.d.
Pre-adipocyte
0 1 0 1
0
Adipocyte
0 1000 1000
0
0
A
0 1 0 1
Uri
c ac
id in
med
ia(µ
g/m
g p
rote
in)
FBX(µM)
OXO(µM)
Pre-adipocyte
25
15
20
10
5
0
Adipocyte
0 1 0 1
0
0
0 0 1000 1000
n.d.n.d. n.d. n.d. n.d. n.d.
Hepatocyte
0 0 1000 1000
by guest on May 21, 2018
http://ww
w.jbc.org/
Dow
nloaded from
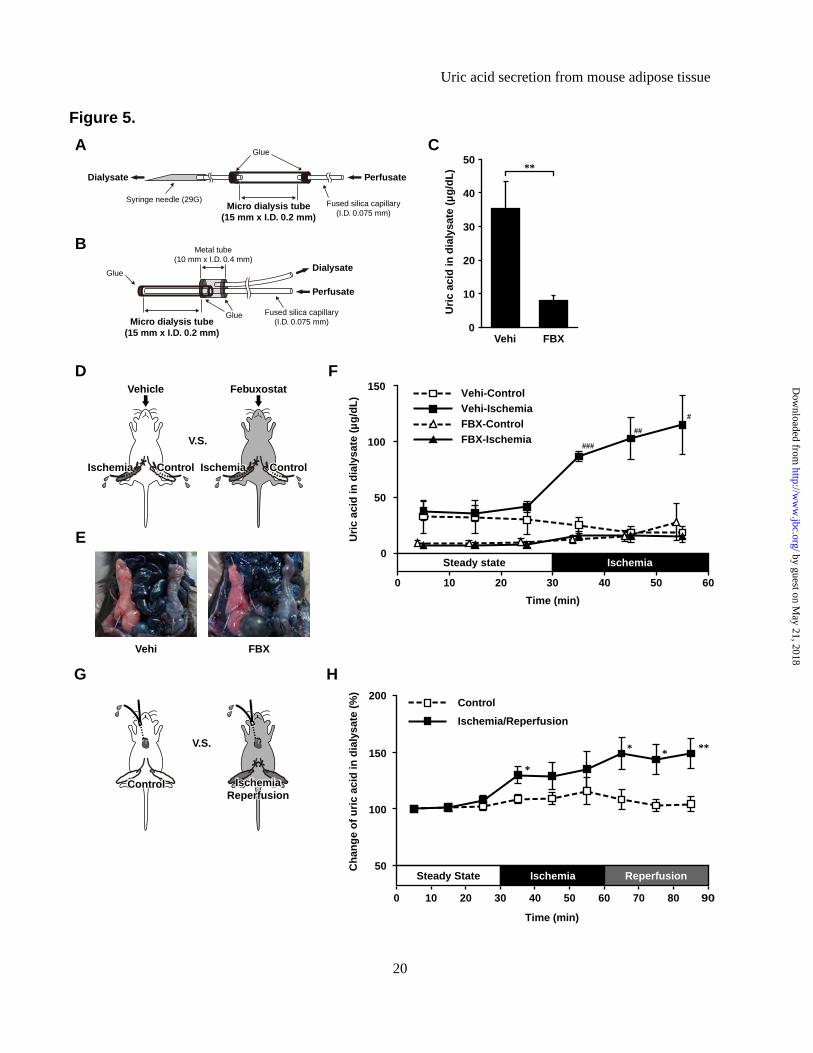
Figure 5.
Uric acid secretion from mouse adipose tissue
20
0
Time (min)
9080706050
50
100
150
Ch
ang
e o
f u
ric
acid
in d
ialy
sate
(%
) 200Control
Ischemia/Reperfusion
40302010
Steady State Ischemia Reperfusion
H
****
*
V.S.
G
ControlControl IschemiaReperfusion
IschemiaReperfusion
Uri
c ac
id in
dia
lysa
te (
µg
/dL
)
F
###
##
#
Vehi-ControlVehi-IschemiaFBX-ControlFBX-Ischemia
150
50
100
0
100 20 30 40 50 60
Time (min)
Steady state Ischemia
E
Vehi FBX
V.S.
Vehicle
IschemiaIschemia ControlControl
Febuxostat
IschemiaIschemia ControlControl
D
Uri
c ac
id in
dia
lysa
te (
µg
/dL
)
50
40
30
20
10
0Vehi FBX
**
C
B
AGlue
Micro dialysis tube(15 mm x I.D. 0.2 mm)
PerfusateDialysate
Fused silica capillary(I.D. 0.075 mm)
Syringe needle (29G)
Micro dialysis tube(15 mm x I.D. 0.2 mm)
Perfusate
DialysateGlue
Glue Fused silica capillary(I.D. 0.075 mm)
Metal tube(10 mm x I.D. 0.4 mm)
by guest on May 21, 2018
http://ww
w.jbc.org/
Dow
nloaded from
21
Uric acid secretion from mouse adipose tissue
Figure 6.
Enz
ymat
ic a
ctiv
ity o
f XO
R(n
mol
s IX
P/m
in/µ
g pr
otei
n)
20O2 (%) 10 1 20 10 1
0FBX(µM) 0 0 1 1 1
1.5
1.0
0.5
0.0n.d. n.d. n.d.
*
***
D
Uri
c ac
id in
med
ia(µ
g/m
g p
rote
in)
20O2 (%) 10 1 20 10 1
0FBX(µM) 0 0 1 1 1
0
90
80
70
60
50
40
30
20
10
**
**
C
C57/DMSO C57/FBX ob/DMSO ob/FBX
0 2 4
Time (hour)
6
† † †‡ ‡ ‡
† † †‡ ‡ ‡
† † †‡ ‡ ‡
† † †
† † †
† † †
† † †
†‡ ‡ ‡
† † †‡ ‡ ‡
† † †‡ ‡ ‡
† † †‡ ‡ ‡
† † †‡ ‡ ‡
# # ## #
Mes WAT
Uri
c ac
id in
med
ia (
µg
/fat
pad
) 1200
1000
800
600
400
200
00 2 4
Time (hour)
6
Epi WAT Sub WAT
Time (hour)
0 2 4 6
B
C57
Uri
c ac
id c
on
ten
t in
tis
sue
(µg
/mg
pro
tein
)
ob
0.0
0.2
0.4
0.6
0.8
1.0
Epi WAT Mes WAT Sub WAT Liver
**
**
A
by guest on May 21, 2018
http://ww
w.jbc.org/
Dow
nloaded from
Mizuho Tamura, Norikazu Maeda, Tohru Funahashi and Iichiro ShimomuraHirofumi Nagao, Takashi Shirakura, Kenta Kato, Keiichiro Imaizumi, Hiroyuki Takahashi, Yu Tsushima, Hitoshi Nishizawa, Yoshihiro Tochino, Hideaki Nakatsuji, Ryohei Sekimoto,
Uric acid secretion from adipose tissue and its increase in obesity
published online August 2, 2013J. Biol. Chem.
10.1074/jbc.M113.485094Access the most updated version of this article at doi:
Alerts:
When a correction for this article is posted•
When this article is cited•
to choose from all of JBC's e-mail alertsClick here
by guest on May 21, 2018
http://ww
w.jbc.org/
Dow
nloaded from


![Bakul GUS-K6.ppt [Read-Only] - ocw.usu.ac.idocw.usu.ac.id/course/download/1110000119-genitourinary-system/gus...Ekskresi/Pembentukan Urine ... urea, uric acid, creatinine Ions: sodium,](https://img.pdfslide.tips/doc/110x75/5ae518c67f8b9ae1578bdb53/bakul-gus-k6ppt-read-only-ocwusuacidocwusuacidcoursedownload1110000119-genitourinary-systemgusekskresipembentukan.jpg)