Embed Size (px)
Citation preview
U.S. EPA Local Climate & Energy Webcast Energy Efficiency in Water and Wastewater
Facilities
October 30, 2013
Michael DiBara Project Manager, MassDEP
www.mass.gov/dep
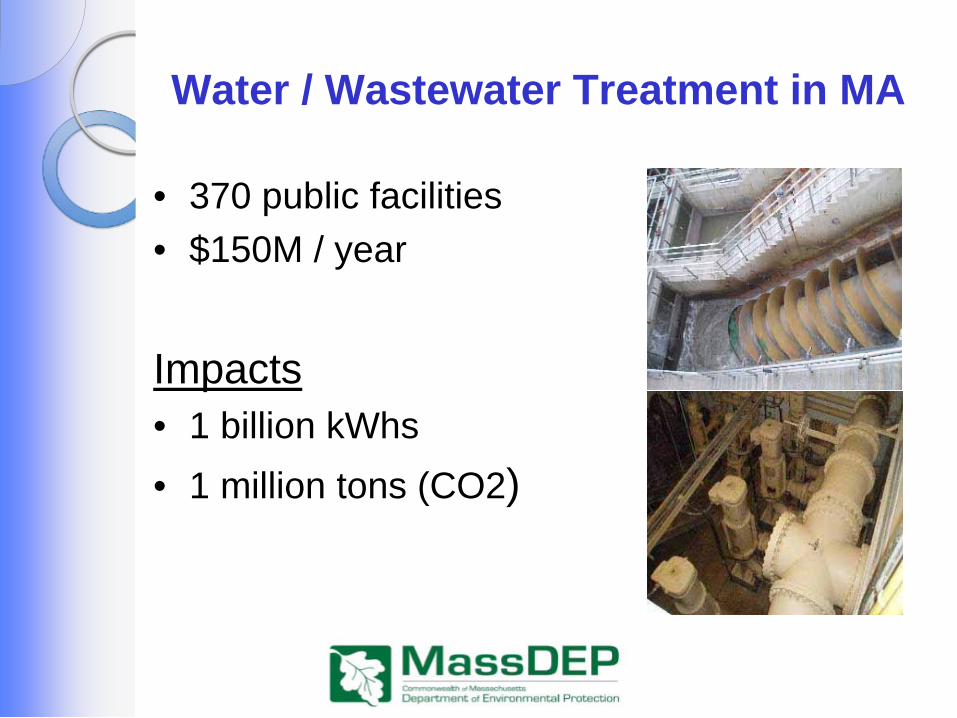
Water / Wastewater Treatment in MA
• 370 public facilities • $150M / year Impacts • 1 billion kWhs • 1 million tons (CO2)
A New Public / Private Partnership
Public • (7) Water & (7) Wastewater Facilities • MA Dept. of Environmental Protection • MA Executive Office of Energy / Environmental Affairs • MA Dept of Energy Resources • EPA New England • MA Renewable Energy Trust • University of MA – Northeast CHP Center Private • Every Major Investor-Owned Electric & Gas Utility Non Profit • Consortium for Energy Efficiency
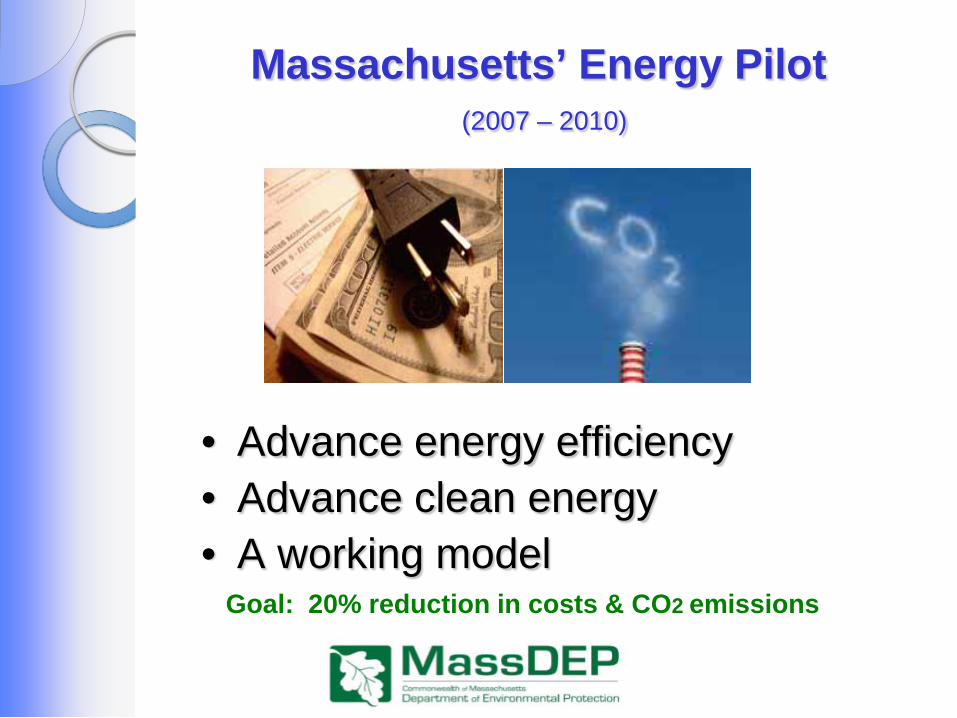
Massachusetts’ Energy Pilot
(2007 – 2010)
• Advance energy efficiency • Advance clean energy • A working model
Goal: 20% reduction in costs & CO2 emissions
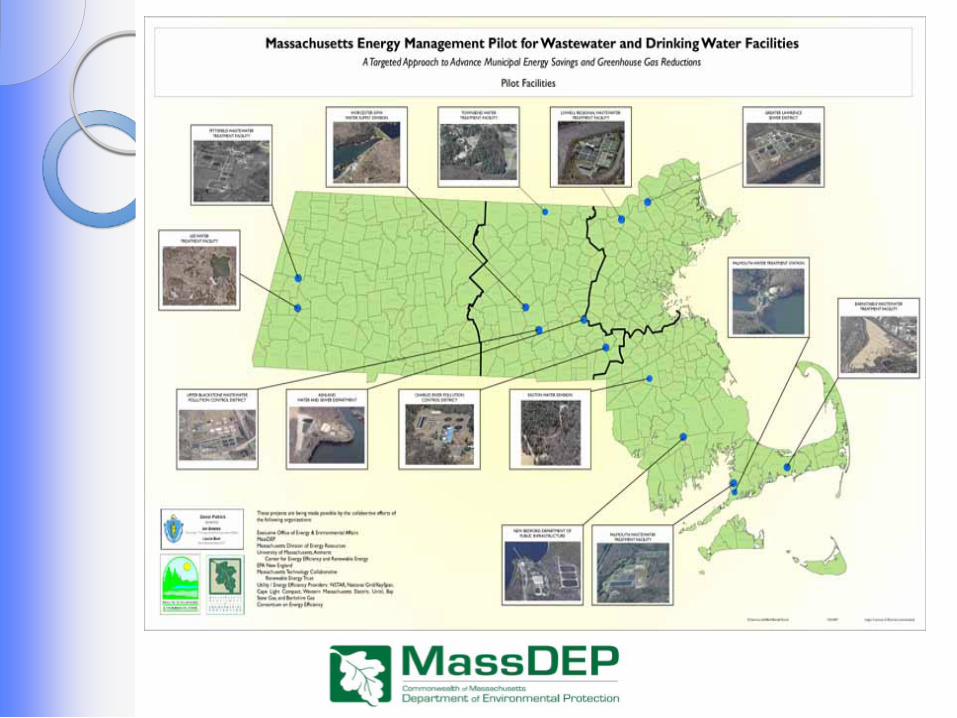
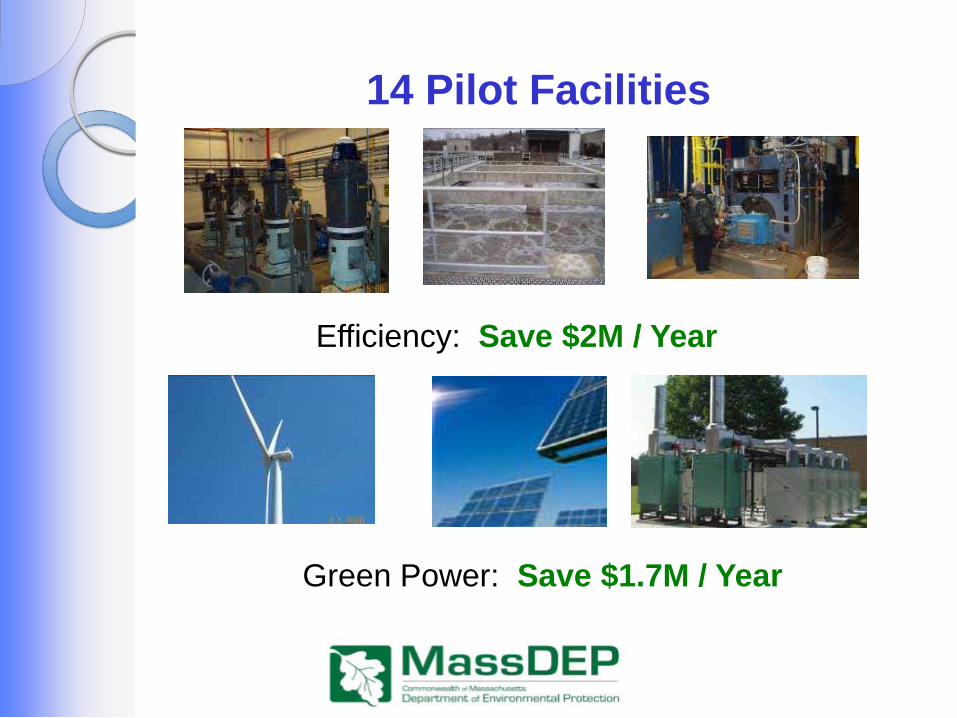
14 Pilot Facilities
Efficiency: Save $2M / Year
Green Power: Save $1.7M / Year
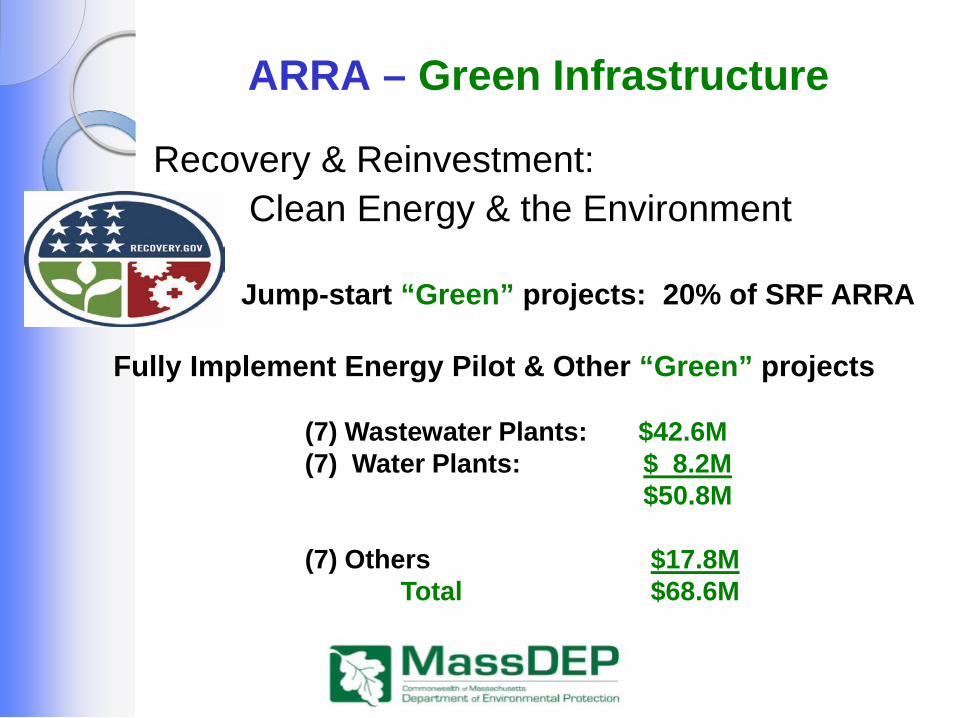
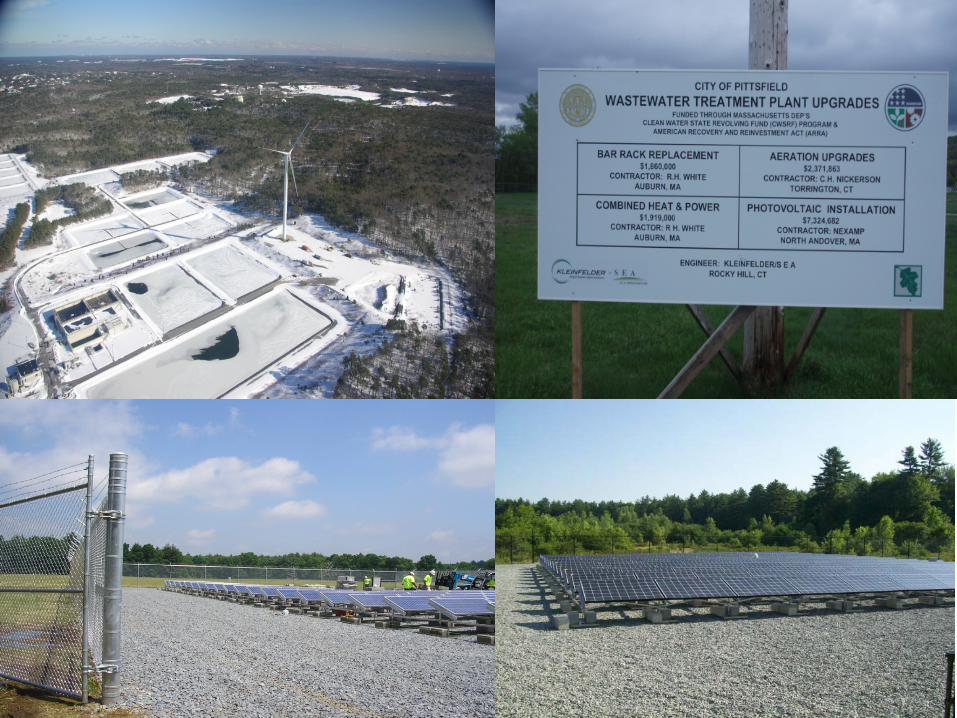
ARRA – Green Infrastructure
Recovery & Reinvestment: Clean Energy & the Environment
Jump-start “Green” projects: 20% of SRF ARRA
Fully Implement Energy Pilot & Other “Green” projects
(7) Wastewater Plants: $42.6M (7) Water Plants: $ 8.2M $50.8M (7) Others $17.8M Total $68.6M
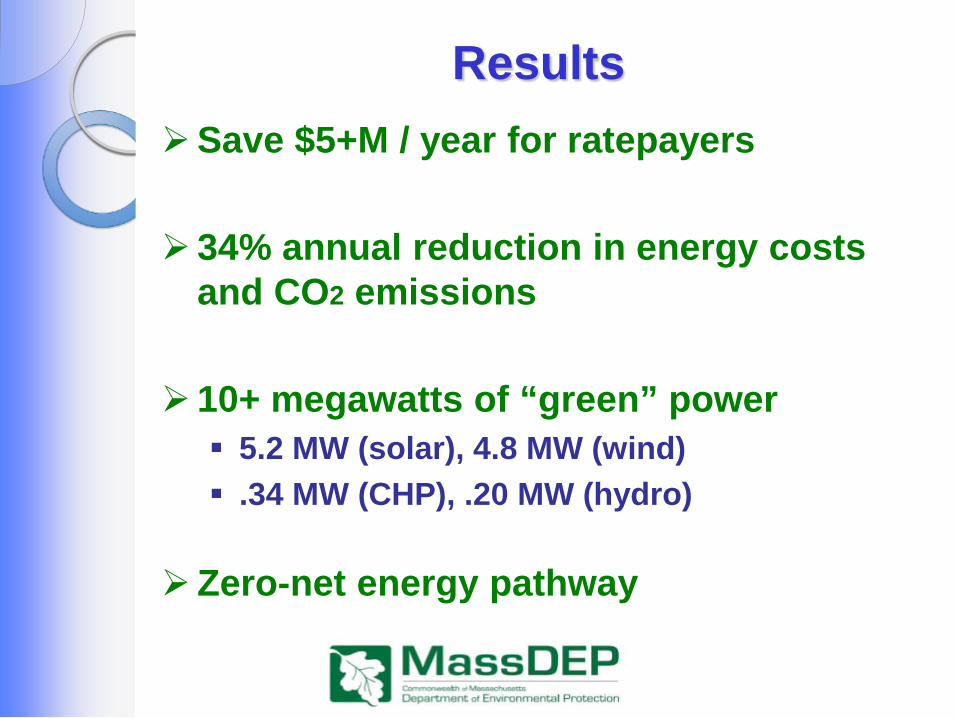
Results Save $5+M / year for ratepayers 34% annual reduction in energy costs
and CO2 emissions
10+ megawatts of “green” power 5.2 MW (solar), 4.8 MW (wind) .34 MW (CHP), .20 MW (hydro)
Zero-net energy pathway

MA Energy Leaders
Coalition of state, federal, community & energy efficiency providers (Mass Save®)
Each meeting has a technical presentation, a presentation from a utility, a discussion on energy management planning, and a site visit.
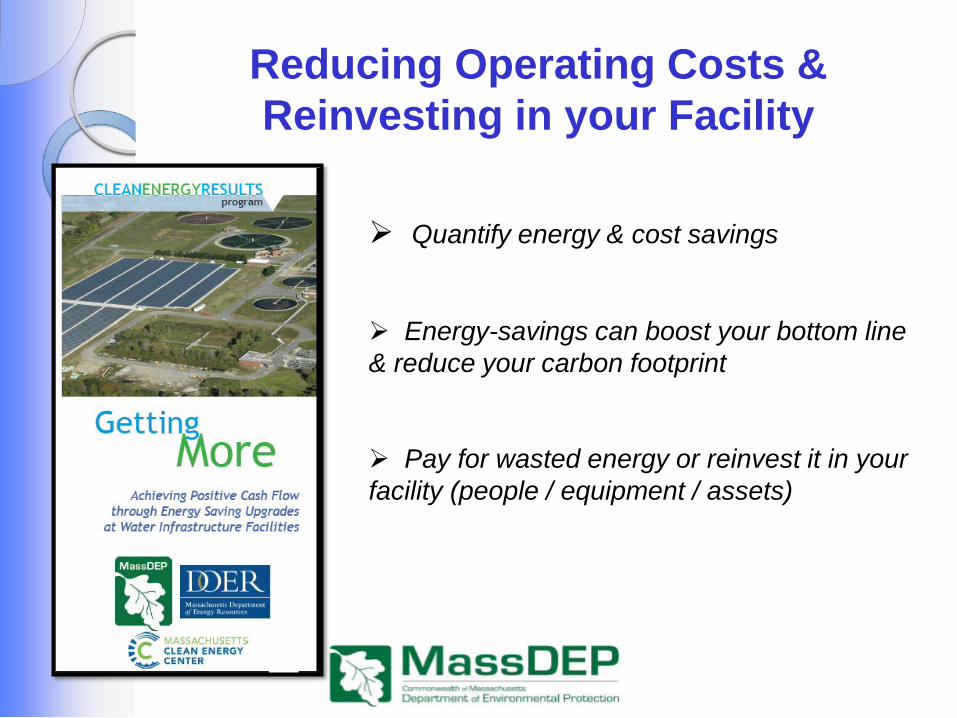
Reducing Operating Costs & Reinvesting in your Facility
Quantify energy & cost savings
Energy-savings can boost your bottom line & reduce your carbon footprint
Pay for wasted energy or reinvest it in your facility (people / equipment / assets)
GREATER LAWRENCE SANITARY DISTRICT
ENERGY EFFICIENCY PROGRAM 2000-2013
U.S. EPA Local Climate & Energy Webcast Energy Efficiency in Water and Wastewater
Facilities October 30, 2013
Presented by:
Richard E. Weare, GLSD Capital Projects Manager
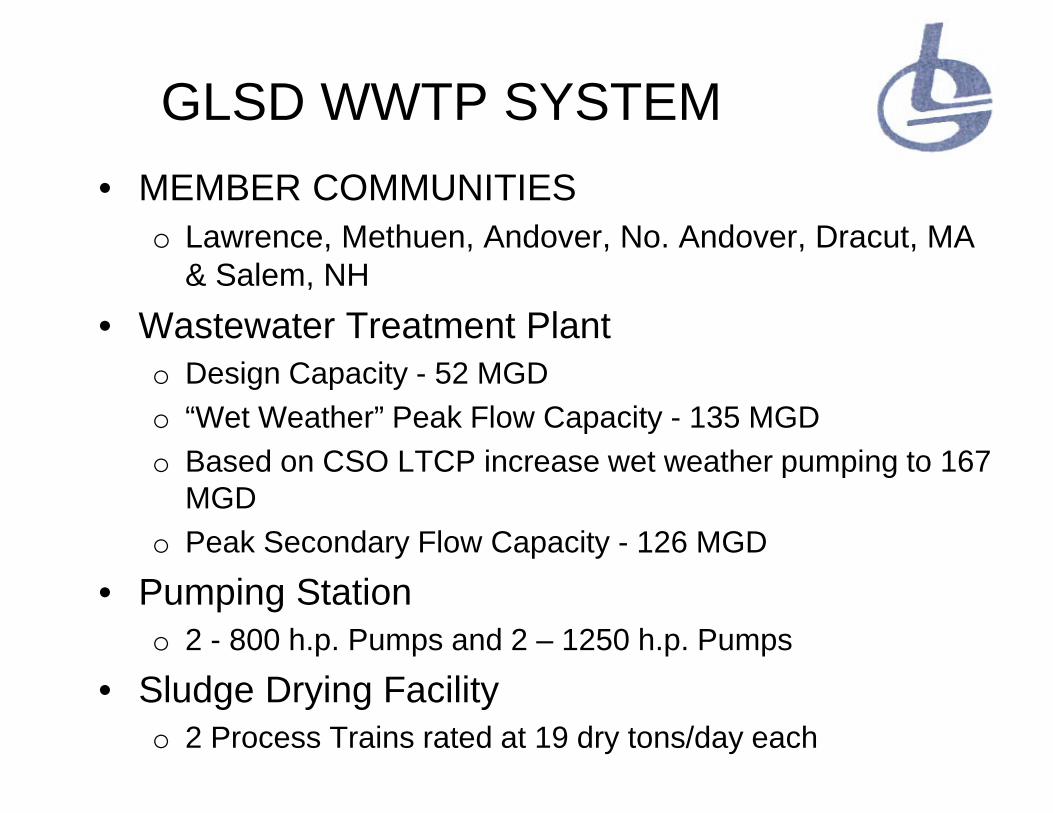
GLSD WWTP SYSTEM • MEMBER COMMUNITIES
o Lawrence, Methuen, Andover, No. Andover, Dracut, MA & Salem, NH
• Wastewater Treatment Plant o Design Capacity - 52 MGD o “Wet Weather” Peak Flow Capacity - 135 MGD o Based on CSO LTCP increase wet weather pumping to 167
MGD o Peak Secondary Flow Capacity - 126 MGD
• Pumping Station o 2 - 800 h.p. Pumps and 2 – 1250 h.p. Pumps
• Sludge Drying Facility o 2 Process Trains rated at 19 dry tons/day each
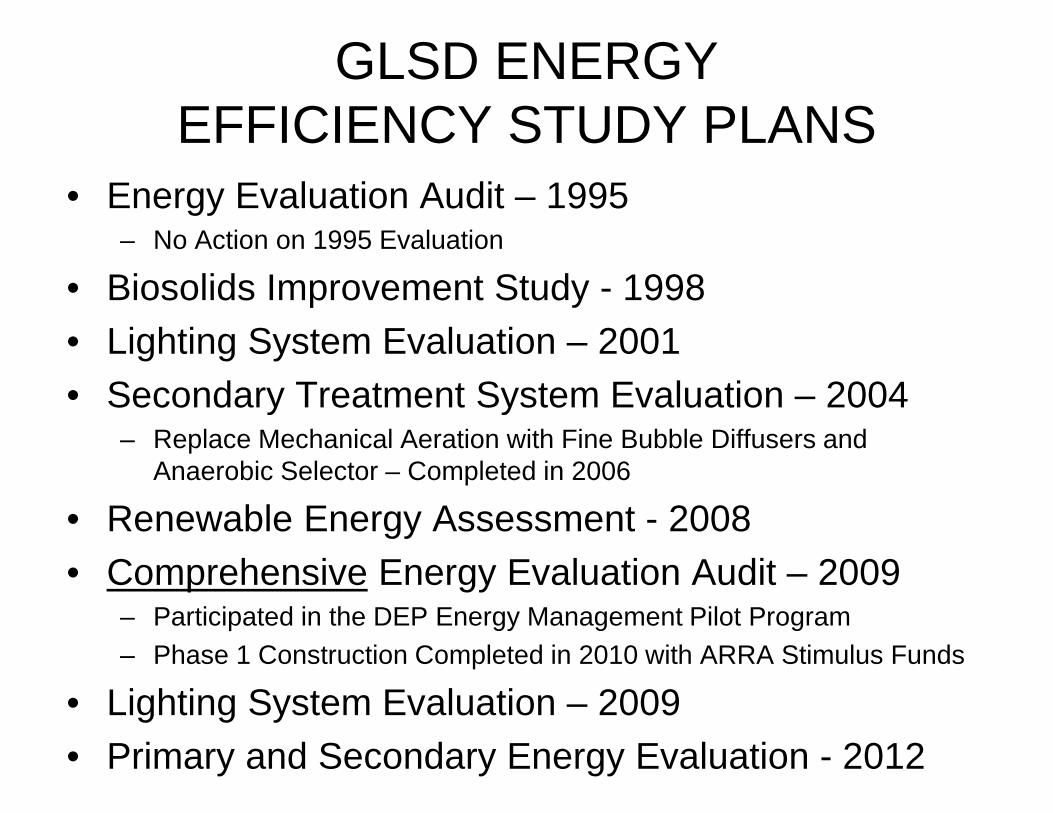
GLSD ENERGY EFFICIENCY STUDY PLANS
• Energy Evaluation Audit – 1995 – No Action on 1995 Evaluation
• Biosolids Improvement Study - 1998 • Lighting System Evaluation – 2001 • Secondary Treatment System Evaluation – 2004
– Replace Mechanical Aeration with Fine Bubble Diffusers and Anaerobic Selector – Completed in 2006
• Renewable Energy Assessment - 2008 • Comprehensive Energy Evaluation Audit – 2009
– Participated in the DEP Energy Management Pilot Program – Phase 1 Construction Completed in 2010 with ARRA Stimulus Funds
• Lighting System Evaluation – 2009 • Primary and Secondary Energy Evaluation - 2012
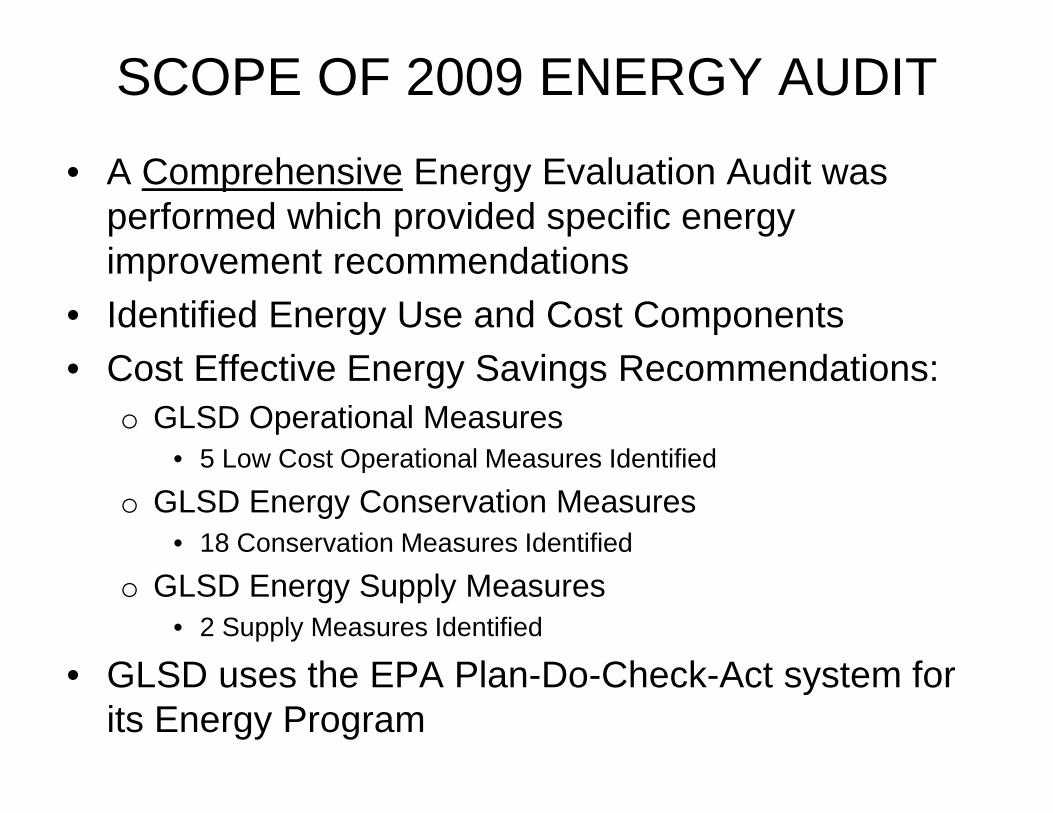
SCOPE OF 2009 ENERGY AUDIT
• A Comprehensive Energy Evaluation Audit was performed which provided specific energy improvement recommendations
• Identified Energy Use and Cost Components • Cost Effective Energy Savings Recommendations:
o GLSD Operational Measures • 5 Low Cost Operational Measures Identified
o GLSD Energy Conservation Measures • 18 Conservation Measures Identified
o GLSD Energy Supply Measures • 2 Supply Measures Identified
• GLSD uses the EPA Plan-Do-Check-Act system for its Energy Program
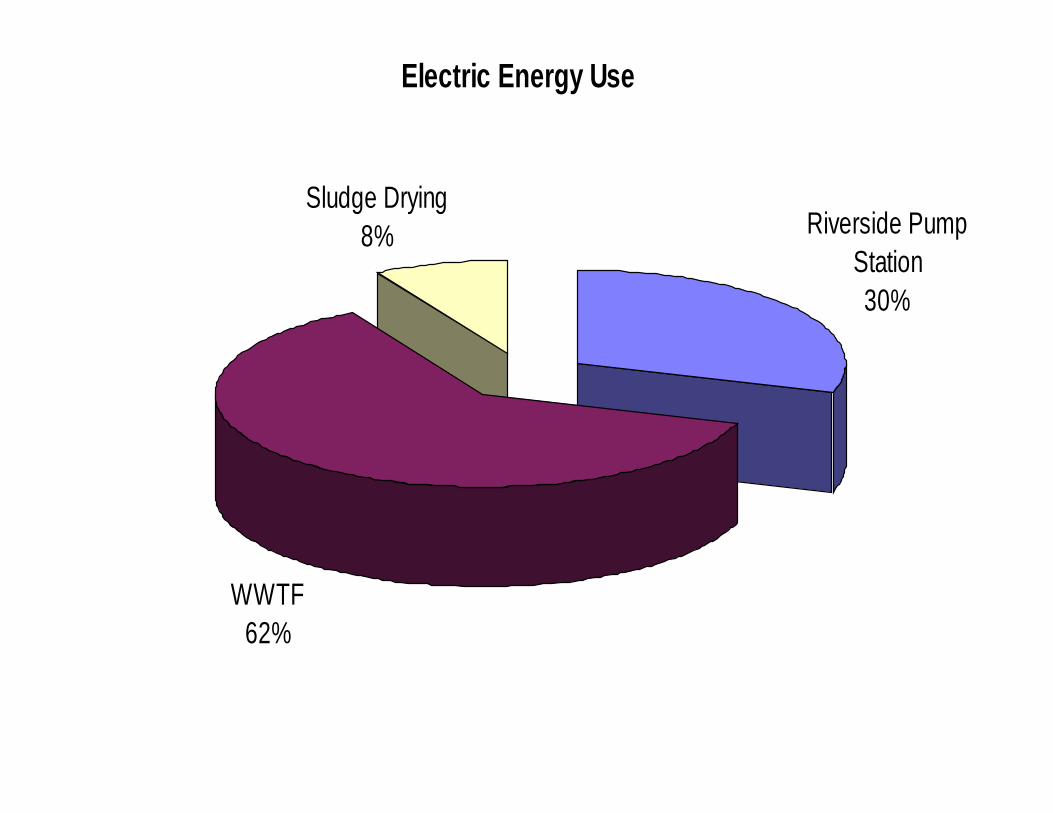
Electric Energy Use
Riverside Pump Station30%
WWTF62%
Sludge Drying8%
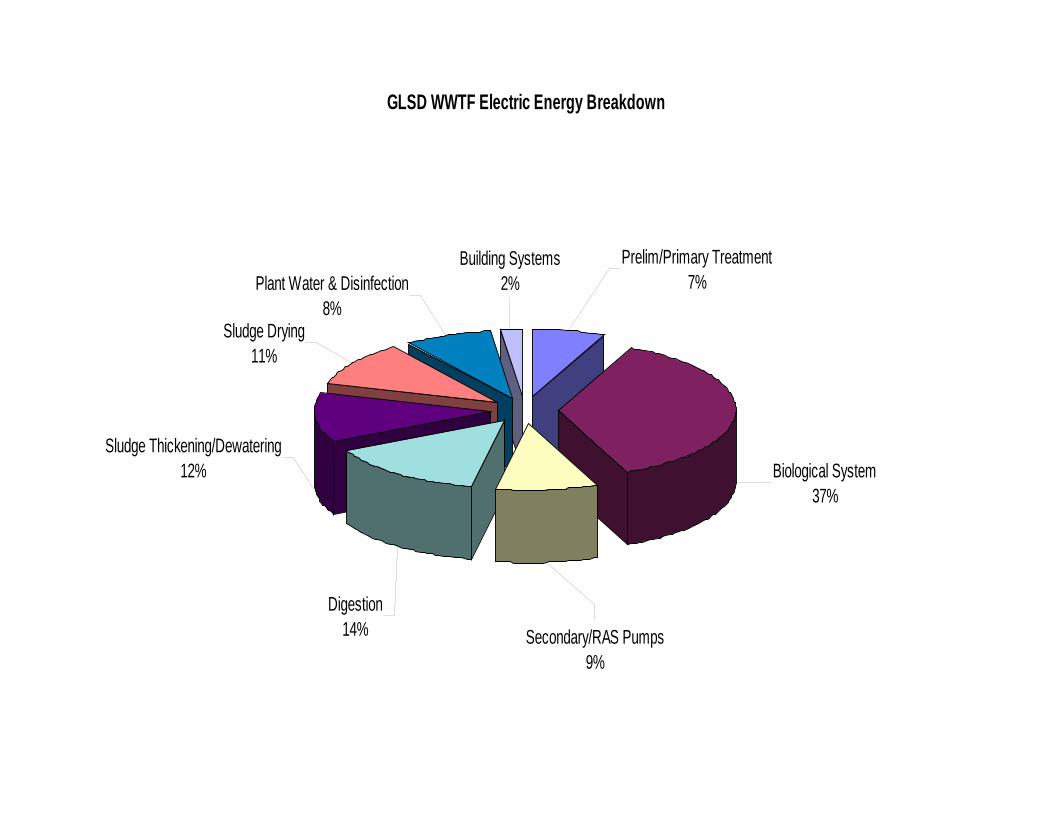
GLSD WWTF Electric Energy Breakdown
Building Systems2%
Prelim/Primary Treatment7%
Biological System37%
Secondary/RAS Pumps9%
Sludge Thickening/Dewatering12%
Digestion14%
Sludge Drying11%
Plant Water & Disinfection8%
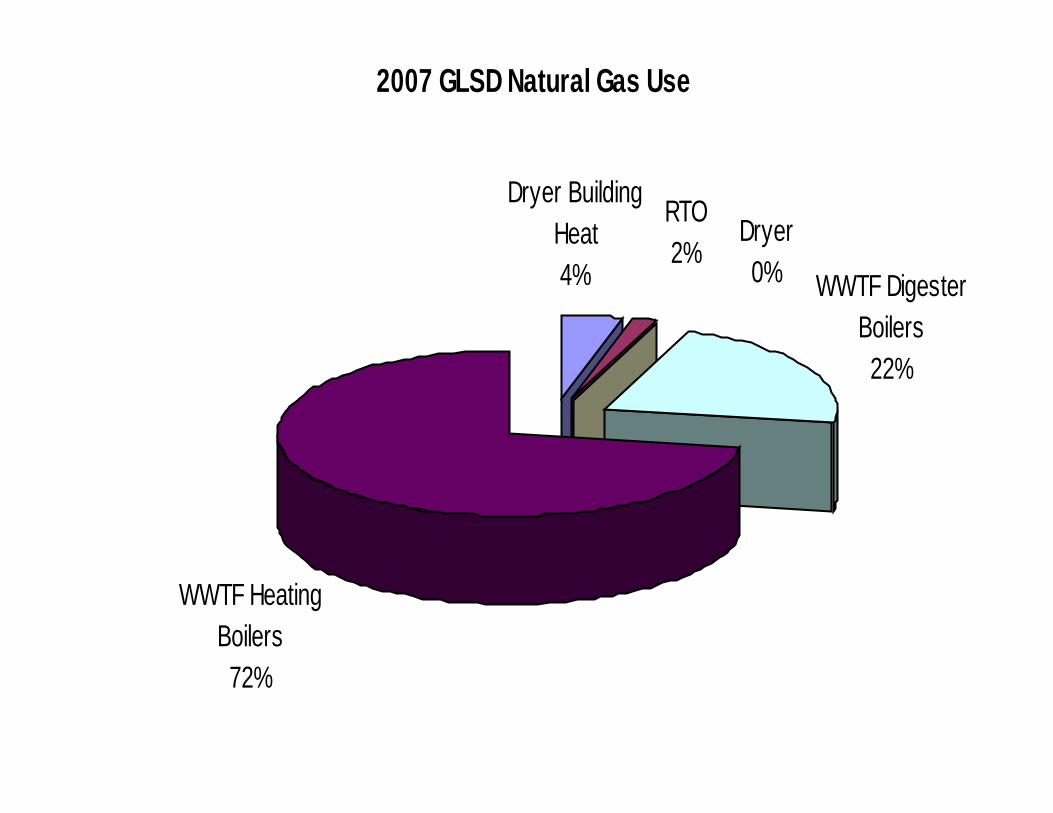
2007 GLSD Natural Gas Use
WWTF Heating Boilers72%
Dryer Building Heat4%
RTO2%
Dryer 0% WWTF Digester
Boilers22%
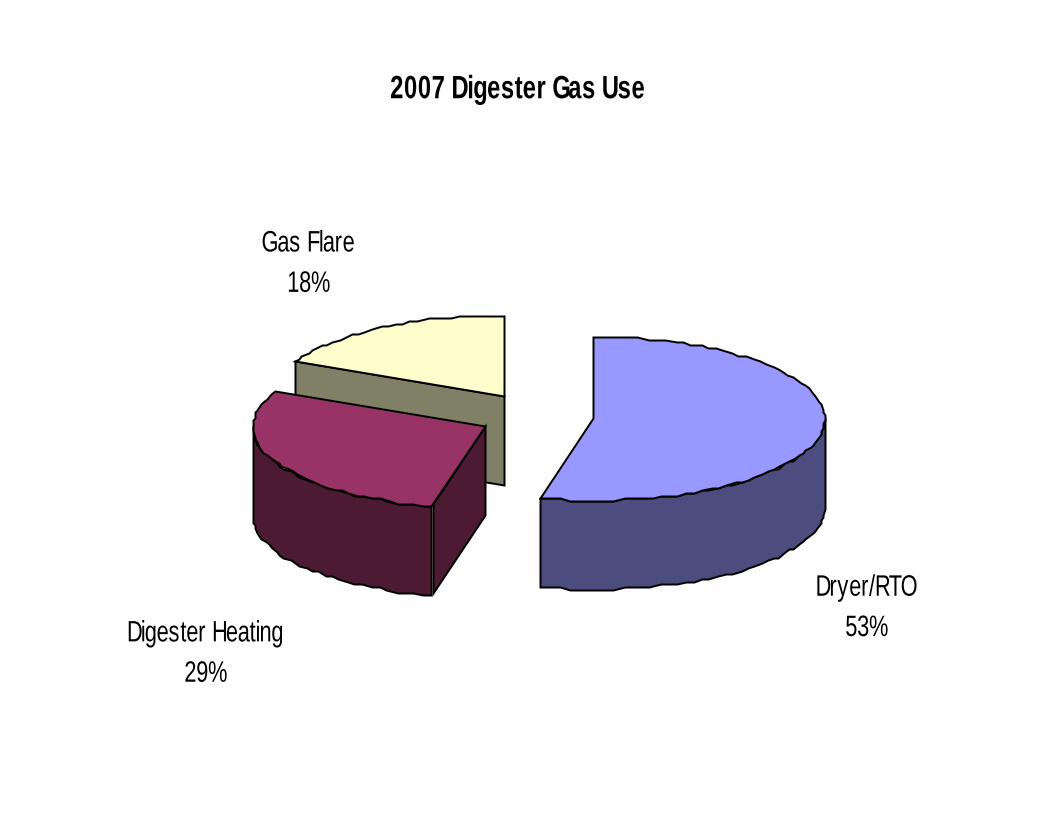
2007 Digester Gas Use
Gas Flare18%
Digester Heating29%
Dryer/RTO 53%
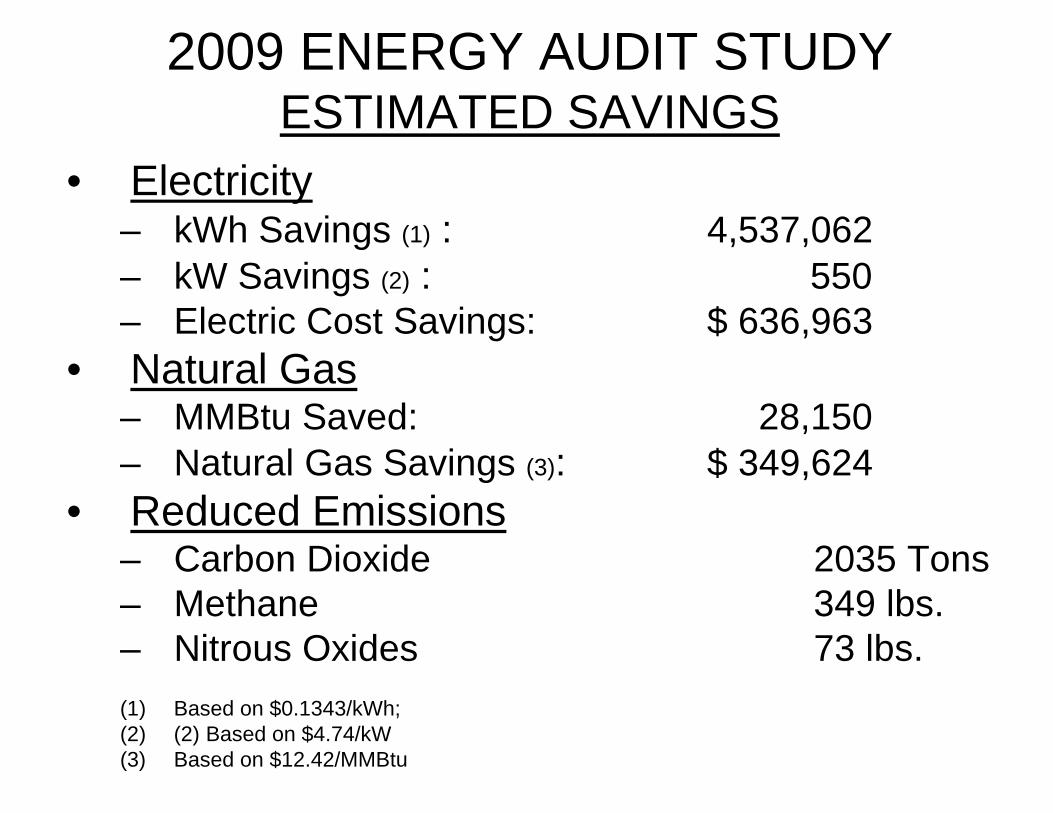
2009 ENERGY AUDIT STUDY ESTIMATED SAVINGS
• Electricity – kWh Savings (1) : 4,537,062 – kW Savings (2) : 550 – Electric Cost Savings: $ 636,963
• Natural Gas – MMBtu Saved: 28,150 – Natural Gas Savings (3): $ 349,624
• Reduced Emissions – Carbon Dioxide 2035 Tons – Methane 349 lbs. – Nitrous Oxides 73 lbs. (1) Based on $0.1343/kWh; (2) (2) Based on $4.74/kW (3) Based on $12.42/MMBtu
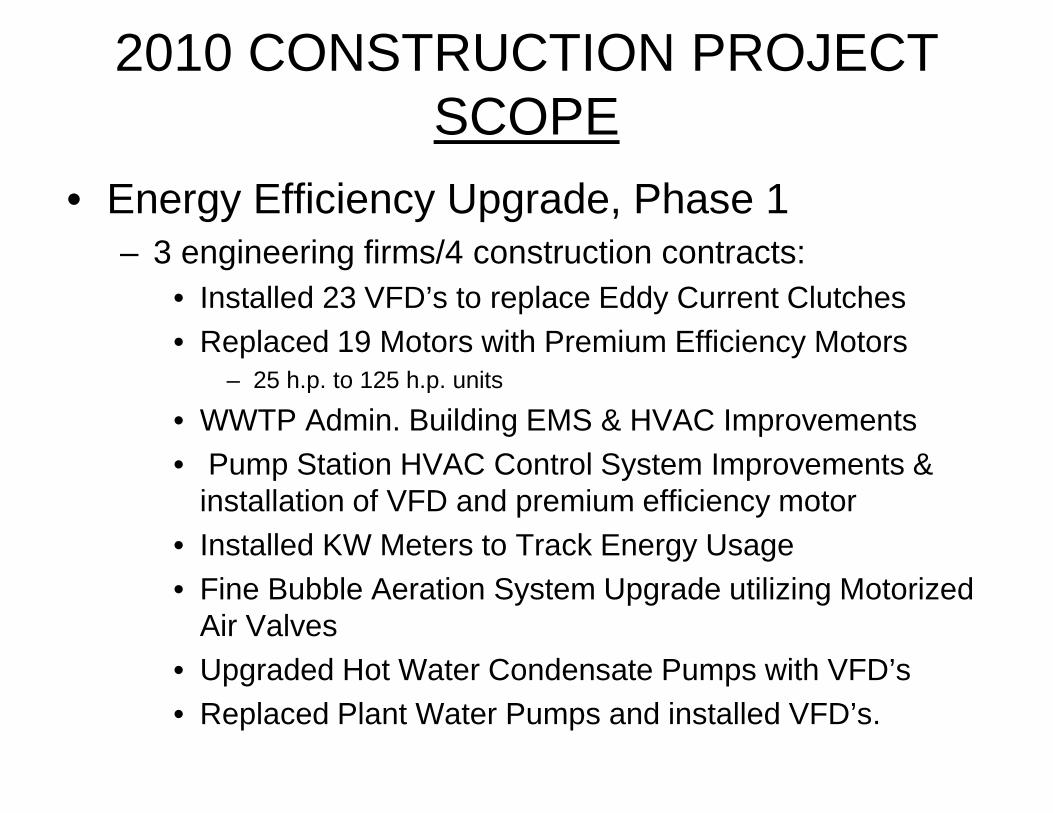
2010 CONSTRUCTION PROJECT
SCOPE • Energy Efficiency Upgrade, Phase 1
– 3 engineering firms/4 construction contracts: • Installed 23 VFD’s to replace Eddy Current Clutches • Replaced 19 Motors with Premium Efficiency Motors
– 25 h.p. to 125 h.p. units
• WWTP Admin. Building EMS & HVAC Improvements • Pump Station HVAC Control System Improvements &
installation of VFD and premium efficiency motor • Installed KW Meters to Track Energy Usage • Fine Bubble Aeration System Upgrade utilizing Motorized
Air Valves • Upgraded Hot Water Condensate Pumps with VFD’s • Replaced Plant Water Pumps and installed VFD’s.
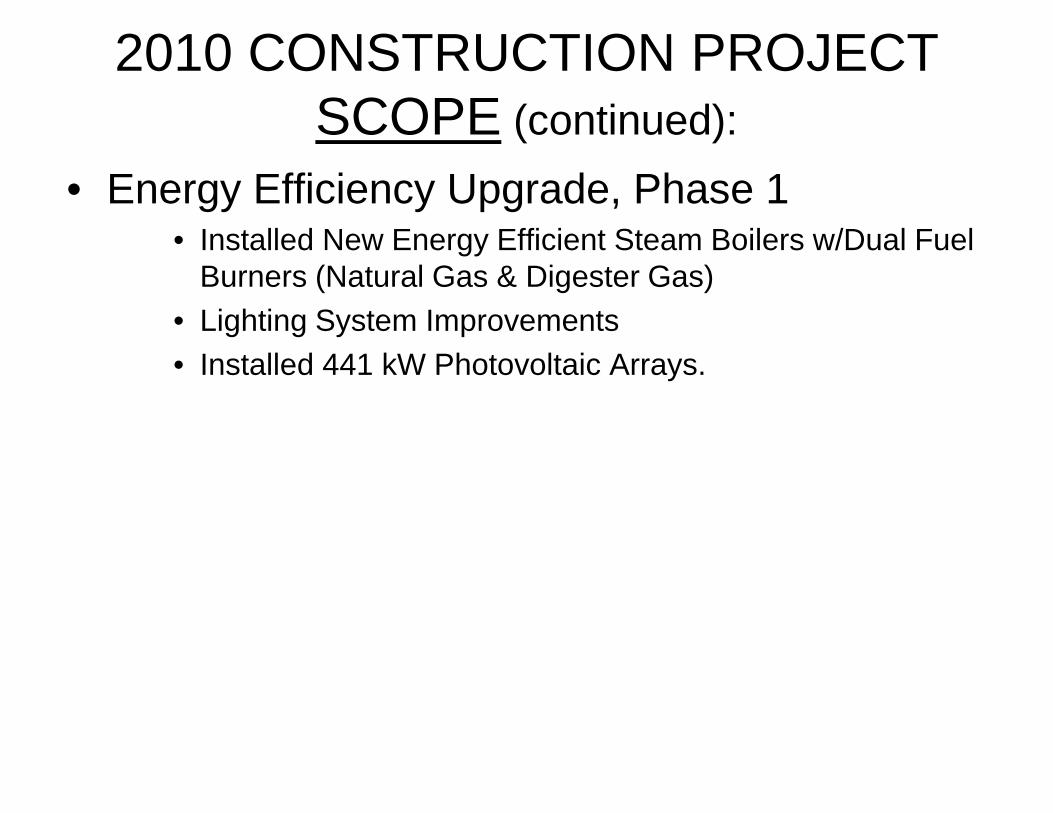
2010 CONSTRUCTION PROJECT
SCOPE (continued): • Energy Efficiency Upgrade, Phase 1
• Installed New Energy Efficient Steam Boilers w/Dual Fuel Burners (Natural Gas & Digester Gas)
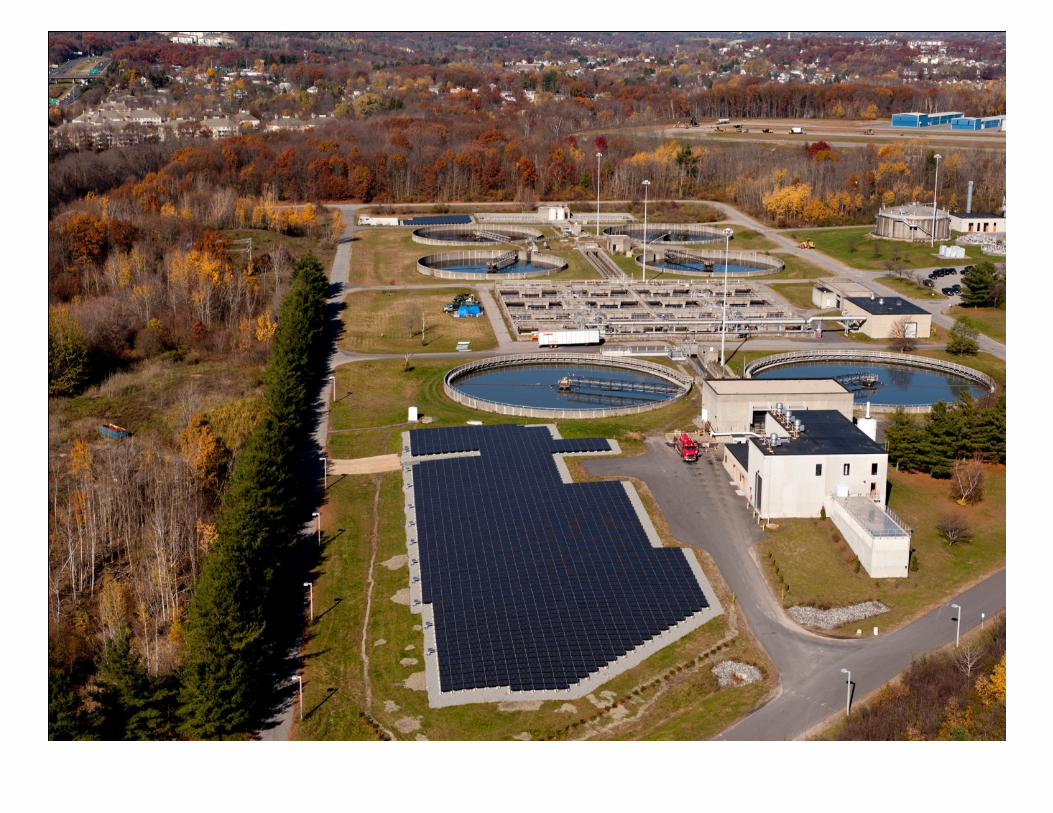
• Lighting System Improvements • Installed 441 kW Photovoltaic Arrays.
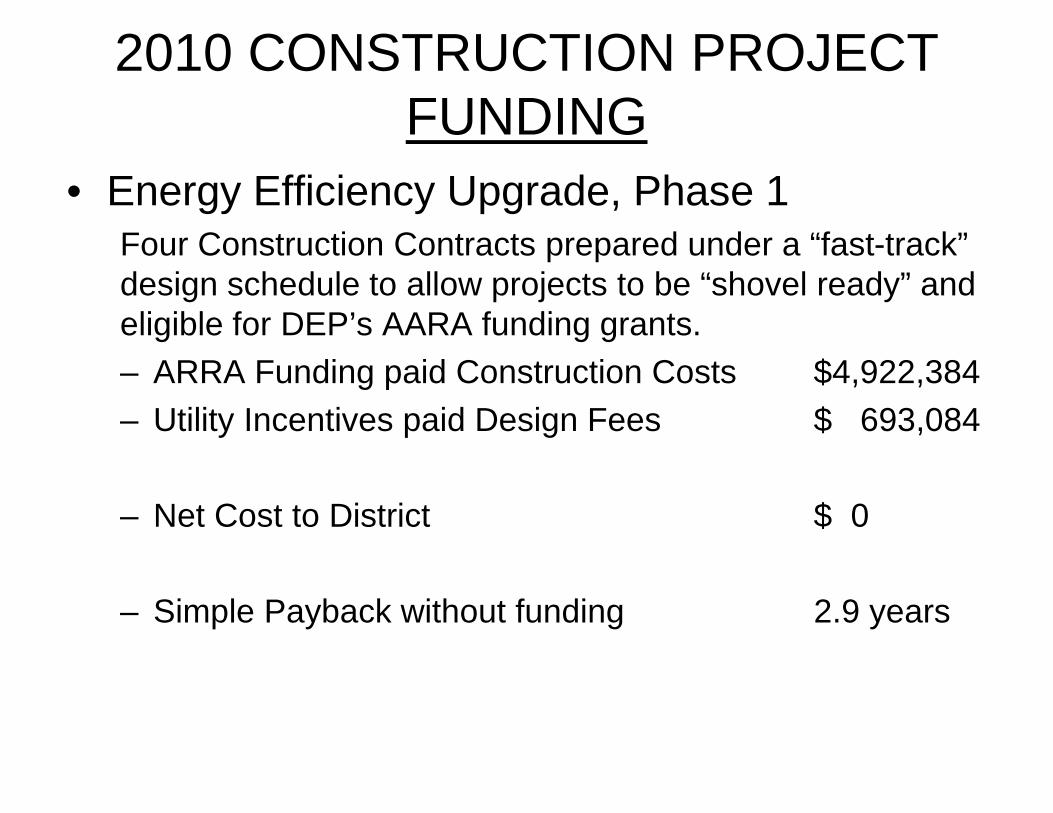
2010 CONSTRUCTION PROJECT
FUNDING • Energy Efficiency Upgrade, Phase 1
Four Construction Contracts prepared under a “fast-track” design schedule to allow projects to be “shovel ready” and eligible for DEP’s AARA funding grants. – ARRA Funding paid Construction Costs $4,922,384 – Utility Incentives paid Design Fees $ 693,084
– Net Cost to District $ 0
– Simple Payback without funding 2.9 years
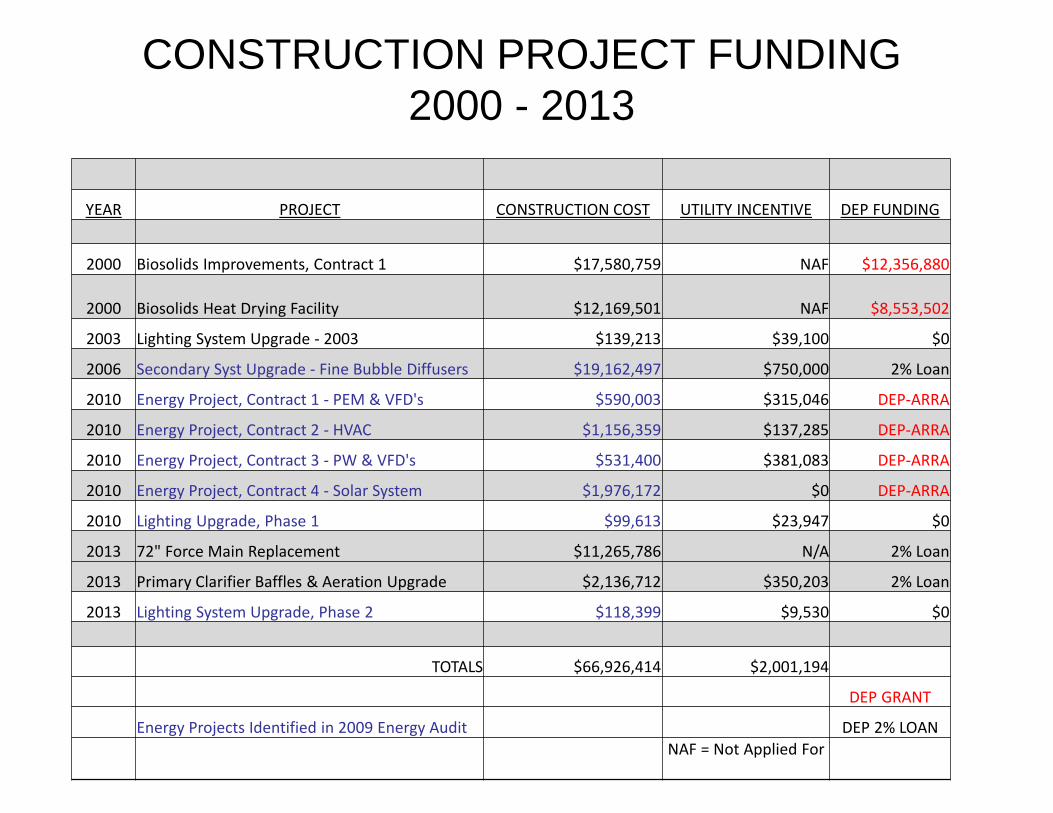
CONSTRUCTION PROJECT FUNDING 2000 - 2013
YEAR PROJECT CONSTRUCTION COST UTILITY INCENTIVE DEP FUNDING
2000 Biosolids Improvements, Contract 1 $17,580,759 NAF $12,356,880
2000 Biosolids Heat Drying Facility $12,169,501 NAF $8,553,502
2003 Lighting System Upgrade - 2003 $139,213 $39,100 $0
2006 Secondary Syst Upgrade - Fine Bubble Diffusers $19,162,497 $750,000 2% Loan
2010 Energy Project, Contract 1 - PEM & VFD's $590,003 $315,046 DEP-ARRA
2010 Energy Project, Contract 2 - HVAC $1,156,359 $137,285 DEP-ARRA
2010 Energy Project, Contract 3 - PW & VFD's $531,400 $381,083 DEP-ARRA
2010 Energy Project, Contract 4 - Solar System $1,976,172 $0 DEP-ARRA
2010 Lighting Upgrade, Phase 1 $99,613 $23,947 $0
2013 72" Force Main Replacement $11,265,786 N/A 2% Loan
2013 Primary Clarifier Baffles & Aeration Upgrade $2,136,712 $350,203 2% Loan
2013 Lighting System Upgrade, Phase 2 $118,399 $9,530 $0
TOTALS $66,926,414 $2,001,194
DEP GRANT
Energy Projects Identified in 2009 Energy Audit DEP 2% LOAN NAF = Not Applied For
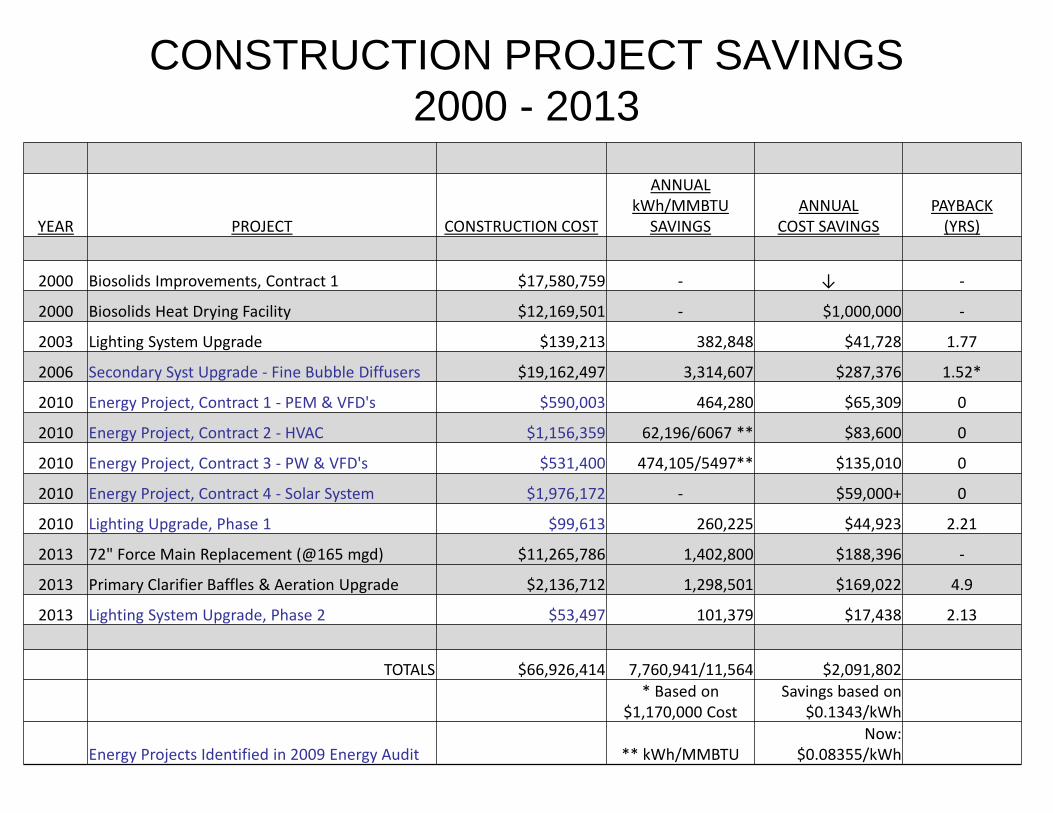
CONSTRUCTION PROJECT SAVINGS 2000 - 2013
YEAR PROJECT CONSTRUCTION COST
ANNUAL kWh/MMBTU
SAVINGS ANNUAL
COST SAVINGS PAYBACK
(YRS)
2000 Biosolids Improvements, Contract 1 $17,580,759 - ↓ -
2000 Biosolids Heat Drying Facility $12,169,501 - $1,000,000 -
2003 Lighting System Upgrade $139,213 382,848 $41,728 1.77
2006 Secondary Syst Upgrade - Fine Bubble Diffusers $19,162,497 3,314,607 $287,376 1.52*
2010 Energy Project, Contract 1 - PEM & VFD's $590,003 464,280 $65,309 0
2010 Energy Project, Contract 2 - HVAC $1,156,359 62,196/6067 ** $83,600 0
2010 Energy Project, Contract 3 - PW & VFD's $531,400 474,105/5497** $135,010 0
2010 Energy Project, Contract 4 - Solar System $1,976,172 - $59,000+ 0
2010 Lighting Upgrade, Phase 1 $99,613 260,225 $44,923 2.21
2013 72" Force Main Replacement (@165 mgd) $11,265,786 1,402,800 $188,396 -
2013 Primary Clarifier Baffles & Aeration Upgrade $2,136,712 1,298,501 $169,022 4.9
2013 Lighting System Upgrade, Phase 2 $53,497 101,379 $17,438 2.13
TOTALS $66,926,414 7,760,941/11,564 $2,091,802 * Based on
$1,170,000 Cost Savings based on
$0.1343/kWh
Energy Projects Identified in 2009 Energy Audit ** kWh/MMBTU Now:
$0.08355/kWh
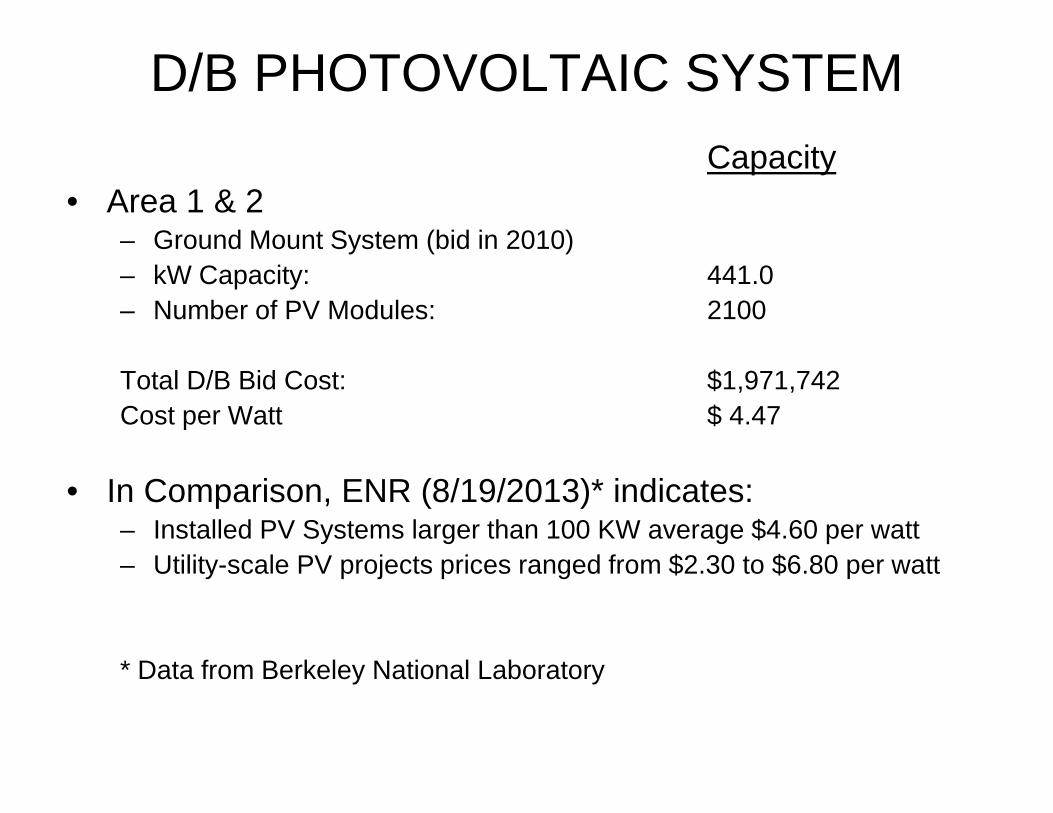
D/B PHOTOVOLTAIC SYSTEM Capacity
• Area 1 & 2 – Ground Mount System (bid in 2010) – kW Capacity: 441.0 – Number of PV Modules: 2100 Total D/B Bid Cost: $1,971,742 Cost per Watt $ 4.47
• In Comparison, ENR (8/19/2013)* indicates:
– Installed PV Systems larger than 100 KW average $4.60 per watt – Utility-scale PV projects prices ranged from $2.30 to $6.80 per watt
* Data from Berkeley National Laboratory
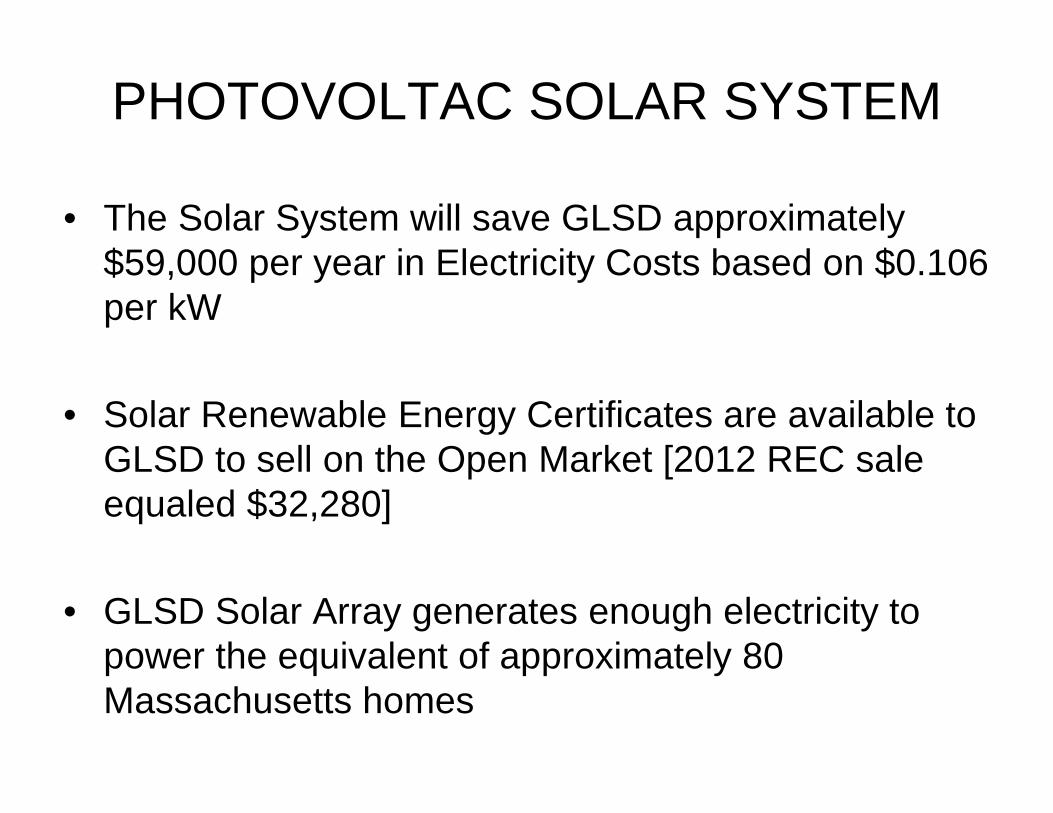
PHOTOVOLTAC SOLAR SYSTEM
• The Solar System will save GLSD approximately $59,000 per year in Electricity Costs based on $0.106 per kW
• Solar Renewable Energy Certificates are available to GLSD to sell on the Open Market [2012 REC sale equaled $32,280]
• GLSD Solar Array generates enough electricity to power the equivalent of approximately 80 Massachusetts homes
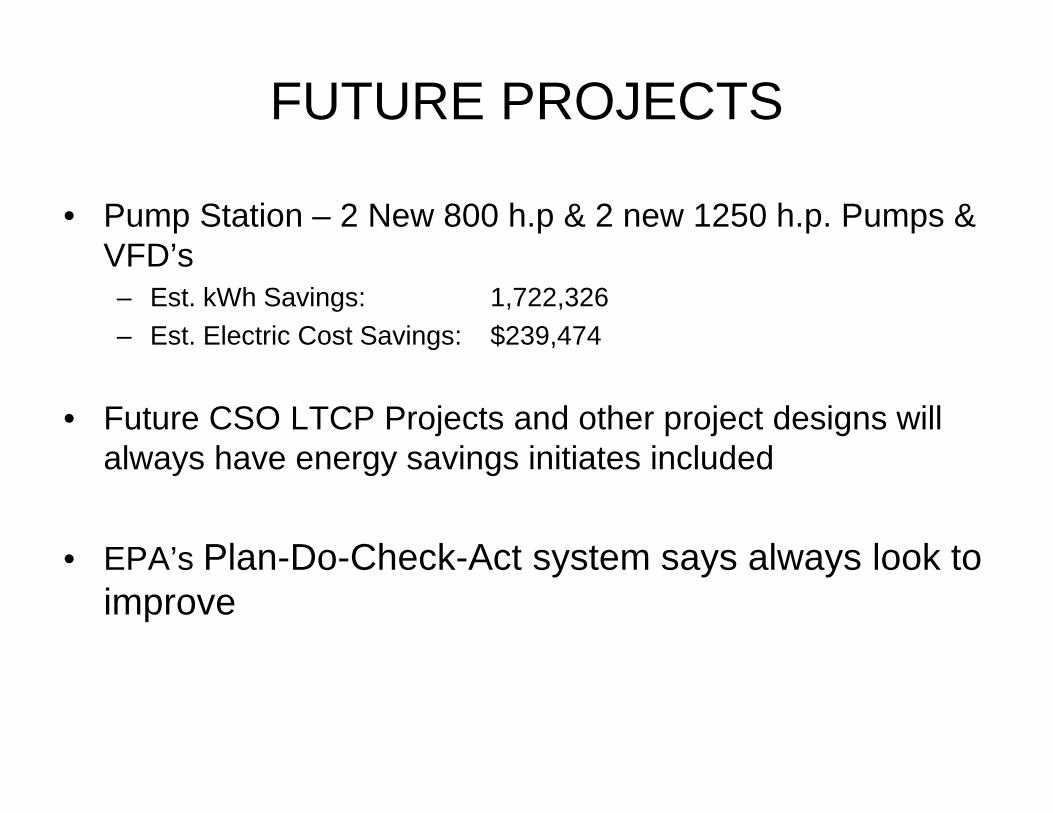
FUTURE PROJECTS
• Pump Station – 2 New 800 h.p & 2 new 1250 h.p. Pumps & VFD’s – Est. kWh Savings: 1,722,326 – Est. Electric Cost Savings: $239,474
• Future CSO LTCP Projects and other project designs will always have energy savings initiates included
• EPA’s Plan-Do-Check-Act system says always look to improve
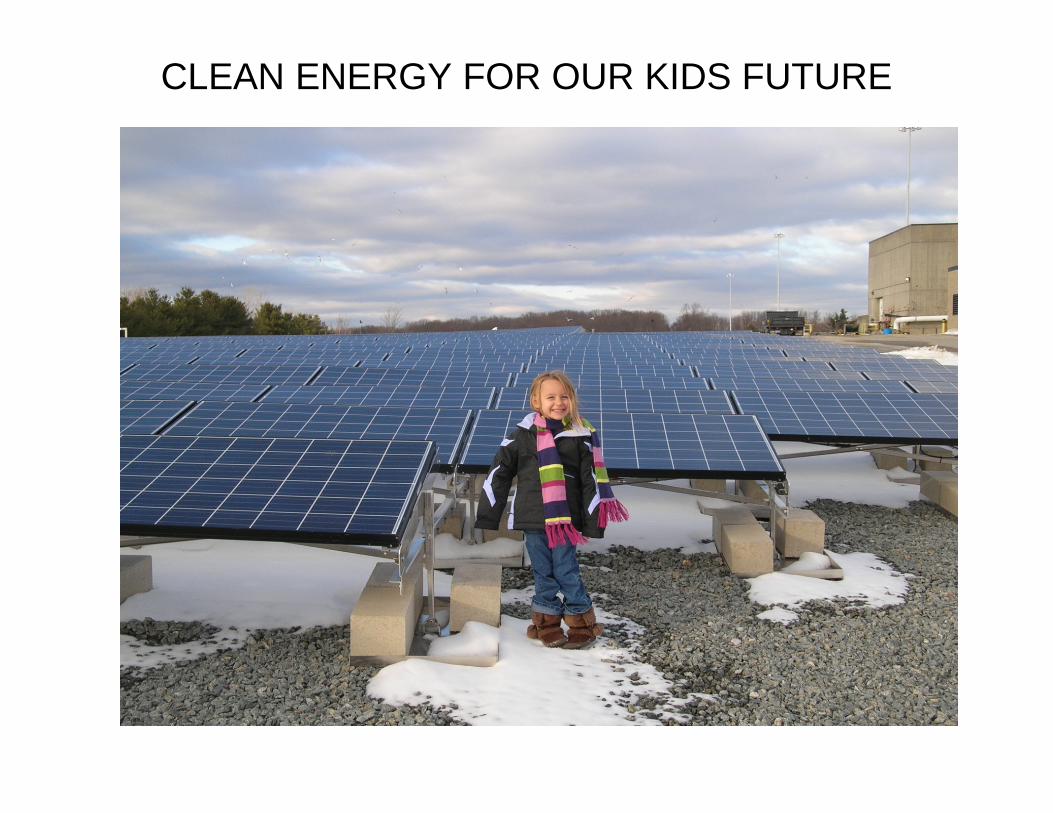
CLEAN ENERGY FOR OUR KIDS FUTURE