Embed Size (px)
Citation preview

Usability Testing Search Engines Evaluating the quantitative and qualitative findings
Designer: D’shaun Guillory
Professor: Michael Duncan, Ph.D
Date: 14 December 2012
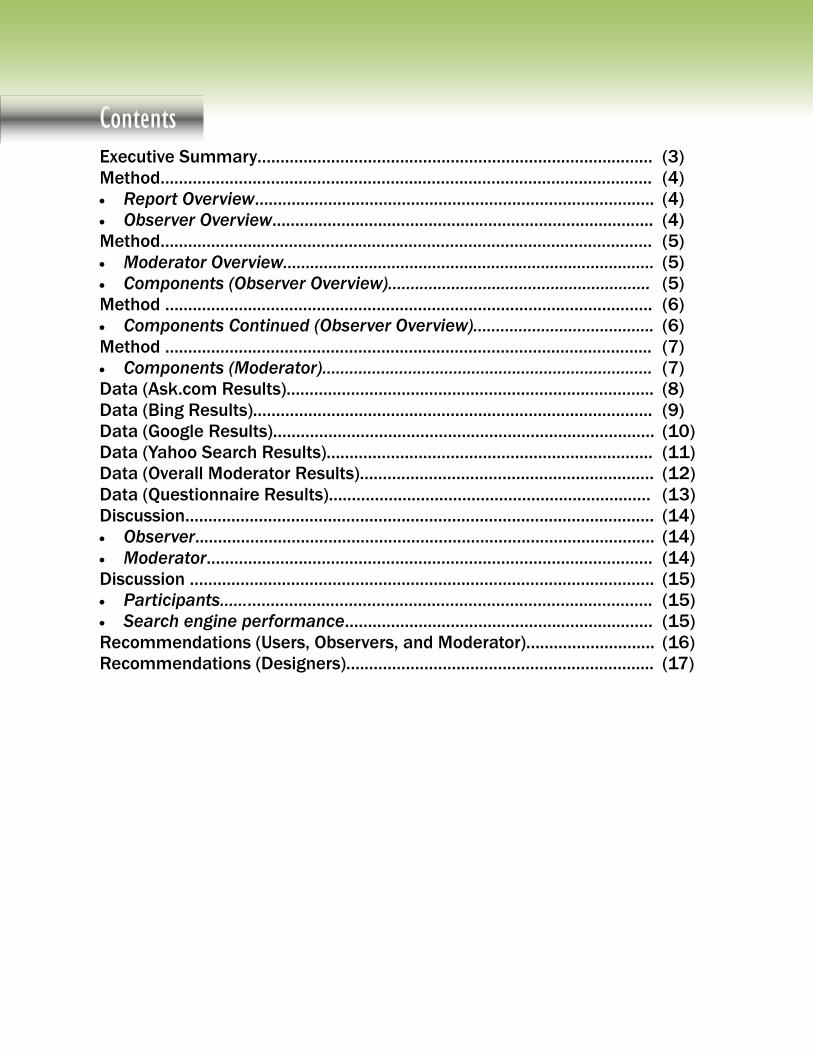
Contents Executive Summary……………………………………………………………….….………
Method………………………………………………...…………………………………………..
Report Overview………...………………………………………………………….……..
Observer Overview……………………..…………………………….…………………..
Method………………...…………………………………………………………………………..
Moderator Overview……………..………………..………………………………………
Components (Observer Overview)……..……………..……………………………
Method ………………..…………………………………………………………………………..
Components Continued (Observer Overview)…………………………….…...
Method ……………….………………………………..………………………………………....
Components (Moderator)……………………………………..………………………..
Data (Ask.com Results)………………………………..…………………………………...
Data (Bing Results)………………..…………………………..……………………………..
Data (Google Results)…………………………………….………………………………….
Data (Yahoo Search Results)……………………………………………………………..
Data (Overall Moderator Results)……………………………………………………….
Data (Questionnaire Results)…………………………………………………………….
Discussion……………………………………………………………………………….………..
Observer...…………………………………………………………………………………….
Moderator…………………………………………………………………………………….
Discussion ………………………………………………………………………………………..
Participants…………………..……………………………………………………………..
Search engine performance……………………………………….…………………
Recommendations (Users, Observers, and Moderator)……………………….
Recommendations (Designers)….……………………………………………………...
(3)
(4)
(4)
(4)
(5)
(5)
(5)
(6)
(6)
(7)
(7)
(8)
(9)
(10)
(11)
(12)
(13)
(14)
(14)
(14)
(15)
(15)
(15)
(16)
(17)
Executive Summary Many users today who frequent search engines either do not stop to think
about how usable many of them may be why there is a preference to a
particular one compared to another. This report analysis the quantitative and
qualitative findings to search engines (Ask.com, Bing, Google, and Yahoo).
These search engines were chosen because they are some of the most used,
more popular sites comparable to others. The report outlines the varying
methods used in the testing process, pertaining to the logistical side and
differing metrics used for note taking purposes. The report also shows the
results from the data compiled during the process. The moderator and
observers gathered important information that would better help explain the
variations in usable pertaining to (Ask.com, Bing, Google, and Yahoo).
The participants involved were undergrad volunteers and a college professor.
The verbal and non-verbal information they provided during the testing
process allowed for a more in-depth analysis of the various search engines
as well as how users react in varying circumstances.
The entire testing process was recorded using Morea Software to which the
participant gave full consent. The end of the report takes the data and
translates it into usable information, qualitatively speaking. This is followed
by a list of recommendations on the behave of the moderator, observers, and
users involved in future Usability Testing of any particular products.
Method Report Overview
The information and data (results) compiled in this report outline the various
performance outcomes of search engines (Ask.com, Bing, Google, and Yahoo
Search). Also presented is an informative outlook on how the participants
perform using the various search engines. The participants were not being
tested per se, but the testing process did allow for an examination on how
the participants responded visually and performance wise throughout the
process. The information is then applied to the data generated by the search
engine performance outcomes. Overall, the results produced by the search
engine and participant outcomes will help establish a foundation on which to
recommend or mandate changes to these web-page databases. The results
should also make clear which search engine has the best and worst overall
performance based on data and participant preference.
Observer(s) Overview
The three individuals were tasked with compiling important information for
the moderator. Observer 1 was tasked with watching the participants from
the one-way mirror and collect aesthetic information such as (body move-
ments and facial expressions). The observer was set in the Usability
classroom not in the lab with moderator. Observer 2 was tasked with viewing
the actions of the participant via (visual and verbal) recordings with in the
Usability classroom. The information provided by the observer used varying
components. First, the camera posted above the computer used by the
participant provided the observer with the verbal occurrences as well as the
visual component. Some of the information provided included (thinking
aloud, clicks per page, page navigation, body movements, facial expressions,
and obvious web-page errors. Observer 3 was tasked with shadowing the
moderator within the Usability Lab. Similar to observer 2, they had to watch
for variations in body movements, as well as looking for obvious errors in
task completion, web-page navigation, and assistance level. Also, located in
the Usability Lab was the Time Keeper tasked with recording a time frame
for not only the set tasks but the three steps per task as well. During the
testing process, the Time Keeper was tasked with (non-verbally) informing
the moderator of the remaining time per task so as to eliminate time
overruns. The Time Keeper was located behind the participant the keeper to
avoid constant distractions.
Method Continued Moderator Overview
The moderator was tasked with controlling all of the designs of the
Usability Test and the logistics of the entire process; excluding controlling the
outcomes of the participant testing process. The moderator was located in
the Usability Lab to the left of the participant so as to eliminate unwarranted
distractions. The main goal was to gather as much information as possible
from the performance of both the search engines and the participants.
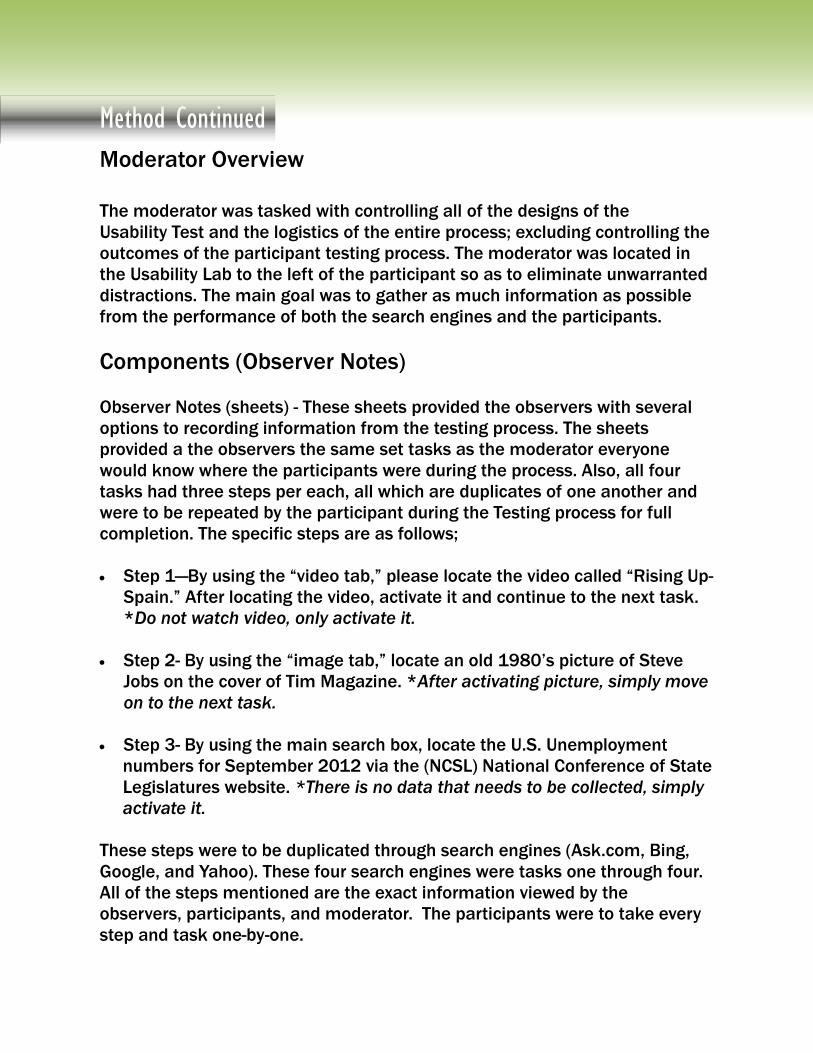
Components (Observer Notes)
Observer Notes (sheets) - These sheets provided the observers with several
options to recording information from the testing process. The sheets
provided a the observers the same set tasks as the moderator everyone
would know where the participants were during the process. Also, all four
tasks had three steps per each, all which are duplicates of one another and
were to be repeated by the participant during the Testing process for full
completion. The specific steps are as follows;
Step 1—By using the “video tab,” please locate the video called “Rising Up-
Spain.” After locating the video, activate it and continue to the next task.
*Do not watch video, only activate it.
Step 2- By using the “image tab,” locate an old 1980’s picture of Steve
Jobs on the cover of Tim Magazine. *After activating picture, simply move
on to the next task.
Step 3- By using the main search box, locate the U.S. Unemployment
numbers for September 2012 via the (NCSL) National Conference of State
Legislatures website. *There is no data that needs to be collected, simply
activate it.
These steps were to be duplicated through search engines (Ask.com, Bing,
Google, and Yahoo). These four search engines were tasks one through four.
All of the steps mentioned are the exact information viewed by the
observers, participants, and moderator. The participants were to take every
step and task one-by-one.
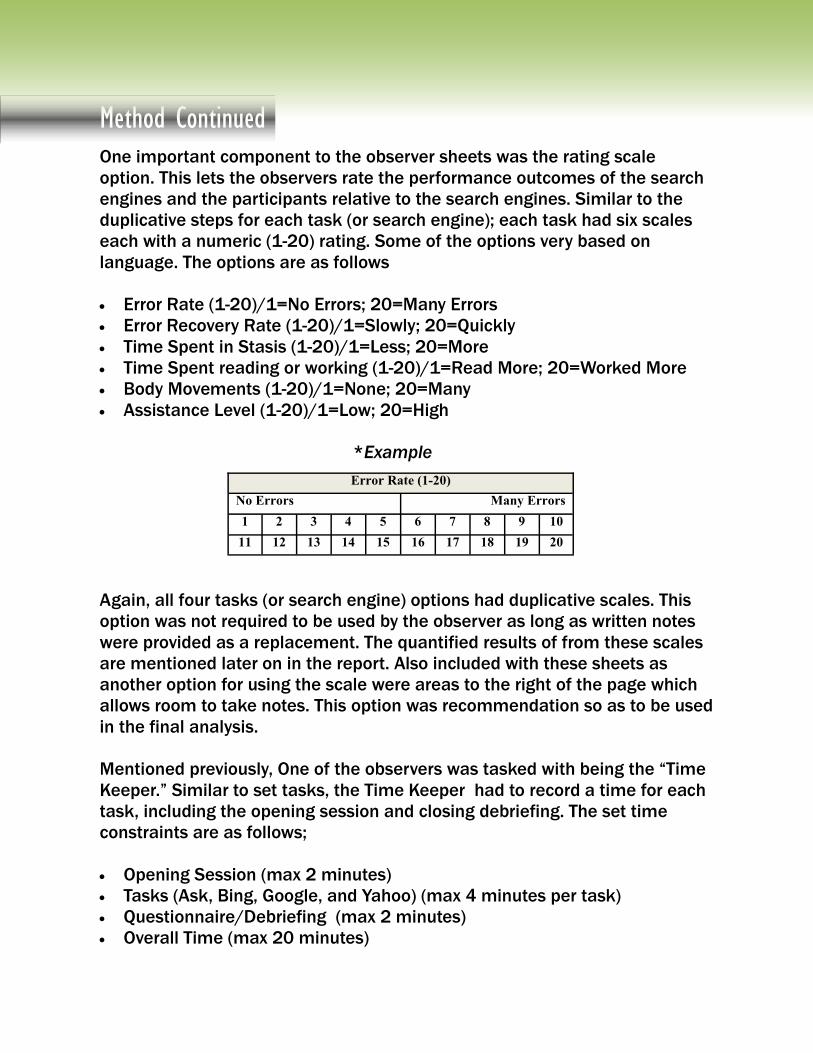
Method Continued One important component to the observer sheets was the rating scale
option. This lets the observers rate the performance outcomes of the search
engines and the participants relative to the search engines. Similar to the
duplicative steps for each task (or search engine); each task had six scales
each with a numeric (1-20) rating. Some of the options very based on
language. The options are as follows
Error Rate (1-20)/1=No Errors; 20=Many Errors
Error Recovery Rate (1-20)/1=Slowly; 20=Quickly
Time Spent in Stasis (1-20)/1=Less; 20=More
Time Spent reading or working (1-20)/1=Read More; 20=Worked More
Body Movements (1-20)/1=None; 20=Many
Assistance Level (1-20)/1=Low; 20=High
*Example
Again, all four tasks (or search engine) options had duplicative scales. This
option was not required to be used by the observer as long as written notes
were provided as a replacement. The quantified results of from these scales
are mentioned later on in the report. Also included with these sheets as
another option for using the scale were areas to the right of the page which
allows room to take notes. This option was recommendation so as to be used
in the final analysis.
Mentioned previously, One of the observers was tasked with being the “Time
Keeper.” Similar to set tasks, the Time Keeper had to record a time for each
task, including the opening session and closing debriefing. The set time
constraints are as follows;
Opening Session (max 2 minutes)
Tasks (Ask, Bing, Google, and Yahoo) (max 4 minutes per task)
Questionnaire/Debriefing (max 2 minutes)
Overall Time (max 20 minutes)
Error Rate (1-20)
No Errors Many Errors
1 2 3 4 5 6 7 8 9 10
11 12 13 14 15 16 17 18 19 20
Method Continued Components (Moderator)
Similar to observer notes; moderator notes offer a list of all set tasks and
steps, followed by the numeric scale and written notes component. In
addition to the six observer scale options; the moderator notes had three
more options of performance to consider. The three options are as follows;
Time spent navigating (1-20)/1=Less; 20=More
Time spent locating tasks (1-20)/1=Less;20=More
Task completion rate (1-20)/1=Not completed;20=Completed all
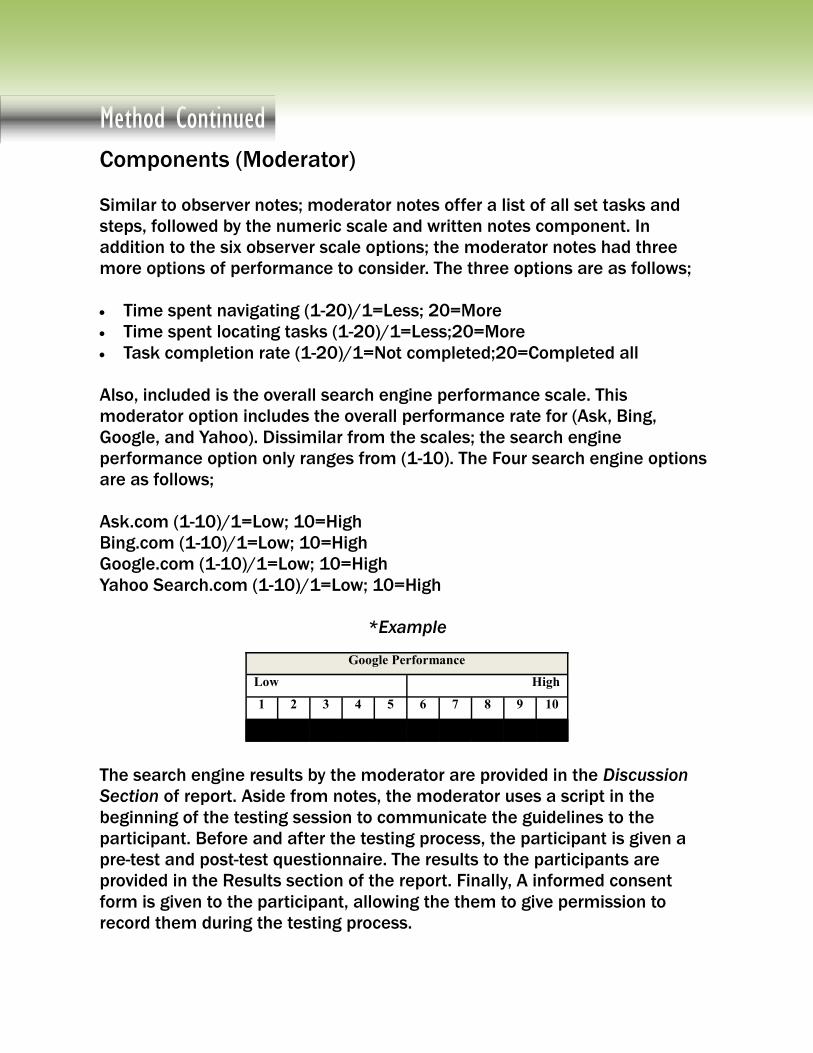
Also, included is the overall search engine performance scale. This
moderator option includes the overall performance rate for (Ask, Bing,
Google, and Yahoo). Dissimilar from the scales; the search engine
performance option only ranges from (1-10). The Four search engine options
are as follows;
Ask.com (1-10)/1=Low; 10=High
Bing.com (1-10)/1=Low; 10=High
Google.com (1-10)/1=Low; 10=High
Yahoo Search.com (1-10)/1=Low; 10=High
*Example
The search engine results by the moderator are provided in the Discussion
Section of report. Aside from notes, the moderator uses a script in the
beginning of the testing session to communicate the guidelines to the
participant. Before and after the testing process, the participant is given a
pre-test and post-test questionnaire. The results to the participants are
provided in the Results section of the report. Finally, A informed consent
form is given to the participant, allowing the them to give permission to
record them during the testing process.
Google Performance
Low High
1 2 3 4 5 6 7 8 9 10
11 12 13 14 15 16 17 18 19 20
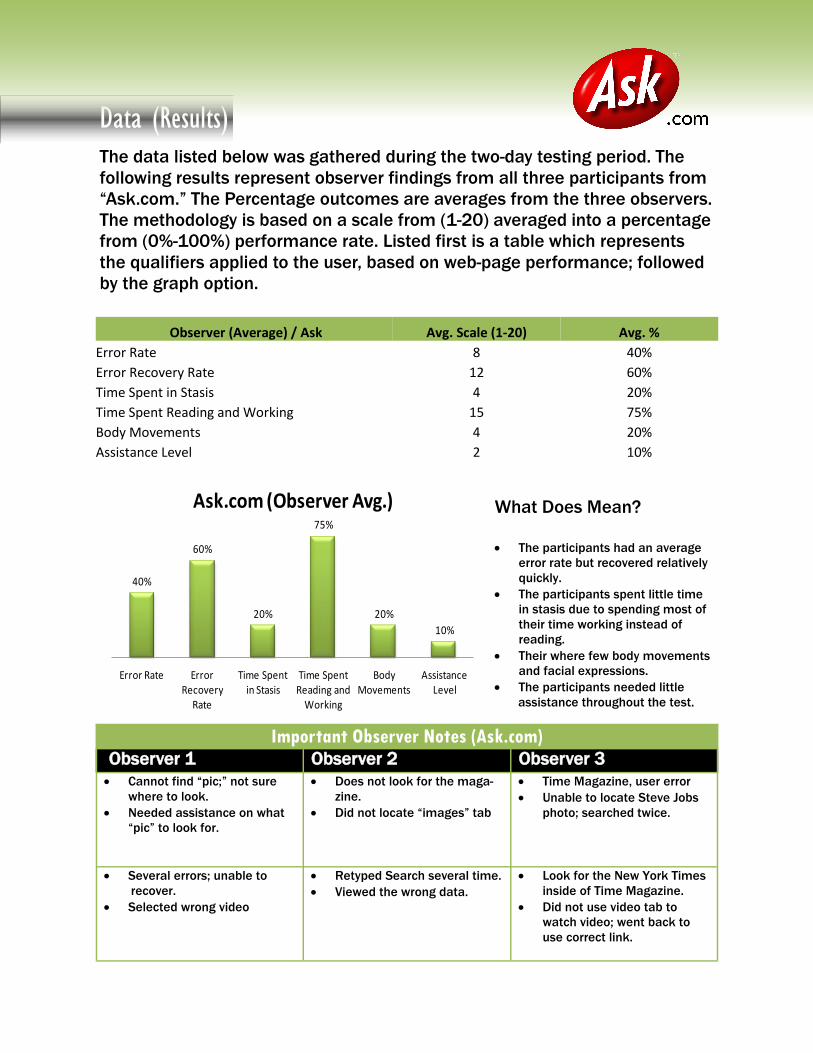
Data (Results)
Observer (Average) / Ask Avg. Scale (1-20) Avg. %
Error Rate 8 40%
Error Recovery Rate 12 60%
Time Spent in Stasis 4 20%
Time Spent Reading and Working 15 75%
Body Movements 4 20%
Assistance Level 2 10%
The data listed below was gathered during the two-day testing period. The
following results represent observer findings from all three participants from
“Ask.com.” The Percentage outcomes are averages from the three observers.
The methodology is based on a scale from (1-20) averaged into a percentage
from (0%-100%) performance rate. Listed first is a table which represents
the qualifiers applied to the user, based on web-page performance; followed
by the graph option.
What Does Mean?
The participants had an average
error rate but recovered relatively
quickly.
The participants spent little time
in stasis due to spending most of
their time working instead of
reading.
Their where few body movements
and facial expressions.
The participants needed little
assistance throughout the test.
Important Observer Notes (Ask.com) Observer 1 Observer 2 Observer 3
Cannot find “pic;” not sure
where to look.
Needed assistance on what
“pic” to look for.
Does not look for the maga-
zine.
Did not locate “images” tab
Time Magazine, user error
Unable to locate Steve Jobs
photo; searched twice.
Several errors; unable to
recover.
Selected wrong video
Retyped Search several time.
Viewed the wrong data.
Look for the New York Times
inside of Time Magazine.
Did not use video tab to
watch video; went back to
use correct link.
40%
60%
20%
75%
20%
10%
Error Rate Error Recovery
Rate
Time Spent in Stasis
Time Spent Reading and
Working
Body Movements
Assistance Level
Ask.com (Observer Avg.)
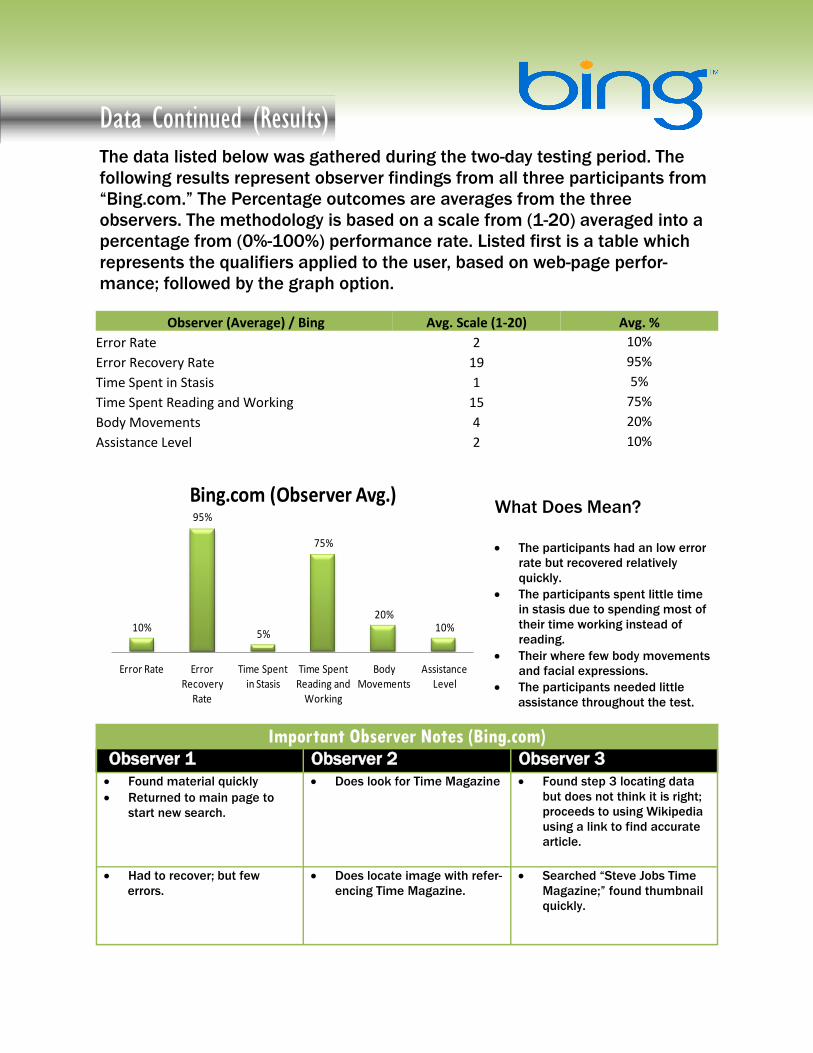
Data Continued (Results)
Observer (Average) / Bing Avg. Scale (1-20) Avg. %
Error Rate 2 10%
Error Recovery Rate 19 95%
Time Spent in Stasis 1 5%
Time Spent Reading and Working 15 75%
Body Movements 4 20%
Assistance Level 2 10%
The data listed below was gathered during the two-day testing period. The
following results represent observer findings from all three participants from
“Bing.com.” The Percentage outcomes are averages from the three
observers. The methodology is based on a scale from (1-20) averaged into a
percentage from (0%-100%) performance rate. Listed first is a table which
represents the qualifiers applied to the user, based on web-page perfor-
mance; followed by the graph option.
What Does Mean?
The participants had an low error
rate but recovered relatively
quickly.
The participants spent little time
in stasis due to spending most of
their time working instead of
reading.
Their where few body movements
and facial expressions.
The participants needed little
assistance throughout the test.
Important Observer Notes (Bing.com) Observer 1 Observer 2 Observer 3
Found material quickly
Returned to main page to
start new search.
Does look for Time Magazine
Found step 3 locating data
but does not think it is right;
proceeds to using Wikipedia
using a link to find accurate
article.
Had to recover; but few
errors.
Does locate image with refer-
encing Time Magazine.
Searched “Steve Jobs Time
Magazine;” found thumbnail
quickly.
10%
95%
5%
75%
20%10%
Error Rate Error Recovery
Rate
Time Spent in Stasis
Time Spent Reading and
Working
Body Movements
Assistance Level
Bing.com (Observer Avg.)
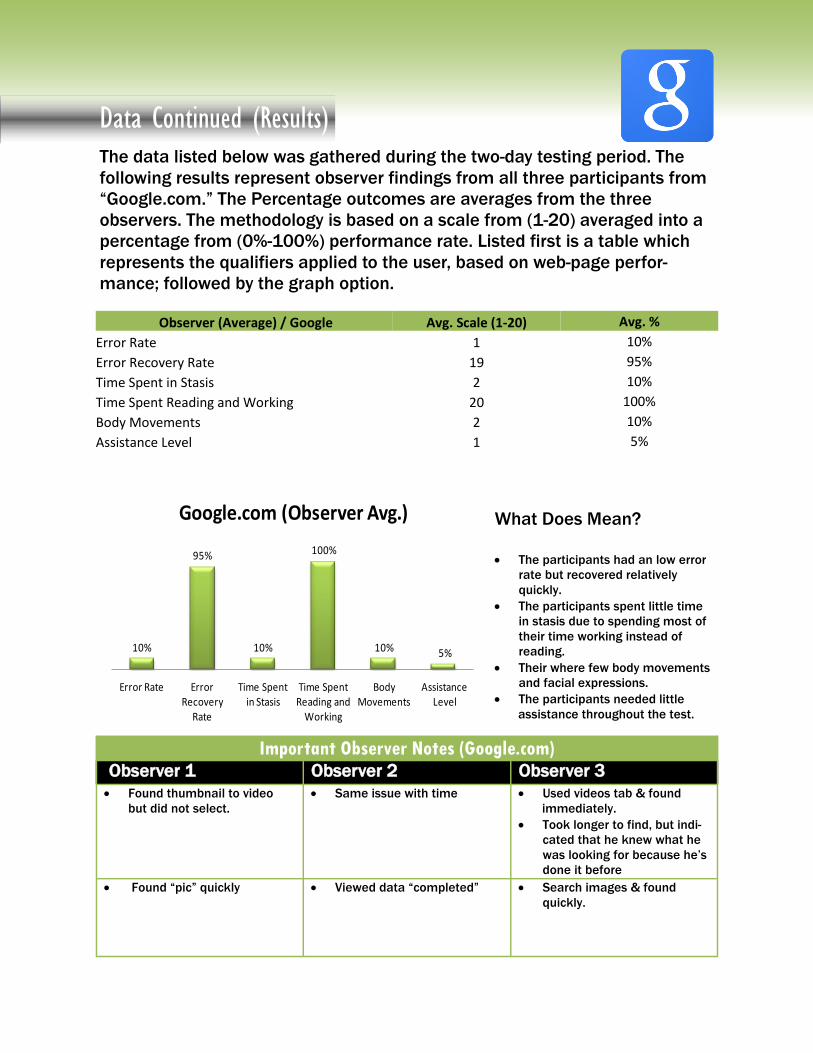
Data Continued (Results)
Observer (Average) / Google Avg. Scale (1-20) Avg. %
Error Rate 1 10%
Error Recovery Rate 19 95%
Time Spent in Stasis 2 10%
Time Spent Reading and Working 20 100%
Body Movements 2 10%
Assistance Level 1 5%
The data listed below was gathered during the two-day testing period. The
following results represent observer findings from all three participants from
“Google.com.” The Percentage outcomes are averages from the three
observers. The methodology is based on a scale from (1-20) averaged into a
percentage from (0%-100%) performance rate. Listed first is a table which
represents the qualifiers applied to the user, based on web-page perfor-
mance; followed by the graph option.
What Does Mean?
The participants had an low error
rate but recovered relatively
quickly.
The participants spent little time
in stasis due to spending most of
their time working instead of
reading.
Their where few body movements
and facial expressions.
The participants needed little
assistance throughout the test.
Important Observer Notes (Google.com) Observer 1 Observer 2 Observer 3
Found thumbnail to video
but did not select.
Same issue with time
Used videos tab & found
immediately.
Took longer to find, but indi-
cated that he knew what he
was looking for because he’s
done it before
Found “pic” quickly
Viewed data “completed” Search images & found
quickly.
10%
95%
10%
100%
10% 5%
Error Rate Error Recovery
Rate
Time Spent in Stasis
Time Spent Reading and
Working
Body Movements
Assistance Level
Google.com (Observer Avg.)
Data Continued (Results)
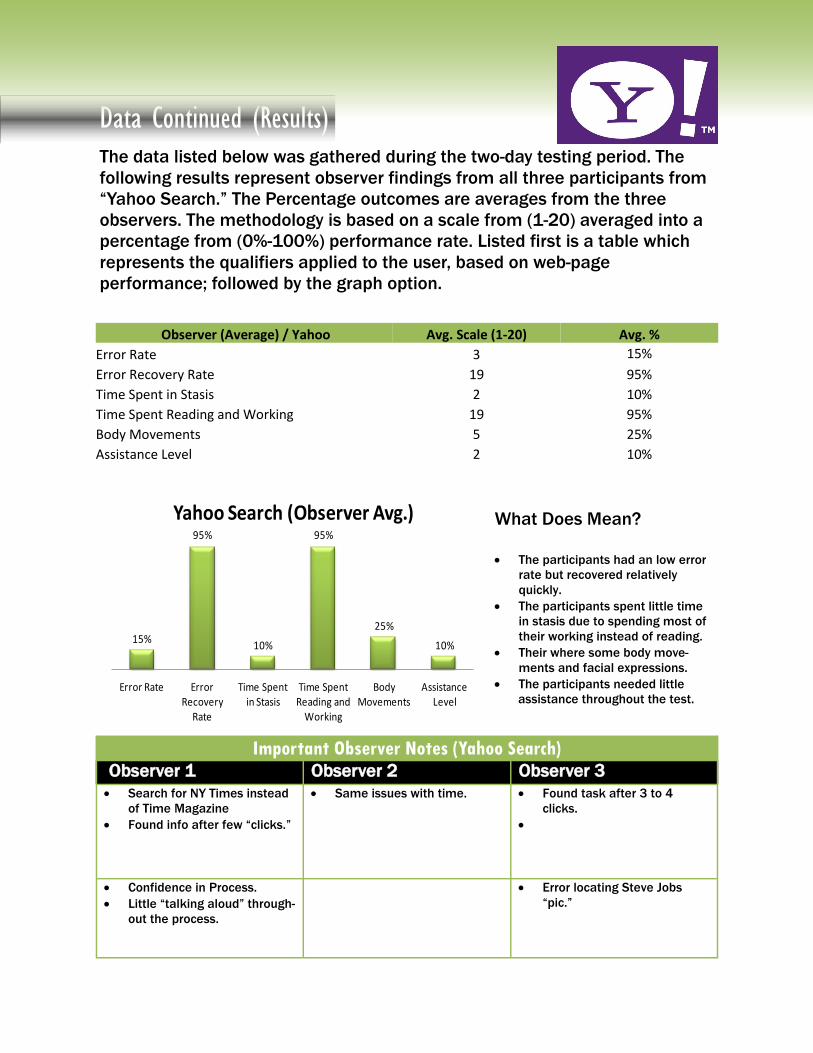
Observer (Average) / Yahoo Avg. Scale (1-20) Avg. %
Error Rate 3 15%
Error Recovery Rate 19 95%
Time Spent in Stasis 2 10%
Time Spent Reading and Working 19 95%
Body Movements 5 25%
Assistance Level 2 10%
Important Observer Notes (Yahoo Search) Observer 1 Observer 2 Observer 3
Search for NY Times instead
of Time Magazine
Found info after few “clicks.”
Same issues with time.
Found task after 3 to 4
clicks.
Confidence in Process.
Little “talking aloud” through-
out the process.
Error locating Steve Jobs
“pic.”
What Does Mean?
The participants had an low error
rate but recovered relatively
quickly.
The participants spent little time
in stasis due to spending most of
their working instead of reading.
Their where some body move-
ments and facial expressions.
The participants needed little
assistance throughout the test.
The data listed below was gathered during the two-day testing period. The
following results represent observer findings from all three participants from
“Yahoo Search.” The Percentage outcomes are averages from the three
observers. The methodology is based on a scale from (1-20) averaged into a
percentage from (0%-100%) performance rate. Listed first is a table which
represents the qualifiers applied to the user, based on web-page
performance; followed by the graph option.
15%
95%
10%
95%
25%
10%
Error Rate Error Recovery
Rate
Time Spent in Stasis
Time Spent Reading and
Working
Body Movements
Assistance Level
Yahoo Search (Observer Avg.)
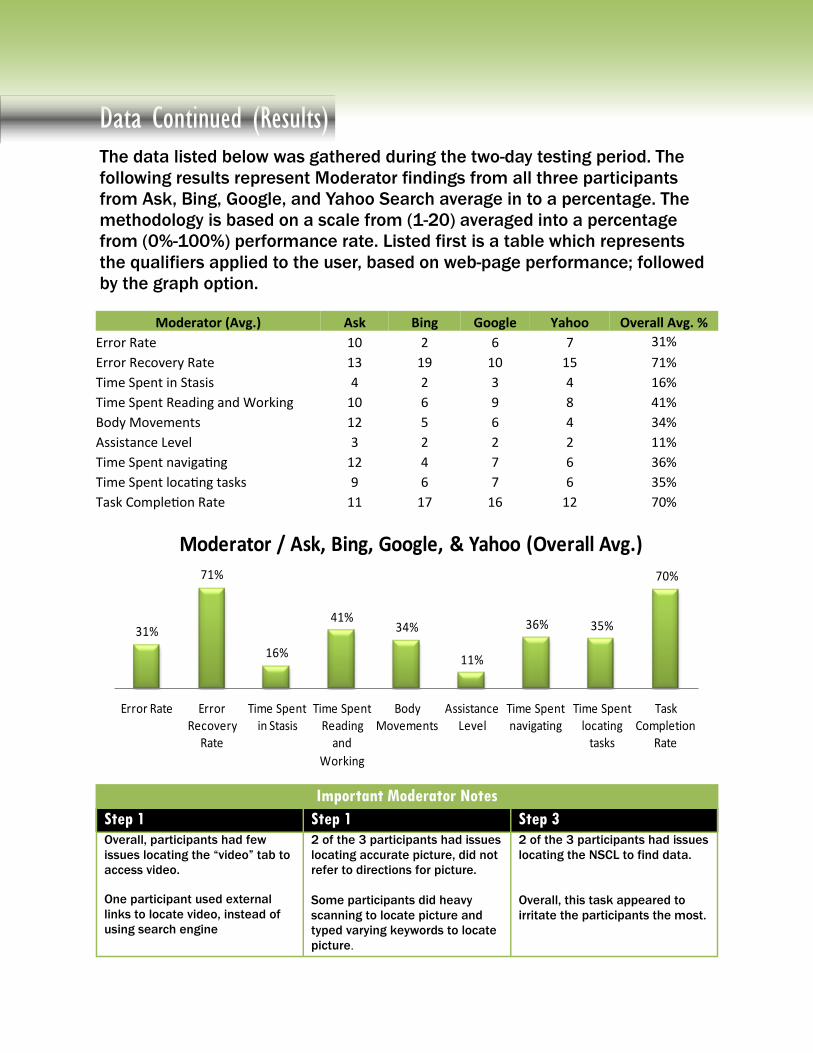
Moderator (Avg.) Ask Bing Google Yahoo Overall Avg. %
Error Rate 10 2 6 7 31%
Error Recovery Rate 13 19 10 15 71%
Time Spent in Stasis 4 2 3 4 16%
Time Spent Reading and Working 10 6 9 8 41%
Body Movements 12 5 6 4 34%
Assistance Level 3 2 2 2 11%
Time Spent navigating 12 4 7 6 36%
Time Spent locating tasks 9 6 7 6 35%
Task Completion Rate 11 17 16 12 70%
Data Continued (Results) The data listed below was gathered during the two-day testing period. The
following results represent Moderator findings from all three participants
from Ask, Bing, Google, and Yahoo Search average in to a percentage. The
methodology is based on a scale from (1-20) averaged into a percentage
from (0%-100%) performance rate. Listed first is a table which represents
the qualifiers applied to the user, based on web-page performance; followed
by the graph option.
31%
71%
16%
41%34%
11%
36% 35%
70%
Error Rate Error Recovery
Rate
Time Spent in Stasis
Time Spent Reading
and
Working
Body Movements
Assistance Level
Time Spent navigating
Time Spent locating
tasks
Task Completion
Rate
Moderator / Ask, Bing, Google, & Yahoo (Overall Avg.)
Important Moderator Notes
Step 1 Step 1 Step 3
Overall, participants had few
issues locating the “video” tab to
access video.
One participant used external
links to locate video, instead of
using search engine
2 of the 3 participants had issues
locating accurate picture, did not
refer to directions for picture.
Some participants did heavy
scanning to locate picture and
typed varying keywords to locate
picture.
2 of the 3 participants had issues
locating the NSCL to find data.
Overall, this task appeared to
irritate the participants the most.
Data Continued (Results)
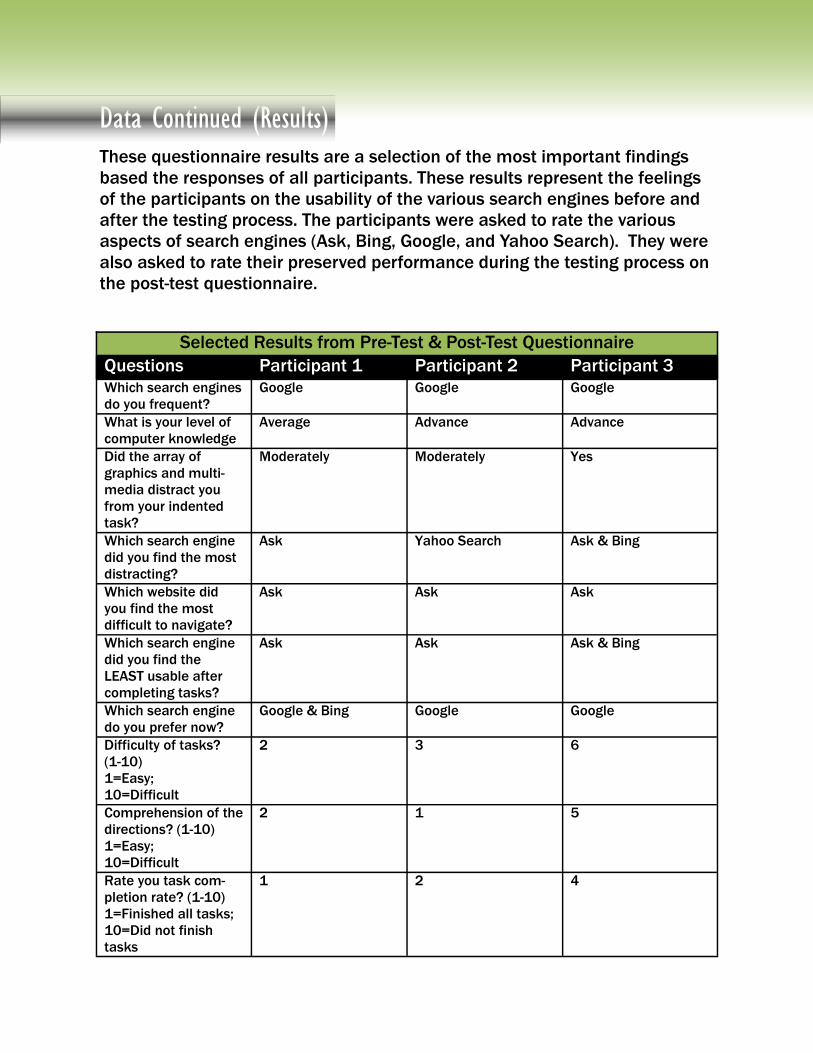
Selected Results from Pre-Test & Post-Test Questionnaire
Questions Participant 1 Participant 2 Participant 3 Which search engines
do you frequent? Google Google Google
What is your level of
computer knowledge Average Advance Advance
Did the array of
graphics and multi-
media distract you
from your indented
task?
Moderately Moderately Yes
Which search engine
did you find the most
distracting?
Ask Yahoo Search Ask & Bing
Which website did
you find the most
difficult to navigate?
Ask Ask Ask
Which search engine
did you find the
LEAST usable after
completing tasks?
Ask Ask Ask & Bing
Which search engine
do you prefer now? Google & Bing Google Google
Difficulty of tasks?
(1-10) 1=Easy;
10=Difficult
2 3 6
Comprehension of the
directions? (1-10) 1=Easy;
10=Difficult
2 1 5
Rate you task com-
pletion rate? (1-10)
1=Finished all tasks; 10=Did not finish
tasks
1 2 4
These questionnaire results are a selection of the most important findings
based the responses of all participants. These results represent the feelings
of the participants on the usability of the various search engines before and
after the testing process. The participants were asked to rate the various
aspects of search engines (Ask, Bing, Google, and Yahoo Search). They were
also asked to rate their preserved performance during the testing process on
the post-test questionnaire.
Discussion Observers
From the information gathered by the observers, the (notes and data) would
indicate that they shared similar sentiment involving the performance of the
search engines, along with the participants outcomes. The observers noted
that all of the participants had late least a low to moderate error rate. This
would indicate the somewhere throughout the testing process, the
participants suffered some sort of lapse when attempting to complete tasks.
Also noted by the observers was the fact that the participants all scored low
according to the “Assistance Level.” This would indicate that the participant
either did not need secondary assistance and felt competent throughout the
testing period or were simply to intimidated to ask the moderator a question
for various reasons. Excluding the moderator, there was only one observer
located in the Usability Lab and the others were located in the opposite side
of the one-way mirror. This may have lessened the level in which the
participants would suffer from constant distraction. As far as the notes,
some of the observers indicated after the testing period, that the format of
the notes sheets were either too difficult or too long to keep up with the pace
of the participant. Taking notes and rating participants multiple times all
while monitoring the participant may have been to much for the observer.
Moderator
Based on the information gathered by the moderator, it became obvious the
there was a consistent trend of confusion or lack of understanding with the
set tasks. Though some of the participants understood how to navigate the
process; after completing “Ask.com” they would repeat the steps repetitively.
The issue arises when the participant does not refer routinely back to the
notes to make sure the tasks are being followed accurately. The four steps
are duplicates of one another which most likely lead to a lack of referring to
directions. The moderator did not intervene in the testing process to take
control of the outcome. The lack of intervention may of led the participant to
think they did not have to fully the tasks literally. There was only a few
moments during some tasks with some participants where the moderator
would help answer questions such as the “How to interpret some of the
directions and if the task or testing was completed.” The point of the
moderator being located in the same space as the participant is to keep
some control over the process without compromising the entire test.
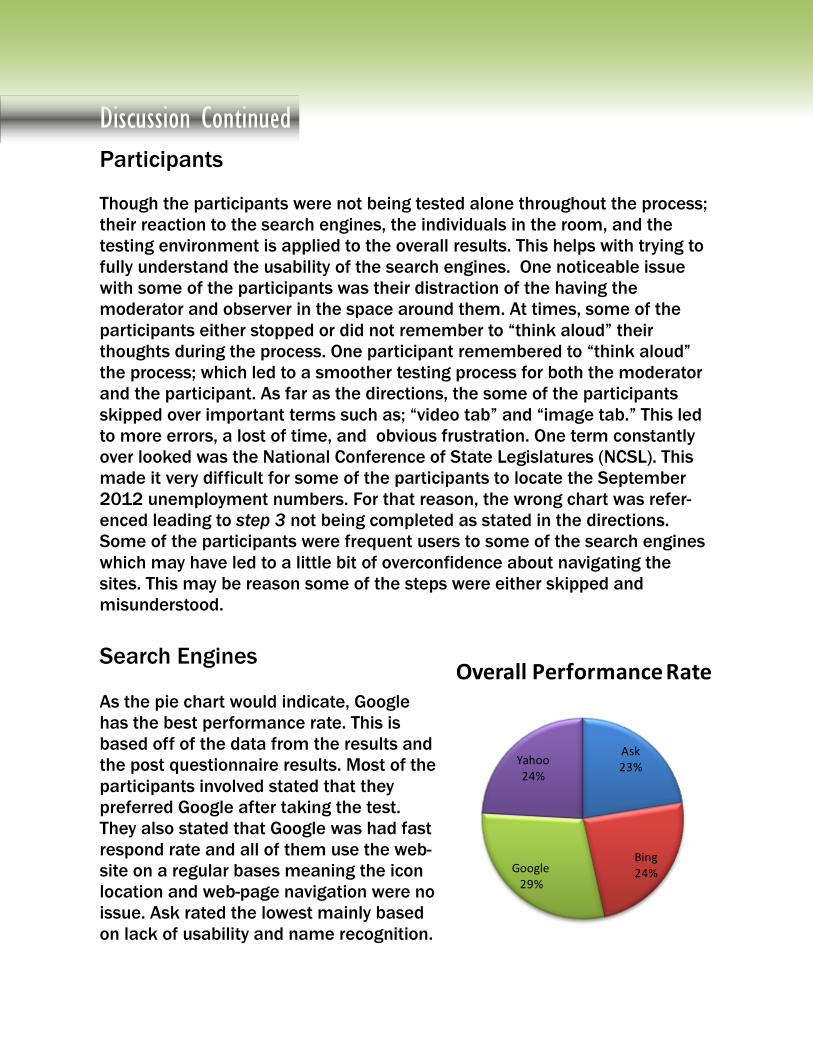
Ask23%
Bing24%Google
29%
Yahoo24%
Overall Performance Rate
Discussion Continued Participants Though the participants were not being tested alone throughout the process;
their reaction to the search engines, the individuals in the room, and the
testing environment is applied to the overall results. This helps with trying to
fully understand the usability of the search engines. One noticeable issue
with some of the participants was their distraction of the having the
moderator and observer in the space around them. At times, some of the
participants either stopped or did not remember to “think aloud” their
thoughts during the process. One participant remembered to “think aloud”
the process; which led to a smoother testing process for both the moderator
and the participant. As far as the directions, the some of the participants
skipped over important terms such as; “video tab” and “image tab.” This led
to more errors, a lost of time, and obvious frustration. One term constantly
over looked was the National Conference of State Legislatures (NCSL). This
made it very difficult for some of the participants to locate the September
2012 unemployment numbers. For that reason, the wrong chart was refer-
enced leading to step 3 not being completed as stated in the directions.
Some of the participants were frequent users to some of the search engines
which may have led to a little bit of overconfidence about navigating the
sites. This may be reason some of the steps were either skipped and
misunderstood.
Search Engines
As the pie chart would indicate, Google
has the best performance rate. This is
based off of the data from the results and
the post questionnaire results. Most of the
participants involved stated that they
preferred Google after taking the test.
They also stated that Google was had fast
respond rate and all of them use the web-
site on a regular bases meaning the icon
location and web-page navigation were no
issue. Ask rated the lowest mainly based
on lack of usability and name recognition.
Recommendations Users, Observers, and Moderators
(User) For future Usability Testing of any particular product, it would be more
informative if the users entered the process as novices and not experts.
Having this kind of method would allow the moderator to cover all areas that
would not be able covered if the user was an expert on the process.
(Observer) For more qualitative information, observers need to focus on
providing as much written content as possible. This will better help aid the
moderator on formulating a report with in-depth information on the
participant.
(Moderator) The moderator should be as involved in the testing process as
possible without compromising the integrity of the test. There may be times
during the process where the participant needs help completing tasks or is
not following directions to the fullest extent. There is a also the issue of
making the participant directions less complicated and more cognitive.
Recommendations Search Engine (Designers)
From the information provided by all parties during the testing process; it
would appear the Bing and Ask both have a high level of distraction. One of
the participants complained of Bing having too much content and
multimedia on the homepage. This led to them forgetting what they were on
the website to do and had to refer back to the directions to continue the test.
Yahoo just does not come across as search engine; rather an “all in one”
website where the user has to go to a secondary page to access the “Search”
only page. There were a few negative comments about Google but the search
engine is basically the default. Most users tend to go to Google before visiting
other websites. This repetitive habit can condition the user into getting used
to the product making it common.
Usability Testing Search Engines Evaluating the quantitative and qualitative findings
Designer: D’shaun Guillory
Professor: Michael Duncan, Ph.D
Testing Location: University of Houston-Downtown
Date: 14 December, 2012