Embed Size (px)
Citation preview
Using The Short Fuse Composite to Forecast Using The Short Fuse Composite to Forecast Severe Convection:Severe Convection:
Part II – “The Next Generation,” Updating the Technique
By Jim Johnson & Mike UmscheidNWS Dodge City, KS
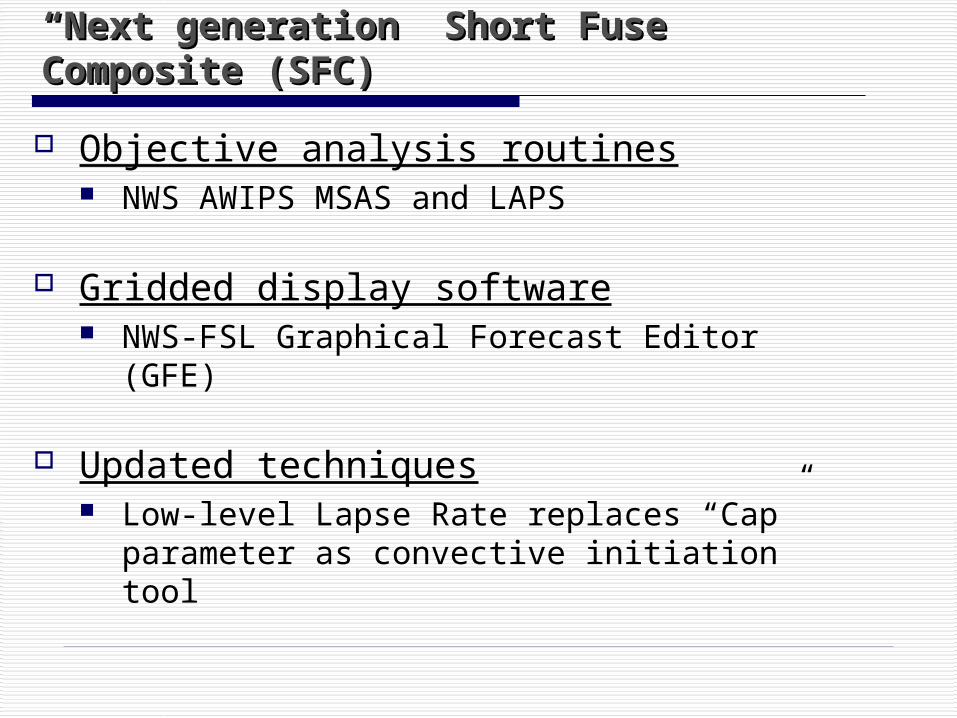
““Next generation” Short Fuse Next generation” Short Fuse Composite (SFC)Composite (SFC)
Objective analysis routines NWS AWIPS MSAS and LAPS
Gridded display software NWS-FSL Graphical Forecast Editor (GFE)
Updated techniques Low-level Lapse Rate replaces “Cap”
parameter as convective initiation tool

Components of the SFC Components of the SFC
Surface Moisture Flux Convergence Calculated from hourly MSAS grids (g/kg/hr * 100)
Potential Temperature Advection Native pot. temp. adv. grid from hourly LAPS (K/hr *
100)
CAPE and ThetaE CAPE- Native grid from hourly LAPS (J/kg) ThetaE- Native grid from hourly LAPS (K)
Low Level Lapse Rate (0 to 2.5km AGL) Calculated from hourly LAPS grids (C/km * 10)
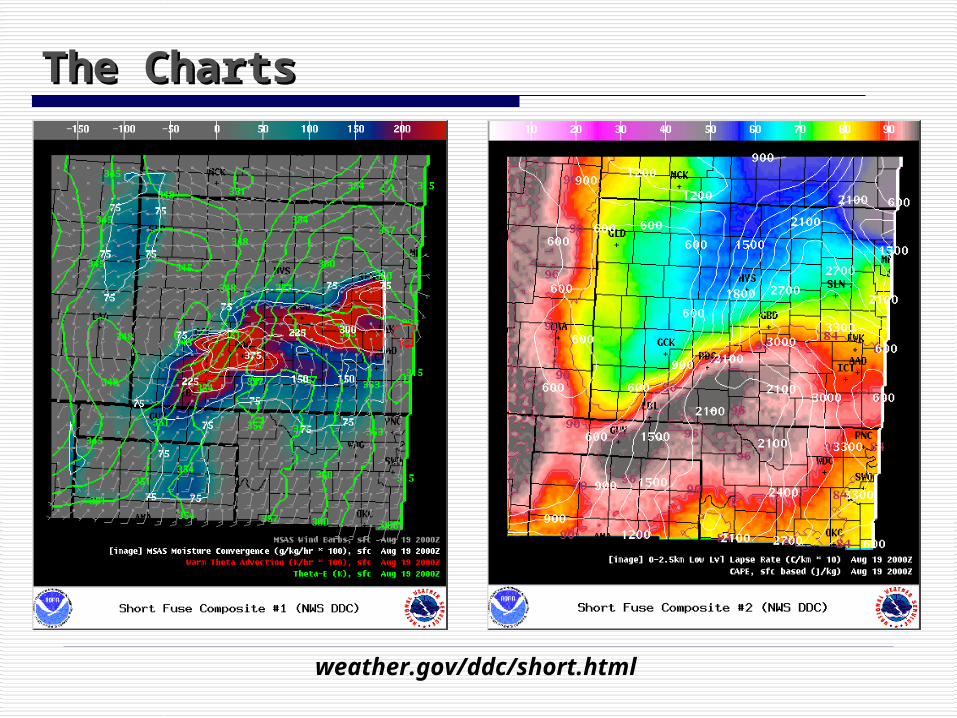
The ChartsThe Charts
weather.gov/ddc/short.html
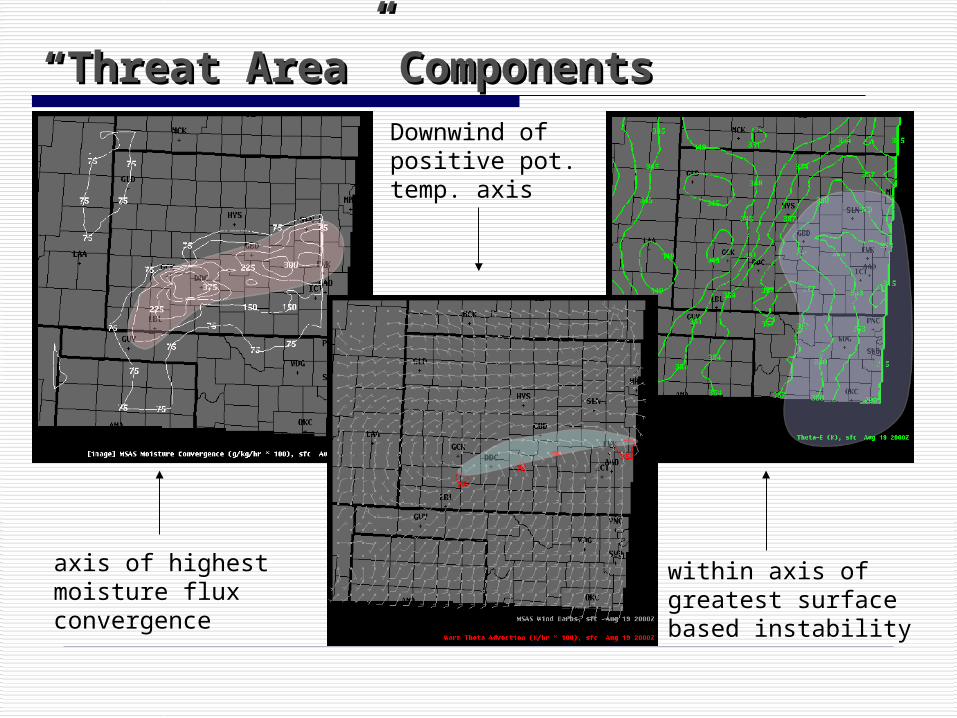
““Threat Area” ComponentsThreat Area” Components
axis of highestmoisture flux convergence
Downwind of positive pot. temp. axis
within axis of greatest surface based instability
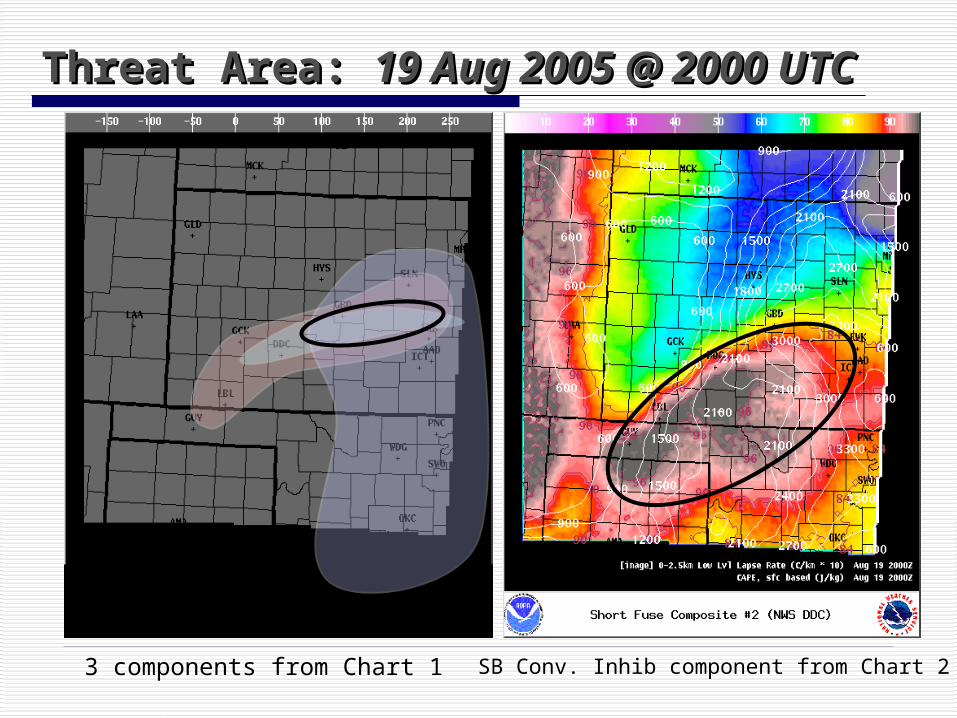
Threat Area: Threat Area: 19 Aug 2005 @ 2000 19 Aug 2005 @ 2000 UTCUTC
3 components from Chart 1 SB Conv. Inhib component from Chart 2
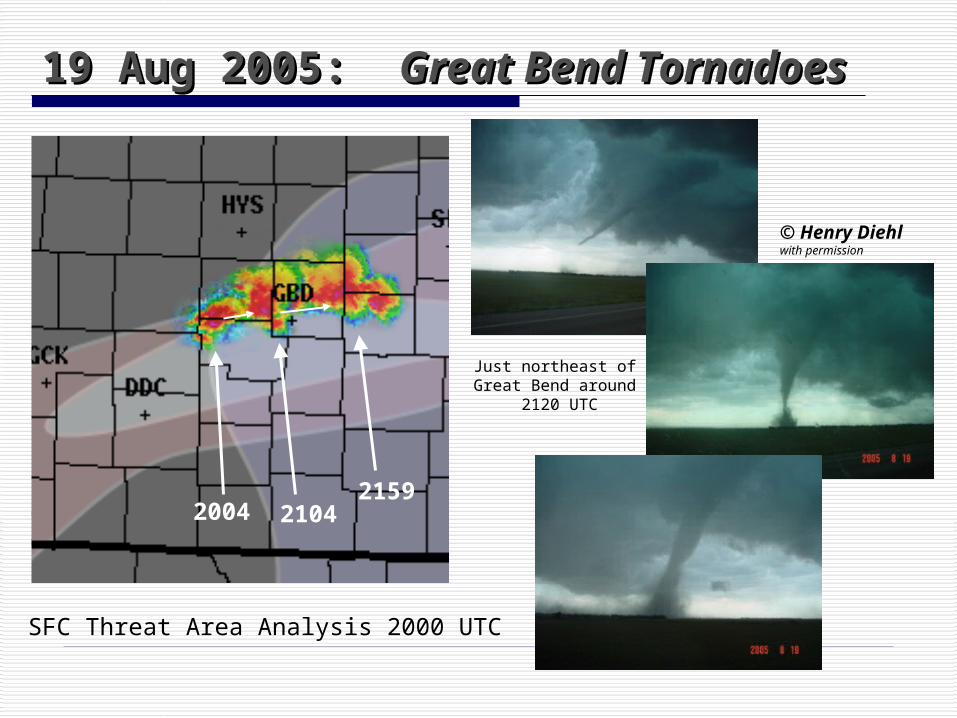
19 Aug 2005: 19 Aug 2005: Great Bend Great Bend TornadoesTornadoes
SFC Threat Area Analysis 2000 UTC
2004 21042159
© Henry Diehlwith permission
Just northeast of Great Bend around
2120 UTC
A few more 2005 cases. . .A few more 2005 cases. . .
April 10 (local tornado outbreak) “cold core” upper low setup with advancing dry
intrusion
June 9 (local tornado outbreak) Traditional southwest flow setup ahead of broad
upper trough
July 3 (long-lived monster supercell) Elevated supercell transitioning to surface based
supercell

Threat Area: Threat Area: 10 Apr 2005 @ 1800 10 Apr 2005 @ 1800 UTCUTC
Radar imagery 1904 UTC
1900 UTCweak tornado west of
Scott State Lake
3 components from Chart 1

Threat Area: Threat Area: 10 Apr 2005 @ 2000 10 Apr 2005 @ 2000 UTCUTC
3 components from Chart 1
Radar imagery 2059 UTC
Multiple tornadoes from 2 storms in
Trego County from 2135 to 2205 UTC
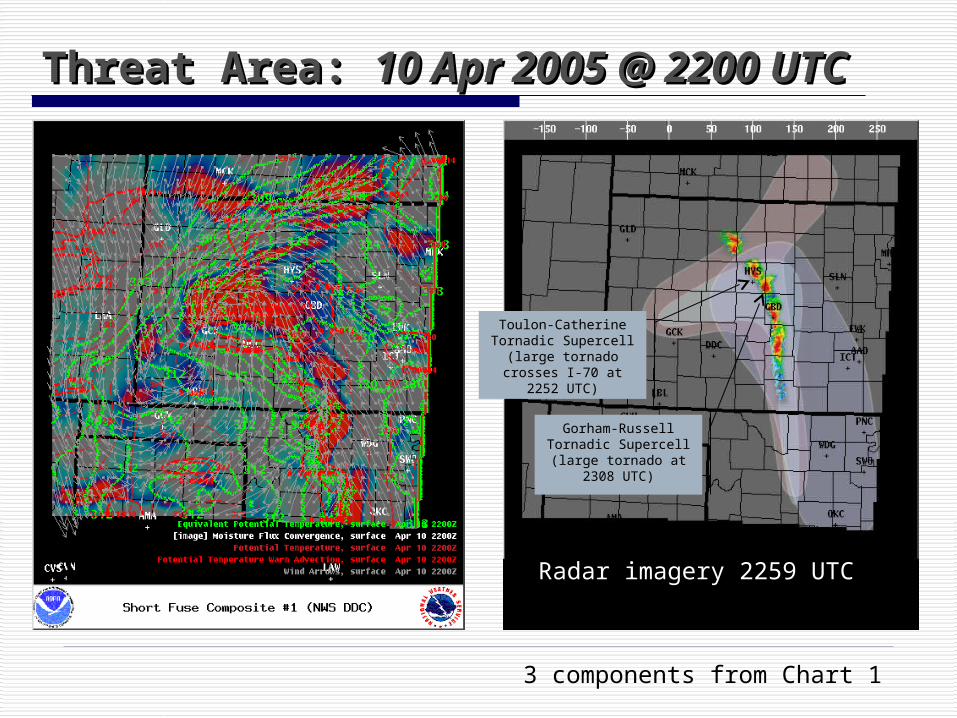
Threat Area: Threat Area: 10 Apr 2005 @ 2200 10 Apr 2005 @ 2200 UTCUTC
Radar imagery 2259 UTC
3 components from Chart 1
Gorham-Russell Tornadic Supercell (large tornado at
2308 UTC)
Toulon-Catherine Tornadic Supercell
(large tornado crosses I-70 at 2252
UTC)
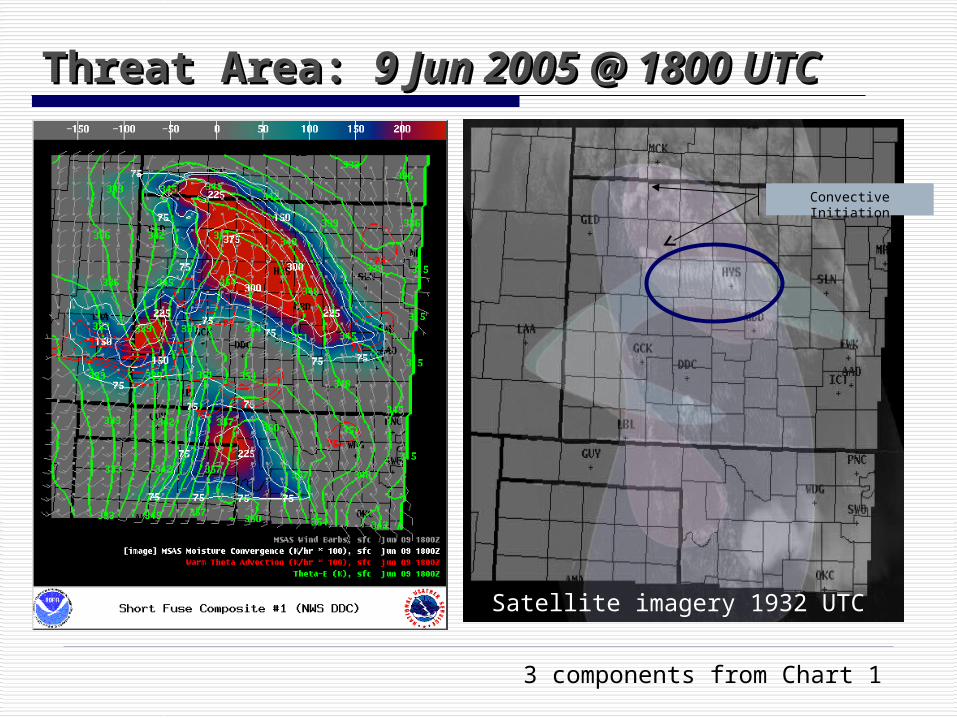
Threat Area: Threat Area: 9 Jun 2005 @ 1800 9 Jun 2005 @ 1800 UTCUTC
Satellite imagery 1932 UTC
3 components from Chart 1
Convective Initiation
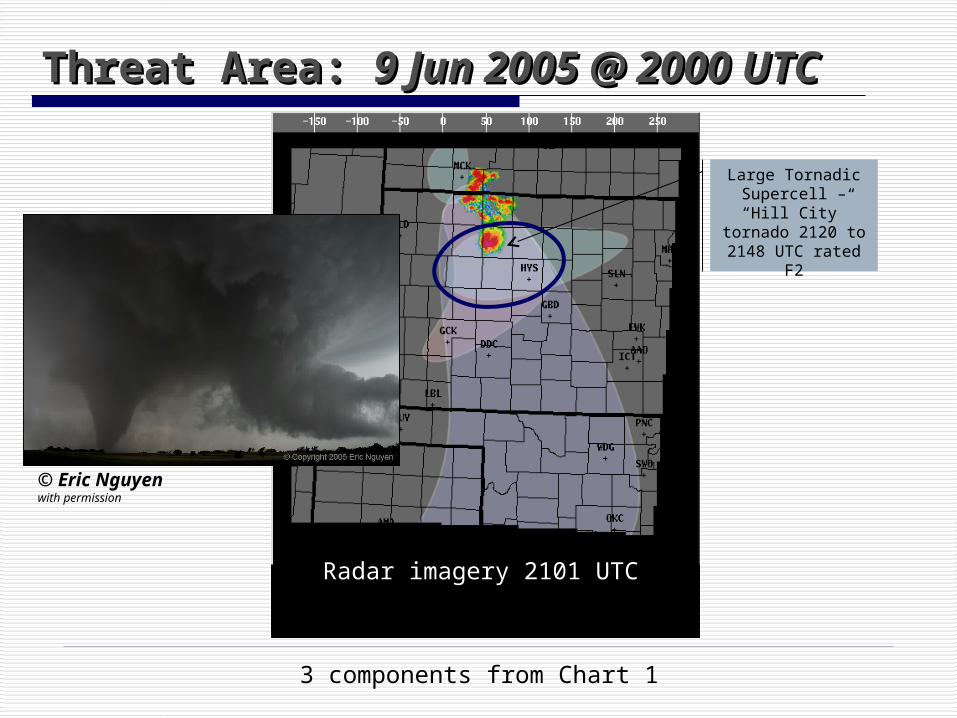
Threat Area: Threat Area: 9 Jun 2005 @ 2000 9 Jun 2005 @ 2000 UTCUTC
Large Tornadic Supercell – “Hill City” tornado
2120 to 2148 UTC rated F2
3 components from Chart 1
Radar imagery 2101 UTC
© Eric Nguyenwith permission
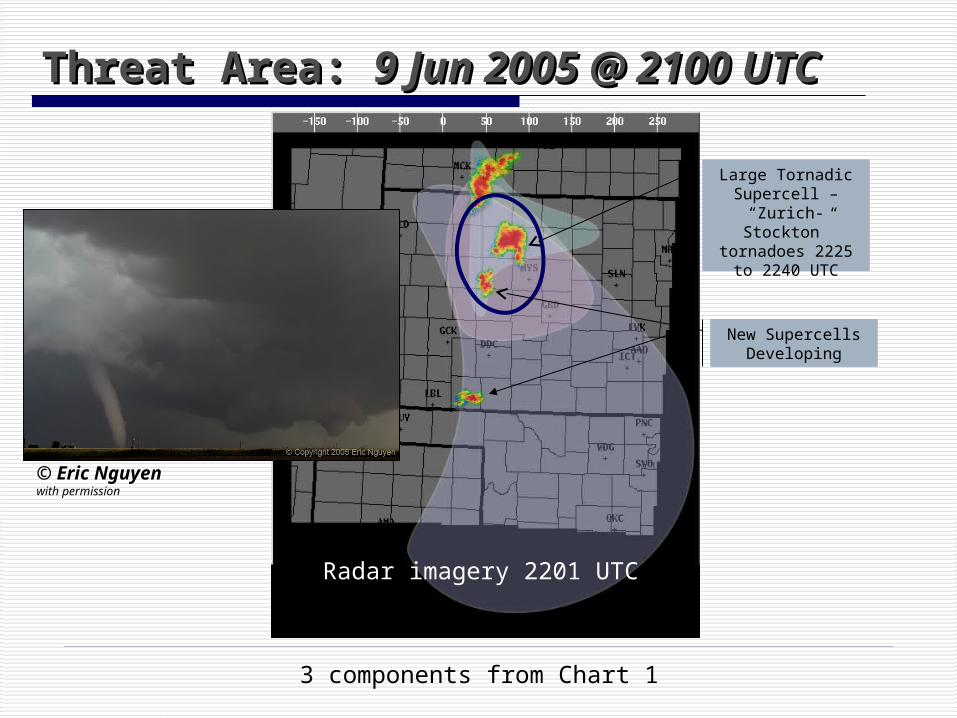
Threat Area: Threat Area: 9 Jun 2005 @ 2100 9 Jun 2005 @ 2100 UTCUTC
Large Tornadic Supercell –
“Zurich-Stockton” tornadoes 2225 to
2240 UTC
New SupercellsDeveloping
Radar imagery 2201 UTC
3 components from Chart 1
© Eric Nguyenwith permission
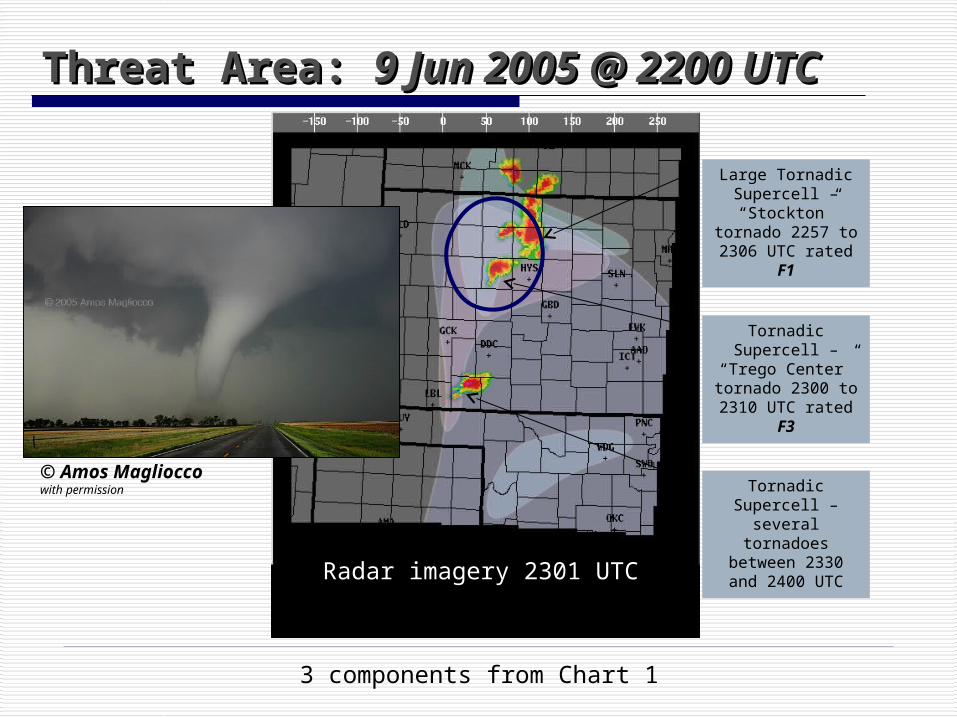
Threat Area: Threat Area: 9 Jun 2005 @ 2200 9 Jun 2005 @ 2200 UTCUTC
Large Tornadic Supercell – “Stockton”
tornado 2257 to 2306 UTC rated
F1
Radar imagery 2301 UTC
Tornadic Supercell – “Trego Center” tornado 2300 to 2310 UTC rated
F3
Tornadic Supercell – several tornadoes
between 2330 and 2400 UTC
3 components from Chart 1
© Amos Maglioccowith permission
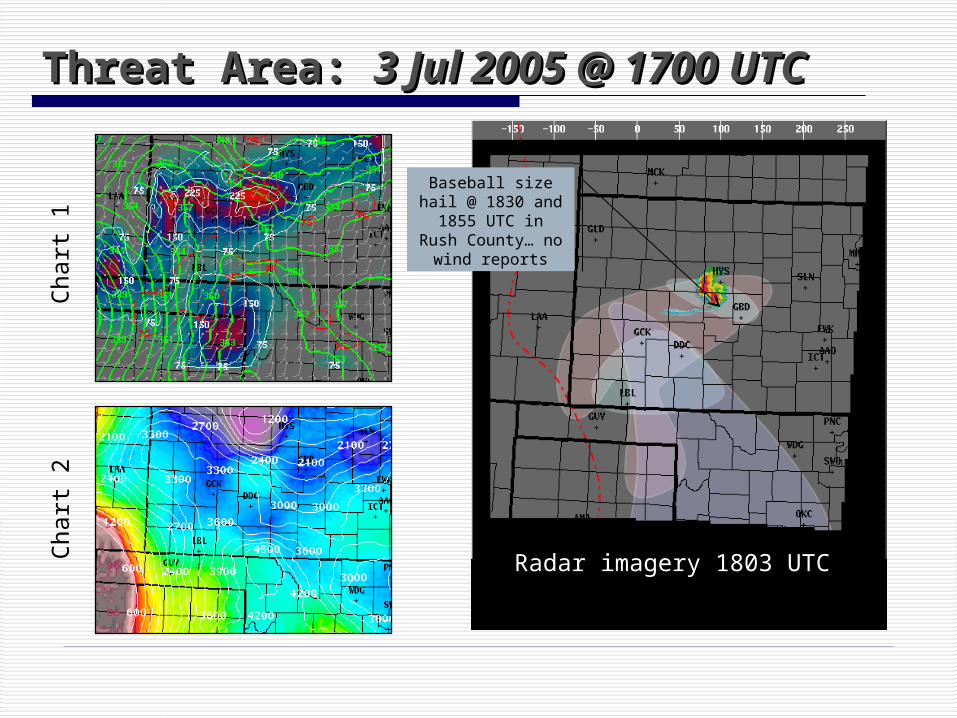
Threat Area: Threat Area: 3 Jul 2005 @ 1700 3 Jul 2005 @ 1700 UTCUTC
Radar imagery 1803 UTC
Chart
1C
hart
2
Baseball size hail @ 1830 and 1855
UTC in Rush County… no wind
reports
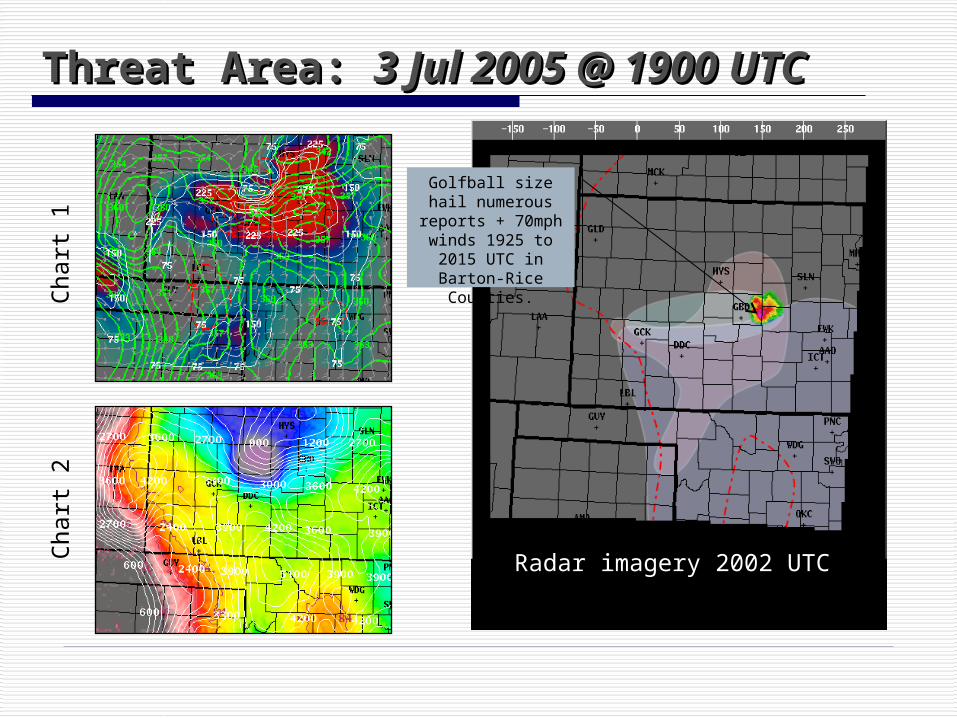
Threat Area: Threat Area: 3 Jul 2005 @ 1900 3 Jul 2005 @ 1900 UTCUTC
Radar imagery 2002 UTC
Chart
1C
hart
2
Golfball size hail numerous reports + 70mph winds
1925 to 2015 UTC in Barton-Rice
Counties.
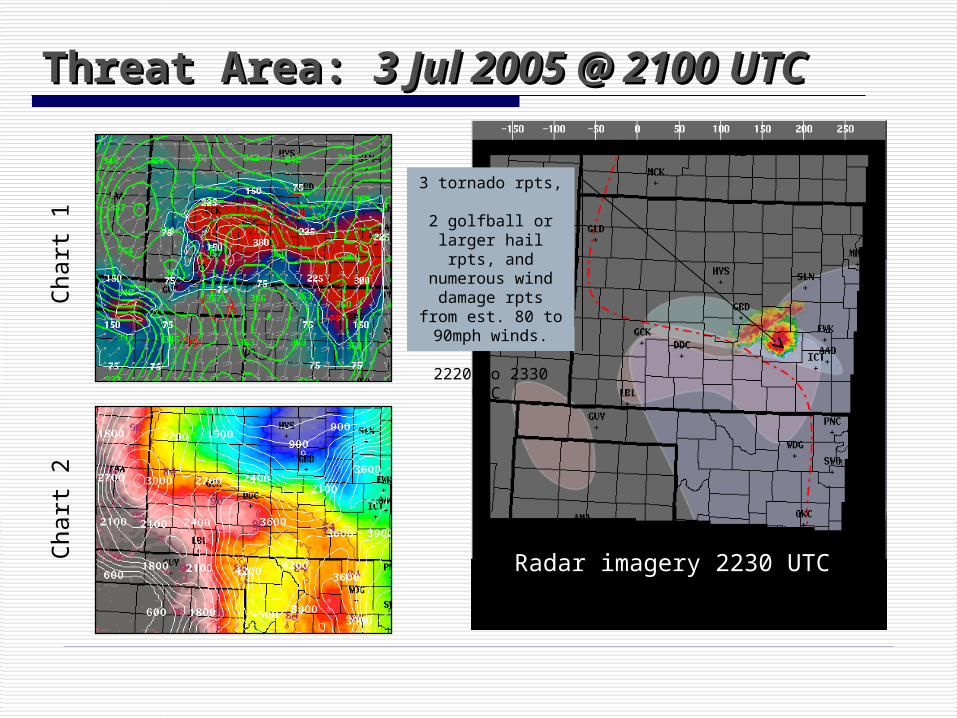
Threat Area: Threat Area: 3 Jul 2005 @ 2100 3 Jul 2005 @ 2100 UTCUTC
Radar imagery 2230 UTC
Chart
1C
hart
2
3 tornado rpts, 2 golfball or larger
hail rpts, and numerous wind
damage rpts from est. 80 to 90mph
winds.
2220 to 2330 UTC
Future WorkFuture Work
Network of local office SFC Operational version 1.0 on AWIPS LAD NWS Goodland, KS first office outside of
DDC to implement http://weather.gov/gld/short
Improvements Web-based looping feature Chart 3: Empirical “Threat Area”
development?NWS DDC Short Fuse Composite website – http://weather.gov/ddc/short.html
Questions & Comments?Questions & Comments?
Thank You!Thank You!
© Mike Umscheid