Embed Size (px)
DESCRIPTION
MC based Potentiometric detection. NO CANTILEVER COATING. Displacement, a = (F /k) Q. The total capacitive force,. V ac sin 0 t. V DC. Tip sample capacitive force, Fcap=F0+F +F2. Only component is extracted. - PowerPoint PPT Presentation
Citation preview

Slide #
Vacsin0t
VDC
Tip sample capacitive force,
Fcap=F0+F+F2
Displacement,
a= (F/k) Q
• The total capacitive force,
G. Koley, M. Qazi, L. Laxminayaranan, and T. G. Thundat, "Gas Sensing using Electrostatic Force Potentiometry", Appl. Phys.Lett. 90, 173105 (2007).
NO CANTILEVER COATING
1
Only component is extracted

Slide #
VACsin0t
VDC
The displacement Amplitude,
k
QVφV
z
Cacdc
G. Koley, M. Qazi, L. Laxminayaranan, and T. G. Thundat, "Gas Sensing using Electrostatic Force Potentiometry", Appl. Phys.Lett. 90, 173105 (2007).
2
When molecules adsorb on the surface

Slide #G. Koley, M. Qazi, L. Laxminayaranan, and T. G. Thundat, "Gas Sensing using Electrostatic Force Potentiometry", Appl. Phys.Lett. 90, 173105 (2007).
3
Assume a noise limited deflection sensitivity of 0.1 nm at resonance, calculate the work function resolution that can be detected. What is the fixed charge density that can be sensed? Assume Q = 50, Vac = 5 V rms, and k = 0.1 N/m.

Slide #4
Molecular Adsorption
Surface Work Function Change
Capacitive Force (F) Change
Oscillation amplitude Change
Transduction

Slide #
Sample Functionalization:
Less complicated No need to replace the cantilever Single cantilever can oscillate over
different sensing layers and detect
Only surface property change matters:
SWF is a surface electrical property. Hence, bulk conductivity is does not affect the response
Sensitivity can be tuned:
By spring constant, k; external voltages Vac and Vdc; the cantilever sample separation, d
5
k
QVφV
z
Ca acdc

Slide #
AFM BASED EXPERIMENTAL SETUP
GAS FLOW FIXTURE
Surface Work Function measurements are performed Optical transduction is applied through laser and PSPD Sensing was performed in ambient conditions
6
GAS FLOW
Slide #
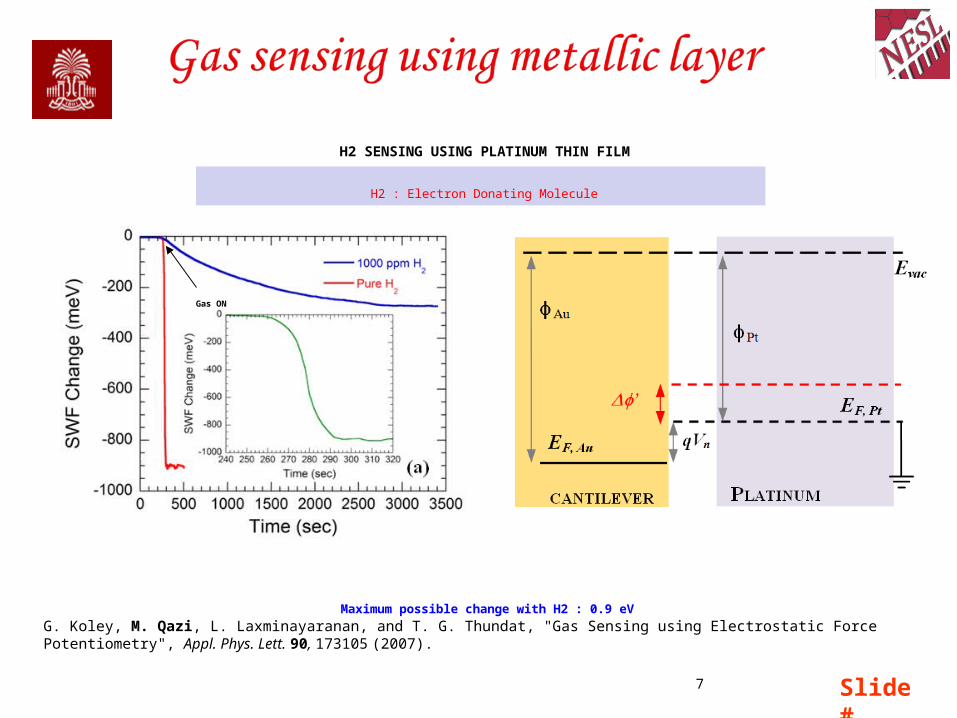
G. Koley, M. Qazi, L. Laxminayaranan, and T. G. Thundat, "Gas Sensing using Electrostatic Force Potentiometry", Appl. Phys. Lett. 90, 173105 (2007).
Maximum possible change with H2 : 0.9 eV
H2 SENSING USING PLATINUM THIN FILM
7
H2 : Electron Donating Molecule
Gas ON
Slide #
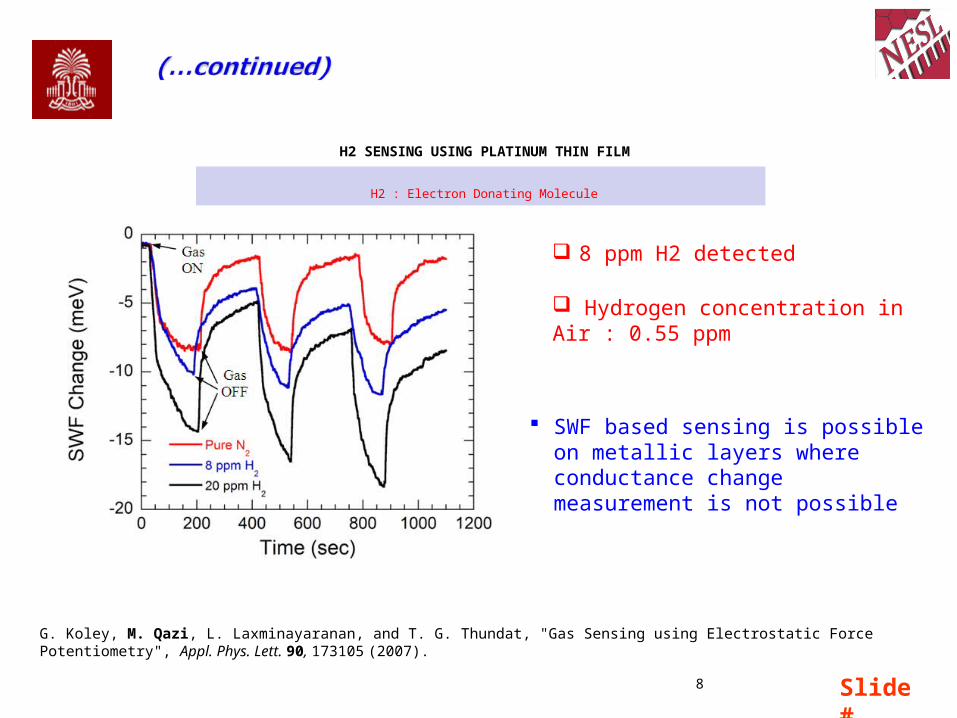
G. Koley, M. Qazi, L. Laxminayaranan, and T. G. Thundat, "Gas Sensing using Electrostatic Force Potentiometry", Appl. Phys. Lett. 90, 173105 (2007).
8 ppm H2 detected
Hydrogen concentration in Air : 0.55 ppm
H2 SENSING USING PLATINUM THIN FILM
8
SWF based sensing is possible on metallic layers where conductance change measurement is not possible
H2 : Electron Donating Molecule

Slide #9
Si piezoresistive microcantilever
9
n – type (001) Si
Piezoresistors longitudinal πl , transverse πt
yL
HEVVG 2
3
Readout of Wheatstone bridge VG
y: deflection; ξ: average piezoresistive coefficient ; F: force ; V: applied voltage on Wheatstone bridge; E: Young’s modulus, L:
length, H: thickness
1111070)(*2/1 PaTL
R3R2
R1 R4
R1R2R4
R3
ttlloR
R
Piezoresistors in [110] or [110]
Tip bias->oscillate microcantilever

Slide #
0
5 10-7
1 10-6
1.5 10-6
2 10-6
0 50 100 150 200 250 300
Str
ain
Position along length (m)
0
5 104
1 105
1.5 105
2 105
2.5 105
3 105
3.5 105
0 50 100 150 200 250 300
Str
ess
(P
a)
Position along length (m)
10
Finite Element Simulations
Stress and strain analysis
10
Force applied at the center
x
Analytical
COMSOL
Strain
Deviation from analytical
results due to finite
dimensions of the
cantilever
Stress
L = 300 µm
W = 140 µm
H = 2 µm
E = 179 GPa
F = 100 nN
Ρ = 2330 kg/m3
Ex F
WH
xLx 2
)(6
Analytical
COMSOL
Slide #11
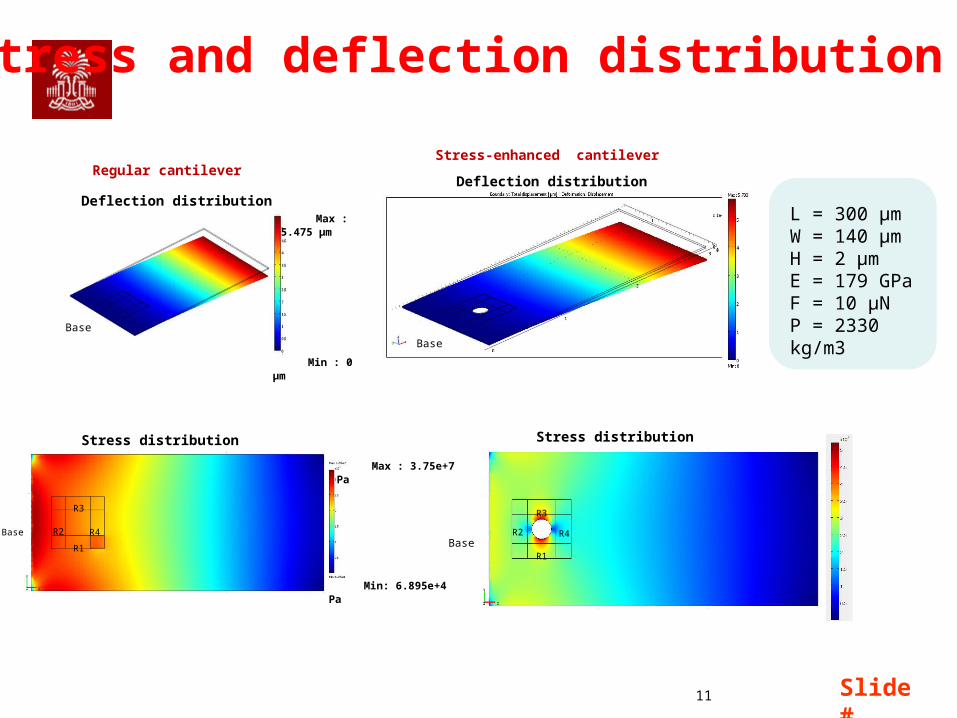
Min : 0 µm
Min: 6.895e+4 Pa
Max : 3.75e+7 Pa
Max : 5.475 µm
Stress distribution
Deflection distribution
Deflection distribution
Stress distribution
3D Stress and deflection distribution analysis
Base
Base
BaseBase
R3
R1
R2 R4
R3
R2
R1
R4
L = 300 µmW = 140 µmH = 2 µmE = 179 GPaF = 10 μN Ρ = 2330 kg/m3
Regular cantilever Stress-enhanced cantilever


![revista sin nombre [nº 0]](https://img.pdfslide.tips/doc/110x75/568bd8d51a28ab2034a4cf5e/revista-sin-nombre-no-0.jpg)