Embed Size (px)
Citation preview
Plasma and Fusion Research: Regular Articles Volume 9, 1401056 (2014)
Validation of Spectroscopic Model for Fe Ions in Non-EquilibriumIonization Plasma in LHD and Hinode∗)
Izumi MURAKAMI1,2), Tetsuya WATANABE3,4), Chihiro SUZUKI1), Shigeru MORITA1,2),Chunfeng DONG1), Naoki TAMURA1), Norimasa YAMAMOTO5), Daiji KATO1,2),
Hiroyuki A. SAKAUE1), Hirohisa HARA3,4), Nobuyuki NAKAMURA6)
and Shigeru SUDO1,2)
1)National Institute for Fusion Science, Toki, Gifu 509-5292, Japan2)Department of Fusion Science, The Graduate University of Advanced Studies (SOKENDAI), Toki, Gifu 509-5292, Japan
3)National Astronomical Observatory of Japan, Mitaka, Tokyo 181-8588, Japan4)Department of Astronomical Science, The Graduate University of Advanced Studies (SOKENDAI), Mitaka, Tokyo
181-8588, Japan5)Center of Applied Superconductivity and Sustainable Energy Research, Chubu University, Kasugai, Aichi
487-8501, Japan6)Institute for Laser Science, The University of Electro-Communications, Chofu, Tokyo 182-8585, Japan
(Received 25 September 2013 / Accepted 16 February 2014)
We measured extreme ultraviolet spectra of Fe ions for plasmas produced in the Large Helical Device(LHD) at the National Institute for Fusion Science (NIFS). Iron was injected into the plasmas by using a tracer–encapsulated pellet. By controlling the neutral beam injection pattern, we could produce plasma with a centralelectron temperature of approximately 500 eV, which was suitable for producing Fe XVII ions. We measuredseven Fe XVII lines. The intensity ratio for λ of 20.468 to 25.493 nm was consistent with the theoretically cal-culated value of 1.1. This calculated value was determined purely from the branching ratio due to the commonupper level of these transitions, although Warren et al. [Astrphys. J. 685, 1277 (2008)] reported a larger ratio ofapproxinately 2 from Hinode EIS measurements. The other five ratios for Fe XVII lines in our LHD measure-ments were also consistent with the theoretical ratios calculated with a collisional–radiative model. A preferredatomic dataset for Fe XVII is suggested to obtain better agreement between the measured and calculated ratios.
c© 2014 The Japan Society of Plasma Science and Nuclear Fusion Research
Keywords: Fe XVII spectral lines, spectroscopic diagnostics, EUV spectrum, solar plasma, fusion plasma
DOI: 10.1585/pfr.9.1401056
1. IntroductionIn solar physics, one of the major issues to be solved
is the identification of the heating mechanism that keepsthe hot and diffuse corona, extending above the Sun’s coolatmosphere at its high temperature of a few million de-grees. Since 2006, the Hinode spacecraft has been in or-bit to study the heating mechanism and dynamics of theactive solar corona, the origin of strong magnetic fields,and the trigger mechanism for solar flares [1]. Hinode isequipped with a solar optical telescope (SOT), an X-raytelescope (XRT), and an extreme ultraviolet (EUV) imag-ing spectrometer (EIS). The EIS takes EUV images of theSun as well as EUV spectra in the wavelength regions of17.0 - 21.0 nm and 25.0 - 29.0 nm [2]. In these regions, FeVIII–XXIV lines are measurable and are expected to pro-vide information on the solar plasma in the wide electrontemperature range 4.7 < log Te[K] < 7.2.
author’s e-mail: [email protected]∗) This article is based on the invited talk at the 29th JSPF Annual Meeting(2012, Fukuoka).
Several models have been proposed to explain coro-nal heating by acoustic waves, Alfvén body waves, mi-croflares, etc [3]. Conventional one-fluid MHD plasmain thermal equilibrium has been used for modeling so-lar plasma. Typical ions observed in the solar transitionregion and the corona have long ionization and recom-bination timescales, and non-equilibrium ionization hasbeen suggested especially for plasma with flow [4] or so-lar flares [5]. When the ionization timescale is longer thanthe time required for an ion to traverse a temperature scaleheight, the degree of ionization is delayed behind the equi-librium value under local conditions. In the solar transi-tion region, the electron temperature and density changedrastically, and non-equilibrium conditions can result fromdownflows or outflows in the transition region. Dupree etal. [4] showed that the electron temperature dependencesof O IV, N IV, and C IV spectral-line intensity ratios arealtered when plasma is in non-equilibrium with outflowsin the transition region. Imada et al. [6] found that the Feion state distribution is quite different from that for ion-
c© 2014 The Japan Society of PlasmaScience and Nuclear Fusion Research
1401056-1
Plasma and Fusion Research: Regular Articles Volume 9, 1401056 (2014)
ization equilibrium when time-dependent ionization andrecombination processes are considered in the shock re-gion caused by magnetic reconnection. Thus, when ana-lyzing the spectroscopic data, we need to focus on phys-ical conditions of plasma, such as flows and shocks. Inaddition, non-thermal velocities measured as an excess ofline thermal broadening are thought to be caused by tur-bulence, waves, or velocity gradients; those velocities pro-vide important information for examining the coronal heat-ing mechanism [7]. Doscheck et al. [7] and Imada et al. [8]estimated non-thermal velocities in the solar active regionby using Fe XII and Fe XVI lines, and obtained values of30 - 60 km s−1 and approximately 13 km s−1, respectively.Such estimates depend on the accuracy of thermal condi-tion determination for plasmas.
The accuracy of the analyzed results from spectro-scopic measurements depends on that of the spectroscopicmodel and the atomic data used in the model. As Hin-ode EIS measures Fe VIII–XXIV lines for plasma diag-nostics as good indices for the solar transition region overa wide electron temperature range, we have constructedcollisional–radiative (CR) models for Fe7+–Fe23+ ions toanalyze both solar and laboratory plasmas [9–14]. We havecarefully examined atomic data of Fe ions to be used in theCR models [15, 16], and so far, have applied the models tothe measurements of laboratory plasmas to validate the CRmodels and atomic data for Fe XIII [9,14], Fe XIV [14], FeXV [14], Fe XXI [12], and Fe XXII [13].
The Large Helical Device (LHD) in the National In-stitute for Fusion Science (NIFS) was used to validate theCR models and atomic data of Fe ions. The LHD canmaintain stable plasmas even after impurity elements areinjected by an impurity pellet or a tracer-encapsulated pel-let (TESPEL) [17, 18]. The LHD has various diagnosticsystems for measuring electron temperature, density, andother plasma properties. LHD plasmas have electron tem-perature distributions from a few electron volts in the pe-ripheral region to approximately 4 keV in the plasma cen-ter. We can produce plasmas in the LHD with electrontemperatures similar to those in the solar transition regionand the corona. Thus, we used a TESPEL to inject ironinto LHD plasmas and measured EUV spectra to comparewith the model calculations [9, 12, 13]. The CR model forFe XIII evaluated using the LHD experiments [9] has beenapplied to analyze solar spectra measured by Hinode EISto estimate the electron density distribution in the solar ac-tive region [11].
We also used an electron beam ion trap (EBIT) deviceand compact EBITs (CoBITs) at the University of Electro-Communications (UEC) and NIFS [19, 20]. An EBIT ion-izes ions by an electron beam and traps them with an elec-tric field of the electron beam. It produces diffuse plasmawith an electron density of approximately 1010cm−3. Itcontrols the ion charge distribution by choosing the elec-tron beam energy, and the charge states of spectral linescan be identified easily as only ions with ionization po-
tentials smaller than the electron beam energy are pro-duced. EUV spectral lines of Fe XIII, Fe XIV, and Fe XVwere measured by the CoBIT at the UEC and comparedwith the CR model calculations [14]. Electron density de-pendence of line ratios for Fe XIII and Fe XIV agreedvery well with the CR model calculations, but the Fe XV23.39 nm/24.38 nm ratio was a factor 1.5 - 2 larger than thatobtained from the model calculation. To find the causeof this discrepancy, we need to examine measurements,atomic data, and the CR model even more carefully.
Here we focus on Fe XVII. Recently, Fe XVII spec-tral lines were measured by Hinode EIS and discrepanciesfrom theoretical predictions were reported for the intensityratios of Fe XVII 20.4675 nm (2p5 3s 1P1–2p5 3p 1S0) and25.4885 nm (2p5 3s 3P1–2p5 3p 1S0) [21]. The upper levelsof both transitions are the same (2p5 3p 1S0), so the inten-sity ratio is determined by the branching ratio of 1.1 anddoes not depend on plasma conditions for optically thinplasma. However, the measured ratio was 2.5. In addition,other Hinode EIS results for this line ratio for the solaractive region also show this discrepancy; the ratio tendsto increase with decreasing electron temperature [22]. Thesame lines were measured previously in solar-flare spec-tra by Skylab and the ratio was 1.1, which agreed with thetheoretical prediction [23]. Del Zanna and Ishikawa [24]made a list of Fe XVII EUV lines based on two HinodeEIS measurements, and also reported a discrepancy withrespect to theoretical calculations for this line ratio. Theysuggested that the 20.466-nm line was blended with anunidentified line at 20.472 nm, with the same morphologyas the Fe VIII line in the monochromatic images taken byHinode EIS.
In order to use the Fe XVII lines for diagnosing high-temperature solar active region, the validation of theatomic data for Fe XVII is needed. Jönsson et al. [26]performed theoretical calculations for the Fe XVII atomicstructure by using the GRASP2K code, which is widelyused for theoretical studies of atoms and is believed tohave a high accuracy [25]. Relativistic effects were care-fully considered in configuration interaction calculations.The results obtained for the branching ratio of the two FeXVII lines agreed with the previous prediction [26].
In this study, we used LHD plasmas to measure the FeXVII spectral lines for validation of the atomic data andthe CR model for Fe XVII experimentally and to investi-gate the discrepancy in the Fe XVII line ratio between the-oretical predictions and Hinode EIS measurements. Thesetwo Fe XVII lines are very weak and were not detected us-ing CoBIT. In Sec. 2, we briefly introduce the CR model,followed by an explanation of the measurements with theLHD and the analysis in Sec. 3. In Secs. 4 and 5, we dis-cuss the results of validation of the CR model and HinodeEIS measurements. This study is summarized in Sec. 6.
1401056-2

Plasma and Fusion Research: Regular Articles Volume 9, 1401056 (2014)
2. Collisional–Radiative ModelThe spectral line intensity of the transition from level
i to level j is proportional to the product of the populationdensity of the upper level; radiative transition probability;and energy difference of the transition, n(i)Ar(i, j)ΔE(i, j).We constructed a CR model to calculate the populationdensities of excited states for an Fe ion using the quasi-steady-state approximation. We assumed that populationdensities of excited states relax fast enough, compared tothe timescales for changes in plasma properties and iondensities, and solved the rate equations for population den-sities as dn(i)/dt = 0. Excited states up to the principalquantum number n = 5 were considered, and a total of 157fine-structure levels were included. The rate equation iswritten as
dn(i)dt
=∑
j�i
{C( j, i)ne+Cp( j, i)np}n( j) +∑
j>i
Ar( j, i)n( j)
−∑
j�i
{C(i, j)ne +Cp(i, j)np + S (i)ne}n(i)
−∑
j<i
Ar(i, j)n(i). (1)
We included radiative decay (Ar(i, j)), electron-impact ex-citation and de-excitation (C(i, j)), electron-impact ioniza-tion (S (i)), and proton-impact excitation and de-excitation(Cp(i, j)) processes. Recombination processes were not in-cluded in this model because LHD plasmas are mostly inan ionizing plasma phase, and in such cases, recombina-tion processes are not important for the spectral analysis.Energy levels, transition probabilities, and electron-impactexcitation and ionization cross sections were calculatedwith the HULLAC atomic code [27]. Proton-impact ratecoefficients were taken from recommended data [15].
For comparison, we also calculated population den-sities and photon emissivity coefficients using the ADASpackage [28]. ADAS contains various atomic datasetsfor one ion; for comparison, we selected three differ-ent atomic datasets for energy levels, transition prob-abilities, and electron-impact excitation effective colli-sion strengths. Specifically, the selected datasets were“chv6” whose atomic data are taken from CHIANTI ver.6(245 levels) [29], “cpb06” whose excitation effective col-lision strengths are obtained by the Dirac-Fock R-matrixmethod (139 levels) [30], and “lgy09” whose excitationeffective collision strengths are obtained by the ICFT R-matrix method (209 levels) [31]. In the CHIANTI dataset,electron-impact excitation rate coefficients are calculatedby the distorted wave method and are included only for cer-tain selected transitions. The same atomic data of “cpb06”were used for the intensity calculations in [24].
3. LHD ExperimentsEUV spectra in the 10 - 30 nm wavelength range were
measured for plasmas in LHD using a flat-field EUV spec-trometer [32]. The spectrometer can cover a wavelengthrange of 5 - 50 nm using a laminar-type holographic grat-ing. Spectral resolution of approximately 0.02 nm wasachieved at 20 nm. A 0.15 µm thick aluminum filter wasplaced in front of the grating to screen out emissions inwavelengths below approximately 17 nm. This success-fully reduced the contamination of higher-order emissionlines, especially the second-order emission line of Fe XXIIat 10.22 nm, which could overlap with the Fe XVII line at20.468 nm. The exposure time of one frame was 5 ms. Anew technique for absolute intensity calibration was con-ducted using bremsstrahlung continuum radiation and abranching ratio of C IV lines [33].
We analyzed the spectra measured for the plasma ofshot number 107802. Figure 1 shows the temporal distri-bution of the discharge. Three tangential neutral beams(NBIs) were injected at t = 3.3 - 4.3 s, and two perpendic-ular neutral beams were injected at t = 4.2 - 6.2 s. Due tothese changes, the stored energy Wp and the central elec-tron temperature started decreasing drastically at t = 4.3 s,reached their minimum at around t = 5 s, and increasedagain. The minimum central electron temperature was
Fig. 1 Temporal evolution of shot 107802 discharge for NBIpower PNBI, stored energy Wp, line-averaged electrondensity 〈ne〉, electron temperature at geometrical centerTe(0), and total radiated power Prad.
1401056-3

Plasma and Fusion Research: Regular Articles Volume 9, 1401056 (2014)
Fig. 2 Electron temperature distributions (top) and electron den-sity distributions (bottom) measured by Thomson scatter-ing at t = 4.3 s (solid circles) and 4.9 s (open diamonds).
about 500 eV. Figure 2 shows the electron temperature anddensity distributions at t = 4.3 and 4.9 s. At t = 4.3 s, thecentral electron temperature was about 2 keV with a peakydistribution; at t = 4.9 s, the distribution flattened witha central electron temperature of approximately 500 eV.This temperature is suitable for Fe XVII measurements.At t = 3.8 s, a TESPEL doped with iron powder was in-jected. This instantly caused a large radiation power loss,but soon the loss became less effective. The electron tem-perature and density in the outer region were not affectedby the changes in the central region.
Figures 3 (a) and 3 (b) show the EUV spectra at t = 4.4and 5.0 s for wavelength regions 18 - 22 nm and 25 - 29 nm,respectively. At t = 4.4 s, the central electron tempera-ture was high, as shown in Fig. 2, and Fe ions in highercharge states were observed, such as Fe XXIII and FeXXIV. However, when the central electron temperaturedecreased to approximately 500 eV at around t = 5.0 s, thehigher charged ions disappeared and Fe XVII at 20.468and 25.493 nm were clearly detected. Lower charged Feions such as Fe XII and Fe XIII were constantly observedas these ions exist in the peripheral region at lower electrontemperatures of approximately 100 eV.
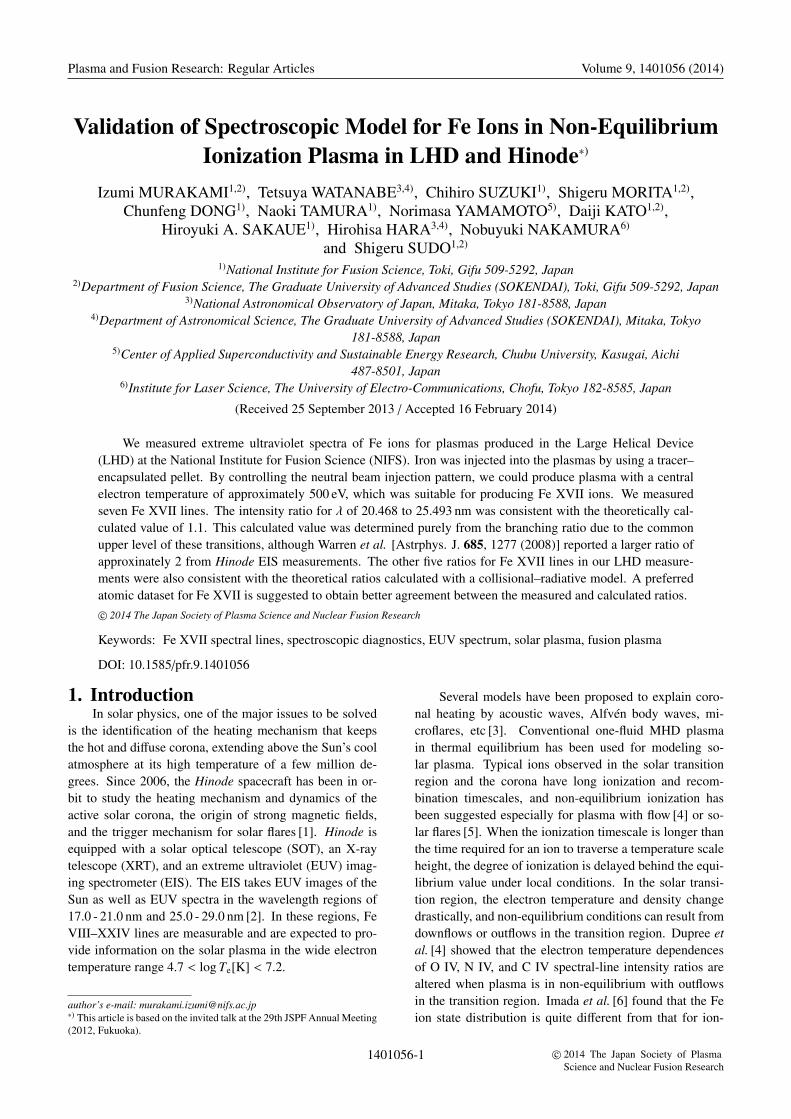
As listed in Table 1, a total of seven Fe XVII lines ap-pear in Fig. 3. The measured wavelengths were calibratedwith known prominent Fe XXIV lines and other impuritylines. Errors for the line wavelengths measured in the LHDin Table 1 were obtained by fitting to a Gaussian profile.The pixel size of the measurements corresponds to about
Fig. 3 EUV spectra at 4.4 s (dotted line) and 5.0 s (solid line) (a)for 18 - 22 nm wavelength region and (b) for 25 - 29 nmwavelength region of shot 107802. Forty frames (Δt =200 ms) were added to obtaine the spectra. Wavelengthsshown in bold face for identified lines were measured;others were taken from the NIST ASD database [35].
0.02 nm, but high S/N ratios in the measurements allowsmaller errors for the line fits. The wavelengths of all FeXVII lines roughly agree with those measured by HinodeEIS, those in the NIST database [34], and those calculatedby the GRASP code [26]. We follow the identifications ofthe transitions for the λ 26.646-nm and 27.564-nm lines inthe NIST database and the GRASP calculation. The iden-tifications of these two lines are exchanged in the list ofWarren et al. [21]. The upper levels of these transitions aremixed with 1D2 and 3F2 levels due to configuration mix-ing, and similarly, the lower levels are mixed with 1P1 and3D1 levels.
The lower level of the transition for λ of 28.021 nm(no.6 in Table 1) is mixed with 2s2 2p5 3p 1D2 and 3D2
levels due to configuration interactions. The term identifi-cation of this level in the NIST database [34] differs fromthat in the GRASP calculation [26], but because the mix-ing coefficients are almost the same, the levels in the NISTdatabase and the GRASP calculation are expected to bephysically identical. The energy levels calculated with theHULLAC code used in our CR model are described with jj
1401056-4
Plasma and Fusion Research: Regular Articles Volume 9, 1401056 (2014)
Table 1 Observed Fe XVII lines.
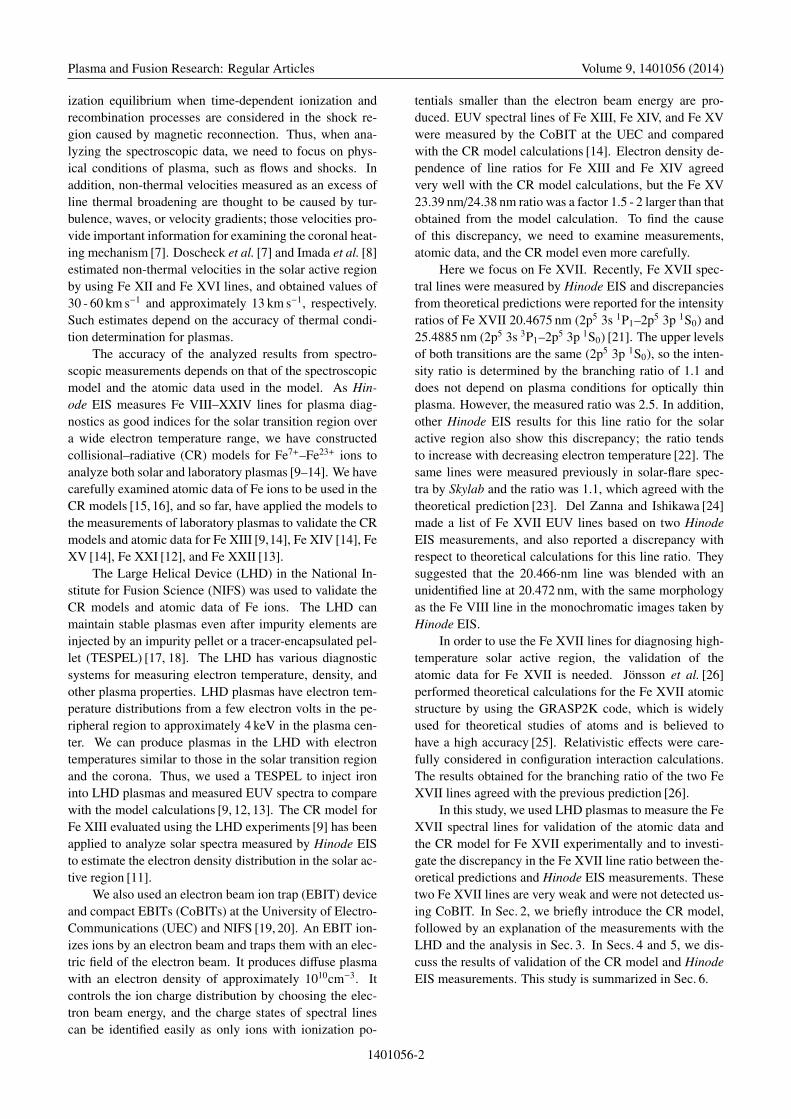
Fig. 4 Temporal evolution of Fe XVII line intensities for shot107802.
coupling, so no LS terms were specified in the HULLACcalculation.
Figure 4 shows the temporal distribution for Fe XVII
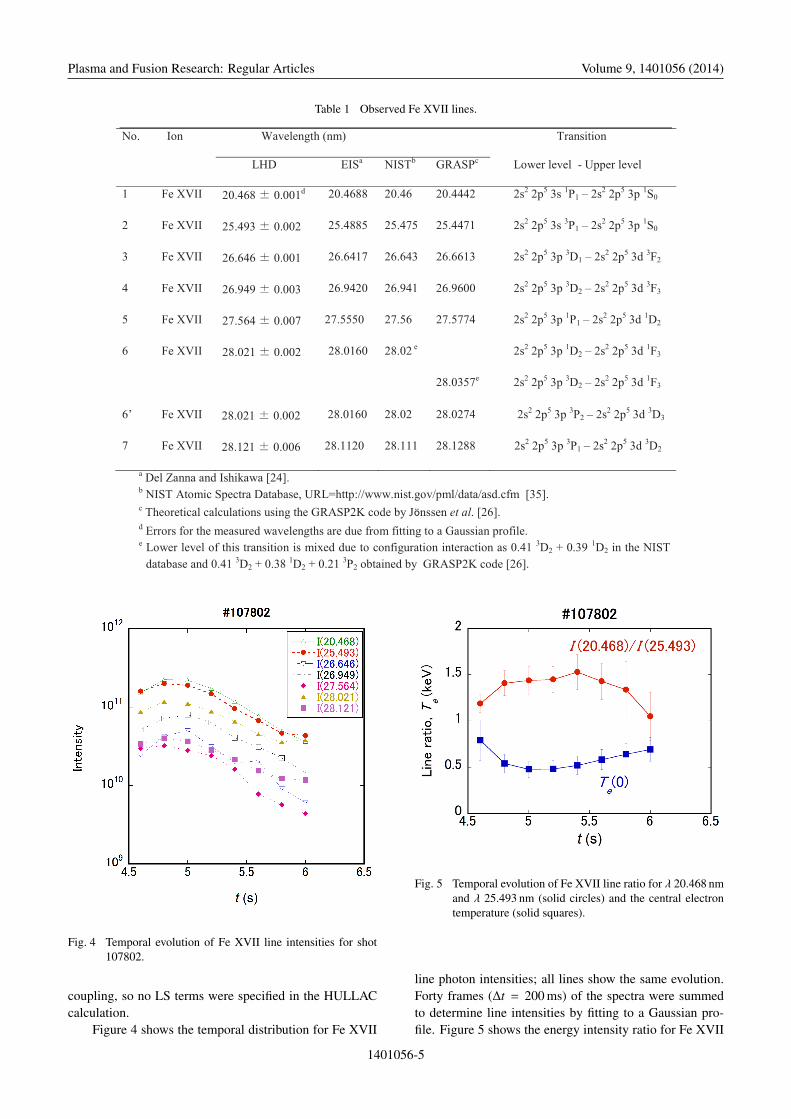
Fig. 5 Temporal evolution of Fe XVII line ratio for λ 20.468 nmand λ 25.493 nm (solid circles) and the central electrontemperature (solid squares).
line photon intensities; all lines show the same evolution.Forty frames (Δt = 200 ms) of the spectra were summedto determine line intensities by fitting to a Gaussian pro-file. Figure 5 shows the energy intensity ratio for Fe XVII
1401056-5
Plasma and Fusion Research: Regular Articles Volume 9, 1401056 (2014)
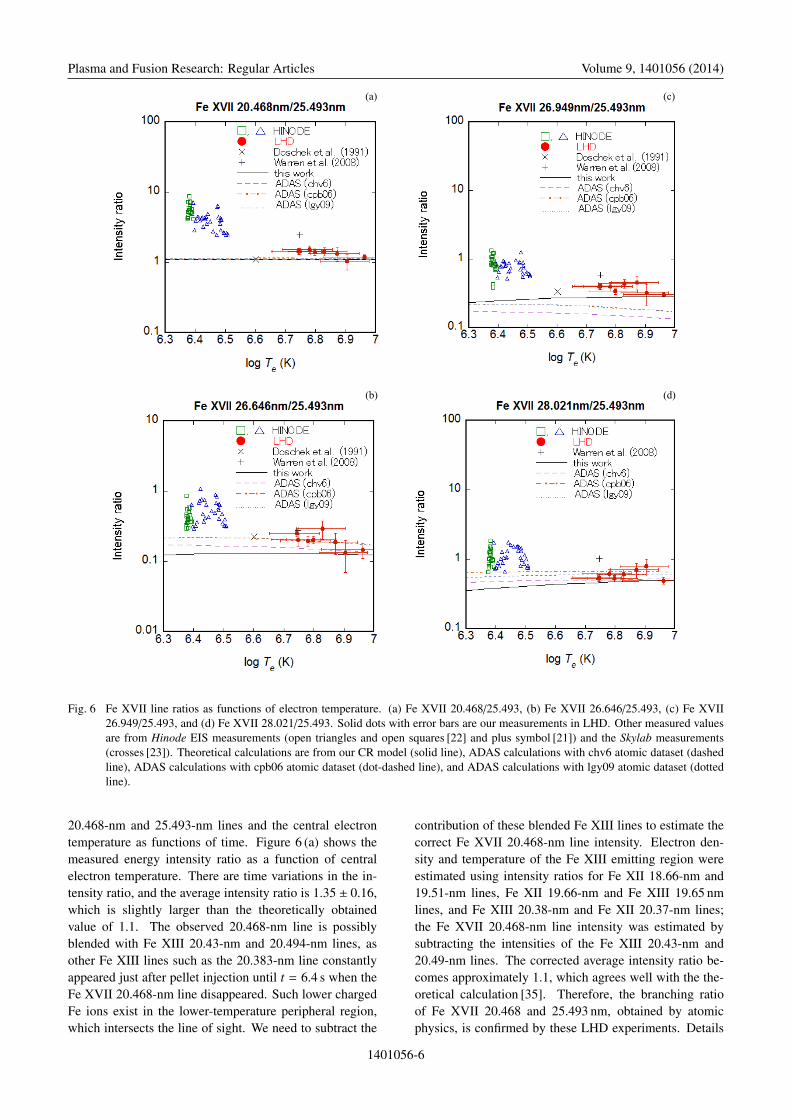
Fig. 6 Fe XVII line ratios as functions of electron temperature. (a) Fe XVII 20.468/25.493, (b) Fe XVII 26.646/25.493, (c) Fe XVII26.949/25.493, and (d) Fe XVII 28.021/25.493. Solid dots with error bars are our measurements in LHD. Other measured valuesare from Hinode EIS measurements (open triangles and open squares [22] and plus symbol [21]) and the Skylab measurements(crosses [23]). Theoretical calculations are from our CR model (solid line), ADAS calculations with chv6 atomic dataset (dashedline), ADAS calculations with cpb06 atomic dataset (dot-dashed line), and ADAS calculations with lgy09 atomic dataset (dottedline).
20.468-nm and 25.493-nm lines and the central electrontemperature as functions of time. Figure 6 (a) shows themeasured energy intensity ratio as a function of centralelectron temperature. There are time variations in the in-tensity ratio, and the average intensity ratio is 1.35 ± 0.16,which is slightly larger than the theoretically obtainedvalue of 1.1. The observed 20.468-nm line is possiblyblended with Fe XIII 20.43-nm and 20.494-nm lines, asother Fe XIII lines such as the 20.383-nm line constantlyappeared just after pellet injection until t = 6.4 s when theFe XVII 20.468-nm line disappeared. Such lower chargedFe ions exist in the lower-temperature peripheral region,which intersects the line of sight. We need to subtract the
contribution of these blended Fe XIII lines to estimate thecorrect Fe XVII 20.468-nm line intensity. Electron den-sity and temperature of the Fe XIII emitting region wereestimated using intensity ratios for Fe XII 18.66-nm and19.51-nm lines, Fe XII 19.66-nm and Fe XIII 19.65 nmlines, and Fe XIII 20.38-nm and Fe XII 20.37-nm lines;the Fe XVII 20.468-nm line intensity was estimated bysubtracting the intensities of the Fe XIII 20.43-nm and20.49-nm lines. The corrected average intensity ratio be-comes approximately 1.1, which agrees well with the the-oretical calculation [35]. Therefore, the branching ratioof Fe XVII 20.468 and 25.493 nm, obtained by atomicphysics, is confirmed by these LHD experiments. Details
1401056-6
Plasma and Fusion Research: Regular Articles Volume 9, 1401056 (2014)
of the analysis for subtracting the contributions of Fe XIIIlines are described by Watanabe et al. [36].
4. Model ValidationAs described above, we confirm that the measured in-
tensity ratio for Fe XVII 20.468 and 25.493 nm is con-sistent with the theoretical prediction. Now we comparemeasured energy intensity ratios for other Fe XVII lineslisted in Table 1 with theoretical calculations by the CRmodel. Some of the results are shown in Fig. 6. Measuredratios are plotted as solid dots with error bars; other datameasured for the solar plasma by Skylab [23] (crosses) andHinode EIS [21, 22] (squares and triangles) are also plot-ted for comparison. In Fig. 6 (a), measured line ratios for20.468 and 25.493 nm before the calibration are plotted.To compare with the measured 28.021-nm line intensity,the calculated intensities of two lines (nos. 6 and 6’ in Ta-ble 1) were summed. Basically, the differences betweenthe four theoretical calculations are mainly due to differ-ent atomic data, i.e., transition probabilities and electron-impact excitation effective collision strengths.
All measured ratios in the LHD plasma are roughlyconsistent with the calculated ratios, but ratios from Hin-ode EIS measurements are larger than the theoretical cal-culations, as seen in Fig. 6. Ratios from our CR modelcalculations are marginally consistent with the LHD mea-surements, but tend to be lower than the measurements. Asdescribed in Sec. 3, the measured ratios for λ of 20.468 to25.493 nm are slightly larger than the theoretical calcula-tions (Fig. 6 (a)), because the λ 20.468-nm line is blendedwith the Fe XIII line. After subtracting the latter con-tribution, the ratio becomes consistent with the theoret-ical prediction. Similarly, our measured ratios for λ of26.949 to 25.493 nm, whose average is 0.382 ± 0.055(Fig. 6 (c)), are marginally consistent with our CR modelcalculation but larger than the three ADAS calculations,perhaps because the λ 26.949-nm line is possibly blendedwith the Fe XIV 26.9357-nm line. As seen in Fig. 4, theline intensities of λ 26.949 and 26.646 nm increased att = 4.8 - 5.0 s, but other lines decreased. These behav-iors of intensity also suggest contamination of other linesto λ 26.949-nm and λ 26.646-nm lines. The measured ra-tios for λ 26.646-nm to 25.493-nm lines, whose average is0.202 ± 0.051 (Fig. 6 (b)), are roughly consistent with cal-culated ratios, but the candidate for line blending is the FeXV 26.6377-nm line. The measured ratios for λ of 28.021to 25.493 nm, whose average is 0.604 ± 0.102 (Fig. 6 (d)),show better agreement with all ADAS calculations thanwith our CR model calculation. The measured ratios forλ of 27.564 to 25.493 nm, whose average is 0.134 ± 0.027,and those for λ 28.121-nm to 25.493-nm lines, whose av-erage is 0.202 ± 0.028 show tendencies similar to that ofthe ratio for λ of 28.021 to 25.493 nm in Fig. 6 (d).
These results show that our CR model is marginallyconsistent with the LHD measurements for the Fe XVII
line ratios. The ADAS calculations with the lgy09 atomicdataset show better agreement with the measurements thanours, except for the λ 26.949-nm line. For constructinga better CR model, the lgy09 atomic dataset is thereforepreferred. The reason is that the electron-impact excita-tion rate coefficient is calculated with the R-matrix method,which includes the resonance effect and is better than thedistorted wave method in the lower collision-energy re-gion, and many excited levels are considered. This atomicdataset can be obtained from the OPEN-ADAS website athttp://open.adas.ac.uk/.
5. DiscussionThe LHD measurements of the Fe XVII lines are al-
most consistent with the theoretical predictions from ourCR model, as described in Sec. 4. However, Hinode EISmeasurements still remain inconsistent with the theoreti-cal predictions. For the λ 20.468-nm line, Del Zanna andIshikawa [24] suggested a blend with an unidentified lineat 20.472 nm, which showed the same morphology as theFe VIII line in monochromatic images taken by HinodeEIS. This unidentified line could originate from the transi-tion regions with lower temperatures at Te = 4 - 6 × 10⁵ K(34 - 54 eV). For an active region core and a small flar-ing event on June 2, 2007, Watanabe et al. [35] reanalyzedthe intensity ratio for λ 20.468-nm and 25.493-nm lines byconsidering the contribution of the unidentified line orig-inating from the transition region; the intensity ratio wassignificantly reduced to approximately 1.5 - 1.6. Neverthe-less, the ratio is higher than the theoretical prediction. Thisinconsistency indicates the need for re-examining the in-flight intensity calibration of Hinode EIS instruments us-ing two CCDs for the wavelength regions of 17 - 21 nmand 25 - 29 nm [37]. For the other five intensity ratios, thelines were measured with the same CCD and the inconsis-tency cannot be attributed to the intensity calibration of theinstruments. The intensity for λ of 25.493 nm seems sys-tematically smaller than the theoretical prediction, but it isdifficult to explain. In the future, we will need to examineHinode EIS measurements in more detail.
6. SummaryWe measured EUV spectra for LHD plasmas in which
iron was injected by a TESPEL. NBI heating was well con-trolled, and we successfully produced plasmas with a cen-tral electron temperature of approximately 500 eV, whichis suitable for producing Fe XVII ions. We detected sevenFe XVII lines whose wavelengths are consistent with Hin-ode EIS measurements, NIST database, and GRASP cal-culations. The measured intensity ratios for Fe XVII linesare consistent with the CR model calculations. Especially,the intensity ratio for Fe XVII 20.468-nm and 25.493-nmlines, after subtracting the effects of line blending, is con-sistent with the theoretical prediction of 1.1. This predic-tion was determined purely from the branching ratio due
1401056-7
Plasma and Fusion Research: Regular Articles Volume 9, 1401056 (2014)
to the common upper level, although Warren et al. [21] re-ported a larger ratio from Hinode EIS measurements. Theagreement of our LHD measurements and theoretical cal-culations for these ratios imply that the atomic data and theCR model are valid to be used for diagnostics. We suggesta preferred atomic dataset to obtain better agreement in theintensity ratios.
AcknowledgmentsWe acknowledge the LHD experimental group for
their assistance. This work is partly supported by the NIFSCollaborative Research Programs (NIFS10KLPF008 andNIFS12KLPF027), the NINS Inter-institute collaborativeprogram for Creation of New Research Area (Head Investi-gator: T. Watanabe), NIFS/NINS under the project of For-mation of International Network for Scientific Collabora-tions (Head Investigator: H. Yamada). The authors wouldlike to thank Enago (www.enago.jp) for the English lan-guage review.
[1] T. Kosugi et al., Solar Phys. 243, 3 (2007).[2] J.L. Culhane et al., Solar Phys. 243, 19 (2007).[3] J.A. Klimchuk, Solar Phys. 234, 41 (2006).[4] A.K. Dupree et al. Astrophys. J. 299, L101 (1979).[5] T. Kato et al., Astrophys. J. 492, 822 (1998).[6] S. Imada et al., Astrophys. J. 742, 70 (2011).[7] G.A. Doschek et al., Astrophys. J. 667, L109 (2007).[8] S. Imada et al., Astrophys. J. 705, L208 (2009).[9] N. Yamamoto et al., Astrophys. J. 689, 646 (2008).
[10] N. Yamamoto et al., J. Phys.: Conf. Ser. 163, 012023(2009).
[11] T. Watanabe et al., Astrophys. J. 692, 1294 (2009).[12] I. Murakami et al., Plasma Fusion Res. 5, S2021 (2010).
[13] H.A. Sakaue et al., J. Appl. Phys. 109, 073304 (2011).[14] N. Nakamura et al., Astrophys. J. 739, 17 (2011).[15] I. Skobelev et al., Astron. Astrophys. 511, A60 (2010).[16] I. Murakami et al., accepted to IAEA Atomic and Plasma-
Material Interaction Data for Fusion (2013).[17] S. Sudo et al, Plasma Phys. Control. Fusion 44, 129 (2002).[18] S. Sudo and N. Tamura, Rev. Sci. Instrum. 83, 023503
(2012).[19] N. Nakamura et al., Rev. Sci. Instrum. 79, 063104 (2008).[20] H.A. Sakaue et al., J. Instrumentation 5, C08010 (2010).[21] H.P. Warren et al., Astrphys. J. 685, 1277 (2008).[22] T. Watanabe et al., 38th COSPER-GA, E25-008-10 (oral
presentation) (2010).[23] G.A. Doscheck et al., Phys. Rev. A 43, 2565 (1991).[24] G. Del Zanna and Y. Ishikawa, Astron. Astrophys. 508,
1517 (2009).[25] P. Jönsson et al., Compt. Phys. Commun. 177, 597 (2007).[26] P. Jönsson et al., Research Report of the National Institute
for Fusion Science, NIFS-DATA-113 (2011); Atomic DataNucl. Data Tables 100, 1 (2014).
[27] A. Bar-Shalon et al., J. Quant. Spect. Rad. Transf. 71, 179(2001).
[28] H.P. Summers, The ADAS User Manual, version 2.6,http://www.adas.ac.uk (2004).
[29] K.P. Dere et al., Astron. Astrophys. 498, 915 (2009).[30] S.D. Loch et al., J. Phys. B 39, 1 (2006).[31] G.Y. Liang and N.R. Badnell, Astron. Astrophys. 518, A64
(2010).[32] M.B. Chowduri et al., Rev. Sci. Instrum. 78, 023501
(2007).[33] C. Dong et al., Rev. Sci. Instrum. 82, 113102 (2011).[34] A. Kramida et al., URL=http://www.nist.gov/apml/data/
asd.cfm[35] T. Watanabe et al., Plasma Fusion Res. 8, 2501105 (2013).[36] T. Watanabe et al., in preparation (2014).[37] G. Del Zanna, Astron. Astrophys. 555, A47 (2013).
1401056-8