Embed Size (px)
Citation preview
Value of Informationin
Spreadsheet Monte Carlo Simulation Models
INFORMS 2010 Austin
Michael R. Middleton, Ph.D.Decision [email protected]
Background
• Spreadsheet models are often used for what‐if sensitivity analysis
• Probability distributions may be assigned to input assumptions, and Monte Carlo simulation can develop the corresponding distribution for the output performance measure
• Problem: How can we compute Value of Information using the results of Monte Carlo simulation in a spreadsheet model?
INFORMS 2010 Austin www.DecisionToolworks.com 2
• Expected Value of Perfect Information, EVPI• Value of Clairvoyance, Value of Information, VOI
• Important for– determining an upper bound on the value of actual information‐gathering activities
– comparing the value of information for multiple uncertainties
• Requires a model of a decision problem with alternatives, probabilities for uncertainties, outcome values, and willingness to determine certain equivalents
• Monte Carlo simulation may be used to describe uncertainty associated with a single alternative or strategy
INFORMS 2010 Austin www.DecisionToolworks.com 3
Value of Information
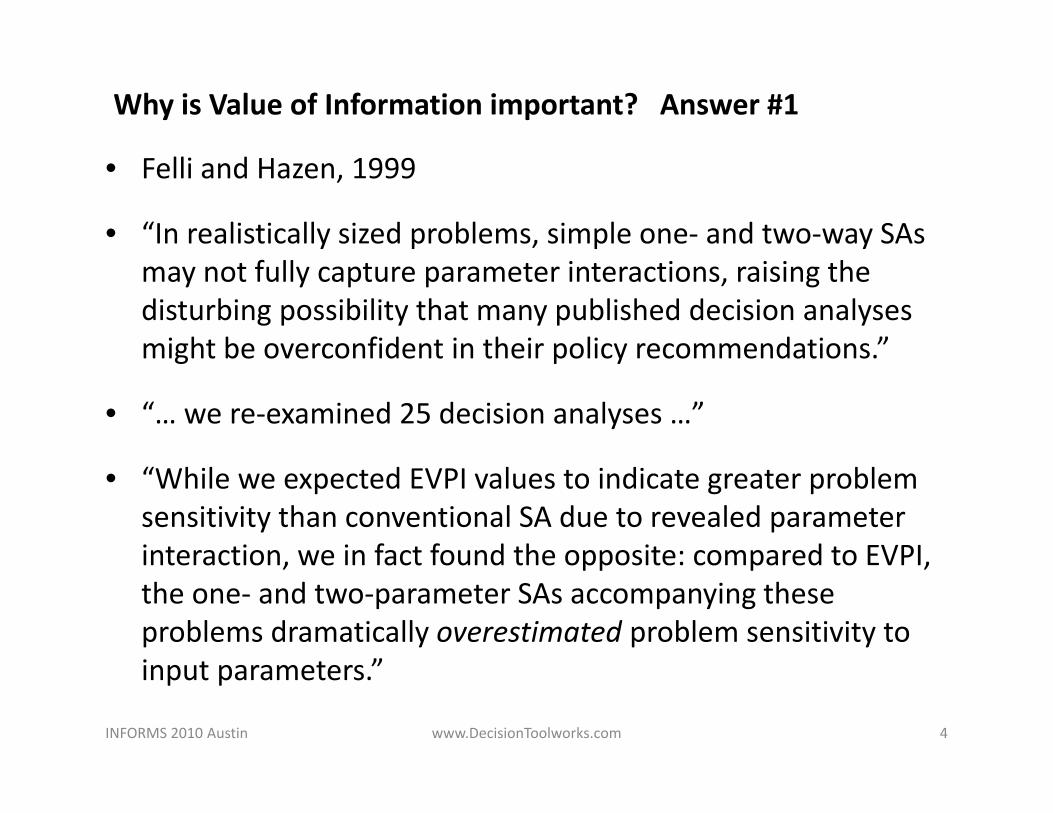
• Felli and Hazen, 1999
• “In realistically sized problems, simple one‐ and two‐way SAs may not fully capture parameter interactions, raising the disturbing possibility that many published decision analyses might be overconfident in their policy recommendations.”
• “… we re‐examined 25 decision analyses …”
• “While we expected EVPI values to indicate greater problem sensitivity than conventional SA due to revealed parameter interaction, we in fact found the opposite: compared to EVPI, the one‐ and two‐parameter SAs accompanying these problems dramatically overestimated problem sensitivity to input parameters.”
INFORMS 2010 Austin www.DecisionToolworks.com 4
Why is Value of Information important? Answer #1
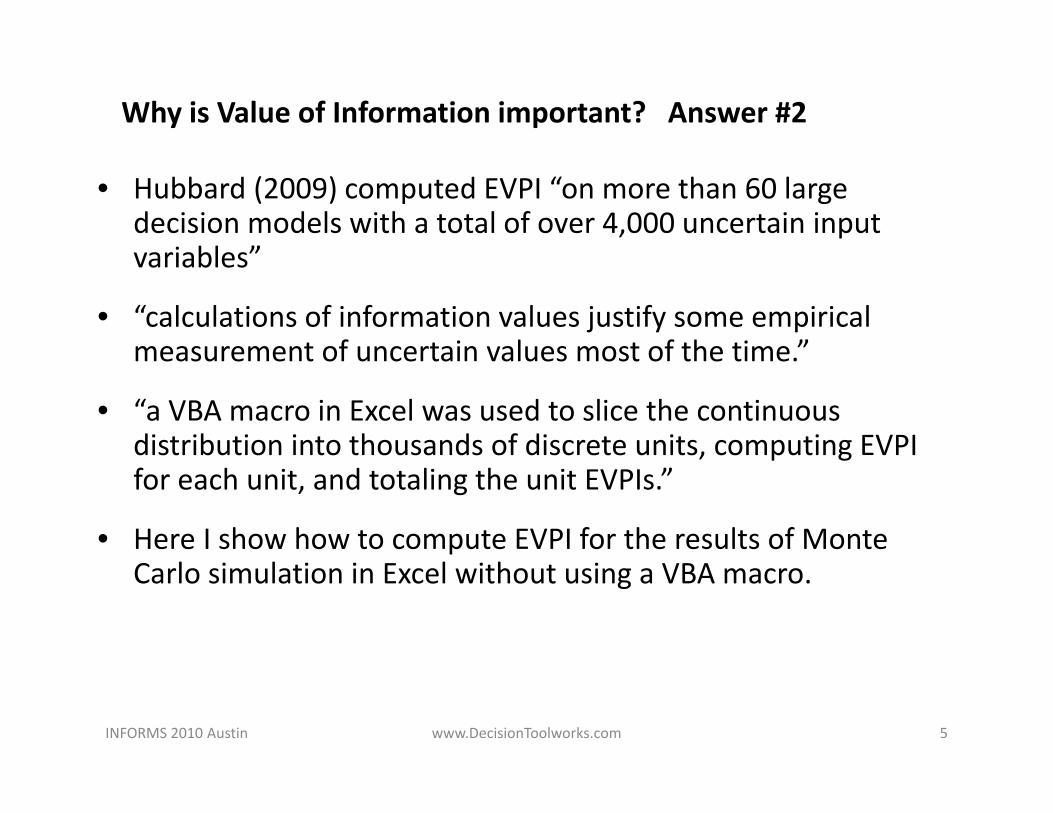
• Hubbard (2009) computed EVPI “on more than 60 large decision models with a total of over 4,000 uncertain input variables”
• “calculations of information values justify some empirical measurement of uncertain values most of the time.”
• “a VBA macro in Excel was used to slice the continuous distribution into thousands of discrete units, computing EVPI for each unit, and totaling the unit EVPIs.”
• Here I show how to compute EVPI for the results of Monte Carlo simulation in Excel without using a VBA macro.
INFORMS 2010 Austin www.DecisionToolworks.com 5
Why is Value of Information important? Answer #2
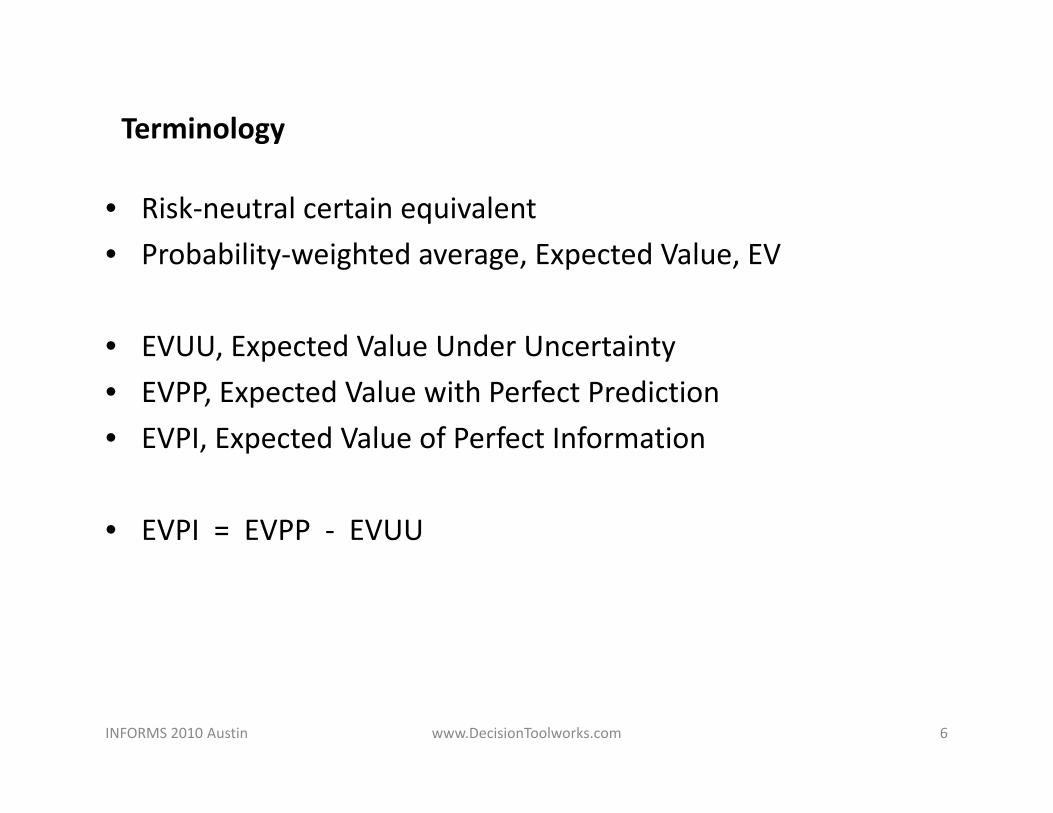
• Risk‐neutral certain equivalent• Probability‐weighted average, Expected Value, EV
• EVUU, Expected Value Under Uncertainty• EVPP, Expected Value with Perfect Prediction• EVPI, Expected Value of Perfect Information
• EVPI = EVPP ‐ EVUU
INFORMS 2010 Austin www.DecisionToolworks.com 6
Terminology
INFORMS 2010 Austin www.DecisionToolworks.com 7
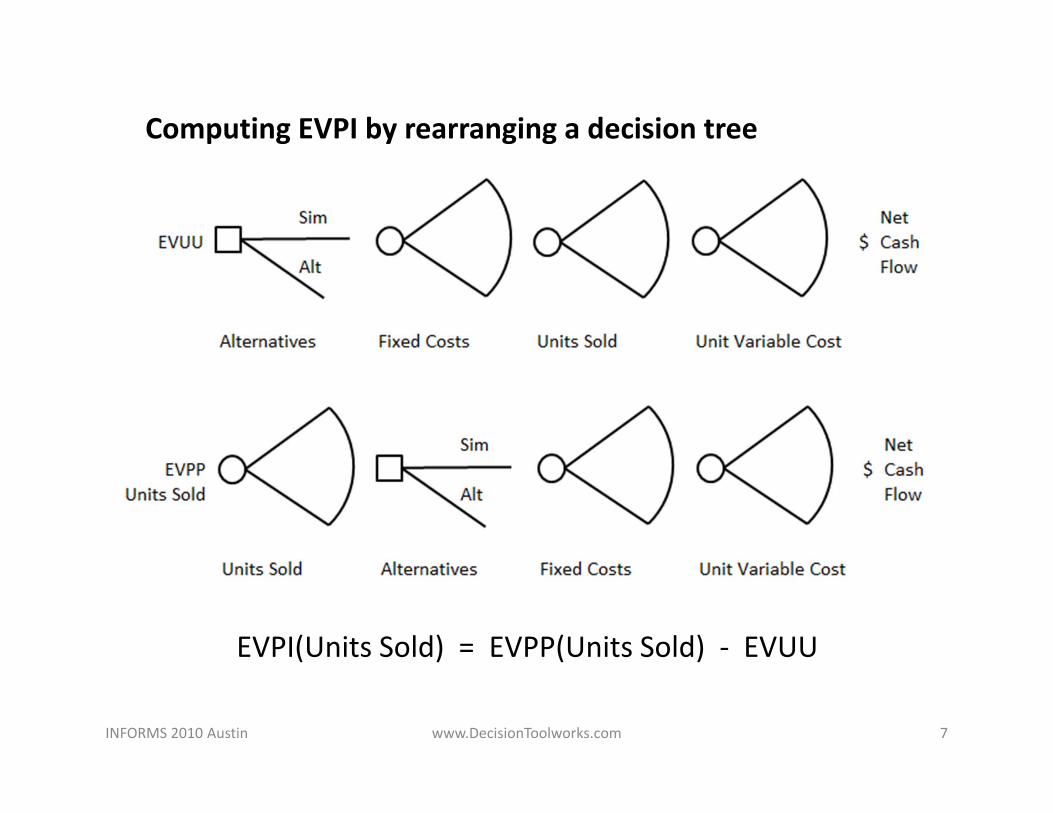
EVPI(Units Sold) = EVPP(Units Sold) ‐ EVUU
Computing EVPI by rearranging a decision tree
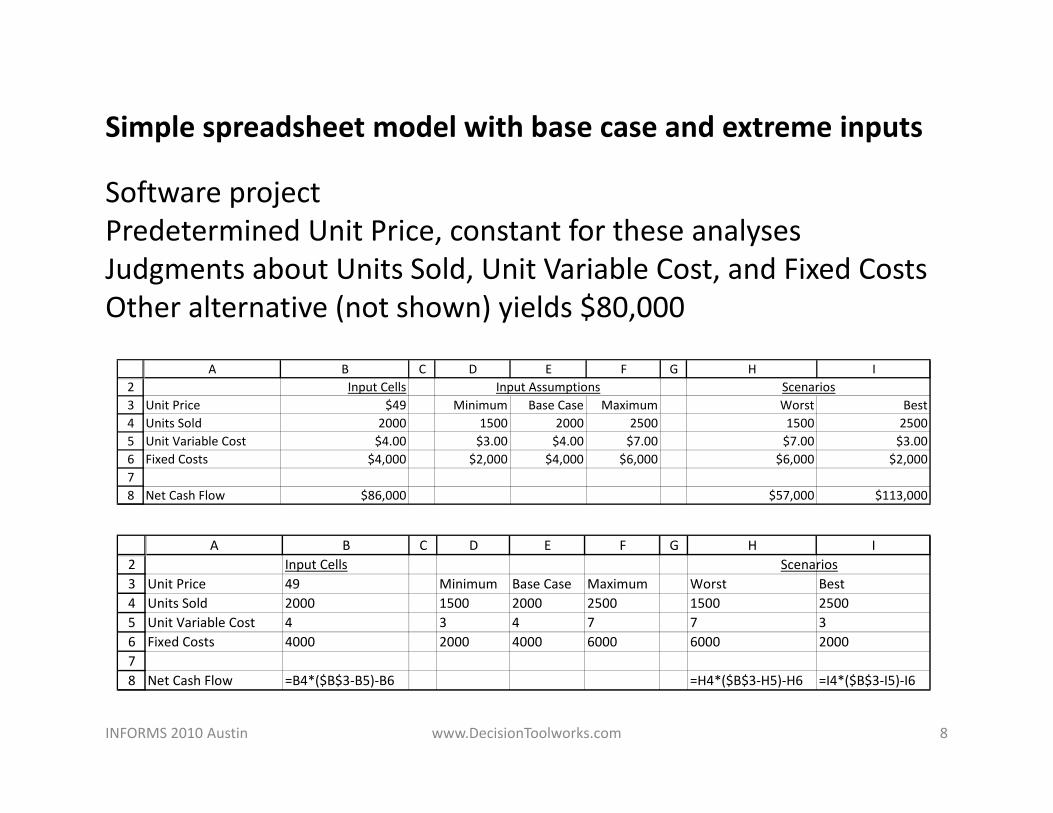
Simple spreadsheet model with base case and extreme inputs
INFORMS 2010 Austin www.DecisionToolworks.com 8
2345678
A B C D E F G H IInput Cells Scenarios
Unit Price 49 Minimum Base Case Maximum Worst BestUnits Sold 2000 1500 2000 2500 1500 2500Unit Variable Cost 4 3 4 7 7 3Fixed Costs 4000 2000 4000 6000 6000 2000
Net Cash Flow =B4*($B$3‐B5)‐B6 =H4*($B$3‐H5)‐H6 =I4*($B$3‐I5)‐I6
2345678
A B C D E F G H IInput Cells Input Assumptions Scenarios
Unit Price $49 Minimum Base Case Maximum Worst BestUnits Sold 2000 1500 2000 2500 1500 2500Unit Variable Cost $4.00 $3.00 $4.00 $7.00 $7.00 $3.00Fixed Costs $4,000 $2,000 $4,000 $6,000 $6,000 $2,000
Net Cash Flow $86,000 $57,000 $113,000
Software projectPredetermined Unit Price, constant for these analysesJudgments about Units Sold, Unit Variable Cost, and Fixed CostsOther alternative (not shown) yields $80,000
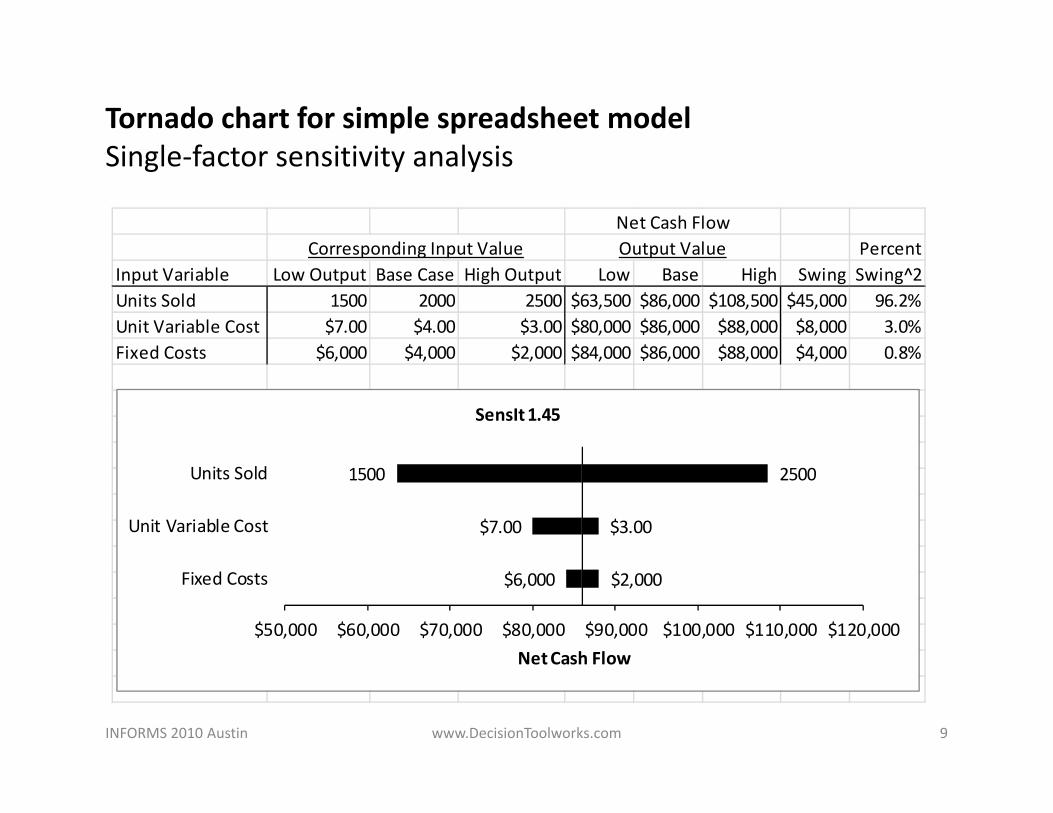
Tornado chart for simple spreadsheet modelSingle‐factor sensitivity analysis
INFORMS 2010 Austin www.DecisionToolworks.com 9
Net Cash FlowCorresponding Input Value Output Value Percent
Input Variable Low Output Base Case High Output Low Base High Swing Swing^2Units Sold 1500 2000 2500 $63,500 $86,000 $108,500 $45,000 96.2%Unit Variable Cost $7.00 $4.00 $3.00 $80,000 $86,000 $88,000 $8,000 3.0%Fixed Costs $6,000 $4,000 $2,000 $84,000 $86,000 $88,000 $4,000 0.8%
1500
$7.00
$6,000
2500
$3.00
$2,000
$50,000 $60,000 $70,000 $80,000 $90,000 $100,000 $110,000 $120,000
Units Sold
Unit Variable Cost
Fixed Costs
Net Cash Flow
SensIt 1.45
INFORMS 2010 Austin www.DecisionToolworks.com 10
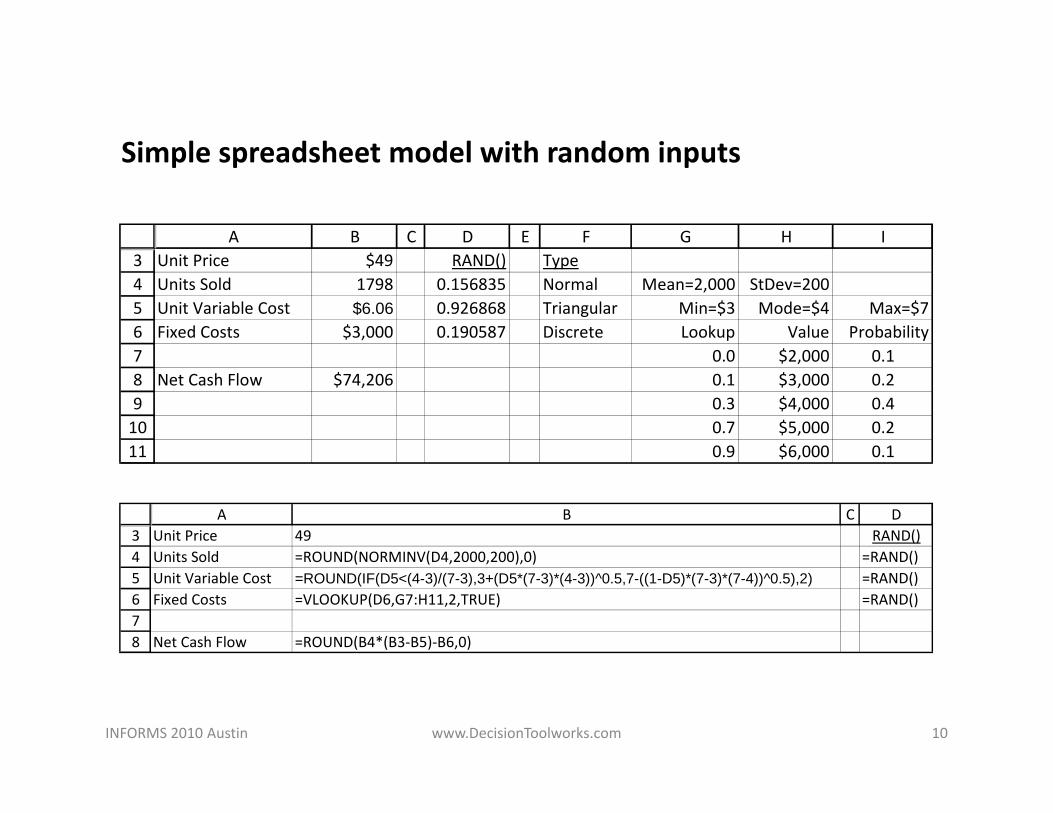
34567891011
A B C D E F G H IUnit Price $49 RAND() TypeUnits Sold 1798 0.156835 Normal Mean=2,000 StDev=200Unit Variable Cost $6.06 0.926868 Triangular Min=$3 Mode=$4 Max=$7Fixed Costs $3,000 0.190587 Discrete Lookup Value Probability
0.0 $2,000 0.1Net Cash Flow $74,206 0.1 $3,000 0.2
0.3 $4,000 0.40.7 $5,000 0.20.9 $6,000 0.1
345678
A B C DUnit Price 49 RAND()Units Sold =ROUND(NORMINV(D4,2000,200),0) =RAND()Unit Variable Cost =ROUND(IF(D5<(4-3)/(7-3),3+(D5*(7-3)*(4-3))^0.5,7-((1-D5)*(7-3)*(7-4))^0.5),2) =RAND()Fixed Costs =VLOOKUP(D6,G7:H11,2,TRUE) =RAND()
Net Cash Flow =ROUND(B4*(B3‐B5)‐B6,0)
Simple spreadsheet model with random inputs
INFORMS 2010 Austin www.DecisionToolworks.com 11
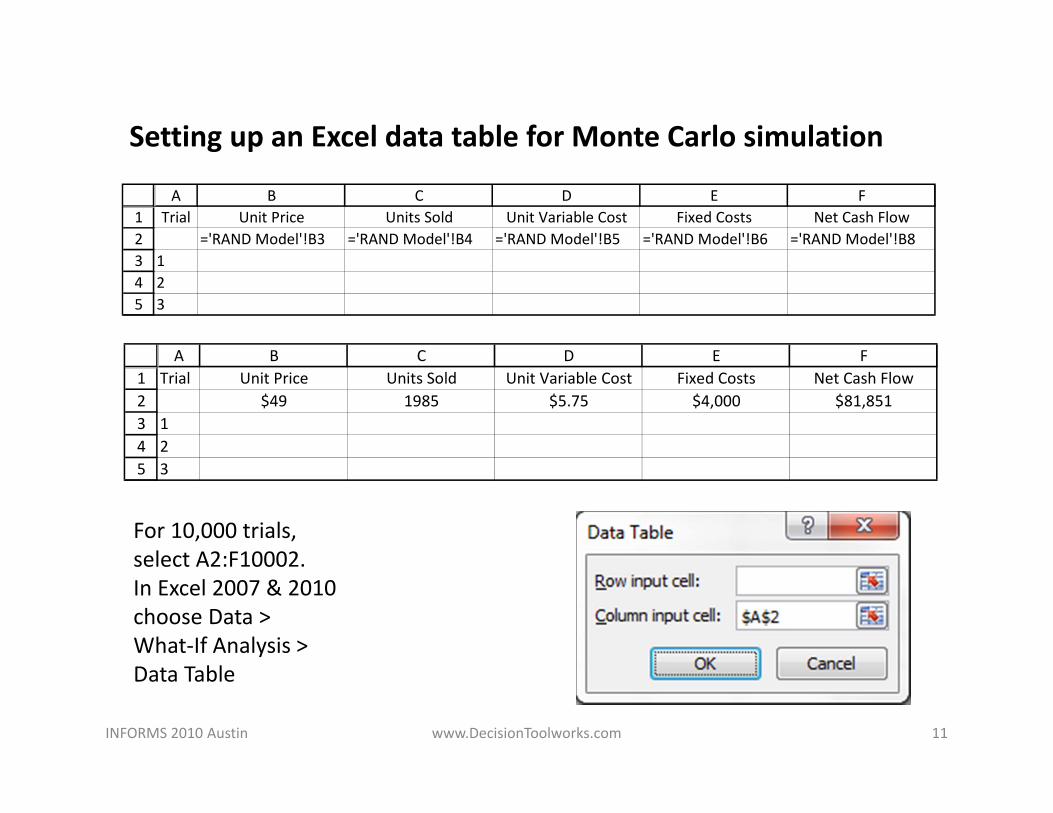
Setting up an Excel data table for Monte Carlo simulation
12345
A B C D E FTrial Unit Price Units Sold Unit Variable Cost Fixed Costs Net Cash Flow
='RAND Model'!B3 ='RAND Model'!B4 ='RAND Model'!B5 ='RAND Model'!B6 ='RAND Model'!B8123
12345
A B C D E FTrial Unit Price Units Sold Unit Variable Cost Fixed Costs Net Cash Flow
$49 1985 $5.75 $4,000 $81,851123
For 10,000 trials, select A2:F10002.In Excel 2007 & 2010 choose Data > What‐If Analysis > Data Table
INFORMS 2010 Austin www.DecisionToolworks.com 12
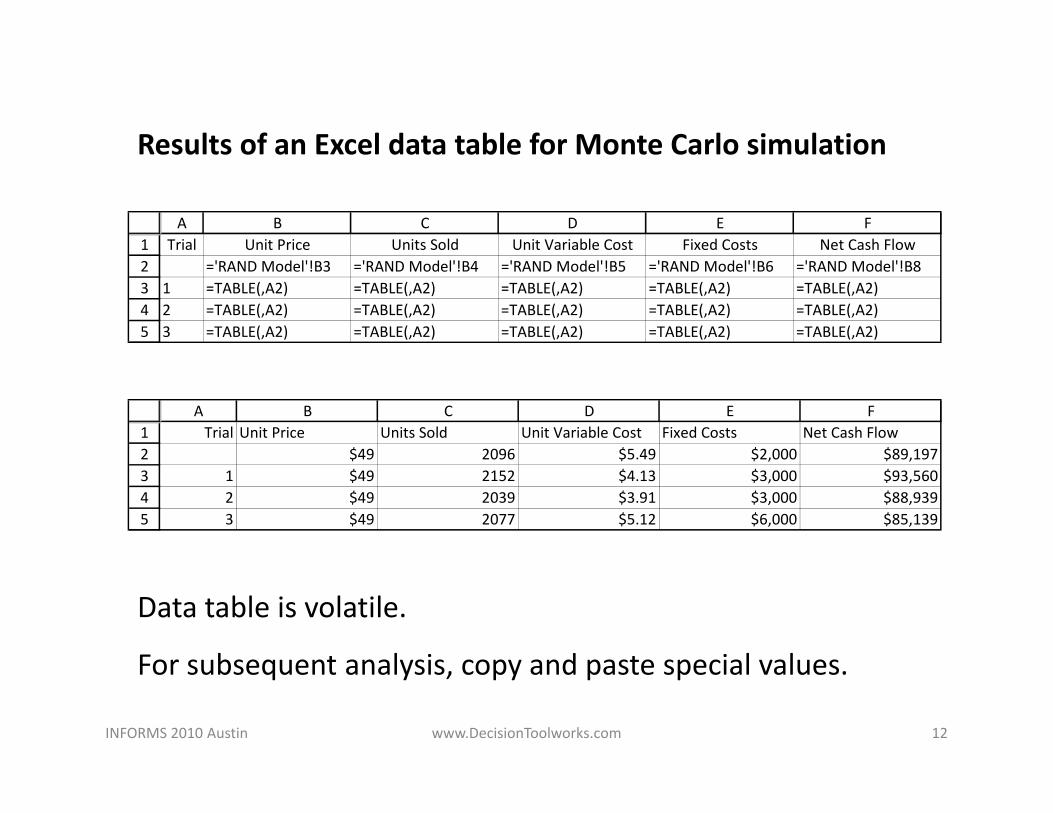
12345
A B C D E FTrial Unit Price Units Sold Unit Variable Cost Fixed Costs Net Cash Flow
='RAND Model'!B3 ='RAND Model'!B4 ='RAND Model'!B5 ='RAND Model'!B6 ='RAND Model'!B81 =TABLE(,A2) =TABLE(,A2) =TABLE(,A2) =TABLE(,A2) =TABLE(,A2)2 =TABLE(,A2) =TABLE(,A2) =TABLE(,A2) =TABLE(,A2) =TABLE(,A2)3 =TABLE(,A2) =TABLE(,A2) =TABLE(,A2) =TABLE(,A2) =TABLE(,A2)
Results of an Excel data table for Monte Carlo simulation
Data table is volatile.
For subsequent analysis, copy and paste special values.
12345
A B C D E FTrial Unit Price Units Sold Unit Variable Cost Fixed Costs Net Cash Flow
$49 2096 $5.49 $2,000 $89,1971 $49 2152 $4.13 $3,000 $93,5602 $49 2039 $3.91 $3,000 $88,9393 $49 2077 $5.12 $6,000 $85,139
INFORMS 2010 Austin www.DecisionToolworks.com 13
1200 1400 1600 1800 2000 2200 2400 2600 28000
200
400
600
800
1000
1200
1400
1600
1800
2000
Units Sold
Freq
uency
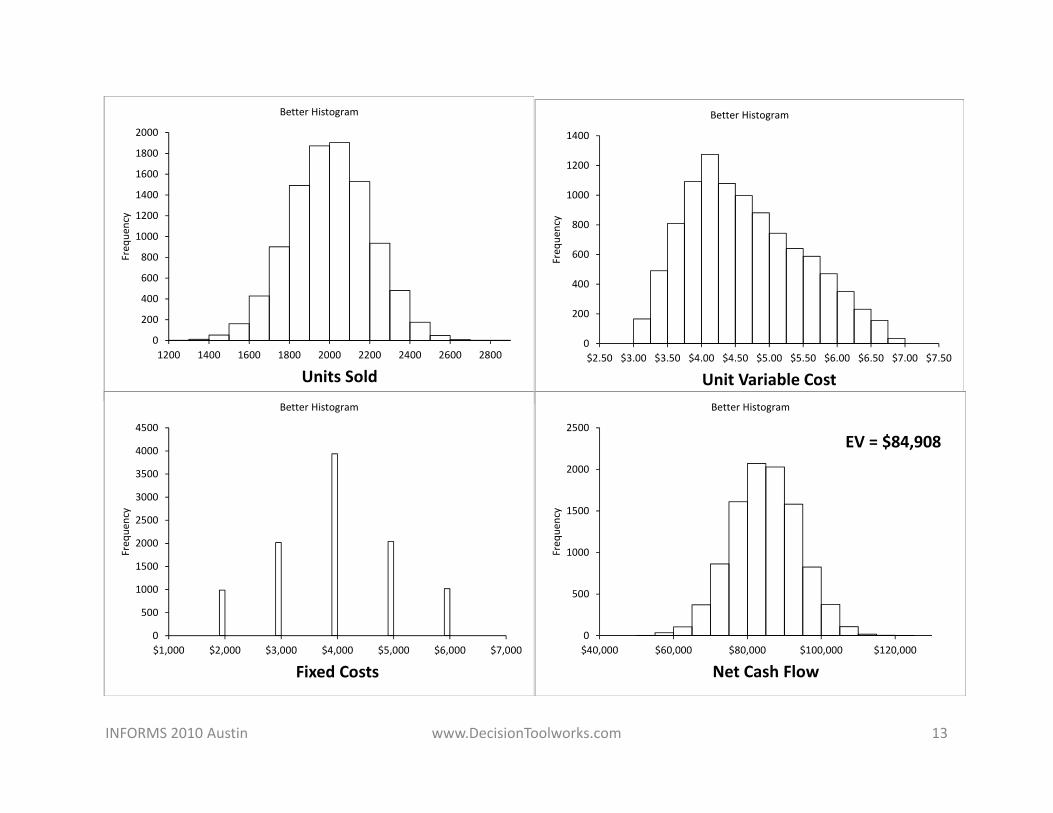
Better Histogram
$2.50 $3.00 $3.50 $4.00 $4.50 $5.00 $5.50 $6.00 $6.50 $7.00 $7.500
200
400
600
800
1000
1200
1400
Unit Variable Cost
Freq
uency
Better Histogram
$1,000 $2,000 $3,000 $4,000 $5,000 $6,000 $7,0000
500
1000
1500
2000
2500
3000
3500
4000
4500
Fixed Costs
Freq
uency
Better Histogram
$40,000 $60,000 $80,000 $100,000 $120,0000
500
1000
1500
2000
2500
Net Cash Flow
Freq
uency
Better Histogram
EV = $84,908
INFORMS 2010 Austin www.DecisionToolworks.com 14
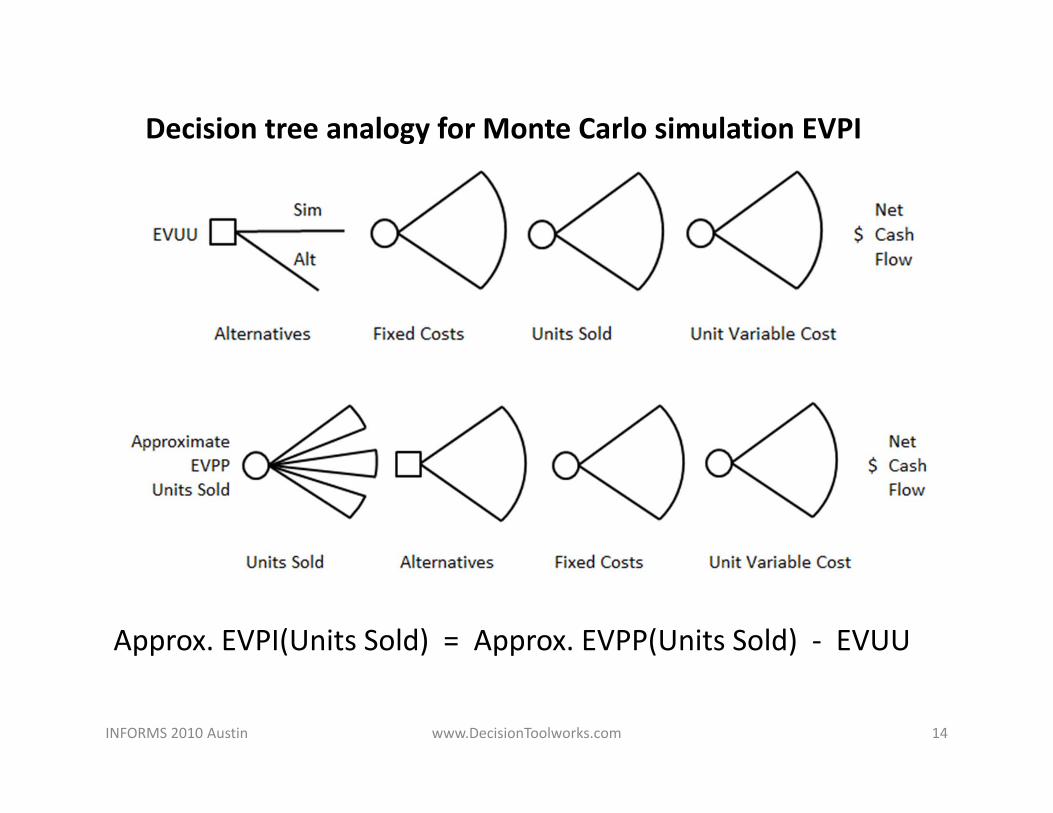
Approx. EVPI(Units Sold) = Approx. EVPP(Units Sold) ‐ EVUU
Decision tree analogy for Monte Carlo simulation EVPI
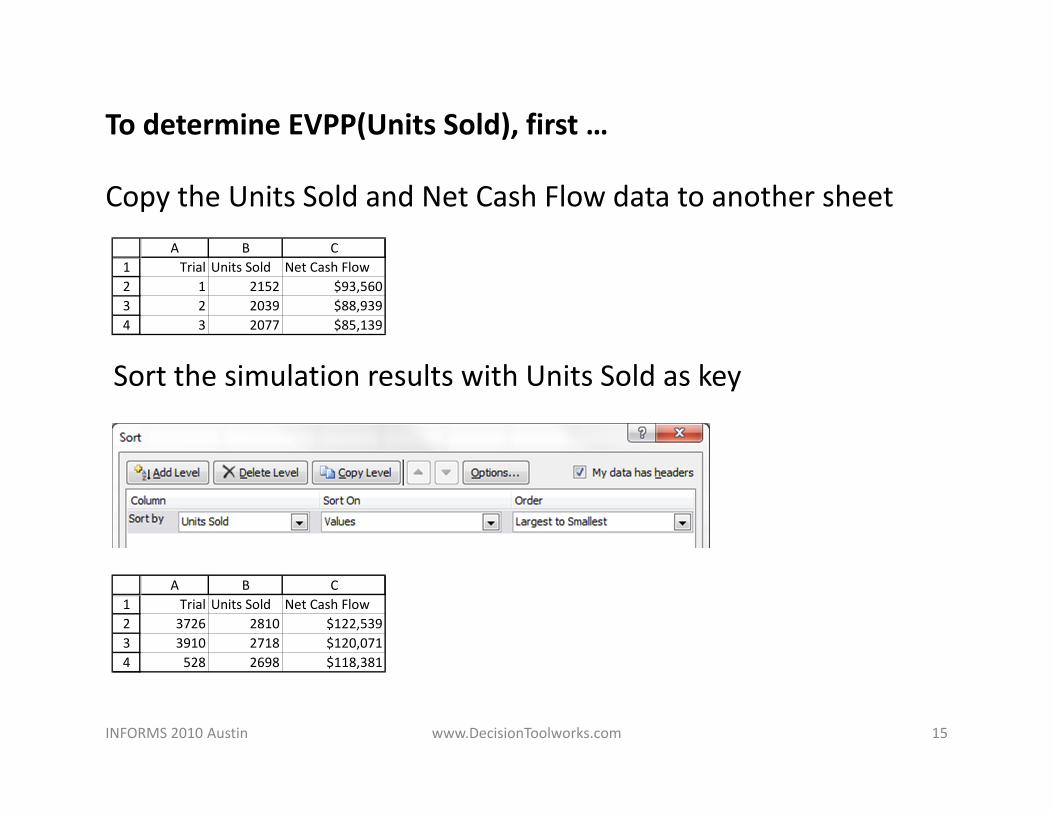
To determine EVPP(Units Sold), first …
Copy the Units Sold and Net Cash Flow data to another sheet
INFORMS 2010 Austin www.DecisionToolworks.com 15
1234
A B CTrial Units Sold Net Cash Flow
1 2152 $93,5602 2039 $88,9393 2077 $85,139
1234
A B CTrial Units Sold Net Cash Flow3726 2810 $122,5393910 2718 $120,071528 2698 $118,381
Sort the simulation results with Units Sold as key
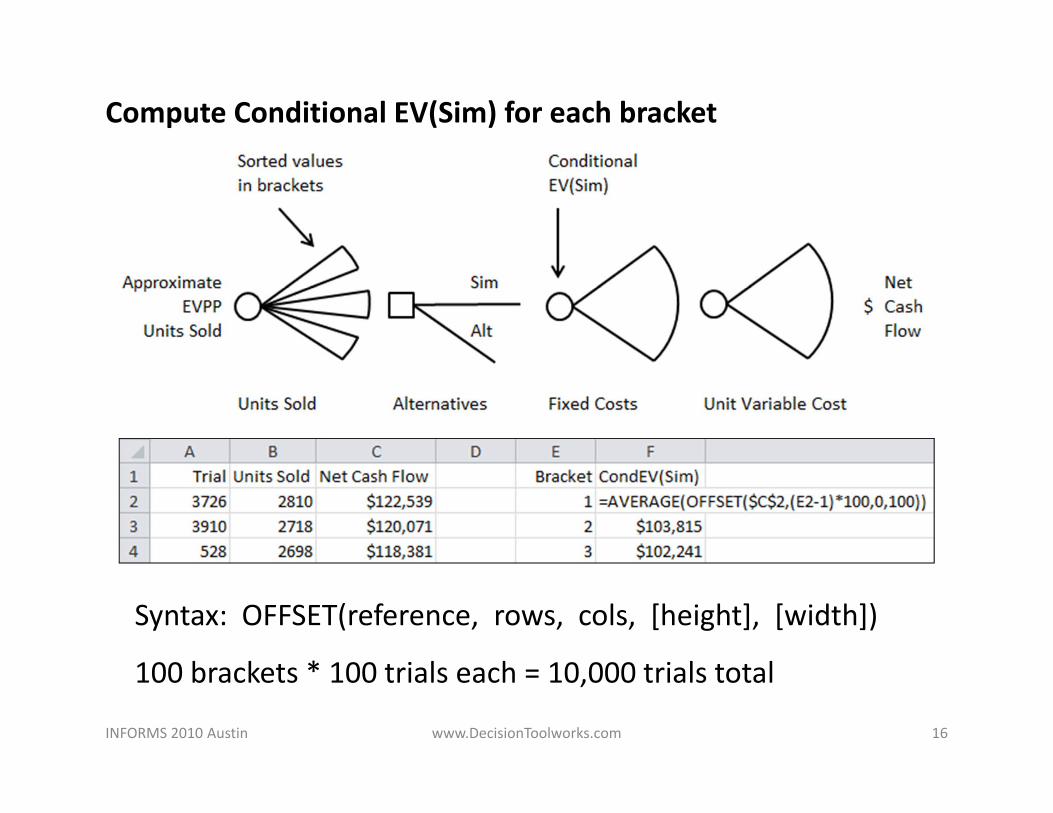
Compute Conditional EV(Sim) for each bracket
INFORMS 2010 Austin www.DecisionToolworks.com 16
Syntax: OFFSET(reference, rows, cols, [height], [width])
100 brackets * 100 trials each = 10,000 trials total
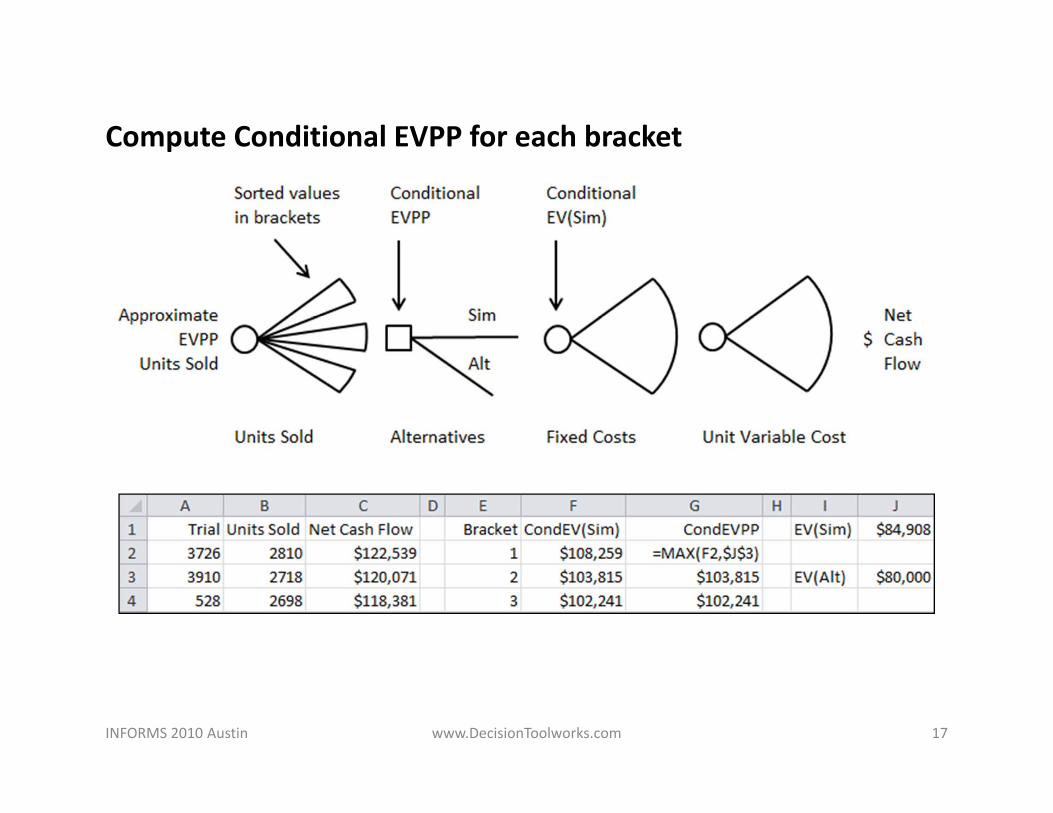
Compute Conditional EVPP for each bracket
INFORMS 2010 Austin www.DecisionToolworks.com 17
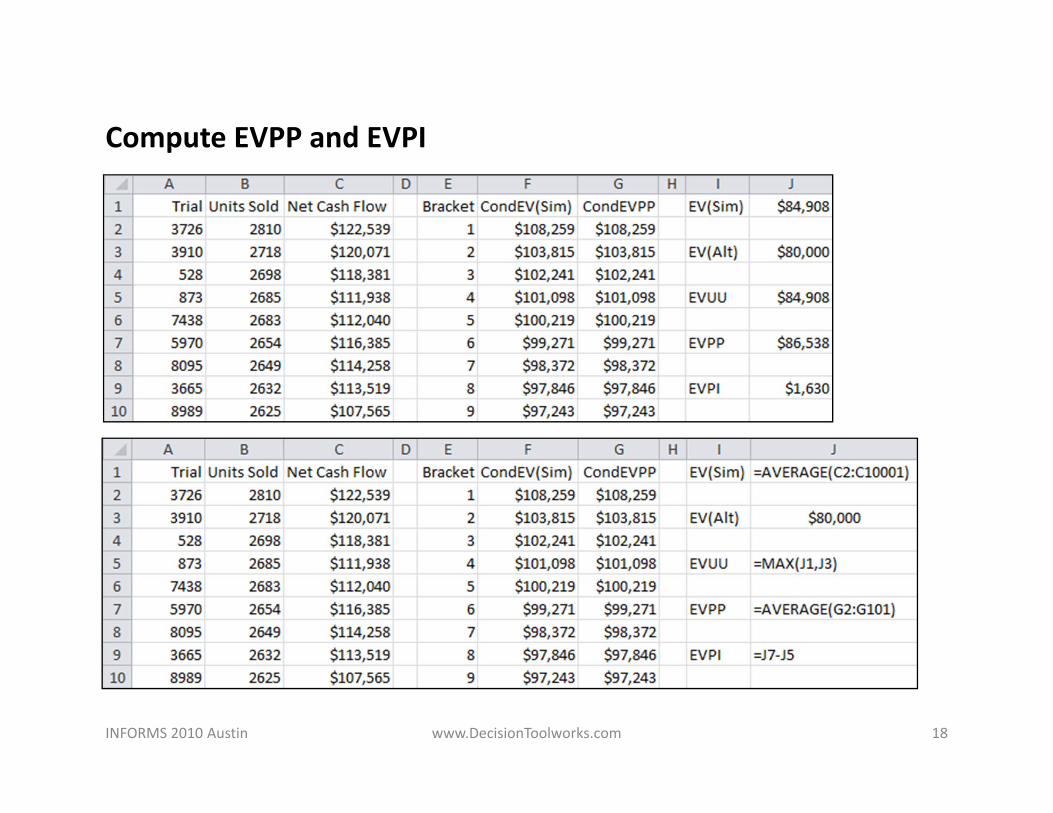
Compute EVPP and EVPI
INFORMS 2010 Austin www.DecisionToolworks.com 18
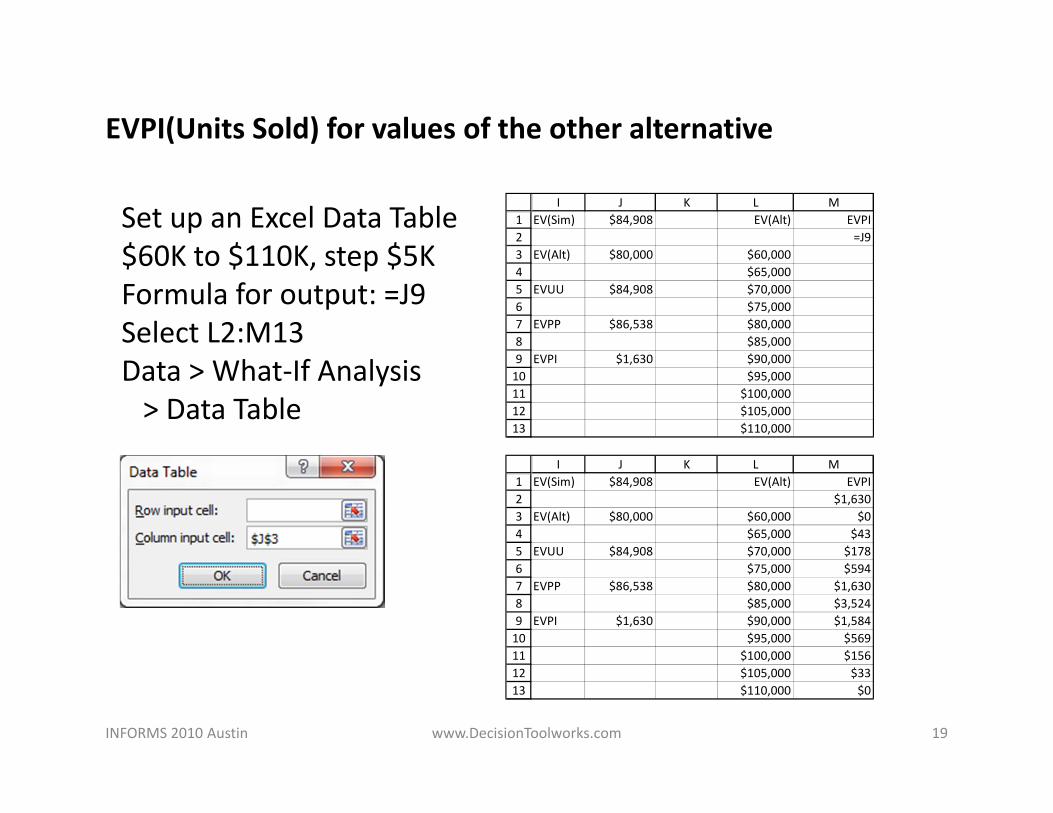
EVPI(Units Sold) for values of the other alternative
INFORMS 2010 Austin www.DecisionToolworks.com 19
Set up an Excel Data Table$60K to $110K, step $5KFormula for output: =J9Select L2:M13Data > What‐If Analysis> Data Table
12345678910111213
I J K L MEV(Sim) $84,908 EV(Alt) EVPI
=J9EV(Alt) $80,000 $60,000
$65,000EVUU $84,908 $70,000
$75,000EVPP $86,538 $80,000
$85,000EVPI $1,630 $90,000
$95,000$100,000$105,000$110,000
12345678910111213
I J K L MEV(Sim) $84,908 EV(Alt) EVPI
$1,630EV(Alt) $80,000 $60,000 $0
$65,000 $43EVUU $84,908 $70,000 $178
$75,000 $594EVPP $86,538 $80,000 $1,630
$85,000 $3,524EVPI $1,630 $90,000 $1,584
$95,000 $569$100,000 $156$105,000 $33$110,000 $0
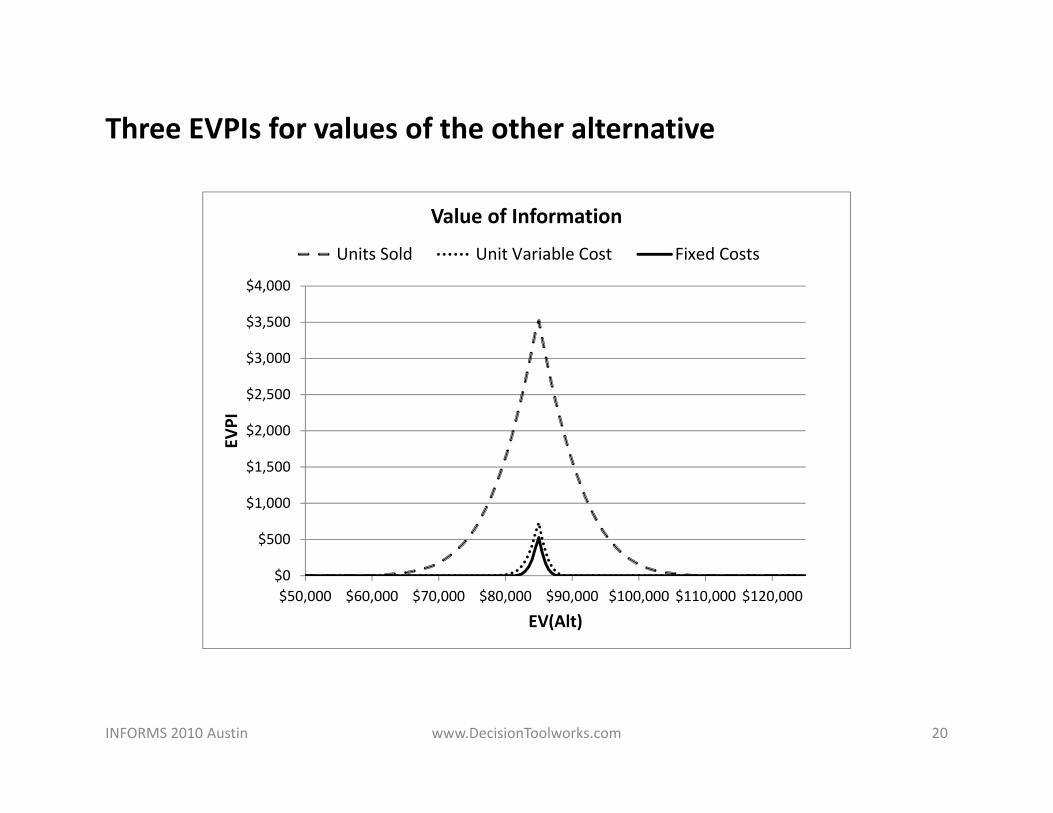
Three EVPIs for values of the other alternative
INFORMS 2010 Austin www.DecisionToolworks.com 20
$0
$500
$1,000
$1,500
$2,000
$2,500
$3,000
$3,500
$4,000
$50,000 $60,000 $70,000 $80,000 $90,000 $100,000 $110,000 $120,000
EVPI
EV(Alt)
Value of Information
Units Sold Unit Variable Cost Fixed Costs
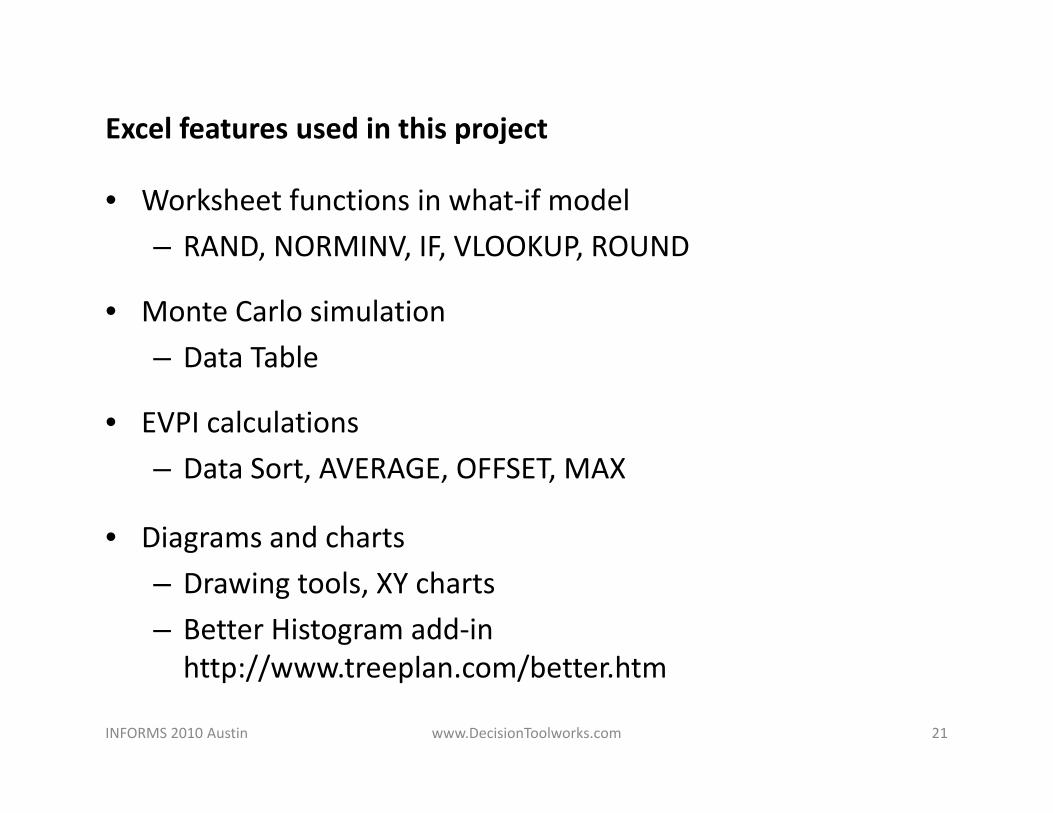
Excel features used in this project
• Worksheet functions in what‐if model– RAND, NORMINV, IF, VLOOKUP, ROUND
• Monte Carlo simulation– Data Table
• EVPI calculations– Data Sort, AVERAGE, OFFSET, MAX
• Diagrams and charts– Drawing tools, XY charts– Better Histogram add‐in http://www.treeplan.com/better.htm
INFORMS 2010 Austin www.DecisionToolworks.com 21
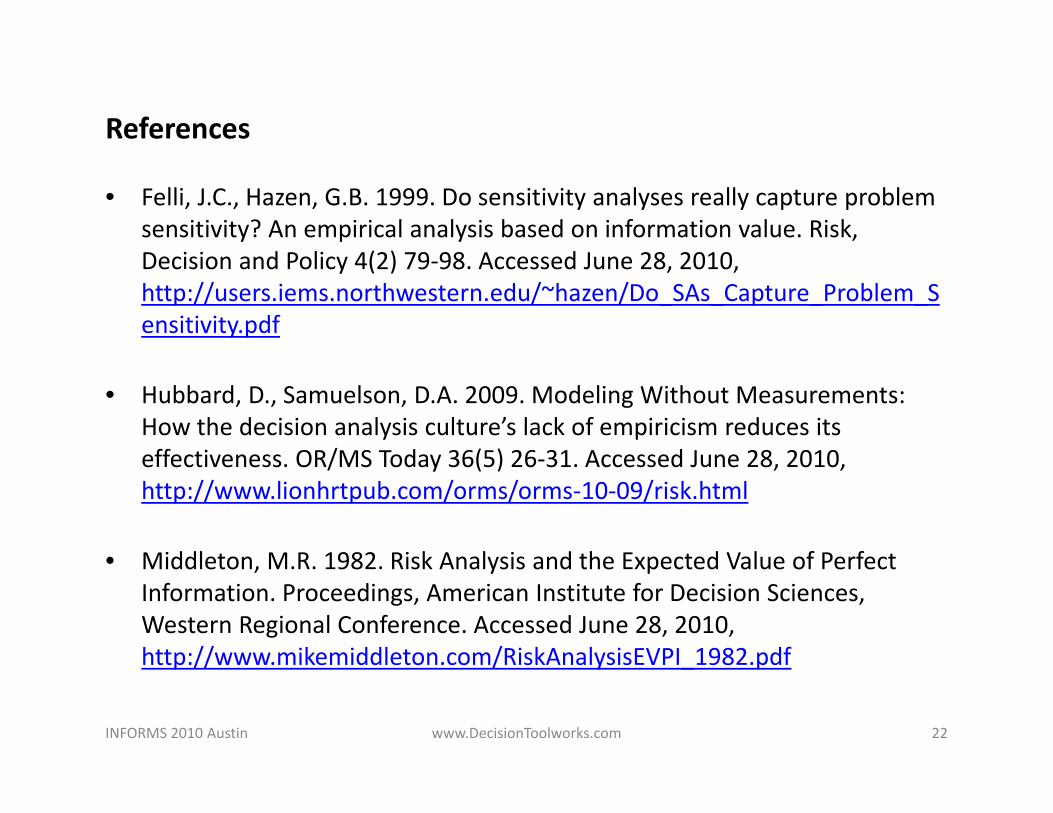
References
• Felli, J.C., Hazen, G.B. 1999. Do sensitivity analyses really capture problem sensitivity? An empirical analysis based on information value. Risk, Decision and Policy 4(2) 79‐98. Accessed June 28, 2010, http://users.iems.northwestern.edu/~hazen/Do_SAs_Capture_Problem_Sensitivity.pdf
• Hubbard, D., Samuelson, D.A. 2009. Modeling Without Measurements: How the decision analysis culture’s lack of empiricism reduces its effectiveness. OR/MS Today 36(5) 26‐31. Accessed June 28, 2010, http://www.lionhrtpub.com/orms/orms‐10‐09/risk.html
• Middleton, M.R. 1982. Risk Analysis and the Expected Value of Perfect Information. Proceedings, American Institute for Decision Sciences, Western Regional Conference. Accessed June 28, 2010, http://www.mikemiddleton.com/RiskAnalysisEVPI_1982.pdf
INFORMS 2010 Austin www.DecisionToolworks.com 22

Value of Informationin
Spreadsheet Monte Carlo Simulation Models
INFORMS 2010 Austin
Michael R. Middleton, Ph.D.Decision [email protected]
PowerPoint Slides, Slides PDF File, and Excel Workbook
http://www.DecisionToolworks.com/SimulationEVPI2010.pptxhttp://www.DecisionToolworks.com/SimulationEVPI2010.pdfhttp://www.DecisionToolworks.com/SimulationEVPI2010.xlsx