Embed Size (px)
Citation preview
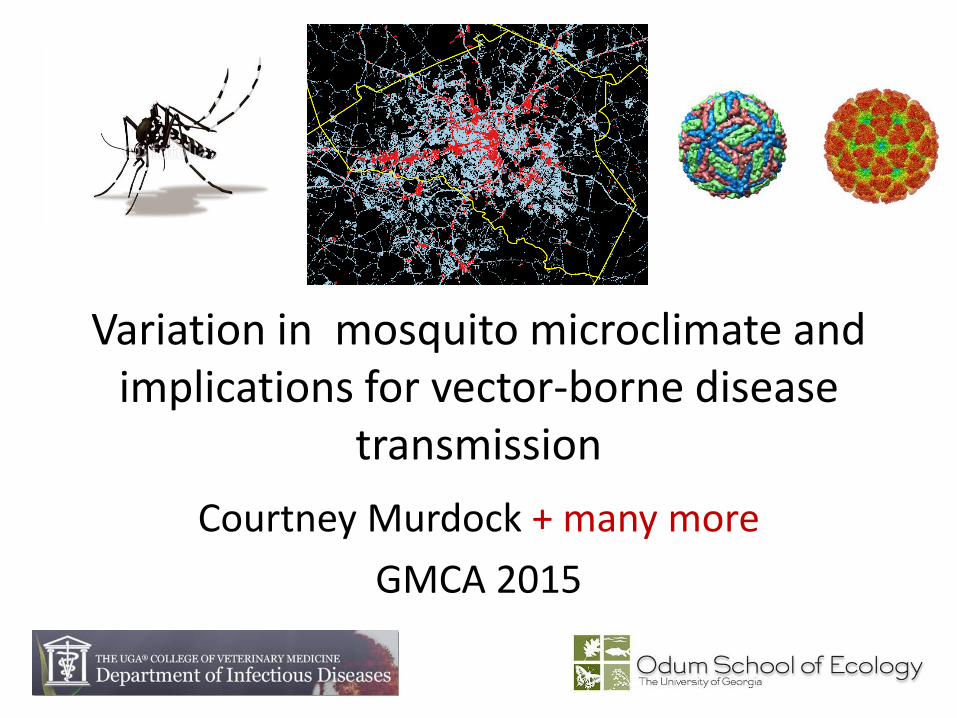
Variation in mosquito microclimate and implications for vector-borne disease
transmission
Courtney Murdock + many more
GMCA 2015
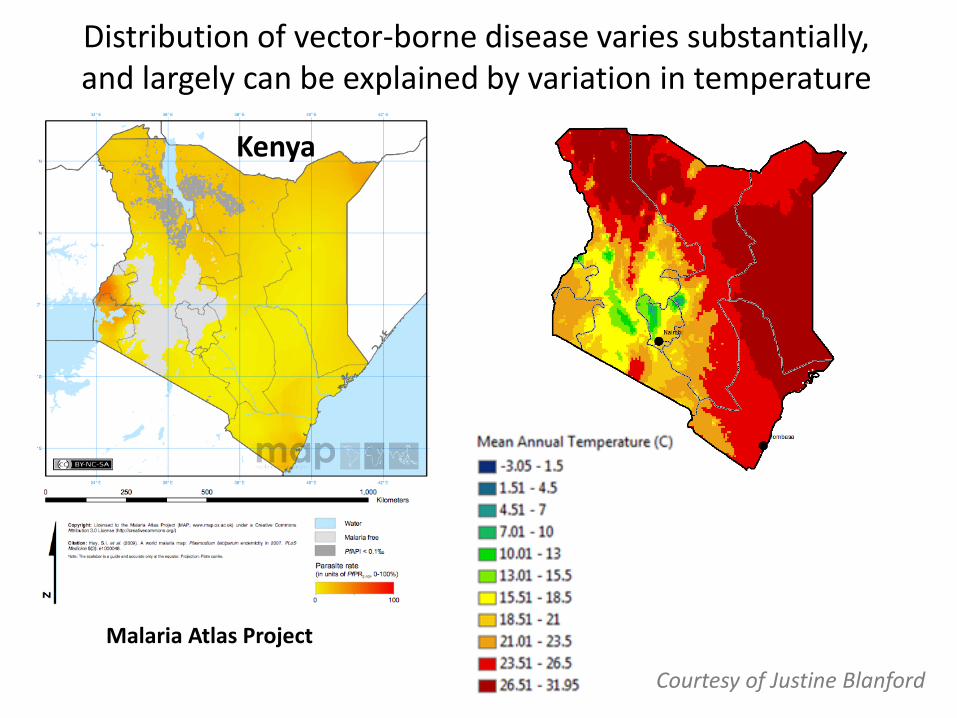
Courtesy of Justine Blanford
Malaria Atlas Project
Kenya
Distribution of vector-borne disease varies substantially,and largely can be explained by variation in temperature
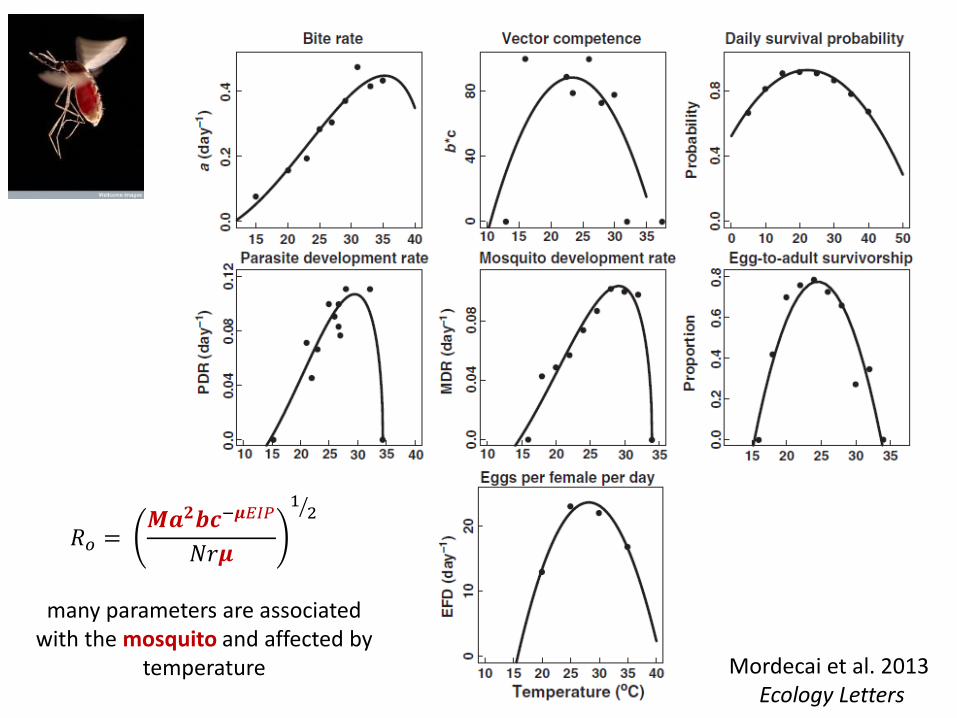
Mordecai et al. 2013 Ecology Letters
𝑅𝑜 =𝑴𝒂𝟐𝒃𝒄−𝝁𝐸𝐼𝑃
𝑁𝑟𝝁
1 2
many parameters are associatedwith the mosquito and affected by
temperature
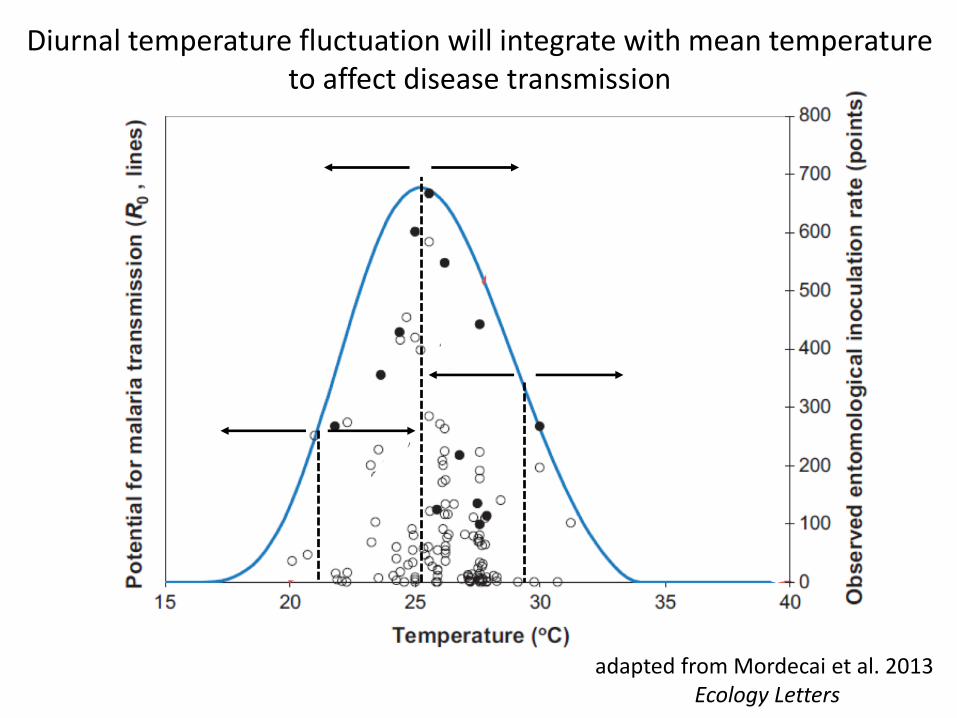
adapted from Mordecai et al. 2013 Ecology Letters
Diurnal temperature fluctuation will integrate with mean temperatureto affect disease transmission
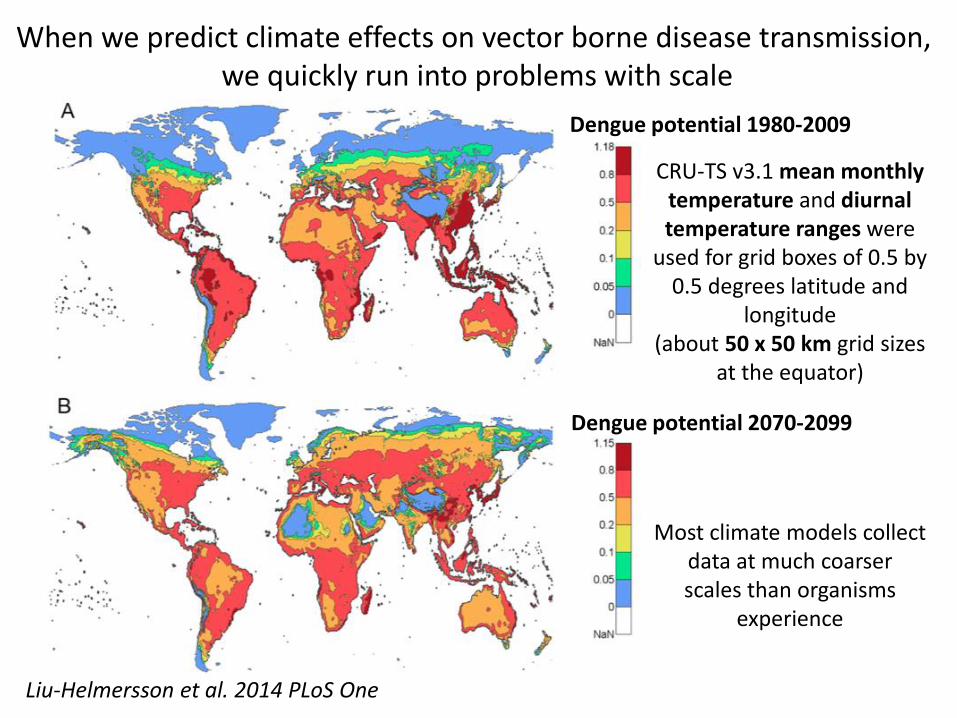
Dengue potential 1980-2009
Dengue potential 2070-2099
Liu-Helmersson et al. 2014 PLoS One
CRU-TS v3.1 mean monthly temperature and diurnal temperature ranges were
used for grid boxes of 0.5 by 0.5 degrees latitude and
longitude(about 50 x 50 km grid sizes
at the equator)
When we predict climate effects on vector borne disease transmission, we quickly run into problems with scale
Most climate models collectdata at much coarserscales than organisms
experience
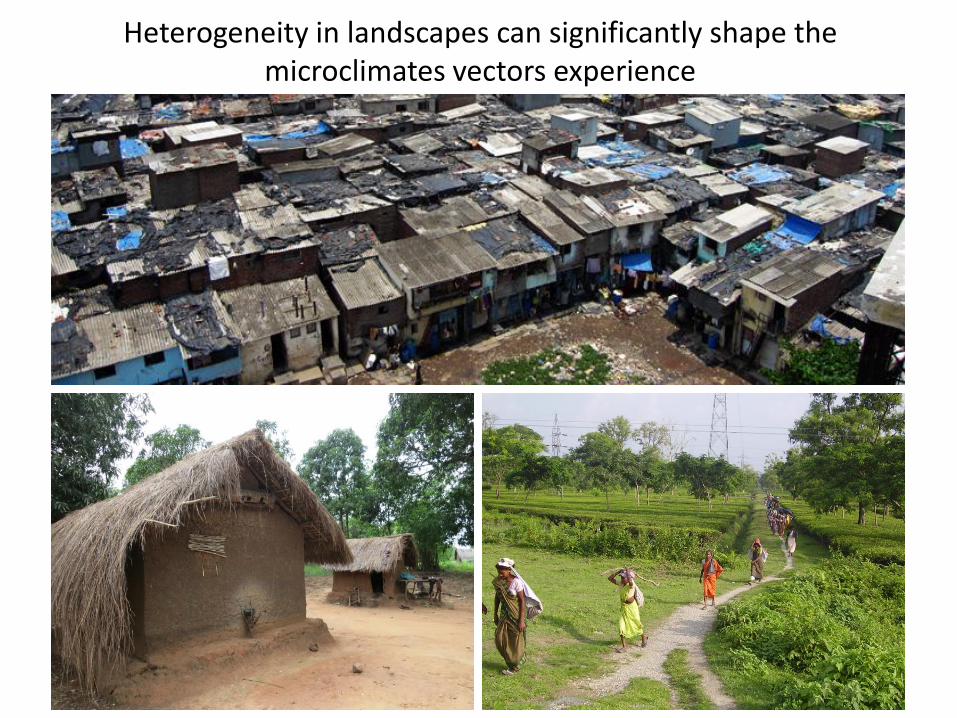
Heterogeneity in landscapes can significantly shape themicroclimates vectors experience
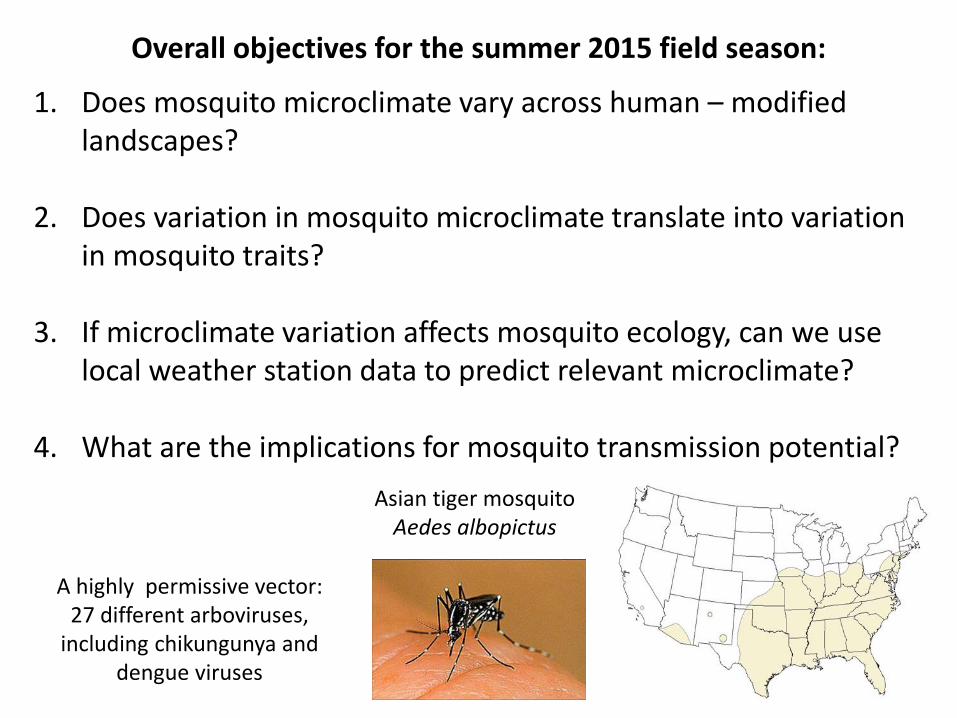
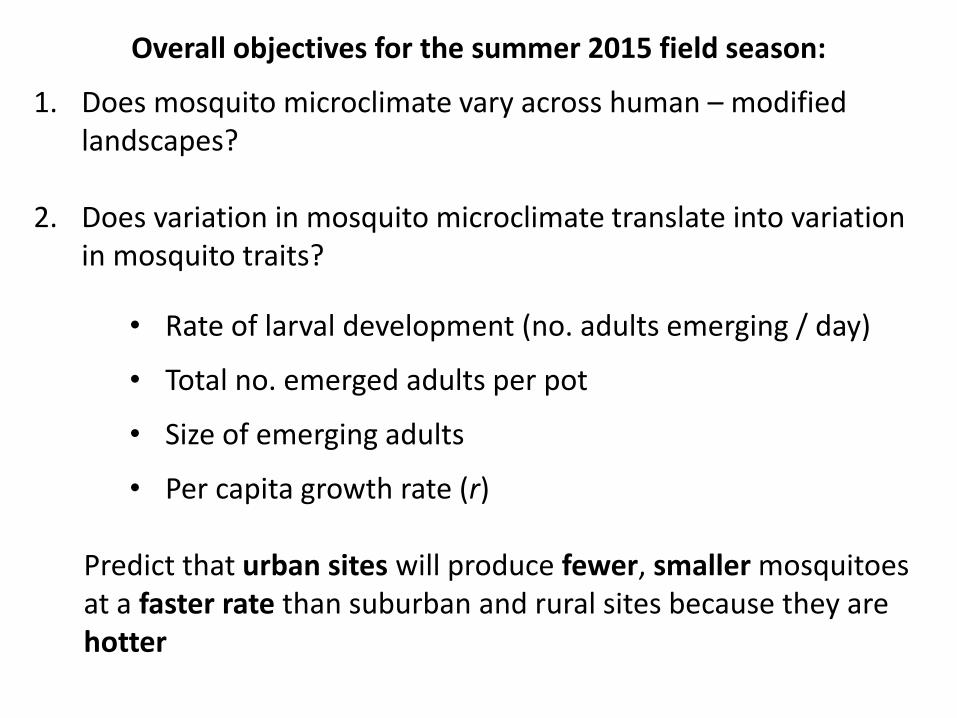
Overall objectives for the summer 2015 field season:
1. Does mosquito microclimate vary across human – modified landscapes?
2. Does variation in mosquito microclimate translate into variation in mosquito traits?
3. If microclimate variation affects mosquito ecology, can we use local weather station data to predict relevant microclimate?
4. What are the implications for mosquito transmission potential?
A highly permissive vector:27 different arboviruses,
including chikungunya and dengue viruses
Asian tiger mosquitoAedes albopictus
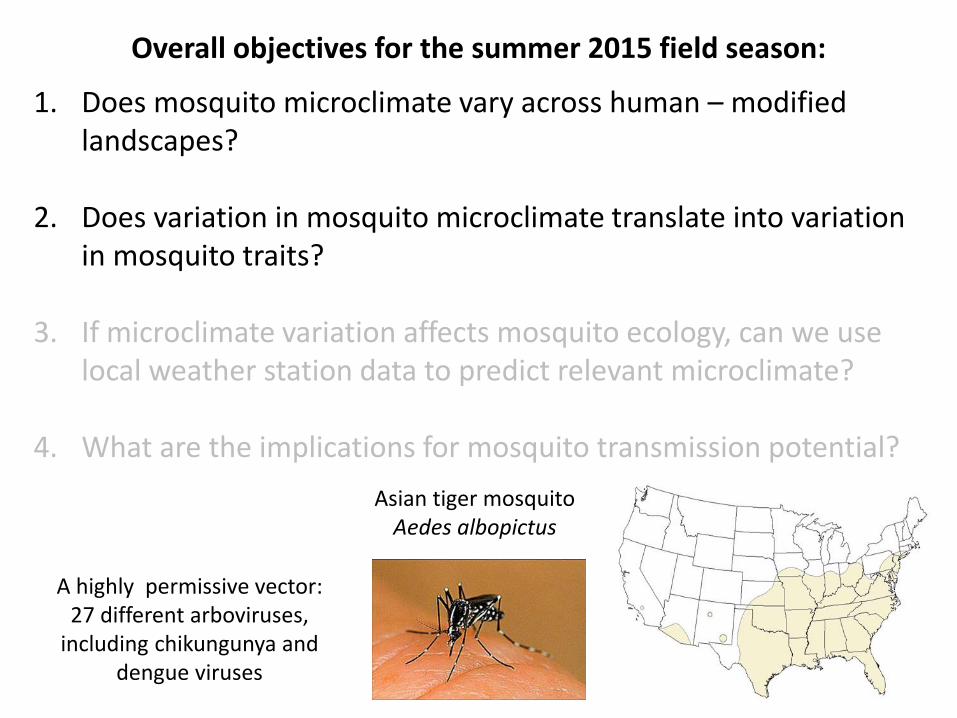
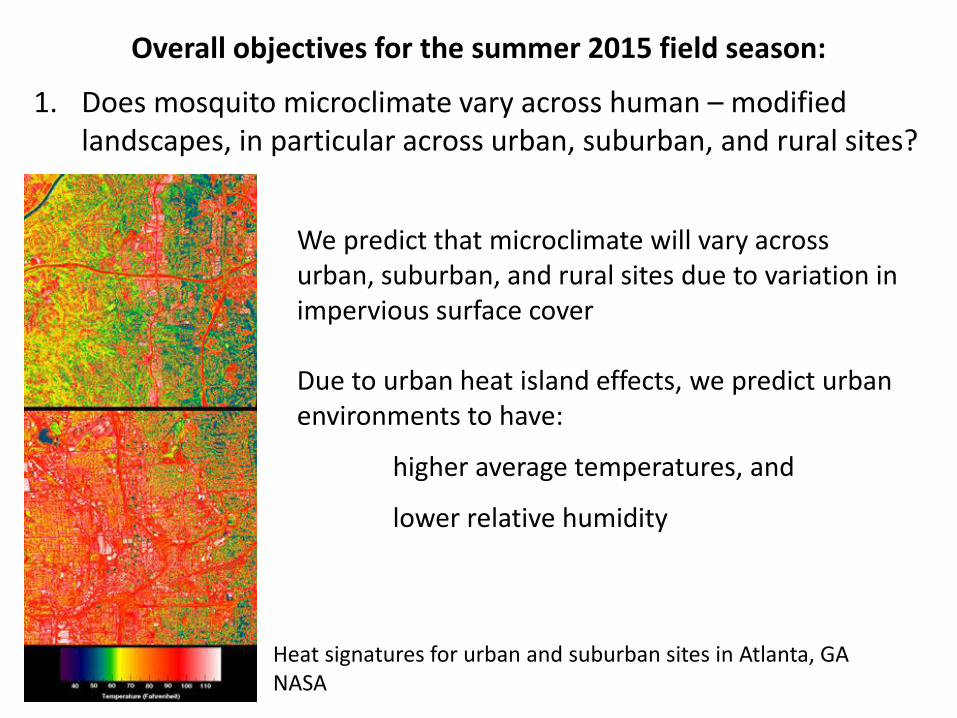
Overall objectives for the summer 2015 field season:
1. Does mosquito microclimate vary across human – modified landscapes, in particular across urban, suburban, and rural sites?
We predict that microclimate will vary acrossurban, suburban, and rural sites due to variation in impervious surface cover
Due to urban heat island effects, we predict urbanenvironments to have:
higher average temperatures, and
lower relative humidity
Heat signatures for urban and suburban sites in Atlanta, GANASA
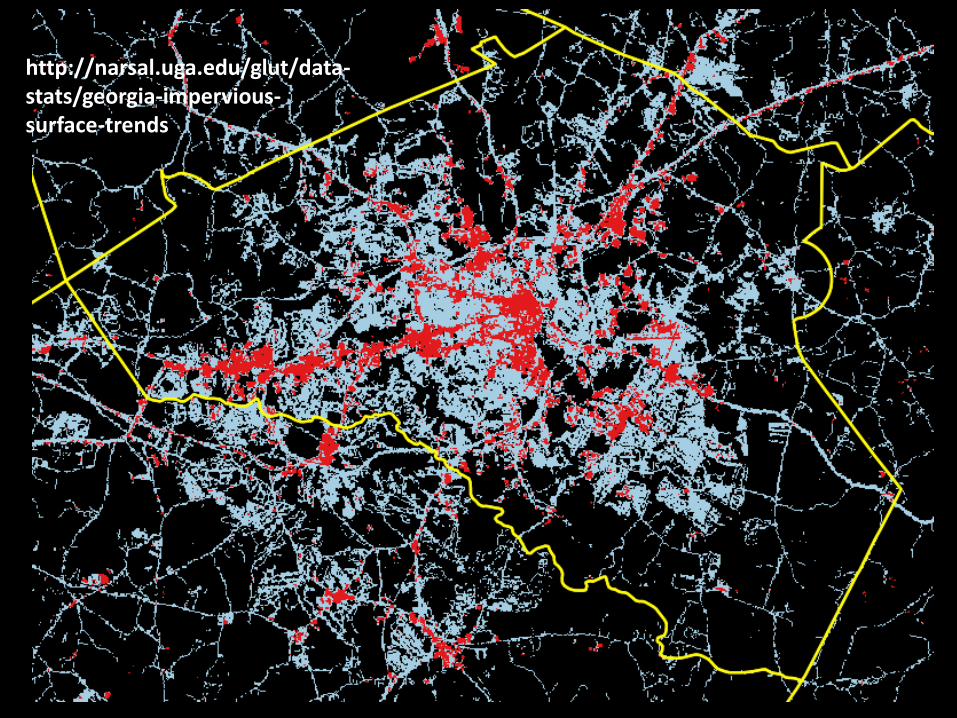
http://narsal.uga.edu/glut/data-stats/georgia-impervious-surface-trends
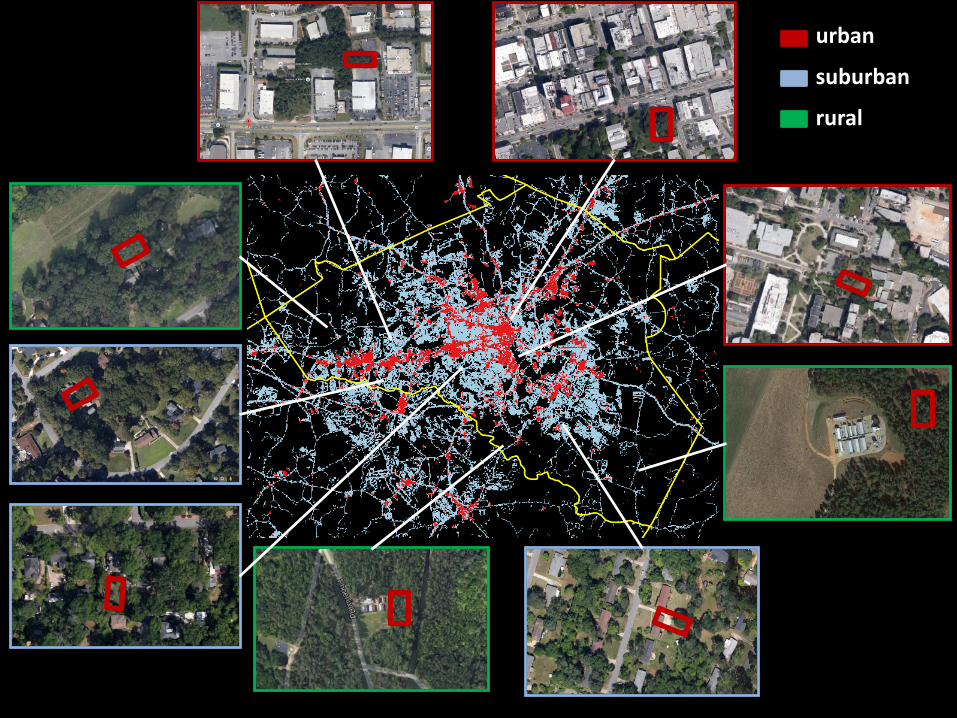
urban
suburban
rural
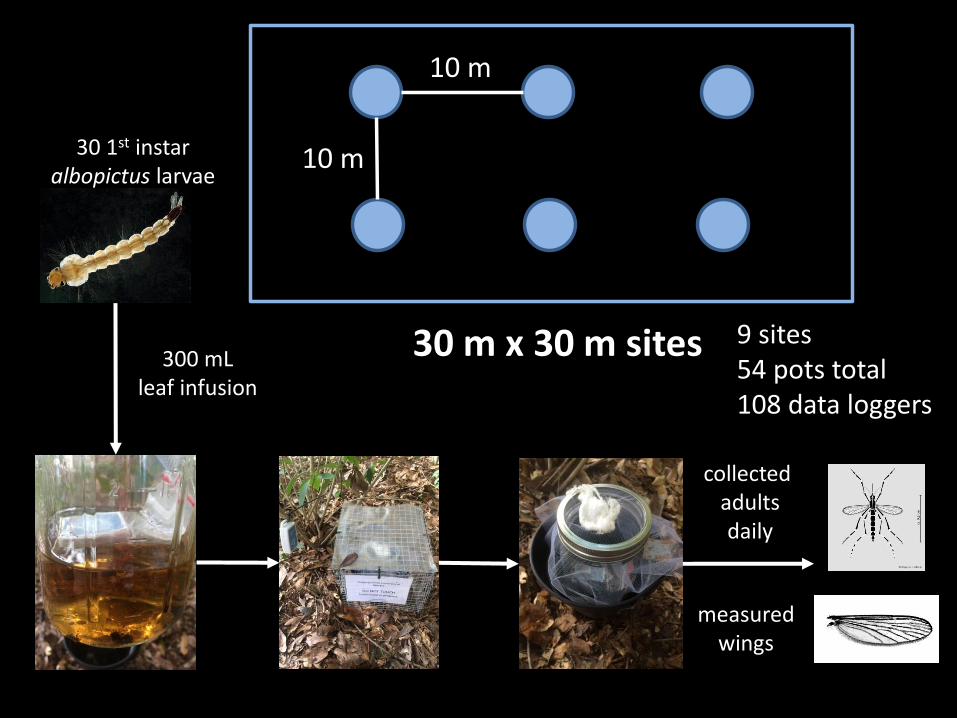
30 m x 30 m sites
10 m
10 m30 1st instaralbopictus larvae
300 mLleaf infusion
collected adultsdaily
measuredwings
9 sites54 pots total108 data loggers
Overall objectives for the summer 2015 field season:
1. Does mosquito microclimate vary across human – modified landscapes?
2. Does variation in mosquito microclimate translate into variation in mosquito traits?
• Rate of larval development (no. adults emerging / day)
• Total no. emerged adults per pot
• Size of emerging adults
• Per capita growth rate (r)
Predict that urban sites will produce fewer, smaller mosquitoes at a faster rate than suburban and rural sites because they are hotter
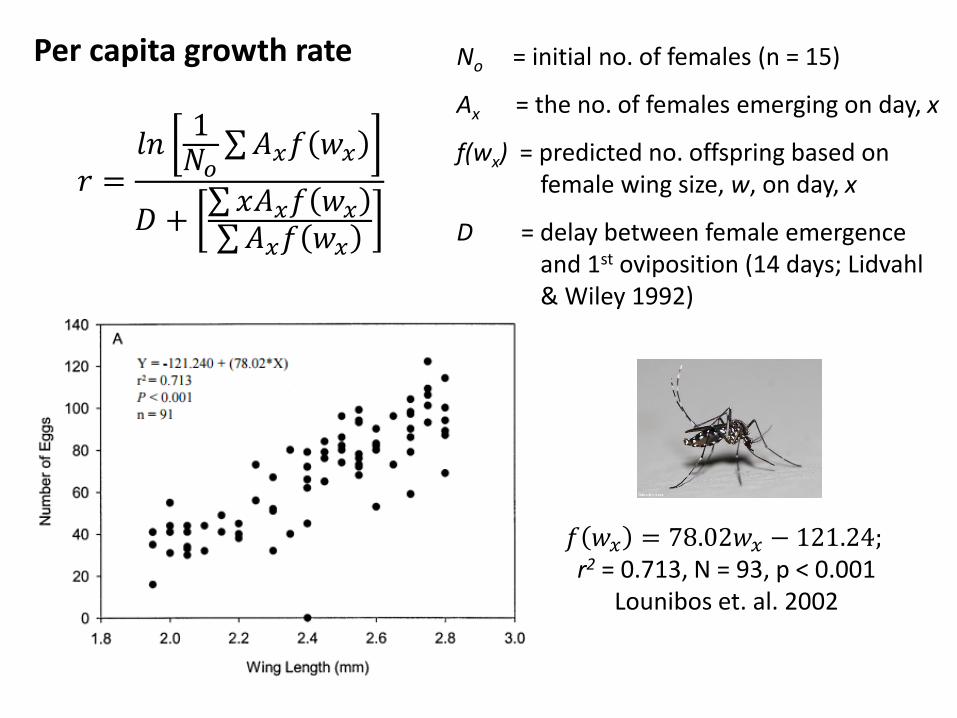
No = initial no. of females (n = 15)
Ax = the no. of females emerging on day, x
f(wx) = predicted no. offspring based on female wing size, w, on day, x
D = delay between female emergence and 1st oviposition (14 days; Lidvahl& Wiley 1992)
𝑟 =𝑙𝑛
1𝑁𝑜
𝐴𝑥𝑓 𝑤𝑥
𝐷 + 𝑥𝐴𝑥𝑓 𝑤𝑥
𝐴𝑥𝑓 𝑤𝑥
Per capita growth rate
𝑓 𝑤𝑥 = 78.02𝑤𝑥 − 121.24;r2 = 0.713, N = 93, p < 0.001
Lounibos et. al. 2002
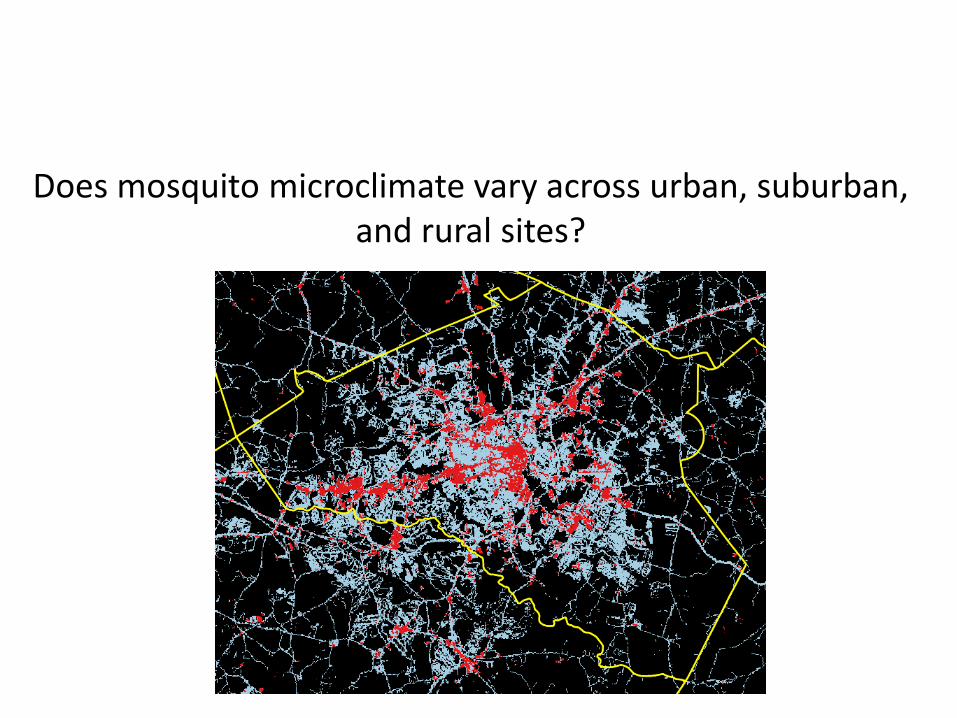
Does mosquito microclimate vary across urban, suburban, and rural sites?
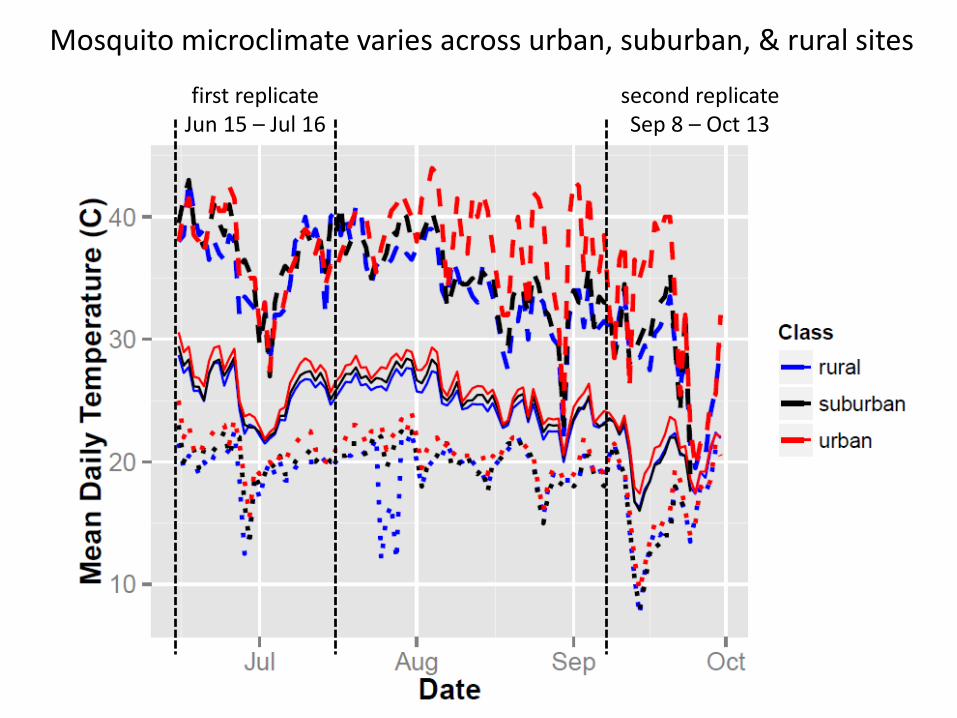
first replicateJun 15 – Jul 16
second replicateSep 8 – Oct 13
Mosquito microclimate varies across urban, suburban, & rural sites
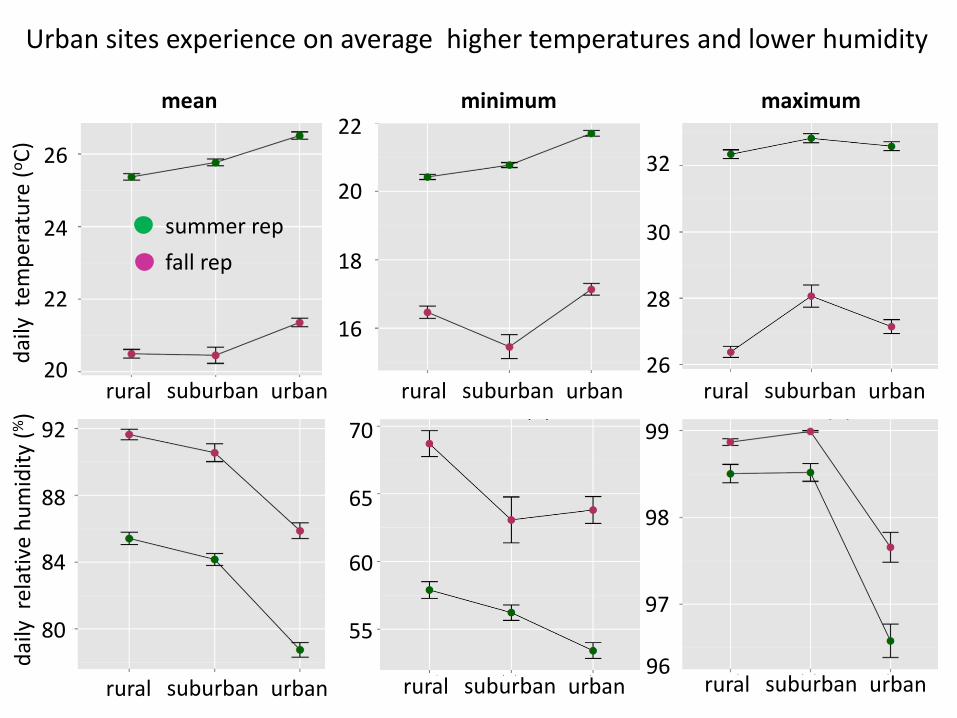
rural suburban urban
dai
ly r
elat
ive
hu
mid
ity
(%)
80
84
88
92
rural suburban urban
55
60
65
70
rural suburban urban
97
98
99
96
Urban sites experience on average higher temperatures and lower humidity
rural suburban urban
minimum
16
18
20
22
rural suburban urban
maximum
26
28
30
32
rural suburban urban
mean
20
22
24
26
dai
ly t
emp
erat
ure
(oC
)
summer rep
fall rep
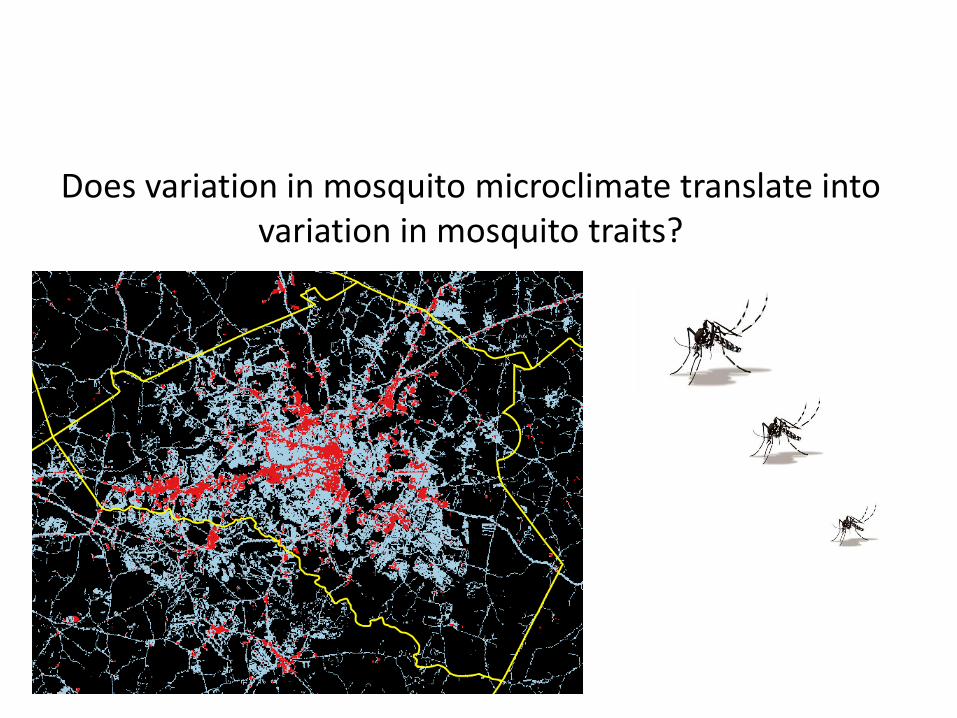
Does variation in mosquito microclimate translate into variation in mosquito traits?
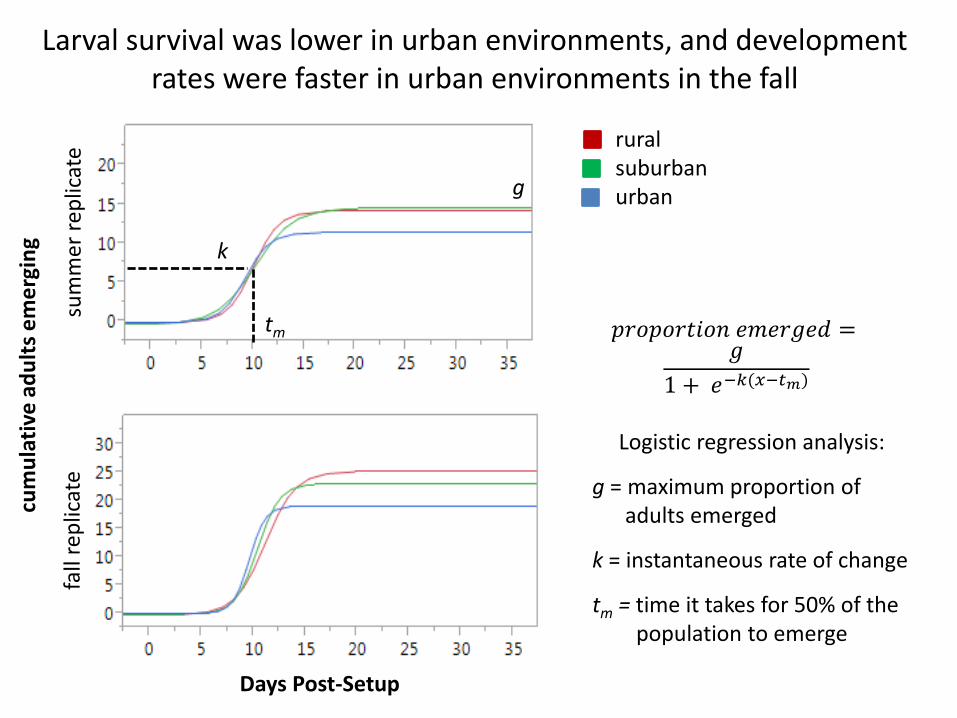
Larval survival was lower in urban environments, and development rates were faster in urban environments in the fall
Days Post-Setup
cum
ula
tive
ad
ult
s e
me
rgin
g
sum
me
r re
plic
ate
fall
rep
licat
e
Logistic regression analysis:
g = maximum proportion of adults emerged
k = instantaneous rate of change
tm = time it takes for 50% of thepopulation to emerge
𝑝𝑟𝑜𝑝𝑜𝑟𝑡𝑖𝑜𝑛 𝑒𝑚𝑒𝑟𝑔𝑒𝑑 =𝑔
1 + 𝑒−𝑘(𝑥−𝑡𝑚)
g
k
tm
ruralsuburbanurban
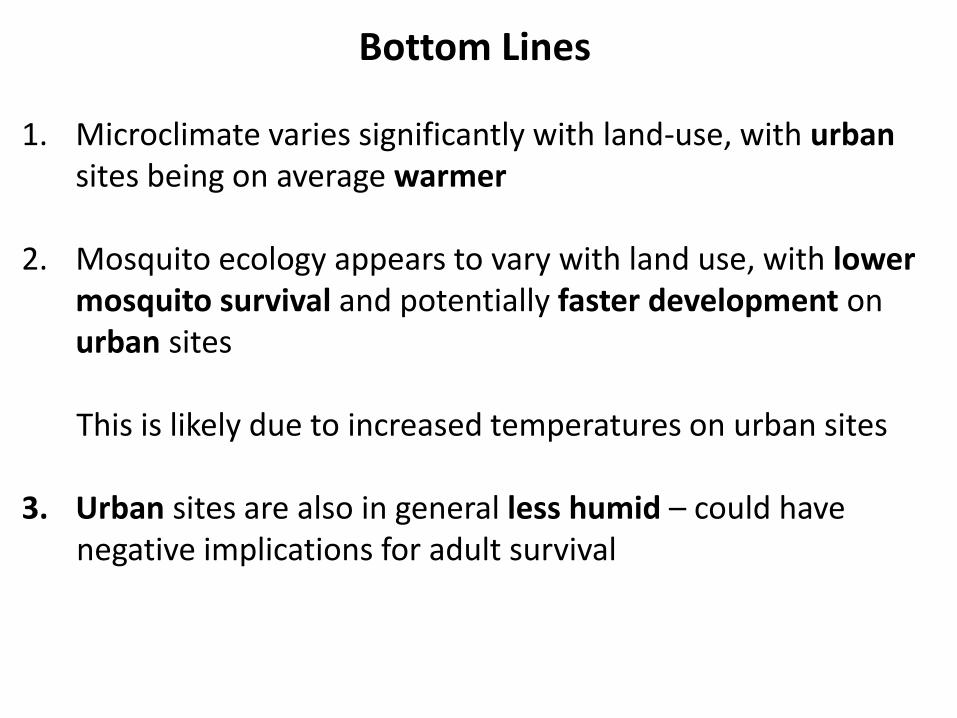
Bottom Lines
1. Microclimate varies significantly with land-use, with urbansites being on average warmer
2. Mosquito ecology appears to vary with land use, with lower mosquito survival and potentially faster development on urban sites
This is likely due to increased temperatures on urban sites
3. Urban sites are also in general less humid – could have negative implications for adult survival
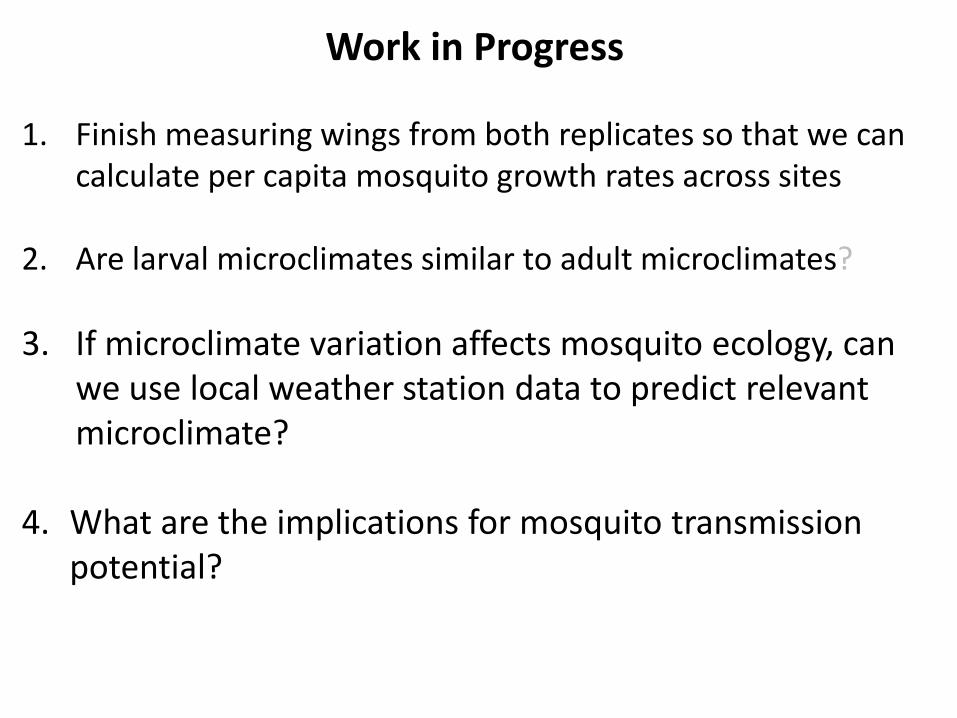
Work in Progress
1. Finish measuring wings from both replicates so that we can calculate per capita mosquito growth rates across sites
2. Are larval microclimates similar to adult microclimates?
3. If microclimate variation affects mosquito ecology, can we use local weather station data to predict relevant microclimate?
4. What are the implications for mosquito transmission potential?
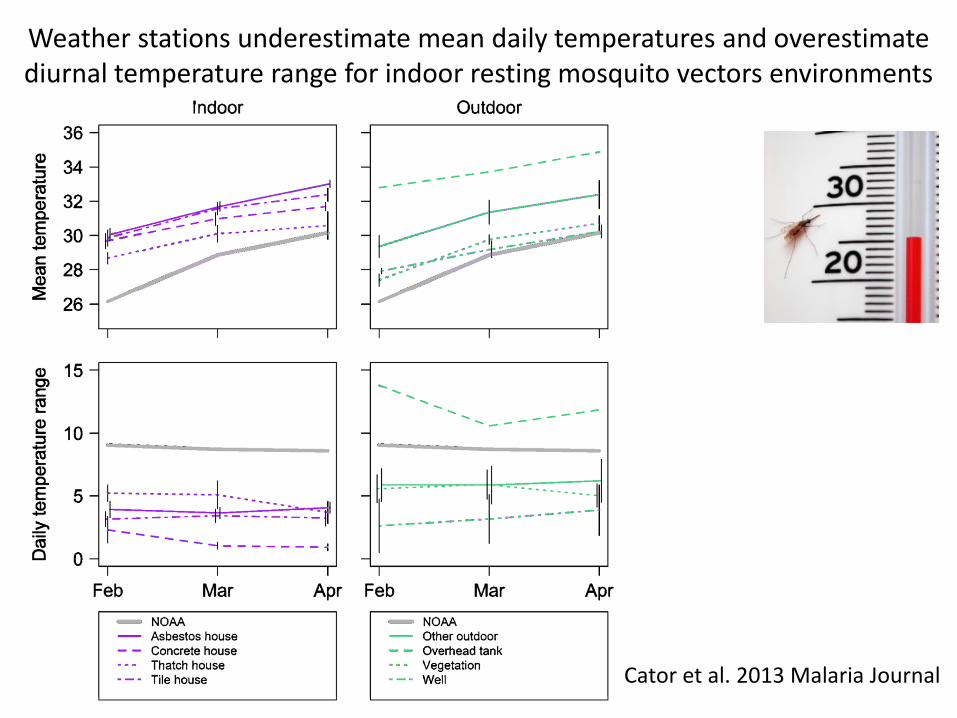
Weather stations underestimate mean daily temperatures and overestimate diurnal temperature range for indoor resting mosquito vectors environments
Cator et al. 2013 Malaria Journal
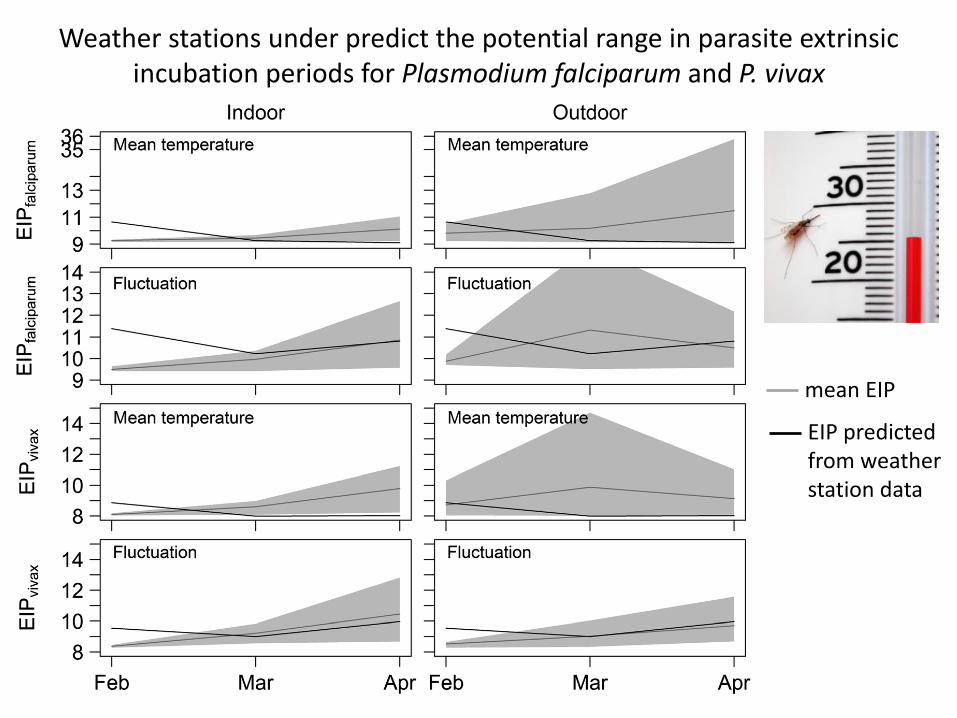
Weather stations under predict the potential range in parasite extrinsic incubation periods for Plasmodium falciparum and P. vivax
mean EIP
EIP predictedfrom weatherstation data
Work in Progress
1. Finish measuring wings from both replicates so that we can calculate per capita mosquito growth rates across sites
2. Are larval microclimates similar to adult microclimates?
3. If microclimate variation affects mosquito ecology, can we use local weather station data to predict relevant microclimate?
4. What are the implications for mosquito transmission potential?
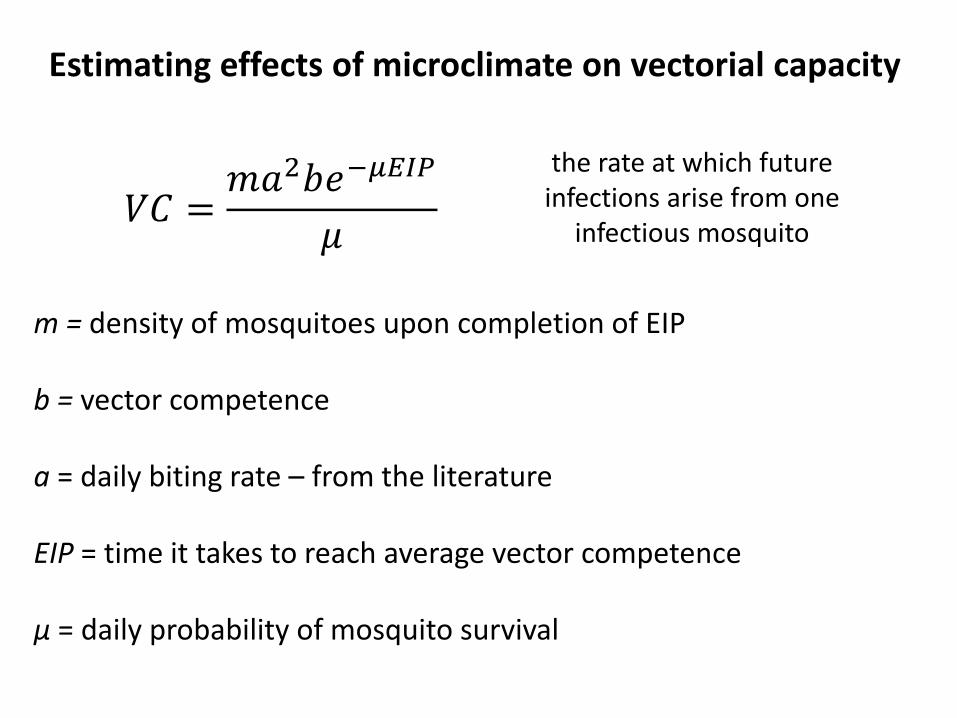
Estimating effects of microclimate on vectorial capacity
m = density of mosquitoes upon completion of EIP
b = vector competence
a = daily biting rate – from the literature
EIP = time it takes to reach average vector competence
µ = daily probability of mosquito survival
𝑉𝐶 =𝑚𝑎2𝑏𝑒−𝜇𝐸𝐼𝑃
𝜇
the rate at which futureinfections arise from one
infectious mosquito
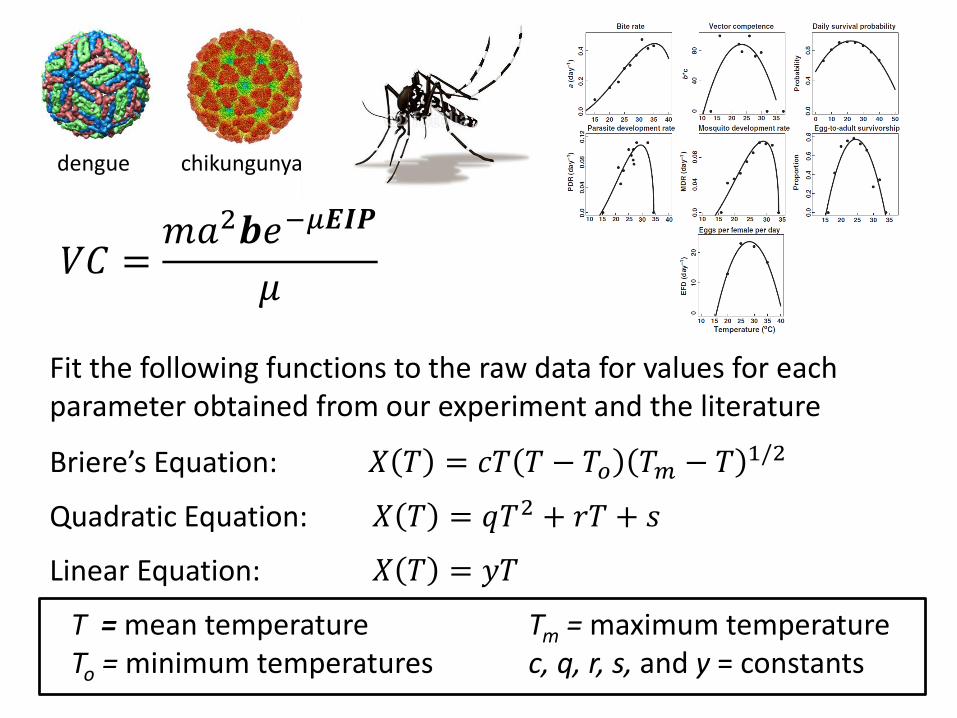
Fit the following functions to the raw data for values for each parameter obtained from our experiment and the literature
Briere’s Equation: 𝑋 𝑇 = 𝑐𝑇 𝑇 − 𝑇𝑜 𝑇𝑚 − 𝑇 1/2
Quadratic Equation: 𝑋 𝑇 = 𝑞𝑇2 + 𝑟𝑇 + 𝑠
Linear Equation: 𝑋 𝑇 = 𝑦𝑇
T = mean temperature Tm = maximum temperatureTo = minimum temperatures c, q, r, s, and y = constants
𝑉𝐶 =𝑚𝑎2𝒃𝑒−𝜇𝑬𝑰𝑷
𝜇
dengue chikungunya
Estimating effects of microclimate on vectorialcapacity
Fit all models using non-linear least squares and use AIC to choose among candidate models (adjusted for small sample sizes)
Build in temperature dependence using above relationships into vectorial capacity:
𝑉𝐶 𝑇 =𝑚 𝑇 𝑎 𝑇 2𝑏 𝑇 𝑒−𝜇 𝑇 𝐸𝐼𝑃 𝑇
𝜇 𝑇
Collaborators The Mosquito Team
John DrakeUGA
Anne ElliotUGA
Mark BrownUGA
Cristina Huertas-Diaz, Blanka Tesla, Kerri MiazgowiczMichelle Evans, Hannah Feltner, Jennifer Cyr
UGA
Taylor McClanahanREU Program
Population Biology of Infectious Diseases REU Program
Funding
College of Veterinary Medicine


![Mosquito [Crowood]](https://img.pdfslide.tips/doc/110x75/577cd3b91a28ab9e7897690d/mosquito-crowood.jpg)


![Mosquito [SAM 1]](https://img.pdfslide.tips/doc/110x75/577ccd6f1a28ab9e788c63b2/mosquito-sam-1.jpg)