Embed Size (px)
Citation preview
VERA 43 GHzによる銀河系中心核 Sgr A*のモニター観測
秋山 和徳 (東京大学 / 国立天文台 水沢VLBI観測所 修士2年)
Collaborators
高橋労太 (苫小牧高専), 本間希樹, 小山友明、小林秀行 (国立天文台 水沢VLBI観測所)
MVO UM 2011/9/28
Eisenhauer+2005
VLA 90cm
VLA 2 cm
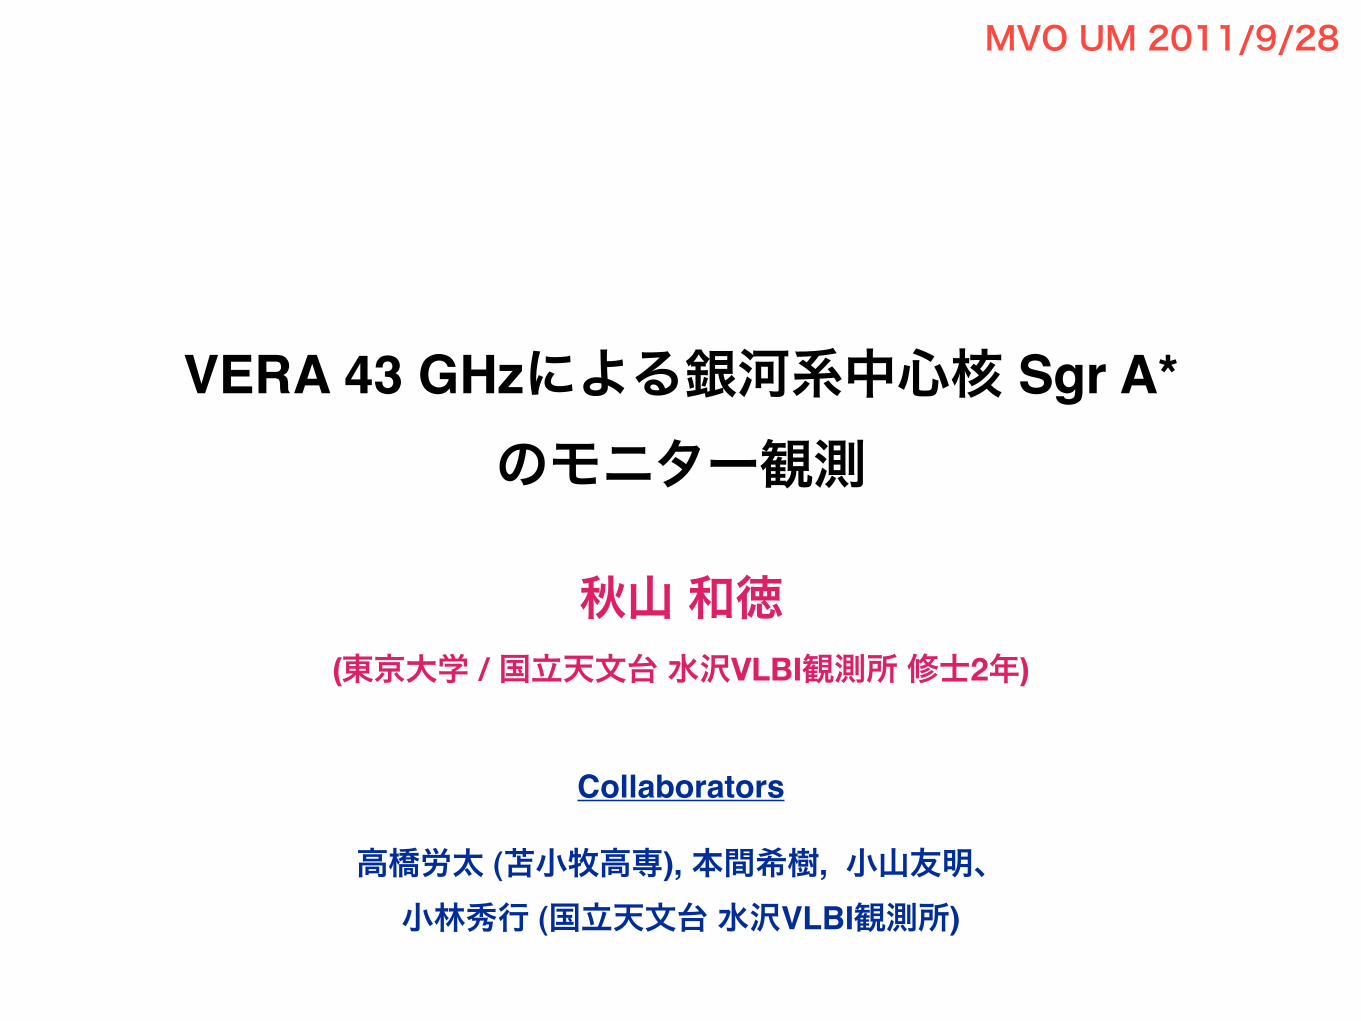
Sgr A* is the nearest AGN!
1°~150 pc
Sgr A
a coherent flow with a systematic motion thatis decoupled from the stellar orbits. Under-standing the kinematics of the system of ion-ized gas is complicated by our incompleteview of its three-dimensional geometry withrespect to Sgr A* and is made more difficultby the interaction of the orbiting gas withnongravitational forces due to collisions withthe winds produced by the central cluster ofhot, mass-losing stars. Recently, the gas ki-nematics and the geometry of the ionizedflow were determined by combining thetransverse velocities measured over 9 years(Fig. 3B) and the radial velocities of ionizedgas (34). In the region within the central 10!of Sgr A*, similar proper motion results havealso been shown (35). The predominant com-ponent of the motion in the plane of the sky isfrom east to west for many of the features,with the exception of a few where the veloc-ity of ionized gas is anomalously large, pos-sibly the result of the interaction between theorbiting ionized gas and ionized stellarwinds. It appears that the overall flow ofionized gas in the northern arm originates inthe northeast with negative velocities in theorbital plane. The ionized gas follows an orbitaltrajectory to the southwest as it crosses a dis-turbed region of the CND and passes behindSgr A* before it moves to the northwest (21,36) (Fig. 3C). The strong gravitational potentialdue to the large concentration of dark matternear Sgr A* is responsible for velocity gradi-ents exceeding 600 km s"1 pc"1.
Moving out from the Galactic center, to ascale of 10 to 20 pc, radio continuum obser-vations show a prominent, nonthermal, con-tinuum shell-like structure, known as Sgr AEast. This extended source is superimposedonto the thermal source Sgr A West and theCND (Fig. 4). Low-frequency continuum ob-servations show a decrease in the brightnessof the Sgr A East shell at the position of SgrA West, which results from free-free absorp-tion (involves a change in the motion of theelectron from one unbound orbit to another)of the radiation from the former by thermalgas in the latter. A good portion of Sgr A Eastmust therefore lie behind Sgr A West (37–39).
Sgr A*: Colliding Winds and TheirInteraction with the Black HoleThe highly compact nature of the distributeddark mass seems to suggest that we aredealing with a pointlike object. The gravi-tational field associated with such a sourceintensifies rapidly with decreasing distanceto the origin, providing the necessary ener-gy and confining power to stress any infall-ing gas to temperatures in excess of a bil-lion degrees, which may explain the emis-sivity that produces the radiation we seefrom Sgr A*. However, suppose we playthe Devil’s advocate and consider the pos-
sibility that the dark matter is not in theform of a single massive black hole. In thatcase, whatever the composition of the dis-tributed dark mass concentration is, onewould be left with the daunting task ofaccounting for the nature of Sgr A* itself,without the benefit of invoking the deepwell of gravitational potential of a pointlikeobject (40). Recently, Melia et al. (41)showed that a distribution of dark matter,even in the form of #10 MJ black holes,simply could not reproduce the spectrum ofSgr A*, because the gas in this region couldnot be squeezed to sufficiently high densi-ties and temperatures to produce the ob-served radiative emission. However, ablack hole exerts a stress on its nearbyenvironment, which contains, in addition tothe large-scale gaseous features describedabove, rather strong winds in and aroundSgr A* itself. The close proximity of theheavy mass-losing stars of IRS 16 leadsinevitably to frequent collisions betweentheir winds, which results in a tessellationof broken flow segments when viewed fromour perspective. This process not only dis-rupts the spherical winds from these stars,but (very important as far as the black holeis concerned) it facilitates the capture ofgas by this object by reducing the plasma’skinetic energy and thereby curtailing itsability to escape from the strong gravita-tional field.
The portion of this wind plasma capturedby the black hole falls inward toward thecenter with increasing speed as it approachesthe event horizon. In the more energetic coresof distant galaxies, the outward push from theescaping radiation can decelerate the flow;this is not so in the Galactic center. Sgr A*does not radiate at a level sufficient to drivethis infalling gas away, and the end result isthat virtually all of the plasma within a tenthof a light-year or so is funneled into the blackhole. Observationally, the key issue is whythe infalling gas maintains a low radiativeefficiency. If we naı̈vely take the calculatedaccretion rate onto the black hole and esti-mate the radiative power produced by theensuing release of gravitational energy (42),we infer a total luminosity in excess of whatis actually measured for Sgr A*. In fact, someestimates have it at 104 or 105 times theactual observed power.
The observations do not yet provide suf-ficient information for us to identify thephysics of accretion when the infalling gaspenetrates to within about 103 or 104
Schwarzschild radii of the central object(no light can escape when it has crossed theSchwarzschild radius of a black hole). Thecaptured plasma is magnetized and highlyionized, but it is not clear how much spe-cific angular momentum it carries, what theintensity of the magnetic field is, what the
relative importance of nonthermal and ther-mal particles is, and whether the plasmaseparates into a two-temperature fluid. As aresult, a variety of assumptions are possible(and consistent with the observations),which results in a range of different inter-pretations. Beckert et al. (43) suggest thatthe radiation from Sgr A* results fromshock waves in the accreting plasma, whichproduce a power-law electron energy dis-tribution that is truncated by strong cool-ing. This forms a “quasi”–mono-energeticdistribution. The overall emission, which isstrictly nonthermal, is suppressed by con-straining the number density of relativisticparticles and the intensity of the magneticfield (at about 5 to 10 G). Falcke et al. (44 ),on the other hand, assume that the infallingplasma eventually produces a jet of power-law electrons whose number density varieswith radius in the expulsion. The overallemission, which is a sum of nonthermalcomponents, is also suppressed by con-straining the particle number density andhence the equipartition magnetic field, bothof which are assumed to be scaled by aslowly accreting fossilized disk. In a modeldeveloped by Narayan et al. (45, 46 ), theinfalling gas carries more angular momen-tum, and a disk forms with an outer radius ofabout 105 Schwarzschild radii. Emission asso-ciated with the dissipation of the additionalangular momentum is suppressed if the electrontemperature (Te) is much lower than that of theprotons (Tp) (Te $$ Tp), because it is the elec-trons that do the radiating.
One reason why the emissivity of SgrA* is so low is that the magnetic field in thecaptured plasma is below its equipartition
Right ascension (E1950)
Dec
linat
ion
(E19
50)
Fig. 4. VLA radio continuum image of the Ga-lactic center showing the shell-like structure ofnonthermal Sgr A East (light blue and green)and the spiral-shaped structure of thermal SgrA West (red) at % & 6 cm with a resolution of3.4 ' 2.9 arc sec. A cluster of HII regionsassociated with Sgr A East is also evident to theeast of the shell. The weak extended features(dark blue) surrounding the shell are part of theSgr A East halo.
www.sciencemag.org SCIENCE VOL 287 7 JANUARY 2000 87
T H E M I L K Y W A Y
on
Sept
embe
r 6, 2
010
ww
w.s
cien
cem
ag.o
rgD
ownl
oade
d fro
m
4’ ~ 9 pc
7 Aug 2001 16:19 AR AR137-09-COLOR.tex AR137-09-COLOR.SGM ARv2(2001/05/10) P1: GDL
Figure 1 Subarcsec (2 cm) image of Sgr A West and Sgr A∗. The cometary-likefeature to the north of Sgr A∗ (identified as the bright central spot in this image) isassociated with the luminous star IRS 7, seen at the corresponding location in Figure 2.(From Yusef-Zadeh & Wandle 1993.)
Figure 4 A radio image of ionized gas (Sgr A West) at λ = 1.2 cm, with its three-arm appearance (orange) superimposed on the distribution of HCN emission (red )(Wright et al. 1993). Most of the ionized gas is distributed in the molecular cavity. Atthe distance to the Galactic Center, this image corresponds to a size of approximately4 pc on each side. (From Yusef-Zadeh, Melia, & Wandle 2000.)
Ann
u. R
ev. A
stro.
Astr
ophy
s. 20
01.3
9:30
9-35
2. D
ownl
oade
d fro
m w
ww
.ann
ualre
view
s.org
by K
OK
URI
TSU
-TEN
MO
ND
AI L
IBRA
RY o
n 09
/06/
10. F
or p
erso
nal u
se o
nly.
Sgr A*
VLA 6 cm
Sgr A West
Distance ~ 8 kpc
Mass ~ 4 x 10⁶ Msun
1 Rs ~ 10 AU
~ 10 μas
Yusef-Zadef+
コンパクトな 電波/近赤外/X線源
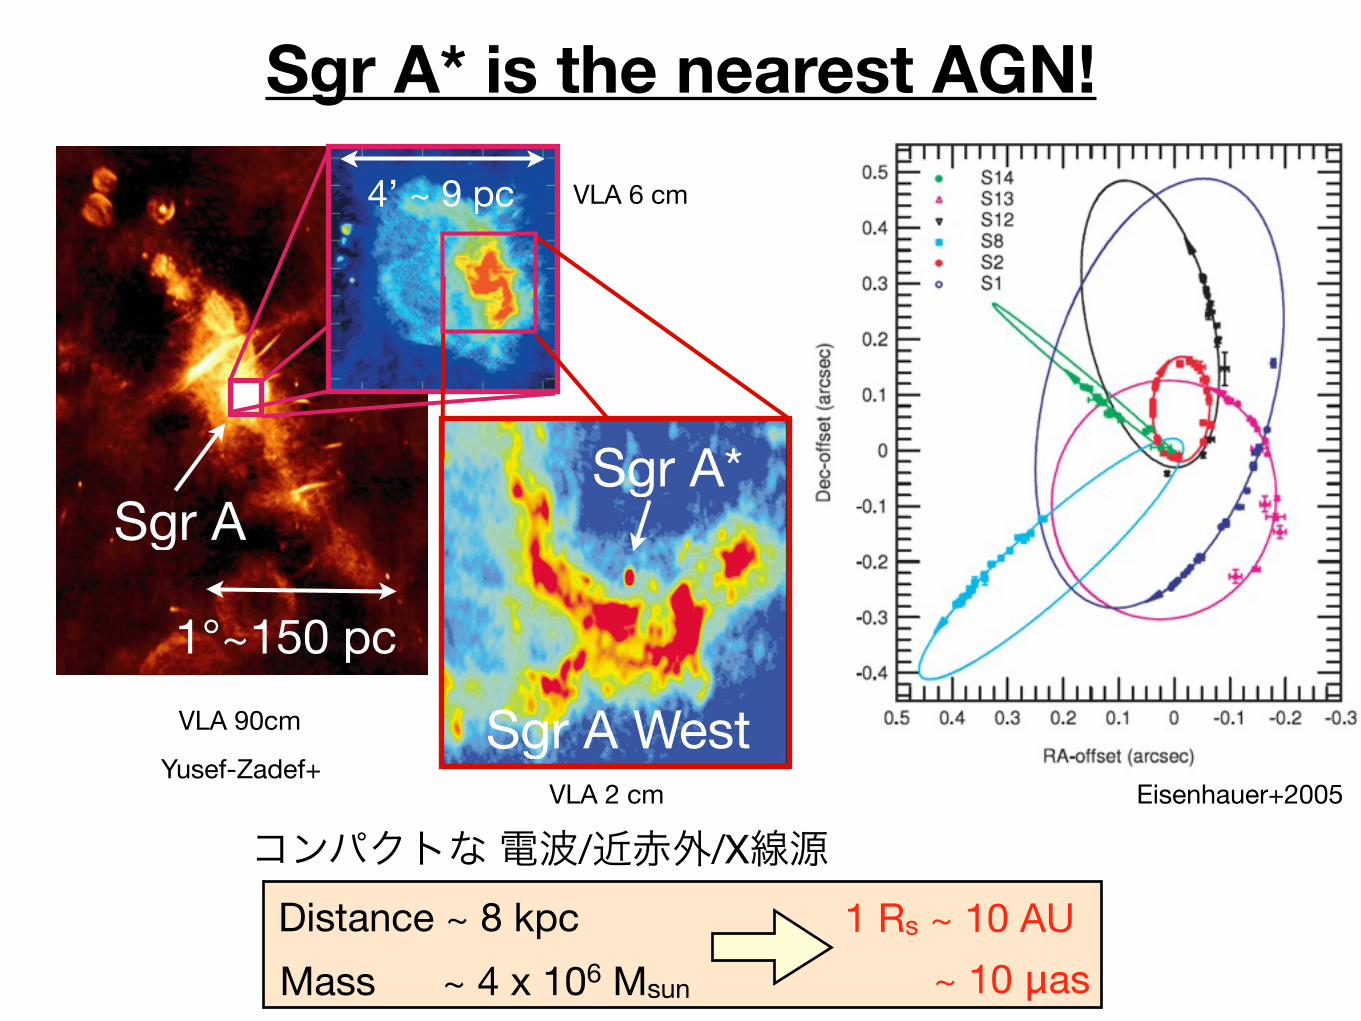
Still under the discussion
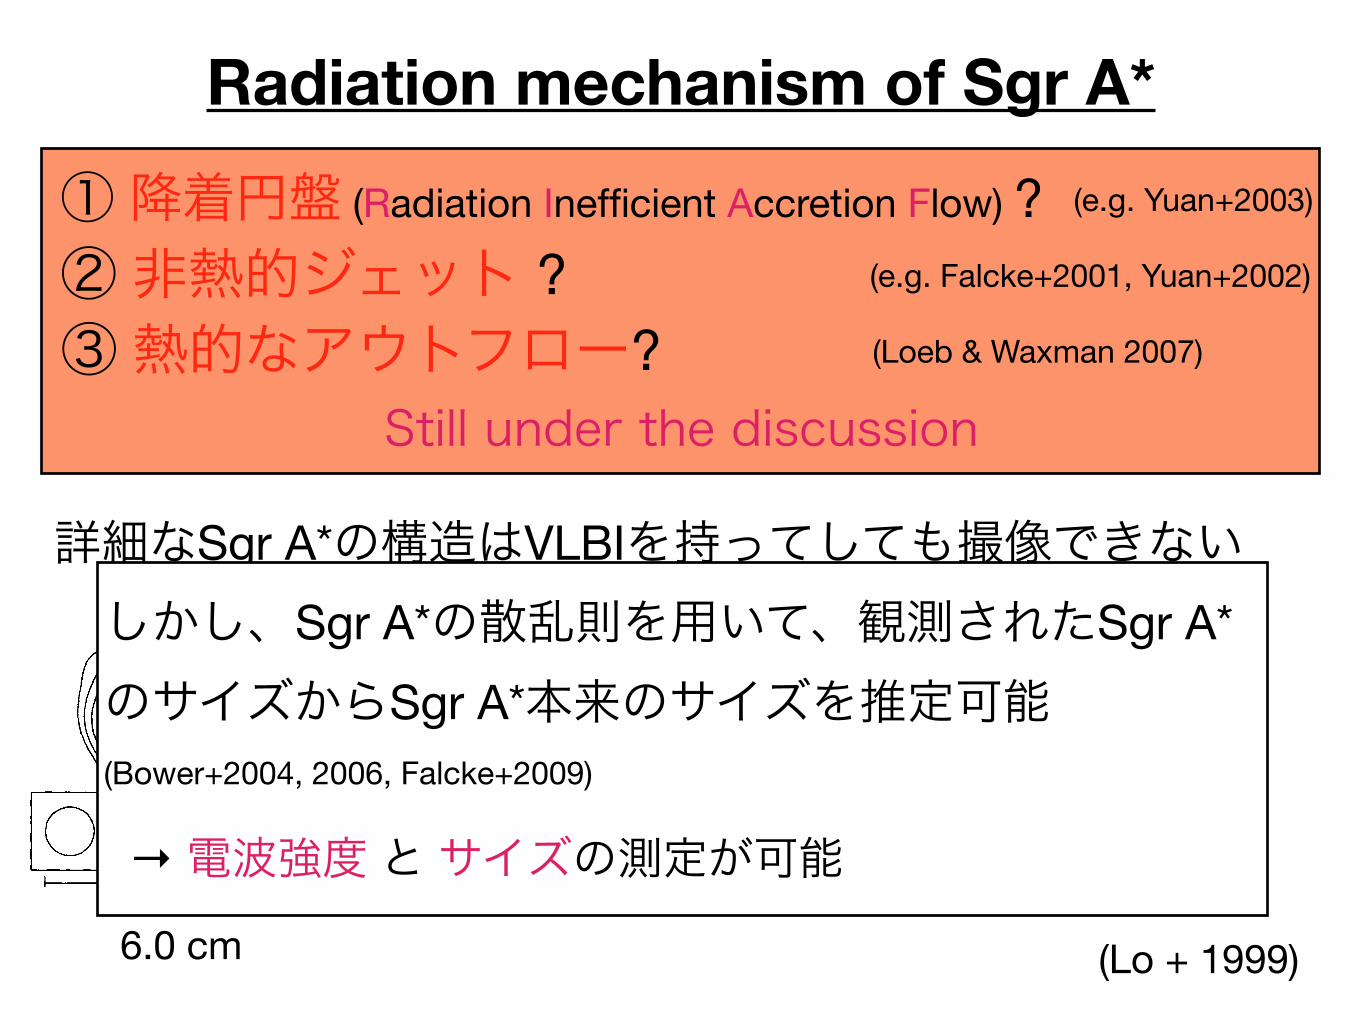
Radiation mechanism of Sgr A*
1999ASPC..186...72L
3.6 cm
1999ASPC..186...72L
2.4 cm
1999ASPC..186...72L
1.3 cm
1999ASPC..186...72L
0.7 cm
1999ASPC..186...72L
6.0 cm (Lo + 1999)
詳細なSgr A*の構造はVLBIを持ってしても撮像できない--> 星間散乱の影響で像がボケてしまう。
① 降着円盤 (Radiation Inefficient Accretion Flow) ?
③ 熱的なアウトフロー?② 非熱的ジェット ? (e.g. Falcke+2001, Yuan+2002)
(Loeb & Waxman 2007)
(e.g. Yuan+2003)
詳細なSgr A*の構造はVLBIを持ってしても撮像できない--> 星間散乱の影響で像がボケてしまう。
Still under the discussion
② 非熱的ジェット ?① 降着円盤 (Radiation Inefficient Accretion Flow) ?
③ 熱的なアウトフロー? (Loeb & Waxman 2007)
1999ASPC..186...72L
3.6 cm
1999ASPC..186...72L
2.4 cm
(e.g. Falcke+2001, Yuan+2002)
(e.g. Yuan+2003)
1999ASPC..186...72L
1.3 cm
1999ASPC..186...72L
0.7 cm
1999ASPC..186...72L
6.0 cm (Lo + 1999)
しかし、Sgr A*の散乱則を用いて、観測されたSgr A*
のサイズからSgr A*本来のサイズを推定可能
(Bower+2004, 2006, Falcke+2009)
→ 電波強度 と サイズの測定が可能
Radiation mechanism of Sgr A*
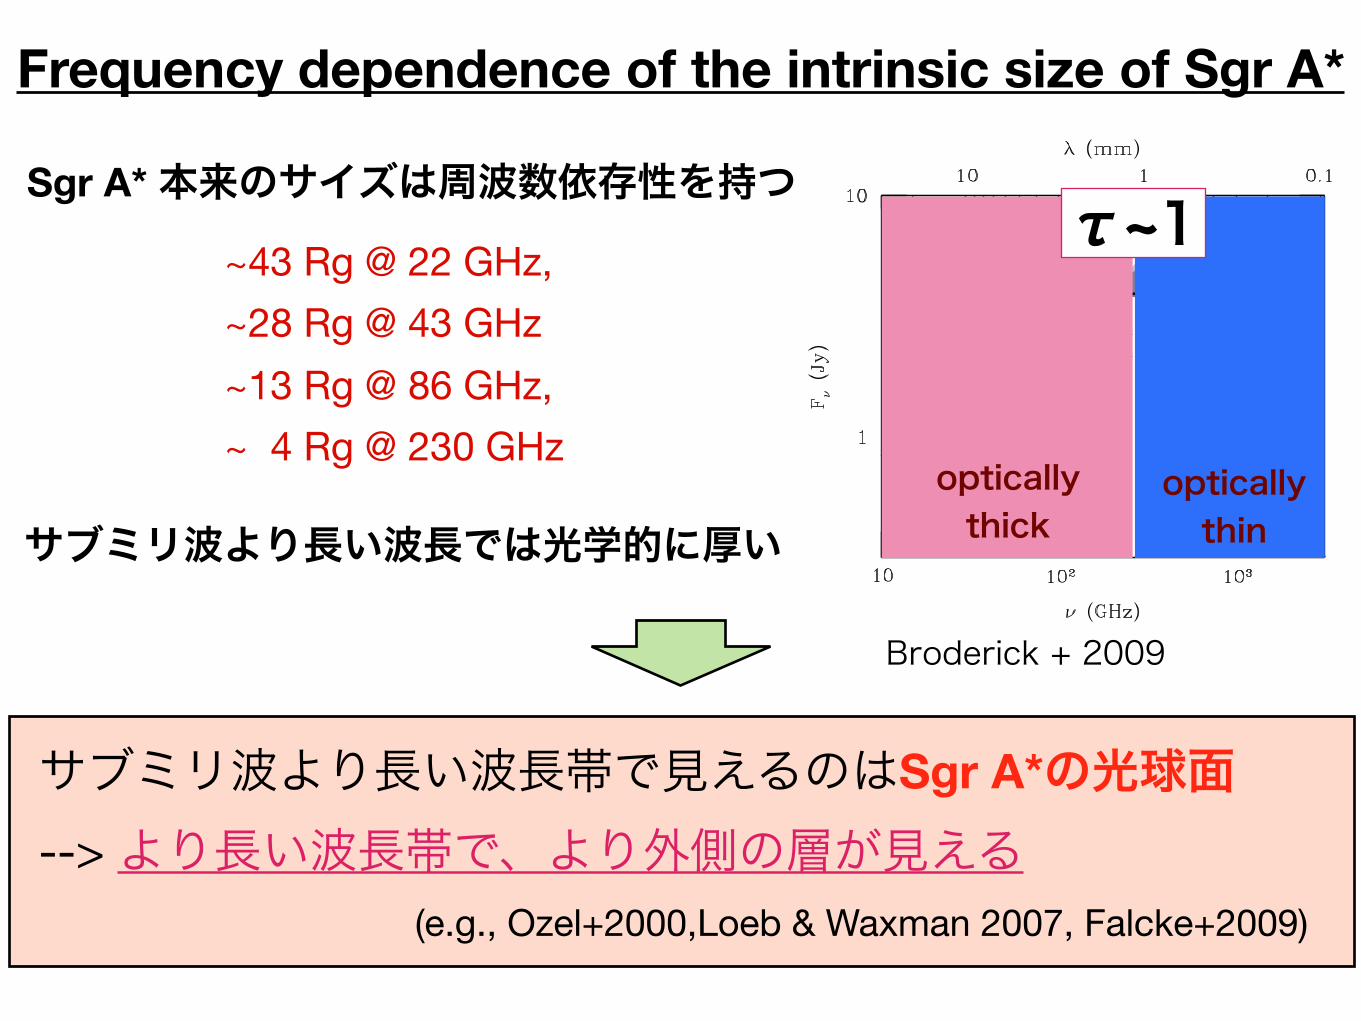
Sgr A* 本来のサイズは周波数依存性を持つ
Frequency dependence of the intrinsic size of Sgr A*
~43 Rg @ 22 GHz,
~28 Rg @ 43 GHz
~13 Rg @ 86 GHz,
~ 4 Rg @ 230 GHz
サブミリ波より長い波長では光学的に厚い
サブミリ波より長い波長帯で見えるのはSgr A*の光球面
--> より長い波長帯で、より外側の層が見える(e.g., Ozel+2000,Loeb & Waxman 2007, Falcke+2009)
No. 1, 2009 VLBI PARAMETER ESTIMATION FOR Sgr A* 47
Figure 1. High-frequency radio data and the range of fitted model spectra. Thered circles are taken from Yuan et al. (2004, and references therein), the yellowsquares are from Marrone (2006), and the blue triangle is the single-dish fluxduring the VLBI observations discussed here. Since all of the data points werenot taken coincidentally, errorbars on the radio data shown by the red circlesare indicative of the variability, not the intrinsic measurement errors (in contrastto the yellow squares which were determined by coincident observations, andthe blue triangle not used in the fit). The gray regions show the envelope of themodel spectra, with the dark gray region showing a ! 0.9, and the light grayshowing 0.9 < a ! 0.998. Finally, the black line shows the spectrum for thespin and inclination shown in Figure 2.(A color version of this figure is available in the online journal.)
of coefficient values. For every inclination and black hole spinpresented here, this was possible with extraordinary accuracy(reduce !2 < 1 in all cases and ! 0.2 for many), implying thatthis model is presently significantly underconstrained by thequiescent spectrum alone.5 Subsequently, we obtained the ap-propriate model parameters for arbitrary spins and inclinationsvia a high-order polynomial interpolation.
The range of spectra for the models we employ here ispresented in Figure 1, together with the radio and submillimeterdata that was used for the fitting procedure. The shown spectradeviate from the fitted spectra much more significantly thanthe scatter in the fitted spectra themselves. This is due almostentirely to interpolation process, and is most extreme at highspins, where the coefficient values begin to change rapidly(and thus have larger interpolation errors). Nevertheless, thesedo not produce substantially different images at 1.3 mm fromtheir tabulated counterparts, and it is important to note that theassociated error in the underlying RIAF model serves only tofavor very high spins (a " 0.99), since in these cases it resultsin a larger accretion-flow photosphere and, as we shall see,the small size of the photosphere of the high-spin models isthe primary reason they are excluded. Hence, in reality, suchmodels are more strongly disfavored than shown here. All ofthese models are also capable of producing the Faraday rotation
5 Part of the reason for this is almost certainly the fact that many of the radiofluxes were measured during different observational epochs, and thus the fluxuncertainties are indicative of the source variability, not the intrinsicmeasurement error. For two of the data points in Figure 1 (the yellow squares),this is not the case, having been measured coincidentally, and thus these play amuch more significant role in constraining the RIAF model parameters.
measures observed, and thus the polarimetric properties ofSgr A*.
At the time that Sgr A* was being monitored by Doelemanet al. (2008) it exhibited an anomalously low 1.3 mm flux of2.4 ± 0.25 Jy, almost 40% below its average value (shown bythe blue triangle in Figure 1). To appropriately account for this,we chose a “minimal” prescription for changing the model,reducing all densities by a fixed factor (decreasing the magneticfield such that " is fixed) until the observed flux was reproduced.In a sense, this models the low flux as a low-mass accretionperiod. These lower-density models do have noticeably smaller,though qualitatively similar, images compared to those used inthe spectral fits.
An example image is shown in the left panel of Figure 2for a moderate spin and viewing inclination. As seen in previousefforts to image relativistic accretion flows, the flow appears asa crescent associated with the approaching side of the accretiondisk (Broderick & Loeb 2006a, 2006b). The non-negligibleoptical depth obscures the black hole “silhouette” on this side.The receding side is all but invisible as a consequence ofthe Doppler shift and Doppler beaming associated with therelativistic orbital motion in the innermost portions of theaccretion flow. Images for # > 90! are related by a reflection(across a line perpendicular to the projected spin axis) to imageswith an inclination 180! " # . However, due to the approximatereflection symmetry of the RIAF model images, the constraintsarising from spins pointed counter to and along the line of sightare nearly identical. As a result, for clarity we restrict ourselvesto the latter range.
Using this model, we created a library of ideal-resolutionimages, each with a flux of 2.4 Jy, having different spins andviewing inclinations spanning all possible values.
2.2. Interstellar Electron Scattering
The existence of an interstellar scattering screen betweenEarth and the Galactic center has been well known for sometime now. This has been carefully characterized empiricallyby a number of authors; we use the recent model from Boweret al. (2006). In this, the observed flux distribution is obtained byconvolving the ideal flux with an anisotropic Gaussian scatteringkernel. The anisotropic Gaussian is defined by the scatteringwidths along major and minor axes (both # $2) and the positionangle of the minor axis (which is independent of $). From Boweret al. (2006), the associated full width at half-maximum for themajor and minor axes are
FWHMmaj = 1.309!
$
1 cm
"2
mas, (5)
FWHMmin = 0.64!
$
1 cm
"2
mas, (6)
with the major axis oriented 78! east of north. In practice, thebroadening was done in the u–v plane, where it reduces to amultiplicative factor.
2.3. Visibility Modeling
Visibilities are then defined in the normal way:
V (u, v) =##
dx dy e"2% i(xu+yv)/$I (x, y), (7)
optically thick
optically thin
Broderick + 2009
τ~1
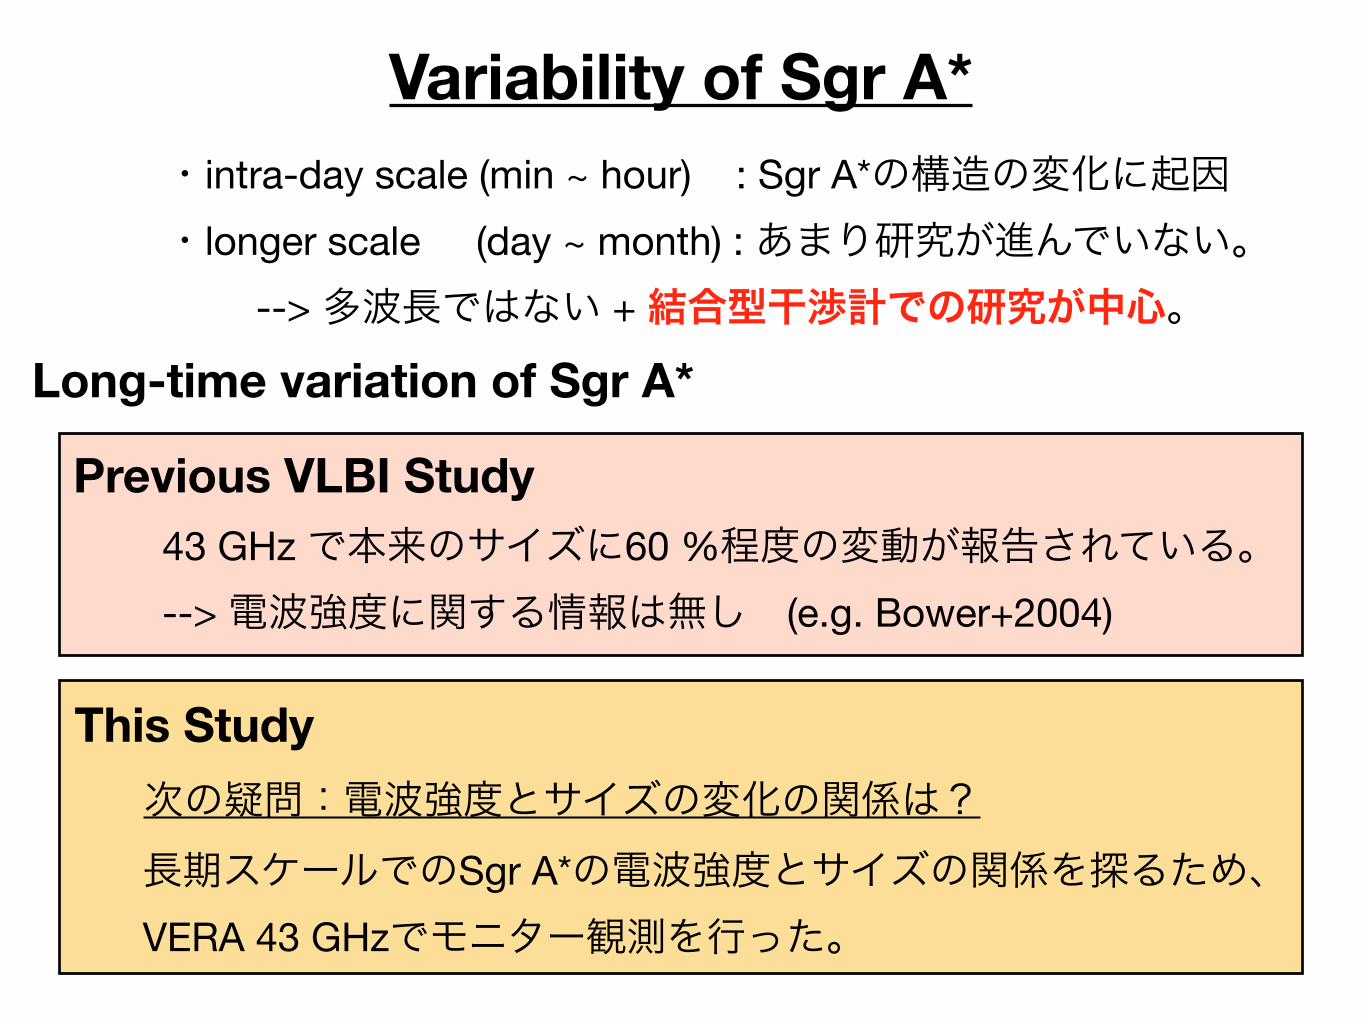
Long-time variation of Sgr A*
43 GHz で本来のサイズに60 %程度の変動が報告されている。--> 電波強度に関する情報は無し (e.g. Bower+2004)
次の疑問:電波強度とサイズの変化の関係は?
Previous VLBI Study
長期スケールでのSgr A*の電波強度とサイズの関係を探るため、VERA 43 GHzでモニター観測を行った。
This Study
・intra-day scale (min ~ hour) : Sgr A*の構造の変化に起因・longer scale (day ~ month) : あまり研究が進んでいない。 --> 多波長ではない + 結合型干渉計での研究が中心。
Variability of Sgr A*
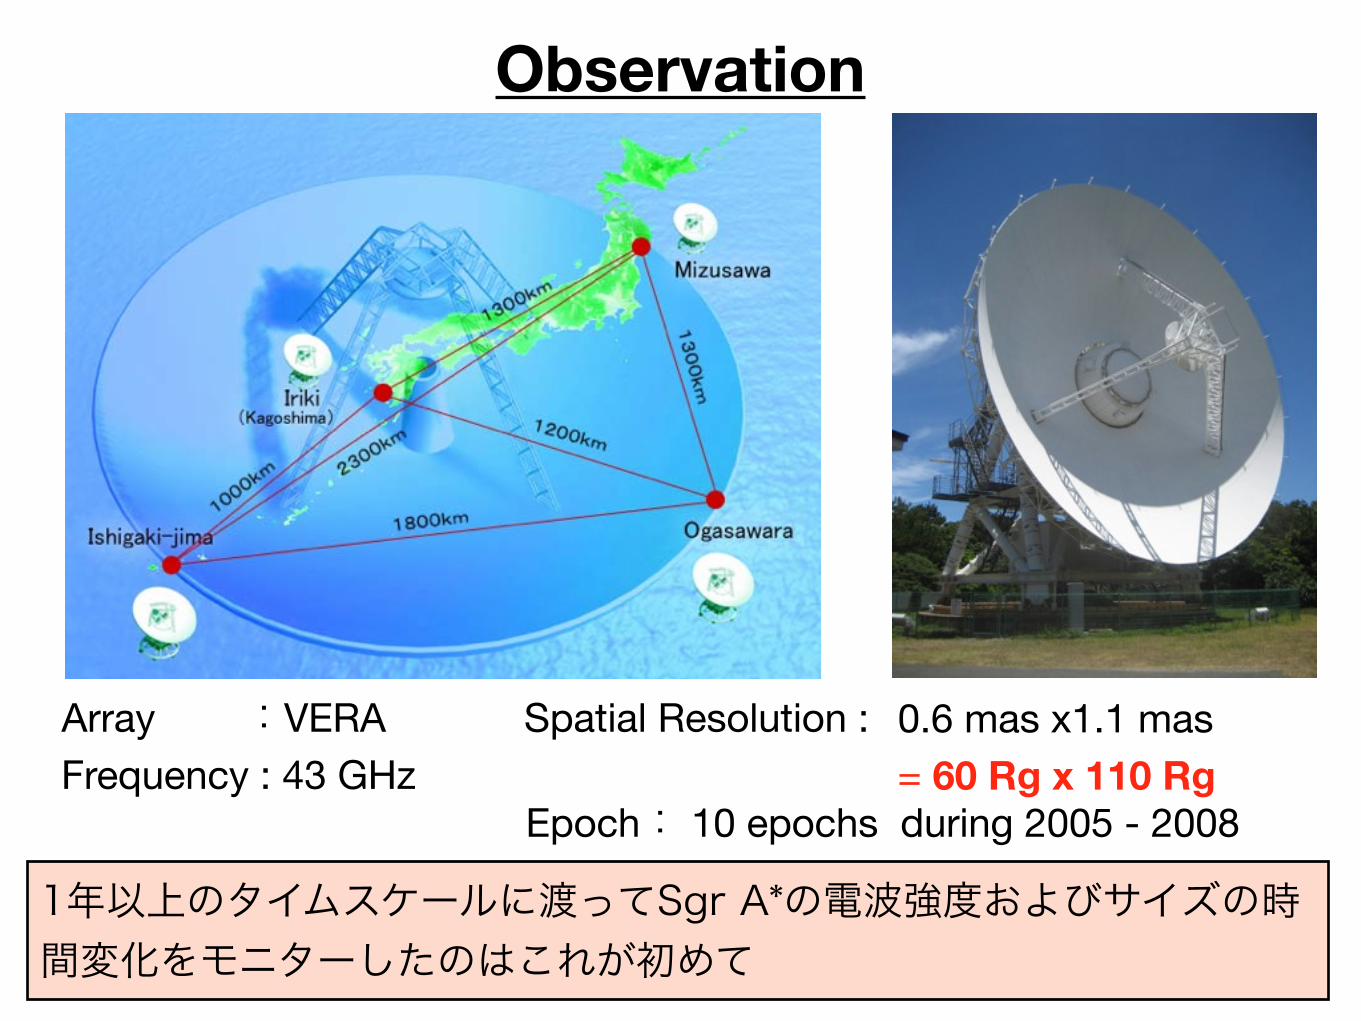
Observation
Array :VERA
Epoch: 10 epochs during 2005 - 2008= 60 Rg x 110 Rg0.6 mas x1.1 mas
1年以上のタイムスケールに渡ってSgr A*の電波強度およびサイズの時間変化をモニターしたのはこれが初めて
Spatial Resolution :Frequency : 43 GHz
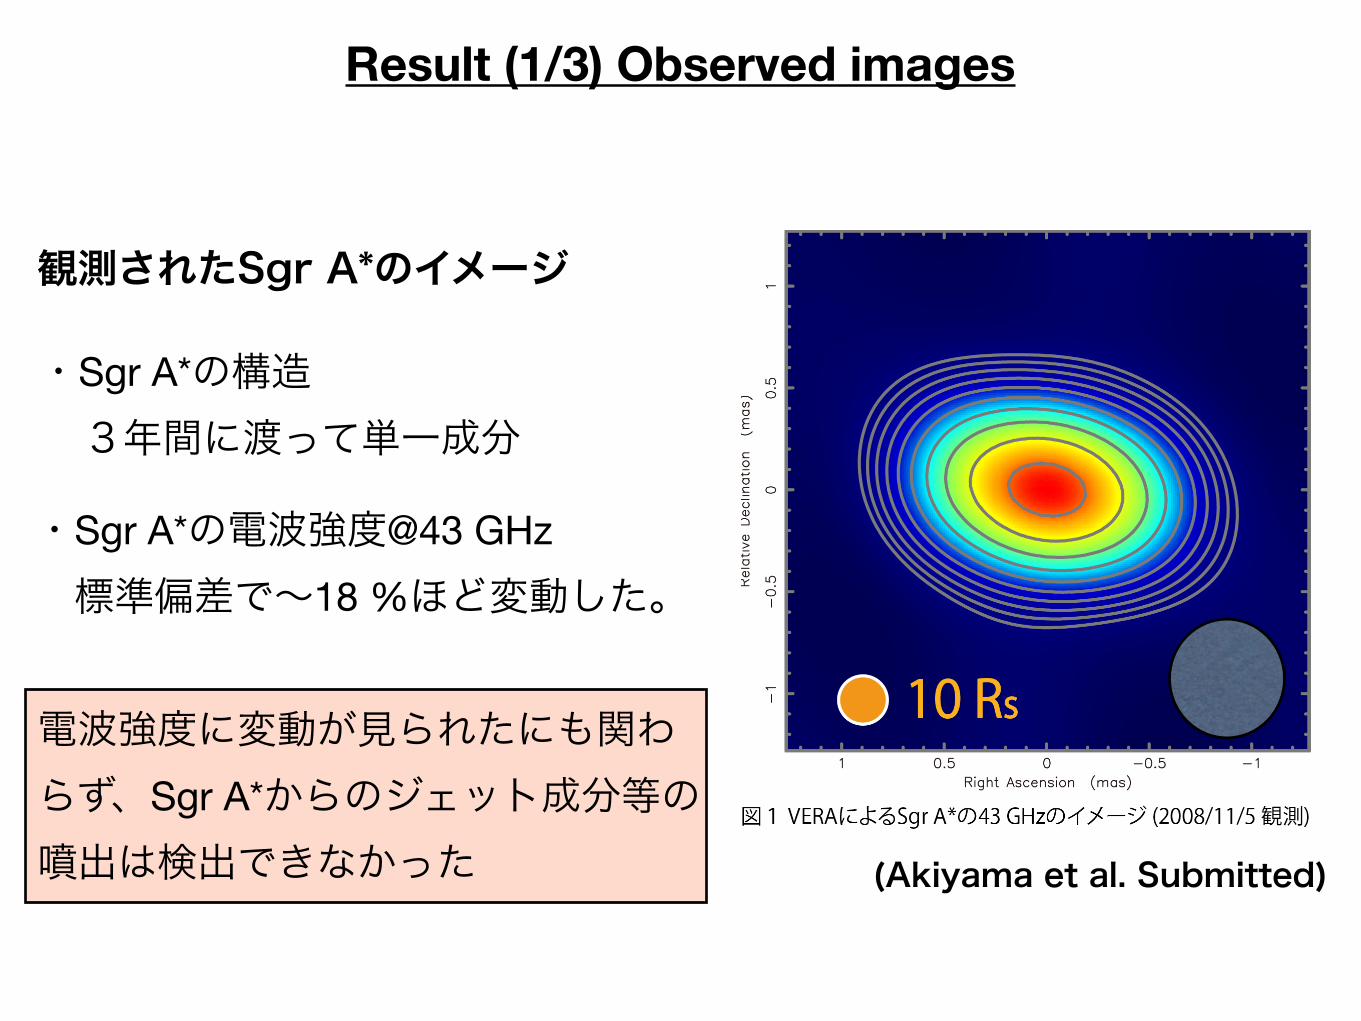
Result (1/3) Observed images
(Akiyama et al. Submitted)
・Sgr A*の構造 3年間に渡って単一成分
・Sgr A*の電波強度@43 GHz
標準偏差で~18 %ほど変動した。
電波強度に変動が見られたにも関わらず、Sgr A*からのジェット成分等の噴出は検出できなかった
観測されたSgr A*のイメージ
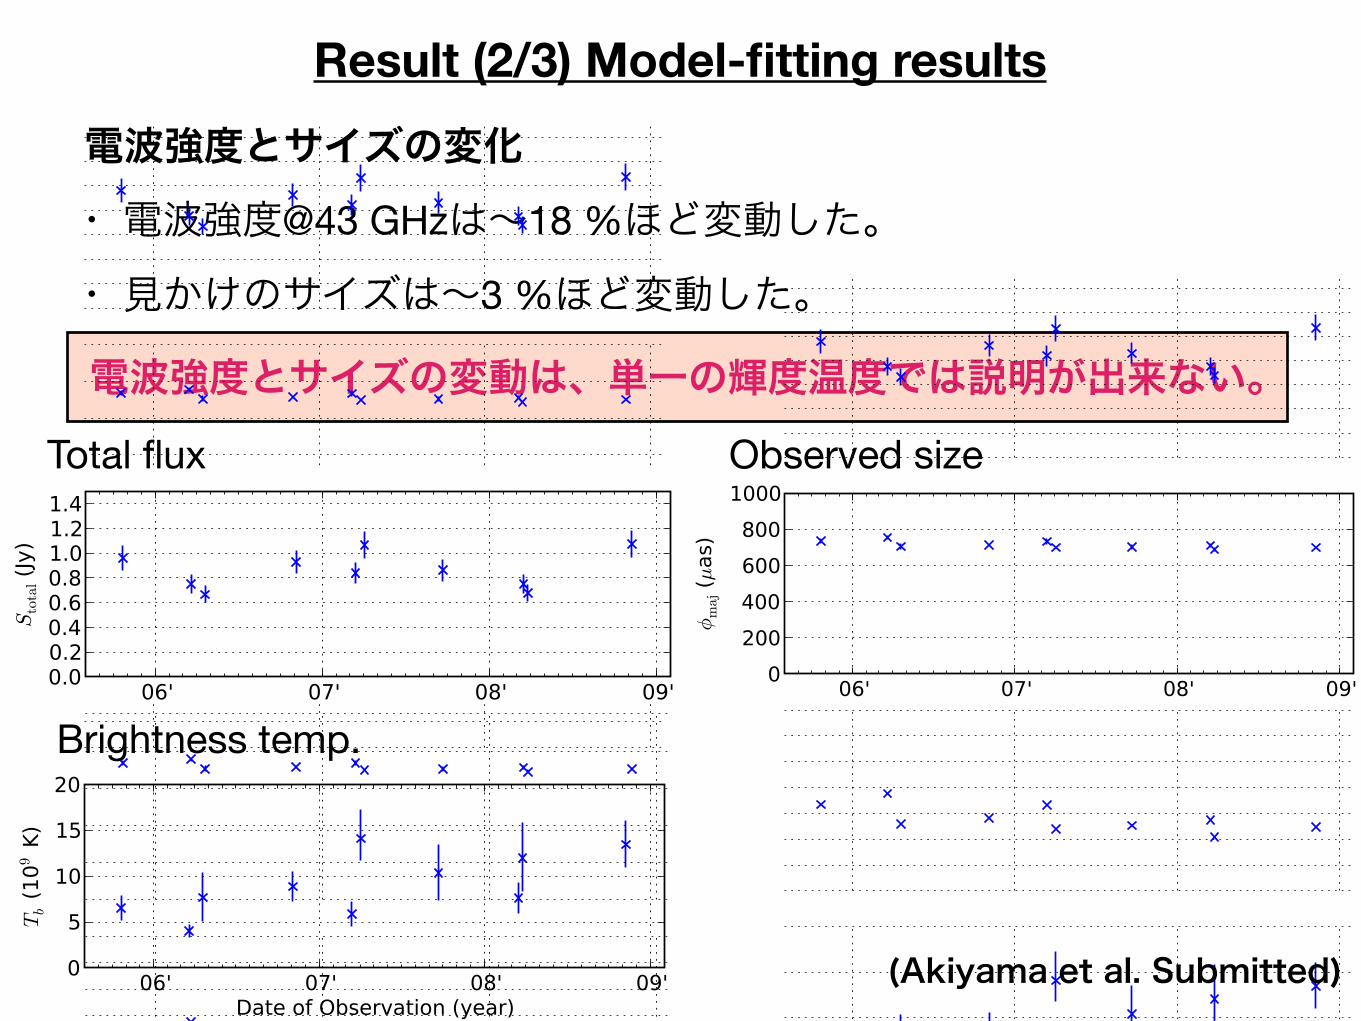
Result (2/3) Model-fitting results
電波強度とサイズの変動は、単一の輝度温度では説明が出来ない。
・ 電波強度@43 GHzは~18 %ほど変動した。
Total flux
Brightness temp.
Observed size
(Akiyama et al. Submitted)
・ 見かけのサイズは~3 %ほど変動した。
電波強度とサイズの変化
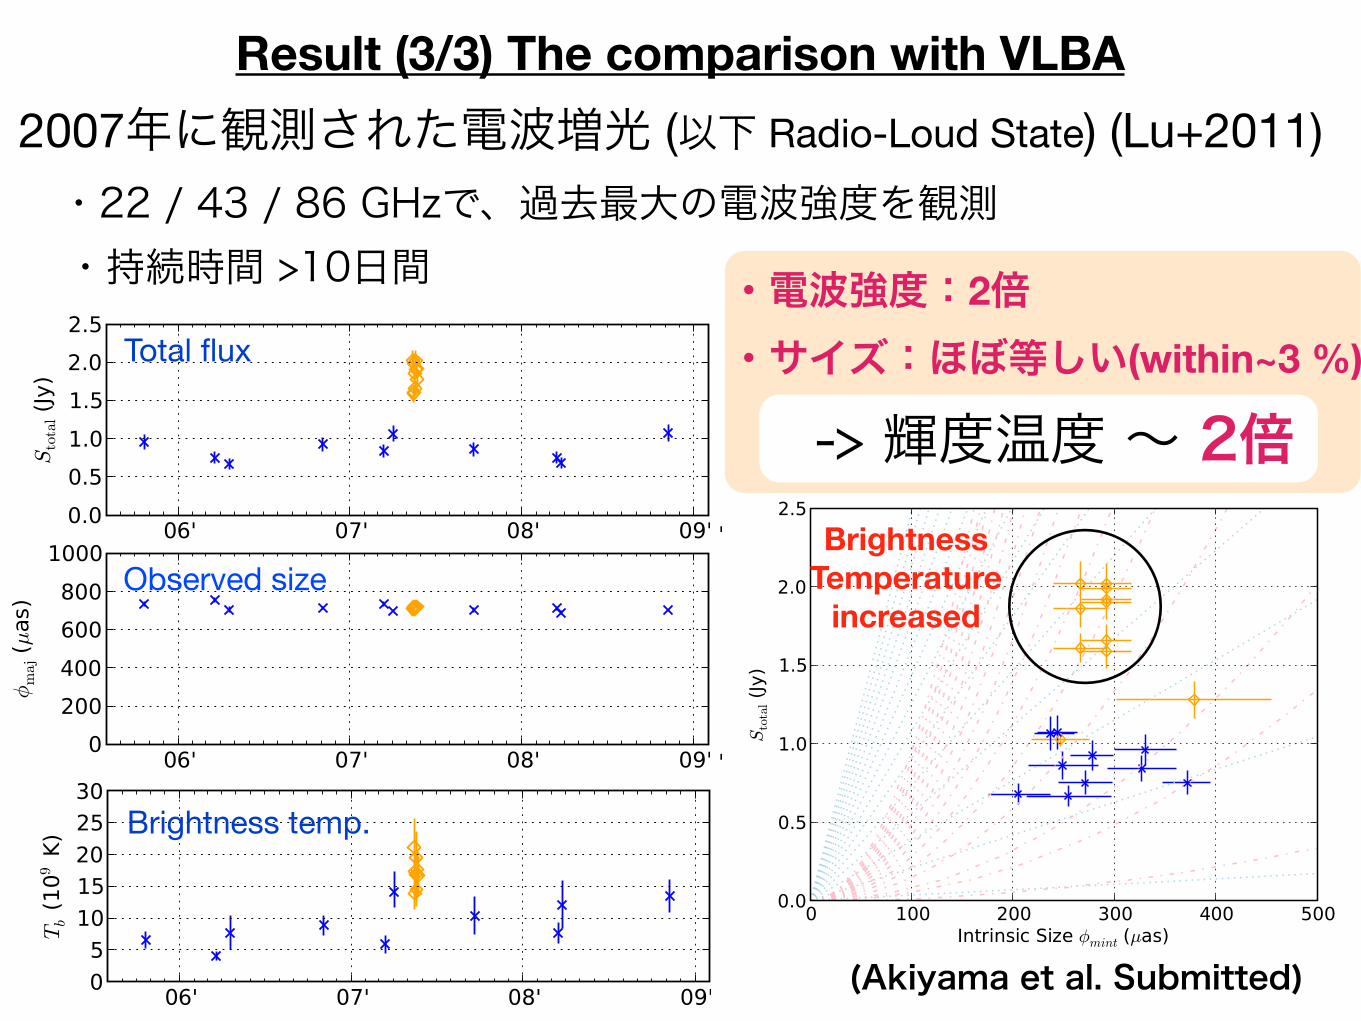
Result (3/3) The comparison with VLBA
・電波強度:2倍・サイズ:ほぼ等しい(within~3 %)
2007年に観測された電波増光 (以下 Radio-Loud State) (Lu+2011)
Brightness Temperature
increased
Total flux
Observed size
Brightness temp.
(Akiyama et al. Submitted)
-> 輝度温度 ~ 2倍
・22 / 43 / 86 GHzで、過去最大の電波強度を観測・持続時間 >10日間
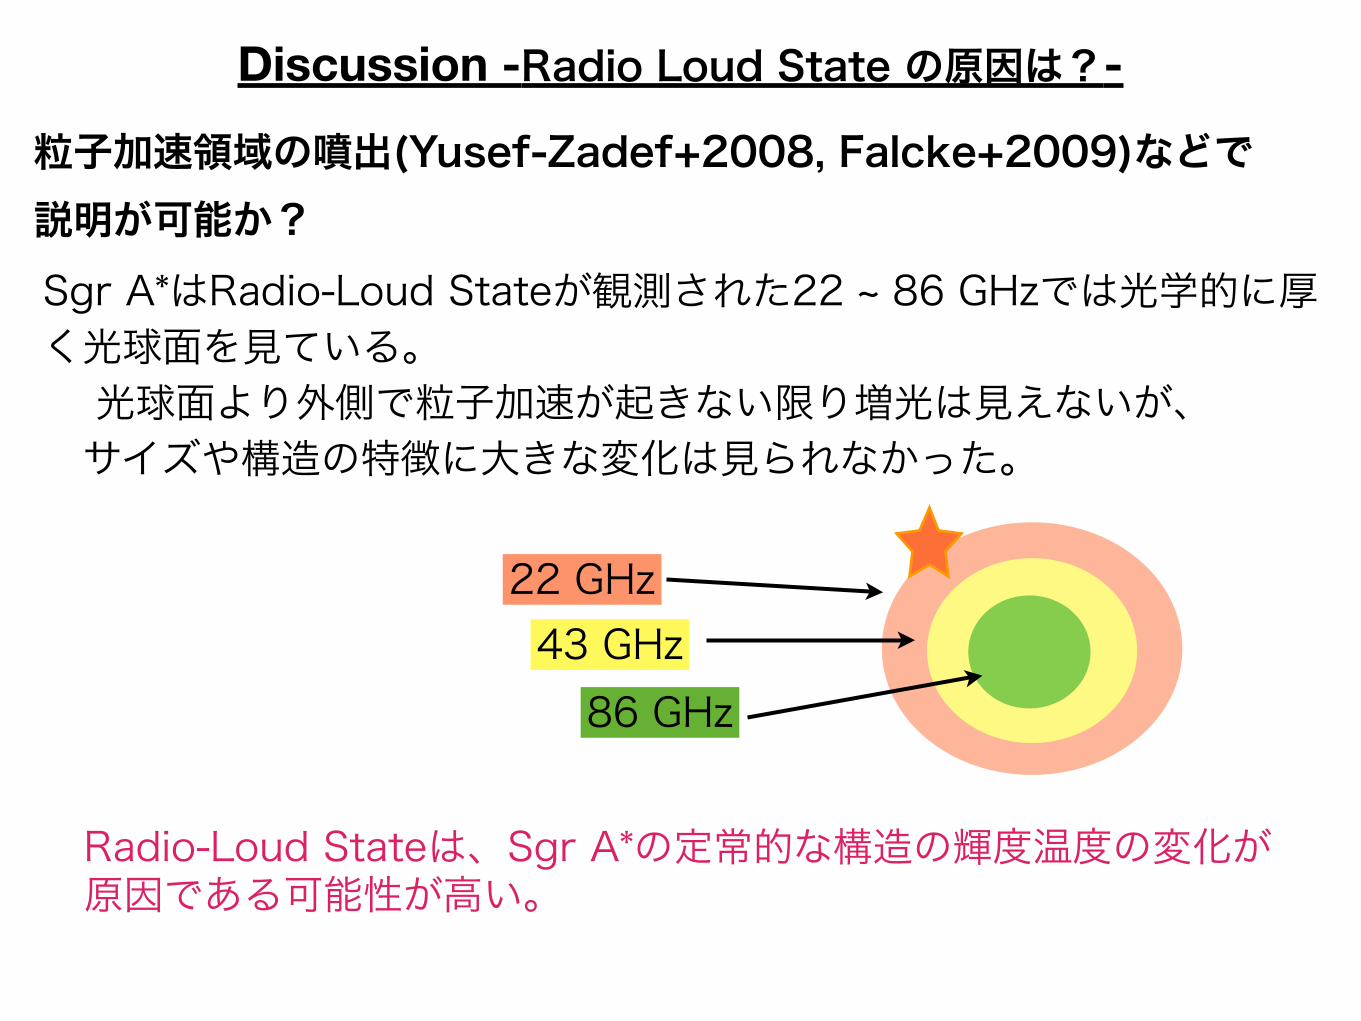
Sgr A*はRadio-Loud Stateが観測された22 ~ 86 GHzでは光学的に厚く光球面を見ている。 光球面より外側で粒子加速が起きない限り増光は見えないが、 サイズや構造の特徴に大きな変化は見られなかった。
Discussion -Radio Loud State の原因は?-
粒子加速領域の噴出(Yusef-Zadef+2008, Falcke+2009)などで説明が可能か?
Radio-Loud Stateは、Sgr A*の定常的な構造の輝度温度の変化が原因である可能性が高い。
86 GHz
22 GHz43 GHz
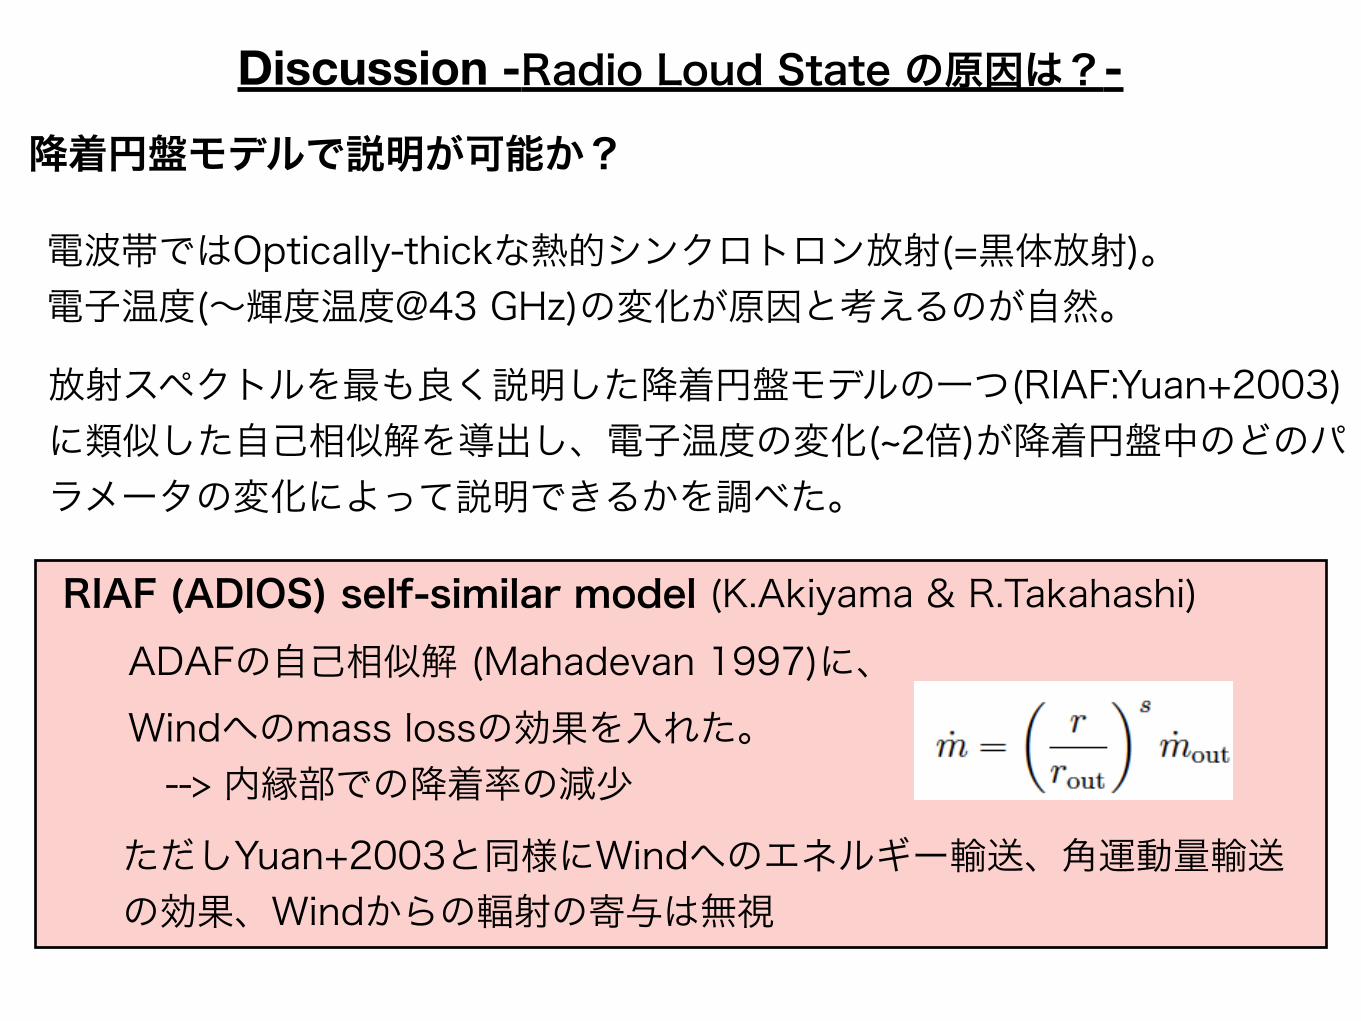
降着円盤モデルで説明が可能か?
Discussion -Radio Loud State の原因は?-
電波帯ではOptically-thickな熱的シンクロトロン放射(=黒体放射)。電子温度(~輝度温度@43 GHz)の変化が原因と考えるのが自然。
放射スペクトルを最も良く説明した降着円盤モデルの一つ(RIAF:Yuan+2003)に類似した自己相似解を導出し、電子温度の変化(~2倍)が降着円盤中のどのパラメータの変化によって説明できるかを調べた。
ADAFの自己相似解 (Mahadevan 1997)に、Windへのmass lossの効果を入れた。 --> 内縁部での降着率の減少
ただしYuan+2003と同様にWindへのエネルギー輸送、角運動量輸送の効果、Windからの輻射の寄与は無視
RIAF (ADIOS) self-similar model (K.Akiyama & R.Takahashi)
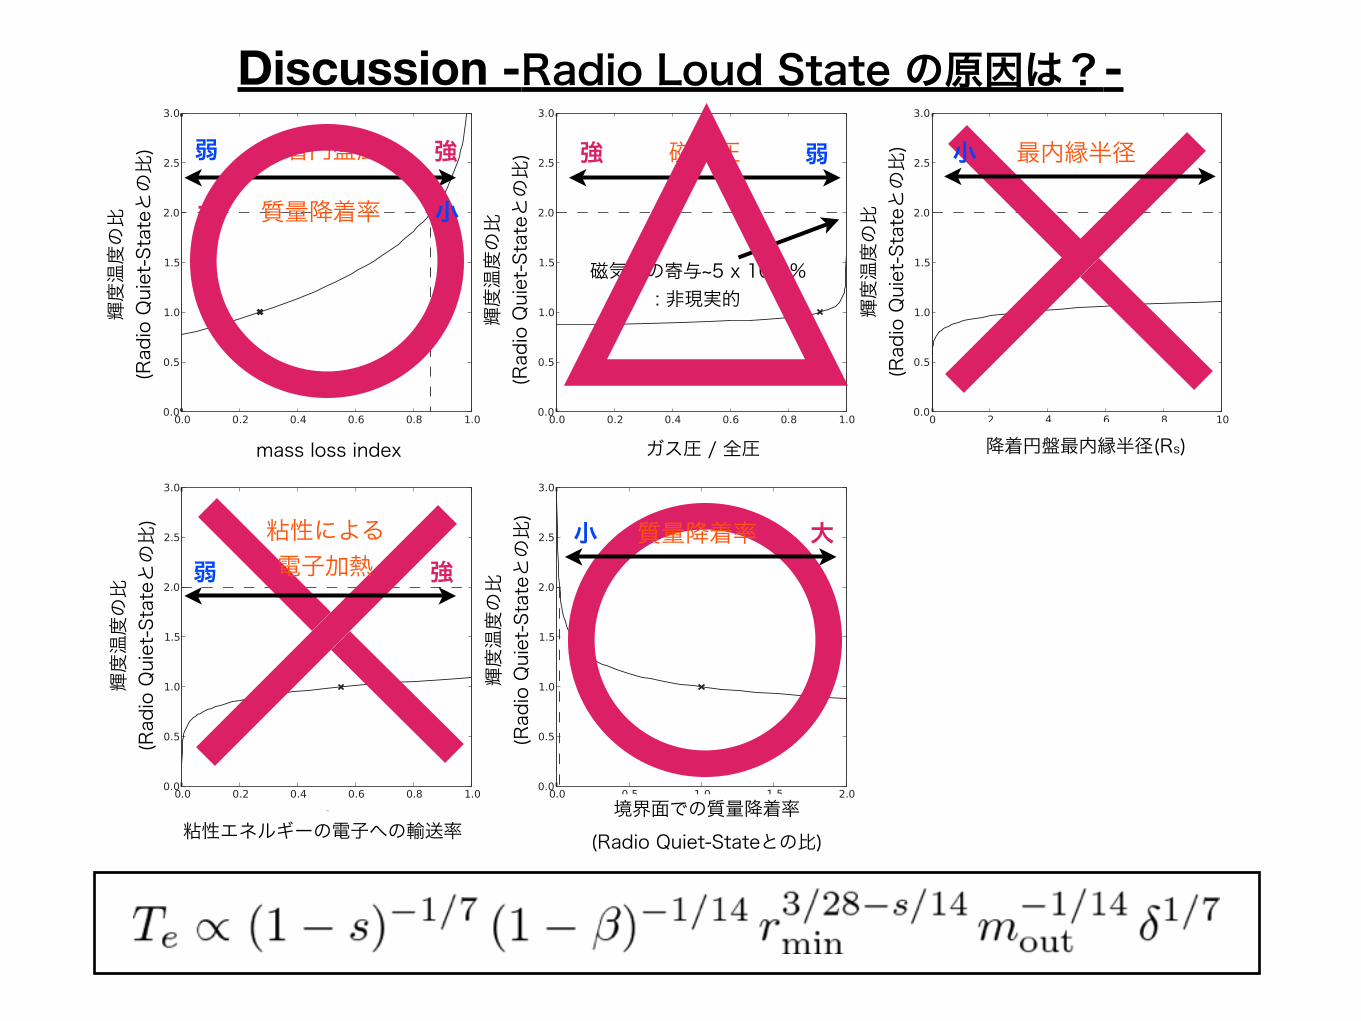
ガス圧 / 全圧
磁気圧強 弱
mass loss index
降着円盤風 強弱
降着円盤最内縁半径(Rs)
粘性エネルギーの電子への輸送率
最内縁半径小
磁気圧の寄与~5 x 10⁻⁴ %: 非現実的
境界面での質量降着率(Radio Quiet-Stateとの比)
輝度温度の比
(Radio Quiet-Stateとの比)
輝度温度の比
(Radio Quiet-Stateとの比)
輝度温度の比
(Radio Quiet-Stateとの比)
輝度温度の比
(Radio Quiet-Stateとの比)
輝度温度の比
(Radio Quiet-Stateとの比)
質量降着率 大小
質量降着率大 小
粘性による電子加熱 強弱
Discussion -Radio Loud State の原因は?-
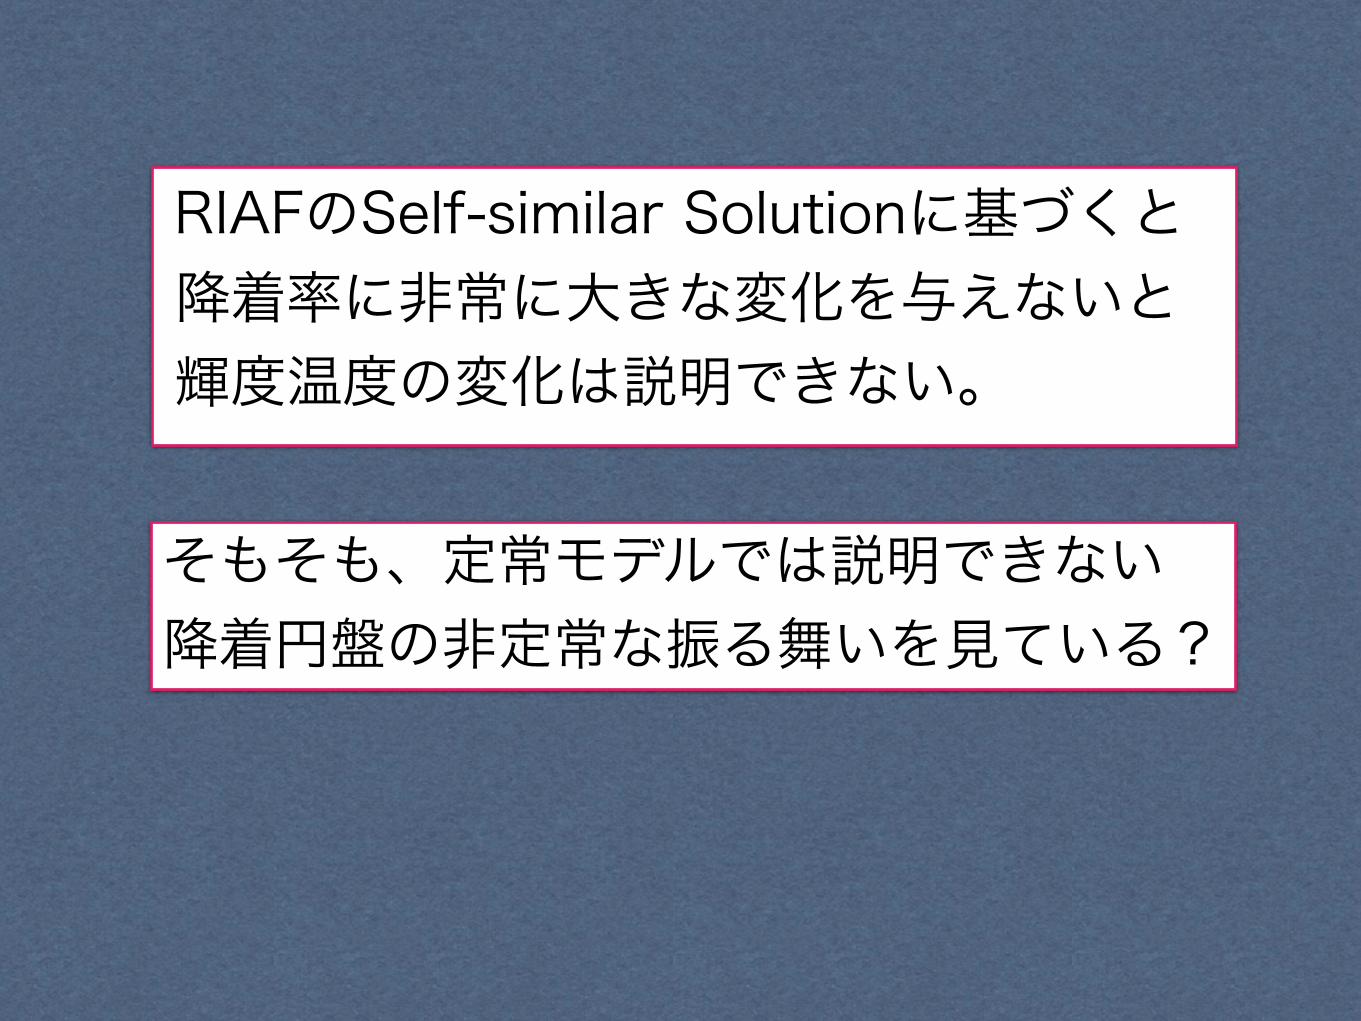
RIAFのSelf-similar Solutionに基づくと降着率に非常に大きな変化を与えないと輝度温度の変化は説明できない。
そもそも、定常モデルでは説明できない降着円盤の非定常な振る舞いを見ている?
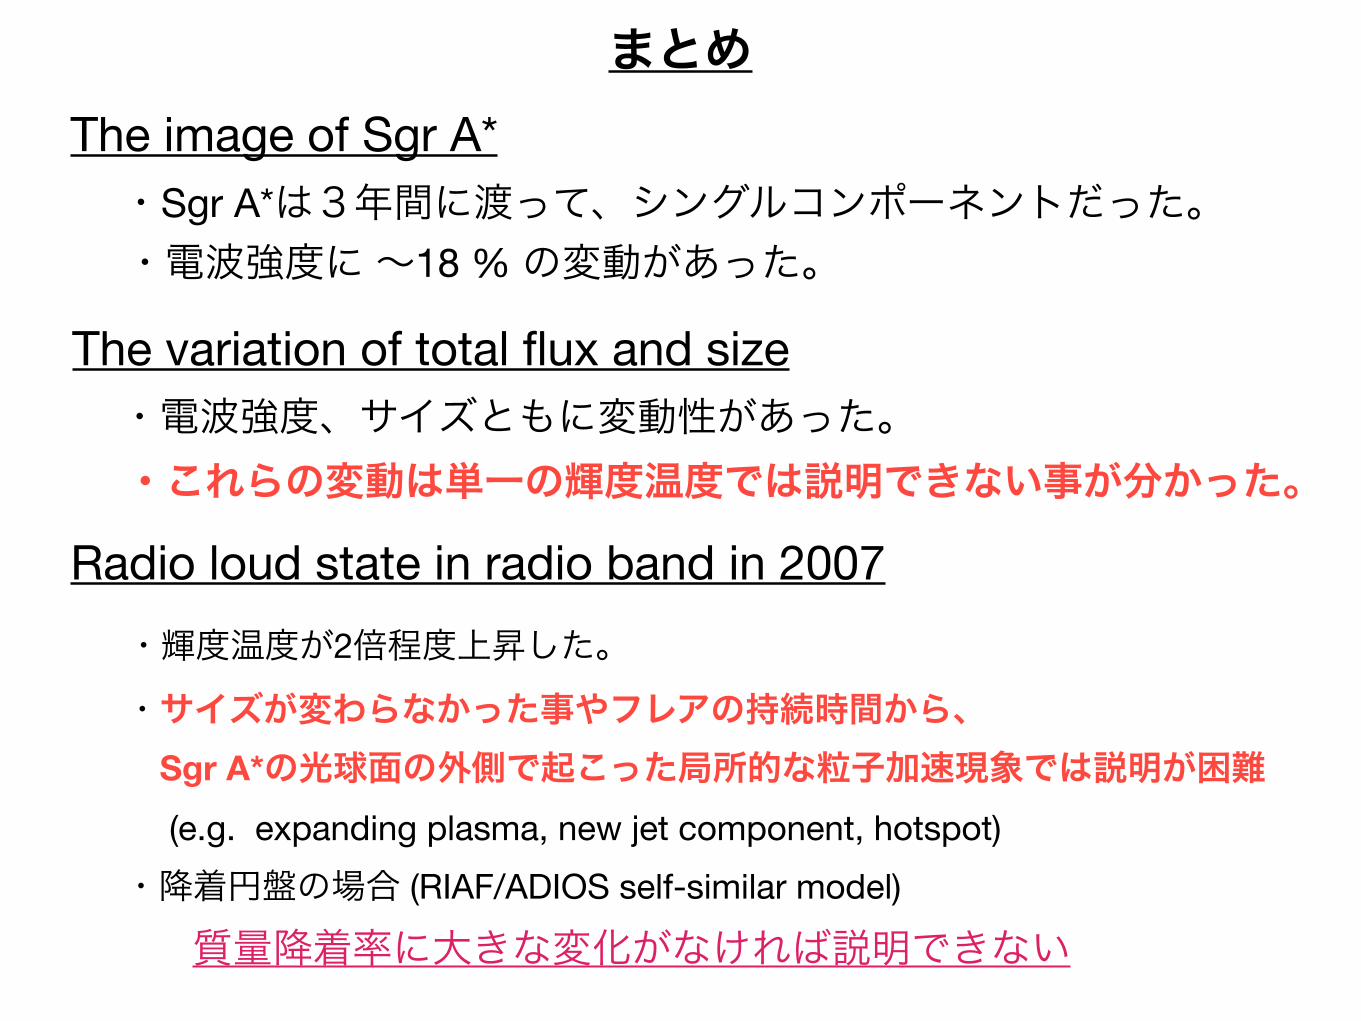
まとめ
・これらの変動は単一の輝度温度では説明できない事が分かった。・電波強度、サイズともに変動性があった。
The variation of total flux and size
Radio loud state in radio band in 2007
・サイズが変わらなかった事やフレアの持続時間から、 Sgr A*の光球面の外側で起こった局所的な粒子加速現象では説明が困難 (e.g. expanding plasma, new jet component, hotspot)
・降着円盤の場合 (RIAF/ADIOS self-similar model)
質量降着率に大きな変化がなければ説明できない
・輝度温度が2倍程度上昇した。
The image of Sgr A*・Sgr A*は3年間に渡って、シングルコンポーネントだった。・電波強度に ~18 % の変動があった。