Embed Size (px)
Citation preview
THIS REPORT CONTAINS ASSESSMENTS OF COMMODITY AND TRADE ISSUES MADE BY
USDA STAFF AND NOT NECESSARILY STATEMENTS OF OFFICIAL U.S. GOVERNMENT
POLICY
Date:
GAIN Report Number:
Approved By:
Prepared By:
Report Highlights:
Post estimates Vietnam’s wheat import volume in the MY 2014/2015 at 2.10 million tons, a slightly increase
compared to MY 2013/2014 imported volume, with expectations of an increase in the use of feed wheat.
Imported volume for MY 2015/2016 is forecast at 2.2 million tons, with the same expectation of increased feed
wheat use. Vietnam’s wheat imports for MY 2013/2014 were 2.03 million tons, about 100,000 lower than
USDA’s official estimate mainly due to less imported feed wheat.
Post estimates corn imported volume in MY 2014/2015 to be at 2.0 million tons, down from the 2.4 million tons
of MY 2013/2014 due to the expected increase of local production. The import volume of corn in MY 2015/2016
is forecast at 1.8 million tons, a 200,000-ton decrease compared with MY 2014/2015, due to expected higher
local corn production and carry-over stocks from MY 2013/2014.
Post estimates total rice production for MY 2014/2015 to reach 44.88 million tons of paddy rice, about 320,000
tons of paddy less than USDA’s official number due mainly to the adjustment of seasonal rice planted/harvested
area. Vietnam’s MY 2014/2015 rice exported volume is revised to 6.7 million tons due to expected strong
competition from Thailand, India, Pakistan and other new exporters such as Cambodia and Myanmar.
Vietnam
Quan Tran
Dwight Wilder
2015
Grain and Feed Annual
VM5025
5/5/2015
Required Report - public distribution
Executive Summary: SITUATION AND OUTLOOK
In calendar year 2014, Vietnam shipped local corn for selling through the border to China due mainly to the price difference.
In turn, Vietnam imported extra volume of Brazilian corn to substitute for the demand gap. This makes Vietnam become
again a seasonal corn exporter, which happened in the last decade.
Ministry of Agriculture and Rural Development (MARD) had signed Decision 69/QD-CT-CLT which recognized three
genetically modified corn varieties of Syngenta Co., This event officially allowed growing of GM corn for
commercialization in Vietnam. Post forecasts an increase of the corn production in CY 2016, given favorable policy from the
GVN and the use of GMO corn varieties. The CY 2016 Vietnam corn production is forecasted to increase thanks to the
GVN’s new policy.
Unlike feed wheat, which has fluctuating consumption levels depending on many factors, milling wheat has an increasing
trend in the pace of urbanization and consumers becoming more familiar with the usage of convenience food, in recent years,
and, increased sophistication and exposure to the Western lifestyle and Western food products. Wheat-based foods, therefore,
are being increasingly consumed in Vietnam, in place of the rice-based diet that still dominates Vietnamese cuisine. The
booming of the giant fast food chains coming into Vietnam, McDonalds, Dunkin Donuts, Burger King and others is also a
key factor to boost the use of wheat based food. The use of wheat based food, however, is still limited to big cities. The level
of increased consumption of milling wheat, therefore, is still moderately small or unchanged. There is predominantly the
change of using more high quality wheat for higher quality wheat based products introduced in the western food outlets. The
demand for U.S. wheat, which is considered as premium quality wheat, therefore, increases steadily. Overall, total demand
for milling wheat is ranging from 1.50 to 1.55 million tons a year.
During the past few years, numerous provinces in the Mekong River Delta have set up large-scale rice farms, attracting the
participation of plant protection companies and local farmers. Companies provide farmers with rice seed and pesticides and,
in turn, they get to buy rice from farmers immediately after harvesting. The model allows using machineries and pesticides
effectively so as to gain higher yields. However, numerous farmers have complained that plant protection companies take
nearly all the profits from these projects, consequently leaving farmers taking part in the model with little benefits.
Particularly, participating farmers are buying rice seed and pesticides from these companies at prices higher than the market
prices while the companies buy harvested rice at a price equal to that set by the Vietnam Food Association. The model to
grow large-scale rice farms has helped farmers reduce production costs. Meanwhile, Vietnam’s Ministry of Agriculture and
Rural Development considers this model as the modern scheme for rice production and is now targeting to expand the model
to one million hectares nationwide from hundreds of hectares during the last crops. However, rice farmers are still facing
hardships as rice exporters and intermediary traders often gain the most in the rice industry.
The Ministry of Agriculture and Rural Development developed a program for shifting from rice crops to other cash crops,
prioritized for corn and soybeans. This is the second year of the program and there is a targeted 100,000-110,000 hectares of
rice cultivation changing to corn and soybean crops per year, i.e., a total 200,000 ha in two years. In reality, the harvest area
from MY 2012/2013 to MY 2014/2015 has shrunk from 7.86 million hectares to 7.70 million hectares (about 160,000
hectares in those 2 years). The program is not considered as successful as people expected. However, the planted/harvested
rice area continues to be cut in MY 2015/2016.
Vietnam feed industry summary
The Vietnam feed industry relies on about 42% of total demanded volume imported from other countries, which includes
soybean meal, corn, DDGS, various kinds of meal or bran like copra, canola, rape seed meal, wheat bran, etc.; and some
animal protein sources like meat and bone meal (MBM) and fish meal. The local production source of feed ingredients
includes corn, rice bran, broken rice and cassava.
In local supply, rice bran and broken rice are obtained from the rice industry and there is approximately 5 million tons of rice
bran from the rice milling industry, most of which is used for feed. Unlike rice bran, which is used only as a feed ingredient,
broken rice is used in a relatively small volume given its strong competitiveness with exported rice. Post estimates about
500,000 tons of small broken rice is used for feed each year. Similarly, despite a gigantic production volume of cassava
(more than 10 million tons yearly), feed use for cassava has strong competition with exported cassava, local industrial use
and the biofuel industry. As a result, the volume of cassava for feed use is only about 1.8-2.0 million tons during CY 2014-
2016 period.
Imported feed wheat accounts for about 20-25 percent of total imported wheat in recent years. However, the import volume
can be increased greatly when wheat prices become competitive with corn import prices. Wheat then becomes an alternative
as a source of energy ingredients.
While Vietnam can supply more than 75 percent of its demand for energy source feed ingredients, it relies heavily on
imported protein sources (soybean, soybean meal, meat and bone meal, fish meal…). Currently, Vietnam focuses on
expanding corn and soybean planted area to minimize the yearly imports. However, it seems that corn is preferable in terms
of government policy for expanding its planted area.
Imports of finished feed are estimated at about 1.5 million tons per year. Home-made feed is estimated based on the main
ingredients, mainly from local supply sources, such as corn, rice bran, broken rice, and cassava. However, the actual volume
of home-made feed includes other local vegetable sources and various kinds of food waste.
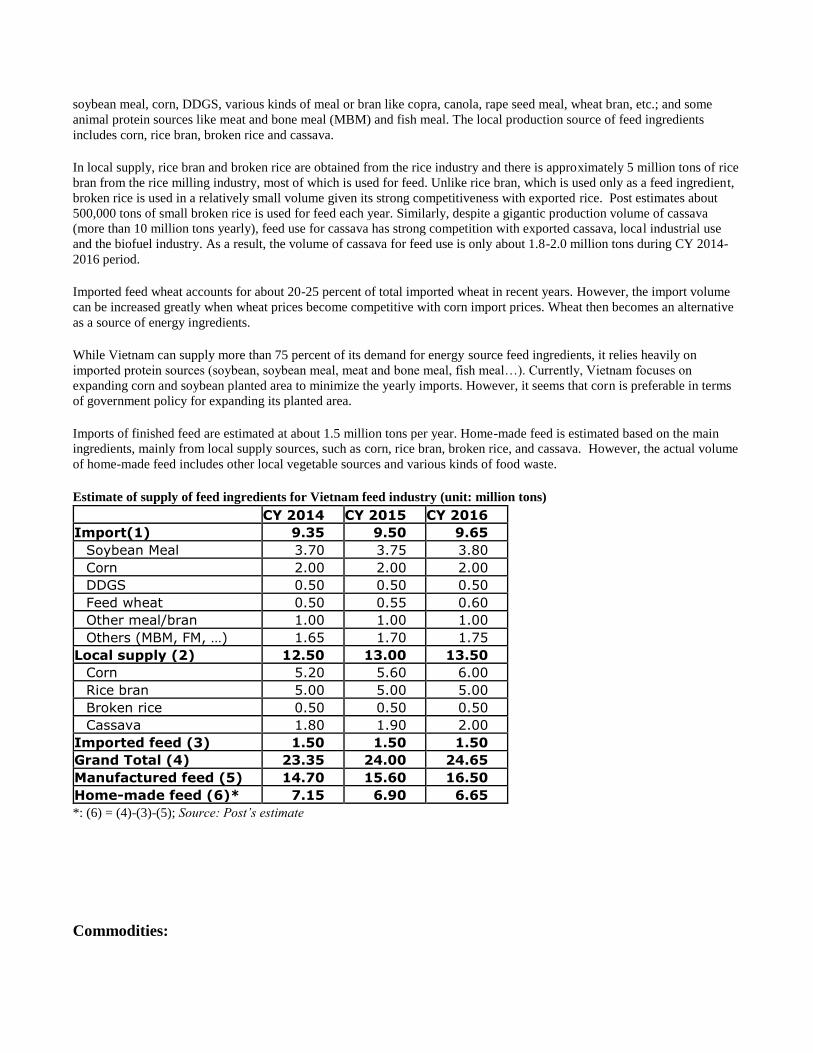
Estimate of supply of feed ingredients for Vietnam feed industry (unit: million tons)
CY 2014 CY 2015 CY 2016
Import(1) 9.35 9.50 9.65
Soybean Meal 3.70 3.75 3.80
Corn 2.00 2.00 2.00
DDGS 0.50 0.50 0.50
Feed wheat 0.50 0.55 0.60
Other meal/bran 1.00 1.00 1.00
Others (MBM, FM, …) 1.65 1.70 1.75
Local supply (2) 12.50 13.00 13.50
Corn 5.20 5.60 6.00
Rice bran 5.00 5.00 5.00
Broken rice 0.50 0.50 0.50
Cassava 1.80 1.90 2.00
Imported feed (3) 1.50 1.50 1.50
Grand Total (4) 23.35 24.00 24.65
Manufactured feed (5) 14.70 15.60 16.50
Home-made feed (6)* 7.15 6.90 6.65
*: (6) = (4)-(3)-(5); Source: Post’s estimate
Commodities:

1. WHEAT
STATISTICAL TABLES
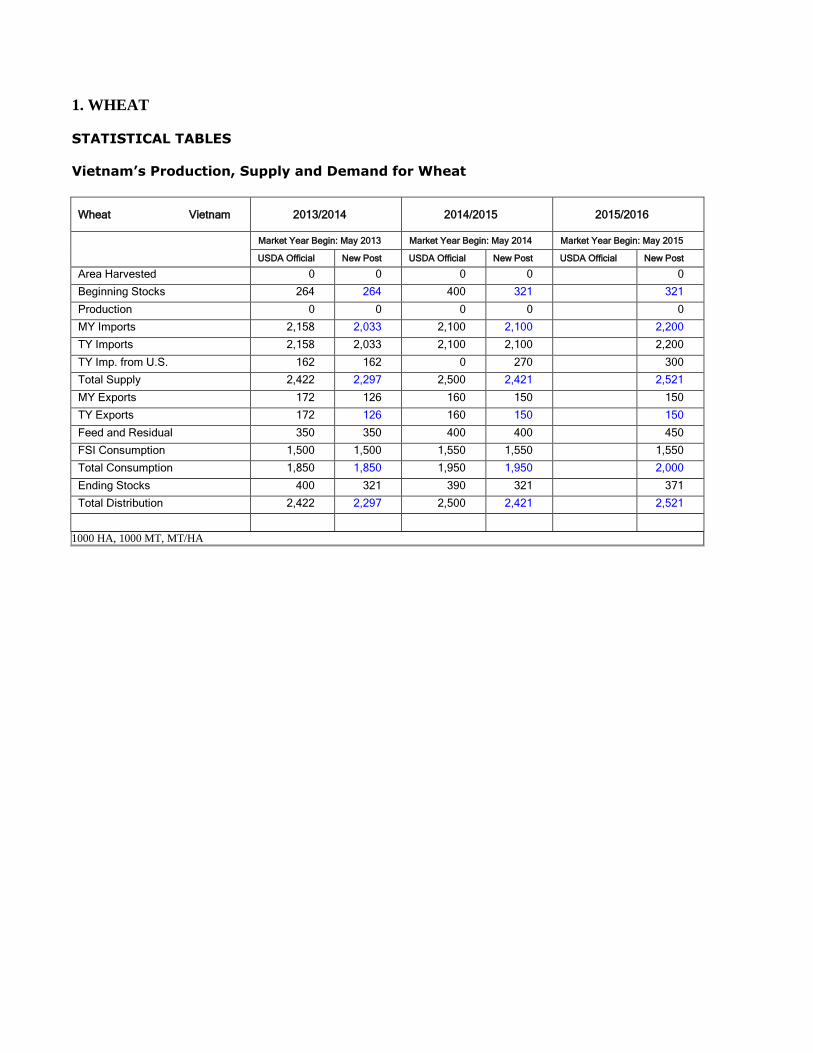
Vietnam’s Production, Supply and Demand for Wheat
Wheat Vietnam 2013/2014 2014/2015 2015/2016
Market Year Begin: May 2013 Market Year Begin: May 2014 Market Year Begin: May 2015
USDA Official New Post USDA Official New Post USDA Official New Post
Area Harvested 0 0 0 0 0
Beginning Stocks 264 264 400 321 321
Production 0 0 0 0 0
MY Imports 2,158 2,033 2,100 2,100 2,200
TY Imports 2,158 2,033 2,100 2,100 2,200
TY Imp. from U.S. 162 162 0 270 300
Total Supply 2,422 2,297 2,500 2,421 2,521
MY Exports 172 126 160 150 150
TY Exports 172 126 160 150 150
Feed and Residual 350 350 400 400 450
FSI Consumption 1,500 1,500 1,550 1,550 1,550
Total Consumption 1,850 1,850 1,950 1,950 2,000
Ending Stocks 400 321 390 321 371
Total Distribution 2,422 2,297 2,500 2,421 2,521
1000 HA, 1000 MT, MT/HA
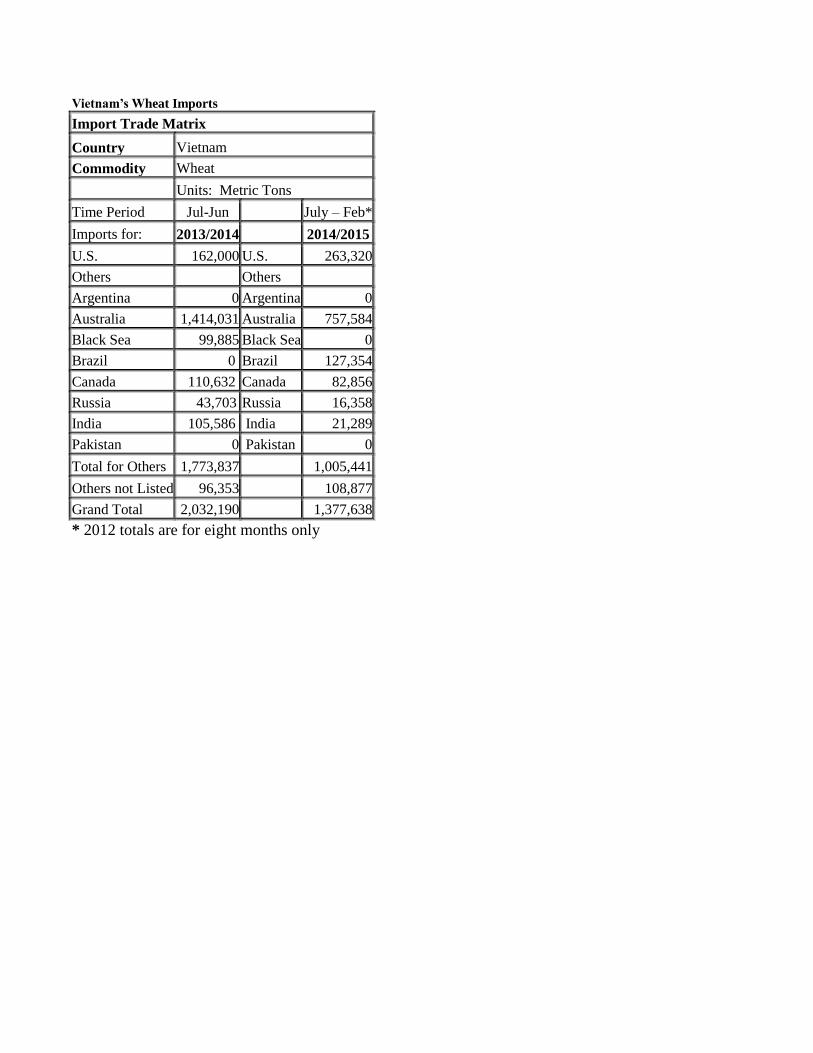
Vietnam’s Wheat Imports
Import Trade Matrix
Country Vietnam
Commodity Wheat
Units: Metric Tons
Time Period Jul-Jun July – Feb*
Imports for: 2013/2014 2014/2015
U.S. 162,000 U.S. 263,320
Others Others
Argentina 0 Argentina 0
Australia 1,414,031 Australia 757,584
Black Sea 99,885 Black Sea 0
Brazil 0 Brazil 127,354
Canada 110,632 Canada 82,856
Russia 43,703 Russia 16,358
India 105,586 India 21,289
Pakistan 0 Pakistan 0
Total for Others 1,773,837 1,005,441
Others not Listed 96,353 108,877
Grand Total 2,032,190 1,377,638
* 2012 totals are for eight months only
PRODUCTION
Vietnam does not produce wheat.
CONSUMPTION
The MY 2014/2015 wheat consumption is estimated at 1.95 million tons, a 100,000-ton increase from
MY 2013/2014 due to the likely increase of both the milling wheat and feed wheat on the market
(50,000 tons of each kind).
The MY 2015/2016 wheat consumption is forecast to slightly increase due to the greater demand for
feed wheat following the growth of the feed industry, mostly for aqua feed.
The Marketing year (MY) 2013/2014 wheat consumption is revised at 1.85 million tons, unchanged with
USDA’s official MY 2013/2014 estimate.
Wheat is the second staple food (after rice) for Vietnamese who live in the big cities of Vietnam,
consumed in many forms of wheat based food; Of the traditional wheat based food, Chinese noodles and
instant noodles account for the largest share of wheat flour consumption in Vietnam, at 40-50 percent.
Bread/baguette production consumes about 35-40 percent, and about 10-25 percent is used for other
baked goods and wheat-based foods. The growth of the noodle and baked goods industries is the driving
factor for the growth of milling wheat consumption.
Unlike feed wheat, which has fluctuating consumption levels depending on many factors, milling wheat
has an increasing trend in the pace of urbanization and consumers becoming more familiar with the
usage of convenience food, in recent years, and, increased sophistication and exposure to the Western
lifestyle and Western food products. Wheat-based foods, therefore, are being increasingly consumed in
Vietnam, in place of the rice-based diet that still dominates Vietnamese cuisine. The increased presence
of fast food chains coming into Vietnam, such as McDonalds, Dunkin Donuts, and Burger King, etc., is
also a key factor in boosting the use of wheat based food. The use of wheat based food, however, is still
limited to big cities. The level of increased consumption of milling wheat, therefore, is still moderately
small or unchanged. There is increased use of more high quality wheat for higher quality wheat based
products introduced in the western food outlets. The demand for U.S. wheat, which is considered as
premium quality wheat, therefore, is increasing steadily. Overall, total demand for milling wheat is
ranging from 1.50 to 1.55 million tons per year.
Some small quantities are also milled for feed use, so called feed wheat. Feed wheat’s share of total feed
consumption was usually about 20-25 percent, mainly used for aquaculture feed, both as an ingredient
and a binding agent for the feed, especially shrimp feed and other aqua-feed. Feed wheat, however, has
recently been an alternative source for other animal feeds, in lieu of corn, cassava, and broken rice,
based on its price competitiveness. Feed wheat imported in MY 2013/2014 decreased sharply due to its
price being uncompetitive, with volume estimated at about 500,000 tons. Post estimates the use of feed
wheat for the local animal feed industry in MY 2014/2015 to be slightly increased, 50,000 tons,
compared with MY 2013/2014 in anticipation of the growth of the feed industry. Similarly, Post
forecasts another increase of 50,000 tons for the MY 2015/2016.
As of 2014, there are 24 wheat mills nationwide, with a total designed capacity of about 3.1 million tons
annually. With strong competition from foreign invested mills, there are only a few local small private
mills existing in the system. As a matter of fact, with the yearly consumption of 2.0-2.1 million tons, the
actual average capacity of those mills only reaches 68 percent of designed capacity. This shows a strong
competition in the wheat milling sector and also demonstrates the anticipation of future growth of
Vietnam’s wheat consumption.
TRADE / COMPETITION
Import
Vietnam is a net importer of wheat. Current import duties are five percent for wheat and fifteen percent
for wheat flour. Australian wheat, however, enjoys duty free access to Vietnam under the Australia –
Vietnam Free Trade Agreement.
Post estimates Vietnam’s wheat imports volume in the MY 2014/2015 at 2.10 million tons, a slight
increase compared to MY 2013/2014 imported volume, with expectation of an increase in the use of
feed wheat. Imported volume for MY 2015/2016 is forecast at 2.2 million tons, with the same
expectation for increased use of feed wheat. Vietnam’s wheat imports for the MY 2013/2014 were 2.03
million tons, about 100,000 lower than USDA’s official estimate mainly due to less imported feed
wheat.
Australian milling wheat is expected to continue dominating the wheat import market in Vietnam,
accounting for over 70-80 percent of Vietnam’s total wheat imported volume in MY 2012/2013.
The growth of baked wheat-based products and noodles requires high quality wheat, which possibly
favors increased consumption of U.S. wheat. U.S. wheat is also used by Vietnamese mills for blending
as a cost-effective way to improve the quality of their flour products. The recent year-on-year volume of
U.S. wheat exported to Vietnam is keeping on increasing proving the increase demand of premium
quality wheat. Exports of U.S. wheat into Vietnam reached more than 160,000 tons in MY 2013/2014,
and an estimated 270,000 tons in MY 2014/2015, and 300,000 tons in MY 2015/2016, as forecasted.
Recent improvements in trade-related infrastructure, such as deep sea ports that can receive Panamax
vessels, should help U.S. wheat be more competitive by reducing ocean freight costs.
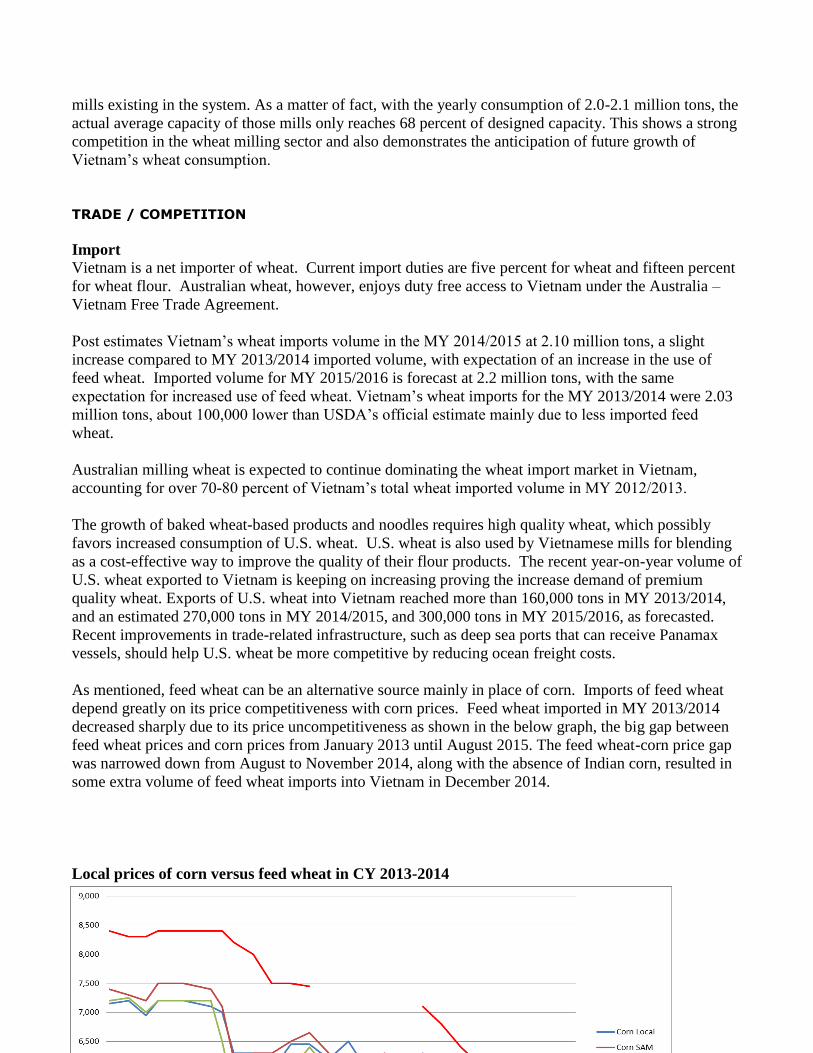
As mentioned, feed wheat can be an alternative source mainly in place of corn. Imports of feed wheat
depend greatly on its price competitiveness with corn prices. Feed wheat imported in MY 2013/2014
decreased sharply due to its price uncompetitiveness as shown in the below graph, the big gap between
feed wheat prices and corn prices from January 2013 until August 2015. The feed wheat-corn price gap
was narrowed down from August to November 2014, along with the absence of Indian corn, resulted in
some extra volume of feed wheat imports into Vietnam in December 2014.
Local prices of corn versus feed wheat in CY 2013-2014
Source: US Grain Council Rep. office in Vietnam
Export
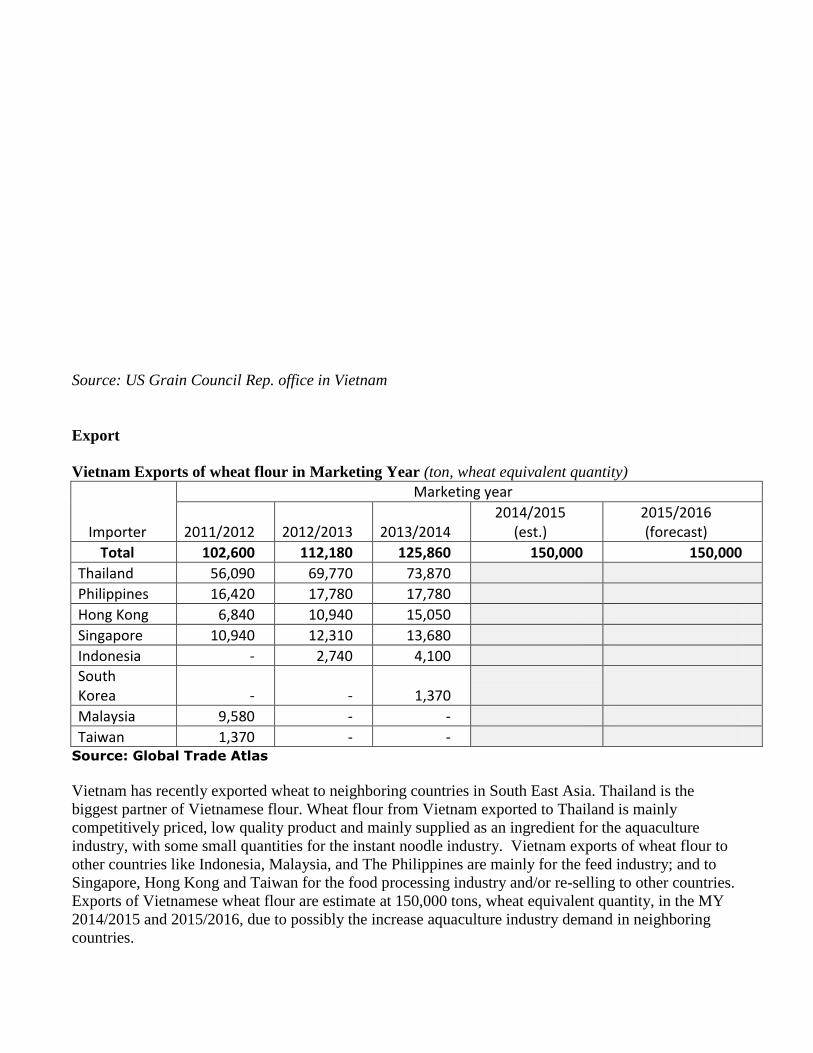
Vietnam Exports of wheat flour in Marketing Year (ton, wheat equivalent quantity)
Importer
Marketing year
2011/2012 2012/2013 2013/2014 2014/2015
(est.) 2015/2016 (forecast)
Total 102,600 112,180 125,860 150,000 150,000
Thailand 56,090 69,770 73,870 Philippines 16,420 17,780 17,780 Hong Kong 6,840 10,940 15,050
Singapore 10,940 12,310 13,680
Indonesia - 2,740 4,100
South Korea - - 1,370
Malaysia 9,580 - -
Taiwan 1,370 - - Source: Global Trade Atlas
Vietnam has recently exported wheat to neighboring countries in South East Asia. Thailand is the
biggest partner of Vietnamese flour. Wheat flour from Vietnam exported to Thailand is mainly
competitively priced, low quality product and mainly supplied as an ingredient for the aquaculture
industry, with some small quantities for the instant noodle industry. Vietnam exports of wheat flour to
other countries like Indonesia, Malaysia, and The Philippines are mainly for the feed industry; and to
Singapore, Hong Kong and Taiwan for the food processing industry and/or re-selling to other countries.
Exports of Vietnamese wheat flour are estimate at 150,000 tons, wheat equivalent quantity, in the MY
2014/2015 and 2015/2016, due to possibly the increase aquaculture industry demand in neighboring
countries.

2. CORN
STATISTICAL TABLES
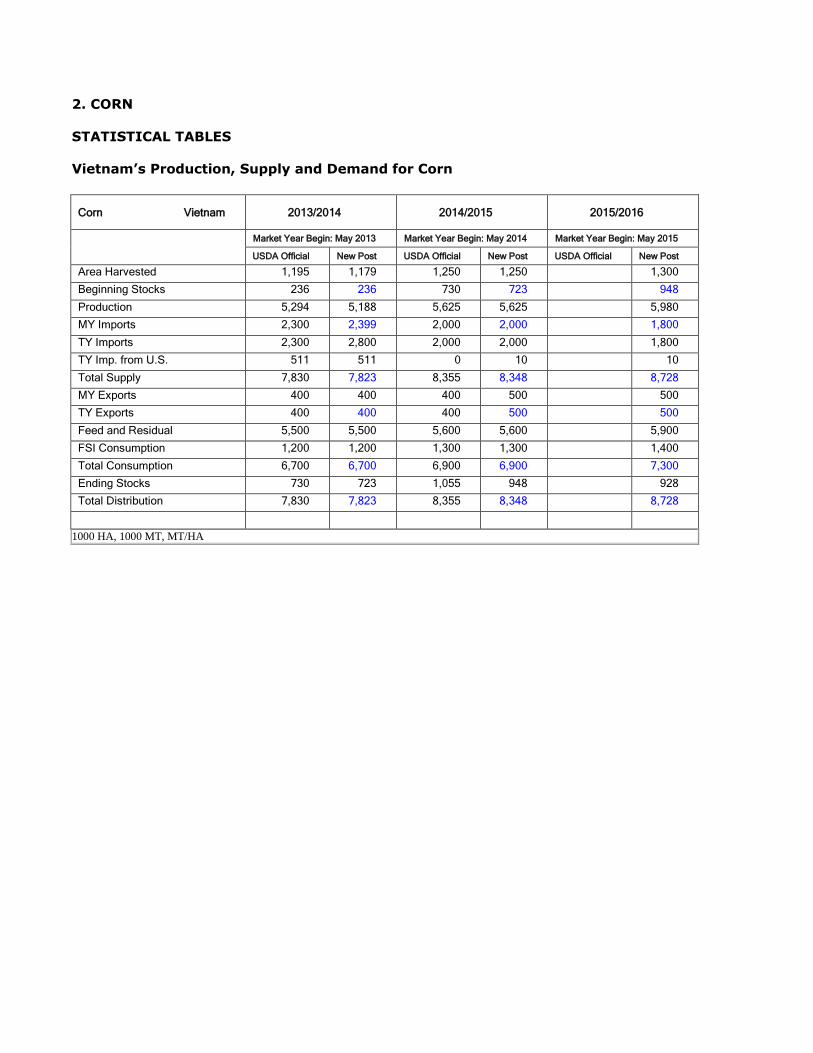
Vietnam’s Production, Supply and Demand for Corn
Corn Vietnam 2013/2014 2014/2015 2015/2016
Market Year Begin: May 2013 Market Year Begin: May 2014 Market Year Begin: May 2015
USDA Official New Post USDA Official New Post USDA Official New Post
Area Harvested 1,195 1,179 1,250 1,250 1,300
Beginning Stocks 236 236 730 723 948
Production 5,294 5,188 5,625 5,625 5,980
MY Imports 2,300 2,399 2,000 2,000 1,800
TY Imports 2,300 2,800 2,000 2,000 1,800
TY Imp. from U.S. 511 511 0 10 10
Total Supply 7,830 7,823 8,355 8,348 8,728
MY Exports 400 400 400 500 500
TY Exports 400 400 400 500 500
Feed and Residual 5,500 5,500 5,600 5,600 5,900
FSI Consumption 1,200 1,200 1,300 1,300 1,400
Total Consumption 6,700 6,700 6,900 6,900 7,300
Ending Stocks 730 723 1,055 948 928
Total Distribution 7,830 7,823 8,355 8,348 8,728
1000 HA, 1000 MT, MT/HA
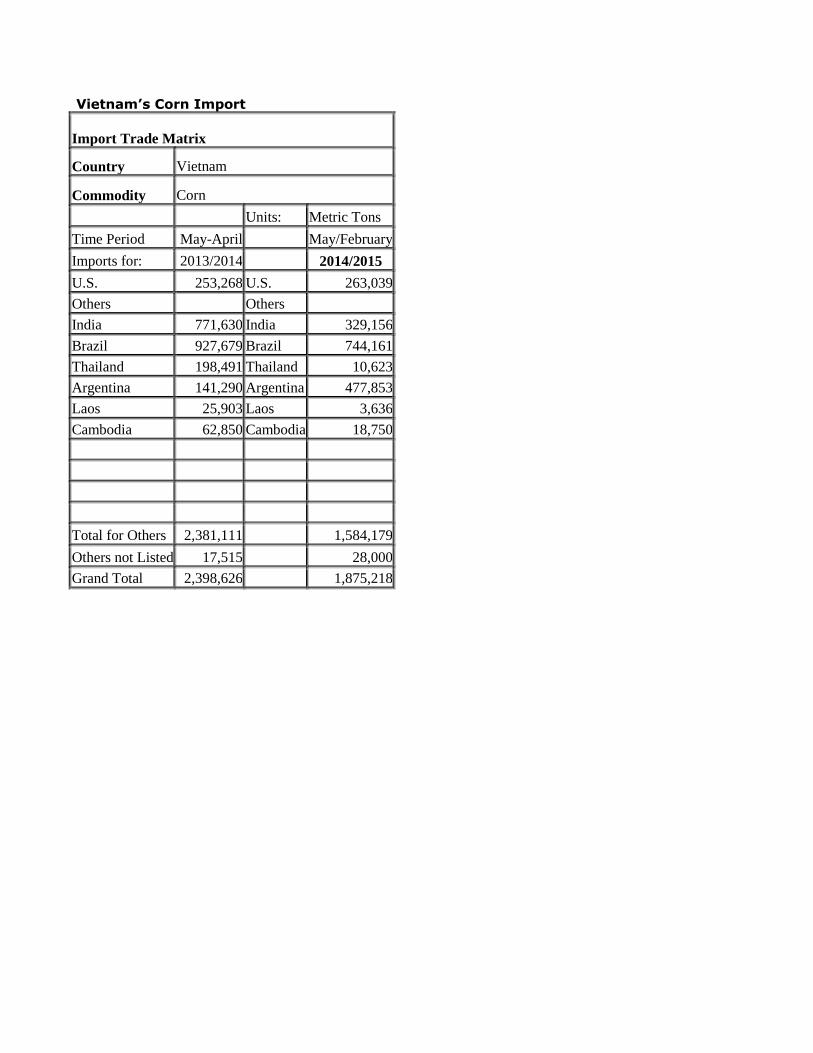
Vietnam’s Corn Import
Import Trade Matrix
Country Vietnam
Commodity Corn
Units: Metric Tons
Time Period May-April May/February
Imports for: 2013/2014 2014/2015
U.S. 253,268 U.S. 263,039
Others Others
India 771,630 India 329,156
Brazil 927,679 Brazil 744,161
Thailand 198,491 Thailand 10,623
Argentina 141,290 Argentina 477,853
Laos 25,903 Laos 3,636
Cambodia 62,850 Cambodia 18,750
Total for Others 2,381,111 1,584,179
Others not Listed 17,515 28,000
Grand Total 2,398,626 1,875,218
PRODUCTION
Corn is Vietnam’s second largest annual crop, after rice, in terms of cultivated area. However, corn
production area is located only where other better cash crops cannot be grown (such as in the
mountainous regions with poor soil fertility) or lack of water for other better cash crops, intercropped
after a better cash crop (such as soybeans in the upland area, or rice in the lowland area when water
supply is short for rice). Since it is primarily being grown in unfavorable conditions, Vietnam’s corn
crop is usually yield diminished or damaged by insects and weeds.
Corn is one of several local crops such as cassava and rice (broken rice, rice bran), which are used to
supply the quickly growing feed industry. And local corn production has been not able to satisfy the
demand in recent years. Imported corn is brought in with the volume of about 2.0 million tons each
year. As such, corn producers are under pressure to quickly increase their productivity in order to satisfy
the increasing demand. Significantly improving average yields by using high-yielding varieties seems
the most likely way to achieve the government’s objectives of increasing corn production for supplying
the feed sector.
In March 2015, Ministry of Agriculture and Rural Development (MARD) signed Decision 69/QD-CT-
CLT, which recognized three genetically modified corn varieties of Syngenta Co. This is officially
allowance production of GM corn for commercialization in Vietnam. (See more in Policy section).
According to the Ministry of Agriculture and Rural Development (MARD), Vietnam calendar year (CY)
2014 corn production was 5.19 million tons, a 105,000-ton decrease compared to Post’s last forecast
(see Vietnam G&F update October 2014). This is due to smaller harvested area caused by adverse
weather in the north of Vietnam.
The estimate of CY 2015 harvested area is revised from 1.2 million hectares to 1.25 million hectares due
to the government of Vietnam’s (GVN’s) policy to increase the corn planted area by shifting from
ineffective rice cultivation area. The average corn yield is expected to be slightly higher due to the use
of GM varieties. The CY 2015 corn production is revised about 300,000 tons higher than Post’s estimate
in Vietnam G&F update October 2014.
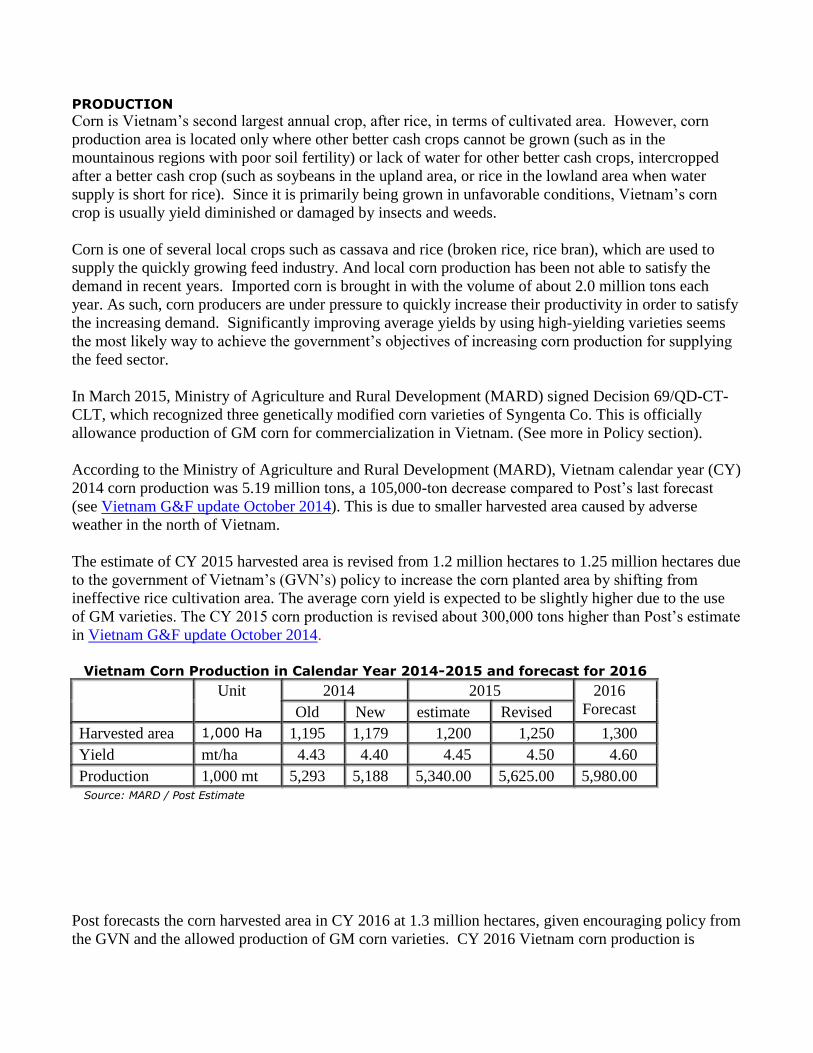
Vietnam Corn Production in Calendar Year 2014-2015 and forecast for 2016
Unit 2014 2015 2016
Forecast Old New estimate Revised
Harvested area 1,000 Ha 1,195 1,179 1,200 1,250 1,300
Yield mt/ha 4.43 4.40 4.45 4.50 4.60
Production 1,000 mt 5,293 5,188 5,340.00 5,625.00 5,980.00 Source: MARD / Post Estimate
Post forecasts the corn harvested area in CY 2016 at 1.3 million hectares, given encouraging policy from
the GVN and the allowed production of GM corn varieties. CY 2016 Vietnam corn production is
forecast to increase more than 350,000 tons, reaching 5.98 million tons, possibly a historically
significant change thanks to the GVN’s new policy.
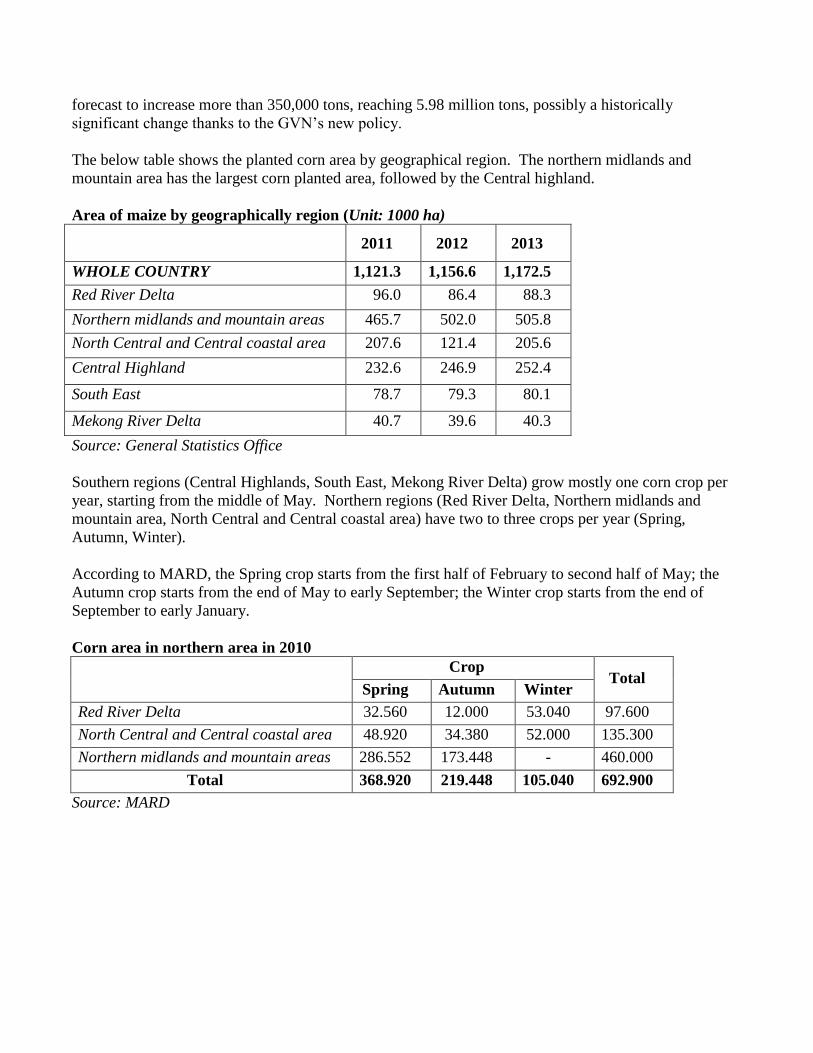
The below table shows the planted corn area by geographical region. The northern midlands and
mountain area has the largest corn planted area, followed by the Central highland.
Area of maize by geographically region (Unit: 1000 ha)
2011 2012 2013
WHOLE COUNTRY 1,121.3 1,156.6 1,172.5
Red River Delta 96.0 86.4 88.3
Northern midlands and mountain areas 465.7 502.0 505.8
North Central and Central coastal area 207.6 121.4 205.6
Central Highland 232.6 246.9 252.4
South East 78.7 79.3 80.1
Mekong River Delta 40.7 39.6 40.3
Source: General Statistics Office
Southern regions (Central Highlands, South East, Mekong River Delta) grow mostly one corn crop per
year, starting from the middle of May. Northern regions (Red River Delta, Northern midlands and
mountain area, North Central and Central coastal area) have two to three crops per year (Spring,
Autumn, Winter).
According to MARD, the Spring crop starts from the first half of February to second half of May; the
Autumn crop starts from the end of May to early September; the Winter crop starts from the end of
September to early January.
Corn area in northern area in 2010
Crop Total
Spring Autumn Winter
Red River Delta 32.560 12.000 53.040 97.600
North Central and Central coastal area 48.920 34.380 52.000 135.300
Northern midlands and mountain areas 286.552 173.448 - 460.000
Total 368.920 219.448 105.040 692.900
Source: MARD
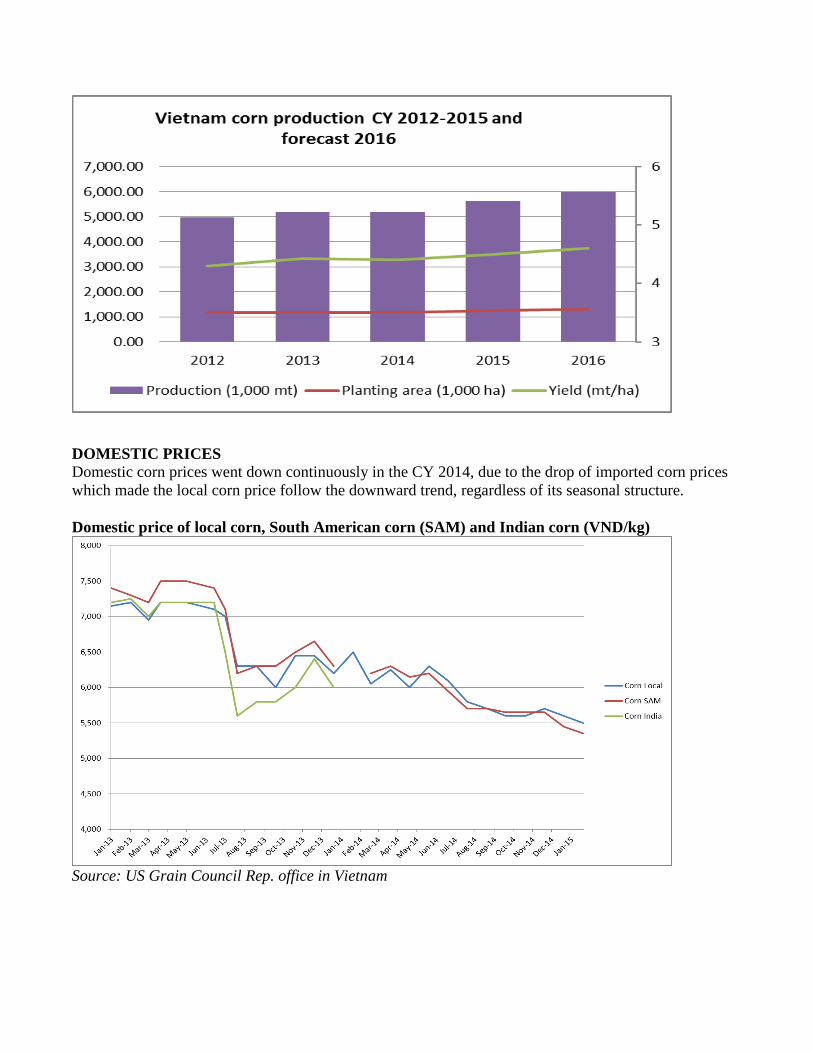
DOMESTIC PRICES
Domestic corn prices went down continuously in the CY 2014, due to the drop of imported corn prices
which made the local corn price follow the downward trend, regardless of its seasonal structure.
Domestic price of local corn, South American corn (SAM) and Indian corn (VND/kg)
Source: US Grain Council Rep. office in Vietnam
CONSUMPTION
In Vietnam, corn is used as the main source of energy-ingredient for the animal feed industry, for food
use as corn starch, and for limited use by other industries like beer, textiles, and the pharmaceutical
industry. However, more than 80 percent of corn is used as feed ingredients.
In the animal feed industry, corn is used in both the commercial and home-made sectors, mainly for hog
and poultry feeds. Corn use is expected to increase to meet the livestock sector’s growth, and
predominantly comes from imported sources, at least for the time being and in the near future, because
local corn production is not able to keep up with fast growing demand of the animal feed industry.
Currently, the feed industry needs about 1.8-2.0 million tons of imported corn to satisfy its demand.
However, the real imported volume depends greatly on the availability other alternative products like
broken rice, rice bran, and cassava locally, and the price competitiveness of imported feed wheat and
DDGS. The annual increase of corn use both for food and feed is about 200,000 – 400,000 tons
depending on above mentioned factors.
TRADE / COMPETITION
Competition exists between the home-made feed and manufactured feed sectors in Vietnam.
Commercial feed manufacturers usually can only purchase up to 50 percent of total locally produced
corn.
Corn growers, on the other hand, do not have appropriate storage facilities. Farmers must sell their
product quickly after the harvest, which will continue to make the local corn prices prone to seasonal
fluctuations.
Corn has competition from other feed ingredient sources. Cassava, broken rice local production and
imported feed wheat are among the main alternatives to corn. In recent years, rice and cassava have
been more focused on export markets and fell short of supplying the domestic animal feed industry.
Imported feed wheat was a very good alternative for imported corn when feed wheat prices became
competitive.
IMPORT / EXPORT
Post estimates corn imported volume in MY 2014/2015 to be at 2.0 million tons, down from 2.4 million
tons of the MY 2013/2014, due to the expected increase of local production. The import of corn volume
in MY 2015/2016 is forecast at 1.8 million tons, a 200,000- ton decrease compared with the MY
2014/2015, due to expected higher local corn production and carry-over stocks from MY 2013/2014.
U.S. corn exports to Vietnam in MY 2013/2014 hit a record of 511,000 tons, due to its competitive
price. The export volume in MY 2014/2015 dropped to 10,000 tons, due to, according to Vietnamese
buyers, its unsuitable moisture that makes it difficult for storage in the tropical weather condition. Post
forecasts U.S. corn export to Vietnam will be at a minimum level of 10,000 tons in MY 2015/1016, the
same as the MY 2014/2015 level.
Brazil became the biggest corn supplier into the Vietnam market, reaching nearly 1.0 million tons in MY
2013/2014 and about 800,000 tons in the first 10 months of MY 2014/2015. Post estimates Vietnam’s
import of Brazilian corn at about 1.0 million tons, the same volume with MY 2013/2014.
According to trade sources, Vietnam exported some volume of its locally produced corn to China via
border trade. There is no official data on the total volume; reportedly, Vietnam exported around 400,000
tons of local corn to China over MY 2013/2014. Post estimates the border trade with China will be
500,000 tons for both MY 2014/2015 and MY 2015/2016.
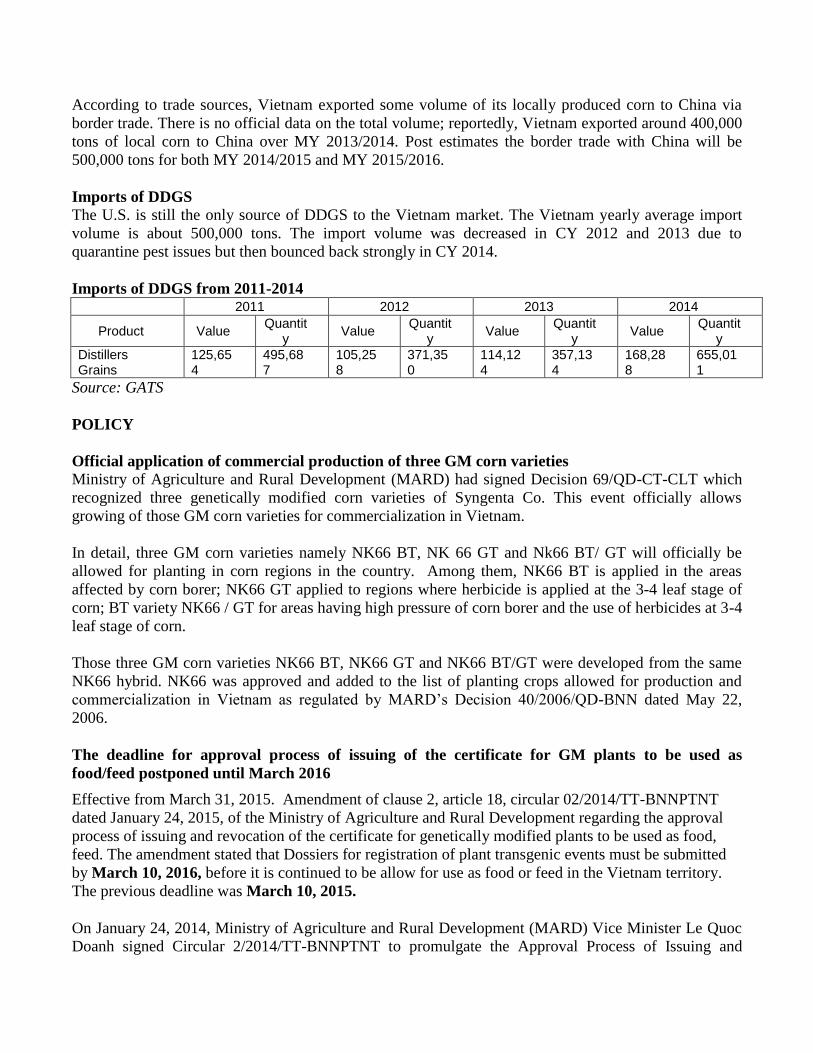
Imports of DDGS
The U.S. is still the only source of DDGS to the Vietnam market. The Vietnam yearly average import
volume is about 500,000 tons. The import volume was decreased in CY 2012 and 2013 due to
quarantine pest issues but then bounced back strongly in CY 2014.
Imports of DDGS from 2011-2014 2011 2012 2013 2014
Product Value Quantit
y Value
Quantity
Value Quantit
y Value
Quantity
Distillers Grains
125,654
495,687
105,258
371,350
114,124
357,134
168,288
655,011
Source: GATS
POLICY
Official application of commercial production of three GM corn varieties
Ministry of Agriculture and Rural Development (MARD) had signed Decision 69/QD-CT-CLT which
recognized three genetically modified corn varieties of Syngenta Co. This event officially allows
growing of those GM corn varieties for commercialization in Vietnam.
In detail, three GM corn varieties namely NK66 BT, NK 66 GT and Nk66 BT/ GT will officially be
allowed for planting in corn regions in the country. Among them, NK66 BT is applied in the areas
affected by corn borer; NK66 GT applied to regions where herbicide is applied at the 3-4 leaf stage of
corn; BT variety NK66 / GT for areas having high pressure of corn borer and the use of herbicides at 3-4
leaf stage of corn.
Those three GM corn varieties NK66 BT, NK66 GT and NK66 BT/GT were developed from the same
NK66 hybrid. NK66 was approved and added to the list of planting crops allowed for production and
commercialization in Vietnam as regulated by MARD’s Decision 40/2006/QD-BNN dated May 22,
2006.
The deadline for approval process of issuing of the certificate for GM plants to be used as
food/feed postponed until March 2016
Effective from March 31, 2015. Amendment of clause 2, article 18, circular 02/2014/TT-BNNPTNT
dated January 24, 2015, of the Ministry of Agriculture and Rural Development regarding the approval
process of issuing and revocation of the certificate for genetically modified plants to be used as food,
feed. The amendment stated that Dossiers for registration of plant transgenic events must be submitted
by March 10, 2016, before it is continued to be allow for use as food or feed in the Vietnam territory.
The previous deadline was March 10, 2015.
On January 24, 2014, Ministry of Agriculture and Rural Development (MARD) Vice Minister Le Quoc
Doanh signed Circular 2/2014/TT-BNNPTNT to promulgate the Approval Process of Issuing and

Withdrawing Certification for Genetically Modified Plants for use as food and feed. Circular 2, outlining
the approval process for agricultural biotechnology to be used as food and feed, is the last piece of
regulation necessary for Vietnam to commercialize agricultural biotechnology. Circular 2 entered into
force on March 10, 2014 and biotech developers have already submitted dossiers to MARD seeking
food and feed approval for biotech traits. Click here to see more in details.
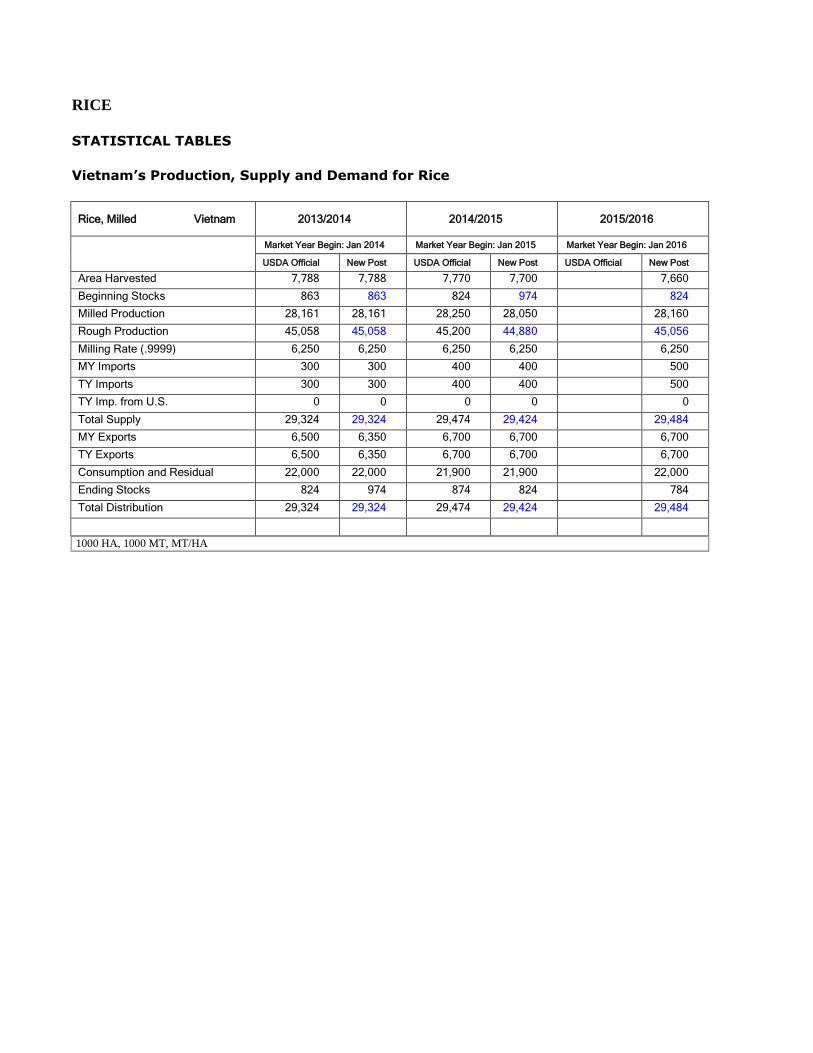
RICE STATISTICAL TABLES
Vietnam’s Production, Supply and Demand for Rice
Rice, Milled Vietnam 2013/2014 2014/2015 2015/2016
Market Year Begin: Jan 2014 Market Year Begin: Jan 2015 Market Year Begin: Jan 2016
USDA Official New Post USDA Official New Post USDA Official New Post
Area Harvested 7,788 7,788 7,770 7,700 7,660
Beginning Stocks 863 863 824 974 824
Milled Production 28,161 28,161 28,250 28,050 28,160
Rough Production 45,058 45,058 45,200 44,880 45,056
Milling Rate (.9999) 6,250 6,250 6,250 6,250 6,250
MY Imports 300 300 400 400 500
TY Imports 300 300 400 400 500
TY Imp. from U.S. 0 0 0 0 0
Total Supply 29,324 29,324 29,474 29,424 29,484
MY Exports 6,500 6,350 6,700 6,700 6,700
TY Exports 6,500 6,350 6,700 6,700 6,700
Consumption and Residual 22,000 22,000 21,900 21,900 22,000
Ending Stocks 824 974 874 824 784
Total Distribution 29,324 29,324 29,474 29,424 29,484
1000 HA, 1000 MT, MT/HA
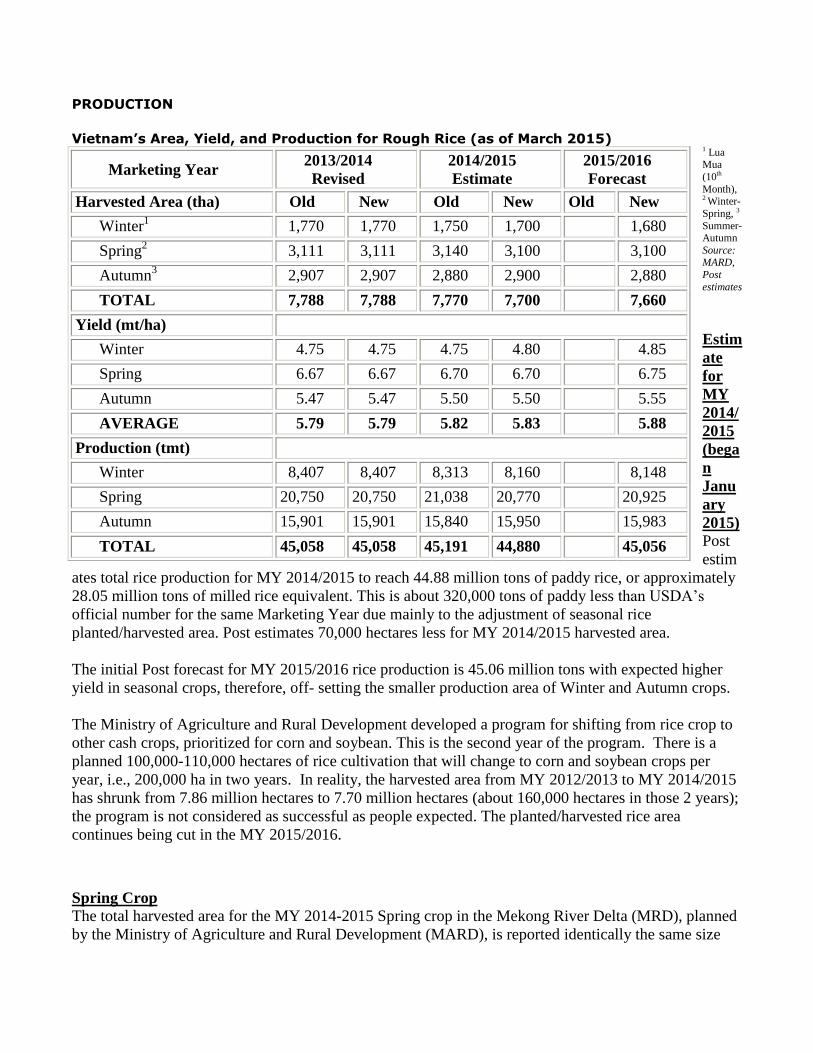
PRODUCTION
Vietnam’s Area, Yield, and Production for Rough Rice (as of March 2015)
1 Lua Mua
(10th
Month), 2 Winter-
Spring, 3
Summer-Autumn
Source: MARD,
Post
estimates
Estim
ate
for
MY
2014/
2015
(bega
n
Janu
ary
2015)
Post
estim
ates total rice production for MY 2014/2015 to reach 44.88 million tons of paddy rice, or approximately
28.05 million tons of milled rice equivalent. This is about 320,000 tons of paddy less than USDA’s
official number for the same Marketing Year due mainly to the adjustment of seasonal rice
planted/harvested area. Post estimates 70,000 hectares less for MY 2014/2015 harvested area.
The initial Post forecast for MY 2015/2016 rice production is 45.06 million tons with expected higher
yield in seasonal crops, therefore, off- setting the smaller production area of Winter and Autumn crops.
The Ministry of Agriculture and Rural Development developed a program for shifting from rice crop to
other cash crops, prioritized for corn and soybean. This is the second year of the program. There is a
planned 100,000-110,000 hectares of rice cultivation that will change to corn and soybean crops per
year, i.e., 200,000 ha in two years. In reality, the harvested area from MY 2012/2013 to MY 2014/2015
has shrunk from 7.86 million hectares to 7.70 million hectares (about 160,000 hectares in those 2 years);
the program is not considered as successful as people expected. The planted/harvested rice area
continues being cut in the MY 2015/2016.
Spring Crop
The total harvested area for the MY 2014-2015 Spring crop in the Mekong River Delta (MRD), planned
by the Ministry of Agriculture and Rural Development (MARD), is reported identically the same size
Marketing Year 2013/2014
Revised
2014/2015
Estimate
2015/2016
Forecast
Harvested Area (tha) Old New Old New Old New
Winter1 1,770 1,770 1,750 1,700 1,680
Spring2
3,111 3,111 3,140 3,100 3,100
Autumn3
2,907 2,907 2,880 2,900 2,880
TOTAL 7,788 7,788 7,770 7,700 7,660
Yield (mt/ha)
Winter 4.75 4.75 4.75 4.80 4.85
Spring 6.67 6.67 6.70 6.70 6.75
Autumn 5.47 5.47 5.50 5.50 5.55
AVERAGE 5.79 5.79 5.82 5.83 5.88
Production (tmt)
Winter 8,407 8,407 8,313 8,160 8,148
Spring 20,750 20,750 21,038 20,770 20,925
Autumn 15,901 15,901 15,840 15,950 15,983
TOTAL 45,058 45,058 45,191 44,880 45,056
with the MY 2013/2014 Spring crop. Post estimates the total Vietnam MY 2014/2015 spring crop
planted area is at 3.10 million hectares. This is also due to favorable weather conditions, which allow
farmers to be able to maintain their large planted area the as those of MY 2013/2014.
The planting progress of MY 2014/2015 Spring crop in North Vietnam was reported as faster than MY
2013/2014, due to the favorable weather that allowed farmers to carry out earlier plantings. As of March
15, 2015, the Northern Spring crop planting is nearly accomplished, about 98.6 percent compared to
planting intentions. Some areas are still planting with late Spring crop. The MY 2014/2015 harvested
area in other regions than the MRD is expected to be unchanged compared with MY 2013-2014.
Autumn Crop
The autumn crop is mainly located in the southern provinces. Especially, the MRD typically accounts
for more than 80 percent of the total autumn crop planting area. As of March 15, 2015, the on-going
MY 2014/2015 autumn crop planted area (mainly in the MRD) totaled more than 287,000 hectares,
compared to about 212,000 hectares in MY 2013/2014, year on year basis, mainly due to the early
harvest of the MY 2014/2015 Spring crop in the Mekong River Delta.
The overall Vietnam harvested area for the MY 2014/2015 autumn crop is estimated to increase about
20,000 hectares, compared to the MY 2013/2014 autumn crop, mainly due to the GVN setting a larger
planted/harvested area for the late Autumn crop in the MRD.
Winter Crop
Post estimates the harvested area for winter crop is 1.7 million hectares, decreasing about 70,000
hectares in MY 2014/2015 compared with MY 2013/2014. The cut is going to happen mainly in the
Mekong River Delta, where the Winter crop is no longer considered as one of the main crops due to its
lower yield than other crops, and being a longer crop cycle that makes it more susceptible to pests and
diseases. Harvested area of MY 2015/2016 Winter crop is forecasted to be at 1.68 million hectares.
0.00
1.00
2.00
3.00
4.00
5.00
6.00
7.00
8.00
9.00
0
5,000
10,000
15,000
20,000
25,000
30,000
35,000
40,000
45,000
50,000
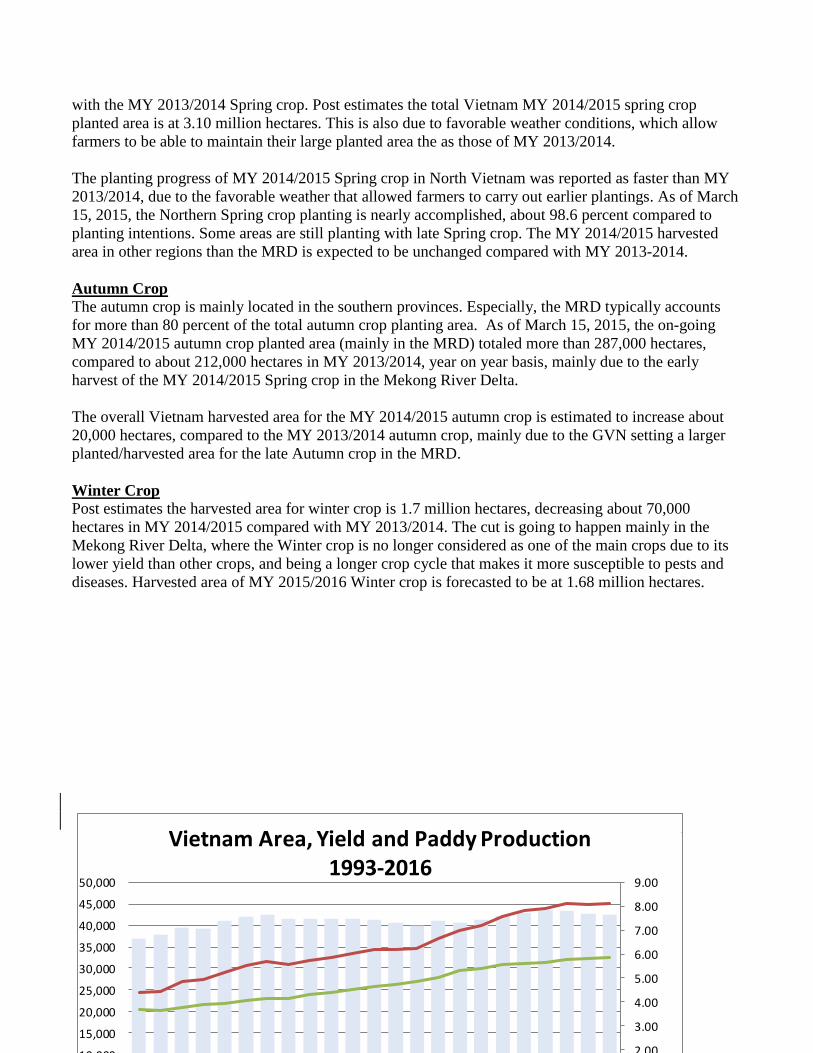
Vietnam Area, Yield and Paddy Production 1993-2016
Area Harvested (Million HA) Paddy Production (1000 MT)
0.00
1.00
2.00
3.00
4.00
5.00
6.00
7.00
8.00
9.00
0
5,000
10,000
15,000
20,000
25,000
30,000
35,000
40,000
45,000
50,000
Vietnam Area, Yield and Paddy Production 1993-2016
Area Harvested (Million HA) Paddy Production (1000 MT)
Source: Foreign Agricultural Service, Official USDA Estimates
The large scale rice farm is on the way
Started in 2008, the total area of large scale rice farms in the MRD (throughout 13 provinces) had
reached over 200,000 hectares by the end of MY 2012/2013. A large scale rice farm can be from 50-100
hectares in most of the provinces. A few farms can reach to 400-500 hectares. A common large scale
rice farm in the Mekong River Delta is ranging between 100-150 hectares. According to MARD, it is
expected to have totally around 300,000-500,000 hectares of large scale rice planting farms by the year
of 2015.
The Ministry of Agriculture and Rural Development (MARD) continues encouraging farmers to
implement the Large Scale Rice Farm model, where farmers gather their individual small farms to get a
larger scale farm model where farmers can capture an economy of scale for their farm work such as land
preparation, seeding, chemical, fertilizer applications, irrigation, harvesting… to save the production
cost; to better use of mechanical in rice cultivation, protect the environment, and to build a stronger
competitiveness. Most of the production input (fertilizer, pesticide, machinery…) is supported by a
trading company. In return, the company will purchase directly most of the rice products from farmers,
without going through middle men.
During the past few years, numerous provinces in the delta have set up large-scale rice farms, attracting
the participation of plant protection companies and local farmers. Companies provide farmers with rice
seed and pesticides and, in turn, they get to buy rice from farmers immediately after harvesting. The
model allows using machineries and pesticides effectively so as to gain higher yield. The model to grow
large-scale rice farms has helped farmers reduce production costs. However, numerous farmers have
complained that plant protection companies take nearly all the profits from these projects, consequently
leaving farmers taking part in the model with little benefits. Particularly, participating farmers are
buying rice seed and pesticides from these companies at prices higher than the market prices while the
companies buy harvested rice at a price equal to that set by the Vietnam Food Association. Meanwhile,
Vietnam’s Ministry of Agriculture and Rural Development considers this model as the modern scheme
of rice growing and is now targeting to expand the model to one million hectares nationwide from
hundreds of ha during the last crops. However, rice farmers are still facing hardships as rice exporters
and intermediary traders often gain the most in the rice industry.
Mekong River Delta (MRD) Rice Production in the MY 2012/2013
Spring Crop
As of March 20, 2015, Mekong River Delta (MRD) farmers have harvested nearly one million hectares,
about 65 percent, of their MY 2014/2015 spring crop. Post estimates the harvested area in the region to
be 1.56 million hectares, about the same size with MY 2013/2014. The estimated spring crop
production for MRD is 11.23 million tons of paddy, up about 50,000 tons from the MY 2012/2013.
According to MARD, the planted crop has been in very good condition and is expected to be a big
bumper crop in MY 2014/2015 with the region’s average yield of about 7.2 tons per hectares.
Autumn Crop and Winter Crop
The autumn crop is mainly located in the southern provinces. The MRD typically accounts for more
than 80 percent of the total autumn crop planting area. The Autumn crop includes Main Autumn and
Late Autumn crops.
Under the MARD program for shifting about 100,000-110,000 hectares of rice cultivation to other
crops, especially corn and soybean, some area of the main Autumn crop (about 10,000 hectares) is cut
for shifting to other crops. However, according to MARD, the plan for late Autumn crop area is still
expanding due to the high selling price advantage during the harvest time of the crop, which is off-
season with competing countries’ harvests. Post estimates the MRD total harvested area for the MY
2014/2015 Autumn crop at 2.47 million hectares (including main and late Autumn crops), about the
same compared with MY 2013/2014.
As of March 15, 2015, the ongoing MY 2014/2015 autumn crop planting is underway with a total area
of more than 288,000 hectares, compared to about 212,000 hectares at the same period last year, mainly
due to the earlier harvest of Spring crop than MY 2013/2014. The on-going planted area of the Autumn
is being carried out about two weeks after the harvest of the Spring crop on the same field.
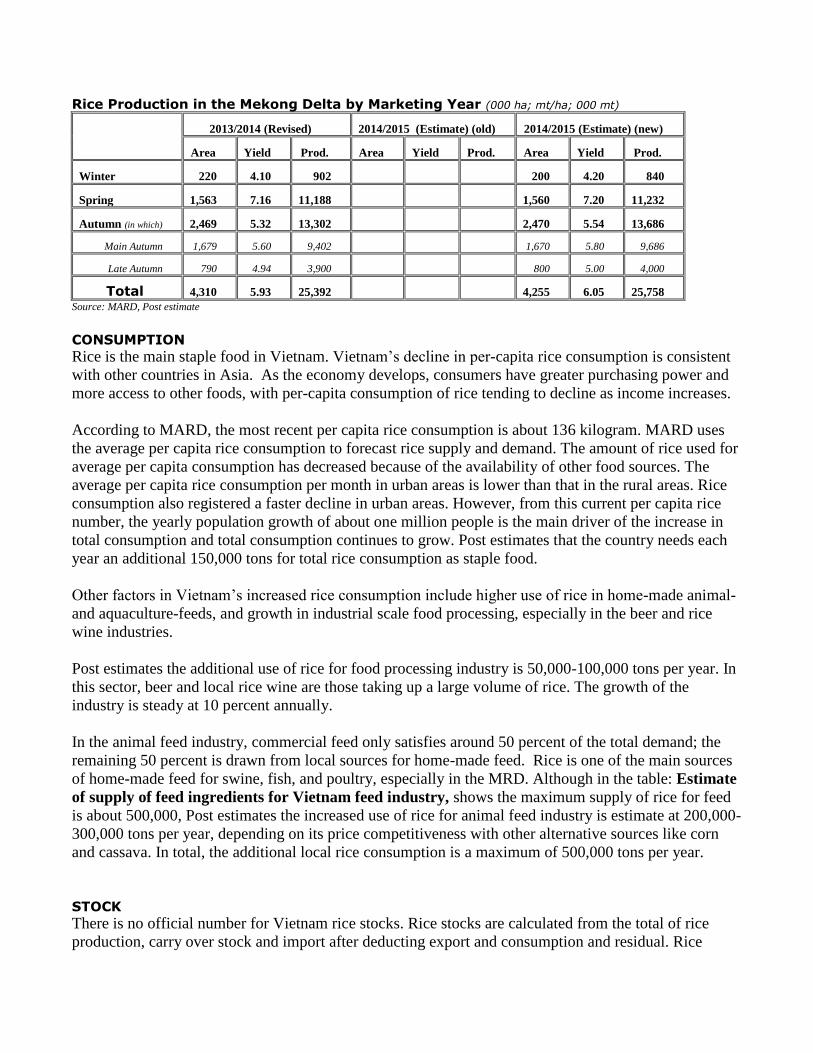
Rice Production in the Mekong Delta by Marketing Year (000 ha; mt/ha; 000 mt)
2013/2014 (Revised) 2014/2015 (Estimate) (old) 2014/2015 (Estimate) (new)
Area Yield Prod. Area Yield Prod. Area Yield Prod.
Winter 220 4.10 902 200 4.20 840
Spring 1,563 7.16 11,188 1,560 7.20 11,232
Autumn (in which) 2,469 5.32 13,302 2,470 5.54 13,686
Main Autumn 1,679 5.60 9,402 1,670 5.80 9,686
Late Autumn 790 4.94 3,900 800 5.00 4,000
Total 4,310 5.93 25,392 4,255 6.05 25,758
Source: MARD, Post estimate
CONSUMPTION
Rice is the main staple food in Vietnam. Vietnam’s decline in per-capita rice consumption is consistent
with other countries in Asia. As the economy develops, consumers have greater purchasing power and
more access to other foods, with per-capita consumption of rice tending to decline as income increases.
According to MARD, the most recent per capita rice consumption is about 136 kilogram. MARD uses
the average per capita rice consumption to forecast rice supply and demand. The amount of rice used for
average per capita consumption has decreased because of the availability of other food sources. The
average per capita rice consumption per month in urban areas is lower than that in the rural areas. Rice
consumption also registered a faster decline in urban areas. However, from this current per capita rice
number, the yearly population growth of about one million people is the main driver of the increase in
total consumption and total consumption continues to grow. Post estimates that the country needs each
year an additional 150,000 tons for total rice consumption as staple food.
Other factors in Vietnam’s increased rice consumption include higher use of rice in home-made animal-
and aquaculture-feeds, and growth in industrial scale food processing, especially in the beer and rice
wine industries.
Post estimates the additional use of rice for food processing industry is 50,000-100,000 tons per year. In
this sector, beer and local rice wine are those taking up a large volume of rice. The growth of the
industry is steady at 10 percent annually.
In the animal feed industry, commercial feed only satisfies around 50 percent of the total demand; the
remaining 50 percent is drawn from local sources for home-made feed. Rice is one of the main sources
of home-made feed for swine, fish, and poultry, especially in the MRD. Although in the table: Estimate
of supply of feed ingredients for Vietnam feed industry, shows the maximum supply of rice for feed
is about 500,000, Post estimates the increased use of rice for animal feed industry is estimate at 200,000-
300,000 tons per year, depending on its price competitiveness with other alternative sources like corn
and cassava. In total, the additional local rice consumption is a maximum of 500,000 tons per year.
STOCK
There is no official number for Vietnam rice stocks. Rice stocks are calculated from the total of rice
production, carry over stock and import after deducting export and consumption and residual. Rice
stocks in MY 2013/2014 went down below 1 million tons, due to the increase of rice consumption and
residual. Rice stocks in MY 2014/2015 and MY 2015/2016 are estimated to decrease to 824,000 tons
and 784,000 tons, respectively, due to remaining strong rice consumption and residual and expected
higher export volumes.
TRADE / COMPETITION
Domestic Prices
Domestic prices fluctuate depending on several factors: the availability of paddy harvested from
different crops during the year, the export demand, and the overall carry-over stock/ending stock. The
paddy prices usually drop to their lowest point two times in the year: once at the peak harvest of the
Spring crop (during March-April) and once at peak harvest of the main Autumn crop (during June-July).
The paddy prices also depend on the available stocks, especially carry-over stocks, by the end of the
year, against the off-harvest time in that period. The harvest of the Spring crop paddy is going on only
by the end of January in the Mekong River Delta.
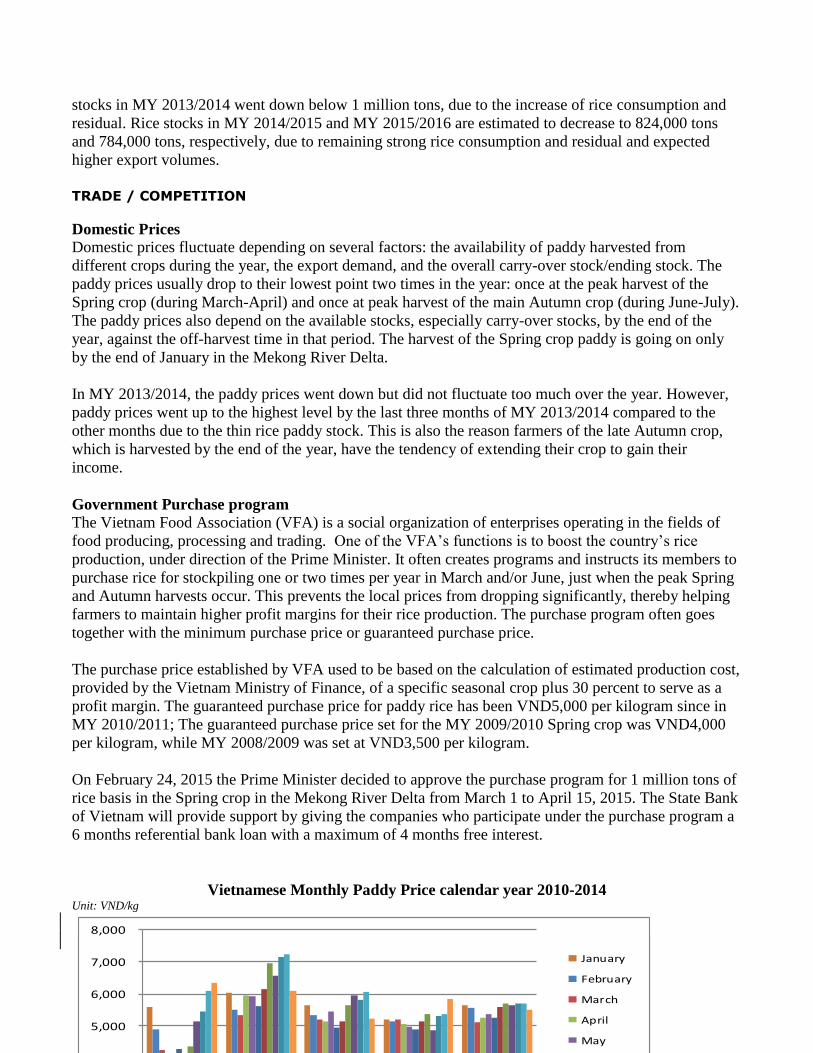
In MY 2013/2014, the paddy prices went down but did not fluctuate too much over the year. However,
paddy prices went up to the highest level by the last three months of MY 2013/2014 compared to the
other months due to the thin rice paddy stock. This is also the reason farmers of the late Autumn crop,
which is harvested by the end of the year, have the tendency of extending their crop to gain their
income.
Government Purchase program
The Vietnam Food Association (VFA) is a social organization of enterprises operating in the fields of
food producing, processing and trading. One of the VFA’s functions is to boost the country’s rice
production, under direction of the Prime Minister. It often creates programs and instructs its members to
purchase rice for stockpiling one or two times per year in March and/or June, just when the peak Spring
and Autumn harvests occur. This prevents the local prices from dropping significantly, thereby helping
farmers to maintain higher profit margins for their rice production. The purchase program often goes
together with the minimum purchase price or guaranteed purchase price.
The purchase price established by VFA used to be based on the calculation of estimated production cost,
provided by the Vietnam Ministry of Finance, of a specific seasonal crop plus 30 percent to serve as a
profit margin. The guaranteed purchase price for paddy rice has been VND5,000 per kilogram since in
MY 2010/2011; The guaranteed purchase price set for the MY 2009/2010 Spring crop was VND4,000
per kilogram, while MY 2008/2009 was set at VND3,500 per kilogram.
On February 24, 2015 the Prime Minister decided to approve the purchase program for 1 million tons of
rice basis in the Spring crop in the Mekong River Delta from March 1 to April 15, 2015. The State Bank
of Vietnam will provide support by giving the companies who participate under the purchase program a
6 months referential bank loan with a maximum of 4 months free interest.
Vietnamese Monthly Paddy Price calendar year 2010-2014 Unit: VND/kg
-
1,000
2,000
3,000
4,000
5,000
6,000
7,000
8,000
2010 2011 2012 2013 2014
January
February
March
April
May
June
July
August
September
October
November
December
-
1,000
2,000
3,000
4,000
5,000
6,000
7,000
8,000
2010 2011 2012 2013 2014
January
February
March
April
May
June
July
August
September
October
November
December
Source: Vietnam Food Association, Combined data
Exports
The Vietnam MY2014/2015 rice exports is revised to 6.7 million tons due to expected strong
competition from Thailand, India, Pakistan and other new exporters such as Cambodia and Myanmar.
The MY 2015/2016 rice export is forecasted at 6.7 million tons, due to expected low carry-over stocks
from the MY 2014/2015.
In early MY 2013/2014, VFA set the export target for 6.5 million tons of milled rice, due to strong
competition among top rice exporting countries like India, Thailand, and Pakistan. In addition, other
new rice exporters such as Myanmar and Cambodia also tried to boost their export volume in the MY
2013/2014. According to VFA, Vietnam January-December 2014 exports reached 6.32 million tons, an
FOB value worth $2.79 billion, and CIF valued at $2.93 billion. Exported volume was reported more
than 5 percent lower compared to MY 2012/2013. The export value was also down 3.46 percent on
Free-on-Board (FOB) basis.
The Vietnam Food Association (VFA) maintains rice export registration requirements and the Minimum
Export Price (MEP) based on the Government regulations on rice exports, Ordinance 109/2010/ND-CP,
in order to regulate the flow and prices for rice exports.
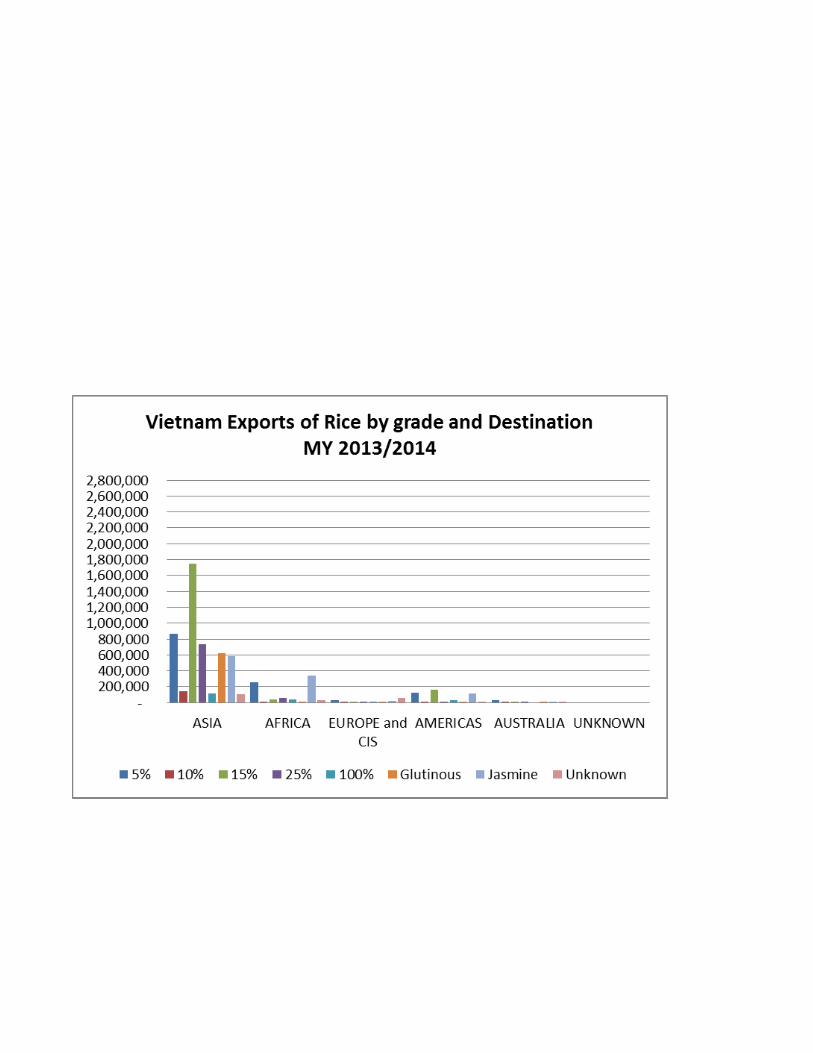
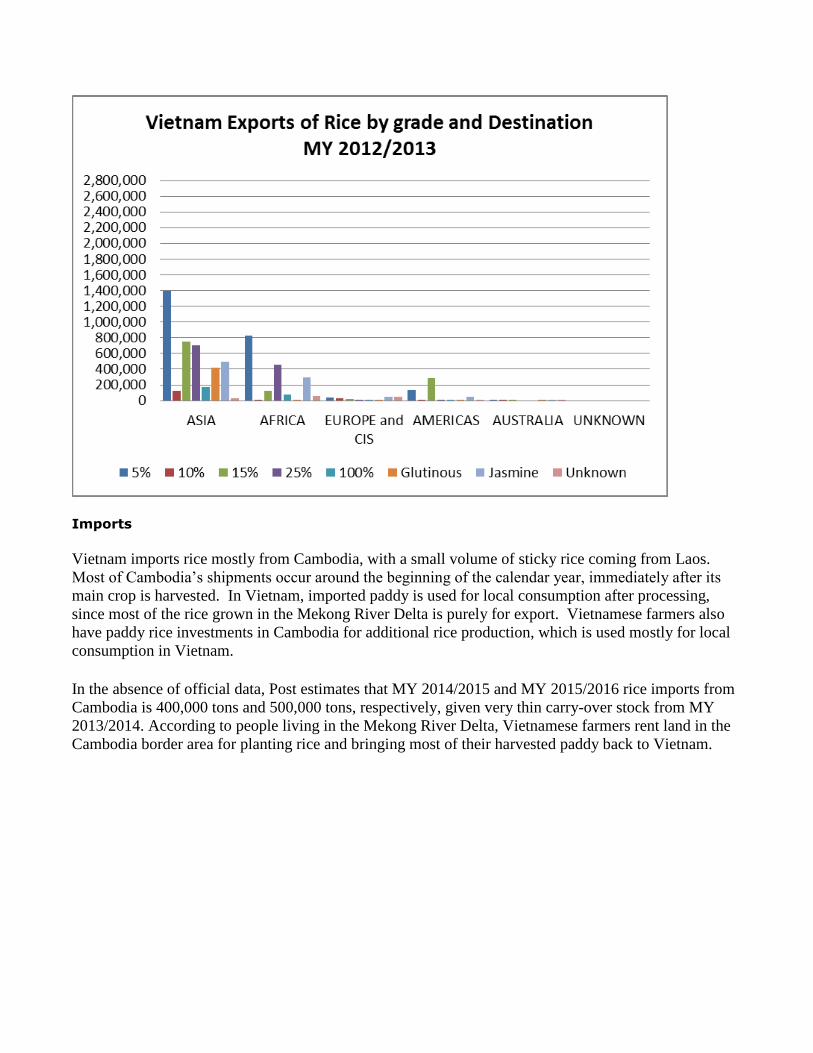
On the official trade, Asia remained the biggest market for Vietnamese rice with nearly 5 million tons
out of total 6.32 million tons in the MY 2013/2014. The Philippines has come back with about 1.5
million tons of official imports from Vietnam.
China remained, for the second year, the top Vietnamese rice importer with 2.0 million tons of milled
rice in MY 2013/2014, down 200,000 tons from MY 2012/2013’s 2.2 million tons. Vietnamese rice
exports to the Chinese market remained strong in the MY 2014/2015. However, Vietnam had stronger
competition from Thailand, India, Pakistan and Myanmar in this marketing year into the Chinese
market.
Vietnam’s exports of milled rice dropped dramatically in the MY 2013/2014. The total volume was
recorded at 800,000 tons compared to 1.8 million tons in the MY 2012/2013 due to strong competition
from India, Thailand and Pakistan.
The buying season for the African market is not in the first quarter, but from the second quarter of the
year onwards. Rice is normally shipped to African countries by international traders on a Free-On-
Board (FOB) basis, and the cargoes are delivered by large vessels that stop at several ports of different
African countries. The exact volume of Vietnamese rice that each African country imports is not clearly
recorded by Vietnam’s statistical authority.
In the Americas, in the first quarter of MY 2012/2013, Vietnam announced a government contract with
Haiti for shipping about 300,000 tons of Vietnamese rice for the whole year of 2013. The first shipment
of 15,000 tons under the government contract arrived Haiti in March 2013. And for MY 2013/2014 the
volume was only 20,000 tons. Comments from the trade are that Vietnam rice is different from that
typically consumed in Haiti, which is mainly imported from the U.S. The Prime Minister of Vietnam,
while on an official delegation to Haiti in March 28-29, 2013, signed a memorandum for Haiti to
purchase about 200,000 tons each year from CY 2014.
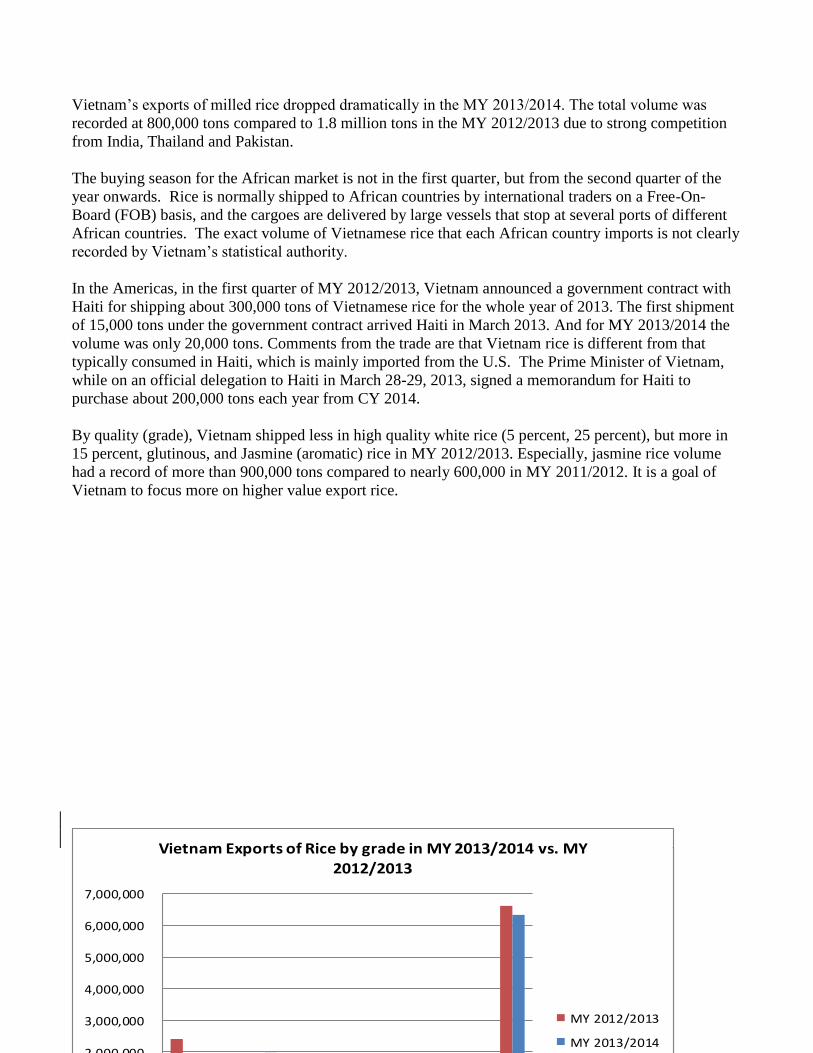
By quality (grade), Vietnam shipped less in high quality white rice (5 percent, 25 percent), but more in
15 percent, glutinous, and Jasmine (aromatic) rice in MY 2012/2013. Especially, jasmine rice volume
had a record of more than 900,000 tons compared to nearly 600,000 in MY 2011/2012. It is a goal of
Vietnam to focus more on higher value export rice.
-
1,000,000
2,000,000
3,000,000
4,000,000
5,000,000
6,000,000
7,000,000
Vietnam Exports of Rice by grade in MY 2013/2014 vs. MY
2012/2013
MY 2012/2013
MY 2013/2014
-
1,000,000
2,000,000
3,000,000
4,000,000
5,000,000
6,000,000
7,000,000
Vietnam Exports of Rice by grade in MY 2013/2014 vs. MY
2012/2013
MY 2012/2013
MY 2013/2014
Imports
Vietnam imports rice mostly from Cambodia, with a small volume of sticky rice coming from Laos.
Most of Cambodia’s shipments occur around the beginning of the calendar year, immediately after its
main crop is harvested. In Vietnam, imported paddy is used for local consumption after processing,
since most of the rice grown in the Mekong River Delta is purely for export. Vietnamese farmers also
have paddy rice investments in Cambodia for additional rice production, which is used mostly for local
consumption in Vietnam.
In the absence of official data, Post estimates that MY 2014/2015 and MY 2015/2016 rice imports from
Cambodia is 400,000 tons and 500,000 tons, respectively, given very thin carry-over stock from MY
2013/2014. According to people living in the Mekong River Delta, Vietnamese farmers rent land in the
Cambodia border area for planting rice and bringing most of their harvested paddy back to Vietnam.