Embed Size (px)
Citation preview
Visual Analytics of Brain Networks
Kaiming Li1,2
, Lei Guo1, Carlos Faraco
3, Dajiang Zhu
2, Hanbo Chen
2, Yixuan Yuan
1,
Jinglei Lv1, Fan Deng
2, Xi Jiang
2, Tuo Zhang
1, Xintao Hu
1, Degang Zhang
1, L Stephen Miller
3,4, Tianming Liu
2
1School of Automation, Northwestern Polytechnical University, Xi’an, China;
2Department of Computer Science
and Bioimaging Research Center, The University of Georgia, Athens, GA; 3Department of Neuroscience and
Bioimaging Research Center, The University of Georgia, Athens, GA; 4Department of Psychology, The
University of Georgia, Athens, GA.
Abstract
Identification of regions of interest (ROIs) is a fundamental issue in brain network construction and analysis.
Recent studies demonstrate that multimodal neuroimaging approaches and joint analysis strategies are crucial for
accurate, reliable and individualized identification of brain ROIs. In this paper, we present a novel approach of
visual analytics and its open-source software for ROI definition and brain network construction. By combining
neuroscience knowledge and computational intelligence capabilities, visual analytics can generate accurate,
reliable and individualized ROIs for brain networks via joint modeling of multimodal neuroimaging data and an
intuitive and real-time visual analytics interface. Furthermore, it can be used as a functional ROI optimization and
prediction solution when fMRI data is unavailable or inadequate. We have applied this approach to an operation
span working memory fMRI/DTI dataset, a schizophrenia DTI/resting state fMRI (R-fMRI) dataset, and a mild
cognitive impairment DTI/R-fMRI dataset, in order to demonstrate the effectiveness of visual analytics. Our
experimental results are encouraging.
Keywords: multimodal neuroimaging, joint modeling, visual analytics, visualization and interaction, brain
networks.
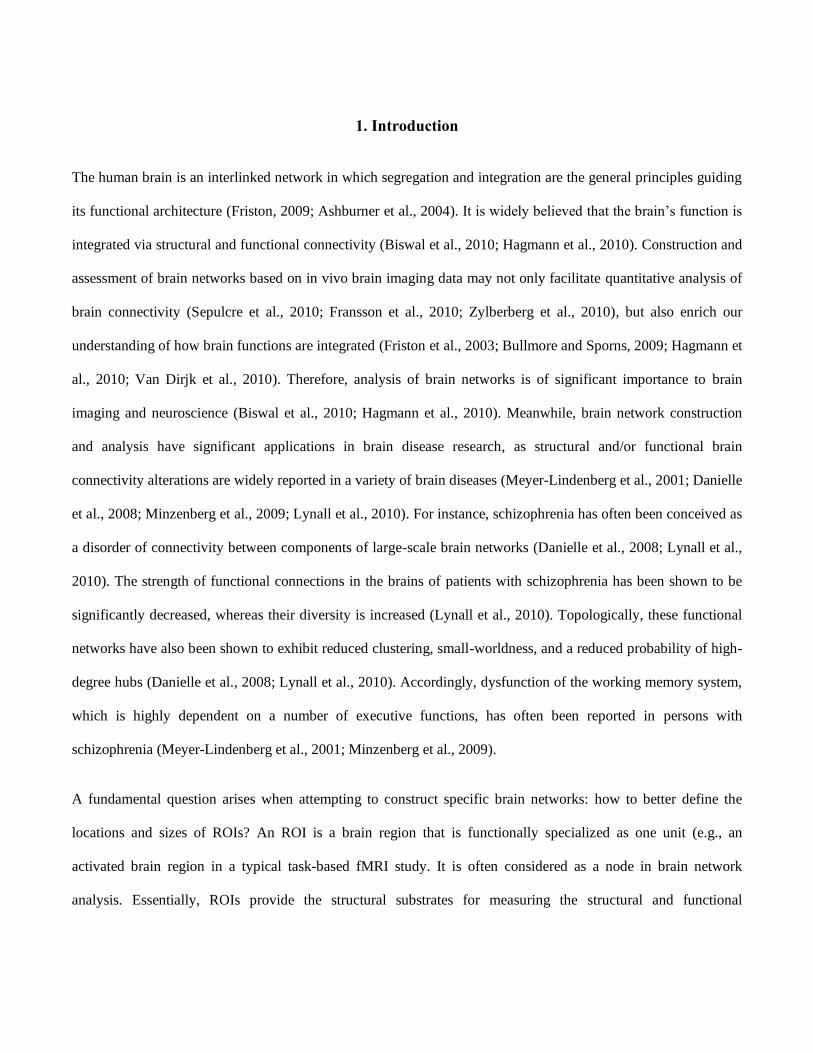
1. Introduction
The human brain is an interlinked network in which segregation and integration are the general principles guiding
its functional architecture (Friston, 2009; Ashburner et al., 2004). It is widely believed that the brain’s function is
integrated via structural and functional connectivity (Biswal et al., 2010; Hagmann et al., 2010). Construction and
assessment of brain networks based on in vivo brain imaging data may not only facilitate quantitative analysis of
brain connectivity (Sepulcre et al., 2010; Fransson et al., 2010; Zylberberg et al., 2010), but also enrich our
understanding of how brain functions are integrated (Friston et al., 2003; Bullmore and Sporns, 2009; Hagmann et
al., 2010; Van Dirjk et al., 2010). Therefore, analysis of brain networks is of significant importance to brain
imaging and neuroscience (Biswal et al., 2010; Hagmann et al., 2010). Meanwhile, brain network construction
and analysis have significant applications in brain disease research, as structural and/or functional brain
connectivity alterations are widely reported in a variety of brain diseases (Meyer-Lindenberg et al., 2001; Danielle
et al., 2008; Minzenberg et al., 2009; Lynall et al., 2010). For instance, schizophrenia has often been conceived as
a disorder of connectivity between components of large-scale brain networks (Danielle et al., 2008; Lynall et al.,
2010). The strength of functional connections in the brains of patients with schizophrenia has been shown to be
significantly decreased, whereas their diversity is increased (Lynall et al., 2010). Topologically, these functional
networks have also been shown to exhibit reduced clustering, small-worldness, and a reduced probability of high-
degree hubs (Danielle et al., 2008; Lynall et al., 2010). Accordingly, dysfunction of the working memory system,
which is highly dependent on a number of executive functions, has often been reported in persons with
schizophrenia (Meyer-Lindenberg et al., 2001; Minzenberg et al., 2009).
A fundamental question arises when attempting to construct specific brain networks: how to better define the
locations and sizes of ROIs? An ROI is a brain region that is functionally specialized as one unit (e.g., an
activated brain region in a typical task-based fMRI study. It is often considered as a node in brain network
analysis. Essentially, ROIs provide the structural substrates for measuring the structural and functional
connectivities within individual brains and for integrating data across populations. Thus, identification of reliable,
reproducible and accurate ROIs is critically important for the success of brain connectivity mapping.
Unfortunately, this task is quite formidable due to the following reasons (Liu, 2011). First, the boundaries
between cortical regions are unclear since it is difficult to obtain in vivo cytoarchitectural and chemoarchitectural
delineation of ROIs on the cerebral cortex. Second, cortical anatomy, connection and function are significantly
variable across individuals. Third, the properties of ROIs are highly nonlinear (Liu, 2011). For instance, a slight
change to the location of an ROI may dramatically change its structural and functional connectivity profiles (Li et
al., 2010a).
Current approaches for identifying ROIs in brain imaging can be broadly classified into three categories. The first
is manual labeling by experts based on their domain knowledge and experience. Though this method is widely
used, it may be vulnerable to inter-subject and intra-subject variation (Amunts et al., 2000) and its reproducibility
might be low. The second method is to cluster ROIs from the brain image itself and is data-driven (Zang et al.,
2004; Beckmann et al., 2005). However, many data-driven approaches could be sensitive to the clustering
parameters used. The third method uses task-based fMRI paradigms to identify activated brain regions as ROIs.
This methodology is regarded as the benchmark approach for ROI identification. However, task-based fMRI itself
has limitations, and is subject to a variety of variables that might affect the detected ROIs. For instance, a few
studies (White et al., 2001; Geissler et al., 2005; Jo et al., 2008; Ou et al., 2010) reported that the locations of
detected fMRI activations could be significantly shifted due to spatial smoothing, which is commonly used in
popular fMRI analysis toolkits such as SPM, FSL and AFNI. Furthermore, group-based activation maps may
show different patterns from an individual's activation map (Li et al., 2010a). In short, standard analysis of task-
based fMRI data remains quite challenging in accurately localizing ROIs for each individual.
ROI identification using joint analysis of multimodal information, e.g., fiber tractography, fMRI BOLD signals,
cortical folding pattern and anatomy, has recently emerged (Ho et al., 2009; Cherubini et al., 2010; Li et al.,
2010a; Chen et al., 2011; Zhang et al., 2011a; Zhang et al., 2011b; Zhu et al., 2011). The neural basis of these
studies is that brain structure and function are highly related to each other. For example, it has been reported that a
functional brain region has a unique set of inputs and outputs called a “connectional fingerprint” (Passingham et
al., 2002). Recent development of joint analysis of multimodal brain imaging data shows that DTI-derived fiber
shape is a good descriptor of brain function (Li et al., 2010a; Zhang et al., 2011b; Zhu et al., 2011). Also, cortical
folding pattern seems to be closely related to the architectonic, connectional and functional specialization of the
cortex as well (Toro and Burnod, 2005; Fischl et al., 2008; Chen et al., 2011). As such, it is of great importance to
leverage all available multimodal information to identify functional ROIs.
Here, we present a novel visual analytics approach that allows neuroscientists to integrate multimodal
neuroimaging data, including structural volumes, cortical surfaces, DTI-derived fiber tracts and fMRI signals, for
visual construction and assessment of functional ROIs. This approach contains two major parts: the joint
modeling of multimodal neuroimaging data and an intuitive and real-time interaction interface. The joint
modeling integrates multimodal data into a unified representation for ROIs; and the interface allows experts to
interactively verify computationally-derived ROIs, edit these ROIs, and visually assess ROI attributes (such as
axonal fibers and fMRI signals) based on their neuroscience knowledge and experimental experience.
Furthermore, the proposed approach can be used as an ROI optimization and prediction solution when fMRI data
is unavailable or inadequate. As examples, we demonstrated the capability of the approach and its accompanied
software to predict missing ROIs from group activation maps for individuals, predict ROIs of patients of
schizophrenia (SZ) using DTI fiber tracts, and predict default mode network (DMN) ROIs for mild cognitive
impairment (MCI) patients. The cross-platform and open source software interface was developed based on
QT/VTK, and has been released online at http://www.cs.uga.edu/~tliu/visualAnalyticTkt/visualAnalyticTkt.htm.
It should be noted that both visualization and analysis of multimodal brain imaging data and network construction
have been active research areas (Viergever et al., 2001; Manssour et al., 2001; Azar et al., 2005; Baum et al.,
2008; Venkataraman et al., 2010; Anderson et al., 2011; Sui et al., 2011). The unique contribution of this paper is
that we emphasize the visual analytics of multimodal brain imaging data for network reconstruction and analysis
by combining neuroscience knowledge and computational intelligence capabilities, and have demonstrated the
significantly improved accuracies in terms of ROI localization by our approach and its accompanied software
interface.
2. Materials and Methods
2.1 Data acquisition and preprocessing
Dataset 1: Twenty five UGA healthy university students (ages: 24.8 2.8, 6 males and 19 females) were
recruited to participate in this study under UGA IRB approval. Multimodal data including T1, fMRI and DTI
were acquired on a GE 3T Signa HDx scanner using an 8-channel head coil at the UGA Bioimaging Research
Center (BIRC). Acquisition parameters were as follows. T1 was acquired with a fast spoiled gradient recalled
echo (FSPGR) protocol. Acquisition parameters are: matrix = 512 x512, TE = min full, TR = 7.5 ms, flip angle =
20°, 154 axial slices, slice thickness = 1.2 mm and FOV = 256 x 256 mm. Task-based fMRI was acquired using a
T2*-weighted single shot echo planar imaging (EPI) sequence. Acquisition parameters are: 64x64 matrix, 30
slices, 4 mm slice thickness, 220 mm FOV, TR = 1.5 s, TE = 25 ms, ASSET = 2; DTI was also acquired using a
T2*-weighted single shot echo planar imaging (EPI) sequence. Acquisition parameters are: 128×128 matrix, 60
slices, 2mm slice thickness, 256 mm FOV, TR = 15100 ms, TE = min-full, ASSET = 2, 3 B0 images, 30 diffusion
weighted images (DWI), b-value = 1000.
The pre-processing of these multimodal MRI data is as follows. For the fMRI data, the operation span (OSPAN)
working memory task (Faraco et al., 2011) was performed during data acquisition. FMRI pre-processing steps
include brain extraction using Brain Extraction Tool (BET) (Smith, 2002), motion correction using the Motion
Correction FMRIB Linear Registration Tool (MCFLIRT) (Jenkinson and Smith, 2001), slice timing correction,
prewhitening, Gaussian smoothing (FWHM=6.75mm). For the T1 structural data, pre-processing includes brain
extraction using BET (Smith, 2002), and tissue segmentation using FSL FAST (Zhang et al., 2001). DTI data pre-
processing includes brain skull removal via FSL BET (Smith, 2002), motion correction, and eddy current
correction. Then tissue segmentation (Liu et al., 2007) and fiber tractography (Fillard and Gerig, 2003) are
conducted on pre-processed DTI data. The grey matter (GM) and white matter (WM) cortical surface was
reconstructed based on the WM map from DTI tissue segmentation (Liu et al., 2007; Liu et al., 2008) using
marching cubes (Lorensen and Cline, 1987). Streamline fiber tractography was performed via MEDINRIA to
meet the real time requirement of visual analytics (http://www-sop.inria.fr/asclepios/software/MedINRIA/).
Dataset 2: This dataset contains 10 schizophrenia (SZ) patients and 10 controls from the NA-MIC dataset
(http://hdl.handle.net/1926/1687). For each of the participants, multimodal T1 structural MRI, DTI and R-fMRI
data were acquired. The T1 images were scanned using contiguous spoiled gradient-recalled acquisition (fast-
SPGR) protocol, and the acquisition parameters are: TR = 7.4 ms, TE = 3 ms, flip angle=10, FOV = 256 x 256
mm, matrix=256×256. DTI scans were acquired using an echo planar imaging (EPI) sequence, and the acquisition
parameters are: TR = 17000 ms, TE = 78 ms, FOV = 240 x 240 mm, matrix = 144 x144, 85 slices were scanned
with slice thickness = 1.7 mm, ASSET = 2, 8 b0 images, and 51 DWI images with b=900. R-fMRI was acquired
with high resolution EPI sequence with scan parameters: TR = 3000 ms, TE = 30 ms, slice thickness = 3 mm, 200
volumes, and matrix = 96×96. The scan lasted for 10 minutes. The pre-processing for T1 and DTI is the same
with Dataset 1. For R-fMRI, the pre-processing includes brain extraction using FSL BET (Smith, 2002), motion
correction using FSL FLIRT (Jenkinson and Smith, 2001), slice timing correction, prewhitening, Gaussian
smoothing, and band-pass filtering (0.01Hz~0.1Hz) using in-house tools.
Dataset 3: 28 participants (10 Mild Cognitive Impairment (MCI) patients and 18 socio-demographically matched
controls) were recruited and scanned in the Duke-UNC Brain Imaging and Analysis Center (BIAC) under IRB
approval. MCI patients were diagnosed by a clinical psychiatrist at Duke Medical Center with criteria in
accordance with NACC procedures and NINCDS-ADRDA diagnostic guidelines. Demographic information for
the participants is as follows: numbers of males in MCI and controls: 5 and 8; age: 74.2 ± 8.6 (MCI) and 72.1 ±
8.2 (controls); MMSE: 28.4 ± 1.5 (MCI) and 29.4 ± 0.9 (controls); years of education: 17.7 ± 4.2 (MCI) and 16.3
± 2.4 (controls). Multimodal MRI data including DTI and R-fMRI was acquired using a 3.0 Tesla scanner (GE
Signa EXCITE, GE Healthcare). The R-fMRI acquisition parameters are: TR = 2000 ms, TE = 32 ms, matrix = 64
× 64, 34 slices, slice thickness = 4 mm, 150 volumes, FOV = 256 x 256 mm. DTI scan parameters are: TR =
17000 ms, TE = 78 ms, flip angle = 90, matrix = 256 x 256, FOV = 256 x 256 mm, 72 slices, slice thickness = 2
mm, 1 b0 image, and 25 DWI images with b = 1000. The pre-processing for DTI and R-fMRI is the same as in
Dataset 1 and 2.
2.2 Approach and software interface overview
In general, this visual analytics approach and its software aims to provide: 1) an informative way to define brain
network nodes (functional ROIs) via joint modeling of multimodal information for the nodes; 2) an intuitive
visualization of brain networks including functional networks; 3) a real-time and user-friendly interaction between
the networks and users; and 4) a framework for experts to compare the multimodal information of ROI attributes
and derived networks from different subjects.
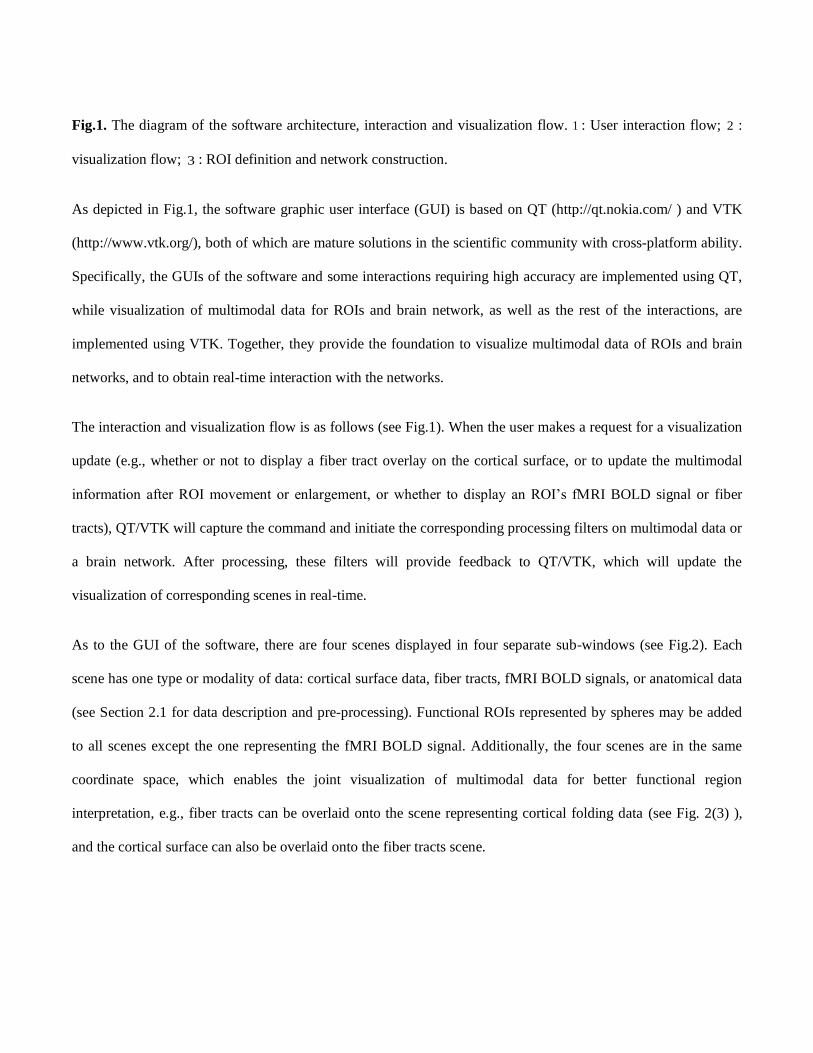
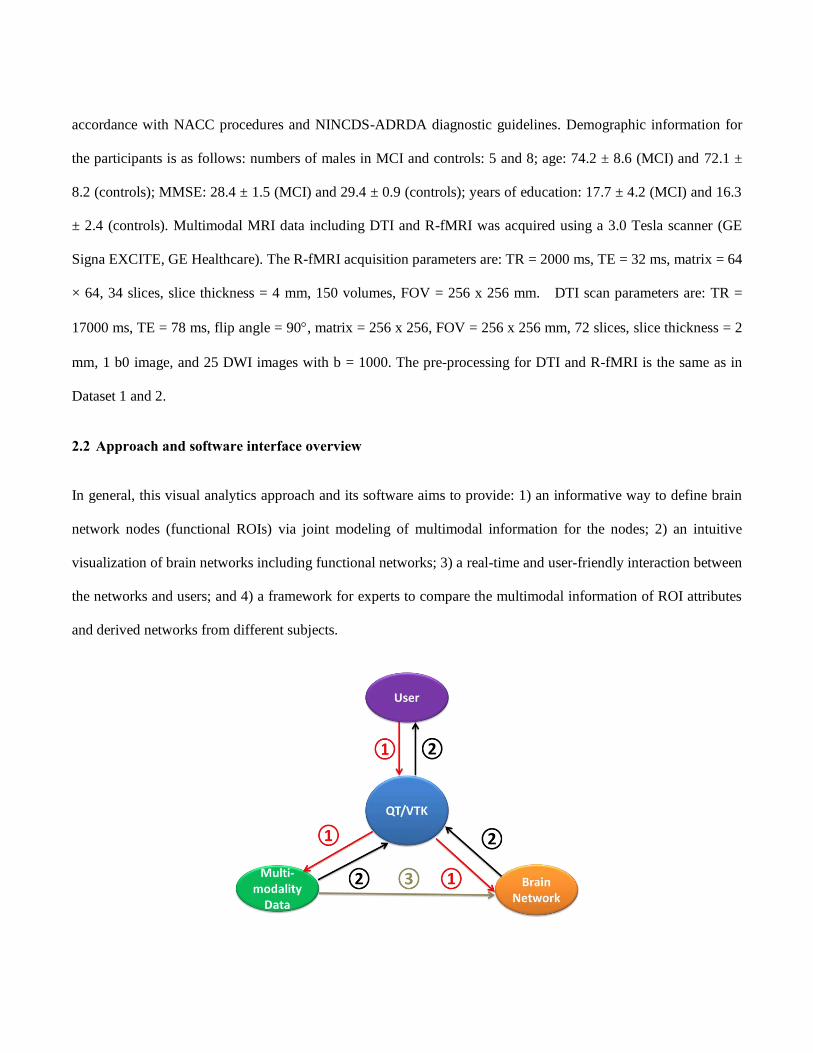
Fig.1. The diagram of the software architecture, interaction and visualization flow. 1 : User interaction flow; 2 :
visualization flow; 3 : ROI definition and network construction.
As depicted in Fig.1, the software graphic user interface (GUI) is based on QT (http://qt.nokia.com/ ) and VTK
(http://www.vtk.org/), both of which are mature solutions in the scientific community with cross-platform ability.
Specifically, the GUIs of the software and some interactions requiring high accuracy are implemented using QT,
while visualization of multimodal data for ROIs and brain network, as well as the rest of the interactions, are
implemented using VTK. Together, they provide the foundation to visualize multimodal data of ROIs and brain
networks, and to obtain real-time interaction with the networks.
The interaction and visualization flow is as follows (see Fig.1). When the user makes a request for a visualization
update (e.g., whether or not to display a fiber tract overlay on the cortical surface, or to update the multimodal
information after ROI movement or enlargement, or whether to display an ROI’s fMRI BOLD signal or fiber
tracts), QT/VTK will capture the command and initiate the corresponding processing filters on multimodal data or
a brain network. After processing, these filters will provide feedback to QT/VTK, which will update the
visualization of corresponding scenes in real-time.
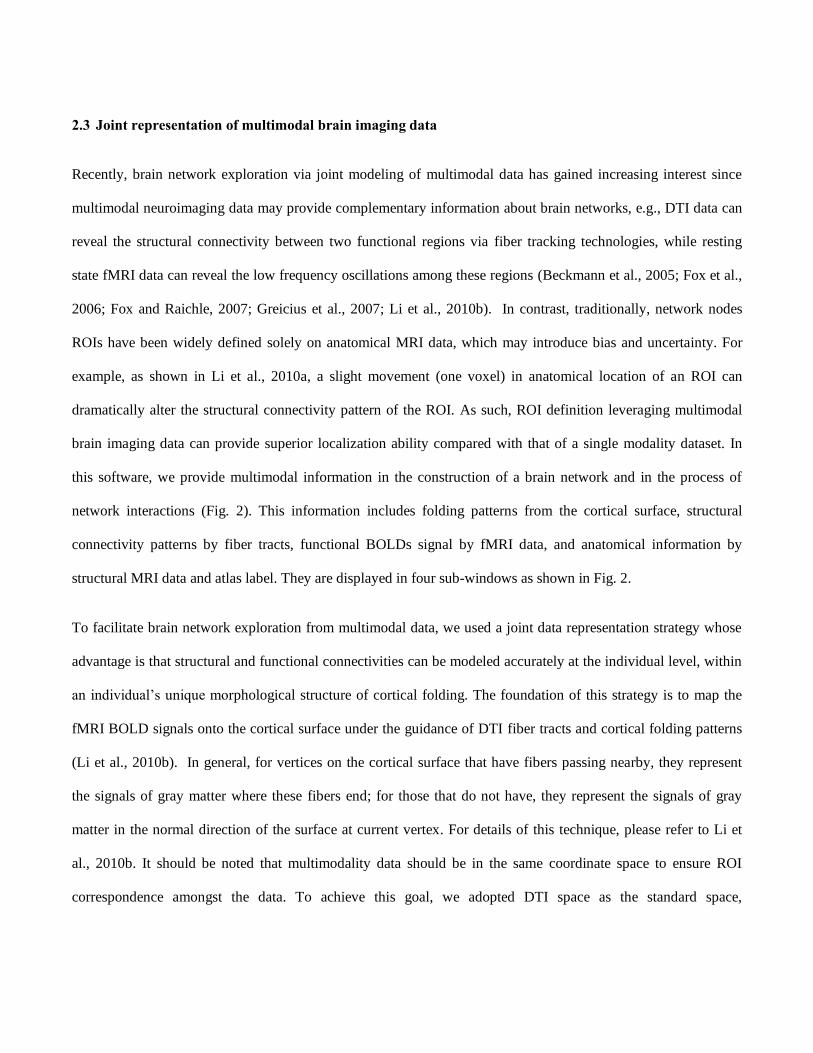
As to the GUI of the software, there are four scenes displayed in four separate sub-windows (see Fig.2). Each
scene has one type or modality of data: cortical surface data, fiber tracts, fMRI BOLD signals, or anatomical data
(see Section 2.1 for data description and pre-processing). Functional ROIs represented by spheres may be added
to all scenes except the one representing the fMRI BOLD signal. Additionally, the four scenes are in the same
coordinate space, which enables the joint visualization of multimodal data for better functional region
interpretation, e.g., fiber tracts can be overlaid onto the scene representing cortical folding data (see Fig. 2(3) ),
and the cortical surface can also be overlaid onto the fiber tracts scene.
2.3 Joint representation of multimodal brain imaging data
Recently, brain network exploration via joint modeling of multimodal data has gained increasing interest since
multimodal neuroimaging data may provide complementary information about brain networks, e.g., DTI data can
reveal the structural connectivity between two functional regions via fiber tracking technologies, while resting
state fMRI data can reveal the low frequency oscillations among these regions (Beckmann et al., 2005; Fox et al.,
2006; Fox and Raichle, 2007; Greicius et al., 2007; Li et al., 2010b). In contrast, traditionally, network nodes
ROIs have been widely defined solely on anatomical MRI data, which may introduce bias and uncertainty. For
example, as shown in Li et al., 2010a, a slight movement (one voxel) in anatomical location of an ROI can
dramatically alter the structural connectivity pattern of the ROI. As such, ROI definition leveraging multimodal
brain imaging data can provide superior localization ability compared with that of a single modality dataset. In
this software, we provide multimodal information in the construction of a brain network and in the process of
network interactions (Fig. 2). This information includes folding patterns from the cortical surface, structural
connectivity patterns by fiber tracts, functional BOLDs signal by fMRI data, and anatomical information by
structural MRI data and atlas label. They are displayed in four sub-windows as shown in Fig. 2.
To facilitate brain network exploration from multimodal data, we used a joint data representation strategy whose
advantage is that structural and functional connectivities can be modeled accurately at the individual level, within
an individual’s unique morphological structure of cortical folding. The foundation of this strategy is to map the
fMRI BOLD signals onto the cortical surface under the guidance of DTI fiber tracts and cortical folding patterns
(Li et al., 2010b). In general, for vertices on the cortical surface that have fibers passing nearby, they represent
the signals of gray matter where these fibers end; for those that do not have, they represent the signals of gray
matter in the normal direction of the surface at current vertex. For details of this technique, please refer to Li et
al., 2010b. It should be noted that multimodality data should be in the same coordinate space to ensure ROI
correspondence amongst the data. To achieve this goal, we adopted DTI space as the standard space,

reconstructed the white matter cortical surface and fibers directly from DTI data, and registered the fMRI data to
DTI space using FSL FLIRT (Jenkinson and Smith, 2001). This helped to reduce the misalignment between DTI
data and fMRI data compared to that between T1 and DTI/fMRI data (Li et al., 2010b).
To take the advantages of rich morphological and anatomical information of T1 structural images and brain
atlases, we also integrate T1 images and Oxford-Harvard cortical atlas into the joint data representation strategy.
What’s more, instant switches between T1 images and DTI images are available in the toolkit. In this way, we can
obtain both detailed morphological and anatomical information with T1 images and atlases as well as the
improved alignment accuracy with DTI images. The intra-subject multimodal images were affinely aligned by
FSL FLIRT (Jenkinson and Smith, 2001), while the inter-subject MRI images were registered via ANTS (Avants
et al., 2008; parameters we used are: ANTS 3 -m CC[template.nii.gz,subject.nii.gz,1,4] –i 100x100x30 -o
output.nii.gz -t SyN[0.25] -r Gauss[3,0] ).
2.4 Real-time visualization of multimodal information for ROI definition and network interaction
Real time visualization of multimodal information (e.g., anatomy, folding pattern, structural connectivity, fMRI
BOLD signals, and atlas label) is of great importance in ROI definition and network interaction. The reason is
that ROIs may not be defined once and for all, since one may not know the optimal location and size of the ROI,
and needs several steps or tries. Therefore, real-time display of changes in the corresponding fibers and fMRI
BOLD signals associated with an ROI will greatly help to determine whether its current position or size needs
modification. For example, when attempting to optimize the location of left and right dorsolateral prefrontal
cortex ROIs in the working memory network, the ROIs should be placed where they show the strongest structural
connections to the parietal lobes.
(1) (2)
(3)
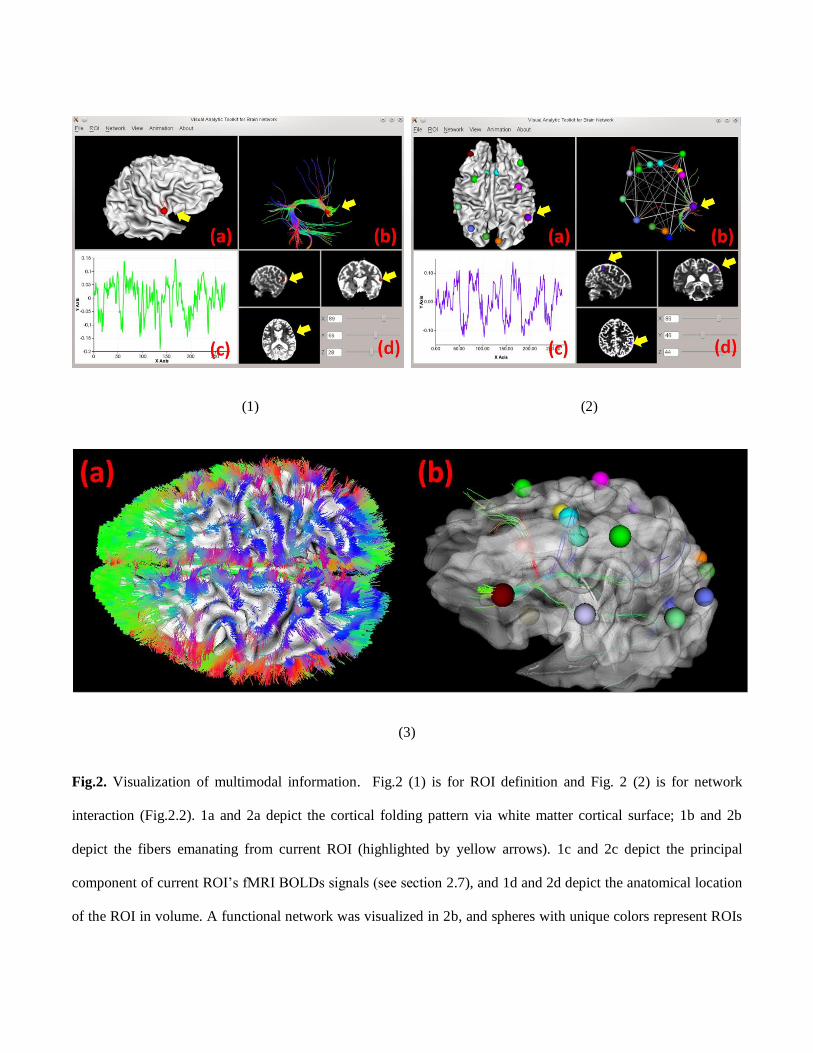
Fig.2. Visualization of multimodal information. Fig.2 (1) is for ROI definition and Fig. 2 (2) is for network
interaction (Fig.2.2). 1a and 2a depict the cortical folding pattern via white matter cortical surface; 1b and 2b
depict the fibers emanating from current ROI (highlighted by yellow arrows). 1c and 2c depict the principal
component of current ROI’s fMRI BOLDs signals (see section 2.7), and 1d and 2d depict the anatomical location
of the ROI in volume. A functional network was visualized in 2b, and spheres with unique colors represent ROIs

of the brain network. Fig.2 (3) depicts snapshots of joint visualization of cortical surface and fiber tracks from the
top-right sub window of the GUI.
In this toolkit, we implemented real-time visualization of multimodal information in both of the ROI definition
and network interaction processes. As shown in Fig. 2(1), while an ROI is being defined, its multimodal
information, including ROI size, folding pattern, fiber tracts, fMRI BOLD signal, anatomy, and atlas label
information, is immediately visualized and dynamically updated. As shown in Fig. 2(2), the same occurs when an
ROI is chosen from an existing network. Furthermore, the displayed connectivity pattern of the whole network is
also updated immediately. On our desktop computer (Xeon 2.0G, 16G RAM, NVIDIA Quardro FX4600 graphic
card), the visualization is almost instant. In fact, the software can run smoothly on most current mainstream
desktops.
2.5 Visual analytics for ROI identification
Interactive ROI editing is the core of ROI definition and network interaction since subtle changes in an ROI’s
location or size may introduce dramatic changes to its structural connectivity profile, as revealed by fiber tracts,
and the fMRI BOLD signal (Li et al., 2010a). These changes may then significantly impact the behavior of the
entire network. As such, interactive ROI location and size editing is of great benefit in ROI definition, as well as
in network exploration.
In this approach and software, we designed two ways to edit ROIs. The first one uses mouse drag-and-drop
manipulations to move the ROI from one location to another; this is easy and intuitive. With the real-time
visualization of multimodal information, users may approach the desired ROI location efficiently. Limits of this
method include the low localization accuracy and the inability to adjust ROI size. Therefore, a second network
controller was designed to fill this gap. As depicted in Fig. 3, the network controller lists all the ROIs with
detailed information for each. Displayed are the ROI name, checkboxes indicating whether to show the ROI, the
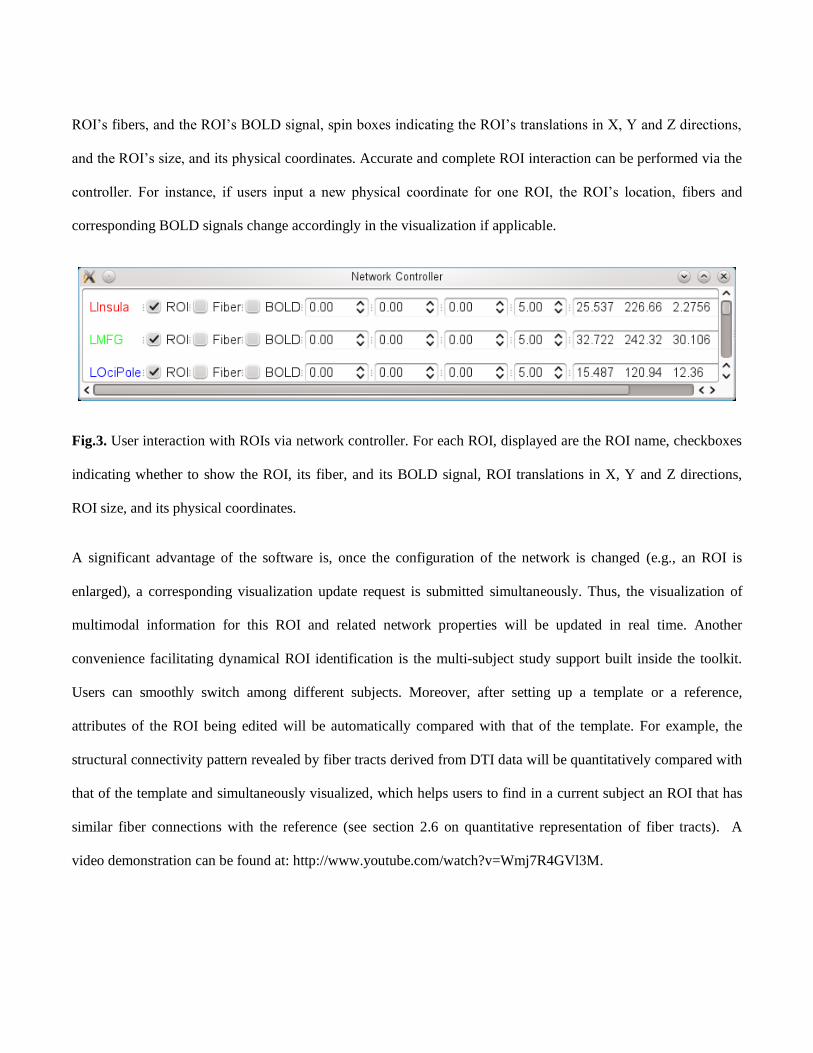
ROI’s fibers, and the ROI’s BOLD signal, spin boxes indicating the ROI’s translations in X, Y and Z directions,
and the ROI’s size, and its physical coordinates. Accurate and complete ROI interaction can be performed via the
controller. For instance, if users input a new physical coordinate for one ROI, the ROI’s location, fibers and
corresponding BOLD signals change accordingly in the visualization if applicable.
Fig.3. User interaction with ROIs via network controller. For each ROI, displayed are the ROI name, checkboxes
indicating whether to show the ROI, its fiber, and its BOLD signal, ROI translations in X, Y and Z directions,
ROI size, and its physical coordinates.
A significant advantage of the software is, once the configuration of the network is changed (e.g., an ROI is
enlarged), a corresponding visualization update request is submitted simultaneously. Thus, the visualization of
multimodal information for this ROI and related network properties will be updated in real time. Another
convenience facilitating dynamical ROI identification is the multi-subject study support built inside the toolkit.
Users can smoothly switch among different subjects. Moreover, after setting up a template or a reference,
attributes of the ROI being edited will be automatically compared with that of the template. For example, the
structural connectivity pattern revealed by fiber tracts derived from DTI data will be quantitatively compared with
that of the template and simultaneously visualized, which helps users to find in a current subject an ROI that has
similar fiber connections with the reference (see section 2.6 on quantitative representation of fiber tracts). A
video demonstration can be found at: http://www.youtube.com/watch?v=Wmj7R4GVl3M.

2.6 Quantitative representation of fiber bundles
Although many algorithms have been proposed to cluster fibers into bundles (Brun et al., 2004, Maddah et al.,
2005, O’Donnell et al., 2006, Garyfallidis et al., 2010), how to quantitatively represent and compare fiber bundles
is still an open question. Recently, we proposed a TraceMap model (Zhu et al., 2011) to deal with this question,
and all the comparisons of fiber tracts in this paper are based on this model. Briefly, for each fiber in a fiber
bundle, we divided it into small segments. For each segment, we used the principal vector from a Principal
Component Analysis to represent it. The principal vector corresponds to a point on the standard sphere with
radius as one, dubbed as TracePoint, in spherical coordinate system. Thus, a fiber bundle can be represented by all
the TracePoints on the standard sphere.
To compare two fiber bundles, we first take samples on the standard sphere by uniformly sampling , in the
parameter space [0, 2 ], and obtain a series of samples:
{ ( , , ) | 1, , , 0,1, ..., ; 0,1, ..., }i j i j
X x r r i j i N j M (1)
where and are the sampling steps in parameter space of and . and N M are the corresponding sampling
numbers at each parameter space.
2
2
N
M
(2)
Then we can represent a fiber bundle as a matrix:
{ | 0,1, ..., ; 0,1, ..., }ij
ij
ij
D i N j M
nD
T
F =
(3)

where ij
n is the number of TracePoints within the neighborhood of sampling point (1, , )i j
x on the standard
sphere , T is the total number of TracePoints for the fiber bundle,ij
D then is the density of TracePoints at
sampling point (1, , )i j
x . Distance of two fiber bundles1 2,f f can then be defined as
1 2
( , )D f f 1 2
F F (4)
where and 1 2
F F are matrix representations of fiber bundles 1 2 and f f , and is the L2-norm of the matrix. For
more information of TraceMap, please refer to Zhu et al., 2011.
2.7 ROI types and network types
ROI definition is a fundamental yet challenging issue, especially when ROI size and shape are taken into
consideration (Liu, 2011). Therefore, a flexible ROI representation scheme is necessary. In this toolkit, three
types of ROIs have currently been supported, i.e., spheres and boxes with adjustable size, and image volumes.
While the first two ROI types are the mainstream in the brain imaging community, the last one enables the
representation of ROIs with arbitrary sizes and shape.
Each ROI may have dozens of fMRI BOLD time series, many of which could have similar fluctuations. To find
the representative BOLD signal for an ROI, we applied a PCA dimension reduction technique to these time series,
and used the first eigen vector (corresponds to the largest eigen value) as the representative BOLD signal for the
current ROI. Mathematically, suppose X is a m t matrix ( m time series, each of which has t time points), and
assume X has zero mean, we want to find an m m orthogonal matrix P so that
1
2
3( )
T
m
Y P X
C ov Y
(5)
where i
is the eigen value, and
1 2 3 m ; P can be re-written as
1 2[ , , ..., ]
mP p p p , and
ip is
an eigenvector of the covariance matrix of X corresponding to the eigenvaluei
. 1
p is the representative BOLD
signal for the current ROI. In this way, regardless the type of ROI, the BOLD signal it represents in our toolkit
will always be the principal component of the BOLD signals within that ROI. However, it should be noted that if
the ROI is too large (e.g., the whole precentral gyrus), the representation of BOLD signal using principal
component would not be preferred. Such ROIs are currently deprecated in our method.
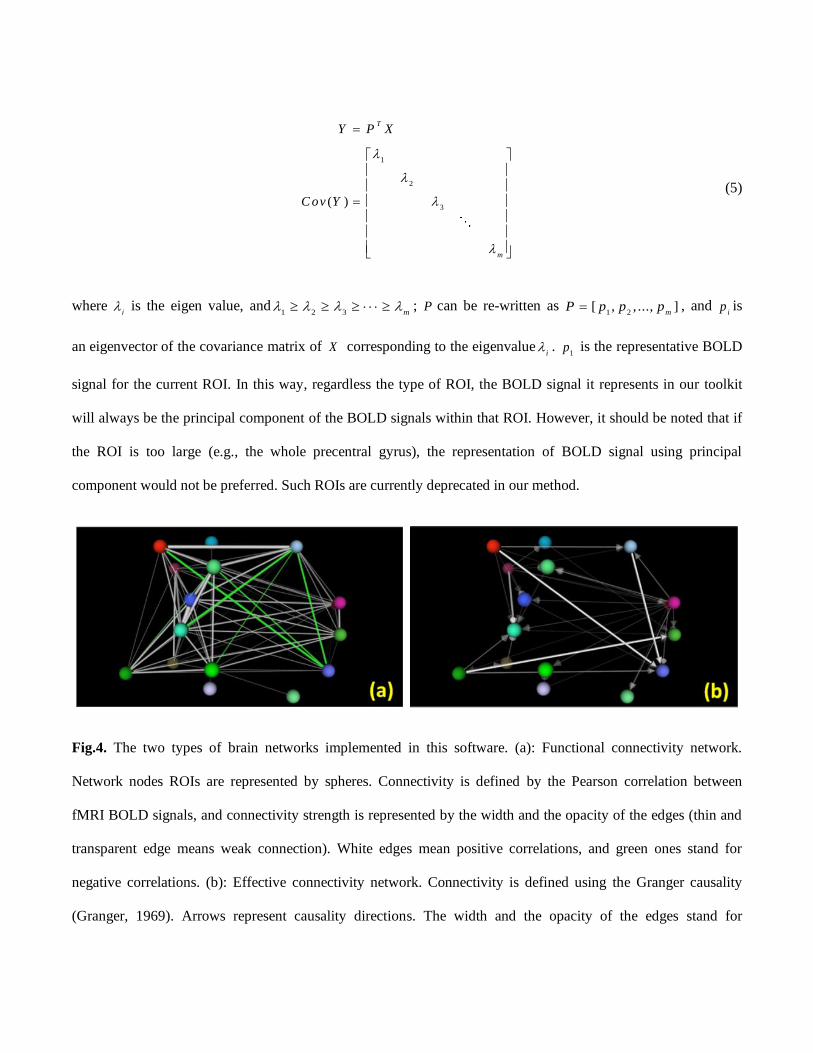
Fig.4. The two types of brain networks implemented in this software. (a): Functional connectivity network.
Network nodes ROIs are represented by spheres. Connectivity is defined by the Pearson correlation between
fMRI BOLD signals, and connectivity strength is represented by the width and the opacity of the edges (thin and
transparent edge means weak connection). White edges mean positive correlations, and green ones stand for
negative correlations. (b): Effective connectivity network. Connectivity is defined using the Granger causality
(Granger, 1969). Arrows represent causality directions. The width and the opacity of the edges stand for

connectivity strength.
Both functional connectivity and effective connectivity have been widely used in brain network analysis (Friston
et al., 2003; Friston 2009; Harrison et al., 2003; Roebroeck et al., 2005; Li et al., 2009). This toolkit supports both
types of analysis. For the functional connectivity network, the classical Pearson correlation coefficient is adopted
as the similarity measurement. Specifically, suppose ,i j
v v are two ROIs whose principal component BOLD signals
are ,i j
b b respectively, the functional connection strength between ,i j
v v is defined as:
1 1
2 2
1 1
( )( ) ( )( )
( 1) ( ) ( )
T T
f ik i jk j ik i jk jk k
ij T Tbi bj
ik i jk jk k
b b b b b b b b
T S S b b b be
(6)
where T is the number of fMRI volumes.
For the effective connectivity network, this toolkit has adopted the Granger causality (Granger, 1969) as the
connectivity measurement. Briefly, suppose two time series and X Y , each of which can be expressed as an auto
regression of their lagged values:
P
t i t - i
i= 1
P
t i t - i
i= 1
1t
2t
= a X + e
Y = b Y + e
X
(7)
where P is the lag order, t
X is the BOLD signal value of X at time t , so ist
Y , and 1 2,e e are prediction errors
and their variances describe the accuracy of the prediction. If each time series has causal effect onto the other,
then and X Y can be re-expressed:

P P
t i t - i i t - i t
i= 1 i= 1
P P
t i t - i i t - i t
i= 1 i= 1
3
4
X = a X + b Y + e
Y = c X + d Y + e
(8)
where , , ,i i i i
a b c d are model coefficients, and 1 2 and e e are the prediction errors. To test the causal effect of Y to
X , we construct a F statistics:
Y X
1 3
3
(S(e ) - S(e )) / PF =
S(e ) / (T - 2P)
(9)
where ( )S is the sum-of-square for a residual variable. Under null hypothesis 1 2 P
H 0 : = 0, b b = (b ,b , ,b ) ,
Y XF
has a F distribution with degree of freedom ( , 2 ) :P T P ~ ( , 2 )
Y XF F P T P
. Here T is the length of
the time series, and P is the lag order in Eq. (7) and (8). The larger Y X
F
is, the more unlikely it is sampled under
0H , which means the causal effect of Y to X is significant. The strength of the causality can be measured by the
causality magnitude:
/ )Y X
M = ln(S(e3) S(e1)
(10)
With Eq. (9) and Eq. (10), we can represent the direction of causality effect and the strength of the causality.
In addition, smooth switching between the two types of networks is available while exploring the networks. This
feature provides cross-validation of certain functional ROIs when users have prior information like connectivity
patterns for both types of brain networks.
3. Experimental Results

3.1 Identification of ROI benchmarks
We adopted three datasets (see section 2.1) to demonstrate the effectiveness of the proposed visual analytics
method and the functionality of its accompanied software toolkit. The first one is a working memory dataset
consisting of T1, DTI and fMRI data, which was used for experiments from section 3.2 to section 3.4; the second
one is a multimodal dataset consisting of data from schizophrenia (SZ) patients and their socio-demographically-
matched normal controls, which was used in section 3.5; and the third one an mild cognitive impairment (MCI)
dataset of DTI and resting state fMRI (R-fMRI) data, which was used for experiments in section 3.6.
ROI benchmarks used in the following sections are identified as depicted in Fig. 5. Taking the working memory
dataset for an example, we used FSL FEAT (Smith et al., 2004) to generate the group activation map
corresponding to (OSPAN-baseline) contrast. Then, group-level activation peaks were identified. These activation
peaks were afterwards affinely registered to each individual subject’s space, and overlaid on each individual
activation map. Then, with the registered group activation peaks as guidelines, two experts worked separately to
manually identify the individual activation peaks for each subject based on domain knowledge. The identified
individual activation peaks with consensus from two experts were considered as ROI benchmarks. In particular,
the activation peaks that exist in group-wise map, but do not exist in the individual map, were not used as ROI
benchmarks. For the default mode network (DMN), we used group ICA (Calhoun et al., 2001) to get the group
ICA map for DMN, and acquired ROI benchmarks for DMN in a similar way. Table 1 summarized the ROIs we
used as benchmarks in the following sections.
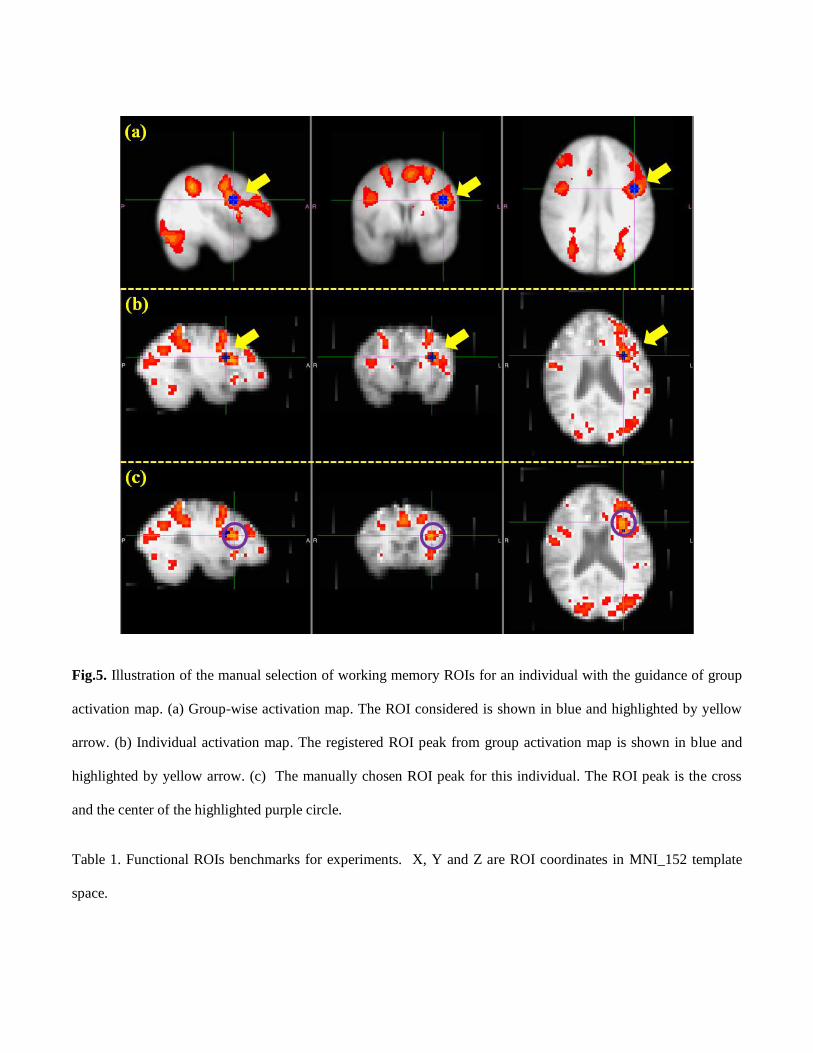
Fig.5. Illustration of the manual selection of working memory ROIs for an individual with the guidance of group
activation map. (a) Group-wise activation map. The ROI considered is shown in blue and highlighted by yellow
arrow. (b) Individual activation map. The registered ROI peak from group activation map is shown in blue and
highlighted by yellow arrow. (c) The manually chosen ROI peak for this individual. The ROI peak is the cross
and the center of the highlighted purple circle.
Table 1. Functional ROIs benchmarks for experiments. X, Y and Z are ROI coordinates in MNI_152 template
space.

Network X
Y Z Atlas Label X Y Z Atlas Label
Working
Memory
-44 4 26 Precentral Gyrus 42 -44 46 Supramarginal Gyrus
-24 6 58 Superior Frontal Gyrus 8 -76 48 Precuneous Cortex
-40 34 32 Middle Frontal Gyrus 24 4 58 Superior Frontal Gyrus
-6 16 42 Paracingulate Gyrus -34 20 -6 Insular Cortex
-42 -46 42 Supramarginal Gyrus -12 -96 -6 Occipital Pole
8 18 42 Paracingulate Gyrus 34 22 -4 Insular Cortex
-8 -74 46 Precuneous Cortex 36 48 12 Frontal Pole
Default
Mode
Network
-46 -62 36 Angular Gyrus 6 -55 11 Posterior Cingulate
42 -65 26 Middle Temporal Gyrus -9 -51 8.4 Posterior Cingulate
52 -20 -12 Superior Temporal Gyrus -58 -14 -16 Middle Temporal Gyrus
-14 30 48 Superior Frontal Gyrus 9 45 38 Medial Frontal Gyrus
3.2 Exploring functional brain network for individuals
Identification of accurate and reliable individualized functional ROIs is fundamental to brain connectivity analysis
and to computational modeling of dynamics and interactions among brain networks. In this section, we explore an
individual’s working memory ROIs using prior knowledge of the working memory network for guidance. More
specifically, we used group data from the OSPAN task, reported in standard MNI (Montreal Neurological
Institute) space, to guide exploration of the working memory network for separate individuals. We expected to
accurately localize the individualized working memory ROIs for the subject.
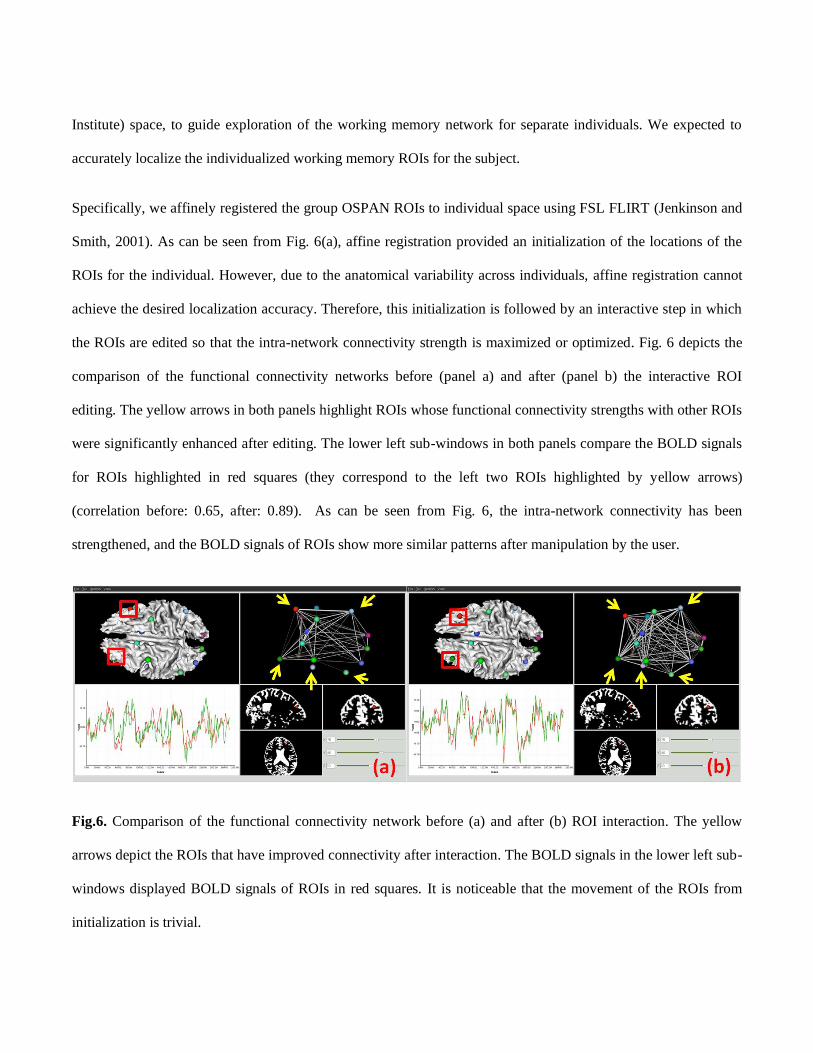
Specifically, we affinely registered the group OSPAN ROIs to individual space using FSL FLIRT (Jenkinson and
Smith, 2001). As can be seen from Fig. 6(a), affine registration provided an initialization of the locations of the
ROIs for the individual. However, due to the anatomical variability across individuals, affine registration cannot
achieve the desired localization accuracy. Therefore, this initialization is followed by an interactive step in which
the ROIs are edited so that the intra-network connectivity strength is maximized or optimized. Fig. 6 depicts the
comparison of the functional connectivity networks before (panel a) and after (panel b) the interactive ROI
editing. The yellow arrows in both panels highlight ROIs whose functional connectivity strengths with other ROIs
were significantly enhanced after editing. The lower left sub-windows in both panels compare the BOLD signals
for ROIs highlighted in red squares (they correspond to the left two ROIs highlighted by yellow arrows)
(correlation before: 0.65, after: 0.89). As can be seen from Fig. 6, the intra-network connectivity has been
strengthened, and the BOLD signals of ROIs show more similar patterns after manipulation by the user.
Fig.6. Comparison of the functional connectivity network before (a) and after (b) ROI interaction. The yellow
arrows depict the ROIs that have improved connectivity after interaction. The BOLD signals in the lower left sub-
windows displayed BOLD signals of ROIs in red squares. It is noticeable that the movement of the ROIs from
initialization is trivial.
A comparison study between the interactively-edited network and the benchmark data revealed that ROI location
changes were trivial (average 2.4 mm ) compared with that between registration and benchmark (average 6.7
mm), considering that there is approximately 2 mm distance from the center of gray matter layer to the cortical
surface. This alludes to the accurate ROI localization ability of this toolkit for individuals. Additionally, the intra
network connectivity strength after ROI editing is even stronger than the benchmark (connectivity strength using
the toolkit 0.73±0.09; benchmark: 0.71±0.13). This suggests that the intuitive network visualization and handy
ROI editing functionalities provided by the toolkit are beneficial to functional network exploration.
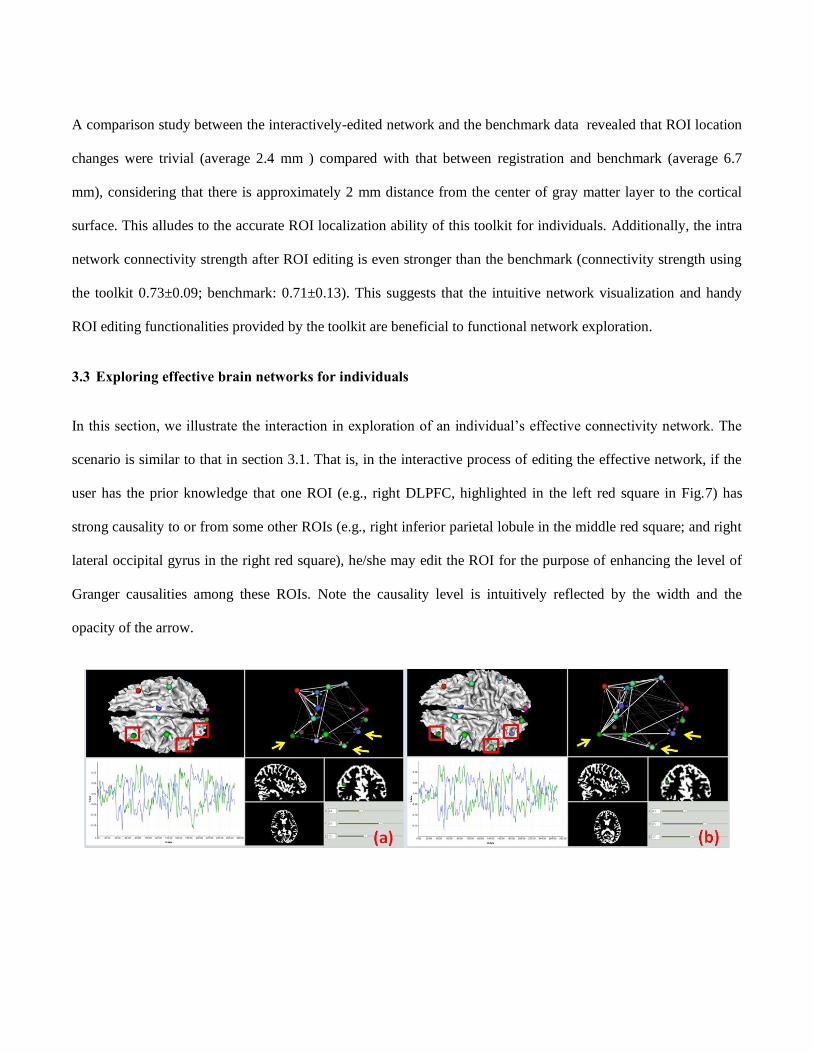
3.3 Exploring effective brain networks for individuals
In this section, we illustrate the interaction in exploration of an individual’s effective connectivity network. The
scenario is similar to that in section 3.1. That is, in the interactive process of editing the effective network, if the
user has the prior knowledge that one ROI (e.g., right DLPFC, highlighted in the left red square in Fig.7) has
strong causality to or from some other ROIs (e.g., right inferior parietal lobule in the middle red square; and right
lateral occipital gyrus in the right red square), he/she may edit the ROI for the purpose of enhancing the level of
Granger causalities among these ROIs. Note the causality level is intuitively reflected by the width and the
opacity of the arrow.
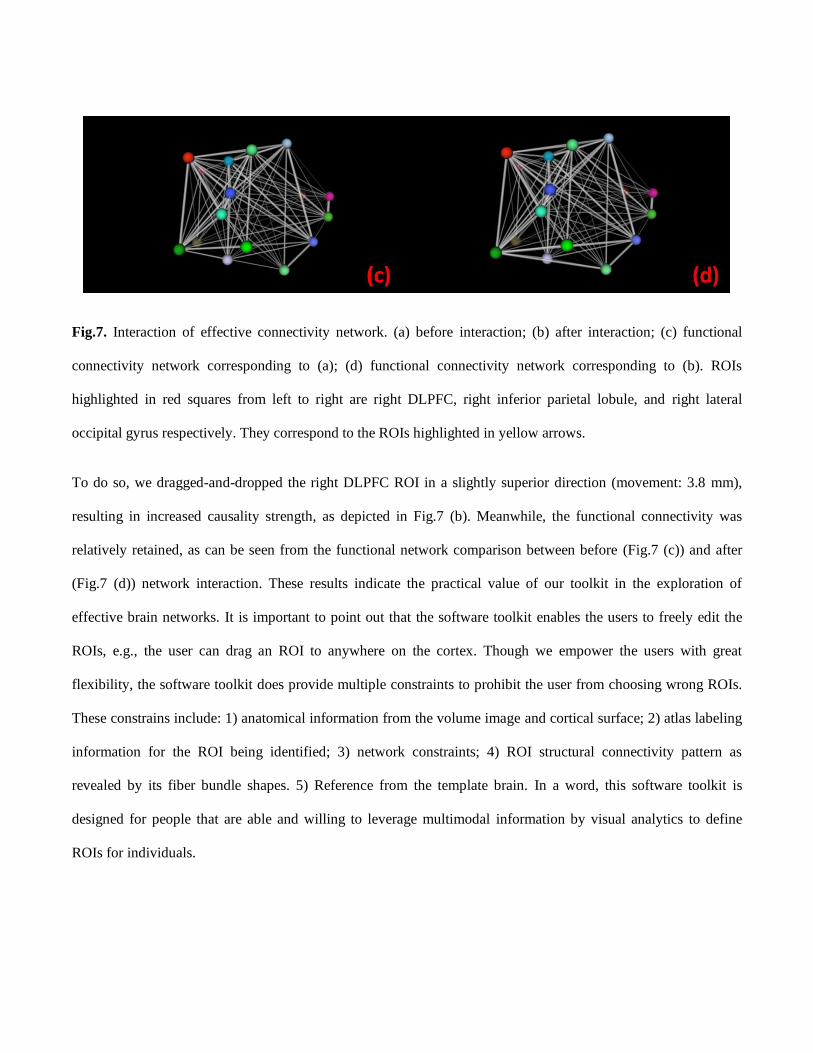
Fig.7. Interaction of effective connectivity network. (a) before interaction; (b) after interaction; (c) functional
connectivity network corresponding to (a); (d) functional connectivity network corresponding to (b). ROIs
highlighted in red squares from left to right are right DLPFC, right inferior parietal lobule, and right lateral
occipital gyrus respectively. They correspond to the ROIs highlighted in yellow arrows.
To do so, we dragged-and-dropped the right DLPFC ROI in a slightly superior direction (movement: 3.8 mm),
resulting in increased causality strength, as depicted in Fig.7 (b). Meanwhile, the functional connectivity was
relatively retained, as can be seen from the functional network comparison between before (Fig.7 (c)) and after
(Fig.7 (d)) network interaction. These results indicate the practical value of our toolkit in the exploration of
effective brain networks. It is important to point out that the software toolkit enables the users to freely edit the
ROIs, e.g., the user can drag an ROI to anywhere on the cortex. Though we empower the users with great
flexibility, the software toolkit does provide multiple constraints to prohibit the user from choosing wrong ROIs.
These constrains include: 1) anatomical information from the volume image and cortical surface; 2) atlas labeling
information for the ROI being identified; 3) network constraints; 4) ROI structural connectivity pattern as
revealed by its fiber bundle shapes. 5) Reference from the template brain. In a word, this software toolkit is
designed for people that are able and willing to leverage multimodal information by visual analytics to define
ROIs for individuals.

3.4 Predicting missing ROIs for individuals
In task-based fMRI, it is common that group-based activation maps show different patterns from individuals (Li et
al., 2010a). For instance, 15% of the individual subjects in dataset 1 have fewer activated regions than the group
result. In this section, we used the working memory dataset (Faraco et al., 2011) to demonstrate the capability of
predicting possible missing ROIs from group activation maps in individuals via visual analytics. Supposing some
ROI, e.g., left occipital pole, were not detected for an individual subject in the OSPAN fMRI experiment, we
initialized its location via FSL FLIRT to register group-wise ROIs to the subject’s space. Afterwards, we used our
visual analytics toolkit to identify the assumed missing ROI by maximizing the similarity of the candidate ROI’s
fiber connection pattern with those of corresponding ROIs in other template subjects.
The prediction of ROI using its fiber tracts is premised on that a functional region/ROI has a unique set of inputs
and outputs which largely determines its function, as reported by Passingham and colleagues (Passingham et al.,
2002). While Passingham and colleagues’ work was based on macaque brains (Passingham et al., 2002), our own
works on human brain also indicated that a functional region tends to have similar structural connection pattern as
revealed by the shape of fiber tracts (Li et al., 2010a, Zhu et al., 2011, Zhang et al., 2011b). Therefore, the close
relationship between ROI function and its connectivity pattern as revealed by the shape of fiber tracts inspires us
to predict a functional ROI using its fiber tracts.
As an example depicted in Fig.8, the predicted left occipital pole (highlighted by yellow arrow in Fig.8c) has
significantly improved fiber bundle consistency with the group (Fig.8a), and the prediction error, measured by the
Euclidean distance between the predicted ROI and ROI benchmark, was 4.08 mm, which is much smaller than the
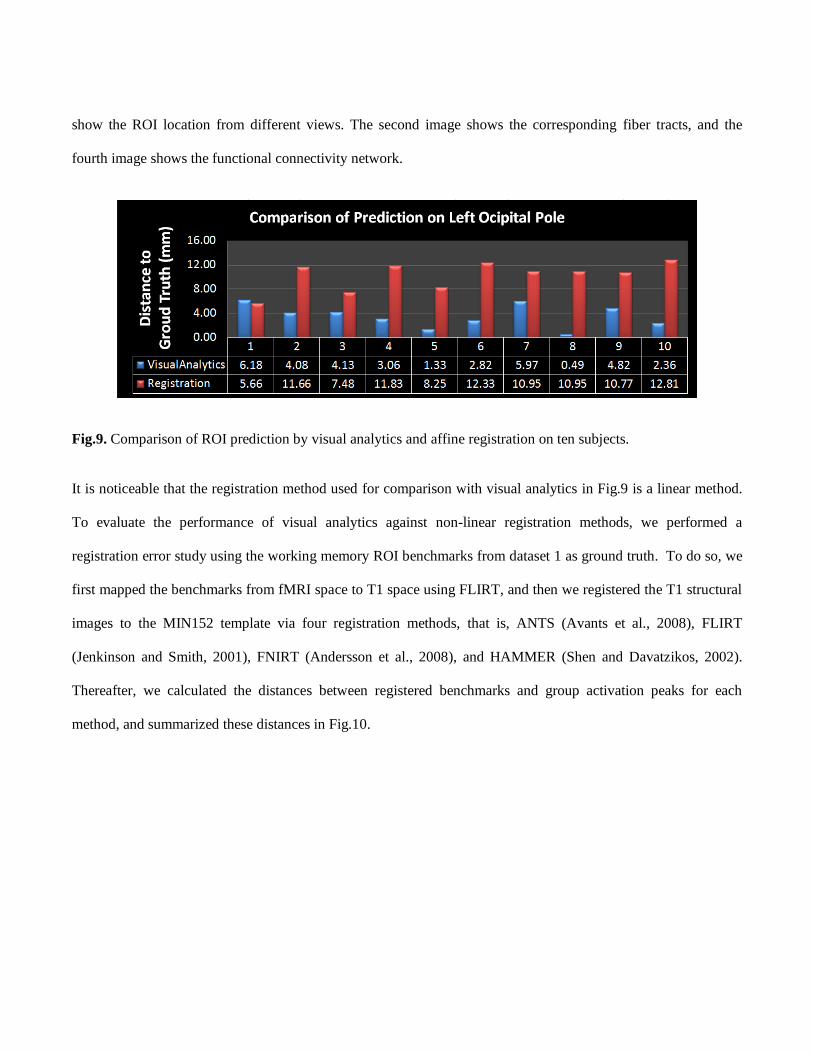
prediction error by using FSL FLIRT registration (11.66 mm). The same procedure was conducted on ten
randomly selected subjects, and the results are detailed in Fig.9. It is evident that the prediction error by using
visual analytics (3.52±1.77 mm) is significantly smaller than that of FSL FLIRT registration (10.27±2.22 mm).
Interestingly, as the fiber shape matching improved, its functional connectivity strength with other ROIs improves
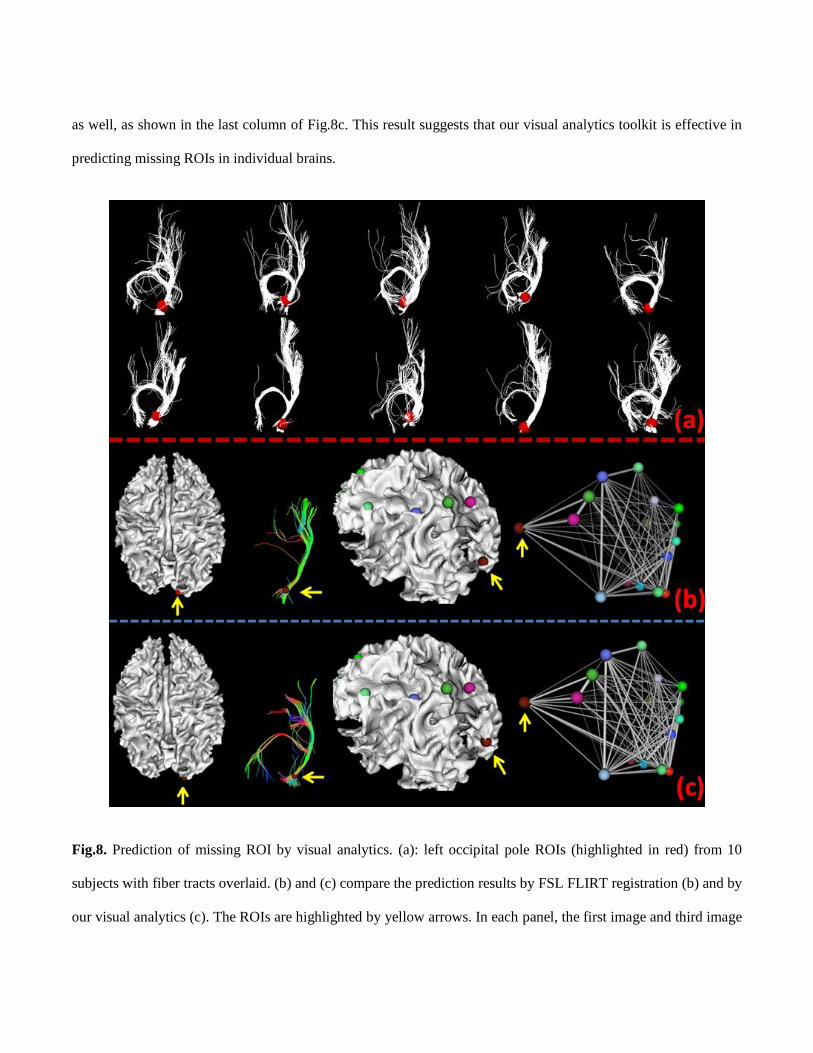
as well, as shown in the last column of Fig.8c. This result suggests that our visual analytics toolkit is effective in
predicting missing ROIs in individual brains.
Fig.8. Prediction of missing ROI by visual analytics. (a): left occipital pole ROIs (highlighted in red) from 10
subjects with fiber tracts overlaid. (b) and (c) compare the prediction results by FSL FLIRT registration (b) and by
our visual analytics (c). The ROIs are highlighted by yellow arrows. In each panel, the first image and third image
show the ROI location from different views. The second image shows the corresponding fiber tracts, and the
fourth image shows the functional connectivity network.
Fig.9. Comparison of ROI prediction by visual analytics and affine registration on ten subjects.
It is noticeable that the registration method used for comparison with visual analytics in Fig.9 is a linear method.
To evaluate the performance of visual analytics against non-linear registration methods, we performed a
registration error study using the working memory ROI benchmarks from dataset 1 as ground truth. To do so, we
first mapped the benchmarks from fMRI space to T1 space using FLIRT, and then we registered the T1 structural
images to the MIN152 template via four registration methods, that is, ANTS (Avants et al., 2008), FLIRT
(Jenkinson and Smith, 2001), FNIRT (Andersson et al., 2008), and HAMMER (Shen and Davatzikos, 2002).
Thereafter, we calculated the distances between registered benchmarks and group activation peaks for each
method, and summarized these distances in Fig.10.
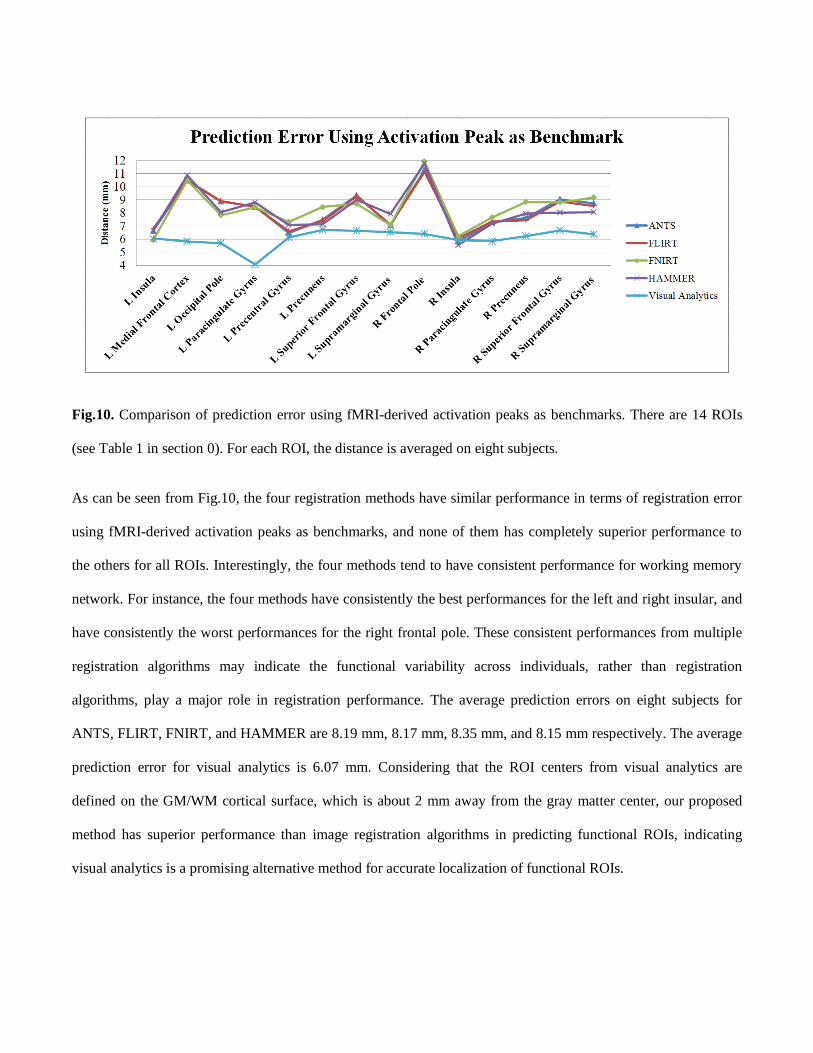
Fig.10. Comparison of prediction error using fMRI-derived activation peaks as benchmarks. There are 14 ROIs
(see Table 1 in section 0). For each ROI, the distance is averaged on eight subjects.
As can be seen from Fig.10, the four registration methods have similar performance in terms of registration error
using fMRI-derived activation peaks as benchmarks, and none of them has completely superior performance to
the others for all ROIs. Interestingly, the four methods tend to have consistent performance for working memory
network. For instance, the four methods have consistently the best performances for the left and right insular, and
have consistently the worst performances for the right frontal pole. These consistent performances from multiple
registration algorithms may indicate the functional variability across individuals, rather than registration
algorithms, play a major role in registration performance. The average prediction errors on eight subjects for
ANTS, FLIRT, FNIRT, and HAMMER are 8.19 mm, 8.17 mm, 8.35 mm, and 8.15 mm respectively. The average
prediction error for visual analytics is 6.07 mm. Considering that the ROI centers from visual analytics are
defined on the GM/WM cortical surface, which is about 2 mm away from the gray matter center, our proposed
method has superior performance than image registration algorithms in predicting functional ROIs, indicating
visual analytics is a promising alternative method for accurate localization of functional ROIs.
3.5 Predicting ROIs in SZ patients based on DTI data.
Though task-based fMRI is considered as the standard approach to identify functional ROIs, in many application
scenarios, there is no task-based fMRI data available. For instance, it might be challenging to conduct task-based
fMRI studies for young children or vulnerable patients such as Alzheimer’s disease (Jack, et al., 2010) and SZ
patients. Instead, DTI scanning typically needs around ten minutes, is much less demanding, and is widely
available. Therefore, we are strongly motivated to accurately estimate the locations of functional ROIs by learning
and applying prior models of ROIs’ fiber shapes derived from DTI data.
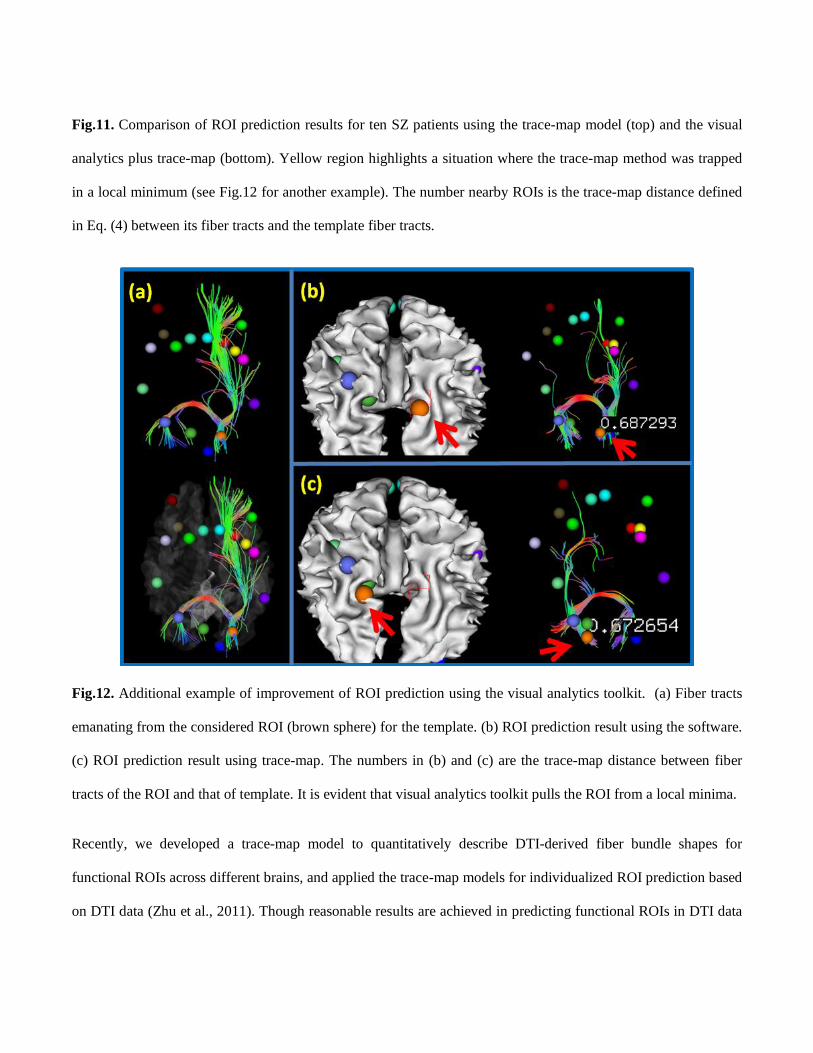
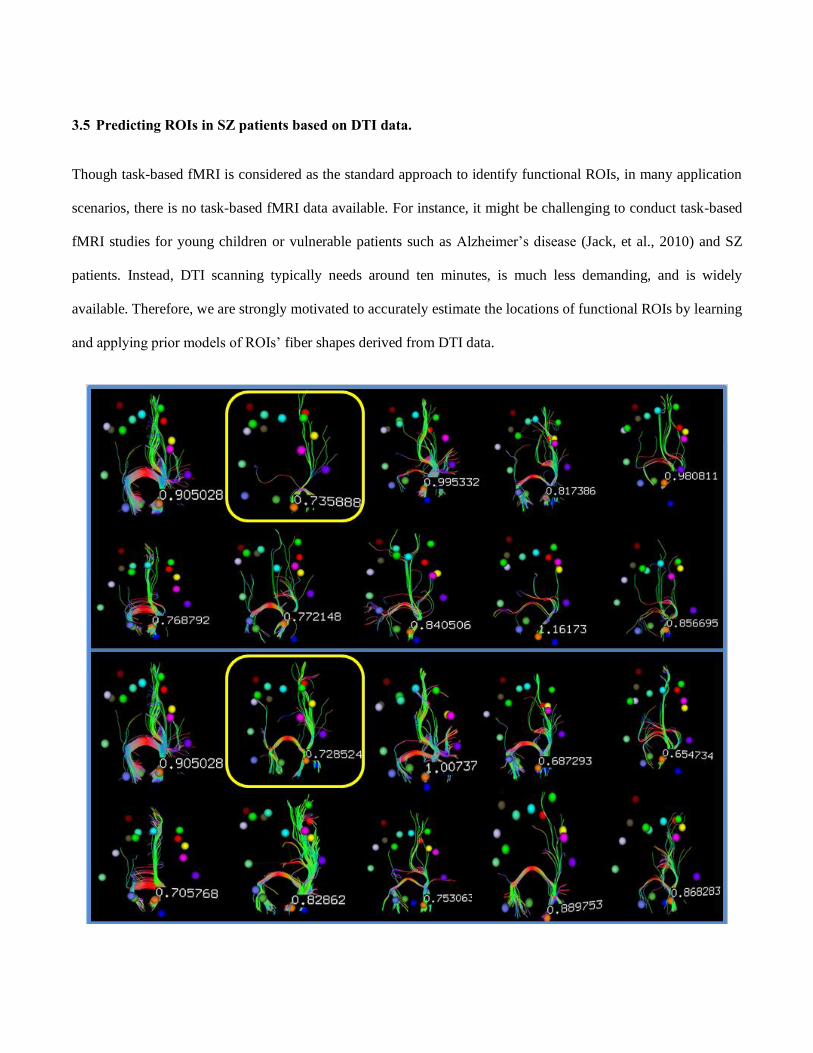
Fig.11. Comparison of ROI prediction results for ten SZ patients using the trace-map model (top) and the visual
analytics plus trace-map (bottom). Yellow region highlights a situation where the trace-map method was trapped
in a local minimum (see Fig.12 for another example). The number nearby ROIs is the trace-map distance defined
in Eq. (4) between its fiber tracts and the template fiber tracts.
Fig.12. Additional example of improvement of ROI prediction using the visual analytics toolkit. (a) Fiber tracts
emanating from the considered ROI (brown sphere) for the template. (b) ROI prediction result using the software.
(c) ROI prediction result using trace-map. The numbers in (b) and (c) are the trace-map distance between fiber
tracts of the ROI and that of template. It is evident that visual analytics toolkit pulls the ROI from a local minima.
Recently, we developed a trace-map model to quantitatively describe DTI-derived fiber bundle shapes for
functional ROIs across different brains, and applied the trace-map models for individualized ROI prediction based
on DTI data (Zhu et al., 2011). Though reasonable results are achieved in predicting functional ROIs in DTI data
of SZ patients, as shown in the upper panel of Fig. 11, the energy function optimization procedure in the trace-
map cannot guarantee the convergence to a global optimal solution, as highlighted by the yellow box in the upper
panel of Fig.11 and Fig.12. As a remedy, our visual analytics approach here provides a natural and intuitive visual
assessment and optimization platform for ROI optimization and prediction based on fiber shapes. It calculates the
distance between an ROI’s fiber bundle and the template one to search for ROI candidates in the background, and
meanwhile dynamically displays the distance in the foreground along with ROI editing. As a result, our visual
analytics system can combine the expert’s neuroscience knowledge and computational intelligence, thus
achieving improved results. Fig.11 shows the comparison of ROI prediction results for ten SZ patients using the
trace-map model (top) (Zhu et al., 2011) and the visual analytics toolkit (bottom). It is evident that fiber tracts
obtained by using our visual analytics are more consistent among the group, e.g., the bundle highlighted in the
yellow box, suggesting the effectiveness of our methods.
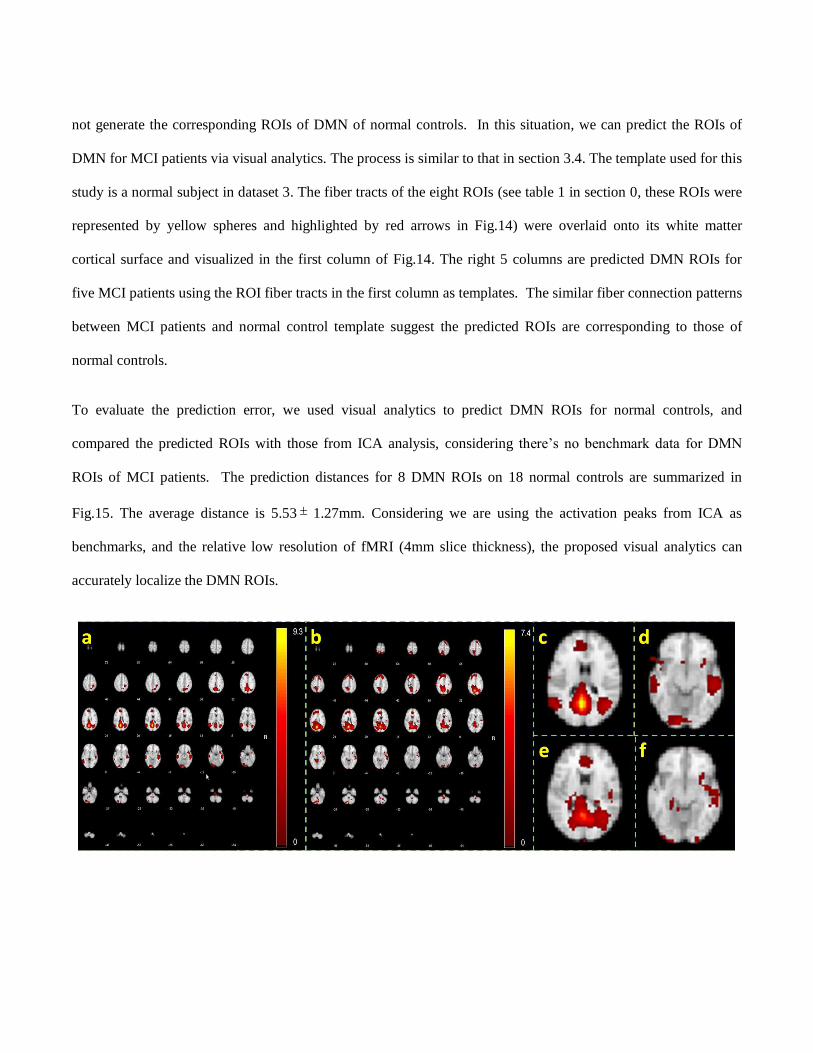
3.6 Predicting default mode network in MCI patients
Many brain diseases are reported to have distinct functional/structural connectivity patterns from their normal
controls (Greicius et al., 2004; Garrity et al., 2007; Sorg et al., 2007; Bai et al., 2008; Supekar et al., 2008; Bluhm
et al., 2009; Atri et al., 2011). For instance, there are reports about MCI and Alzheimer’s disease (AD) on the
altered default mode network (DMN) that is distinguished from normal controls (Greicius et al., 2004; Bai et al.,
2008). As an example in Fig.13, we applied group ICA (Calhoun et al., 2001) analysis on Dataset 3 (see section
2.1) using GIFT (http://mialab.mrn.org/software/gift/), and compared the group ICA map of DMN for normal
controls (Fig.13a) and MCI subjects (Fig.13b). Fig.13c and Fig.13d are two slices from the ICA map of normal
control (Fig.13a), and Fig.13e and Fig.13f are two corresponding slices from MCI (Fig.13b). As can be seen from
Fig.13, MCI patients have disrupted DMN compared with normal controls.
To quantitatively compare DMN between MCI patients and normal controls, we need to predict the ROIs of
DMN for MCI subjects since standard fMRI analysis like ICA (Calhoun et al., 2001; Beckmann et al., 2005) may
not generate the corresponding ROIs of DMN of normal controls. In this situation, we can predict the ROIs of
DMN for MCI patients via visual analytics. The process is similar to that in section 3.4. The template used for this
study is a normal subject in dataset 3. The fiber tracts of the eight ROIs (see table 1 in section 0, these ROIs were
represented by yellow spheres and highlighted by red arrows in Fig.14) were overlaid onto its white matter
cortical surface and visualized in the first column of Fig.14. The right 5 columns are predicted DMN ROIs for
five MCI patients using the ROI fiber tracts in the first column as templates. The similar fiber connection patterns
between MCI patients and normal control template suggest the predicted ROIs are corresponding to those of
normal controls.
To evaluate the prediction error, we used visual analytics to predict DMN ROIs for normal controls, and
compared the predicted ROIs with those from ICA analysis, considering there’s no benchmark data for DMN
ROIs of MCI patients. The prediction distances for 8 DMN ROIs on 18 normal controls are summarized in
Fig.15. The average distance is 5.53 1.27mm. Considering we are using the activation peaks from ICA as
benchmarks, and the relative low resolution of fMRI (4mm slice thickness), the proposed visual analytics can
accurately localize the DMN ROIs.
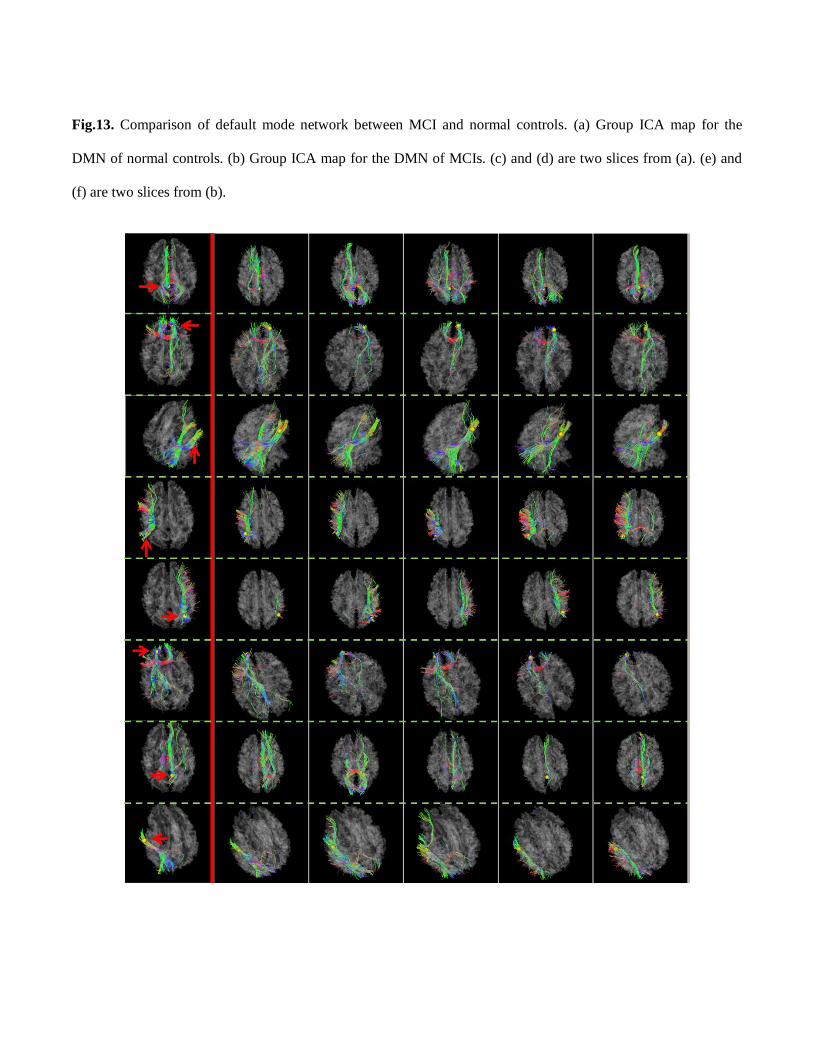
Fig.13. Comparison of default mode network between MCI and normal controls. (a) Group ICA map for the
DMN of normal controls. (b) Group ICA map for the DMN of MCIs. (c) and (d) are two slices from (a). (e) and
(f) are two slices from (b).
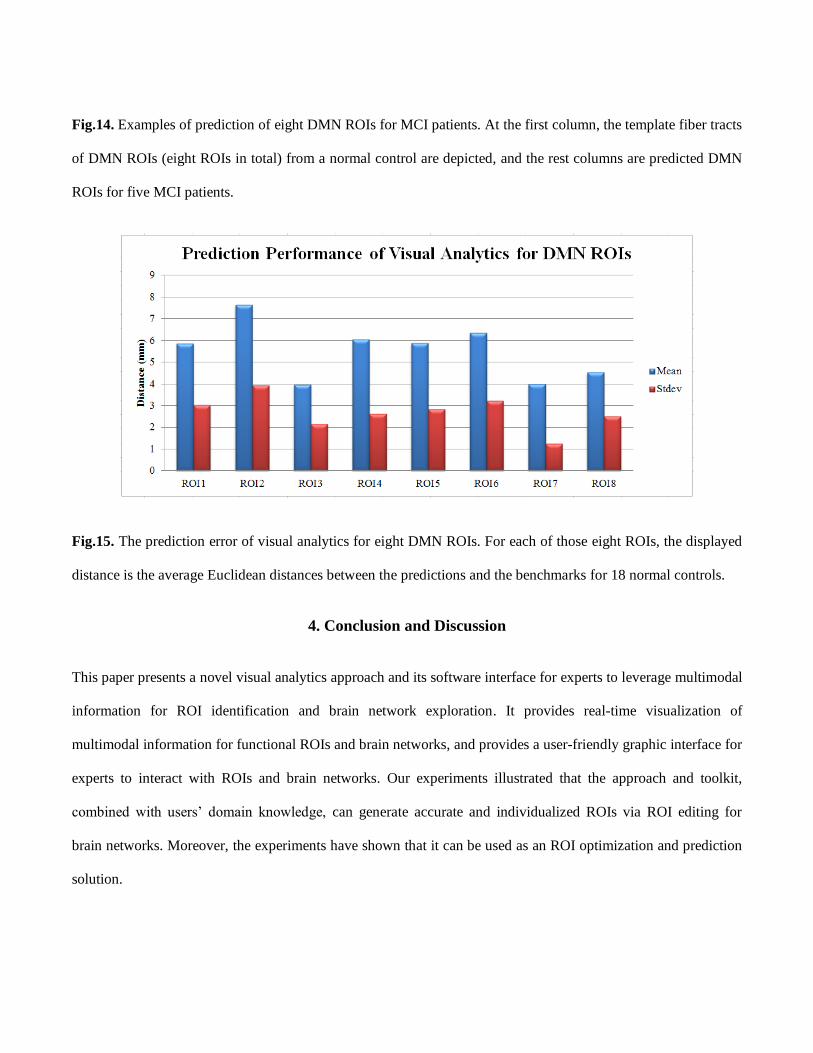
Fig.14. Examples of prediction of eight DMN ROIs for MCI patients. At the first column, the template fiber tracts
of DMN ROIs (eight ROIs in total) from a normal control are depicted, and the rest columns are predicted DMN
ROIs for five MCI patients.
Fig.15. The prediction error of visual analytics for eight DMN ROIs. For each of those eight ROIs, the displayed
distance is the average Euclidean distances between the predictions and the benchmarks for 18 normal controls.
4. Conclusion and Discussion
This paper presents a novel visual analytics approach and its software interface for experts to leverage multimodal
information for ROI identification and brain network exploration. It provides real-time visualization of
multimodal information for functional ROIs and brain networks, and provides a user-friendly graphic interface for
experts to interact with ROIs and brain networks. Our experiments illustrated that the approach and toolkit,
combined with users’ domain knowledge, can generate accurate and individualized ROIs via ROI editing for
brain networks. Moreover, the experiments have shown that it can be used as an ROI optimization and prediction
solution.
The proposed visual analytics method aims to accurately identify reliable individualized ROIs for brain networks.
It achieved this goal by combining neuroscience knowledge and computational intelligence capabilities.
Specifically, it integrates multimodal neuroimaging information into a unified representation framework via joint
modeling of multimodal data, and provides simultaneous multimodal data visualization and intuitive interaction
between data and users via a visual analytic software interface. The source codes, binaries, testing data, demos
and documents of the software interface are available online at:
http://www.cs.uga.edu/~tliu/visualAnalyticTkt/visualAnalyticTkt.htm.
Since visual analytics leverages the domain knowledge of users for identification of network ROIs, users are
granted great power and flexibility in ROI identification. Thus various biases from users, e.g., confirmation
bias and domain knowledge bias, might lead to inappropriate network ROIs. . To deal with this problem, it
is highly recommended that users make full use of the following constraints provided by the software interface. 1)
Anatomical information from the volume image and cortical surface. 2) The Atlas information of a functional
region. 3) functional/effective connectivity information. 4) Structural connectivity pattern as revealed by fiber
bundle shapes. 5) Reference to a template brain. As to the order of importance of these constrains, it depends on
application scenarios and the confidences of the user to them. Generally, a functional region has a unique set of
properties that are consistent and complementary. For instance, the same functional region tends to have similar
structural connectivity patterns across subjects, and brain networks with consistent functional connectivity
patterns are expected to have consistent structural connectivity pattern (Li et al., 2010a).
Identifying activation peaks using task-based fMRI has been regarded as the standard approach for functional ROI
mapping (Friston, 2009). The functional ROI benchmark adopted in the result sections of this paper was
generated based on peaks of individual activation maps (Calhoun et al., 2001; Beckmann et al., 2005; Faraco et
al., 2011), which were used for comparisons of the proposed multi-modal approach and other image registration
algorithms. It should be noted that the image registration algorithms such as FNIRT, ANTS and HAMMER were
originally designed for anatomical alignments, but not for functional ROI mapping. If these image registration
algorithms take multimodal data into considerations in the future, their performances for functional ROI
alignments could be substantially better than what was reported in this paper.
Our future work includes the integration of advanced ROI optimization algorithms at the background (Li et al.,
2010a; Zhu et al., 2011), and the parallelization of these algorithms using GPU to achieve real time optimization
in the back end and simultaneous visualization in the front end. We believe availability of this toolkit to the
community will be a valuable contribution to many brain imaging applications that require accurate localization
of functional brain ROIs.
Acknowledgements
This work was supported by the NIH Career Award (NIH EB 006878), NIH R01 HL087923-03S2 and The
University of Georgia start-up research funding. The SZ dataset was provided by the NA-MIC. The MCI dataset
was provided by Dr. Lihong Wang of Duke University. We would like to thank the anonymous reviewers for their
constructive comments that have helped to significantly improve this paper.
References
[Amunts et al., 2000] Amunts K, Malikovic A, Mohlberg H, Schormann T, Zilles K. Brodmann's areas 17 and 18
brought into stereotaxic space-where and how variable? Neuroimage. 2000 Jan; 11(1):66-84.
[Andersson et al. 2008] Andersson, J., Smith, S., Jenkinson, M., 2008. FNIRT - FMRIB’s Non-linear Image
Registration Tool. Human Brain Mapping, 2008.

[Anderson et al., 2011] Anderson EJ, Jones DK, O'Gorman RL, Leemans A, Catani M, Husain M.Cortical
Network for Gaze Control in Humans Revealed Using Multimodal MRI, Cerebral Cortex. 2011 Jun 21.
[Ashburner et al., 2004] Ashburner J, Friston K.J., and Penny W, Human Brain Function, Academic Press, 2004.
[Atri et al., 2011] Atri, A., O'Brien, J.L., Sreenivasan, A., Rastegar, S., Salisbury, S., DeLuca, A.N., O'Keefe,
K.M., LaViolette, P.S., Rentz, D.M., Locascio, J.J., Sperling, R.A., Test-retest reliability of memory task
functional magnetic resonance imaging in Alzheimer disease clinical trials, Arch Neurol. 68(5), 599-606, 2011.
[Avants et al. 2008] Avants BB, Epstein CL, Grossman M, Gee JC. Symmetric diffeomorphic image registration
with cross-correlation: evaluating automated labeling of elderly and neurodegenerative brain. Med Image Anal.
2008 Feb; 12(1):26-41.
[Azar et al., 2005] Fred S. Azar, Mazen ElBawab, Ali Khamene, Kijoon Lee, Regine Choe, Alper Corlu, Soren D.
Konecky, Arjun G. Yodh and Frank Sauer, Multimodal information integration and visualization: optical imaging
and MRI, Proc. SPIE 6009, 60090E (2005).
[Bai et al., 2008] Bai, F., Zhang, Z., Yu, H., Shi, Y., Yuan, Y., Zhu, W., Zhang, X., Qian, Y., Default-mode
network activity distinguishes amnestic type mild cognitive impairment from healthy aging: A combined
structural and resting-state functional MRI study, Neuroscience Letters 438, 111-115, 2008.
[Baum et al., 2008] Baum KG, Helguera M, Krol A. Fusion viewer: a new tool for fusion and visualization of
multimodal medical data sets. J Digit Imaging. 2008 Oct; 21 Suppl 1:S59-68.
[Beckmann et al., 2005] Beckmann CF; DeLuca M; Devlin JT; Smith SM. (29 May 2005). Investigations into
resting-state connectivity using independent component analysis. Philos Trans R Soc Lond B Biol Sci. 360:1001-
1013.
[Biswal et al., 2010] Biswal BB, Mennes M, Zuo XN, et al. (2010). Toward discovery science of human brain

function. PNAS 107(10):4734-9.
[Bluhm et al., 2009] Bluhm, R.L., Williamson, P.C., Osuch, E.A., Frewen, P.A., Stevens, T.K., Boksman, K.,
Neufeld, R.W.J., Théberge, J., Lanius, R.A., Alterations in default network connectivity in posttraumatic stress
disorder related to early-life trauma J. Psychiatry Neurosci, 34(3), 187-94, 2009.
[Brun et al. 2004] Brun, A., Knutsson, H., Park, H.J., Shenton, M.E., Westin, C.F., Clustering fiber tracts using
normalized cuts, MICCAI 2004, LINCS 3216, pp.368-375, 2004.
[Bullmore and Sporns, 2009] Ed Bullmore and Olaf Sporns, Complex brain networks: graph theoretical analysis
of structural and functional systems, Nature Neuroscience Reviews, 186(10), March, 2009.
[Calhoun et al., 2001] V.D. Calhoun, T. Adali, G.D. Pearlson, and J.J. Pekar, A Method for Making Group
Inferences From Functional MRI Data Using Independent Component Analysis, HBM, vol. 14, pp. 140-151,
2001.
[Chen et al., 2011] Hanbo Chen, Lei Guo, Kaiming Li, Xintao Hu, Tianming Liu, Assessment of Regularity and
Variability of Cortical Folding Patterns of Working Memory ROIs, MICCAI 2011.
[Cherubini et al., 2010] Cherubini, A.; Spoletini, I.; Peran, P.; Luccichenti, G.; Di Paola, M.; Sancesario, G.;
Gianni, W.; Giubilei, F.; Bossu, P.; Sabatini, U.; Caltagirone, C.; Spalletta, G. A multimodal MRI investigation of
the subventricular zone in mild cognitive impairment and Alzheimer's disease patients. Neurosci. Lett. 2010, 469,
214-218.
[Danielle et al., 2008] Danielle S. Bassett, Edward Bullmore, Beth A. Verchinski, Venkata S. Mattay, Daniel R.
Weinberger, and Andreas Meyer-Lindenberg, Hierarchical Organization of Human Cortical Networks in Health
and Schizophrenia, The Journal of Neuroscience, September 10, 2008, 28(37):9239 –9248.
[Faraco et al., 2011] Faraco, C. C., Unsworth, N., Lagnely, J. Terry, D., Li, K., Zhang, D., Liu, T., and Miller,

L.S., Complex span tasks and hippocampal recruitment during working memory, NeuroImage, Volume 55, Issue
2, 15 March 2011, Pages 773-787.
[Fillard and Gerig 2003] P. Fillard and G. Gerig. Analysis Tool For Diffusion Tensor MR. In Proc. of
MICCAI'03, Part II, volume 2879 of LNCS, pages 979-980, November 2003. Springer.
[Fischl et al., 2008] Fischl B., Rajendran N. , Busa E., Augustinack J., Hinds O., Yeo B.T.T., Mohlberg H.,
Amunts K., Zilles K. Cortical Folding Patterns and Predicting Cytoarchitecture. Cerebral Cortex 18(8):1973-1980
(2008).
[Fox and Raichle 2007] M.D. Fox and M.E. Raichle, Spontaneous fluctuations in brain activity observed with
functional magnetic resonance imaging, Nat Rev Neurosci 8:700-711, 2007.
[Fox et al., 2006] Fox, M.D., Corbetta, M., Snyder, A.Z., Vincent, J.L., & Raichle, M.E. (2006). Spontaneous
neuronal activity distinguishes human dorsal and ventral attention systems. PNAS, 103, 10046-10051.
[Fransson et al., 2010] Fransson P, Aden U, Blennow M, Lagercrantz H. The Functional Architecture of the Infant
Brain as Revealed by Resting-State fMRI. Cereb Cortex. 2010 Apr 26.
[Friston et al., 2003] Friston, K.J., Harrison, L., and Penny, W. (2003). Dynamic causal modeling, Neuroimage,
19, 1273-1302, 2003.
[Friston, 2009] Friston K. J. (2009). Modalities, modes, and models in functional neuroimaging. Science,
326(5951), 399–403.
[Garyfallidis et al., 2010] Garyfallidis E, Brett M, Nimmo-Smith I (2010), “Fast Dimensionality Reduction for
Brain Tractography Clustering”, 16th Annual Meeting of the Organization for Human Brain Mapping.
[Garrity et al., 2007] Garrity, A.G., Pearlson, G.D., McKiernan, K., Lloyd, D., Kiehl, K.A., Calhoun, V.D.,
Aberrant “Default Mode” Functional Connectivity in Schizophrenia, Am J. Psychiatry 164(7), 1123, 2007.

[Geissler et al., 2005] Geissler, A., Lanzenberger, R., Barth, M., Tahamtan, A.R., Milakara, D., Gartus, A.,
Beisteiner, R., 2005. Influence of fMRI smoothing procedures on replicability of fine scale motor localization.
Neuroimage 24, 323–331.
[Granger, 1969] Granger, C.W.J., Investigating Causal Relations by Econometric Models and Cross-spectral
Methods. Econometrica, 1969. 37(3): p. 424-438.
[Greicius et al., 2004] Greicius, M.D., Srivastava, G., Reiss, A.L., Menon, V., Default-mode network activity
distinguishes Alzheimer's disease from healthy aging: evidence from functional MRI, Proc Natl Acad Sci U S A
101(13), 4637-42, 2004.
[Greicius et al., 2007]Greicius MD, Krasnow B, Reiss AL, Menon V. Functional connectivity in the resting brain:
a network analysis of the default mode hypothesis.Proc Natl Acad Sci U S A. 2003 Jan 7;100(1):253-8. Epub
2002 Dec 27.
[Hagmann et al., 2010] Hagmann P, Cammoun L, Gigandet X, Gerhard S, Grant PE, Wedeen V, Meuli R, Thiran
JP, Honey CJ, Sporns O. MR connectomics: Principles and challenges. J Neurosci Methods. 2010 Jan 22.
[Harrison et al., 2003] Harrison L, Penny W, Friston KJ (2003): Multivariate autoregressive modeling of fMRI
time series. Neuroimage 19:1477–1491.
[Hasson et al., 2004] U. Hasson, Y. Nir, I. Levy, G. Fuhrmann, and R. Malach. Intersubject synchronization of
cortical activity during natural vision. Science 303:1634-1640, 2004.
[Hasson et al., 2010] Hasson U, Malach R, Heeger DJ. Reliability of cortical activity during natural stimulation,
Trends in Cognitive Sciences, vol. 14, Issue 1, January 2010, Pages 40-48.
[Ho et al., 2009] Ho A, Hua X, Lee S, Leow AD, Yanovsky I, Gutman B, Dinov ID, Lepore N, Stein J, Toga AW,
Jack CR, Bernstein MA, Reiman EM, Harvey DJ, Kornak J, Schuff N, Alexander GE, Weiner MW, Thompson

PM. Comparing 3 Tesla and 1.5 Tesla MRI for Tracking Alzheimer's Disease Progression with Tensor-Based
Morphometry, Human Brain Mapping, 2009.
[Jack CR Jr, et al., 2010] Jack CR Jr, Bernstein MA, Borowski BJ, et al., Update on the magnetic resonance
imaging core of the Alzheimer's disease neuroimaging initiative, Alzheimers Dement. 6(3):212-20. (2010).
[Jenkinson and Smith, 2001] M. Jenkinson and S.M. Smith. A global optimisation method for robust affine
registration of brain images. Medical Image Analysis, 5(2):143-156, 2001.
[Jo et al., 2008] Jo HJ, Lee JM, Kim JH, Choi CH, Gu BM, Kang DH, Ku J, Kwon JS, Kim SI. Artificial shifting
of fMRI activation localized by volume- and surface-based analyses, Neuroimage. 2008 Apr 15; 40(3):1077-89.
[Li et al., 2009] Kaiming Li, Lei Guo, Jingxin Nie, Gang Li, Tianming Liu, Review of Methods for Functional
Brain Connectivity Detection Using fMRI. Computerized Medical Imaging and Graphics, Volume 33, Issue 2,
March 2009, Pages 131-139.
[Li et al., 2010a] Kaiming Li, Lei Guo, Carlos Faraco, Dajiang Zhu, Fan Deng, Tuo Zhang, Xi Jiang, Degang
Zhang, Hanbo Chen, Xintao Hu, L. Stephen Miller, Tianming Liu, Individualized ROI Optimization via
Maximization of Group-wise Consistency of Structural and Functional Profiles, accepted, Neural Information
Processing Systems (NIPS), 2010.
[Li et al., 2010b] Kaiming Li, Lei Guo, Gang Li, Jingxin Nie, Carlos Faraco, Qun Zhao, Stephen Miller,
Tianming Liu, Cortical surface based identification of brain networks using high spatial resolution resting state
fMRI data, International Symposium of Biomedical Imaging (ISBI) 2010.
[Liu, 2011] Tianming Liu, A few thoughts on brain ROIs, Brain Imaging and Behavior, in press, 2011.
[Lorensen and Cline, 1987] Lorensen, WE., Cline, H. 1987. Marching Cubes: A high resolution 3D surface
construction algorithm. In: Computer Graphics, Vol. 21, Nr. 4.

[Lynall et al., 2010] Lynall ME, Bassett DS, Kerwin R, McKenna PJ, Kitzbichler M, Muller U, Bullmore E.
Functional connectivity and brain networks in schizophrenia. J Neurosci. 2010 Jul 14;30 (28):9477-87.
[Maddah et al. 2005] Maddah, M., Mewes, A.U., Haker, S., Grimson, W.E., Warfield, S.K., Automated atlas-
based clustering of white matter fiber tracts from DTMRI, MICCAI, 8:188-195, 2005.
[Manssour et al., 2001] Manssour, I.H., Furuie, S.S., Nedel, L.P., and Freitas, C.M.D.S. A Framework to Interact
and Visualize with Multimodal Medical Images (ST). In Proceedings of Volume Graphics. 2001.
[Meyer-Lindenberg et al., 2001] Meyer-Lindenberg A, Poline JB, Kohn PD, Holt JL, Egan MF, Weinberger DR,
Berman KF (2001) Evidence for abnormal cortical functional connectivity during working memory in
schizophrenia. Am J Psychiatry 158:1809 –1817.
[Minzenberg et al., 2009] Minzenberg MJ, Laird AR, Thelen S, Carter CS, Glahn DC, (2009) Meta-analysis of 41
functional neuroimaging studies of executive function in schizophrenia. Arch Gen Psychiatry 66:811– 822.
[O’Donnell et al. 2006] O’Donnell, L.J., Kubicki, M., Shenton, M.E., Dreusicke, M.H., Grimson, W.E., Westin,
C.F., A method for clustering white matter fiber tracts, AJNR Am J Neuroradiol., 27:1032-36, 2006.
[Ou et al., 2010] W. Ou, W.M. Wells III, and P. Golland. Combining Spatial Priors and Anatomical Information
for fMRI Detection. Medical Image Analysis, 14(3):318-331, 2010.
[Passingham et al., 2002] Passingham RE, Stephan KE, Kötter R. The anatomical basis of functional localization
in the cortex. Nat Rev Neurosci. 3(8):606-16. 2002.
[Roebroeck et al., 2005] Roebroeck A, Formisano E, Goebel R. Mapping directed influence over the brain using
Granger causality and fMRI. Neuroimage. 2005 Mar; 25(1):230-42.
[Sepulcre et al., 2010] Sepulcre J, Liu H, Talukdar T, Martincorena I, Yeo BT, Buckner RL. The organization of
local and distant functional connectivity in the human brain. PLoS Comput Biol. Jun 10; 6(6). 2010.

[Shen and Davatzikos, 2002] Dinggang Shen and Christos Davatzikos, HAMMER: hierarchical attribute
matching mechanism for elastic registration. IEEE Trans. on Medical Imaging, 21(11):1421-1439, 2002.
[Smith, 2002] Smith, S. M. (2002). Fast robust automated brain extraction. Human Brain Mapping, 17, 143-155.
[Smith et al., 2004] Smith, S. M., Jenkinson, M., Woolrich, M. W., Beckmann, C. F., Behrens, T. E., Johansen-
Berg, H., et al. (2004). Advances in functional and structural MR image analysis and implementation as FSL.
NeuroImage, 23, Suppl 1, S208-219.
[Sorg et al., 2007] Sorg, C., Riedl, V., Mühlau, M., Calhoun, V.D., Eichele, T., Läer, L., Drzezga, A., Förstl, H.,
Kurz, A., Zimmer, C., Wohlschläger, A.M., Selective changes of resting-state networks in individuals at risk for
Alzheimer's disease, Proc Natl Acad Sci U S A 104(47), 18760-5, 2007.
[Sporns et al., 2005] Sporns O, Tononi G, Kötter R, The human connectome: A structural description of the
human brain. PLoS Comput Biol. 2005 Sep; 1(4): e42.
[Sui et al., 2011] Sui J, Pearlson G, Caprihan A, Adali T, Kiehl KA, Liu J, Yamamoto J, Calhoun VD.
Discriminating schizophrenia and bipolar disorder by fusing fMRI and DTI in a multimodal CCA+ joint ICA
model. Neuroimage. 2011 Aug 1; 57(3):839-55.
[Supekar et al., 2008] Supekar, K., Menon, V., Rubin, D., Musen, M., Greicius, M.D., Network analysis of
intrinsic functional brain connectivity in Alzheimer's disease, PLoS Comput Biol, 4(6):e1000100, 2008. [Toro and
Burnod, 2005] Toro R, Burnod Y. A Morphogenetic Model of the Development of Cortical Convolutions.
Cerebral Cortex, 15:1900-1913, 2005.
[Van Dirjk et al., 2010] Van Dijk KR, Hedden T, Venkataraman A, Evans KC, Lazar SW, Buckner RL, Intrinsic
functional connectivity as a tool for human connectomics: theory, properties, and optimization. J Neurophysiol.
2010 Jan; 103(1): 297-321.

[Venkataraman et al., 2010] Venkataraman A., Rathi Y., Kubicki M., Westin C-F., Golland P. Joint Generative
Model for fMRI/DWI and its Application to Population Studies. Int Conf Med Image Comput Comput Assist
Interv. 2010;13(Pt 1):191-9.
[Viergever et al., 2001] Viergever MA, Maintz JB, Niessen WJ, Noordmans HJ, Pluim JP, Stokking R, Vincken
KL. Registration, segmentation, and visualization of multimodal brain images, Comput Med Imaging Graph.
2001; 25(2):147-51.
[White et al., 2001] White, T.,O', Leary, D., Magnotta,V., Arndt, S., Flaum, M., Andreasen, N.C., 2001. Anatomic
and functional variability: the effects of filter size in group fMRI data analysis. Neuroimage 13, 577–588.
[Zang et al., 2004] Zang Y, Jiang T, Lu Y, He Y, Tian L. Regional homogeneity approach to fMRI data analysis,
NeuroImage, 22(1): p. 394-400, 2004.
[Zhang et al., 2001] Y. Zhang, M. Brady, and S. Smith. Segmentation of brain MR images through a hidden
Markov random field model and the expectation maximization algorithm. IEEE Trans. on Medical Imaging,
20(1):45-57, 2001.
[Zhang et al., 2011a] Tuo Zhang, Lei Guo, Xintao Hu, Kaiming Li, Tianming Liu, Predicting Functional Cortical
ROIs based on Fiber Shape Models, MICCAI 2011.
[Zhang et al., 2011b] Tuo Zhang, Lei Guo, Kaiming Li, Changfeng Jing, Yan Yin, Dajing Zhu, Guangbin Cui,
Lingjiang Li, Tianming Liu, Predicting Functional Cortical ROIs via DTI-derived Fiber Shape Models, in press,
Cerebral Cortex, 2011.
[Zhu et al., 2011] Dajiang Zhu, Kaiming Li, Carlos Faraco, Fan Deng, Degang Zhang, Xi Jiang, Hanbo Chen, Lei
Guo, Stephen Miller, Tianming Liu, Discovering Dense and Consistent Landmarks in the Brain, IPMI 2011.
[Zylberberg et al., 2010] Zylberberg A, Fernández Slezak D, Roelfsema PR, Dehaene S, Sigman M. The brain's

router: a cortical network model of serial processing in the primate brain. PLoS Comput Biol. Apr 29; 6(4). 2010.