Embed Size (px)
Citation preview
FarmaciaHOSPITALARIAwww.elsevier.es/farmhosp
FarmaciaHOSPITALARIA
Volumen 33. Número 5. Septiembre-Octubre 2009
••
ÓRGANO OFICIAL DE EXPRESIÓN CIENTÍFICA DE LA SOCIEDAD ESPAÑOLA DE FARMACIA HOSPITALARIA
Editorial235 El reto de disminuir los costes en el tratamiento de la anemia renal
con factores eritropoyéticosJ. Hernández Jaras
237 Posicionamiento del farmacéutico de hospital ante la utilización de medicamentos en condiciones diferentes a las autorizadasO. Delgado, F. Puigventós y A. Clopés
Originales240 Análisis de minimización de costes de fludarabina (Beneflur )
oral vs. intravenosa en EspañaJ. Delgado, L. Febrer, D. Nieves, C. Piñol y M. Brosa
247 Impacto presupuestario de una combinación a dosis fija de efavirenz-emtricitabina-tenofovir para tratamiento de pacientes infectados por el virus de la inmunodeficiencia humana tipo 1I. Oyagüez, M.A. Casado, M. Cotarelo, A. Ramírez-Arellano y J. Mallolas
257 Estudio de incidencia de los errores de medicación en los procesos de utilización del medicamento: prescripción, transcripción, validación, preparación, dispensación y administración en el ámbito hospitalarioL. Pastó-Cardona, C. Masuet-Aumatell, B. Bara-Oliván, I. Castro-Cels, A. Clopés-Estela, F. Pàez-Vives, J.A. Schönenberger-Arnaiz, M.Q. Gorgas-Torner y C. Codina-Jané
269 Calidad de las recomendaciones farmacoterapéuticas de los procesos asistenciales integrados en AndalucíaR.M. Muñoz Corte, R. García Estepa, B. Santos Ramos y F.J. Bautista Paloma
Artículo especial281 Revisión de la legislación sobre la investigación clínica en el Sistema Nacional Salud
y los servicios de farmacia hospitalariaN. Laguna-Goya, M.A. Serrano y C. Gómez-Chacón
Cartas al Director285 Bivalirudina en trombocitopenia inducida por heparina
M. Gasol-Boncompte, B. Gracia-García, L. Pastó-Cardona y R. Jódar-Masanes
286 Crisis clónica generalizada asociada a vincristina en un caso pediátricoM.C. Garzás-Martín de Almagro, A.I. Gago Sánchez, I. Fernández García y C. Zarza Verdugo
288 Sorafenib: eficacia frente a seguridad. Prevención del síndrome mano-pieL. Delgado-Téllez, M.A. Campos Fernández de Sevilla y F. Tutau
289 Hepatitis asociada a infusiones acuosas de té verde: a propósito de un casoP. Amariles, N. Angulo, J. Agudelo-Agudelo y G. Gaviria
www.elsevier.es/farmhosp
1130-6343/$ - see front matter © 2008 SEFH. Published by Elsevier España, S.L. All rights reserved.
Farm Hosp. 2009;33(5):257-68
ORIGINAL ARTICLE
Incident study of medication errors in drug use processes: prescription, transcription, validation, preparation, dispensing, and administering in the hospital environment
Lourdes Pastó-Cardona,a,* C. Masuet-Aumatell,b B. Bara-Oliván,c I. Castro-Cels,d A. Clopés-Estela,e F. Pàez-Vives,f J.A. Schönenberger-Arnaiz,g M.Q. Gorgas-Torner,h and C. Codina-Janéh
aServicio de Farmacia, Hospital Universitari de Bellvitge, L’Hospitalet de Llobregat, Barcelona, Spain bServicio de Medicina Preventiva, Hospital Universitari de Bellvitge, L’Hospitalet de Llobregat, Barcelona, Spain cServicio de Farmacia, Capio Hospital General de Catalaunya, Sant Cugat, Barcelona, Spain dServicio de Farmacia, Hospital de la Santa Creu i Sant Pau, Barcelona, Spain eServicio de Farmacia, Institut Català d’Oncologia, L’Hospitalet de Llobregat, Barcelona, Spain fServicio de Farmacia, Hospital Comarcal Mora d’Ebre, Tarragona, Spain gServicio de Farmacia, Hospital Arnau de Vilanova, IRB Lleida, Spain hSocietat Catalana de Farmàcia Clínica
Received November 25, 2008; accepted May 18, 2009
*Corresponding author. E-mail address: [email protected] (L. Pastó Cardona).
AbstractObjective: To determine both the global incident, and the incident for stages of medication errors in 6 Catalonian hospitals, the types of error, and the consequences.Method: A prospective design, with the global variable of the medication error. Potential errors have been excluded. The patients admitted to each hospital were studied in 2 groups of up to 300 patients and 1500 administrations were observed. The NCCMERP taxonomy was applied. The prescription error was detected through the review of prescriptions, checking the patient, medication, adherence to protocols, interactions, contraindications, omission, duplicated therapy, doses, frequency, method, and lack of follow-up. During the transcription/validation, it was verified that the prescription matched the original order. In the dispensing process, the content of the drawers was checked, comparing it to the computer generated list, before sending out the single dose trolley. The transcription, preparation and administration were observed on the wards. The information for all the procedures was registered in a specific data sheet. There was moderate concordance amongst the inspectors (kappa=0.525).Results: Sixteen point ninety-four errors were detected per 100 patients-day and 0.98 errors per patient: sixteen percent in prescription, 27% in transcription/validation, 48% in dispensing, and
KEYWORDSHospital medication errors;Prescription errors;Transcription errors;Dispensing errors;Administration errors;Consequences of the errors
Documento descargado de http://www.elsevier.es el 13/12/2012. Copia para uso personal, se prohíbe la transmisión de este documento por cualquier medio o formato.
258 Pastó-Cardona L et al
Estudio de incidencia de los errores de medicación en los procesos de utilización del medicamento: prescripción, transcripción, validación, preparación, dispensación y administración en el ámbito hospitalario
ResumenObjetivo: Determinar la incidencia global y por etapas de los errores de medicación en 6 hospi-tales de Cataluña, así como los tipos de error y las consecuencias. Método: Diseño prospectivo, cuya variable global es el error de medicación. Se han excluido los errores potenciales. En cada hospital se estudiaron los ingresados en 2 unidades hasta 300 pa-cientes y se observaron 1.500 administraciones. Se aplicó la taxonomía del National Coordinat-ing Council for Medication Error Reporting and Prevention. El error de prescripción se detectó mediante la revisión de las prescripciones, en la que se com-probaron paciente, medicamento, adherencia a protocolos, interacciones, contraindicaciones, omisión, duplicidad terapéutica, dosis, frecuencia, vía y falta de seguimiento. En la transcrip-ción/validación se comprobó la coincidencia con la orden médica original. En la dispensación, antes de enviar los carros de unidosis, se revisó el contenido de los cajetines, y se contrastó con el listado generado informáticamente. En planta, los observadores comprobaron transcripción, preparación y administración. En todos los procesos se registraron los datos en una hoja especí-fica. La concordancia entre revisores fue moderada (kappa = 0,525).Resultados: Se detectaron 16,94 errores por 100 pacientes-día y 0,98 por paciente: 16 % en prescripción, 27% en transcripción/validación, 48 % en dispensación y 9 % en administración. El 84,47 % pertenecía a la categoría B (no se alcanzó al paciente), y menos del 0,5 % causaron daño. La población, de 65 años de media, se distribuyó en una relación varón/mujer de 60/40. Los principales grupos terapéuticos fueron: agentes contra la úlcera péptica y el reflujo gastroe-sofágico, antitrombóticos, y otros analgésicos y antipiréticos, en los que predominaba la forma farmacéutica sólida oral (58 %). Los medicamentos por paciente-día fueron 5,5 y las unidades de medicamento, 11,21 de promedio, con gran variabilidad entre centros; el ajuste a 10 unidades uniformizó el resultado. En todas las fases, la omisión resultó el error más frecuente.Discusión: La distinta metodología y el ámbito de las investigaciones dificulta la comparación de resultados; esto se observa en los errores con daño, cuya proporción se ve afectada por el pro-cedimiento de detección. El número de errores evitados mediante la ejecución de este proyec-to manifiesta la necesidad de mejorar la planificación de los sistemas de trabajo y el establec-imiento de medidas de seguridad.
© 2008 SEFH. Publicado por Elsevier España, S.L. Todos los derechos reservados.
PALABRAS CLAVEErrores de medicación hospitalarios;Errores de prescripción;Errores de transcripción;Errores de dispensación;Errores de administración;Consecuencias de los errores
9% in administration. Eighty-four point forty-seven percent were category B errors (they did not reach the patient), and <0.5% of the errors were harmful. The population, with an average age of 65, had a male/female ratio of 60/40. The principal therapeutic groups were: agents against peptic ulcer and GERD, antithrombotic agents, and other analgesics and antipyretics, principa-lly in a solid oral drug form (58%). The medications per patient-day were 5.5 and the units of medication were on average 11.21, varying greatly among the institutions. The adjustment of 10 units made the results more uniform. In all the stages, omission was the most frequent error.Discussion: The different methods used and different areas of the investigations make compari-sons difficult. This is evident in the harmful errors, the proportion of which is affected by the detection procedure. The number of mistakes avoided during the execution of this project de-monstrates the need to improve the planning of the work systems and to establish safety mea-sures.
©2008 SEFH. Published by Elsevier España, S.L. All rights reserved.
Introduction
Patient safety occupies an increasingly important place among the quality objectives of health systems. In spite of previous investigations related to healthcare, it was not
until the publication in 1999 and 2001 of 2 reports from the Institute of Medicine (IOM) of the United States (“To err is human: building a safer health system” and “Crossing the quality chasm: a new health system for the 21st century”) that the magnitude of the problem was revealed. These
Documento descargado de http://www.elsevier.es el 13/12/2012. Copia para uso personal, se prohíbe la transmisión de este documento por cualquier medio o formato.
Medication errors in the hospital environment 259
reports estimated annual mortality from medical errors in the United States at 44 000 and 98 000 respectively and strikingly the majority of these errors can be attributed to defects in the system.1,2 Subsequently, the consultancy group Health Grades (a company dedicated to healthcare quality assessment) updated this information in a study which covered 45% of annual hospital admissions. The results revealed that annual deaths from errors were up to 195 000.3
In response to the IOM report, the federal government issued an exhaustive paper on patient safety, with intervention proposals for carrying out the IOM recommendations.4
Along these lines, the UK government proposed to reduce serious medication errors by 40%.5
In 2005, the Spanish government promoted the Spanish National Study of Hospitalisation-Related Adverse Events (ENEAS) and found that 9.3% of admitted patients exhibited an adverse effect of healthcare. Thirty-seven point four percent of these incidents are caused by medications.6 As a consequence of the investigation, the Spanish Ministry of Health and Consumer Affairs designed the Quality Plan for the Spanish National Health System, which was edited in March 2006, and in which areas of performance, strategies, objectives, and projects aimed at increasing patient safety were developed.7
The bodies that work in safety development agree with the rule proclaimed by Leape8 in 1994, that error prevention strategies in health systems should be centred on the system itself and not on the individual.
Among the incidents arising from healthcare are safety failures in the use of medications which may occur at any stage along the course of their use: acquisition, prescription, transcription, validation, dispensing, preparation, administration, and patient compliance.
In spite of multiple studies published in the field, it has been difficult to accept the information extracted. Although most have been conducted in the hospital, the differences between the centres themselves, the objectives, population, error detection method used, inclusion or not of circumstances capable of causing error, and the differences in the error concept itself, encumber comparisons and extrapolations. Nonetheless, and thanks to published investigations, we know that errors are produced at a rate of 1.4 per admission,9 23.6 per 100 admissions-year, 6.1 adverse events, and 5.5 potential adverse events per 100 admissions11; and although harm is caused in only 5%,12 in Spain they cause between 4.7% and 5.3% of hospital admissions.13,14 Some authors have also determined that the error rate oscillates between 3.5% and 7% of administered doses,15 and that a hospitalised patient is subject to 0.9 daily medication errors.16
In Catalonia, the Catalan Society of Clinical Pharmacy, together with the Avedis Donabedian Foundation and the Regional Ministry of Health of the Catalonian Government, among others, have been the driving force behind the Patient Safety Alliance, through the coordination of research projects. In this framework, a study has been carried out in 6 hospitals of different levels and ownership, with the aim of:
– Determining the overall incidence of errors in the medication usage process in 6 Catalonian hospitals.
– Learning the proportion of medication errors in the study population.
– Determining the incidence of medication errors in medical and surgical units.
– Determining the incidence of medication errors in each of the stages or processes in the therapeutic chain: prescription, transcription/validation, dispensing, administration, and determining what kind of errors are produced at each stage.
– Determining the consequences of medication errors.– Relating the errors with the number of medications
used.– Facilitating a methodology that can be applied to other
studies.
Method
Design
This is an observational cohort study, with prospective design that includes follow-up, whose principal variable is medication error. Errors of prescription, transcription, validation, pharmacy preparation/dispensing, and nursing preparation/administration have been considered partial or process variables. Other secondary variables are: number of patients reached by an error, type of error, consequences for the patient, and severity. Circumstances or incidents capable of causing error have not been included.
Scope
The study was conducted in 6 Catalonian hospitals with distinct geographical locations and different healthcare levels (Table 1).
All the hospitals had a unit dose drug dispensing (UDDD) system and a medication preparation unit. One hospital had the electronic prescription system, 2 were partially electronic, and the remaining 3 relied on manual prescription. Filling the trolleys was manual in 4 hospitals and semiautomatic (Kardex type) in the other 2.
Population
Each centre chose 2 hospitalisation units, 1 medical, and 1 surgical, except one of the centres which chose 1 medical and 1 mixed, in the absence of a totally surgical unit.
All hospitalised patients in the selected units at the start of the study, without exception, were included along with all subsequent admissions until its finalisation.
Calculation of sample size
The overall incidence of medication error was taken as 14.8 per 100 admissions-year.10 The calculation of the sample size was done by assuming an alpha risk of .05 and a beta risk of .20 in bilateral contrast. The number of individuals necessary to detect a difference equal to or above .025 was 1647. It was rounded to 300 patients per hospital.
In our sample, the daily errors produced in prescription, transcription/validation, preparation in the Pharmacy Service (PS) and dispensing were recorded. Due to the
Documento descargado de http://www.elsevier.es el 13/12/2012. Copia para uso personal, se prohíbe la transmisión de este documento por cualquier medio o formato.
260 Pastó-Cardona L et al
difficulty in observing all the administrations during the study period, it was agreed to follow-up a total of 1500 administrations per centre, distributed between the different shifts, including weekends and public holidays. This figure represents 18.7%–37.5% of the total in a patient who receives 20 to 10 administrations a day, respectively.
The unit of preference for evaluation was patient-day.
Study variables
Definition of medication error and classificationThe concept adopted by the National Coordinating Council for Medication Error Reporting and Prevention (NCC MERP) was applied for the definition of error. The NCC MERP defines error as any preventable event that may cause or lead to inappropriate medication use or patient harm while the medication is in the control of the healthcare professional, patient, or consumer. Such events may be related to professional practice, healthcare products, procedures, and systems, including errors in prescribing, order communication, product labelling, packaging, nomenclature, compounding, dispensing, distribution, administration, education, monitoring, and use.17
Classification was done according to the Otero et al adaptation of the NCC MERP taxonomy. They were grouped according to the process in which the error originated: prescription, transcription/validation, preparation/dispensing, preparation/administration, and patient/treatment follow-up.
Depending on their nature, errors were classified as: incorrect medication (inappropriate selection of medication, unsuitable medication, previous history of allergy, contraindicated medication, inappropriate medication for the patient because of age or clinical situation, therapeutic duplication), omission of dose or medication (omission in the prescription, transcription, dispensing, administration), incorrect dose (overdosing, extra dose), incorrect administration frequency, incorrect pharmaceutical form, error of preparation or manipulation or conditioning, incorrect administration technique, incorrect administration route, incorrect velocity, incorrect time of administration, wrong patient, incorrect treatment duration (longer than the correct period, shorter), lack of treatment follow-up (lack of clinical, analytical reviews, interactions), deteriorated medication, patient non-compliance, others.18
The NCC MERP classification has been used for consequences in patient health, in which errors were grouped in 9 categories of increasing severity17 (Table 2).
This study does not include potential errors or circumstances capable of causing error (severity category A), or adverse reactions to medications or unpreventable adverse events.
Errors affecting the care of the patient and diet were also excluded.
Error detection
Prescription: a pharmacist made a daily review of the study patients’ prescriptions and analysed: right patient and medication, adhesion to protocol, interactions, contraindications, omissions, therapeutic duplication, dosage, frequency, route, and lack of follow-up. Where appropriate, information was obtained from the physician or nurse. The errors were recorded on a sheet designed for the purpose.
Transcription/validation by the PS: following the prescription review, above, and also on a daily basis,
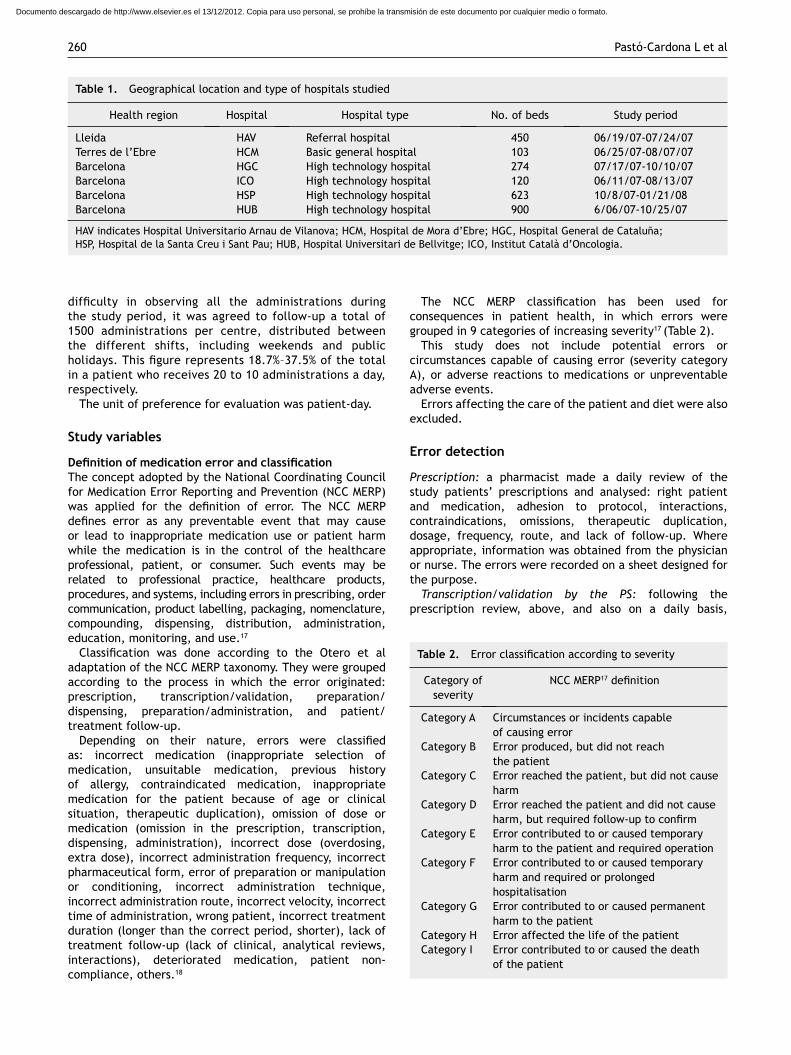
Table 1. Geographical location and type of hospitals studied
Health region Hospital Hospital type No. of beds Study period
Lleida HAV Referral hospital 450 06/19/07-07/24/07Terres de l’Ebre HCM Basic general hospital 103 06/25/07-08/07/07Barcelona HGC High technology hospital 274 07/17/07-10/10/07Barcelona ICO High technology hospital 120 06/11/07-08/13/07Barcelona HSP High technology hospital 623 10/8/07-01/21/08Barcelona HUB High technology hospital 900 6/06/07-10/25/07
HAV indicates Hospital Universitario Arnau de Vilanova; HCM, Hospital de Mora d’Ebre; HGC, Hospital General de Cataluña; HSP, Hospital de la Santa Creu i Sant Pau; HUB, Hospital Universitari de Bellvitge; ICO, Institut Català d’Oncologia.
Table 2. Error classification according to severity
Category of severity
NCC MERP17 definition
Category A Circumstances or incidents capable of causing error
Category B Error produced, but did not reach the patient
Category C Error reached the patient, but did not cause harm
Category D Error reached the patient and did not cause harm, but required follow-up to confirm
Category E Error contributed to or caused temporary harm to the patient and required operation
Category F Error contributed to or caused temporary harm and required or prolonged hospitalisation
Category G Error contributed to or caused permanent harm to the patient
Category H Error affected the life of the patientCategory I Error contributed to or caused the death
of the patient
Documento descargado de http://www.elsevier.es el 13/12/2012. Copia para uso personal, se prohíbe la transmisión de este documento por cualquier medio o formato.
Medication errors in the hospital environment 261
another pharmacist verified coincidence with the original medical order (MO): patient, medication, dosage, schedule, route, and duration. Disagreements were compared with the original MO and the errors recorded.
Preparation in the PS: a pharmacist, technician, or nursing personnel, according to the availability and procedure of each hospital, revised the medications prepared for the study patients: prescribed formulas, parenteral nutrition, intravenous mixtures, cytostatics. The suitability of the medication or active principle, concentration, quantity, diluents, preparation techniques, identification, stability, use-by date, and conservation were studied and the errors recorded.
Dispensing: in the PS, before sending out the trolleys with the unitary doses, the boxes were checked and their contents compared with the trolley inventory control list generated by the unitary dose computer system. Errors were considered: wrong medication, omission of dose or medication, incorrect dose, incorrect pharmaceutical form, wrong patient, and deteriorated or badly conserved medication. This activity was performed by technical, auxiliary, nursing or pharmaceutical personnel, according to the organisation of each centre.
Errors were noted directly on the medication lists or the sheet designed for that purpose.
Transcription by nursing staff: on the floor, the nursing staff assigned to observe the administration, checked that the transcription of the MO was correct against a list of medications by patient, a computerised nursing sheet, or a copy of the MO, depending on each hospital. Disagreements were resolved by comparing the nursing and pharmacy information with the original MO.
Preparation/handling by nursing and administration: once the transcription was validated, the nurse in charge checked by direct observation, the correct preparation and administration of the medications and accompanied the ward nurse during the drug round: medication, omission, pharmaceutical form, solvent, dosage, concentration, preparation method, incompatibilities, conservation, stability of final product, patient, clinical situation, route, velocity, administration technique, time, treatment duration and follow-up. Schedule error was defined as at least 1 hour before or after the established time. Detected errors were avoided, but were recorded as if they had reached the patient, attributed a potential morbidity and classified in terms of the pertinent severity. This task was performed daily observing part of the administrations of the different shifts continually until the total observations had been reached.
Errors were recorded directly onto the checklist or form. In all cases, detected errors were corrected.Prescription, pharmaceutical transcription/validation, or
dispensing errors detected during the administration stage were not counted in the hospitals which had performed the ward observations at a later time than the rest of the study since, as mentioned, the errors were intercepted once diagnosed and thus did not go beyond the nursing unit.
Work plan
The Catalan Society of Clinical Pharmacy announced the existence of the study, and enrolment was opened to the
centres that wished to participate. Hospitals of different levels were selected, and in each one a work team was created, formed by at least one doctor, one nurse and one pharmaceutical coordinator responsible for the training of the members participating in the study.
A specific sheet for each process was drawn up for recording details of the errors with a common section requiring information on the patient and the drugs involved.
The hospitals entered their own information into a database designed by the Institute for Safe Medication Practices-Spain and the Spanish Society of Hospital Pharmacy, which was used in the investigation of medication errors in the Ruiz Jarabo 2000 grant project (Otero et al). Furthermore, each hospital created a registry of patients, hospital stays, number of medications, and units of medication assigned to the study patients.
On planning the development of the study, it was estimated that a mean stay of 1 week and daily follow-up of 50 patients would take some 40 days, including weekends and public holidays (considering units of 25 beds and 100% occupancy) to include 300 patients per hospital. In some centres, the administration errors were studied at a later date than the rest of the study, although in the same units as the previous stages.
Data capture started on June 1, 2007 and ended on January 23, 2008 due to the late entry of one hospital (Table 1).
Statistical analysis
Data was analysed with the SPSS 11.0 (SPSS Inc., Chicago, IL, USA) statistical software package. Qualitative variables were described as percentages and incidence, such as incidence density (number of errors per patients-day at risk), equal to the quotient between the number of medication errors produced during the follow-up period and the sum of all the individual observation times. Quantitative variables were described through measures of central tendency (mean or median according to normality criteria studied by the Kolmogorov-Smirnov test) and dispersion (standard deviation, interquartile range). Frequency comparisons between 2 types of units (medical and surgical) were done using the c2 test or Fisher test, whichever was agreed. Quantitative data was compared using the Student t test or Mann-Whitney U test, depending on the unit (medical or surgical).
Statistical significance was defined as a value of P≤.05, and 95% of confidence interval (CI) . Unless stated otherwise, the results are given per 100 patients-day.
Interhospital concordance study
During a meeting between collaborators and work group members from the different centres, a concordance study was made through the written resolution of practical cases to evaluate the characterisation of medication errors and uncover differences of opinion in their diagnosis.
Given that the kappa index determines the degree of agreement that exists above that expected at random, this means was used to study overall concordance between reviewers and stratified according to the stages of the therapeutic chain process.
Documento descargado de http://www.elsevier.es el 13/12/2012. Copia para uso personal, se prohíbe la transmisión de este documento por cualquier medio o formato.
262 Pastó-Cardona L et al
The result of the overall identification of errors was moderate (kappa=0.525), being good in administration (kappa=0.778) and weak or moderate in prescription (kappa=0.296) and dispensing (kappa=0.450).
Once these evaluations were completed, a case by case discussion took place and a consensus reached in 100% of the studied cases.
Ethical aspects
The coordinators of each centre sought the agreement of the chiefs and supervisors of the implicated services in order to conduct the study, and informed the respective directors’ offices when it began. Each principal investigator presented the project to the Clinical Investigation Ethics Committee of their own hospital for approval.
Observation of the administration was made in agreement with the floor nursing staff, and conducted by experienced nurses, largely on the staff, outside their regular shift. Errors were corrected as soon as they were detected.
In order to present the results anonymously, each hospital was identified with a code.
Results
General information on medication errors
The study was carried out on an adult population, although this was not an inclusion criterium. The mean (standard deviation) of age was 65.18 (15.76) years. In all the centres, the mean oscillates between 65 and 67 years, except in
Hp5, where it is significantly lower (P<.001) and equal to 59 years. 61% are male and 39%, female.
Between the 6 participating hospitals, 2030 patients were studied during 11 714 stays (or patients-day). The total of medication units was 131 378 which corresponded to 64 527 medications. The distribution by hospital is shown in Table 3. The administrations observed were 8784.
Overall, 1984 medication errors were detected, which implies an incident rate of 16.94 errors per 100 patients-day (95% CI, 16.63-17.25) and a proportion of 0.98 errors per patient (95% CI, 0.93-1.02) (Figure 1).
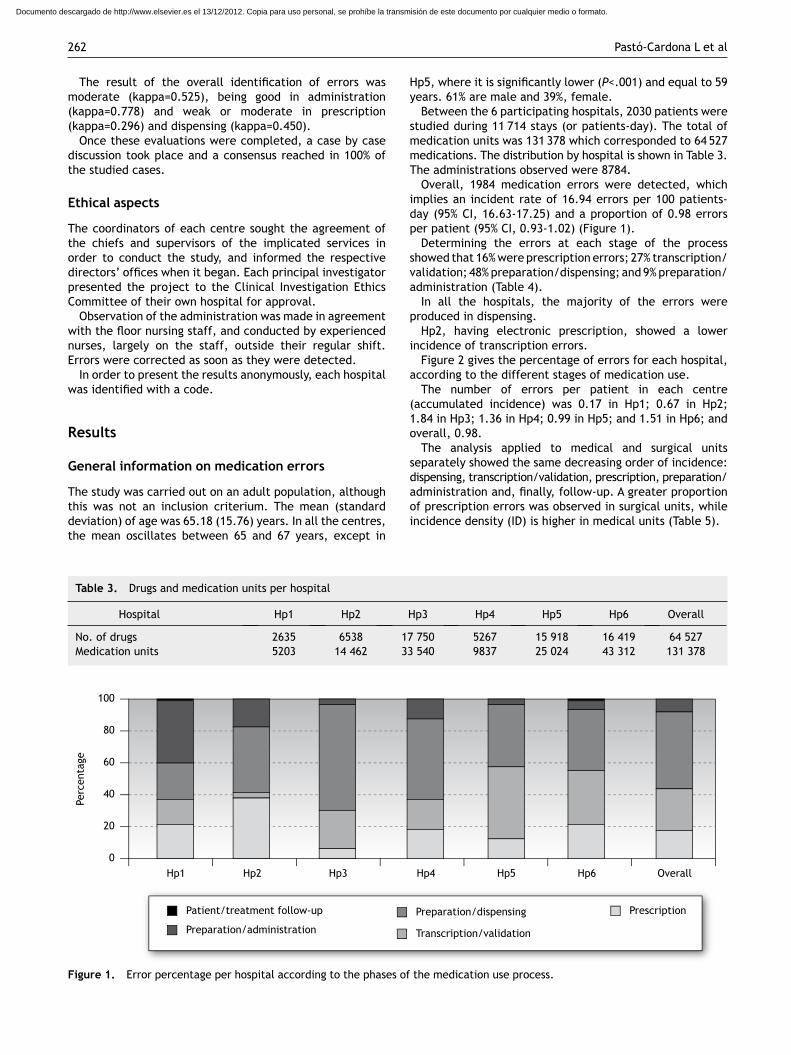
Determining the errors at each stage of the process showed that 16% were prescription errors; 27% transcription/validation; 48% preparation/dispensing; and 9% preparation/administration (Table 4).
In all the hospitals, the majority of the errors were produced in dispensing.
Hp2, having electronic prescription, showed a lower incidence of transcription errors.
Figure 2 gives the percentage of errors for each hospital, according to the different stages of medication use.
The number of errors per patient in each centre (accumulated incidence) was 0.17 in Hp1; 0.67 in Hp2; 1.84 in Hp3; 1.36 in Hp4; 0.99 in Hp5; and 1.51 in Hp6; and overall, 0.98.
The analysis applied to medical and surgical units separately showed the same decreasing order of incidence: dispensing, transcription/validation, prescription, preparation/ administration and, finally, follow-up. A greater proportion of prescription errors was observed in surgical units, while incidence density (ID) is higher in medical units (Table 5).
Table 3. Drugs and medication units per hospital
Hospital Hp1 Hp2 Hp3 Hp4 Hp5 Hp6 Overall
No. of drugs 2635 6538 17 750 5267 15 918 16 419 64 527Medication units 5203 14 462 33 540 9837 25 024 43 312 131 378
Hp1 Hp2 Hp3 Hp4 Hp5 Hp6 Overall
100
80
60
40
20
0
Perc
enta
ge
Prescription
Preparation/administration
Patient/treatment follow-up
Transcription/validation
Preparation/dispensing
Figure 1. Error percentage per hospital according to the phases of the medication use process.
Documento descargado de http://www.elsevier.es el 13/12/2012. Copia para uso personal, se prohíbe la transmisión de este documento por cualquier medio o formato.
Medication errors in the hospital environment 263
Consequences for the patient
Category B is the most numerous with 84.5% of the total, followed by category C (error that reaches the patient, but
causes no harm) (14.5%). In group D, (error without harm but requiring follow-up to confirm) 0.71%, there are 14 cases: six originating from prescription errors, 2 in transcription by pharmacy, and 6 in administration.
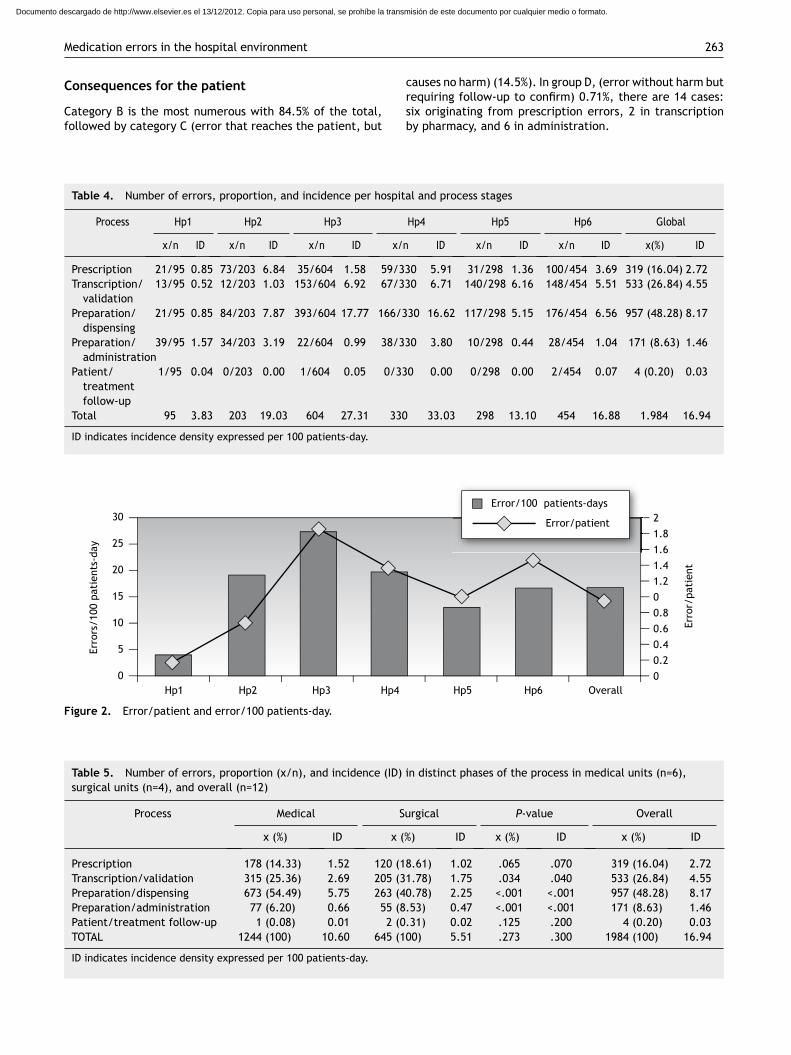
Table 4. Number of errors, proportion, and incidence per hospital and process stages
Process Hp1 Hp2 Hp3 Hp4 Hp5 Hp6 Global
x/n ID x/n ID x/n ID x/n ID x/n ID x/n ID x(%) ID
Table 5. Number of errors, proportion (x/n), and incidence (ID) in distinct phases of the process in medical units (n=6), surgical units (n=4), and overall (n=12)
Process Medical Surgical P-value Overall
x (%) ID x (%) ID x (%) ID x (%) ID
Figure 2. Error/patient and error/100 patients-day.
Hp1 Hp2 Hp3 Hp4 Hp5 Hp6 Overall
30
25
20
15
10
5
0
21.81.61.41.200.80.60.40.20
Erro
rs/1
00 p
atie
nts-
day
Erro
r/pa
tien
t
Error/patient
Error/100 patients-days
Prescription 21/95 0.85 73/203 6.84 35/604 1.58 59/330 5.91 31/298 1.36 100/454 3.69 319 (16.04) 2.72Transcription/ 13/95 0.52 12/203 1.03 153/604 6.92 67/330 6.71 140/298 6.16 148/454 5.51 533 (26.84) 4.55 validationPreparation/ 21/95 0.85 84/203 7.87 393/604 17.77 166/330 16.62 117/298 5.15 176/454 6.56 957 (48.28) 8.17 dispensingPreparation/ 39/95 1.57 34/203 3.19 22/604 0.99 38/330 3.80 10/298 0.44 28/454 1.04 171 (8.63) 1.46 administrationPatient/ 1/95 0.04 0/203 0.00 1/604 0.05 0/330 0.00 0/298 0.00 2/454 0.07 4 (0.20) 0.03 treatment follow-upTotal 95 3.83 203 19.03 604 27.31 330 33.03 298 13.10 454 16.88 1.984 16.94
ID indicates incidence density expressed per 100 patients-day.
Prescription 178 (14.33) 1.52 120 (18.61) 1.02 .065 .070 319 (16.04) 2.72Transcription/validation 315 (25.36) 2.69 205 (31.78) 1.75 .034 .040 533 (26.84) 4.55Preparation/dispensing 673 (54.49) 5.75 263 (40.78) 2.25 <.001 <.001 957 (48.28) 8.17Preparation/administration 77 (6.20) 0.66 55 (8.53) 0.47 <.001 <.001 171 (8.63) 1.46Patient/treatment follow-up 1 (0.08) 0.01 2 (0.31) 0.02 .125 .200 4 (0.20) 0.03TOTAL 1244 (100) 10.60 645 (100) 5.51 .273 .300 1984 (100) 16.94
ID indicates incidence density expressed per 100 patients-day.
Documento descargado de http://www.elsevier.es el 13/12/2012. Copia para uso personal, se prohíbe la transmisión de este documento por cualquier medio o formato.
264 Pastó-Cardona L et al
Only in 0.35% (n=7) would errors have caused harm had they not been intercepted; in terms of origin, 4 are prescription and 3, administration.
There were no occurrences in category G (error with harm: error contributes to or causes permanent harm to the patient), H (error with harm: the error affects the patient’s life and requires life-sustaining intervention), or I (fatal error).
Error related to medications and medication units
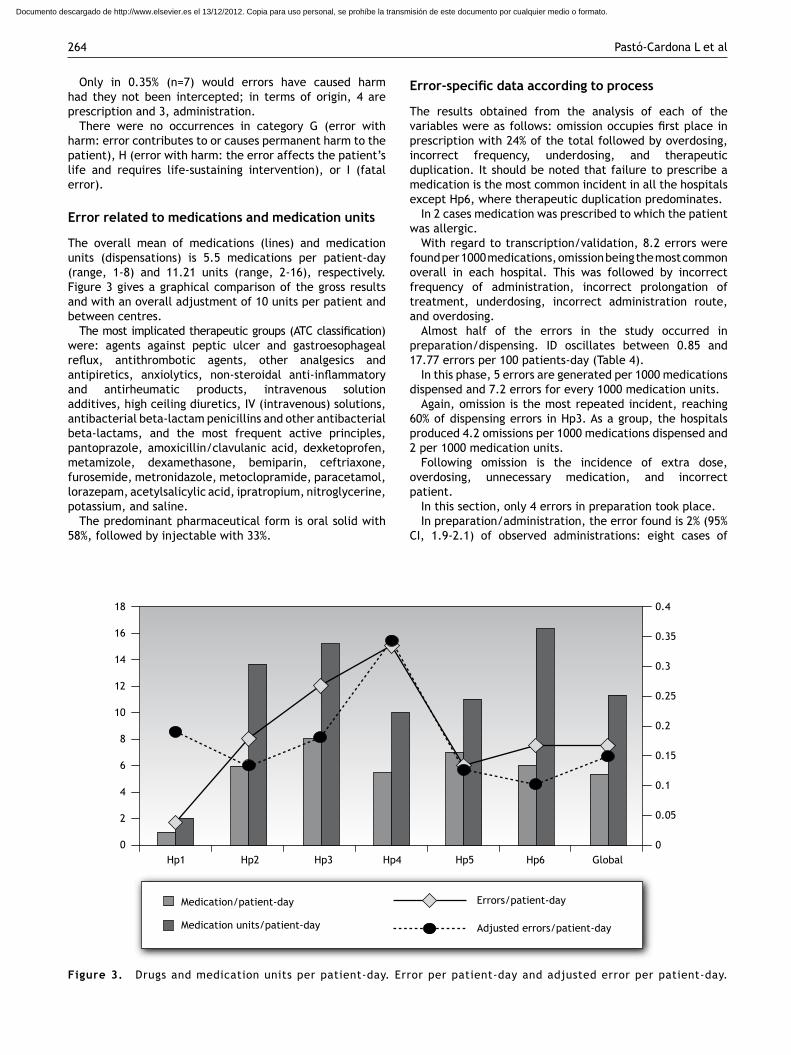
The overall mean of medications (lines) and medication units (dispensations) is 5.5 medications per patient-day (range, 1-8) and 11.21 units (range, 2-16), respectively. Figure 3 gives a graphical comparison of the gross results and with an overall adjustment of 10 units per patient and between centres.
The most implicated therapeutic groups (ATC classification) were: agents against peptic ulcer and gastroesophageal reflux, antithrombotic agents, other analgesics and antipiretics, anxiolytics, non-steroidal anti-inflammatory and antirheumatic products, intravenous solution additives, high ceiling diuretics, IV (intravenous) solutions, antibacterial beta-lactam penicillins and other antibacterial beta-lactams, and the most frequent active principles, pantoprazole, amoxicillin/clavulanic acid, dexketoprofen, metamizole, dexamethasone, bemiparin, ceftriaxone, furosemide, metronidazole, metoclopramide, paracetamol, lorazepam, acetylsalicylic acid, ipratropium, nitroglycerine, potassium, and saline.
The predominant pharmaceutical form is oral solid with 58%, followed by injectable with 33%.
Error-specific data according to process
The results obtained from the analysis of each of the variables were as follows: omission occupies first place in prescription with 24% of the total followed by overdosing, incorrect frequency, underdosing, and therapeutic duplication. It should be noted that failure to prescribe a medication is the most common incident in all the hospitals except Hp6, where therapeutic duplication predominates.
In 2 cases medication was prescribed to which the patient was allergic.
With regard to transcription/validation, 8.2 errors were found per 1000 medications, omission being the most common overall in each hospital. This was followed by incorrect frequency of administration, incorrect prolongation of treatment, underdosing, incorrect administration route, and overdosing.
Almost half of the errors in the study occurred in preparation/dispensing. ID oscillates between 0.85 and 17.77 errors per 100 patients-day (Table 4).
In this phase, 5 errors are generated per 1000 medications dispensed and 7.2 errors for every 1000 medication units.
Again, omission is the most repeated incident, reaching 60% of dispensing errors in Hp3. As a group, the hospitals produced 4.2 omissions per 1000 medications dispensed and 2 per 1000 medication units.
Following omission is the incidence of extra dose, overdosing, unnecessary medication, and incorrect patient.
In this section, only 4 errors in preparation took place.In preparation/administration, the error found is 2% (95%
CI, 1.9-2.1) of observed administrations: eight cases of
Figure 3. Drugs and medication units per patient-day. Error per patient-day and adjusted error per patient-day.
Hp1 Hp2 Hp3 Hp4 Hp5 Hp6 Global
18
16
14
12
10
8
6
4
2
0
0.4
0.35
0.3
0.25
0.2
0.15
0.1
0.05
0
Medication/patient-day
Medication units/patient-day
Errors/patient-day
Adjusted errors/patient-day
Documento descargado de http://www.elsevier.es el 13/12/2012. Copia para uso personal, se prohíbe la transmisión de este documento por cualquier medio o formato.
Medication errors in the hospital environment 265
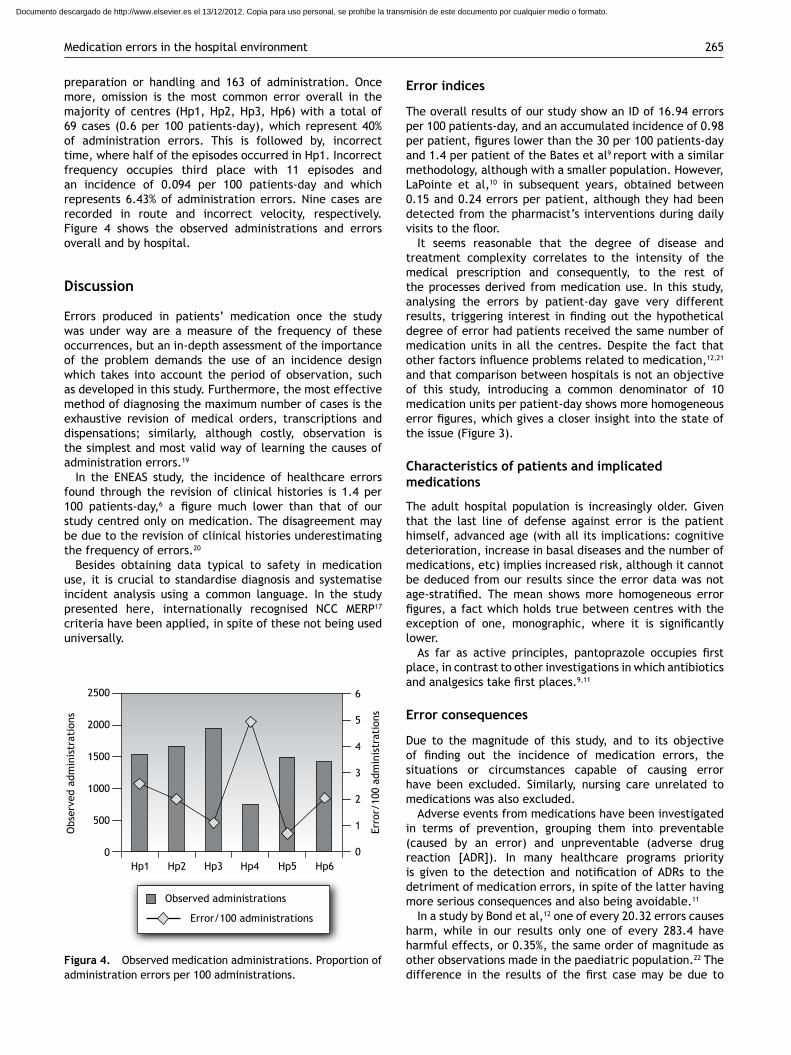
preparation or handling and 163 of administration. Once more, omission is the most common error overall in the majority of centres (Hp1, Hp2, Hp3, Hp6) with a total of 69 cases (0.6 per 100 patients-day), which represent 40% of administration errors. This is followed by, incorrect time, where half of the episodes occurred in Hp1. Incorrect frequency occupies third place with 11 episodes and an incidence of 0.094 per 100 patients-day and which represents 6.43% of administration errors. Nine cases are recorded in route and incorrect velocity, respectively. Figure 4 shows the observed administrations and errors overall and by hospital.
Discussion
Errors produced in patients’ medication once the study was under way are a measure of the frequency of these occurrences, but an in-depth assessment of the importance of the problem demands the use of an incidence design which takes into account the period of observation, such as developed in this study. Furthermore, the most effective method of diagnosing the maximum number of cases is the exhaustive revision of medical orders, transcriptions and dispensations; similarly, although costly, observation is the simplest and most valid way of learning the causes of administration errors.19
In the ENEAS study, the incidence of healthcare errors found through the revision of clinical histories is 1.4 per 100 patients-day,6 a figure much lower than that of our study centred only on medication. The disagreement may be due to the revision of clinical histories underestimating the frequency of errors.20
Besides obtaining data typical to safety in medication use, it is crucial to standardise diagnosis and systematise incident analysis using a common language. In the study presented here, internationally recognised NCC MERP17 criteria have been applied, in spite of these not being used universally.
Error indices
The overall results of our study show an ID of 16.94 errors per 100 patients-day, and an accumulated incidence of 0.98 per patient, figures lower than the 30 per 100 patients-day and 1.4 per patient of the Bates et al9 report with a similar methodology, although with a smaller population. However, LaPointe et al,10 in subsequent years, obtained between 0.15 and 0.24 errors per patient, although they had been detected from the pharmacist’s interventions during daily visits to the floor.
It seems reasonable that the degree of disease and treatment complexity correlates to the intensity of the medical prescription and consequently, to the rest of the processes derived from medication use. In this study, analysing the errors by patient-day gave very different results, triggering interest in finding out the hypothetical degree of error had patients received the same number of medication units in all the centres. Despite the fact that other factors influence problems related to medication,12,21 and that comparison between hospitals is not an objective of this study, introducing a common denominator of 10 medication units per patient-day shows more homogeneous error figures, which gives a closer insight into the state of the issue (Figure 3).
Characteristics of patients and implicated medications
The adult hospital population is increasingly older. Given that the last line of defense against error is the patient himself, advanced age (with all its implications: cognitive deterioration, increase in basal diseases and the number of medications, etc) implies increased risk, although it cannot be deduced from our results since the error data was not age-stratified. The mean shows more homogeneous error figures, a fact which holds true between centres with the exception of one, monographic, where it is significantly lower.
As far as active principles, pantoprazole occupies first place, in contrast to other investigations in which antibiotics and analgesics take first places.9,11
Error consequences
Due to the magnitude of this study, and to its objective of finding out the incidence of medication errors, the situations or circumstances capable of causing error have been excluded. Similarly, nursing care unrelated to medications was also excluded.
Adverse events from medications have been investigated in terms of prevention, grouping them into preventable (caused by an error) and unpreventable (adverse drug reaction [ADR]). In many healthcare programs priority is given to the detection and notification of ADRs to the detriment of medication errors, in spite of the latter having more serious consequences and also being avoidable.11
In a study by Bond et al,12 one of every 20.32 errors causes harm, while in our results only one of every 283.4 have harmful effects, or 0.35%, the same order of magnitude as other observations made in the paediatric population.22 The difference in the results of the first case may be due to
Figura 4. Observed medication administrations. Proportion of administration errors per 100 administrations.
Hp1 Hp2 Hp3 Hp4 Hp5 Hp6
2500
2000
1500
1000
500
0
6
5
4
3
2
1
0
Obs
erve
d ad
min
istr
atio
ns
Error/100 administrations
Observed administrations
Erro
r/10
0 ad
min
istr
atio
ns
Documento descargado de http://www.elsevier.es el 13/12/2012. Copia para uso personal, se prohíbe la transmisión de este documento por cualquier medio o formato.
266 Pastó-Cardona L et al
events being detected from the error notification register, in which the most serious are recorded in detriment to the less significant.
The origin of errors which produce harm, in our casuistics, lies in prescription and administration, coinciding with other authors.12 It is uncertain whether any of the category B errors could have reached the patient and caused harm, had they not been intercepted. In the field of industry, a study was developed in which the conclusion reached was that for every accident with important injury there were 29 which caused mild consequences and 300 which had no effect on health.23 According to our results, for every error causing significant injury (Categories E and F) there were 2 which produced mild consequences (Category D) and 280 with no impact on patient health (Categories B and C).
Errors are not only important from the patient health point of view; they also increase the costs of hospitalisation and hinder improvement (lengthening stays, consequences, additional tests, etc), not to mention the legal complaints and claims that may arise. Even trivial errors require work to correct them, implying loss of time and, therefore, cost repercussions. Bates et al9 calculated that 8 minutes were needed to repair an error of omission, divided between pharmacy and nursing, and supposed that the same mean investment of time would be required to resolve any kind of medication error. If we apply this piece of information to our study, the time consumed in correcting all the errors would total over 264 hours, equivalent to approximately 2 months on a 35-hour working week.
Prescription errors
In many publications, the lack of basic information in the MO (patient identification, route, dosage, duration, ambiguous prescription, doctor’s signature, etc) counts as an error and is extensive in manual prescription; these are Category A errors (Table 2) and not included in our study. Thus, while some results vary between 39% and 62.8% of the total,10,24,25 in our investigation prescription error is much less (16%).
In this stage, 2.72 errors were found per 100 patients-day and 5 per 1000 prescribed medications. Omission is the most frequent error, as in other studies.9 The centre, Hp2, contributes more than half of these cases, the majority of which are due to failure to prescribe a necessary medication, referring to the patient’s usual medication before admission. Prescription omissions are a common error among admissions26,27 and underline the lack of continuity between in-patient and out-patient care.28
After omission, the most frequent errors are overdosing, incorrect frequency, underdosing, therapeutic duplication and prolonged treatment duration. This profile is similar to that described by Bates et al,9 although, in our results, prescribing a medication to which the patient is allergic is much less frequent.
Transcription errors
In our investigation, transcription errors make up 27% of the total, a proportion similar to that described by LaPointe et al10 and much higher than the 12% and 11% of Kohn et al1 and Bates et al,11 respectively.
Once again, omission is the most repeated. Overdose and underdose errors occur with a similar frequency, while prolonged treatment duration occurs 10 times more than the opposite error: suspending the treatment before time.
Electronic prescription seems a promising solution: it avoids transcription and does away with patient identification problems (clear reading of the MO, complete treatment regimen, allergies, incorrect dosage, interactions, etc). However, some authors have come across up to 22 new types of error as a result of electronic prescription.29
Nursing transcription errors are more likely to cause harm: the medication use process is very close to the patient and there are fewer protective barriers. Furthermore, if the error continues over several doses, there will undoubtedly be clinical repercussions.
Dispensing errors
In our analysis, dispensing errors comprise almost half the total, in contrast to other reports which claim only 11%-14%.7,15 Somewhat more elevated (17%) was the percentage detected through hospital medication error notifications, compiled by the United States Pharmacopeia in 1999.30
A relation has been drawn between mistakes in dispensing and a series of causes, such as, staff dissatisfaction, little relationship with supervision, infrequent work breaks, lack of attention, poor lighting, inadequate equipment and insufficient sleep. According to the investigators, these factors cause mental stress and distractions which increase the number of errors. Curiously, however, they found no relation to the workload.31
According to our results, omission is the most frequent dispensing error.
In the United Kingdom, where the UDDD system is not used by the majority, higher rates of dispensing errors have been described (2.1% of dispensed doses); among the immediate causes, the authors point out: wrong selection, incorrect assumptions about the implicated products, factors relating to labelling and placement of medications, similar name and appearance of medications, interruptions and distractions, dependence of companions at the time of identification and rectification of mistakes, little experience and lack of quality control systems in dispensing.32
In this study, overall dispensing error (1.5%) is higher than the 0.8% of other investigations;21 nevertheless, on comparing the data with studies conducted in Spain, our error figures are lower.33,34
Dispensing errors are usually intercepted before reaching the patient; nonetheless, cases have been published in which the error did reach the patient and harm was caused.35
In our study, the magnitude of the results requires us to suggest a solution. Semiautomatic and automatic methods seem a safe alternative to manual dispensing but demand considerable investment and a redistribution of activity in the PS, and are susceptible, at least, to error derived from the manual replenishment of the cabinet.20 In the hospitals in our study, the error varies between 0.4% and 1.17% of dispensations, and in the centres where replenishing is done by Kardex (Hp2 and Hp4), the figures fall between these limits. To date, the only method to guarantee safety in dispensing unit doses is the complete revision of the drawers.
Documento descargado de http://www.elsevier.es el 13/12/2012. Copia para uso personal, se prohíbe la transmisión de este documento por cualquier medio o formato.
Medication errors in the hospital environment 267
Administration errors
Direct observation, applied in this part of the work, is the best method for identifying preparation/administration errors, in which up to 92% of cases are detected; nevertheless, it is expensive and requires the training of personnel.19 According to our study, 2% of administrations are erroneous; in spite of this, the percentage rises to 14.6 in the observations of Flynn et al,36 in which the moment of administration makes up 40% of cases, in contrast to our study, where it is infrequent.
At this stage of medication use, errors signify 8.61% of the total, less than in other published studies, with 26% and 38%,11,24 and higher compared to the 4.8% of LaPointe et al.10
Figure 4 shows the administration errors in the different hospitals.
Administration errors are the most difficult to intercept since there is no barrier, except the patient himself, to avoid them. Although the consequences may be light in some cases, route or drug errors can be serious: even the omission of certain medications (insulin, antiepileptics, corticoids, etc) can harm the patient, especially if the omission continues. It has been shown that two thirds of administration errors cause potential harm to patients, although only a fifth produce real damage.37 In our results, omission in the administration of doses is the most frequent incident.
Limitations of the study
The study was confined to 2 units of each hospital due to the difficulty and cost of the detection method. There was no masking of the observations which may have influenced the results in some stages, especially administration, in spite of the fact that the Hawthorne effect, which states that a worker’s performance will improve under observation, disappears when the observation is sequential, over a period of time.
The different characteristics of the participating hospitals, far from being an inconvenience in the collection of overall data errors in our population, take on greater representation; more so when the minimum number of study patients per hospital has been the same.
With respect to the time period covered by the study, it was intended that all the centres would commence at the same time, to complete before the holiday period, something which, in the end, proved impossible. This had an important impact on the administration phase: in some hospitals, this phase was conducted at a different time to the rest of the study (Table 1).
From the prevention point of view, through the execution of this project, some 2000 errors have been detected and avoided. The participating hospitals have made a tremendous effort to carry it out and have required specific personnel to do so, taking into account that only 2 units of each hospital were analysed during approximately 1 month. This difficulty shows that the centres are not equipped with exhaustive quality controls in medication use processes.
In spite of the difficulties entailed, the execution of this study may serve to initiate others with similar methodology
in our medium and, from the results, improve the planning of work systems and establish measures to reduce error.
The detection and registration of medication errors should be implemented systematically using unified criteria. The same happens in the design and use of safety indicators.
Funding
Project realised with the financial support of the Patient Safety Alliance in Catalonia, Regional Ministry of Health of the Catalonian Government.
Acknowledgments
Hospital Universitari Arnau de Vilanova: Laura Rumi, Irene Mangues, Manuel Cano, Nuria Amador, Ana Uson, Mireia Olmo, Maria Muñoz, Mireia Martínez. Hospital Mora d’Ebre: Rosa Montaña, Noèlia Anadón. Hospital Universitari de Bellvitge: Liz Aliaga, Núria Turet, Ernest Argilaga, M. José Marrero, Ángel Fernández, Santiago Gallego, Montserrat Comella. Institut Català d’Oncología: Montse Rey, Eduard Fort, Zaida Codina, Ester Corrales, Francisco Moreno, Monica Salinas, M. José Baños Capio. Hospital General de Catalunya: Teresa Cerezo, Montserrat Santos, Remei González, Anabel Roldós, M. Lluïsa Ruiz, Montse Granados, Irene Weber, M. Pilar Marcos, Pablo Pila, Núria Calaf, Gemma Baronet, Mónica Sanmartín. Avedis Donabedian Foundation: Roser Anglès, Victoria Gimeno. Hospital de la Santa Creu i Sant Pau: Anna Montserrat, Laura Losa; and Pharmacy personnel (pharmacists and technicians), and nursing personnel from the Sant Albert and Sant Alfred wards.
References
1. Kohn LT, Corrigan JM, Donaldson MS, editors. To err is human: Building a safer health system. Committee on Health Care in America. Institute of Medicine. Washington (DC): National Academy Press; 1999.
2. Committee on Health Care in America. Institute of Medicine. Crossing the quality chasm: A new health system for the 21st century. Washington (DC): National Academy Press; 2001.
3. Available from: http://www.google.com/search?q=cache: h t t p : //www.hea l t h g r ade s . com/med i a/DMS/pd f/InhosptialDeathsPatientSafetyPressRelease072704.pdf
4. Doing What Counts for Patient Safety: Federal Actions to Reduce Medical Errors and Their Impact. Report of the Quality Interagency Coordination Task Force (QuIC) to the President, February 2000. Quality Interagency Coordination Task Force. Washington, DC. Available from: http://www.quic.gov/report/toc.htm
5. Smith J. Febr. 2004. Building a safer NHS: Improving medication safety. Department of Health. Available from: http://www.dh.gov.uk/prod_consum_dh/groups/dh_digitalassets/@dh/@en/documents/digitalasset/dh_4084961.pdf
6. Available from: www.msc.es/organizacion/sns/planCalidad-SNS/pdf/excelencia/opsc_sp2.pdf
7. Available from: www.msc.es/organizacion/sns/planCalidad-SNS/pdf/pncalidad/notaPrensa20060323TextoIntegro.pdf
8. Leape LL. Error in medicine. JAMA. 1994;272:1851-7. 9. Bates DW, Boyle DL, Vander Vliet MB, Schneider J, Leape L.
Relationship between medication errors and adverse drug events. J Gen Intern Med. 1995;10:199-205.
Documento descargado de http://www.elsevier.es el 13/12/2012. Copia para uso personal, se prohíbe la transmisión de este documento por cualquier medio o formato.
268 Pastó-Cardona L et al
19. LaPointe NMA, Jollis JG. Medication errors in hospitalized cardiovascular patients. Arch Intern Med. 2003;163:1461-6.
11. Bates DW, Cullen DJ, Laird N, Petersen LA, Small SD, Servi D, et al. Incidence of adverse drug evenst and potential adverse drug events: implications for prevention. JAMA. 1995;274:29-34.
12. Bond CA, Raehl CL, Franke T. Medication errors in United States Hospitals. Pharmacotherapy. 2001;21:1023-36.
13. Otero MJ, Alonso P, Martín R, Valverde MP, Domínguez-Gil A. Analysis of preventable adverse drug events (ADEs) leading to hospital admission: incidence, categorization and cost. 36th ASHP Midyear Clinical Meeting and Exhibits, December 2-6, 2001 New Orleans (LA).
14. Martín MT, Codina C, Tuset M, Carné X, Nogué S, Ribas J. Problemas relacionados con la medicación como causa del ingreso hospitalario. Med Clin (Barc). 2002;118:205-10.
15. Lacasa C, Polo C, Andreu C, Roure C, Martínez J, Cot R. Detección de errores de medicación en hospitales. Evaluación de la calidad del proceso de prescripción, dispensación y administración de medicamentos. Rev Calidad Asistencial. 1998;13:92-100.
16. Blasco P, Mariño EL, Aznar MT, Pol E, Alós M, Castells M, et al. Desarrollo de un método observacional prospectivo de estudio de Errores de Medicación para su aplicación en hospitales. Farm Hosp. 2001;25:253-73.
17. National Coordinating Council for Medication Error Reporting and Prevention. NCCMERP Taxonomy of medication errors, 1998. [Cited March 2, 2003] http://www.nccmerp.org/aboutmederrors.htm
18. Otero MJ, Codina C, Tamés MJ, Pérez M. Errores de medicación: estandarización de la terminología y clasifi cación. Resultados de la beca Ruiz-Jarabo 2000. Farm Hosp. 2003;27:137-49.
19. Barker KN, Flynn EA, Pepper GA. Observation method of detecting medication errors. Am J Health-Sys Pharm. 2002;59: 2314-6.
20. Juvany R, Sevilla D, de la Peña MD, Leiva E, Perayre M, Jódar R. Optimización de la calidad del proceso de dispensación de medicamentos en dosis unitaria mediante la implantación del sistema semiautomático Kardex. Farm Hosp. 2007;31:38-42.
21. Runciman WB, Roughead EE, Semple SJ, Adams RJ. Adverse drug events and medication errors in Australia. Int J Qual Health Care. 2003;15(S1):i49-i59.
22. Raju TN, Thornton JP, Perry M, Feldman S. Medication errors in neonatal and pediatric intensive-care units. Lancet. 1989;2:374-6.
23. Phillips DP, Christenfeld N, Glynn LM. Increase in US medication- error deaths between 1983 and 1993. Research letter. Lancet. 1998;351:643.
24. Leape LL, Bates DW, Cullen DJ, Cooper J, Demonaco HJ, Gallivan T, et al. System analysis of adverse drug events. JAMA. 1995;274:35-43.
25. Lisby M, Nielsen LP, Mainz J. Errors in the medication process: frequency, type and potential. Int J Qual Health Care. 2005; 17:15-22.
26. Tam VC, Knowles SR, Cornish PL, Fine N, Marchesano R, Etchells EE. Frequency, type and clinical importance of medication history errors at admission to hospital: a systematic review. CMAJ. 2005;173:510-5.
27. Gutiérrez L, González I, Requena T, Fernández MC. Errores de prescripción en pacientes que ingresan en un servicio de medicina interna procedentes de urgencias. Farm Hosp. 2006;30:85-91.
28. 2004 ISMP Medication Safety Self Assessment® for Hospitals. Institute for Safe Medication Practices. Available from: http://www.ismp.org/selfassessments/Hospital/2004Hosplrg.pdf
29. Koppel R, Metlay JP, Cohen A, Abaluck B, Localio AR, Kimmel SE, et al. Role of computerized physician order entry on systems in facilitating medication errors. JAMA. 2005;293:1197-203.
30. United States Pharmacopeia. Summary of the 1999 information submitted to MedMARx a nacional database for hospital medication error reporting. 29
31. Grasha A. Pharmacy workload: the causes and confusion of dispensing errors. Canadian Pharmac J. 2001;134:26-35.
32. Beso A, Franklin BD, Barber N. The frequency and potential causes of dispensing errors in a hospital pharmacy. Pharmacy World Science. 2005;27:182-90.
33. Recio Blázquez ML, López Ruiz M, Arias Fernández L, Zamora Barrios MD. Análisis of medication errors detected in the dispensing process by the unit dose system in a Spanish hospital. EJHP. 2003;6:20-5.
34. Lorente L, Bovaira J, García R, Ferrer P, Espuny A. Mejora de la calidad del proceso de llenado de carros de medicación en un sistema de distribución de medicamentos en dosis unitarias. Farm Hosp. 2005;29:359-63.
35. Ball MJ Douglas JV. Redefi ning and improving patient safety. Meth Inf Med. 2003;41:271-6.
36. Flynn EA, Baker KN, Pepper GA, Bates PW. Observation method of detecting medication errors. Am J Health-System Pharm. 2002;59:2314-6.
37. de Clifford J, Montalvo M, Khoo SM, Rowley DH. Accuracy of medication administration by nurses with sole responsibility for patients; pilot study of error rate measurement. Aust J Hosp Pharm. 1994;24:491-3.
Documento descargado de http://www.elsevier.es el 13/12/2012. Copia para uso personal, se prohíbe la transmisión de este documento por cualquier medio o formato.