Embed Size (px)
Citation preview
8/10/2019 Vulnerability Appert Chapelon
http://slidepdf.com/reader/full/vulnerability-appert-chapelon 1/23
Measuring urban road network vulnerability using graph
theory : the case of Montpellier’s road network
Manuel Appert, Chapelon Laurent
To cite this version:
Manuel Appert, Chapelon Laurent. Measuring urban road network vulnerability using graphtheory : the case of Montpellier’s road network. Frederic Leone, Freddy Vinet, 2008, La miseen carte des risques naturels. Diversite des approche.. 2007. <halshs-00841520>
HAL Id: halshs-00841520
https://halshs.archives-ouvertes.fr/halshs-00841520
Submitted on 8 Jul 2013
HAL is a multi-disciplinary open access
archive for the deposit and dissemination of sci-
entific research documents, whether they are pub-
lished or not. The documents may come from
teaching and research institutions in France or
abroad, or from public or private research centers.
L’archive ouverte pluridisciplinaire HAL, est
destinee au depot et a la diffusion de documents
scientifiques de niveau recherche, publies ou non,
emanant des etablissements d’enseignement et de
recherche francais ou etrangers, des laboratoires
publics ou prives.
8/10/2019 Vulnerability Appert Chapelon
http://slidepdf.com/reader/full/vulnerability-appert-chapelon 2/23
Measuring urban road network vulnerability using graphtheory : the case of Montpellier’s road network
Working paper
Manuel Appert, Associate professor at Lyon 2 University, researcher and director of
Institut des Recherches Géographiques (IRG) part of UMR 5600 Environnement,
Ville, Société. [email protected]
Web : http://ghhat.univ-lyon2.fr/appert-manuel-517520.kjsp
Laurent Chapelon, professor at Montpellier III University, UMR GRED
Gouvernance, Risques, Environnement, Développement (IRD).
Web : http://www.gred.ird.fr/membres2/membres-permanents/chapelon-
laurent#chapitre_0
Abstract The urban road network provides spatial access to the city through an overlapping
hierarchy, ranging from highways to local access streets. This pattern of network
organisation has led to an increased propensity to vulnerability, exposing parts of the
city to sharp decreases in accessibility when traffic blockages occur on the main links
or at junctions. Our aim is to define road network vulnerability and to measure the
road network's exposure to risk. We postulate that the network morphology, structure
and level of congestion can be influencing factors. Two vulnerability indices which
pinpoint accessibility loss in the city by removing links and vertices one by one, have
been developed to assess the network's vulnerability.
Keywords accessibility, graph modelling, Montpellier, risk, urban road network, vulnerability.
IntroductionVulnerability, exposure to risk or reliability are already well researched concepts in
the field of transport (Bell and Lida 1997, Miller and Shaw, 2001). They have been
studied not only from a safety point of view, but also as a problem of an insufficient
level of service and its spatial implications (Berdica 1998, 2001, Lida 1999, Chen et
al., 1999, Taylor 1999). In recent decades, the urban road network has come to
provide complete spatial access to the city through an overlapping hierarchy, ranging
from highways to local access streets. This pattern of network organisation is
responsible for an increased propensity to vulnerability, exposing parts of the city to
sharp decreases in accessibility when traffic blockages occur on the main links or at junctions. Therefore, there is a growing need for a new characterisation of the
8/10/2019 Vulnerability Appert Chapelon
http://slidepdf.com/reader/full/vulnerability-appert-chapelon 3/23
network propensity to malfunction, as far as its spatial and functional structures are
concerned (Berdica 2002). The first part of our paper focuses, as previous research
has done (Beom and Chang 2002, Gleyze 2001, 2003), on defining road network
vulnerability and measuring of the road network's exposure to risk. In our approach,
we postulate that the network morphology, structure and level of congestion can be
influencing factors. The second part of the paper is concerned with the construction
of two vulnerability indices and testing of one of them, which pinpoint accessibility
loss in the city by removing links and vertices one by one and which have been
developed to assess the network's vulnerability.
1. Vulnerability of the urban traffic system: definition andindices
Vulnerability has already been defined by some researchers from a broader
perspective, including safety. Focusing on network structure vulnerability from a
circulatory point of view, we shall use and build on the definition proposed by Berdica
(2000, 2001, 2002) and Goodwin (1992). This is that "there is a need for an overall
characterisation of road networks, to gain insight into their propensity to malfunction".
Our goal is not to quantify the consequences of risks on a given area, but to evaluate
the supply side – the routes between nodes on a network and the nodes themselves
– more consistently with our theoretical approach to vulnerability. In this case, we
have found it more appropriate to describe the performance of the road system
(network + level of service) in terms of serviceability (Berdica 2002). Performance is
thus defined more accurately by several criteria and not just the ability to go from A to
B. Serviceability is thus "the basic ability of a system to deliver you from where you
are, to where you want to be, at the time you want to travel (
) that makes the
journey worthwhile" (Goodwin, 1992). We shall bear in mind that "vulnerability in the
road transportation system is a susceptibility to incidents that can result in
considerable reductions in road network serviceability". The incidents may then be
more or less predictable, caused voluntarily or involuntarily, by man or nature. Risks
such as maintenance closure and roadworks are not considered, because drivers
may know of those incidents in advance and postpone or reroute their journeys
accordingly. Blockages and congestion should be of a non-recurrent type, due to
random, unplanned restrictions to traffic flow.
Vulnerability is a much more relevant concept than reliability (Taylor, 1999) becauseit is solely "related to the consequences of link failure, irrespective of the probability
of failure" (Berdica 2002).
Vulnerability is determined by the absolute severity of an incident and by the relative
consequences of its occurrence on a given infrastructure or service (serviceability in
the broad sense). For incidents of equal severity, we can define two potential failure
locations on the graph:
- the vertices
- the arcs
and three network structural predispositions that can cause the level of serviceability
to fluctuate:- network morphology predispositions
8/10/2019 Vulnerability Appert Chapelon
http://slidepdf.com/reader/full/vulnerability-appert-chapelon 4/23
- network quality predispositions
- network crowding predispositions.
1.1 Road network link vulnerability index
This index measures the loss of overall accessibility recorded by the vertices of a
graph representing the modelled area. The arcs are removed one by one to simulate
accidental cuts to the links that they represent. Accessibility is considered here to be
the sum of the available shortest path between all vertices.
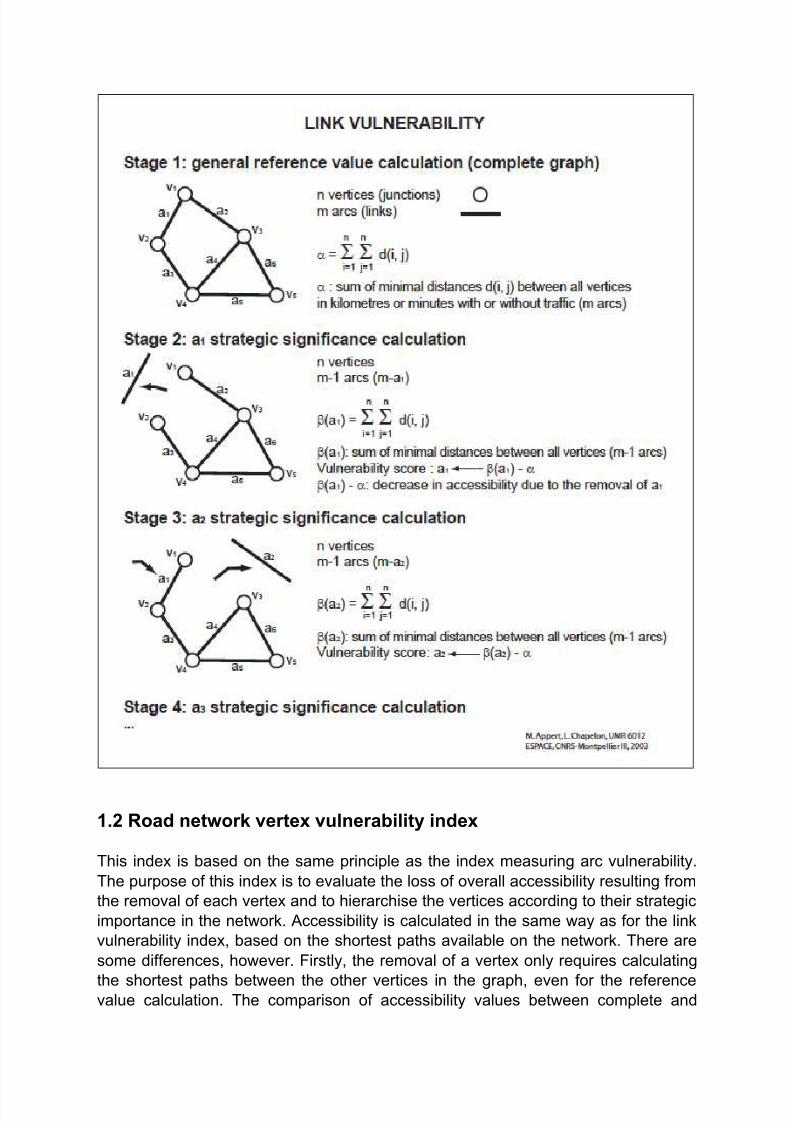
The first stage of the process consists in calculating the sum of the shortest path on
the complete network to obtain the reference value. (Figure 1, Stage 1) In Stage 2,
the algorithm automatically removes the first arc in the matrix. The sum of the
shortest path on the network is thus recalculated for the incomplete network (Figure
1, Stage 2). The resulting sum is at least equal to or greater than the reference value.
We then substract the reference value from this new value to obtain the vulnerability
index associated with the removal of that particular arc. The higher the difference
between the reference value and the value obtained on the uncomplete graph, the
greater the loss of overall accessibility caused by the removal of that arc. The greater
the loss of accessibility, the more strategic the link in the network organisation. We
then proceed in the same manner for the remaining arcs in the graph, comparing the
difference between the reference value of the shortest path and the sum resulting
from the removal of each arc (Figure 1, Stages 3 and beyond).
FIGURE 1 – LINK VULNERABILITY
8/10/2019 Vulnerability Appert Chapelon
http://slidepdf.com/reader/full/vulnerability-appert-chapelon 5/23
1.2 Road network vertex vulnerability index
This index is based on the same principle as the index measuring arc vulnerability.
The purpose of this index is to evaluate the loss of overall accessibility resulting from
the removal of each vertex and to hierarchise the vertices according to their strategic
importance in the network. Accessibility is calculated in the same way as for the link
vulnerability index, based on the shortest paths available on the network. There are
some differences, however. Firstly, the removal of a vertex only requires calculating
the shortest paths between the other vertices in the graph, even for the referencevalue calculation. The comparison of accessibility values between complete and
8/10/2019 Vulnerability Appert Chapelon
http://slidepdf.com/reader/full/vulnerability-appert-chapelon 6/23
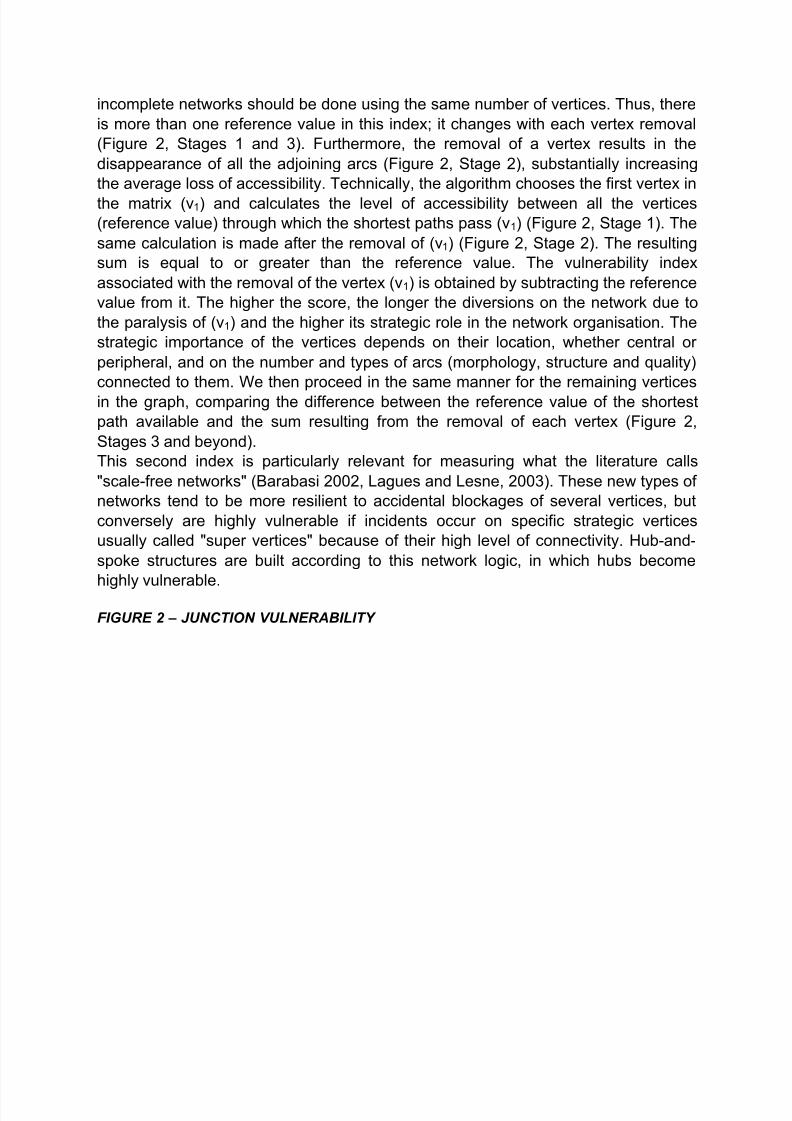
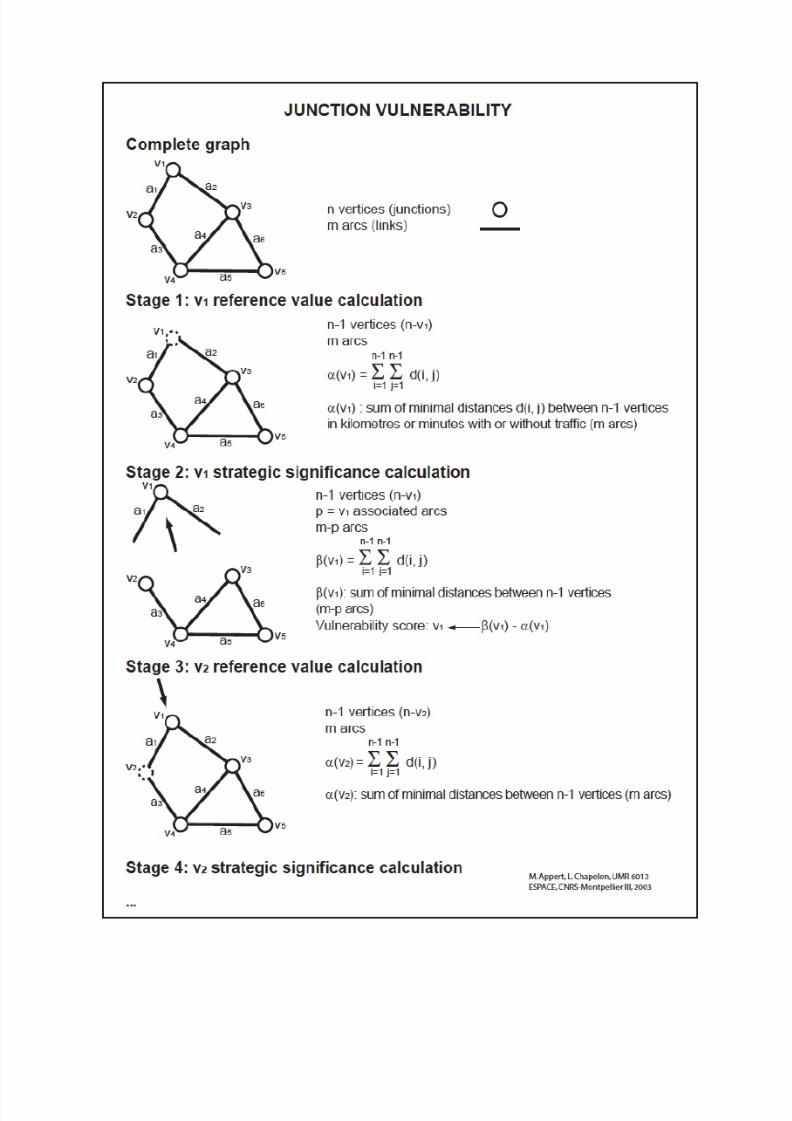
incomplete networks should be done using the same number of vertices. Thus, there
is more than one reference value in this index; it changes with each vertex removal
(Figure 2, Stages 1 and 3). Furthermore, the removal of a vertex results in the
disappearance of all the adjoining arcs (Figure 2, Stage 2), substantially increasing
the average loss of accessibility. Technically, the algorithm chooses the first vertex in
the matrix (v1) and calculates the level of accessibility between all the vertices
(reference value) through which the shortest paths pass (v1) (Figure 2, Stage 1). The
same calculation is made after the removal of (v1) (Figure 2, Stage 2). The resulting
sum is equal to or greater than the reference value. The vulnerability index
associated with the removal of the vertex (v1) is obtained by subtracting the reference
value from it. The higher the score, the longer the diversions on the network due to
the paralysis of (v1) and the higher its strategic role in the network organisation. The
strategic importance of the vertices depends on their location, whether central or
peripheral, and on the number and types of arcs (morphology, structure and quality)
connected to them. We then proceed in the same manner for the remaining vertices
in the graph, comparing the difference between the reference value of the shortest
path available and the sum resulting from the removal of each vertex (Figure 2,
Stages 3 and beyond).
This second index is particularly relevant for measuring what the literature calls
"scale-free networks" (Barabasi 2002, Lagues and Lesne, 2003). These new types of
networks tend to be more resilient to accidental blockages of several vertices, but
conversely are highly vulnerable if incidents occur on specific strategic vertices
usually called "super vertices" because of their high level of connectivity. Hub-and-
spoke structures are built according to this network logic, in which hubs become
highly vulnerable.
FIGURE 2 – JUNCTION VULNERABILITY
8/10/2019 Vulnerability Appert Chapelon
http://slidepdf.com/reader/full/vulnerability-appert-chapelon 7/23
8/10/2019 Vulnerability Appert Chapelon
http://slidepdf.com/reader/full/vulnerability-appert-chapelon 8/23
The following simulations are based on link vulnerability. Further work is required to
model vertex vulnerability. Research on this issue is under way at Montpellier
University.
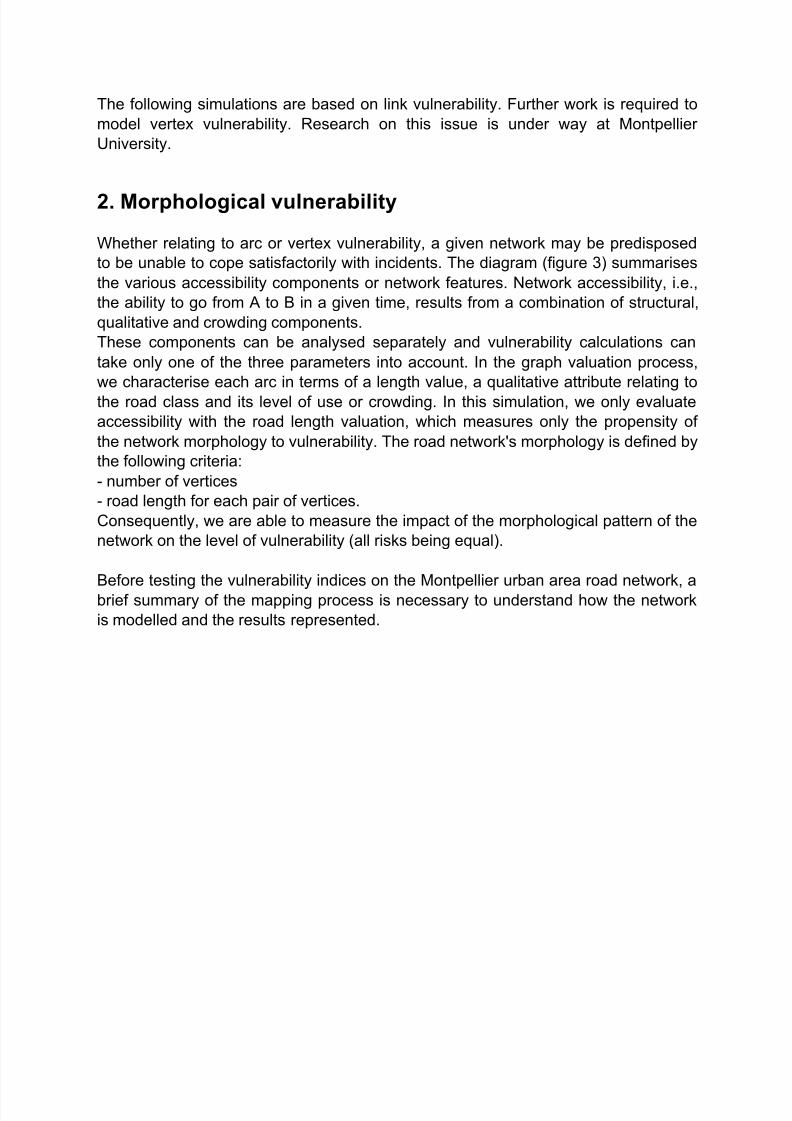
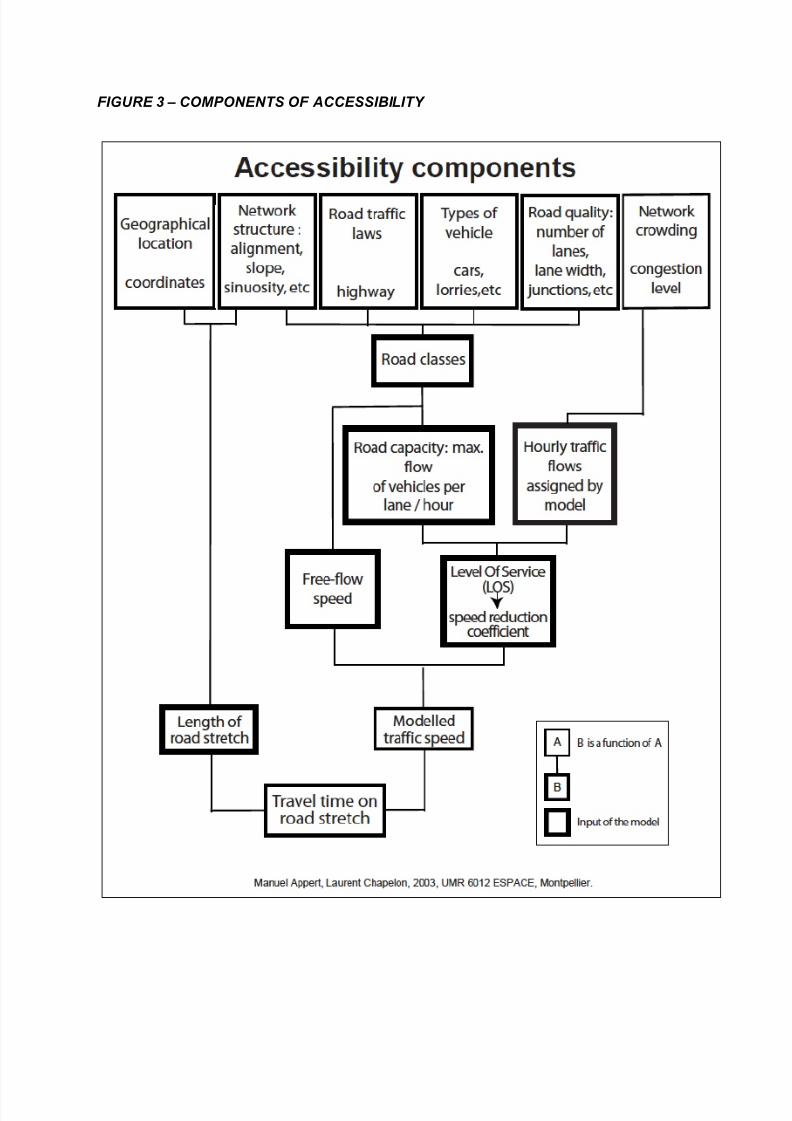
2. Morphological vulnerability
Whether relating to arc or vertex vulnerability, a given network may be predisposed
to be unable to cope satisfactorily with incidents. The diagram (figure 3) summarises
the various accessibility components or network features. Network accessibility, i.e.,
the ability to go from A to B in a given time, results from a combination of structural,
qualitative and crowding components.
These components can be analysed separately and vulnerability calculations can
take only one of the three parameters into account. In the graph valuation process,
we characterise each arc in terms of a length value, a qualitative attribute relating to
the road class and its level of use or crowding. In this simulation, we only evaluate
accessibility with the road length valuation, which measures only the propensity of
the network morphology to vulnerability. The road network's morphology is defined by
the following criteria:
- number of vertices
- road length for each pair of vertices.
Consequently, we are able to measure the impact of the morphological pattern of the
network on the level of vulnerability (all risks being equal).
Before testing the vulnerability indices on the Montpellier urban area road network, a
brief summary of the mapping process is necessary to understand how the network
is modelled and the results represented.
8/10/2019 Vulnerability Appert Chapelon
http://slidepdf.com/reader/full/vulnerability-appert-chapelon 9/23
FIGURE 3 – COMPONENTS OF ACCESSIBILITY

8/10/2019 Vulnerability Appert Chapelon
http://slidepdf.com/reader/full/vulnerability-appert-chapelon 10/23
2.1. Mapping vulnerability indices
2.1.1. Graph construction methodology
The graph construction is an important stage in the modelling process because of its
potential influence on the results.
There are three main concerns:
- Sticking to the strategic road hierarchy to reflect the local road classification
strategy, covering the entire built-up area and distinguishing as accurately as
possible between the various types of roads in order to obtain results that are not
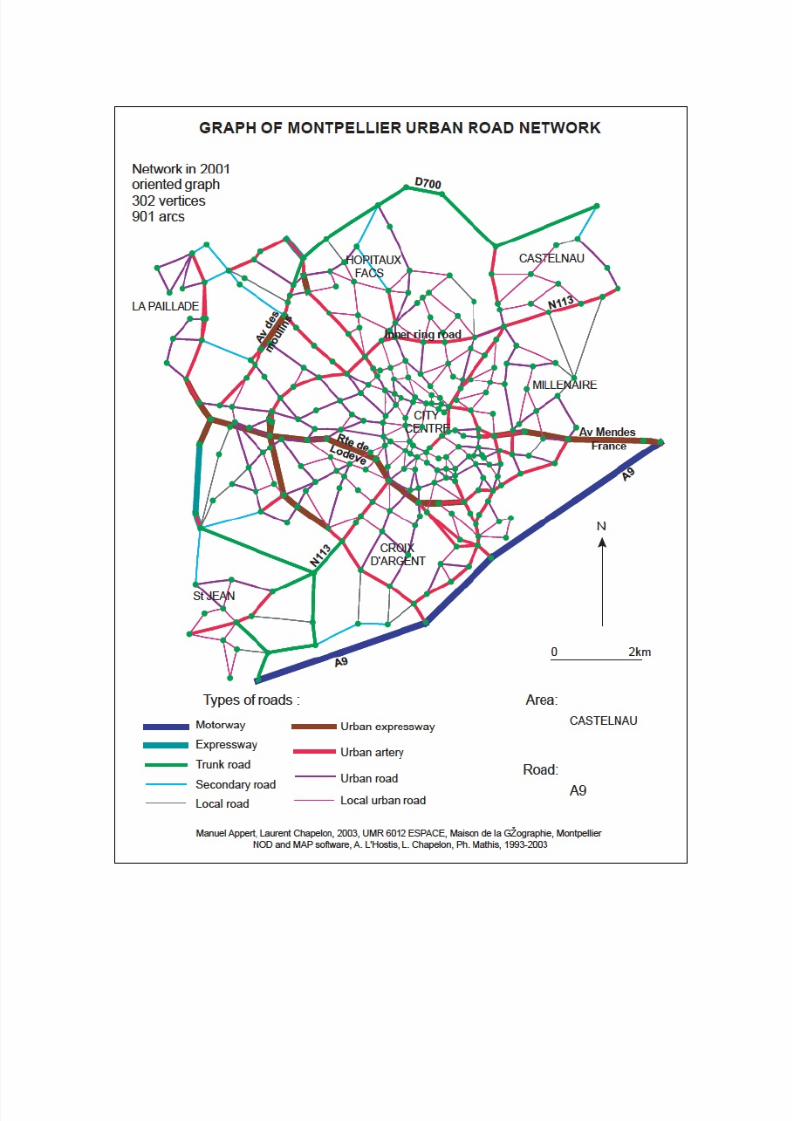
biased by poor road classification. The resulting graph consists of 302 vertices and
901 arcs (Figure 4).
- In the selection process, the choice of one vertex over another is extremelyimportant. The selection criteria are that the vertices must model all main crossroads
(major road intersections) and the junctions where roads change from one type to
another. To reduce possible bias, demographic and socio-economic criteria were not
used.
- Junction modelling must consider restrictions at some crossroads or interchanges
where movement is not allowed in all directions (e.g., restricted access interchanges,
no right/left turn, etc.).
The Montpellier road network model covers the built-up area of the conurbation. Theselected area is more homogeneous than, say, the metropolitan region, since
population and network density are high almost everywhere. Therefore, results
should not be biased by heterogeneity.
The arcs show direction because of our meso-scale approach, which means that
one-way streets must be included in traffic movement models.
FIGURE 4 - GRAPH OF MONTPELLIER ROAD NETWORK
8/10/2019 Vulnerability Appert Chapelon
http://slidepdf.com/reader/full/vulnerability-appert-chapelon 11/23
8/10/2019 Vulnerability Appert Chapelon
http://slidepdf.com/reader/full/vulnerability-appert-chapelon 12/23
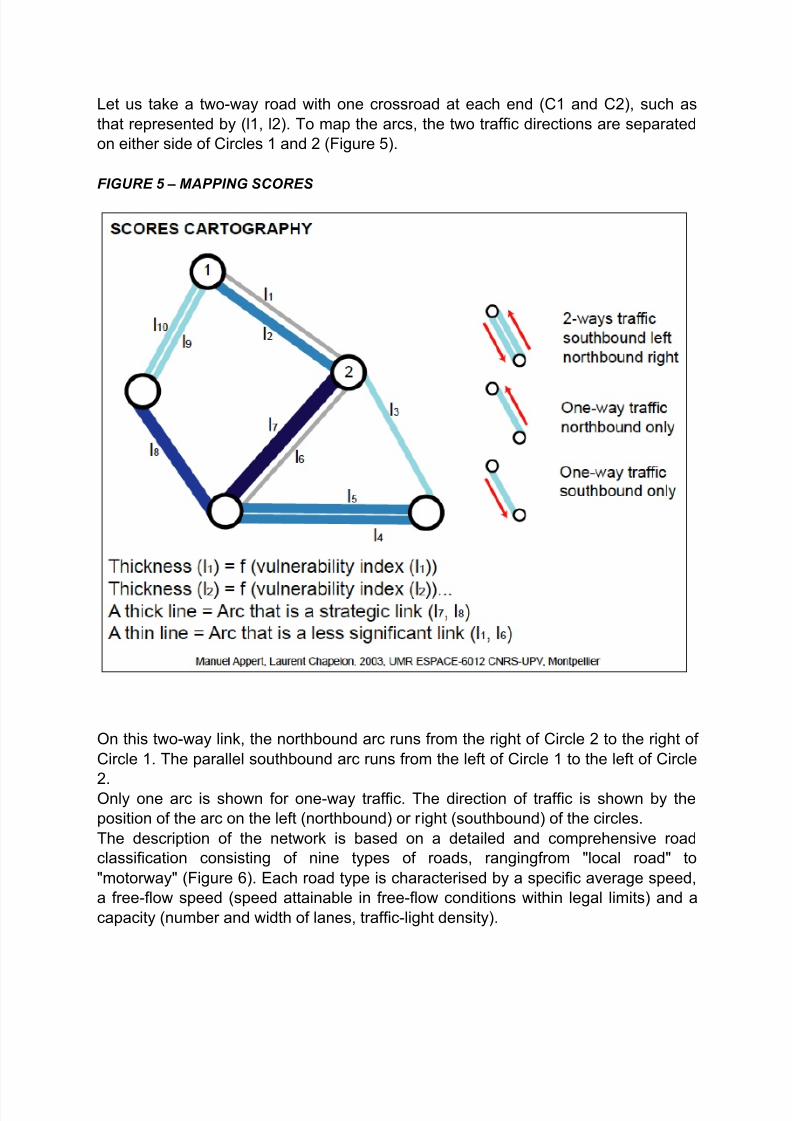
Let us take a two-way road with one crossroad at each end (C1 and C2), such as
that represented by (l1, l2). To map the arcs, the two traffic directions are separated
on either side of Circles 1 and 2 (Figure 5).
FIGURE 5 – MAPPING SCORES
On this two-way link, the northbound arc runs from the right of Circle 2 to the right of
Circle 1. The parallel southbound arc runs from the left of Circle 1 to the left of Circle
2.Only one arc is shown for one-way traffic. The direction of traffic is shown by the
position of the arc on the left (northbound) or right (southbound) of the circles.
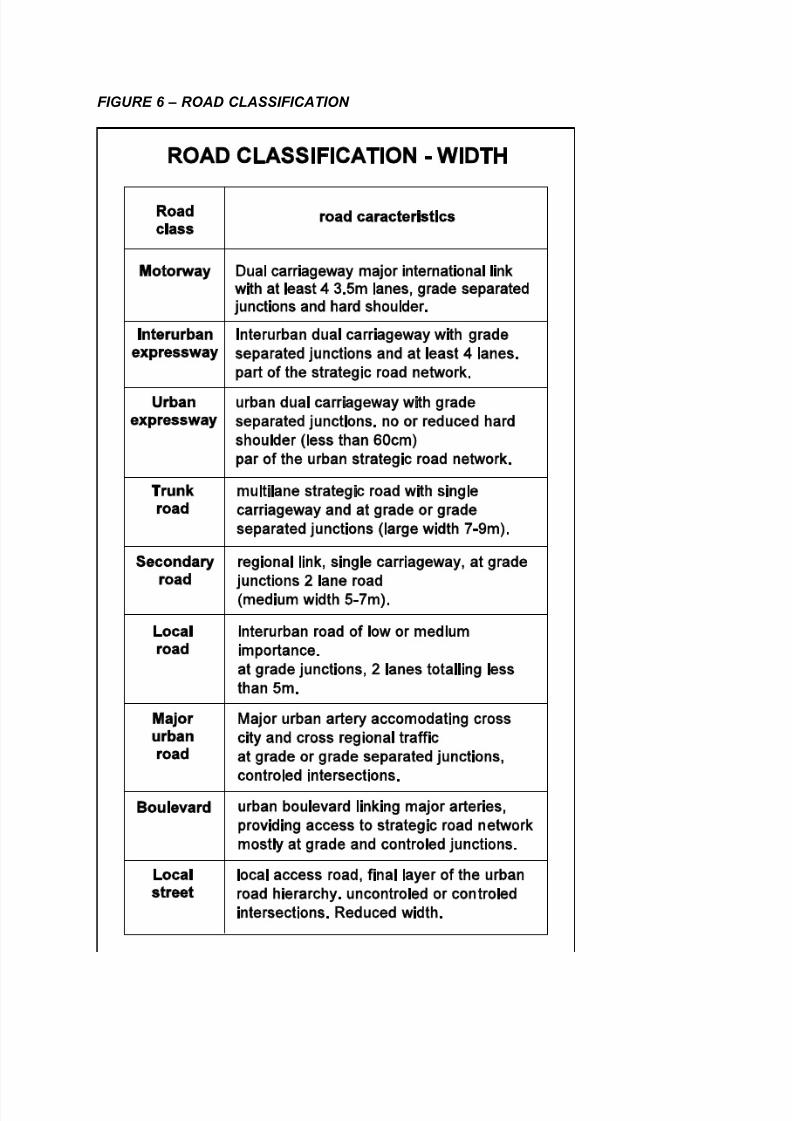
The description of the network is based on a detailed and comprehensive road
classification consisting of nine types of roads, rangingfrom "local road" to
"motorway" (Figure 6). Each road type is characterised by a specific average speed,
a free-flow speed (speed attainable in free-flow conditions within legal limits) and a
capacity (number and width of lanes, traffic-light density).
8/10/2019 Vulnerability Appert Chapelon
http://slidepdf.com/reader/full/vulnerability-appert-chapelon 13/23
FIGURE 6 – ROAD CLASSIFICATION
8/10/2019 Vulnerability Appert Chapelon
http://slidepdf.com/reader/full/vulnerability-appert-chapelon 14/23
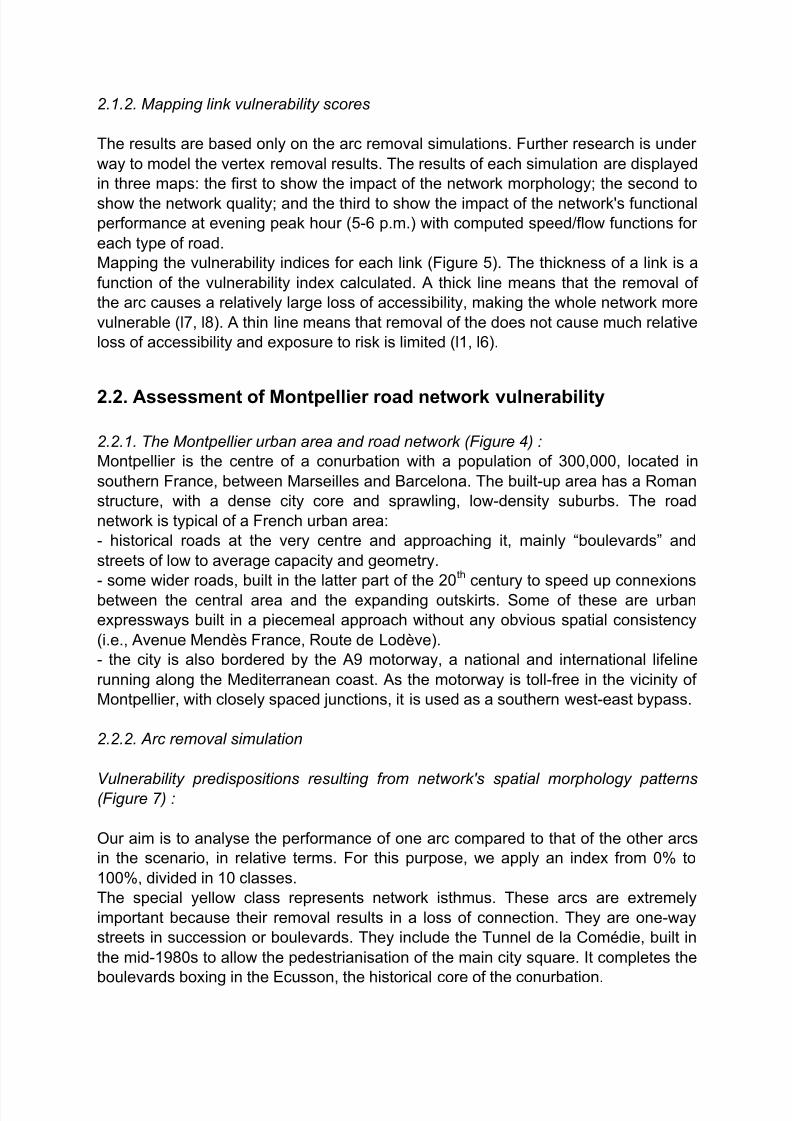
2.1.2. Mapping link vulnerability scores
The results are based only on the arc removal simulations. Further research is under
way to model the vertex removal results. The results of each simulation are displayed
in three maps: the first to show the impact of the network morphology; the second to
show the network quality; and the third to show the impact of the network's functional
performance at evening peak hour (5-6 p.m.) with computed speed/flow functions for
each type of road.
Mapping the vulnerability indices for each link (Figure 5). The thickness of a link is a
function of the vulnerability index calculated. A thick line means that the removal of
the arc causes a relatively large loss of accessibility, making the whole network more
vulnerable (l7, l8). A thin line means that removal of the does not cause much relative
loss of accessibility and exposure to risk is limited (l1, l6).
2.2. Assessment of Montpellier road network vulnerability
2.2.1. The Montpellier urban area and road network (Figure 4) :
Montpellier is the centre of a conurbation with a population of 300,000, located in
southern France, between Marseilles and Barcelona. The built-up area has a Roman
structure, with a dense city core and sprawling, low-density suburbs. The road
network is typical of a French urban area:
- historical roads at the very centre and approaching it, mainly “boulevards” and
streets of low to average capacity and geometry.
- some wider roads, built in the latter part of the 20th century to speed up connexions
between the central area and the expanding outskirts. Some of these are urban
expressways built in a piecemeal approach without any obvious spatial consistency
(i.e., Avenue Mendès France, Route de Lodève).
- the city is also bordered by the A9 motorway, a national and international lifeline
running along the Mediterranean coast. As the motorway is toll-free in the vicinity of
Montpellier, with closely spaced junctions, it is used as a southern west-east bypass.
2.2.2. Arc removal simulation
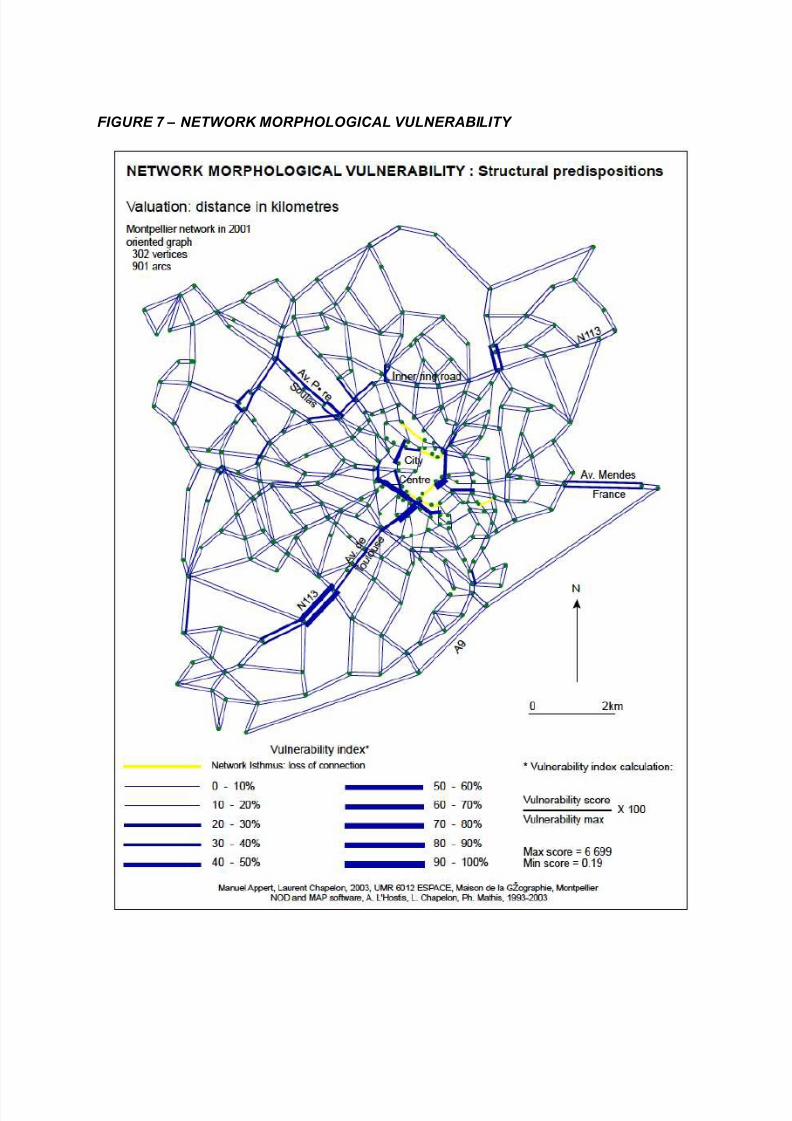
Vulnerability predispositions resulting from network's spatial morphology patterns(Figure 7) :
Our aim is to analyse the performance of one arc compared to that of the other arcs
in the scenario, in relative terms. For this purpose, we apply an index from 0% to
100%, divided in 10 classes.
The special yellow class represents network isthmus. These arcs are extremely
important because their removal results in a loss of connection. They are one-way
streets in succession or boulevards. They include the Tunnel de la Comédie, built in
the mid-1980s to allow the pedestrianisation of the main city square. It completes the
boulevards boxing in the Ecusson, the historical core of the conurbation.
8/10/2019 Vulnerability Appert Chapelon
http://slidepdf.com/reader/full/vulnerability-appert-chapelon 15/23
FIGURE 7 – NETWORK MORPHOLOGICAL VULNERABILITY

8/10/2019 Vulnerability Appert Chapelon
http://slidepdf.com/reader/full/vulnerability-appert-chapelon 16/23
The most striking feature is the “natural” predispositions of the city centre. One
observes that there are only a few alternatives to the N113, which explains its
strategic role, whereas in the centre there are plenty of alternative routes, but these
have the highest scores (note, however, the absence of nodes in the very city
centre).
The pattern of the routes is clearly radial, converging towards the centre and
encircling it with the boulevards. Some cross-routes are obvious, such as those using
the inner ring road. The radial network pattern is clearly visible with a convergent
series of radials to andfrom the city centre and an inner ring road connecting them.
This translates into a mainly central and radial vulnerability.
3. Network quality vulnerability
Whether relating to arc or vertex vulnerability, a given network may be predisposed
to be unable to cope satisfactorily with incidents as we have seen in Section 2. Those
components can be analysed separately and vulnerability calculations can take only
one parameter into account. In the graph valuation process, we characterise each
arc in terms of a length value, a qualitative attribute relating to the road class and its
level of use or crowding. In this second case, we evaluate accessibility by adding the
free-flow speed valuation, which is the maximum attainable speed given legal limits
and road characteristics. We thus measure the propensity of the network quality to
vulnerability and the impact of a typical circum-radial hierarchised network structure.
We define the network's quality by:
- the number of vertices, and
- the free-flow speed on links between pairs of vertices (Figure 6).
Consequently, we are able to measure the impact of the road classification (road
hierarchy) on the level of vulnerability (all risks being equal).
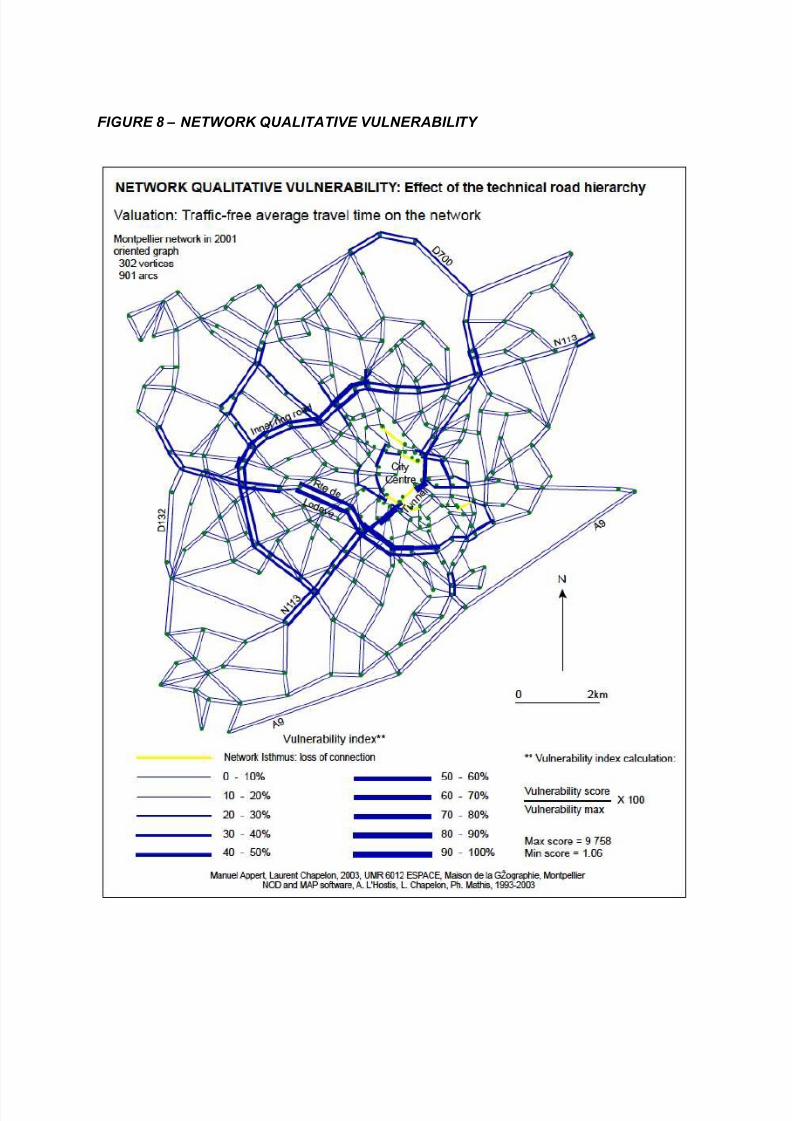
The introduction of new roads at the top of the hierarchy has resulted in an increased
concentration of vulnerability on a few links (Figure 8):
The vulnerability pattern has changed from a radial to a circum-radial structure. Ring
roads are now well established (the inner ring road, the D700 and Route de Lodève,but not the A9 motorway because of its remoteness).
Vulnerability is dual. On the one hand, network is potentially exposed to severe
paralysis, but on the other hand, this reflects past transport policies that sought to
segregate and hierarchise traffic flow on suitable roads and prevent routes from
concentrating in the centre of town.
8/10/2019 Vulnerability Appert Chapelon
http://slidepdf.com/reader/full/vulnerability-appert-chapelon 17/23
FIGURE 8 – NETWORK QUALITATIVE VULNERABILITY
8/10/2019 Vulnerability Appert Chapelon
http://slidepdf.com/reader/full/vulnerability-appert-chapelon 18/23
4. Network functional vulnerability
Whether relating to arc or vertex vulnerability, a given network may be predisposed
to be unable to cope satisfactorily with incidents as we have seen in Section 2. These
components can be analysed separately and vulnerability calculations can take only
one parameter into account. In the graph valuation process, we characterise each
arc with a length value, a qualitative attribute relating to the road class and its level of
use or crowding. In this third case, we evaluate accessibility by adding the rush-hour
speed valuation, which is the maximum attainable speed given legal limits, road
characteristics and the level of crowding on the network. We thus measure the
propensity of network crowding to vulnerability. We define the network's level of
crowding by the following inputs:
- the number of vertices, and
- the rush-hour flow speed on links connecting pairs of vertices.
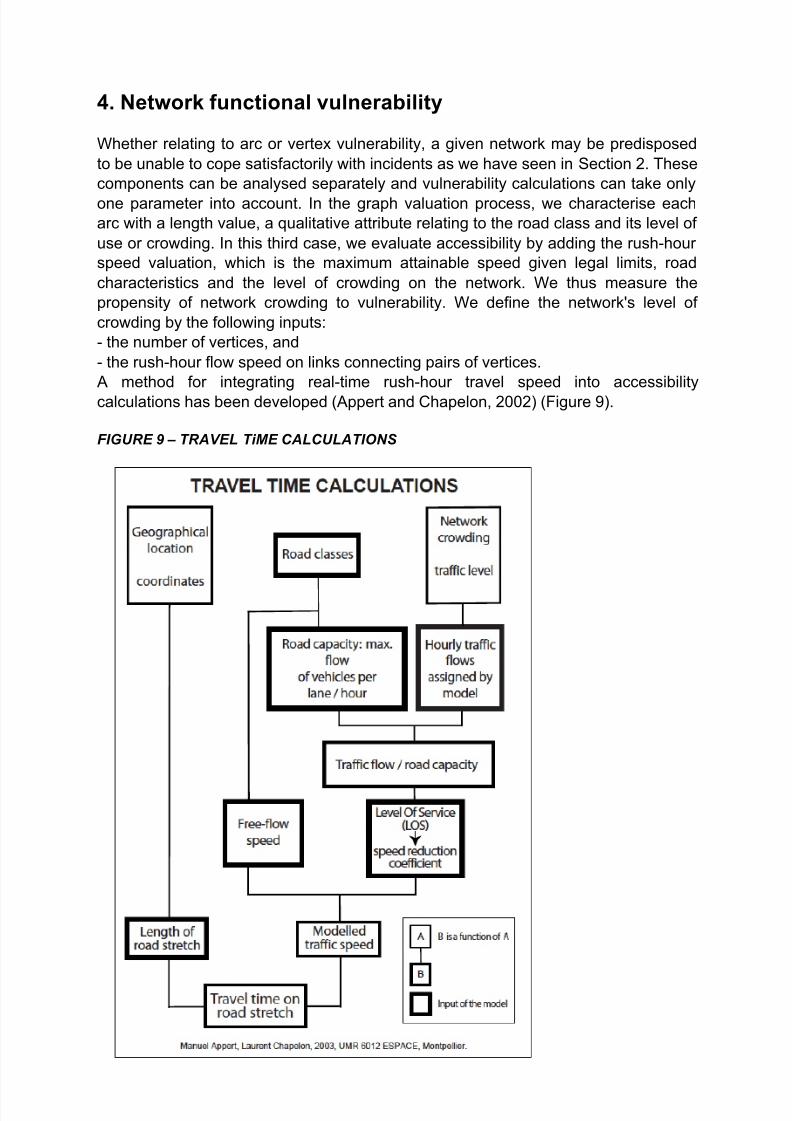
A method for integrating real-time rush-hour travel speed into accessibility
calculations has been developed (Appert and Chapelon, 2002) (Figure 9).
FIGURE 9 – TRAVEL TiME CALCULATIONS
8/10/2019 Vulnerability Appert Chapelon
http://slidepdf.com/reader/full/vulnerability-appert-chapelon 19/23
This simulation requires congestion modelling in order to obtain specific travel
speeds for each link of the network for the given time period. We have chosen
evening rush-hour speeds (5-6 p.m.) to model maximum crowding conditions on the
network. There are several ways to model congestion, depending on whether we
consider it as coming from the links or the junctions (e.g., traffic-light capacity). For
this meso-scale approach, microscopic congestion modelling was inappropriate, too
time-consuming and produces results that are not significantly more accurate than
more traditional link modelling (HCM, Cohen). Figure 9 summarises the steps of the
modelling process. For each link (arc in the graph), we have computed:
- a maximum speed (max. speed)
- a given capacity (functions of the road characteristics –capacity and max.
speed)
- and the assigned hourly flows between 5 and6 p.m. (modelled by
emme/2).
For each type of road (road class), a speed-flow function applies, enabling us to
calculate the effective travel speed on the links.
One might postulate that in a congestion simulation, modelled hourly traffic flow
(given by emme/2 traffic model) should be reassigned for each removal or iteration.
While some reroutings can occur under certain conditions, in our case, traffic
blockages are of an accidental nature and therefore cannot be anticipated.
Consequently, we are able to measure the impact of the road classification (road
hierarchy) on the level of vulnerability (all risks being equal) and use, in other words,
how the importance of highways and new high-speed roads can influence exposure
to risk.
How congestion tends to destabilise the whole system by reducing concentration on
the main links (Figure 10) :
Note that the maximum value is almost twice as high in absolute terms as in the
previous scenario. This can be explained by greater differences in travel speeds
because congestion does not affect links in the same way. As for the calculation
process, the difference in relation to the reference value is greater because of
degraded traffic conditions on the alternative routes.
The hierarchy appears to be undermined by congestion. Vulnerability is more
widespread, main roads don’t know longer seem able to cope and routes are beingdiverted to less suitable roads. This can result in greater “rat-running” on the
secondary network, which is not suitable for today’s high flows of traffic.
The A9 motorway, far from being saturated, is playing a bigger part in conducting
east-west cross routes.

8/10/2019 Vulnerability Appert Chapelon
http://slidepdf.com/reader/full/vulnerability-appert-chapelon 20/23
FIGURE 10 – NETWORK FUNCTIONAL VULNERABILITY
8/10/2019 Vulnerability Appert Chapelon
http://slidepdf.com/reader/full/vulnerability-appert-chapelon 21/23
Conclusion
Road networks play a specific role in the urban system. As a circulatory component,
they provide spatial access to every single part of the city. Road users benefit from
an almost continuous service thanks to an overlapping road network. This convenient
network organisation is partly responsible for increasing exposure of interconnected
roads to gridlock. When the urban road network was more homogeneous and less
polarised, this exposure was less acute because travel routes were more spatially
diffused. However, the addition of highways at the top of the road hierarchy has
resulted in increased polarisation and concentration of traffic on some links and at
key junctions.
With increasing traffic flows and innovations in the road construction industry, many
cities and towns have chosen to build wider, faster roads that are either radial or
orbital. This kind of infrastructure now overlaps the existing hierarchy, segregating
through and local traffic, and finally forming the urban trunk road network. Should an
incident occur on the main carriageways, the whole system collapses, with increased
rat-running in less suitable areas causing concerns about safety, pollution and the
quality of life. Consequently, the entire urban road network seems vulnerable by
exposing parts of the city to decreases in accessibility.
Network vulnerability is materialised on the two distinctive factors in a network, i.e.,
the vertices and the arcs. The degree of vulnerability also depends on three network
factors: morphology, structure and performance.
We have determined that a network is vulnerable to varying degrees according to the
level of hierachisation of its links and junctions, which leads to a concentration of
routes. Surprisingly, the latest road additions have tended to increase polarisation
and therefore vulnerability. The pattern of vulnerability has changed as a result, with
the city centre tending to be relieved, whereas the outskirts bear the brunt of
exposure. At rush hour, the deterioration of travel speeds on the major links results in
less route polarisation, leading to widespread vulnerability. As traffic cannot simply
disappear after the occurrence of an incident, rat-running increases sharply, resulting
in high volumes of traffic on unsuitable roads.
The road network vulnerability indices that we have developed can be used by
planners and road agencies to evaluate exposure to risk and to address the source
of this exposure, whether it comes from the network's morphology, quality or level of
use. The indices also highlight the growing importance of geographical research onthe risks to which cities are exposed. In our networked, just-in-time urban lives, road
travel-time reliability is extremely important and the authorities must recognise the
need to manage networks to reduce exposure to gridlock resulting from incidents as
much as possible. These simulations can help develop better signalling systems or
improve network organisation.
8/10/2019 Vulnerability Appert Chapelon
http://slidepdf.com/reader/full/vulnerability-appert-chapelon 22/23
Acknowledgements
We would like to thank the local road agency (CETE Méditerranée, Montpellier) for
providing us with modelled rush-hour (5-6 p.m.) traffic flows on the Montpellier road
network.
References
Appert M., Chapelon L., 2003, "Variabilité de la performance des réseaux routiers :
application à la région urbaine de Londres", in: MATHIS Ph. (Ed), Graphes et
réseaux: modélisation multiniveau. Paris: Hermès. 49-76.
Barabasi A-L., 2002, Linked: The New Science of Networks, Perseus Publishing.
Beom J.K., Chang No Y., Holme P., Seung Kee H., 2002, "Attack vulnerability of
complex networks". Working paper.
Berdica K., 2002, "An introduction to road vulnerability : what has been done, is done
and should be done". Transport Policy 9(2), 117-127.
Bell M.G.H., Lida Y., 1997, "Network reliability", in: Transportation Network Analysis,
Wiley&Sons, Chichester pp.179-192.
CERTU, 1990, Les études de prévision de trafic en milieu urbain : guide technique .
Lyon: CERTU.
Cohen S., 1990, Ingénierie du trafic routier . Paris: Presses de l’ENPC.
Gleyze J. F., "Les dommages induits par les coupures du reseau routier",
Conference paper at Colloque Risque d’accidents et risques environnementaux dans
les transports routiers - October 2001, 15p.
Gleyze J. F., 2003, "Fonctionnalité du réseau de métro parisien", Conference paperat 6èmes rencontres Théoquant, 20-21 February 2003, Besançon.
Goodwin P.B., 1992, "A quality margin in transport", in: Traffic Engineering and
Control , 33 (12), p. 661-665.
Lagues M., Lesne A ; 2003, Invariances d’échelle : des changements d’états à la
turbulence, Editions Belin.
Lida Y., 1999, "Basic concepts and future directions of road network reliability
analysis", in : Journal of Advanced Transportation, vol. 33, No2, 125-134.
8/10/2019 Vulnerability Appert Chapelon
http://slidepdf.com/reader/full/vulnerability-appert-chapelon 23/23
Miller H.J., Shaw S.L., 2001, "Transportation, Environment and Hazards" in:
Geographic Information Systems for Transportation, Oxford: Oxford University Press.
341-379.
Taylor M.A.P., 1999, "Dense network traffic models, travel time reliability and traffic
management. I: General introduction". Journal of Advanced Transportation, vol. 33,
No2, 218-233.
Taylor M.A.P., 1999, "Dense network traffic models, travel time reliability and traffic
management. II: application to network reliability". Journal of Advanced
Transportation, vol. 33, No2, 235-251.
Transport Research Board, 1998, Highway Capacity Manual . Washington: TRB.
List of FiguresFigure 1: Link vulnerability
Figure 2: Junction vulnerability
Figure 3: Components of accessibility
Figure 4: Graph of Montpellier road network
Figure 5: Mapping scores
Figure 6: Road classification
Figure 7: Network morphological vulnerability
Figure 8: Network qualitative vulnerability
Figure 9: Travel time calculations
Figure 10: Network functional vulnerability