Embed Size (px)
Citation preview

WORK ING PAPER SER I E SNO 1378 / S EPTEMBER 2011
by Gábor Kézdiand István Kónya
WAGE SETTINGIN HUNGARY
EVIDENCE FROMA FIRM SURVEY
WAGE DYNAMICS
NETWORK
WAGE DYNAMICS
NETWORK
1 Central European University, Nador u. 9, 1051 Budapest, Hungary; e-mail: [email protected]; IEHAS and Magyar Nemzeti Bank.
2 Magyar Nemzeti Bank, 1054 Szabadság tér 8/9, 1850 Budapest; e-mail: [email protected]; and Central European University.
This paper can be downloaded without charge from http://www.ecb.europa.eu or from the Social Science Research Network electronic library at http://ssrn.com/abstract_id=1920694.
NOTE: This Working Paper should not be reported as representing the views of the European Central Bank (ECB). The views expressed are those of the authors
and do not necessarily reflect those of the ECB.
WORK ING PAPER SER I E SNO 1378 / SEPTEMBER 2011
WAGE SETTING IN HUNGARY
EVIDENCE FROM A FIRM SURVEY
by Gábor Kézdi 1 and István Kónya 2
In 2011 all ECBpublications
feature a motiftaken from
the €100 banknote.
Wage Dynamics Network
This paper contains research conducted within the Wage Dynamics Network (WDN). The WDN is a research network consisting of economists from the European Central Bank (ECB) and the national central banks (NCBs) of the EU countries. The WDN aims at studying in depth the features and sources of wage and labour cost dynamics and their implications for monetary policy. The specific objectives of the network are: i) identifying the sources and features of wage and labour cost dynamics that are most relevant for monetary policy and ii) clarifying the relationship between wages, labour costs and prices both at the firm and macro-economic level.
The refereeing process of this paper has been co-ordinated by a team composed of Gabriel Fagan (ECB,
Bihan (Banque de France) and Thomas Mathä (Banque centrale du Luxembourg).
form, to encourage comments and suggestions prior to final publication. The views expressed in the paper are the author’s own and do not necessarily reflect those of the ESCB.
The paper is released in order to make the results of WDN research generally available, in preliminary
The WDN is chaired by Frank Smets (ECB). Giuseppe Bertola (Università di Torino) and Julián Messina
chairperson), Philip Vermeulen (ECB), Giuseppe Bertola, Julián Messina, Jan Babecký (CNB), Hervé Le
(World Bank and University of Girona) act as external consultants and Ana Lamo (ECB) as Secretary.
© European Central Bank, 2011
AddressKaiserstrasse 2960311 Frankfurt am Main, Germany
Postal addressPostfach 16 03 1960066 Frankfurt am Main, Germany
Telephone+49 69 1344 0
Internethttp://www.ecb.europa.eu
Fax+49 69 1344 6000
All rights reserved.
Any reproduction, publication and reprint in the form of a different publication, whether printed or produced electronically, in whole or in part, is permitted only with the explicit written authorisation of the ECB or the authors.
Information on all of the papers published in the ECB Working Paper Series can be found on the ECB’s website, http://www.ecb.europa.eu/pub/scientific/wps/date/html/index.en.html
ISSN 1725-2806 (online)
3ECB
Working Paper Series No 1378September 2011
Abstract 4
Non-technical summary 5
1 Introduction 7
2 The WDN wage setting survey 8
2.1 General survey design 8
2.2 The Hungarian questionnaire 10
2.3 The Hungarian sample 11
3 Results 12
3.1 Worker turnover 12
3.2 Wage setting 15
3.3 Wage adjustment 16
3.4 Adjustment to external shocks 18
3.5 The minimum wage 20
3.6 Prices and wages 22
4 Economic interpretations 22
5 Summary and conclusions 25
References 26
Appendices 28
Tables and fi gures 43
CONTENTS
4ECBWorking Paper Series No 1378September 2011
Abstract This paper presents new evidence on the flexibility of the Hungarian labor market, with special emphasis on wages.
The results are based on a new survey on wage setting among Hungarian firms. The survey is part of the Eurosystem
Wage Dynamics Network (WDN), and it is a harmonized questionnaire administered in 17 countries in Europe,
including almost all Euro Area countries as well as five Central and Eastern European countries. The survey results
show that the Hungarian labor market, while institutionally flexible, appears to be surprisingly rigid. The survey
evidence points to low turnover and possibly more rigid wages than previously thought.
JEL: C83, J01, J30
Keywords: Wage setting, survey, wage dynamics network, Hungary
5ECB
Working Paper Series No 1378September 2011
Non-technical summary This paper presents new evidence on the flexibility of the Hungarian labor market, with special emphasis on
wages. The results are based on a new survey on wage setting among Hungarian firms. The survey is part of
the Eurosystem Wage Dynamics Network (WDN), coordinated by the European Central Bank (ECB). It is a
harmonized questionnaire administered in 17 countries in Europe, including almost all Euro Area countries
as well as five Central and Eastern European countries. Here we focus on the Hungarian results and use the
results from the other countries to put the Hungarian findings in context. For a general overview of the
WDN survey, see Babeczky et. al. (2008), Bertola et. al. (2008), Druant et. al. (2008) and Nicolitsas et. al.
(2008).
Our paper identifies facts of wage determination in Hungarian firms. Whenever possible, we present the
Hungarian results together with average results from the other Central and Eastern European (CEE)
countries (the Czech Republic, Estonia, Lithuania and Poland) as well as the Euro Area (EA) countries. We
also present the most important findings by sector and firm size. After establishing the facts, we make
sense of them in the light of theories of wage setting. We also draw some tentative policy conclusions.
Our most important findings are the following.
1. Worker turnover in Hungary is low, especially among small and medium sized enterprises. In that
respect, Hungary stands out from the analyzed CEE countries.
2. Hungarian firms do not face formal institutional constraints in wage setting, with the important
exception of the minimum wage.
3. Despite this fact, wages appear rigid, particularly base wages. They are reset on average once a
year at most, in a time-dependent fashion. In terms of frequency, Hungary is similar to the EA and
other CEE countries, although wage setting in the other CEE countries is less time-dependent.
4. Wages are irresponsive to temporary shocks. Firms are accommodating these shocks by cutting
other costs, and to a lesser degree, changing prices, margins and output.
5. It is unclear whether flexible wage components are used to absorb external shocks. The survey
answers are contradictory in this respect, and call for further investigation.
6. By 2006 the minimum wage is a binding constraint for firms. A 20% minimum wage increase would
not induce massive layoffs, but it would spill over to other workers, and lead to an additional 2%
increase in average wages.
7. The frequencies of wage and price setting are not synchronized, at least not by explicit
mechanisms.
8. Overall, in terms of its formal institutions, the Hungarian labor market is flexible, similarly to other
CEE countries. In terms of outcomes, however, it is more similar to the more rigid Euro Area
countries.
6ECBWorking Paper Series No 1378September 2011
We can draw a few tentative policy conclusions from these facts. First, lower levels of real flexibility of the
Hungarian small and medium size enterprises have direct consequences for efficient allocation of resources
and economic growth. We can only guess the reasons behind lower flexibility, but high taxes and welfare
benefits are likely to play an important role. Therefore the reduction of taxes and reforming the benefit
system is important in order to increase labor market flexibility as well.
Second, the fact that Hungarian firms use non-labor costs to adjust for adverse shocks has important
implications for monetary policy. We speculated that firms may use investment or capital utilization for
adjustment. Since investment is sensitive to changes in monetary conditions, monetary policy may have a
bigger impact on firm behavior than previously thought. An important caveat, however, is that the role of
flexible wage components is unclear from the contradictory answers to different sets of questions.
Downward nominal wage rigidity is also important for monetary policy. While DNWR was not binding for
Hungarian firms in the sample period, it is clearly present in the wage setting decision. Thus as productivity
growth slows down and inflation declines, DNWR may become an important constraint for nominal wage
adjustment at least for some firms and employees. The aggregate implications of this are not clear, and
merit further research.
Some of these results are new, others are in line with previous findings, and yet others are at odds with
those. Previous research suggests that wages in Hungary are rather flexible in European comparison, and
labor institutions are also relatively flexible, with the potential exception of the effect of the minimum
wage. On the other hand, other aspects of the Hungarian labor market may show significantly less
flexibility. For important references, see Kőrösi (2003), Kertesi and Köllő (2003), Horváth and Szalai (2007),
Kátay (2007), Kőrösi (2007), Nacsa and Köllő (2007), Commander and Köllő (2008). Our findings are based
on descriptive evidence from one survey. Most of our results thus pose questions rather than giving
definite answers. In particular, the results that conflict with previous findings call for further investigations.
7ECB
Working Paper Series No 1378September 2011
1. Introduction
The functioning of the labor market is central to the macroeconomic performance of a country. Labor
market flexibility allows economies to adjust to temporary shocks and permanent changes. Thus it is a key
question whether labor markets in particular countries are indeed flexible, and if not, what are the main
constraints that prevent adjustment.
Labor market adjustment can occur through changes in employment, hours, and wages. In different
countries, any of these can be subject to rigidities, due to unionization, government intervention, and even
to optimal human resource management at the firm level. While the flexibility in employment and hours
are primarily important to determine long-run unemployment, the behavior of wages also influences
inflation dynamics. Empirical evidence on labor market flexibility in general, and on wage flexibility in
particular, is thus crucial to economic policy making.
This paper presents new evidence on the flexibility of the Hungarian labor market, with special emphasis on
wages. The results are based on a new survey on wage setting among Hungarian firms. The survey is part of
the Eurosystem Wage Dynamics Network (WDN). It is a harmonized questionnaire administered in 17
countries in Europe, including almost all Euro Area countries as well as five Central and Eastern European
countries. Here we mainly focus on the Hungarian results and use the results from the other countries to
put the Hungarian findings in context. For a general overview of the WDN survey, see Babeczky et. al.
(2008), Bertola et. al. (2008), Druant et. al. (2008) and Nicolitsas et. al. (2008).
The WDN is a research network coordinated by the European Central Bank (ECB). It includes all Euro Area
countries and most of the other members of the European Union. Its main goals are "studying in depth the
features and sources of wage and labor cost dynamics and their implications for monetary policy in the
euro area".3
Within this broad mandate, the WDN survey is an important effort to collect first-hand evidence on how
firms set their wages (and prices).The questions are designed to provide researchers with a set of stylized
facts that characterize wage setting, and to facilitate the empirical validation of different theories of wage
setting. The survey includes a core set of questions common to all national questionnaires, a set of
additional questions that were optional for each country, and it also allowed country teams to ask further,
country-specific questions.
This is a descriptive paper with two aims. The first aim is identifying facts of wage determination in
Hungarian firms. Whenever possible, we present the Hungarian results together with average results from
the other Central and Eastern European (CEE) countries (the Czech Republic, Estonia, Lithuania and Poland)
as well as the Euro Area (EA) countries. We also present the most important findings by sector and firm
size. Our second aim is to make sense of the facts in the light of theories of wage setting. We also draw 3 http://www.ecb.int/home/html/researcher_wdn.en.html
8ECBWorking Paper Series No 1378September 2011
some tentative policy conclusions. Some of our results are new, others are in line with previous findings,
and yet others are at odds with those. By the nature of our findings (descriptive evidence from one survey),
most of our results pose questions rather than giving definite answers. In particular, the results that conflict
with previous findings call for further investigations.
Previous research suggests that wages in Hungary are rather flexible in European comparison, and labor
institutions are also relatively flexible, with the potential exception of the effect of the minimum wage. On
the other hand, other aspects of the Hungarian labor market may show significantly less flexibility. For
important references, see Kőrösi (2003), Kertesi and Köllő (2003), Horváth and Szalai (2007), Kátay (2007),
Kőrösi (2007), Nacsa and Köllő (2007), Commander and Köllő (2008). The 2008 Convergence Report of the
Magyar Nemzeti Bank concludes that "the Hungarian labour market may basically be considered flexible in
terms of real wage adjustment, (...) [and] wages can be considered flexible in nominal terms as well. (...) At
the same time, the structural inflexibility of the labour market is alarmingly high." (MNB, 2008, p. 40.)
The survey results we summarize are mostly in line with this assessment. The Hungarian labor market,
while institutionally flexible, appears to be surprisingly rigid. The survey evidence points to low turnover,
and possibly to more rigid wages than previously thought. While generalizing from these findings is fraught
with difficulties, we think it is important to take firms' perception of the labor market seriously, and
investigate the surprising results further.
The rest of the paper is structured the following way. We first describe the Hungarian WDN survey. Then
we present the results using simple tools, but always comparing them to the results from the Euro Area and
CEE countries. After presenting the results, we put them in the context of various wage setting theories.
The last part concludes. It includes a summary list of the most important facts as well as some tentative
policy conclusions.
2. The WDN wage setting survey
2.1 General survey design
This paper makes use of the Wage Dynamics Network (WDN) Survey of 2008. The WDN Survey aims at
uncovering specific features of firms' price and wage setting policies in Europe. Appendix A contains the
questionnaire.
The project involves all Euro Area (EA) countries except Finland and Malta (Austria, Belgium, France,
Germany, Greece, Italy, Ireland, Luxembourg, the Netherlands, Portugal, Slovenia and Spain), as well as five
Central-Eastern European (CEE) countries: the Czech Republic, Estonia, Hungary, Lithuania and Poland. The
overall number of covered countries is 17. This analysis excludes Luxembourg (the data is not ready yet)
and Germany (the data is poorly comparable and it is not available for public use).
9ECB
Working Paper Series No 1378September 2011
The survey was implemented in a decentralized way in which each National Central Bank was responsible
for carrying out the survey within its country. Strong coordination guaranteed that the national
questionnaires are almost fully harmonized, at least with respect to the pre-defined "core questions". The
data was collected between the end of 2007 and the beginning of 2008. Overall, more than 17,000 firms
were interviewed. In most countries the survey was outsourced to an external company, which collected
the answers from firms mainly through traditional mail or the internet. Operational instructions were
added to the questionnaire, in particular regarding the person who preferably was required to fill in the
questionnaire (the CEO or the Human Resource Manager), the business unit answers should refer to (the
firm and not the establishment), and the reference period (2006 for most questions). All national
questionnaires were pre-tested on a pilot sample.
The Hungarian survey closely followed the WDN instructions. It was commissioned and supervised by the
Magyar Nemzeti Bank and administered by the survey research institute TARKI. The data was collected
through personal interviews, in which interviewees could fill out the questionnaire themselves as well. The
person interviewed was the CEO or the Human Resource Manager of the firm. This mixed-mode technique
ensured comparability with the mailout survey mode applied by most countries, and at the same time it led
to relatively high response rates. It also made sure that respondents fully understood the questions and
could answer them at their own convenience.
The sample was taken from the population of firms that filed corporate tax reports in 2006 (56 thousand
firms with 1.6 million employees). The sample was stratified by sector, firm size and county; and sampling
probability was increasing in firm size. Response rate was 53 per cent, among the highest in the WDN, with
little variation by sector and size. Non-responding firms were replaced by second addresses within strata in
order to meet target sample sizes and ensure representativeness by strata.
Sectoral coverage varies somewhat across countries. All national samples cover manufacturing, trade and
business services (trade is not covered in Germany but we don't use German data anyway). Besides those
three sectors, we include construction and financial intermediation in this analysis. Those are covered by
many but not all countries, along with the energy sector, whereas non-market services are only covered by
a few countries. Energy and non-market services are excluded from this analysis because of poor coverage
and sample size considerations. Concerning firm size, the sample is split into four classes: 5 to 19
employees, 20 to 49 employees, 50 to 199 employees and 200 employees and more. All countries cover
firms that employ at least five employees.
The analyzed sample covers 15,000 firms. Sample size varies across countries, ranging from 366 in Estonia
to 2001 in France. The Hungarian sample is among the largest ones, with 1959 observations. In terms of
response rates, three broad groups can be identified: Austria, Greece and Lithuania with a response rate
below 20 percent; a large group of countries with response rates between 20 and 50 percent; and Hungary,

10ECBWorking Paper Series No 1378September 2011
Ireland, the Netherlands, Poland and Spain with above 50 percent. The sample represents 2.4 million firms
and 48 million employees.
During the analysis, we use the WDN-generated employment-adjusted weights. This is defined as the sum
of all employees in the population in a sampling category divided by the number of firms in the sample in
the sampling category (see Druant et al, 2008, for more details). The employment-adjusted weights ensure
that the reported figures show distributions in terms of employment. We shall compare the Hungarian
results to two groups of countries, the Euro Area (EA) countries and the Central and Eastern European (CEE)
countries in the sample. The latter group contains the Czech Republic, Estonia, Lithuania and Poland.
Because of the large size asymmetries, the CEE results are dominated by Poland as it has 69 per cent of the
employees (the Czech Republic having another 20 per cent). For a robustness check, we looked at the two
largest countries separately. Our main conclusions are the same if the Hungarian data are compared to
either the Polish or the Czech data.
2.2 The Hungarian questionnaire
The Hungarian survey conforms very closely to the template provided by the WDN. It includes not only its
core but also its optional questions, and it also has some questions that are specific to Hungary and are not
included in other national questionnaires. In this section we describe the content of the Hungarian survey
in more detail.
The questions asked can be divided into the following broad categories:
1. The firm and its employees
a. Descriptive information on firm size, sector, employment composition
b. Worker turnover
2. Wage setting and wage changes
a. Collective agreement
b. Structure and type of wages
c. Frequency of wage changes
d. Wages of new hires
3. Wage rigidity and shocks
a. Existence of downward wage rigidity
b. Adjustment to shocks
c. Insurance of workers against shocks
d. Effects of increasing the national minimum wage
4. Price setting and wages
Questions under 1a allow us to examine cross-firm heterogeneity in terms of sector and size, while those
under 1b provide evidence on labor flows into and out of the firms, i.e. the "real" side of flexibility.
11ECB
Working Paper Series No 1378September 2011
Questions under 2a explore the prevalence of wage coordination either at the firm or at a higher level. 2b
questions ask about the relative importance of hourly vs. monthly wages, and the weight of bonuses and
other flexible wage components in total compensation. 2c questions are related to wage stickiness, which is
an important issue for new Keynesian macroeconomic models used at many central banks (including MNB).
In particular, dynamic stochastic general equilibrium (DSGE) models often assume that wages are not
completely flexible.4
Answers to 2d are also important for macroeconomic modeling. If wages of newly hired workers are more
flexible than those of existing employees, firms can use changes in employment to adjust their overall wage
bill.5
Answers to 3a and 3b shed light on the extent and consequences of downward nominal wage rigidity
(DNWR). If present, DNWR may have macroeconomic consequences if firms are not able to use alternative
channels to respond to negative shocks. The macro importance of DNWR, in turn, is an important aspect of
the determination of the optimal level of inflation.
Questions 3c and 3d are specific to the Hungarian survey: 3c complements research carried out at the MNB
(Kátay 2008), while 3d collects information on the effects of increasing the minimum wage. The minimum
wage is an important institution of the Hungarian labor market. It is set as a country-wide monthly
minimum for full-time employees. Our questions looked at a hypothetical increase in the minimum wage as
well as past experiences. Besides direct effects on employment, we asked about indirect effects on the
wages of other employees.
Finally, questions in the last block try to uncover regularities between price and wage setting. In the new
Keynesian interpretation of monetary policy and its transmission, which is now the dominant doctrine in
most central banks, wage costs play a key role in inflation dynamics. Thus the survey asks questions about
the synchronization of price and wage changes, and test whether firms' wage setting and pricing behavior
confirms the theoretical assumptions.
2.3 The Hungarian sample
The Hungarian sample is drawn from the population of firms that filed a tax report in 2006. It is restricted
to firms having more than five employees. The original sample includes manufacturing; electricity, gas,
water; construction; trade; business and non-business services (together classified as market services); and
financial intermediation. Of those, the electricity, gas and water sector is not used in this analysis because
of small sample size. In order to make the sample representative of employment, the sampling probability
4 The DSGE model of the Magyar Nemzeti Bank is described in Jakab and Vilagi (2008). 5 For a theoretical argument for the importance of distinguishing wages of existing and new workers, see Pissarides (2009). Some empirical evidence for the US is given by Haefke et. al (2009).
12ECBWorking Paper Series No 1378September 2011
is proportional to firm size. The sample is made fully representative of all employees in the target
population (sector and firm size) by using the employment corrected weights of the WDN.
Figures 1 through 3 describe the Hungarian sample in more detail. As mentioned above, we present
statistics for two control groups: the Euro Area (EA) and the four Central and Eastern European countries
without Hungary (CEE: the Czech Republic, Estonia, Lithuania and Poland). The figures show the sectoral
composition, size distribution, and employment composition of the firms. These are broadly similar across
Hungary and the other countries. One partial difference is in the size distribution, where the Hungarian
sample is similar to the Euro Area sample but contains more large firms relative to the CEE sample. Recall
that since the sample is re-weighted using overall employment by sector and firm size in each country,
Figures 1 and 2 reflect differences in overall employment as opposed to the composition of the WDN
sample.
Another difference is that the Hungarian sample contains more production and fewer technical workers
than both the EA and the CEE average (Figure 3). This is more likely to be due to classification differences
across countries. In the Hungarian translation (as advised by the WDN template), the production/technical
categories are defined as synonymous to unskilled/skilled manual employment, with vocational training
school graduates included in the unskilled part. Other countries followed different procedures.
Overall, we conclude that in terms of firm size distribution, Hungary is closer to the Euro Area than the
other CEE countries. Otherwise the samples seem comparable in general, and there are no obvious reasons
for concern.
3. Results
We present summary statistics for all the main question blocks of the Hungarian wage setting survey. Since
the questions are straightforward, our strategy is to concentrate on the presentation of simple facts. As we
mentioned earlier, whenever possible, we present the Hungarian results together with average results from
the other Central and Eastern European (CEE) countries in the sample (the Czech Republic, Estonia,
Lithuania and Poland) as well as the Euro Area (EA) countries. We defer the more detailed economic
interpretation of the results to a later section.
3.1 Worker turnover
We start by the survey evidence on employment type and turnover, summarized on Figure 4. Worker flows
represent the "real side" or the "quantity side" of the labor market. Besides their importance for flexible
adjustment of the labor market, they have a direct bearing on the wage setting process as well.
The first set of bars show that the fraction of permanent full-time employees in Hungary is close to 80 per
cent, very similarly to the other CEE countries and slightly below the Euro Area average. In the Euro Area,
the remaining 20 per cent are made of part time and temporary workers in equal proportions. On average,
13ECB
Working Paper Series No 1378September 2011
the CEE countries employ temporary workers to a significantly larger extent. Hungarian firms are different
in this respect: they use very few temporary workers and significantly more part-time workers.
Temporary workers are, by definition, easier to hire and fire than permanent workers, be those full-time or
part-time. As a result, temporary work plays an important role in making the labor market more flexible. It
is therefore an important finding that Hungarian firms make less use of flexible employment contracts than
other CEE countries or, in fact, other countries of continental Europe. In principle, this may not reflect
lower flexibility in itself. Hungarian firms would need less of the temporary contracts if the permanent
contracts were more flexible than in the comparison countries. However, regular employment in the other
CEE labor markets is not considered any more rigid, and yet they make use of significantly more temporary
work than Hungary. This finding points to somewhat lower flexibility of Hungarian firms in their hiring and
firing decisions.
That conclusion is supported by the second observation from Figure 4, shown by the bottom two sets of
bars. The turnover of employment, both in job creation and job destruction, is lower in Hungary than in the
CEE region. It is more similar to the Euro Area average, although lower than that as well, especially with
respect to job creation.
In order to gain more insight on this issue, Figures 5 and 6 plot job destruction and job creation by firm size.
Interestingly, job creation and job destruction are lowest for small enterprises in Hungary, while there is no
obvious pattern for the Euro Area. Relative to the CEE region, job destruction is uniformly lower, but job
creation lags especially in large firms. The latter finding indicates that the expansion of large companies
found in the CEE region is much less prevalent in Hungary. This may be because in 2006 Hungary was in a
different part of its business cycle. But the job destruction figures and the negative relationship of worker
flows and firm size are more likely to be explained by structural features of the Hungarian labor market.
Tables 2 to 4 further examine the cross-country differences in worker turnover and its relation to firm size
by controlling for sector and some firm-level control variables in a regression framework. We look at three
left-hand-side variables: the per cent share of temporary workers, the percentage of workers who left the
firm in the previous year, and the percentage of workers who joined the firm in the previous year. For each
left-hand side variable for firm i in sector j in country c we run the following three specifications (we
run separate regressions for the EA countries, the CEE countries and Hungary):
where is the full vector of size dummies (the regression contains no constant), are country-
sector fixed effects (full interaction), and is a vector of firm-specific control variables. The first
𝑦𝑖𝑗𝑐
𝑠𝑖𝑧𝑒𝑖𝑗𝑐 𝛼𝑖𝑗𝑐
𝑥𝑖𝑗𝑐
𝑦𝑖𝑗𝑐 = 𝑠𝑖𝑧𝑒𝑖𝑗𝑐𝛽 + 𝑢𝑖𝑗𝑐
𝑦𝑖𝑗𝑐 = 𝑠𝑖𝑧𝑒𝑖𝑗𝑐𝛽 + 𝛼𝑗𝑐 + 𝑣𝑖𝑗𝑐
𝑦𝑖𝑗𝑐 = 𝑠𝑖𝑧𝑒𝑖𝑗𝑐𝛽 + 𝑥𝑖𝑗𝑐𝛾 + 𝛼𝑗𝑐 + 𝑤𝑖𝑗𝑐 ,
14ECBWorking Paper Series No 1378September 2011
regression shows heterogeneity by firm size (for the second and third left-hand-side variables it reproduces
figures 5 and 6). The second and third specifications look at whether the conclusions from the figures are
robust to heterogeneity in terms of sectors (allowed to have different effects in different countries), and
the additional control variables. The control variables include the share of labor costs among total costs,
the share of white-collar workers, the share of workers covered by collective wage agreements, the share
of exports in total revenues, and whether the firm is likely to follow a price cut by a competitor as a
measure of competitive pressure (see Druant et al. 2009 for an argument for using the last variable). Note
that the vector of control variables is missing in quite a few cases (some 30 per cent in the EA subsample);
robustness of the conclusions to that specification is therefore a strong result. The coefficients on the size
dummies are directly comparable across the three models because we normalized all other right-hand-side
variables to have zero mean (in each of the three subsamples separately).
These are linear regressions estimated by OLS, weighted by the employment-adjusted WDN weights. Note
that the left-hand-side variables are bounded between 0 and 100 per cent. The frequency of zero values is
substantial: most firms in the sample employ no temporary workers, and quite a few firms report zero
percentage of workers who left or joined in the previous year. The latter is most common among small
firms, for whom total employment is a small integer number. Notice that the Tobit model is unlikely to
address the question of zeros in the worker turnover models as the problem is not of censoring but of
relatively rare events occurring among small integer numbers. For this reason we do not estimate
generalized nonlinear models but stay with the linear OLS estimates.
The regression results show that the raw differences between Hungary and the EA or CEE countries, as well
as their variation by firm size, are robust to heterogeneity by sector and the observed control variables.
Temporary employment in the large firms of Hungary is similar to the large firms in the Euro Area, but
significantly less than in other CEE countries. On the other hand, small and medium sized firms in Hungary
employ no temporary workers at all, while firm size is not significantly related to temporary employment in
the EA. Hungarian firms are more similar to firms in the EA in terms of worker turnover than to firms in the
CEE countries. The share of workers who left the preceding year is virtually the same in Hungary and the EA
countries in all size categories, and the share of workers who joined the firms is also very similar, especially
in the richest specification. All these figures are substantially lower than the corresponding estimates in the
other CEE countries.
Taken these findings together, we can conclude that on the "real" or "quantity" side, Hungarian firms are
similar to their peers in the Euro Area, but much less flexible than similar firms in the CEE region.
Temporary employment is very low among small firms in Hungary even compared to the EA. The positive
relationship between flexibility and firm size is apparent in Hungary in all specifications, even after
controlling for sector and firm-specific variables. We conclude that our findings from Figures 5 and 6 remain
valid.
15ECB
Working Paper Series No 1378September 2011
This conclusion is rather surprising in the light of previous research on Hungarian firms implying flexibility in
terms of employment. The figures in Faggio (2006) suggest that Hungarian job creation and job destruction
rates are very similar to those in other CEE countries. Körösi (2003) also suggests that "the standard gross
job flow figures indicate an extremely flexible labor market." Moreover, he concludes that "small firms are,
as expected, much more flexible," especially in destroying jobs (p. 9.). Those analyses differ from ours in
several aspects. First, the concept of job creation and job destruction used by Faggio and Körösi is
narrower; it is net employment changes at the firm level. Second, our sample contains more of the very
small firms that we found to be less flexible. Faggio's sample consists of medium and large firms only, and
Körösi's sample has fewer of the very small firms than ours. Third, the sample period of those two studies is
different from ours, ending in 2003 and 2001, respectively, while our figures refer to 2006. Nevertheless,
their conclusions are clearly at odds with ours. This puzzle calls for further research.
3.2 Wage setting
3.2.1 Collective agreements
Many countries in Europe apply collective agreements in the wage bargaining process. This can take place
at the country, sector, or firm level. Due to local specificities, the Hungarian questionnaire asks about all
collective agreements, whereas the other countries restrict the question to collective wage agreements
that include specific provisions for wages ("collective wage agreements"). In order to ensure comparability,
the Hungarian data was corrected ex post, using the official registry of collective wage agreements, in order
to restrict the agreements recorded in the survey to those that include wage provisions. Our figures are
based on the corrected measures.
As Figure 7 shows, collective wage agreements are common in the Euro Area countries, but are rare in CEE
countries. The magnitude of the difference is large: the Hungarian coverage is below 20%, while in the Euro
Area countries it is above 80%. Equally striking is the fact that while in the old member states collective
agreements occur mostly at the country or sectoral level, in the CEE region only firm-level agreements are
present. We thus conclude that in Hungary the wage setting process takes place mostly at the individual
level, similarly to other countries in the region but in stark contrast to the Euro Area nations. These results
are in line with previous research (Horváth and Szalai, 2007; and MNB, 2008).
3.2.2 The structure of wages
An important question is to determine how easily the overall wage bill can be adjusted. While we discuss
this in more detail below, an important first answer is provided by Figures 8 and 9. Performance related
components of the overall wage bill are usually more flexible than the wage bill. Figure 8 shows that their
role in Hungary is moderately important, consisting about 10% of the overall wage bill. Interestingly,
Hungary is more similar to the Euro Area than to the other CEE countries, where such wage components
are more common at 17 %.
16ECBWorking Paper Series No 1378September 2011
Inflation indexation is another potentially important determinant of wage flexibility. Figure 9 shows that a
significant minority of Hungarian employees worked in firms with some kind of indexation. Out of these
cases, the majority uses implicit adjustment to inflation. Inflation indexation is less prevalent in Hungary
than in other CEE countries, which may be surprising given the country's history of fairly high inflation. One
explanation could be that by 2006 inflation was low enough to allow firms to move away from indexation,
even from implicit indexation mechanisms. The lack of centralized wage setting also implies that there are
no external indexation requirements on firms (as opposed to, for example, Belgium). Note that the results
should be taken as a lower limit as firms may not have any explicit (formal or informal) policy of indexation
but may take inflation into account when changing wages. Nevertheless, this conclusion of the lack of real
wage rigidity is in line with the conclusions of MNB (2008).
3.3 Wage adjustment
3.3.1 The timing of wage changes
An obvious indicator of wage flexibility is the timing and frequency of wage changes. The survey question
refers to base wages, since other components are typically more flexible. Figure 10 presents results
concerning the frequency of wage changes.
In most countries, approximately 60 % of firms adjust base wages at a yearly frequency. In Hungary, even
more of them, 80 % of firms adjust their wages once a year. In order to have a summary, if artificial,
measure of the frequency of wage adjustments, we calculated average wage durations as well. (The
construction of the duration measures is shown in detail in Appendix B. The measures are identical to the
ones used by other papers using the WDN survey data, see Druant et al., 2008.) Average duration of base
wages is 13.8 months in Hungary, to be compared to the 15 months average in the EA and 14.8 months in
the CEE countries. The fact that CEE countries, including Hungary adjust base wages at virtually the same
frequency than Euro Area countries is remarkable in light of the fact that they have more decentralized
wage setting institutions.
Since base wages are stable for an extended period, it is important to know if wage changes happen in
predefined time periods (i.e. they are time-dependent), or respond to changes in the environment only
periodically (i.e. they are state-dependent). Figure 11 shows that at least in Hungary, time-dependent wage
setting predominates. Fully 40% of employees work in firms where wages are reset in January, and the
wages of another 30% are reset in the same month each year (other than January). These months are the
ones following January, so they still correspond closely to the end of the calendar year. Anecdotal evidence
suggests that even among these firms wage changes are backdated to January, but the survey does not
directly ask about this kind of behavior.
There is large heterogeneity in Europe in this respect. Time-dependent wage setting is more common
among Hungarian firms than the average of other CEE countries, with 70 per cent and 30 per cent,
17ECB
Working Paper Series No 1378September 2011
respectively (calculated as the inverse of the last set of bars). In that respect, Hungary is a lot closer to (but
even higher than) the Euro Area average at 60 per cent. These results are new: we are not aware of any
study in Hungary that looked at the timing and frequency of wage changes.
The average duration measures discussed above are useful for the parameterization of macro models with
Calvo-type wage and price rigidities. Recall that average wage duration in Hungary is 13.8 months, to be
compared to 15 months for the Euro Area and 14.8 months for the other CEE countries. These numbers are
similar to other estimates, and the cross-country differences are not very substantial. We have also
calculated durations by sectors and firm size, which are available from the authors upon request. In a
nutshell, we found that both sectoral and size heterogeneity is moderate.
3.3.2 Downward nominal wage rigidity
There is a large body of international evidence that firms are reluctant to cut wages in general, and base
wages in particular. At the same time, some evidence seems to suggest that Hungarians firms cut nominal
wages relatively often (16 per cent of workers saw their nominal wages cut between 1999 and 2002, as
shown in charts 1-12 in MNB, 2008, p. 33).
Our results suggest that Hungarian firms are as reluctant to cut or freeze wages as their western-European
peers. Figure 12 shows the fraction of firms that reported to have implemented some wage freezes or wage
cuts in the previous five years. Similarly to the previous figures, the data are weighted by the number of
employees in order to represent the fraction of employees who work at such firms. The results show that in
Hungary, less than 5% of employees work at firm that experienced wage freezes; and essentially none
experienced wage cuts. Wage cuts are very rare in all countries, but freezes do happen: in the four CEE
countries in the sample, about 9 per cent of employees work at firms that implemented them. The
difference between Hungary and the CEE average may be due to the different inflationary environment.
While Hungary still had sizable inflation and fast average nominal wage growth in the 5 years up to 2006,
inflation was significantly lower in the other countries.
These findings are clearly at odds with the figure published by MNB (2008). When comparing the results,
one should keep at least two differences in mind. First, the MNB (2008) figure presents changes at the
individual level, while our figure shows the fraction of firms (weighted by employment). Measurement
error in each data may be in part responsible for the gap: classical error in individual wages would
exacerbate the fraction of measured negative wage changes, while fading memories of small cuts or freezes
may bias firm-level figures downwards. Another difference is in the concept of wages: while our figures are
about base wages, the MNB (2008) figure contains all other elements in earnings. While our previous figure
8 suggests that the role of performance-related elements is small in Hungarian earnings, other non-base
wage elements can be important. The puzzling difference between the two results calls for further
research.
18ECBWorking Paper Series No 1378September 2011
Figure 13 lists reasons why firms find it difficult to cut wages (which are again understood as base wages).
Many factors seem to be important, with the ones related to motivation and morale being the most
prevalent. Collective agreements are much less important in Hungary and the CEE region than in Euro Area
countries, and implicit wage insurance (the intolerance of instability) is somewhat more common in
Hungary than in other nations.
The survey contains some other questions related to wage cuts and freezes. Given that in the sample
period downward nominal wage rigidity was not a binding constraint for most firms in Hungary, we skip the
discussion of these questions. More results concerning this topic are available from the authors upon
request.
3.3.3 Wages of new hires
Another margin of adjustment of the overall wage bill is the wages of newly hired employees. This becomes
especially important when the wages of existing employees are infrequently adjusted, as we showed
above. There is also a growing body of theoretical and empirical evidence that underscores the importance
of this issue. We defer the detailed discussion of this issue to a later section.
Figure 14 shows the most important factors in the setting of the wages of newly hired workers. In Euro
Area countries with sectoral or nationwide wage setting these also apply to new hires. Perhaps more
interestingly, however, firms in the CEE countries without such external constraints feel constrained by
internal wage equity considerations. In Hungary almost 80% of firms report that the wages inside the firm
are very relevant when they determine the wages of new entrants. The same is true for CEE countries, but
to a somewhat lesser extent.
Besides the general question on entry wages, the survey includes two questions that address the
importance of market pressure on entry wages. Figure 15 and 16 show the answer when the labor market
is unusually tight or unusually slack. Remarkably, less than one fifth of the firms adjust wages in response to
market pressure. Those who do not are reluctant to adjust entry wages because of internal considerations;
they feel that would be unfair to either existing or new workers. Firms in the Euro Area cite external
institutional constraints to be the main reason, while CEE countries emphasize informal constraints such as
fairness and motivation. Hungary is close to the other CEE countries with some differences that show no
particular pattern.
3.4 Adjustment to external shocks
3.4.1 Demand and cost shocks
The WDN survey includes three sets of questions that address (i) the flexibility of wages in response to
different types of shocks, and (ii) the importance of alternative adjustment mechanisms. The three sets
differ in the hypothetical shock under consideration: a decrease in demand, an increase in the price of an
intermediate input, and an increase in competitors' wages. The responses are summarized in Figures 17 to
19.
19ECB
Working Paper Series No 1378September 2011
The first observation from the top four answers to the three questions is that Hungarian firms seem to
adjust less of everything than their peers in CEE countries or the Euro Area. Besides the obvious
interpretation (Hungarian firms are less likely to adjust to shocks), it is possible that Hungarian firms are
less likely to use all four adjustment margins but concentrate on fewer at a time.
Figure 17 lists the most common ways firms respond when demand for their products falls. Hungarian firms
mostly try to cut costs, while output, price and mark-up adjustments are common in other countries. Base
wages are never cut in any country, and cutting flexible wage components is also rare. Interestingly,
adjusting of temporary employment is an important margin in the Euro Area, but not in the CEE countries.
An input cost increase is frequently passed on to consumers, and reducing margins is also common (Figure
18). Cutting production is an option in other countries, but Hungarian firms do not typically use that
margin. Again, Hungarian companies try to adopt by cutting non-labor costs. Since - apart from input and
labor costs - the only major cost item is capital costs, this provides some indirect evidence that investment
is an important adjustment margin in Hungary. Of course, cost cutting may reflect increasing efficiency as
well.
Wage increases outside the control of the firms are mostly countered by trying to reduce other costs in
Hungary (Figure 19). Again, while in other countries firms are likely to increase prices, reduce the mark-up
or cut production, these options are less common in Hungary.
An important concern is that some of the respondents to the survey do not have a complete view about the
firm's strategic decisions and thus underestimate the importance of certain adjustments. The important
questions here are whether the position of the respondent affects the answers and whether the Hungarian
sample is different in terms of the position of the respondents. Unfortunately, we don't know the position
of the respondent in the harmonized cross-country data so we cannot address the second question.
However, the Hungarian data does contain such information, which allows for testing the first question. We
found that respondents from human resources do tend to underestimate all adjustments relative to
respondents in finance and general management as expected, but the differences are small and statistically
insignificant if we control for sector and size. All results are available from the authors upon request.
We can therefore conclude that Hungarian firms accommodate negative shocks by cutting non-labor costs,
irrespective of the nature of the shock. Flexible wage components may also serve as an adjustment margin
to some extent, but their role is limited. These results are quite puzzling and call for further research.
Besides the possible room for increasing efficiency, an explanation could be that Hungarian firms use
investment as a buffer more often than their peers in the Euro Area or other CEE countries.
20ECBWorking Paper Series No 1378September 2011
3.4.2 Wage insurance
Our previous findings suggest that firms are reluctant to cut labor-related costs in case of unfavorable
shocks. One potential reason is that employers provide insurance to their workers against unfavorable
events. Kátay (2008) presents micro evidence that this is the case. In order to take another look at the
issue, the Hungarian WDN survey includes questions on wage insurance as well.
Figures 20-23 list the answers to 4 possible scenarios: permanent and temporary improvements and
declines in profitability. Firms are asked if they would change base wages, flexible wages, and hiring
behavior. If the insurance hypothesis is correct, wages should respond more to permanent shocks than to
temporary ones.
Base wages are immune to profit declines, both in case of temporary and permanent changes. For profit
increases, we find small effects: only 20% of companies would change wages somewhat, and essentially
none would make a big adjustment. We thus find evidence to some asymmetry in response to shocks
depending on their sign. This is also consistent with the presence of downward nominal wage rigidity. Since
direct questions indicated that DNWR was not a concern in the past (see above), the reason must be that
DNWR was simply not binding.
Flexible wage components respond much more to profit shocks. More than 60% of firms would adjust
flexible wage components, and many of these by moderate and even large amounts. We do not see
significant asymmetries between positive and negative shocks, but the effects are somewhat larger for
permanent changes.
Hiring behavior is affected by declining profitability, and in case of a permanent decline the effect is quite
pronounced. Hiring responds much less to positive shocks, especially when the shock is temporary. All
these again point to the existence of asymmetric wage rigidity, as (some) firms use hiring rather than wage
cuts to accommodate adverse shocks.
These results are consistent with the findings of Kátay (2008) that show substantial but not full insurance
against transitory shocks. We find, however, an interesting asymmetry in the responses to positive vs.
negatie shocks: the former are accommodate more through wages, while the latter more through hiring.
We interpret these as indications of downward nominal wage rigidity.
Finally, as expected, flexible wage components are important margins of adjustment under all
circumstances. This finding somewhat contradicts those on Figures 17-19, where flexible wage components
were not mentioned by firms as shock absorbents. This apparent discrepancy calls for further investigation.
3.5 The minimum wage
A section of the survey specific to Hungary asked about the effects of an increase in the minimum wage.
The questions refer to (i) a hypothetical 20% increase in the minimum wage, and (ii) the actual minimum
21ECB
Working Paper Series No 1378September 2011
wage increase in 2001-2002 that led to a 100 per cent increase in two steps. Table 1 lists the answers to
both sets of questions. The findings are consistent across the hypothetical and the actual experiments,
which differ only in size. For this reason, we mostly report results concerning the hypothetical minimum
wage increase, but corroborate findings with the actual minimum wage change.
On average, around 14% of employees would earn at or below the hypothetical higher minimum wage
(after the 20% increase). Thus such an increase would represent a significant wage shock to firms. Given
the magnitude of the shock, it is surprising to find that very few companies would respond by laying off
workers: less than 8% indicated any possible layoffs. Those who said yes would, on average, lay off one
third of the affected workers. This implies that about 2.5% of affected employees and 0.34% of all
employees would lose their jobs a direct result of the 20% increase in the national minimum wage.
This number may seem surprisingly low: as a share of total employment it is essentially zero. While one
may suspect that firms underestimate the layoffs in a hypothetical scenario, the responses to the 2001-
2002 minimum wage increase are only marginally stronger despite the fact that then the increase was close
to 100 per cent. Note that the weak response in 2001-2002 is consistent with other estimates. Kertesi and
Köllõ (2003) estimated the aggregate employment response to the 2001 increase (which was nearly 60 per
cent in itself) to be around 0.5%. This could be because that increase took place in a different point of the
business cycle, and (even though proportionately much higher) hit firms less than a 2006 increase would
have. It is also possible, of course, that the minimum wage was not effective before 2001-2002. Tonin
(2007) provides some evidence that tax evasion was an important reason why the reported minimum wage
may not have been an effective constraint on firms in that period.
The second important finding is that firms would (and did) pass on the minimum wage increase to
employees not directly affected. About 30% of (employment weighted) firms gave an affirmative answer to
this question, and they would raise wages for a large set of their employees. In case of a hypothetical 20%
increase in the minimum wage, these firms would increase the wages of an additional 62.1% by around
10%. This implies that in addition to the direct effect, the minimum wage increase would lead to a further
2% increase in the economy-wide wage rate. Again, the numbers are somewhat smaller for the 2001-2002
increase, but they are significant as well.
This finding is consistent with the hypothesis that firms are concerned about the relationship among their
employees, and want to have a wage distribution that is perceived as "fair". This seems to include the
keeping of a "pecking order" of workers, where relative wages are important in addition to absolute levels.
An interesting question is the way firms would respond to maintain profitability in response to a significant
cost shock. While the survey did not ask this question for the minimum wage increase, previously we saw
that the main way Hungarian companies are trying to adjust is by cutting non-labor costs.
22ECBWorking Paper Series No 1378September 2011
3.6 Prices and wages
The survey also contained questions about pricing and about links between price and wage setting. This is
an important issue given that wage costs are the biggest component of firms' total costs, and an arguably
even larger component of marginal costs. Thus, theoretically, we expect wage pressure to lead to higher
prices. In a competitive labor market, on the other hand, firms would pass on price increases to wages,
implying a reverse relationship.
Figure 24 and 25 display basic characteristics of price setting. Roughly half of Hungarian firms (employment
weighted) keep prices fixed for about 1 year, which is comparable to the Euro Area but somewhat higher
than the CEE average. The average price duration is somewhat shorter than the average wage duration in
all countries, at around 10 months. The average price duration is somewhat higher in Hungary (10.7
months) than in the other CEE countries (9.5 months) or the Euro Area (9.6 months).
Compared to wages, prices are substantially less time-dependent. Recall that many wages are typically
reset in January, but we see that to a much lesser extent for prices (Figure 25). Overall only about 25% of
employees work in firms that have explicit time-dependent price setting practices. There is some
heterogeneity across countries, but it is generally true that wage changes are more concentrated to
particular months.
Figure 26 shows answers to questions whether firms' price and wage changes are linked. The answers
indicate that the link is weak or nonexistent, and especially so in Hungary. Only about 22% of employment-
weighted firms report any link, and most of these claim that the link follows no particular pattern. It is
important to note, however, that the survey asked about a very specific type of relationship, i.e. about the
timing of price and wage changes. Even if wage changes respond to price movements and vice versa, the
lag may very well depend on other factors. Thus we think the answers to this question are only informative
about the lack of a joint time-dependent nature of price and wage setting.
4. Economic interpretations
After presenting the basic findings of the WDN wage setting survey, in this section we discuss the economic
interpretation of these findings. The main question is to see if the survey answers are consistent with basic
theories of wage setting, and which of these theories is the most relevant for Hungary.
The first conclusion we can draw from the survey is that Hungarian firms are not constrained by external
factors in their wage setting (with the important exception of the minimum wage, which we discuss below).
Collective agreements at the national or sector level are nonexistent, and even within firms wages are
typically set individually. On the other hand, wages are set in a fairly rigid manner. The wages of new hires
confirm to the wages of existing employees, and most firms reset their wages at most once a year. Base
23ECB
Working Paper Series No 1378September 2011
wages are never cut, and are hardly frozen, although the latter finding may be due to the sample period
during which average wage growth was high.
To reconcile these findings, we need to look for wage theories that emphasize that wages may have other
roles than reflecting workers' marginal product. The implicit contract theory (see, for example, Beaudry and
DiNardo 1991) argues that workers receive an insurance against idiosyncratic shocks, since firms may be
better able to hedge against such risks. While infrequent wage setting and the reluctance of cutting wages
supports this hypothesis, the lack of inflation indexation suggests either money illusion from the workers'
part, or other considerations behind the stability of wages.
One set of facts supporting implicit insurance is that firms shield workers from temporary and permanent
profit shocks, seen on Figures 20-23. While this is certainly evidence to the insurance motive, the
asymmetric response between negative and positive (temporary) shocks also suggests that workers are
sensitive to nominal wages.
Another set of theories comes under the heading of "efficiency wages". Efficiency wage theories assume
that wages may have an incentive component, that the right wage motivates workers to work harder and
more productively. Firms may use their wage setting policies to alleviate moral hazard problems (Shapiro
and Stiglitz 1984), to provide workers with a "fair" wage relative to others (Akerlof and Yellen 1991), or to
reduce costly turnover (Salop 1979). An important empirical contribution in this area is Bewley (1999). In
interviews with over three hundred business leaders and human resource officers in the US, Bewley found
that employers are reluctant to cut wages because they think it would hurt morale.
The WDN survey is supportive of the Bewley (1999) findings. Firms are reluctant to cut wages even in the
case of adverse shocks. This is true even for flexible wage components that should in principle act as "shock
absorbents". It seems that bonuses are used less to accommodate outside shocks, and more to motivate
individual worker effort. Employers also pay close attention to relative wages within the company, either in
the case of new hires or in the case of changes in the minimum wage. Altogether a robust conclusion seems
to be that maintaining employee morale and work incentives is a very strong consideration for wage
setting.
A third set of theories emphasizes frictions in hiring and the existence of long-term employer-employee
relationships, which is known as the search-and-matching framework or the flow approach to
unemployment (Mortensen and Pissarides 1994). While the search-and-matching model was developed
primarily to understand equilibrium unemployment, its implications for wage setting have also been
discussed extensively.
Hall (2005), for example, argues that wage rigidity helps the search-and-matching model to match
unemployment volatility. The main advantage of the model in this respect is that since forming job matches
is costly, successful matches generate a surplus that is shared by the worker and employer. Since the wage
24ECBWorking Paper Series No 1378September 2011
is the result of bilateral bargaining and it is not allocational over the surplus range, economic theory says
little about the outcome. As long as it remains in the bargaining set, a rigid wage is thus fully consistent
with economic rationality and equilibrium conditions.
An interesting question concerns the behavior of the wages of newly hired workers. Pissarides (2009)
argues that the crucial wage rate in the search-and-matching model is that of new hires, and he presents
some evidence that these are more flexible than average wages. The WDN survey offers some contradicting
evidence. The firms report that they do not respond to labor market developments by adjusting the wages
of new hires. The main reasons offered are that it would be after to existing employees and would hurt
morale. Collecting more evidence on this issue should be an important topic for future research.
An important set of facts related to the flow approach to labor markets is on job turnover. In Hungary, both
job creation and job destruction are low, especially relative to the CEE region. Firms are reluctant to fire
workers, even in the case of adverse shocks. The survey provides little information on why this is the case,
but we speculate that this is not because of firing costs or strong regulation. Rather, our interpretation is
that the small amount of "churning" is due to rigidities at the lower end of the labor market.
In particular, Hungary is both characterized by a high minimum wage and generous welfare benefits. This
implies that hiring low-skilled workers is difficult, given their low productivity and high outside option. Since
low-skilled jobs are much less stable than high-skilled ones, such composition effect can explain why
turnover is lower in Hungary.
The only direct evidence to the composition effect in the survey can be seen on Figure 3, which seems to
contradict our hypothesis. The share of production workers is much higher in the Hungarian sample than
elsewhere, while the share of skilled manufacturing jobs is much lower. We believe, however, that the
classification was probably misleading, and as a result, the Hungarian figure is not in line with the skill
distribution in Hungary. Evidence from other sources does show that the employment of low-skilled
workers is much smaller in Hungary than the European average (Köllő, Bajnai and Hámori 2009).
Nevertheless, this is an issue which a possible repeat of the survey could clarify further.
Up to now we have discussed wage setting theories with a micro-foundation. In macroeconomics, however,
it is common to assume that wages are simply set in a staggered way. Time-dependency of wage setting is
assumed in many New Keynesian (DSGE) models, starting with the contribution of Erceg, Henderson and
Levin (2000).
The WDN survey provides support for the time-dependent nature of wage setting. Wages are reset
infrequently, mostly once a year. Many wages change in January, or in other fixed period. For price setting,
the evidence is less conclusive: while prices are also fixed for up to one year on average, they are changed
in a much less predictable time pattern. Probably for this reason, wage and price changes are not
coordinated in most companies.
25ECB
Working Paper Series No 1378September 2011
A practical issue for macro models is the calibration of Calvo-parameters for price and wage setting. For the
latter, the survey suggests two obvious values. The mode of the distribution is 4 quarters, while the average
is a bit below 5 quarters. Given the huge spike at 1 year, it is probably more representative of the
distribution than the average value. In case of price setting, the mode is also at 4 quarters while the
average is around 3 quarters. Since the spike is less dramatic but still very significant, both 3 and 4 quarters
seem reasonable calibration values.
5. Summary and conclusions
In this paper we summarized findings from the 2006 Hungarian wage setting survey of the Eurosystem
Wage Dynamics Network. We focused on aggregate findings and comparisons to two country groups, the
Euro Area and the CEE region. Summing up, the analysis of the Hungarian WDN survey of 2008 suggests the
following facts.
Worker turnover in Hungary is low, especially among small and medium sized enterprises. In that
respect, Hungary stands out from the analyzed CEE countries.
exception of the minimum wage.
year at most, in a time-dependent fashion. In terms of frequency, Hungary is similar to the EA and
other CEE countries, although wage setting in the other CEE countries is less time-dependent.
other costs, and to a lesser degree, changing prices, margins and output.
answers are contradictory in this respect, and call for further investigation.
not induce massive layoffs, but it would spill over to other workers, and lead to an additional 2%
increase in average wages.
mechanisms.
CEE countries. In terms of outcomes, however, it is more similar to the more rigid Euro Area
countries.
We can draw a few tentative policy conclusions from these facts. First, lower levels of real flexibility of the
Hungarian small and medium size enterprises have direct consequences for efficient allocation of resources
and economic growth. We can only guess the reasons behind lower flexibility, but high taxes and welfare
1.
2. Hungarian firms dot not face formal institutional constraints in wage setting, with the important
4. Wages are irresponsive to temporary shocks. Firms are accommodating these shocks by cutting
3. Despite this fact, wages appear rigid, particularly base wages. They are reset on average once a
5. It is unclear whether flexible wage components are used to absorb external shocks. The survey
6. By 2006 the minimum wage is a binding constraint for firms. A 20% minimum wage increase would
7. The frequencies of wage and price setting are not synchronized, at least not by explicit
8. Overall, in terms of its formal institutions, the Hungarian labor market is flexible, similarly to other
26ECBWorking Paper Series No 1378September 2011
benefits are likely to play an important role. Therefore the reduction of taxes and reforming the benefit
system is important in order to increase labor market flexibility as well.
Second, the fact that Hungarian firms use non-labor costs to adjust for adverse shocks has important
implications for monetary policy. We speculated that firms may use investment or capital utilization for
adjustment. Since investment is sensitive to changes in monetary conditions, monetary policy may have a
bigger impact on firm behavior than previously thought. An important caveat, however, is that the role of
flexible wage components is unclear from the contradictory answers to different sets of questions.
Downward nominal wage rigidity is also important for monetary policy. While DNWR was not binding for
Hungarian firms in the sample period, it is clearly present in the wage setting decision. Thus as productivity
growth slows down and inflation declines, DNWR may become an important constraint for nominal wage
adjustment at least for some firms and employees. The aggregate implications of this are not clear, and
merit further research.
Many interesting questions can be investigated further that we do not have the space to do in this
overview - a task that we leave for future research. A particularly interesting question concerns the
behavior of firms under different circumstances. The current labor market conditions are very different
from the ones in 2006, and repeating or updating the survey would provide information on how firms adapt
to such changed circumstances. We hope that such an update will indeed take place, and we are looking
forward to report the findings from that exercise.
References
Akerlof, G. and Yellen, J. (1990). "The Fair Wage-Effort Hypothesis and Unemployment". Quarterly Journal
of Economics, 105, p.255-283.
Bajnai, B. and Sz. Hámori and J. Köllő (2009). "The Hungarian Labor Market: a European Perspective". In: K.
Fazekas and J. Köllő (eds.): The Hungarian Labor Market 2009, Institute of Economics (IE-HAS), Budapest.
Beaudry, P. and DiNardo, J (1991). "The Effect of Implicit Contracts on the Movement of Wages over the
Business Cycle: Evidence from Micro Data". Journal of Political Economy, 99, p.665-688.
Bewley, T. (1999). Why Wages Don't Fall During a Recession. Harvard University Press, Cambridge MA.
Commander, S and J. Köllő (2008). "The changing demand for skills: Evidence from the transition."
Economics of Transition, 16, p.199-221.
Druant, M., S. Fabiani, G. Kezdi, A. Lamo F. Martins and R. Sabbatini (2008), "How are firms' wages and
prices linked: evidence in Europe." European Central Bank Working Paper No. 1084.
27ECB
Working Paper Series No 1378September 2011
Erceg, C. and Henderson, D. and Levin, A. (2000). "Optimal monetary policy with staggered wage and price
contracts". Journal of Monetary Economics, 46, p.281-313.
Faggio, Giulia (2006), "Job Destruction, Job Creation and Unemployment in Transition Countries: What Can
We Learn?" Working Paper, presented at the 2007 AEA Meetings.
Haefke, C. and M. Sonntag and T. van Rens (2009). "Wage rigidity and job creation". Kiel Working Papers
1504, Kiel Institute for the World Economy.
Horváth, H. and Z. Szalai (2007). "Labour market institutions in Hungary with a focus on wage and
employment flexibility," MNB Occasional Papers, No. 77.
Kátay G. (2008). "Do firms provide wage insurance against shocks? - Evidence from Hungary." Working
Paper Series 964, European Central Bank.
Kertesi, G and J. Köllő (2003), "Fighting low equilibria by doubling the minimum wage -- Hungary's
experiment." IZA Discussion Paper No. 970.
Köllő, J and B. Nacsa (2007), "Flexibility for Some, Security for Others? Hungary's Experience." in: Cazes S.
and A. Nesporova (eds.) Flexicurity -- A relevant approach in Central and Eastern Europe. International
Labour Office, Geneva, pp. 121-149.
Kőrösi, Gábor (2007), "Dynamics of inter-firm wage differentials." in: Fazekas K. and Kézdi G. (eds.): The
Hungarian Labour Market 2007; MTA KTI--OFK, Budapest, p.47-59.
Körösi, Gábor (2003), "Job Creation and Destruction in Hungary." Central European University Working
Paper No. 1/2003.
MNB (2008), Analysis of the Convergence Process. Magyar Nemzeti Bank, Budapest.
Mortensen, D. and Pissarides, C. (1994). "Job Creation and Job Destruction in the Theory of
Unemployment". Review of Economic Studies, 61, p.397-415.
Pissarides, C (2009). "The Unemployment Volatility Puzzle: Is Wage Stickiness the Answer?". Econometrica,
77, p.1339-1369.
Salop, S. (1979). "A Model of the Natural Rate of Unemployment". American Economic Review, 69, p.117-
25.
Shapiro, C. and Stiglitz, J. (1984). "Equilibrium unemployment as a worker discipline device". American
Economic Review, 74, p.433-444.

28ECBWorking Paper Series No 1378September 2011
Appendices
A The WDN Questionnaire
This survey is aimed at collecting information on wage and price setting procedures at the firm level. The survey is an integral part of a Eurosystem project on wage dynamics, involving the Central banks of the euro area and of other EU countries, and is conducted through a harmonised questionnaire. The importance the Eurosystem places on conducting this survey is signalled by the accompanying letter by ….. In the case of Italy, the survey is conducted by …. under the supervision and the authority of the Bank of Italy. Your cooperation is extremely valuable but your participation is totally on a voluntary basis and your eventual refusal to participate will not have any implication. Firm-level information collected through the questionnaire will be treated only inside the Bank of Italy on a secure and confidential basis, will be never disseminated outside the Bank of Italy and will be used exclusively for research purposes. Only aggregate figures, that do not contain information which might permit the identification of individual records in the data, will be published and eventually disseminated to other organizations. A copy of the main aggregate findings of the survey will be sent to you. *** The questionnaire is addressed to either the CEO of the company or the Human Resource Manager and is organised in 4 sections: Section 1 - Wage Setting and Wage Changes collects information on wage setting practices and the frequency and timing of the wage changes. Section 2 - Downward Wage Rigidity and Adjustment to Shocks collects information on potential obstacles to downward wage rigidity and the reaction of firms to shocks Section 3 - Price Setting and Price Changes gathers information on price setting procedures, the main determinants of prices and the frequency of price changes. Section 4 - Information about the firm collects some information about the firm mainly relating to the main features of the workforce. Most questions are qualitative and only a few of them (mostly those in the 4th section) require figures. If exact numbers are difficult for you to find please use approximate answers. We estimate that the questionnaire takes approximately xx minutes to complete. At the beginning of each section/question you might find instructions and definitions that are helpful to fill in the individual questions. Moreover, the following instructions should simplify this process: i) Business unit: answers should refer to the firm and not to the establishment (which is a single physical location at which business is conducted). ii) Reference period: The reference period used should be that covered by your latest 12 month profit and loss account. Most questions refer to the practices followed during that period, a few questions; however, refer to figures at end of the reference period (e.g. question on the distribution and number of employees). iii) Contacts and help: You can send the required information either by fax (….) or by email (…), possibly by the end of …. .In case you need any information or clarification, you can contact ….
Before we begin with the questionnaire, please indicate:
a) name of the firm ______________________________ b) VAT number ______________________________ c) Sector of activity (Ateco 2002) ______________________________
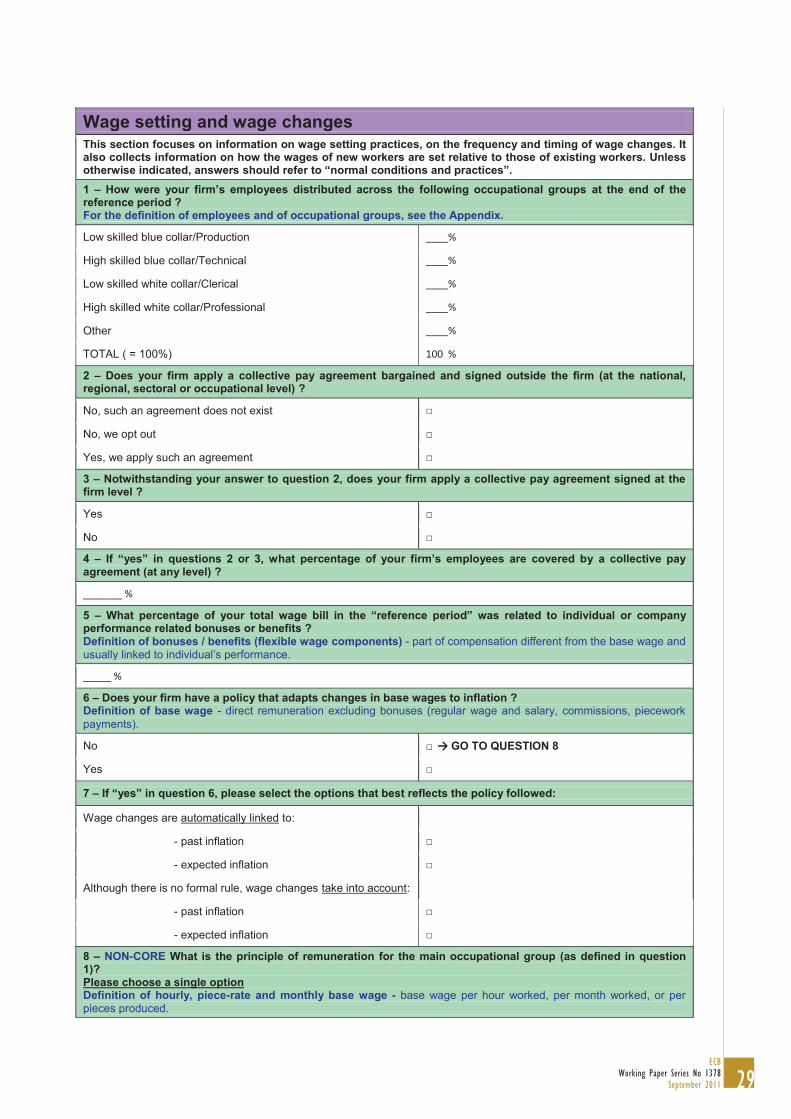
29ECB
Working Paper Series No 1378September 2011
Wage setting and wage changes This section focuses on information on wage setting practices, on the frequency and timing of wage changes. It also collects information on how the wages of new workers are set relative to those of existing workers. Unless otherwise indicated, answers should refer to “normal conditions and practices”. 1 – How were your firm’s employees distributed across the following occupational groups at the end of the reference period ? For the definition of employees and of occupational groups, see the Appendix.
Low skilled blue collar/Production ____%
High skilled blue collar/Technical ____%
Low skilled white collar/Clerical ____%
High skilled white collar/Professional ____%
Other ____%
TOTAL ( = 100%) 100 %
2 – Does your firm apply a collective pay agreement bargained and signed outside the firm (at the national, regional, sectoral or occupational level) ?
No, such an agreement does not exist □
No, we opt out □
Yes, we apply such an agreement □
3 – Notwithstanding your answer to question 2, does your firm apply a collective pay agreement signed at the firm level ?
Yes □
No □
4 – If “yes” in questions 2 or 3, what percentage of your firm’s employees are covered by a collective pay agreement (at any level) ?
_______ %
5 – What percentage of your total wage bill in the “reference period” was related to individual or company performance related bonuses or benefits ? Definition of bonuses / benefits (flexible wage components) - part of compensation different from the base wage and usually linked to individual’s performance.
_____ %
6 – Does your firm have a policy that adapts changes in base wages to inflation ? Definition of base wage - direct remuneration excluding bonuses (regular wage and salary, commissions, piecework payments).
No □ → GO TO QUESTION 8
Yes □
7 – If “yes” in question 6, please select the options that best reflects the policy followed:
Wage changes are automatically linked to:
- past inflation □
- expected inflation □
Although there is no formal rule, wage changes take into account:
- past inflation □
- expected inflation □
8 – NON-CORE What is the principle of remuneration for the main occupational group (as defined in question 1)? Please choose a single option Definition of hourly, piece-rate and monthly base wage - base wage per hour worked, per month worked, or per pieces produced.
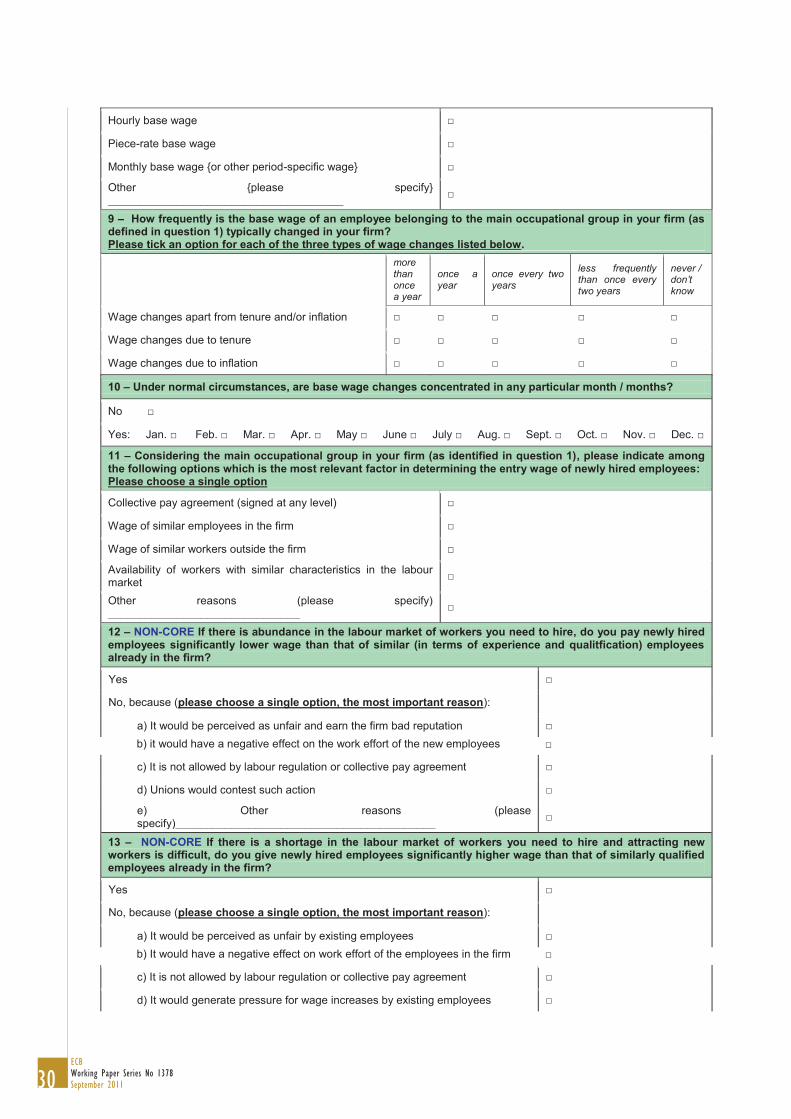
30ECBWorking Paper Series No 1378September 2011
Hourly base wage □
Piece-rate base wage □
Monthly base wage {or other period-specific wage} □
Other {please specify} ______________________________________ □
9 – How frequently is the base wage of an employee belonging to the main occupational group in your firm (as defined in question 1) typically changed in your firm? Please tick an option for each of the three types of wage changes listed below.
more than once a year
once a year
once every two years
less frequently than once every two years
never / don’t know
Wage changes apart from tenure and/or inflation □ □ □ □ □
Wage changes due to tenure □ □ □ □ □
Wage changes due to inflation □ □ □ □ □
10 – Under normal circumstances, are base wage changes concentrated in any particular month / months?
No □
Yes: Jan. □ Feb. □ Mar. □ Apr. □ May □ June □ July □ Aug. □ Sept. □ Oct. □ Nov. □ Dec. □
11 – Considering the main occupational group in your firm (as identified in question 1), please indicate among the following options which is the most relevant factor in determining the entry wage of newly hired employees: Please choose a single option
Collective pay agreement (signed at any level) □
Wage of similar employees in the firm □
Wage of similar workers outside the firm □
Availability of workers with similar characteristics in the labour market □
Other reasons (please specify) _______________________________ □
12 – NON-CORE If there is abundance in the labour market of workers you need to hire, do you pay newly hired employees significantly lower wage than that of similar (in terms of experience and qualitfication) employees already in the firm?
Yes □
No, because (please choose a single option, the most important reason):
a) It would be perceived as unfair and earn the firm bad reputation □ b) it would have a negative effect on the work effort of the new employees □
c) It is not allowed by labour regulation or collective pay agreement □
d) Unions would contest such action □
e) Other reasons (please specify)__________________________________________ □
13 – NON-CORE If there is a shortage in the labour market of workers you need to hire and attracting new workers is difficult, do you give newly hired employees significantly higher wage than that of similarly qualified employees already in the firm?
Yes □
No, because (please choose a single option, the most important reason):
a) It would be perceived as unfair by existing employees □ b) It would have a negative effect on work effort of the employees in the firm □
c) It is not allowed by labour regulation or collective pay agreement □
d) It would generate pressure for wage increases by existing employees □
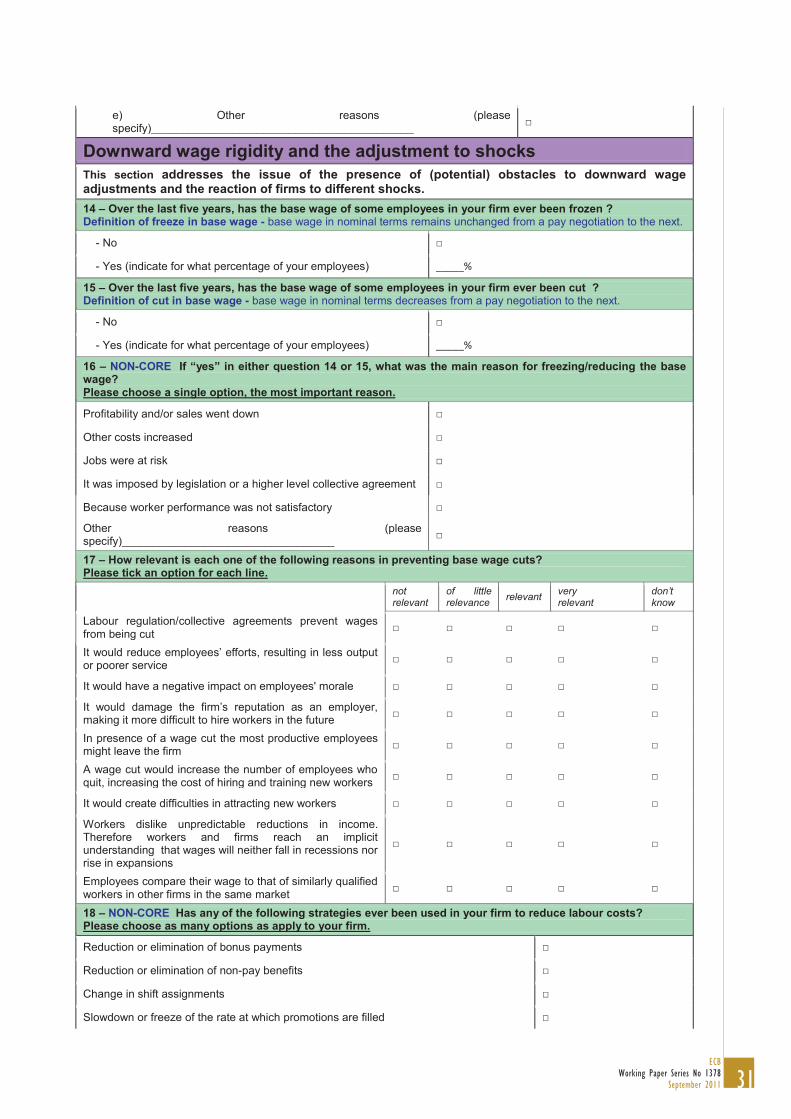
31ECB
Working Paper Series No 1378September 2011
e) Other reasons (please specify)__________________________________________ □
Downward wage rigidity and the adjustment to shocks This section addresses the issue of the presence of (potential) obstacles to downward wage adjustments and the reaction of firms to different shocks. 14 – Over the last five years, has the base wage of some employees in your firm ever been frozen ? Definition of freeze in base wage - base wage in nominal terms remains unchanged from a pay negotiation to the next.
- No □
- Yes (indicate for what percentage of your employees) _____%
15 – Over the last five years, has the base wage of some employees in your firm ever been cut ? Definition of cut in base wage - base wage in nominal terms decreases from a pay negotiation to the next.
- No □
- Yes (indicate for what percentage of your employees) _____%
16 – NON-CORE If “yes” in either question 14 or 15, what was the main reason for freezing/reducing the base wage? Please choose a single option, the most important reason.
Profitability and/or sales went down □
Other costs increased □
Jobs were at risk □
It was imposed by legislation or a higher level collective agreement □
Because worker performance was not satisfactory □
Other reasons (please specify)__________________________________ □
17 – How relevant is each one of the following reasons in preventing base wage cuts? Please tick an option for each line. not
relevant of little relevance
relevant very relevant
don’t know
Labour regulation/collective agreements prevent wages from being cut □ □ □ □ □
It would reduce employees’ efforts, resulting in less output or poorer service □ □ □ □ □
It would have a negative impact on employees' morale □ □ □ □ □
It would damage the firm’s reputation as an employer, making it more difficult to hire workers in the future □ □ □ □ □
In presence of a wage cut the most productive employees might leave the firm □ □ □ □ □
A wage cut would increase the number of employees who quit, increasing the cost of hiring and training new workers □ □ □ □ □
It would create difficulties in attracting new workers □ □ □ □ □
Workers dislike unpredictable reductions in income. Therefore workers and firms reach an implicit understanding that wages will neither fall in recessions nor rise in expansions
□ □ □ □ □
Employees compare their wage to that of similarly qualified workers in other firms in the same market □ □ □ □ □
18 – NON-CORE Has any of the following strategies ever been used in your firm to reduce labour costs? Please choose as many options as apply to your firm.
Reduction or elimination of bonus payments □
Reduction or elimination of non-pay benefits □
Change in shift assignments □
Slowdown or freeze of the rate at which promotions are filled □
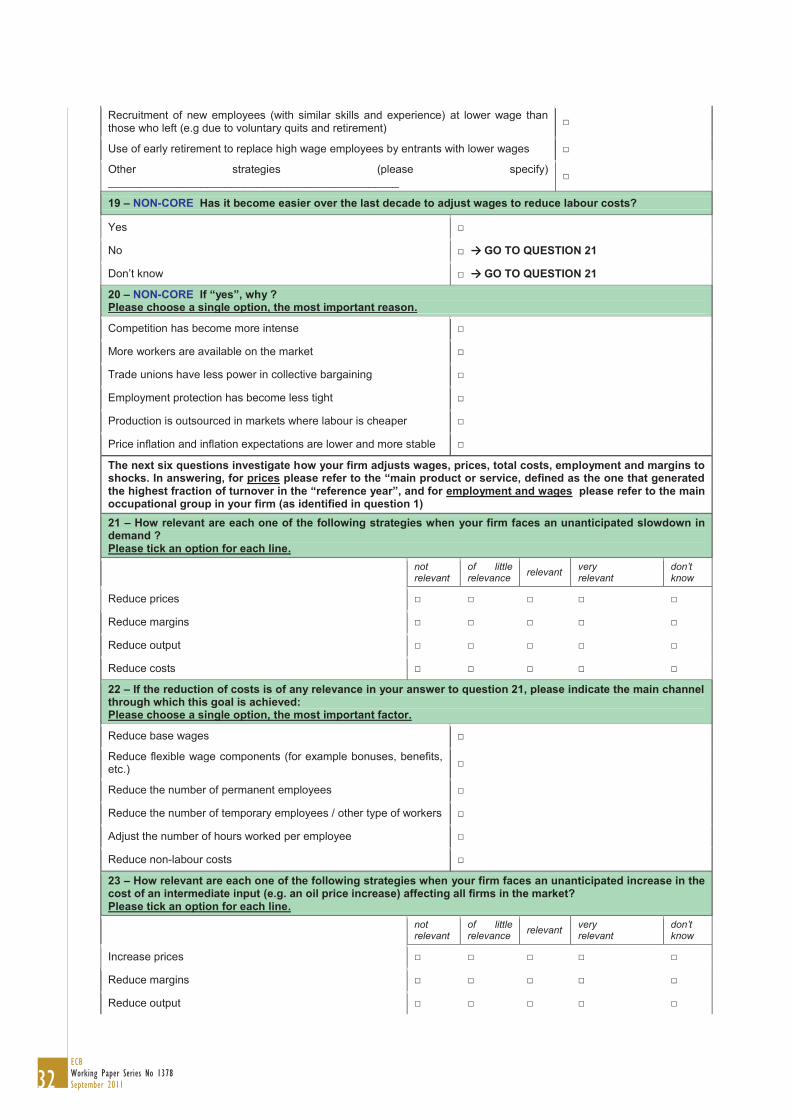
32ECBWorking Paper Series No 1378September 2011
Recruitment of new employees (with similar skills and experience) at lower wage than those who left (e.g due to voluntary quits and retirement) □
Use of early retirement to replace high wage employees by entrants with lower wages □
Other strategies (please specify) _______________________________________________ □
19 – NON-CORE Has it become easier over the last decade to adjust wages to reduce labour costs?
Yes □
No □ → GO TO QUESTION 21
Don’t know □ → GO TO QUESTION 21
20 – NON-CORE If “yes”, why ? Please choose a single option, the most important reason.
Competition has become more intense □
More workers are available on the market □
Trade unions have less power in collective bargaining □
Employment protection has become less tight □
Production is outsourced in markets where labour is cheaper □
Price inflation and inflation expectations are lower and more stable □
The next six questions investigate how your firm adjusts wages, prices, total costs, employment and margins to shocks. In answering, for prices please refer to the “main product or service, defined as the one that generated the highest fraction of turnover in the “reference year”, and for employment and wages please refer to the main occupational group in your firm (as identified in question 1) 21 – How relevant are each one of the following strategies when your firm faces an unanticipated slowdown in demand ? Please tick an option for each line. not
relevant of little relevance
relevant very relevant
don’t know
Reduce prices □ □ □ □ □
Reduce margins □ □ □ □ □
Reduce output □ □ □ □ □
Reduce costs □ □ □ □ □
22 – If the reduction of costs is of any relevance in your answer to question 21, please indicate the main channel through which this goal is achieved: Please choose a single option, the most important factor.
Reduce base wages □
Reduce flexible wage components (for example bonuses, benefits, etc.) □
Reduce the number of permanent employees □
Reduce the number of temporary employees / other type of workers □
Adjust the number of hours worked per employee □
Reduce non-labour costs □
23 – How relevant are each one of the following strategies when your firm faces an unanticipated increase in the cost of an intermediate input (e.g. an oil price increase) affecting all firms in the market? Please tick an option for each line. not
relevant of little relevance relevant very
relevant don’t know
Increase prices □ □ □ □ □
Reduce margins □ □ □ □ □
Reduce output □ □ □ □ □
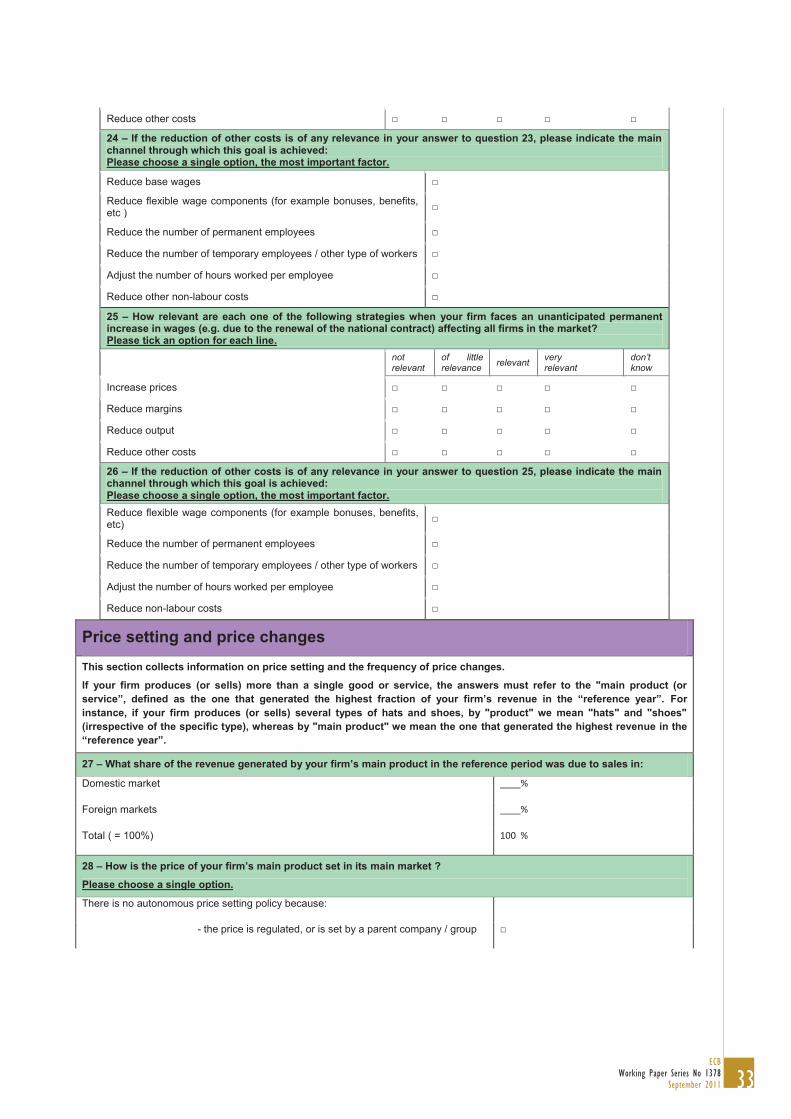
33ECB
Working Paper Series No 1378September 2011
Reduce other costs □ □ □ □ □
24 – If the reduction of other costs is of any relevance in your answer to question 23, please indicate the main channel through which this goal is achieved: Please choose a single option, the most important factor.
Reduce base wages □
Reduce flexible wage components (for example bonuses, benefits, etc ) □
Reduce the number of permanent employees □
Reduce the number of temporary employees / other type of workers □
Adjust the number of hours worked per employee □
Reduce other non-labour costs □
25 – How relevant are each one of the following strategies when your firm faces an unanticipated permanent increase in wages (e.g. due to the renewal of the national contract) affecting all firms in the market? Please tick an option for each line. not
relevant of little relevance relevant very
relevant don’t know
Increase prices □ □ □ □ □
Reduce margins □ □ □ □ □
Reduce output □ □ □ □ □
Reduce other costs □ □ □ □ □
26 – If the reduction of other costs is of any relevance in your answer to question 25, please indicate the main channel through which this goal is achieved: Please choose a single option, the most important factor. Reduce flexible wage components (for example bonuses, benefits, etc) □
Reduce the number of permanent employees □
Reduce the number of temporary employees / other type of workers □
Adjust the number of hours worked per employee □
Reduce non-labour costs □
Price setting and price changes
This section collects information on price setting and the frequency of price changes.
If your firm produces (or sells) more than a single good or service, the answers must refer to the "main product (or service”, defined as the one that generated the highest fraction of your firm’s revenue in the “reference year”. For instance, if your firm produces (or sells) several types of hats and shoes, by "product" we mean "hats" and "shoes" (irrespective of the specific type), whereas by "main product" we mean the one that generated the highest revenue in the “reference year”.
27 – What share of the revenue generated by your firm’s main product in the reference period was due to sales in:
Domestic market ____%
Foreign markets ____%
Total ( = 100%) 100 %
28 – How is the price of your firm’s main product set in its main market ?
Please choose a single option.
There is no autonomous price setting policy because:
- the price is regulated, or is set by a parent company / group □

34ECBWorking Paper Series No 1378September 2011
- the price is set by the main customer(s) □
The price is set following the main competitors □
The price is set fully according to costs and a completely self-determined profit margin □
Other (please specify) ___________________________________________________ □
29 – NON-CORE To what extent does your firm experience price competition for its main product?
Please choose a single one option.
Severe competition □
Strong competition □
Weak competition □
No competition □
Don’t know / no answer □
30 – Suppose that the main competitor for your firm’s main product decreases its prices; how likely is your firm to react by decreasing its own price?
Please choose a single option.
Very likely □
Likely □
Not likely □
Not at all □
It doesn’t apply □
31 – Under normal circumstances, how often is the price of the firm’s main product typically changed?
Please choose a single option, the one that best describes the situation in your firm
More than once a year:
- daily □
- weekly □
- monthly □
- quarterly □
- half-yearly □
Once a year □
Once every two years □
Less frequently than once every two years □
Never □
There is not a defined pattern □
32 – Under normal circumstances, are these price changes concentrated in any particular month / months?
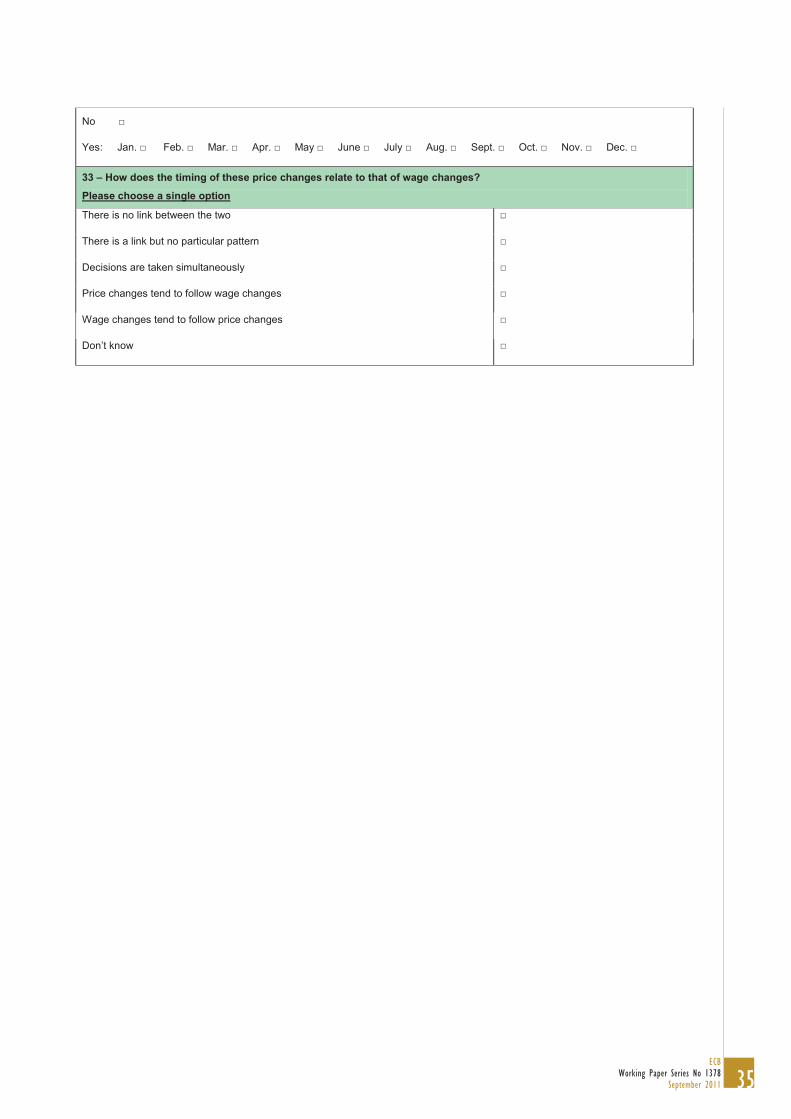
35ECB
Working Paper Series No 1378September 2011
No □
Yes: Jan. □ Feb. □ Mar. □ Apr. □ May □ June □ July □ Aug. □ Sept. □ Oct. □ Nov. □ Dec. □
33 – How does the timing of these price changes relate to that of wage changes?
Please choose a single option
There is no link between the two □
There is a link but no particular pattern □
Decisions are taken simultaneously □
Price changes tend to follow wage changes □
Wage changes tend to follow price changes □
Don’t know □

36ECBWorking Paper Series No 1378September 2011
Information about the firm
34 – How many workers (including employees and other types of workers) did your firm have at the end of the reference period?
Definition of employees is provided in the Appendix. Other definitions: Permanent full-time - those who have no set termination date, and whose regular working hours are the same as the collectively agreed or customarily worked.
Permanent part-time - those who have no set termination date, whose working hours are less than those specified for permanent full-time.
Temporary - those who have a set termination date or a specific period of employment.
Number of employees: _______________
of which:
(fill in one of the two columns, as you prefer: levels or %) Percentages Number
permanent full-time _____ % _______________
permanent part-time _____ % _______________
temporary _____ % _______________
TOTAL ( = 100%) 100 %
Number of other types of workers (e.g. people employed by agencies, freelance, consultants, apprenticeships, students, other casual workers, etc.)
Number
_______________
35 – How many employees left the firm during the reference period?
Please refer to all types of employees: temporary and permanent, see definition in question 34.
_______________
36 – How many employees joined the firm during the reference period?
Please refer to all types of employees: temporary and permanent, see definition in question 34.
_______________
37 – NON-CORE How were your firm’s employees distributed across the following age classes at the end of the reference period?
Less than 24 years old _____ %
24-54 years old _____ %
55-65 years old _____ %
>65 years old _____ %
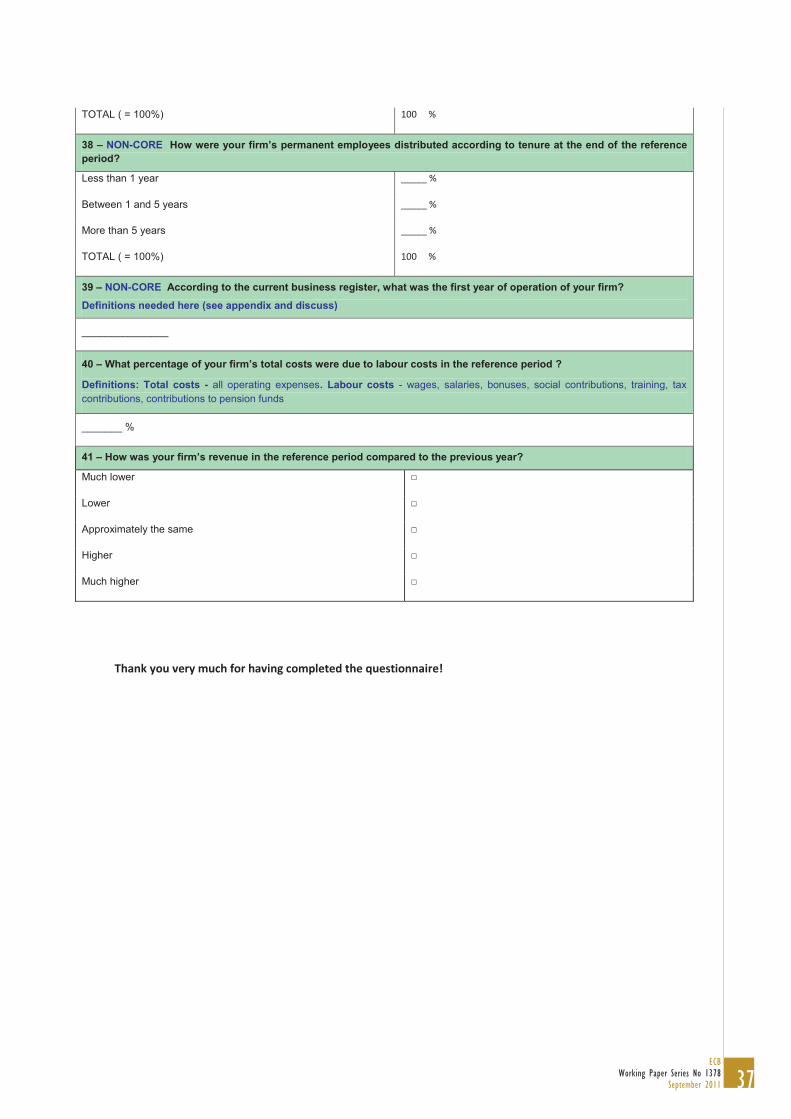
37ECB
Working Paper Series No 1378September 2011
TOTAL ( = 100%) 100 %
38 – NON-CORE How were your firm’s permanent employees distributed according to tenure at the end of the reference period?
Less than 1 year _____ %
Between 1 and 5 years _____ %
More than 5 years _____ %
TOTAL ( = 100%) 100 %
39 – NON-CORE According to the current business register, what was the first year of operation of your firm?
Definitions needed here (see appendix and discuss)
_______________
40 – What percentage of your firm’s total costs were due to labour costs in the reference period ?
Definitions: Total costs - all operating expenses. Labour costs - wages, salaries, bonuses, social contributions, training, tax contributions, contributions to pension funds
_______ %
41 – How was your firm’s revenue in the reference period compared to the previous year?
Much lower □
Lower □
Approximately the same □
Higher □
Much higher □
Thank you very much for having completed the questionnaire!
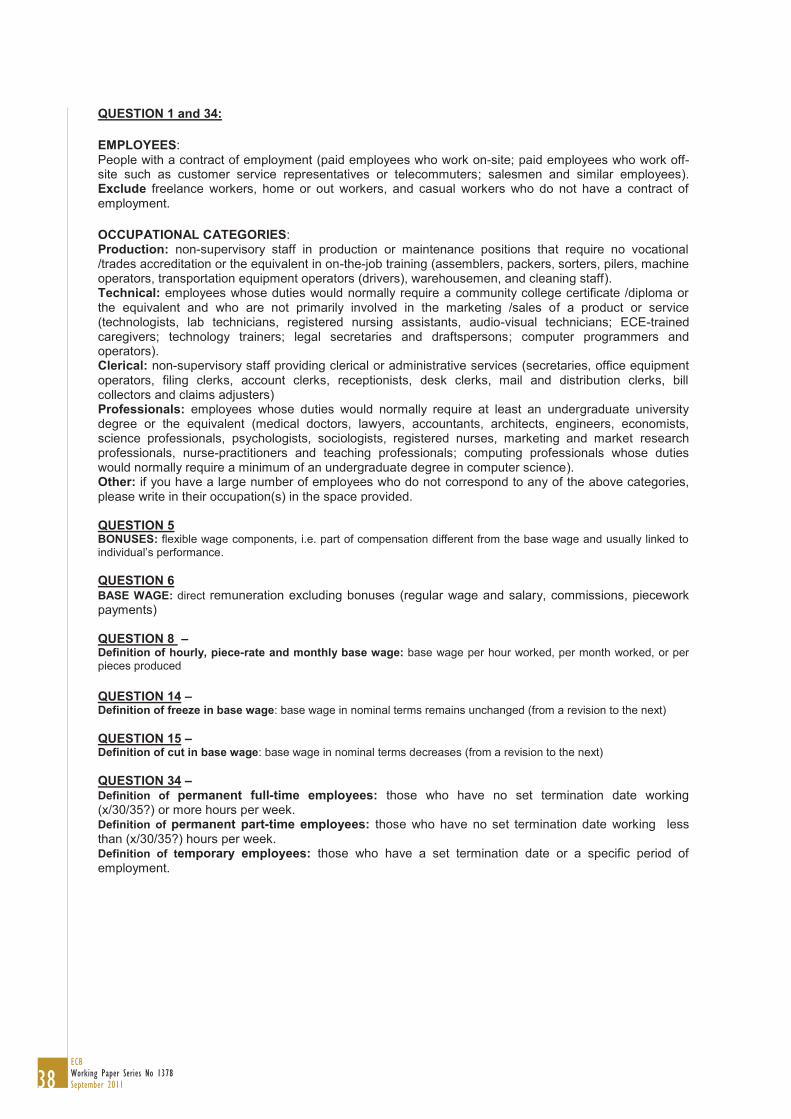
38ECBWorking Paper Series No 1378September 2011
QUESTION 1 and 34: EMPLOYEES: People with a contract of employment (paid employees who work on-site; paid employees who work off-site such as customer service representatives or telecommuters; salesmen and similar employees). Exclude freelance workers, home or out workers, and casual workers who do not have a contract of employment. OCCUPATIONAL CATEGORIES: Production: non-supervisory staff in production or maintenance positions that require no vocational /trades accreditation or the equivalent in on-the-job training (assemblers, packers, sorters, pilers, machine operators, transportation equipment operators (drivers), warehousemen, and cleaning staff). Technical: employees whose duties would normally require a community college certificate /diploma or the equivalent and who are not primarily involved in the marketing /sales of a product or service (technologists, lab technicians, registered nursing assistants, audio-visual technicians; ECE-trained caregivers; technology trainers; legal secretaries and draftspersons; computer programmers and operators). Clerical: non-supervisory staff providing clerical or administrative services (secretaries, office equipment operators, filing clerks, account clerks, receptionists, desk clerks, mail and distribution clerks, bill collectors and claims adjusters) Professionals: employees whose duties would normally require at least an undergraduate university degree or the equivalent (medical doctors, lawyers, accountants, architects, engineers, economists, science professionals, psychologists, sociologists, registered nurses, marketing and market research professionals, nurse-practitioners and teaching professionals; computing professionals whose duties would normally require a minimum of an undergraduate degree in computer science). Other: if you have a large number of employees who do not correspond to any of the above categories, please write in their occupation(s) in the space provided. QUESTION 5 BONUSES: flexible wage components, i.e. part of compensation different from the base wage and usually linked to individual’s performance. QUESTION 6 BASE WAGE: direct remuneration excluding bonuses (regular wage and salary, commissions, piecework payments) QUESTION 8 – Definition of hourly, piece-rate and monthly base wage: base wage per hour worked, per month worked, or per pieces produced QUESTION 14 – Definition of freeze in base wage: base wage in nominal terms remains unchanged (from a revision to the next) QUESTION 15 – Definition of cut in base wage: base wage in nominal terms decreases (from a revision to the next) QUESTION 34 – Definition of permanent full-time employees: those who have no set termination date working (x/30/35?) or more hours per week. Definition of permanent part-time employees: those who have no set termination date working less than (x/30/35?) hours per week. Definition of temporary employees: those who have a set termination date or a specific period of employment.

39ECB
Working Paper Series No 1378September 2011
QUESTION 39 – It should be decided whether this includes: Change of name, Change of address, Change of activity, takeover / merger, being sold by parent organisation, Ex-public sector, now privatised / denationalised, Management buy-out, Buy-out by employees generally, etc QUESTION 40 – Total costs: all operating expenses Labour costs: wages, salaries,bonuses, social contributions, training, tax contributions, contributions to pension funds. From the employers point of view these are often grouped as: direct remuneration (direct pay for time worked and bonuses); other direct cost (payments in kind, payment in capital and remuneration for non working days); indirect cost (soc. sec. contributions , vocational training and miscellaneous taxes).

40ECBWorking Paper Series No 1378September 2011
B The measurement of price and wage durations
This Appendix discusses the creation of the wage and price duration measures from the frequency
answers in the WDN survey. The Appendix is reprinted from Druant et al. (2008).
The WDN survey asks questions on the frequency of price changes (the price of the firm's main product)
and wage changes (the base wage of the firm's typical worker). The answers to those frequency
questions identify the duration of prices and wages with the help of a few additional assumptions. Price
and wage duration can be interpreted as the time interval for which these variables remain unchanged.
The frequency answers identify points and intervals on the support of the duration distribution. Most
frequency answers are points (e.g. once a year), which translate directly into durations. Some answers
are intervals (e.g. more than once a year), which call for the imputation of expected durations within
each interval. Such imputations require distributional assumptions. Three such interval answers appear
in the survey: a) expected wage duration if it is shorter than one year (frequency more than once a
year); b) expected wage duration if it is longer than two years (frequency less than once every two
years); c) expected price duration if it is longer than one year (frequency less than yearly).
We assume a lognormal distribution for both wage and price durations. Note that the support of the
lognormal is the positive real line appropriate for durations, and the shape of the histogram of point
answers is close to the shape of a lognormal density function both for wages and prices. The
distributional assumption is necessarily ad-hoc but it is consistent with a positive support of durations.
At the same time, the reported large mass of probability at specific points (e.g. once a year that
translates into 12 months exactly) is at odds with the lognormal or any other continuous distribution.
With these caveats in mind, one should think of the duration results as being an approximation.
We define durations in months. Let denote the duration of wages and the duration of prices. As
already mentioned, the three durations that need to be imputed are the following:
The sufficient statistics for the computation of expected durations are derived from point answers.
Denote the answers to the wage change frequency question by so that refers to more than once
a year, to once a year, to once every two years, and to less frequently than once every two
years. Similarly, denote the answers to the price change frequency question by so that refers to
𝑑𝑤 𝑑𝑝
𝐸[𝑑𝑤|𝑑𝑤 < 12], 𝐸[𝑑𝑤|𝑑𝑤 > 24], 𝐸�𝑑𝑝|𝑑𝑝 > 12�.
𝜏𝑤𝜏𝑤4
𝜏𝑤1 𝜏𝑤2 𝜏𝑤3
𝑝𝑗 𝜏𝑝1𝜏𝑝
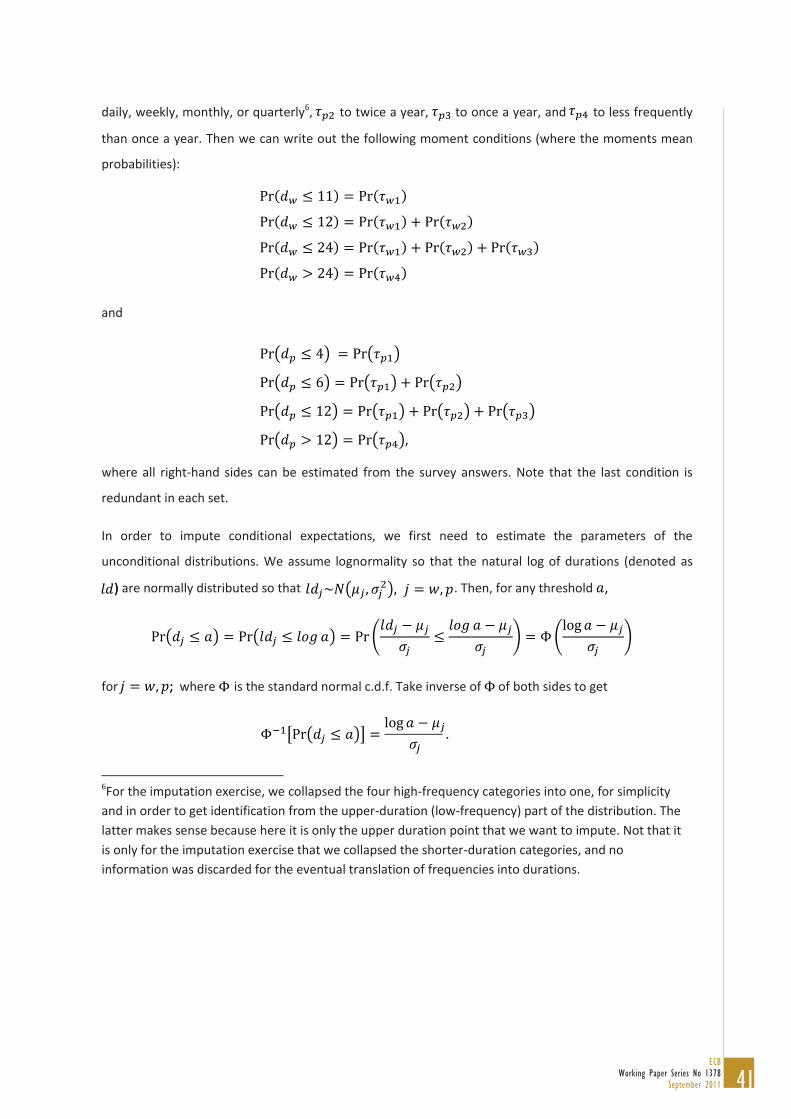
41ECB
Working Paper Series No 1378September 2011
daily, weekly, monthly, or quarterly6, to twice a year, to once a year, and to less frequently
than once a year. Then we can write out the following moment conditions (where the moments mean
probabilities):
and
where all right-hand sides can be estimated from the survey answers. Note that the last condition is
redundant in each set.
In order to impute conditional expectations, we first need to estimate the parameters of the
unconditional distributions. We assume lognormality so that the natural log of durations (denoted as
) are normally distributed so that
for ; where is the standard normal c.d.f. Take inverse of of both sides to get
6For the imputation exercise, we collapsed the four high-frequency categories into one, for simplicity and in order to get identification from the upper-duration (low-frequency) part of the distribution. The latter makes sense because here it is only the upper duration point that we want to impute. Not that it is only for the imputation exercise that we collapsed the shorter-duration categories, and no information was discarded for the eventual translation of frequencies into durations.
𝜏𝑝2 𝜏𝑝3 𝜏𝑝4
Pr(𝑑𝑤 ≤ 11) = Pr(𝜏𝑤1)
Pr(𝑑𝑤 ≤ 12) = Pr(𝜏𝑤1) + Pr(𝜏𝑤2)
Pr(𝑑𝑤 ≤ 24) = Pr(𝜏𝑤1) + Pr(𝜏𝑤2) + Pr(𝜏𝑤3)
Pr(𝑑𝑤 > 24) = Pr(𝜏𝑤4)
Pr�𝑑𝑝 ≤ 4� = Pr�𝜏𝑝1�
Pr�𝑑𝑝 ≤ 6� = Pr�𝜏𝑝1� + Pr�𝜏𝑝2�
Pr�𝑑𝑝 ≤ 12� = Pr�𝜏𝑝1� + Pr�𝜏𝑝2� + Pr�𝜏𝑝3�
Pr�𝑑𝑝 > 12� = Pr�𝜏𝑝4�,
𝑙𝑑) 𝑙𝑑𝑗~𝑁�𝜇𝑗 ,𝜎𝑗2�, 𝑗 = 𝑤,𝑝. Then, for any threshold 𝑎,
Pr�𝑑𝑗 ≤ 𝑎� = Pr�𝑙𝑑𝑗 ≤ 𝑙𝑜𝑔 𝑎� = Pr�𝑙𝑑𝑗 − 𝜇𝑗
𝜎𝑗≤𝑙𝑜𝑔 𝑎 − 𝜇𝑗
𝜎𝑗� = Φ�
log𝑎 − 𝜇𝑗𝜎𝑗
�
𝑗 = 𝑤,𝑝; Φ Φ
Φ−1�Pr�𝑑𝑗 ≤ 𝑎�� =log𝑎 − 𝜇𝑗
𝜎𝑗.
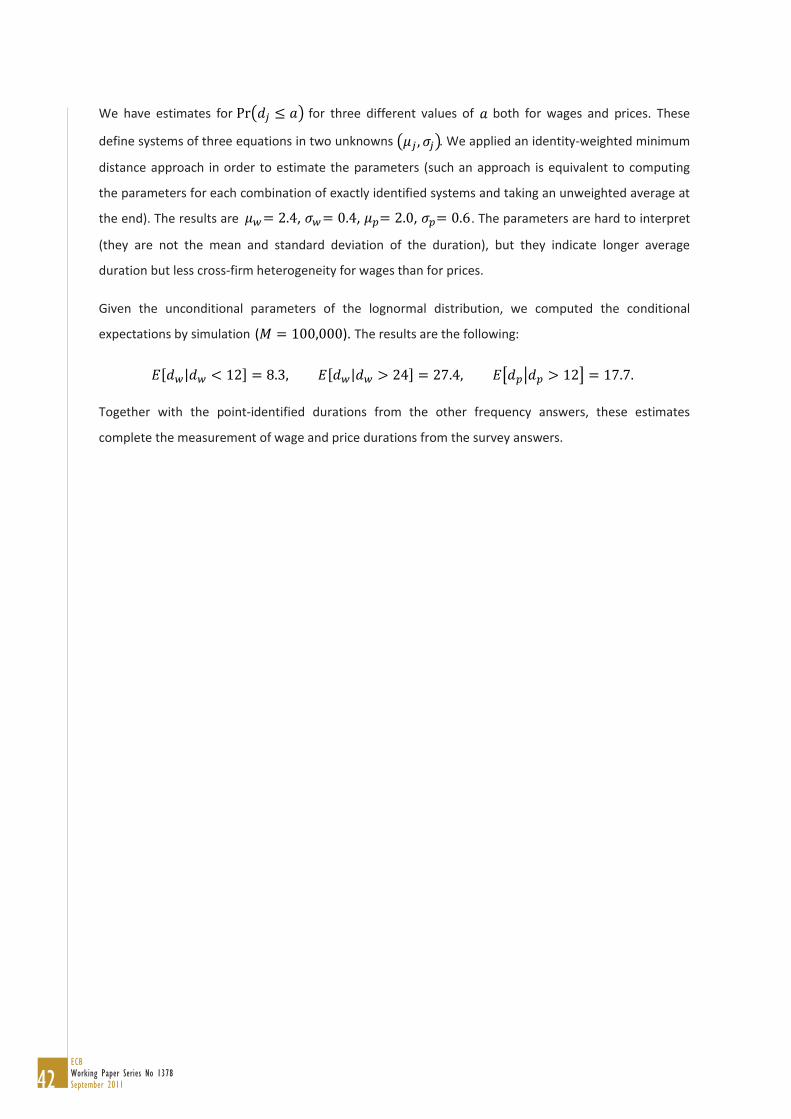
42ECBWorking Paper Series No 1378September 2011
We have estimates for for three different values of both for wages and prices. These
define systems of three equations in two unknowns . We applied an identity-weighted minimum
distance approach in order to estimate the parameters (such an approach is equivalent to computing
the parameters for each combination of exactly identified systems and taking an unweighted average at
the end). The results are . The parameters are hard to interpret
(they are not the mean and standard deviation of the duration), but they indicate longer average
duration but less cross-firm heterogeneity for wages than for prices.
Given the unconditional parameters of the lognormal distribution, we computed the conditional
Together with the point-identified durations from the other frequency answers, these estimates
complete the measurement of wage and price durations from the survey answers.
Pr�𝑑𝑗 ≤ 𝑎� 𝑎
�𝜇𝑗 ,𝜎𝑗�
𝜇 = 2.4, 𝜎𝑤= 0.4, 𝜇𝑝= 2.0, 𝜎𝑝= 0.6𝑤
(𝑀 = 100,000). expectations by simulation The results are the following:
𝐸[𝑑𝑤|𝑑𝑤 < 12] = 8.3, 𝐸[𝑑𝑤|𝑑𝑤 > 24] = 27.4, 𝐸�𝑑𝑝�𝑑𝑝 > 12� = 17.7.
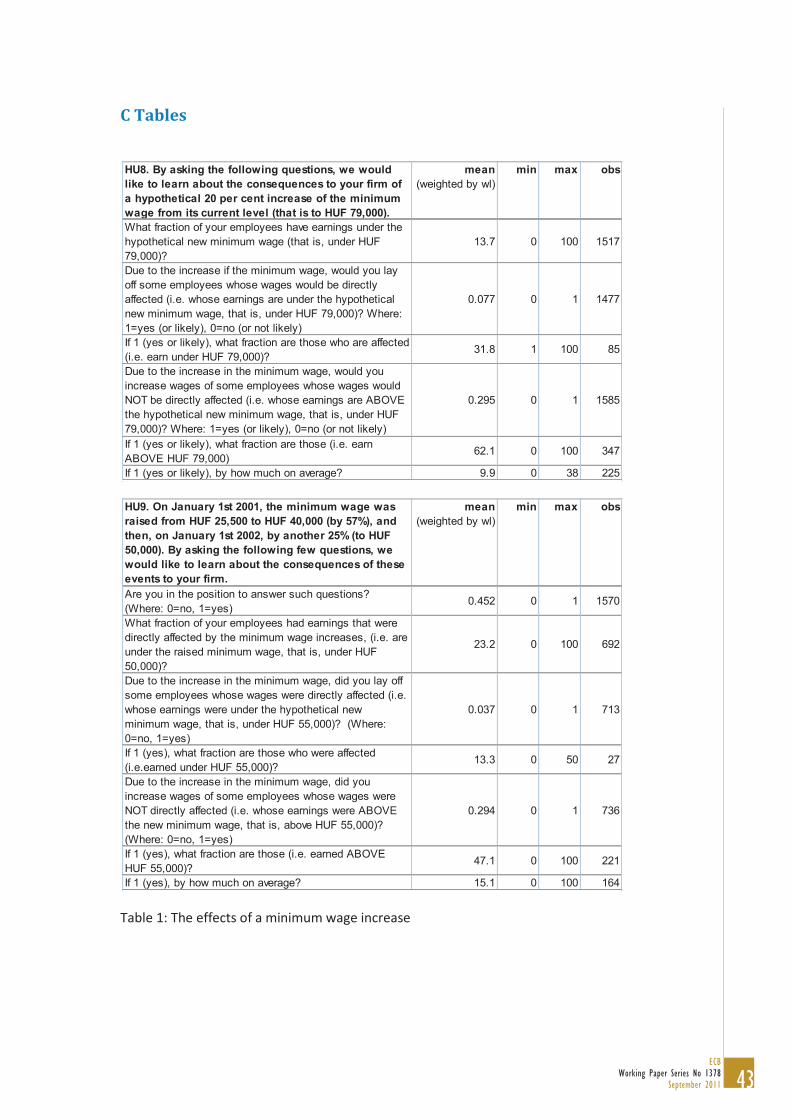
43ECB
Working Paper Series No 1378September 2011
C Tables
Table 1: The effects of a minimum wage increase
HU8. By asking the following questions, we would like to learn about the consequences to your firm of a hypothetical 20 per cent increase of the minimum wage from its current level (that is to HUF 79,000).
mean (weighted by wl)
min max obs
What fraction of your employees have earnings under the hypothetical new minimum wage (that is, under HUF 79,000)?
13.7 0 100 1517
Due to the increase if the minimum wage, would you lay off some employees whose wages would be directly affected (i.e. whose earnings are under the hypothetical new minimum wage, that is, under HUF 79,000)? Where: 1=yes (or likely), 0=no (or not likely)
0.077 0 1 1477
If 1 (yes or likely), what fraction are those who are affected (i.e. earn under HUF 79,000)?
31.8 1 100 85
Due to the increase in the minimum wage, would you increase wages of some employees whose wages would NOT be directly affected (i.e. whose earnings are ABOVE the hypothetical new minimum wage, that is, under HUF 79,000)? Where: 1=yes (or likely), 0=no (or not likely)
0.295 0 1 1585
If 1 (yes or likely), what fraction are those (i.e. earn ABOVE HUF 79,000)
62.1 0 100 347
If 1 (yes or likely), by how much on average? 9.9 0 38 225
HU9. On January 1st 2001, the minimum wage was raised from HUF 25,500 to HUF 40,000 (by 57%), and then, on January 1st 2002, by another 25% (to HUF 50,000). By asking the following few questions, we would like to learn about the consequences of these events to your firm.
mean (weighted by wl)
min max obs
Are you in the position to answer such questions? (Where: 0=no, 1=yes)
0.452 0 1 1570
What fraction of your employees had earnings that were directly affected by the minimum wage increases, (i.e. are under the raised minimum wage, that is, under HUF 50,000)?
23.2 0 100 692
Due to the increase in the minimum wage, did you lay off some employees whose wages were directly affected (i.e. whose earnings were under the hypothetical new minimum wage, that is, under HUF 55,000)? (Where: 0=no, 1=yes)
0.037 0 1 713
If 1 (yes), what fraction are those who were affected (i.e.earned under HUF 55,000)?
13.3 0 50 27
Due to the increase in the minimum wage, did you increase wages of some employees whose wages were NOT directly affected (i.e. whose earnings were ABOVE the new minimum wage, that is, above HUF 55,000)? (Where: 0=no, 1=yes)
0.294 0 1 736
If 1 (yes), what fraction are those (i.e. earned ABOVE HUF 55,000)?
47.1 0 100 221
If 1 (yes), by how much on average? 15.1 0 100 164
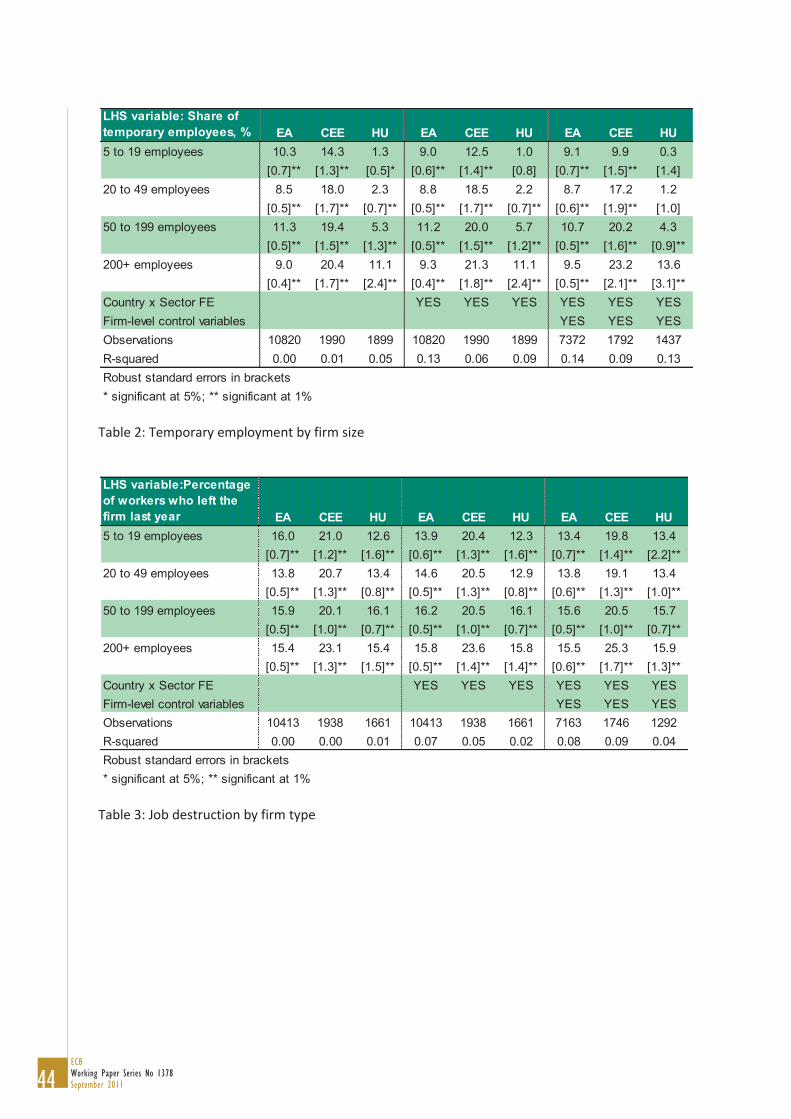
44ECBWorking Paper Series No 1378September 2011
Table 2: Temporary employment by firm size
Table 3: Job destruction by firm type
LHS variable: Share of temporary employees, % EA CEE HU EA CEE HU EA CEE HU5 to 19 employees 10.3 14.3 1.3 9.0 12.5 1.0 9.1 9.9 0.3
[0.7]** [1.3]** [0.5]* [0.6]** [1.4]** [0.8] [0.7]** [1.5]** [1.4]20 to 49 employees 8.5 18.0 2.3 8.8 18.5 2.2 8.7 17.2 1.2
[0.5]** [1.7]** [0.7]** [0.5]** [1.7]** [0.7]** [0.6]** [1.9]** [1.0]50 to 199 employees 11.3 19.4 5.3 11.2 20.0 5.7 10.7 20.2 4.3
[0.5]** [1.5]** [1.3]** [0.5]** [1.5]** [1.2]** [0.5]** [1.6]** [0.9]**200+ employees 9.0 20.4 11.1 9.3 21.3 11.1 9.5 23.2 13.6
[0.4]** [1.7]** [2.4]** [0.4]** [1.8]** [2.4]** [0.5]** [2.1]** [3.1]**Country x Sector FE YES YES YES YES YES YESFirm-level control variables YES YES YESObservations 10820 1990 1899 10820 1990 1899 7372 1792 1437R-squared 0.00 0.01 0.05 0.13 0.06 0.09 0.14 0.09 0.13Robust standard errors in brackets* significant at 5%; ** significant at 1%
LHS variable:Percentage of workers who left the firm last year EA CEE HU EA CEE HU EA CEE HU5 to 19 employees 16.0 21.0 12.6 13.9 20.4 12.3 13.4 19.8 13.4
[0.7]** [1.2]** [1.6]** [0.6]** [1.3]** [1.6]** [0.7]** [1.4]** [2.2]**20 to 49 employees 13.8 20.7 13.4 14.6 20.5 12.9 13.8 19.1 13.4
[0.5]** [1.3]** [0.8]** [0.5]** [1.3]** [0.8]** [0.6]** [1.3]** [1.0]**50 to 199 employees 15.9 20.1 16.1 16.2 20.5 16.1 15.6 20.5 15.7
[0.5]** [1.0]** [0.7]** [0.5]** [1.0]** [0.7]** [0.5]** [1.0]** [0.7]**200+ employees 15.4 23.1 15.4 15.8 23.6 15.8 15.5 25.3 15.9
[0.5]** [1.3]** [1.5]** [0.5]** [1.4]** [1.4]** [0.6]** [1.7]** [1.3]**Country x Sector FE YES YES YES YES YES YESFirm-level control variables YES YES YESObservations 10413 1938 1661 10413 1938 1661 7163 1746 1292R-squared 0.00 0.00 0.01 0.07 0.05 0.02 0.08 0.09 0.04Robust standard errors in brackets* significant at 5%; ** significant at 1%
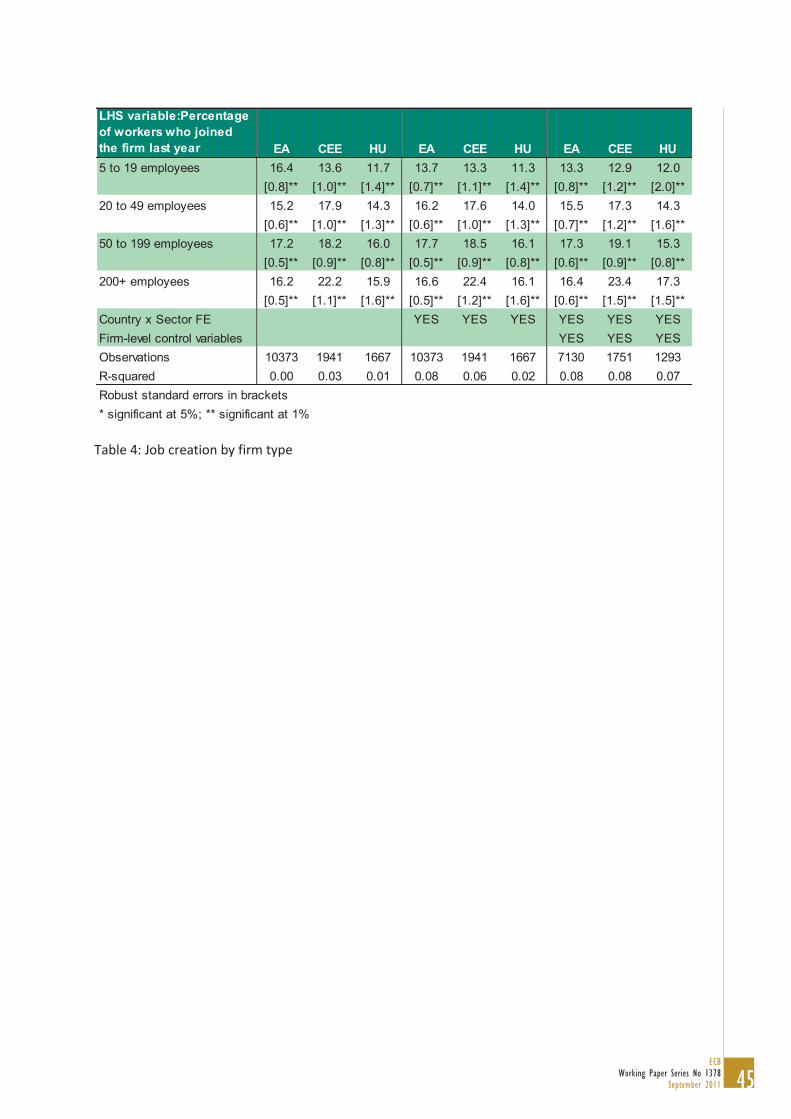
45ECB
Working Paper Series No 1378September 2011
Table 4: Job creation by firm type
LHS variable:Percentage of workers who joined the firm last year EA CEE HU EA CEE HU EA CEE HU5 to 19 employees 16.4 13.6 11.7 13.7 13.3 11.3 13.3 12.9 12.0
[0.8]** [1.0]** [1.4]** [0.7]** [1.1]** [1.4]** [0.8]** [1.2]** [2.0]**20 to 49 employees 15.2 17.9 14.3 16.2 17.6 14.0 15.5 17.3 14.3
[0.6]** [1.0]** [1.3]** [0.6]** [1.0]** [1.3]** [0.7]** [1.2]** [1.6]**50 to 199 employees 17.2 18.2 16.0 17.7 18.5 16.1 17.3 19.1 15.3
[0.5]** [0.9]** [0.8]** [0.5]** [0.9]** [0.8]** [0.6]** [0.9]** [0.8]**200+ employees 16.2 22.2 15.9 16.6 22.4 16.1 16.4 23.4 17.3
[0.5]** [1.1]** [1.6]** [0.5]** [1.2]** [1.6]** [0.6]** [1.5]** [1.5]**Country x Sector FE YES YES YES YES YES YESFirm-level control variables YES YES YESObservations 10373 1941 1667 10373 1941 1667 7130 1751 1293R-squared 0.00 0.03 0.01 0.08 0.06 0.02 0.08 0.08 0.07Robust standard errors in brackets* significant at 5%; ** significant at 1%
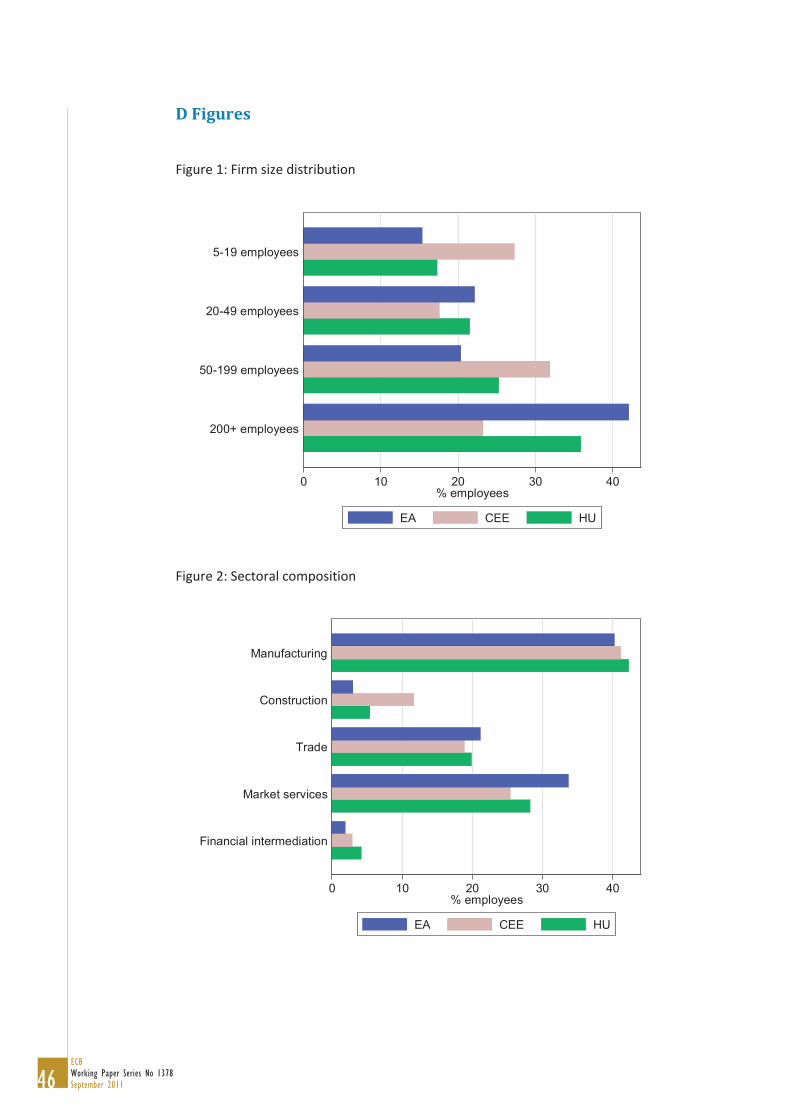
46ECBWorking Paper Series No 1378September 2011
D Figures
Figure 1: Firm size distribution
Figure 2: Sectoral composition
0 10 20 30 40% employees
200+ employees
50-199 employees
20-49 employees
5-19 employees
EA CEE HU
0 10 20 30 40% employees
Financial intermediation
Market services
Trade
Construction
Manufacturing
EA CEE HU
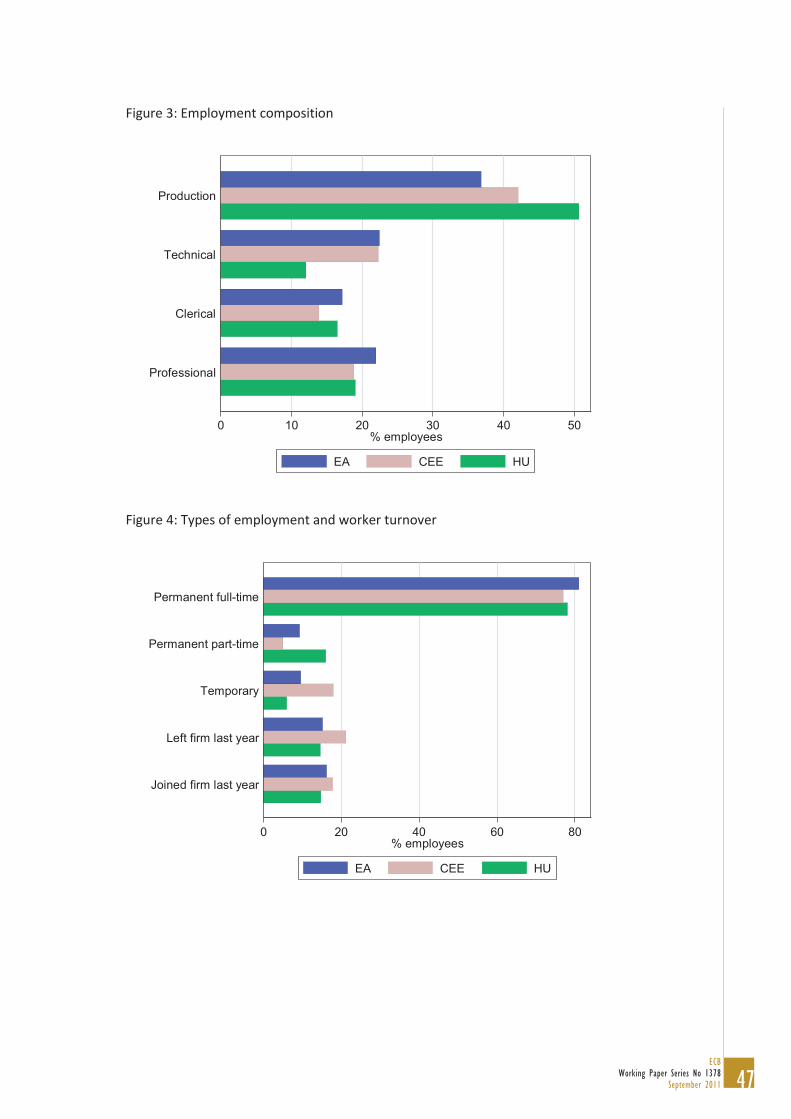
47ECB
Working Paper Series No 1378September 2011
Figure 3: Employment composition
Figure 4: Types of employment and worker turnover
0 10 20 30 40 50% employees
Professional
Clerical
Technical
Production
EA CEE HU
0 20 40 60 80% employees
Joined firm last year
Left firm last year
Temporary
Permanent part-time
Permanent full-time
EA CEE HU
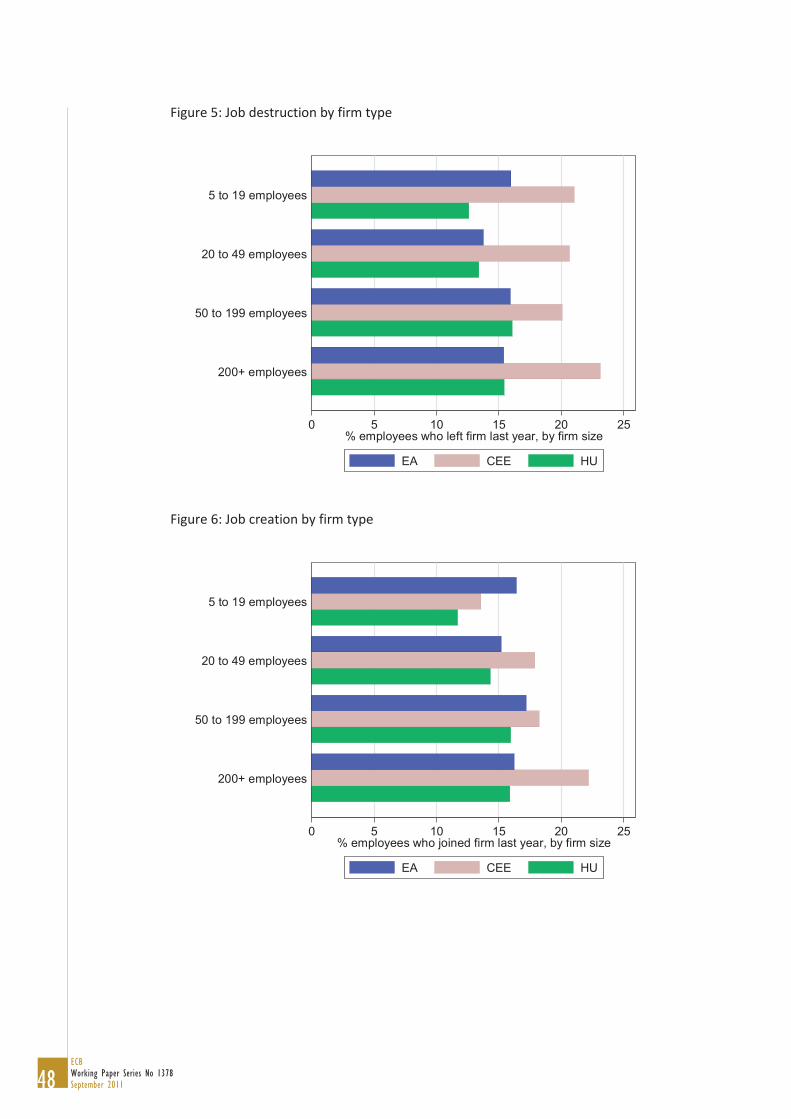
48ECBWorking Paper Series No 1378September 2011
Figure 5: Job destruction by firm type
Figure 6: Job creation by firm type
0 5 10 15 20 25% employees who left firm last year, by firm size
200+ employees
50 to 199 employees
20 to 49 employees
5 to 19 employees
EA CEE HU
0 5 10 15 20 25% employees who joined firm last year, by firm size
200+ employees
50 to 199 employees
20 to 49 employees
5 to 19 employees
EA CEE HU
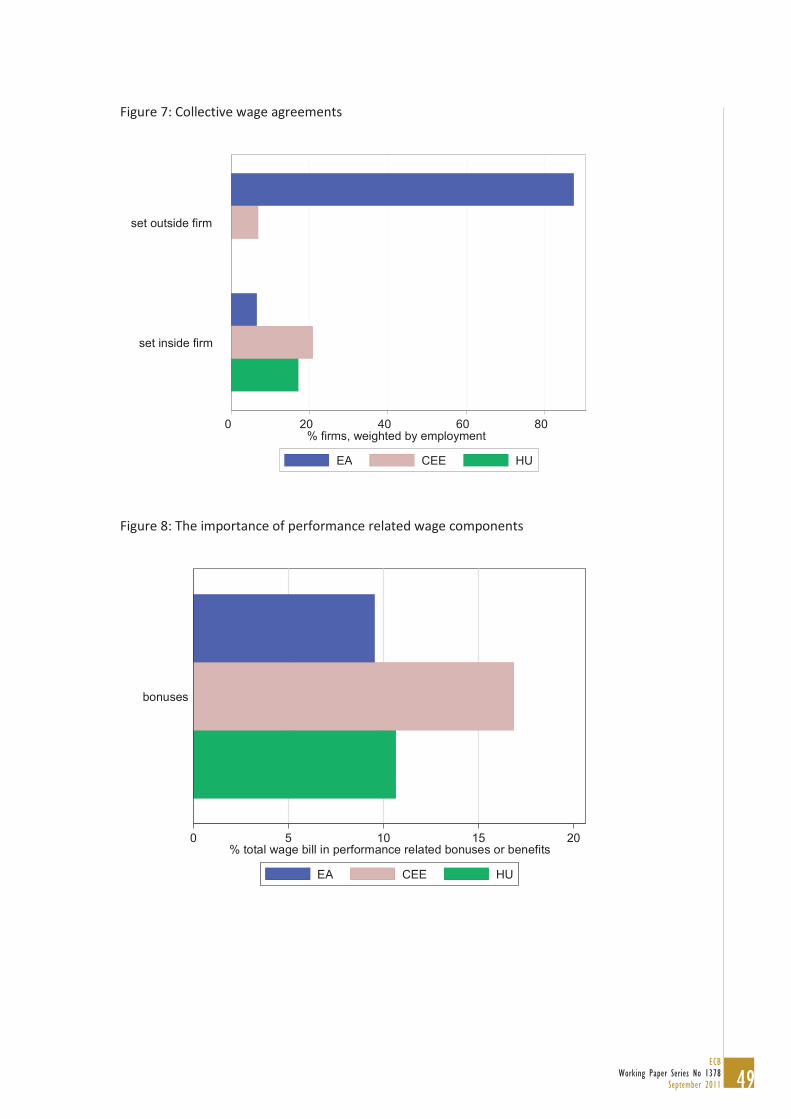
49ECB
Working Paper Series No 1378September 2011
Figure 7: Collective wage agreements
Figure 8: The importance of performance related wage components
0 5 10 15 20% total wage bill in performance related bonuses or benefits
bonuses
EA CEE HU
0 20 40 60 80 % firms, weighted by employment
set inside firm
set outside firm
EA CEE HU
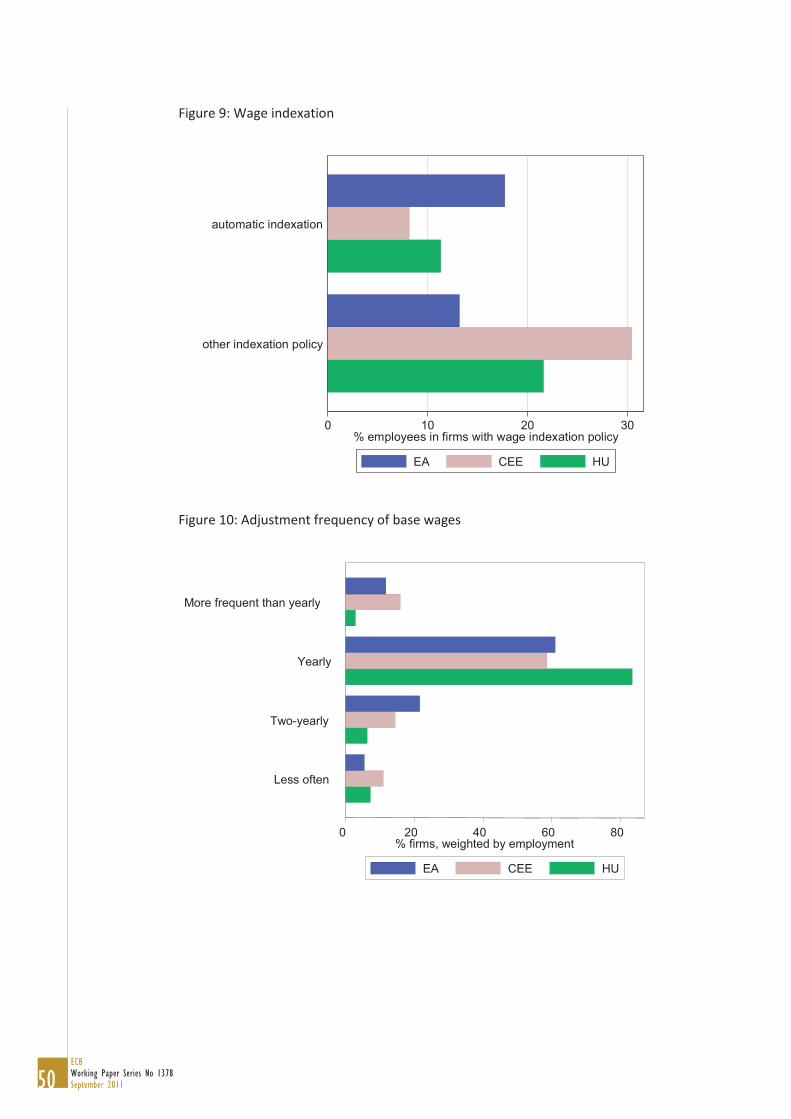
50ECBWorking Paper Series No 1378September 2011
Figure 9: Wage indexation
Figure 10: Adjustment frequency of base wages
0 10 20 30% employees in firms with wage indexation policy
other indexation policy
automatic indexation
EA CEE HU
0 20 40 60 80 % firms, weighted by employment
Less often
Two-yearly
Yearly
More frequent than yearly
EA CEE HU
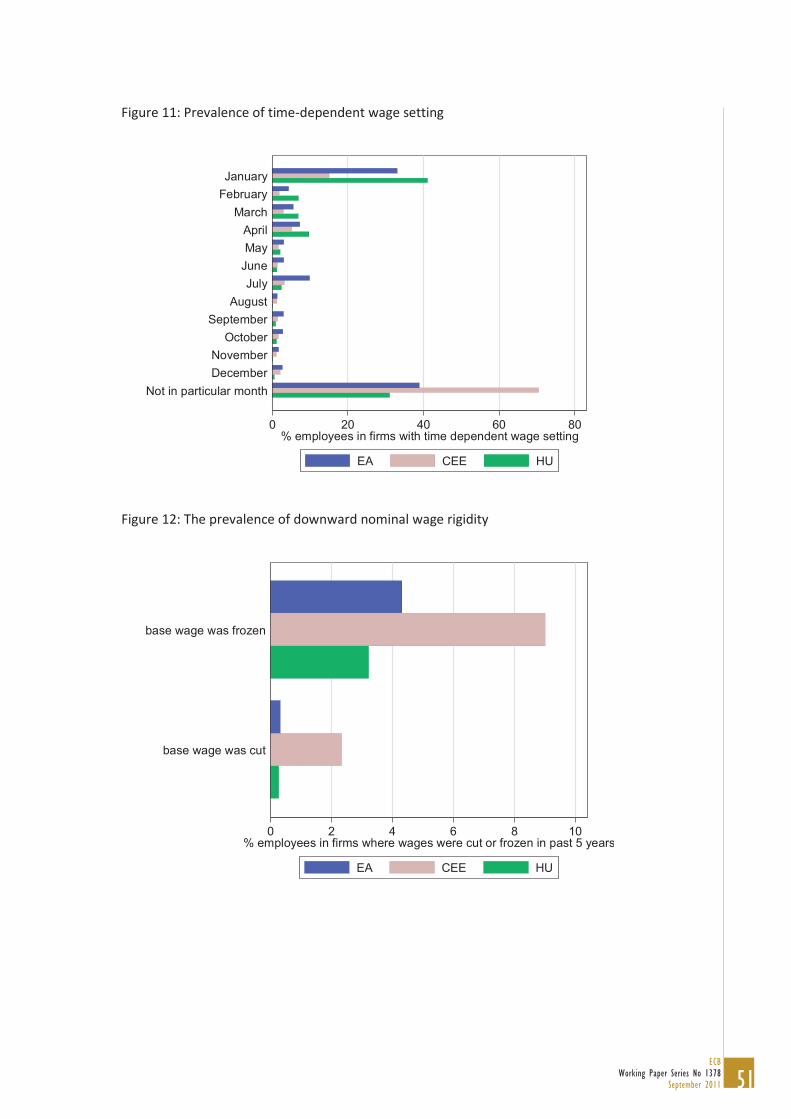
51ECB
Working Paper Series No 1378September 2011
Figure 11: Prevalence of time-dependent wage setting
Figure 12: The prevalence of downward nominal wage rigidity
0 20 40 60 80% employees in firms with time dependent wage setting
Not in particular monthDecemberNovember
OctoberSeptember
AugustJuly
JuneMayApril
MarchFebruaryJanuary
EA CEE HU
0 2 4 6 8 10% employees in firms where wages were cut or frozen in past 5 years
base wage was cut
base wage was frozen
EA CEE HU
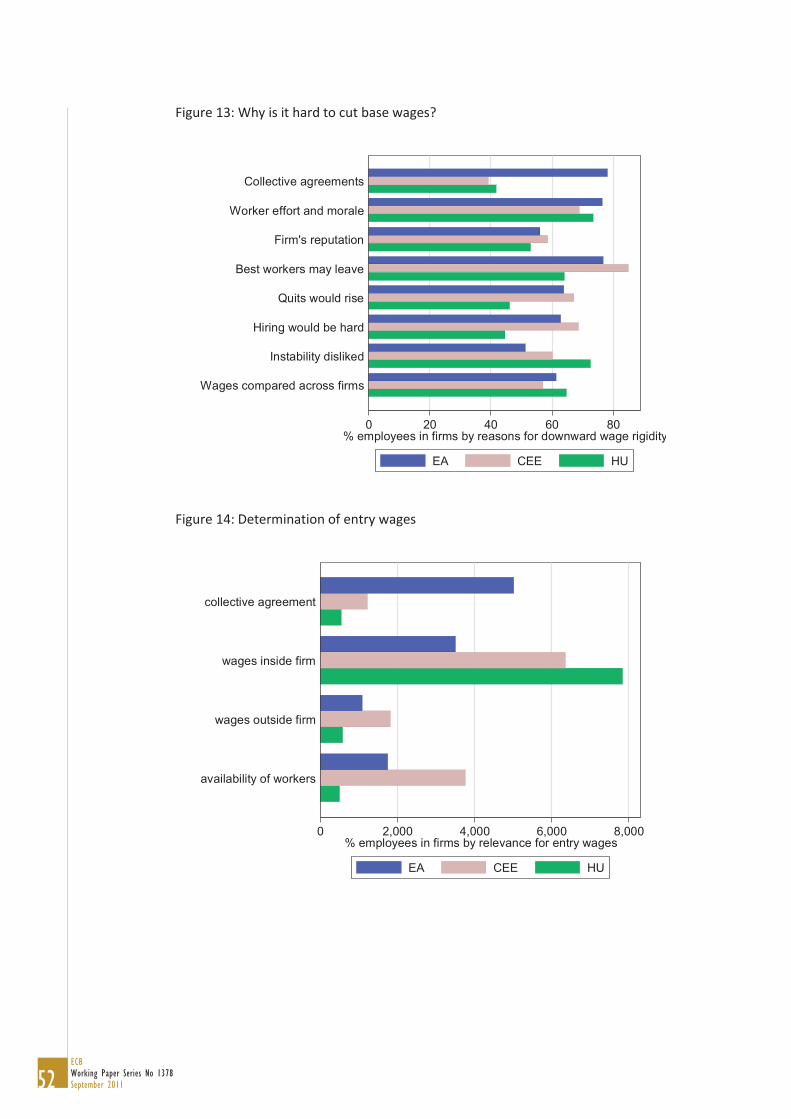
52ECBWorking Paper Series No 1378September 2011
Figure 13: Why is it hard to cut base wages?
Figure 14: Determination of entry wages
0 20 40 60 80% employees in firms by reasons for downward wage rigidity
Wages compared across firms
Instability disliked
Hiring would be hard
Quits would rise
Best workers may leave
Firm's reputation
Worker effort and morale
Collective agreements
EA CEE HU
0 2,000 4,000 6,000 8,000% employees in firms by relevance for entry wages
availability of workers
wages outside firm
wages inside firm
collective agreement
EA CEE HU
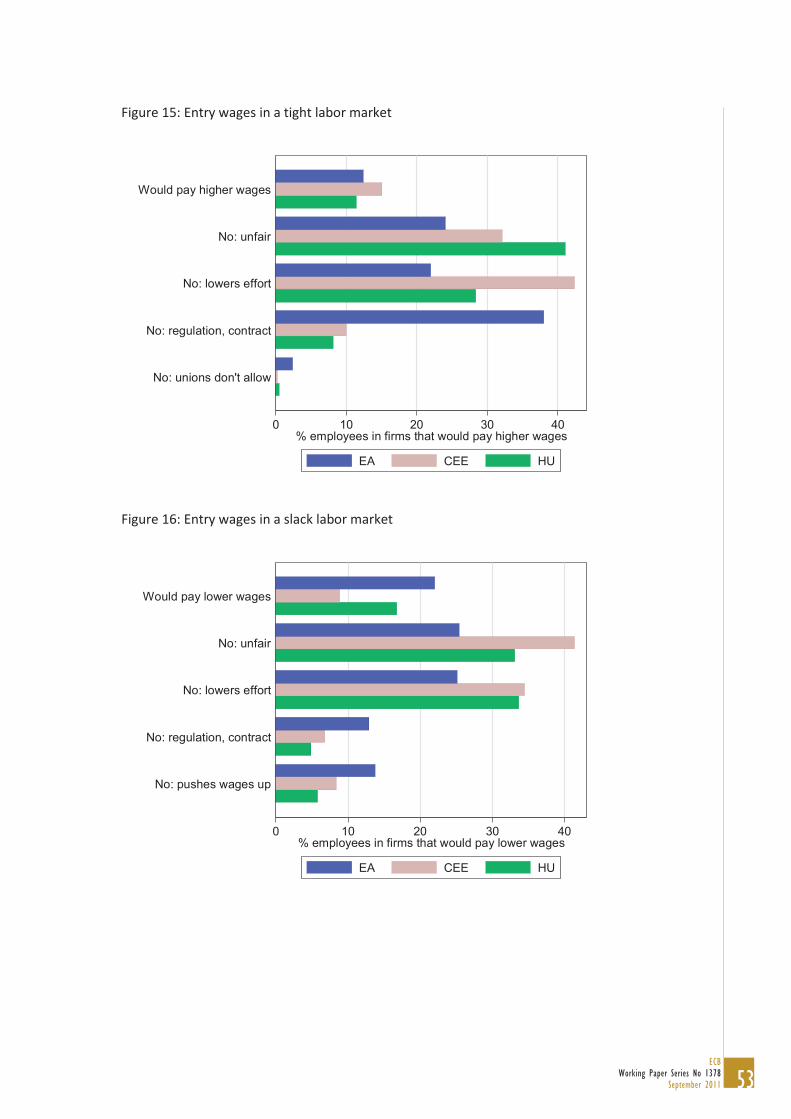
53ECB
Working Paper Series No 1378September 2011
Figure 15: Entry wages in a tight labor market
Figure 16: Entry wages in a slack labor market
0 10 20 30 40% employees in firms that would pay higher wages
No: unions don't allow
No: regulation, contract
No: lowers effort
No: unfair
Would pay higher wages
EA CEE HU
0 10 20 30 40% employees in firms that would pay lower wages
No: pushes wages up
No: regulation, contract
No: lowers effort
No: unfair
Would pay lower wages
EA CEE HU
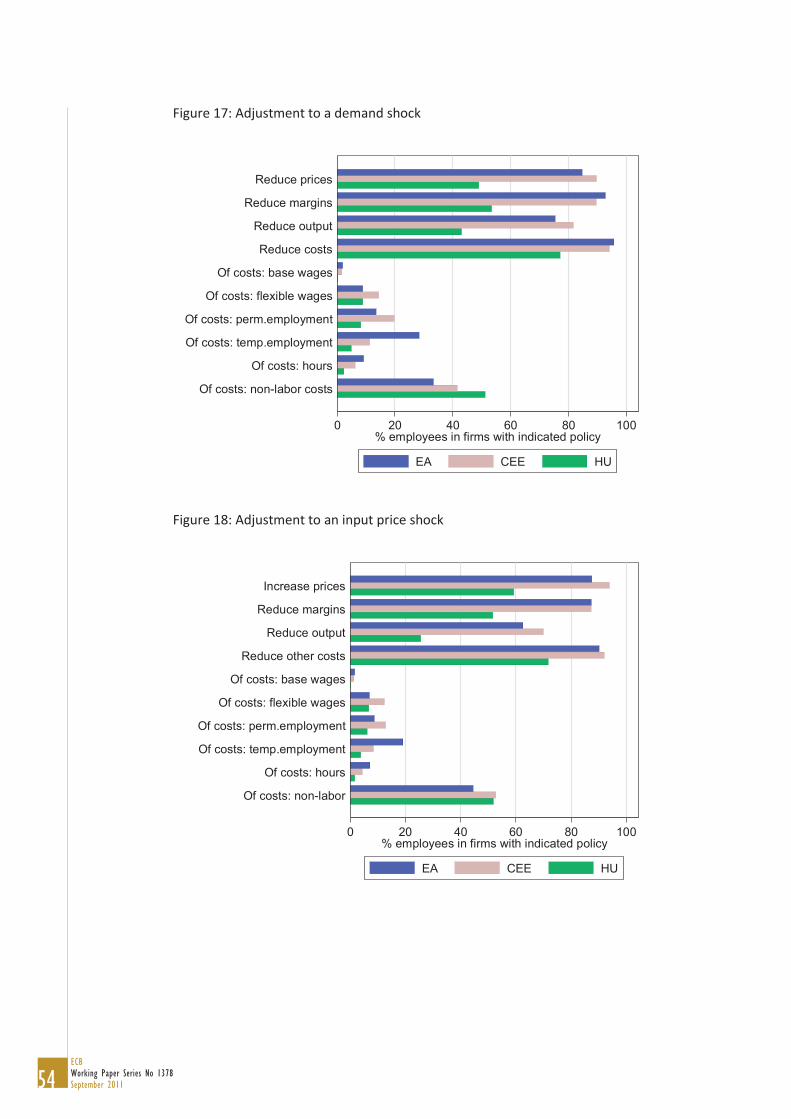
54ECBWorking Paper Series No 1378September 2011
Figure 17: Adjustment to a demand shock
Figure 18: Adjustment to an input price shock
0 20 40 60 80 100% employees in firms with indicated policy
Of costs: non-labor costs
Of costs: hours
Of costs: temp.employment
Of costs: perm.employment
Of costs: flexible wages
Of costs: base wages
Reduce costs
Reduce output
Reduce margins
Reduce prices
EA CEE HU
0 20 40 60 80 100% employees in firms with indicated policy
Of costs: non-labor
Of costs: hours
Of costs: temp.employment
Of costs: perm.employment
Of costs: flexible wages
Of costs: base wages
Reduce other costs
Reduce output
Reduce margins
Increase prices
EA CEE HU
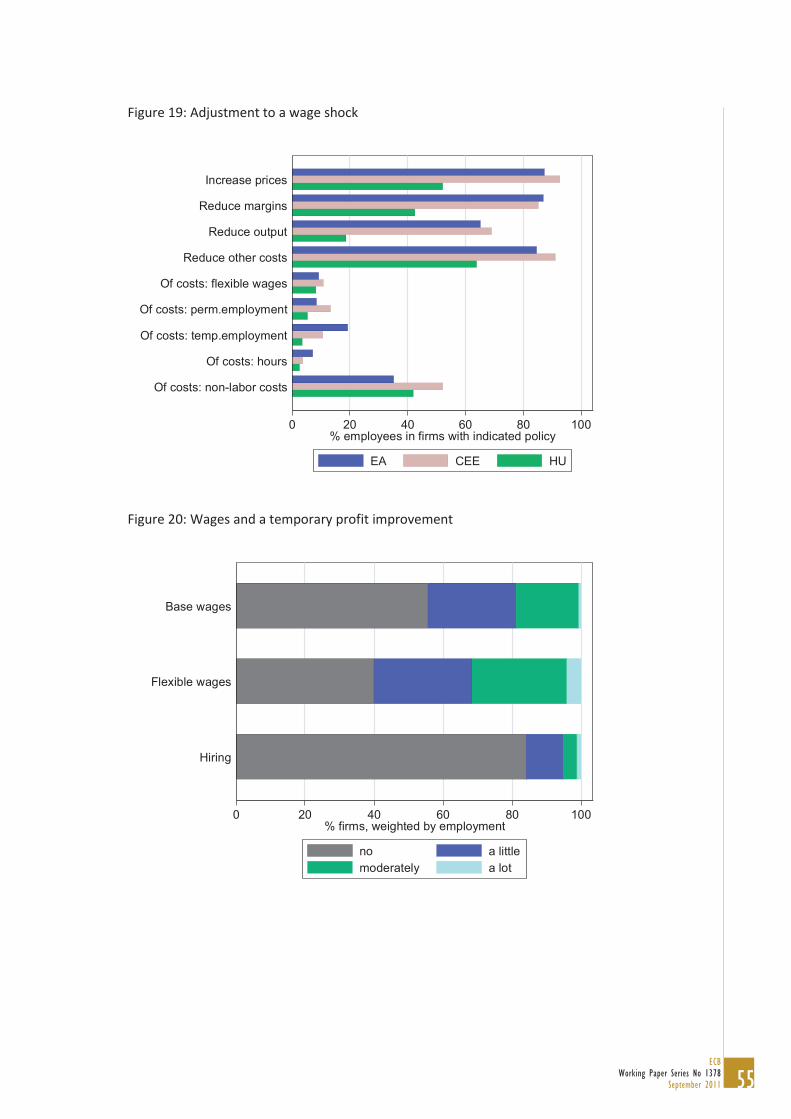
55ECB
Working Paper Series No 1378September 2011
Figure 19: Adjustment to a wage shock
Figure 20: Wages and a temporary profit improvement
0 20 40 60 80 100% employees in firms with indicated policy
Of costs: non-labor costs
Of costs: hours
Of costs: temp.employment
Of costs: perm.employment
Of costs: flexible wages
Reduce other costs
Reduce output
Reduce margins
Increase prices
EA CEE HU
0 20 40 60 80 100% firms, weighted by employment
Hiring
Flexible wages
Base wages
no a littlemoderately a lot
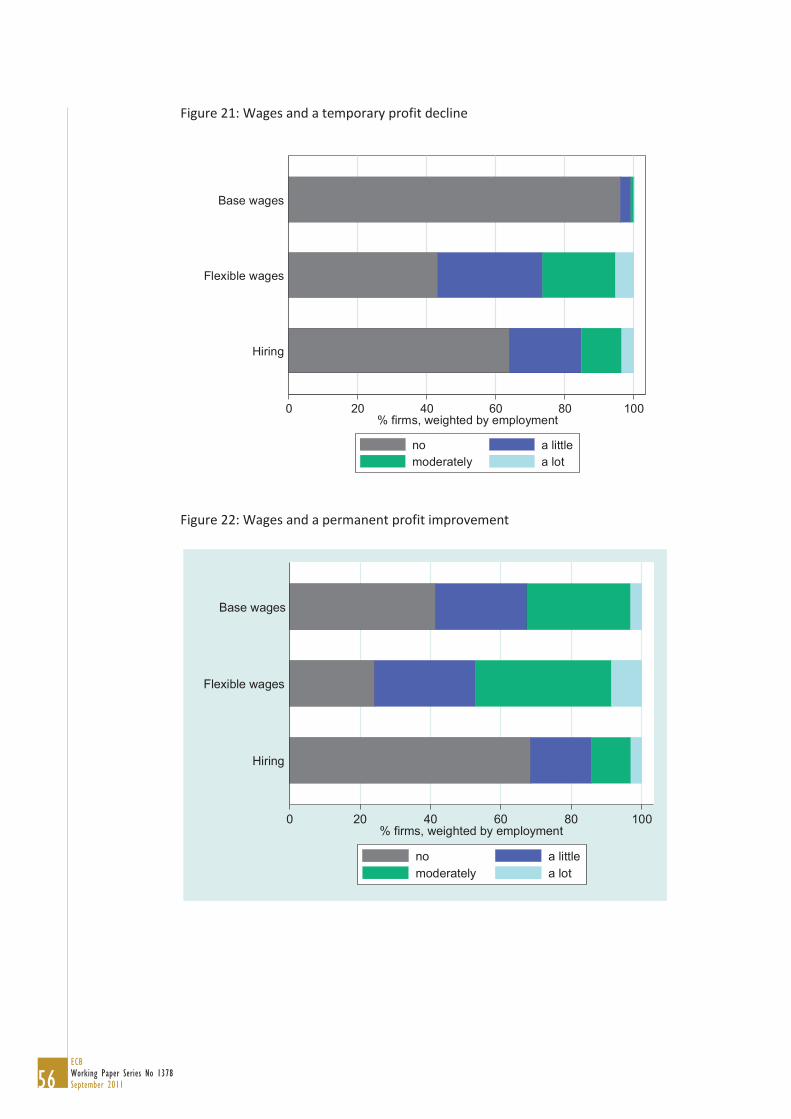
56ECBWorking Paper Series No 1378September 2011
Figure 21: Wages and a temporary profit decline
Figure 22: Wages and a permanent profit improvement
0 20 40 60 80 100% firms, weighted by employment
Hiring
Flexible wages
Base wages
no a littlemoderately a lot
0 20 40 60 80 100% firms, weighted by employment
Hiring
Flexible wages
Base wages
no a littlemoderately a lot
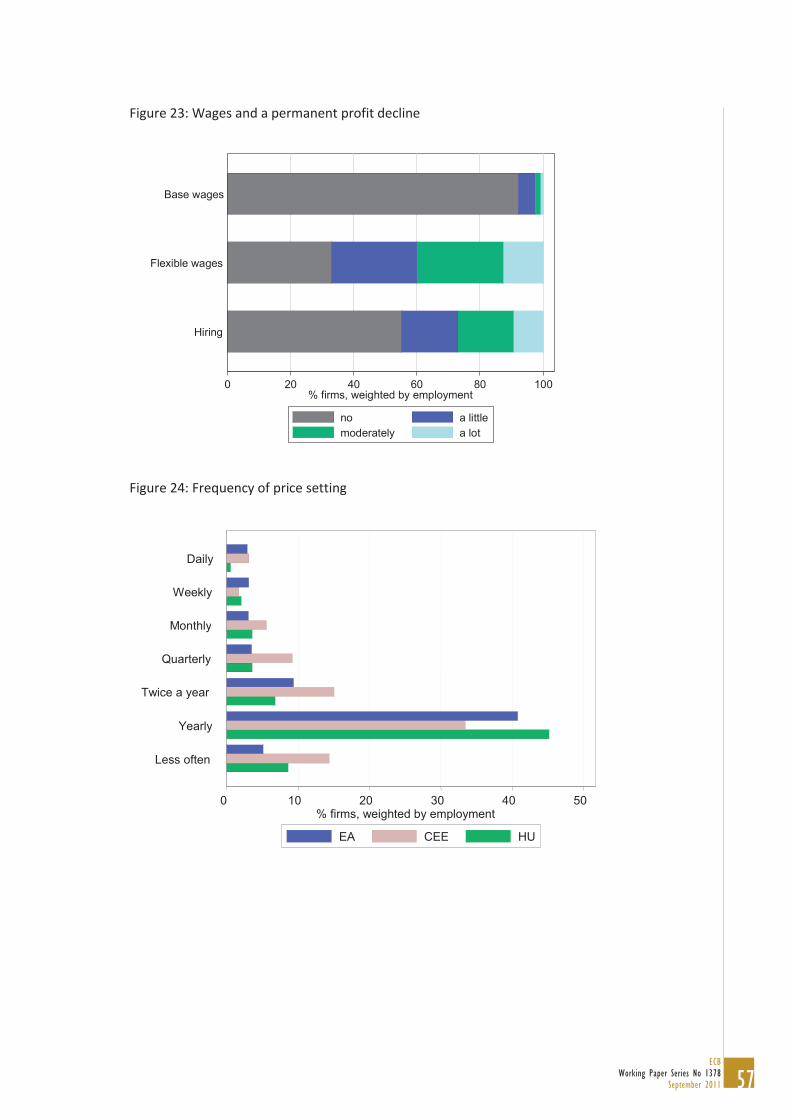
57ECB
Working Paper Series No 1378September 2011
Figure 23: Wages and a permanent profit decline
Figure 24: Frequency of price setting
0 20 40 60 80 100% firms, weighted by employment
Hiring
Flexible wages
Base wages
no a littlemoderately a lot
0 10 20 30 40 50
Less often
Yearly
Twice a year
Quarterly
Monthly
Weekly
Daily
EA CEE HU
% firms, weighted by employment
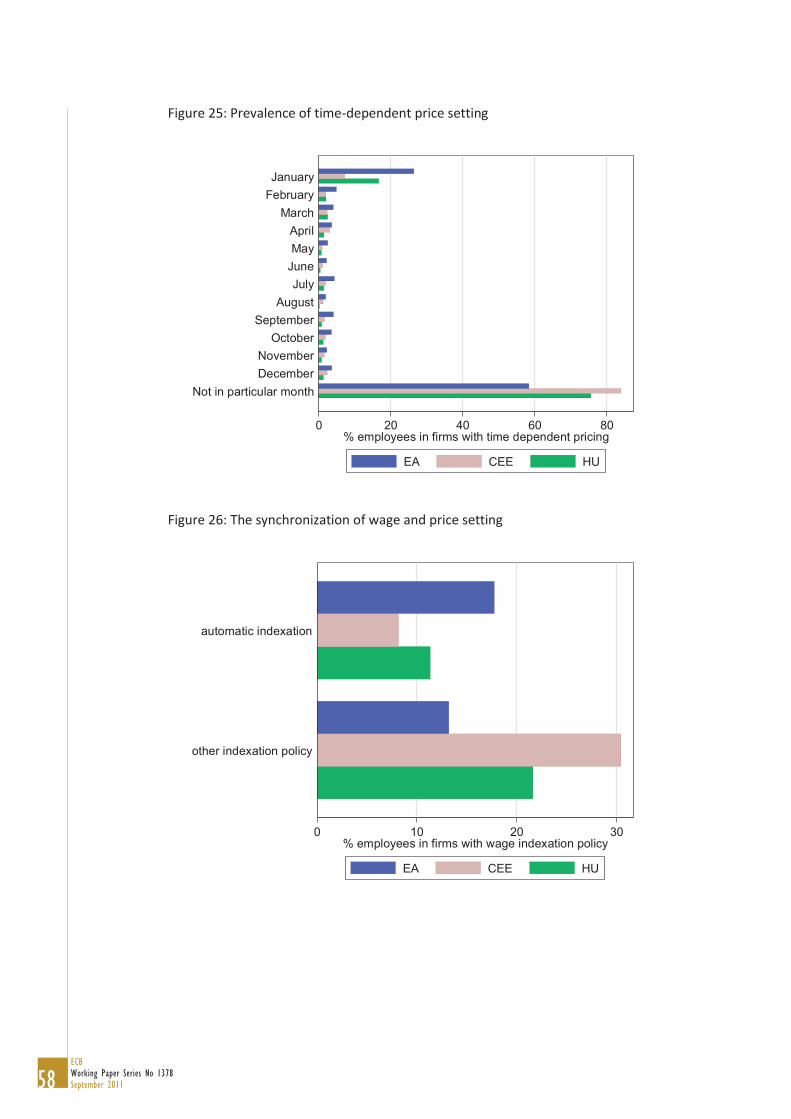
58ECBWorking Paper Series No 1378September 2011
Figure 25: Prevalence of time-dependent price setting
Figure 26: The synchronization of wage and price setting
0 20 40 60 80% employees in firms with time dependent pricing
Not in particular monthDecemberNovember
OctoberSeptember
AugustJuly
JuneMayApril
MarchFebruaryJanuary
EA CEE HU
0 10 20 30% employees in firms with wage indexation policy
other indexation policy
automatic indexation
EA CEE HU

Work ing PaPer Ser i e Sno 1118 / november 2009
DiScretionary FiScal PolicieS over the cycle
neW eviDence baSeD on the eScb DiSaggregateD aPProach
by Luca Agnello and Jacopo Cimadomo