Embed Size (px)
Citation preview


Wal-Mart Stores, Inc.
(Amounts in millions, except share data) Q1 $ Δ1 % Δ1
Total revenue $114,826 -$134 -0.1%
Total revenue, constant currency2 $118,106 $3,146 2.7%
Net sales $114,002 -$165 -0.1%
Net sales, constant currency2 $117,258 $3,091 2.7%
Membership & other income $824 $31 3.9%
Operating income $5,680 -$513 -8.3%
Interest expense, net $824 $256 45.1%
Consolidated net income attributable to Walmart $3,341 -$252 -7.0%
Diluted EPS (continuing operations) $1.03 -$0.07 -6.4%
1 Change versus prior year comparable period
2 See press release located at www.stock.walmart.com regarding reconciliations for non-GAAP financial measures. 2

Q1 bps Δ1
Gross profit rate 24.1% 9 bps
Operating expenses as a percentage of net sales 19.9% 56 bps
Effective tax rate 32.4% -164 bps
Debt to total capitalization2 39.6% -350 bps
Return on investment3,4 16.6% -10 bps
1 Basis points change versus prior year comparable period
2 Debt to total capitalization is calculated as of April 30, 2015.
3 ROI is calculated for the trailing 12 months ended April 30, 2015.
4 See press release located at www.stock.walmart.com regarding reconciliations for non-GAAP financial measures.
Wal-Mart Stores, Inc.
3

(Amounts in millions) Q1 $ Δ1 % Δ1
Receivables, net $5,813 -$283 -4.6%
Inventories $46,310 $995 2.2%
Accounts payable $37,224 $877 2.4%
1 Change versus prior year comparable period
Wal-Mart Stores, Inc.
4

(Amounts in millions) Q1 $ Δ1
Operating cash flow $4,446 -$1,493
Capital expenditures $2,203 $46
Free cash flow2 $2,243 -$1,539
(Amounts in millions) Q1 % Δ1
Dividends $1,579 2.1%
Share repurchases3 $280 -55.3%
Total $1,859 -14.5%
1 Change versus prior year comparable period
2 See press release located at www.stock.walmart.com regarding reconciliations for non-GAAP financial measures.
3 $10.0 billion remaining of $15 billion authorization approved in June 2013.
Wal-Mart Stores, Inc.
5

(Amounts in millions) Q1 Δ1
Net sales $70,245 3.5%
Comparable store sales2 1.1% 120 bps
• Comp traffic 1.0% 240 bps
• Comp ticket 0.1% -120 bps
E-commerce impact3 ~0.2% NP
Neighborhood Market4 ~7.9% NP
Gross profit rate Decrease -13 bps
Operating income $4,639 -6.8%
1 Change versus prior year comparable period
2 Comp sales are on a 13-week basis for the period ended May 1, 2015.
3 The company's e-commerce sales impact includes those sales initiated through the company's websites and fulfilled through the
company's dedicated e-commerce distribution facilities, as well as an estimate for sales initiated online, but fulfilled through the
company's stores and clubs.
4 Traditional Neighborhood Market format.
NP = not provided
Walmart U.S.
6

Category Comp
Grocery1 relatively flat
General merchandise2 - low single-digit
Health & wellness + mid single-digit
Apparel + mid single-digit
Home + mid single-digit
1 Includes food and consumables
2 Includes entertainment, toys, hardlines and seasonal
Walmart U.S.
7

1
(Amounts in millions) Reported Constant currency1
Q1 Δ2 Q1 Δ2
Net sales $30,278 -6.6% $33,534 3.4%
Gross profit rate Increase 3 bps NP NP
Operating income $1,070 -11.0% $1,203 0.1%
1 See press release located at www.stock.walmart.com regarding reconciliations for non-GAAP financial measures.
2 Change versus prior year comparable period
Walmart International
8
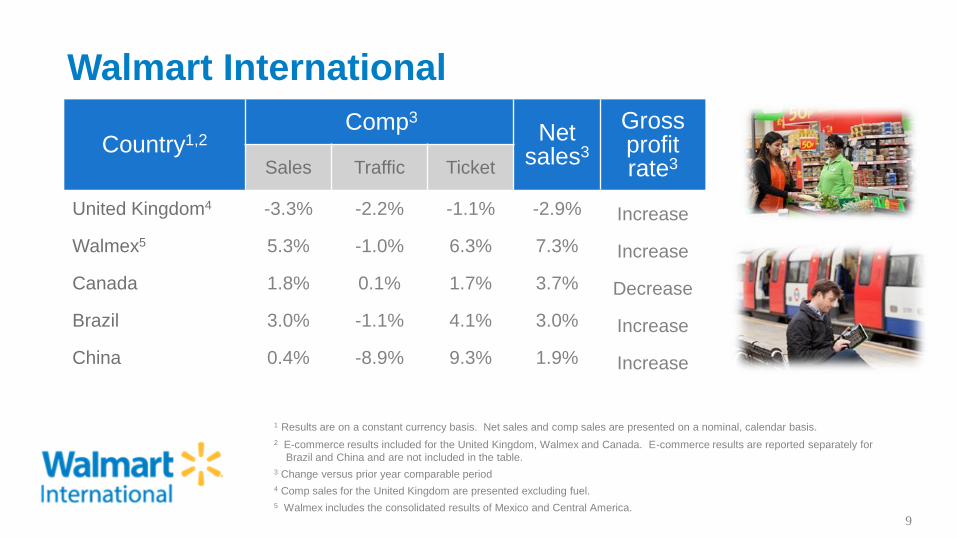
Country1,2 Comp3
Net sales3
Gross profit rate3 Sales Traffic Ticket
United Kingdom4 -3.3% -2.2% -1.1% -2.9% Increase
Walmex5 5.3% -1.0% 6.3% 7.3% Increase
Canada 1.8% 0.1% 1.7% 3.7% Decrease
Brazil 3.0% -1.1% 4.1% 3.0% Increase
China 0.4% -8.9% 9.3% 1.9% Increase
1 Results are on a constant currency basis. Net sales and comp sales are presented on a nominal, calendar basis.
2 E-commerce results included for the United Kingdom, Walmex and Canada. E-commerce results are reported separately for
Brazil and China and are not included in the table.
3 Change versus prior year comparable period
4 Comp sales for the United Kingdom are presented excluding fuel.
5 Walmex includes the consolidated results of Mexico and Central America.
Walmart International
9

(Amounts in millions) Without fuel1 With fuel
Q1 Δ2 Q1 Δ2
Net sales $12,363 1.2% $13,479 -3.0%
Comparable club sales3 0.4% 90 bps -3.8% -300 bps
• Comp traffic -0.2% — bps NP NP
• Comp ticket 0.6% 90 bps NP NP
E-commerce impact4 ~0.4% NP NP NP
Gross profit rate Decrease -15 bps Increase 27 bps
Membership & other income NP 4.9% NP NP
Membership income NP 7.4% NP NP
Operating income $436 -8.6% $427 -10.9%
1 See press release located at www.stock.walmart.com regarding reconciliations for non-GAAP financial measures.
2 Change versus prior year comparable period
3 Comp sales are on a 13-week basis for the period ended May 1, 2015..
4 The company's e-commerce sales impact includes those sales initiated through the company's websites and fulfilled through the
company's dedicated e-commerce distribution facilities, as well as an estimate for sales initiated online, but fulfilled through the
company's stores and clubs.
Sam's Club
10

Category Comp
Fresh / Freezer / Cooler + low single-digit
Grocery and beverage + low single-digit
Consumables relatively flat
Home and apparel + low single-digit
Technology, office and entertainment - mid single-digit
Health and wellness + low single-digit
Sam's Club
11

Total company
Walmart U.S. comps
Sam's Club comps
FY16 Q2 EPS:
• $1.06 - $1.18
13-week period1:
• around 1.0%
13-week period1:
• Flat to +2.0%
1 13-week period from May 2, 2015 through July 31, 2015, compared to 13-week period ended August 1, 2014
Guidance
12
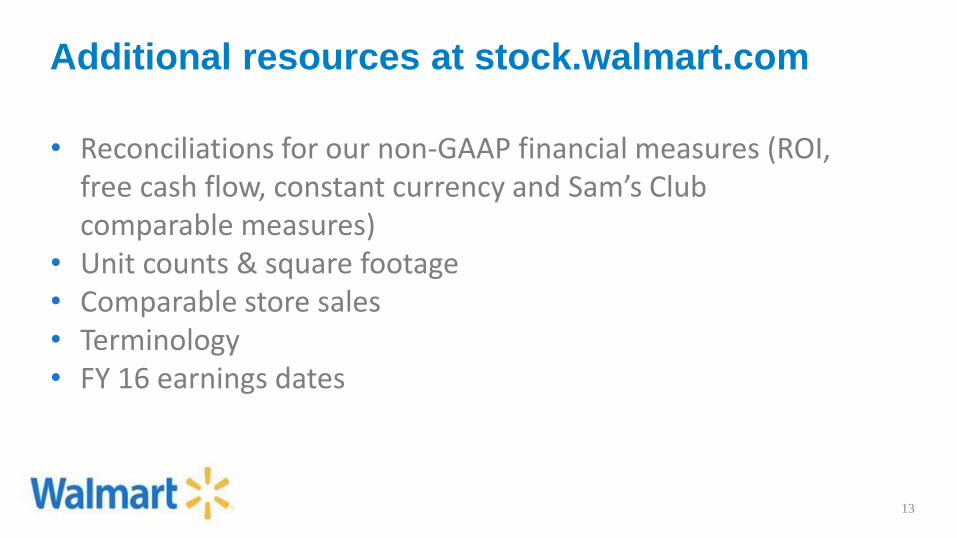
Additional resources at stock.walmart.com
13
• Reconciliations for our non-GAAP financial measures (ROI, free cash flow, constant currency and Sam’s Club comparable measures)
• Unit counts & square footage • Comparable store sales • Terminology • FY 16 earnings dates