Embed Size (px)
Citation preview
8/4/2019 Wamu 10-k 2003 Subprime
http://slidepdf.com/reader/full/wamu-10-k-2003-subprime 1/146
10-K/A 1 a2131585z10-ka.htm FORM 10-K/AQuickLinks -- Click here to rapidly navigate through this document
UNITED STATES
SECURITIES AND EXCHANGE COMMISSIONWASHINGTON, D.C. 20549
FORM 10-K/AAmendment No. 1
ANNUAL REPORT PURSUANT TO SECTION 13 OR 15(d) OF THE SECURITIES EXCHANGE ACT OF 1934 FOR THE
FISCAL YEAR ENDED DECEMBER 31, 2003
Commission File Number 1-14667
WASHINGTON MUTUAL, INC.(Exact name of registrant as specified in its charter)
Washington
(State or other jurisdiction of
incorporation or organization)
91-1653725
(I.R.S. Employer
Identification Number)
1201 Third Avenue, Seattle, Washington
(Address of principal executive offices)
98101
(Zip Code)
Registrant's telephone number, including area code: (206) 461-2000
Securities registered pursuant to Section 12(b) of the Act:
Title of each class
Name of each exchange on which registered
Common Stock New York Stock Exchange
Securities registered pursuant to Section 12(g) of the Act:
Title of each class
Name of each exchange on which registered
Litigation Tracking Warrants™ NASDAQ
Indicate by check mark whether the registrant (1) has filed all reports required to be filed by Section 13 or 15(d) of the
Securities Exchange Act of 1934 during the preceding 12 months (or for such shorter period that the registrant was required to file
such reports), and (2) has been subject to such filing requirements for the past 90 days. Yes ý No o.
Indicate by check mark if disclosure of delinquent filers pursuant to Item 405 of Regulation S-K is not contained herein, and will
not be contained, to the best of registrant's knowledge, in definitive proxy or information statements incorporated by reference in
Part III of this Form 10-K or any amendment to this Form 10-K. o
Indicate by check mark whether the registrant is an accelerated filer (as defined in Rule 12b-2 of the Act). Yes ý No o.
The aggregate market value of voting stock held by non-affiliates of the registrant as of June 30, 2003:
http://www.sec.gov/Archives/edgar/data/933136/000104746904
46 9/17/2011
8/4/2019 Wamu 10-k 2003 Subprime
http://slidepdf.com/reader/full/wamu-10-k-2003-subprime 2/146
Common Stock—$37,362,586,793(1)
(1)Does not include any value attributable to 17,100,000 shares held in escrow.
The number of shares outstanding of the issuer's classes of common stock as of February 27, 2004:
Common Stock—868,397,759(2)
(2)Includes 6,000,000 shares held in escrow.
Documents Incorporated by Reference
Portions of the definitive proxy statement for the Annual Meeting of Shareholders to be held April 20, 2004, are incorporated by
reference into Part III.
WASHINGTON MUTUAL, INC.
2003 ANNUAL REPORT ON FORM 10-K/A
TABLE OF CONTENTS
Page
PART I 1
Item 1. Business 1
Overview 1
Business Segments 1
Available Information 4
Employees 5
Factors That May Affect Future Results 5
Taxation 7
Environmental Regulation 7
Regulation and Supervision 8
Executive Officers 12
Item 2. Properties 14
Item 3. Legal Proceedings 15
Item 4. Submission of Matters to a Vote of Security Holders 15
PART II 15
Item 5. Market for our Common Stock and Related Stockholder Matters 15
Item 6. Selected Financial Data 23
Item 7. Management's Discussion and Analysis of Financial Condition and Results of Operations 16
Controls and Procedures 16
Overview 16
Critical Accounting Policies 18
Recently Issued Accounting Standards 21
Five-Year Summary of Selected Financial Data 23Ratios and Other Supplemental Data 24
Earnings Performance from Continuing Operations 25
Review of Financial Condition 35
Operating Segments 38
Off-Balance Sheet Activities 44
Asset Quality 45
Liquidity 54
Capital Adequacy 56
Market Risk Management 57
Maturity and Repricing Information 62
Tax Contingency 67
http://www.sec.gov/Archives/edgar/data/933136/000104746904
46 9/17/2011
8/4/2019 Wamu 10-k 2003 Subprime
http://slidepdf.com/reader/full/wamu-10-k-2003-subprime 3/146
Goodwill Litigation 67
Item 7A. Quantitative and Qualitative Disclosures about Market Risk 57
Item 8. Financial Statements and Supplementary Data 70
Item 9. Changes in and Disagreements with Accountants on Accounting and Financial Disclosure 70
Item 9A. Controls and Procedures 16
PART III 70
Item 10. Directors and Executive Officers of the Registrant 70
Item 11. Executive Compensation 70
Item 12. Security Ownership of Certain Beneficial Owners and Management and Related Stockholder Matters 70 Item 13. Certain Relationships and Related Transactions 70
Item 14. Principal Accounting Fees and Services 70
PART IV 71
Item 15. Exhibits, Financial Statement Schedules and Reports on Form 8-K 71
i
Explanatory Note
Washington Mutual, Inc. ("Washington Mutual" or the "Company") is filing this Amendment No. 1 on Form 10-K/A to amend itsAnnual Report on Form 10-K for the year ended December 31, 2003 to correct the funds transfer pricing methodology applied to the
2001 financial results of the Company's operating segments. Such information had no effect on previously reported 2001 consolidated
results of operations or any other period presented in this report.
This Amendment No. 1 on Form 10-K/A amends:
• Item 7 (Management's Discussion and Analysis of Financial Condition and Results of Operations) solely to reflect the
changes to segment information reported for 2001 in the tables and narrative discussion of Operating Segments on
pages 40 through 44; and
• Item 8 (Financial Statements and Supplementary Data) to reflect, in Notes 2—"Restatements of Financial Statements"
and 25—"Operating Segments" to the Consolidated Financial Statements, the changes to segment information reported
in the table for the year ended December 31, 2001 contained in Note 25, and to include the reissued report of theCompany's independent auditors.
While this Amendment No. 1 also sets forth the complete text of each other item of the Company's Form 10-K for the year ended
December 31, 2003, it does not change any information contained in these other items as originally filed on March 15, 2004. This
Amendment No. 1 also does not reflect events that have occurred after the original filing of the Form 10-K.
PART I
BUSINESS
Overview
With a history dating back to 1889, Washington Mutual, Inc. (together with its subsidiaries, "Washington Mutual," or the
"Company") is a financial services company committed to serving consumers and small- to mid-sized businesses. Based on our
consolidated assets at December 31, 2003, we were the largest thrift holding company in the United States and the eighth largest
among all U.S.-based bank and thrift holding companies.
Company Growth
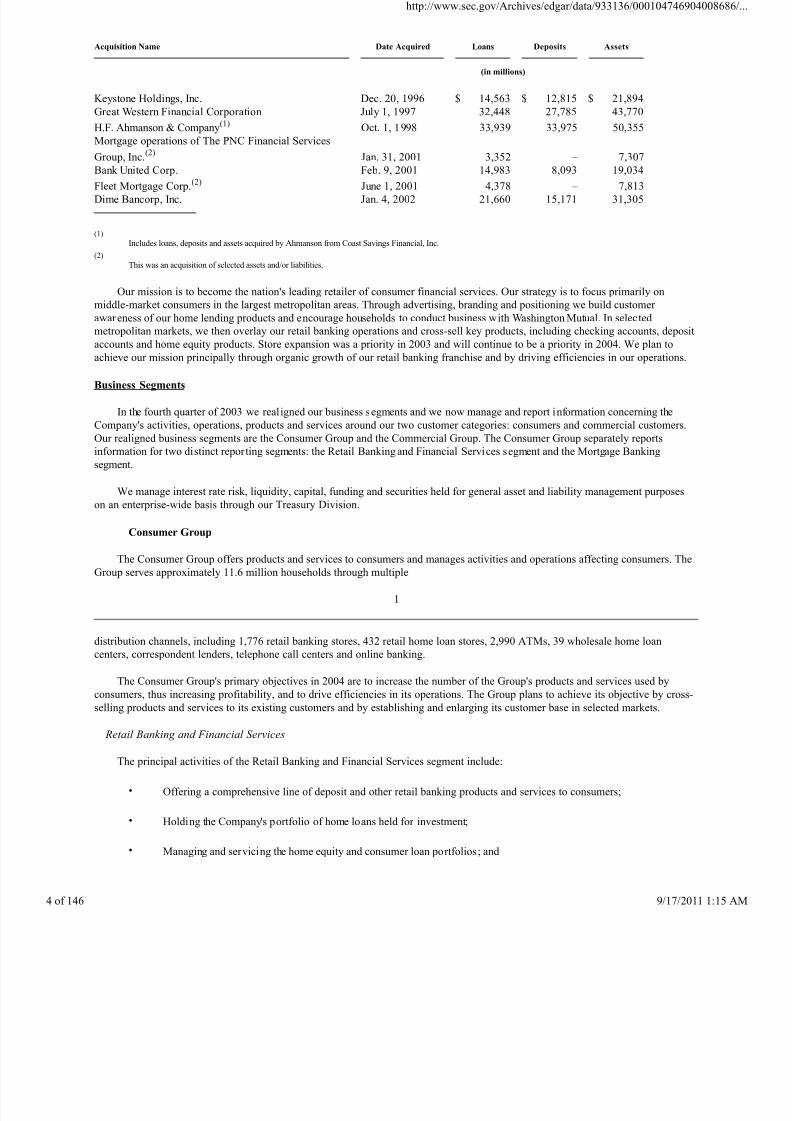
Our assets have grown over the last eight years primarily through the following significant acquisitions:
http://www.sec.gov/Archives/edgar/data/933136/000104746904
46 9/17/2011
8/4/2019 Wamu 10-k 2003 Subprime
http://slidepdf.com/reader/full/wamu-10-k-2003-subprime 4/146
Acquisition Name
Date Acquired
Loans
Deposits
Assets
(in millions)
Keystone Holdings, Inc. Dec. 20, 1996 $ 14,563 $ 12,815 $ 21,894
Great Western Financial Corporation July 1, 1997 32,448 27,785 43,770
H.F. Ahmanson & Company(1) Oct. 1, 1998 33,939 33,975 50,355
Mortgage operations of The PNC Financial Services
Group, Inc.(2) Jan. 31, 2001 3,352 – 7,307
Bank United Corp. Feb. 9, 2001 14,983 8,093 19,034Fleet Mortgage Corp.(2) June 1, 2001 4,378 – 7,813
Dime Bancorp, Inc. Jan. 4, 2002 21,660 15,171 31,305
(1)
Includes loans, deposits and assets acquired by Ahmanson from Coast Savings Financial, Inc.
(2)
This was an acquisition of selected assets and/or liabilities.
Our mission is to become the nation's leading retailer of consumer financial services. Our strategy is to focus primarily on
middle-market consumers in the largest metropolitan areas. Through advertising, branding and positioning we build customer
awareness of our home lending products and encourage households to conduct business with Washington Mutual. In selected
metropolitan markets, we then overlay our retail banking operations and cross-sell key products, including checking accounts, deposit
accounts and home equity products. Store expansion was a priority in 2003 and will continue to be a priority in 2004. We plan toachieve our mission principally through organic growth of our retail banking franchise and by driving efficiencies in our operations.
Business Segments
In the fourth quarter of 2003 we realigned our business segments and we now manage and report information concerning the
Company's activities, operations, products and services around our two customer categories: consumers and commercial customers.
Our realigned business segments are the Consumer Group and the Commercial Group. The Consumer Group separately reports
information for two distinct reporting segments: the Retail Banking and Financial Services segment and the Mortgage Banking
segment.
We manage interest rate risk, liquidity, capital, funding and securities held for general asset and liability management purposes
on an enterprise-wide basis through our Treasury Division.
Consumer Group
The Consumer Group offers products and services to consumers and manages activities and operations affecting consumers. The
Group serves approximately 11.6 million households through multiple
1
distribution channels, including 1,776 retail banking stores, 432 retail home loan stores, 2,990 ATMs, 39 wholesale home loan
centers, correspondent lenders, telephone call centers and online banking.
The Consumer Group's primary objectives in 2004 are to increase the number of the Group's products and services used by
consumers, thus increasing profitability, and to drive efficiencies in its operations. The Group plans to achieve its objective by cross-selling products and services to its existing customers and by establishing and enlarging its customer base in selected markets.
Retail Banking and Financial Services
The principal activities of the Retail Banking and Financial Services segment include:
• Offering a comprehensive line of deposit and other retail banking products and services to consumers;
• Holding the Company's portfolio of home loans held for investment;
• Managing and servicing the home equity and consumer loan portfolios; and
http://www.sec.gov/Archives/edgar/data/933136/000104746904
46 9/17/2011
8/4/2019 Wamu 10-k 2003 Subprime
http://slidepdf.com/reader/full/wamu-10-k-2003-subprime 5/146
• Providing investment advisory and brokerage services, sales of annuities, mutual fund management and other financial
services.
The segment's expansion of its national retail banking franchise is an integral element of the Consumer Group's strategy for
achieving its 2004 objective. In 2004, the segment plans to open approximately 250 new retail banking stores, primarily in the Tampa,
Chicago and New York metropolitan areas. In 2003, the segment opened 260 stores primarily in the Chicago, Houston, Dallas and
New York metropolitan areas. New retail banking stores are configured on an award-winning and innovative retail banking platform
that serves customers in an open, free-flowing retail environment.
Deposit products offered by the segment include the Company's signature free checking and Platinum accounts as well as other
personal checking accounts, savings accounts, money market deposit accounts and time deposit accounts. The segment also offers
home equity loans and lines of credit and consumer loans. Home equity loans and lines of credit accounted for 16% of loans held in
portfolio at the end of 2003, up from 11% at the end of 2002. Home equity loans and lines of credit generally provide higher margins
than home loans. As such, the Company believes they represent an attractive opportunity to grow the loan portfolio.
The segment holds loans in portfolio that are or iginated by the Mortgage Banking segment. Through our specialty mortgage
finance program, the segment also purchases and re-underwrites loans to higher risk borrowers; such loans, while held in portfolio,
are serviced by third parties.
Investment advisory and securities brokerage services are provided by approximately 600 financial consultants of WM
Financial Services, Inc., a licensed broker-dealer. In addition, fixed annuities are offered to the public by approximately 1,300
licensed banking employees. The Company's mutual fund management business, WM Advisors, Inc., offers investment advisory andmutual fund distribution services and had assets under management at December 31, 2003 of $17.87 billion.
Mortgage Banking
The principal activities of the Mortgage Banking segment include:
• Originating and servicing home loans;
• Buying and sell ing home loans in the secondary market; and
• Providing insurance-related products.
The Mortgage Banking segment's primary objectives in 2004 are to drive significant efficiencies by fully integrating the
mortgage banking companies we acquired in 2001 and 2002 and to increase the
2
number of the Company's products and services used by customers. The segment is transitioning to a single non-proprietary servicing
platform for home loans in 2004 and is also consolidating its origination systems and loan fulfillment centers.
In 2003 Washington Mutual was a leading originator and servicer of mortgage loans and expanded its distribution channel with
the opening of 93 new retail home loan centers.
Through its multiple lending channels, the segment offers a diverse set of home loan products including:
• Fixed-rate home loans;
• Adjustable-rate home loans (where the interest rate may be adjusted as frequently as every month);
• Hybrid home loans (where the interest rate is fixed for a predetermined time period, typically 3 or 5 years, and then
reprices monthly or annually, depending on the product); and
• Government insured or guaranteed home loans.
http://www.sec.gov/Archives/edgar/data/933136/000104746904
46 9/17/2011
8/4/2019 Wamu 10-k 2003 Subprime
http://slidepdf.com/reader/full/wamu-10-k-2003-subprime 6/146
Home loans are either originated or purchased and are either held in portfolio by the Retail Banking and Financial Services
segment or sold by the Mortgage Banking segment to institutional investors in the secondary market or to the housing government-
sponsored enterprises. In general, the Retail Banking and Financial Services segment holds in portfolio purchased loans made to
higher-risk borrowers and adjustable-rate mortgages, and the Mortgage Banking segment sells fixed-rate home loans, generally to the
Federal National Mortgage Association ("Fannie Mae"), a government-sponsored enterprise. As conditions warrant, the Mortgage
Banking segment may securitize adjustable-rate loans into available-for-sale securities to be held by the Treasury Division as part of
the Company's overall asset and liability management strategy. In the future, the segment may securitize and sell adjustable-rate loans
in the secondary market as part of the Company's capital management process.
Mortgage servicing involves the administration and collection of home loan payments. The Mortgage Banking segment performs
most home loan servicing activities, including the servicing of loans held in portfolio by the Retail Banking and Financial Services
segment. When loans are sold into the secondary market, the Company generally retains the right to service those loans and hence
retains the customer relationship. The Company intends to use these customer relationships to cross-sell additional products and
services.
All loans, whether originated or purchased, are subject to the same nondiscriminatory underwriting standards. When originating
home loans, the Company follows established lending policies and procedures that require consideration of an applicant's credit
profile relative to the size and characteristics of the loan. When purchasing home loans, the Company normally delegates the
underwriting responsibility to the correspondent lenders that originate the loans. The Company requires correspondent lenders to
comply with its underwriting and appraisal standards and performs quality control procedures to ensure that compliance occurs.
The Mortgage Banking segment makes insurance products avai lable to its customers that complement the mortgage lending
process including private mortgage insurance, mortgage life insurance, flood, homeowners', earthquake and other property and
casualty insurance. Other types of insurance products made available include accidental death and dismemberment, and term andwhole life insurance. The Mortgage Banking segment also manages the Company's captive reinsurance activities.
See Note 25 to the Consolidated Financial Statements—"Operating Segments" for financial information regarding the two
operating segments of the Consumer Group and refer to Management's Discussion and Analysis—"Operating Segments" for a
description of the principal differences between the previous and newly aligned segment structures.
3
Commercial Group
The principal activities of the Commercial Group include:
• Providing financing to developers, investors, mortgage bankers and homebuilders for the acquisition or construction of
multi-family dwellings, other commercial properties and new homes;
• Originating and servicing multi-family and other commercial real estate loans and either holding such loans in
portfolio as part of its commercial asset management business or selling them in the secondary market;
• Originating, selling and servicing home loans to higher-risk borrowers through the Company's subsidiary, Long Beach
Mortgage Company; and
• Offering a full array of commercial banking products and services.
The Group's primary objectives in 2004 are to improve productivity by consolidating operations and to increase market share in
the highly fragmented multi-family, commercial real estate and commercial banking markets through organic growth. The Group
expects to integrate approximately 80 commercial banking centers and small business centers with its existing multi-family and
commercial real estate operations. Additional productivity improvements should result from centralizing servicing operations and
automating and streamlining the underwriting and loan closing processes.
The multi-family lending business, which accounts for a majority of the Group's revenues, is comprised of three key activities:
originating and managing loans retained in the loan portfolio, servicing loans and providing ancillary banking services to enhance
customer retention. Combining these three activities into one integrated business model has allowed the Group to become a leading
originator and holder of multi-family loans. The Group's multi-family lending program has a dominant market share of more than 20%
in certain key cities along the west coast and is building market share on the east coast with recent office openings in Boston,
http://www.sec.gov/Archives/edgar/data/933136/000104746904
46 9/17/2011
8/4/2019 Wamu 10-k 2003 Subprime
http://slidepdf.com/reader/full/wamu-10-k-2003-subprime 7/146
Washington, D.C., and Miami.
As part of the Company's specialty mortgage finance program, the Group originates home loans to higher-risk borrowers through
Long Beach Mortgage, which it then sells to secondary market participants, retaining the servicing relationship.
The Group also offers a full array of commercial banking products and services, including lines of credit, receivables and
inventory financing, equipment loans, real estate financing, government-guaranteed loans, international trade financing, cash
management and merchant bankcard services.
The Company completed the sale of Washington Mutual Finance Corporation, its consumer finance subsidiary, which was
formerly part of the Commercial Group, on January 9, 2004. Washington Mutual Finance's operations are reported as discontinued
operations elsewhere in this report on Form 10-K unless otherwise noted.
See Note 25 to the Consolidated Financial Statements—"Operating Segments" for financial information regarding the
Commercial Group and refer to Management's Discussion and Analysis—"Operating Segments" for a description of the principal
differences between the previous and newly aligned segment structures.
Available Information
We make our annual report on Form 10-K, quarterly reports on Form 10-Q, current reports on Form 8-K, and all amendments to
such reports filed pursuant to Section 13(a) or 15(d) of the Exchange Act, available free of charge on or through our website located
at www.wamu.com/ir as soon as reasonably practicable after filing with the United States Securities and Exchange Commission.
The Company's Code of Conduct, which applies to all officers, directors and employees of the Company, and the Code of Ethics
for Senior Financial Officers, which applies to the Company's Chief
4
Executive Officer, Chief Financial Officer, Controller, and each business segment or business line chief financial officer and
controller, as well as any waiver of our Code of Conduct and amendment to or waiver of the Code of Ethics for Senior Financial
Officers, are disclosed on our website located at www.wamu.com/ir.
Employees
At December 31, 2003, we had 63,720 employees, compared with 55,200 at December 31, 2002 and 41,901 at December 31,
2001, which included 2,346, 2,330 and 2,717 employees related to the Company's discontinued operations. During 2003, our number
of employees increased substantially to accommodate the high refinancing activity in the earlier part of the year and the opening of
new retail banking stores. The increase in 2002 over the same period in 2001 was primarily due to the acquisitions of Dime and
HomeSide Lending, Inc., which was acquired in two transactions in 2002. We believe that we have been successful in attracting
quality employees and that our employee relations are good.
Factors That May Affect Future Results
Our Form 10-K and other documents that we file with the Securities and Exchange Commission have forward-looking
statements. In addition, our senior management may make forward-looking statements orally to analysts, investors , the media and
others. Forward-looking statements can be identified by the fact that they do not relate strictly to historical or current facts. They often
include words such as "expects," "anticipates," "intends," "plans," "believes," "seeks," "estimates," or words of similar meaning, or future or conditional verbs such as "will," "would," "should," "could" or "may."
Forward-looking statements provide our expectations or predictions of future conditions, events or results. They are not
guarantees of future performance. By their nature, forward-looking statements are subject to risks and uncertainties. These statements
speak only as of the date they are made. We do not undertake to update forward-looking statements to reflect the impact of
circumstances or events that arise after the date the forward-looking statements were made. There are a number of factors, many of
which are beyond our control, that could cause actual conditions, events or results to differ significantly from those described in the
forward-looking statements.
Some of these factors are described below.
http://www.sec.gov/Archives/edgar/data/933136/000104746904
46 9/17/2011
8/4/2019 Wamu 10-k 2003 Subprime
http://slidepdf.com/reader/full/wamu-10-k-2003-subprime 8/146
General business and economic conditions may significantly affect our earnings.
Our business and earnings are sensitive to general business and economic conditions. These conditions include short-term and
long-term interest rates, inflation, money supply, fluctuations in both debt and equity capital markets, the strength of the U.S. economy,
and of the local economies in which we conduct business. Changes in these conditions may adversely affect our business and
earnings. For example, if short-term interest rates rise faster than mortgage rates, our net interest income, which is our largest
component of net income, could be adversely affected. A prolonged economic downturn could increase the number of customers who
become delinquent or default on their loans, or a rising interest rate environment could decrease the demand for loans. An increase in
delinquencies or defaults could result in a higher level of charge-offs and provision for loan and lease losses, which could adversely
affect our earnings.
In addition, our business and earnings are significantly affected by the fiscal and monetary policies of the federal government and
its agencies. We are particularly affected by the policies of the Federal Reserve Board, which regulates the supply of money and
credit in the United States. The Federal Reserve Board's policies directly and indirectly influence the yield on our interest-earning
assets and the cost of our interest-bearing liabilities. Changes in those policies are beyond our control and difficult to predict.
5
If we are unable to effectively manage the volatility of our mortgage banking business, our earnings could be adversely
affected.
Changes in interest rates s ignificantly affect the mortgage banking business. One of the principal risks of declining interest rates
on the mortgage banking business is the acceleration of prepayments which reduce the fair value of our mortgage servicing rights
("MSR"). One of the ways we mitigate this risk is by purchasing financial instruments, such as fixed-rate investment securities,
interest rate contracts and forward commitments to purchase mortgage-backed securities, which tend to increase in value when
long-term interest rates decline. The success of this strategy, however, is dependent on management's judgments regarding the amount,
type and mix of MSR risk management instruments that we select to manage the changes in fair value of our mortgage servicing asset.
If this strategy is not successful, our net income could be adversely affected. Moreover, many of our interest rate and MSR risk
management strategies depend on liquidity in mortgage-related financial instruments traded in the secondary market. If periods of
illiquidity develop in these markets, our ability to effectively implement our MSR risk management strategies could be adversely
affected. Another significant risk to the mortgage banking business is the effect of interest rates on loan volume and gain from
mortgage loans. In rising interest rate environments, loan volume is generally lower and, accordingly, the overall amount of gain from
mortgage loans is lower. Due to the high levels of salable fixed-rate loan volume in 2002 and 2003 that resulted from historically low
mortgage interest rates, our gain from mortgage loans in 2003 and 2002 was higher than it is likely to be when mortgage interest ratesrise above their historical low points for a sustained period of time. For further discussion of how interest rate risk, basis risk and
MSR prepayment risk are managed, see "Market Risk Management."
If we are unable to fully realize the operational and systems efficiencies sought to be achieved from our recently announced
business segment realignment, our earnings could be adversely affected.
In the fourth quarter of 2003 we realigned our operating segment structure according to products and services that are grouped
into two primary categories—those offered to retail consumers and those offered to commercial customers—in order to create a more
highly integrated and unified retailing strategy and to streamline and simplify operations. To accomplish these goals we are
eliminating redundancies throughout the organization, completing the integration of the mortgage banking companies we acquired in
2001 and 2002, transitioning to a single non-proprietary platform for the servicing of home loans, consolidating our mortgage
origination systems and loan fulfillment centers and integrating call centers. We anticipate that these initiatives will result in operating
efficiencies.
If we experience difficulties, such as a prolonged interruption of our service, as we realign our business segments and continue
to integrate our systems and operations, including those of the acquired mortgage companies, we could experience higher than
anticipated administrative costs and the loss of customers, among other things. These events could adversely affect our operations and
financial condition.
The financial services industry is highly competitive.
We are subject to significant competition in attracting and retaining deposits and making loans as well as in providing other
financial services in all of our market areas. We face pricing competition for loan and deposit products. In addition, customer
convenience and service capabilities, such as product lines offered and the accessibility of services are significant competitive
factors.
http://www.sec.gov/Archives/edgar/data/933136/000104746904
46 9/17/2011
8/4/2019 Wamu 10-k 2003 Subprime
http://slidepdf.com/reader/full/wamu-10-k-2003-subprime 9/146
Our most direct competition for loans comes from commercial banks, other savings institutions, national mortgage companies
and government-sponsored enterprises. Our most direct competition for deposits comes from commercial banks, other savings
institutions, and credit unions doing business in our market areas. As with all banking organizations, we have also experienced
competition from nonbanking sources, including mutual funds, corporate and government debt securities and other investment
alternatives offered within and outside of our primary market areas.
6
Changes in the regulation of financial services companies and housing government-sponsored enterprises could adversely
affect our business.
Proposals for further regulation of the financial services industry are continually being introduced in Congress. Proposals that
are now receiving a great deal of attention include consumer protection initiatives relating to the Real Estate Settlement Procedures
Act, predatory lending, credit reporting and privacy. The agencies regulating the financial services industry also periodically adopt
changes to their regulations. It is possible that one or more legislative proposals may be adopted or regulatory changes may be made
that would have an adverse effect on our business. For further discussion of the regulations of financial services, see "Regulation and
Supervision."
The Federal National Mortgage Association ("FNMA" or "Fannie Mae"), the Federal Home Loan Mortgage Corporation
("FHLMC" or "Freddie Mac") and the Federal Home Loan Banks are housing government-sponsored enterprises ("GSEs") which
play a powerful role in the mortgage industry. We have significant business relationships with these GSEs. Proposals are beingconsidered in Congress and by various regulators which would affect the manner in which these GSEs conduct their business. These
proposals include establishing a new independent agency to regulate GSEs, requiring GSEs to register their stock with the United
States Securities and Exchange Commission, and reducing or limiting certain business benefits GSEs receive from the federal
government. The enactment of any of these proposals could increase the costs incurred by, or otherwise adversely affect the business
of, the GSEs, which in turn could have an adverse impact on our business. For discussion of the Federal Home Loan Bank System and
the regulation of financial services, see "Regulation and Supervision."
Taxation
General
For federal income tax purposes, we report income and expenses using the accrual method of accounting on a calendar year
basis. We are subject to federal income tax under existing provisions of the Internal Revenue Code of 1986, as amended, in generallythe same manner as other corporations.
State Income Taxation
Many of the states in which we do business impose corporate income taxes on companies doing business in those states. The
State of Washington does not currently have a corporate income tax, but has a business and occupation tax on gross receipts.
Currently, the tax does not apply to interest received on loans secured by first mortgages or deeds of trust on residential properties.
Assistance Agreement
In connection with the acquisition of Keystone Holdings, Inc. in 1996, we succeeded to the rights and obligations of Keystone
Holdings and certain of its affiliates under a number of continuing agreements with the predecessor to the Federal Deposit Insurance
Corporation ("FDIC"), including an Assistance Agreement. The Assistance Agreement provides, in part, for the payment to theFederal Savings & Loan Insurance Corporation Resolution Fund over time of 75% of most of the federal tax savings and 19.5% of
most of the California tax savings (in each case computed in accordance with specific provisions contained in the Assistance
Agreement) attributable to the utilization of certain tax loss carryforwards. The provision for such payments is reflected in the
Consolidated Financial Statements as "Income Taxes."
See Note 14 to the Consolidated Financial Statements—"Income Taxes" for further discussion.
Environmental Regulation
Our business and properties are subject to federal and state laws and regulations governing environmental matters, including the
regulation of hazardous substances and wastes. For example, under
http://www.sec.gov/Archives/edgar/data/933136/000104746904
46 9/17/2011
8/4/2019 Wamu 10-k 2003 Subprime
http://slidepdf.com/reader/full/wamu-10-k-2003-subprime 10/146
7
the federal Comprehensive Environmental Response, Compensation, and Liability Act and similar state laws, owners and operators
of contaminated properties may be liable for the costs of cleaning up hazardous substances without regard to whether such persons
actually caused the contamination. Such laws may affect us both as an owner of properties used in or held for our business, and as a
secured lender on property that is found to contain hazardous substances or wastes. Our general policy is to obtain an environmental
assessment prior to foreclosing on commercial property. The existence of hazardous substances or wastes on such property may cause
us to elect not to foreclose on the property, thereby limiting, and in some instances precluding, our realization on such loans.
Regulation and Supervision
The following discussion describes elements of the extensive regulatory framework applicable to savings and loan holding
companies, federal savings associations and state savings banks and provides some specific information relevant to us. This
regulatory framework is primarily intended for the protection of depositors, federal deposit insurance funds and the banking system as
a whole rather than for the protection of shareholders and creditors.
To the extent that this section describes statutory and regulatory provisions, it is qualified in its entirety by reference to those
provisions. Those statutes and regulations, as well as related policies, are subject to change by Congress, state legislatures and
federal and state regulators. Changes in statutes, regulations or regulatory policies applicable to the Company, including interpretation
or implementation thereof, could have a material effect on the Company's business.
General
Washington Mutual, Inc. is a Washington state corporation. It owns two federal savings associations and one Washington state-
chartered savings bank, as well as numerous nonbank subsidiaries. Because our state bank has elected to be treated as a savings
association for purposes of federal holding company law, Washington Mutual, Inc. is a savings and loan holding company. As a
savings and loan holding company, Washington Mutual, Inc. is subject to regulation by the Office of Thrift Supervision (the "OTS").
Our federal savings associations are subject to extensive regulation and examination by the OTS, their primary federal regulator,
as well as the FDIC. Our state bank is subject to regulation and supervision by the Director of Financial Institutions of the State of
Washington (the "State Director") and by the FDIC. Our nonbank financial subsidiaries are also subject to various federal and state
laws and regulations.
All of our banking subsidiaries are under the common control of Washington Mutual, Inc. and are insured by the FDIC. If aninsured institution fails, claims for administrative expenses of the receiver and for deposits in U.S. branches (including claims of the
FDIC as subrogee of the failed institution) have priority over the claims of general unsecured creditors. In addition, the FDIC has
authority to require any of our banking subsidiaries to reimburse it for losses it incurs in connection either with the failure of another
of our banking subsidiaries or with the FDIC's provision of assistance to one of our banking subsidiaries that is in danger of failure.
Payment of Dividends
Washington Mutual, Inc. is a legal entity separate and distinct from its banking and other subsidiaries. Its principal sources of
funds are cash dividends paid by those subsidiaries, investment income, and borrowings. Federal and state laws limit the amount of
dividends or other capital distributions that a banking institution, such as our federal associations and our state bank, can pay. Each of
our banking subsidiaries has a policy to remain well-capitalized and, accordingly, would not pay dividends to the extent payment of
the dividend would result in it not being well-capitalized. In addition, our federal associations must file a notice with the OTS at least
30 days before they can pay dividends to their parent companies.
8
See Note 19 to the Consolidated Financial Statements—"Regulatory Capital Requirements and Dividend Restrictions" for a more
detailed description of the limits on the dividends our subsidiary banks can pay.
Capital Adequacy
Washington Mutual, Inc. is not currently subject to any regulatory capi tal requirements, but each of its subsidiary depository
banking institutions is subject to various capital requirements. Our state bank is subject to FDIC capital requirements, while our
http://www.sec.gov/Archives/edgar/data/933136/000104746904
146 9/17/2011
8/4/2019 Wamu 10-k 2003 Subprime
http://slidepdf.com/reader/full/wamu-10-k-2003-subprime 11/146
federal associations are subject to OTS capital requirements. An institution's capital category depends upon where its capital levels
are in relation to relevant capital measures, which include a r isk-based capital measure, a leverage ratio capital measure, a tangible
equity ratio measure, and certain other factors.
Federal law and regulations establish minimum capital standards, and under the OTS and FDIC regulations, an institution (that is
not in the most highly-rated category) is required to have a leverage ratio of at least 4.00%, a Tier 1 risk-based ratio of 4.00% and a
total ri sk-based ratio of 8.00%. In addition, our federal associations are required to have a tangible capi tal ratio of 1.50%. Federal
law and regulations also establish five capital categories: well-capitalized, adequately capitalized, undercapitalized, significantly
undercapitalized and critically undercapitalized. An institution is treated as well-capitalized if its ratio of total capital to
risk-weighted assets is 10.00% or more, its ra tio of Tier 1 capital to risk-weighted assets is 6.00% or more, its leverage ratio is
5.00% or more, and it is not subject to any federal supervisory order or directive to meet a specific capital level. In order to be
adequately capitalized, an institution must have a total risk-based capital ratio of not less than 8.00%, a Tier 1 risk-based capital ratio
of not less than 4.00%, and (unless it is in the most highly-rated category) a leverage ratio of not less than 4.00%. Any institution that
is neither well-capitalized nor adequately capitalized will be considered undercapitalized. Any institution with a tangible equity ratio
of 2.00% or less will be considered critically undercapitalized.
As of December 31, 2003 each of our banking subsidiaries met all capital requirements to which it was subject and satisfied the
requirements to be treated as well-capitalized. See Note 19 to the Consolidated Financial Statements—"Regulatory Capital
Requirements and Dividend Restrictions" for an analysis of our regulatory capital.
Holding Company Status and Acquisitions
Washington Mutual, Inc. is a multiple savings and loan holding company, as defined by federal law, because it owns more than
one savings association. Washington Mutual, Inc. is regulated as a unitary savings and loan holding company, however, because theOTS deems our federal associations to have been acquired in supervisory transactions. Therefore, we are exempt from certain
restrictions that would otherwise apply under federal law to the activities and investments of a multiple savings and loan holding
company. These restrictions will apply to Washington Mutual, Inc. if any of our three banking institutions fails to meet a qualified
thrift lender test established by federal law. As of December 31, 2003, the Company's three banking subsidiaries were in compliance
with qualified thrift lender standards.
Washington Mutual, Inc. may not acquire control of another savings association unless the OTS approves. Washington
Mutual, Inc. may not be acquired by a company, other than a bank holding company, unless the OTS approves, or by an individual
unless the OTS does not object after receiving notice. Washington Mutual, Inc. may not be acquired by a bank holding company unless
the Board of Governors of the Federal Reserve System (the "Federal Reserve") approves. In any case, the public must have an
opportunity to comment on the proposed acquisition, and the OTS or Federal Reserve must complete an application review. Without
prior approval from the OTS, Washington Mutual, Inc. may not acquire more than 5% of the voting stock of any savings institution that
is not one of its subsidiaries.
9
The Gramm-Leach-Bliley Act generally restricts any non-financial entity from acquiring Washington Mutual, Inc. unless such
non-financial entity was, or had submitted an application to become, a savings and loan holding company as of May 4, 1999. Since
Washington Mutual, Inc. was treated as a unitary savings and loan holding company prior to that date, Washington Mutual, Inc. may
engage in non-financial activities and acquire non-financial subsidiaries.
Federal Home Loan Bank System
The primary purpose of the Federal Home Loan Banks (the "FHLBs") is to provide funding to their members for making housing
loans as well as for affordable housing and community development lending. The FHLBs are generally able to make advances to their member institutions at interest rates that are lower than could otherwise be obtained by such institutions. The FHLB System consists
of twelve regional FHLBs; each is federally chartered but privately owned by its member institutions. The Federal Housing Finance
Board ("Finance Board"), a government agency, is generally responsible for regulating the FHLB System.
One of our federal savings associations, Washington Mutual Bank, FA, currently is a member only of the San Francisco FHLB.
Our state bank, Washington Mutual Bank, and our other federal association, Washington Mutual Bank fsb, are members of the Seattle
FHLB.
Proposals have been made recently which would affect the operations and structure of the FHLB System. The Finance Board has
proposed a regulation that would require each FHLB to register its stock with the United States Securities and Exchange Commission
and provide more public disclosure. Congress is considering proposals which would establish a new regulator for the FHLB System,
http://www.sec.gov/Archives/edgar/data/933136/000104746904
146 9/17/2011
8/4/2019 Wamu 10-k 2003 Subprime
http://slidepdf.com/reader/full/wamu-10-k-2003-subprime 12/146
as well as for other housing government-sponsored entities. We cannot predict at this time which, if any, of these proposals may be
adopted or what effect they would have on the business of the Company.
Deposit Insurance
The FDIC insures the deposits of each of our banking subsidiaries to the applicable maximum in each institution, and such
insurance is backed by the full faith and credit of the United States government. The FDIC administers two separate deposit insurance
funds, the Bank Insurance Fund (the "BIF") and the Savings Association Insurance Fund (the "SAIF"). The BIF is a deposit insurance
fund for commercial banks and some federal and state-chartered savings banks. The SAIF is a deposit insurance fund for most savings
associations. Our state bank is a member of the BIF, but a substantial portion of its deposits is insured through the SAIF. Our federal
associations are members of the SAIF, but a small portion of Washington Mutual Bank, FA's deposits are insured through the BIF.
The FDIC has established a risk-based system for setting deposit insurance assessments. Under the risk-based assessment
system, an institution's insurance assessments vary according to the level of capital the institution holds and the degree to which it is
the subject of supervisory concern. During 2003, the assessment rate for both SAIF and BIF deposits ranged from zero to 0.27% of
assessable deposits. Our banking subsidiaries qualified for the lowest rate on their deposits in 2003 and paid no deposit insurance
assessments.
Affiliate Transaction Restrictions
Our three banking subsidiaries are subject to the same affiliate and insider transaction rules applicable to member banks of the
Federal Reserve System as well as additional limitations imposed by the OTS. These provisions prohibit or limit a banking
institution from extending credit to, or entering into certain transactions with, affiliates (such as Washington Mutual, Inc.), principal
stockholders, directors and executive officers of the banking institution and its affiliates. Each of our banking subsidiaries currently is
in material compliance with all of these limitations.
10
Federal Reserve, Consumer and Other Regulation
Numerous regulations promulgated by the Federal Reserve Board affect the business operations of our banking subsidiaries.
These include regulations relating to equal credit opportunity, electronic fund transfers, collection of checks, truth in lending, truth in
savings and availability of funds.
Under Federal Reserve Board regulations, each of our banking subsidiaries is required to maintain a reserve against its
transaction accounts (primarily interest-bearing and noninterest-bearing checking accounts). Because reserves must generally be
maintained in cash or in noninterest-bearing accounts, the effect of the reserve requirements is to increase an institution's cost of
funds.
The Gramm-Leach-Bliley Act included provisions that give consumers new protections regarding the transfer and use of their
nonpublic personal information by financial institutions. In addition, states are permitted under the Gramm-Leach-Bliley Act to have
their own privacy laws, which may offer greater protection to consumers than the Gramm-Leach-Bliley Act. Numerous states in
which the Company does business have enacted such laws.
The four federal banking agencies, including our regulators, have jointly issued expanded examination and supervision guidance
relating to two areas affecting our activities—subprime lending and, most recently, mortgage banking and mortgage servicing rights.
The USA PATRIOT Act, which was enacted following the events of September 11, 2001, included numerous provisions
designed to fight international money laundering and to block terrorist access to the U.S. financial system. We have established policies and procedures to ensure compliance with the Act's provisions, and the impact of the Act on our operations has not been
material.
Community Re investment Act
The Community Reinvestment Act ("CRA") requires that our banking subsidiaries ascertain and help meet the credit needs of the
communities we serve, including low- to moderate-income neighborhoods, while maintaining safe and sound banking practices. We
maintain a CRA file that is available for public viewing. The file includes copies of our most recent CRA Public Evaluations,
descriptions of our products and services, delivery outlet information, and public comments.
In September 2001, we announced a new ten-year $375 billion community commitment, effective January 2002. This
http://www.sec.gov/Archives/edgar/data/933136/000104746904
146 9/17/2011
8/4/2019 Wamu 10-k 2003 Subprime
http://slidepdf.com/reader/full/wamu-10-k-2003-subprime 13/146
commitment replaced prior ones made by us and the companies we acquired. As of December 31, 2003, we had exceeded our yearly
targets for lending in low- to moderate-income neighborhoods and underserved market areas.
Regulatory Enforcement
The OTS, FDIC and the State Director may take regulatory enforcement actions against any of their regulated institutions that do
not operate in accordance with applicable regulations, policies and directives. Proceedings may be instituted against any banking
institution, or any institution-affiliated party, such as a director, officer, employee, agent, or controlling person, who engages in unsafe
and unsound practices, including violations of applicable laws and regulations. Each of the OTS, the FDIC and the State Director has
authority under various circumstances to appoint a receiver or conservator for an insured institution that it regulates, to issue cease
and desist orders, to obtain injunctions restraining or prohibiting unsafe or unsound practices, to revalue assets and to require the
establishment of reserves. The FDIC has additional authority to terminate insurance of accounts, after notice and hearing, upon a
finding that the insured institution is or has engaged in any unsafe or unsound practice that has not been corrected, is operating in an
unsafe or unsound condition, or has violated any applicable law, regulation, rule, or order of, or condition imposed by the FDIC.
11
Regulation of Nonbanking Affiliates
As broker-dealers registered with the Securities and Exchange Commission and as members of the National Association of
Securities Dealers, Inc., our broker-dealer subsidiaries are subject to various regulations and restrictions imposed by those entities,
as well as by various state authorities. As a registered investment advisor, WM Advisors is subject to various federal and state
securities regulations and restrictions. Our specialty mortgage finance subsidiary is subject to various federal and state laws and
regulations, including those relating to truth-in-lending, equal credit opportunity, fair credit reporting, real estate settlement
procedures, debt collection practices and usury. Our insurance subsidiaries are subject to regulation by various state insurance
regulators. Some of our subsidiaries are subject to various state licensing and examination requirements.
Executive Officers
The following table sets forth certain information regarding the executive officers of Washington Mutual:
Executive Officers
Age
Capacity in Which Serve d
Employee of
Company
Since
Kerry K. Killinger 54 Chairman of the Board of Directors, President andChief Executive Officer
1983
Thomas W. Casey 41 Executive Vice President and Chief Financial Officer 2002
Craig J. Chapman 47 President, Commercial Group and Chief
Administrative Officer
1998
Fay L. Chapman 57 Senior Executive Vice President and General Counsel 1997
Daryl D. David 49 Executive Vice President, Human Resources 2000
Jeremy V. Gross 46 Executive Vice President and Chief Information
Officer
2001
William A. Longbrake 61 Vice Chair 1996
Robert H. Miles 47 Senior Vice President and Controller 1999
Deanna W. Oppenheimer 45 President, Consumer Group 1985
Craig E. Tall 58 Vice Chair, Corporate Development 1985
James G. Vanasek 60 Executive Vice President and Chief Enterprise Risk Officer 1999
Mr. Killinger established the Executive Committee in 1990 to facilitate and coordinate decision making by and communication
among the most senior executive officers of the Company who, as a committee, determine the Company's strategic direction. The
President's Council, established by Mr. Killinger in December 2002 and comprised of the Chief Financial Officer, the Chief
Administrative Officer and the Group Presidents, is focused on operational efficiency, operational decision-making and strategic
execution, with particular emphasis on operations and execution across business segments. The executive officers serving on these
committees at December 31, 2003 are indicated below.
Mr. Killinger is Chairman, President and Chief Executive Officer of Washington Mutual. He was named President and Director
in 1988, Chief Executive Officer in 1990 and Chairman in 1991. Mr. Killinger joined Washington Mutual as an Executive Vice
President of Washington Mutual Bank in 1983. He has been a member of the Executive Committee since its formation in 1990.
http://www.sec.gov/Archives/edgar/data/933136/000104746904
146 9/17/2011
8/4/2019 Wamu 10-k 2003 Subprime
http://slidepdf.com/reader/full/wamu-10-k-2003-subprime 14/146
Mr. Casey is Executive Vice President and Chief Financial Officer of Washington Mutual. As a member of the Executive
Committee and the President's Council, he oversees all aspects of Washington Mutual's corporate finance, strategic planning and
investor relations functions. Prior to joining Washington Mutual, Mr. Casey was with GE Capital Corp. from 1992 through 2002
where he held advising,
12
controllership and analyst positions prior to becoming a vice president of GE and Senior Vice President and CFO of GE FinancialAssurance in 1999.
Mr. Chapman is President of the Commercial Group and Chief Administrative Officer. He is responsible for overseeing multi-
family lending, commercial real estate, homebuilder finance, mortgage banker finance, Long Beach Mortgage Company, and
commercial banking. As Chief Administrative Officer, Mr. Chapman oversees operational excellence, acquisition integration,
corporate property services and strategic sourcing. After joining Washington Mutual in 1998 as President and Chief Executive Officer
of Washington Mutual Finance Corporation, he became a member of the Executive Committee in 2001 and a member of the
President's Council in 2002. Previously, Mr. Chapman served as President of AMRESCO Residential Mortgage Corporation from
1996 to 1997.
Ms. Chapman is Washington Mutual's General Counsel and has been Senior Executive Vice President since 1999. She became
Executive Vice President, General Counsel and a member of the Executive Committee in 1997. Prior to joining Washington Mutual,
she was a partner at the Seattle law office of Foster Pepper & Shefelman PLLC from 1979 to 1997.
Mr. David joined Washington Mutual in 2000 as Executive Vice President, Human Resources. He is responsible for talent
acquisition, organizational capabilities, leadership development and rewards and benefits. Mr. David became a member of the
Executive Committee in 2001. He joined Washington Mutual from Amazon.com where he was Vice President of Strategic Growth and
Human Resources from 1999 to 2000. Previously, he served as Executive Vice President and Chief Administrative Officer of Sanga
International from 1998 to 1999.
Mr. Gross joined Washington Mutual in 2001 as Executive Vice President and Chief Information Officer and became a member
of the Executive Committee at that time. He is responsible for directing the Company's corporate technology strategy. Mr. Gross
joined Washington Mutual from Sydney, Australia-based Westpac Banking Corp. where he was Group Executive of Technology,
Operations and eCommerce from 1999 to 2001. From 1992 to 1999, he was Managing Director and Chief Technology Officer at
Countrywide Credit Industries.
Mr. Longbrake has been Vice Chair since 1999 and a member of the Executive Committee since 1996. He serves as the
Company's primary executive liaison with regulators, legislators, industry trade organizations, and government-sponsored enterprises.
Mr. Longbrake was an Executive Vice President from 1996 to 1999 and served as the Company's Chief Financial Officer from 1996
to 2002.
Mr. Miles has been Senior Vice President and Controller since January 2001. He serves as Washington Mutual's principal
accounting officer. Mr. Miles joined the Company as Senior Vice President, Corporate Tax in June 1999. Prior to joining the
Company, Mr. Miles was Director, Domestic Taxes of the former BankBoston, N.A. from 1996 to 1999.
Ms. Oppenheimer is President of the Consumer Group. She is responsible for two of the Company's reporting segments, Retail
Banking and Financial Services, and Mortgage Banking. Additionally, Ms. Oppenheimer oversees corporate relations and the
Company's Corporate Innovation and Research Center. Ms. Oppenheimer became Executive Vice President in 1993, has been a
member of the Executive Committee since its formation in 1990, and became a member of the President's Council in 2002. She has been an officer of the Company since 1985.
Mr. Tall is Vice Chair of Corporate Development. He is responsible for overseeing the Company's corporate development,
including acquisitions and divestitures. He is also Chairman of Washington Mutual's Strategic Capital Fund Investment Committee.
Mr. Tall became an Executive Vice President in 1987 and Vice Chair in 1999. He has been a member of the Executive Committee
since its formation in 1990.
13
http://www.sec.gov/Archives/edgar/data/933136/000104746904
146 9/17/2011
8/4/2019 Wamu 10-k 2003 Subprime
http://slidepdf.com/reader/full/wamu-10-k-2003-subprime 15/146
Mr. Vanasek is Executive Vice President and Chief Enterprise Risk Officer. He is responsible for overseeing credit risk
management for the Company, as well as compliance, market and operational risk, internal audit and business continuity. Mr. Vanasek
became a member of the Executive Committee in 2001. Prior to joining Washington Mutual in 1999, he spent eight years at the former
Norwest Bank, in a variety of lending risk management positions including Chief Credit Officer.
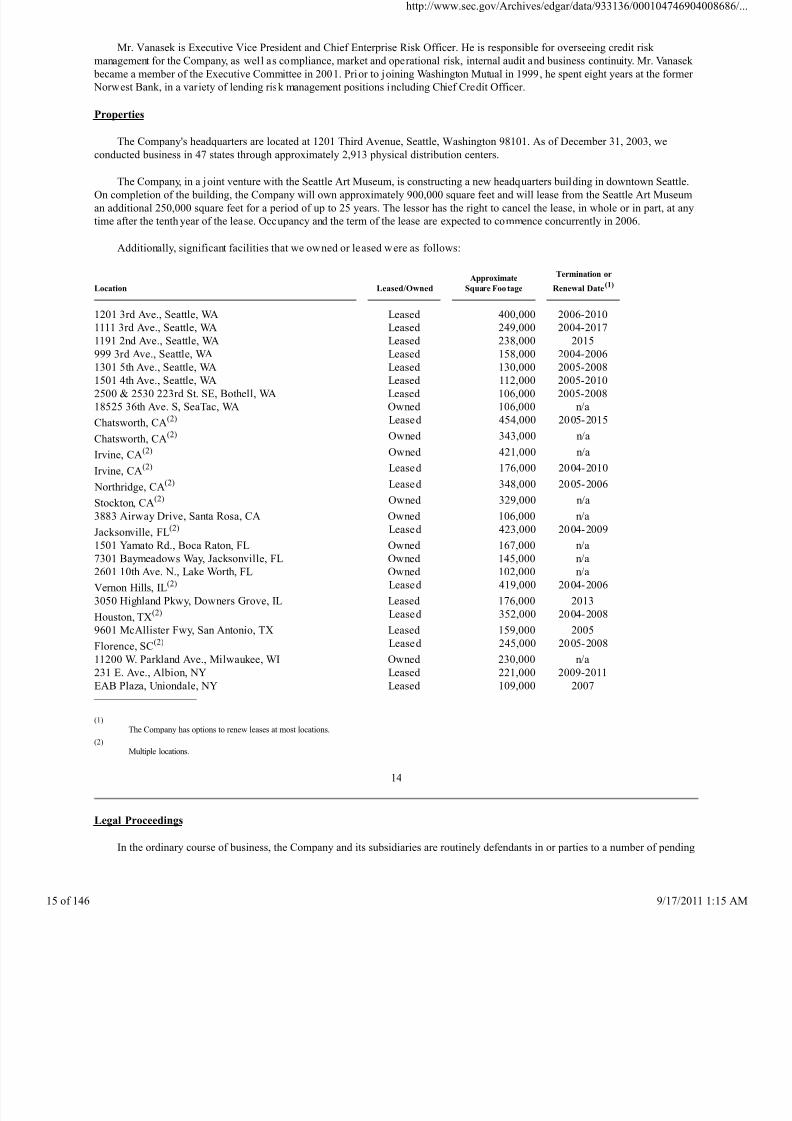
Properties
The Company's headquarters are located at 1201 Third Avenue, Seattle, Washington 98101. As of December 31, 2003, we
conducted business in 47 states through approximately 2,913 physical distribution centers.
The Company, in a joint venture with the Seattle Art Museum, is constructing a new headquarters building in downtown Seattle.
On completion of the building, the Company will own approximately 900,000 square feet and will lease from the Seattle Art Museum
an additional 250,000 square feet for a period of up to 25 years. The lessor has the right to cancel the lease, in whole or in part, at any
time after the tenth year of the lease. Occupancy and the term of the lease are expected to commence concurrently in 2006.
Additionally, significant facilities that we owned or leased were as follows:
Location
Leased/Owned
Approximate
Square Foo tage
Termination or
Renewal Date(1)
1201 3rd Ave., Seattle, WA Leased 400,000 2006-2010
1111 3rd Ave., Seattle, WA Leased 249,000 2004-2017
1191 2nd Ave., Seattle, WA Leased 238,000 2015
999 3rd Ave., Seattle, WA Leased 158,000 2004-20061301 5th Ave., Seattle, WA Leased 130,000 2005-2008
1501 4th Ave., Seattle, WA Leased 112,000 2005-2010
2500 & 2530 223rd St. SE, Bothell, WA Leased 106,000 2005-2008
18525 36th Ave. S, SeaTac, WA Owned 106,000 n/a
Chatsworth, CA(2) Leased 454,000 2005-2015
Chatsworth, CA(2) Owned 343,000 n/a
Irvine, CA(2) Owned 421,000 n/a
Irvine, CA(2) Leased 176,000 2004-2010
Northridge, CA(2) Leased 348,000 2005-2006
Stockton, CA(2) Owned 329,000 n/a
3883 Airway Drive, Santa Rosa, CA Owned 106,000 n/a
Jacksonville, FL(2) Leased 423,000 2004-2009
1501 Yamato Rd., Boca Raton, FL Owned 167,000 n/a
7301 Baymeadows Way, Jacksonville, FL Owned 145,000 n/a
2601 10th Ave. N., Lake Worth, FL Owned 102,000 n/a
Vernon Hills, IL(2) Leased 419,000 2004-2006
3050 Highland Pkwy, Downers Grove, IL Leased 176,000 2013
Houston, TX(2) Leased 352,000 2004-2008
9601 McAllister Fwy, San Antonio, TX Leased 159,000 2005
Florence, SC(2) Leased 245,000 2005-2008
11200 W. Parkland Ave., Milwaukee, WI Owned 230,000 n/a
231 E. Ave., Albion, NY Leased 221,000 2009-2011
EAB Plaza, Uniondale, NY Leased 109,000 2007
(1)
The Company has options to renew leases at most locations.
(2)
Multiple locations.
14
Legal Proceedings
In the ordinary course of business, the Company and its subsidiaries are routinely defendants in or parties to a number of pending
http://www.sec.gov/Archives/edgar/data/933136/000104746904
146 9/17/2011
8/4/2019 Wamu 10-k 2003 Subprime
http://slidepdf.com/reader/full/wamu-10-k-2003-subprime 16/146
and threatened legal actions and proceedings, including actions brought on behalf of various classes of claimants. In certain of these
actions and proceedings, claims for substantial monetary damages are asserted against the Company and its subsidiaries. Certain of
these actions and proceedings are based on alleged violations of consumer protection, banking and other laws.
See Note 15 to the Consolidated Financial Statements—"Commitments, Guarantees and Contingencies" for a further discussion
of pending and threatened li tigation action and proceedings against the Company.
Submission of Matters to a Vote of Security Holders
No matters were submitted to shareholders during the fourth quarter of 2003.
PART II
Market for our Common Stock and Related Stockholder Matters
Our common stock trades on The New York Stock Exchange under the symbol WM. As of February 27, 2004, there were
868,397,759 shares issued and outstanding (including 6 million shares held in escrow) held by 51,293 shareholders of record. The
information regarding high and low quarterly sales prices of the Company's common stock, and the quarterly cash dividends declared
thereon, is set forth in this Form 10-K/A in the "Quarterly Results of Operations" table included under Supplementary Data on page
151 and is expressly incorporated herein by reference.
15
MANAGEMENT'S DISCUSSION AND ANALYSIS OF FINANCIAL CONDITION AND RESULTS OF OPERATIONS
Restatements of Financial Statements
During the fourth quarter of 2003, the Company concluded that the inclusion of certain components (i .e. deferred acquisition
costs and claims stabilization reserves) in the cash surrender value of its bank-owned life insurance policies was incorrect. The
accounting policy the Company previously used resulted in the overstatement of the cash surrender value of the policies and,
accordingly, other noninterest income. This restatement also decreased other assets, and correspondingly, retained earnings by
$73 million, $38 million and $28 million as of December 31, 2002, 2001 and 2000. The restatement only affects periods commencing
with the second quarter of 2000 when the policies were first acquired and had no tax effect. The Company has corrected itsaccounting for all affected prior reporting periods.
During the first quarter of 2004 and subsequent to the original filing of the Company's Annual Report on Form 10-K, the
Company corrected the funds transfer pricing methodology applied to the financial results of the Company's operating segments for the
year ending December 31, 2001. The correction revises certain operating segment information, including net interest income and net
income, of its operating segment results reported for that year. The corrected information is included in the operating segment tables
presented herein and in Note 25 to the Consolidated Financial Statements—"Operating Segments." Such information had no effect on
previously reported 2001 consolidated results of operations or any other period presented in this report.
Discontinued Operations
On November 24, 2003 the Company announced a definitive agreement to sell its subsidiary, Washington Mutual Finance
Corporation, to CitiFinancial, a subsidiary of Citigroup, for approximately $1.25 billion in cash. This sale was completed onJanuary 9, 2004. Accordingly, Washington Mutual Finance is presented in this report as a discontinued operation with the results of
operations and cash flows segregated from the Company's results of continuing operations for all periods presented on the
Consolidated Statements of Income, Cash Flows and Notes to the Consolidated Financial Statements as well as the tables presented
herein, unless otherwise noted. Likewise, the assets and liabilities of Washington Mutual Finance have each been combined and
presented as separate captions on the Consolidated Statements of Financial Condition.
Controls and Procedures
Disclosure Controls and Procedures
The Company's management, under the direction of the Company's Chief Executive Officer and Chief Financial Officer, has
http://www.sec.gov/Archives/edgar/data/933136/000104746904
146 9/17/2011
8/4/2019 Wamu 10-k 2003 Subprime
http://slidepdf.com/reader/full/wamu-10-k-2003-subprime 17/146
evaluated the effectiveness of the Company's disclosure controls and procedures as of the end of the period covered by this report.
Based on such evaluation, the Company's Chief Executive Officer and Chief Financial Officer have concluded that, as of the end of
such period, the Company's disclosure controls and procedures are effective in recording, processing, summarizing and reporting, on
a timely basis, information required to be disclosed by the Company in the reports that it files or submits under the Securities
Exchange Act of 1934.
We review and evaluate the design and effectiveness of our disclosure controls and procedures on an ongoing basis and improve
our controls and procedures over time and correct any deficiencies that we may discover. While we believe the present design of our
disclosure controls and procedures is effective, future events affecting our business may cause us to modify our disclosure controls
and procedures.
16
Internal Control Over Financial Reporting
There have not been any changes in the Company's internal control over financial reporting during the fourth quarter of 2003 that
have materially affected, or are reasonably likely to materially affect, the Company's internal control over financial reporting.
Overview
Net income increased to $3.88 bi llion or $4.21 per diluted share in 2003, from $3.86 billion or $4.02 per diluted share in 2002,an increase of 5% on a per share basis. The increase in earnings per share was predominantly due to share repurchase activity that
occurred during the year. During 2003, the Company repurchased a total of 65.9 million shares, as compared with 38.0 million shares
repurchased in 2002. Largely in response to a favorable change in the federal income tax treatment of dividends and our financial
performance, the Company's common stock dividend payout ratio increased from 25.92% in 2002 to 32.63% in 2003.
Net interest income declined to $7.63 bil lion in 2003, a decrease of $500 million from $8.13 billion in 2002. This decrease w as
attributable to a 30 basis point decline in the net interest margin year-over-year. We expect the margin to contract further in 2004 as
yields on our debt securities and loans continue to reprice downward to current market levels.
Home loan mortgage banking income was $1.97 billion in 2003, an increase of $1.27 billion from $707 million in 2002. During
the first part of 2003, the anemic recovery in the U.S. economy pressured home loan mortgage lending rates to historical lows. This,
in turn, fueled an industry-wide mortgage refinance boom, and led to extremely high loan volume, an increase in gain from mortgage
loans and high levels of noninterest-bearing custodial deposits (collected from loan payoff activity) during the first half of 2003. Inthe third quarter of 2003, the monthly average of the U.S. mortgage refinance index (seasonally adjusted) declined by 31%, which
was caused by a sharp increase in mortgage interest rates. As a result, customer preferences began to shift from fixed-rate, salable
production to adjustable-rate, portfolio activity, which resulted in a decline in gain from mortgage loans and lower levels of custodial
balances. Market volatility and operational issues exacerbated the decrease in gain from mortgage loans during the third quarter of
2003. Refinancing activity diminished further in the fourth quarter of 2003 as mortgage interest rates remained above their historical
low points and thus caused gain from mortgage loans to remain well below the levels recorded during the first half of the year. The
volatility in mortgage interest rates in 2003 also caused significant fluctuations in the anticipated prepayment speeds of the Company's
loans serviced for others portfolio and, as a result, led to significant changes in the amortization level and the fair value of the
Company's MSR. The performance of the Company's MSR risk management instruments during the year, which consist of derivative
financial instruments and available-for-sale securities, mitigated the financial effects of prepayment speed volatility.
Additional strides were made in retail banking market penetration as there was a net increase of over 800,000 retail checking
accounts during the year, including over 180,000 during the fourth quarter, bringing the Company's total to more than 8 millionaccounts. The year produced depositor and other retail banking fees of $1.82 billion, an increase of $184 million from $1.63 billion
in 2002. At year end, the average mature retail banking household maintained 5.59 products and services with the Company, an
increase from 5.28 at year end 2002. A total of 260 new retail banking stores were opened in 2003, bringing the total number of retail
banking stores nationwide to 1,776 at the end of the year. The build out of our national retail banking franchise will continue in 2004,
as we expect to open approximately 250 new stores and deepen existing relationships by cross-selling additional products to
customers.
Noninterest expense was $7.41 billion, an increase of $1.22 billion from $6.19 billion in 2002 due to higher personnel costs to
accommodate the high refinancing activity in the earlier part of the year and the opening of new retail banking stores. With the
refinancing boom over, the Company announced its cost containment initiative in the fourth quarter of 2003. The Company intends to
reduce expenses in those areas of operations that are not integral to the Company's planned expansion of the retail banking
http://www.sec.gov/Archives/edgar/data/933136/000104746904
146 9/17/2011
8/4/2019 Wamu 10-k 2003 Subprime
http://slidepdf.com/reader/full/wamu-10-k-2003-subprime 18/146
17
franchise. The savings realized from this cost containment initiative will be used to facilitate this expansion. The recent realignment
of the Company's operations into two major categories—retail consumers and commercial customers—will support this initiative by
eliminating redundant operations and processes. The Company expects that the impact of this initiative, which is not scheduled to be
completed until the middle of 2005, coupled with the costs to be incurred in 2004 from the continuing expansion of the retail banking
franchise, will result in an increase in noninterest expense of no more than 5% in 2004, as compared with 2003.
Credit quality of the Company's loan portfolio improved in 2003 as the Company benefited from the strengthening U.S. economy
during the latter part of the year and continued to take advantage of market opportunities to reduce specific credit risk exposures. At
December 31, 2003, nonperforming assets as a percentage of total assets were 0.70 percent versus 0.93 percent at December 31,
2002. Total nonperforming assets were down $546 million to $1.94 billion at December 31, 2003, as compared wi th $2.48 billion at
December 31, 2002. The improved credit risk profile resulted in the recording of a $202 million reversal in the allowance for loan
and lease losses in the fourth quarter of 2003 and a provision for loan and lease losses of $42 million for the year ended
December 31, 2003.
In the fourth quarter of 2003, the Company entered into a definitive agreement to sell Washington Mutual Finance Corporation, a
subsidiary of the Company, to CitiFinancial, a subsidiary of Citigroup, for approximately $1.25 billion. The sale was completed on
January 9, 2004 and resulted in a pre-tax gain of approximately $660 million, to be recorded in the first quarter of 2004.
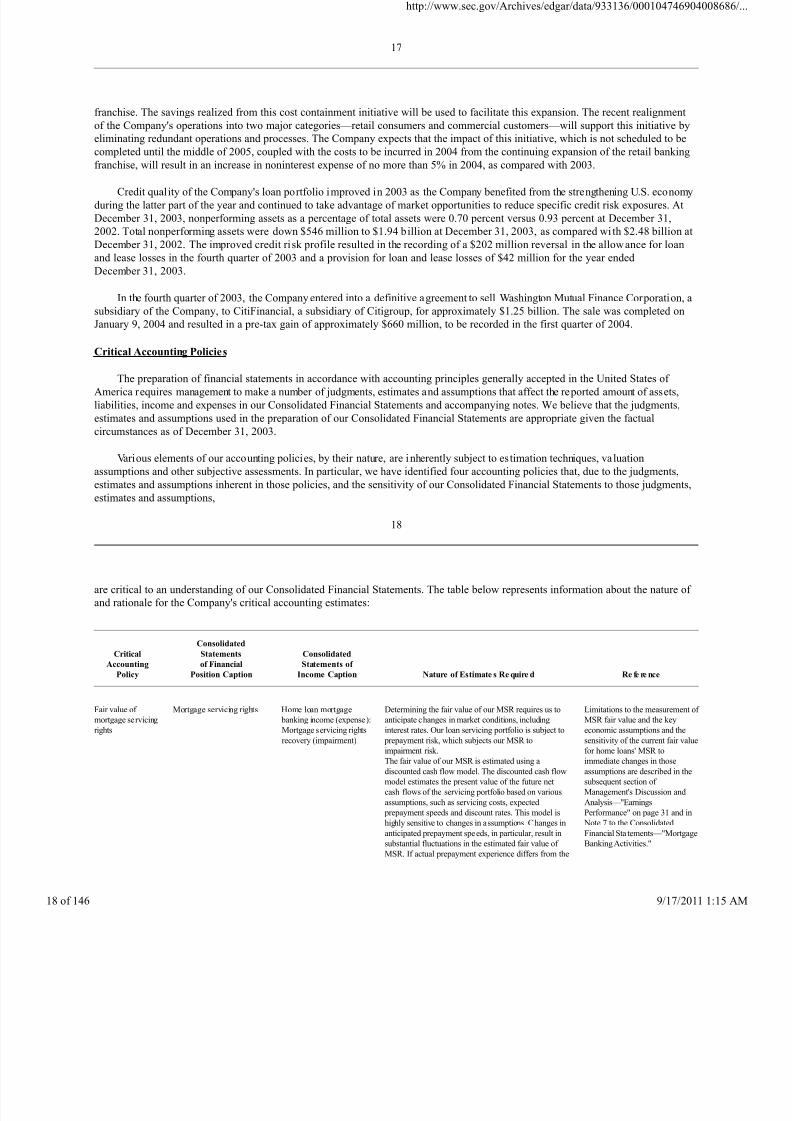
Critical Accounting Policies
The preparation of financial statements in accordance with accounting principles generally accepted in the United States of
America requires management to make a number of judgments, estimates and assumptions that affect the reported amount of assets,
liabilities, income and expenses in our Consolidated Financial Statements and accompanying notes. We believe that the judgments,
estimates and assumptions used in the preparation of our Consolidated Financial Statements are appropriate given the factual
circumstances as of December 31, 2003.
Various elements of our accounting policies, by their nature, are inherently subject to estimation techniques, valuation
assumptions and other subjective assessments. In particular, we have identified four accounting policies that, due to the judgments,
estimates and assumptions inherent in those policies, and the sensitivity of our Consolidated Financial Statements to those judgments,
estimates and assumptions,
18
are critical to an understanding of our Consolidated Financial Statements. The table below represents information about the nature of
and rationale for the Company's critical accounting estimates:
Critical
Accounting
Policy
Consolidated
Statements
of Financial
Position Caption
Consolidated
Statements of
Income Caption Nature of Estimate s Re quire d Re fe re nce
Fair value of
mortgage servicing
rights
Mortgage servicing rights Home loan mortgage
banking income (expense):
Mortgage servicing rights
recovery (impairment)
Determining the fair value of our MSR requires us to
anticipate changes in market conditions, including
interest rates. Our loan servicing portfolio is subject to
prepayment risk, which subjects our MSR to
impairment risk.
The fair value of our MSR is estimated using a
discounted cash flow model. The discounted cash flow
model estimates the present value of the future net
cash flows of the servicing portfolio based on various
assumptions, such as servicing costs, expected
prepayment speeds and discount rates. This model is
highly sensitive to changes in assumptions. Changes in
anticipated prepayment speeds, in particular, result in
substantial fluctuations in the estimated fair value of
MSR. If actual prepayment experience differs from the
Limitations to the measurement of
MSR fair value and the key
economic assumptions and the
sensitivity of the current fair value
for home loans' MSR to
immediate changes in those
assumptions are described in the
subsequent section of
Management's Discussion and
Analysis—"Earnings
Performance" on page 31 and in
Note 7 to the Consolidated
Financial Sta tements—"Mortgage
Banking Activities."
http://www.sec.gov/Archives/edgar/data/933136/000104746904
146 9/17/2011
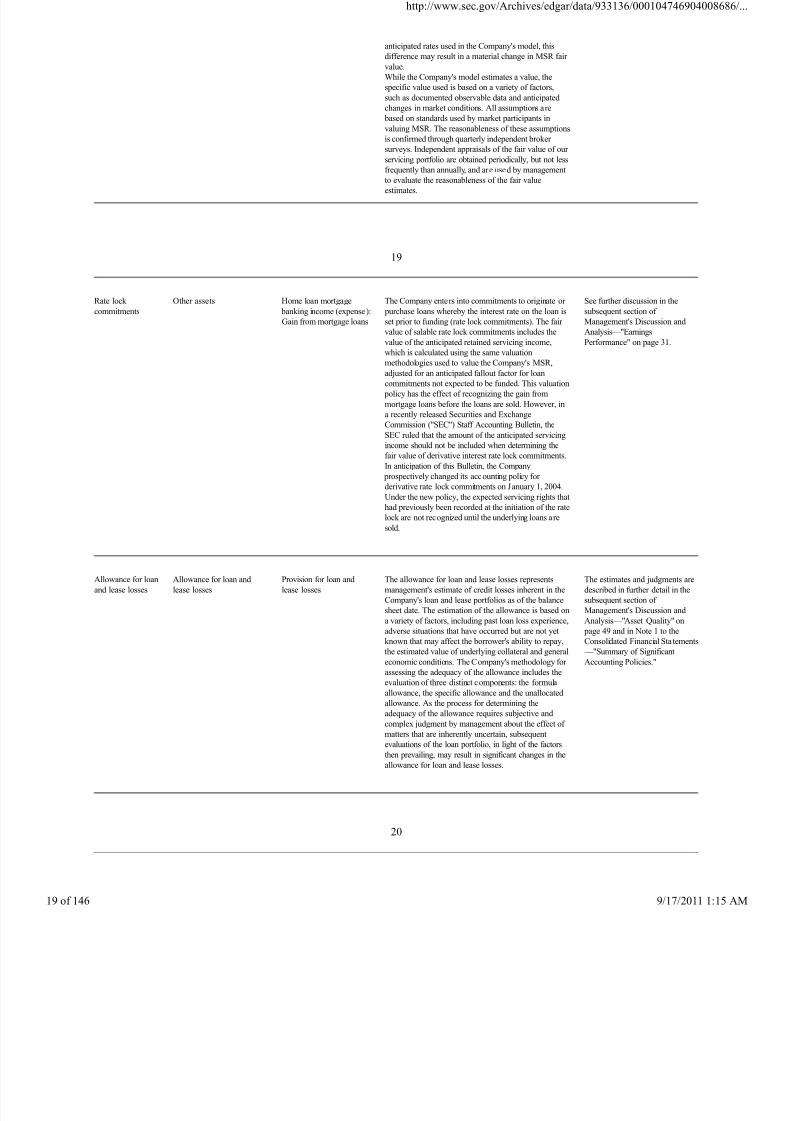
8/4/2019 Wamu 10-k 2003 Subprime
http://slidepdf.com/reader/full/wamu-10-k-2003-subprime 19/146
anticipated rates used in the Company's model, this
difference may result in a material change in MSR fair
value.
While the Company's model estimates a value, the
specific value used is based on a variety of factors,
such as documented observable data and anticipated
changes in market conditions. All assumptions are
based on standards used by market participants in
valuing MSR. The reasonableness of these assumptions
is confirmed through quarterly independent broker
surveys. Independent appraisals of the fair value of our
servicing portfolio are obtained periodically, but not less
frequently than annually, and are used by management
to evaluate the reasonableness of the fair value
estimates.
19
Rate lock
commitments
Other assets Home loan mortgage
banking income (expense):
Gain from mortgage loans
The Company enters into commitments to originate or
purchase loans whereby the interest rate on the loan is
set prior to funding (rate lock commitments). The fair
value of salable rate lock commitments includes the
value of the anticipated retained servicing income,
which is calculated using the same valuationmethodologies used to value the Company's MSR,
adjusted for an anticipated fallout factor for loan
commitments not expected to be funded. This valuation
policy has the effect of recognizing the gain from
mortgage loans before the loans are sold. However, in
a recently released Securities and Exchange
Commission ("SEC") Staff Accounting Bulletin, the
SEC ruled that the amount of the anticipated servicing
income should not be included when determining the
fair value of derivative interest rate lock commitments.
In anticipation of this Bulletin, the Company
prospectively changed its accounting policy for
derivative rate lock commitments on January 1, 2004.
Under the new policy, the expected servicing rights that
had previously been recorded at the initiation of the rate
lock are not recognized until the underlying loans are
sold.
See further discussion in the
subsequent section of
Management's Discussion and
Analysis—"Earnings
Performance" on page 31.
Allowance for loan
and lease losses
Allowance for loan and
lease losses
Provision for loan and
lease losses
The allowance for loan and lease losses represents
management's estimate of credit losses inherent in the
Company's loan and lease portfolios as of the balance
sheet date. The estimation of the allowance is based on
a variety of factors, including past loan loss experience,
adverse situations that have occurred but are not yet
known that may affect the borrower's ability to repay,
the estimated value of underlying collateral and general
economic conditions. The Company's methodology for
assessing the adequacy of the allowance includes the
evaluation of three distinct components: the formula
allowance, the specific allowance and the unallocated
allowance. As the process for determining theadequacy of the allowance requires subjective and
complex judgment by management about the effect of
matters that are inherently uncertain, subsequent
evaluations of the loan portfolio, in light of the factors
then prevailing, may result in significant changes in the
allowance for loan and lease losses.
The estimates and judgments are
described in further detail in the
subsequent section of
Management's Discussion and
Analysis—"Asset Quality" on
page 49 and in Note 1 to the
Consolidated Financial Sta tements
—"Summary of Significant
Accounting Policies."
20
http://www.sec.gov/Archives/edgar/data/933136/000104746904
146 9/17/2011
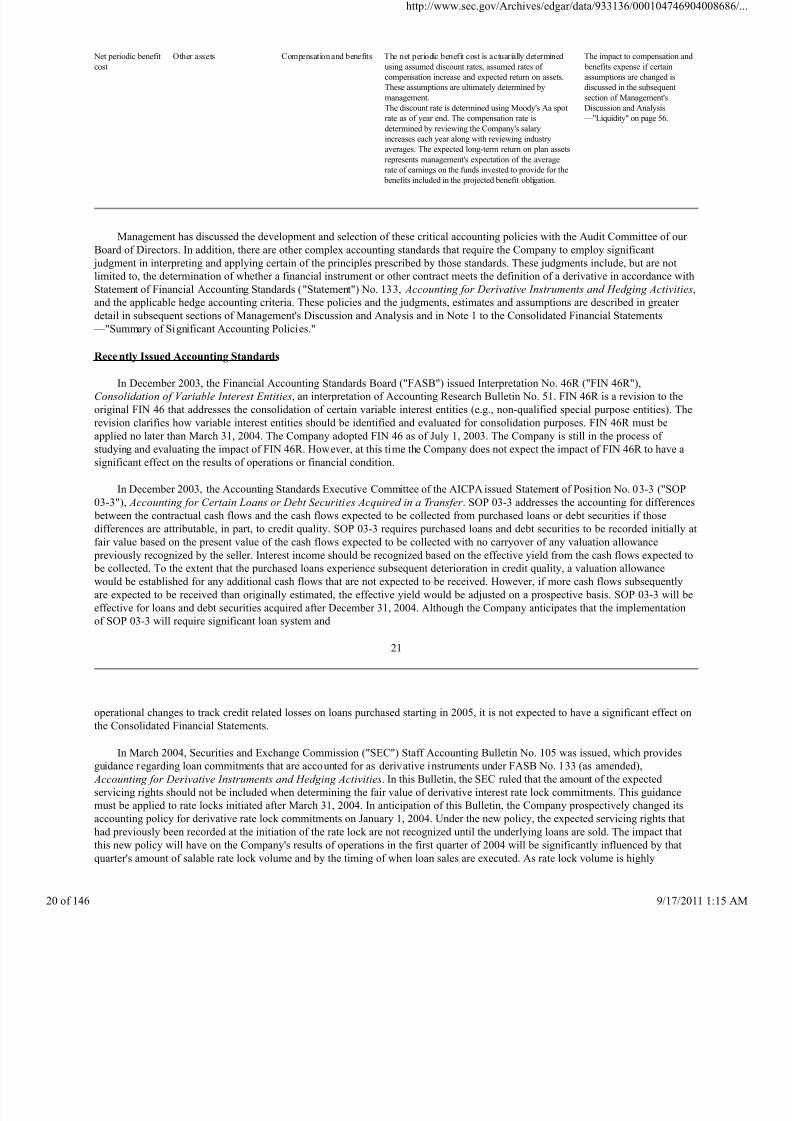
8/4/2019 Wamu 10-k 2003 Subprime
http://slidepdf.com/reader/full/wamu-10-k-2003-subprime 20/146
Net periodic benefit
cost
Other assets Compensation and benefits The net periodic benefit cost is actuarially determined
using assumed discount rates, assumed rates of
compensation increase and expected return on assets.
These assumptions are ultimately determined by
management.
The discount rate is determined using Moody's Aa spot
rate as of year end. The compensation rate is
determined by reviewing the Company's salary
increases each year along with reviewing industry
averages. The expected long-term return on plan assets
represents management's expectation of the average
rate of earnings on the funds invested to provide for the
benefits included in the projected benefit obligation.
The impact to compensation and
benefits expense if certain
assumptions are changed is
discussed in the subsequent
section of Management's
Discussion and Analysis
—"Liquidity" on page 56.
Management has discussed the development and selection of these critical accounting policies with the Audit Committee of our
Board of Directors. In addition, there are other complex accounting standards that require the Company to employ significant
judgment in interpreting and applying certain of the principles prescribed by those standards. These judgments include, but are not
limited to, the determination of whether a financial instrument or other contract meets the definition of a derivative in accordance with
Statement of Financial Accounting Standards ("Statement") No. 133, Accounting for Derivative Instruments and Hedging Activities,
and the applicable hedge accounting criteria. These policies and the judgments, estimates and assumptions are described in greater
detail in subsequent sections of Management's Discussion and Analysis and in Note 1 to the Consolidated Financial Statements
—"Summary of Significant Accounting Policies."
Rece ntly Issued Accounting Standards
In December 2003, the Financial Accounting Standards Board ("FASB") issued Interpretation No. 46R ("FIN 46R"),
Consolidation of Variable Interest Entities, an interpretation of Accounting Research Bulletin No. 51. FIN 46R is a revision to the
original FIN 46 that addresses the consolidation of certain variable interest entities (e.g., non-qualified special purpose entities). The
revision clarifies how variable interest entities should be identified and evaluated for consolidation purposes. FIN 46R must be
applied no later than March 31, 2004. The Company adopted FIN 46 as of July 1, 2003. The Company is still in the process of
studying and evaluating the impact of FIN 46R. However, at this time the Company does not expect the impact of FIN 46R to have a
significant effect on the results of operations or financial condition.
In December 2003, the Accounting Standards Executive Committee of the AICPA issued Statement of Posi tion No. 03-3 ("SOP
03-3"), Accounting for Certain Loans or Debt Securities Acquired in a Transfer . SOP 03-3 addresses the accounting for differences
between the contractual cash flows and the cash flows expected to be collected from purchased loans or debt securities if those
differences are attributable, in part, to credit quality. SOP 03-3 requires purchased loans and debt securities to be recorded initially atfair value based on the present value of the cash flows expected to be collected with no carryover of any valuation allowance
previously recognized by the seller. Interest income should be recognized based on the effective yield from the cash flows expected to
be collected. To the extent that the purchased loans experience subsequent deterioration in credit quality, a valuation allowance
would be established for any additional cash flows that are not expected to be received. However, if more cash flows subsequently
are expected to be received than originally estimated, the effective yield would be adjusted on a prospective basis. SOP 03-3 will be
effective for loans and debt securities acquired after December 31, 2004. Although the Company anticipates that the implementation
of SOP 03-3 will require significant loan system and
21
operational changes to track credit related losses on loans purchased starting in 2005, it is not expected to have a significant effect on
the Consolidated Financial Statements.
In March 2004, Securities and Exchange Commission ("SEC") Staff Accounting Bulletin No. 105 was issued, which provides
guidance regarding loan commitments that are accounted for as derivative instruments under FASB No. 133 (as amended),
Accounting for Derivative Instruments and Hedging Activities. In this Bulletin, the SEC ruled that the amount of the expected
servicing rights should not be included when determining the fair value of derivative interest rate lock commitments. This guidance
must be applied to rate locks initiated after March 31, 2004. In anticipation of this Bulletin, the Company prospectively changed its
accounting policy for derivative rate lock commitments on January 1, 2004. Under the new policy, the expected servicing rights that
had previously been recorded at the initiation of the rate lock are not recognized until the underlying loans are sold. The impact that
this new policy will have on the Company's results of operations in the first quarter of 2004 will be significantly influenced by that
quarter's amount of salable rate lock volume and by the timing of when loan sales are executed. As rate lock volume is highly
http://www.sec.gov/Archives/edgar/data/933136/000104746904
146 9/17/2011
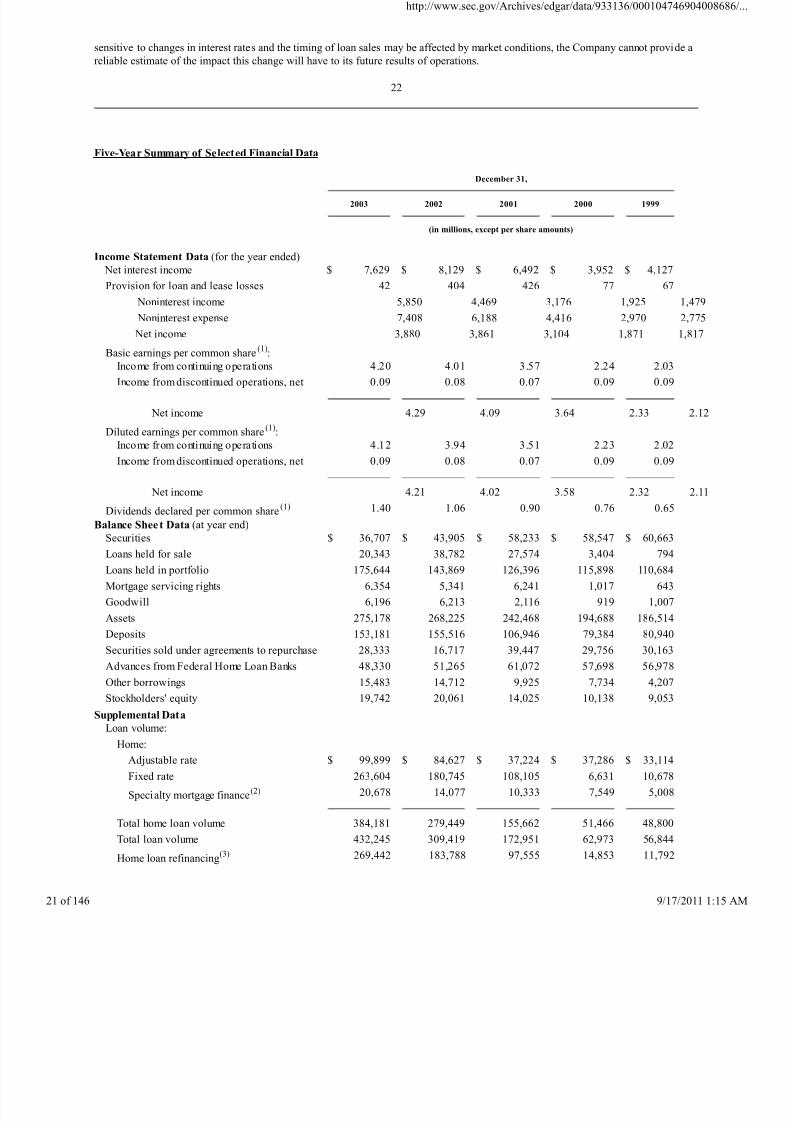
8/4/2019 Wamu 10-k 2003 Subprime
http://slidepdf.com/reader/full/wamu-10-k-2003-subprime 21/146
sensitive to changes in interest rates and the timing of loan sales may be affected by market conditions, the Company cannot provide a
reliable estimate of the impact this change will have to its future results of operations.
22
Five-Year Summary of Selected Financial Data
December 31,
2003
2002
2001
2000
1999
(in millions, except per share amounts)
Income Statement Data (for the year ended)
Net interest income $ 7,629 $ 8,129 $ 6,492 $ 3,952 $ 4,127
Provision for loan and lease losses 42 404 426 77 67
Noninterest income 5,850 4,469 3,176 1,925 1,479
Noninterest expense 7,408 6,188 4,416 2,970 2,775
Net income 3,880 3,861 3,104 1,871 1,817
Basic earnings per common share(1): Income from continuing operations 4.20 4.01 3.57 2.24 2.03
Income from discontinued operations, net 0.09 0.08 0.07 0.09 0.09
Net income 4.29 4.09 3.64 2.33 2.1
Diluted earnings per common share(1):
Income from continuing operations 4.12 3.94 3.51 2.23 2.02
Income from discontinued operations, net 0.09 0.08 0.07 0.09 0.09
Net income 4.21 4.02 3.58 2.32 2.1
Dividends declared per common share(1) 1.40 1.06 0.90 0.76 0.65
Balance Shee t Data (at year end) Securities $ 36,707 $ 43,905 $ 58,233 $ 58,547 $ 60,663
Loans held for sale 20,343 38,782 27,574 3,404 794
Loans held in portfolio 175,644 143,869 126,396 115,898 110,684
Mortgage servicing rights 6,354 5,341 6,241 1,017 643
Goodwill 6,196 6,213 2,116 919 1,007
Assets 275,178 268,225 242,468 194,688 186,514
Deposits 153,181 155,516 106,946 79,384 80,940
Securities sold under agreements to repurchase 28,333 16,717 39,447 29,756 30,163
Advances from Federal Home Loan Banks 48,330 51,265 61,072 57,698 56,978
Other borrowings 15,483 14,712 9,925 7,734 4,207
Stockholders' equity 19,742 20,061 14,025 10,138 9,053Supplemental Data
Loan volume:
Home:
Adjustable rate $ 99,899 $ 84,627 $ 37,224 $ 37,286 $ 33,114
Fixed rate 263,604 180,745 108,105 6,631 10,678
Specialty mortgage finance(2) 20,678 14,077 10,333 7,549 5,008
Total home loan volume 384,181 279,449 155,662 51,466 48,800
Total loan volume 432,245 309,419 172,951 62,973 56,844
Home loan refinancing(3) 269,442 183,788 97,555 14,853 11,792
http://www.sec.gov/Archives/edgar/data/933136/000104746904
146 9/17/2011
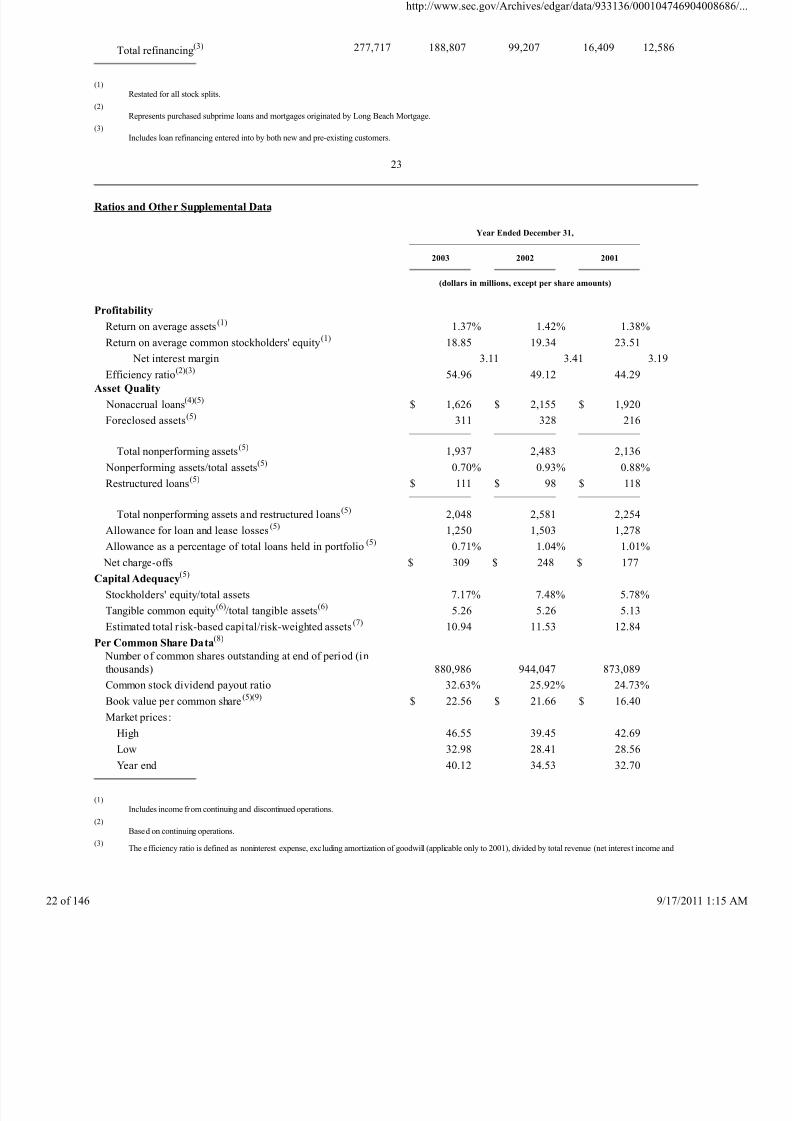
8/4/2019 Wamu 10-k 2003 Subprime
http://slidepdf.com/reader/full/wamu-10-k-2003-subprime 22/146
Total refinancing(3) 277,717 188,807 99,207 16,409 12,586
(1)
Restated for all stock splits.
(2)
Represents purchased subprime loans and mortgages originated by Long Beach Mortgage.
(3)
Includes loan refinancing entered into by both new and pre-existing customers.
23
Ratios and Other Supplemental Data
Year Ended December 31,
2003
2002
2001
(dollars in millions, except per share amounts)
Profitability
Return on average assets(1) 1.37% 1.42% 1.38%
Return on average common stockholders' equity(1) 18.85 19.34 23.51
Net interest margin 3.11 3.41 3.19
Efficiency ratio(2)(3) 54.96 49.12 44.29
Asset Quality
Nonaccrual loans(4)(5) $ 1,626 $ 2,155 $ 1,920
Foreclosed assets(5) 311 328 216
Total nonperforming assets(5) 1,937 2,483 2,136
Nonperforming assets/total assets(5) 0.70% 0.93% 0.88%
Restructured loans(5) $ 111 $ 98 $ 118
Total nonperforming assets and restructured loans(5) 2,048 2,581 2,254
Allowance for loan and lease losses(5) 1,250 1,503 1,278
Allowance as a percentage of total loans held in portfolio (5) 0.71% 1.04% 1.01%
Net charge-offs $ 309 $ 248 $ 177
Capital Adequacy(5)
Stockholders' equity/total assets 7.17% 7.48% 5.78%
Tangible common equity(6)/total tangible assets(6) 5.26 5.26 5.13
Estimated total r isk-based capi tal/risk-weighted assets(7) 10.94 11.53 12.84
Per Common Share Data(8)
Number of common shares outstanding at end of period (in
thousands) 880,986 944,047 873,089
Common stock dividend payout ratio 32.63% 25.92% 24.73%
Book value per common share(5)(9) $ 22.56 $ 21.66 $ 16.40Market prices:
High 46.55 39.45 42.69
Low 32.98 28.41 28.56
Year end 40.12 34.53 32.70
(1)
Includes income from continuing and discontinued operations.
(2)
Based on continuing operations.
(3)The efficiency ratio is defined as noninterest expense, excluding amortization of goodwill (applicable only to 2001), divided by total revenue (net interest income and
http://www.sec.gov/Archives/edgar/data/933136/000104746904
146 9/17/2011
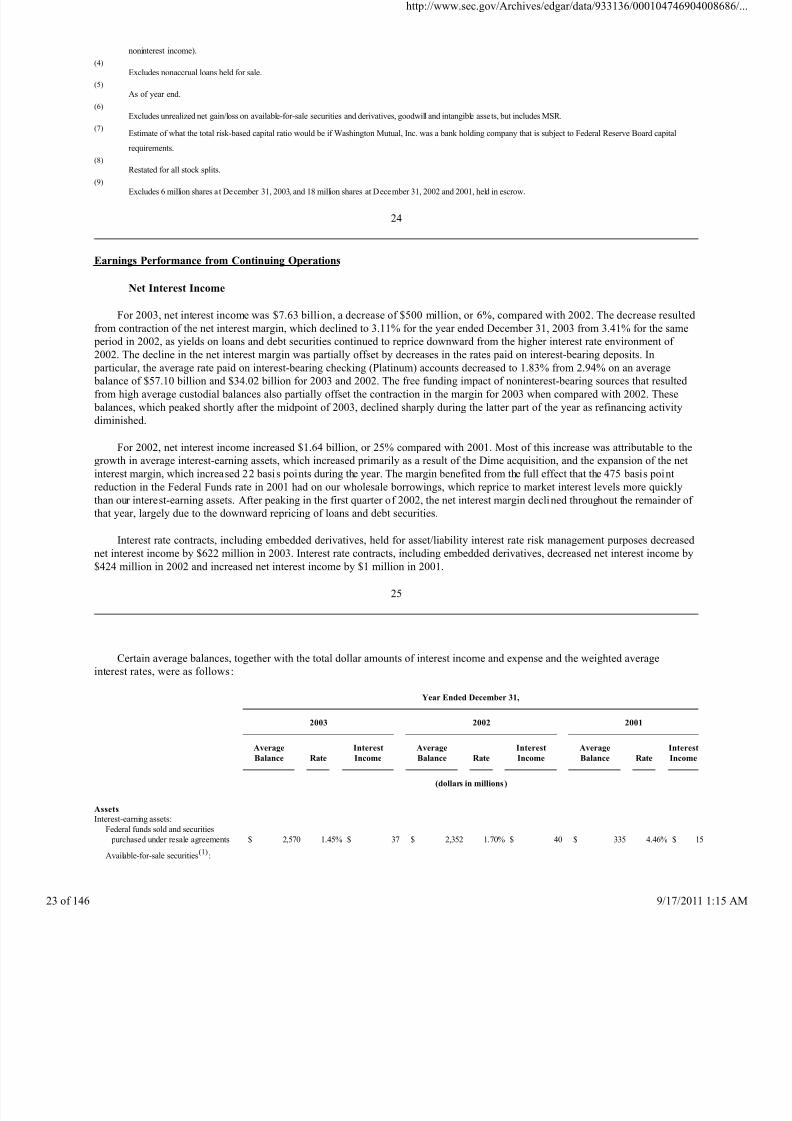
8/4/2019 Wamu 10-k 2003 Subprime
http://slidepdf.com/reader/full/wamu-10-k-2003-subprime 23/146
noninterest income).
(4)
Excludes nonaccrual loans held for sale.
(5)
As of year end.
(6)
Excludes unrealized net gain/loss on available-for-sale securities and derivatives, goodwill and intangible assets, but includes MSR.
(7)Estimate of what the total risk-based capital ratio would be if Washington Mutual, Inc. was a bank holding company that is subject to Federal Reserve Board capital
requirements.
(8)
Restated for all stock splits.
(9)
Excludes 6 million shares at December 31, 2003, and 18 million shares at December 31, 2002 and 2001, held in escrow.
24
Earnings Performance from Continuing Operations
Net Interest Income
For 2003, net interest income was $7.63 billion, a decrease of $500 million, or 6%, compared with 2002. The decrease resulted
from contraction of the net interest margin, which declined to 3.11% for the year ended December 31, 2003 from 3.41% for the same
period in 2002, as yields on loans and debt securities continued to reprice downward from the higher interest rate environment of
2002. The decline in the net interest margin was partially offset by decreases in the rates paid on interest-bearing deposits. In
particular, the average rate paid on interest-bearing checking (Platinum) accounts decreased to 1.83% from 2.94% on an average
balance of $57.10 billion and $34.02 billion for 2003 and 2002. The free funding impact of noninterest-bearing sources that resulted
from high average custodial balances also partially offset the contraction in the margin for 2003 when compared with 2002. These
balances, which peaked shortly after the midpoint of 2003, declined sharply during the latter part of the year as refinancing activity
diminished.
For 2002, net interest income increased $1.64 billion, or 25% compared with 2001. Most of this increase was attributable to the
growth in average interest-earning assets, which increased primarily as a result of the Dime acquisition, and the expansion of the net
interest margin, which increased 22 basi s points during the year. The margin benefited from the full effect that the 475 basis point
reduction in the Federal Funds rate in 2001 had on our wholesale borrowings, which reprice to market interest levels more quickly
than our interest-earning assets. After peaking in the first quarter of 2002, the net interest margin declined throughout the remainder of
that year, largely due to the downward repricing of loans and debt securities.
Interest rate contracts, including embedded derivatives, held for asset/liability interest rate risk management purposes decreased
net interest income by $622 million in 2003. Interest rate contracts, including embedded derivatives, decreased net interest income by
$424 million in 2002 and increased net interest income by $1 million in 2001.
25
Certain average balances, together with the total dollar amounts of interest income and expense and the weighted average
interest rates, were as follows:
Year Ended December 31,
2003
2002
2001
Average
Balance
Rate
Interest
Income
Average
Balance
Rate
Interest
Income
Average
Balance
Rate
Interest
Income
(dollars in millions)
Assets
Interest-earning assets:
Federal funds sold and securities
purchased under resale agreements $ 2,570 1.45% $ 37 $ 2,352 1.70% $ 40 $ 335 4.46% $ 15
Available-for-sale securities(1)
:
http://www.sec.gov/Archives/edgar/data/933136/000104746904
146 9/17/2011
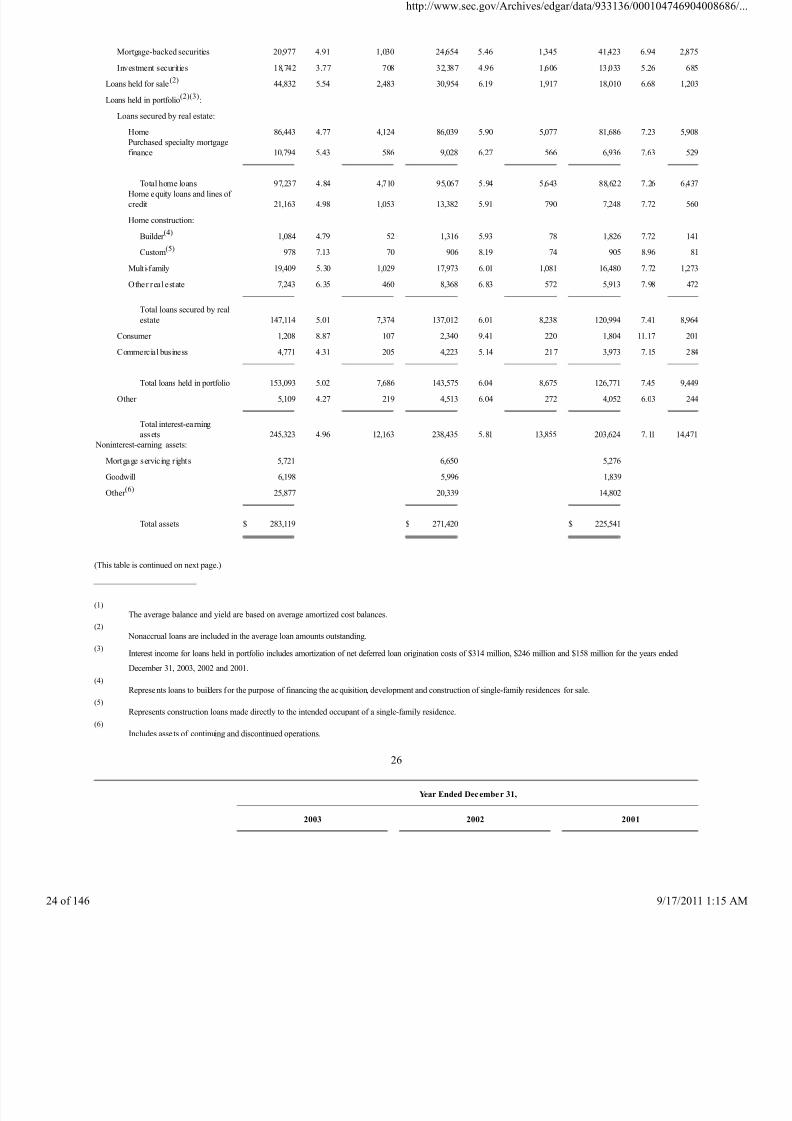
8/4/2019 Wamu 10-k 2003 Subprime
http://slidepdf.com/reader/full/wamu-10-k-2003-subprime 24/146
Mortgage-backed securities 20,977 4.91 1,030 24,654 5.46 1,345 41,423 6.94 2,875
Investment securities 18,742 3.77 708 32,387 4.96 1,606 13,033 5.26 685
Loans held for sale(2)
44,832 5.54 2,483 30,954 6.19 1,917 18,010 6.68 1,203
Loans held in portfolio(2)(3)
:
Loans secured by real estate:
Home 86,443 4.77 4,124 86,039 5.90 5,077 81,686 7.23 5,908
Purchased specialty mortgage
finance 10,794 5.43 586 9,028 6.27 566 6,936 7.63 529
Total home loans 97,237 4.84 4,710 95,067 5.94 5,643 88,622 7.26 6,437
Home equity loans and lines of
credit 21,163 4.98 1,053 13,382 5.91 790 7,248 7.72 560
Home construction:
Builder (4)
1,084 4.79 52 1,316 5.93 78 1,826 7.72 141
Custom(5) 978 7.13 70 906 8.19 74 905 8.96 81
Multi-family 19,409 5.30 1,029 17,973 6.01 1,081 16,480 7.72 1,273
Other real estate 7,243 6.35 460 8,368 6.83 572 5,913 7.98 472
Total loans secured by real
estate 147,114 5.01 7,374 137,012 6.01 8,238 120,994 7.41 8,964
Consumer 1,208 8.87 107 2,340 9.41 220 1,804 11.17 201
Commercial business 4,771 4.31 205 4,223 5.14 217 3,973 7.15 284
Total loans held in portfolio 153,093 5.02 7,686 143,575 6.04 8,675 126,771 7.45 9,449
Other 5,109 4.27 219 4,513 6.04 272 4,052 6.03 244
Total interest-earning
assets 245,323 4.96 12,163 238,435 5.81 13,855 203,624 7.11 14,471
Noninterest-earning assets:
Mortgage servicing r ights 5,721 6,650 5,276
Goodwill 6,198 5,996 1,839
Other (6)
25,877 20,339 14,802
Total assets $ 283,119 $ 271,420 $ 225,541
(This table is continued on next page.)
(1)
The average balance and yield are based on average amortized cost balances.
(2)
Nonaccrual loans are included in the average loan amounts outstanding.
(3)Interest income for loans held in portfolio includes amortization of net deferred loan origination costs of $314 million, $246 million and $158 million for the years ended
December 31, 2003, 2002 and 2001.
(4)
Represents loans to builders for the purpose of financing the acquisition, development and construction of single-family residences for sale.
(5)Represents construction loans made directly to the intended occupant of a single-family residence.
(6)
Includes asse ts of continuing and discontinued operations.
26
Year Ended December 31,
2003
2002
2001
http://www.sec.gov/Archives/edgar/data/933136/000104746904
146 9/17/2011
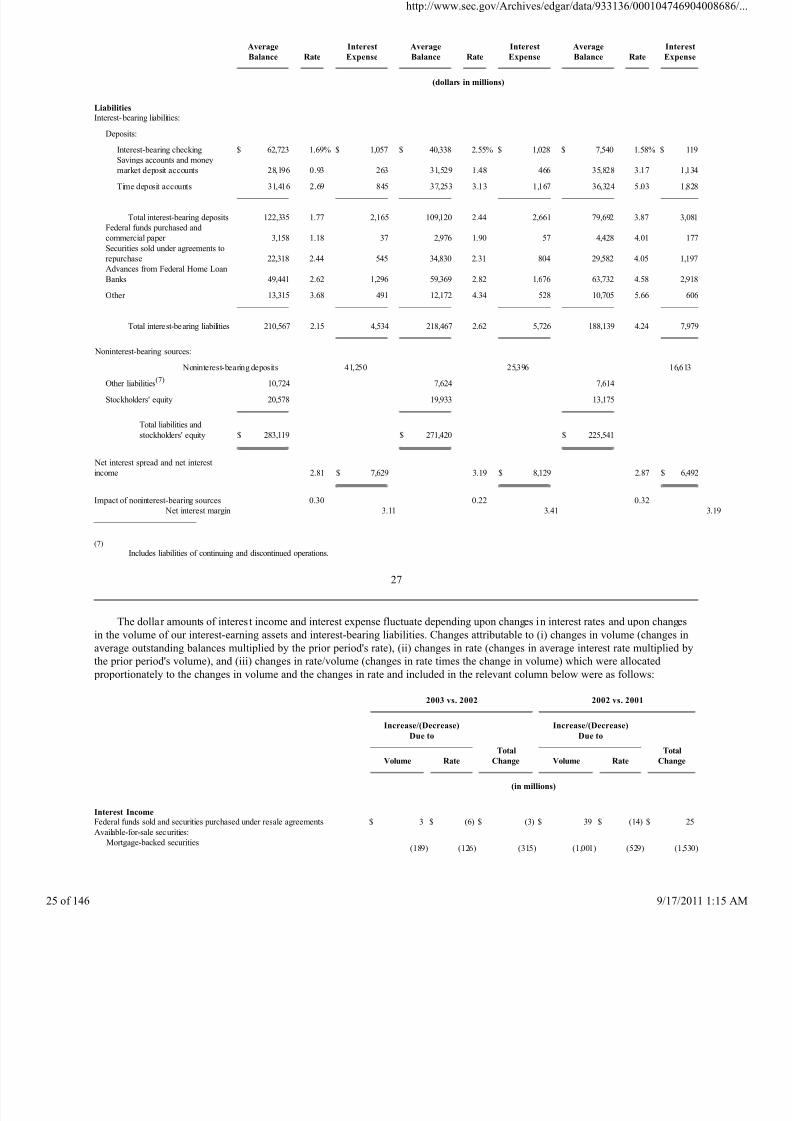
8/4/2019 Wamu 10-k 2003 Subprime
http://slidepdf.com/reader/full/wamu-10-k-2003-subprime 25/146
Average
Balance
Rate
Interest
Expense
Average
Balance
Rate
Interest
Expense
Average
Balance
Rate
Interest
Expense
(dollars in millions)
Liabilities
Interest-bearing liabilities:
Deposits:
Interest-bearing checking $ 62,723 1.69% $ 1,057 $ 40,338 2.55% $ 1,028 $ 7,540 1.58% $ 119
Savings accounts and money
market deposit accounts 28,196 0.93 263 31,529 1.48 466 35,828 3.17 1,134
Time deposit accounts 31,416 2.69 845 37,253 3.13 1,167 36,324 5.03 1,828
Total interest-bearing deposits 122,335 1.77 2,165 109,120 2.44 2,661 79,692 3.87 3,081
Federal funds purchased and
commercial paper 3,158 1.18 37 2,976 1.90 57 4,428 4.01 177
Securities sold under agreements to
repurchase 22,318 2.44 545 34,830 2.31 804 29,582 4.05 1,197
Advances from Federal Home Loan
Banks 49,441 2.62 1,296 59,369 2.82 1,676 63,732 4.58 2,918
Other 13,315 3.68 491 12,172 4.34 528 10,705 5.66 606
Total interest-bearing liabilities 210,567 2.15 4,534 218,467 2.62 5,726 188,139 4.24 7,979
Noninterest-bearing sources:
Noninterest-bearing deposits 41,250 25,396 16,613
Other liabilities(7)
10,724 7,624 7,614
Stockholders' equity 20,578 19,933 13,175
Total liabilities and
stockholders' equity $ 283,119 $ 271,420 $ 225,541
Net interest spread and net interest
income 2.81 $ 7,629 3.19 $ 8,129 2.87 $ 6,492
Impact of noninterest-bearing sources 0.30 0.22 0.32
Net interest margin 3.11 3.41
(7)
Includes liabilities of continuing and discontinued operations.
27
The dollar amounts of interest income and interest expense fluctuate depending upon changes in interest rates and upon changes
in the volume of our interest-earning assets and interest-bearing liabilities. Changes attributable to (i) changes in volume (changes in
average outstanding balances multiplied by the prior period's rate), (ii) changes in rate (changes in average interest rate multiplied by
the prior period's volume), and (iii) changes in rate/volume (changes in rate times the change in volume) which were allocated
proportionately to the changes in volume and the changes in rate and included in the relevant column below were as follows:
2003 vs. 2002
2002 vs. 2001
Increase/(Decrease)
Due to Increase/(Decrease)
Due to
Total
Change
Total
Change
Volume
Rate
Volume
Rate
(in millions)
Interest Income
Federal funds sold and securities purchased under resale agreements $ 3 $ (6) $ (3) $ 39 $ (14) $ 25
Available-for-sale securities:
Mortgage-backed securities(189) (126) (315) (1,001) (529) (1,530)
http://www.sec.gov/Archives/edgar/data/933136/000104746904
146 9/17/2011
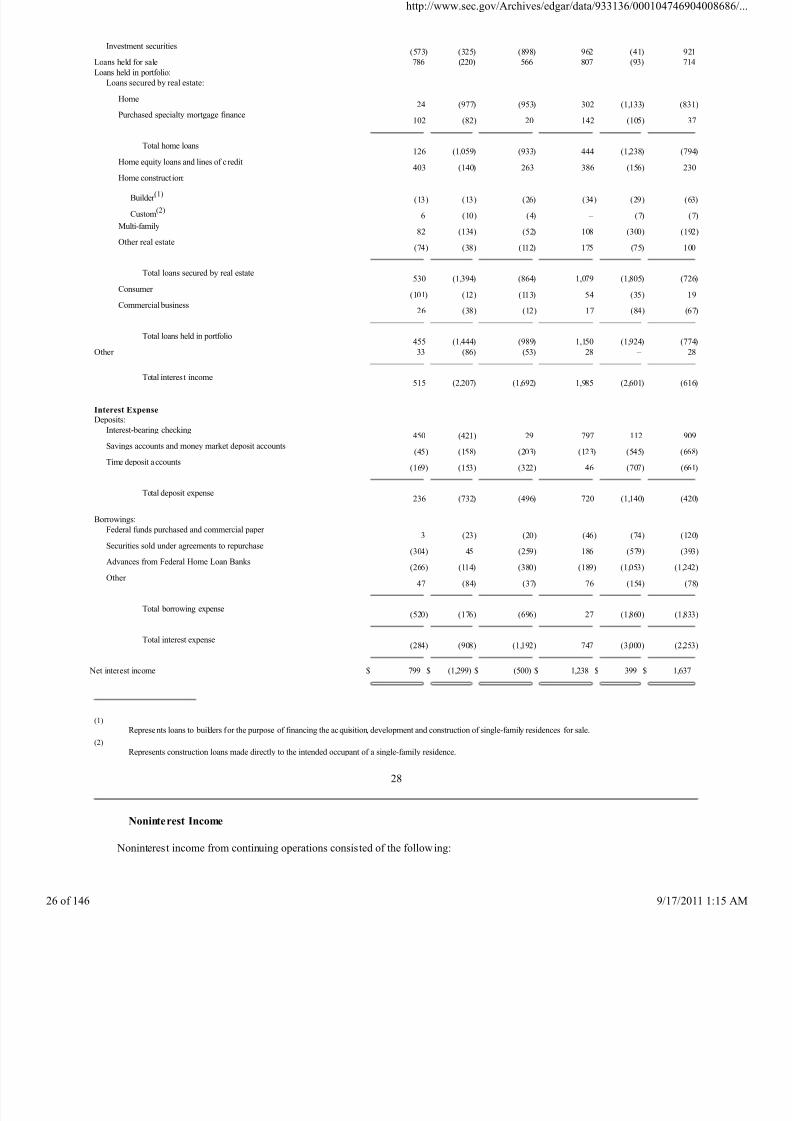
8/4/2019 Wamu 10-k 2003 Subprime
http://slidepdf.com/reader/full/wamu-10-k-2003-subprime 26/146
Investment securities(573) (325) (898) 962 (41) 921
Loans held for sale 786 (220) 566 807 (93) 714
Loans held in portfolio:
Loans secured by real estate:
Home24 (977) (953) 302 (1,133) (831)
Purchased specialty mortgage finance102 (82) 20 142 (105) 37
Total home loans126 (1,059) (933) 444 (1,238) (794)
Home equity loans and lines of c redit403 (140) 263 386 (156) 230
Home construction:
Builder (1)
(13) (13) (26) (34) (29) (63)
Custom(2)
6 (10) (4) – (7) (7)
Multi-family82 (134) (52) 108 (300) (192)
Other real estate(74) (38) (112) 175 (75) 100
Total loans secured by real estate530 (1,394) (864) 1,079 (1,805) (726)
Consumer (101) (12) (113) 54 (35) 19
Commercial business26 (38) (12) 17 (84) (67)
Total loans held in portfolio455 (1,444) (989) 1,150 (1,924) (774)
Other 33 (86) (53) 28 – 28
Total interest income515 (2,207) (1,692) 1,985 (2,601) (616)
Interest Expense
Deposits:
Interest-bearing checking450 (421) 29 797 112 909
Savings accounts and money market deposit accounts(45) (158) (203) (123) (545) (668)
Time deposit accounts(169) (153) (322) 46 (707) (661)
Total deposit expense236 (732) (496) 720 (1,140) (420)
Borrowings:
Federal funds purchased and commercial paper 3 (23) (20) (46) (74) (120)
Securities sold under agreements to repurchase(304) 45 (259) 186 (579) (393)
Advances from Federal Home Loan Banks(266) (114) (380) (189) (1,053) (1,242)
Other 47 (84) (37) 76 (154) (78)
Total borrowing expense(520) (176) (696) 27 (1,860) (1,833)
Total interest expense(284) (908) (1,192) 747 (3,000) (2,253)
Net interest income $ 799 $ (1,299) $ (500) $ 1,238 $ 399 $ 1,637
(1)
Represents loans to builders for the purpose of financing the acquisition, development and construction of single-family residences for sale.
(2)
Represents construction loans made directly to the intended occupant of a single-family residence.
28
Noninterest Income
Noninterest income from continuing operations consisted of the following:
http://www.sec.gov/Archives/edgar/data/933136/000104746904
146 9/17/2011
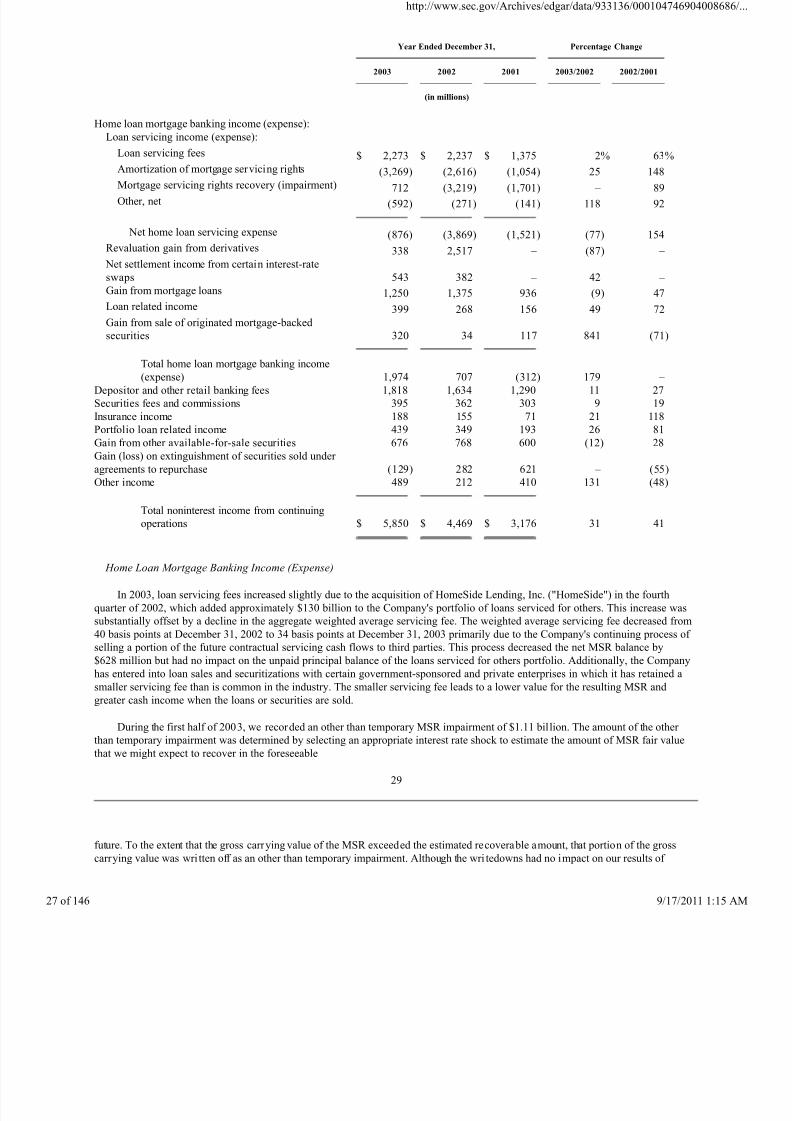
8/4/2019 Wamu 10-k 2003 Subprime
http://slidepdf.com/reader/full/wamu-10-k-2003-subprime 27/146
Year Ended December 31,
Percentage Change
2003
2002
2001
2003/2002
2002/2001
(in millions)
Home loan mortgage banking income (expense):
Loan servicing income (expense):
Loan servicing fees $ 2,273 $ 2,237 $ 1,375 2% 63%
Amortization of mortgage servicing rights
(3,269) (2,616) (1,054) 25 148Mortgage servicing rights recovery (impairment) 712 (3,219) (1,701) – 89
Other, net (592) (271) (141) 118 92
Net home loan servicing expense (876) (3,869) (1,521) (77) 154
Revaluation gain from derivatives 338 2,517 – (87) –
Net settlement income from certain interest-rate
swaps
543 382 – 42 –
Gain from mortgage loans 1,250 1,375 936 (9) 47
Loan related income 399 268 156 49 72
Gain from sale of originated mortgage-backed
securities
320 34 117 841 (71)
Total home loan mortgage banking income
(expense)
1,974 707 (312) 179 –
Depositor and other retail banking fees 1,818 1,634 1,290 11 27
Securities fees and commissions 395 362 303 9 19
Insurance income 188 155 71 21 118
Portfolio loan related income 439 349 193 26 81
Gain from other available-for-sale securities 676 768 600 (12) 28
Gain (loss) on extinguishment of securities sold under
agreements to repurchase
(129) 282 621 – (55)
Other income 489 212 410 131 (48)
Total noninterest income from continuing
operations
$ 5,850 $ 4,469 $ 3,176 31 41
Home Loan Mortgage Banking Income (Expense)
In 2003, loan servicing fees increased slightly due to the acquisition of HomeSide Lending, Inc. ("HomeSide") in the fourth
quarter of 2002, which added approximately $130 billion to the Company's portfolio of loans serviced for others. This increase was
substantially offset by a decline in the aggregate weighted average servicing fee. The weighted average servicing fee decreased from
40 basis points at December 31, 2002 to 34 basis points at December 31, 2003 primarily due to the Company's continuing process of
selling a portion of the future contractual servicing cash flows to third parties. This process decreased the net MSR balance by
$628 million but had no impact on the unpaid principal balance of the loans serviced for others portfolio. Additionally, the Company
has entered into loan sales and securitizations with certain government-sponsored and private enterprises in which it has retained a
smaller servicing fee than is common in the industry. The smaller servicing fee leads to a lower value for the resulting MSR and
greater cash income when the loans or securities are sold.
During the first half of 2003, we recorded an other than temporary MSR impairment of $1.11 billion. The amount of the other
than temporary impairment was determined by selecting an appropriate interest rate shock to estimate the amount of MSR fair value
that we might expect to recover in the foreseeable
29
future. To the extent that the gross carrying value of the MSR exceeded the estimated recoverable amount, that portion of the gross
carrying value was wri tten off as an other than temporary impairment. Although the wri tedowns had no impact on our results of
http://www.sec.gov/Archives/edgar/data/933136/000104746904
146 9/17/2011
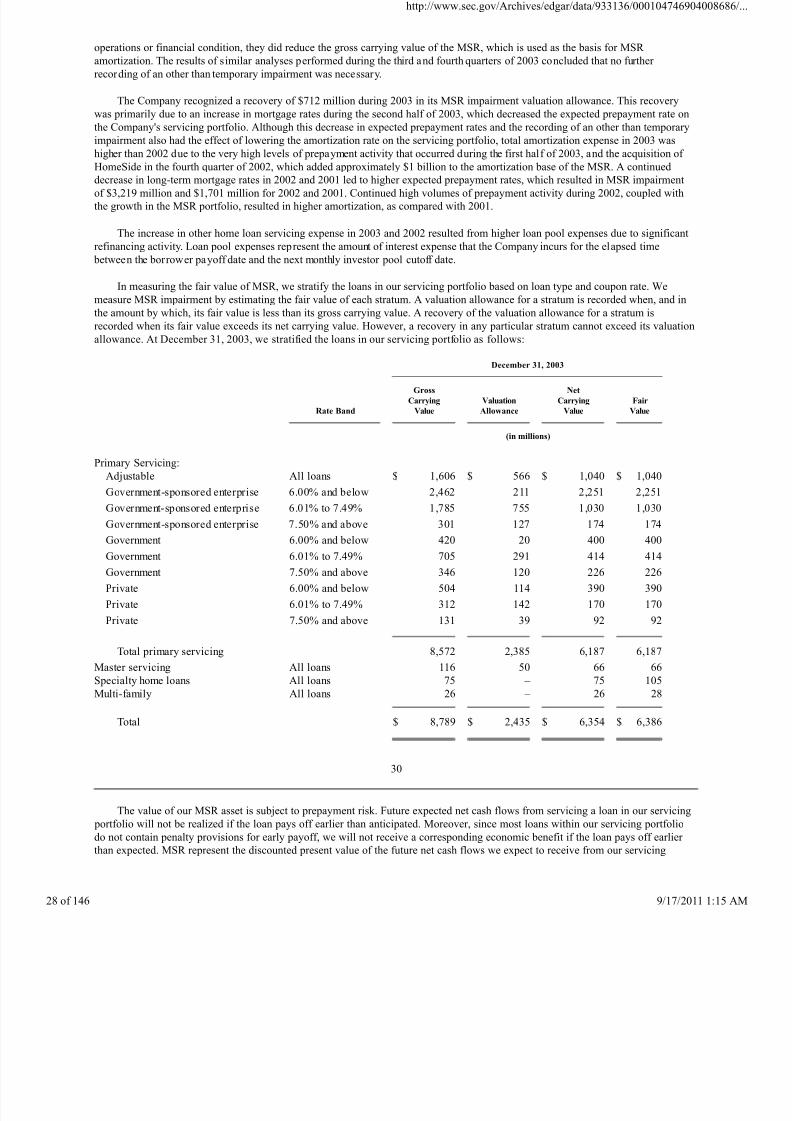
8/4/2019 Wamu 10-k 2003 Subprime
http://slidepdf.com/reader/full/wamu-10-k-2003-subprime 28/146
operations or financial condition, they did reduce the gross carrying value of the MSR, which is used as the basis for MSR
amortization. The results of similar analyses performed during the third and fourth quarters of 2003 concluded that no further
recording of an other than temporary impairment was necessary.
The Company recognized a recovery of $712 million during 2003 in its MSR impairment valuation allowance. This recovery
was primarily due to an increase in mortgage rates during the second half of 2003, which decreased the expected prepayment rate on
the Company's servicing portfolio. Although this decrease in expected prepayment rates and the recording of an other than temporary
impairment also had the effect of lowering the amortization rate on the servicing portfolio, total amortization expense in 2003 was
higher than 2002 due to the very high levels of prepayment activity that occurred during the first half of 2003, and the acquisition of
HomeSide in the fourth quarter of 2002, which added approximately $1 billion to the amortization base of the MSR. A continued
decrease in long-term mortgage rates in 2002 and 2001 led to higher expected prepayment rates, which resulted in MSR impairment
of $3,219 million and $1,701 million for 2002 and 2001. Continued high volumes of prepayment activity during 2002, coupled with
the growth in the MSR portfolio, resulted in higher amortization, as compared with 2001.
The increase in other home loan servicing expense in 2003 and 2002 resulted from higher loan pool expenses due to significant
refinancing activity. Loan pool expenses represent the amount of interest expense that the Company incurs for the elapsed time
between the borrower payoff date and the next monthly investor pool cutoff date.
In measuring the fair value of MSR, we stratify the loans in our servicing portfolio based on loan type and coupon rate. We
measure MSR impairment by estimating the fair value of each stratum. A valuation allowance for a stratum is recorded when, and in
the amount by which, its fair value is less than its gross carrying value. A recovery of the valuation allowance for a stratum is
recorded when its fair value exceeds its net carrying value. However, a recovery in any particular stratum cannot exceed its valuation
allowance. At December 31, 2003, we stratified the loans in our servicing portfolio as follows:
December 31, 2003
Rate Band
Gross
Carrying
Value
Valuation
Allowance
Net
Carrying
Value
Fair
Value
(in millions)
Primary Servicing:
Adjustable All loans $ 1,606 $ 566 $ 1,040 $ 1,040
Government-sponsored enterprise 6.00% and below 2,462 211 2,251 2,251
Government-sponsored enterprise 6.01% to 7.49% 1,785 755 1,030 1,030
Government-sponsored enterprise 7.50% and above 301 127 174 174
Government 6.00% and below 420 20 400 400
Government 6.01% to 7.49% 705 291 414 414
Government 7.50% and above 346 120 226 226
Private 6.00% and below 504 114 390 390
Private 6.01% to 7.49% 312 142 170 170
Private 7.50% and above 131 39 92 92
Total primary servicing 8,572 2,385 6,187 6,187
Master servicing All loans 116 50 66 66
Specialty home loans All loans 75 – 75 105
Multi-family All loans 26 – 26 28
Total $ 8,789 $ 2,435 $ 6,354 $ 6,386
30
The value of our MSR asset is subject to prepayment risk. Future expected net cash flows from servicing a loan in our servicing
portfolio will not be realized if the loan pays off earlier than anticipated. Moreover, since most loans within our servicing portfolio
do not contain penalty provisions for early payoff, we will not receive a corresponding economic benefit if the loan pays off earlier
than expected. MSR represent the discounted present value of the future net cash flows we expect to receive from our servicing
http://www.sec.gov/Archives/edgar/data/933136/000104746904
146 9/17/2011
8/4/2019 Wamu 10-k 2003 Subprime
http://slidepdf.com/reader/full/wamu-10-k-2003-subprime 29/146
portfolio. Accordingly, prepayment risk subjects our MSR to impairment risk.
We estimate fair value of each MSR stratum using a discounted cash flow model. The discounted cash flow model estimates the
present value of the future net cash flows of the servicing portfolio based on various factors, such as servicing costs, expected
prepayment speeds and discount rates, about which management must make assumptions based on future expectations. While the
Company's model estimates a value, the specific value used is based on a variety of factors, such as documented observable data and
anticipated changes in market conditions. All the assumptions are based on standards used by market participants in valuing MSR.
The reasonableness of management's assumptions about these factors is confirmed through quarterly independent broker surveys.
Independent appraisals of the fair value of our servicing portfolio are obtained periodically, but not less frequently than annually, and
are used by management to evaluate the reasonableness of the fair value conclusions.
Our methodology for estimating the fair value of MSR is highly sensitive to changes in assumptions. For example, our
determination of fair value uses anticipated prepayment speeds. Actual prepayment experience may differ and any difference may
have a material effect on the MSR fair value. Changes in fair value based on a variation in assumptions generally cannot be
extrapolated because the relationship of the change in assumption to the change in fair value may not be linear. Thus, any measurement
of MSR fair value is limited by the conditions existing and assumptions made as of a particular point in time. Those assumptions may
not be appropriate if they are applied to a different point in time. Refer to "Market Risk Management" for discussion of how MSR
prepayment risk is managed and to Note 1 to the Consolidated Financial Statements—"Summary of Significant Accounting Policies"
for further discussion of how MSR impairment is measured. For a quantitative analysis of key economic assumptions used in
measuring the fair value of MSR, and a sensitivity analysis based on changes to those assumptions, see Note 7 to the Consolidated
Financial Statements—"Mortgage Banking Activities ."
As part of its mortgage banking activities , the Company enters into commitments to originate or purchase loans whereby the
interest rate on the loan is set prior to funding (rate lock commitments). Rate lock commitments on mortgage loans that are intended to be sold are considered to be derivatives. Therefore, they are recorded at fair value on the Consolidated Statements of Financial
Condition with changes in fair value recorded in gain from mortgage loans on the Consolidated Statements of Income. In measuring
the fair value of rate lock commitments, the amount of the expected servicing rights is included in the valuation. This value is
calculated using the same methodologies as are used to value the Company's MSR, adjusted for an anticipated fallout factor for loan
commitments that are not expected to be funded. When funding occurs, the value of the rate lock commitment becomes part of the cost
basis of the loan. The aggregate fair value of these assets on the Consolidated Statements of Financial Condition at December 31,
2003 and 2002 was $247 million and $961 million.
A new SEC Staff Accounting Bulletin regarding the accounting for interest rate lock commitments will delay the Company's
recognition of the value of the expected servicing rights until the loans are sold. The Company adopted and prospectively applied this
new accounting guidance to all commitments for loans originated for sale that were initiated after December 31, 2003. Refer to
"Recently Issued Accounting Standards" for further discussion of this Staff Accounting Bulletin.
High levels of loan refinancing activity during the first half of 2003, which occurred due to historically low long-term mortgage
rates that were in effect during that period, resulted in rate lock commitment volume of $290.77 billion for the year, compared with
$236.05 billion in 2002. Although this increase also resulted in strong levels of salable home loan volume, gain from mortgage loans
in 2003 decreased by
31
$125 million, or 9%, from 2002. The decrease was largely the result of losses sustained during the third quarter of 2003. These
losses stemmed from various market volatility and operational issues, including unhedged rate lock extensions granted to customers, a
diminished level of market liquidity for certain instruments used to manage interest rate risk on rate locks and loans held for sale, andsystem issues that caused data interruptions during the period. The Company undertook numerous actions to correct these issues and to
mitigate their financial effects, including the sale of originated mortgage-backed securities, which resulted in a gain of $258 million in
the third quarter of 2003, and the sale of other available-for-sale securities, which produced a gain of $381 million during that
period.
In accordance with regulatory guidance issued in December of 2003, the Company's buyouts of delinquent mortgages contained
within Government National Mortgage Association ("GNMA") loan pools that it services must now be classified as loans on the
Consolidated Statements of Financial Condition. As the Company sells most of these repurchased loans to secondary market
participants, they are classified as loans held for sale on the Consolidated Statements of Financial Condition. Accordingly, gains that
are generated from the subsequent resale of these delinquent mortgages, which had been recorded as part of other home loan mortgage
banking income on the Consolidated Statements of Income in prior periods, are now classified as gain from mortgage loans. Prior
periods have been restated. In one part of the Company's program, loans that have been 30 days past due for three consecutive months
http://www.sec.gov/Archives/edgar/data/933136/000104746904
146 9/17/2011
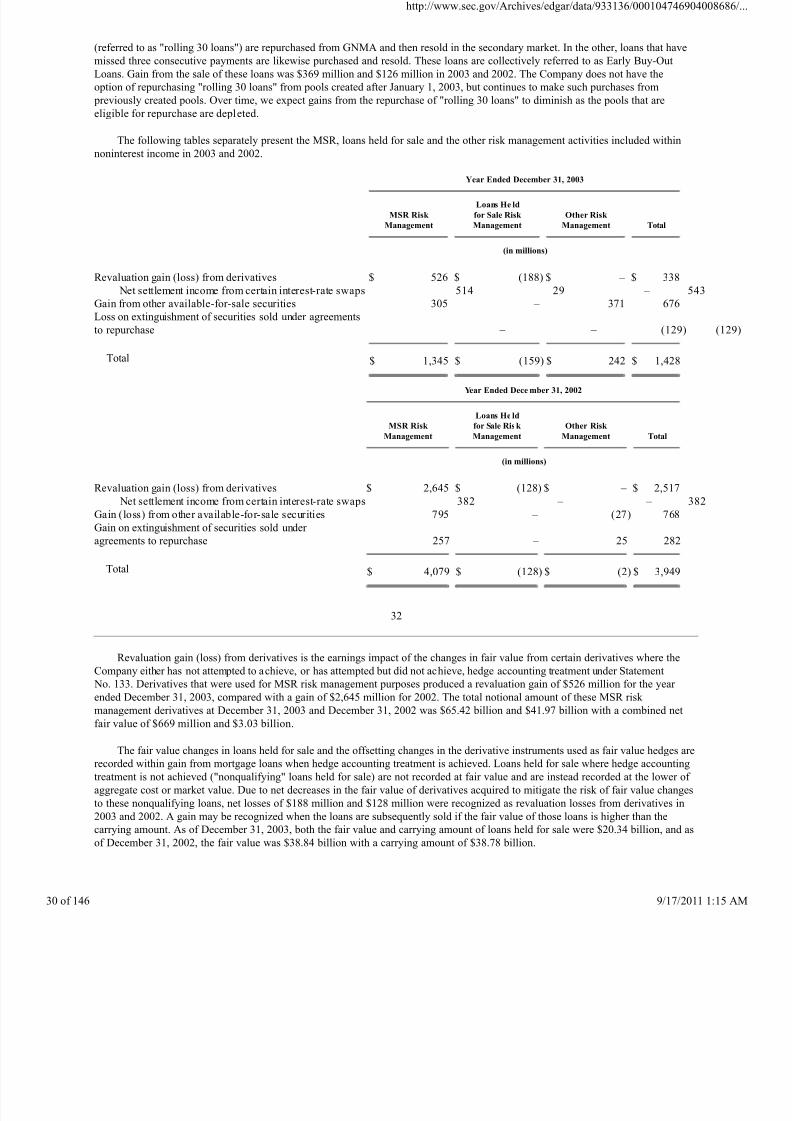
8/4/2019 Wamu 10-k 2003 Subprime
http://slidepdf.com/reader/full/wamu-10-k-2003-subprime 30/146
(referred to as "rolling 30 loans") are repurchased from GNMA and then resold in the secondary market. In the other, loans that have
missed three consecutive payments are likewise purchased and resold. These loans are collectively referred to as Early Buy-Out
Loans. Gain from the sale of these loans was $369 million and $126 million in 2003 and 2002. The Company does not have the
option of repurchasing "rolling 30 loans" from pools created after January 1, 2003, but continues to make such purchases from
previously created pools. Over time, we expect gains from the repurchase of "rolling 30 loans" to diminish as the pools that are
eligible for repurchase are depleted.
The following tables separately present the MSR, loans held for sale and the other risk management activities included within
noninterest income in 2003 and 2002.
Year Ended December 31, 2003
MSR Risk
Management
Loans He ld
for Sale Risk
Management
Other Risk
Management
Total
(in millions)
Revaluation gain (loss) from derivatives $ 526 $ (188) $ – $ 338
Net settlement income from certain interest-rate swaps 514 29 – 543
Gain from other available-for-sale securities 305 – 371 676
Loss on extinguishment of securities sold under agreements
to repurchase
– – (129)
Total $ 1,345 $ (159) $ 242 $ 1,428
Year Ended Dece mber 31, 2002
MSR Risk
Management
Loans He ld
for Sale Ris k
Management
Other Risk
Management
Total
(in millions)
Revaluation gain (loss) from derivatives $ 2,645 $ (128) $ – $ 2,517
Net settlement income from certain interest-rate swaps 382 – – 382
Gain (loss) from other available-for-sale securities 795 – (27) 768
Gain on extinguishment of securities sold under agreements to repurchase
257 – 25 282
Total $ 4,079 $ (128) $ (2) $ 3,949
32
Revaluation gain (loss) from derivatives is the earnings impact of the changes in fair value from certain derivatives where the
Company either has not attempted to achieve, or has attempted but did not achieve, hedge accounting treatment under Statement
No. 133. Derivatives that were used for MSR risk management purposes produced a revaluation gain of $526 million for the year
ended December 31, 2003, compared with a gain of $2,645 million for 2002. The total notional amount of these MSR risk management derivatives at December 31, 2003 and December 31, 2002 was $65.42 billion and $41.97 billion with a combined net
fair value of $669 million and $3.03 billion.
The fair value changes in loans held for sale and the offsetting changes in the derivative instruments used as fair value hedges are
recorded within gain from mortgage loans when hedge accounting treatment is achieved. Loans held for sale where hedge accounting
treatment is not achieved ("nonqualifying" loans held for sale) are not recorded at fair value and are instead recorded at the lower of
aggregate cost or market value. Due to net decreases in the fair value of derivatives acquired to mitigate the risk of fair value changes
to these nonqualifying loans, net losses of $188 million and $128 million were recognized as revaluation losses from derivatives in
2003 and 2002. A gain may be recognized when the loans are subsequently sold if the fair value of those loans is higher than the
carrying amount. As of December 31, 2003, both the fair value and carrying amount of loans held for sale were $20.34 billion, and as
of December 31, 2002, the fair value was $38.84 billion with a carrying amount of $38.78 billion.
http://www.sec.gov/Archives/edgar/data/933136/000104746904
146 9/17/2011
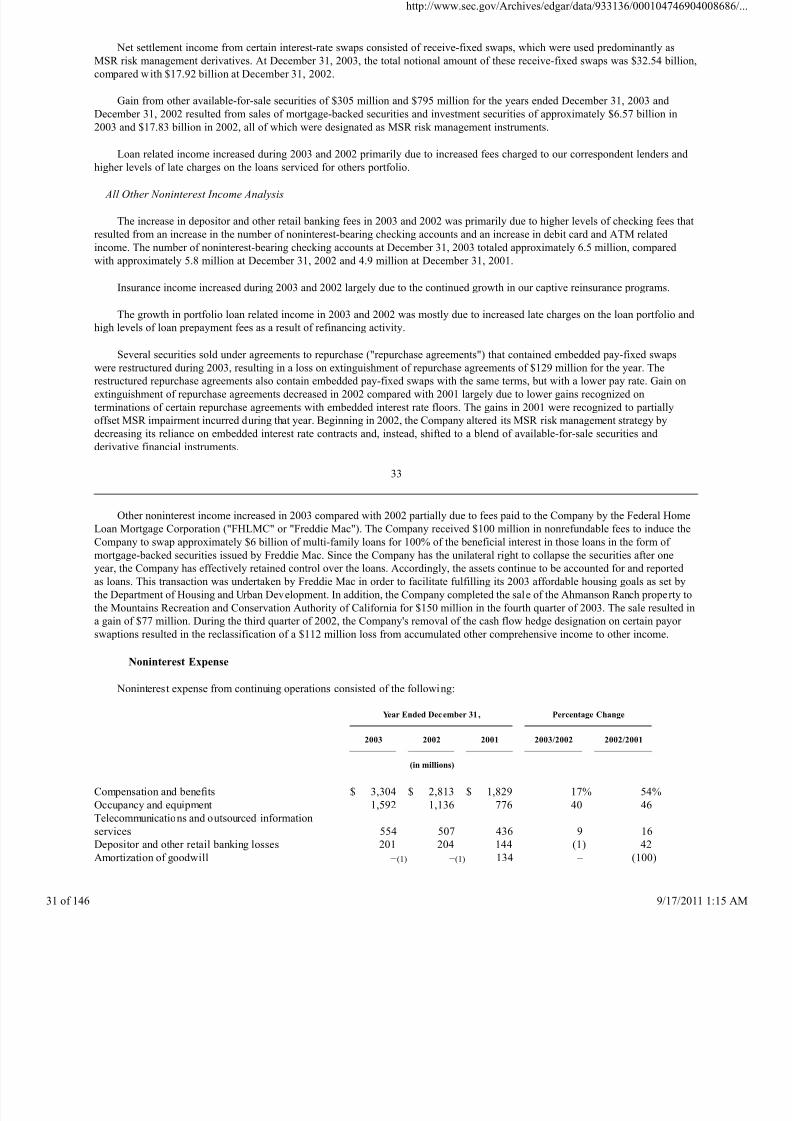
8/4/2019 Wamu 10-k 2003 Subprime
http://slidepdf.com/reader/full/wamu-10-k-2003-subprime 31/146
Net settlement income from certain interest-rate swaps consisted of receive-fixed swaps, which were used predominantly as
MSR risk management derivatives. At December 31, 2003, the total notional amount of these receive-fixed swaps was $32.54 billion,
compared with $17.92 billion at December 31, 2002.
Gain from other available-for-sale securities of $305 million and $795 million for the years ended December 31, 2003 and
December 31, 2002 resulted from sales of mortgage-backed securities and investment securities of approximately $6.57 billion in
2003 and $17.83 billion in 2002, all of which were designated as MSR risk management instruments.
Loan related income increased during 2003 and 2002 primarily due to increased fees charged to our correspondent lenders and
higher levels of late charges on the loans serviced for others portfolio.
All Other Noninterest Income Analysis
The increase in depositor and other retail banking fees in 2003 and 2002 was primarily due to higher levels of checking fees that
resulted from an increase in the number of noninterest-bearing checking accounts and an increase in debit card and ATM related
income. The number of noninterest-bearing checking accounts at December 31, 2003 totaled approximately 6.5 million, compared
with approximately 5.8 million at December 31, 2002 and 4.9 million at December 31, 2001.
Insurance income increased during 2003 and 2002 largely due to the continued growth in our captive reinsurance programs.
The growth in portfolio loan related income in 2003 and 2002 was mostly due to increased late charges on the loan portfolio and
high levels of loan prepayment fees as a result of refinancing activity.
Several securities sold under agreements to repurchase ("repurchase agreements") that contained embedded pay-fixed swaps
were restructured during 2003, resulting in a loss on extinguishment of repurchase agreements of $129 million for the year. The
restructured repurchase agreements also contain embedded pay-fixed swaps with the same terms, but with a lower pay rate. Gain on
extinguishment of repurchase agreements decreased in 2002 compared with 2001 largely due to lower gains recognized on
terminations of certain repurchase agreements with embedded interest rate floors. The gains in 2001 were recognized to partially
offset MSR impairment incurred during that year. Beginning in 2002, the Company altered its MSR risk management strategy by
decreasing its reliance on embedded interest rate contracts and, instead, shifted to a blend of available-for-sale securities and
derivative financial instruments.
33
Other noninterest income increased in 2003 compared with 2002 partially due to fees paid to the Company by the Federal Home
Loan Mortgage Corporation ("FHLMC" or "Freddie Mac"). The Company received $100 million in nonrefundable fees to induce theCompany to swap approximately $6 billion of multi-family loans for 100% of the beneficial interest in those loans in the form of
mortgage-backed securities issued by Freddie Mac. Since the Company has the unilateral right to collapse the securities after one
year, the Company has effectively retained control over the loans. Accordingly, the assets continue to be accounted for and reported
as loans. This transaction was undertaken by Freddie Mac in order to facilitate fulfilling its 2003 affordable housing goals as set by
the Department of Housing and Urban Development. In addition, the Company completed the sale of the Ahmanson Ranch property to
the Mountains Recreation and Conservation Authority of California for $150 million in the fourth quarter of 2003. The sale resulted in
a gain of $77 million. During the third quarter of 2002, the Company's removal of the cash flow hedge designation on certain payor
swaptions resulted in the reclassification of a $112 million loss from accumulated other comprehensive income to other income.
Noninterest Expense
Noninterest expense from continuing operations consisted of the following:
Year Ended December 31 ,
Percentage Change
2003
2002
2001
2003/2002
2002/2001
(in millions)
Compensation and benefits $ 3,304 $ 2,813 $ 1,829 17% 54%
Occupancy and equipment 1,592 1,136 776 40 46
Telecommunications and outsourced information
services
554 507 436 9 16
Depositor and other retail banking losses 201 204 144 (1) 42
Amortization of goodwill – (1) – (1) 134 – (100)
http://www.sec.gov/Archives/edgar/data/933136/000104746904
146 9/17/2011
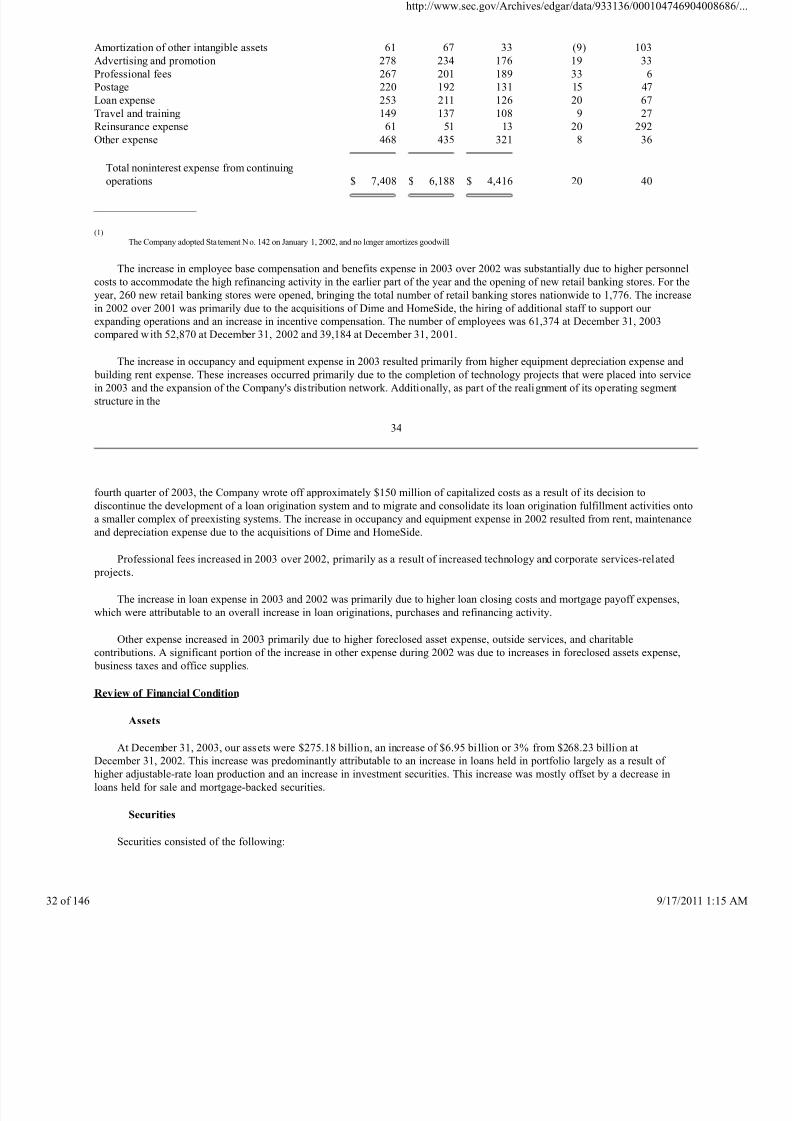
8/4/2019 Wamu 10-k 2003 Subprime
http://slidepdf.com/reader/full/wamu-10-k-2003-subprime 32/146
Amortization of other intangible assets 61 67 33 (9) 103
Advertising and promotion 278 234 176 19 33
Professional fees 267 201 189 33 6
Postage 220 192 131 15 47
Loan expense 253 211 126 20 67
Travel and training 149 137 108 9 27
Reinsurance expense 61 51 13 20 292
Other expense 468 435 321 8 36
Total noninterest expense from continuing
operations
$ 7,408 $ 6,188 $ 4,416 20 40
(1)
The Company adopted Sta tement No. 142 on January 1, 2002, and no longer amortizes goodwill.
The increase in employee base compensation and benefits expense in 2003 over 2002 was substantially due to higher personnel
costs to accommodate the high refinancing activity in the earlier part of the year and the opening of new retail banking stores. For the
year, 260 new retail banking stores were opened, bringing the total number of retail banking stores nationwide to 1,776. The increase
in 2002 over 2001 was primarily due to the acquisitions of Dime and HomeSide, the hiring of additional staff to support our
expanding operations and an increase in incentive compensation. The number of employees was 61,374 at December 31, 2003
compared with 52,870 at December 31, 2002 and 39,184 at December 31, 2001.
The increase in occupancy and equipment expense in 2003 resulted primarily from higher equipment depreciation expense and
building rent expense. These increases occurred primarily due to the completion of technology projects that were placed into service
in 2003 and the expansion of the Company's distribution network. Additionally, as part of the realignment of its operating segment
structure in the
34
fourth quarter of 2003, the Company wrote off approximately $150 million of capitalized costs as a result of its decision to
discontinue the development of a loan origination system and to migrate and consolidate its loan origination fulfillment activities onto
a smaller complex of preexisting systems. The increase in occupancy and equipment expense in 2002 resulted from rent, maintenance
and depreciation expense due to the acquisitions of Dime and HomeSide.
Professional fees increased in 2003 over 2002, primarily as a result of increased technology and corporate services-related
projects.
The increase in loan expense in 2003 and 2002 was primarily due to higher loan closing costs and mortgage payoff expenses,
which were attributable to an overall increase in loan originations, purchases and refinancing activity.
Other expense increased in 2003 primarily due to higher foreclosed asset expense, outside services, and charitable
contributions. A significant portion of the increase in other expense during 2002 was due to increases in foreclosed assets expense,
business taxes and office supplies.
Review of Financial Condition
Assets
At December 31, 2003, our assets were $275.18 billion, an increase of $6.95 bi llion or 3% from $268.23 billion at
December 31, 2002. This increase was predominantly attributable to an increase in loans held in portfolio largely as a result of
higher adjustable-rate loan production and an increase in investment securities. This increase was mostly offset by a decrease in
loans held for sale and mortgage-backed securities.
Securities
Securities consisted of the following:
http://www.sec.gov/Archives/edgar/data/933136/000104746904
146 9/17/2011
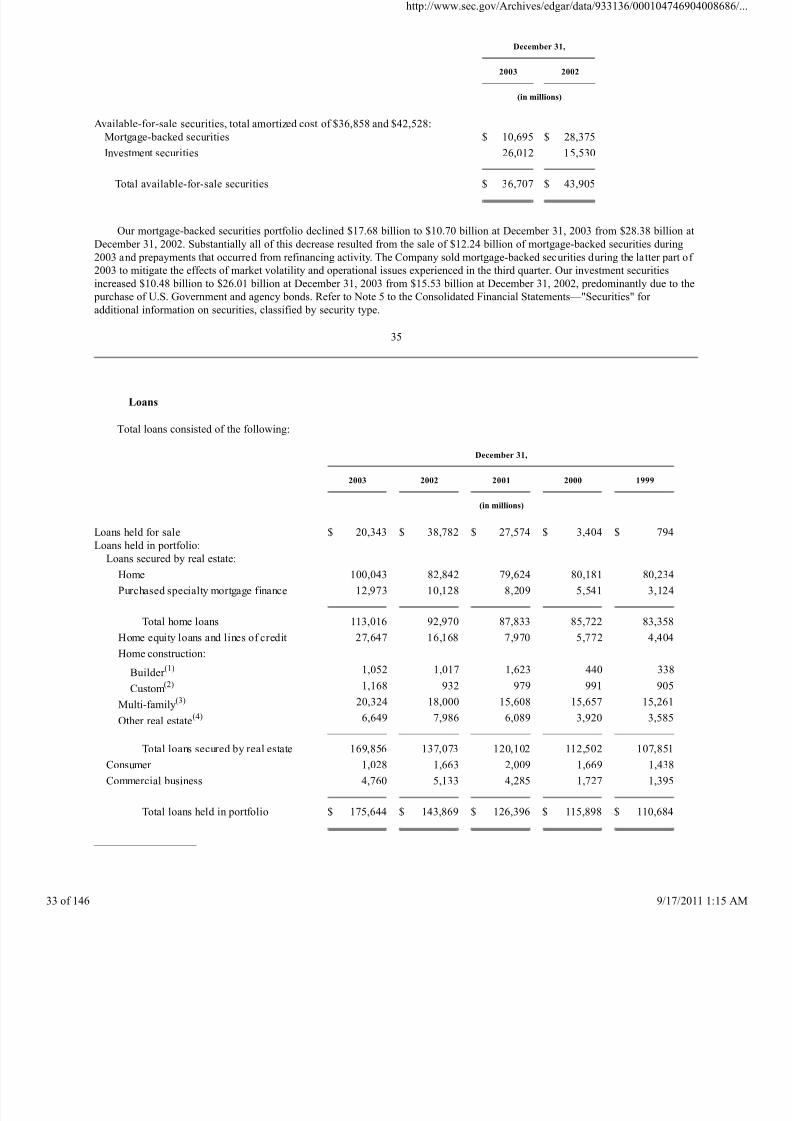
8/4/2019 Wamu 10-k 2003 Subprime
http://slidepdf.com/reader/full/wamu-10-k-2003-subprime 33/146
December 31,
2003
2002
(in millions)
Available-for-sale securities, total amortized cost of $36,858 and $42,528:
Mortgage-backed securities $ 10,695 $ 28,375
Investment securities 26,012 15,530
Total available-for-sale securities $ 36,707 $ 43,905
Our mortgage-backed securities portfolio declined $17.68 billion to $10.70 billion at December 31, 2003 from $28.38 billion at
December 31, 2002. Substantially all of this decrease resulted from the sale of $12.24 billion of mortgage-backed securities during
2003 and prepayments that occurred from refinancing activity. The Company sold mortgage-backed securities during the latter part of
2003 to mitigate the effects of market volatility and operational issues experienced in the third quarter. Our investment securities
increased $10.48 billion to $26.01 billion at December 31, 2003 from $15.53 billion at December 31, 2002, predominantly due to the
purchase of U.S. Government and agency bonds. Refer to Note 5 to the Consolidated Financial Statements—"Securities" for
additional information on securities, classified by security type.
35
Loans
Total loans consisted of the following:
December 31,
2003
2002
2001
2000
1999
(in millions)
Loans held for sale $ 20,343 $ 38,782 $ 27,574 $ 3,404 $ 794
Loans held in portfolio:
Loans secured by real estate:
Home 100,043 82,842 79,624 80,181 80,234
Purchased specialty mortgage finance 12,973 10,128 8,209 5,541 3,124
Total home loans 113,016 92,970 87,833 85,722 83,358
Home equity loans and lines of credit 27,647 16,168 7,970 5,772 4,404
Home construction:
Builder (1) 1,052 1,017 1,623 440 338
Custom(2) 1,168 932 979 991 905
Multi-family(3) 20,324 18,000 15,608 15,657 15,261
Other real estate(4) 6,649 7,986 6,089 3,920 3,585
Total loans secured by real estate 169,856 137,073 120,102 112,502 107,851
Consumer 1,028 1,663 2,009 1,669 1,438
Commercial business 4,760 5,133 4,285 1,727 1,395
Total loans held in portfolio $ 175,644 $ 143,869 $ 126,396 $ 115,898 $ 110,684
http://www.sec.gov/Archives/edgar/data/933136/000104746904
146 9/17/2011
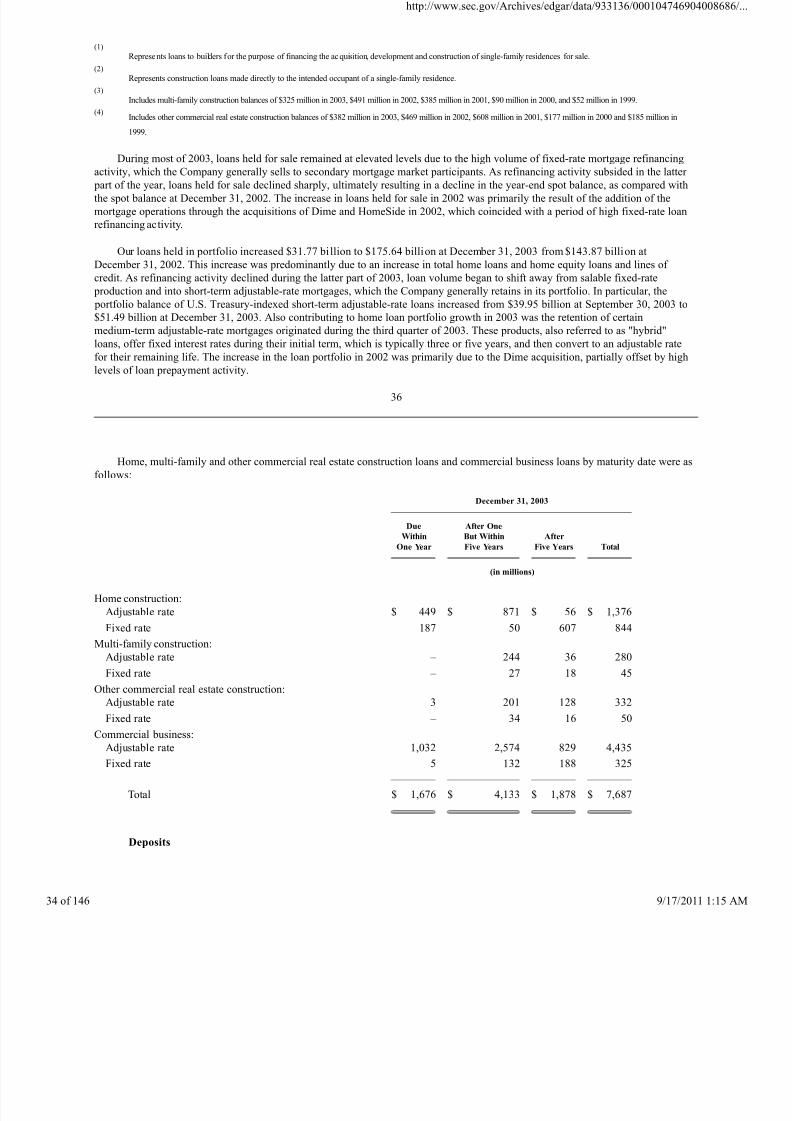
8/4/2019 Wamu 10-k 2003 Subprime
http://slidepdf.com/reader/full/wamu-10-k-2003-subprime 34/146
(1)
Represents loans to builders for the purpose of financing the acquisition, development and construction of single-family residences for sale.
(2)
Represents construction loans made directly to the intended occupant of a single-family residence.
(3)
Includes multi-family construction balances of $325 million in 2003, $491 million in 2002, $385 million in 2001, $90 million in 2000, and $52 million in 1999.
(4)Includes other commercial real estate construction balances of $382 million in 2003, $469 million in 2002, $608 million in 2001, $177 million in 2000 and $185 million in
1999.
During most of 2003, loans held for sale remained at elevated levels due to the high volume of fixed-rate mortgage refinancing
activity, which the Company generally sells to secondary mortgage market participants. As refinancing activity subsided in the latter part of the year, loans held for sale declined sharply, ultimately resulting in a decline in the year-end spot balance, as compared with
the spot balance at December 31, 2002. The increase in loans held for sale in 2002 was primarily the result of the addition of the
mortgage operations through the acquisitions of Dime and HomeSide in 2002, which coincided with a period of high fixed-rate loan
refinancing activity.
Our loans held in portfolio increased $31.77 bi llion to $175.64 billion at December 31, 2003 from $143.87 billion at
December 31, 2002. This increase was predominantly due to an increase in total home loans and home equity loans and lines of
credit. As refinancing activity declined during the latter part of 2003, loan volume began to shift away from salable fixed-rate
production and into short-term adjustable-rate mortgages, which the Company generally retains in its portfolio. In particular, the
portfolio balance of U.S. Treasury-indexed short-term adjustable-rate loans increased from $39.95 billion at September 30, 2003 to
$51.49 billion at December 31, 2003. Also contributing to home loan portfolio growth in 2003 was the retention of certain
medium-term adjustable-rate mortgages originated during the third quarter of 2003. These products, also referred to as "hybrid"
loans, offer fixed interest rates during their initial term, which is typically three or five years, and then convert to an adjustable rate
for their remaining life. The increase in the loan portfolio in 2002 was primarily due to the Dime acquisition, partially offset by high
levels of loan prepayment activity.
36
Home, multi-family and other commercial real estate construction loans and commercial business loans by maturity date were as
follows:
December 31, 2003
DueWithin
One Year
After OneBut Within
Five Years
After
Five Years
Total
(in millions)
Home construction:
Adjustable rate $ 449 $ 871 $ 56 $ 1,376
Fixed rate 187 50 607 844
Multi-family construction:
Adjustable rate – 244 36 280
Fixed rate – 27 18 45
Other commercial real estate construction:
Adjustable rate 3 201 128 332
Fixed rate – 34 16 50
Commercial business:
Adjustable rate 1,032 2,574 829 4,435
Fixed rate 5 132 188 325
Total $ 1,676 $ 4,133 $ 1,878 $ 7,687
Deposits
http://www.sec.gov/Archives/edgar/data/933136/000104746904
146 9/17/2011
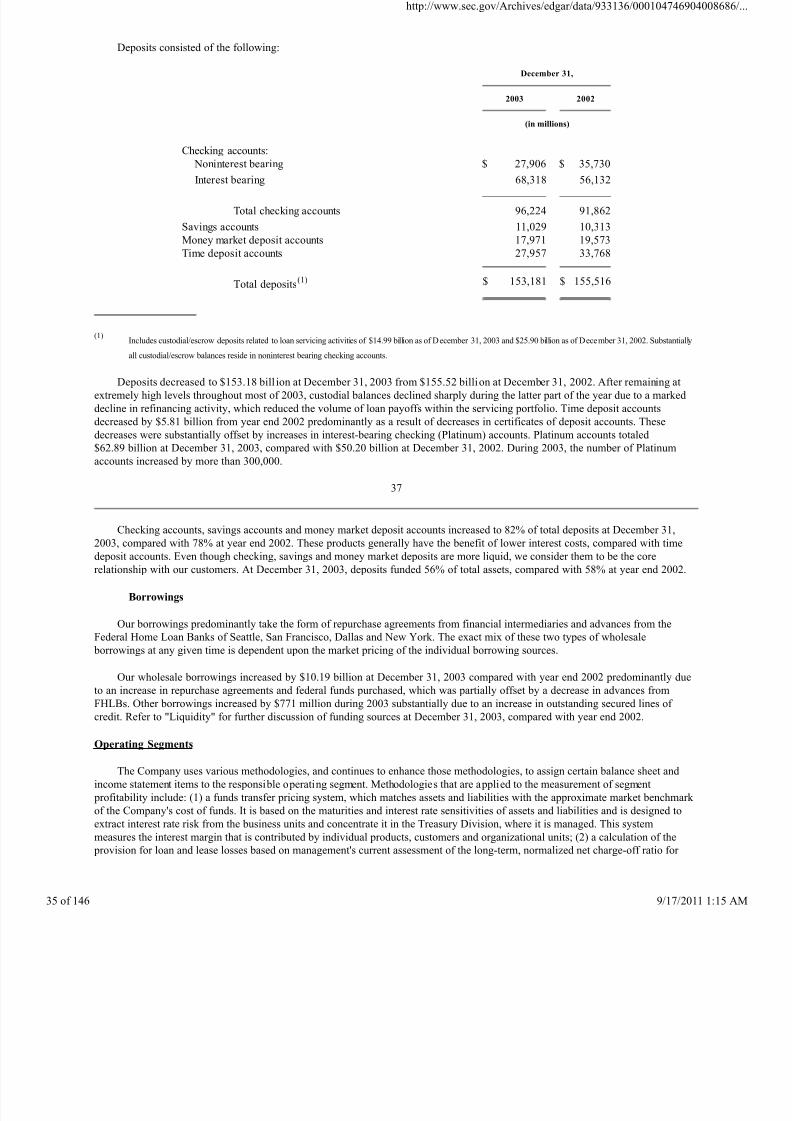
8/4/2019 Wamu 10-k 2003 Subprime
http://slidepdf.com/reader/full/wamu-10-k-2003-subprime 35/146
Deposits consisted of the following:
December 31,
2003
2002
(in millions)
Checking accounts:
Noninterest bearing $ 27,906 $ 35,730
Interest bearing 68,318 56,132
Total checking accounts 96,224 91,862
Savings accounts 11,029 10,313
Money market deposit accounts 17,971 19,573
Time deposit accounts 27,957 33,768
Total deposits(1) $ 153,181 $ 155,516
(1)Includes custodial/escrow deposits related to loan servicing activities of $14.99 billion as of December 31, 2003 and $25.90 billion as of December 31, 2002. Substantially
all custodial/escrow balances reside in noninterest bearing checking accounts.
Deposits decreased to $153.18 bill ion at December 31, 2003 from $155.52 billion at December 31, 2002. After remaining at
extremely high levels throughout most of 2003, custodial balances declined sharply during the latter part of the year due to a marked
decline in refinancing activity, which reduced the volume of loan payoffs within the servicing portfolio. Time deposit accounts
decreased by $5.81 billion from year end 2002 predominantly as a result of decreases in certificates of deposit accounts. These
decreases were substantially offset by increases in interest-bearing checking (Platinum) accounts. Platinum accounts totaled
$62.89 billion at December 31, 2003, compared with $50.20 billion at December 31, 2002. During 2003, the number of Platinum
accounts increased by more than 300,000.
37
Checking accounts, savings accounts and money market deposit accounts increased to 82% of total deposits at December 31,
2003, compared with 78% at year end 2002. These products generally have the benefit of lower interest costs, compared with time
deposit accounts. Even though checking, savings and money market deposits are more liquid, we consider them to be the core
relationship with our customers. At December 31, 2003, deposits funded 56% of total assets, compared with 58% at year end 2002.
Borrowings
Our borrowings predominantly take the form of repurchase agreements from financial intermediaries and advances from the
Federal Home Loan Banks of Seattle, San Francisco, Dallas and New York. The exact mix of these two types of wholesale
borrowings at any given time is dependent upon the market pricing of the individual borrowing sources.
Our wholesale borrowings increased by $10.19 billion at December 31, 2003 compared with year end 2002 predominantly due
to an increase in repurchase agreements and federal funds purchased, which was partially offset by a decrease in advances from
FHLBs. Other borrowings increased by $771 million during 2003 substantially due to an increase in outstanding secured lines of credit. Refer to "Liquidity" for further discussion of funding sources at December 31, 2003, compared with year end 2002.
Operating Segments
The Company uses various methodologies, and continues to enhance those methodologies, to assign certain balance sheet and
income statement items to the responsible operating segment. Methodologies that are applied to the measurement of segment
profitability include: (1) a funds transfer pricing system, which matches assets and liabilities with the approximate market benchmark
of the Company's cost of funds. It is based on the maturities and interest rate sensitivities of assets and liabilities and is designed to
extract interest rate risk from the business units and concentrate it in the Treasury Division, where it is managed. This system
measures the interest margin that is contributed by individual products, customers and organizational units; (2) a calculation of the
provision for loan and lease losses based on management's current assessment of the long-term, normalized net charge-off ratio for
http://www.sec.gov/Archives/edgar/data/933136/000104746904
146 9/17/2011
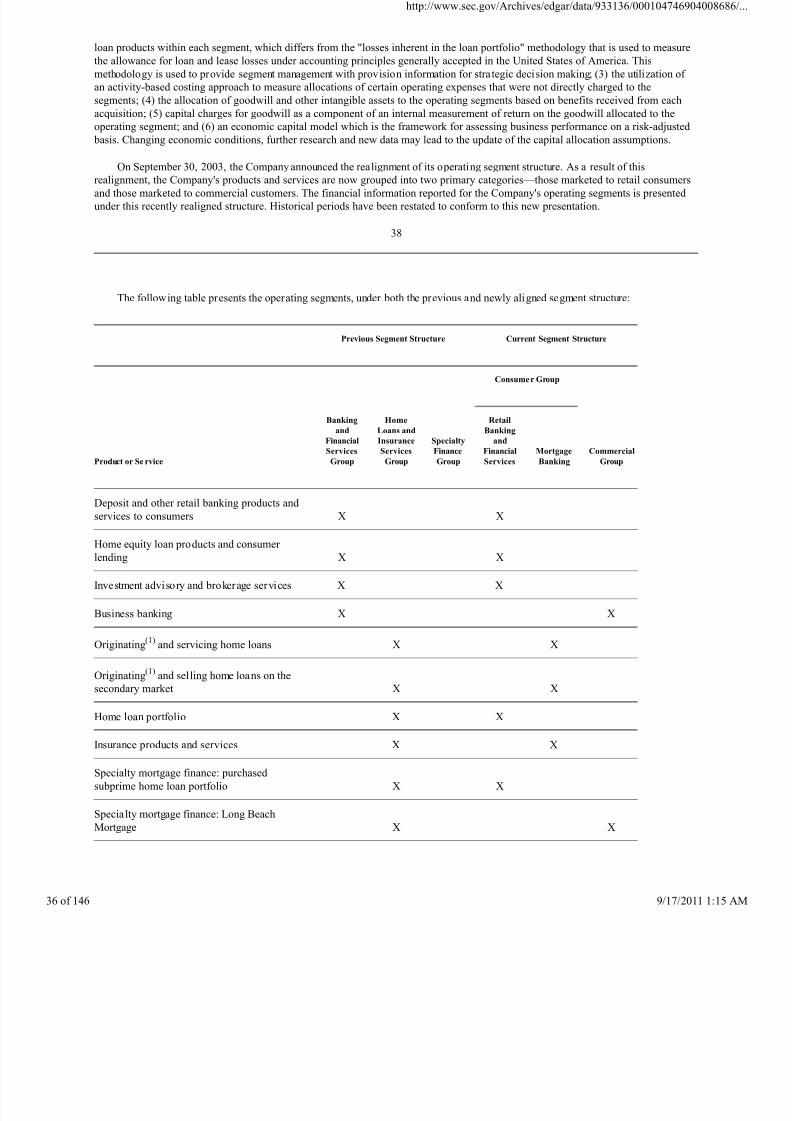
8/4/2019 Wamu 10-k 2003 Subprime
http://slidepdf.com/reader/full/wamu-10-k-2003-subprime 36/146
loan products within each segment, which differs from the "losses inherent in the loan portfolio" methodology that is used to measure
the allowance for loan and lease losses under accounting principles generally accepted in the United States of America. This
methodology is used to provide segment management with provision information for stra tegic decision making; (3) the utilization of
an activity-based costing approach to measure allocations of certain operating expenses that were not directly charged to the
segments; (4) the allocation of goodwill and other intangible assets to the operating segments based on benefits received from each
acquisition; (5) capital charges for goodwill as a component of an internal measurement of return on the goodwill allocated to the
operating segment; and (6) an economic capital model which is the framework for assessing business performance on a risk-adjusted
basis. Changing economic conditions, further research and new data may lead to the update of the capital allocation assumptions.
On September 30, 2003, the Company announced the realignment of its operating segment structure. As a result of this
realignment, the Company's products and services are now grouped into two primary categories—those marketed to retail consumers
and those marketed to commercial customers. The financial information reported for the Company's operating segments is presented
under this recently realigned structure. Historical periods have been restated to conform to this new presentation.
38
The following table presents the operating segments, under both the previous and newly aligned segment structure:
Previous Segment Structure
Current Segment Structure
Consumer Group
Product or Se rvice
Banking
and
Financial
Services
Group
Home
Loans and
Insurance
Services
Group
Specialty
Finance
Group
Retail
Banking
and
Financial
Services
Mortgage
Banking
Commercial
Group
Deposit and other retail banking products and
services to consumers
X X
Home equity loan products and consumer
lending
X X
Investment advisory and brokerage services X X
Business banking X X
Originating(1) and servicing home loans X X
Originating(1) and selling home loans on the
secondary market
X X
Home loan portfolio X X
Insurance products and services X X
Specialty mortgage finance: purchased
subprime home loan portfolio
X X
Specialty mortgage finance: Long Beach
Mortgage
X X
http://www.sec.gov/Archives/edgar/data/933136/000104746904
146 9/17/2011
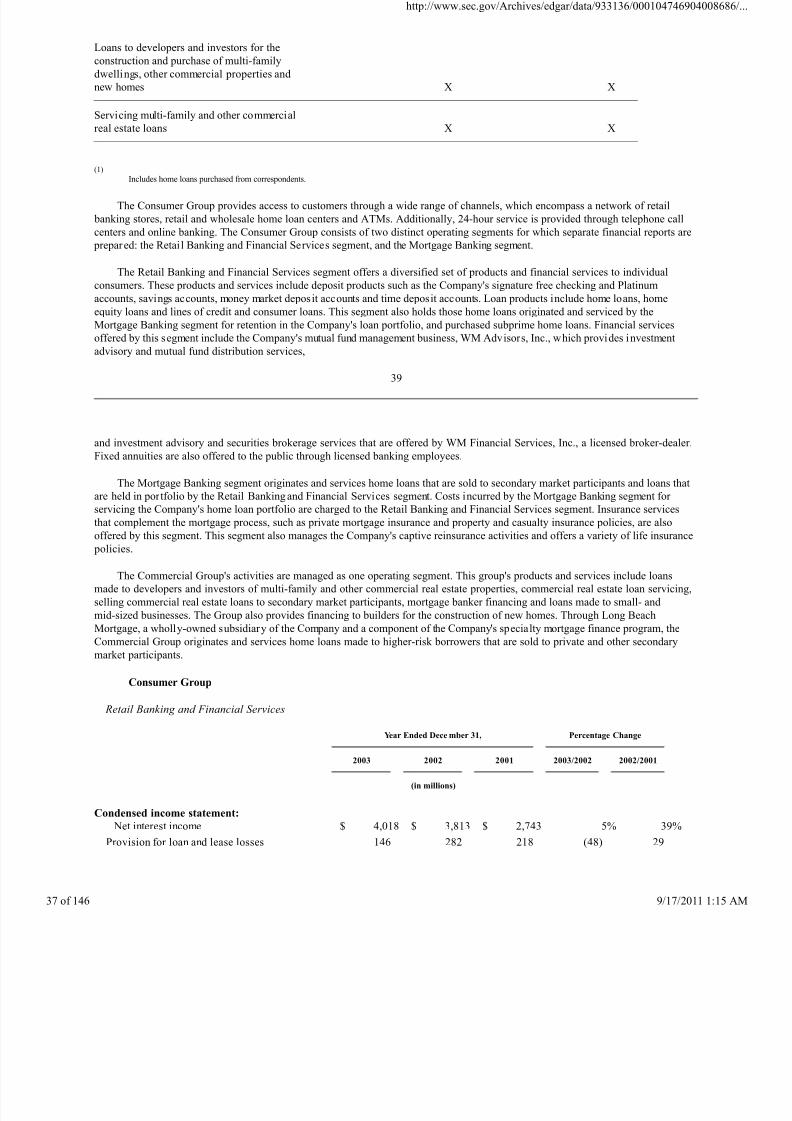
8/4/2019 Wamu 10-k 2003 Subprime
http://slidepdf.com/reader/full/wamu-10-k-2003-subprime 37/146
Loans to developers and investors for the
construction and purchase of multi-family
dwellings, other commercial properties and
new homes
X X
Servicing multi-family and other commercial
real estate loans
X X
(1)
Includes home loans purchased from correspondents.
The Consumer Group provides access to customers through a wide range of channels, which encompass a network of retail
banking stores, retail and wholesale home loan centers and ATMs. Additionally, 24-hour service is provided through telephone call
centers and online banking. The Consumer Group consists of two distinct operating segments for which separate financial reports are
prepared: the Retail Banking and Financial Services segment, and the Mortgage Banking segment.
The Retail Banking and Financial Services segment offers a diversified set of products and financial services to individual
consumers. These products and services include deposit products such as the Company's signature free checking and Platinum
accounts, savings accounts, money market deposit accounts and time deposit accounts. Loan products include home loans, home
equity loans and lines of credit and consumer loans. This segment also holds those home loans originated and serviced by the
Mortgage Banking segment for retention in the Company's loan portfolio, and purchased subprime home loans. Financial services
offered by this segment include the Company's mutual fund management business, WM Advisors, Inc., which provides investment
advisory and mutual fund distribution services,
39
and investment advisory and securities brokerage services that are offered by WM Financial Services, Inc., a licensed broker-dealer.
Fixed annuities are also offered to the public through licensed banking employees.
The Mortgage Banking segment originates and services home loans that are sold to secondary market participants and loans that
are held in portfolio by the Retail Banking and Financial Services segment. Costs incurred by the Mortgage Banking segment for
servicing the Company's home loan portfolio are charged to the Retail Banking and Financial Services segment. Insurance services
that complement the mortgage process, such as private mortgage insurance and property and casualty insurance policies, are alsooffered by this segment. This segment also manages the Company's captive reinsurance activities and offers a variety of life insurance
policies.
The Commercial Group's activities are managed as one operating segment. This group's products and services include loans
made to developers and investors of multi-family and other commercial real estate properties, commercial real estate loan servicing,
selling commercial real estate loans to secondary market participants, mortgage banker financing and loans made to small- and
mid-sized businesses. The Group also provides financing to builders for the construction of new homes. Through Long Beach
Mortgage, a wholly-owned subsidiary of the Company and a component of the Company's specialty mortgage finance program, the
Commercial Group originates and services home loans made to higher-risk borrowers that are sold to private and other secondary
market participants.
Consumer Group
Retail Banking and Financial Services
Year Ended Dece mber 31,
Percentage Change
2003
2002
2001
2003/2002
2002/2001
(in millions)
Condensed income statement:
Net interest income $ 4,018 $ 3,813 $ 2,743 5% 39%
Provision for loan and lease losses 146 282 218 (48) 29
http://www.sec.gov/Archives/edgar/data/933136/000104746904
146 9/17/2011
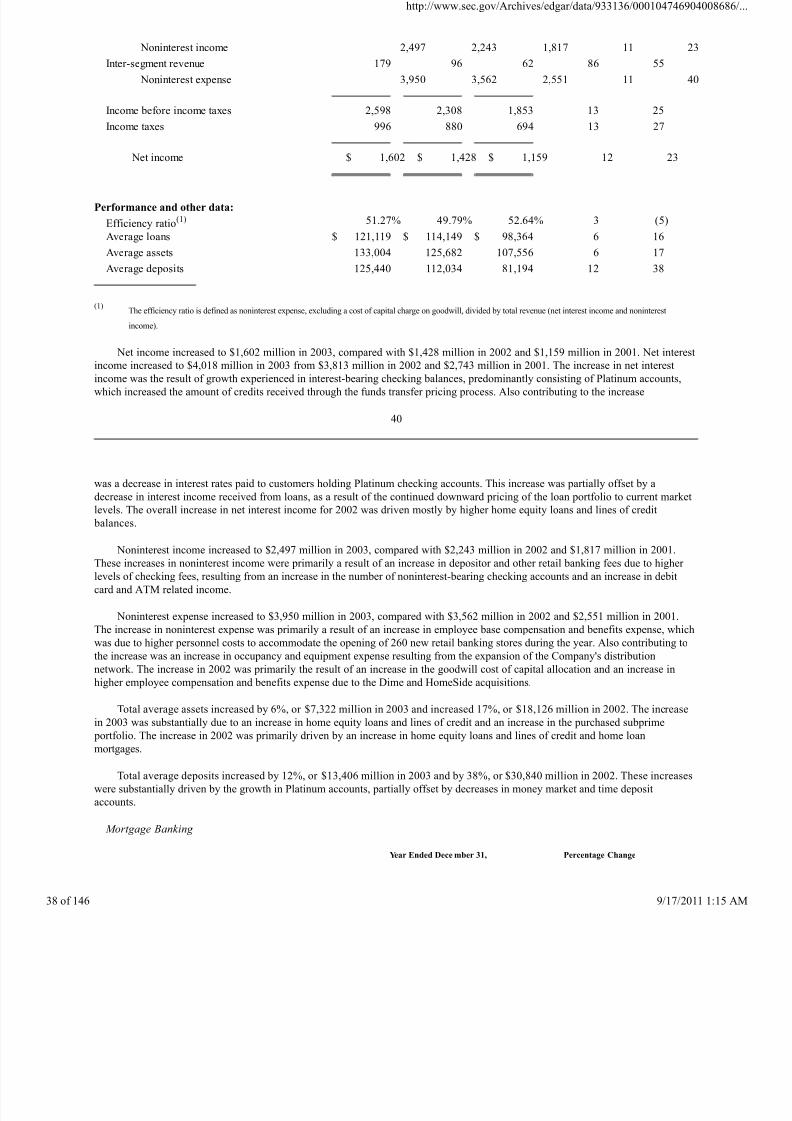
8/4/2019 Wamu 10-k 2003 Subprime
http://slidepdf.com/reader/full/wamu-10-k-2003-subprime 38/146
Noninterest income 2,497 2,243 1,817 11 23
Inter-segment revenue 179 96 62 86 55
Noninterest expense 3,950 3,562 2,551 11 40
Income before income taxes 2,598 2,308 1,853 13 25
Income taxes 996 880 694 13 27
Net income $ 1,602 $ 1,428 $ 1,159 12 23
Performance and other data:
Efficiency ratio(1) 51.27% 49.79% 52.64% 3 (5)
Average loans $ 121,119 $ 114,149 $ 98,364 6 16
Average assets 133,004 125,682 107,556 6 17
Average deposits 125,440 112,034 81,194 12 38
(1)The efficiency ratio is defined as noninterest expense, excluding a cost of capital charge on goodwill, divided by total revenue (net interest income and noninterest
income).
Net income increased to $1,602 million in 2003, compared with $1,428 million in 2002 and $1,159 million in 2001. Net interestincome increased to $4,018 million in 2003 from $3,813 million in 2002 and $2,743 million in 2001. The increase in net interest
income was the result of growth experienced in interest-bearing checking balances, predominantly consisting of Platinum accounts,
which increased the amount of credits received through the funds transfer pricing process. Also contributing to the increase
40
was a decrease in interest rates paid to customers holding Platinum checking accounts. This increase was partially offset by a
decrease in interest income received from loans, as a result of the continued downward pricing of the loan portfolio to current market
levels. The overall increase in net interest income for 2002 was driven mostly by higher home equity loans and lines of credit
balances.
Noninterest income increased to $2,497 million in 2003, compared with $2,243 million in 2002 and $1,817 million in 2001.
These increases in noninterest income were primarily a result of an increase in depositor and other retail banking fees due to higher
levels of checking fees, resulting from an increase in the number of noninterest-bearing checking accounts and an increase in debit
card and ATM related income.
Noninterest expense increased to $3,950 million in 2003, compared with $3,562 million in 2002 and $2,551 million in 2001.
The increase in noninterest expense was primarily a result of an increase in employee base compensation and benefits expense, which
was due to higher personnel costs to accommodate the opening of 260 new retail banking stores during the year. Also contributing to
the increase was an increase in occupancy and equipment expense resulting from the expansion of the Company's distribution
network. The increase in 2002 was primarily the result of an increase in the goodwill cost of capital allocation and an increase in
higher employee compensation and benefits expense due to the Dime and HomeSide acquisitions.
Total average assets increased by 6%, or $7,322 million in 2003 and increased 17%, or $18,126 million in 2002. The increase
in 2003 was substantially due to an increase in home equity loans and lines of credit and an increase in the purchased subprime
portfolio. The increase in 2002 was primarily driven by an increase in home equity loans and lines of credit and home loan
mortgages.
Total average deposits increased by 12%, or $13,406 million in 2003 and by 38%, or $30,840 million in 2002. These increases
were substantially driven by the growth in Platinum accounts, partially offset by decreases in money market and time deposit
accounts.
Mortgage Banking
Year Ended Dece mber 31,
Percentage Change
http://www.sec.gov/Archives/edgar/data/933136/000104746904
146 9/17/2011
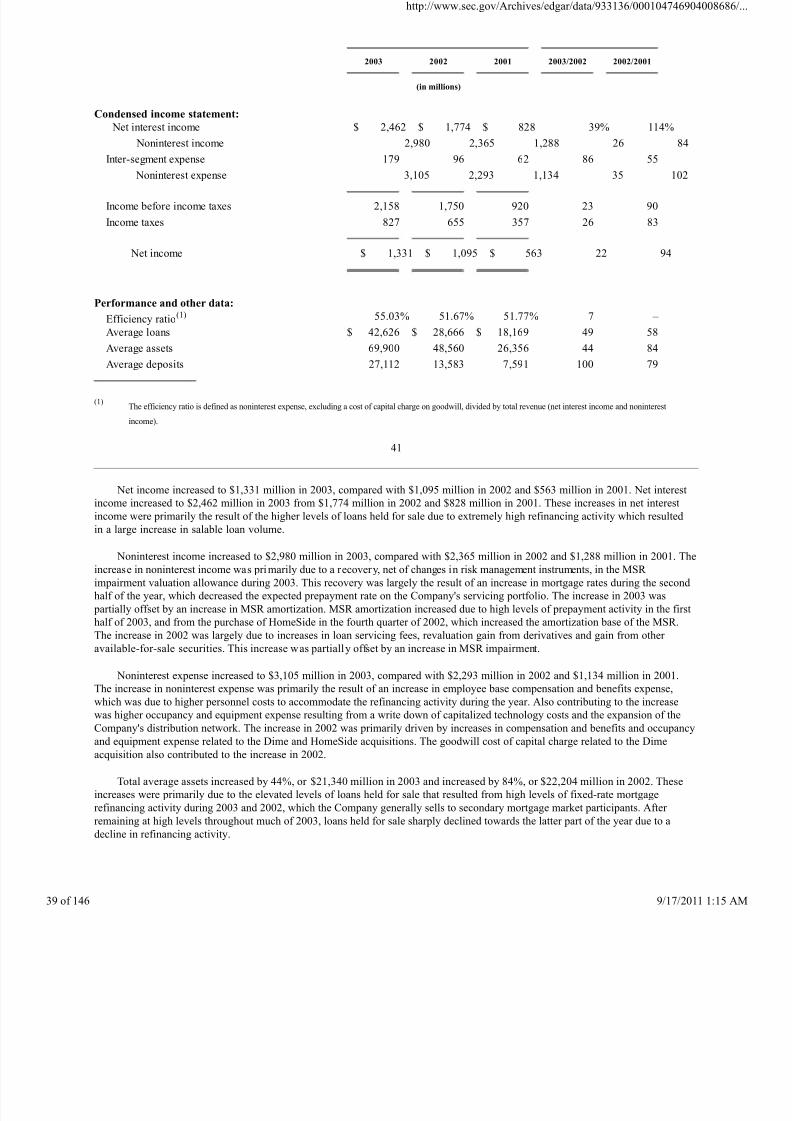
8/4/2019 Wamu 10-k 2003 Subprime
http://slidepdf.com/reader/full/wamu-10-k-2003-subprime 39/146
2003
2002
2001
2003/2002
2002/2001
(in millions)
Condensed income statement:
Net interest income $ 2,462 $ 1,774 $ 828 39% 114%
Noninterest income 2,980 2,365 1,288 26 84
Inter-segment expense 179 96 62 86 55
Noninterest expense 3,105 2,293 1,134 35 102
Income before income taxes 2,158 1,750 920 23 90
Income taxes 827 655 357 26 83
Net income $ 1,331 $ 1,095 $ 563 22 94
Performance and other data:
Efficiency ratio(1) 55.03% 51.67% 51.77% 7 –
Average loans $ 42,626 $ 28,666 $ 18,169 49 58
Average assets 69,900 48,560 26,356 44 84Average deposits 27,112 13,583 7,591 100 79
(1)The efficiency ratio is defined as noninterest expense, excluding a cost of capital charge on goodwill, divided by total revenue (net interest income and noninterest
income).
41
Net income increased to $1,331 million in 2003, compared with $1,095 million in 2002 and $563 million in 2001. Net interest
income increased to $2,462 million in 2003 from $1,774 million in 2002 and $828 million in 2001. These increases in net interest
income were primarily the result of the higher levels of loans held for sale due to extremely high refinancing activity which resulted
in a large increase in salable loan volume.
Noninterest income increased to $2,980 million in 2003, compared with $2,365 million in 2002 and $1,288 million in 2001. The
increase in noninterest income was primarily due to a recovery, net of changes in risk management instruments, in the MSR
impairment valuation allowance during 2003. This recovery was largely the result of an increase in mortgage rates during the second
half of the year, which decreased the expected prepayment rate on the Company's servicing portfolio. The increase in 2003 was
partially offset by an increase in MSR amortization. MSR amortization increased due to high levels of prepayment activity in the first
half of 2003, and from the purchase of HomeSide in the fourth quarter of 2002, which increased the amortization base of the MSR.
The increase in 2002 was largely due to increases in loan servicing fees, revaluation gain from derivatives and gain from other
available-for-sale securities. This increase was partially offset by an increase in MSR impairment.
Noninterest expense increased to $3,105 million in 2003, compared with $2,293 million in 2002 and $1,134 million in 2001.
The increase in noninterest expense was primarily the result of an increase in employee base compensation and benefits expense,
which was due to higher personnel costs to accommodate the refinancing activity during the year. Also contributing to the increasewas higher occupancy and equipment expense resulting from a write down of capitalized technology costs and the expansion of the
Company's distribution network. The increase in 2002 was primarily driven by increases in compensation and benefits and occupancy
and equipment expense related to the Dime and HomeSide acquisitions. The goodwill cost of capital charge related to the Dime
acquisition also contributed to the increase in 2002.
Total average assets increased by 44%, or $21,340 million in 2003 and increased by 84%, or $22,204 million in 2002. These
increases were primarily due to the elevated levels of loans held for sale that resulted from high levels of fixed-rate mortgage
refinancing activity during 2003 and 2002, which the Company generally sells to secondary mortgage market participants. After
remaining at high levels throughout much of 2003, loans held for sale sharply declined towards the latter part of the year due to a
decline in refinancing activity.
http://www.sec.gov/Archives/edgar/data/933136/000104746904
146 9/17/2011
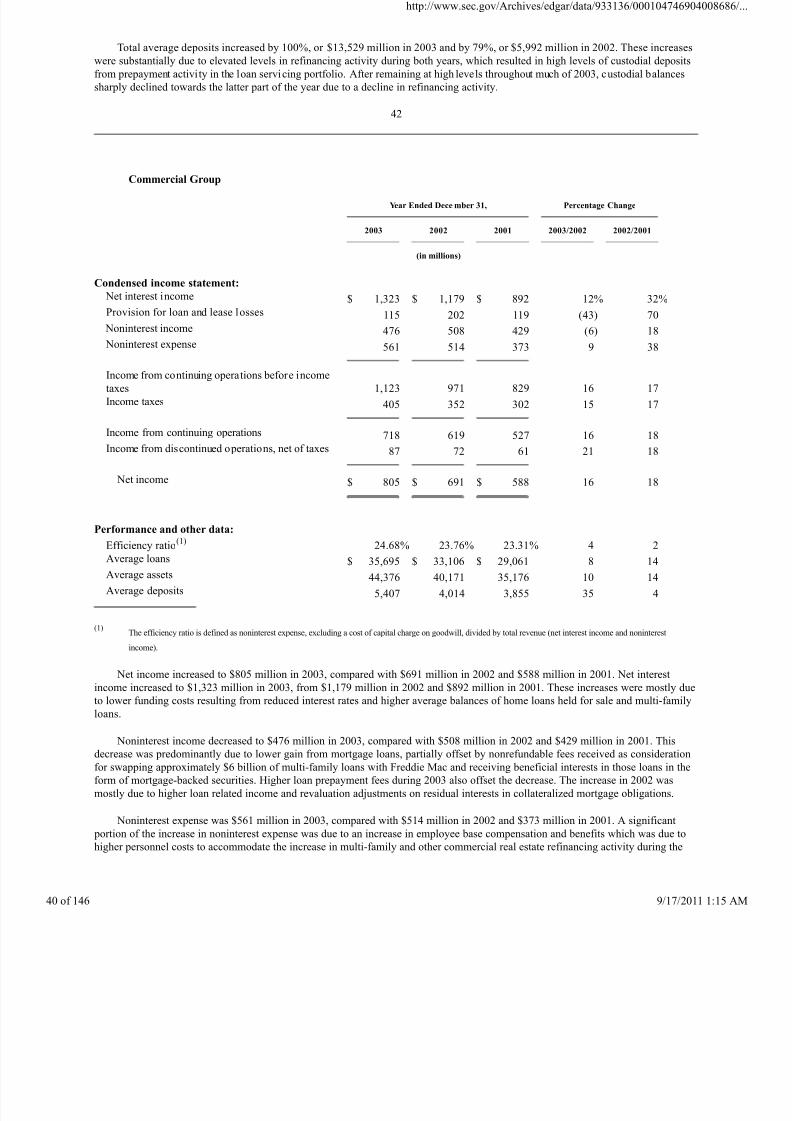
8/4/2019 Wamu 10-k 2003 Subprime
http://slidepdf.com/reader/full/wamu-10-k-2003-subprime 40/146
Total average deposits increased by 100%, or $13,529 million in 2003 and by 79%, or $5,992 million in 2002. These increases
were substantially due to elevated levels in refinancing activity during both years, which resulted in high levels of custodial deposits
from prepayment activity in the loan servicing portfolio. After remaining at high levels throughout much of 2003, custodial balances
sharply declined towards the latter part of the year due to a decline in refinancing activity.
42
Commercial Group
Year Ended Dece mber 31,
Percentage Change
2003
2002
2001
2003/2002
2002/2001
(in millions)
Condensed income statement:
Net interest income $ 1,323 $ 1,179 $ 892 12% 32%
Provision for loan and lease losses 115 202 119 (43) 70
Noninterest income 476 508 429 (6) 18
Noninterest expense 561 514 373 9 38
Income from continuing operations before income
taxes
1,123 971 829 16 17
Income taxes 405 352 302 15 17
Income from continuing operations 718 619 527 16 18
Income from discontinued operations, net of taxes 87 72 61 21 18
Net income $ 805 $ 691 $ 588 16 18
Performance and other data:
Efficiency ratio(1) 24.68% 23.76% 23.31% 4 2
Average loans $ 35,695 $ 33,106 $ 29,061 8 14
Average assets 44,376 40,171 35,176 10 14
Average deposits 5,407 4,014 3,855 35 4
(1)The efficiency ratio is defined as noninterest expense, excluding a cost of capital charge on goodwill, divided by total revenue (net interest income and noninterest
income).
Net income increased to $805 million in 2003, compared with $691 million in 2002 and $588 million in 2001. Net interest
income increased to $1,323 million in 2003, from $1,179 million in 2002 and $892 million in 2001. These increases were mostly due
to lower funding costs resulting from reduced interest rates and higher average balances of home loans held for sale and multi-familyloans.
Noninterest income decreased to $476 million in 2003, compared with $508 million in 2002 and $429 million in 2001. This
decrease was predominantly due to lower gain from mortgage loans, partially offset by nonrefundable fees received as consideration
for swapping approximately $6 billion of multi-family loans with Freddie Mac and receiving beneficial interests in those loans in the
form of mortgage-backed securities. Higher loan prepayment fees during 2003 also offset the decrease. The increase in 2002 was
mostly due to higher loan related income and revaluation adjustments on residual interests in collateralized mortgage obligations.
Noninterest expense was $561 million in 2003, compared with $514 million in 2002 and $373 million in 2001. A significant
portion of the increase in noninterest expense was due to an increase in employee base compensation and benefits which was due to
higher personnel costs to accommodate the increase in multi-family and other commercial real estate refinancing activity during the
http://www.sec.gov/Archives/edgar/data/933136/000104746904
146 9/17/2011
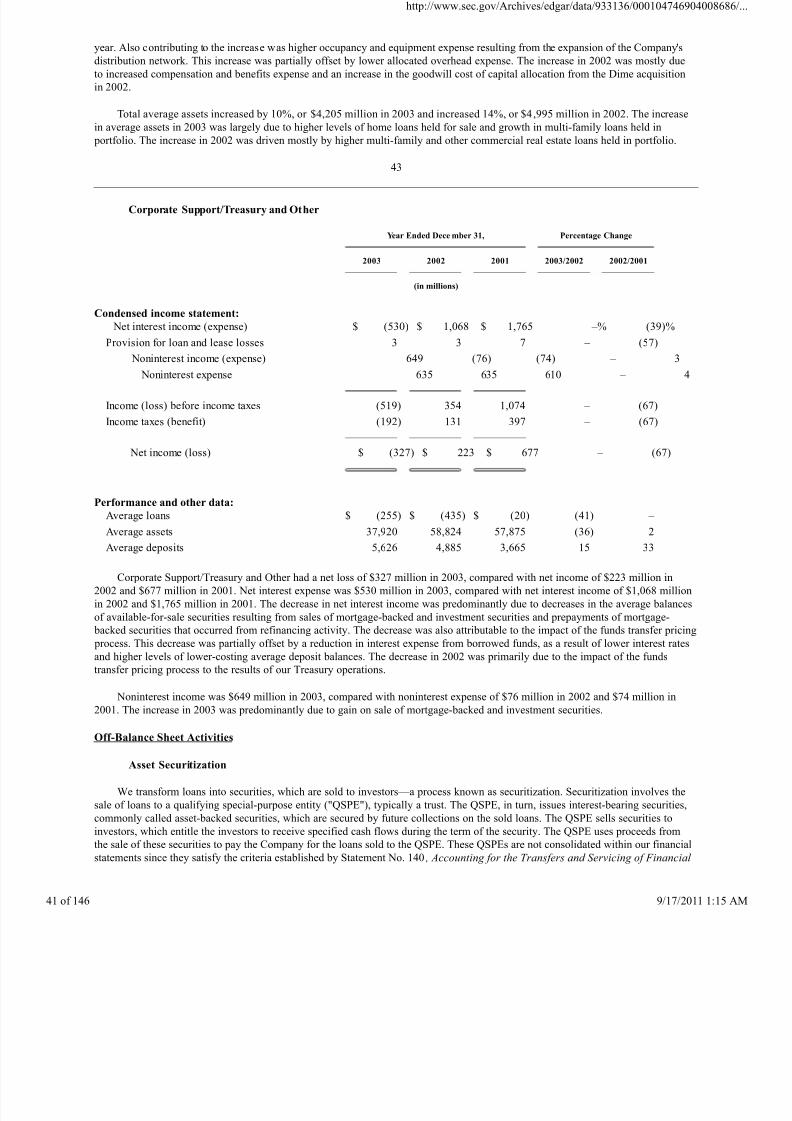
8/4/2019 Wamu 10-k 2003 Subprime
http://slidepdf.com/reader/full/wamu-10-k-2003-subprime 41/146
year. Also contributing to the increase was higher occupancy and equipment expense resulting from the expansion of the Company's
distribution network. This increase was partially offset by lower allocated overhead expense. The increase in 2002 was mostly due
to increased compensation and benefits expense and an increase in the goodwill cost of capital allocation from the Dime acquisition
in 2002.
Total average assets increased by 10%, or $4,205 million in 2003 and increased 14%, or $4,995 million in 2002. The increase
in average assets in 2003 was largely due to higher levels of home loans held for sale and growth in multi-family loans held in
portfolio. The increase in 2002 was driven mostly by higher multi-family and other commercial real estate loans held in portfolio.
43
Corporate Support/Treasury and Other
Year Ended Dece mber 31,
Percentage Change
2003
2002
2001
2003/2002
2002/2001
(in millions)
Condensed income statement:
Net interest income (expense) $ (530) $ 1,068 $ 1,765 –% (39)%
Provision for loan and lease losses 3 3 7 – (57)
Noninterest income (expense) 649 (76) (74) – 3
Noninterest expense 635 635 610 – 4
Income (loss) before income taxes (519) 354 1,074 – (67)
Income taxes (benefit) (192) 131 397 – (67)
Net income (loss) $ (327) $ 223 $ 677 – (67)
Performance and other data:
Average loans $ (255) $ (435) $ (20) (41) –
Average assets 37,920 58,824 57,875 (36) 2
Average deposits 5,626 4,885 3,665 15 33
Corporate Support/Treasury and Other had a net loss of $327 million in 2003, compared with net income of $223 million in
2002 and $677 million in 2001. Net interest expense was $530 million in 2003, compared with net interest income of $1,068 million
in 2002 and $1,765 million in 2001. The decrease in net interest income was predominantly due to decreases in the average balances
of available-for-sale securities resulting from sales of mortgage-backed and investment securities and prepayments of mortgage-
backed securities that occurred from refinancing activity. The decrease was also attributable to the impact of the funds transfer pricing
process. This decrease was partially offset by a reduction in interest expense from borrowed funds, as a result of lower interest rates
and higher levels of lower-costing average deposit balances. The decrease in 2002 was primarily due to the impact of the funds
transfer pricing process to the results of our Treasury operations.
Noninterest income was $649 million in 2003, compared with noninterest expense of $76 million in 2002 and $74 million in2001. The increase in 2003 was predominantly due to gain on sale of mortgage-backed and investment securities.
Off-Balance Sheet Activities
Asset Securitization
We transform loans into securities, which are sold to investors—a process known as securitization. Securitization involves the
sale of loans to a qualifying special-purpose entity ("QSPE"), typically a trust. The QSPE, in turn, issues interest-bearing securities,
commonly called asset-backed securities, which are secured by future collections on the sold loans. The QSPE sells securities to
investors, which entitle the investors to receive specified cash flows during the term of the security. The QSPE uses proceeds from
the sale of these securities to pay the Company for the loans sold to the QSPE. These QSPEs are not consolidated within our financial
statements since they satisfy the criteria established by Statement No. 140 , Accounting for the Transfers and Servicing of Financial
http://www.sec.gov/Archives/edgar/data/933136/000104746904
146 9/17/2011
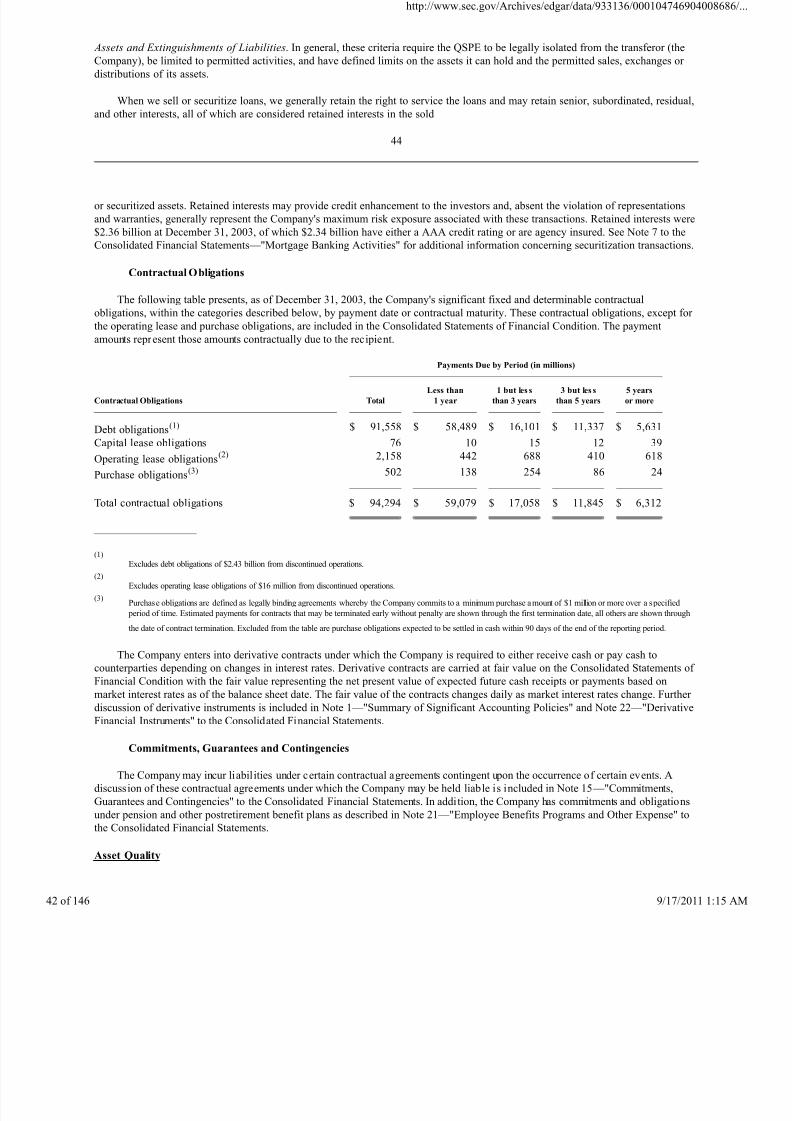
8/4/2019 Wamu 10-k 2003 Subprime
http://slidepdf.com/reader/full/wamu-10-k-2003-subprime 42/146
Assets and Extinguishments of Liabilities. In general, these criteria require the QSPE to be legally isolated from the transferor (the
Company), be limited to permitted activities, and have defined limits on the assets it can hold and the permitted sales, exchanges or
distributions of its assets.
When we sell or securitize loans, we generally retain the right to service the loans and may retain senior, subordinated, residual,
and other interests, all of which are considered retained interests in the sold
44
or securitized assets. Retained interests may provide credit enhancement to the investors and, absent the violation of representations
and warranties, generally represent the Company's maximum risk exposure associated with these transactions. Retained interests were
$2.36 billion at December 31, 2003, of which $2.34 billion have either a AAA credit rating or are agency insured. See Note 7 to the
Consolidated Financial Statements—"Mortgage Banking Activities" for additional information concerning securitization transactions.
Contractual Obligations
The following table presents, as of December 31, 2003, the Company's significant fixed and determinable contractual
obligations, within the categories described below, by payment date or contractual maturity. These contractual obligations, except for
the operating lease and purchase obligations, are included in the Consolidated Statements of Financial Condition. The payment
amounts represent those amounts contractually due to the recipient.
Payments Due by Period (in millions)
Contractual Obligations
Total
Less than
1 year
1 but les s
than 3 years
3 but les s
than 5 years
5 years
or more
Debt obligations(1) $ 91,558 $ 58,489 $ 16,101 $ 11,337 $ 5,631
Capital lease obligations 76 10 15 12 39
Operating lease obligations(2) 2,158 442 688 410 618
Purchase obligations(3) 502 138 254 86 24
Total contractual obligations $ 94,294 $ 59,079 $ 17,058 $ 11,845 $ 6,312
(1)
Excludes debt obligations of $2.43 billion from discontinued operations.
(2)
Excludes operating lease obligations of $16 million from discontinued operations.
(3)Purchase obligations are defined as legally binding agreements whereby the Company commits to a minimum purchase amount of $1 million or more over a specified
period of time. Estimated payments for contracts that may be terminated early without penalty are shown through the first termination date, all others are shown through
the date of contract termination. Excluded from the table are purchase obligations expected to be settled in cash within 90 days of the end of the reporting period.
The Company enters into derivative contracts under which the Company is required to either receive cash or pay cash to
counterparties depending on changes in interest rates. Derivative contracts are carried at fair value on the Consolidated Statements of
Financial Condition with the fair value representing the net present value of expected future cash receipts or payments based on
market interest rates as of the balance sheet date. The fair value of the contracts changes daily as market interest rates change. Further discussion of derivative instruments is included in Note 1—"Summary of Significant Accounting Policies" and Note 22—"Derivative
Financial Instruments" to the Consolidated Financial Statements.
Commitments, Guarantees and Contingencies
The Company may incur liabilities under certain contractual agreements contingent upon the occurrence of certain events. A
discussion of these contractual agreements under which the Company may be held liable is included in Note 15—"Commitments,
Guarantees and Contingencies" to the Consolidated Financial Statements. In addition, the Company has commitments and obligations
under pension and other postretirement benefit plans as described in Note 21—"Employee Benefits Programs and Other Expense" to
the Consolidated Financial Statements.
Asset Quality
http://www.sec.gov/Archives/edgar/data/933136/000104746904
146 9/17/2011
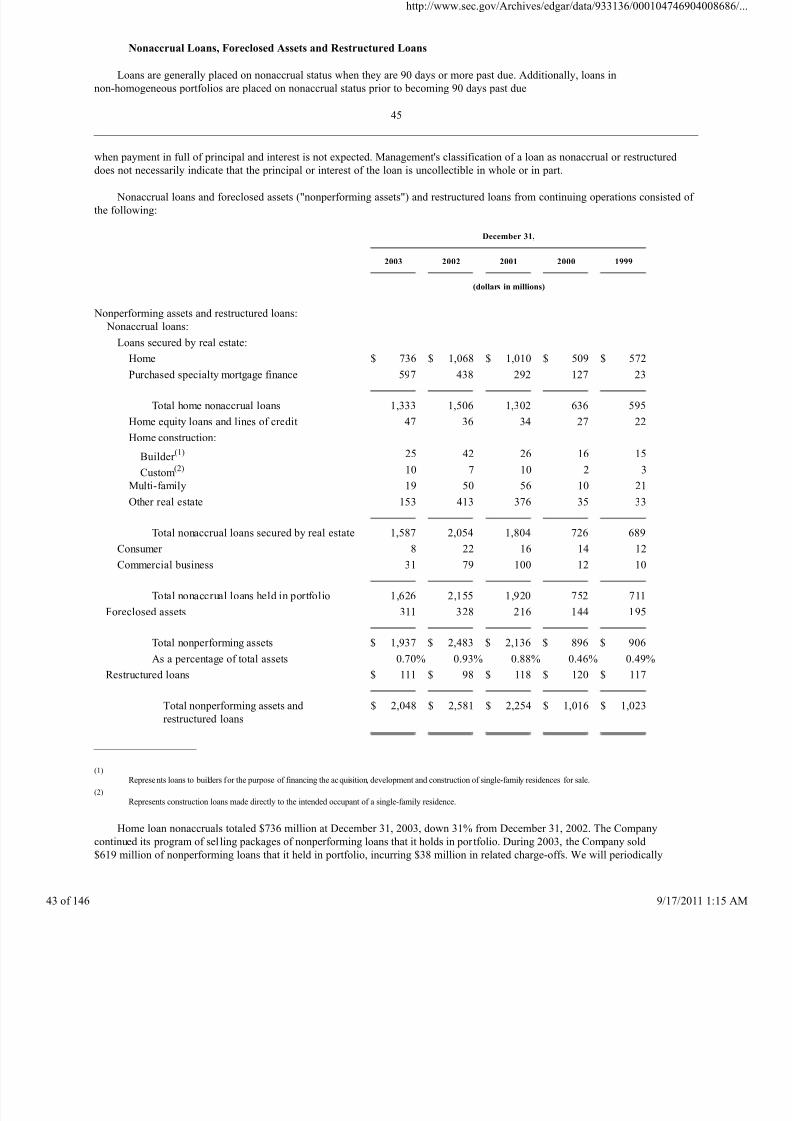
8/4/2019 Wamu 10-k 2003 Subprime
http://slidepdf.com/reader/full/wamu-10-k-2003-subprime 43/146
Nonaccrual Loans, Foreclosed Assets and Restructured Loans
Loans are generally placed on nonaccrual status when they are 90 days or more past due. Additionally, loans in
non-homogeneous portfolios are placed on nonaccrual status prior to becoming 90 days past due
45
when payment in full of principal and interest is not expected. Management's classification of a loan as nonaccrual or restructured
does not necessarily indicate that the principal or interest of the loan is uncollectible in whole or in part.
Nonaccrual loans and foreclosed assets ("nonperforming assets") and restructured loans from continuing operations consisted of
the following:
December 31,
2003
2002
2001
2000
1999
(dollars in millions)
Nonperforming assets and restructured loans:
Nonaccrual loans:
Loans secured by real estate:
Home $ 736 $ 1,068 $ 1,010 $ 509 $ 572
Purchased specialty mortgage finance 597 438 292 127 23
Total home nonaccrual loans 1,333 1,506 1,302 636 595
Home equity loans and lines of credit 47 36 34 27 22
Home construction:
Builder (1) 25 42 26 16 15
Custom(2) 10 7 10 2 3
Multi-family 19 50 56 10 21
Other real estate 153 413 376 35 33
Total nonaccrual loans secured by real estate 1,587 2,054 1,804 726 689
Consumer 8 22 16 14 12
Commercial business 31 79 100 12 10
Total nonaccrual loans held in portfolio 1,626 2,155 1,920 752 711
Foreclosed assets 311 328 216 144 195
Total nonperforming assets $ 1,937 $ 2,483 $ 2,136 $ 896 $ 906
As a percentage of total assets 0.70% 0.93% 0.88% 0.46% 0.49%
Restructured loans $ 111 $ 98 $ 118 $ 120 $ 117
Total nonperforming assets and
restructured loans
$ 2,048 $ 2,581 $ 2,254 $ 1,016 $ 1,023
(1)
Represents loans to builders for the purpose of financing the acquisition, development and construction of single-family residences for sale.
(2)
Represents construction loans made directly to the intended occupant of a single-family residence.
Home loan nonaccruals totaled $736 million at December 31, 2003, down 31% from December 31, 2002. The Company
continued its program of sel ling packages of nonperforming loans that it holds in portfolio. During 2003, the Company sold
$619 million of nonperforming loans that it held in portfolio, incurring $38 million in related charge-offs. We will periodically
http://www.sec.gov/Archives/edgar/data/933136/000104746904
146 9/17/2011
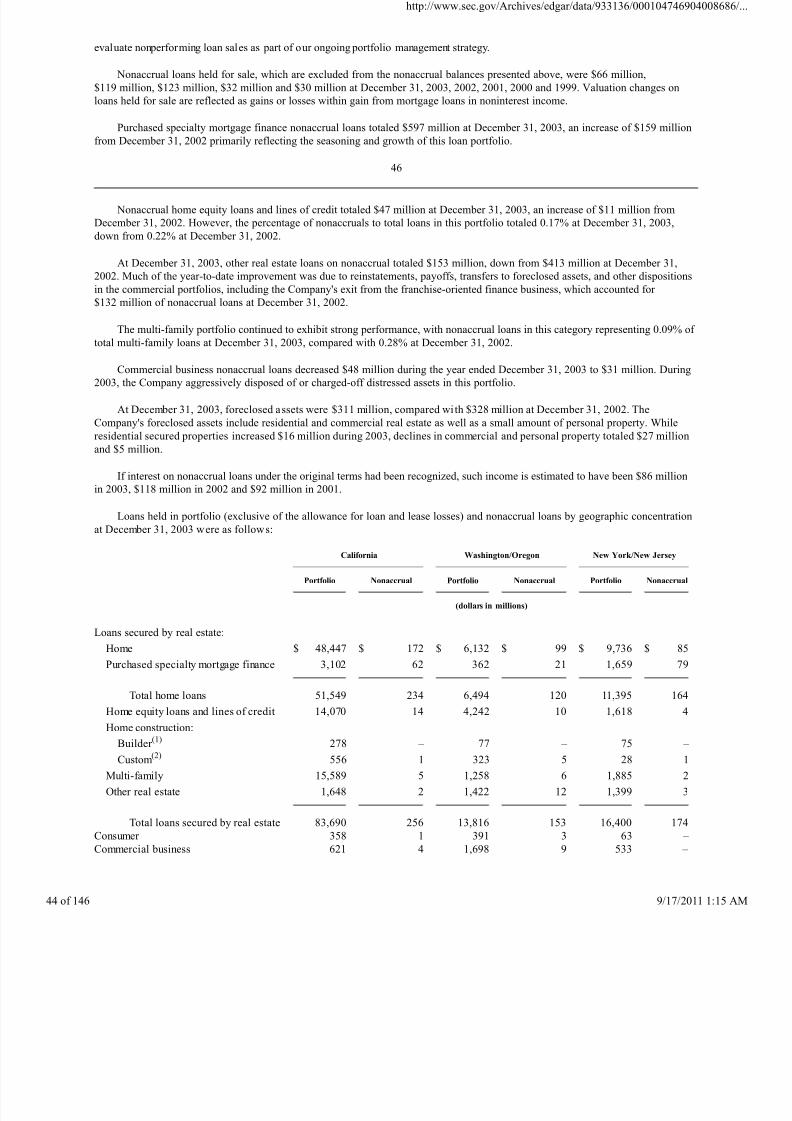
8/4/2019 Wamu 10-k 2003 Subprime
http://slidepdf.com/reader/full/wamu-10-k-2003-subprime 44/146
evaluate nonperforming loan sales as part of our ongoing portfolio management strategy.
Nonaccrual loans held for sale, which are excluded from the nonaccrual balances presented above, were $66 million,
$119 million, $123 million, $32 million and $30 million at December 31, 2003, 2002, 2001, 2000 and 1999. Valuation changes on
loans held for sale are reflected as gains or losses within gain from mortgage loans in noninterest income.
Purchased specialty mortgage finance nonaccrual loans totaled $597 million at December 31, 2003, an increase of $159 million
from December 31, 2002 primarily reflecting the seasoning and growth of this loan portfolio.
46
Nonaccrual home equity loans and lines of credit totaled $47 million at December 31, 2003, an increase of $11 million from
December 31, 2002. However, the percentage of nonaccruals to total loans in this portfolio totaled 0.17% at December 31, 2003,
down from 0.22% at December 31, 2002.
At December 31, 2003, other real estate loans on nonaccrual totaled $153 million, down from $413 million at December 31,
2002. Much of the year-to-date improvement was due to reinstatements, payoffs, transfers to foreclosed assets, and other dispositions
in the commercial portfolios, including the Company's exit from the franchise-oriented finance business, which accounted for
$132 million of nonaccrual loans at December 31, 2002.
The multi-family portfolio continued to exhibit strong performance, with nonaccrual loans in this category representing 0.09% of
total multi-family loans at December 31, 2003, compared with 0.28% at December 31, 2002.
Commercial business nonaccrual loans decreased $48 million during the year ended December 31, 2003 to $31 million. During
2003, the Company aggressively disposed of or charged-off distressed assets in this portfolio.
At December 31, 2003, foreclosed assets were $311 million, compared with $328 million at December 31, 2002. The
Company's foreclosed assets include residential and commercial real estate as well as a small amount of personal property. While
residential secured properties increased $16 million during 2003, declines in commercial and personal property totaled $27 million
and $5 million.
If interest on nonaccrual loans under the original terms had been recognized, such income is estimated to have been $86 million
in 2003, $118 million in 2002 and $92 million in 2001.
Loans held in portfolio (exclusive of the allowance for loan and lease losses) and nonaccrual loans by geographic concentration
at December 31, 2003 were as follows:
California
Washington/Oregon
New York/New Jersey
Portfolio
Nonaccrual
Portfolio
Nonaccrual
Portfolio
Nonaccrual
(dollars in millions)
Loans secured by real estate:
Home $ 48,447 $ 172 $ 6,132 $ 99 $ 9,736 $ 85
Purchased specialty mortgage finance 3,102 62 362 21 1,659 79
Total home loans 51,549 234 6,494 120 11,395 164Home equity loans and lines of credit 14,070 14 4,242 10 1,618 4
Home construction:
Builder (1) 278 – 77 – 75 –
Custom(2) 556 1 323 5 28 1
Multi-family 15,589 5 1,258 6 1,885 2
Other real estate 1,648 2 1,422 12 1,399 3
Total loans secured by real estate 83,690 256 13,816 153 16,400 174
Consumer 358 1 391 3 63 –
Commercial business 621 4 1,698 9 533 –
http://www.sec.gov/Archives/edgar/data/933136/000104746904
146 9/17/2011
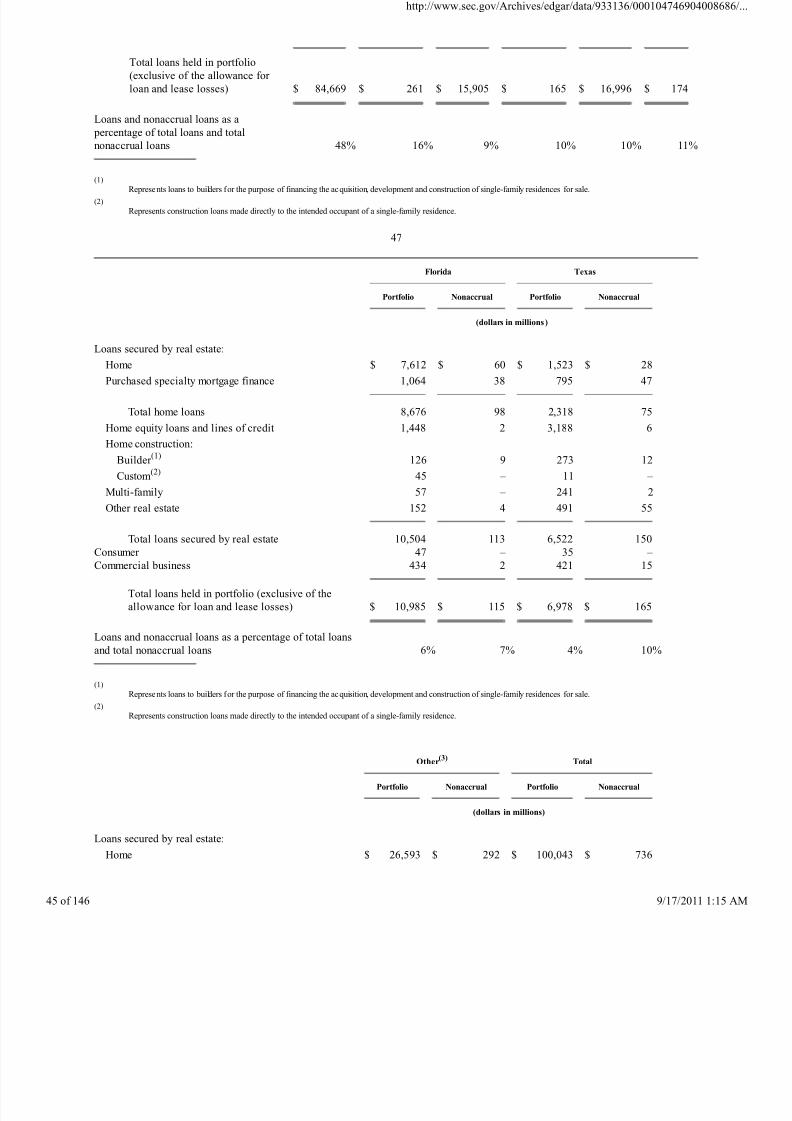
8/4/2019 Wamu 10-k 2003 Subprime
http://slidepdf.com/reader/full/wamu-10-k-2003-subprime 45/146
Total loans held in portfolio
(exclusive of the allowance for
loan and lease losses) $ 84,669 $ 261 $ 15,905 $ 165 $ 16,996 $ 174
Loans and nonaccrual loans as a
percentage of total loans and total
nonaccrual loans 48% 16% 9% 10% 10% 11%
(1)
Represents loans to builders for the purpose of financing the acquisition, development and construction of single-family residences for sale.
(2)
Represents construction loans made directly to the intended occupant of a single-family residence.
47
Florida
Texas
Portfolio
Nonaccrual
Portfolio
Nonaccrual
(dollars in millions)
Loans secured by real estate:Home $ 7,612 $ 60 $ 1,523 $ 28
Purchased specialty mortgage finance 1,064 38 795 47
Total home loans 8,676 98 2,318 75
Home equity loans and lines of credit 1,448 2 3,188 6
Home construction:
Builder (1) 126 9 273 12
Custom(2) 45 – 11 –
Multi-family 57 – 241 2
Other real estate 152 4 491 55
Total loans secured by real estate 10,504 113 6,522 150
Consumer 47 – 35 –
Commercial business 434 2 421 15
Total loans held in portfolio (exclusive of the
allowance for loan and lease losses) $ 10,985 $ 115 $ 6,978 $ 165
Loans and nonaccrual loans as a percentage of total loans
and total nonaccrual loans 6% 7% 4% 10%
(1)
Represents loans to builders for the purpose of financing the acquisition, development and construction of single-family residences for sale.
(2)
Represents construction loans made directly to the intended occupant of a single-family residence.
Other(3)
Total
Portfolio
Nonaccrual
Portfolio
Nonaccrual
(dollars in millions)
Loans secured by real estate:
Home $ 26,593 $ 292 $ 100,043 $ 736
http://www.sec.gov/Archives/edgar/data/933136/000104746904
146 9/17/2011
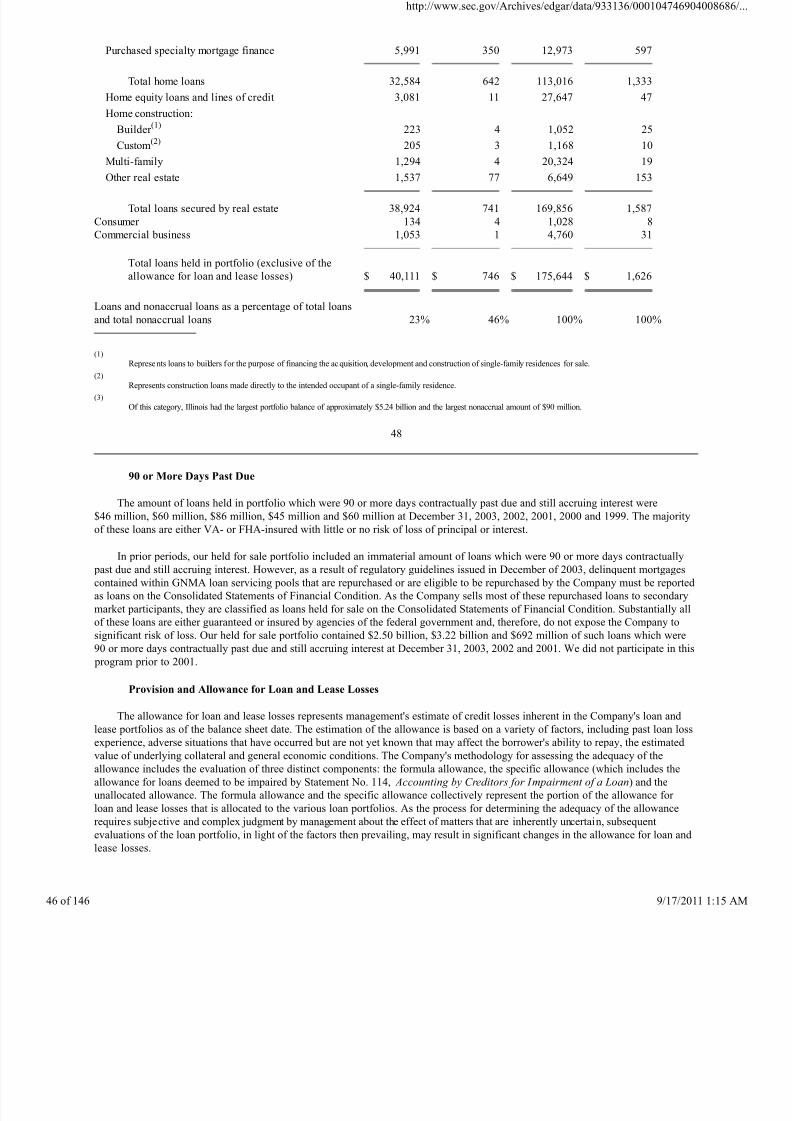
8/4/2019 Wamu 10-k 2003 Subprime
http://slidepdf.com/reader/full/wamu-10-k-2003-subprime 46/146
Purchased specialty mortgage finance 5,991 350 12,973 597
Total home loans 32,584 642 113,016 1,333
Home equity loans and lines of credit 3,081 11 27,647 47
Home construction:
Builder (1) 223 4 1,052 25
Custom(2) 205 3 1,168 10
Multi-family 1,294 4 20,324 19
Other real estate 1,537 77 6,649 153
Total loans secured by real estate 38,924 741 169,856 1,587
Consumer 134 4 1,028 8
Commercial business 1,053 1 4,760 31
Total loans held in portfolio (exclusive of the
allowance for loan and lease losses) $ 40,111 $ 746 $ 175,644 $ 1,626
Loans and nonaccrual loans as a percentage of total loans
and total nonaccrual loans 23% 46% 100% 100%
(1)
Represents loans to builders for the purpose of financing the acquisition, development and construction of single-family residences for sale.
(2)
Represents construction loans made directly to the intended occupant of a single-family residence.
(3)
Of this category, Illinois had the largest portfolio balance of approximately $5.24 billion and the largest nonaccrual amount of $90 million.
48
90 or More Days Past Due
The amount of loans held in portfolio which were 90 or more days contractually past due and still accruing interest were
$46 million, $60 million, $86 million, $45 million and $60 million at December 31, 2003, 2002, 2001, 2000 and 1999. The majority
of these loans are either VA- or FHA-insured with little or no risk of loss of principal or interest.
In prior periods, our held for sale portfolio included an immaterial amount of loans which were 90 or more days contractually
past due and still accruing interest. However, as a result of regulatory guidelines issued in December of 2003, delinquent mortgages
contained within GNMA loan servicing pools that are repurchased or are eligible to be repurchased by the Company must be reported
as loans on the Consolidated Statements of Financial Condition. As the Company sells most of these repurchased loans to secondary
market participants, they are classified as loans held for sale on the Consolidated Statements of Financial Condition. Substantially all
of these loans are either guaranteed or insured by agencies of the federal government and, therefore, do not expose the Company to
significant risk of loss. Our held for sale portfolio contained $2.50 billion, $3.22 billion and $692 million of such loans which were
90 or more days contractually past due and still accruing interest at December 31, 2003, 2002 and 2001. We did not participate in this
program prior to 2001.
Provision and Allowance for Loan and Lease Losses
The allowance for loan and lease losses represents management's estimate of credit losses inherent in the Company's loan and
lease portfolios as of the balance sheet date. The estimation of the allowance is based on a variety of factors, including past loan loss
experience, adverse situations that have occurred but are not yet known that may affect the borrower's ability to repay, the estimated
value of underlying collateral and general economic conditions. The Company's methodology for assessing the adequacy of the
allowance includes the evaluation of three distinct components: the formula allowance, the specific allowance (which includes the
allowance for loans deemed to be impaired by Statement No. 114, Accounting by Creditors for Impairment of a Loan) and the
unallocated allowance. The formula allowance and the specific allowance collectively represent the portion of the allowance for
loan and lease losses that is allocated to the various loan portfolios. As the process for determining the adequacy of the allowance
requires subjective and complex judgment by management about the effect of matters that are inherently uncertain, subsequent
evaluations of the loan portfolio, in light of the factors then prevailing, may result in significant changes in the allowance for loan and
lease losses.
http://www.sec.gov/Archives/edgar/data/933136/000104746904
146 9/17/2011
8/4/2019 Wamu 10-k 2003 Subprime
http://slidepdf.com/reader/full/wamu-10-k-2003-subprime 47/146
The allowance considers losses that are inherent in loan portfolios, but have not yet been realized. Losses are recognized when
(a) available information indicates that it is probable that a loss has been incurred and (b) the amount of the loss can be reasonably
estimated. Generally, the Company believes that borrowers are impacted by events that result in loan default and eventual loss well in
advance of a lender's knowledge of those events. The time frame between the occurrence of such events and the resulting default and
loss realization is referred to as the loss emergence period. Examples of such loss-causing events for home loans are borrower job
loss, divorce and medical crisis. An example for commercial real estate loans would be the loss of a major tenant.
The formula allowance is calculated by applying loss factors against all loans in what are considered homogeneous portfolios
(such as home loans, home equity loans and lines of credit, and purchased specialty mortgage finance loans). Loss factors are based
on an analysis of the historical loss experience of each loan category and an assessment of portfolio trends and conditions, as well as
specific risk factors impacting the loan and lease portfolios. These factors may be adjusted for external factors that, in management's
judgment, affect the collectibility of the portfolio as of the evaluation date. Such external factors include, but are not limited to, the
interest rate environment and housing prices.
For non-homogeneous loans such as commercial real estate, larger commercial business loans and builder home construction
loans, loss factors are assigned based on risk ratings that are ascribed to the
49
individual loans. A specific allowance may be assigned to these loans if they have been individually determined to be impaired.
Loans, other than those included in homogeneous portfolios, are considered impaired when it is probable that we will be unable
to collect all amounts past due, including interest payments. For loans that are determined to be impaired, the amount of impairment is
measured by a discounted cash flow analysis, using the loan's effective interest rate, except when it is determined that the only source
of repayment for the loan is the operation or liquidation of the underlying collateral. In such cases, the current fair value of the
collateral, reduced by estimated disposal costs, will be used in place of discounted cash flows. In estimating the fair value of
collateral, we evaluate various factors, such as occupancy and rental rates in our real estate markets and the level of obsolescence
that may exist on assets acquired from commercial business loans.
Loans that are determined to be impaired are excluded from the formula allowance analysis so as not to double-count the loss
exposure.
In estimating the amount of credit losses inherent in the Company's loan and lease portfolios, various assumptions are made. For
example, when assessing the condition of the overall economic environment, assumptions are made regarding current economic trendsand their impact on the loan and lease portfolio. In the event the national economy were to sustain a prolonged downturn, the loss
factors applied to our portfolios may need to be revised, which may significantly impact the measurement of the allowance for loan
and lease losses. For impaired loans that are collateral-dependent, the estimated fair value of the collateral may deviate significantly
from the proceeds received when the collateral is sold. To mitigate the imprecision inherent in most estimates of expected credit
losses, the allocated component of the allowance is supplemented by an unallocated component. The unallocated component reflects
our judgmental assessment of the impact that various factors have on the overall measurement of credit losses. These factors include,
but are not limited to, general economic and business conditions affecting the key lending areas of the Company, credit quality and
collateral value trends, loan concentrations, specific industry conditions within portfolio segments, recent loss experience in
particular segments of the portfolio, duration of the current business cycle, the impact of new product initiatives and other such
variables for which recent historical data do not provide a high level of precision for risk evaluation, the results of regulatory
examinations and findings from the Company's internal credit review function.
Refer to Note 1 to the Consolidated Financial Statements—"Summary of Significant Accounting Policies" for further discussionof the Allowance for Loan and Lease Losses.
50
Changes in the allowance for loan and lease losses were as follows:
Year Ended Dece mber 31,
2003
2002
2001
2000
1999
http://www.sec.gov/Archives/edgar/data/933136/000104746904
146 9/17/2011
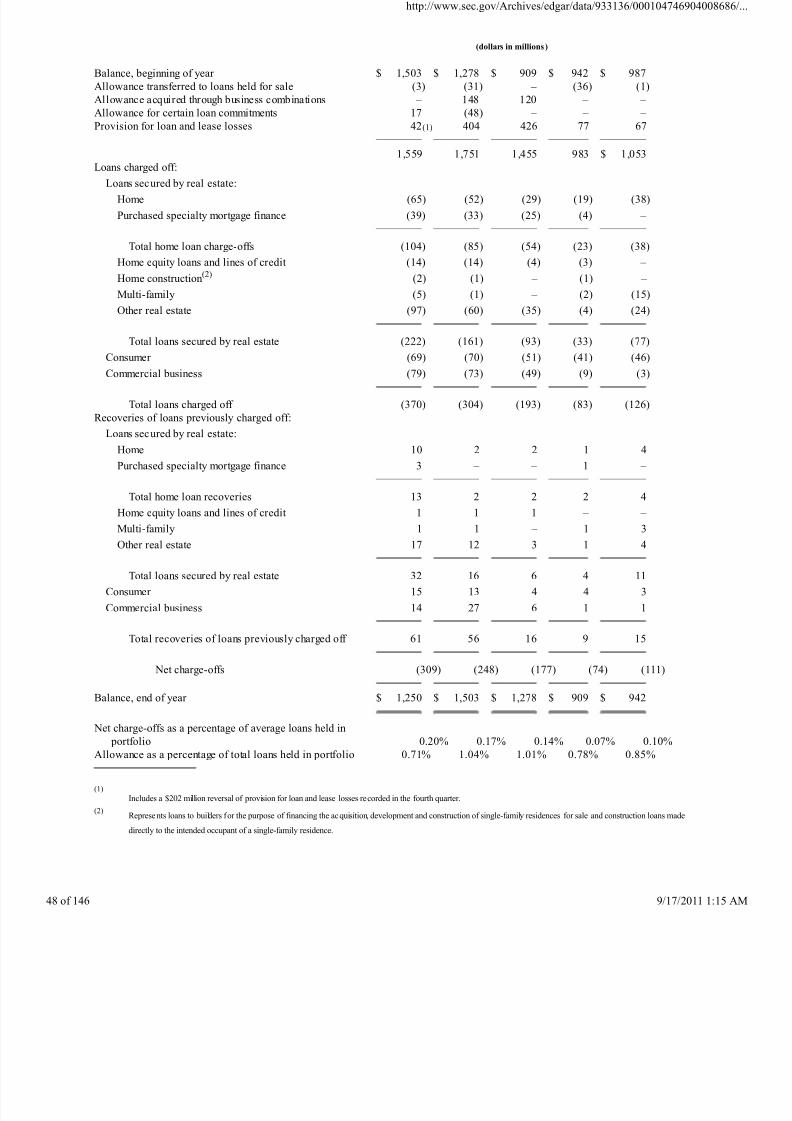
8/4/2019 Wamu 10-k 2003 Subprime
http://slidepdf.com/reader/full/wamu-10-k-2003-subprime 48/146
(dollars in millions)
Balance, beginning of year $ 1,503 $ 1,278 $ 909 $ 942 $ 987
Allowance transferred to loans held for sale (3) (31) – (36) (1)
Allowance acquired through business combinations – 148 120 – –
Allowance for certain loan commitments 17 (48) – – –
Provision for loan and lease losses 42(1) 404 426 77 67
1,559 1,751 1,455 983 $ 1,053
Loans charged off:
Loans secured by real estate:
Home (65) (52) (29) (19) (38)
Purchased specialty mortgage finance (39) (33) (25) (4) –
Total home loan charge-offs (104) (85) (54) (23) (38)
Home equity loans and lines of credit (14) (14) (4) (3) –
Home construction(2) (2) (1) – (1) –
Multi-family (5) (1) – (2) (15)
Other real estate (97) (60) (35) (4) (24)
Total loans secured by real estate (222) (161) (93) (33) (77)
Consumer (69) (70) (51) (41) (46)
Commercial business (79) (73) (49) (9) (3)
Total loans charged off (370) (304) (193) (83) (126)
Recoveries of loans previously charged off:
Loans secured by real estate:
Home 10 2 2 1 4
Purchased specialty mortgage finance 3 – – 1 –
Total home loan recoveries 13 2 2 2 4
Home equity loans and lines of credit 1 1 1 – –
Multi-family 1 1 – 1 3
Other real estate 17 12 3 1 4
Total loans secured by real estate 32 16 6 4 11
Consumer 15 13 4 4 3
Commercial business 14 27 6 1 1
Total recoveries of loans previously charged off 61 56 16 9 15
Net charge-offs (309) (248) (177) (74) (111)
Balance, end of year $ 1,250 $ 1,503 $ 1,278 $ 909 $ 942
Net charge-offs as a percentage of average loans held in
portfolio 0.20% 0.17% 0.14% 0.07% 0.10%
Allowance as a percentage of total loans held in portfolio 0.71% 1.04% 1.01% 0.78% 0.85%
(1)
Includes a $202 million reversal of provision for loan and lease losses recorded in the fourth quarter.
(2)Represents loans to builders for the purpose of financing the acquisition, development and construction of single-family residences for sale and construction loans made
directly to the intended occupant of a single-family residence.
http://www.sec.gov/Archives/edgar/data/933136/000104746904
146 9/17/2011
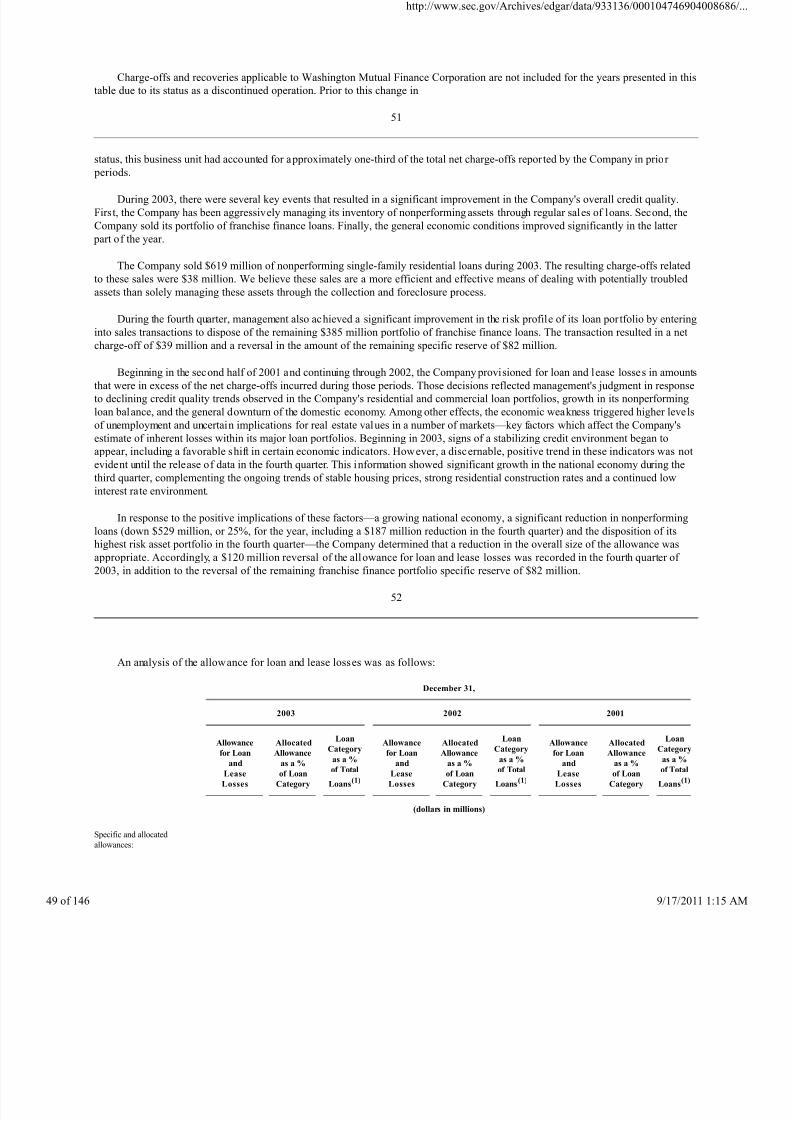
8/4/2019 Wamu 10-k 2003 Subprime
http://slidepdf.com/reader/full/wamu-10-k-2003-subprime 49/146
Charge-offs and recoveries applicable to Washington Mutual Finance Corporation are not included for the years presented in this
table due to its status as a discontinued operation. Prior to this change in
51
status, this business unit had accounted for approximately one-third of the total net charge-offs reported by the Company in prior
periods.
During 2003, there were several key events that resulted in a significant improvement in the Company's overall credit quality.
First, the Company has been aggressively managing its inventory of nonperforming assets through regular sales of loans. Second, the
Company sold its portfolio of franchise finance loans. Finally, the general economic conditions improved significantly in the latter
part of the year.
The Company sold $619 million of nonperforming single-family residential loans during 2003. The resulting charge-offs related
to these sales were $38 million. We believe these sales are a more efficient and effective means of dealing with potentially troubled
assets than solely managing these assets through the collection and foreclosure process.
During the fourth quarter, management also achieved a significant improvement in the risk profile of its loan portfolio by entering
into sales transactions to dispose of the remaining $385 million portfolio of franchise finance loans. The transaction resulted in a net
charge-off of $39 million and a reversal in the amount of the remaining specific reserve of $82 million.
Beginning in the second half of 2001 and continuing through 2002, the Company provisioned for loan and lease losses in amounts
that were in excess of the net charge-offs incurred during those periods. Those decisions reflected management's judgment in response
to declining credit quality trends observed in the Company's residential and commercial loan portfolios, growth in its nonperforming
loan balance, and the general downturn of the domestic economy. Among other effects, the economic weakness triggered higher levels
of unemployment and uncertain implications for real estate values in a number of markets—key factors which affect the Company's
estimate of inherent losses within its major loan portfolios. Beginning in 2003, signs of a stabilizing credit environment began to
appear, including a favorable shift in certain economic indicators. However, a discernable, positive trend in these indicators was not
evident until the release of data in the fourth quarter. This information showed significant growth in the national economy during the
third quarter, complementing the ongoing trends of stable housing prices, strong residential construction rates and a continued low
interest rate environment.
In response to the positive implications of these factors—a growing national economy, a significant reduction in nonperforming
loans (down $529 million, or 25%, for the year, including a $187 million reduction in the fourth quarter) and the disposition of its
highest risk asset portfolio in the fourth quarter—the Company determined that a reduction in the overall size of the allowance was
appropriate. Accordingly, a $120 million reversal of the allowance for loan and lease losses was recorded in the fourth quarter of
2003, in addition to the reversal of the remaining franchise finance portfolio specific reserve of $82 million.
52
An analysis of the allowance for loan and lease losses was as follows:
December 31,
2003
2002
2001
Allowance
for Loan
and
Lease
Losses
Allocated
Allowance
as a %
of Loan
Category
Loan
Category
as a %
of Total
Loans(1)
Allowance
for Loan
and
Lease
Losses
Allocated
Allowance
as a %
of Loan
Category
Loan
Category
as a %
of Total
Loans(1)
Allowance
for Loan
and
Lease
Losses
Allocated
Allowance
as a %
of Loan
Category
Loan
Category
as a %
of Total
Loans(1)
(dollars in millions)
Specific and allocated
allowances:
http://www.sec.gov/Archives/edgar/data/933136/000104746904
146 9/17/2011
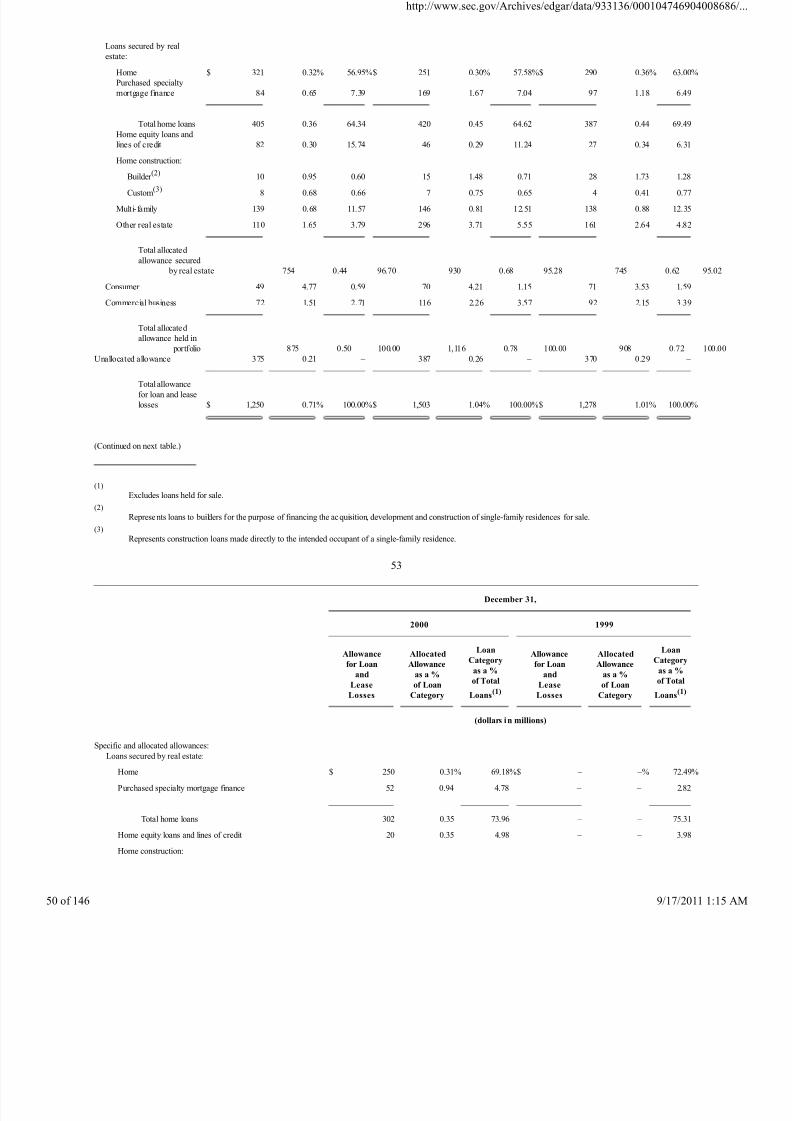
8/4/2019 Wamu 10-k 2003 Subprime
http://slidepdf.com/reader/full/wamu-10-k-2003-subprime 50/146
Loans secured by real
estate:
Home $ 321 0.32% 56.95%$ 251 0.30% 57.58%$ 290 0.36% 63.00%
Purchased specialty
mortgage finance 84 0.65 7.39 169 1.67 7.04 97 1.18 6.49
Total home loans 405 0.36 64.34 420 0.45 64.62 387 0.44 69.49
Home equity loans and
lines of credit 82 0.30 15.74 46 0.29 11.24 27 0.34 6.31
Home construction:
Builder (2) 10 0.95 0.60 15 1.48 0.71 28 1.73 1.28
Custom(3)
8 0.68 0.66 7 0.75 0.65 4 0.41 0.77
Multi-family 139 0.68 11.57 146 0.81 12.51 138 0.88 12.35
Other real estate 110 1.65 3.79 296 3.71 5.55 161 2.64 4.82
Total allocated
allowance secured
by real estate 754 0.44 96.70 930 0.68 95.28 745 0.62
Consumer 49 4.77 0.59 70 4.21 1.15 71 3.53 1.59
Commercial business 72 1.51 2.71 116 2.26 3.57 92 2.15 3.39
Total allocated
allowance held in
portfolio 875 0.50 100.00 1,116 0.78 100.00 908 0.72 Unallocated allowance 375 0.21 – 387 0.26 – 370 0.29 –
Total allowance
for loan and lease
losses $ 1,250 0.71% 100.00%$ 1,503 1.04% 100.00%$ 1,278 1.01% 100.00%
(Continued on next table.)
(1)
Excludes loans held for sale.
(2)
Represents loans to builders for the purpose of financing the acquisition, development and construction of single-family residences for sale.
(3)
Represents construction loans made directly to the intended occupant of a single-family residence.
53
December 31,
2000
1999
Allowance
for Loan
and
Lease
Losses
Allocated
Allowance
as a %
of Loan
Category
Loan
Category
as a %
of Total
Loans(1)
Allowance
for Loan
and
Lease
Losses
Allocated
Allowance
as a %
of Loan
Category
Loan
Category
as a %
of Total
Loans(1)
(dollars in millions)
Specific and allocated allowances:
Loans secured by real estate:
Home $ 250 0.31% 69.18%$ – –% 72.49%
Purchased specialty mortgage finance 52 0.94 4.78 – – 2.82
Total home loans 302 0.35 73.96 – – 75.31
Home equity loans and lines of credit 20 0.35 4.98 – – 3.98
Home construction:
http://www.sec.gov/Archives/edgar/data/933136/000104746904
146 9/17/2011
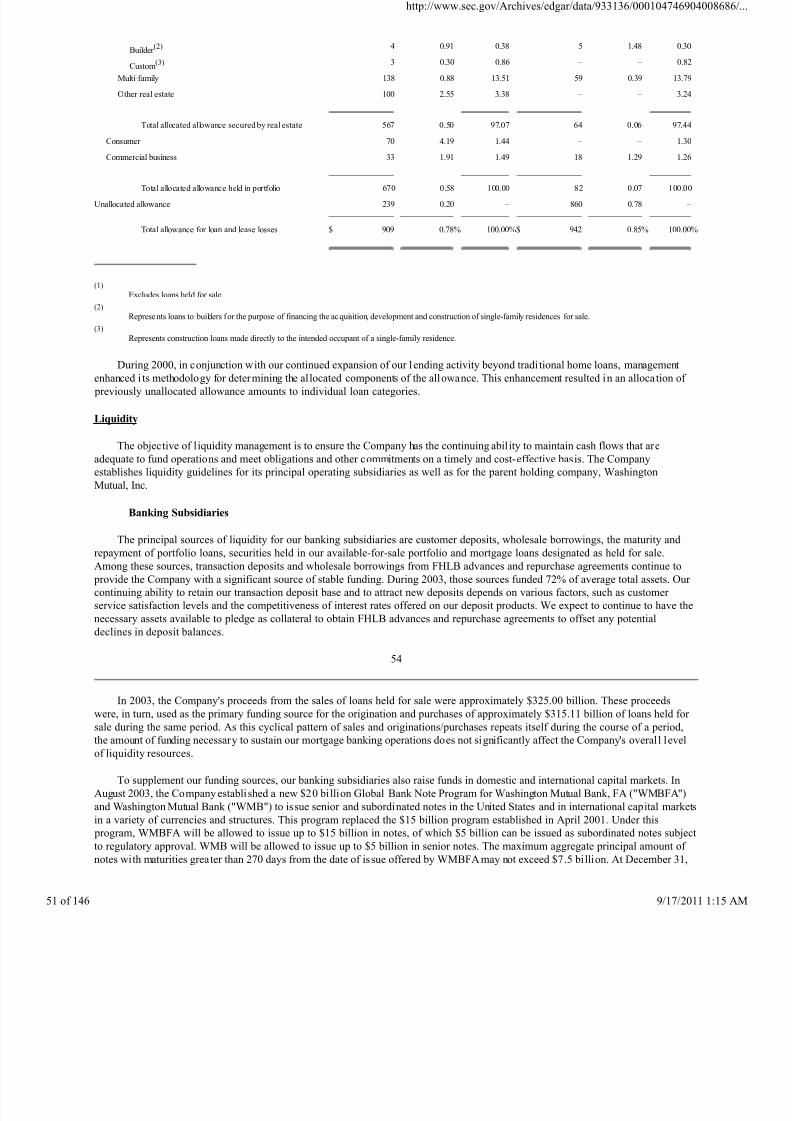
8/4/2019 Wamu 10-k 2003 Subprime
http://slidepdf.com/reader/full/wamu-10-k-2003-subprime 51/146
Builder (2) 4 0.91 0.38 5 1.48 0.30
Custom(3) 3 0.30 0.86 – – 0.82
Multi-family 138 0.88 13.51 59 0.39 13.79
Other real estate 100 2.55 3.38 – – 3.24
Total allocated allowance secured by real estate 567 0.50 97.07 64 0.06 97.44
Consumer 70 4.19 1.44 – – 1.30
Commercial business 33 1.91 1.49 18 1.29 1.26
Total allocated allowance held in portfolio 670 0.58 100.00 82 0.07 100.00
Unallocated allowance 239 0.20 – 860 0.78 –
Total allowance for loan and lease losses $ 909 0.78% 100.00%$ 942 0.85% 100.00%
(1)
Excludes loans held for sale.
(2)
Represents loans to builders for the purpose of financing the acquisition, development and construction of single-family residences for sale.
(3)
Represents construction loans made directly to the intended occupant of a single-family residence.
During 2000, in conjunction with our continued expansion of our l ending activity beyond tradi tional home loans, management
enhanced i ts methodology for determining the allocated components of the allowance. This enhancement resulted in an allocation of
previously unallocated allowance amounts to individual loan categories.
Liquidity
The objective of liquidity management is to ensure the Company has the continuing ability to maintain cash flows that are
adequate to fund operations and meet obligations and other commitments on a timely and cost-effective basis. The Company
establishes liquidity guidelines for its principal operating subsidiaries as well as for the parent holding company, Washington
Mutual, Inc.
Banking Subsidiaries
The principal sources of liquidity for our banking subsidiaries are customer deposits, wholesale borrowings, the maturity and
repayment of portfolio loans, securities held in our available-for-sale portfolio and mortgage loans designated as held for sale.
Among these sources, transaction deposits and wholesale borrowings from FHLB advances and repurchase agreements continue to
provide the Company with a significant source of stable funding. During 2003, those sources funded 72% of average total assets. Our
continuing ability to retain our transaction deposit base and to attract new deposits depends on various factors, such as customer
service satisfaction levels and the competitiveness of interest rates offered on our deposit products. We expect to continue to have the
necessary assets available to pledge as collateral to obtain FHLB advances and repurchase agreements to offset any potential
declines in deposit balances.
54
In 2003, the Company's proceeds from the sales of loans held for sale were approximately $325.00 billion. These proceedswere, in turn, used as the primary funding source for the origination and purchases of approximately $315.11 billion of loans held for
sale during the same period. As this cyclical pattern of sales and originations/purchases repeats itself during the course of a period,
the amount of funding necessary to sustain our mortgage banking operations does not significantly affect the Company's overal l level
of liquidity resources.
To supplement our funding sources, our banking subsidiaries also raise funds in domestic and international capital markets. In
August 2003, the Company established a new $20 billion Global Bank Note Program for Washington Mutual Bank, FA ("WMBFA")
and Washington Mutual Bank ("WMB") to issue senior and subordinated notes in the United States and in international capital markets
in a variety of currencies and structures. This program replaced the $15 billion program established in April 2001. Under this
program, WMBFA will be allowed to issue up to $15 billion in notes, of which $5 billion can be issued as subordinated notes subject
to regulatory approval. WMB will be allowed to issue up to $5 billion in senior notes. The maximum aggregate principal amount of
notes with maturities greater than 270 days from the date of issue offered by WMBFA may not exceed $7.5 billion. At December 31,
http://www.sec.gov/Archives/edgar/data/933136/000104746904
146 9/17/2011
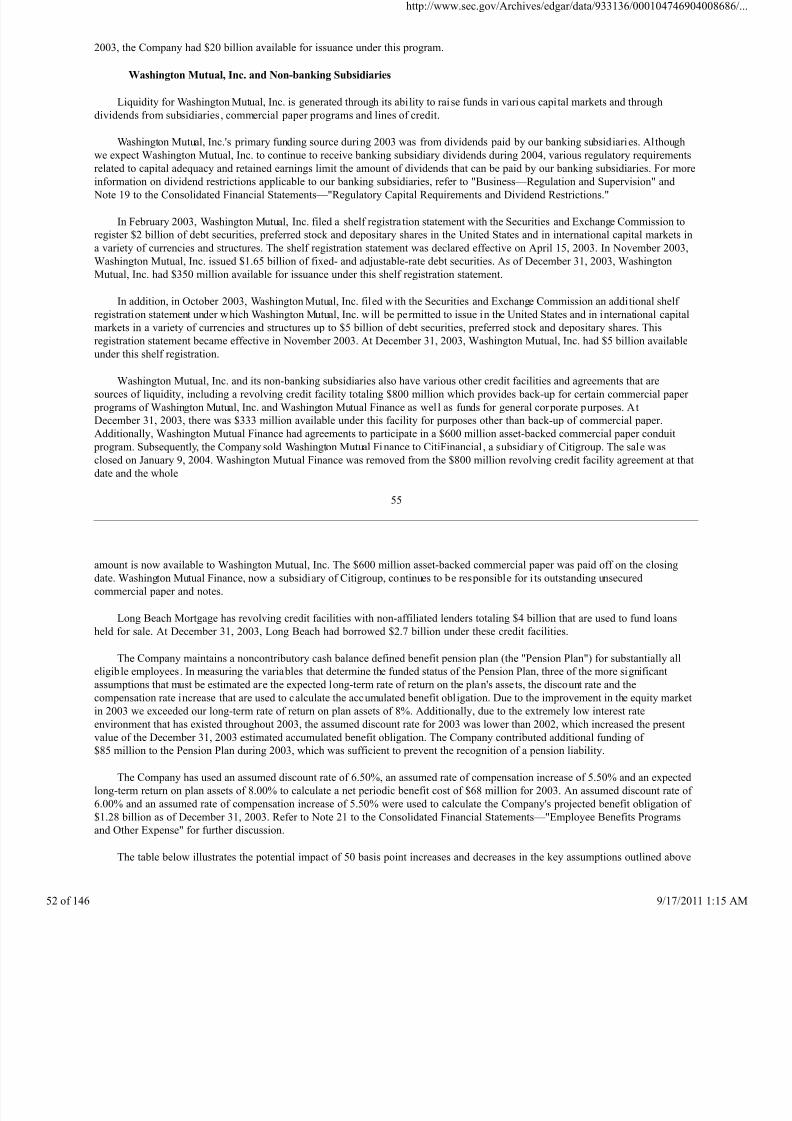
8/4/2019 Wamu 10-k 2003 Subprime
http://slidepdf.com/reader/full/wamu-10-k-2003-subprime 52/146
2003, the Company had $20 billion available for issuance under this program.
Washington Mutual, Inc. and Non-banking Subsidiaries
Liquidity for Washington Mutual, Inc. is generated through its ability to raise funds in various capital markets and through
dividends from subsidiaries , commercial paper programs and lines of credit.
Washington Mutual, Inc.'s primary funding source during 2003 was from dividends paid by our banking subsidiaries. Although
we expect Washington Mutual, Inc. to continue to receive banking subsidiary dividends during 2004, various regulatory requirements
related to capital adequacy and retained earnings limit the amount of dividends that can be paid by our banking subsidiaries. For more
information on dividend restrictions applicable to our banking subsidiaries, refer to "Business—Regulation and Supervision" and
Note 19 to the Consolidated Financial Statements—"Regulatory Capital Requirements and Dividend Restrictions."
In February 2003, Washington Mutual, Inc. filed a shelf registration statement with the Securities and Exchange Commission to
register $2 billion of debt securities, preferred stock and depositary shares in the United States and in international capital markets in
a variety of currencies and structures. The shelf registration statement was declared effective on April 15, 2003. In November 2003,
Washington Mutual, Inc. issued $1.65 billion of fixed- and adjustable-rate debt securities. As of December 31, 2003, Washington
Mutual, Inc. had $350 million available for issuance under this shelf registration statement.
In addition, in October 2003, Washington Mutual, Inc. filed with the Securities and Exchange Commission an additional shelf
registration statement under which Washington Mutual, Inc. will be permitted to issue in the United States and in international capital
markets in a variety of currencies and structures up to $5 billion of debt securities, preferred stock and depositary shares. This
registration statement became effective in November 2003. At December 31, 2003, Washington Mutual, Inc. had $5 billion available
under this shelf registration.
Washington Mutual, Inc. and its non-banking subsidiaries also have various other credit facilities and agreements that are
sources of liquidity, including a revolving credit facility totaling $800 million which provides back-up for certain commercial paper
programs of Washington Mutual, Inc. and Washington Mutual Finance as well as funds for general corporate purposes. At
December 31, 2003, there was $333 million available under this facility for purposes other than back-up of commercial paper.
Additionally, Washington Mutual Finance had agreements to participate in a $600 million asset-backed commercial paper conduit
program. Subsequently, the Company sold Washington Mutual Finance to CitiFinancial , a subsidiary of Citigroup. The sale was
closed on January 9, 2004. Washington Mutual Finance was removed from the $800 million revolving credit facility agreement at that
date and the whole
55
amount is now available to Washington Mutual, Inc. The $600 million asset-backed commercial paper was paid off on the closing
date. Washington Mutual Finance, now a subsidiary of Citigroup, continues to be responsible for i ts outstanding unsecured
commercial paper and notes.
Long Beach Mortgage has revolving credit facilities with non-affiliated lenders totaling $4 billion that are used to fund loans
held for sale. At December 31, 2003, Long Beach had borrowed $2.7 billion under these credit facilities.
The Company maintains a noncontributory cash balance defined benefit pension plan (the "Pension Plan") for substantially all
eligible employees. In measuring the variables that determine the funded status of the Pension Plan, three of the more significant
assumptions that must be estimated are the expected long-term rate of return on the plan's assets, the discount rate and the
compensation rate increase that are used to calculate the accumulated benefit obligation. Due to the improvement in the equity marketin 2003 we exceeded our long-term rate of return on plan assets of 8%. Additionally, due to the extremely low interest rate
environment that has existed throughout 2003, the assumed discount rate for 2003 was lower than 2002, which increased the present
value of the December 31, 2003 estimated accumulated benefit obligation. The Company contributed additional funding of
$85 million to the Pension Plan during 2003, which was sufficient to prevent the recognition of a pension liability.
The Company has used an assumed discount rate of 6.50%, an assumed rate of compensation increase of 5.50% and an expected
long-term return on plan assets of 8.00% to calculate a net periodic benefit cost of $68 million for 2003. An assumed discount rate of
6.00% and an assumed rate of compensation increase of 5.50% were used to calculate the Company's projected benefit obligation of
$1.28 billion as of December 31, 2003. Refer to Note 21 to the Consolidated Financial Statements—"Employee Benefits Programs
and Other Expense" for further discussion.
The table below illustrates the potential impact of 50 basis point increases and decreases in the key assumptions outlined above
http://www.sec.gov/Archives/edgar/data/933136/000104746904
146 9/17/2011
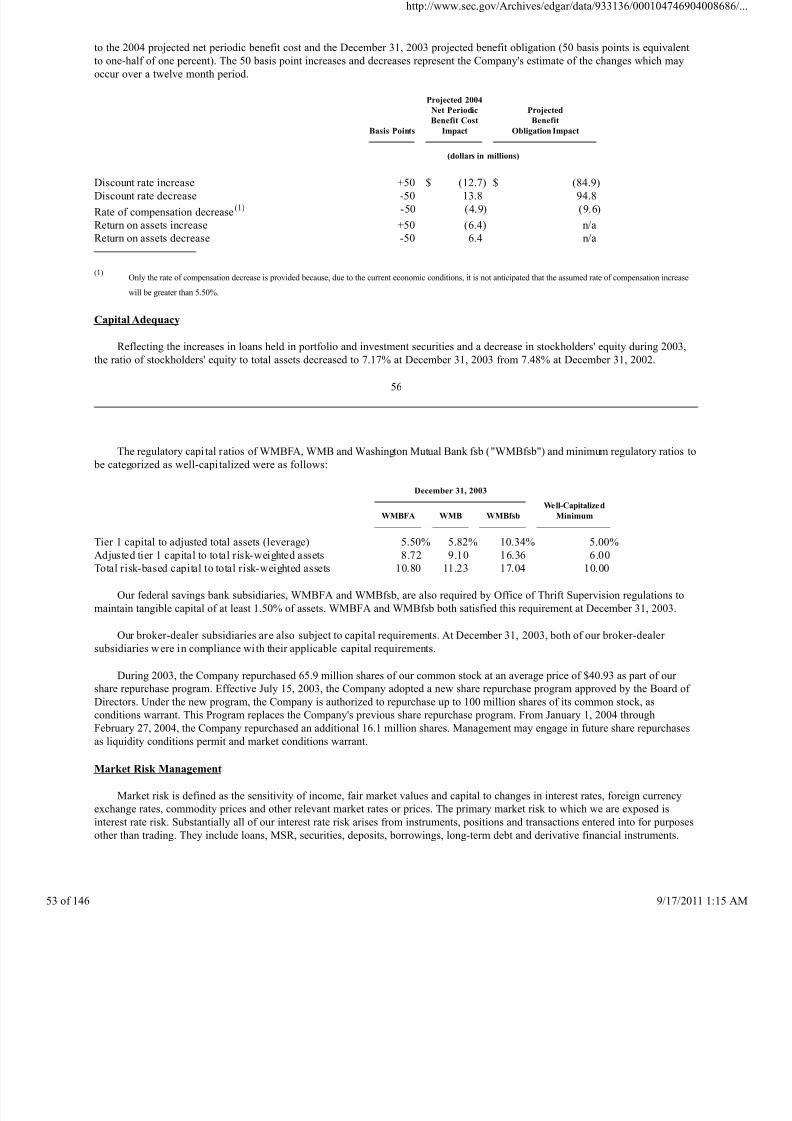
8/4/2019 Wamu 10-k 2003 Subprime
http://slidepdf.com/reader/full/wamu-10-k-2003-subprime 53/146
to the 2004 projected net periodic benefit cost and the December 31, 2003 projected benefit obligation (50 basis points is equivalent
to one-half of one percent). The 50 basis point increases and decreases represent the Company's estimate of the changes which may
occur over a twelve month period.
Basis Points
Projected 2004
Net Periodic
Benefit Cost
Impact
Projected
Benefit
Obligation Impact
(dollars in millions)
Discount rate increase +50 $ (12.7) $ (84.9)
Discount rate decrease -50 13.8 94.8
Rate of compensation decrease(1) -50 (4.9) (9.6)
Return on assets increase +50 (6.4) n/a
Return on assets decrease -50 6.4 n/a
(1)Only the rate of compensation decrease is provided because, due to the current economic conditions, it is not anticipated that the assumed rate of compensation increase
will be greater than 5.50%.
Capital Adequacy
Reflecting the increases in loans held in portfolio and investment securities and a decrease in stockholders' equity during 2003,the ratio of stockholders' equity to total assets decreased to 7.17% at December 31, 2003 from 7.48% at December 31, 2002.
56
The regulatory capi tal ratios of WMBFA, WMB and Washington Mutual Bank fsb ("WMBfsb") and minimum regulatory ratios to
be categorized as well-capi talized were as follows:
December 31, 2003
Well-Capitalized
Minimum
WMBFA
WMB
WMBfsb
Tier 1 capital to adjusted total assets (leverage) 5.50% 5.82% 10.34% 5.00%
Adjusted tier 1 capital to total risk-weighted assets 8.72 9.10 16.36 6.00
Total risk-based capital to total risk-weighted assets 10.80 11.23 17.04 10.00
Our federal savings bank subsidiaries, WMBFA and WMBfsb, are also required by Office of Thrift Supervision regulations to
maintain tangible capital of at least 1.50% of assets. WMBFA and WMBfsb both satisfied this requirement at December 31, 2003.
Our broker-dealer subsidiaries are also subject to capital requirements. At December 31, 2003, both of our broker-dealer
subsidiaries were in compliance with their applicable capital requirements.
During 2003, the Company repurchased 65.9 million shares of our common stock at an average price of $40.93 as part of our
share repurchase program. Effective July 15, 2003, the Company adopted a new share repurchase program approved by the Board of
Directors. Under the new program, the Company is authorized to repurchase up to 100 million shares of its common stock, asconditions warrant. This Program replaces the Company's previous share repurchase program. From January 1, 2004 through
February 27, 2004, the Company repurchased an additional 16.1 million shares. Management may engage in future share repurchases
as liquidity conditions permit and market conditions warrant.
Market Risk Management
Market risk is defined as the sensitivity of income, fair market values and capital to changes in interest rates, foreign currency
exchange rates, commodity prices and other relevant market rates or prices. The primary market risk to which we are exposed is
interest rate risk. Substantially all of our interest rate risk arises from instruments, positions and transactions entered into for purposes
other than trading. They include loans, MSR, securities, deposits, borrowings, long-term debt and derivative financial instruments.
http://www.sec.gov/Archives/edgar/data/933136/000104746904
146 9/17/2011
8/4/2019 Wamu 10-k 2003 Subprime
http://slidepdf.com/reader/full/wamu-10-k-2003-subprime 54/146
We manage interest rate risk within a consolidated enterprise risk management framework that includes an assessment of interest
rate risk within our Asset/Liability Management process, which includes the measurement and management of specific portfolios
(MSR and Other Mortgage Banking) discussed below. The principal objective of asset/liability management is to manage the
sensitivity of net income to changing interest rates. Asset/liability management is governed by a policy reviewed and approved
annually by our Board. The Board has delegated the oversight of the administration of this policy to the Finance Committee.
Overview of Interest Rate Risk
Increases or decreases in interest rates can cause changes in net income, fluctuations in the fair value of assets and liabilities,
such as MSR, investment securities and derivatives, and changes in noninterest income and noninterest expense, particularly gain
from mortgage loans, loan servicing fees and the amortization of MSR. Our interest rate risk arises because assets and liabilities
reprice, mature, prepay or decay at different times or in accordance with different indices as market interest rates change.
Types of Interest Rate Risk
We are exposed to different types of interest rate risks. These include lag, repricing, basis, prepayment, lifetime cap and
volatility risk.
57
Lag/Repricing Risk
Lag risk results from the inherent timing difference between the repricing of adjustable-rate assets and liabilities. Repricing risk
is caused by the mismatch in the maturities between assets and liabilities. For example, if our assets reprice slower than our
liabilities, the effect of this timing difference, or "lag," will be favorable during a period of declining interest rates and unfavorable
during a period of rising interest rates. Lag/repricing risk can produce short-term volatility in net interest income during periods of
interest rate movements even though the effect of this lag generally balances out over time.
Basis Risk
Basis risk occurs when assets and liabilities have similar repricing frequencies but are tied to different market interest rate
indices.
Prepayment Risk
Prepayment risk results from the ability of customers to pay off their loans prior to maturity. Generally, prepayments increase in
falling interest rate environments and decrease in rising interest rate environments.
Lifetime Cap Risk
The lifetime interest rate caps on adjustable-rate loans limits, or "caps," the interest rate at a contractually determined level. In
periods of dramatically rising rates, adjustable-rate loans that have reached l ifetime caps will no longer reprice upward.
Volatili ty Risk
Volatil ity risk is the change to the fair value of an option, or a fixed income instrument containing options (such as mortgages)
from changes in the implied market level of future volatility ("implied volatility"). Implied volatility is a key determinant of option
value with higher volatility generally increasing option value and lower volatility generally decreasing option value. Mortgage loans
generally contain embedded written options so increases in volatility generally decreases their value and decreases in volatility
generally increases their value.
MSR Risk Management
We manage potential impairment in the fair value of MSR and increased amortization levels of MSR through a comprehensive
risk management program. Our intent is to offset the changes in fair value and amortization levels of MSR with changes in the fair
value of risk management instruments. The risk management instruments include interest rate contracts, forward purchase
commitments and available-for-sale securities.
The available-for-sale securities generally consist of fixed-rate debt securities, such as U.S. Government and agency obligations
and mortgage-backed securities, including principal-only strips. The interest rate contracts typically consist of interest rate swaps,
http://www.sec.gov/Archives/edgar/data/933136/000104746904
146 9/17/2011
8/4/2019 Wamu 10-k 2003 Subprime
http://slidepdf.com/reader/full/wamu-10-k-2003-subprime 55/146
interest rate swaptions, interest rate floors and forward commitments to purchase mortgage-backed securities. These forward
purchase commitments generally consist of agreements to purchase 15- and 30-year fixed-rate mortgage-backed securities. From time
to time, we may choose to embed interest rate contracts into our borrowing instruments, such as repurchase agreements.
As derivatives, the interest rate swaps, interest rate swaptions, stand alone interest rate floors and forward commitments are
marked-to-market through earnings. Changes in the fair value of MSR risk management instruments are recorded as components of
noninterest income.
58
We measure on a daily basis the fair value and risk profile of the MSR and, when appropriate, adjust on a daily basis the
instruments we use to manage MSR fair value changes. The fair value of MSR is primarily affected by changes in prepayments that
result from shifts in mortgage rates. Changes in the behavior of how MSR risk management instruments respond to changes in interest
rates vary based on the specific instrument. The difference in market indices between the MSR and the risk management instruments
results in basis risk. For example, changes in the fair value of interest rate swaps are driven by shifts in interest rate swap rates while
the fair value of U.S. Treasury bonds is based on changes in U.S. Treasury rates. Mortgage rates may move more or less than the rates
on Treasury bonds or interest rate swaps. This could result in a change in the fair value of the MSR that differs from the change in fair
value of the MSR risk management instruments.
Additionally, changes in long-term rates impact the fair value and the amortization rate of MSR. The fair value of MSR
decreases and the amortization rate increases in a declining long-term interest rate environment due to the higher prepayment activity,resulting in the potential for impairment and a reduction in net loan servicing income. During periods of rising long-term interest
rates, the amortization rate of MSR decreases and the fair value of MSR increases, resulting in the potential recovery of the MSR
valuation allowance and an increase in net loan servicing income. The timing and amount of any potential MSR recovery cannot be
predicted with absolute precision because of its dependency on the timing and magnitude of future interest rate increases and the
amount of the valuation allowance within each interest rate strata of our loans serviced for others portfolio at the time of the increase.
We manage the MSR dai ly against our risk tolerance l imits and adjust the mix of instruments used to manage MSR fair value
changes as interest rates and market conditions warrant. The objective is to maintain an efficient and fairly liquid mix as well as a
diverse portfolio of risk management instruments with maturity ranges that correspond well to the anticipated behavior of the MSR.
The mix of instruments we use to manage MSR fair value changes is predicated, in part, on the requirement that we account for MSR
at the lower of cost or market value, whereby each interest rate stratum within our servicing portfolio is recorded at the lower of its
aggregate fair value or its aggregate amortized cost. This could have resulted in increases in the fair value of MSR that are not
marked-to-market through earnings. The Company is poised to apply fair value hedge accounting treatment, as prescribed byStatement No. 133, to a significant portion of its mortgage servicing assets. For that portion which qualifies for hedge accounting
treatment, all changes in fair value to the MSR, including situations when the fair value is higher than amortized cost, will be
recorded through earnings. We believe this overall risk management strategy is the most efficient approach to managing MSR fair
value risk.
We also manage the size and risk profile of the MSR asset. Depending on market conditions and our desire to expand customer
relationships, we may periodically sell or purchase additional servicing. We also may structure loan sales to control the size of the
MSR asset. Our net income could be adversely affected if we are unable to effectively implement, execute or manage this strategy.
Other Mortgage Banking Risk Management
We also manage the risks associated with our mortgage warehouse and pipeline. The mortgage warehouse consists of funded
loans, which are primarily fixed-rate home mortgages to be sold in the secondary market. The pipeline consists of commitments tooriginate or purchase fixed-rate and, to a lesser degree, adjustable-rate home loans to be sold in the secondary market. The risk
associated with the mortgage pipeline and warehouse is the potential change in interest rates between the time the customer locks in
the rate on the loan and the time the loan is sold. Generally, loans in the mortgage warehouse are sold within 60 to 120 days after the
initial recognition of the rate lock commitment.
We measure the risk profile of the mortgage warehouse and pipeline daily against our established risk tolerance limits. As
needed to manage the warehouse and pipeline risk, we execute forward sales commitments, interest rate contracts, mortgage option
contracts and interest rate futures. A forward sales
59
http://www.sec.gov/Archives/edgar/data/933136/000104746904
146 9/17/2011
8/4/2019 Wamu 10-k 2003 Subprime
http://slidepdf.com/reader/full/wamu-10-k-2003-subprime 56/146
commitment protects us in a rising interest rate environment, since the sales price and delivery date are already established. A
forward sales commitment is different, however, from an option contract in that we are obligated to deliver the loan to the third party
on the agreed-upon future date. We also estimate the fallout factor, which represents the percentage of loans that are not expected to
be funded, when determining the appropriate amount of our pipeline and warehouse risk management instruments.
Asset/Liability Risk Management
The asset/liability risk management process oversees the aggregate risk profile of the consolidated Company. Asset/liability risk
analysis combines the MSR and Other Mortgage Banking activities with substantially all the other remaining interest rate risk
positions inherent in the Company's operations.
To analyze net income sensitivity, we project net income over a twelve month horizon based on parallel shifts in the yield curve.
Management also employs other analyses and interest rate scenarios to evaluate interest rate risk. For example, we project net income
and net interest income under a variety of interest rate scenarios, including non-parallel shifts in the yield curve and more extreme
non-parallel rising and falling rate environments. These scenarios also capture the net income and net interest income sensitivity due
to changes in the slope of the yield curve and changes in the spread between Treasury and LIBOR rates. Additionally, management
measures the sensitivity of asset and liability fair value changes to changes in interest rates to analyze risk exposure over longer
periods of time.
The projection of the sensitivity of net income requires numerous behavioral assumptions. Prepayment, decay rate (the estimated
runoff of deposit accounts that do not have a stated maturity) and loan and deposit volume and mix projections are the most significant
assumptions. Prepayments affect the size of the balance sheet, which impacts net interest income, and is also a major factor in the
valuation of MSR. The decay rate assumptions also impact net interest income by altering the expected deposit mix and rates in
various interest rate environments. The prepayment and decay rate assumptions reflect management's best estimate of future behavior.These assumptions are derived from internal and external analysis of customer behavior.
The sensitivity of new loan volume and mix to changes in market interest rate levels is also projected. Generally, we assume
loan production increases in falling interest rate scenarios with an increased proportion of salable fixed-rate production. We
generally assume a reduction in total loan production in rising interest rate scenarios with a shift towards a greater proportion of
adjustable-rate production, which we generally hold in our loan portfolio. The gain from mortgage loans also varies under different
interest rate scenarios. Normally, the gain from mortgage loans increases in falling interest rate environments primarily from high
fixed-rate mortgage refinancing activity. Conversely, the gain from mortgage loans tends to decline when interest rates increase as
salable loan volume declines and loan pricing becomes more competitive.
In addition to gain from mortgage loans, the sensitivity of noninterest income and expense also involves estimates. The
impairment and recovery of MSR is the most significant element of sensitivity in the projection of noninterest income. Management
analyzes MSR on a daily basis and adjusts the risk management instruments based on this daily analysis. The analysis also assumesthat mortgage and interest rate swap spreads remain constant in all interest rate environments. Changes in these spreads could result in
significant changes in projected net income sensitivity.
The other components of noninterest income and expense, such as deposit and loan fees and expenses, generally increase or
decrease in conjunction with depositor and loan volumes. Loan servicing fees and the amortization of MSR are also dependent on
prepayment expectations.
To manage interest rate sensitivity, management first utilizes the interest rate risk characteristics of our balance sheet assets and
liabilities to offset each other as much as possible. Balance sheet products have a variety of risk profiles and sensitivities. Some of
the components of our interest rate risk are countercyclical. We may adjust the amount or mix of risk management instruments based
on the countercyclical behavior of our balance sheet products.
60
The slope of the yield curve, current interest rate conditions and the speed of changes in interest rates affect our sensitivity to
changes in interest rates. Our deposits and borrowings typically reprice faster than our mortgage loans and securities. In addition, a
lag effect is inherent in our adjustable-rate loans and mortgage-backed securities indexed to the 12-month average of the annual yields
on actively traded U.S. Treasury securities adjusted to a constant maturity of one year ("MTA") and to the 11th District FHLB monthly
weighted average cost of funds index ("COFI").
In periods of rising interest rates, the net interest margin normally contracts since the repricing period of liabilities is shorter
than the repricing period of assets. Also, in periods of relatively high interest rates the lifetime cap feature on adjustable-rate loan
products may adversely impact net interest income. Typically, the lifetime cap is 300 to 500 basis points above the fully indexed
http://www.sec.gov/Archives/edgar/data/933136/000104746904
146 9/17/2011
8/4/2019 Wamu 10-k 2003 Subprime
http://slidepdf.com/reader/full/wamu-10-k-2003-subprime 57/146
initial rate. The lifetime caps on our existing loan and mortgage-backed security portfolios would not have a material adverse effect
on net interest income unless interest rates increased substantially from current levels. The net interest margin generally expands in
periods of falling interest rates as borrowing costs reprice downward faster than asset yields.
When the countercyclical behavior inherent in portions of our balance sheet composition do not result in an acceptable risk
profile, management utilizes investment securities and interest rate contracts to mitigate this situation. The interest rate contracts used
for this purpose are classified as asset/liability risk management instruments. These contracts are often used to modify the repricing
period of our interest-bearing funding sources with the intention of reducing the volatili ty of changes in net interest income. The types
of contracts used for this purpose consist of interest rate swaps, interest rate corridors, interest rate swaptions and certain derivatives
that are embedded in borrowings. We also use receive-fixed swaps as part of our asset/liability risk management strategy to help us
modify the repricing characteristics of certain long-term liabilities to match those of our assets. Typically, these are swaps of
long-term fixed-rate debt to a short-term adjustable-rate which more closely resembles our asset repricing characteristics.
January 1, 2004 and January 1, 2003 Sensitivity Comparison
The table below indicates the sensitivity of net income and net interest income to interest rate movements. The comparative
scenarios assume a parallel shift in the yield curve with interest rates rising 200 basis points in even quarterly increments over the
twelve month periods ending December 31, 2004 and December 31, 2003 and interest rates decreasing by 50 basis points in even
quarterly increments over the first six months of the twelve month periods. The net income and net interest income simulations
performed for the one year period beginning January 1, 2004 include the effects of securities that were sold during the first quarter of
2004, w hich had the effect of mitigating both sensitivi ty measurements. No other actions were taken after December 31, 2003 that
would materially change the sensitivities shown in the table. The projected net income and net interest income profile may not be
realized and may not be present for non-parallel shifts in the yield curve or changes in the spreads between mortgage, Treasury and
LIBOR rates.
Gradual Change in Rates
-50 basis points
+200 basis
points
Net income change for the one-year period beginning:
January 1, 2004 2.45% (1.96)%
January 1, 2003 5.24 3.98
Net interest income change for the one-year period beginning:
January 1, 2004 3.01 (2.57)
January 1, 2003 2.32 (5.91)
The change in the profile of the MSR and related hedges occurred due to the substantial prepayment activity that occurred
throughout 2003. This prepayment activity caused a significant decline in the weighted average rate paid on the loans underlying the
MSR; which, in turn, significantly altered the risk profile of the MSR (since the rate paid on the underlying loan is a primary driver of
the prepayment risk of
61
the loan). The higher long term rates at year end 2003 compared to year end 2002 additionally affected the risk profile of the MSR.
Net interest income sensitivity changed since year end 2002 mainly due to changes to the assumptions concerning the repricing of our Platinum checking accounts. Net income sensitivity changed primarily due to changes in the profile of the MSR and related hedge
instruments.
Maturity and Repricing Information
We use interest rate risk management contracts and available-for-sale securities as tools to manage our interest rate risk profile.
The following tables summarize the key contractual terms associated with these contracts and available-for-sale securities. Interest
rate risk management contracts that are embedded within certain adjustable- and fixed-rate borrowings, while not accounted for as
derivatives under Statement No. 133, have been included in the tables since they also function as interest rate risk management tools.
Substantially all of the pay-fixed swaps, receive-fixed swaps, payor swaptions, floors and embedded derivatives at December 31,
2003 are indexed to three-month LIBOR.
http://www.sec.gov/Archives/edgar/data/933136/000104746904
146 9/17/2011
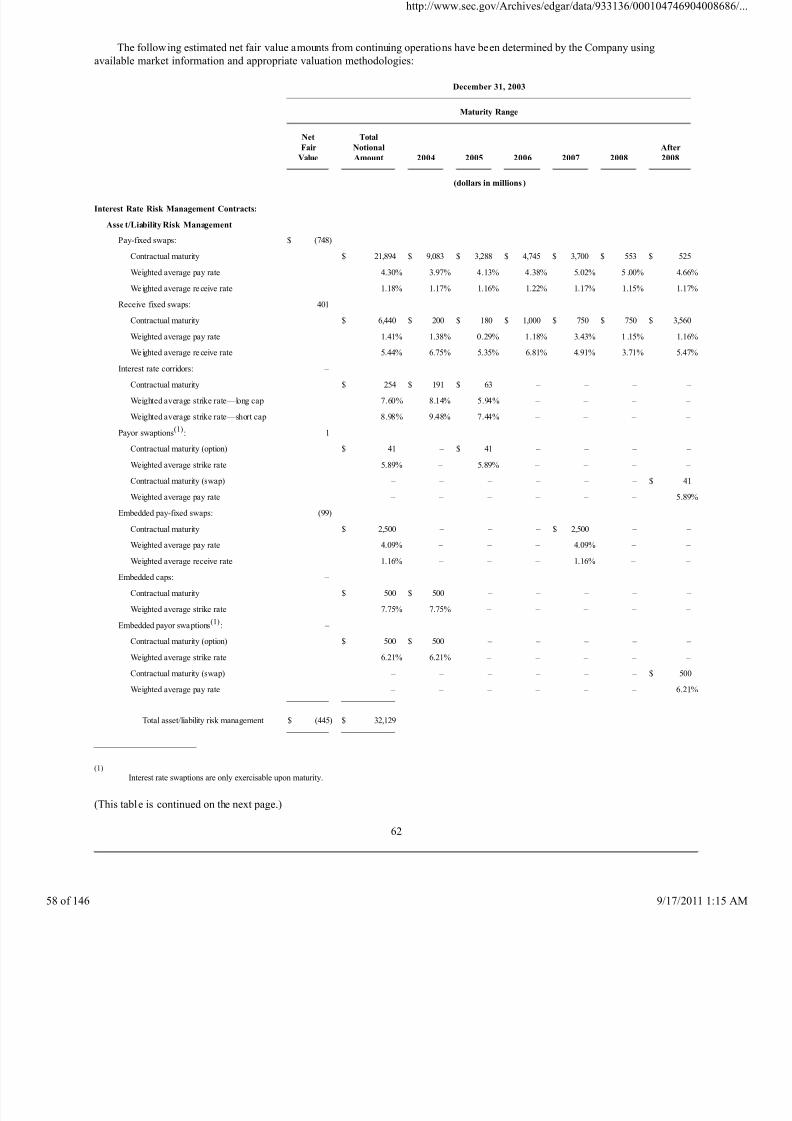
8/4/2019 Wamu 10-k 2003 Subprime
http://slidepdf.com/reader/full/wamu-10-k-2003-subprime 58/146
The following estimated net fair value amounts from continuing operations have been determined by the Company using
available market information and appropriate valuation methodologies:
December 31, 2003
Maturity Range
Net
Fair
Value
Total
Notional
Amount
2004
2005
2006
2007
2008
After
2008
(dollars in millions )
Interest Rate Risk Management Contracts:
Asse t/Liability Risk Management
Pay-fixed swaps: $ (748)
Contractual maturity $ 21,894 $ 9,083 $ 3,288 $ 4,745 $ 3,700 $ 553 $ 525
Weighted average pay rate 4.30% 3.97% 4.13% 4.38% 5.02% 5 .00% 4.66%
We ighted average re ceive rate 1.18% 1.17% 1.16% 1.22% 1.17% 1.15% 1.17%
Receive-fixed swaps: 401
Contractual maturity $ 6,440 $ 200 $ 180 $ 1,000 $ 750 $ 750 $ 3,560
Weighted average pay rate 1.41% 1.38% 0.29% 1.18% 3.43% 1 .15% 1.16%
We ighted average re ceive rate 5.44% 6.75% 5.35% 6.81% 4.91% 3.71% 5.47%
Interest rate corridors: –
Contractual maturity $ 254 $ 191 $ 63 – – – –
Weighted average strike rate—long cap 7.60% 8.14% 5.94% – – – –
Weighted average strike rate—short cap 8.98% 9.48% 7.44% – – – –
Payor swaptions(1)
: 1
Contractual maturity (option) $ 41 – $ 41 – – – –
Weighted average strike rate 5.89% – 5.89% – – – –
Contractual maturity (swap) – – – – – – $ 41
Weighted average pay rate – – – – – – 5.89%
Embedded pay-fixed swaps: (99)
Contractual maturity $ 2,500 – – – $ 2,500 – –
Weighted average pay rate 4.09% – – – 4.09% – –
Weighted average receive rate 1.16% – – – 1.16% – –
Embedded caps: –
Contractual maturity $ 500 $ 500 – – – – –
Weighted average strike rate 7.75% 7.75% – – – – –
Embedded payor swaptions(1)
: –
Contractual maturity (option) $ 500 $ 500 – – – – –
Weighted average strike rate 6.21% 6.21% – – – – –
Contractual maturity (swap) – – – – – – $ 500
Weighted average pay rate – – – – – – 6.21%
Total asset/liability risk management $ (445) $ 32,129
(1)
Interest rate swaptions are only exercisable upon maturity.
(This table is continued on the next page.)
62
http://www.sec.gov/Archives/edgar/data/933136/000104746904
146 9/17/2011
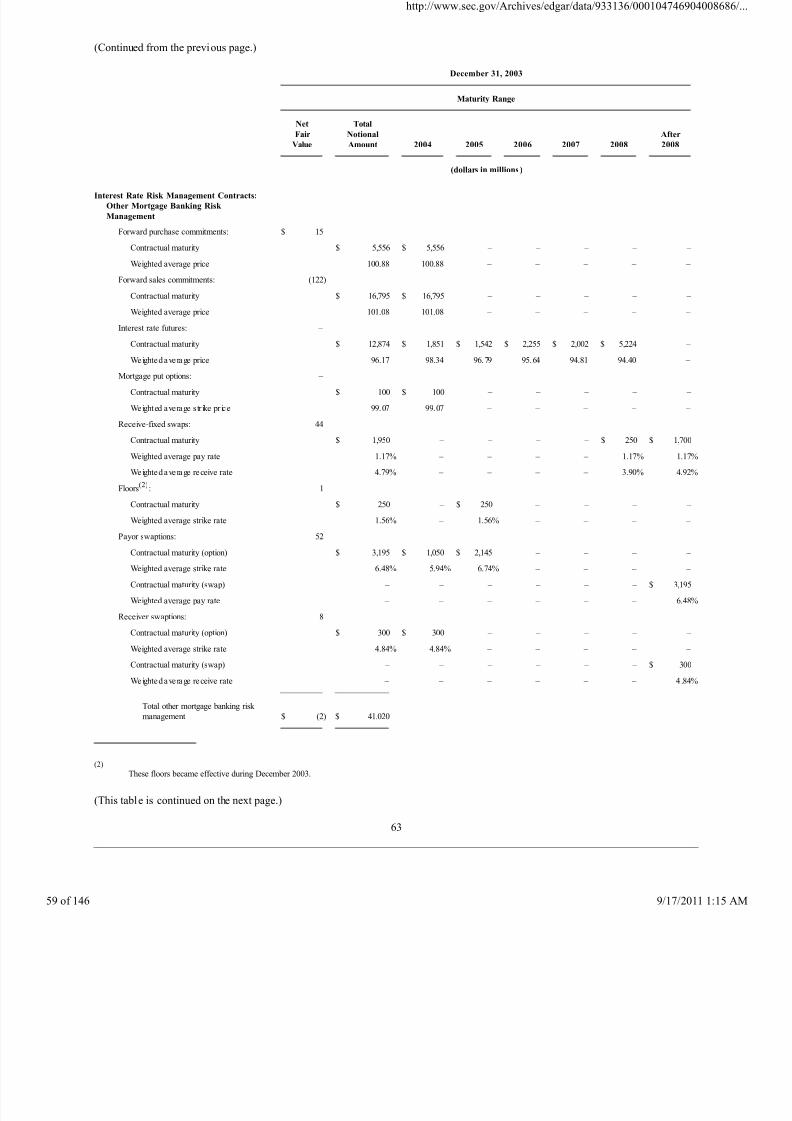
8/4/2019 Wamu 10-k 2003 Subprime
http://slidepdf.com/reader/full/wamu-10-k-2003-subprime 59/146
(Continued from the previous page.)
December 31, 2003
Maturity Range
Net
Fair
Value
Total
Notional
Amount
2004
2005
2006
2007
2008
After
2008
(dollars in millions)
Interest Rate Risk Management Contracts:
Other Mortgage Banking Risk
Management
Forward purchase commitments: $ 15
Contractual maturity $ 5,556 $ 5,556 – – – – –
Weighted average price 100.88 100.88 – – – – –
Forward sales commitments: (122)
Contractual maturity $ 16,795 $ 16,795 – – – – –
Weighted average price 101.08 101.08 – – – – –
Interest rate futures: –
Contractual maturity $ 12,874 $ 1,851 $ 1,542 $ 2,255 $ 2,002 $ 5,224 –
Weighted average price 96.17 98.34 96.79 95.64 94.81 94.40 –
Mortgage put options: –
Contractual maturity $ 100 $ 100 – – – – –
Weighted average str ike pr ice 99.07 99.07 – – – – –
Receive-fixed swaps: 44
Contractual maturity $ 1,950 – – – – $ 250 $ 1,700
Weighted average pay rate 1.17% – – – – 1.17% 1.17%
Weighted average receive rate 4.79% – – – – 3.90% 4.92%
Floors(2)
: 1
Contractual maturity $ 250 – $ 250 – – – –
Weighted average strike rate 1.56% – 1.56% – – – –
Payor swaptions: 52
Contractual maturity (option) $ 3,195 $ 1,050 $ 2,145 – – – –
Weighted average strike rate 6.48% 5.94% 6.74% – – – –
Contractual maturity (swap) – – – – – – $ 3,195
Weighted average pay rate – – – – – – 6.48%
Receiver swaptions: 8
Contractual maturity (option) $ 300 $ 300 – – – – –
Weighted average strike rate 4.84% 4.84% – – – – –
Contractual maturity (swap) – – – – – – $ 300
Weighted average receive rate – – – – – – 4 .84%
Total other mortgage banking risk
management $ (2) $ 41,020
(2)
These floors became effective during December 2003.
(This table is continued on the next page.)
63
http://www.sec.gov/Archives/edgar/data/933136/000104746904
146 9/17/2011
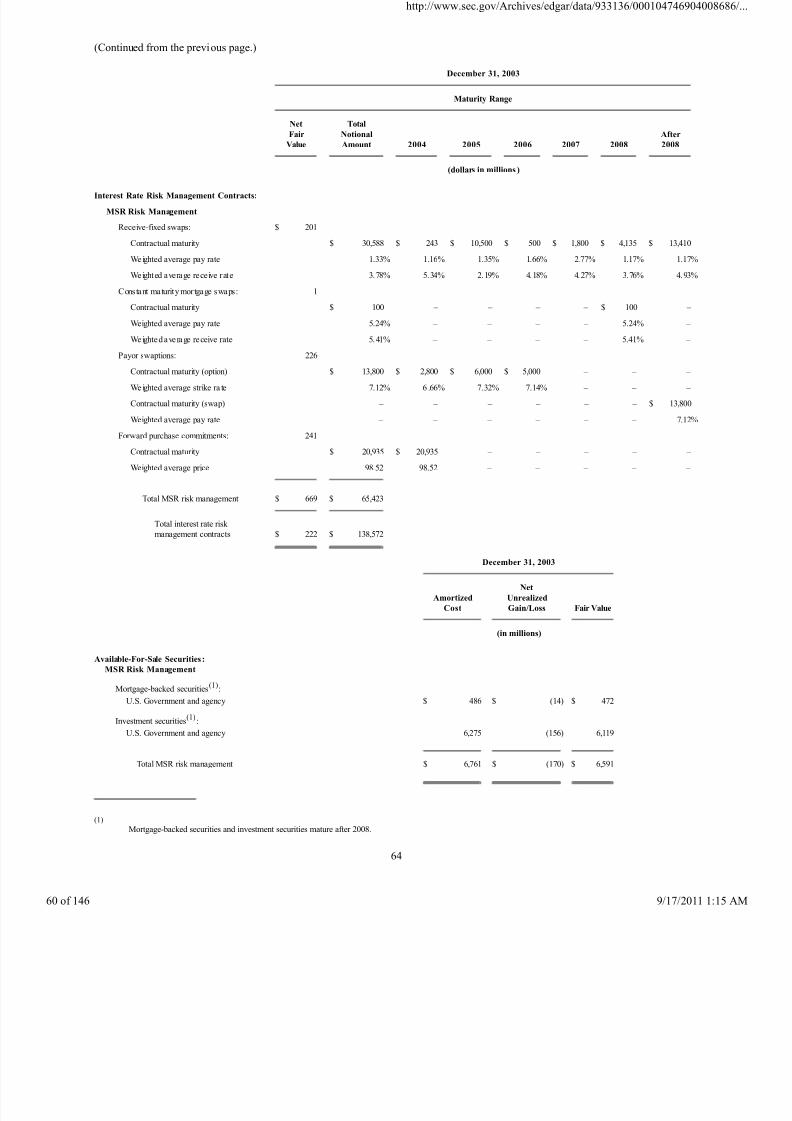
8/4/2019 Wamu 10-k 2003 Subprime
http://slidepdf.com/reader/full/wamu-10-k-2003-subprime 60/146
(Continued from the previous page.)
December 31, 2003
Maturity Range
Net
Fair
Value
Total
Notional
Amount
2004
2005
2006
2007
2008
After
2008
(dollars in millions )
Interest Rate Risk Management Contracts:
MSR Risk Management
Receive-fixed swaps: $ 201
Contractual maturity $ 30,588 $ 243 $ 10,500 $ 500 $ 1,800 $ 4,135 $ 13,410
We ighted average pay rate 1.33% 1.16% 1.35% 1.66% 2.77% 1.17% 1.17%
Weighted average receive rate 3.78% 5.34% 2.19% 4.18% 4.27% 3.76% 4.93%
Constant maturity mortgage swaps: 1
Contractual maturity $ 100 – – – – $ 100 –
Weighted average pay rate 5.24% – – – – 5.24% –
Weighted average receive rate 5.41% – – – – 5.41% –
Payor swaptions: 226
Contractual maturity (option) $ 13,800 $ 2,800 $ 6,000 $ 5,000 – – –
We ighted average strike ra te 7.12% 6 .66% 7.32% 7.14% – – –
Contractual maturity (swap) – – – – – – $ 13,800
Weighted average pay rate – – – – – – 7.12%
Forward purchase commitments: 241
Contractual maturity $ 20,935 $ 20,935 – – – – –
Weighted average price 98.52 98.52 – – – – –
Total MSR risk management $ 669 $ 65,423
Total interest rate risk management contracts $ 222 $ 138,572
December 31, 2003
Amortized
Cost
Net
Unrealized
Gain/Loss
Fair Value
(in millions)
Available-For-Sale Securities :
MSR Risk Management
Mortgage-backed securities(1)
:
U.S. Government and agency $ 486 $ (14) $ 472
Investment securities(1)
:
U.S. Government and agency 6,275 (156) 6,119
Total MSR risk management $ 6,761 $ (170) $ 6,591
(1)
Mortgage-backed securities and investment securities mature after 2008.
64
http://www.sec.gov/Archives/edgar/data/933136/000104746904
146 9/17/2011
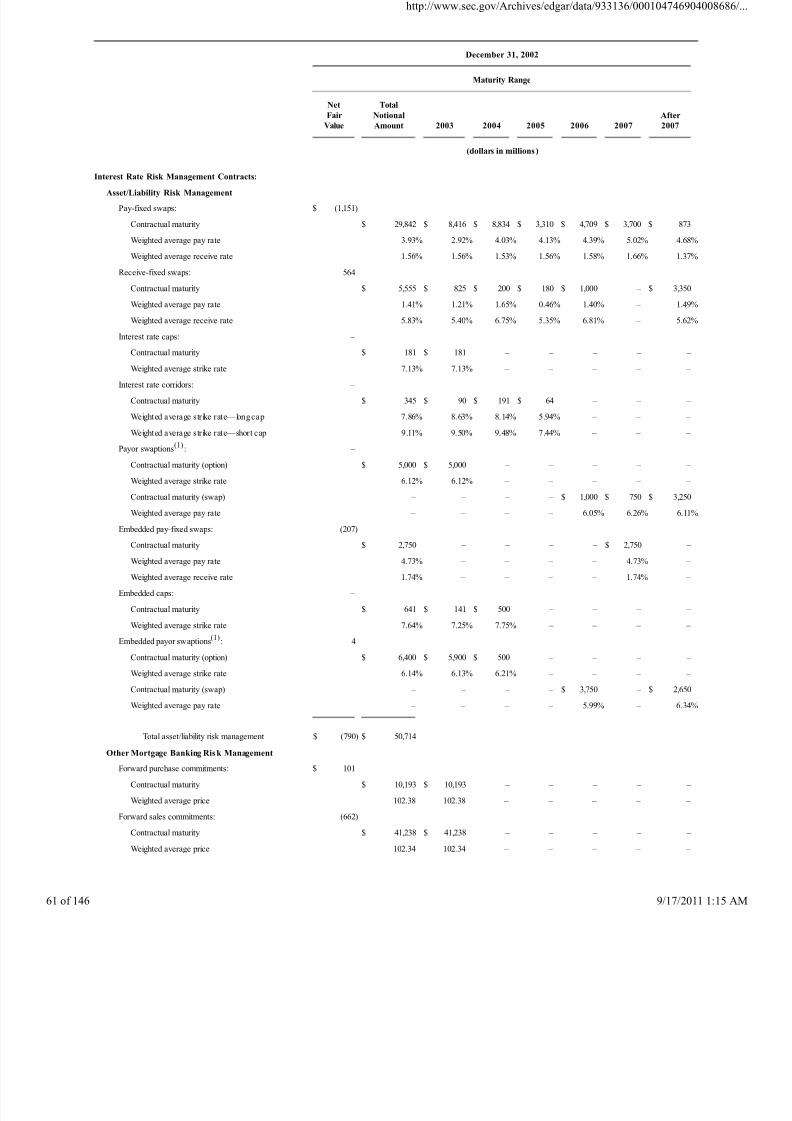
8/4/2019 Wamu 10-k 2003 Subprime
http://slidepdf.com/reader/full/wamu-10-k-2003-subprime 61/146
December 31, 2002
Maturity Range
Net
Fair
Value
Total
Notional
Amount
2003
2004
2005
2006
2007
After
2007
(dollars in millions)
Interest Rate Risk Management Contracts:
Asset/Liability Risk Management
Pay-fixed swaps: $ (1,151)
Contractual maturity $ 29,842 $ 8,416 $ 8,834 $ 3,310 $ 4,709 $ 3,700 $ 873
Weighted average pay rate 3.93% 2.92% 4.03% 4.13% 4.39% 5.02% 4.68%
Weighted average receive rate 1.56% 1.56% 1.53% 1.56% 1.58% 1.66% 1.37%
Receive-fixed swaps: 564
Contractual maturity $ 5,555 $ 825 $ 200 $ 180 $ 1,000 – $ 3,350
Weighted average pay rate 1.41% 1.21% 1.65% 0.46% 1.40% – 1.49%
Weighted average receive rate 5.83% 5.40% 6.75% 5.35% 6.81% – 5.62%
Interest rate caps: –
Contractual maturity $ 181 $ 181 – – – – –
Weighted average strike rate 7.13% 7.13% – – – – –
Interest rate corridors: –
Contractual maturity $ 345 $ 90 $ 191 $ 64 – – –
Weighted average strike rate—long cap 7.86% 8.63% 8.14% 5.94% – – –
Weighted average strike rate—short cap 9.11% 9.50% 9.48% 7.44% – – –
Payor swaptions(1)
: –
Contractual maturity (option) $ 5,000 $ 5,000 – – – – –
Weighted average strike rate 6.12% 6.12% – – – – –
Contractual maturity (swap) – – – – $ 1,000 $ 750 $ 3,250
Weighted average pay rate – – – – 6.05% 6.26% 6.11%
Embedded pay-fixed swaps: (207)
Contractual maturity $ 2,750 – – – – $ 2,750 –
Weighted average pay rate 4.73% – – – – 4.73% –
Weighted average receive rate 1.74% – – – – 1.74% –
Embedded caps: –
Contractual maturity $ 641 $ 141 $ 500 – – – –
Weighted average strike rate 7.64% 7.25% 7.75% – – – –
Embedded payor swaptions(1)
: 4
Contractual maturity (option) $ 6,400 $ 5,900 $ 500 – – – –
Weighted average strike rate 6.14% 6.13% 6.21% – – – –
Contractual maturity (swap) – – – – $ 3,750 – $ 2,650
Weighted average pay rate – – – – 5.99% – 6.34%
Total asset/liability risk management $ (790) $ 50,714
Other Mortgage Banking Ris k Management
Forward purchase commitments: $ 101
Contractual maturity $ 10,193 $ 10,193 – – – – –
Weighted average price 102.38 102.38 – – – – –
Forward sales commitments: (662)
Contractual maturity $ 41,238 $ 41,238 – – – – –
Weighted average price 102.34 102.34 – – – – –
http://www.sec.gov/Archives/edgar/data/933136/000104746904
146 9/17/2011
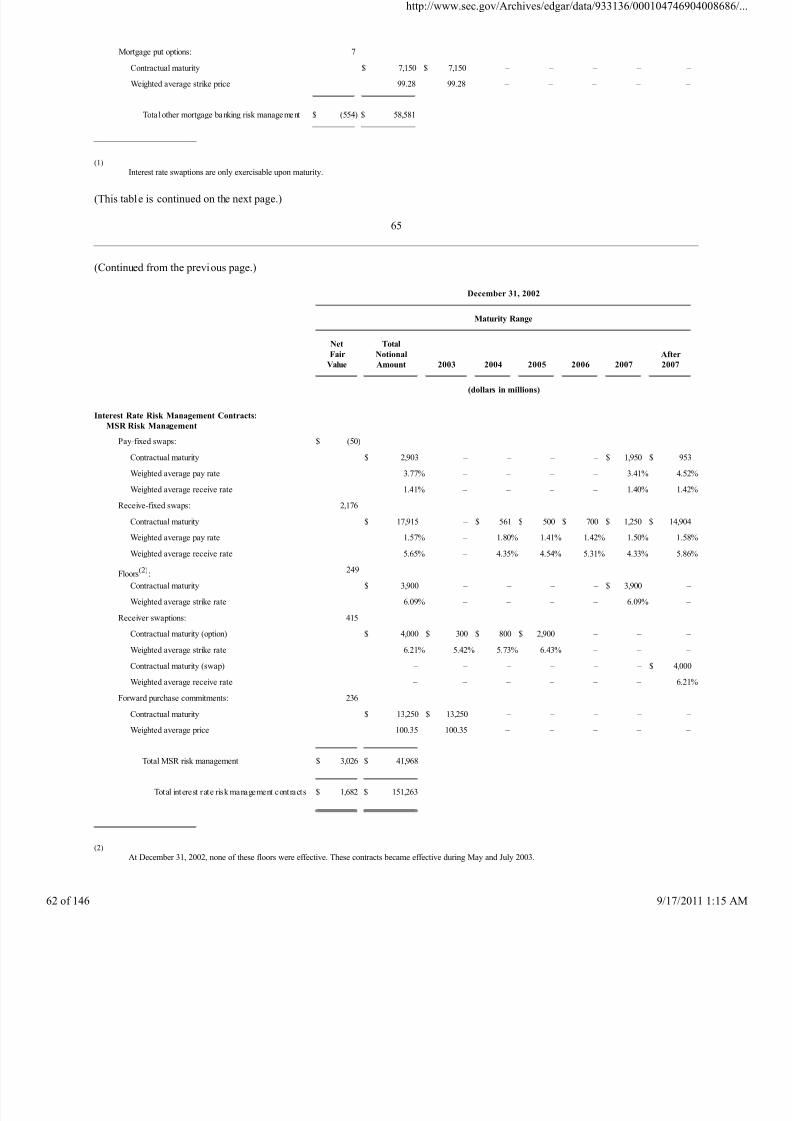
8/4/2019 Wamu 10-k 2003 Subprime
http://slidepdf.com/reader/full/wamu-10-k-2003-subprime 62/146
Mortgage put options: 7
Contractual maturity $ 7,150 $ 7,150 – – – – –
Weighted average strike price 99.28 99.28 – – – – –
Tota l other mortgage banking risk management $ (554) $ 58,581
(1)
Interest rate swaptions are only exercisable upon maturity.
(This table is continued on the next page.)
65
(Continued from the previous page.)
December 31, 2002
Maturity Range
Net
Fair
Value
Total
Notional
Amount
2003
2004
2005
2006
2007
After
2007
(dollars in millions)
Interest Rate Risk Management Contracts:
MSR Risk Management
Pay-fixed swaps: $ (50)
Contractual maturity $ 2,903 – – – – $ 1,950 $ 953
Weighted average pay rate 3.77% – – – – 3.41% 4.52%
Weighted average receive rate 1.41% – – – – 1.40% 1.42%
Receive-fixed swaps: 2,176
Contractual maturity $ 17,915 – $ 561 $ 500 $ 700 $ 1,250 $ 14,904Weighted average pay rate 1.57% – 1.80% 1.41% 1.42% 1.50% 1.58%
Weighted average receive rate 5.65% – 4.35% 4.54% 5.31% 4.33% 5.86%
Floors(2)
:249
Contractual maturity $ 3,900 – – – – $ 3,900 –
Weighted average strike rate 6.09% – – – – 6.09% –
Receiver swaptions: 415
Contractual maturity (option) $ 4,000 $ 300 $ 800 $ 2,900 – – –
Weighted average strike rate 6.21% 5.42% 5.73% 6.43% – – –
Contractual maturity (swap) – – – – – – $ 4,000
Weighted average receive rate – – – – – – 6.21%
Forward purchase commitments: 236
Contractual maturity $ 13,250 $ 13,250 – – – – –
Weighted average price 100.35 100.35 – – – – –
Total MSR risk management $ 3,026 $ 41,968
Total interest rate risk management contracts $ 1,682 $ 151,263
(2)
At December 31, 2002, none of these floors were effective. These contracts became effective during May and July 2003.
http://www.sec.gov/Archives/edgar/data/933136/000104746904
146 9/17/2011
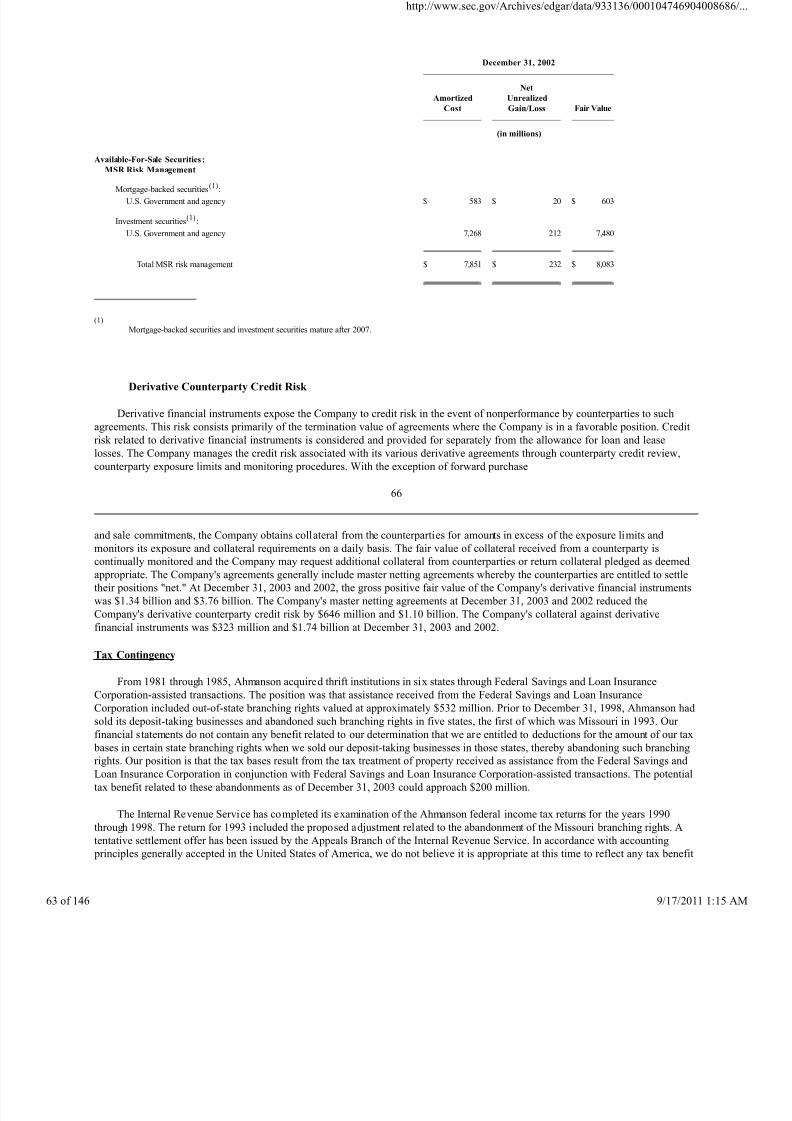
8/4/2019 Wamu 10-k 2003 Subprime
http://slidepdf.com/reader/full/wamu-10-k-2003-subprime 63/146
December 31, 2002
Amortized
Cost
Net
Unrealized
Gain/Loss
Fair Value
(in millions)
Available-For-Sale Securities :
MSR Risk Management
Mortgage-backed securities(1):
U.S. Government and agency $ 583 $ 20 $ 603
Investment securities(1):
U.S. Government and agency 7,268 212 7,480
Total MSR risk management $ 7,851 $ 232 $ 8,083
(1)
Mortgage-backed securities and investment securities mature after 2007.
Derivative Counterparty Credit Risk
Derivative financial instruments expose the Company to credit risk in the event of nonperformance by counterparties to such
agreements. This risk consists primarily of the termination value of agreements where the Company is in a favorable position. Credit
risk related to derivative financial instruments is considered and provided for separately from the allowance for loan and lease
losses. The Company manages the credit risk associated with its various derivative agreements through counterparty credit review,
counterparty exposure limits and monitoring procedures. With the exception of forward purchase
66
and sale commitments, the Company obtains collateral from the counterparties for amounts in excess of the exposure limits and
monitors its exposure and collateral requirements on a daily basis. The fair value of collateral received from a counterparty is
continually monitored and the Company may request additional collateral from counterparties or return collateral pledged as deemed
appropriate. The Company's agreements generally include master netting agreements whereby the counterparties are entitled to settle
their positions "net." At December 31, 2003 and 2002, the gross positive fair value of the Company's derivative financial instruments
was $1.34 billion and $3.76 billion. The Company's master netting agreements at December 31, 2003 and 2002 reduced the
Company's derivative counterparty credit risk by $646 million and $1.10 billion. The Company's collateral against derivative
financial instruments was $323 million and $1.74 billion at December 31, 2003 and 2002.
Tax Contingency
From 1981 through 1985, Ahmanson acquired thrift institutions in six states through Federal Savings and Loan Insurance
Corporation-assisted transactions. The position was that assistance received from the Federal Savings and Loan InsuranceCorporation included out-of-state branching rights valued at approximately $532 million. Prior to December 31, 1998, Ahmanson had
sold its deposit-taking businesses and abandoned such branching rights in five states, the first of which was Missouri in 1993. Our
financial statements do not contain any benefit related to our determination that we are entitled to deductions for the amount of our tax
bases in certain state branching rights when we sold our deposit-taking businesses in those states, thereby abandoning such branching
rights. Our position is that the tax bases result from the tax treatment of property received as assistance from the Federal Savings and
Loan Insurance Corporation in conjunction with Federal Savings and Loan Insurance Corporation-assisted transactions. The potential
tax benefit related to these abandonments as of December 31, 2003 could approach $200 million.
The Internal Revenue Service has completed its examination of the Ahmanson federal income tax returns for the years 1990
through 1998. The return for 1993 included the proposed adjustment related to the abandonment of the Missouri branching rights. A
tentative settlement offer has been issued by the Appeals Branch of the Internal Revenue Service. In accordance with accounting
principles generally accepted in the United States of America, we do not believe it is appropriate at this time to reflect any tax benefit
http://www.sec.gov/Archives/edgar/data/933136/000104746904
146 9/17/2011
8/4/2019 Wamu 10-k 2003 Subprime
http://slidepdf.com/reader/full/wamu-10-k-2003-subprime 64/146
for this matter in our Consolidated Financial Statements.
In addition, losses have been claimed for amounts capitalized as supervisory goodwill for acquisitions made by companies we
acquired. The deductions claimed for these total $1.45 billion. Our position is that tax bases resulted from the tax treatment of
property received as assistance from the Federal Savings and Loan Insurance Corporation in the same manner as branching rights, and
that the tax bases became deductible losses by virtue of new regulatory standards imposed by Congress. The potential tax benefit
related to these assets as of December 31, 2003 could approach $550 million.
The Internal Revenue Service has established a coordinated position and settlement guidelines in opposing the deductibility of
the tax loss for supervisory goodwill. Further review by the Appeals Branch of the Internal Revenue Service is expected regarding
the position and arguments for deduction of the losses incurred. In accordance with accounting principles generally accepted in the
United States of America, we do not believe it is appropriate at this time to reflect any tax benefits for these matters in our
Consolidated Financial Statements.
Goodwill Litigation
On August 9, 1989, the Financial Institutions Reform, Recovery and Enforcement Act was enacted. Among other things, the Act
raised the minimum capital requirements for savings institutions and required a phase-out of the amount of supervisory goodwill that
could be included in satisfying certain regulatory capital requirements. The exclusion of supervisory goodwill from regulatory capital
led many savings institutions to either replace the lost capital by issuing new qualifying debt or equity securities or to reduce assets.
67
To date, trials have been concluded and opinions have been issued in a number of actions in the United States Court of Federal
Claims in which savings institutions and investors in savings institutions sought damages from the U.S. Government based on breach
of contract and other theories. Generally, in cases in which these opinions on the merits have been issued by the federal claims court,
either the plaintiff(s), the defendant (U.S. Government), or both the plaintiff(s) and the defendant, have opted to appeal the federal
claims court's decision. Of those appeals, some are now pending before the United States Court of Appeals for the Federal Circuit
and others have been decided. Generally, the appeals have resulted in the cases being remanded to the federal claims court for further
trial proceedings. In one case, California Federal Bank v. United States, the plaintiff petitioned and the defendant cross petitioned
the United States Supreme Court for a writ of certiorari, both of which were denied.
Home Savings
WMBFA, as successor to Home Savings, has continued to pursue a favorable outcome in the lawsuit filed by Home Savings in
September 1992 against the U.S. Government for damages from the exclusion from regulatory capital of supervisory goodwill
resulting from Home Savings' acquisitions of savings institutions in Florida, Missouri, Texas, Illinois, and Ohio, and of Century
Federal Savings of New York, over the period from 1981 to 1985.
In the Home Savings goodwill litigation, Home Savings and Ahmanson (the parent of Home Savings prior to its acquisition by
WMBFA) alleged breaches of contract as well as certain other claims. All claims other than the breach of contract claims have been
dismissed by the federal claims court, and proceedings to adjudicate the breach of contract claims were bifurcated into two stages. In
the first stage of the proceedings which was concluded in May 2001, the federal claims court held the government to be liable in
damages for the breaches of contract alleged by Home Savings and Ahmanson. In the second stage of the proceedings, the court sought
to fix the amount of damages, if any, to which WMBFA was entitled in compensation for the breaches of contract. After holding a
three-week trial in February 2003, the court on September 3, 2003 entered judgment in favor of Home Savings and Ahmanson and
awarded damages of approximately $134 million, which has not been recorded as of December 31, 2003.
The United States has sought review of this judgment of both liability and damages by the Court of Appeals. As a result of this
review, the Court of Appeals could uphold the judgment of the federal claims court or could reverse part or all of the judgment
resulting in a reduction in the amount of damages to which WMBFA is entitled or a determination that WMBFA is entitled to no
damages. After the Court of Appeals completes its review, the government, or WMBFA, or both may seek further review by the
United States Supreme Court, and WMBFA wil l become entitled to payment of any portion of the damages that ultimately may be
affirmed only after all such appeals have been exhausted or the period of time in which appeals may be sought has expired without
any appeal being filed. Moreover, the courts could hold that WMBFA is not entitled to receive interest on any principal amount of the
judgment that ultimately becomes due.
American Savings Bank, F.A.
http://www.sec.gov/Archives/edgar/data/933136/000104746904
146 9/17/2011
8/4/2019 Wamu 10-k 2003 Subprime
http://slidepdf.com/reader/full/wamu-10-k-2003-subprime 65/146
In December 1992, American Savings Bank, Keystone Holdings and certain related parties brought a lawsuit against the U.S.
Government, alleging, among other things, that in connection with the acquisition of American Savings Bank they entered into a
contract with agencies of the United States and that the U.S. Government breached that contract. As a result of the Keystone
acquisition, we succeeded to all of the rights of American Savings Bank, Keystone Holdings and such related parties in such litigation
and will receive any recovery from the litigation.
In connection with the Keystone acquisition, we placed 8 million shares of our common stock into an escrow. As of
December 19, 2002, as a result of stock splits, there were 18 million shares in the escrow. Under the escrow arrangement, upon our
receipt of net cash proceeds from a judgment in or settlement of the litigation, all or part of the escrow shares were to be released,
64.9% to investors in Keystone Holdings
68
or their assigns, and 35.1% to the FDIC as manager of the Federal Savings and Loan Insurance Corporation Resolution Fund or its
assigns. The number of escrow shares to be released was to be equal to the case proceeds, reduced by certain tax and litigation-
related costs and expenses, divided by $18.4944. The escrow would by its terms automatically expire on December 20, 2002, absent
the occurrence of certain circumstances that would extend it.
In December, 2002, we contended that these circumstances had not occurred and we notified the escrow agent that the escrow
had expired. Accordingly, we instructed the escrow agent to return to us the 18 million shares of our common stock held in escrow,
together with the dividends paid on those shares and the interest earned on the cash while in escrow. The Keystone Holdings'investors and the FDIC objected to such release, contending, among other matters, that the circumstances that would extend the
escrow had occurred.
During much of 2003, we were in discussion with the Keystone Holdings' investors and the FDIC about a possible resolution of
our disagreement relating to the escrow. In the third quarter of 2003, the FDIC agreed to sell its contingent interest in the escrow to
Escrow Partners, L.P., a partnership owned by investors in Keystone Holdings. In the fourth quarter, we resolved our disagreement
with Keystone Holdings and Escrow Partners by agreeing that six million shares of our common stock will remain in the escrow,
together with the accumulated dividends and interest earned on the cash, under substantially the same terms as set forth in the original
escrow agreement, except that the expiration date of the escrow has been extended to December 20, 2008, subject to certain limited
extensions. As a result, in 2003, a total of 12 million shares of common stock were returned to us from the escrow together with
$73 million in cash. Approximately $68 million of that cash amount represented dividends paid on the returned shares, which
included $53 million paid prior to 2003 and $15 million paid during 2003. Also included was approximately $5 million in interest
earned on the cash while in escrow.
Bank United Corp.
Prior to its acquisition, Bank United had a similar lawsuit against the U.S. Government. Securities representing interests in this
lawsuit were issued to Bank United shareholders. These securities, called contingent payment rights certificates, are currently traded
on the NASDAQ Stock Market under the symbol BNKUZ. We do not own a significant number of these securities.
Dime Bancorp, Inc.
In January 1995, Anchor Savings Bank FSB, filed suit against the U.S. Government for unspecified damages involving
supervisory goodwill related to its acquisition of eight troubled savings institutions from 1982-1985. Four of the acquisitions
involved financial assistance from the U.S. Government, and four did not. The Dime Savings Bank of New York, FSB acquired
Anchor Savings Bank shortly after the case was brought and Dime Savings Bank assumed the rights under the litigation against thegovernment. Dime Bancorp distributed a Litigation Tracking Warrant™ (an "LTW") for each share of its common stock outstanding on
December 22, 2000 to each of its shareholders on that date. In January 2002, Dime Savings Bank and Dime Bancorp merged into
WMBFA and the Company. As a result of these mergers, we assumed the litigation against the government and the LTWs are now
exercisable for shares of our common stock. For additional information concerning the Dime goodwill litigation and the LTWs, see
the Company's Current Report on Form 8-K, dated March 12, 2003, File No. 1-14667.
In a series of decisions issued in 2002, the Court of Federal Claims granted our summary judgment motions as to contract
liability with respect to the four acquisitions involving financial assistance, but granted the government's motions with respect to the
four unassisted acquisitions. On September 29, 2003, the Court denied the government's motion for summary judgment with respect to
the claim for the Company's lost profits, but granted the government's motion with respect to the Company's alternative claims for
reliance damages and for the value of the lost supervisory goodwill. Trial on the lost profits claim is expected sometime in 2004.
http://www.sec.gov/Archives/edgar/data/933136/000104746904
146 9/17/2011
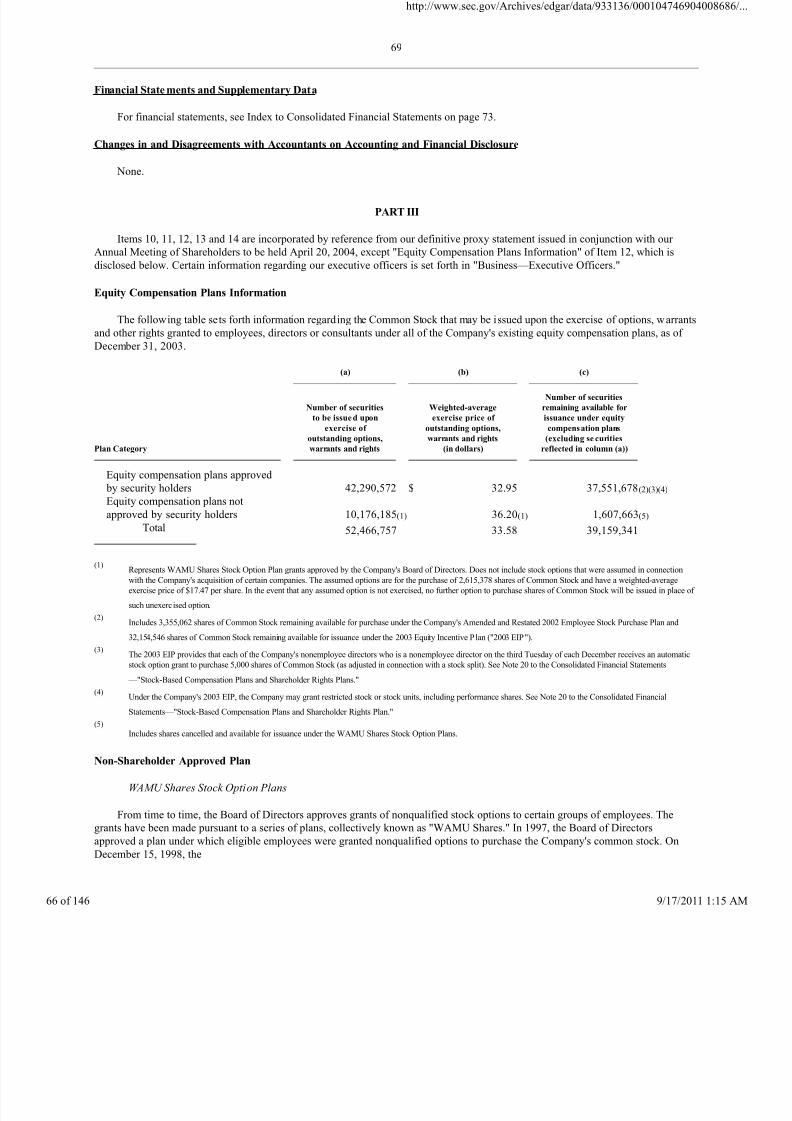
8/4/2019 Wamu 10-k 2003 Subprime
http://slidepdf.com/reader/full/wamu-10-k-2003-subprime 66/146
69
Financial State ments and Supplementary Data
For financial statements, see Index to Consolidated Financial Statements on page 73.
Changes in and Disagreements with Accountants on Accounting and Financial Disclosure
None.
PART III
Items 10, 11, 12, 13 and 14 are incorporated by reference from our definitive proxy statement issued in conjunction with our
Annual Meeting of Shareholders to be held April 20, 2004, except "Equity Compensation Plans Information" of Item 12, which is
disclosed below. Certain information regarding our executive officers is set forth in "Business—Executive Officers."
Equity Compensation Plans Information
The following table sets forth information regarding the Common Stock that may be issued upon the exercise of options, warrants
and other rights granted to employees, directors or consultants under all of the Company's existing equity compensation plans, as of
December 31, 2003.
(a)
(b)
(c)
Plan Category
Number of securities
to be issue d upon
exercise of
outstanding options,
warrants and rights
Weighted-average
exercise price of
outstanding options,
warrants and rights
(in dollars)
Number of securities
remaining available for
issuance under equity
compensation plans
(excluding se curities
reflected in column (a))
Equity compensation plans approved
by security holders
42,290,572 $ 32.95 37,551,678(2)(3)(4)
Equity compensation plans not
approved by security holders
10,176,185(1) 36.20(1) 1,607,663(5)
Total 52,466,757 33.58 39,159,341
(1)Represents WAMU Shares Stock Option Plan grants approved by the Company's Board of Directors. Does not include stock options that were assumed in connection
with the Company's acquisition of certain companies. The assumed options are for the purchase of 2,615,378 shares of Common Stock and have a weighted-average
exercise price of $17.47 per share. In the event that any assumed option is not exercised, no further option to purchase shares of Common Stock will be issued in place of
such unexercised option.
(2)Includes 3,355,062 shares of Common Stock remaining available for purchase under the Company's Amended and Restated 2002 Employee Stock Purchase Plan and
32,154,546 shares of Common Stock remaining available for issuance under the 2003 Equity Incentive Plan ("2003 EIP").
(3)The 2003 EIP provides that each of the Company's nonemployee directors who is a nonemployee director on the third Tuesday of each December receives an automatic
stock option grant to purchase 5,000 shares of Common Stock (as adjusted in connection with a stock split). See Note 20 to the Consolidated Financial Statements
—"Stock-Based Compensation Plans and Shareholder Rights Plans."
(4)
Under the Company's 2003 EIP, the Company may grant restricted stock or stock units, including performance shares. See Note 20 to the Consolidated FinancialStatements—"Stock-Based Compensation Plans and Shareholder Rights Plan."
(5)
Includes shares cancelled and available for issuance under the WAMU Shares Stock Option Plans.
Non-Shareholder Approved Plan
WAMU Shares Stock Option Plans
From time to time, the Board of Directors approves grants of nonqualified stock options to certain groups of employees. The
grants have been made pursuant to a series of plans, collectively known as "WAMU Shares." In 1997, the Board of Directors
approved a plan under which eligible employees were granted nonqualified options to purchase the Company's common stock. On
December 15, 1998, the
http://www.sec.gov/Archives/edgar/data/933136/000104746904
146 9/17/2011
8/4/2019 Wamu 10-k 2003 Subprime
http://slidepdf.com/reader/full/wamu-10-k-2003-subprime 67/146
70
Board adopted a new plan to grant additional nonqualified stock options to eligible employees ("1999 WAMU Shares"). On
February 13, 2001, the Board adopted a third plan and granted nonqualified options to eligible employees ("2001 WAMU Shares").
On September 17, 2002, the Board amended the 2001 WAMU Shares Plan to provide for an additional grant of nonqualified options
to eligible employees effective September 3, 2002. The aggregate number of shares authorized by the Board of Directors for grants
under the WAMU Shares Plans was 14,511,900. On October 16, 2002, the Board amended the 1999 WAMU Shares and the 2001
WAMU Shares plans to allow grants to a broader group of employees, including management, so that some of the authorized but
unissued options could be granted to eligible employees as part of the annual grant in December 2002. Generally, eligible full-time
and part-time employees on the award dates were granted options to purchase shares of Washington Mutual common stock. The
exercise price for all grants is the fair market value of Washington Mutual's common stock on designated dates, and all options vest
one to three years after the award date and expire five to ten years from the award date.
PART IV
Exhibits, Financial Statement Schedules and Reports on Form 8-K
(a) (1) Financial Statements
See Index to Consolidated Financial Statements on page 73.
(2) Financial Statement Schedules
All financial statement schedules are omitted because they are not applicable or not required, or because the required
information is included in the Consolidated Financial Statements or the Notes thereto.
(b) Reports on Form 8-K:
Washington Mutual filed the following reports on Form 8-K during the fourth quarter of 2003:
1. Report filed on October 21, 2003. Items included: Item 7. Exhibits, and Item 12. Results of Operations and FinancialCondition. The report included a press release announcing Washington Mutual's third quarter 2003 financial results and unaudited
Consolidated Financial Statements for the three and nine months ended September 30, 2003.
2. Report filed on October 27, 2003. Items included: Item 7. Financial Statements, Pro Forma Financial Information and
Exhibits. The report included an Underwriting Agreement dated October 27, 2003 between Washington Mutual, Inc. and The Bank of
New York, as trustee, for the Company to issue Senior Debt Securities totaling $400 million bearing a floating rate and due on
November 3, 2005, $250 million bearing a fixed rate of 2.40% and due on November 3, 2005 and $1 billion bearing a fixed rate of
4.00% and due January 15, 2009.
3. Report filed on November 13, 2003. Items included: Item 9. Regulation FD Disclosure. The report included a press release
announcing that its Form 10-Q for the period ended September 30, 2003 contained the correction of an error in its previous
accounting for certain components of bank owned life insurance.
4. Report filed on December 9, 2003. Items included: Item 7. Exhibit, and Item 9. Regulation FD Disclosure. The report
included a press release giving revised earnings guidance for 2003 and 2004.
(c) Exhibits:
The exhibits filed as part of this report and exhibits incorporated herein by reference to other documents are listed in the Index of
Exhibits to this Annual Report on Form 10-K/A (pages E-1 through E-7).
71
http://www.sec.gov/Archives/edgar/data/933136/000104746904
146 9/17/2011
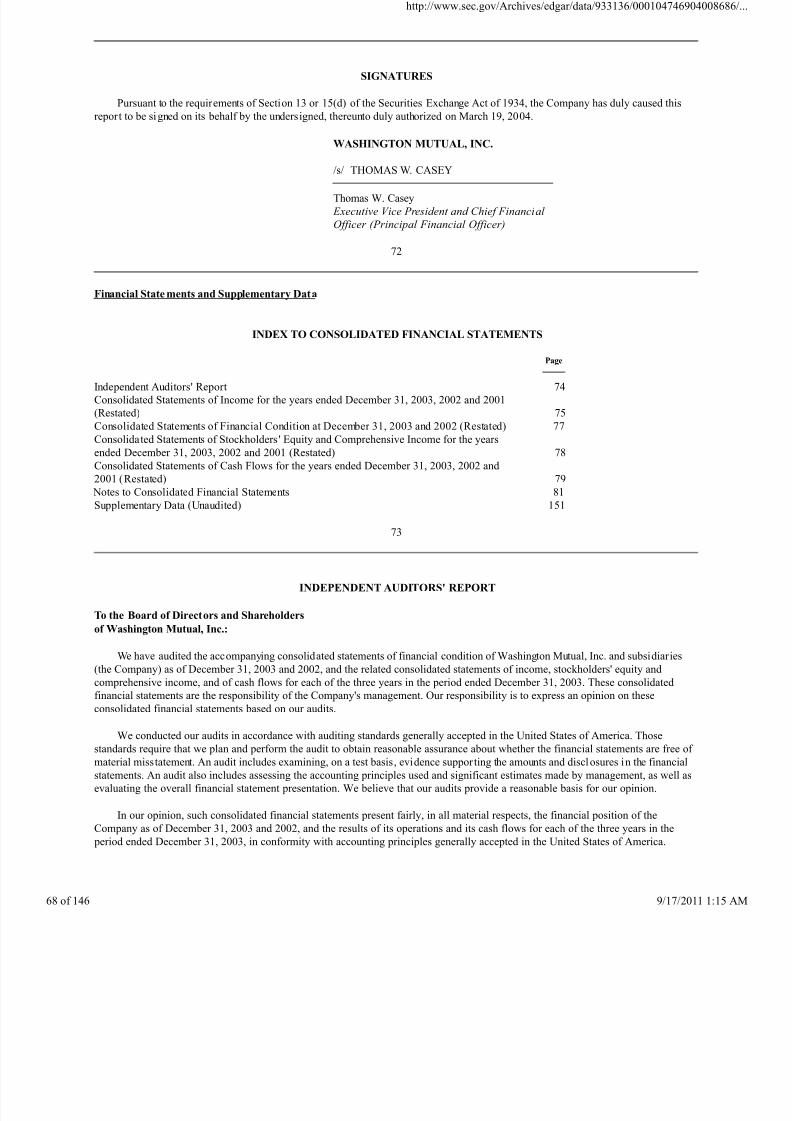
8/4/2019 Wamu 10-k 2003 Subprime
http://slidepdf.com/reader/full/wamu-10-k-2003-subprime 68/146
SIGNATURES
Pursuant to the requirements of Section 13 or 15(d) of the Securities Exchange Act of 1934, the Company has duly caused this
report to be signed on its behalf by the undersigned, thereunto duly authorized on March 19, 2004.
WASHINGTON MUTUAL, INC.
/s/ THOMAS W. CASEY
Thomas W. Casey
Executive Vice President and Chief Financial
Officer (Principal Financial Officer)
72
Financial State ments and Supplementary Data
INDEX TO CONSOLIDATED FINANCIAL STATEMENTS
Page
Independent Auditors' Report 74
Consolidated Statements of Income for the years ended December 31, 2003, 2002 and 2001
(Restated)
75
Consolidated Statements of Financial Condition at December 31, 2003 and 2002 (Restated) 77
Consolidated Statements of Stockholders ' Equity and Comprehensive Income for the years
ended December 31, 2003, 2002 and 2001 (Restated)
78
Consolidated Statements of Cash Flows for the years ended December 31, 2003, 2002 and
2001 (Restated)
79
Notes to Consolidated Financial Statements 81
Supplementary Data (Unaudited) 151
73
INDEPENDENT AUDITORS' REPORT
To the Board of Directors and Shareholders
of Washington Mutual, Inc.:
We have audited the accompanying consolidated statements of financial condition of Washington Mutual, Inc. and subsidiaries
(the Company) as of December 31, 2003 and 2002, and the related consolidated statements of income, stockholders' equity and
comprehensive income, and of cash flows for each of the three years in the period ended December 31, 2003. These consolidated
financial statements are the responsibility of the Company's management. Our responsibility is to express an opinion on theseconsolidated financial statements based on our audits.
We conducted our audits in accordance with auditing standards generally accepted in the United States of America. Those
standards require that we plan and perform the audit to obtain reasonable assurance about whether the financial statements are free of
material misstatement. An audit includes examining, on a test basis, evidence supporting the amounts and disclosures in the financial
statements. An audit also includes assessing the accounting principles used and significant estimates made by management, as well as
evaluating the overall financial statement presentation. We believe that our audits provide a reasonable basis for our opinion.
In our opinion, such consolidated financial statements present fairly, in all material respects, the financial position of the
Company as of December 31, 2003 and 2002, and the results of its operations and its cash flows for each of the three years in the
period ended December 31, 2003, in conformity with accounting principles generally accepted in the United States of America.
http://www.sec.gov/Archives/edgar/data/933136/000104746904
146 9/17/2011
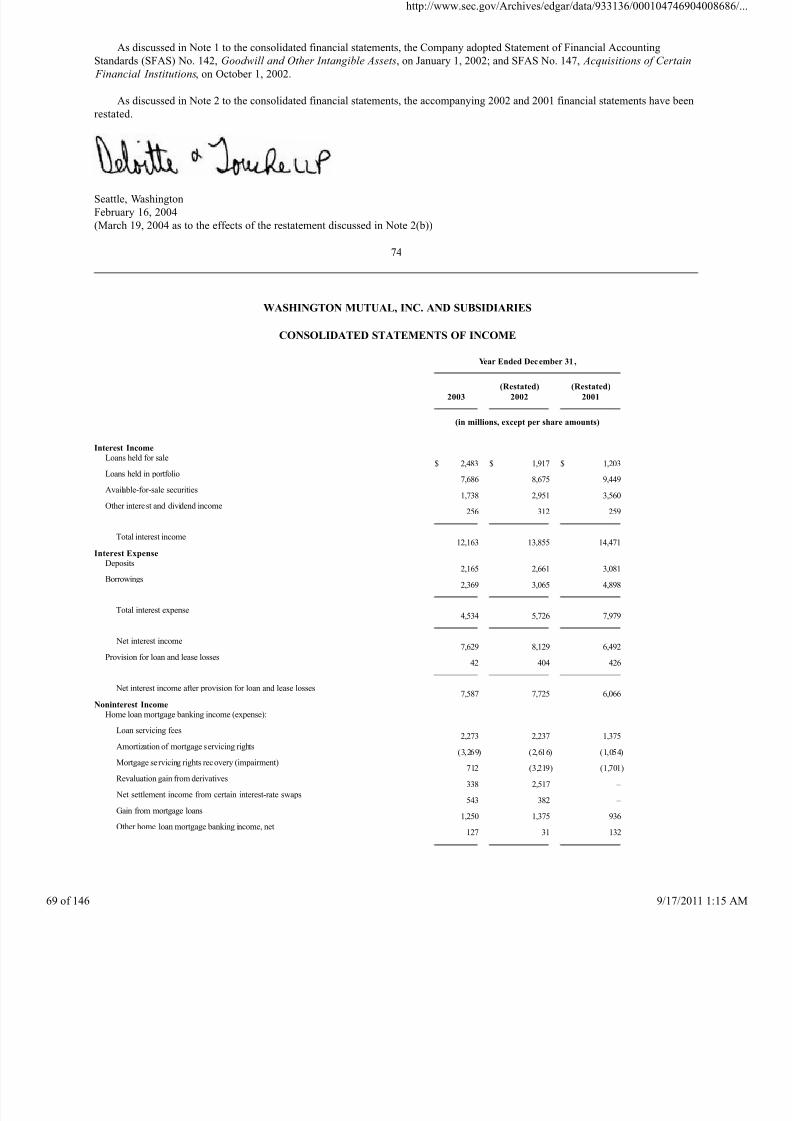
8/4/2019 Wamu 10-k 2003 Subprime
http://slidepdf.com/reader/full/wamu-10-k-2003-subprime 69/146
As discussed in Note 1 to the consolidated financial statements, the Company adopted Statement of Financial Accounting
Standards (SFAS) No. 142, Goodwill and Other Intangible Assets, on January 1, 2002; and SFAS No. 147, Acquisitions of Certain
Financial Institutions, on October 1, 2002.
As discussed in Note 2 to the consolidated financial statements, the accompanying 2002 and 2001 financial statements have been
restated.
Seattle, Washington
February 16, 2004
(March 19, 2004 as to the effects of the restatement discussed in Note 2(b))
74
WASHINGTON MUTUAL, INC. AND SUBSIDIARIES
CONSOLIDATED STATEMENTS OF INCOME
Year Ended December 31 ,
2003
(Restated)
2002
(Restated)
2001
(in millions, except per share amounts)
Interest Income
Loans held for sale$ 2,483 $ 1,917 $ 1,203
Loans held in portfolio7,686 8,675 9,449
Available-for-sale securities1,738 2,951 3,560
Other interest and dividend income256 312 259
Total interest income12,163 13,855 14,471
Interest Expense
Deposits2,165 2,661 3,081
Borrowings2,369 3,065 4,898
Total interest expense4,534 5,726 7,979
Net interest income7,629 8,129 6,492
Provision for loan and lease losses42 404 426
Net interest income after provision for loan and lease losses7,587 7,725 6,066
Noninterest Income
Home loan mortgage banking income (expense):
Loan servicing fees2,273 2,237 1,375
Amortization of mortgage servicing rights(3,269) (2,616) (1,054)
Mortgage servicing rights recovery (impairment)712 (3,219) (1,701)
Revaluation gain from derivatives338 2,517 –
Net settlement income from certain interest-rate swaps543 382 –
Gain from mortgage loans1,250 1,375 936
Other home loan mortgage banking income, net127 31 132
http://www.sec.gov/Archives/edgar/data/933136/000104746904
146 9/17/2011
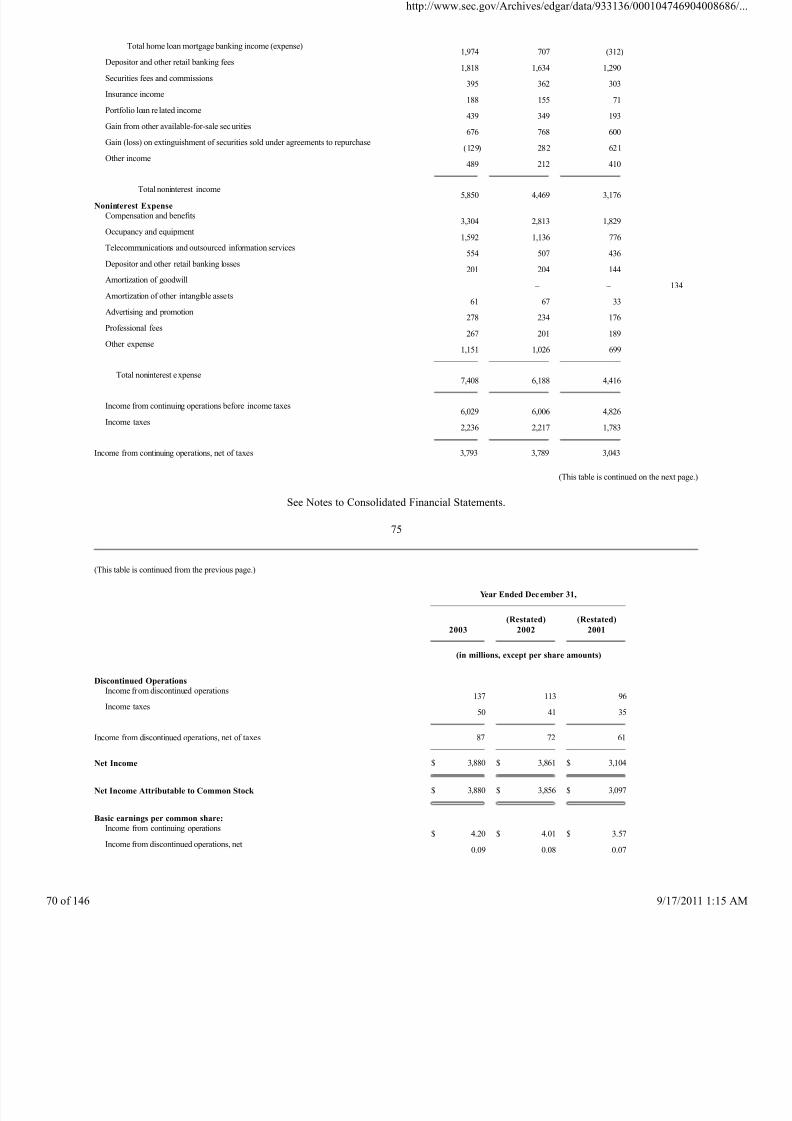
8/4/2019 Wamu 10-k 2003 Subprime
http://slidepdf.com/reader/full/wamu-10-k-2003-subprime 70/146
Total home loan mortgage banking income (expense)1,974 707 (312)
Depositor and other retail banking fees1,818 1,634 1,290
Securities fees and commissions395 362 303
Insurance income188 155 71
Portfolio loan re lated income439 349 193
Gain from other available-for-sale securities676 768 600
Gain (loss) on extinguishment of securities sold under agreements to repurchase(129) 282 621
Other income489 212 410
Total noninterest income5,850 4,469 3,176
Noninterest Expense
Compensation and benefits3,304 2,813 1,829
Occupancy and equipment1,592 1,136 776
Telecommunications and outsourced information services554 507 436
Depositor and other retail banking losses201 204 144
Amortization of goodwill – – 134
Amortization of other intangible assets61 67 33
Advertising and promotion278 234 176
Professional fees267 201 189
Other expense1,151 1,026 699
Total noninterest expense7,408 6,188 4,416
Income from continuing operations before income taxes6,029 6,006 4,826
Income taxes2,236 2,217 1,783
Income from continuing operations, net of taxes 3,793 3,789 3,043
(This table is continued on the next page.)
See Notes to Consolidated Financial Statements.
75
(This table is continued from the previous page.)
Year Ended December 31,
2003
(Restated)
2002
(Restated)
2001
(in millions, except per share amounts)
Discontinued Operations
Income from discontinued operations
137 113 96 Income taxes
50 41 35
Income from discontinued operations, net of taxes 87 72 61
Net Income $ 3,880 $ 3,861 $ 3,104
Net Income Attributable to Common Stock $ 3,880 $ 3,856 $ 3,097
Basic earnings per common share:
Income from continuing operations$ 4.20 $ 4.01 $ 3.57
Income from discontinued operations, net0.09 0.08 0.07
http://www.sec.gov/Archives/edgar/data/933136/000104746904
146 9/17/2011
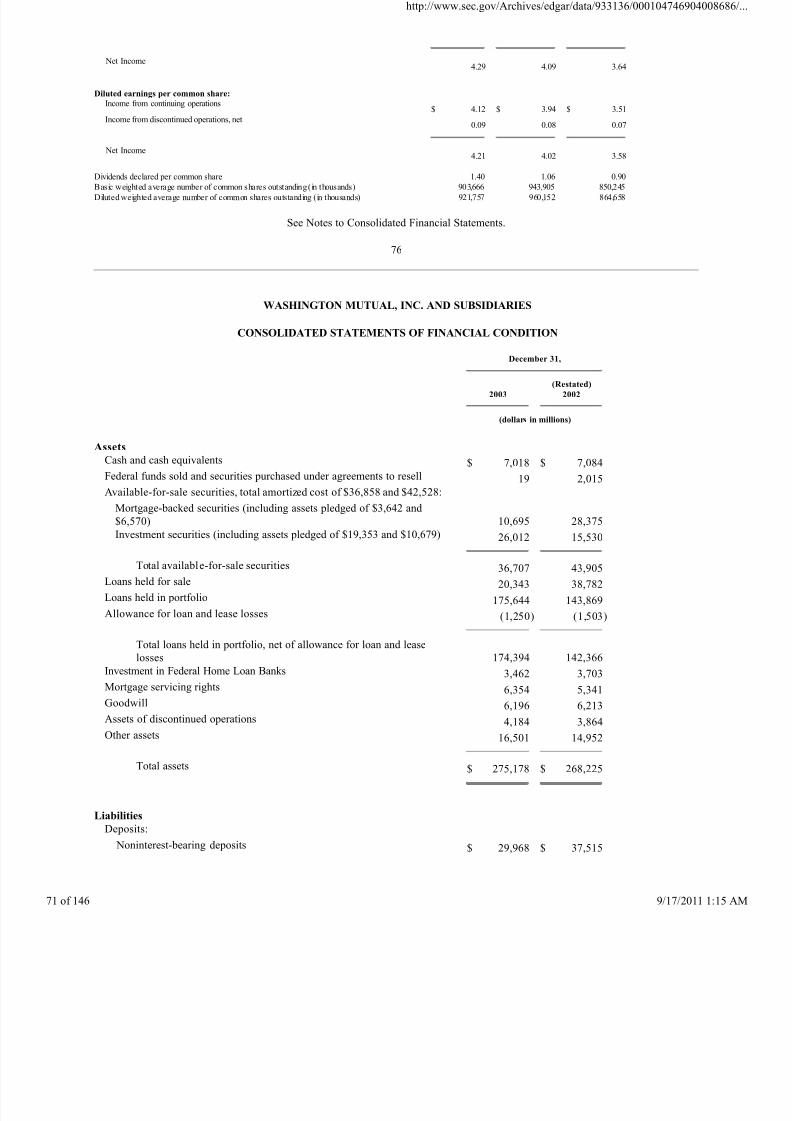
8/4/2019 Wamu 10-k 2003 Subprime
http://slidepdf.com/reader/full/wamu-10-k-2003-subprime 71/146
Net Income4.29 4.09 3.64
Diluted earnings per common share:
Income from continuing operations$ 4.12 $ 3.94 $ 3.51
Income from discontinued operations, net0.09 0.08 0.07
Net Income4.21 4.02 3.58
Dividends declared per common share 1.40 1.06 0.90Basic weighted average number of common shares outstanding (in thousands) 903,666 943,905 850,245
Diluted weighted average number of common shares outstanding (in thousands) 921,757 960,152 864,658
See Notes to Consolidated Financial Statements.
76
WASHINGTON MUTUAL, INC. AND SUBSIDIARIES
CONSOLIDATED STATEMENTS OF FINANCIAL CONDITION
December 31,
2003
(Restated)
2002
(dollars in millions)
Assets
Cash and cash equivalents $ 7,018 $ 7,084
Federal funds sold and securities purchased under agreements to resell 19 2,015
Available-for-sale securities, total amortized cost of $36,858 and $42,528:
Mortgage-backed securities (including assets pledged of $3,642 and
$6,570)
10,695 28,375Investment securities (including assets pledged of $19,353 and $10,679) 26,012 15,530
Total available-for-sale securities 36,707 43,905
Loans held for sale 20,343 38,782
Loans held in portfolio 175,644 143,869
Allowance for loan and lease losses (1,250) (1,503)
Total loans held in portfolio, net of allowance for loan and lease
losses
174,394 142,366
Investment in Federal Home Loan Banks 3,462 3,703
Mortgage servicing rights 6,354 5,341
Goodwill 6,196 6,213
Assets of discontinued operations 4,184 3,864
Other assets 16,501 14,952
Total assets $ 275,178 $ 268,225
Liabilities
Deposits:
Noninterest-bearing deposits $ 29,968 $ 37,515
http://www.sec.gov/Archives/edgar/data/933136/000104746904
146 9/17/2011
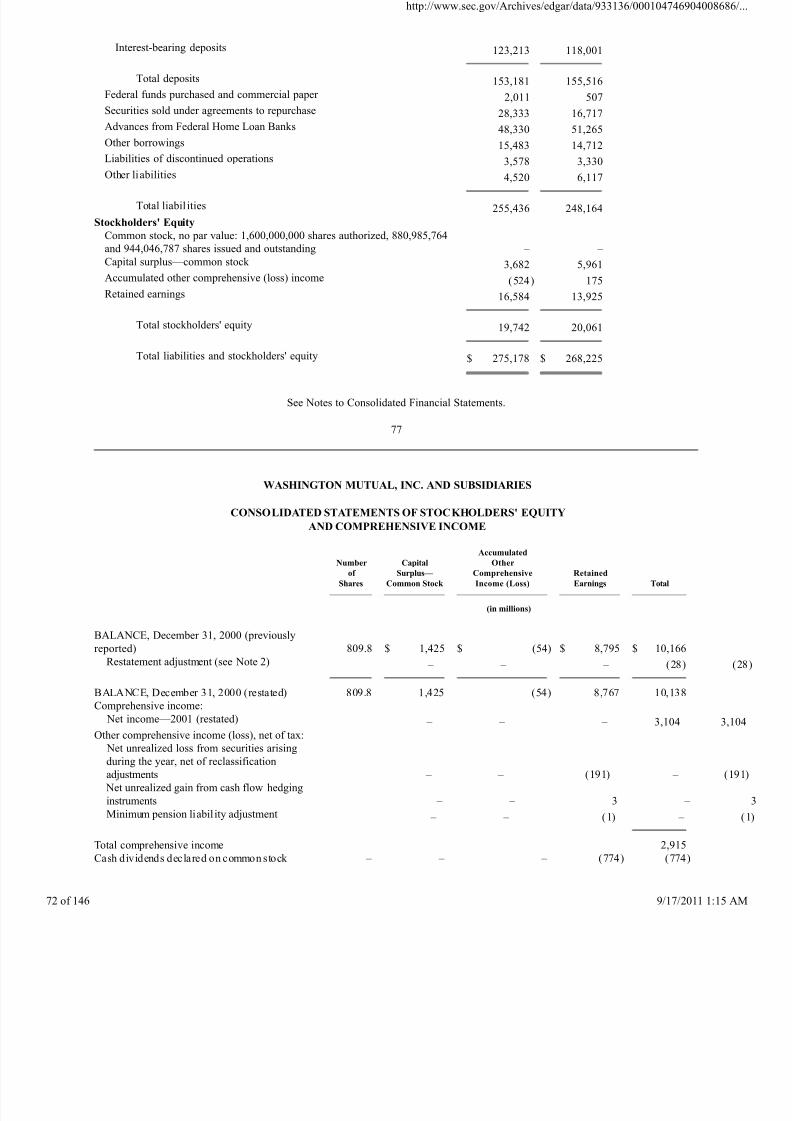
8/4/2019 Wamu 10-k 2003 Subprime
http://slidepdf.com/reader/full/wamu-10-k-2003-subprime 72/146
Interest-bearing deposits 123,213 118,001
Total deposits 153,181 155,516
Federal funds purchased and commercial paper 2,011 507
Securities sold under agreements to repurchase 28,333 16,717
Advances from Federal Home Loan Banks 48,330 51,265
Other borrowings 15,483 14,712
Liabilities of discontinued operations 3,578 3,330
Other liabilities 4,520 6,117
Total liabil ities 255,436 248,164
Stockholders' Equity
Common stock, no par value: 1,600,000,000 shares authorized, 880,985,764
and 944,046,787 shares issued and outstanding
– –
Capital surplus—common stock 3,682 5,961
Accumulated other comprehensive (loss) income (524) 175
Retained earnings 16,584 13,925
Total stockholders' equity 19,742 20,061
Total liabilities and stockholders' equity $ 275,178 $ 268,225
See Notes to Consolidated Financial Statements.
77
WASHINGTON MUTUAL, INC. AND SUBSIDIARIES
CONSOLIDATED STATEMENTS OF STOCKHOLDERS' EQUITY
AND COMPREHENSIVE INCOME
Number
of
Shares
Capital
Surplus—
Common Stock
Accumulated
Other
Comprehensive
Income (Loss)
Retained
Earnings
Total
(in millions)
BALANCE, December 31, 2000 (previously
reported)
809.8 $ 1,425 $ (54) $ 8,795 $ 10,166
Restatement adjustment (see Note 2) – – – (28)
BALANCE, December 31, 2000 (restated) 809.8 1,425 (54) 8,767 10,138
Comprehensive income:
Net income—2001 (restated) – – – 3,104
Other comprehensive income (loss), net of tax:
Net unrealized loss from securities arising
during the year, net of reclassification
adjustments
– – (191) –
Net unrealized gain from cash flow hedging
instruments
– – 3 –
Minimum pension liabil ity adjustment – – (1) –
Total comprehensive income 2,915
Cash dividends declared on common stock – – – (774) (774)
http://www.sec.gov/Archives/edgar/data/933136/000104746904
146 9/17/2011
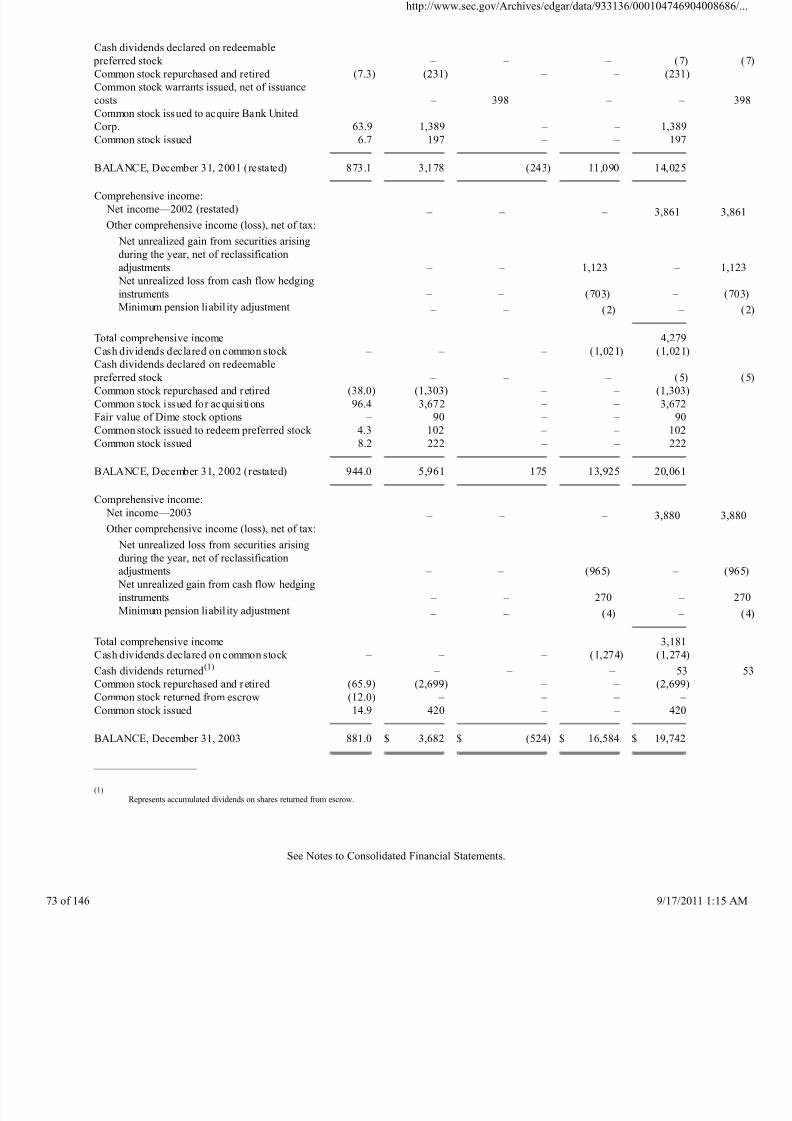
8/4/2019 Wamu 10-k 2003 Subprime
http://slidepdf.com/reader/full/wamu-10-k-2003-subprime 73/146
Cash dividends declared on redeemable
preferred stock
– – – (7)
Common stock repurchased and retired (7.3) (231) – – (231)
Common stock warrants issued, net of issuance
costs
– 398 – –
Common stock issued to acquire Bank United
Corp.
63.9 1,389 – – 1,389
Common stock issued 6.7 197 – – 197
BALANCE, December 31, 2001 (restated) 873.1 3,178 (243) 11,090 14,025
Comprehensive income:
Net income—2002 (restated) – – – 3,861
Other comprehensive income (loss), net of tax:
Net unrealized gain from securities arising
during the year, net of reclassification
adjustments
– – 1,123 –
Net unrealized loss from cash flow hedging
instruments
– – (703) –
Minimum pension liabil ity adjustment – – (2) –
Total comprehensive income 4,279
Cash dividends declared on common stock – – – (1,021) (1,021)Cash dividends declared on redeemable
preferred stock
– – – (5)
Common stock repurchased and retired (38.0) (1,303) – – (1,303)
Common stock issued for acquisi tions 96.4 3,672 – – 3,672
Fair value of Dime stock options – 90 – – 90
Common stock issued to redeem preferred stock 4.3 102 – – 102
Common stock issued 8.2 222 – – 222
BALANCE, December 31, 2002 (restated) 944.0 5,961 175 13,925 20,061
Comprehensive income:
Net income—2003 – – – 3,880
Other comprehensive income (loss), net of tax:
Net unrealized loss from securities arising
during the year, net of reclassification
adjustments
– – (965) –
Net unrealized gain from cash flow hedging
instruments
– – 270 –
Minimum pension liabil ity adjustment – – (4) –
Total comprehensive income 3,181
Cash dividends declared on common stock – – – (1,274) (1,274)
Cash dividends returned(1) – – – 53
Common stock repurchased and retired (65.9) (2,699) – – (2,699)
Common stock returned from escrow (12.0) – – – – Common stock issued 14.9 420 – – 420
BALANCE, December 31, 2003 881.0 $ 3,682 $ (524) $ 16,584 $ 19,742
(1)
Represents accumulated dividends on shares returned from escrow.
See Notes to Consolidated Financial Statements.
http://www.sec.gov/Archives/edgar/data/933136/000104746904
146 9/17/2011
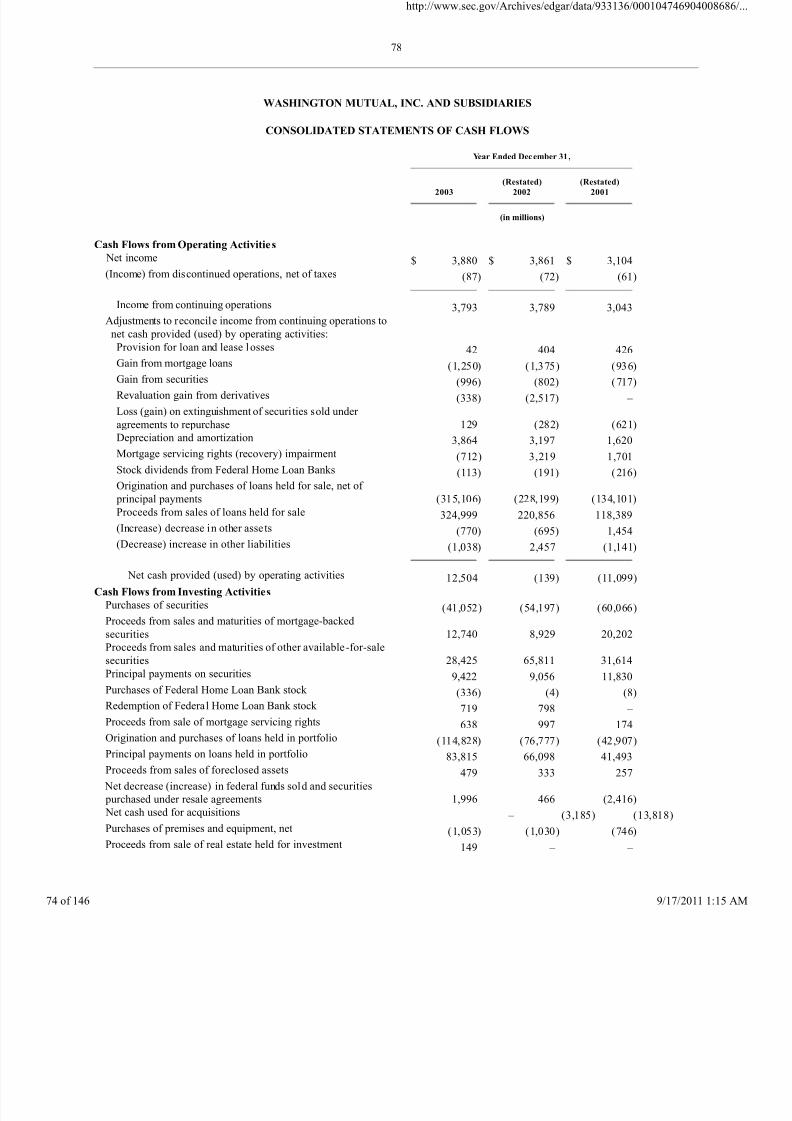
8/4/2019 Wamu 10-k 2003 Subprime
http://slidepdf.com/reader/full/wamu-10-k-2003-subprime 74/146
78
WASHINGTON MUTUAL, INC. AND SUBSIDIARIES
CONSOLIDATED STATEMENTS OF CASH FLOWS
Year Ended December 31 ,
2003
(Restated)
2002
(Restated)
2001
(in millions)
Cash Flows from Operating Activities
Net income $ 3,880 $ 3,861 $ 3,104
(Income) from discontinued operations, net of taxes (87) (72) (61)
Income from continuing operations 3,793 3,789 3,043
Adjustments to reconcile income from continuing operations to
net cash provided (used) by operating activities:
Provision for loan and lease losses 42 404 426Gain from mortgage loans (1,250) (1,375) (936)
Gain from securities (996) (802) (717)
Revaluation gain from derivatives (338) (2,517) –
Loss (gain) on extinguishment of securities sold under
agreements to repurchase
129 (282) (621)
Depreciation and amortization 3,864 3,197 1,620
Mortgage servicing rights (recovery) impairment (712) 3,219 1,701
Stock dividends from Federal Home Loan Banks (113) (191) (216)
Origination and purchases of loans held for sale, net of
principal payments
(315,106) (228,199) (134,101)
Proceeds from sales of loans held for sale 324,999 220,856 118,389
(Increase) decrease in other assets (770) (695) 1,454
(Decrease) increase in other liabilities (1,038) 2,457 (1,141)
Net cash provided (used) by operating activities 12,504 (139) (11,099)
Cash Flows from Investing Activities
Purchases of securities (41,052) (54,197) (60,066)
Proceeds from sales and maturities of mortgage-backed
securities
12,740 8,929 20,202
Proceeds from sales and maturities of other available-for-sale
securities
28,425 65,811 31,614
Principal payments on securities 9,422 9,056 11,830
Purchases of Federal Home Loan Bank stock (336) (4) (8)
Redemption of Federal Home Loan Bank stock 719 798 –
Proceeds from sale of mortgage servicing rights 638 997 174
Origination and purchases of loans held in portfolio (114,828) (76,777) (42,907)
Principal payments on loans held in portfolio 83,815 66,098 41,493
Proceeds from sales of foreclosed assets 479 333 257
Net decrease (increase) in federal funds sold and securities
purchased under resale agreements
1,996 466 (2,416)
Net cash used for acquisitions – (3,185) (13,818)
Purchases of premises and equipment, net (1,053) (1,030) (746)
Proceeds from sale of real estate held for investment 149 – –
http://www.sec.gov/Archives/edgar/data/933136/000104746904
146 9/17/2011
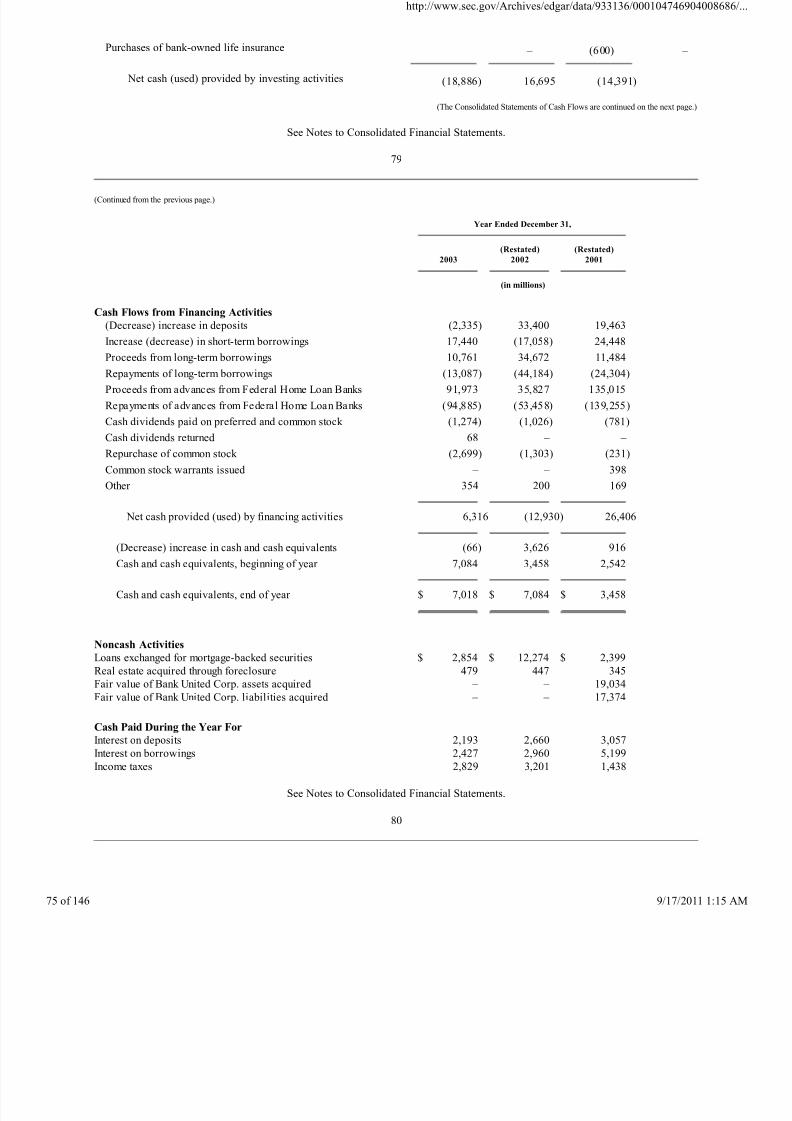
8/4/2019 Wamu 10-k 2003 Subprime
http://slidepdf.com/reader/full/wamu-10-k-2003-subprime 75/146
Purchases of bank-owned life insurance – (600) –
Net cash (used) provided by investing activities (18,886) 16,695 (14,391)
(The Consolidated Statements of Cash Flows are continued on the next page.)
See Notes to Consolidated Financial Statements.
79
(Continued from the previous page.)
Year Ended December 31,
2003
(Restated)
2002
(Restated)
2001
(in millions)
Cash Flows from Financing Activities
(Decrease) increase in deposits (2,335) 33,400 19,463
Increase (decrease) in short-term borrowings 17,440 (17,058) 24,448
Proceeds from long-term borrowings 10,761 34,672 11,484
Repayments of long-term borrowings (13,087) (44,184) (24,304)
Proceeds from advances from Federal Home Loan Banks 91,973 35,827 135,015
Repayments of advances from Federal Home Loan Banks (94,885) (53,458) (139,255)
Cash dividends paid on preferred and common stock (1,274) (1,026) (781)
Cash dividends returned 68 – –
Repurchase of common stock (2,699) (1,303) (231)
Common stock warrants issued – – 398
Other 354 200 169
Net cash provided (used) by financing activities 6,316 (12,930) 26,406
(Decrease) increase in cash and cash equivalents (66) 3,626 916
Cash and cash equivalents, beginning of year 7,084 3,458 2,542
Cash and cash equivalents, end of year $ 7,018 $ 7,084 $ 3,458
Noncash Activities
Loans exchanged for mortgage-backed securities $ 2,854 $ 12,274 $ 2,399
Real estate acquired through foreclosure 479 447 345
Fair value of Bank United Corp. assets acquired – – 19,034
Fair value of Bank United Corp. liabilities acquired – – 17,374
Cash Paid During the Year For
Interest on deposits 2,193 2,660 3,057
Interest on borrowings 2,427 2,960 5,199
Income taxes 2,829 3,201 1,438
See Notes to Consolidated Financial Statements.
80
http://www.sec.gov/Archives/edgar/data/933136/000104746904
146 9/17/2011
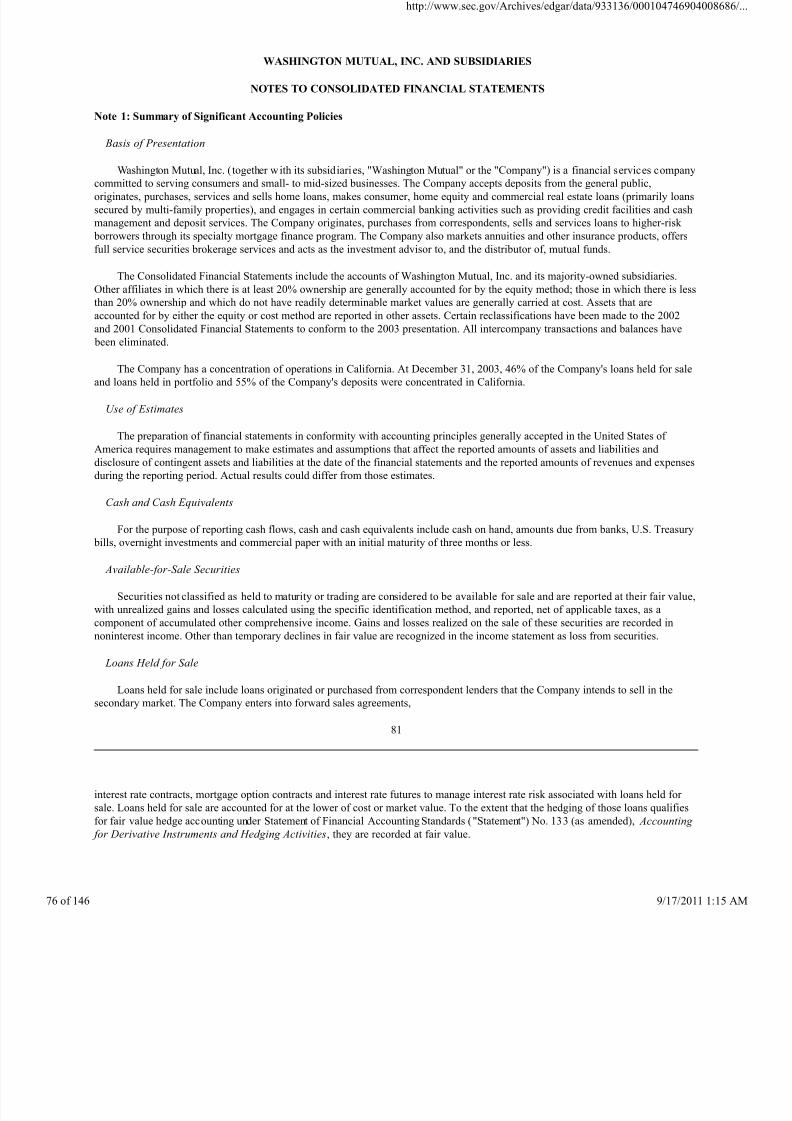
8/4/2019 Wamu 10-k 2003 Subprime
http://slidepdf.com/reader/full/wamu-10-k-2003-subprime 76/146
WASHINGTON MUTUAL, INC. AND SUBSIDIARIES
NOTES TO CONSOLIDATED FINANCIAL STATEMENTS
Note 1: Summary of Significant Accounting Policies
Basis of Presentation
Washington Mutual, Inc. (together with its subsidiaries, "Washington Mutual" or the "Company") is a financial services companycommitted to serving consumers and small- to mid-sized businesses. The Company accepts deposits from the general public,
originates, purchases, services and sells home loans, makes consumer, home equity and commercial real estate loans (primarily loans
secured by multi-family properties), and engages in certain commercial banking activities such as providing credit facilities and cash
management and deposit services. The Company originates, purchases from correspondents, sells and services loans to higher-risk
borrowers through its specialty mortgage finance program. The Company also markets annuities and other insurance products, offers
full service securities brokerage services and acts as the investment advisor to, and the distributor of, mutual funds.
The Consolidated Financial Statements include the accounts of Washington Mutual, Inc. and its majority-owned subsidiaries.
Other affiliates in which there is at least 20% ownership are generally accounted for by the equity method; those in which there is less
than 20% ownership and which do not have readily determinable market values are generally carried at cost. Assets that are
accounted for by either the equity or cost method are reported in other assets. Certain reclassifications have been made to the 2002
and 2001 Consolidated Financial Statements to conform to the 2003 presentation. All intercompany transactions and balances have
been eliminated.
The Company has a concentration of operations in California. At December 31, 2003, 46% of the Company's loans held for sale
and loans held in portfolio and 55% of the Company's deposits were concentrated in California.
Use of Estimates
The preparation of financial statements in conformity with accounting principles generally accepted in the United States of
America requires management to make estimates and assumptions that affect the reported amounts of assets and liabilities and
disclosure of contingent assets and liabilities at the date of the financial statements and the reported amounts of revenues and expenses
during the reporting period. Actual results could differ from those estimates.
Cash and Cash Equivalents
For the purpose of reporting cash flows, cash and cash equivalents include cash on hand, amounts due from banks, U.S. Treasury bills, overnight investments and commercial paper with an initial maturity of three months or less.
Available-for-Sale Securities
Securities not classified as held to maturity or trading are considered to be available for sale and are reported at their fair value,
with unrealized gains and losses calculated using the specific identification method, and reported, net of applicable taxes, as a
component of accumulated other comprehensive income. Gains and losses realized on the sale of these securities are recorded in
noninterest income. Other than temporary declines in fair value are recognized in the income statement as loss from securities.
Loans Held for Sale
Loans held for sale include loans originated or purchased from correspondent lenders that the Company intends to sell in the
secondary market. The Company enters into forward sales agreements,
81
interest rate contracts, mortgage option contracts and interest rate futures to manage interest rate risk associated with loans held for
sale. Loans held for sale are accounted for at the lower of cost or market value. To the extent that the hedging of those loans qualifies
for fair value hedge accounting under Statement of Financial Accounting Standards ("Statement") No. 133 (as amended), Accounting
for Derivative Instruments and Hedging Activities, they are recorded at fair value.
http://www.sec.gov/Archives/edgar/data/933136/000104746904
146 9/17/2011
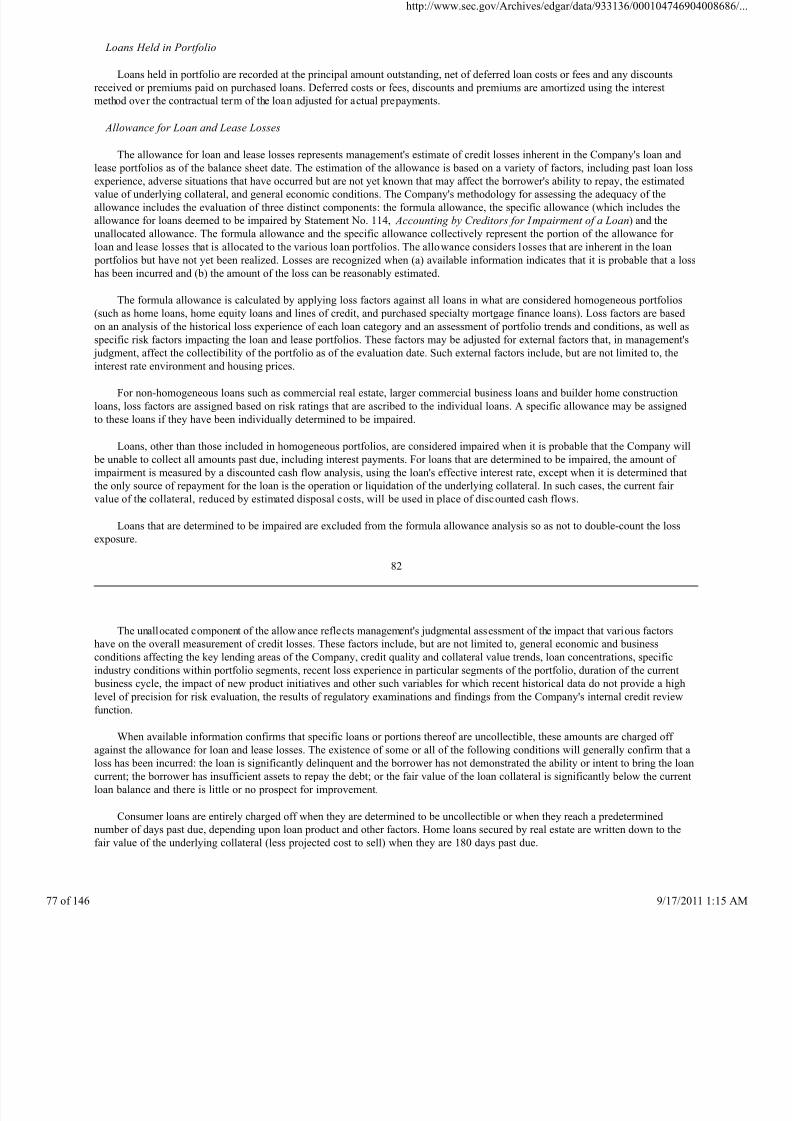
8/4/2019 Wamu 10-k 2003 Subprime
http://slidepdf.com/reader/full/wamu-10-k-2003-subprime 77/146
Loans Held in Portfolio
Loans held in portfolio are recorded at the principal amount outstanding, net of deferred loan costs or fees and any discounts
received or premiums paid on purchased loans. Deferred costs or fees, discounts and premiums are amortized using the interest
method over the contractual term of the loan adjusted for actual prepayments.
Allowance for Loan and Lease Losses
The allowance for loan and lease losses represents management's estimate of credit losses inherent in the Company's loan and
lease portfolios as of the balance sheet date. The estimation of the allowance is based on a variety of factors, including past loan loss
experience, adverse situations that have occurred but are not yet known that may affect the borrower's ability to repay, the estimated
value of underlying collateral, and general economic conditions. The Company's methodology for assessing the adequacy of the
allowance includes the evaluation of three distinct components: the formula allowance, the specific allowance (which includes the
allowance for loans deemed to be impaired by Statement No. 114, Accounting by Creditors for Impairment of a Loan) and the
unallocated allowance. The formula allowance and the specific allowance collectively represent the portion of the allowance for
loan and lease losses that is allocated to the various loan portfolios. The allowance considers losses that are inherent in the loan
portfolios but have not yet been realized. Losses are recognized when (a) available information indicates that it is probable that a loss
has been incurred and (b) the amount of the loss can be reasonably estimated.
The formula allowance is calculated by applying loss factors against all loans in what are considered homogeneous portfolios
(such as home loans, home equity loans and lines of credit, and purchased specialty mortgage finance loans). Loss factors are based
on an analysis of the historical loss experience of each loan category and an assessment of portfolio trends and conditions, as well as
specific risk factors impacting the loan and lease portfolios. These factors may be adjusted for external factors that, in management's
judgment, affect the collectibility of the portfolio as of the evaluation date. Such external factors include, but are not limited to, theinterest rate environment and housing prices.
For non-homogeneous loans such as commercial real estate, larger commercial business loans and builder home construction
loans, loss factors are assigned based on risk ratings that are ascribed to the individual loans. A specific allowance may be assigned
to these loans if they have been individually determined to be impaired.
Loans, other than those included in homogeneous portfolios, are considered impaired when it is probable that the Company will
be unable to collect all amounts past due, including interest payments. For loans that are determined to be impaired, the amount of
impairment is measured by a discounted cash flow analysis, using the loan's effective interest rate, except when it is determined that
the only source of repayment for the loan is the operation or liquidation of the underlying collateral. In such cases, the current fair
value of the collateral, reduced by estimated disposal costs, will be used in place of discounted cash flows.
Loans that are determined to be impaired are excluded from the formula allowance analysis so as not to double-count the lossexposure.
82
The unallocated component of the allowance reflects management's judgmental assessment of the impact that various factors
have on the overall measurement of credit losses. These factors include, but are not limited to, general economic and business
conditions affecting the key lending areas of the Company, credit quality and collateral value trends, loan concentrations, specific
industry conditions within portfolio segments, recent loss experience in particular segments of the portfolio, duration of the current
business cycle, the impact of new product initiatives and other such variables for which recent historical data do not provide a high
level of precision for risk evaluation, the results of regulatory examinations and findings from the Company's internal credit reviewfunction.
When available information confirms that specific loans or portions thereof are uncollectible, these amounts are charged off
against the allowance for loan and lease losses. The existence of some or all of the following conditions will generally confirm that a
loss has been incurred: the loan is significantly delinquent and the borrower has not demonstrated the ability or intent to bring the loan
current; the borrower has insufficient assets to repay the debt; or the fair value of the loan collateral is significantly below the current
loan balance and there is little or no prospect for improvement.
Consumer loans are entirely charged off when they are determined to be uncollectible or when they reach a predetermined
number of days past due, depending upon loan product and other factors. Home loans secured by real estate are written down to the
fair value of the underlying collateral (less projected cost to sell) when they are 180 days past due.
http://www.sec.gov/Archives/edgar/data/933136/000104746904
146 9/17/2011
8/4/2019 Wamu 10-k 2003 Subprime
http://slidepdf.com/reader/full/wamu-10-k-2003-subprime 78/146
The ultimate recovery of all loans is susceptible to future market factors beyond the Company's control. These factors may result
in losses or recoveries differing significantly from those provided for in the Consolidated Financial Statements.
Nonaccrual Loans
Loans for which interest is not being accrued are referred to as loans on nonaccrual status. Generally, loans are placed on
nonaccrual status when the loan becomes 90 days past due. Additionally, loans in non-homogeneous portfolios, such as commercial
real estate, commercial business loans and builder home construction loans, are placed on nonaccrual status prior to becoming
90 days past due when payment in full of principal and interest is not expected. When a loan is placed on nonaccrual status, all
interest accrued, but not collected, is reversed.
Loans in homogeneous portfolios are returned to accrual status when the borrower brings the loan to less than 30 days past due.
Additionally, loans in the non-homogeneous portfolio are returned to accrual status when, in management's opinion, projected cash
proceeds are sufficient to repay both principal and interest.
Restructured Loans
In cases where a borrower experiences financial difficulties and the Company makes certain concessionary modifications to
contractual terms, the loan is classified as a restructured (accruing) loan. Loans restructured at a rate equal to or greater than that of a
new loan with comparable risk at the time the contract is modified are not considered to be impaired loans in the calendar years
subsequent to the restructuring.
Generally, restructured loans in the non-homogeneous portfolios remain on nonaccrual for a period of six months to demonstrate
that the borrower can meet the restructured terms. However, performance prior to the restructuring, or significant events that coincidewith the restructuring, are included in assessing whether the borrower will be able to comply with the new terms and may result in the
loan being
83
returned to accrual at the time of restructuring or after a shorter performance period. If the borrower's ability to meet the revised
payment schedule is uncertain, the loan remains classified as a nonaccrual loan.
Foreclosed Assets
Foreclosed assets are accounted for at the lower of fair value (less estimated costs to sell) or cost. The amount the Company
ultimately recovers from foreclosed assets may differ substantially from the net carrying value of these assets because of future market
factors beyond the Company's control or because of changes in the Company's strategy for sale of the property.
Investment in Federal Home Loan Banks
The Company's investment in the stock of the Federal Home Loan Banks ("FHLBs") is carried at cost since it is not a readily
marketable security.
Transfers and Servicing of Financial Assets
Washington Mutual securitizes, sells and services interests in residential home loans and commercial real estate loans. When the
Company sells or securitizes loans, it generally retains the right to service the loans and may retain senior, subordinated, residual, or other interests, all of which are considered retained interests in the securitized assets. Gain on sale of the assets depends, in part, on
the Company's allocation of the previous carrying amount of the assets to the retained interests. Previous carrying amounts are
allocated in proportion to the relative fair values of the assets sold and the interests retained.
Quoted market prices, if available, are used to obtain fair values of senior, subordinated and residual interests. Generally,
quoted market prices for subordinated and residual interests are not available; therefore, the Company estimates the fair values based
upon the present value of the associated expected future cash flows. In determining the fair value of subordinated and residual
interests, management is required to make assumptions about future prepayment rates, discount rates, expected credit losses, and other
factors that impact the value of retained interests. See Note 7 to the Consolidated Financial Statements—"Mortgage Banking
Activities."
The fair value of the mortgage servicing rights ("MSR") is determined by reference to internally developed estimates of fair
http://www.sec.gov/Archives/edgar/data/933136/000104746904
146 9/17/2011
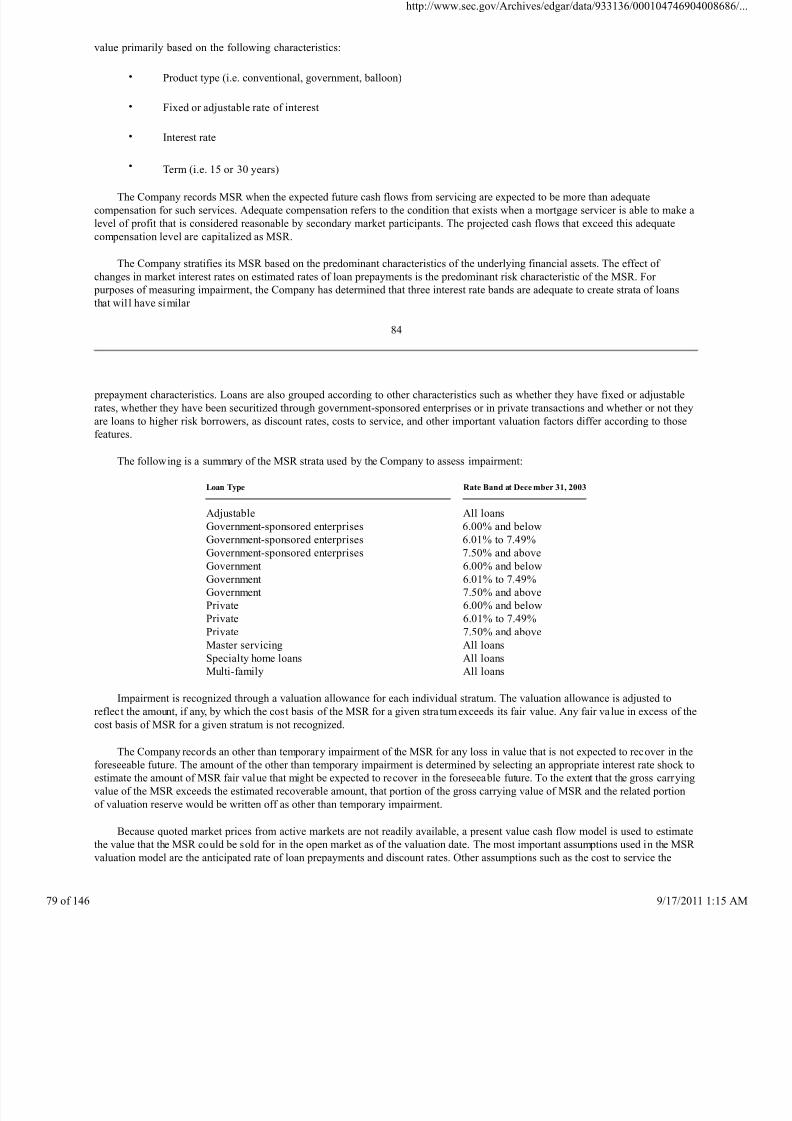
8/4/2019 Wamu 10-k 2003 Subprime
http://slidepdf.com/reader/full/wamu-10-k-2003-subprime 79/146
value primarily based on the following characteristics:
• Product type (i.e. conventional, government, balloon)
• Fixed or adjustable rate of interest
• Interest rate
•
Term (i.e. 15 or 30 years)
The Company records MSR when the expected future cash flows from servicing are expected to be more than adequate
compensation for such services. Adequate compensation refers to the condition that exists when a mortgage servicer is able to make a
level of profit that is considered reasonable by secondary market participants. The projected cash flows that exceed this adequate
compensation level are capitalized as MSR.
The Company stratifies its MSR based on the predominant characteristics of the underlying financial assets. The effect of
changes in market interest rates on estimated rates of loan prepayments is the predominant risk characteristic of the MSR. For
purposes of measuring impairment, the Company has determined that three interest rate bands are adequate to create strata of loans
that wil l have similar
84
prepayment characteristics. Loans are also grouped according to other characteristics such as whether they have fixed or adjustable
rates, whether they have been securitized through government-sponsored enterprises or in private transactions and whether or not they
are loans to higher risk borrowers, as discount rates, costs to service, and other important valuation factors differ according to those
features.
The following is a summary of the MSR strata used by the Company to assess impairment:
Loan Type
Rate Band at Dece mber 31, 2003
Adjustable All loans
Government-sponsored enterprises 6.00% and belowGovernment-sponsored enterprises 6.01% to 7.49%
Government-sponsored enterprises 7.50% and above
Government 6.00% and below
Government 6.01% to 7.49%
Government 7.50% and above
Private 6.00% and below
Private 6.01% to 7.49%
Private 7.50% and above
Master servicing All loans
Specialty home loans All loans
Multi-family All loans
Impairment is recognized through a valuation allowance for each individual stratum. The valuation allowance is adjusted toreflect the amount, if any, by which the cost basis of the MSR for a given stratum exceeds its fair value. Any fair value in excess of the
cost basis of MSR for a given stratum is not recognized.
The Company records an other than temporary impairment of the MSR for any loss in value that is not expected to recover in the
foreseeable future. The amount of the other than temporary impairment is determined by selecting an appropriate interest rate shock to
estimate the amount of MSR fair value that might be expected to recover in the foreseeable future. To the extent that the gross carrying
value of the MSR exceeds the estimated recoverable amount, that portion of the gross carrying value of MSR and the related portion
of valuation reserve would be written off as other than temporary impairment.
Because quoted market prices from active markets are not readily available, a present value cash flow model is used to estimate
the value that the MSR could be sold for in the open market as of the valuation date. The most important assumptions used in the MSR
valuation model are the anticipated rate of loan prepayments and discount rates. Other assumptions such as the cost to service the
http://www.sec.gov/Archives/edgar/data/933136/000104746904
146 9/17/2011
8/4/2019 Wamu 10-k 2003 Subprime
http://slidepdf.com/reader/full/wamu-10-k-2003-subprime 80/146
underlying loans, foreclosure costs, ancillary income and float rates are also used in determining the value of the MSR.
All of the assumptions are based on standards used by market participants in valuing MSR. The reasonableness of these
assumptions is confirmed through surveys conducted with independent brokers. They are reviewed and approved on a quarterly basis.
In addition, independent broker appraisals of the fair value of the MSR portfolio are obtained at least annually to confirm the
reasonableness of the value generated by the MSR valuation model.
Premises and Equipment
Land, buildings, leasehold improvements and equipment are carried at amortized cost. Buildings and equipment are depreciated
over their estimated useful lives using the straight-line method. The estimated
85
useful life of newly constructed buildings is 40 years and the lives of new assets that are added to existing buildings are based on the
remaining life of the original building. The estimated useful life for equipment is 3-10 years. Leasehold improvements are amortized
over the shorter of their useful lives or lease terms. The Company reviews buildings, leasehold improvements, and equipment for
impairment whenever events or changes in circumstances indicate that the asset may not generate enough income to recover its
carrying value. Impairment exists when, and in the amount by which, the carrying amount exceeds its fair value.
Goodwill and Other Intangible Assets
Goodwill and other intangible assets represent the excess of the purchase price over the fair value of net assets acquired in
business combinations under the purchase method of accounting. Other intangible assets include core deposit intangibles and other
finite-life intangible assets; these assets are amortized over their estimated useful lives ranging from 7-10 years. Goodwill is not
amortized, but instead is tested for impairment at the reporting unit level annually or more frequently if the presence of certain
circumstances indicates that impairment may have occurred. Impairment testing is also performed periodically on amortizing
intangible assets. Other intangible assets are classified as other assets on the Consolidated Statements of Financial Condition.
Securities Sold Under Agreements to Repurchase
The Company enters into agreements under which it sells securities subject to an obligation to repurchase the same or similar
securities ("repurchase agreements"). Under these arrangements, the Company transfers legal control over the assets but still retains
effective control through an agreement that both entitles and obligates the Company to repurchase the assets. As a result, repurchaseagreements are accounted for as collateralized financing arrangements and not as a sale and subsequent repurchase of securities. The
obligation to repurchase the securities is reflected as a liability in the Consolidated Statements of Financial Condition while the
securities underlying the agreements remain in the respective asset accounts. These securities are classified as pledged.
Stock-Based Compensation
In December 2002, the Financial Accounting Standards Board ("FASB") issued Statement No. 148, Accounting for Stock-Based
Compensation—Transition and Disclosure, which amends Statement No. 123, Accounting for Stock-Based Compensation. This
Statement provides alternative methods of transitioning, on a voluntary basis, from the intrinsic value method of accounting
prescribed by Accounting Principles Board ("APB") Opinion No. 25, Accounting for Stock Issued to Employees , to the fair value
method of accounting for stock-based employee compensation. Effective January 1, 2003 and in accordance with the transitional
guidance of Statement No. 148, the Company elected to prospectively apply the fair value method of accounting for stock-based
awards granted subsequent to December 31, 2002. For such awards, fair value is estimated using a binomial option pricing model,with compensation expense recognized in earnings over the required service period. Stock-based awards granted prior to January 1,
2003, and not modified after December 31, 2002, will continue to be accounted for under APB Opinion No. 25, and the pro forma
presentation of what the impact to the financial statements would be if these awards were accounted for on the fair value basis will
continue to be disclosed in the Notes to Consolidated Financial Statements until the last of those awards vest in 2005.
Had compensation cost for the Company's stock-based compensation plans been determined using the fair value method
consistent with Statement No. 123 for all periods presented, the Company's net
86
http://www.sec.gov/Archives/edgar/data/933136/000104746904
146 9/17/2011
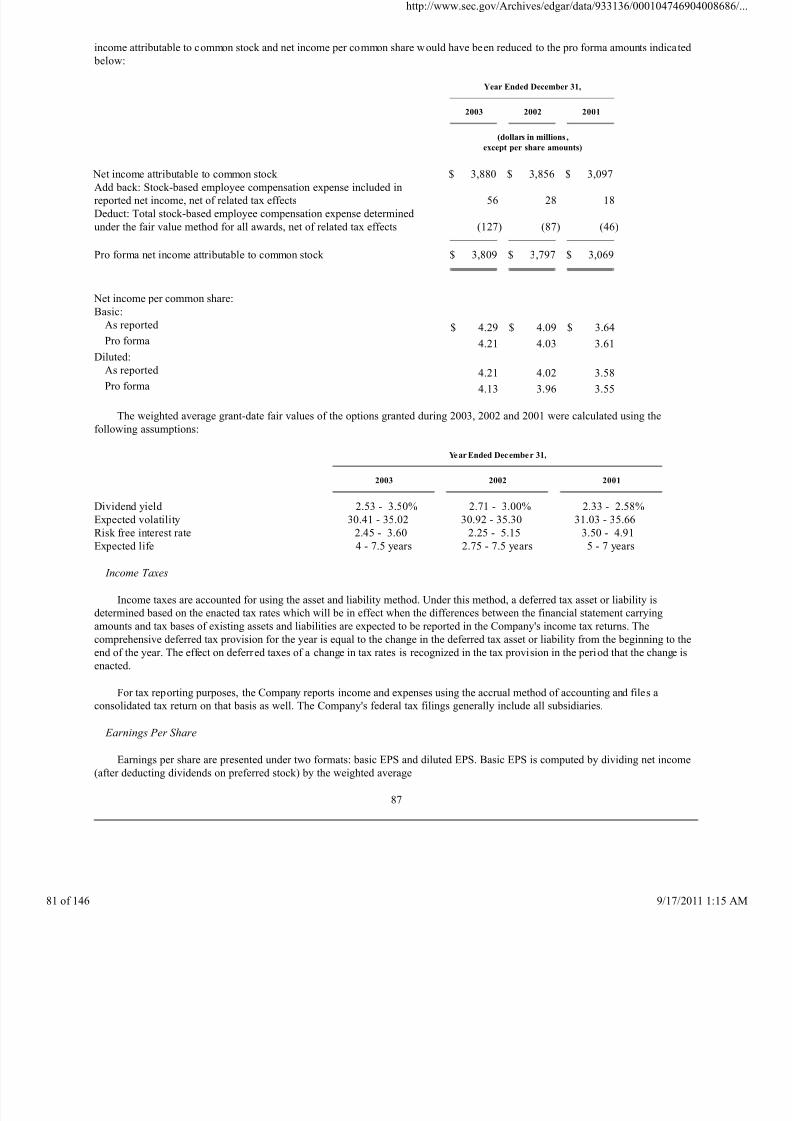
8/4/2019 Wamu 10-k 2003 Subprime
http://slidepdf.com/reader/full/wamu-10-k-2003-subprime 81/146
income attributable to common stock and net income per common share would have been reduced to the pro forma amounts indicated
below:
Year Ended December 31,
2003
2002
2001
(dollars in millions ,
except per share amounts)
Net income attributable to common stock $ 3,880 $ 3,856 $ 3,097Add back: Stock-based employee compensation expense included in
reported net income, net of related tax effects
56 28 18
Deduct: Total stock-based employee compensation expense determined
under the fair value method for all awards, net of related tax effects
(127) (87) (46)
Pro forma net income attributable to common stock $ 3,809 $ 3,797 $ 3,069
Net income per common share:
Basic:
As reported $ 4.29 $ 4.09 $ 3.64
Pro forma 4.21 4.03 3.61
Diluted:
As reported 4.21 4.02 3.58
Pro forma 4.13 3.96 3.55
The weighted average grant-date fair values of the options granted during 2003, 2002 and 2001 were calculated using the
following assumptions:
Year Ended December 31,
2003
2002
2001
Dividend yield 2.53 - 3.50% 2.71 - 3.00% 2.33 - 2.58%
Expected volatility 30.41 - 35.02 30.92 - 35.30 31.03 - 35.66Risk free interest rate 2.45 - 3.60 2.25 - 5.15 3.50 - 4.91
Expected life 4 - 7.5 years 2.75 - 7.5 years 5 - 7 years
Income Taxes
Income taxes are accounted for using the asset and liability method. Under this method, a deferred tax asset or liability is
determined based on the enacted tax rates which will be in effect when the differences between the financial statement carrying
amounts and tax bases of existing assets and liabilities are expected to be reported in the Company's income tax returns. The
comprehensive deferred tax provision for the year is equal to the change in the deferred tax asset or liability from the beginning to the
end of the year. The effect on deferred taxes of a change in tax rates is recognized in the tax provision in the period that the change is
enacted.
For tax reporting purposes, the Company reports income and expenses using the accrual method of accounting and files a
consolidated tax return on that basis as well. The Company's federal tax filings generally include all subsidiaries.
Earnings Per Share
Earnings per share are presented under two formats: basic EPS and diluted EPS. Basic EPS is computed by dividing net income
(after deducting dividends on preferred stock) by the weighted average
87
http://www.sec.gov/Archives/edgar/data/933136/000104746904
146 9/17/2011
8/4/2019 Wamu 10-k 2003 Subprime
http://slidepdf.com/reader/full/wamu-10-k-2003-subprime 82/146
number of common shares outstanding during the year. Diluted EPS is computed by dividing net income (after deducting dividends on
preferred stock) by the weighted average number of common shares outstanding during the year, plus the impact of dilutive potential
common shares, such as stock options.
Derivatives and Hedging Activities
The Company enters into derivative contracts to manage the various risks associated with certain assets, liabilities, or probable
forecasted transactions. On the date the Company enters into a derivative contract, the derivative instrument is designated as: (1) a
hedge of the fair value of a recognized asset or liability or of an unrecognized firm commitment (a "fair value" hedge); (2) a hedge of
the variability in expected future cash flows associated with an existing recognized asset or liability or a probable forecasted
transaction (a "cash flow" hedge); or (3) held for other risk management purposes ("risk management derivatives").
In a fair value hedge, changes in the fair value of the hedging derivative are recognized in earnings and offset by recognizing
changes in the fair value of the hedged item attributable to the risk being hedged. To the extent that the hedge is ineffective, the
changes in fair value will not offset and the difference is reflected in earnings.
In a cash flow hedge, the effective portion of the change in the fair value of the hedging derivative is recorded in accumulated
other comprehensive income and is subsequently reclassified into earnings during the same period in which the hedged item affects
earnings. The change in fair value of any ineffective portion of the hedging derivative is recognized immediately in earnings.
The changes in fair value of the risk management derivatives held for other risk management purposes are recorded in
revaluation gain from derivatives or gain (loss) from mortgage loans if the derivatives are home loan mortgage banking related, or are
recorded in other income for derivatives related to other types of asset/liability interest rate risk management.
The Company formally documents the relationship between the hedging instruments and hedged items, as well as its risk
management objective and s trategy before undertaking the hedge. To qualify for hedge accounting, the derivatives and related hedged
items must be designated as a hedge. For hedging relationships in which effectiveness is measured, the correlation between the
hedging instruments and hedged items are assessed at inception of the hedge and on an ongoing basis , which includes determining
whether the hedge relationship is expected to be highly effective in offsetting changes in fair value or cash flows of hedged items. If it
is determined that the derivative instrument is not highly effective as a hedge, hedge accounting is discontinued.
The Company discontinues hedge accounting prospectively when (1) it determines that the derivative is no longer effective in
offsetting changes in the fair value or cash flows of the designated hedged item; (2) the derivative expires or is sold, terminated, or
exercised; (3) the derivative is de-designated as a fair value or cash flow hedge; or (4) it is probable that the forecasted transaction
will not occur by the end of the originally specified time period.
If the Company determines that the derivative no longer qualifies as a fair value or cash flow hedge and therefore hedgeaccounting is discontinued, the derivative (if retained) will continue to be recorded on the balance sheet at its fair value with changes
in fair value included in current earnings. For a discontinued fair value hedge, the previously hedged item no longer is adjusted for
changes in fair value.
When hedge accounting is discontinued because it is probable that a forecasted transaction will not occur, the derivative will
continue to be recorded on the balance sheet at its fair value with changes in fair value included in current earnings, and the gains and
losses in accumulated other comprehensive income
88
wil l be recognized immediately in earnings. When hedge accounting is discontinued because the hedging instrument is sold,
terminated or de-designated as a hedge, the amount reported in accumulated other comprehensive income through the date of sale,
termination, or de-designation will continue to be reported in accumulated other comprehensive income until the forecasted
transaction impacts earnings.
The Company occasionally purchases or originates financial instruments that contain an embedded derivative instrument. At
inception of the financial instrument, the Company determines whether an embedded derivative is required to be accounted for
separately as a derivative. This is determined by assessing whether the economic characteristics and risks of the embedded
derivative instrument are clearly and closely related to the economic characteristics of the financial instrument (host contract). Under
Statement No. 133, Accounting for Derivative Instruments and Hedging Activities, an embedded derivative is required to be
accounted for separately as a derivative if the embedded derivative instrument is determined not to be clearly and closely related to
the host contract, the host contract is not currently measured at fair value with changes in fair value reported in earnings and the
http://www.sec.gov/Archives/edgar/data/933136/000104746904
146 9/17/2011
8/4/2019 Wamu 10-k 2003 Subprime
http://slidepdf.com/reader/full/wamu-10-k-2003-subprime 83/146
embedded derivative instrument separately would qualify as a derivative instrument. As of December 31, 2003, 2002 and 2001, all of
the Company's embedded derivatives were considered clearly and closely related to the host contract and therefore were not required
to be separated from their host contracts.
The Company enters into commitments to make loans whereby the interest rate on the loan is set prior to funding (rate lock
commitments). The Company also enters into commitments to purchase mortgage loans through its correspondent channel (purchase
commitments). Both rate lock and purchase commitments on mortgage loans that are intended to be sold are considered to be
derivatives. In addition, purchase commitments for mortgage loans that will be held for investment purposes can qualify as
derivatives. Those types of loan commitments are evaluated under the definition of a derivative to determine whether Statement
No. 133 is applicable. Rate lock and purchase commitments that are considered to be derivatives are recorded, at fair value, in other
assets on the Consolidated Statements of Financial Condition with changes in fair value recorded in gain from mortgage loans on the
Consolidated Statements of Income. In measuring the fair value of rate lock and purchase commitments, the amount of the expected
servicing rights is included in the valuation. This value is calculated using the same methodologies as are used to value the
Company's MSR, adjusted using an anticipated fallout factor for loan commitments that are not expected to be funded. This policy of
recognizing the value of the derivative has the effect of recognizing the gain from mortgage loans before the loans are sold. Both rate
lock and purchase commitments expose the Company to interest rate risk. The Company manages that risk by entering into various
interest rate contracts that are recorded at fair value with changes in fair value reported in gain from mortgage loans.
Recently Issued Accounting Standards
In December 2003, the FASB issued Interpretation No. 46R ("FIN 46R"), Consolidation of Variable Interest Entities, an
interpretation of Accounting Research Bulletin No. 51. FIN 46R is a revision to the original FIN 46 that addresses the consolidation
of certain variable interest entities (e.g., non-qualified special purpose entities). The revis ion clarifies how variable interest entities
should be identified and evaluated for consolidation purposes. FIN 46R must be applied no later than March 31, 2004. The Companyadopted FIN 46 as of July 1, 2003. The Company is still in the process of studying and evaluating the impact of FIN 46R. However, at
this time the Company does not expect the impact of FIN 46R to have a significant effect on the results of operations or financial
condition.
In December 2003, the Accounting Standards Executive Committee of the AICPA issued Statement of Posi tion No. 03-3 ("SOP
03-3"), Accounting for Certain Loans or Debt Securities Acquired in a Transfer . SOP 03-3 addresses the accounting for differences
between the contractual cash flows and the cash flows
89
expected to be collected from purchased loans or debt securities if those differences are attributable, in part, to credit quality. SOP
03-3 requires purchased loans and debt securities to be recorded initially at fair value based on the present value of the cash flows
expected to be collected with no carryover of any valuation allowance previously recognized by the seller. Interest income should be
recognized based on the effective yield from the cash flows expected to be collected. To the extent that the purchased loans
experience subsequent deterioration in credit quality, a valuation allowance would be established for any additional cash flows that
are not expected to be received. However, if more cash flows subsequently are expected to be received than originally estimated, the
effective yield would be adjusted on a prospective basis. SOP 03-3 will be effective for loans and debt securities acquired after
December 31, 2004. Although the Company anticipates that the implementation of SOP 03-3 wil l require significant loan system and
operational changes to track credit related losses on loans purchased starting in 2005, it is not expected to have a significant effect on
the Consolidated Financial Statements.
In March 2004, Securities and Exchange Commission ("SEC") Staff Accounting Bulletin No. 105 was issued, which provides
guidance regarding loan commitments that are accounted for as derivative instruments under FASB No. 133 (as amended), Accounting for Derivative Instruments and Hedging Activities. In this Bulletin, the SEC ruled that the amount of the expected
servicing rights should not be included when determining the fair value of derivative interest rate lock commitments. This guidance
must be applied to rate locks initiated after March 31, 2004. In anticipation of this Bulletin, the Company prospectively changed its
accounting policy for derivative rate lock commitments on January 1, 2004. Under the new policy, the expected servicing rights that
had previously been recorded at the initiation of the rate lock are not recognized until the underlying loans are sold. The impact that
this new policy will have on the Company's results of operations in the first quarter of 2004 will be significantly influenced by that
quarter's amount of salable rate lock volume and by the timing of when loan sales are executed. As rate lock volume is highly
sensitive to changes in interest rates and the timing of loan sales may be affected by market conditions, the Company cannot provide a
reliable estimate of the impact this change will have to its future results of operations.
Recently Adopted Accounting Standards
http://www.sec.gov/Archives/edgar/data/933136/000104746904
146 9/17/2011
8/4/2019 Wamu 10-k 2003 Subprime
http://slidepdf.com/reader/full/wamu-10-k-2003-subprime 84/146
In June 2001, the FASB issued Statement No. 143, Accounting for Asset Retirement Obligations . Statement No. 143 addresses
the accounting and reporting for obligations associated with the retirement of tangible, long-lived assets. The Statement became
effective January 1, 2003 and did not have a material impact on the results of operations or financial condition of the Company.
In June 2002, the FASB issued Statement No. 146 , Accounting for Costs Associated with Exit or Disposal Activit ies. This
Statement requires that a liability for costs associated with an exit or disposal activity be recognized when the liability is incurred
and be measured at fair value and adjusted for changes in estimated cash flows. Existing generally accepted accounting principles
provide for the recognition of such costs at the date of management's commitment to an exit plan. Under Statement No. 146,
management's commitment to an exit plan would not be sufficient, by itself, to recognize a liability. The Statement is effective for exit
or disposal activities initiated after December 31, 2002 and did not have a material impact on the results of operations or financial
condition of the Company.
In November 2002, the FASB issued Interpretation No. 45 ("FIN 45"), Guarantor's Accounting and Disclosure Requirements
for Guarantees, Including Indirect Guarantees of Indebtedness of Others, which expands on the accounting guidance of Statements
No. 5, 57 and 107 and incorporates without change the provisions of FASB Interpretation No. 34, which is being superseded. This
Interpretation requires a guarantor to recognize, at the inception of the guarantee, a liability for the fair value of the obligation
undertaken in issuing the guarantee. The recognition requirements of FIN 45 apply prospectively to
90
guarantees issued or modified after December 31, 2002. Refer to Note 15 to the Consolidated Financial Statements—"Guarantees"for discussion on significant guarantees that have been entered into by the Company.
In January 2003, the FASB issued Interpretation No. 46 ("FIN 46"), Consolidation of Variable Interest Entities. This
Interpretation provides guidance on how to identify a variable interest entity and determine when the assets, liabilities, noncontrolling
interests and results of operations of a variable interest entity should be consolidated by the primary beneficiary. The primary
beneficiary is the enterprise that will absorb a majority of the variable interest entity's expected losses or receive a majority of the
expected residual returns as a result of holding variable interests. The Company adopted the provisions of FIN 46 for variable
interest entities formed on or after February 1, 2003, which did not have a material effect on the Consolidated Financial Statements.
The Company adopted the provisions of FIN 46 for existing variable interest entities on July 1, 2003, which did not have a material
effect on the Consolidated Financial Statements.
In April 2003, the FASB issued Statement No. 149, Amendment of Statement 133 on Derivative Instruments and Hedging
Activities. Statement No. 149 provides clarification on the definition of derivative instruments within the scope of FASB Statement No. 133. Generally, this Statement is effective for contracts entered into or modified after June 30, 2003 and for hedging relationships
designated after June 30, 2003, and did not have a material impact on the Consolidated Financial Statements.
In May 2003, the FASB issued Statement No. 150, Accounting for Certain Financial Instruments with Characteristics of both
Liabilities and Equity. Statement No. 150 establishes standards for how an issuer classifies and measures certain financial
instruments with characteristics of both liabilities and equity. This Statement, which was effective for financial instruments entered
into or modified after May 31, 2003 and for all financial instruments on July 1, 2003, did not have a material impact on the
Consolidated Financial Statements.
In December 2003, the FASB issued a revised version of Statement No. 132, Employers' Disclosures about Pensions and
Other Postretirement Benefits. The revised Statement requires companies to provide more details about plan assets, benefit
obligations, cash flows, benefit costs, and other relevant information. Companies are required to provide (1) a breakdown of plan
assets by category (e.g. equity and debt), (2) a description of investment policies and strategies and target allocation percentages or ranges, (3) projections of future benefit payments, and (4) an estimate of contributions to be made in the next year. In addition,
companies are required to provide various elements of pension and other postretirement benefit costs on a quarterly basis. Statement
No. 132 is effective as of December 31, 2003. The new disclosures are reflected in Note 21 of the Consolidated Financial Statements
—"Employee Benefits Programs and Other Expense".
Note 2: Restatements of Financial Statements
(a) During the fourth quarter of 2003, the Company concluded that the inclusion of certain components (i.e. deferred acquisition
costs and claims stabilization reserves) in the cash surrender value of its bank-owned life insurance policies was incorrect. The
accounting policy the Company previously used resulted in the overstatement of the cash surrender value of the policies and,
accordingly, other noninterest income. This restatement also decreased other assets, and correspondingly, retained earnings by
$73 million and $38 million as of December 31, 2002 and 2001. The Company has corrected its accounting
http://www.sec.gov/Archives/edgar/data/933136/000104746904
146 9/17/2011
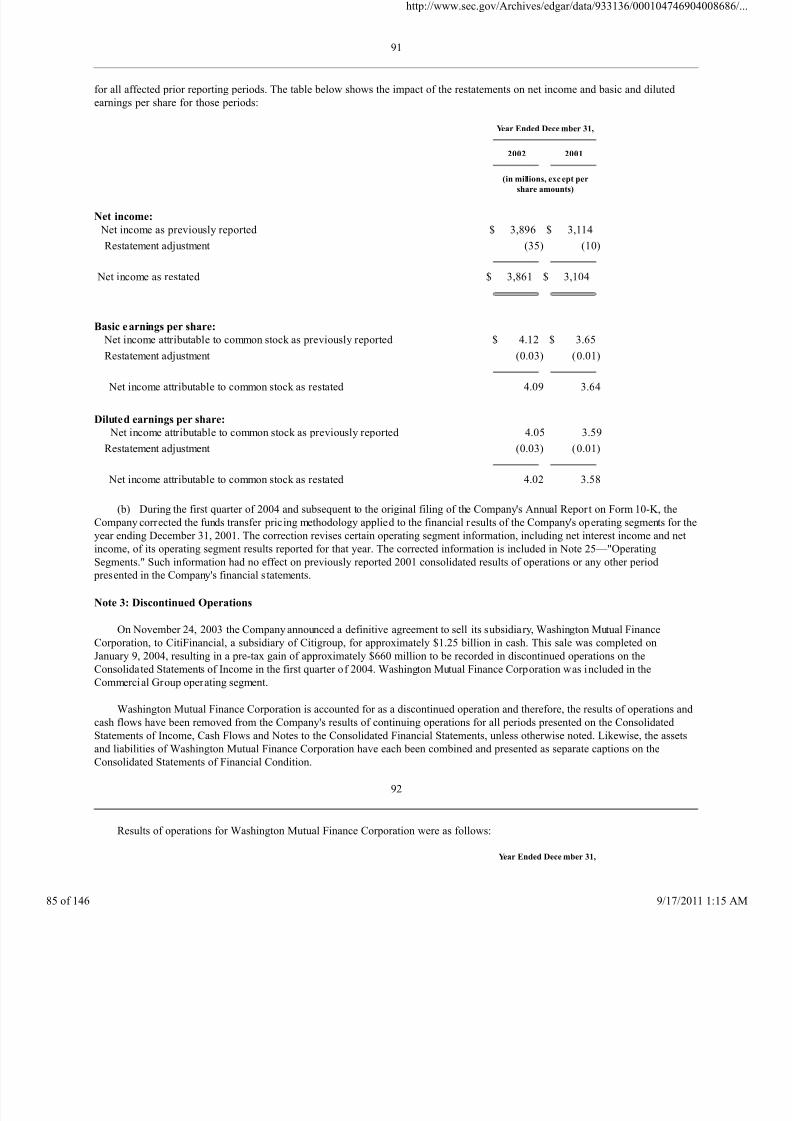
8/4/2019 Wamu 10-k 2003 Subprime
http://slidepdf.com/reader/full/wamu-10-k-2003-subprime 85/146
91
for all affected prior reporting periods. The table below shows the impact of the restatements on net income and basic and diluted
earnings per share for those periods:
Year Ended Dece mber 31,
2002
2001
(in millions, exc ept per
share amounts)
Net income:
Net income as previously reported $ 3,896 $ 3,114
Restatement adjustment (35) (10)
Net income as restated $ 3,861 $ 3,104
Basic earnings per share:
Net income attributable to common stock as previously reported $ 4.12 $ 3.65
Restatement adjustment (0.03) (0.01)
Net income attributable to common stock as restated 4.09 3.64
Diluted earnings per share:
Net income attributable to common stock as previously reported 4.05 3.59
Restatement adjustment (0.03) (0.01)
Net income attributable to common stock as restated 4.02 3.58
(b) During the first quarter of 2004 and subsequent to the original filing of the Company's Annual Report on Form 10-K, the
Company corrected the funds transfer pricing methodology applied to the financial results of the Company's operating segments for theyear ending December 31, 2001. The correction revises certain operating segment information, including net interest income and net
income, of its operating segment results reported for that year. The corrected information is included in Note 25—"Operating
Segments." Such information had no effect on previously reported 2001 consolidated results of operations or any other period
presented in the Company's financial s tatements.
Note 3: Discontinued Operations
On November 24, 2003 the Company announced a definitive agreement to sell its subsidiary, Washington Mutual Finance
Corporation, to CitiFinancial, a subsidiary of Citigroup, for approximately $1.25 billion in cash. This sale was completed on
January 9, 2004, resulting in a pre-tax gain of approximately $660 million to be recorded in discontinued operations on the
Consolidated Statements of Income in the first quarter of 2004. Washington Mutual Finance Corporation was included in the
Commercial Group operating segment.
Washington Mutual Finance Corporation is accounted for as a discontinued operation and therefore, the results of operations and
cash flows have been removed from the Company's results of continuing operations for all periods presented on the Consolidated
Statements of Income, Cash Flows and Notes to the Consolidated Financial Statements, unless otherwise noted. Likewise, the assets
and liabilities of Washington Mutual Finance Corporation have each been combined and presented as separate captions on the
Consolidated Statements of Financial Condition.
92
Results of operations for Washington Mutual Finance Corporation were as follows:
Year Ended Dece mber 31,
http://www.sec.gov/Archives/edgar/data/933136/000104746904
146 9/17/2011
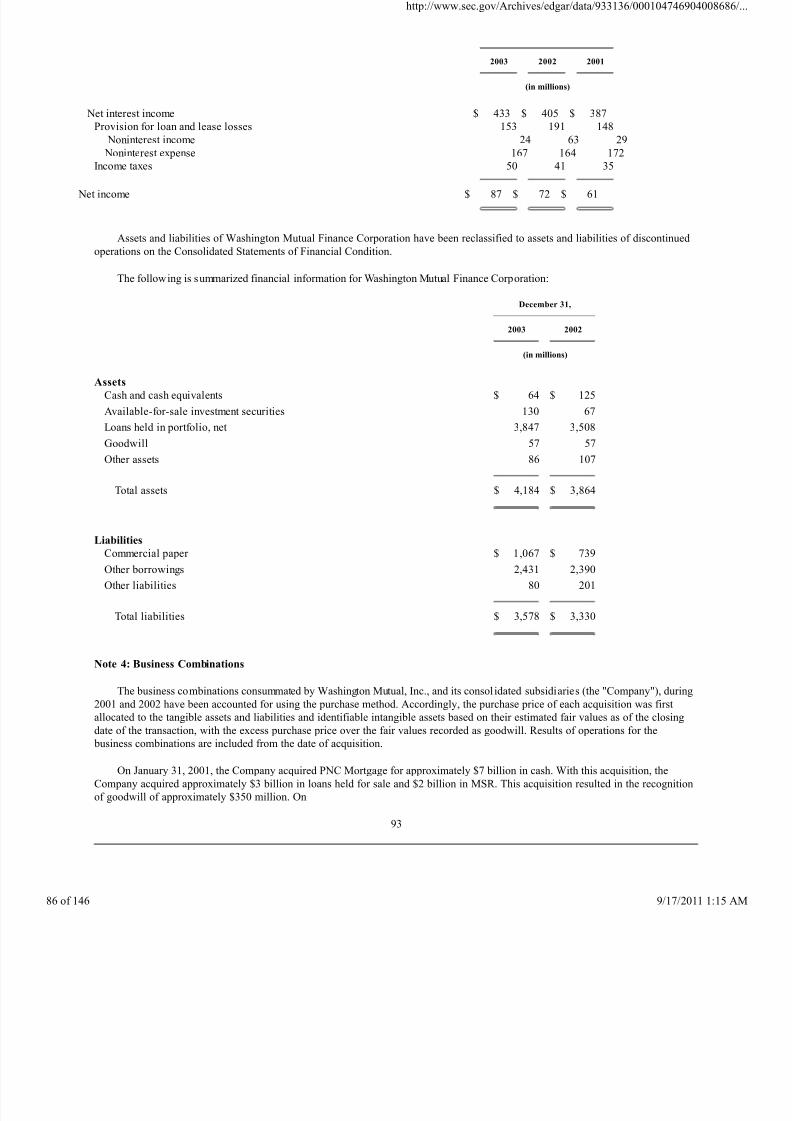
8/4/2019 Wamu 10-k 2003 Subprime
http://slidepdf.com/reader/full/wamu-10-k-2003-subprime 86/146
2003
2002
2001
(in millions)
Net interest income $ 433 $ 405 $ 387
Provision for loan and lease losses 153 191 148
Noninterest income 24 63 29
Noninterest expense 167 164 172
Income taxes 50 41 35
Net income $ 87 $ 72 $ 61
Assets and liabilities of Washington Mutual Finance Corporation have been reclassified to assets and liabilities of discontinued
operations on the Consolidated Statements of Financial Condition.
The following is summarized financial information for Washington Mutual Finance Corporation:
December 31,
2003
2002
(in millions)
Assets
Cash and cash equivalents $ 64 $ 125
Available-for-sale investment securities 130 67
Loans held in portfolio, net 3,847 3,508
Goodwill 57 57
Other assets 86 107
Total assets $ 4,184 $ 3,864
Liabilities
Commercial paper $ 1,067 $ 739
Other borrowings 2,431 2,390
Other liabilities 80 201
Total liabilities $ 3,578 $ 3,330
Note 4: Business Combinations
The business combinations consummated by Washington Mutual, Inc., and its consol idated subsidiaries (the "Company"), during
2001 and 2002 have been accounted for using the purchase method. Accordingly, the purchase price of each acquisition was firstallocated to the tangible assets and liabilities and identifiable intangible assets based on their estimated fair values as of the closing
date of the transaction, with the excess purchase price over the fair values recorded as goodwill. Results of operations for the
business combinations are included from the date of acquisition.
On January 31, 2001, the Company acquired PNC Mortgage for approximately $7 billion in cash. With this acquisition, the
Company acquired approximately $3 billion in loans held for sale and $2 billion in MSR. This acquisition resulted in the recognition
of goodwill of approximately $350 million. On
93
http://www.sec.gov/Archives/edgar/data/933136/000104746904
146 9/17/2011
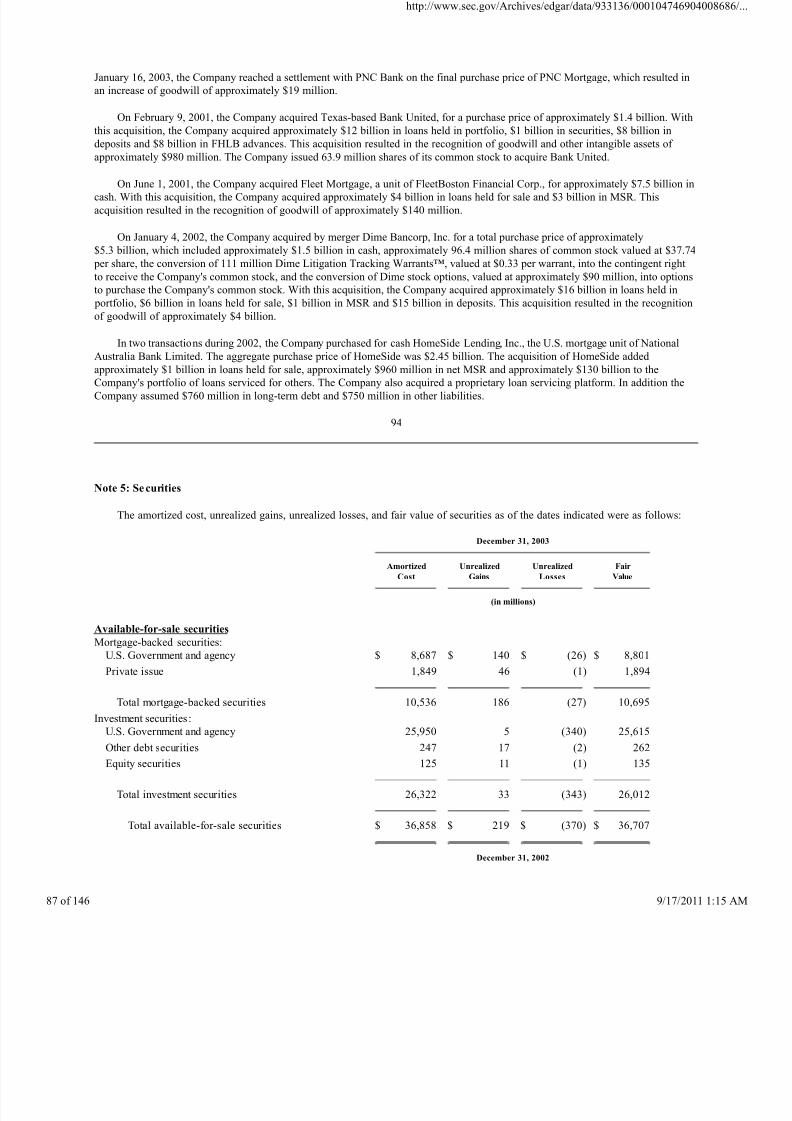
8/4/2019 Wamu 10-k 2003 Subprime
http://slidepdf.com/reader/full/wamu-10-k-2003-subprime 87/146
January 16, 2003, the Company reached a settlement with PNC Bank on the final purchase price of PNC Mortgage, which resulted in
an increase of goodwill of approximately $19 million.
On February 9, 2001, the Company acquired Texas-based Bank United, for a purchase price of approximately $1.4 billion. With
this acquisition, the Company acquired approximately $12 billion in loans held in portfolio, $1 billion in securities, $8 billion in
deposits and $8 billion in FHLB advances. This acquisition resulted in the recognition of goodwill and other intangible assets of
approximately $980 million. The Company issued 63.9 million shares of its common stock to acquire Bank United.
On June 1, 2001, the Company acquired Fleet Mortgage, a unit of FleetBoston Financial Corp., for approximately $7.5 billion in
cash. With this acquisition, the Company acquired approximately $4 billion in loans held for sale and $3 billion in MSR. This
acquisition resulted in the recognition of goodwill of approximately $140 million.
On January 4, 2002, the Company acquired by merger Dime Bancorp, Inc. for a total purchase price of approximately
$5.3 billion, which included approximately $1.5 billion in cash, approximately 96.4 million shares of common stock valued at $37.74
per share, the conversion of 111 million Dime Litigation Tracking Warrants™, valued at $0.33 per warrant, into the contingent right
to receive the Company's common stock, and the conversion of Dime stock options, valued at approximately $90 million, into options
to purchase the Company's common stock. With this acquisition, the Company acquired approximately $16 billion in loans held in
portfolio, $6 billion in loans held for sale, $1 billion in MSR and $15 billion in deposits. This acquisition resulted in the recognition
of goodwill of approximately $4 billion.
In two transactions during 2002, the Company purchased for cash HomeSide Lending, Inc., the U.S. mortgage unit of National
Australia Bank Limited. The aggregate purchase price of HomeSide was $2.45 billion. The acquisition of HomeSide added
approximately $1 billion in loans held for sale, approximately $960 million in net MSR and approximately $130 billion to the
Company's portfolio of loans serviced for others. The Company also acquired a proprietary loan servicing platform. In addition the
Company assumed $760 million in long-term debt and $750 million in other liabilities.
94
Note 5: Securities
The amortized cost, unrealized gains, unrealized losses, and fair value of securities as of the dates indicated were as follows:
December 31, 2003
Amortized
Cost
Unrealized
Gains
Unrealized
Losses
Fair
Value
(in millions)
Available-for-sale securities
Mortgage-backed securities:
U.S. Government and agency $ 8,687 $ 140 $ (26) $ 8,801
Private issue 1,849 46 (1) 1,894
Total mortgage-backed securities 10,536 186 (27) 10,695
Investment securities:
U.S. Government and agency 25,950 5 (340) 25,615
Other debt securities 247 17 (2) 262
Equity securities 125 11 (1) 135
Total investment securities 26,322 33 (343) 26,012
Total available-for-sale securities $ 36,858 $ 219 $ (370) $ 36,707
December 31, 2002
http://www.sec.gov/Archives/edgar/data/933136/000104746904
146 9/17/2011
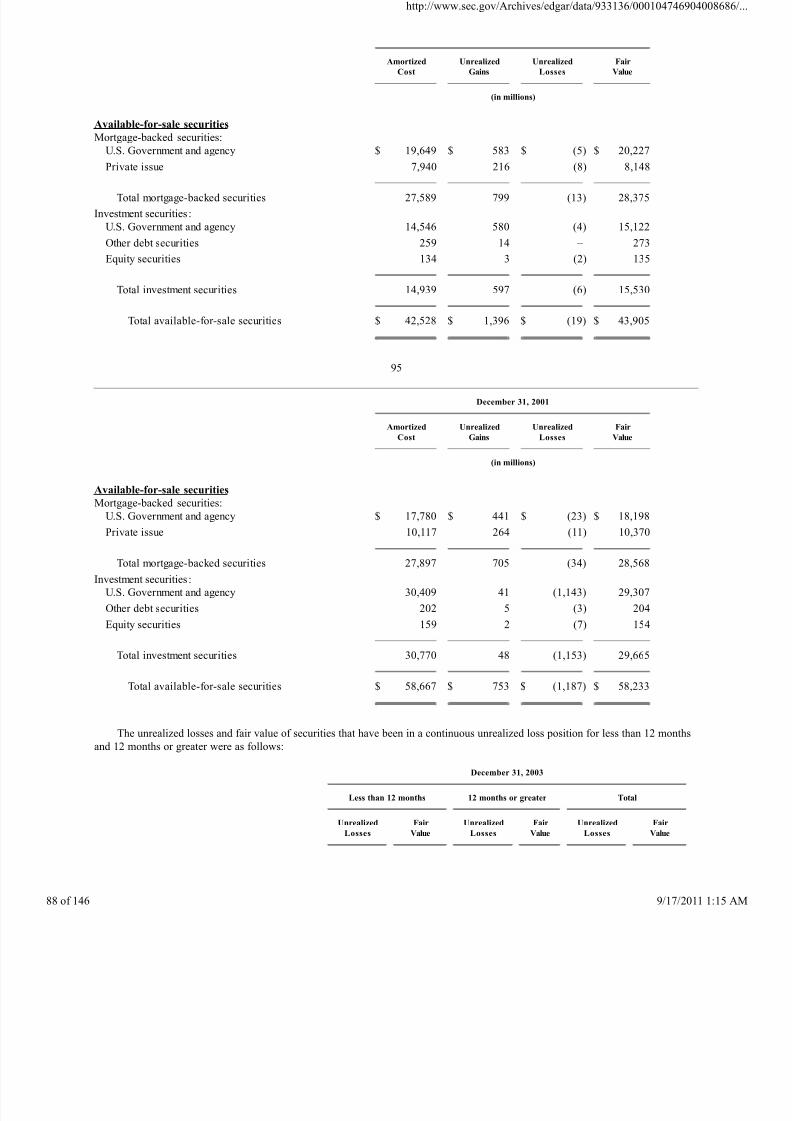
8/4/2019 Wamu 10-k 2003 Subprime
http://slidepdf.com/reader/full/wamu-10-k-2003-subprime 88/146
Amortized
Cost
Unrealized
Gains
Unrealized
Losses
Fair
Value
(in millions)
Available-for-sale securities
Mortgage-backed securities:
U.S. Government and agency $ 19,649 $ 583 $ (5) $ 20,227
Private issue 7,940 216 (8) 8,148
Total mortgage-backed securities 27,589 799 (13) 28,375
Investment securities:
U.S. Government and agency 14,546 580 (4) 15,122
Other debt securities 259 14 – 273
Equity securities 134 3 (2) 135
Total investment securities 14,939 597 (6) 15,530
Total available-for-sale securities $ 42,528 $ 1,396 $ (19) $ 43,905
95
December 31, 2001
Amortized
Cost
Unrealized
Gains
Unrealized
Losses
Fair
Value
(in millions)
Available-for-sale securities
Mortgage-backed securities:
U.S. Government and agency $ 17,780 $ 441 $ (23) $ 18,198
Private issue 10,117 264 (11) 10,370
Total mortgage-backed securities 27,897 705 (34) 28,568
Investment securities:
U.S. Government and agency 30,409 41 (1,143) 29,307
Other debt securities 202 5 (3) 204
Equity securities 159 2 (7) 154
Total investment securities 30,770 48 (1,153) 29,665
Total available-for-sale securities $ 58,667 $ 753 $ (1,187) $ 58,233
The unrealized losses and fair value of securities that have been in a continuous unrealized loss position for less than 12 months
and 12 months or greater were as follows:
December 31, 2003
Less than 12 months
12 months or greater
Total
Unrealized
Losses
Fair
Value
Unrealized
Losses
Fair
Value
Unrealized
Losses
Fair
Value
http://www.sec.gov/Archives/edgar/data/933136/000104746904
146 9/17/2011
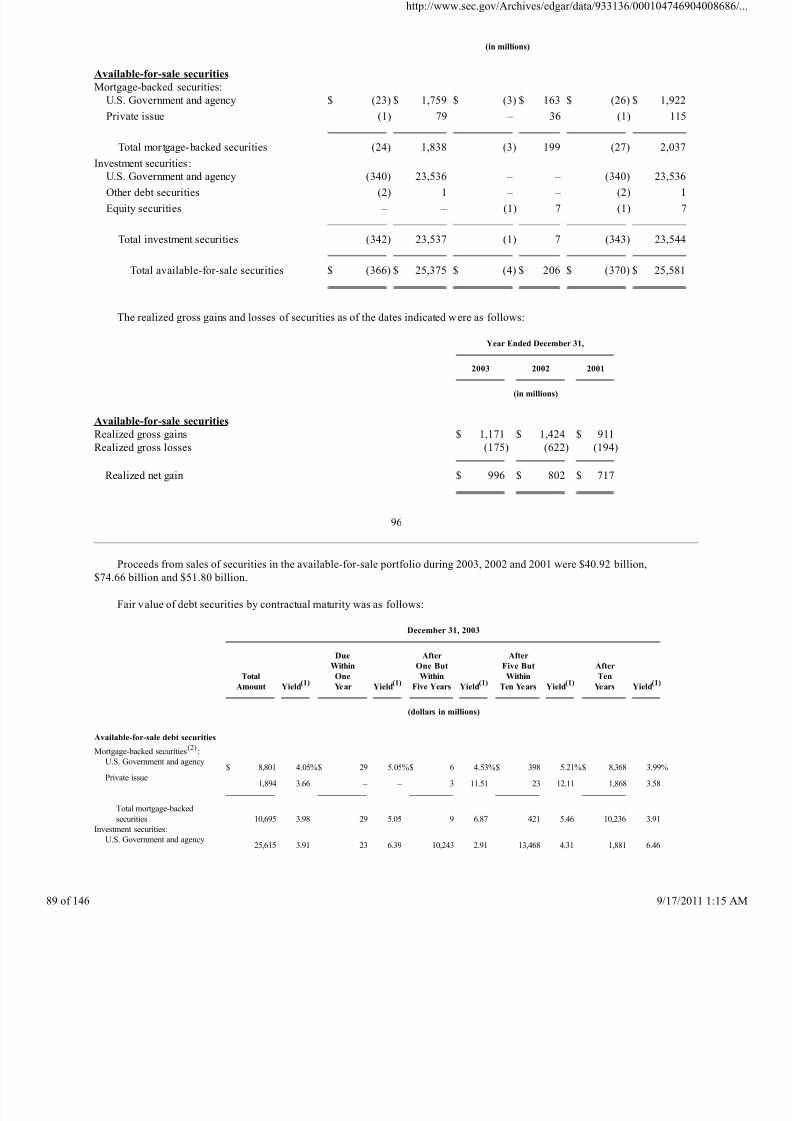
8/4/2019 Wamu 10-k 2003 Subprime
http://slidepdf.com/reader/full/wamu-10-k-2003-subprime 89/146
(in millions)
Available-for-sale securities
Mortgage-backed securities:
U.S. Government and agency $ (23) $ 1,759 $ (3) $ 163 $ (26) $ 1,922
Private issue (1) 79 – 36 (1) 115
Total mor tgage-backed securities (24) 1,838 (3) 199 (27) 2,037
Investment securities:
U.S. Government and agency (340) 23,536 – – (340) 23,536
Other debt securities (2) 1 – – (2) 1
Equity securities – – (1) 7 (1) 7
Total investment securities (342) 23,537 (1) 7 (343) 23,544
Total available-for-sale securities $ (366) $ 25,375 $ (4) $ 206 $ (370) $ 25,581
The realized gross gains and losses of securities as of the dates indicated were as follows:
Year Ended December 31,
2003
2002
2001
(in millions)
Available-for-sale securities
Realized gross gains $ 1,171 $ 1,424 $ 911
Realized gross losses (175) (622) (194)
Realized net gain $ 996 $ 802 $ 717
96
Proceeds from sales of securities in the available-for-sale portfolio during 2003, 2002 and 2001 were $40.92 billion,
$74.66 billion and $51.80 billion.
Fair value of debt securities by contractual maturity was as follows:
December 31, 2003
Total
Amount
Yield(1)
Due
Within
One
Year
Yield(1)
After
One But
Within
Five Years
Yield(1)
After
Five But
Within
Ten Years
Yield(1)
After
Ten
Years
Yield(1)
(dollars in millions)
Available-for-sale debt securities
Mortgage-backed securities(2)
:
U.S. Government and agency$ 8,801 4.05%$ 29 5.05%$ 6 4.53%$ 398 5.21%$ 8,368 3.99%
Private issue1,894 3.66 – – 3 11.51 23 12.11 1,868 3.58
Total mortgage-backed
securities
10,695 3.98 29 5.05 9 6.87 421 5.46 10,236 3.91
Investment securities:
U.S. Government and agency25,615 3.91 23 6.39 10,243 2.91 13,468 4.31 1,881 6.46
http://www.sec.gov/Archives/edgar/data/933136/000104746904
146 9/17/2011
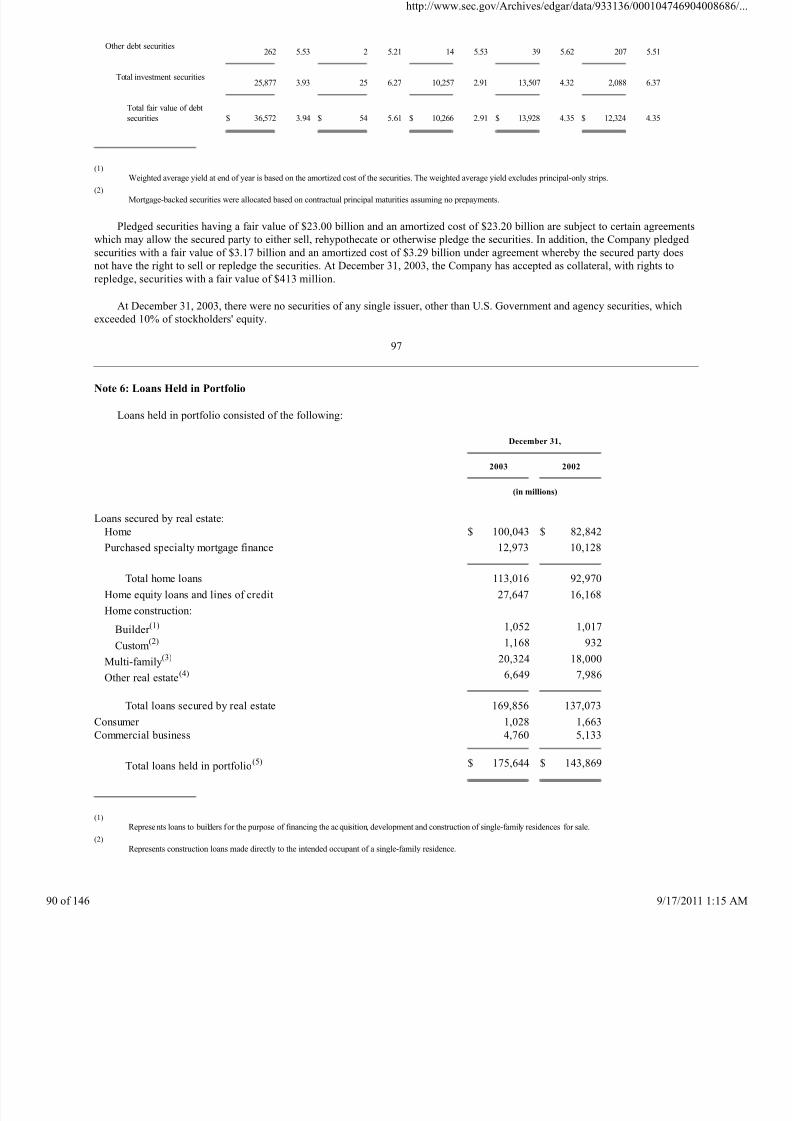
8/4/2019 Wamu 10-k 2003 Subprime
http://slidepdf.com/reader/full/wamu-10-k-2003-subprime 90/146
Other debt securities262 5.53 2 5.21 14 5.53 39 5.62 207 5.51
Total investment securities25,877 3.93 25 6.27 10,257 2.91 13,507 4.32 2,088 6.37
Total fair value of debt
securities
$ 36,572 3.94 $ 54 5.61 $ 10,266 2.91 $ 13,928 4.35 $ 12,324 4.35
(1)
Weighted average yield at end of year is based on the amortized cost of the securities. The weighted average yield excludes principal-only strips.
(2)
Mortgage-backed securities were allocated based on contractual principal maturities assuming no prepayments.
Pledged securities having a fair value of $23.00 billion and an amortized cost of $23.20 billion are subject to certain agreements
which may allow the secured party to either sell, rehypothecate or otherwise pledge the securities. In addition, the Company pledged
securities with a fair value of $3.17 billion and an amortized cost of $3.29 billion under agreement whereby the secured party does
not have the right to sell or repledge the securities. At December 31, 2003, the Company has accepted as collateral, with rights to
repledge, securities with a fair value of $413 million.
At December 31, 2003, there were no securities of any single issuer, other than U.S. Government and agency securities, which
exceeded 10% of stockholders' equity.
97
Note 6: Loans Held in Portfolio
Loans held in portfolio consisted of the following:
December 31,
2003
2002
(in millions)
Loans secured by real estate:
Home $ 100,043 $ 82,842
Purchased specialty mortgage finance 12,973 10,128
Total home loans 113,016 92,970
Home equity loans and lines of credit 27,647 16,168
Home construction:
Builder (1) 1,052 1,017
Custom(2) 1,168 932
Multi-family(3) 20,324 18,000
Other real estate(4) 6,649 7,986
Total loans secured by real estate 169,856 137,073
Consumer 1,028 1,663
Commercial business 4,760 5,133
Total loans held in portfolio(5) $ 175,644 $ 143,869
(1)
Represents loans to builders for the purpose of financing the acquisition, development and construction of single-family residences for sale.
(2)
Represents construction loans made directly to the intended occupant of a single-family residence.
http://www.sec.gov/Archives/edgar/data/933136/000104746904
146 9/17/2011
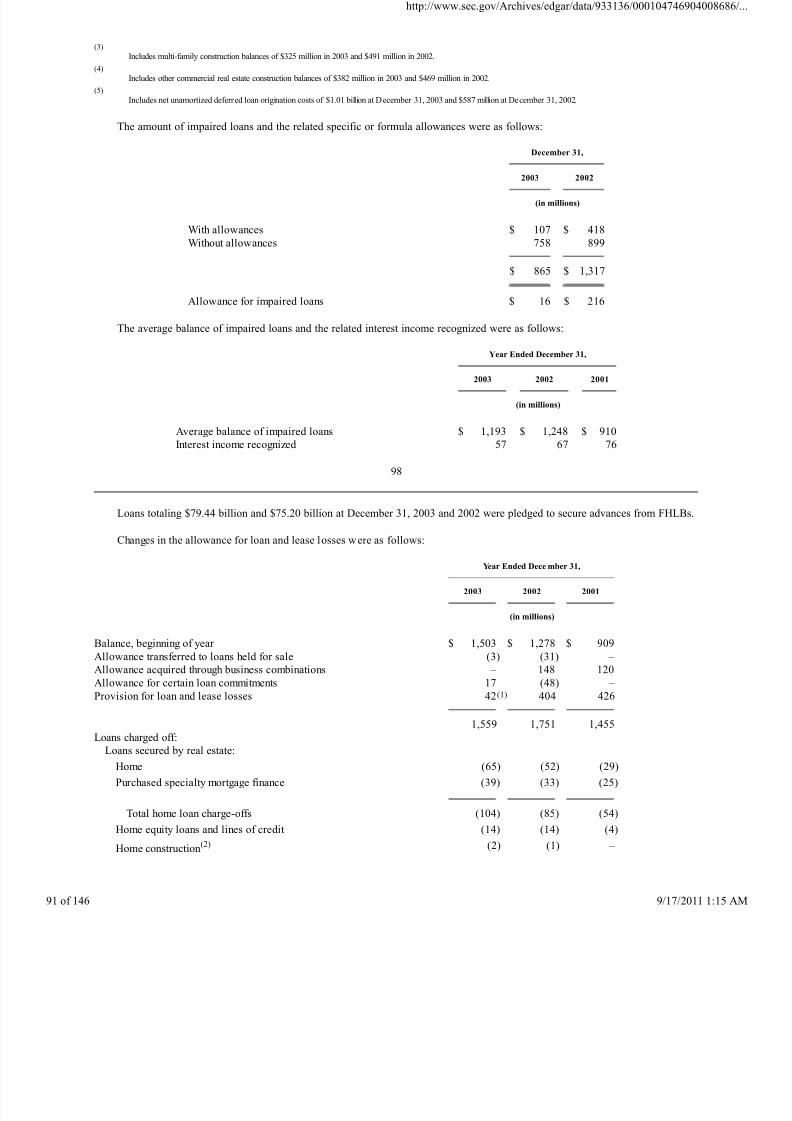
8/4/2019 Wamu 10-k 2003 Subprime
http://slidepdf.com/reader/full/wamu-10-k-2003-subprime 91/146
(3)
Includes multi-family construction balances of $325 million in 2003 and $491 million in 2002.
(4)
Includes other commercial real estate construction balances of $382 million in 2003 and $469 million in 2002.
(5)
Includes net unamortized deferred loan origination costs of $1.01 billion at December 31, 2003 and $587 million at December 31, 2002.
The amount of impaired loans and the related specific or formula allowances were as follows:
December 31,
2003
2002
(in millions)
With allowances $ 107 $ 418
Without allowances 758 899
$ 865 $ 1,317
Allowance for impaired loans $ 16 $ 216
The average balance of impaired loans and the related interest income recognized were as follows:
Year Ended December 31,
2003
2002
2001
(in millions)
Average balance of impaired loans $ 1,193 $ 1,248 $ 910
Interest income recognized 57 67 76
98
Loans totaling $79.44 billion and $75.20 billion at December 31, 2003 and 2002 were pledged to secure advances from FHLBs.
Changes in the allowance for loan and lease losses were as follows:
Year Ended Dece mber 31,
2003
2002
2001
(in millions)
Balance, beginning of year $ 1,503 $ 1,278 $ 909
Allowance transferred to loans held for sale (3) (31) –
Allowance acquired through business combinations – 148 120
Allowance for certain loan commitments 17 (48) –
Provision for loan and lease losses 42(1)
404 426
1,559 1,751 1,455
Loans charged off:
Loans secured by real estate:
Home (65) (52) (29)
Purchased specialty mortgage finance (39) (33) (25)
Total home loan charge-offs (104) (85) (54)
Home equity loans and lines of credit (14) (14) (4)
Home construction(2) (2) (1) –
http://www.sec.gov/Archives/edgar/data/933136/000104746904
146 9/17/2011
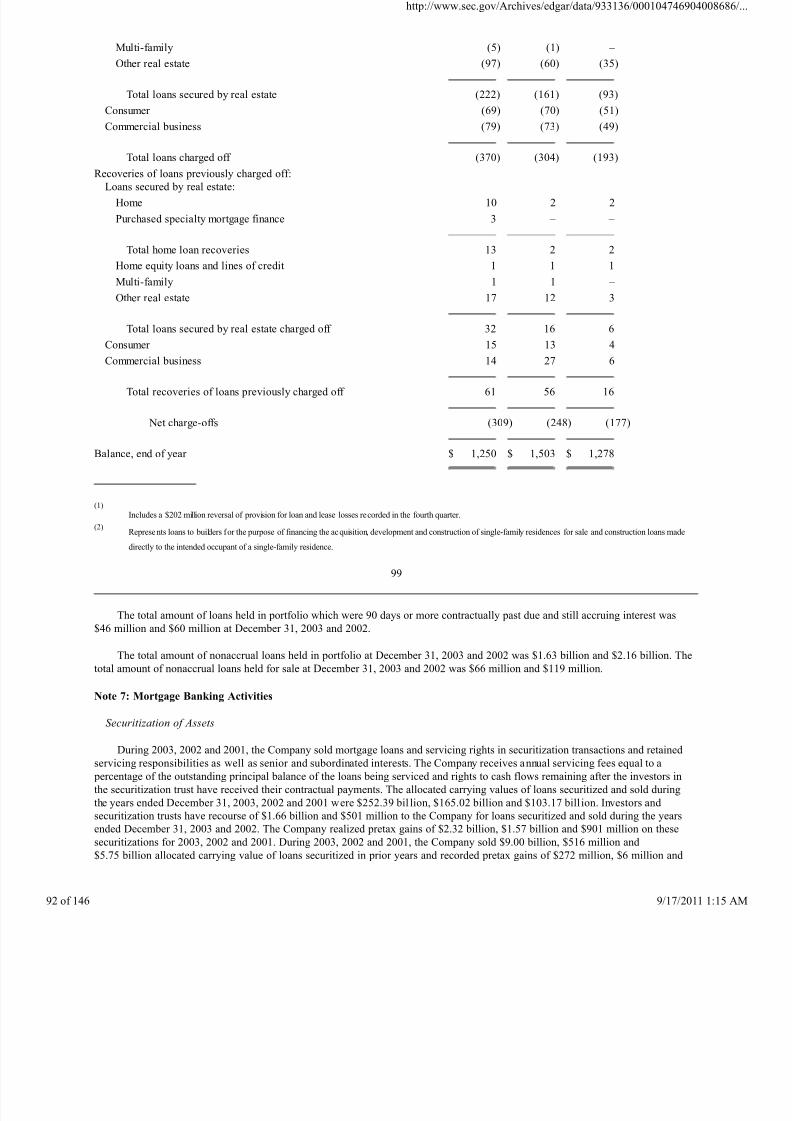
8/4/2019 Wamu 10-k 2003 Subprime
http://slidepdf.com/reader/full/wamu-10-k-2003-subprime 92/146
Multi-family (5) (1) –
Other real estate (97) (60) (35)
Total loans secured by real estate (222) (161) (93)
Consumer (69) (70) (51)
Commercial business (79) (73) (49)
Total loans charged off (370) (304) (193)
Recoveries of loans previously charged off:Loans secured by real estate:
Home 10 2 2
Purchased specialty mortgage finance 3 – –
Total home loan recoveries 13 2 2
Home equity loans and lines of credit 1 1 1
Multi-family 1 1 –
Other real estate 17 12 3
Total loans secured by real estate charged off 32 16 6
Consumer 15 13 4Commercial business 14 27 6
Total recoveries of loans previously charged off 61 56 16
Net charge-offs (309) (248) (177)
Balance, end of year $ 1,250 $ 1,503 $ 1,278
(1)
Includes a $202 million reversal of provision for loan and lease losses recorded in the fourth quarter.
(2)Represents loans to builders for the purpose of financing the acquisition, development and construction of single-family residences for sale and construction loans made
directly to the intended occupant of a single-family residence.
99
The total amount of loans held in portfolio which were 90 days or more contractually past due and still accruing interest was
$46 million and $60 million at December 31, 2003 and 2002.
The total amount of nonaccrual loans held in portfolio at December 31, 2003 and 2002 was $1.63 billion and $2.16 billion. The
total amount of nonaccrual loans held for sale at December 31, 2003 and 2002 was $66 million and $119 million.
Note 7: Mortgage Banking Activities
Securitization of Assets
During 2003, 2002 and 2001, the Company sold mortgage loans and servicing rights in securitization transactions and retained
servicing responsibilities as well as senior and subordinated interests. The Company receives annual servicing fees equal to a
percentage of the outstanding principal balance of the loans being serviced and rights to cash flows remaining after the investors in
the securitization trust have received their contractual payments. The allocated carrying values of loans securitized and sold during
the years ended December 31, 2003, 2002 and 2001 were $252.39 bil lion, $165.02 billion and $103.17 bill ion. Investors and
securitization trusts have recourse of $1.66 billion and $501 million to the Company for loans securitized and sold during the years
ended December 31, 2003 and 2002. The Company realized pretax gains of $2.32 billion, $1.57 billion and $901 million on these
securitizations for 2003, 2002 and 2001. During 2003, 2002 and 2001, the Company sold $9.00 billion, $516 million and
$5.75 billion allocated carrying value of loans securitized in prior years and recorded pretax gains of $272 million, $6 million and
http://www.sec.gov/Archives/edgar/data/933136/000104746904
146 9/17/2011
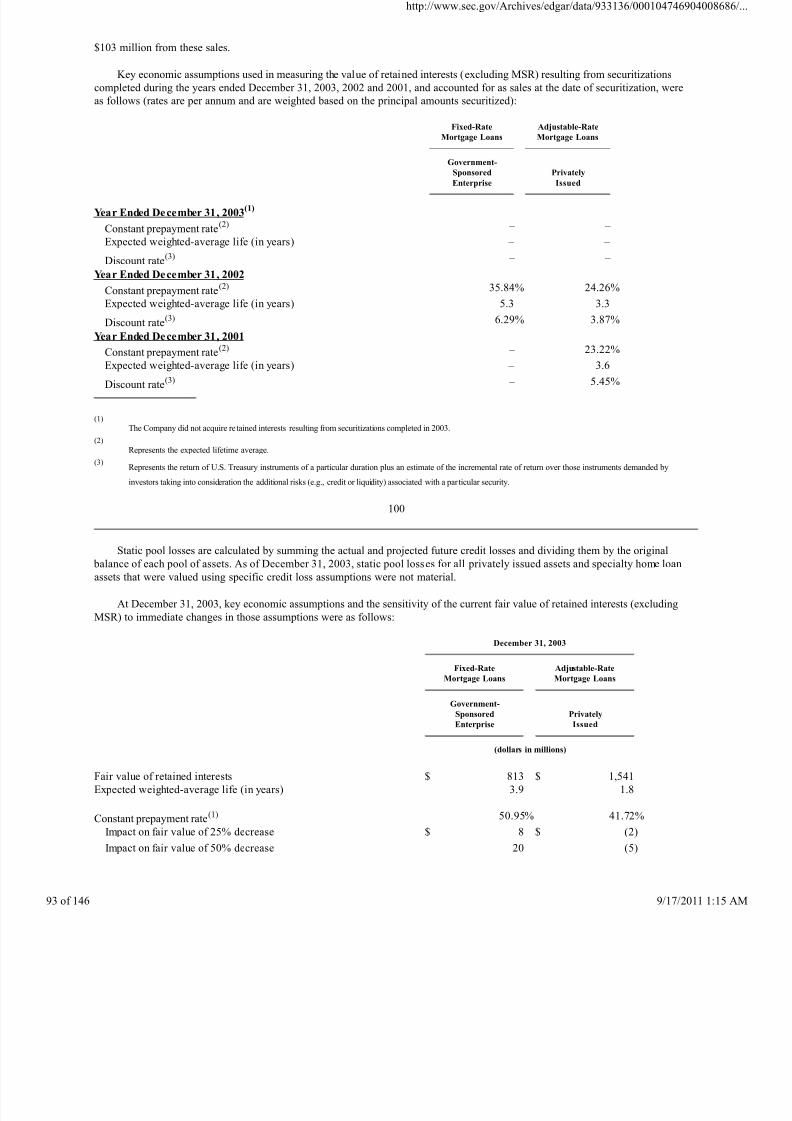
8/4/2019 Wamu 10-k 2003 Subprime
http://slidepdf.com/reader/full/wamu-10-k-2003-subprime 93/146
$103 million from these sales.
Key economic assumptions used in measuring the value of retained interests (excluding MSR) resulting from securitizations
completed during the years ended December 31, 2003, 2002 and 2001, and accounted for as sales at the date of securitization, were
as follows (rates are per annum and are weighted based on the principal amounts securitized):
Fixed-Rate
Mortgage Loans
Adjustable-Rate
Mortgage Loans
Government-
SponsoredEnterprise
PrivatelyIssued
Year Ended December 31, 2003(1)
Constant prepayment rate(2) – –
Expected weighted-average life (in years) – –
Discount rate(3) – –
Year Ended December 31, 2002
Constant prepayment rate(2) 35.84% 24.26%
Expected weighted-average life (in years) 5.3 3.3
Discount rate(3) 6.29% 3.87%
Year Ended December 31, 2001
Constant prepayment rate(2) – 23.22%
Expected weighted-average life (in years) – 3.6
Discount rate(3) – 5.45%
(1)
The Company did not acquire retained interests resulting from securitizations completed in 2003.
(2)
Represents the expected lifetime average.
(3)Represents the return of U.S. Treasury instruments of a particular duration plus an estimate of the incremental rate of return over those instruments demanded by
investors taking into consideration the additional risks (e.g., credit or liquidity) associated with a particular security.
100
Static pool losses are calculated by summing the actual and projected future credit losses and dividing them by the original
balance of each pool of assets. As of December 31, 2003, static pool losses for all privately issued assets and specialty home loan
assets that were valued using specific credit loss assumptions were not material.
At December 31, 2003, key economic assumptions and the sensitivity of the current fair value of retained interests (excluding
MSR) to immediate changes in those assumptions were as follows:
December 31, 2003
Fixed-Rate
Mortgage Loans
Adjustable-Rate
Mortgage Loans
Government-
Sponsored
Enterprise
Privately
Issued
(dollars in millions)
Fair value of retained interests $ 813 $ 1,541
Expected weighted-average life (in years) 3.9 1.8
Constant prepayment rate(1) 50.95% 41.72%
Impact on fair value of 25% decrease $ 8 $ (2)
Impact on fair value of 50% decrease 20 (5)
http://www.sec.gov/Archives/edgar/data/933136/000104746904
146 9/17/2011
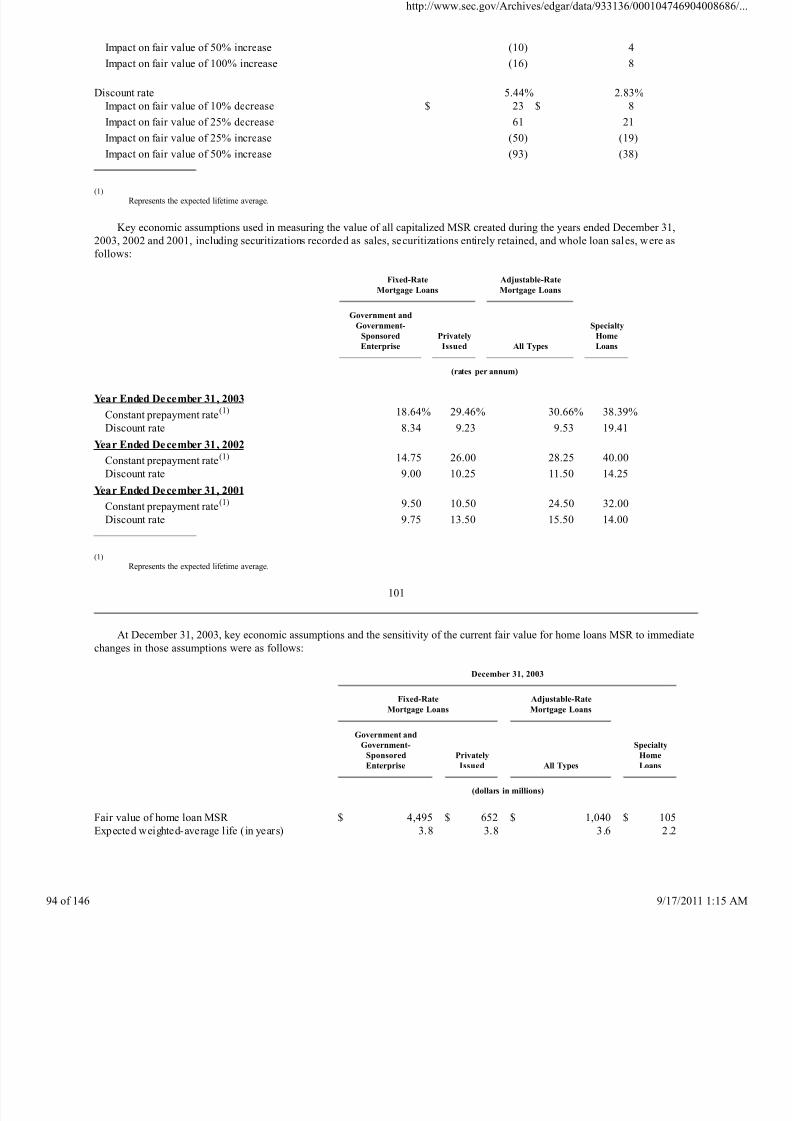
8/4/2019 Wamu 10-k 2003 Subprime
http://slidepdf.com/reader/full/wamu-10-k-2003-subprime 94/146
Impact on fair value of 50% increase (10) 4
Impact on fair value of 100% increase (16) 8
Discount rate 5.44% 2.83%
Impact on fair value of 10% decrease $ 23 $ 8
Impact on fair value of 25% decrease 61 21
Impact on fair value of 25% increase (50) (19)
Impact on fair value of 50% increase (93) (38)
(1)
Represents the expected lifetime average.
Key economic assumptions used in measuring the value of all capitalized MSR created during the years ended December 31,
2003, 2002 and 2001, including securitizations recorded as sales, securitizations entirely retained, and whole loan sales, were as
follows:
Fixed-Rate
Mortgage Loans
Adjustable-Rate
Mortgage Loans
Government and
Government-
Sponsored
Enterprise
Privately
Issued
All Types
Specialty
Home
Loans
(rates per annum)
Year Ended December 31, 2003
Constant prepayment rate(1) 18.64% 29.46% 30.66% 38.39%
Discount rate 8.34 9.23 9.53 19.41
Year Ended December 31, 2002
Constant prepayment rate(1) 14.75 26.00 28.25 40.00
Discount rate 9.00 10.25 11.50 14.25
Year Ended December 31, 2001
Constant prepayment rate(1) 9.50 10.50 24.50 32.00
Discount rate 9.75 13.50 15.50 14.00
(1)
Represents the expected lifetime average.
101
At December 31, 2003, key economic assumptions and the sensitivity of the current fair value for home loans MSR to immediate
changes in those assumptions were as follows:
December 31, 2003
Fixed-RateMortgage Loans
Adjustable-RateMortgage Loans
Government and
Government-
Sponsored
Enterprise
Privately
Issued
All Types
Specialty
Home
Loans
(dollars in millions)
Fair value of home loan MSR $ 4,495 $ 652 $ 1,040 $ 105
Expected weighted-average life (in years) 3.8 3.8 3.6 2.2
http://www.sec.gov/Archives/edgar/data/933136/000104746904
146 9/17/2011
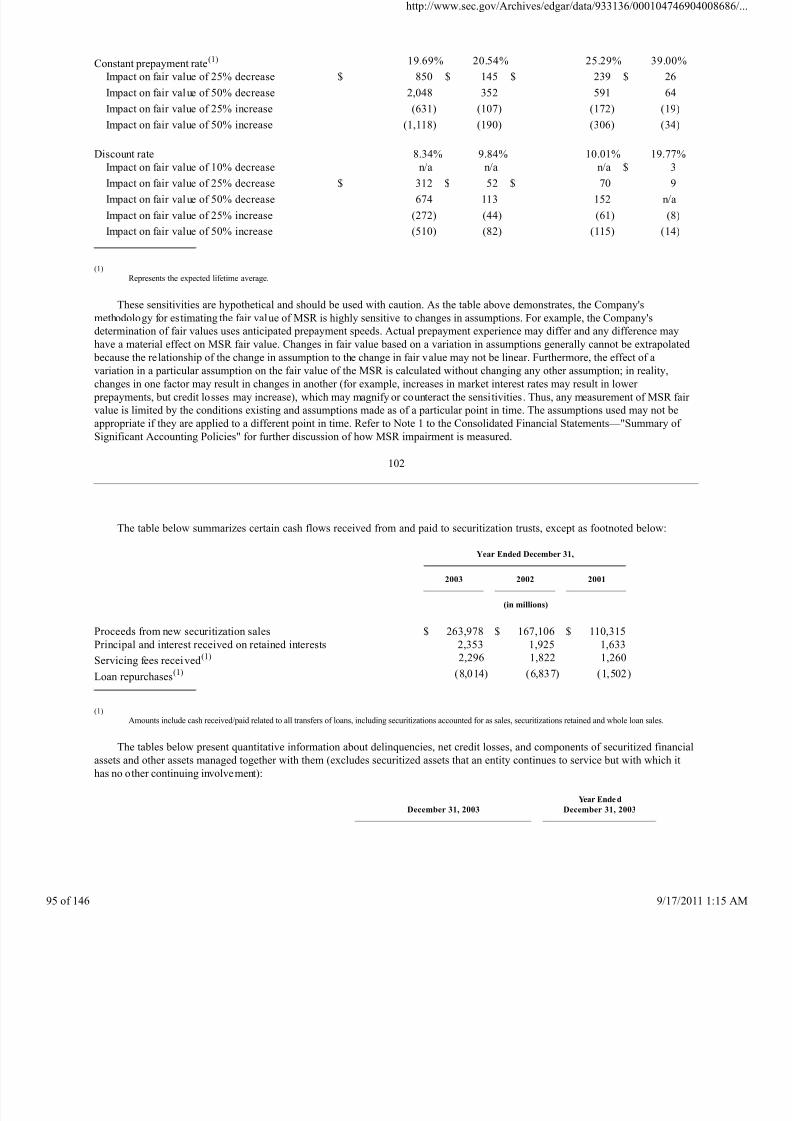
8/4/2019 Wamu 10-k 2003 Subprime
http://slidepdf.com/reader/full/wamu-10-k-2003-subprime 95/146
Constant prepayment rate(1) 19.69% 20.54% 25.29% 39.00%
Impact on fair value of 25% decrease $ 850 $ 145 $ 239 $ 26
Impact on fair value of 50% decrease 2,048 352 591 64
Impact on fair value of 25% increase (631) (107) (172) (19)
Impact on fair value of 50% increase (1,118) (190) (306) (34)
Discount rate 8.34% 9.84% 10.01% 19.77%
Impact on fair value of 10% decrease n/a n/a n/a $ 3
Impact on fair value of 25% decrease $ 312 $ 52 $ 70 9
Impact on fair value of 50% decrease 674 113 152 n/a
Impact on fair value of 25% increase (272) (44) (61) (8)
Impact on fair value of 50% increase (510) (82) (115) (14)
(1)
Represents the expected lifetime average.
These sensitivities are hypothetical and should be used with caution. As the table above demonstrates, the Company's
methodology for estimating the fair value of MSR is highly sensitive to changes in assumptions. For example, the Company's
determination of fair values uses anticipated prepayment speeds. Actual prepayment experience may differ and any difference may
have a material effect on MSR fair value. Changes in fair value based on a variation in assumptions generally cannot be extrapolated because the relationship of the change in assumption to the change in fair value may not be linear. Furthermore, the effect of a
variation in a particular assumption on the fair value of the MSR is calculated without changing any other assumption; in reality,
changes in one factor may result in changes in another (for example, increases in market interest rates may result in lower
prepayments, but credit losses may increase), which may magnify or counteract the sensitivities. Thus, any measurement of MSR fair
value is limited by the conditions existing and assumptions made as of a particular point in time. The assumptions used may not be
appropriate if they are applied to a different point in time. Refer to Note 1 to the Consolidated Financial Statements—"Summary of
Significant Accounting Policies" for further discussion of how MSR impairment is measured.
102
The table below summarizes certain cash flows received from and paid to securitization trusts, except as footnoted below:
Year Ended December 31,
2003
2002
2001
(in millions)
Proceeds from new securitization sales $ 263,978 $ 167,106 $ 110,315
Principal and interest received on retained interests 2,353 1,925 1,633
Servicing fees received(1) 2,296 1,822 1,260
Loan repurchases(1) (8,014) (6,837) (1,502)
(1)
Amounts include cash received/paid related to all transfers of loans, including securitizations accounted for as sales, securitizations retained and whole loan sales.
The tables below present quantitative information about delinquencies, net credit losses, and components of securitized financial
assets and other assets managed together with them (excludes securitized assets that an entity continues to service but with which it
has no other continuing involvement):
December 31, 2003
Year Ende d
December 31, 2003
http://www.sec.gov/Archives/edgar/data/933136/000104746904
146 9/17/2011
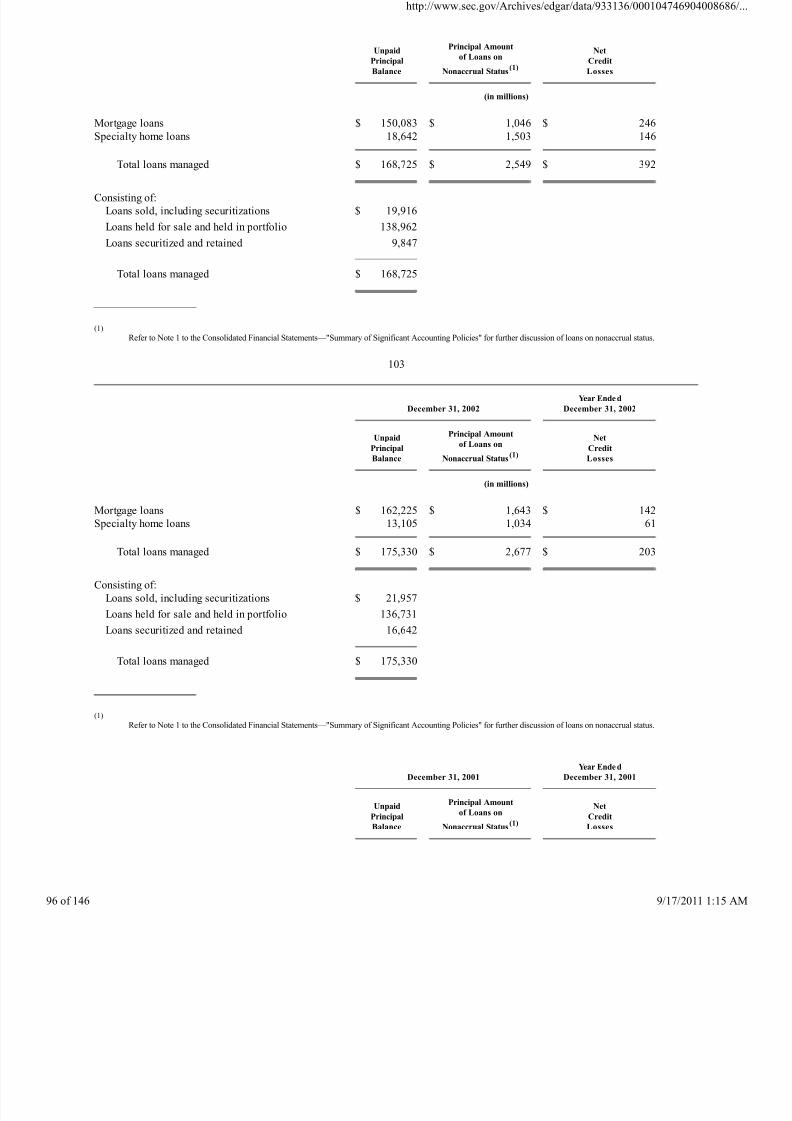
8/4/2019 Wamu 10-k 2003 Subprime
http://slidepdf.com/reader/full/wamu-10-k-2003-subprime 96/146
Unpaid
Principal
Balance
Principal Amount
of Loans on
Nonaccrual Status(1)
Net
Credit
Losses
(in millions)
Mortgage loans $ 150,083 $ 1,046 $ 246
Specialty home loans 18,642 1,503 146
Total loans managed $ 168,725 $ 2,549 $ 392
Consisting of:
Loans sold, including securitizations $ 19,916
Loans held for sale and held in portfolio 138,962
Loans securitized and retained 9,847
Total loans managed $ 168,725
(1)
Refer to Note 1 to the Consolidated Financial Statements—"Summary of Significant Accounting Policies" for further discussion of loans on nonaccrual status.
103
December 31, 2002
Year Ende d
December 31, 2002
Unpaid
Principal
Balance
Principal Amount
of Loans on
Nonaccrual Status(1)
Net
Credit
Losses
(in millions)
Mortgage loans $ 162,225 $ 1,643 $ 142
Specialty home loans 13,105 1,034 61
Total loans managed $ 175,330 $ 2,677 $ 203
Consisting of:
Loans sold, including securitizations $ 21,957
Loans held for sale and held in portfolio 136,731
Loans securitized and retained 16,642
Total loans managed $ 175,330
(1)
Refer to Note 1 to the Consolidated Financial Statements—"Summary of Significant Accounting Policies" for further discussion of loans on nonaccrual status.
December 31, 2001
Year Ende d
December 31, 2001
Unpaid
Principal
Balance
Principal Amount
of Loans on
Nonaccrual Status(1)
Net
Credit
Losses
http://www.sec.gov/Archives/edgar/data/933136/000104746904
146 9/17/2011
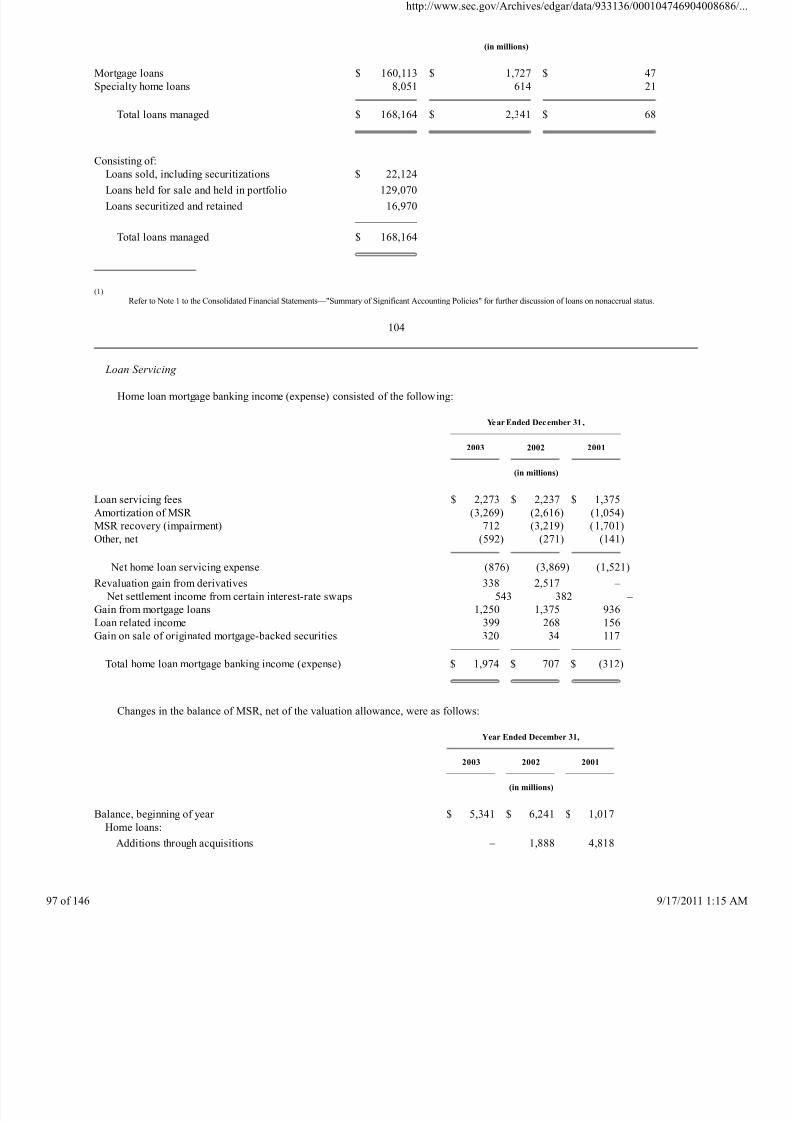
8/4/2019 Wamu 10-k 2003 Subprime
http://slidepdf.com/reader/full/wamu-10-k-2003-subprime 97/146
(in millions)
Mortgage loans $ 160,113 $ 1,727 $ 47
Specialty home loans 8,051 614 21
Total loans managed $ 168,164 $ 2,341 $ 68
Consisting of:
Loans sold, including securitizations $ 22,124Loans held for sale and held in portfolio 129,070
Loans securitized and retained 16,970
Total loans managed $ 168,164
(1)
Refer to Note 1 to the Consolidated Financial Statements—"Summary of Significant Accounting Policies" for further discussion of loans on nonaccrual status.
104
Loan Servicing
Home loan mortgage banking income (expense) consisted of the following:
Year Ended December 31 ,
2003
2002
2001
(in millions)
Loan servicing fees $ 2,273 $ 2,237 $ 1,375
Amortization of MSR (3,269) (2,616) (1,054)
MSR recovery (impairment) 712 (3,219) (1,701)Other, net (592) (271) (141)
Net home loan servicing expense (876) (3,869) (1,521)
Revaluation gain from derivatives 338 2,517 –
Net settlement income from certain interest-rate swaps 543 382 –
Gain from mortgage loans 1,250 1,375 936
Loan related income 399 268 156
Gain on sale of originated mortgage-backed securities 320 34 117
Total home loan mortgage banking income (expense) $ 1,974 $ 707 $ (312)
Changes in the balance of MSR, net of the valuation allowance, were as follows:
Year Ended December 31,
2003
2002
2001
(in millions)
Balance, beginning of year $ 5,341 $ 6,241 $ 1,017
Home loans:
Additions through acquisitions – 1,888 4,818
http://www.sec.gov/Archives/edgar/data/933136/000104746904
146 9/17/2011
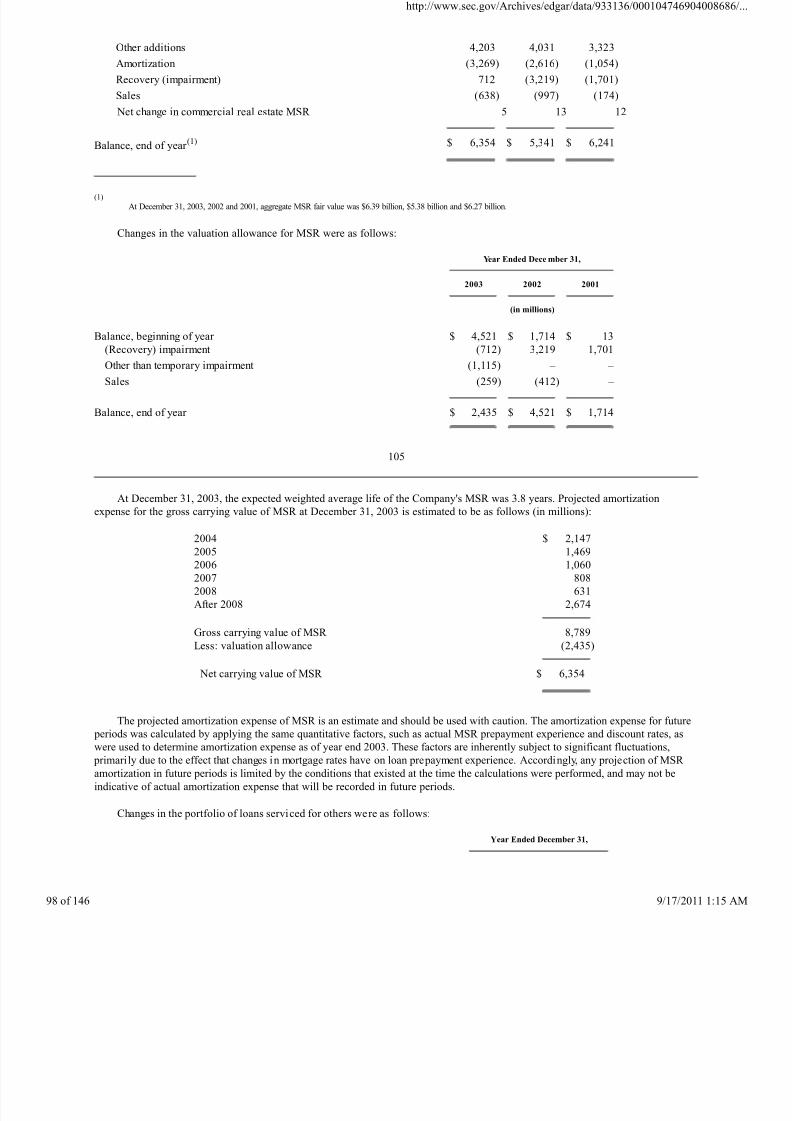
8/4/2019 Wamu 10-k 2003 Subprime
http://slidepdf.com/reader/full/wamu-10-k-2003-subprime 98/146
Other additions 4,203 4,031 3,323
Amortization (3,269) (2,616) (1,054)
Recovery (impairment) 712 (3,219) (1,701)
Sales (638) (997) (174)
Net change in commercial real estate MSR 5 13 12
Balance, end of year (1) $ 6,354 $ 5,341 $ 6,241
(1)
At December 31, 2003, 2002 and 2001, aggregate MSR fair value was $6.39 billion, $5.38 billion and $6.27 billion.
Changes in the valuation allowance for MSR were as follows:
Year Ended Dece mber 31,
2003
2002
2001
(in millions)
Balance, beginning of year $ 4,521 $ 1,714 $ 13
(Recovery) impairment (712) 3,219 1,701
Other than temporary impairment (1,115) – –
Sales (259) (412) –
Balance, end of year $ 2,435 $ 4,521 $ 1,714
105
At December 31, 2003, the expected weighted average life of the Company's MSR was 3.8 years. Projected amortization
expense for the gross carrying value of MSR at December 31, 2003 is estimated to be as follows (in millions):
2004 $ 2,147
2005 1,469
2006 1,060
2007 808
2008 631
After 2008 2,674
Gross carrying value of MSR 8,789
Less: valuation allowance (2,435)
Net carrying value of MSR $ 6,354
The projected amortization expense of MSR is an estimate and should be used with caution. The amortization expense for future
periods was calculated by applying the same quantitative factors, such as actual MSR prepayment experience and discount rates, as
were used to determine amortization expense as of year end 2003. These factors are inherently subject to significant fluctuations,
primarily due to the effect that changes in mortgage rates have on loan prepayment experience. Accordingly, any projection of MSR
amortization in future periods is limited by the conditions that existed at the time the calculations were performed, and may not be
indicative of actual amortization expense that will be recorded in future periods.
Changes in the portfolio of loans serviced for others were as follows:
Year Ended December 31,
http://www.sec.gov/Archives/edgar/data/933136/000104746904
146 9/17/2011
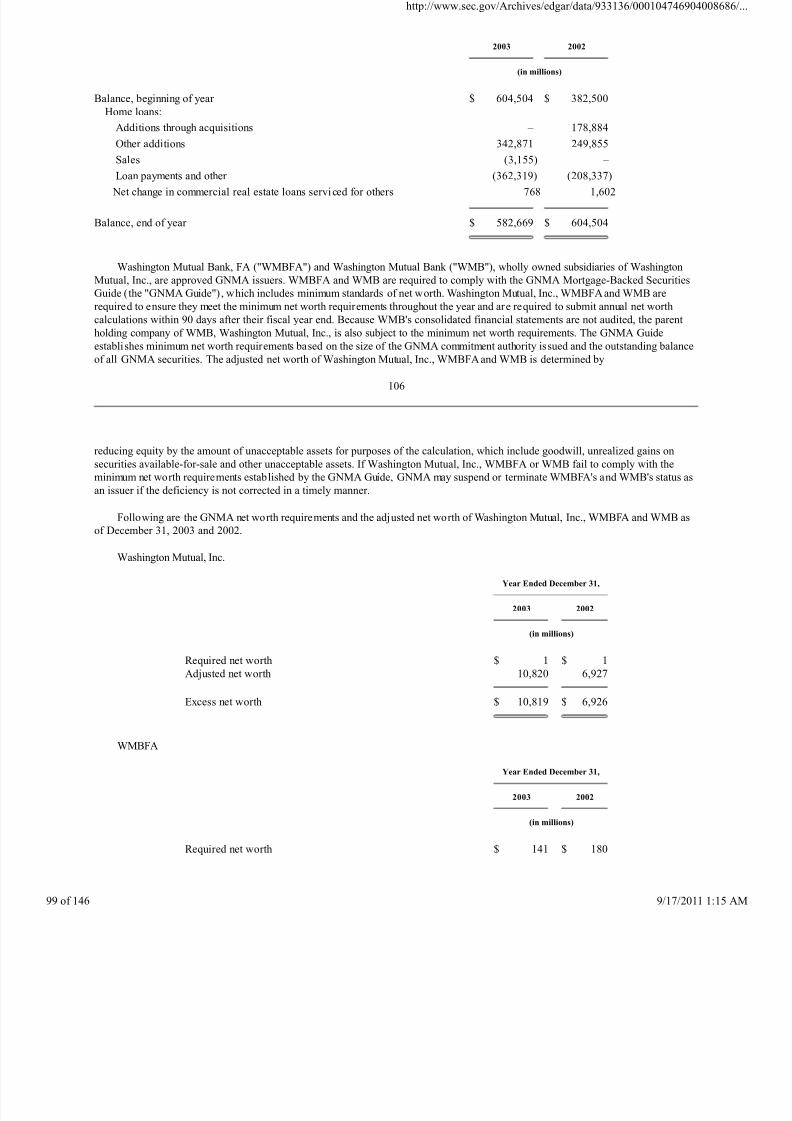
8/4/2019 Wamu 10-k 2003 Subprime
http://slidepdf.com/reader/full/wamu-10-k-2003-subprime 99/146
2003
2002
(in millions)
Balance, beginning of year $ 604,504 $ 382,500
Home loans:
Additions through acquisitions – 178,884
Other additions 342,871 249,855
Sales (3,155) –
Loan payments and other (362,319) (208,337)
Net change in commercial real estate loans serviced for others 768 1,602
Balance, end of year $ 582,669 $ 604,504
Washington Mutual Bank, FA ("WMBFA") and Washington Mutual Bank ("WMB"), wholly owned subsidiaries of Washington
Mutual, Inc., are approved GNMA issuers. WMBFA and WMB are required to comply with the GNMA Mortgage-Backed Securities
Guide (the "GNMA Guide") , which includes minimum standards of net worth. Washington Mutual, Inc., WMBFA and WMB are
required to ensure they meet the minimum net worth requirements throughout the year and are required to submit annual net worth
calculations within 90 days after their fiscal year end. Because WMB's consolidated financial statements are not audited, the parent
holding company of WMB, Washington Mutual, Inc., is also subject to the minimum net worth requirements. The GNMA Guide
establishes minimum net worth requirements based on the size of the GNMA commitment authority issued and the outstanding balanceof all GNMA securities. The adjusted net worth of Washington Mutual, Inc., WMBFA and WMB is determined by
106
reducing equity by the amount of unacceptable assets for purposes of the calculation, which include goodwill, unrealized gains on
securities available-for-sale and other unacceptable assets. If Washington Mutual, Inc., WMBFA or WMB fail to comply with the
minimum net worth requirements established by the GNMA Guide, GNMA may suspend or terminate WMBFA's and WMB's status as
an issuer if the deficiency is not corrected in a timely manner.
Following are the GNMA net worth requirements and the adjusted net worth of Washington Mutual, Inc., WMBFA and WMB as
of December 31, 2003 and 2002.
Washington Mutual, Inc.
Year Ended December 31,
2003
2002
(in millions)
Required net worth $ 1 $ 1
Adjusted net worth 10,820 6,927
Excess net worth $ 10,819 $ 6,926
WMBFA
Year Ended December 31,
2003
2002
(in millions)
Required net worth $ 141 $ 180
http://www.sec.gov/Archives/edgar/data/933136/000104746904
146 9/17/2011
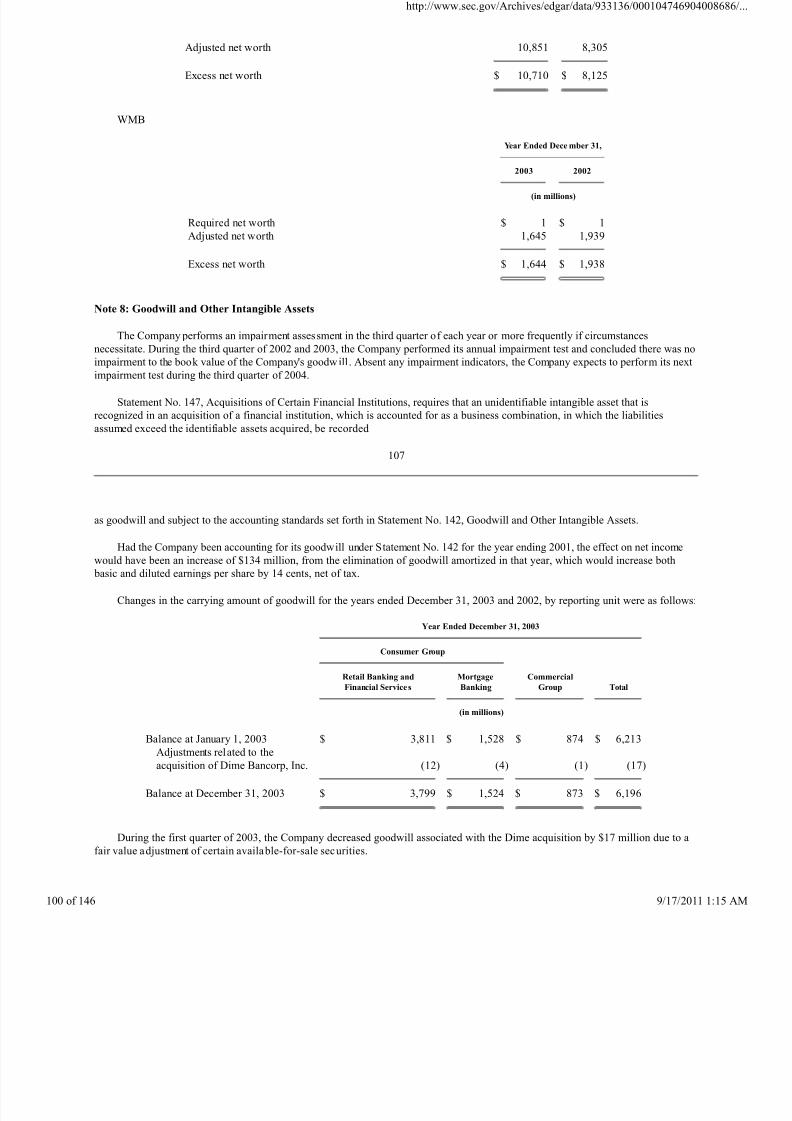
8/4/2019 Wamu 10-k 2003 Subprime
http://slidepdf.com/reader/full/wamu-10-k-2003-subprime 100/146
Adjusted net worth 10,851 8,305
Excess net worth $ 10,710 $ 8,125
WMB
Year Ended Dece mber 31,
2003
2002
(in millions)
Required net worth $ 1 $ 1
Adjusted net worth 1,645 1,939
Excess net worth $ 1,644 $ 1,938
Note 8: Goodwill and Other Intangible Assets
The Company performs an impairment assessment in the third quarter of each year or more frequently if circumstances
necessitate. During the third quarter of 2002 and 2003, the Company performed its annual impairment test and concluded there was noimpairment to the book value of the Company's goodwill. Absent any impairment indicators, the Company expects to perform its next
impairment test during the third quarter of 2004.
Statement No. 147, Acquisitions of Certain Financial Institutions, requires that an unidentifiable intangible asset that is
recognized in an acquisition of a financial institution, which is accounted for as a business combination, in which the liabilities
assumed exceed the identifiable assets acquired, be recorded
107
as goodwill and subject to the accounting standards set forth in Statement No. 142, Goodwill and Other Intangible Assets.
Had the Company been accounting for its goodwill under Statement No. 142 for the year ending 2001, the effect on net income
would have been an increase of $134 million, from the elimination of goodwill amortized in that year, which would increase both
basic and diluted earnings per share by 14 cents, net of tax.
Changes in the carrying amount of goodwill for the years ended December 31, 2003 and 2002, by reporting unit were as follows:
Year Ended December 31, 2003
Consumer Group
Retail Banking and
Financial Services
Mortgage
Banking
Commercial
Group
Total
(in millions)
Balance at January 1, 2003 $ 3,811 $ 1,528 $ 874 $ 6,213
Adjustments related to the
acquisition of Dime Bancorp, Inc.
(12) (4) (1) (17)
Balance at December 31, 2003 $ 3,799 $ 1,524 $ 873 $ 6,196
During the first quarter of 2003, the Company decreased goodwill associated with the Dime acquisition by $17 million due to a
fair value adjustment of certain available-for-sale securities.
http://www.sec.gov/Archives/edgar/data/933136/000104746904
f 146 9/17/2011
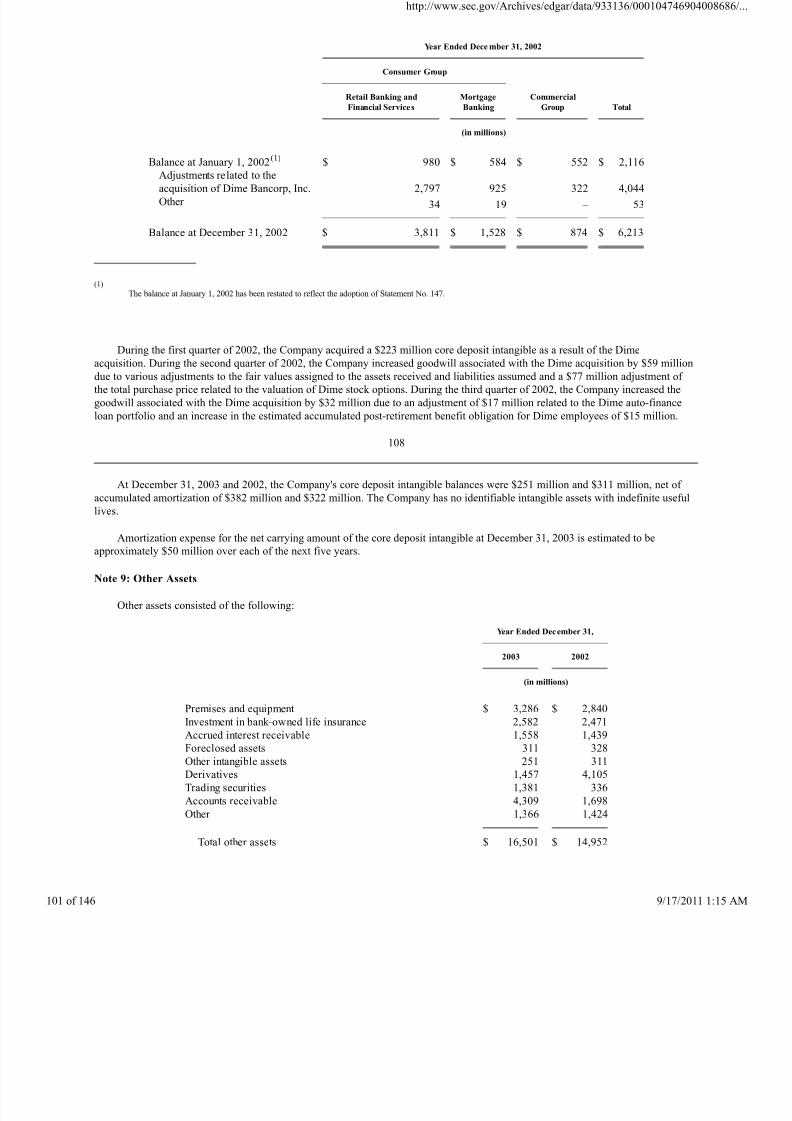
8/4/2019 Wamu 10-k 2003 Subprime
http://slidepdf.com/reader/full/wamu-10-k-2003-subprime 101/146
Year Ended Dece mber 31, 2002
Consumer Group
Retail Banking and
Financial Services
Mortgage
Banking
Commercial
Group
Total
(in millions)
Balance at January 1, 2002(1) $ 980 $ 584 $ 552 $ 2,116
Adjustments related to theacquisition of Dime Bancorp, Inc.
2,797 925 322 4,044
Other 34 19 – 53
Balance at December 31, 2002 $ 3,811 $ 1,528 $ 874 $ 6,213
(1)
The balance at January 1, 2002 has been restated to reflect the adoption of Statement No. 147.
During the first quarter of 2002, the Company acquired a $223 million core deposit intangible as a result of the Dimeacquisition. During the second quarter of 2002, the Company increased goodwill associated with the Dime acquisition by $59 million
due to various adjustments to the fair values assigned to the assets received and liabilities assumed and a $77 million adjustment of
the total purchase price related to the valuation of Dime stock options. During the third quarter of 2002, the Company increased the
goodwill associated with the Dime acquisition by $32 million due to an adjustment of $17 million related to the Dime auto-finance
loan portfolio and an increase in the estimated accumulated post-retirement benefit obligation for Dime employees of $15 million.
108
At December 31, 2003 and 2002, the Company's core deposit intangible balances were $251 million and $311 million, net of
accumulated amortization of $382 million and $322 million. The Company has no identifiable intangible assets with indefinite useful
lives.
Amortization expense for the net carrying amount of the core deposit intangible at December 31, 2003 is estimated to be
approximately $50 million over each of the next five years.
Note 9: Other Assets
Other assets consisted of the following:
Year Ended December 31,
2003
2002
(in millions)
Premises and equipment $ 3,286 $ 2,840
Investment in bank-owned life insurance 2,582 2,471
Accrued interest receivable 1,558 1,439
Foreclosed assets 311 328
Other intangible assets 251 311
Derivatives 1,457 4,105
Trading securities 1,381 336
Accounts receivable 4,309 1,698
Other 1,366 1,424
Total other assets $ 16,501 $ 14,952
http://www.sec.gov/Archives/edgar/data/933136/000104746904
f 146 9/17/2011
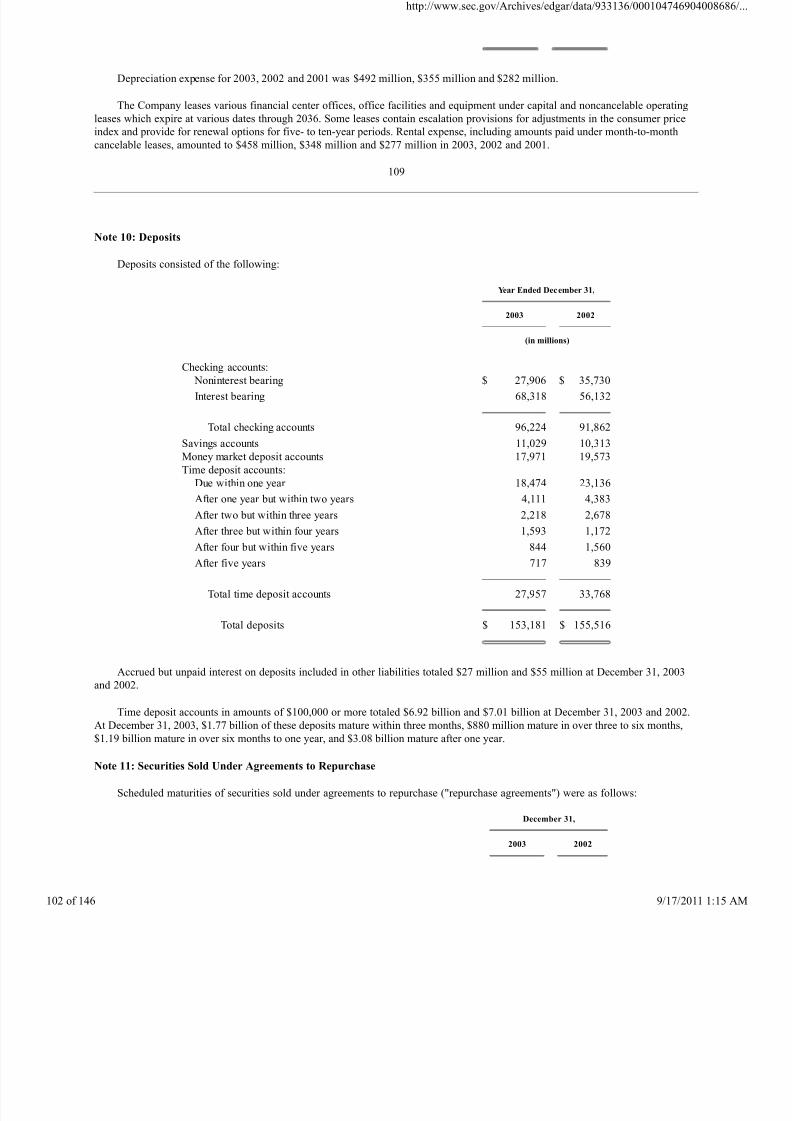
8/4/2019 Wamu 10-k 2003 Subprime
http://slidepdf.com/reader/full/wamu-10-k-2003-subprime 102/146
Depreciation expense for 2003, 2002 and 2001 was $492 million, $355 million and $282 million.
The Company leases various financial center offices, office facilities and equipment under capital and noncancelable operating
leases which expire at various dates through 2036. Some leases contain escalation provisions for adjustments in the consumer price
index and provide for renewal options for five- to ten-year periods. Rental expense, including amounts paid under month-to-month
cancelable leases, amounted to $458 million, $348 million and $277 million in 2003, 2002 and 2001.
109
Note 10: Deposits
Deposits consisted of the following:
Year Ended December 31,
2003
2002
(in millions)
Checking accounts:
Noninterest bearing $ 27,906 $ 35,730
Interest bearing 68,318 56,132
Total checking accounts 96,224 91,862
Savings accounts 11,029 10,313
Money market deposit accounts 17,971 19,573
Time deposit accounts:
Due within one year 18,474 23,136
After one year but within two years 4,111 4,383
After two but within three years 2,218 2,678
After three but within four years 1,593 1,172
After four but within five years 844 1,560
After five years 717 839
Total time deposit accounts 27,957 33,768
Total deposits $ 153,181 $ 155,516
Accrued but unpaid interest on deposits included in other liabilities totaled $27 million and $55 million at December 31, 2003
and 2002.
Time deposit accounts in amounts of $100,000 or more totaled $6.92 billion and $7.01 billion at December 31, 2003 and 2002.
At December 31, 2003, $1.77 billion of these deposits mature within three months, $880 million mature in over three to six months,
$1.19 billion mature in over six months to one year, and $3.08 billion mature after one year.
Note 11: Securities Sold Under Agreements to Repurchase
Scheduled maturities of securities sold under agreements to repurchase ("repurchase agreements") were as follows:
December 31,
2003
2002
http://www.sec.gov/Archives/edgar/data/933136/000104746904
f 146 9/17/2011
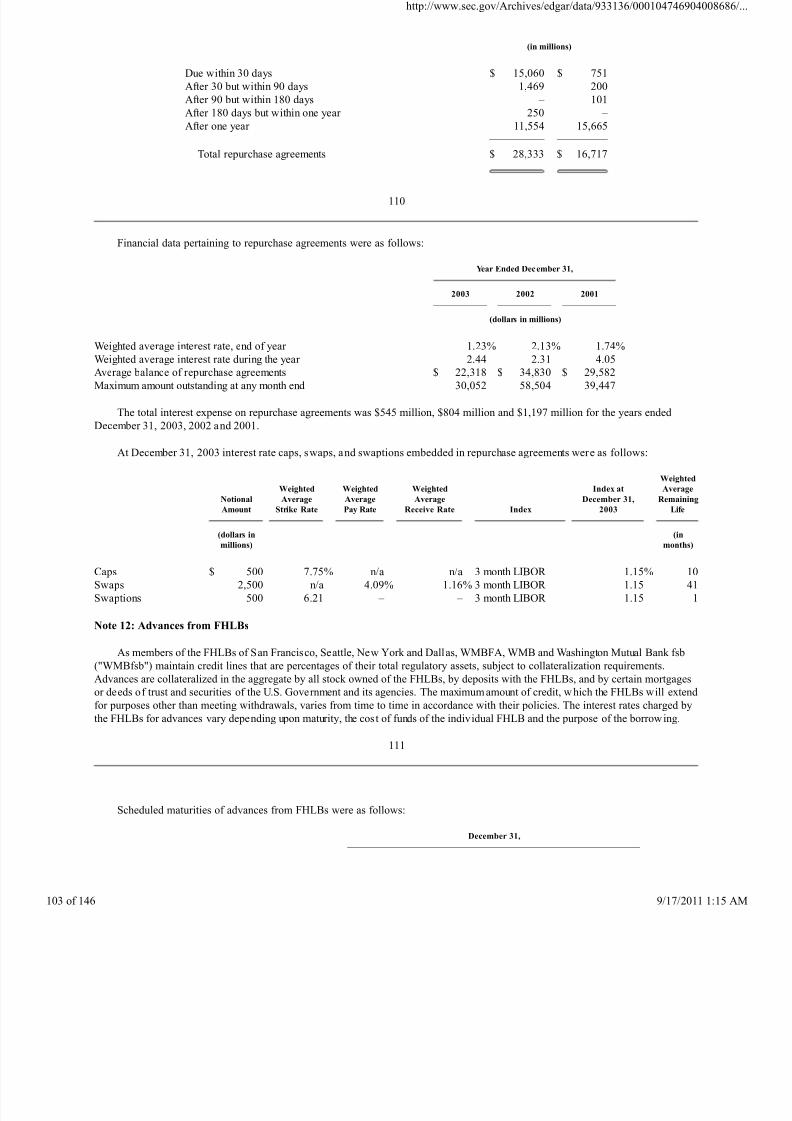
8/4/2019 Wamu 10-k 2003 Subprime
http://slidepdf.com/reader/full/wamu-10-k-2003-subprime 103/146
(in millions)
Due within 30 days $ 15,060 $ 751
After 30 but within 90 days 1,469 200
After 90 but within 180 days – 101
After 180 days but within one year 250 –
After one year 11,554 15,665
Total repurchase agreements $ 28,333 $ 16,717
110
Financial data pertaining to repurchase agreements were as follows:
Year Ended December 31,
2003
2002
2001
(dollars in millions)
Weighted average interest rate, end of year 1.23% 2.13% 1.74%Weighted average interest rate during the year 2.44 2.31 4.05
Average balance of repurchase agreements $ 22,318 $ 34,830 $ 29,582
Maximum amount outstanding at any month end 30,052 58,504 39,447
The total interest expense on repurchase agreements was $545 million, $804 million and $1,197 million for the years ended
December 31, 2003, 2002 and 2001.
At December 31, 2003 interest rate caps, swaps, and swaptions embedded in repurchase agreements were as follows:
Notional
Amount
Weighted
Average
Strike Rate
Weighted
Average
Pay Rate
Weighted
Average
Receive Rate
Index
Index at
December 31,
2003
Weighted
Average
Remaining
Life
(dollars in
millions)
(in
months)
Caps $ 500 7.75% n/a n/a 3 month LIBOR 1.15% 10
Swaps 2,500 n/a 4.09% 1.16% 3 month LIBOR 1.15 41
Swaptions 500 6.21 – – 3 month LIBOR 1.15 1
Note 12: Advances from FHLBs
As members of the FHLBs of San Francisco, Seattle, New York and Dallas, WMBFA, WMB and Washington Mutual Bank fsb
("WMBfsb") maintain credit lines that are percentages of their total regulatory assets, subject to collateralization requirements.
Advances are collateralized in the aggregate by all stock owned of the FHLBs, by deposits with the FHLBs, and by certain mortgages
or deeds of trust and securities of the U.S. Government and its agencies. The maximum amount of credit, w hich the FHLBs will extend
for purposes other than meeting withdrawals, varies from time to time in accordance with their policies. The interest rates charged by
the FHLBs for advances vary depending upon maturity, the cost of funds of the individual FHLB and the purpose of the borrowing.
111
Scheduled maturities of advances from FHLBs were as follows:
December 31,
http://www.sec.gov/Archives/edgar/data/933136/000104746904
f 146 9/17/2011
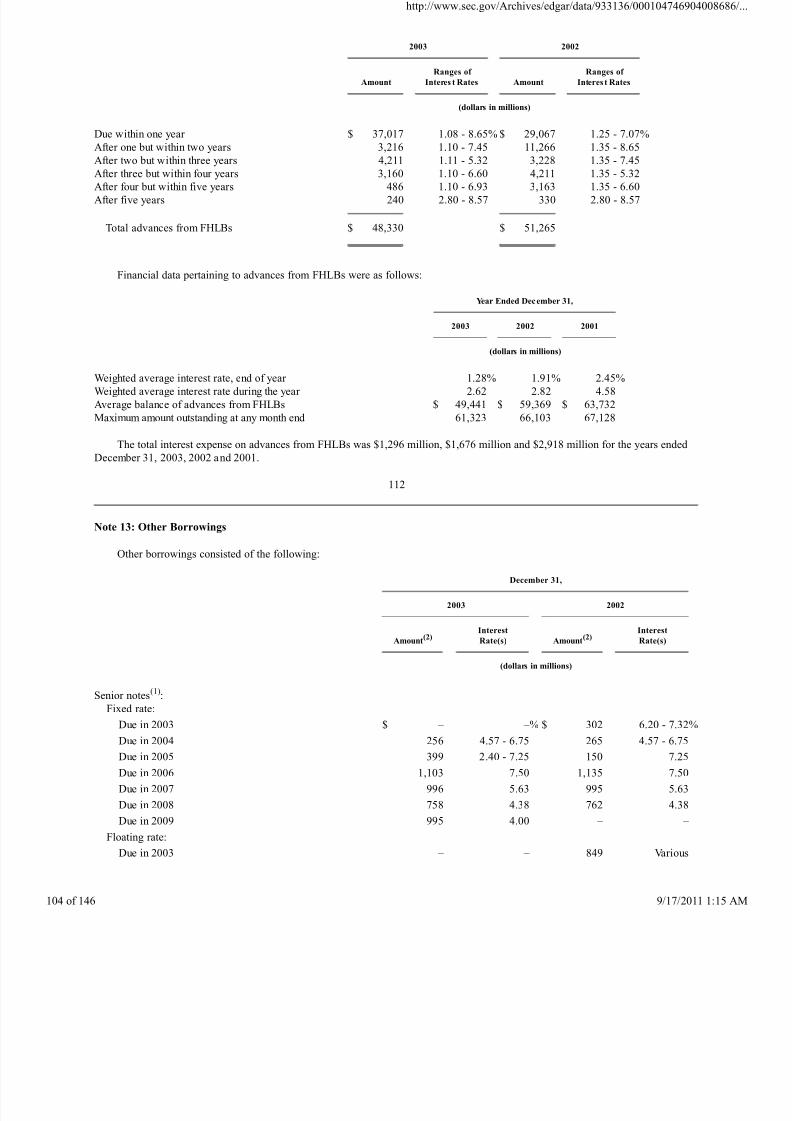
8/4/2019 Wamu 10-k 2003 Subprime
http://slidepdf.com/reader/full/wamu-10-k-2003-subprime 104/146
2003
2002
Amount
Ranges of
Interes t Rates
Amount
Ranges of
Interes t Rates
(dollars in millions)
Due within one year $ 37,017 1.08 - 8.65% $ 29,067 1.25 - 7.07%
After one but within two years 3,216 1.10 - 7.45 11,266 1.35 - 8.65
After two but within three years 4,211 1.11 - 5.32 3,228 1.35 - 7.45
After three but within four years 3,160 1.10 - 6.60 4,211 1.35 - 5.32After four but within five years 486 1.10 - 6.93 3,163 1.35 - 6.60
After five years 240 2.80 - 8.57 330 2.80 - 8.57
Total advances from FHLBs $ 48,330 $ 51,265
Financial data pertaining to advances from FHLBs were as follows:
Year Ended December 31,
2003
2002
2001
(dollars in millions)
Weighted average interest rate, end of year 1.28% 1.91% 2.45%
Weighted average interest rate during the year 2.62 2.82 4.58
Average balance of advances from FHLBs $ 49,441 $ 59,369 $ 63,732
Maximum amount outstanding at any month end 61,323 66,103 67,128
The total interest expense on advances from FHLBs was $1,296 million, $1,676 million and $2,918 million for the years ended
December 31, 2003, 2002 and 2001.
112
Note 13: Other Borrowings
Other borrowings consisted of the following:
December 31,
2003
2002
Amount(2)
Interest
Rate(s)
Amount(2)
Interest
Rate(s)
(dollars in millions)
Senior notes
(1)
:
Fixed rate:
Due in 2003 $ – –% $ 302 6.20 - 7.32%
Due in 2004 256 4.57 - 6.75 265 4.57 - 6.75
Due in 2005 399 2.40 - 7.25 150 7.25
Due in 2006 1,103 7.50 1,135 7.50
Due in 2007 996 5.63 995 5.63
Due in 2008 758 4.38 762 4.38
Due in 2009 995 4.00 – –
Floating rate:
Due in 2003 – – 849 Various
http://www.sec.gov/Archives/edgar/data/933136/000104746904
f 146 9/17/2011
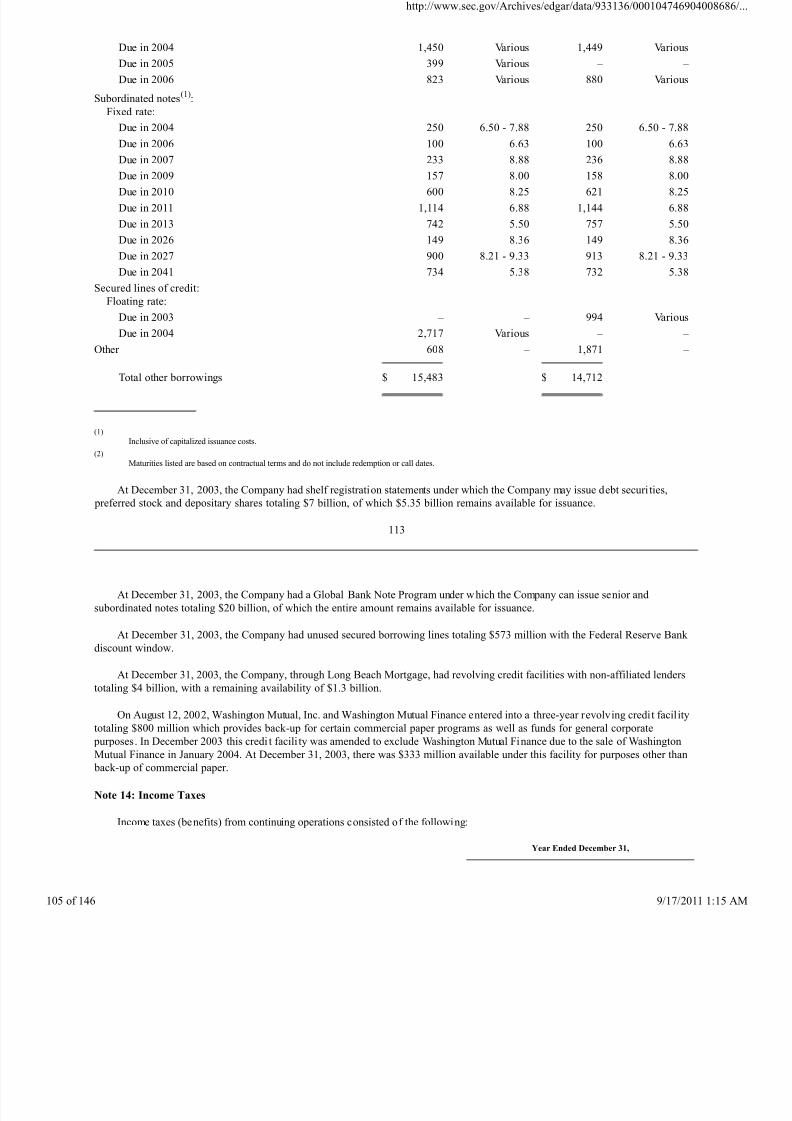
8/4/2019 Wamu 10-k 2003 Subprime
http://slidepdf.com/reader/full/wamu-10-k-2003-subprime 105/146
Due in 2004 1,450 Various 1,449 Various
Due in 2005 399 Various – –
Due in 2006 823 Various 880 Various
Subordinated notes(1):
Fixed rate:
Due in 2004 250 6.50 - 7.88 250 6.50 - 7.88
Due in 2006 100 6.63 100 6.63
Due in 2007 233 8.88 236 8.88
Due in 2009 157 8.00 158 8.00Due in 2010 600 8.25 621 8.25
Due in 2011 1,114 6.88 1,144 6.88
Due in 2013 742 5.50 757 5.50
Due in 2026 149 8.36 149 8.36
Due in 2027 900 8.21 - 9.33 913 8.21 - 9.33
Due in 2041 734 5.38 732 5.38
Secured lines of credit:
Floating rate:
Due in 2003 – – 994 Various
Due in 2004 2,717 Various – –
Other 608 – 1,871 –
Total other borrowings $ 15,483 $ 14,712
(1)
Inclusive of capitalized issuance costs.
(2)
Maturities listed are based on contractual terms and do not include redemption or call dates.
At December 31, 2003, the Company had shelf registration statements under which the Company may issue debt securi ties,
preferred stock and depositary shares totaling $7 billion, of which $5.35 billion remains available for issuance.
113
At December 31, 2003, the Company had a Global Bank Note Program under which the Company can issue senior and
subordinated notes totaling $20 billion, of which the entire amount remains available for issuance.
At December 31, 2003, the Company had unused secured borrowing lines totaling $573 million with the Federal Reserve Bank
discount window.
At December 31, 2003, the Company, through Long Beach Mortgage, had revolving credit facilities with non-affiliated lenders
totaling $4 billion, with a remaining availability of $1.3 billion.
On August 12, 2002, Washington Mutual, Inc. and Washington Mutual Finance entered into a three-year revolving credit facility
totaling $800 million which provides back-up for certain commercial paper programs as well as funds for general corporate
purposes. In December 2003 this credi t facili ty was amended to exclude Washington Mutual Finance due to the sale of Washington
Mutual Finance in January 2004. At December 31, 2003, there was $333 million available under this facility for purposes other than
back-up of commercial paper.
Note 14: Income Taxes
Income taxes (benefits) from continuing operations consisted of the following:
Year Ended December 31,
http://www.sec.gov/Archives/edgar/data/933136/000104746904
f 146 9/17/2011
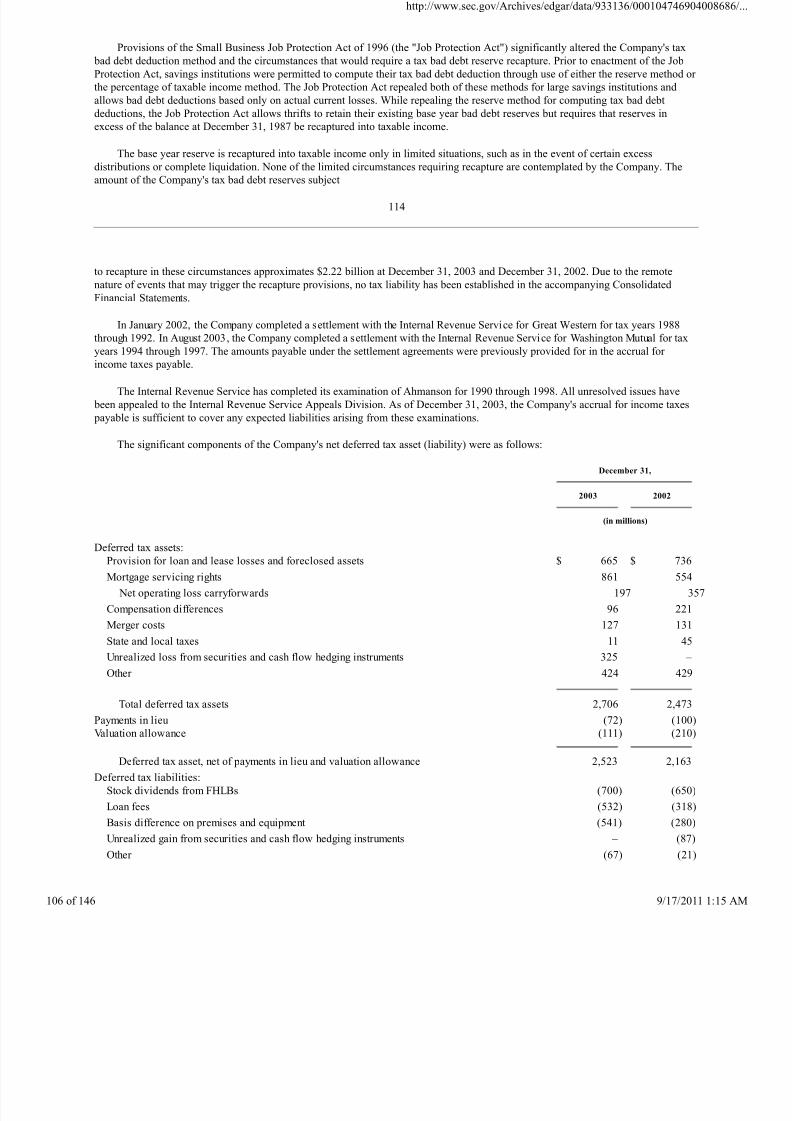
8/4/2019 Wamu 10-k 2003 Subprime
http://slidepdf.com/reader/full/wamu-10-k-2003-subprime 106/146
Provisions of the Small Business Job Protection Act of 1996 (the "Job Protection Act") significantly altered the Company's tax
bad debt deduction method and the circumstances that would require a tax bad debt reserve recapture. Prior to enactment of the Job
Protection Act, savings institutions were permitted to compute their tax bad debt deduction through use of either the reserve method or
the percentage of taxable income method. The Job Protection Act repealed both of these methods for large savings institutions and
allows bad debt deductions based only on actual current losses. While repealing the reserve method for computing tax bad debt
deductions, the Job Protection Act allows thrifts to retain their existing base year bad debt reserves but requires that reserves in
excess of the balance at December 31, 1987 be recaptured into taxable income.
The base year reserve is recaptured into taxable income only in limited situations, such as in the event of certain excess
distributions or complete liquidation. None of the limited circumstances requiring recapture are contemplated by the Company. The
amount of the Company's tax bad debt reserves subject
114
to recapture in these circumstances approximates $2.22 billion at December 31, 2003 and December 31, 2002. Due to the remote
nature of events that may trigger the recapture provisions, no tax liability has been established in the accompanying Consolidated
Financial Statements.
In January 2002, the Company completed a settlement with the Internal Revenue Service for Great Western for tax years 1988
through 1992. In August 2003, the Company completed a settlement with the Internal Revenue Service for Washington Mutual for tax
years 1994 through 1997. The amounts payable under the settlement agreements were previously provided for in the accrual for income taxes payable.
The Internal Revenue Service has completed its examination of Ahmanson for 1990 through 1998. All unresolved issues have
been appealed to the Internal Revenue Service Appeals Division. As of December 31, 2003, the Company's accrual for income taxes
payable is sufficient to cover any expected liabilities arising from these examinations.
The significant components of the Company's net deferred tax asset (liability) were as follows:
December 31,
2003
2002
(in millions)
Deferred tax assets:
Provision for loan and lease losses and foreclosed assets $ 665 $ 736
Mortgage servicing rights 861 554
Net operating loss carryforwards 197 357
Compensation differences 96 221
Merger costs 127 131
State and local taxes 11 45
Unrealized loss from securities and cash flow hedging instruments 325 –
Other 424 429
Total deferred tax assets 2,706 2,473
Payments in lieu (72) (100)
Valuation allowance (111) (210)
Deferred tax asset, net of payments in lieu and valuation allowance 2,523 2,163
Deferred tax liabilities:
Stock dividends from FHLBs (700) (650)
Loan fees (532) (318)
Basis difference on premises and equipment (541) (280)
Unrealized gain from securities and cash flow hedging instruments – (87)
Other (67) (21)
http://www.sec.gov/Archives/edgar/data/933136/000104746904
f 146 9/17/2011
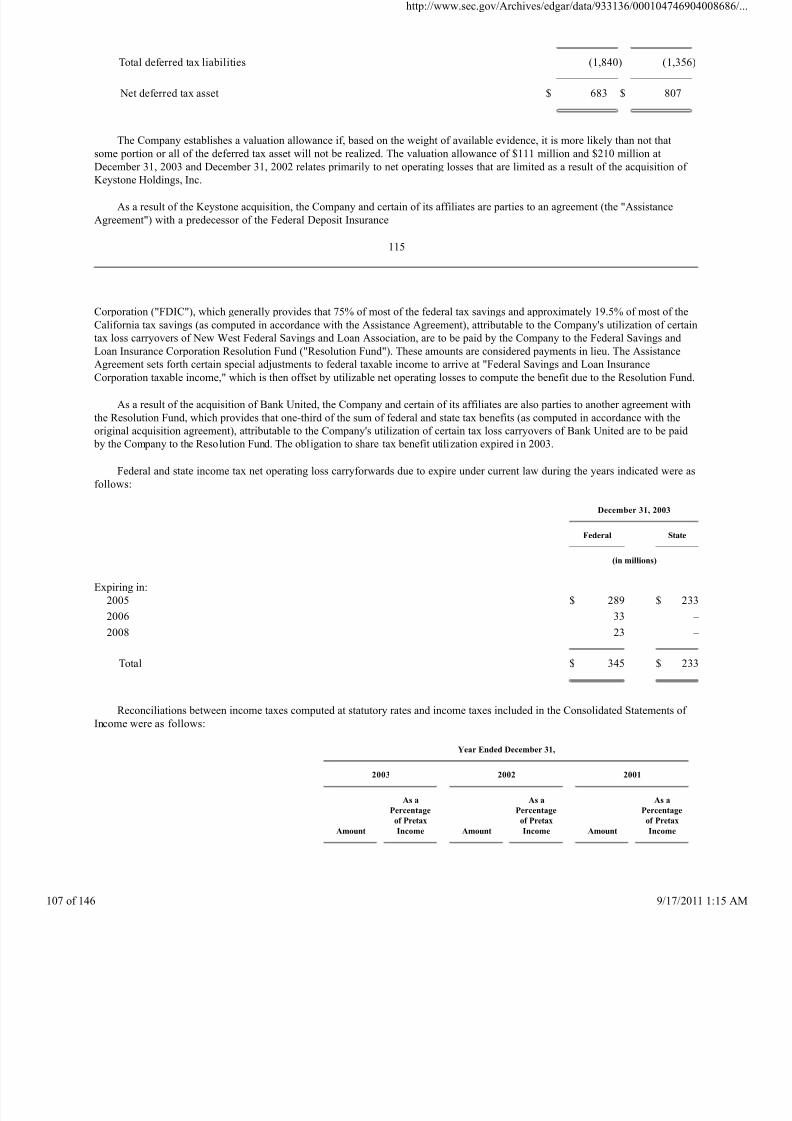
8/4/2019 Wamu 10-k 2003 Subprime
http://slidepdf.com/reader/full/wamu-10-k-2003-subprime 107/146
Total deferred tax liabilities (1,840) (1,356)
Net deferred tax asset $ 683 $ 807
The Company establishes a valuation allowance if, based on the weight of available evidence, it is more likely than not that
some portion or all of the deferred tax asset will not be realized. The valuation allowance of $111 million and $210 million at
December 31, 2003 and December 31, 2002 relates primarily to net operating losses that are limited as a result of the acquisition of
Keystone Holdings, Inc.
As a result of the Keystone acquisition, the Company and certain of its affiliates are parties to an agreement (the "Assistance
Agreement") with a predecessor of the Federal Deposit Insurance
115
Corporation ("FDIC"), which generally provides that 75% of most of the federal tax savings and approximately 19.5% of most of the
California tax savings (as computed in accordance with the Assistance Agreement), attributable to the Company's utilization of certain
tax loss carryovers of New West Federal Savings and Loan Association, are to be paid by the Company to the Federal Savings and
Loan Insurance Corporation Resolution Fund ("Resolution Fund"). These amounts are considered payments in lieu. The AssistanceAgreement sets forth certain special adjustments to federal taxable income to arrive at "Federal Savings and Loan Insurance
Corporation taxable income," which is then offset by utilizable net operating losses to compute the benefit due to the Resolution Fund.
As a result of the acquisition of Bank United, the Company and certain of its affiliates are also parties to another agreement with
the Resolution Fund, which provides that one-third of the sum of federal and state tax benefits (as computed in accordance with the
original acquisition agreement), attributable to the Company's utilization of certain tax loss carryovers of Bank United are to be paid
by the Company to the Resolution Fund. The obligation to share tax benefit utilization expired in 2003.
Federal and state income tax net operating loss carryforwards due to expire under current law during the years indicated were as
follows:
December 31, 2003
Federal
State
(in millions)
Expiring in:
2005 $ 289 $ 233
2006 33 –
2008 23 –
Total $ 345 $ 233
Reconciliations between income taxes computed at statutory rates and income taxes included in the Consolidated Statements of
Income were as follows:
Year Ended December 31,
2003
2002
2001
Amount
As a
Percentage
of Pretax
Income
Amount
As a
Percentage
of Pretax
Income
Amount
As a
Percentage
of Pretax
Income
http://www.sec.gov/Archives/edgar/data/933136/000104746904
f 146 9/17/2011
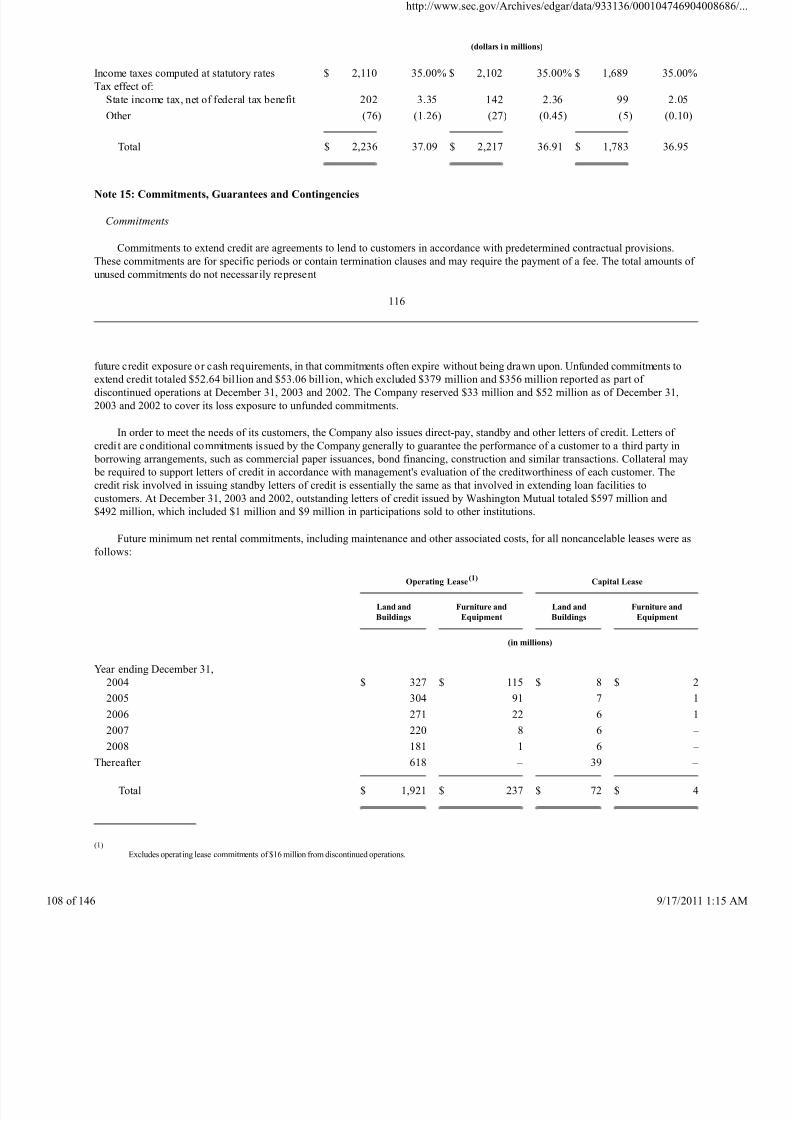
8/4/2019 Wamu 10-k 2003 Subprime
http://slidepdf.com/reader/full/wamu-10-k-2003-subprime 108/146
(dollars in millions)
Income taxes computed at statutory rates $ 2,110 35.00% $ 2,102 35.00% $ 1,689 35.00%
Tax effect of:
State income tax, net of federal tax benefit 202 3.35 142 2.36 99 2.05
Other (76) (1.26) (27) (0.45) (5) (0.10)
Total $ 2,236 37.09 $ 2,217 36.91 $ 1,783 36.95
Note 15: Commitments, Guarantees and Contingencies
Commitments
Commitments to extend credit are agreements to lend to customers in accordance with predetermined contractual provisions.
These commitments are for specific periods or contain termination clauses and may require the payment of a fee. The total amounts of
unused commitments do not necessar ily represent
116
future credit exposure or cash requirements, in that commitments often expire without being drawn upon. Unfunded commitments to
extend credit totaled $52.64 bil lion and $53.06 bill ion, which excluded $379 million and $356 million reported as part of
discontinued operations at December 31, 2003 and 2002. The Company reserved $33 million and $52 million as of December 31,
2003 and 2002 to cover its loss exposure to unfunded commitments.
In order to meet the needs of its customers, the Company also issues direct-pay, standby and other letters of credit. Letters of
credi t are conditional commitments issued by the Company generally to guarantee the performance of a customer to a third party in
borrowing arrangements, such as commercial paper issuances, bond financing, construction and similar transactions. Collateral may
be required to support letters of credit in accordance with management's evaluation of the creditworthiness of each customer. The
credit risk involved in issuing standby letters of credit is essentially the same as that involved in extending loan facilities to
customers. At December 31, 2003 and 2002, outstanding letters of credit issued by Washington Mutual totaled $597 million and
$492 million, which included $1 million and $9 million in participations sold to other institutions.
Future minimum net rental commitments, including maintenance and other associated costs, for all noncancelable leases were as
follows:
Operating Lease(1)
Capital Lease
Land and
Buildings
Furniture and
Equipment
Land and
Buildings
Furniture and
Equipment
(in millions)
Year ending December 31,
2004 $ 327 $ 115 $ 8 $ 2
2005 304 91 7 1 2006 271 22 6 1
2007 220 8 6 –
2008 181 1 6 –
Thereafter 618 – 39 –
Total $ 1,921 $ 237 $ 72 $ 4
(1)
Excludes operating lease commitments of $16 million from discontinued operations.
http://www.sec.gov/Archives/edgar/data/933136/000104746904
f 146 9/17/2011
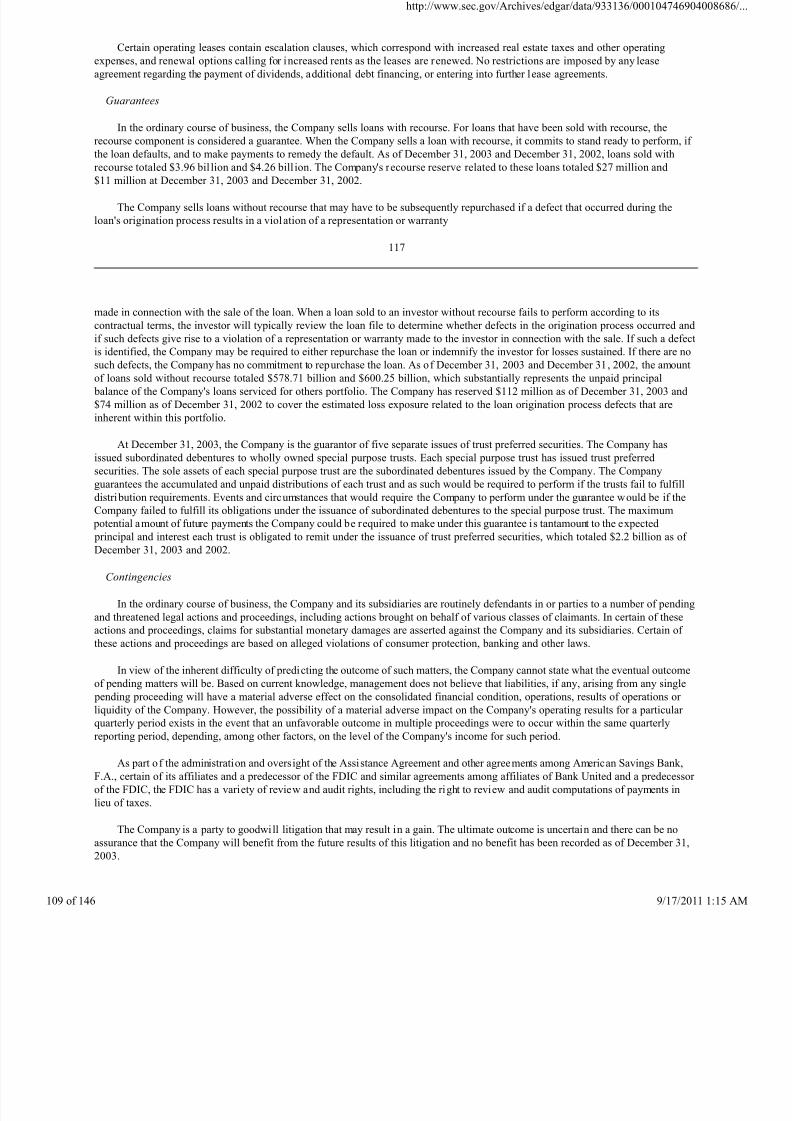
8/4/2019 Wamu 10-k 2003 Subprime
http://slidepdf.com/reader/full/wamu-10-k-2003-subprime 109/146
Certain operating leases contain escalation clauses, which correspond with increased real estate taxes and other operating
expenses, and renewal options calling for increased rents as the leases are renewed. No restrictions are imposed by any lease
agreement regarding the payment of dividends, additional debt financing, or entering into further lease agreements.
Guarantees
In the ordinary course of business, the Company sells loans with recourse. For loans that have been sold with recourse, the
recourse component is considered a guarantee. When the Company sells a loan with recourse, it commits to stand ready to perform, if
the loan defaults, and to make payments to remedy the default. As of December 31, 2003 and December 31, 2002, loans sold with
recourse totaled $3.96 bil lion and $4.26 bill ion. The Company's recourse reserve related to these loans totaled $27 million and
$11 million at December 31, 2003 and December 31, 2002.
The Company sells loans without recourse that may have to be subsequently repurchased if a defect that occurred during the
loan's origination process results in a violation of a representation or warranty
117
made in connection with the sale of the loan. When a loan sold to an investor without recourse fails to perform according to its
contractual terms, the investor will typically review the loan file to determine whether defects in the origination process occurred and
if such defects give rise to a violation of a representation or warranty made to the investor in connection with the sale. If such a defect
is identified, the Company may be required to either repurchase the loan or indemnify the investor for losses sustained. If there are nosuch defects, the Company has no commitment to repurchase the loan. As of December 31, 2003 and December 31, 2002, the amount
of loans sold without recourse totaled $578.71 billion and $600.25 billion, which substantially represents the unpaid principal
balance of the Company's loans serviced for others portfolio. The Company has reserved $112 million as of December 31, 2003 and
$74 million as of December 31, 2002 to cover the estimated loss exposure related to the loan origination process defects that are
inherent within this portfolio.
At December 31, 2003, the Company is the guarantor of five separate issues of trust preferred securities. The Company has
issued subordinated debentures to wholly owned special purpose trusts. Each special purpose trust has issued trust preferred
securities. The sole assets of each special purpose trust are the subordinated debentures issued by the Company. The Company
guarantees the accumulated and unpaid distributions of each trust and as such would be required to perform if the trusts fail to fulfill
distribution requirements. Events and circumstances that would require the Company to perform under the guarantee would be if the
Company failed to fulfill its obligations under the issuance of subordinated debentures to the special purpose trust. The maximum
potential amount of future payments the Company could be required to make under this guarantee is tantamount to the expected principal and interest each trust is obligated to remit under the issuance of trust preferred securities, which totaled $2.2 billion as of
December 31, 2003 and 2002.
Contingencies
In the ordinary course of business, the Company and its subsidiaries are routinely defendants in or parties to a number of pending
and threatened legal actions and proceedings, including actions brought on behalf of various classes of claimants. In certain of these
actions and proceedings, claims for substantial monetary damages are asserted against the Company and its subsidiaries. Certain of
these actions and proceedings are based on alleged violations of consumer protection, banking and other laws.
In view of the inherent difficulty of predicting the outcome of such matters, the Company cannot state what the eventual outcome
of pending matters will be. Based on current knowledge, management does not believe that liabilities, if any, arising from any single
pending proceeding will have a material adverse effect on the consolidated financial condition, operations, results of operations or liquidity of the Company. However, the possibility of a material adverse impact on the Company's operating results for a particular
quarterly period exists in the event that an unfavorable outcome in multiple proceedings were to occur within the same quarterly
reporting period, depending, among other factors, on the level of the Company's income for such period.
As part of the administration and oversight of the Assistance Agreement and other agreements among American Savings Bank,
F.A., certain of its affiliates and a predecessor of the FDIC and similar agreements among affiliates of Bank United and a predecessor
of the FDIC, the FDIC has a variety of review and audit rights, including the right to review and audit computations of payments in
lieu of taxes.
The Company is a party to goodwill litigation that may result in a gain. The ultimate outcome is uncertain and there can be no
assurance that the Company will benefit from the future results of this litigation and no benefit has been recorded as of December 31,
2003.
http://www.sec.gov/Archives/edgar/data/933136/000104746904
f 146 9/17/2011
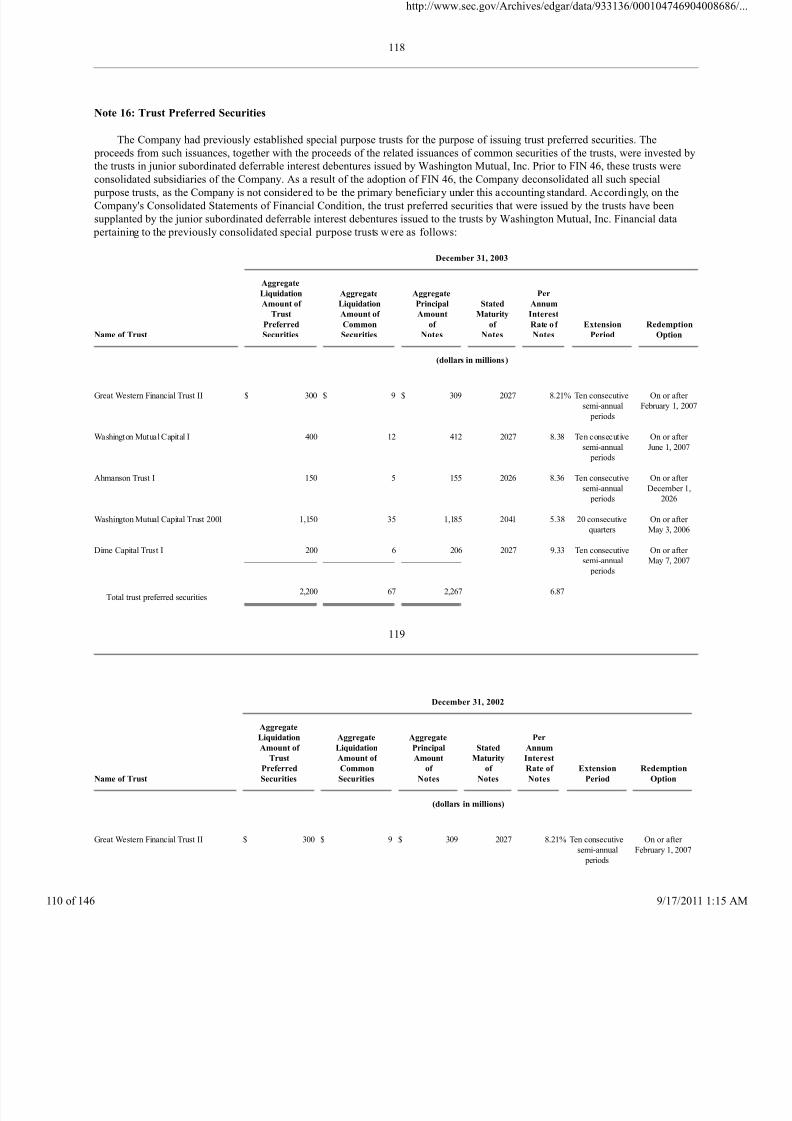
8/4/2019 Wamu 10-k 2003 Subprime
http://slidepdf.com/reader/full/wamu-10-k-2003-subprime 110/146
118
Note 16: Trust Preferred Securities
The Company had previously established special purpose trusts for the purpose of issuing trust preferred securities. The
proceeds from such issuances, together with the proceeds of the related issuances of common securities of the trusts, were invested by
the trusts in junior subordinated deferrable interest debentures issued by Washington Mutual, Inc. Prior to FIN 46, these trusts were
consolidated subsidiaries of the Company. As a result of the adoption of FIN 46, the Company deconsolidated all such special
purpose trusts, as the Company is not considered to be the primary beneficiary under this accounting standard. Accordingly, on the
Company's Consolidated Statements of Financial Condition, the trust preferred securities that were issued by the trusts have been
supplanted by the junior subordinated deferrable interest debentures issued to the trusts by Washington Mutual, Inc. Financial data
pertaining to the previously consolidated special purpose trusts were as follows:
December 31, 2003
Name of Trust
Aggregate
Liquidation
Amount of
Trust
Preferred
Securities
Aggregate
Liquidation
Amount of
Common
Securities
Aggregate
Principal
Amount
of
Notes
Stated
Maturity
of
Notes
Per
Annum
Interest
Rate o f
Notes
Extension
Period
Redemption
Option
(dollars in millions)
Great Western Financial Trust II $ 300 $ 9 $ 309 2027 8.21% Ten consecutive
semi-annual
periods
On or after
February 1, 2007
Washington Mutual Capital I 400 12 412 2027 8.38 Ten consecutive
semi-annual
periods
On or after
June 1, 2007
Ahmanson Trust I 150 5 155 2026 8.36 Ten consecutive
semi-annual
periods
On or after
December 1,
2026
Washington Mutual Capital Trust 2001 1,150 35 1,185 2041 5.38 20 consecutive
quarters
On or after
May 3, 2006
Dime Capital Trust I 200 6 206 2027 9.33 Ten consecutive
semi-annual
periods
On or after
May 7, 2007
Total trust preferred securities
2,200 67 2,267 6.87
119
December 31, 2002
Name of Trust
Aggregate
Liquidation
Amount of
Trust
Preferred
Securities
Aggregate
Liquidation
Amount of
Common
Securities
Aggregate
Principal
Amount
of
Notes
Stated
Maturity
of
Notes
Per
Annum
Interest
Rate of
Notes
Extension
Period
Redemption
Option
(dollars in millions)
Great Western Financial Trust II $ 300 $ 9 $ 309 2027 8.21% Ten consecutive
semi-annual
periods
On or after
February 1, 2007
http://www.sec.gov/Archives/edgar/data/933136/000104746904
f 146 9/17/2011
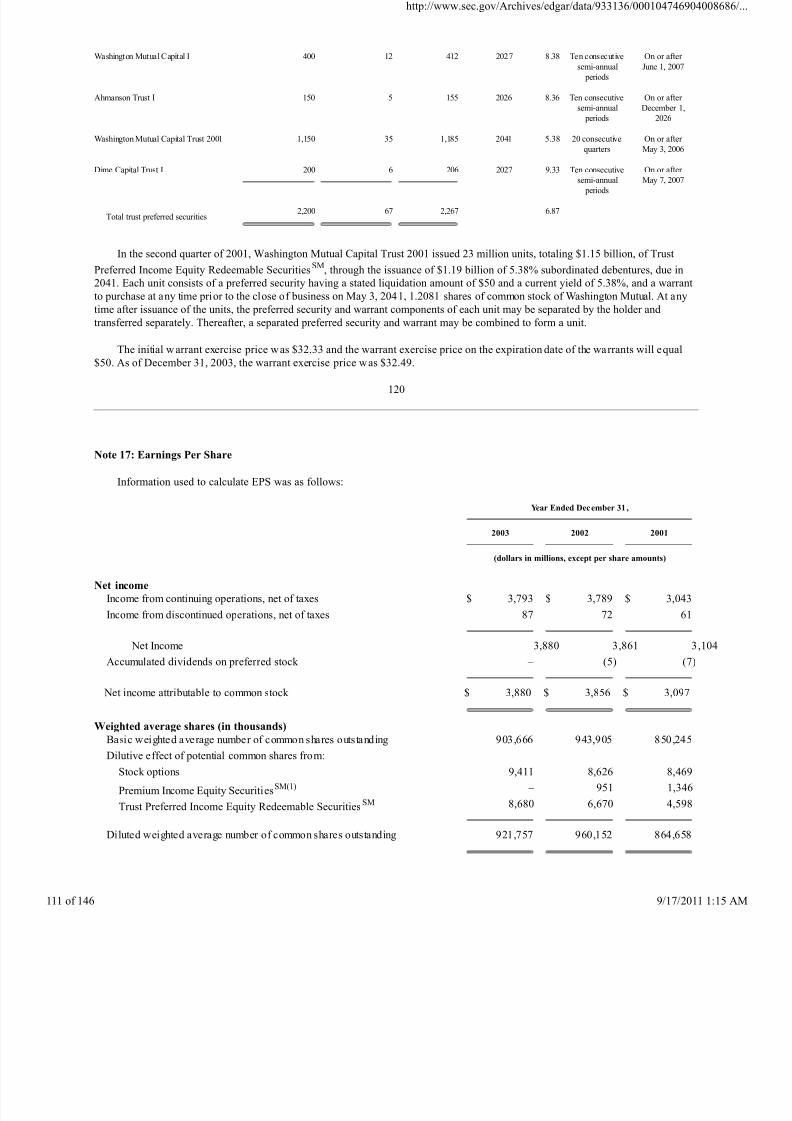
8/4/2019 Wamu 10-k 2003 Subprime
http://slidepdf.com/reader/full/wamu-10-k-2003-subprime 111/146
Washington Mutual Capital I 400 12 412 2027 8.38 Ten consecutive
semi-annual
periods
On or after
June 1, 2007
Ahmanson Trust I 150 5 155 2026 8.36 Ten consecutive
semi-annual
periods
On or after
December 1,
2026
Washington Mutual Capital Trust 2001 1,150 35 1,185 2041 5.38 20 consecutive
quarters
On or after
May 3, 2006
Dime Capital Trust I 200 6 206 2027 9.33 Ten consecutive
semi-annual
periods
On or after
May 7, 2007
Total trust preferred securities
2,200 67 2,267 6.87
In the second quarter of 2001, Washington Mutual Capital Trust 2001 issued 23 million units, totaling $1.15 billion, of Trust
Preferred Income Equity Redeemable SecuritiesSM, through the issuance of $1.19 billion of 5.38% subordinated debentures, due in
2041. Each unit consists of a preferred security having a stated liquidation amount of $50 and a current yield of 5.38%, and a warrant
to purchase at any time prior to the close of business on May 3, 2041, 1.2081 shares of common stock of Washington Mutual. At any
time after issuance of the units, the preferred security and warrant components of each unit may be separated by the holder and
transferred separately. Thereafter, a separated preferred security and warrant may be combined to form a unit.
The initial w arrant exercise price was $32.33 and the warrant exercise price on the expiration date of the warrants will equal$50. As of December 31, 2003, the warrant exercise price was $32.49.
120
Note 17: Earnings Per Share
Information used to calculate EPS was as follows:
Year Ended December 31 ,
2003
2002
2001
(dollars in millions, except per share amounts)
Net income
Income from continuing operations, net of taxes $ 3,793 $ 3,789 $ 3,043
Income from discontinued operations, net of taxes 87 72 61
Net Income 3,880 3,861 3,
Accumulated dividends on preferred stock – (5) (7)
Net income attributable to common stock $ 3,880 $ 3,856 $ 3,097
Weighted average shares (in thousands)
Basic weighted average number of common shares outstanding 903,666 943,905 850,245
Dilutive effect of potential common shares from:
Stock options 9,411 8,626 8,469
Premium Income Equity SecuritiesSM(1) – 951 1,346
Trust Preferred Income Equity Redeemable SecuritiesSM 8,680 6,670 4,598
Diluted weighted average number of common shares outstanding 921,757 960,152 864,658
http://www.sec.gov/Archives/edgar/data/933136/000104746904
f 146 9/17/2011
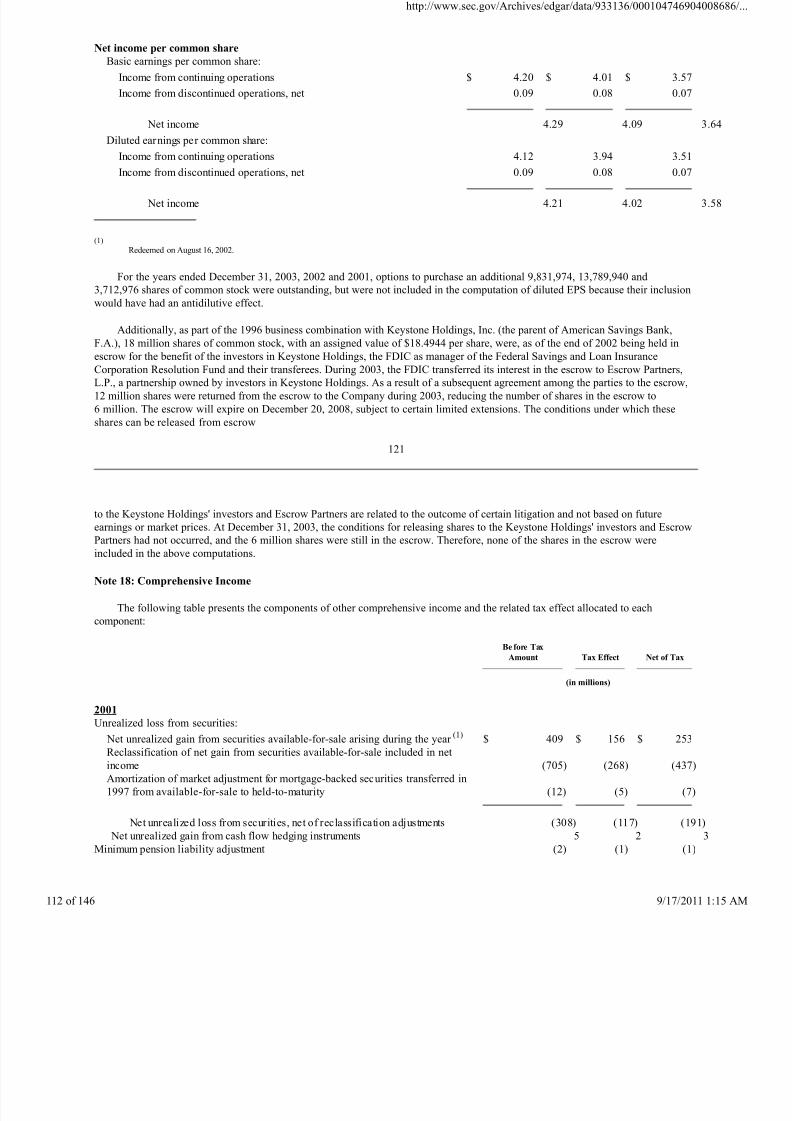
8/4/2019 Wamu 10-k 2003 Subprime
http://slidepdf.com/reader/full/wamu-10-k-2003-subprime 112/146
Net income per common share
Basic earnings per common share:
Income from continuing operations $ 4.20 $ 4.01 $ 3.57
Income from discontinued operations, net 0.09 0.08 0.07
Net income 4.29 4.09 3
Diluted earnings per common share:
Income from continuing operations 4.12 3.94 3.51
Income from discontinued operations, net 0.09 0.08 0.07
Net income 4.21 4.02 3
(1)
Redeemed on August 16, 2002.
For the years ended December 31, 2003, 2002 and 2001, options to purchase an additional 9,831,974, 13,789,940 and
3,712,976 shares of common stock were outstanding, but were not included in the computation of diluted EPS because their inclusion
would have had an antidilutive effect.
Additionally, as part of the 1996 business combination with Keystone Holdings, Inc. (the parent of American Savings Bank,
F.A.), 18 million shares of common stock, with an assigned value of $18.4944 per share, were, as of the end of 2002 being held in
escrow for the benefit of the investors in Keystone Holdings, the FDIC as manager of the Federal Savings and Loan Insurance
Corporation Resolution Fund and their transferees. During 2003, the FDIC transferred its interest in the escrow to Escrow Partners,
L.P., a partnership owned by investors in Keystone Holdings. As a result of a subsequent agreement among the parties to the escrow,
12 million shares were returned from the escrow to the Company during 2003, reducing the number of shares in the escrow to
6 million. The escrow will expire on December 20, 2008, subject to certain limited extensions. The conditions under which these
shares can be released from escrow
121
to the Keystone Holdings' investors and Escrow Partners are related to the outcome of certain litigation and not based on future
earnings or market prices. At December 31, 2003, the conditions for releasing shares to the Keystone Holdings' investors and EscrowPartners had not occurred, and the 6 million shares were still in the escrow. Therefore, none of the shares in the escrow were
included in the above computations.
Note 18: Comprehensive Income
The following table presents the components of other comprehensive income and the related tax effect allocated to each
component:
Be fore Tax
Amount
Tax Effect
Net of Tax
(in millions)
2001
Unrealized loss from securities:
Net unrealized gain from securities available-for-sale arising during the year (1) $ 409 $ 156 $ 253
Reclassification of net gain from securities available-for-sale included in net
income (705) (268) (437)
Amortization of market adjustment for mortgage-backed securities transferred in
1997 from available-for-sale to held-to-maturity (12) (5) (7)
Net unrealized loss from securities, net of reclassification adjustments (308) (117) (191
Net unrealized gain from cash flow hedging instruments 5 2
Minimum pension liability adjustment (2) (1) (1)
http://www.sec.gov/Archives/edgar/data/933136/000104746904
f 146 9/17/2011
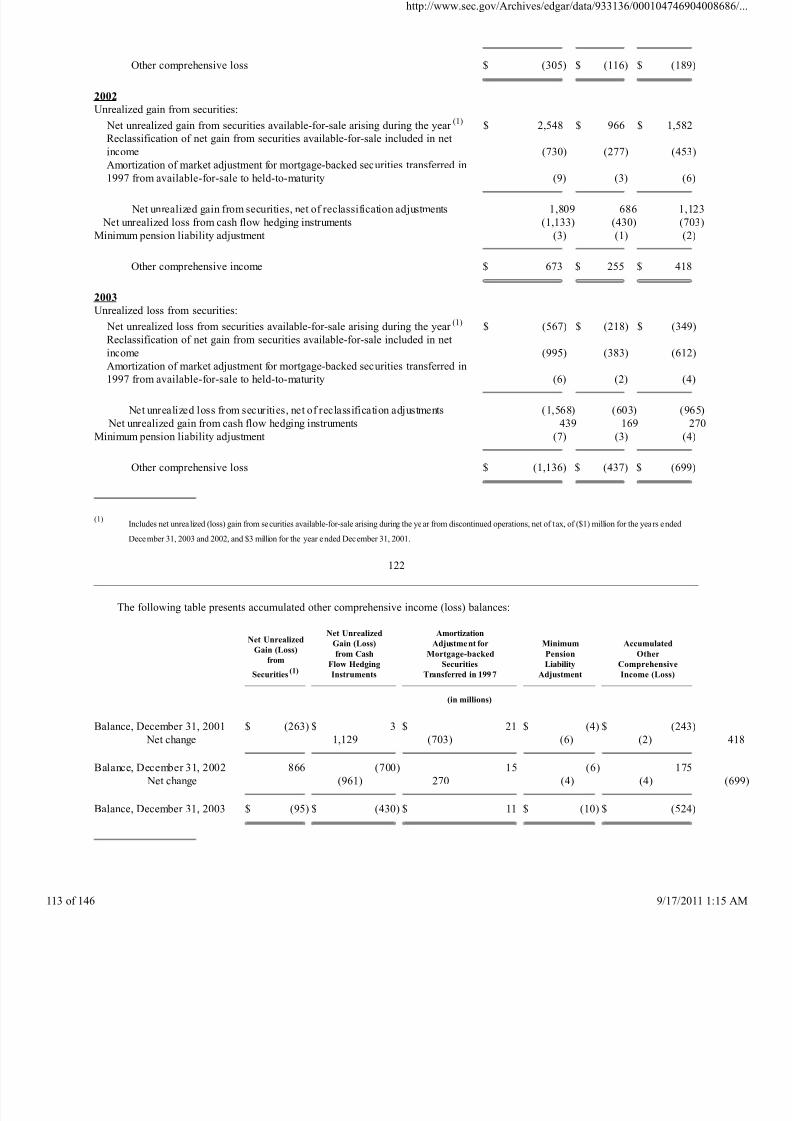
8/4/2019 Wamu 10-k 2003 Subprime
http://slidepdf.com/reader/full/wamu-10-k-2003-subprime 113/146
Other comprehensive loss $ (305) $ (116) $ (189)
2002
Unrealized gain from securities:
Net unrealized gain from securities available-for-sale arising during the year (1) $ 2,548 $ 966 $ 1,582
Reclassification of net gain from securities available-for-sale included in net
income (730) (277) (453)
Amortization of market adjustment for mortgage-backed securities transferred in
1997 from available-for-sale to held-to-maturity (9) (3) (6)
Net unrealized gain from securities, net of reclassification adjustments 1,809 686 1,123
Net unrealized loss from cash flow hedging instruments (1,133) (430) (703)
Minimum pension liability adjustment (3) (1) (2)
Other comprehensive income $ 673 $ 255 $ 418
2003
Unrealized loss from securities:
Net unrealized loss from securities available-for-sale arising during the year (1) $ (567) $ (218) $ (349)
Reclassification of net gain from securities available-for-sale included in net
income (995) (383) (612)
Amortization of market adjustment for mortgage-backed securities transferred in
1997 from available-for-sale to held-to-maturity (6) (2) (4)
Net unrealized loss from securities, net of reclassification adjustments (1,568) (603) (965
Net unrealized gain from cash flow hedging instruments 439 169 270
Minimum pension liability adjustment (7) (3) (4)
Other comprehensive loss $ (1,136) $ (437) $ (699)
(1)
Includes net unrea lized (loss) gain from securities available-for-sale arising during the year from discontinued operations, net of tax, of ($1) million for the years ended
December 31, 2003 and 2002, and $3 million for the year ended December 31, 2001.
122
The following table presents accumulated other comprehensive income (loss) balances:
Net Unrealized
Gain (Loss)
from
Securities(1)
Net Unrealized
Gain (Loss)
from Cash
Flow Hedging
Instruments
Amortization
Adjustment for
Mortgage-backed
Securities
Transferred in 199 7
Minimum
Pension
Liability
Adjustment
Accumulated
Other
Comprehensive
Income (Loss)
(in millions)
Balance, December 31, 2001 $ (263) $ 3 $ 21 $ (4) $ (243)
Net change 1,129 (703) (6) (2)
Balance, December 31, 2002 866 (700) 15 (6) 175
Net change (961) 270 (4) (4)
Balance, December 31, 2003 $ (95) $ (430) $ 11 $ (10) $ (524)
http://www.sec.gov/Archives/edgar/data/933136/000104746904
f 146 9/17/2011
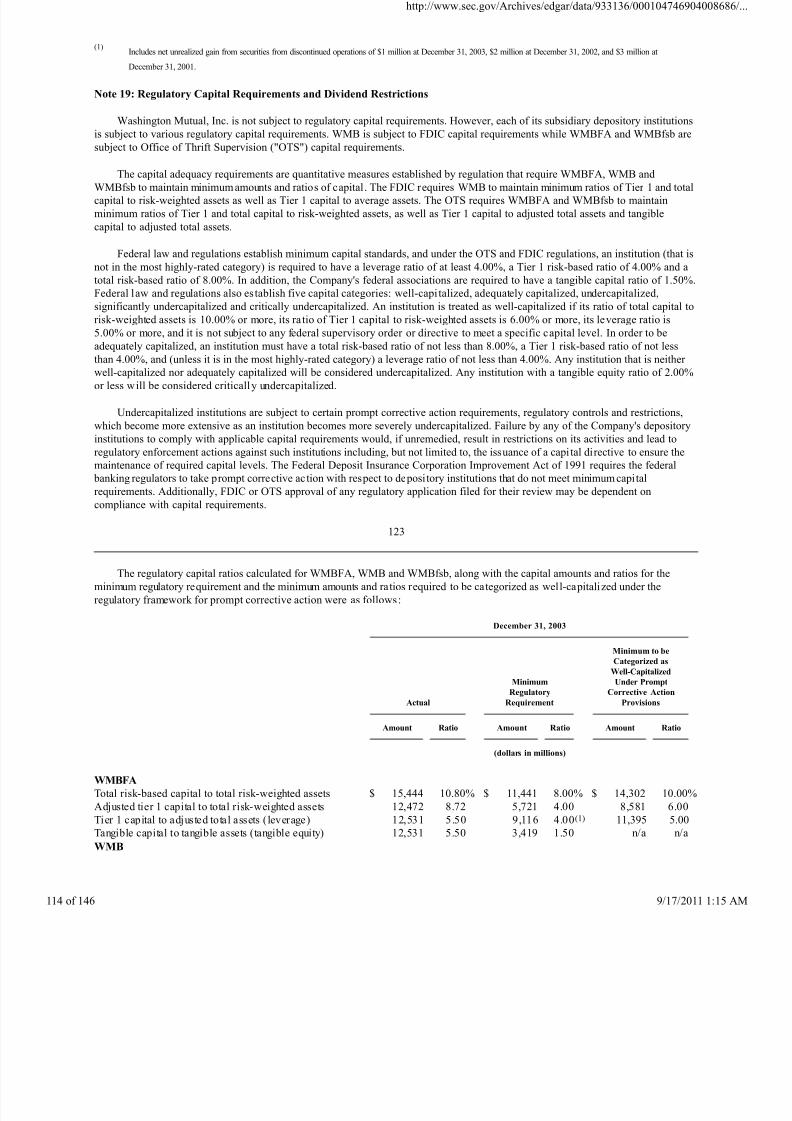
8/4/2019 Wamu 10-k 2003 Subprime
http://slidepdf.com/reader/full/wamu-10-k-2003-subprime 114/146
(1)Includes net unrealized gain from securities from discontinued operations of $1 million at December 31, 2003, $2 million at December 31, 2002, and $3 million at
December 31, 2001.
Note 19: Regulatory Capital Requirements and Dividend Restrictions
Washington Mutual, Inc. is not subject to regulatory capital requirements. However, each of its subsidiary depository institutions
is subject to various regulatory capital requirements. WMB is subject to FDIC capital requirements while WMBFA and WMBfsb are
subject to Office of Thrift Supervision ("OTS") capital requirements.
The capital adequacy requirements are quantitative measures established by regulation that require WMBFA, WMB andWMBfsb to maintain minimum amounts and ratios of capital. The FDIC requires WMB to maintain minimum ratios of Tier 1 and total
capital to risk-weighted assets as well as Tier 1 capital to average assets. The OTS requires WMBFA and WMBfsb to maintain
minimum ratios of Tier 1 and total capital to risk-weighted assets, as well as Tier 1 capital to adjusted total assets and tangible
capital to adjusted total assets.
Federal law and regulations establish minimum capital standards, and under the OTS and FDIC regulations, an institution (that is
not in the most highly-rated category) is required to have a leverage ratio of at least 4.00%, a Tier 1 risk-based ratio of 4.00% and a
total risk-based ratio of 8.00%. In addition, the Company's federal associations are required to have a tangible capital ratio of 1.50%.
Federal law and regulations also establish five capital categories: well-capi talized, adequately capitalized, undercapitalized,
significantly undercapitalized and critically undercapitalized. An institution is treated as well-capitalized if its ratio of total capital to
risk-weighted assets is 10.00% or more, its ra tio of Tier 1 capital to risk-weighted assets is 6.00% or more, its leverage ratio is
5.00% or more, and it is not subject to any federal supervisory order or directive to meet a specific capital level. In order to be
adequately capitalized, an institution must have a total risk-based ratio of not less than 8.00%, a Tier 1 risk-based ratio of not lessthan 4.00%, and (unless it is in the most highly-rated category) a leverage ratio of not less than 4.00%. Any institution that is neither
well-capitalized nor adequately capitalized will be considered undercapitalized. Any institution with a tangible equity ratio of 2.00%
or less will be considered critically undercapitalized.
Undercapitalized institutions are subject to certain prompt corrective action requirements, regulatory controls and restrictions,
which become more extensive as an institution becomes more severely undercapitalized. Failure by any of the Company's depository
institutions to comply with applicable capital requirements would, if unremedied, result in restrictions on its activities and lead to
regulatory enforcement actions against such institutions including, but not limited to, the issuance of a capi tal directive to ensure the
maintenance of required capital levels. The Federal Deposit Insurance Corporation Improvement Act of 1991 requires the federal
banking regulators to take prompt corrective action with respect to depository institutions that do not meet minimum capital
requirements. Additionally, FDIC or OTS approval of any regulatory application filed for their review may be dependent on
compliance with capital requirements.
123
The regulatory capital ratios calculated for WMBFA, WMB and WMBfsb, along with the capital amounts and ratios for the
minimum regulatory requirement and the minimum amounts and ratios required to be categorized as well-capitalized under the
regulatory framework for prompt corrective action were as follows:
December 31, 2003
Actual
Minimum
Regulatory
Requirement
Minimum to be
Categorized as
Well-Capitalized
Under Prompt
Corrective Action
Provisions
Amount
Ratio
Amount
Ratio
Amount
Ratio
(dollars in millions)
WMBFA
Total risk-based capital to total risk-weighted assets $ 15,444 10.80% $ 11,441 8.00% $ 14,302 10.00%
Adjusted tier 1 capital to total risk-weighted assets 12,472 8.72 5,721 4.00 8,581 6.00
Tier 1 capital to adjusted total assets (leverage) 12,531 5.50 9,116 4.00(1) 11,395 5.00
Tangible capital to tangible assets (tangible equity) 12,531 5.50 3,419 1.50 n/a n/a
WMB
http://www.sec.gov/Archives/edgar/data/933136/000104746904
f 146 9/17/2011
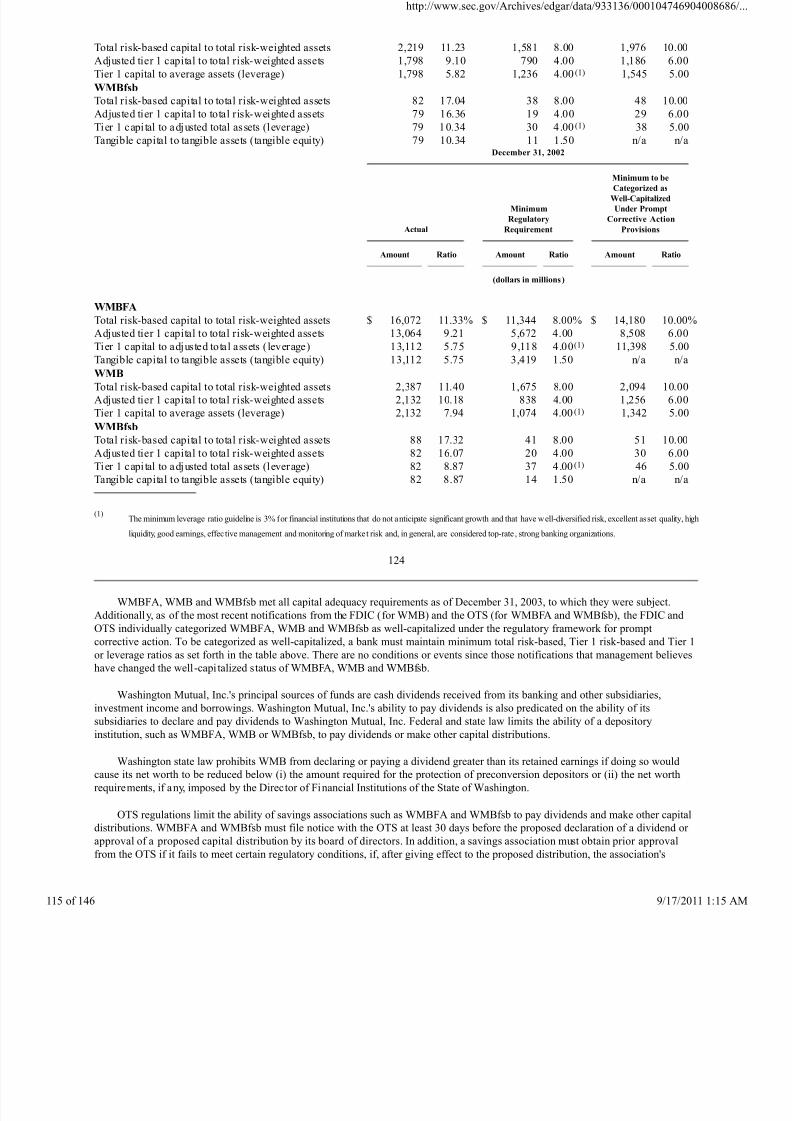
8/4/2019 Wamu 10-k 2003 Subprime
http://slidepdf.com/reader/full/wamu-10-k-2003-subprime 115/146
Total risk-based capital to total risk-weighted assets 2,219 11.23 1,581 8.00 1,976 10.00
Adjusted tier 1 capital to total risk-weighted assets 1,798 9.10 790 4.00 1,186 6.00
Tier 1 capital to average assets (leverage) 1,798 5.82 1,236 4.00(1) 1,545 5.00
WMBfsb
Total risk-based capital to total risk-weighted assets 82 17.04 38 8.00 48 10.00
Adjusted tier 1 capital to total risk-weighted assets 79 16.36 19 4.00 29 6.00
Tier 1 capi tal to adjusted total assets (leverage) 79 10.34 30 4.00(1) 38 5.00
Tangible capital to tangible assets (tangible equity) 79 10.34 11 1.50 n/a n/aDecember 31, 2002
Actual
Minimum
Regulatory
Requirement
Minimum to be
Categorized as
Well-Capitalized
Under Prompt
Corrective Action
Provisions
Amount
Ratio
Amount
Ratio
Amount
Ratio
(dollars in millions)
WMBFA
Total risk-based capital to total risk-weighted assets $ 16,072 11.33% $ 11,344 8.00% $ 14,180 10.00%
Adjusted tier 1 capital to total risk-weighted assets 13,064 9.21 5,672 4.00 8,508 6.00
Tier 1 capital to adjusted total assets (leverage) 13,112 5.75 9,118 4.00(1)
11,398 5.00Tangible capital to tangible assets (tangible equity) 13,112 5.75 3,419 1.50 n/a n/a
WMB
Total risk-based capital to total risk-weighted assets 2,387 11.40 1,675 8.00 2,094 10.00
Adjusted tier 1 capital to total risk-weighted assets 2,132 10.18 838 4.00 1,256 6.00
Tier 1 capital to average assets (leverage) 2,132 7.94 1,074 4.00(1) 1,342 5.00
WMBfsb
Total risk-based capital to total risk-weighted assets 88 17.32 41 8.00 51 10.00
Adjusted tier 1 capital to total risk-weighted assets 82 16.07 20 4.00 30 6.00
Tier 1 capi tal to adjusted total assets (leverage) 82 8.87 37 4.00(1) 46 5.00
Tangible capital to tangible assets (tangible equity) 82 8.87 14 1.50 n/a n/a
(1)The minimum leverage ratio guideline is 3% for financial institutions that do not anticipate significant growth and that have well-diversified risk, excellent asset quality, high
liquidity, good earnings, effec tive management and monitoring of market risk and, in general, are considered top-rate , strong banking organizations.
124
WMBFA, WMB and WMBfsb met all capital adequacy requirements as of December 31, 2003, to which they were subject.
Additionally, as of the most recent notifications from the FDIC (for WMB) and the OTS (for WMBFA and WMBfsb), the FDIC and
OTS individually categorized WMBFA, WMB and WMBfsb as well-capitalized under the regulatory framework for prompt
corrective action. To be categorized as well-capitalized, a bank must maintain minimum total risk-based, Tier 1 risk-based and Tier 1
or leverage ratios as set forth in the table above. There are no conditions or events since those notifications that management believes
have changed the well-capi talized status of WMBFA, WMB and WMBfsb.
Washington Mutual, Inc.'s principal sources of funds are cash dividends received from its banking and other subsidiaries,investment income and borrowings. Washington Mutual, Inc.'s ability to pay dividends is also predicated on the ability of its
subsidiaries to declare and pay dividends to Washington Mutual, Inc. Federal and state law limits the ability of a depository
institution, such as WMBFA, WMB or WMBfsb, to pay dividends or make other capital distributions.
Washington state law prohibits WMB from declaring or paying a dividend greater than its retained earnings if doing so would
cause its net worth to be reduced below (i) the amount required for the protection of preconversion depositors or (ii) the net worth
requirements, if any, imposed by the Director of Financial Institutions of the State of Washington.
OTS regulations limit the ability of savings associations such as WMBFA and WMBfsb to pay dividends and make other capital
distributions. WMBFA and WMBfsb must file notice with the OTS at least 30 days before the proposed declaration of a dividend or
approval of a proposed capital distribution by its board of directors. In addition, a savings association must obtain prior approval
from the OTS if it fails to meet certain regulatory conditions, if, after giving effect to the proposed distribution, the association's
http://www.sec.gov/Archives/edgar/data/933136/000104746904
f 146 9/17/2011
8/4/2019 Wamu 10-k 2003 Subprime
http://slidepdf.com/reader/full/wamu-10-k-2003-subprime 116/146
capital distributions in a calendar year would exceed its year-to-date net income plus retained net income for the preceding two years
or the association would not be at least adequately capitalized or if the distribution would violate a statute, regulation, regulatory
agreement or a regulatory condition to which the association is subject.
The Company's retained earnings at December 31, 2003 included a pre-1988 thrift bad debt reserve for tax purposes of
$2.22 billion for which no federal income taxes have been provided. In the future, if the thrift bad debt reserve is used for any
purpose other than to absorb bad debt losses, or if any of the banking subsidiaries no longer qualifies as a bank, the Company will
incur a federal income tax liability, at the then prevailing corporate income tax rate, to the extent of such subsidiaries' pre-1988 thrift
bad debt reserve. As a result, the Company's ability to pay dividends in excess of current earnings may be limited.
Note 20: Stock-Based Compensation Plans and Shareholder Rights Plan
Washington Mutual maintains an equity incentive plan and an employee stock purchase plan. The following information is
disclosed on a continuing and discontinued operations basis.
2003 Equity Incentive Plan
In February 2003 the Board of Directors adopted the 2003 Equity Incentive Plan ("2003 EIP"). On April 15, 2003 the
shareholders approved the adoption of the 2003 EIP, which replaced the 1994 Stock Option Plan ("1994 Plan") and the Company's
Equity Incentive Plan. Under the 2003 EIP, all of the Company's employees, officers, directors and certain consultants, agents,
advisors and independent contractors are eligible to receive awards. Awards which may be granted under the 2003 EIP include stock
options, stock appreciation rights, restricted stock and stock units, performance shares and performance units and other stock or
cash-based awards. The 2003 EIP is generally similar to the 1994 Plan and the
125
Equity Incentive Plan, and does not affect the terms of any option granted under the 1994 Plan or stock or shares awarded under the
Equity Incentive Plan. The maximum number of shares of Washington Mutual common stock available for grant under the 2003 EIP is
44,919,426, which includes authorized shares not issued or subject to outstanding awards under the Company's 1994 Plan or Equity
Incentive Plan.
Under the 2003 EIP, the exercise price of the option must at least equal the fair market value of Washington Mutual's common
stock on the date of the grant. The options generally vest on a phased-in schedule over one to three years, depending on the terms of
the grant, and expire 10 years from the grant date.
The 2003 EIP permits awards of restricted stock and stock units, and performance shares and performance units with or without
performance-based vesting restrictions. The maximum aggregate number of such shares that may be issued under the 2003 EIP (other
than options and stock appreciation rights) is 13,000,000, and the maximum number of shares that may be issued under the 2003 EIP
pursuant to awards (other than options and stock appreciation rights) that have no restrictions or have restrictions based solely on
service for less than three years is 4,350,000.
In 2003, 2,912,134 restricted shares were granted under the 2003 EIP with a weighted-average grant-date per share fair value of
$40.88. As of December 31, 2003, there were 2,886,818 restricted shares outstanding. Upon the grant of restricted stock awards,
shares are issued to a trustee who releases them to recipients when the restrictions lapse. At the date of grant, unearned compensation
is recorded as an offset to stockholders' equity and is amortized as compensation expense over the restricted period. The balance of
unearned compensation related to these restricted shares was $104 million at December 31, 2003. Restricted stock and stock units
accrue or pay dividends. All canceled or forfeited shares become available for future grants.
Certain executives participate in the Company's Performance Shares Program. Under this program, executives are notified of
target awards and the performance criteria that determine actual awards at the end of the three-year measurement period. The actual
awards may be between 0% and 250% of the target award, depending on the Company's performance. After the three-year
performance cycle has been completed, actual awards may be made in cash or in the Company's common stock. Common stock
awards will be made from the 2003 EIP.
The total compensation expense recognized for the 2003 EIP was $18 million in 2003.
1994 Stock Option Plan
On April 19, 1994, the Company's shareholders approved the adoption of the 1994 Stock Option Plan, which was subsequently
http://www.sec.gov/Archives/edgar/data/933136/000104746904
f 146 9/17/2011
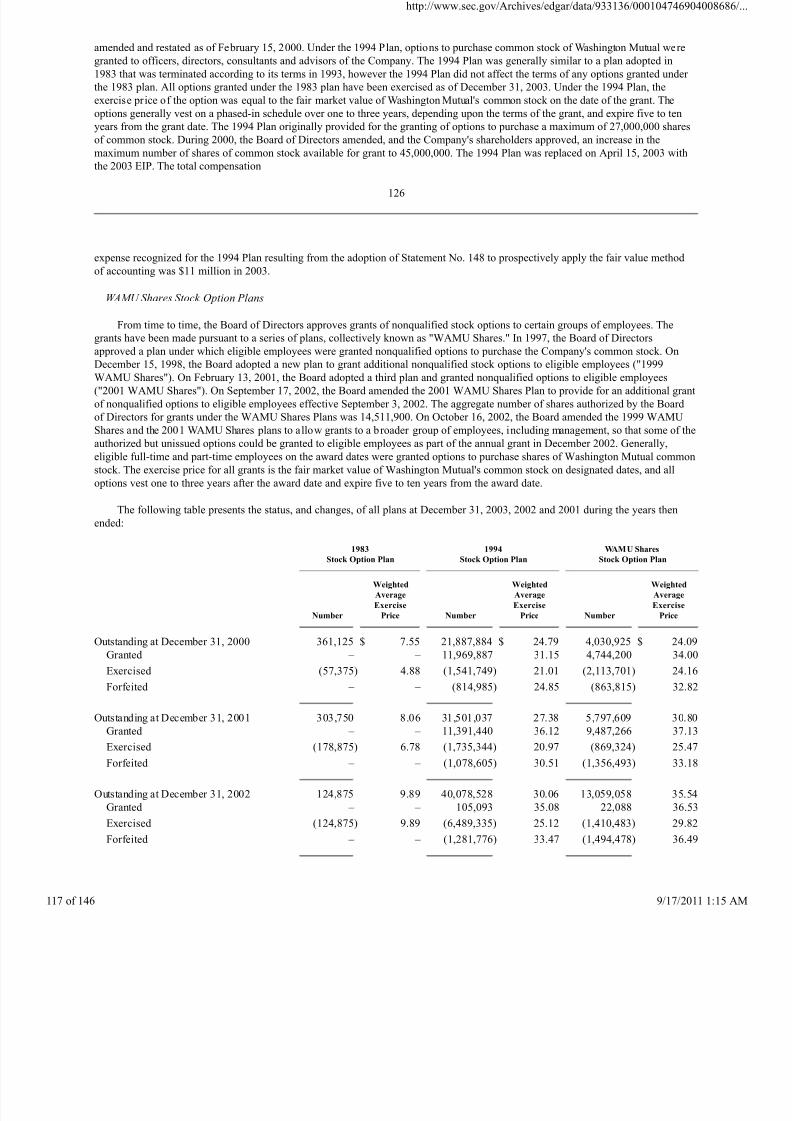
8/4/2019 Wamu 10-k 2003 Subprime
http://slidepdf.com/reader/full/wamu-10-k-2003-subprime 117/146
amended and restated as of February 15, 2000. Under the 1994 Plan, options to purchase common stock of Washington Mutual were
granted to officers, directors, consultants and advisors of the Company. The 1994 Plan was generally similar to a plan adopted in
1983 that was terminated according to its terms in 1993, however the 1994 Plan did not affect the terms of any options granted under
the 1983 plan. All options granted under the 1983 plan have been exercised as of December 31, 2003. Under the 1994 Plan, the
exercise price of the option was equal to the fair market value of Washington Mutual's common stock on the date of the grant. The
options generally vest on a phased-in schedule over one to three years, depending upon the terms of the grant, and expire five to ten
years from the grant date. The 1994 Plan originally provided for the granting of options to purchase a maximum of 27,000,000 shares
of common stock. During 2000, the Board of Directors amended, and the Company's shareholders approved, an increase in the
maximum number of shares of common stock available for grant to 45,000,000. The 1994 Plan was replaced on April 15, 2003 with
the 2003 EIP. The total compensation
126
expense recognized for the 1994 Plan resulting from the adoption of Statement No. 148 to prospectively apply the fair value method
of accounting was $11 million in 2003.
WAMU Shares Stock Option Plans
From time to time, the Board of Directors approves grants of nonqualified stock options to certain groups of employees. The
grants have been made pursuant to a series of plans, collectively known as "WAMU Shares." In 1997, the Board of Directors
approved a plan under which eligible employees were granted nonqualified options to purchase the Company's common stock. OnDecember 15, 1998, the Board adopted a new plan to grant additional nonqualified stock options to eligible employees ("1999
WAMU Shares"). On February 13, 2001, the Board adopted a third plan and granted nonqualified options to eligible employees
("2001 WAMU Shares"). On September 17, 2002, the Board amended the 2001 WAMU Shares Plan to provide for an additional grant
of nonqualified options to eligible employees effective September 3, 2002. The aggregate number of shares authorized by the Board
of Directors for grants under the WAMU Shares Plans was 14,511,900. On October 16, 2002, the Board amended the 1999 WAMU
Shares and the 2001 WAMU Shares plans to allow grants to a broader group of employees, including management, so that some of the
authorized but unissued options could be granted to eligible employees as part of the annual grant in December 2002. Generally,
eligible full-time and part-time employees on the award dates were granted options to purchase shares of Washington Mutual common
stock. The exercise price for all grants is the fair market value of Washington Mutual's common stock on designated dates, and all
options vest one to three years after the award date and expire five to ten years from the award date.
The following table presents the status, and changes, of all plans at December 31, 2003, 2002 and 2001 during the years then
ended:
1983
Stock Option Plan
1994
Stock Option Plan
WAMU Shares
Stock Option Plan
Number
Weighted
Average
Exercise
Price
Number
Weighted
Average
Exercise
Price
Number
Weighted
Average
Exercise
Price
Outstanding at December 31, 2000 361,125 $ 7.55 21,887,884 $ 24.79 4,030,925 $ 24.09
Granted – – 11,969,887 31.15 4,744,200 34.00
Exercised (57,375) 4.88 (1,541,749) 21.01 (2,113,701) 24.16
Forfeited – – (814,985) 24.85 (863,815) 32.82
Outstanding at December 31, 2001 303,750 8.06 31,501,037 27.38 5,797,609 30.80
Granted – – 11,391,440 36.12 9,487,266 37.13
Exercised (178,875) 6.78 (1,735,344) 20.97 (869,324) 25.47
Forfeited – – (1,078,605) 30.51 (1,356,493) 33.18
Outstanding at December 31, 2002 124,875 9.89 40,078,528 30.06 13,059,058 35.54
Granted – – 105,093 35.08 22,088 36.53
Exercised (124,875) 9.89 (6,489,335) 25.12 (1,410,483) 29.82
Forfeited – – (1,281,776) 33.47 (1,494,478) 36.49
http://www.sec.gov/Archives/edgar/data/933136/000104746904
f 146 9/17/2011
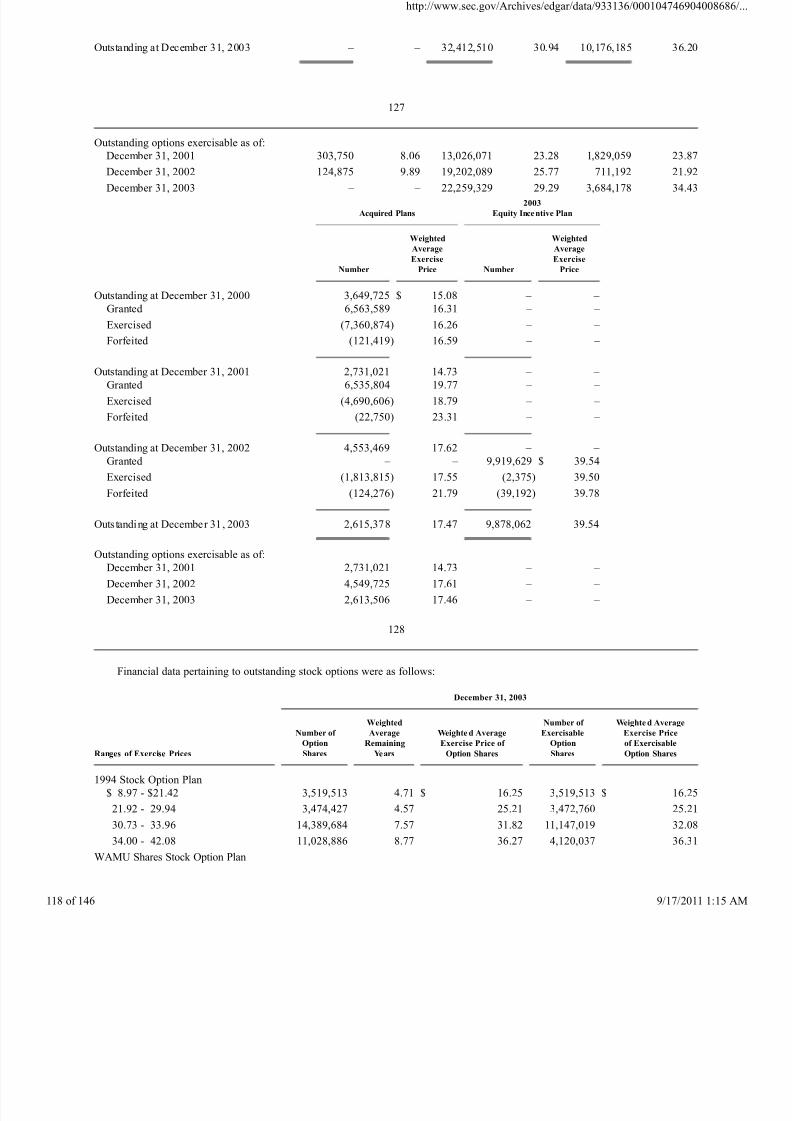
8/4/2019 Wamu 10-k 2003 Subprime
http://slidepdf.com/reader/full/wamu-10-k-2003-subprime 118/146
Outstanding at December 31, 2003 – – 32,412,510 30.94 10,176,185 36.20
127
Outstanding options exercisable as of:
December 31, 2001 303,750 8.06 13,026,071 23.28 1,829,059 23.87
December 31, 2002 124,875 9.89 19,202,089 25.77 711,192 21.92 December 31, 2003 – – 22,259,329 29.29 3,684,178 34.43
Acquired Plans
2003
Equity Incentive Plan
Number
Weighted
Average
Exercise
Price
Number
Weighted
Average
Exercise
Price
Outstanding at December 31, 2000 3,649,725 $ 15.08 – –
Granted 6,563,589 16.31 – –
Exercised (7,360,874) 16.26 – –
Forfeited (121,419) 16.59 – –
Outstanding at December 31, 2001 2,731,021 14.73 – –
Granted 6,535,804 19.77 – –
Exercised (4,690,606) 18.79 – –
Forfeited (22,750) 23.31 – –
Outstanding at December 31, 2002 4,553,469 17.62 – –
Granted – – 9,919,629 $ 39.54
Exercised (1,813,815) 17.55 (2,375) 39.50
Forfeited (124,276) 21.79 (39,192) 39.78
Outstanding at December 31, 2003 2,615,378 17.47 9,878,062 39.54
Outstanding options exercisable as of:
December 31, 2001 2,731,021 14.73 – –
December 31, 2002 4,549,725 17.61 – –
December 31, 2003 2,613,506 17.46 – –
128
Financial data pertaining to outstanding stock options were as follows:
December 31, 2003
Ranges of Exercise Prices
Number of
Option
Shares
Weighted
Average
Remaining
Years
Weighte d Average
Exercise Price of
Option Shares
Number of
Exercisable
Option
Shares
Weighte d Average
Exercise Price
of Exercisable
Option Shares
1994 Stock Option Plan
$ 8.97 - $21.42 3,519,513 4.71 $ 16.25 3,519,513 $ 16.25
21.92 - 29.94 3,474,427 4.57 25.21 3,472,760 25.21
30.73 - 33.96 14,389,684 7.57 31.82 11,147,019 32.08
34.00 - 42.08 11,028,886 8.77 36.27 4,120,037 36.31
WAMU Shares Stock Option Plan
http://www.sec.gov/Archives/edgar/data/933136/000104746904
f 146 9/17/2011
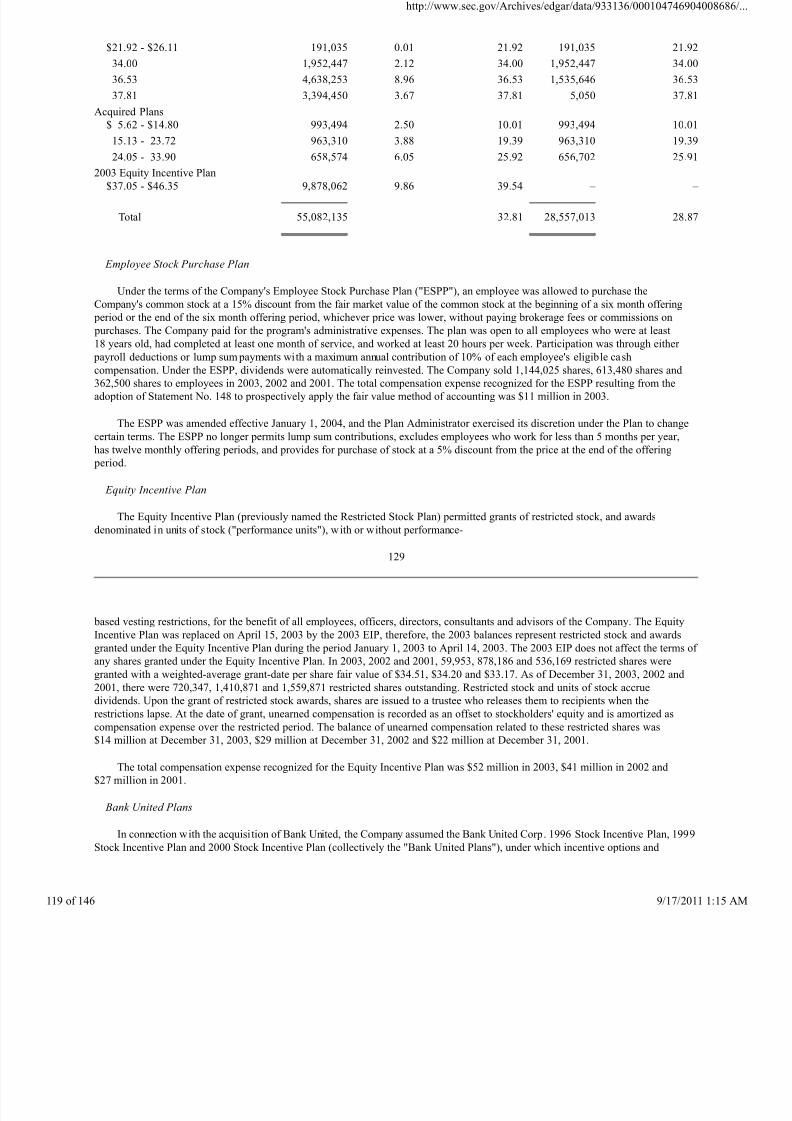
8/4/2019 Wamu 10-k 2003 Subprime
http://slidepdf.com/reader/full/wamu-10-k-2003-subprime 119/146
$21.92 - $26.11 191,035 0.01 21.92 191,035 21.92
34.00 1,952,447 2.12 34.00 1,952,447 34.00
36.53 4,638,253 8.96 36.53 1,535,646 36.53
37.81 3,394,450 3.67 37.81 5,050 37.81
Acquired Plans
$ 5.62 - $14.80 993,494 2.50 10.01 993,494 10.01
15.13 - 23.72 963,310 3.88 19.39 963,310 19.39
24.05 - 33.90 658,574 6.05 25.92 656,702 25.91
2003 Equity Incentive Plan$37.05 - $46.35 9,878,062 9.86 39.54 – –
Total 55,082,135 32.81 28,557,013 28.87
Employee Stock Purchase Plan
Under the terms of the Company's Employee Stock Purchase Plan ("ESPP"), an employee was allowed to purchase the
Company's common stock at a 15% discount from the fair market value of the common stock at the beginning of a six month offering
period or the end of the six month offering period, whichever price was lower, without paying brokerage fees or commissions on
purchases. The Company paid for the program's administrative expenses. The plan was open to all employees who were at least
18 years old, had completed at least one month of service, and worked at least 20 hours per week. Participation was through either
payroll deductions or lump sum payments with a maximum annual contribution of 10% of each employee's eligible cash
compensation. Under the ESPP, dividends were automatically reinvested. The Company sold 1,144,025 shares, 613,480 shares and
362,500 shares to employees in 2003, 2002 and 2001. The total compensation expense recognized for the ESPP resulting from the
adoption of Statement No. 148 to prospectively apply the fair value method of accounting was $11 million in 2003.
The ESPP was amended effective January 1, 2004, and the Plan Administrator exercised its discretion under the Plan to change
certain terms. The ESPP no longer permits lump sum contributions, excludes employees who work for less than 5 months per year,
has twelve monthly offering periods, and provides for purchase of stock at a 5% discount from the price at the end of the offering
period.
Equity Incentive Plan
The Equity Incentive Plan (previously named the Restricted Stock Plan) permitted grants of restricted stock, and awards
denominated in units of stock ("performance units"), with or without performance-
129
based vesting restrictions, for the benefit of all employees, officers, directors, consultants and advisors of the Company. The Equity
Incentive Plan was replaced on April 15, 2003 by the 2003 EIP, therefore, the 2003 balances represent restricted stock and awards
granted under the Equity Incentive Plan during the period January 1, 2003 to April 14, 2003. The 2003 EIP does not affect the terms of
any shares granted under the Equity Incentive Plan. In 2003, 2002 and 2001, 59,953, 878,186 and 536,169 restricted shares were
granted with a weighted-average grant-date per share fair value of $34.51, $34.20 and $33.17. As of December 31, 2003, 2002 and
2001, there were 720,347, 1,410,871 and 1,559,871 restricted shares outstanding. Restricted stock and units of stock accrue
dividends. Upon the grant of restricted stock awards, shares are issued to a trustee who releases them to recipients when therestrictions lapse. At the date of grant, unearned compensation is recorded as an offset to stockholders' equity and is amortized as
compensation expense over the restricted period. The balance of unearned compensation related to these restricted shares was
$14 million at December 31, 2003, $29 million at December 31, 2002 and $22 million at December 31, 2001.
The total compensation expense recognized for the Equity Incentive Plan was $52 million in 2003, $41 million in 2002 and
$27 million in 2001.
Bank United Plans
In connection with the acquisition of Bank United, the Company assumed the Bank United Corp. 1996 Stock Incentive Plan, 1999
Stock Incentive Plan and 2000 Stock Incentive Plan (collectively the "Bank United Plans"), under which incentive options and
http://www.sec.gov/Archives/edgar/data/933136/000104746904
f 146 9/17/2011
8/4/2019 Wamu 10-k 2003 Subprime
http://slidepdf.com/reader/full/wamu-10-k-2003-subprime 120/146
nonqualified options to purchase common stock, restricted common stock and other performance awards may be granted to officers,
employees and consultants. Options under the Bank United Plans general ly expire ten years from the date of grant, and vest over
varying periods that were determined at grant date. All options granted under the Bank United Plans included a limited stock
appreciation right, which entitles the holder to surrender the vested and exercisable option for cash following the closing of an
acquisition. With the Company's acquisition of Bank United, the Company assumed approximately 6.6 million options to purchase
Bank United common stock, which were converted into options to purchase Washington Mutual common stock. During 2002 and
2001, approximately 6.4 million of these options were exercised. As of December 31, 2003, options to purchase approximately
202,000 shares were remaining to be exercised.
Dime Savings Plans
In connection with the acquisition of Dime, the Company assumed the Dime Bancorp, Inc. 1991 Stock Incentive Plan, 1997 Stock
Incentive Plan and 1997 Stock Incentive Plan for Outside Directors (collectively the "Dime Savings Plans"), under which incentive
options and nonqualifed options to purchase common stock, restricted common stock, stock appreciation rights and deferred common
stock may be granted to officers, employees and consultants. Options under the Dime Savings Plans generally expire ten or eleven
years from the date of the grant and vest over varying periods that were determined at the grant date. Certain options had a stock
appreciation rights feature that was exercisable only for a period of 60 days following the occurrence of certain specified changes in
ownership or control of Dime or certain of its subsidiaries. These stock appreciation rights were converted to options to acquire
Washington Mutual common stock or paid out in cash for their value.
Dime also issued options to purchase shares of common stock under the company's Pride Share Program, a broad-based stock
option plan adopted in 1997 and 1999. Under the program, all eligible full-time and part-time employees could receive options to
purchase common stock which expire eleven years from the date of grant. The vesting of these stock options generally occurred at the
earlier of five years after the date of grant or the date the common stock price reached a specified target price (as
130
established on the grant date) and its closing price stayed at, or rose above, that target price for five consecutive trading days.
With the Company's acquisition of Dime, it assumed approximately 6.5 million options to purchase Dime common stock, which
were converted into options to purchase Washington Mutual common stock. As of December 31, 2003, approximately 5.4 million of
the options assumed were exercised leaving 1 million options remaining to be exercised.
Shareholder Rights Plan
In October 2000, the 1994 Shareholder Rights Plan expired in accordance with its terms. On December 19, 2000, the Company's
Board of Directors adopted a new Shareholder Rights Plan and declared a dividend of one right for each outstanding share of
common stock to shareholders of record on January 4, 2001. The rights have certain anti-takeover effects. They are intended to
discourage coercive or unfair takeover tactics and to encourage any potential acquirer to negotiate a price fair to all shareholders.
The rights may cause substantial dilution to an acquiring party that attempts to acquire the Company on terms not approved by the
Board of Directors, but they will not interfere with any friendly merger or other business combination. The plan was not adopted in
response to any specific effort to acquire control of the Company.
Note 21: Employee Benefits Programs and Other Expense
Pension Plan
Washington Mutual maintains a noncontributory cash balance defined benefit pension plan (the "Pension Plan") for substantially
all eligible employees. As a result of the acquisition of Dime, the Company acquired Dime's noncontributory pension plan, which was
merged into the Pension Plan on July 1, 2002. Benefits earned for each year of service are based primarily on the level of
compensation in that year plus a stipulated rate of return on the benefit balance. It is the Company's policy to fund the Pension Plan on
a current basis to the extent deductible under federal income tax regulations.
Nonqualified Defined Benefit Plans and Other Postretirement Benefit Plans
The Company, as successor to previously acquired companies, has assumed responsibility for nonqualified, noncontributory,
unfunded postretirement benefit plans, including retirement restoration plans for cer tain employees, a number of supplemental
retirement plans for certain officers and multiple outside directors' retirement plans. Benefits under the retirement restoration plans
are generally determined by the Company. Benefits under the supplemental retirement plans are generally based on years of service.
http://www.sec.gov/Archives/edgar/data/933136/000104746904
f 146 9/17/2011
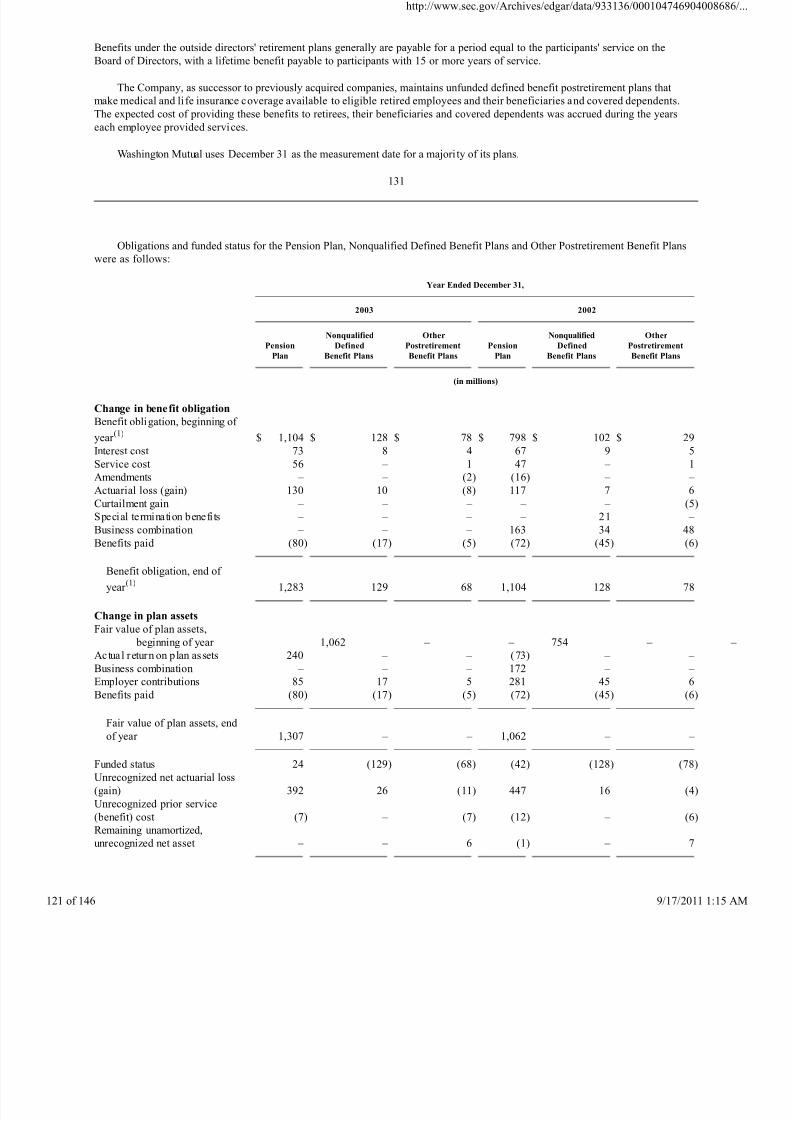
8/4/2019 Wamu 10-k 2003 Subprime
http://slidepdf.com/reader/full/wamu-10-k-2003-subprime 121/146
Benefits under the outside directors' retirement plans generally are payable for a period equal to the participants' service on the
Board of Directors, with a lifetime benefit payable to participants with 15 or more years of service.
The Company, as successor to previously acquired companies, maintains unfunded defined benefit postretirement plans that
make medical and li fe insurance coverage available to eligible retired employees and their beneficiaries and covered dependents.
The expected cost of providing these benefits to retirees, their beneficiaries and covered dependents was accrued during the years
each employee provided services.
Washington Mutual uses December 31 as the measurement date for a majori ty of its plans.
131
Obligations and funded status for the Pension Plan, Nonqualified Defined Benefit Plans and Other Postretirement Benefit Plans
were as follows:
Year Ended December 31,
2003
2002
PensionPlan
Nonqualified
DefinedBenefit Plans
Other
PostretirementBenefit Plans
PensionPlan
Nonqualified
DefinedBenefit Plans
Other
PostretirementBenefit Plans
(in millions)
Change in benefit obligation
Benefit obligation, beginning of
year (1) $ 1,104 $ 128 $ 78 $ 798 $ 102 $ 29
Interest cost 73 8 4 67 9 5
Service cost 56 – 1 47 – 1
Amendments – – (2) (16) – –
Actuarial loss (gain) 130 10 (8) 117 7 6
Curtailment gain – – – – – (5)
Special termination benefits – – – – 21 –
Business combination – – – 163 34 48
Benefits paid (80) (17) (5) (72) (45) (6)
Benefit obligation, end of
year (1) 1,283 129 68 1,104 128 78
Change in plan assets
Fair value of plan assets,
beginning of year 1,062 – – 754 –
Actual return on plan assets 240 – – (73) – –
Business combination – – – 172 – –
Employer contributions 85 17 5 281 45 6
Benefits paid (80) (17) (5) (72) (45) (6)
Fair value of plan assets, end
of year 1,307 – – 1,062 – –
Funded status 24 (129) (68) (42) (128) (78)
Unrecognized net actuarial loss
(gain) 392 26 (11) 447 16 (4)
Unrecognized prior service
(benefit) cost (7) – (7) (12) – (6)
Remaining unamortized,
unrecognized net asset – – 6 (1) – 7
http://www.sec.gov/Archives/edgar/data/933136/000104746904
f 146 9/17/2011
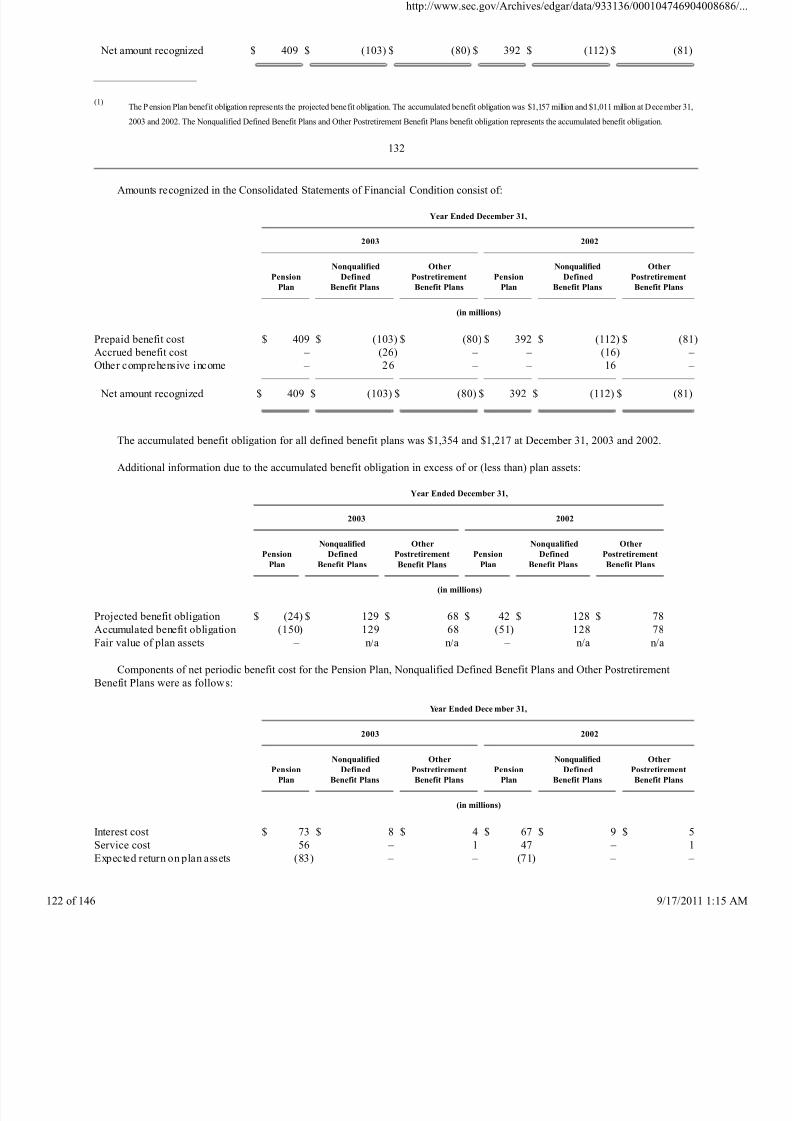
8/4/2019 Wamu 10-k 2003 Subprime
http://slidepdf.com/reader/full/wamu-10-k-2003-subprime 122/146
Net amount recognized $ 409 $ (103) $ (80) $ 392 $ (112) $ (81)
(1)The P ension Plan benefit obligation represents the projected benefit obligation. The accumulated benefit obligation was $1,157 million and $1,011 million at December 31,
2003 and 2002. The Nonqualified Defined Benefit Plans and Other Postretirement Benefit Plans benefit obligation represents the accumulated benefit obligation.
132
Amounts recognized in the Consolidated Statements of Financial Condition consist of:
Year Ended December 31,
2003
2002
Pension
Plan
Nonqualified
Defined
Benefit Plans
Other
Postretirement
Benefit Plans
Pension
Plan
Nonqualified
Defined
Benefit Plans
Other
Postretirement
Benefit Plans
(in millions)
Prepaid benefit cost $ 409 $ (103) $ (80) $ 392 $ (112) $ (81)
Accrued benefit cost – (26) – – (16) – Other comprehensive income – 26 – – 16 –
Net amount recognized $ 409 $ (103) $ (80) $ 392 $ (112) $ (81)
The accumulated benefit obligation for all defined benefit plans was $1,354 and $1,217 at December 31, 2003 and 2002.
Additional information due to the accumulated benefit obligation in excess of or (less than) plan assets:
Year Ended December 31,
2003
2002
Pension
Plan
Nonqualified
Defined
Benefit Plans
Other
Postretirement
Benefit Plans
Pension
Plan
Nonqualified
Defined
Benefit Plans
Other
Postretirement
Benefit Plans
(in millions)
Projected benefit obligation $ (24) $ 129 $ 68 $ 42 $ 128 $ 78
Accumulated benefit obligation (150) 129 68 (51) 128 78
Fair value of plan assets – n/a n/a – n/a n/a
Components of net periodic benefit cost for the Pension Plan, Nonqualified Defined Benefit Plans and Other Postretirement
Benefit Plans were as follows:
Year Ended Dece mber 31,
2003
2002
Pension
Plan
Nonqualified
Defined
Benefit Plans
Other
Postretirement
Benefit Plans
Pension
Plan
Nonqualified
Defined
Benefit Plans
Other
Postretirement
Benefit Plans
(in millions)
Interest cost $ 73 $ 8 $ 4 $ 67 $ 9 $ 5
Service cost 56 – 1 47 – 1
Expected return on plan assets (83) – – (71) – –
http://www.sec.gov/Archives/edgar/data/933136/000104746904
f 146 9/17/2011
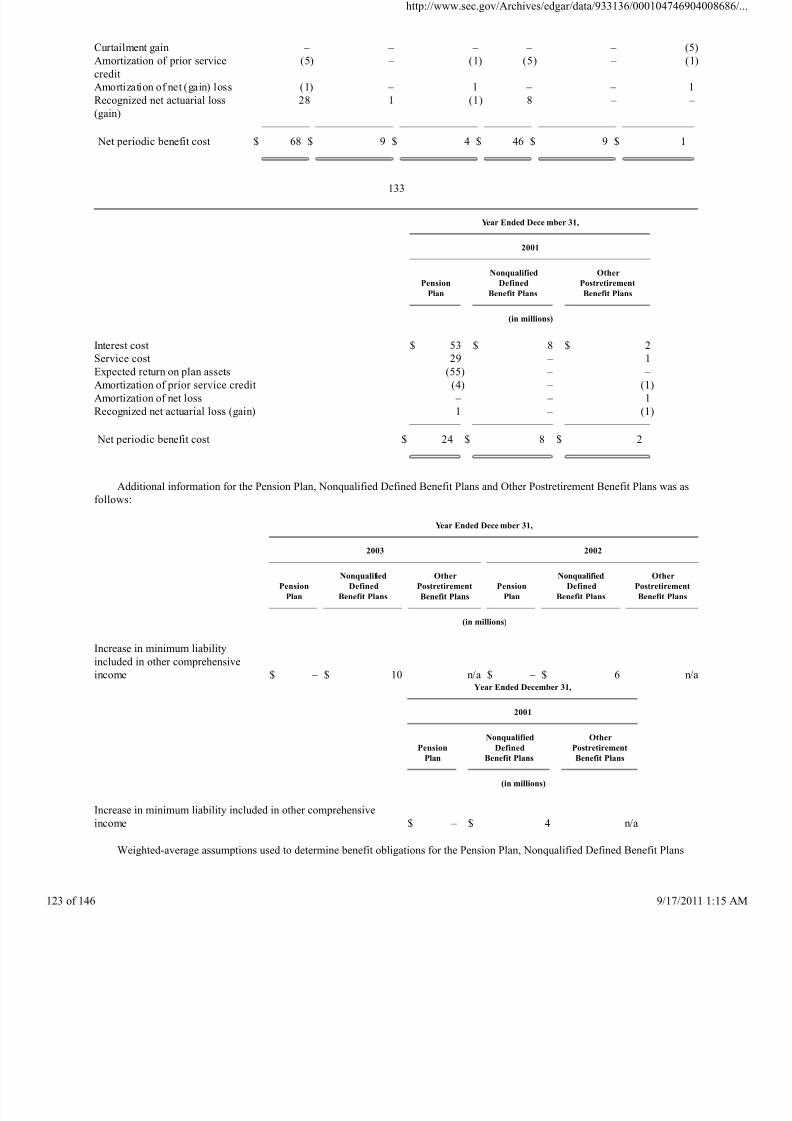
8/4/2019 Wamu 10-k 2003 Subprime
http://slidepdf.com/reader/full/wamu-10-k-2003-subprime 123/146
Curtailment gain – – – – – (5)
Amortization of prior service
credit
(5) – (1) (5) – (1)
Amortization of net (gain) loss (1) – 1 – – 1
Recognized net actuarial loss
(gain)
28 1 (1) 8 – –
Net periodic benefit cost $ 68 $ 9 $ 4 $ 46 $ 9 $ 1
133
Year Ended Dece mber 31,
2001
Pension
Plan
Nonqualified
Defined
Benefit Plans
Other
Postretirement
Benefit Plans
(in millions)
Interest cost $ 53 $ 8 $ 2Service cost 29 – 1
Expected return on plan assets (55) – –
Amortization of prior service credit (4) – (1)
Amortization of net loss – – 1
Recognized net actuarial loss (gain) 1 – (1)
Net periodic benefit cost $ 24 $ 8 $ 2
Additional information for the Pension Plan, Nonqualified Defined Benefit Plans and Other Postretirement Benefit Plans was as
follows:
Year Ended Dece mber 31,
2003
2002
Pension
Plan
Nonqualified
Defined
Benefit Plans
Other
Postretirement
Benefit Plans
Pension
Plan
Nonqualified
Defined
Benefit Plans
Other
Postretirement
Benefit Plans
(in millions)
Increase in minimum liability
included in other comprehensive
income $ – $ 10 n/a $ – $ 6 n/a
Year Ended December 31,
2001
Pension
Plan
Nonqualified
Defined
Benefit Plans
Other
Postretirement
Benefit Plans
(in millions)
Increase in minimum liability included in other comprehensive
income $ – $ 4 n/a
Weighted-average assumptions used to determine benefit obligations for the Pension Plan, Nonqualified Defined Benefit Plans
http://www.sec.gov/Archives/edgar/data/933136/000104746904
f 146 9/17/2011
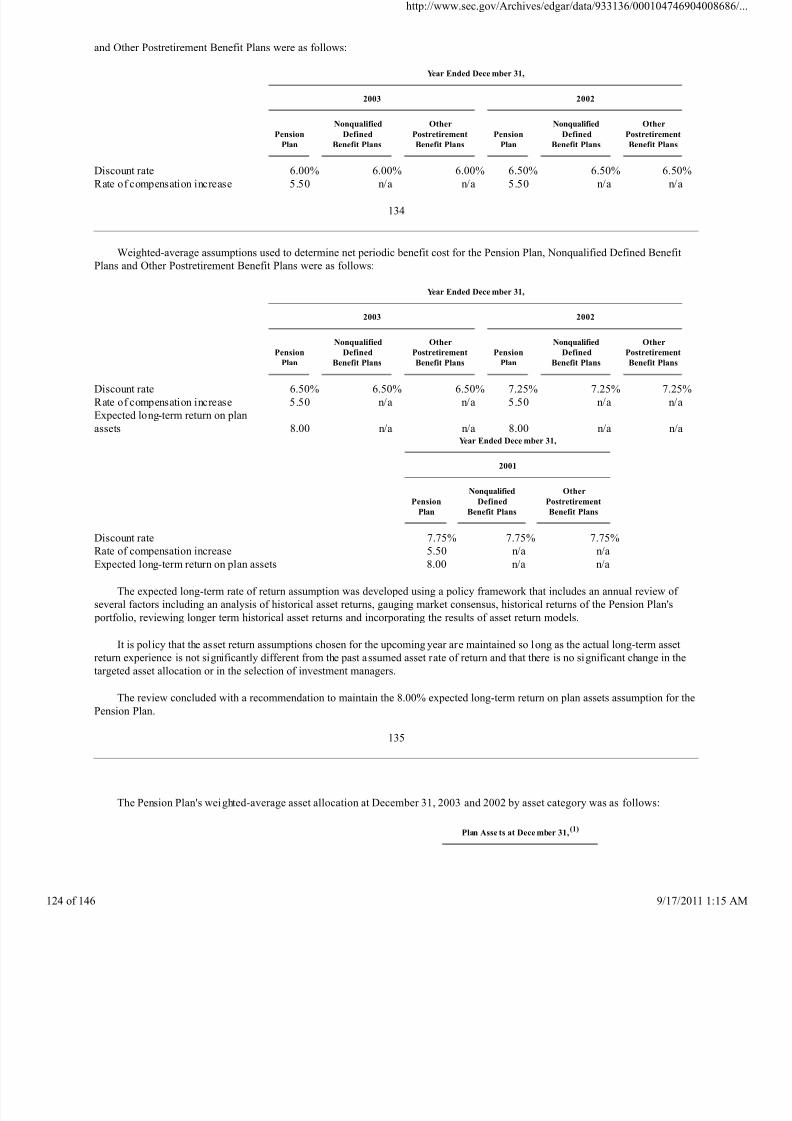
8/4/2019 Wamu 10-k 2003 Subprime
http://slidepdf.com/reader/full/wamu-10-k-2003-subprime 124/146
and Other Postretirement Benefit Plans were as follows:
Year Ended Dece mber 31,
2003
2002
Pension
Plan
Nonqualified
Defined
Benefit Plans
Other
Postretirement
Benefit Plans
Pension
Plan
Nonqualified
Defined
Benefit Plans
Other
Postretirement
Benefit Plans
Discount rate 6.00% 6.00% 6.00% 6.50% 6.50% 6.50%Rate of compensation increase 5.50 n/a n/a 5.50 n/a n/a
134
Weighted-average assumptions used to determine net periodic benefit cost for the Pension Plan, Nonqualified Defined Benefit
Plans and Other Postretirement Benefit Plans were as follows:
Year Ended Dece mber 31,
2003
2002
PensionPlan
Nonqualified
DefinedBenefit Plans
Other
PostretirementBenefit Plans
PensionPlan
Nonqualified
DefinedBenefit Plans
Other
PostretirementBenefit Plans
Discount rate 6.50% 6.50% 6.50% 7.25% 7.25% 7.25%
Rate of compensation increase 5.50 n/a n/a 5.50 n/a n/a
Expected long-term return on plan
assets 8.00 n/a n/a 8.00 n/a n/aYear Ended Dece mber 31,
2001
Pension
Plan
Nonqualified
Defined
Benefit Plans
Other
Postretirement
Benefit Plans
Discount rate 7.75% 7.75% 7.75%
Rate of compensation increase 5.50 n/a n/a
Expected long-term return on plan assets 8.00 n/a n/a
The expected long-term rate of return assumption was developed using a policy framework that includes an annual review of
several factors including an analysis of historical asset returns, gauging market consensus, historical returns of the Pension Plan's
portfolio, reviewing longer term historical asset returns and incorporating the results of asset return models.
It is policy that the asset return assumptions chosen for the upcoming year are maintained so long as the actual long-term asset
return experience is not significantly different from the past assumed asset rate of return and that there is no significant change in the
targeted asset allocation or in the selection of investment managers.
The review concluded with a recommendation to maintain the 8.00% expected long-term return on plan assets assumption for thePension Plan.
135
The Pension Plan's weighted-average asset allocation at December 31, 2003 and 2002 by asset category was as follows:
Plan Asse ts at Dece mber 31,(1)
http://www.sec.gov/Archives/edgar/data/933136/000104746904
f 146 9/17/2011
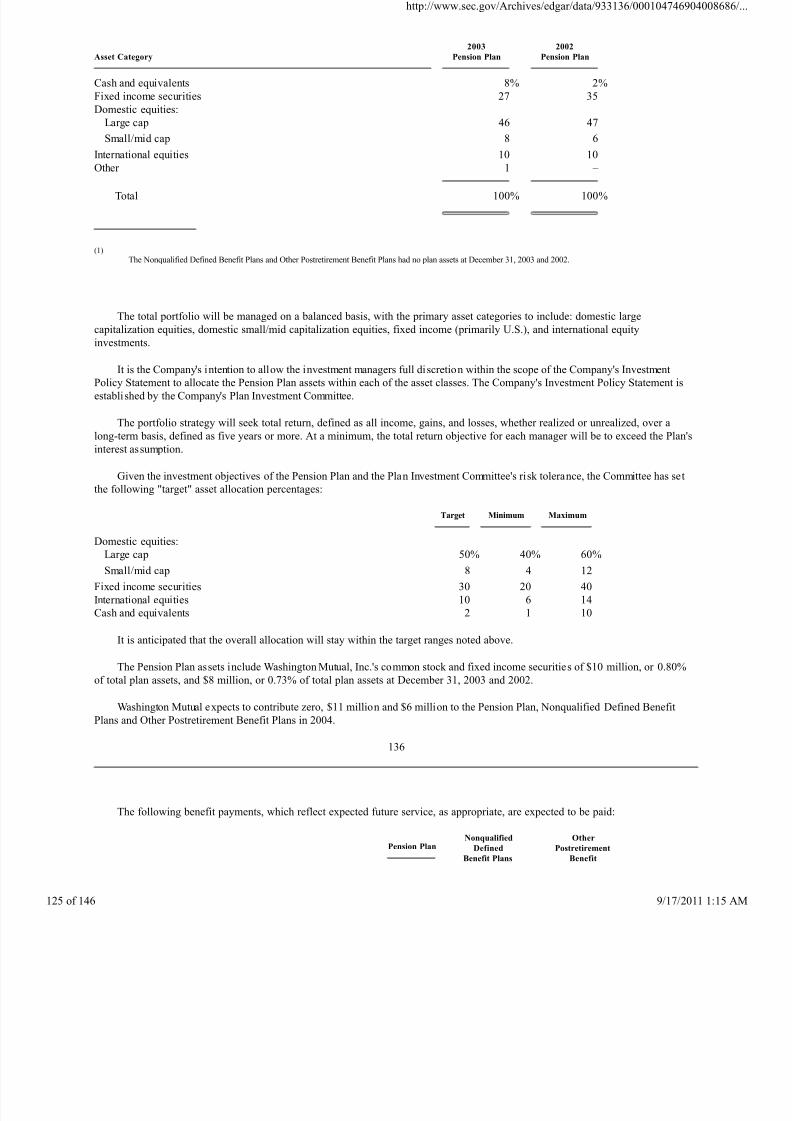
8/4/2019 Wamu 10-k 2003 Subprime
http://slidepdf.com/reader/full/wamu-10-k-2003-subprime 125/146
Asset Category
2003
Pension Plan
2002
Pension Plan
Cash and equivalents 8% 2%
Fixed income securities 27 35
Domestic equities:
Large cap 46 47
Small/mid cap 8 6
International equities 10 10
Other 1 –
Total 100% 100%
(1)
The Nonqualified Defined Benefit Plans and Other Postretirement Benefit Plans had no plan assets at December 31, 2003 and 2002.
The total portfolio will be managed on a balanced basis, with the primary asset categories to include: domestic large
capitalization equities, domestic small/mid capitalization equities, fixed income (primarily U.S.), and international equity
investments.
It is the Company's intention to allow the investment managers full discretion within the scope of the Company's Investment
Policy Statement to allocate the Pension Plan assets within each of the asset classes. The Company's Investment Policy Statement is
established by the Company's Plan Investment Committee.
The portfolio strategy will seek total return, defined as all income, gains, and losses, whether realized or unrealized, over a
long-term basis, defined as five years or more. At a minimum, the total return objective for each manager will be to exceed the Plan's
interest assumption.
Given the investment objectives of the Pension Plan and the Plan Investment Committee's risk tolerance, the Committee has set
the following "target" asset allocation percentages:
Target
Minimum
Maximum
Domestic equities:
Large cap 50% 40% 60%
Small/mid cap 8 4 12
Fixed income securities 30 20 40
International equities 10 6 14
Cash and equivalents 2 1 10
It is anticipated that the overall allocation will stay within the target ranges noted above.
The Pension Plan assets include Washington Mutual, Inc.'s common stock and fixed income securities of $10 million, or 0.80%
of total plan assets, and $8 million, or 0.73% of total plan assets at December 31, 2003 and 2002.
Washington Mutual expects to contribute zero, $11 million and $6 million to the Pension Plan, Nonqualified Defined Benefit
Plans and Other Postretirement Benefit Plans in 2004.
136
The following benefit payments, which reflect expected future service, as appropriate, are expected to be paid:
Pension Plan
Nonqualified
Defined
Benefit Plans
Other
Postretirement
Benefit
http://www.sec.gov/Archives/edgar/data/933136/000104746904
f 146 9/17/2011
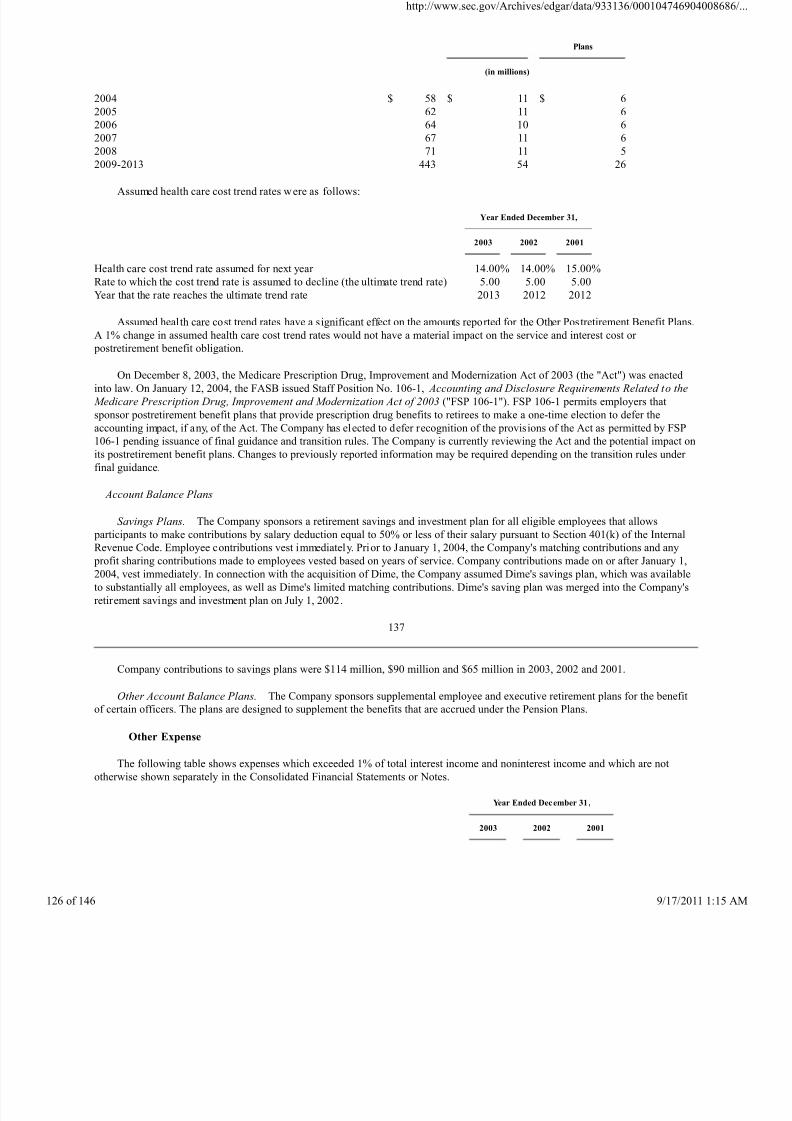
8/4/2019 Wamu 10-k 2003 Subprime
http://slidepdf.com/reader/full/wamu-10-k-2003-subprime 126/146
Plans
(in millions)
2004 $ 58 $ 11 $ 6
2005 62 11 6
2006 64 10 6
2007 67 11 6
2008 71 11 5
2009-2013 443 54 26
Assumed health care cost trend rates were as follows:
Year Ended December 31,
2003
2002
2001
Health care cost trend rate assumed for next year 14.00% 14.00% 15.00%
Rate to which the cost trend rate is assumed to decline (the ultimate trend rate) 5.00 5.00 5.00
Year that the rate reaches the ultimate trend rate 2013 2012 2012
Assumed health care cost trend rates have a significant effect on the amounts reported for the Other Postretirement Benefit Plans.
A 1% change in assumed health care cost trend rates would not have a material impact on the service and interest cost or
postretirement benefit obligation.
On December 8, 2003, the Medicare Prescription Drug, Improvement and Modernization Act of 2003 (the "Act") was enacted
into law. On January 12, 2004, the FASB issued Staff Position No. 106-1, Accounting and Disclosure Requirements Related to the
Medicare Prescription Drug, Improvement and Modernization Act of 2003 ("FSP 106-1"). FSP 106-1 permits employers that
sponsor postretirement benefit plans that provide prescription drug benefits to retirees to make a one-time election to defer the
accounting impact, if any, of the Act. The Company has elected to defer recognition of the provisions of the Act as permitted by FSP
106-1 pending issuance of final guidance and transition rules. The Company is currently reviewing the Act and the potential impact on
its postretirement benefit plans. Changes to previously reported information may be required depending on the transition rules under
final guidance.
Account Balance Plans
Savings Plans. The Company sponsors a retirement savings and investment plan for all eligible employees that allows participants to make contributions by salary deduction equal to 50% or less of their salary pursuant to Section 401(k) of the Internal
Revenue Code. Employee contributions vest immediately. Prior to January 1, 2004, the Company's matching contributions and any
profit sharing contributions made to employees vested based on years of service. Company contributions made on or after January 1,
2004, vest immediately. In connection with the acquisition of Dime, the Company assumed Dime's savings plan, which was available
to substantially all employees, as well as Dime's limited matching contributions. Dime's saving plan was merged into the Company's
retirement savings and investment plan on July 1, 2002.
137
Company contributions to savings plans were $114 million, $90 million and $65 million in 2003, 2002 and 2001.
Other Account Balance Plans. The Company sponsors supplemental employee and executive retirement plans for the benefitof certain officers. The plans are designed to supplement the benefits that are accrued under the Pension Plans.
Other Expense
The following table shows expenses which exceeded 1% of total interest income and noninterest income and which are not
otherwise shown separately in the Consolidated Financial Statements or Notes.
Year Ended December 31 ,
2003
2002
2001
http://www.sec.gov/Archives/edgar/data/933136/000104746904
f 146 9/17/2011
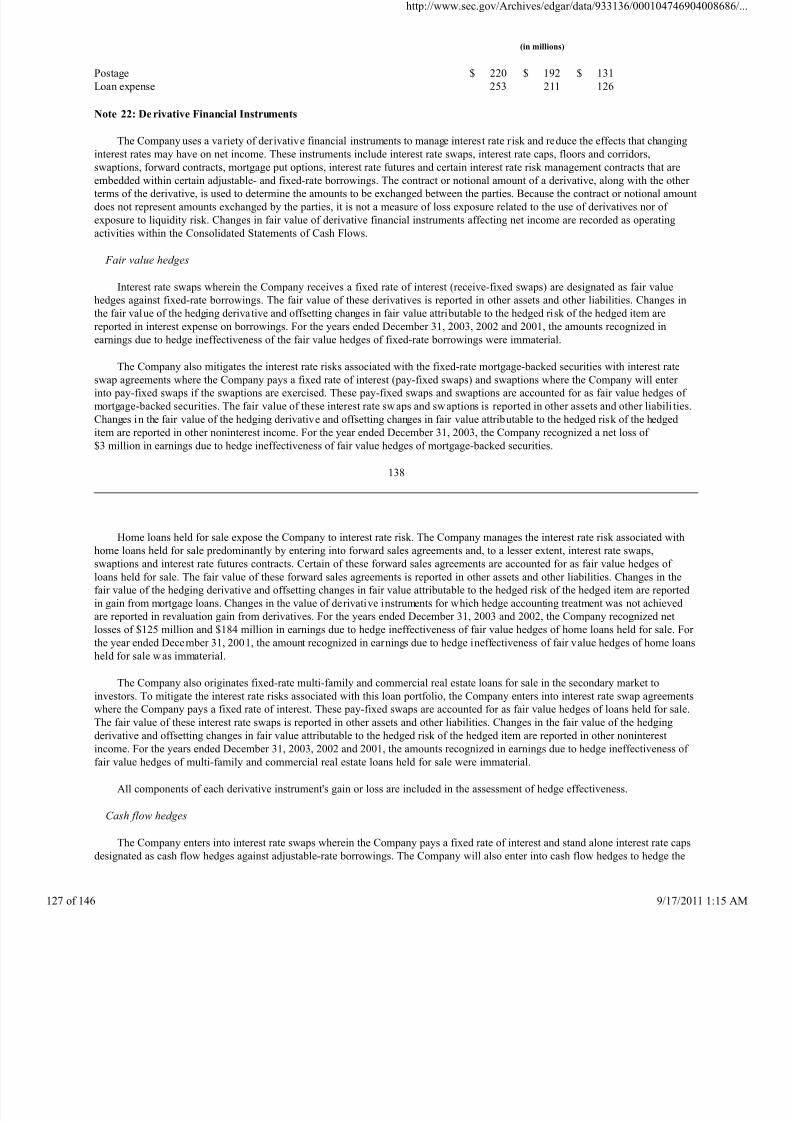
8/4/2019 Wamu 10-k 2003 Subprime
http://slidepdf.com/reader/full/wamu-10-k-2003-subprime 127/146
(in millions)
Postage $ 220 $ 192 $ 131
Loan expense 253 211 126
Note 22: Derivative Financial Instruments
The Company uses a variety of derivative financial instruments to manage interest rate risk and reduce the effects that changing
interest rates may have on net income. These instruments include interest rate swaps, interest rate caps, floors and corridors,
swaptions, forward contracts, mortgage put options, interest rate futures and certain interest rate risk management contracts that are
embedded within certain adjustable- and fixed-rate borrowings. The contract or notional amount of a derivative, along with the other
terms of the derivative, is used to determine the amounts to be exchanged between the parties. Because the contract or notional amount
does not represent amounts exchanged by the parties, it is not a measure of loss exposure related to the use of derivatives nor of
exposure to liquidity risk. Changes in fair value of derivative financial instruments affecting net income are recorded as operating
activities within the Consolidated Statements of Cash Flows.
Fair value hedges
Interest rate swaps wherein the Company receives a fixed rate of interest (receive-fixed swaps) are designated as fair value
hedges against fixed-rate borrowings. The fair value of these derivatives is reported in other assets and other liabilities. Changes in
the fair value of the hedging derivative and offsetting changes in fair value attributable to the hedged risk of the hedged item are
reported in interest expense on borrowings. For the years ended December 31, 2003, 2002 and 2001, the amounts recognized in
earnings due to hedge ineffectiveness of the fair value hedges of fixed-rate borrowings were immaterial.
The Company also mitigates the interest rate risks associated with the fixed-rate mortgage-backed securities with interest rate
swap agreements where the Company pays a fixed rate of interest (pay-fixed swaps) and swaptions where the Company will enter
into pay-fixed swaps if the swaptions are exercised. These pay-fixed swaps and swaptions are accounted for as fair value hedges of
mortgage-backed securities. The fair value of these interest rate swaps and swaptions is reported in other assets and other liabili ties.
Changes in the fair value of the hedging derivative and offsetting changes in fair value attributable to the hedged risk of the hedged
item are reported in other noninterest income. For the year ended December 31, 2003, the Company recognized a net loss of
$3 million in earnings due to hedge ineffectiveness of fair value hedges of mortgage-backed securities.
138
Home loans held for sale expose the Company to interest rate risk. The Company manages the interest rate risk associated with
home loans held for sale predominantly by entering into forward sales agreements and, to a lesser extent, interest rate swaps,
swaptions and interest rate futures contracts. Certain of these forward sales agreements are accounted for as fair value hedges of
loans held for sale. The fair value of these forward sales agreements is reported in other assets and other liabilities. Changes in the
fair value of the hedging derivative and offsetting changes in fair value attributable to the hedged risk of the hedged item are reported
in gain from mortgage loans. Changes in the value of derivative instruments for which hedge accounting treatment was not achieved
are reported in revaluation gain from derivatives. For the years ended December 31, 2003 and 2002, the Company recognized net
losses of $125 million and $184 million in earnings due to hedge ineffectiveness of fair value hedges of home loans held for sale. For
the year ended December 31, 2001, the amount recognized in earnings due to hedge ineffectiveness of fair value hedges of home loans
held for sale was immaterial.
The Company also originates fixed-rate multi-family and commercial real estate loans for sale in the secondary market to
investors. To mitigate the interest rate risks associated with this loan portfolio, the Company enters into interest rate swap agreementswhere the Company pays a fixed rate of interest. These pay-fixed swaps are accounted for as fair value hedges of loans held for sale.
The fair value of these interest rate swaps is reported in other assets and other liabilities. Changes in the fair value of the hedging
derivative and offsetting changes in fair value attributable to the hedged risk of the hedged item are reported in other noninterest
income. For the years ended December 31, 2003, 2002 and 2001, the amounts recognized in earnings due to hedge ineffectiveness of
fair value hedges of multi-family and commercial real estate loans held for sale were immaterial.
All components of each derivative instrument's gain or loss are included in the assessment of hedge effectiveness.
Cash flow hedges
The Company enters into interest rate swaps wherein the Company pays a fixed rate of interest and stand alone interest rate caps
designated as cash flow hedges against adjustable-rate borrowings. The Company will also enter into cash flow hedges to hedge the
http://www.sec.gov/Archives/edgar/data/933136/000104746904
f 146 9/17/2011
8/4/2019 Wamu 10-k 2003 Subprime
http://slidepdf.com/reader/full/wamu-10-k-2003-subprime 128/146
forecasted sale of a portfolio of fixed-rate multi-family loans using interest rate swaps. The fair value of these derivatives is reported
in other assets and other liabilities. For the hedges against adjustable-rate borrowings, amounts reported in accumulated other
comprehensive income are subsequently reclassified to interest expense on borrowings during the same period in which the hedged
item affects interest expense. For the hedges against the forecasted sale of loans, amounts recorded in accumulated other
comprehensive income are subsequently reclassified into other noninterest income, during the same period in which the hedged item
affects earnings. For the years ended December 31, 2003 and 2002, the Company recognized net losses of $5 million and $3 million
in earnings due to hedge ineffectiveness of cash flow hedges. For the year ended December 31, 2001, the amount recognized in
earnings due to hedge ineffectiveness of cash flow hedges was immaterial.
During 2002, the Company removed its cash flow hedge designation on certain payor swaptions because it was probable that the
underlying hedged items, which were interest payments on anticipated issuances of certain long-term adjustable-rate borrowings,
were not going to occur by the end of the originally specified time periods or within the additional periods of time allowed by
Statement No. 133. Thus in accordance with Statement No. 133, the pretax accumulated loss of $112 million related to these payor
swaptions was reclassified from accumulated other comprehensive income to other noninterest income.
139
As of December 31, 2003, accumulated other comprehensive income included $299 million of deferred after-tax net losses
related to derivative instruments designated as cash flow hedges of adjustable-rate liabilities that are expected to be reclassified into
earnings during the next twelve months, as compared to $397 million of deferred after-tax net losses related to derivative instruments
designated as cash flow hedges at December 31, 2002.
All components of each derivative instrument's gain or loss are included in the assessment of hedge effectiveness.
Risk management derivatives
In addition to investment securities that are held for MSR risk management purposes, the Company enters into a combination of
derivatives to manage changes in fair value of its MSR. During 2003, 2002 and 2001, the Company did not attempt to achieve hedge
accounting treatment under Statement No. 133 for these derivatives. These derivatives include interest rate swaps, swaptions, floors
and forward purchase commitments. The fair value of these derivatives is reported in other assets and other liabilities. The changes in
the fair value of these derivatives are reported in revaluation gain from derivatives.
Occasionally, the Company utilizes derivative instruments for asset/liability interest rate risk management which do not qualify
for hedge accounting treatment. These risk management derivatives include interest rate swaps, swaptions, interest rate caps andcorridors. The fair value of these derivatives is reported in other assets and other liabilities. The changes in the fair value of these
derivatives are reported in other noninterest income.
The Company occasionally purchases or originates financial instruments that contain an embedded derivative instrument. At
inception of the financial instrument, the Company determines whether an embedded derivative is required to be accounted for
separately as a der ivative. As of December 31, 2003 and 2002, all of the Company's embedded derivatives are considered clearly
and closely related to the host contract and are not required to be separated from their host contracts.
Derivative Counterparty Credit Risk
Derivative financial instruments expose the Company to credit risk in the event of nonperformance by counterparties to such
agreements. This risk consists primarily of the termination value of agreements where the Company is in a favorable position. Credit
risk related to derivative financial instruments is considered and provided for separately from the allowance for loan and leaselosses. The Company manages the credit risk associated with its various derivative agreements through counterparty credit review,
counterparty exposure limits and monitoring procedures. With the exception of forward purchase and sale commitments, the Company
obtains collateral from the counterparties for amounts in excess of the exposure limits and monitors its exposure and collateral
requirements on a daily basis. The fair value of collateral received from a counterparty is continually monitored and the Company
may request additional collateral from counterparties or return collateral pledged as deemed appropriate. The Company's agreements
generally include master netting agreements whereby the counterparties are entitled to settle their positions "net". At December 31,
2003 and 2002, the gross positive fair value of the Company's derivative financial instruments was $1.34 billion and $3.76 billion.
The Company's master netting agreements at December 31, 2003 and 2002 reduced the Company's derivative counterparty credit risk
by $646 million and $1.10 billion. The Company's collateral against derivative financial instruments was $323 million and
$1.74 billion at December 31, 2003 and 2002.
140
http://www.sec.gov/Archives/edgar/data/933136/000104746904
f 146 9/17/2011
8/4/2019 Wamu 10-k 2003 Subprime
http://slidepdf.com/reader/full/wamu-10-k-2003-subprime 129/146
Note 23: Fair Value of Financial Instruments
The following estimated fair value amounts have been determined by the Company using available market information and
appropriate valuation methodologies. These estimates do not reflect any premium or discount that could result from offering for sale
at one time the Company's entire holdings of a particular financial instrument. Because an active secondary market does not exist for a
portion of the Company's financial instruments, fair value estimates were based on management's judgment concerning future expected
loss experience, current economic conditions, risk characteristics of various financial instruments and other factors. In addition,
considerable judgment was required to interpret market data to develop the estimates of fair value. Accordingly, the estimates presented herein are not necessarily indicative of the amounts the Company could realize in a current market exchange. The use of
different market assumptions and/or estimation methodologies may have a material effect on the estimated fair value amounts.
Fair value estimates were determined for existing financial instruments, including derivative instruments, without attempting to
estimate the value of anticipated future business and the value of certain assets and liabilities that were not considered financial
instruments. Significant assets that were not considered financial instruments include premises and equipment, net tax assets, real
estate held for investment, foreclosed assets and other intangible assets. In addition, the value of the servicing rights for loans sold in
which the MSR has not been capitalized was excluded from the valuation. Finally, the tax ramifications related to the realization of
the unrealized gains and losses could have a significant effect on fair value estimates and have not been considered in any of the
valuations.
Assets and liabilities whose carrying amounts approximate fair value include cash and cash equivalents, federal funds sold and
securities purchased under resale agreements, available-for-sale securities, investment in FHLBs, checking accounts, savingsaccounts and money market deposit accounts, federal funds purchased and commercial paper and derivative financial instruments.
The following methods and assumptions were used to estimate the fair value of each class of financial instrument as of
December 31, 2003 and 2002:
Federal funds sold and securities purchased under resale agreements—The carrying amount represented fair value. Federal
funds sold and securities purchased under resale agreements are investments of high liquidity and have characteristics similar to cash.
Available-for-sale securities—Fair values w ere based on quoted market prices. If a quoted market price was not available, fair
value was estimated using market prices for similar securities, as well as internal analysis.
Investment in FHLBs—The carrying amount represented fair value. FHLB stock does not have a readily determinable fair value
and is required to be sold back at its par value.
Loans held for sale—Fair values were derived from quoted market prices, internal estimates and pricing of similar instruments.
Loans held in portfolio—Loans were priced using an option-adjusted cash flow valuation methodology. Fair values were
derived from quoted market prices, internal estimates and the pricing of similar instruments.
MSR—The fair value of MSR was estimated using projected cash flows, adjusted for the effects of anticipated prepayments,
using a market discount rate. The fair value estimates exclude the value of the servicing rights for loans sold in which the MSR has
not been capitalized.
141
Deposits—The fair value of checking accounts, savings accounts and money market deposit accounts was the amount payable on
demand at the reporting date. For time deposit accounts, the fair value was determined using an option-adjusted cash flow
methodology. The discount rate was derived from the rate currently offered on alternate funding sources with similar maturities.
Other financial liabilities—These liabilities include federal funds purchased, commercial paper, repurchase agreements,
advances from FHLBs and other borrowings. These were valued using an option-adjusted cash flow methodology. The discount rate
for the respective financial liabilities was derived from the rate currently offered on similar borrowings. If a quoted market price was
not available, fair value was estimated using an internal analysis based on the market prices of similar instruments.
Derivative financial instruments—The value of these financial instruments represents their fair value and approximates the
http://www.sec.gov/Archives/edgar/data/933136/000104746904
f 146 9/17/2011
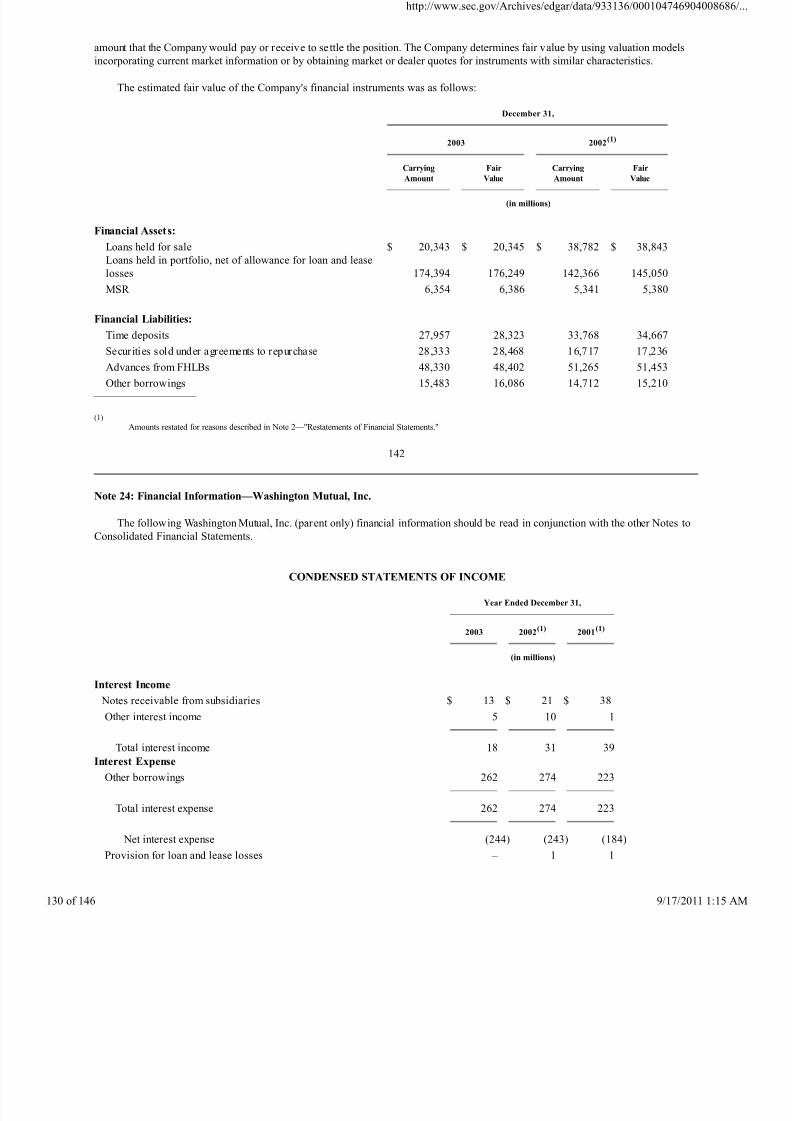
8/4/2019 Wamu 10-k 2003 Subprime
http://slidepdf.com/reader/full/wamu-10-k-2003-subprime 130/146
amount that the Company would pay or receive to settle the position. The Company determines fair value by using valuation models
incorporating current market information or by obtaining market or dealer quotes for instruments with similar characteristics.
The estimated fair value of the Company's financial instruments was as follows:
December 31,
2003
2002(1)
Carrying
Amount
Fair
Value
Carrying
Amount
Fair
Value
(in millions)
Financial Assets:
Loans held for sale $ 20,343 $ 20,345 $ 38,782 $ 38,843
Loans held in portfolio, net of allowance for loan and lease
losses 174,394 176,249 142,366 145,050
MSR 6,354 6,386 5,341 5,380
Financial Liabilities:
Time deposits 27,957 28,323 33,768 34,667
Securities sold under agreements to repurchase 28,333 28,468 16,717 17,236 Advances from FHLBs 48,330 48,402 51,265 51,453
Other borrowings 15,483 16,086 14,712 15,210
(1)
Amounts restated for reasons described in Note 2—"Restatements of Financial Statements."
142
Note 24: Financial Information—Washington Mutual, Inc.
The following Washington Mutual, Inc. (parent only) financial information should be read in conjunction with the other Notes toConsolidated Financial Statements.
CONDENSED STATEMENTS OF INCOME
Year Ended December 31,
2003
2002(1)
2001(1)
(in millions)
Interest Income
Notes receivable from subsidiaries $ 13 $ 21 $ 38Other interest income 5 10 1
Total interest income 18 31 39
Interest Expense
Other borrowings 262 274 223
Total interest expense 262 274 223
Net interest expense (244) (243) (184)
Provision for loan and lease losses – 1 1
http://www.sec.gov/Archives/edgar/data/933136/000104746904
f 146 9/17/2011
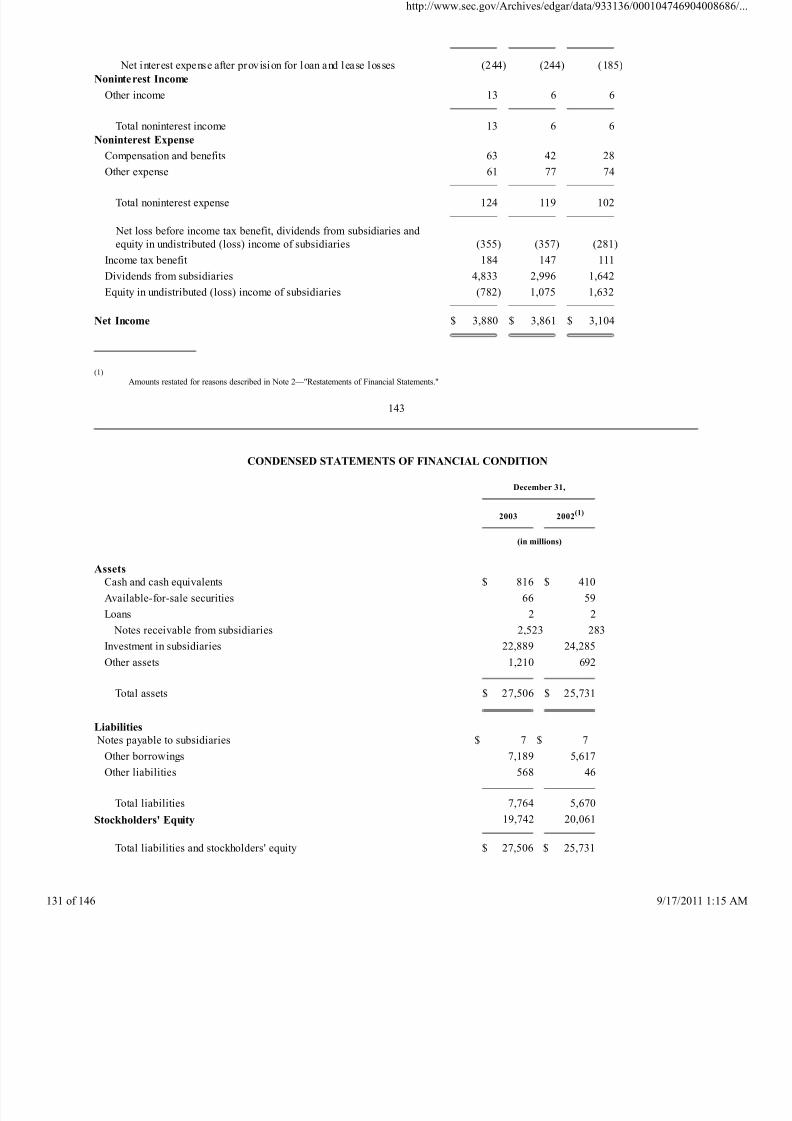
8/4/2019 Wamu 10-k 2003 Subprime
http://slidepdf.com/reader/full/wamu-10-k-2003-subprime 131/146
Net interest expense after provision for loan and lease losses (244) (244) (185)
Noninterest Income
Other income 13 6 6
Total noninterest income 13 6 6
Noninterest Expense
Compensation and benefits 63 42 28
Other expense 61 77 74
Total noninterest expense 124 119 102
Net loss before income tax benefit, dividends from subsidiaries and
equity in undistributed (loss) income of subsidiaries (355) (357) (281)
Income tax benefit 184 147 111
Dividends from subsidiaries 4,833 2,996 1,642
Equity in undistributed (loss) income of subsidiaries (782) 1,075 1,632
Net Income $ 3,880 $ 3,861 $ 3,104
(1)
Amounts restated for reasons described in Note 2—"Restatements of Financial Statements."
143
CONDENSED STATEMENTS OF FINANCIAL CONDITION
December 31,
2003
2002(1)
(in millions)
Assets
Cash and cash equivalents $ 816 $ 410
Available-for-sale securities 66 59
Loans 2 2
Notes receivable from subsidiaries 2,523 283
Investment in subsidiaries 22,889 24,285
Other assets 1,210 692
Total assets $ 27,506 $ 25,731
Liabilities
Notes payable to subsidiaries $ 7 $ 7
Other borrowings 7,189 5,617
Other liabilities 568 46
Total liabilities 7,764 5,670
Stockholders' Equity 19,742 20,061
Total liabilities and stockholders' equity $ 27,506 $ 25,731
http://www.sec.gov/Archives/edgar/data/933136/000104746904
f 146 9/17/2011
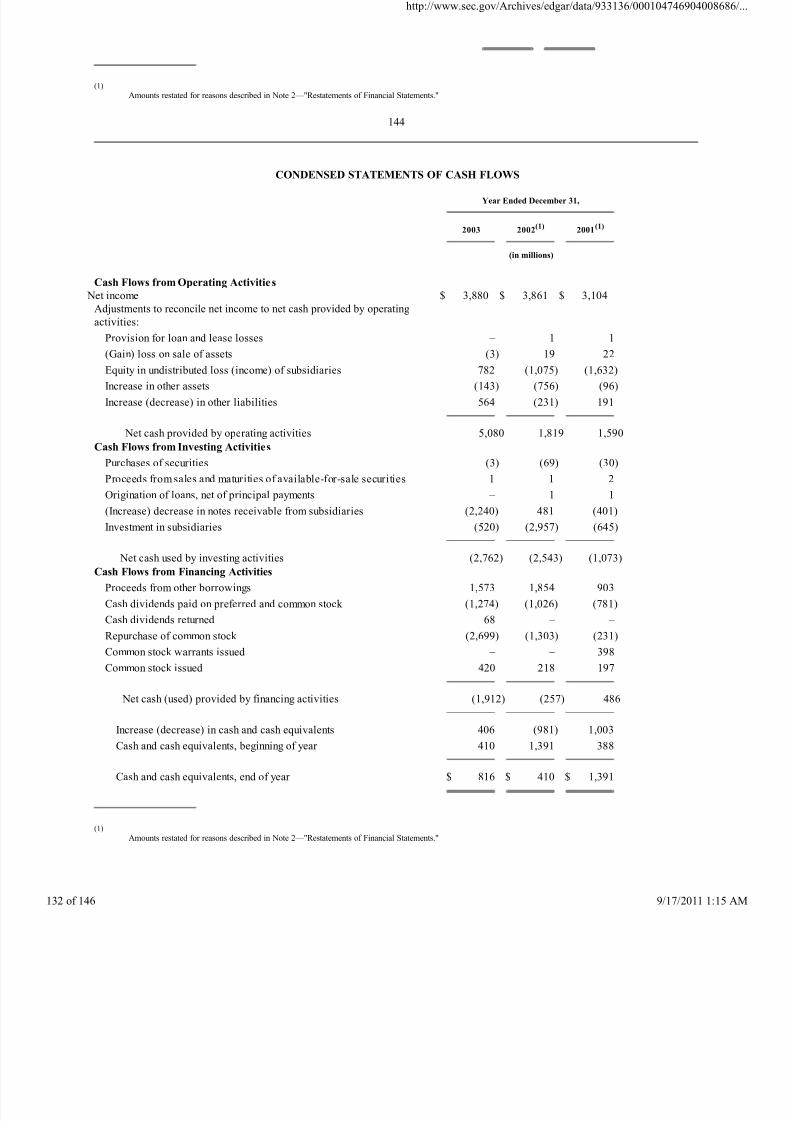
8/4/2019 Wamu 10-k 2003 Subprime
http://slidepdf.com/reader/full/wamu-10-k-2003-subprime 132/146
(1)
Amounts restated for reasons described in Note 2—"Restatements of Financial Statements."
144
CONDENSED STATEMENTS OF CASH FLOWS
Year Ended December 31,
2003
2002(1)
2001(1)
(in millions)
Cash Flows from Operating Activities
Net income $ 3,880 $ 3,861 $ 3,104
Adjustments to reconcile net income to net cash provided by operating
activities:
Provision for loan and lease losses – 1 1
(Gain) loss on sale of assets (3) 19 22
Equity in undistributed loss (income) of subsidiaries 782 (1,075) (1,632)
Increase in other assets (143) (756) (96)
Increase (decrease) in other liabilities 564 (231) 191
Net cash provided by operating activities 5,080 1,819 1,590
Cash Flows from Investing Activities
Purchases of securities (3) (69) (30)
Proceeds from sales and maturities of available-for-sale securities 1 1 2
Origination of loans, net of principal payments – 1 1
(Increase) decrease in notes receivable from subsidiaries (2,240) 481 (401)
Investment in subsidiaries (520) (2,957) (645)
Net cash used by investing activities (2,762) (2,543) (1,073)
Cash Flows from Financing Activities
Proceeds from other borrowings 1,573 1,854 903
Cash dividends paid on preferred and common stock (1,274) (1,026) (781)
Cash dividends returned 68 – –
Repurchase of common stock (2,699) (1,303) (231)
Common stock warrants issued – – 398
Common stock issued 420 218 197
Net cash (used) provided by financing activities (1,912) (257) 486
Increase (decrease) in cash and cash equivalents 406 (981) 1,003
Cash and cash equivalents, beginning of year 410 1,391 388
Cash and cash equivalents, end of year $ 816 $ 410 $ 1,391
(1)
Amounts restated for reasons described in Note 2—"Restatements of Financial Statements."
http://www.sec.gov/Archives/edgar/data/933136/000104746904
f 146 9/17/2011
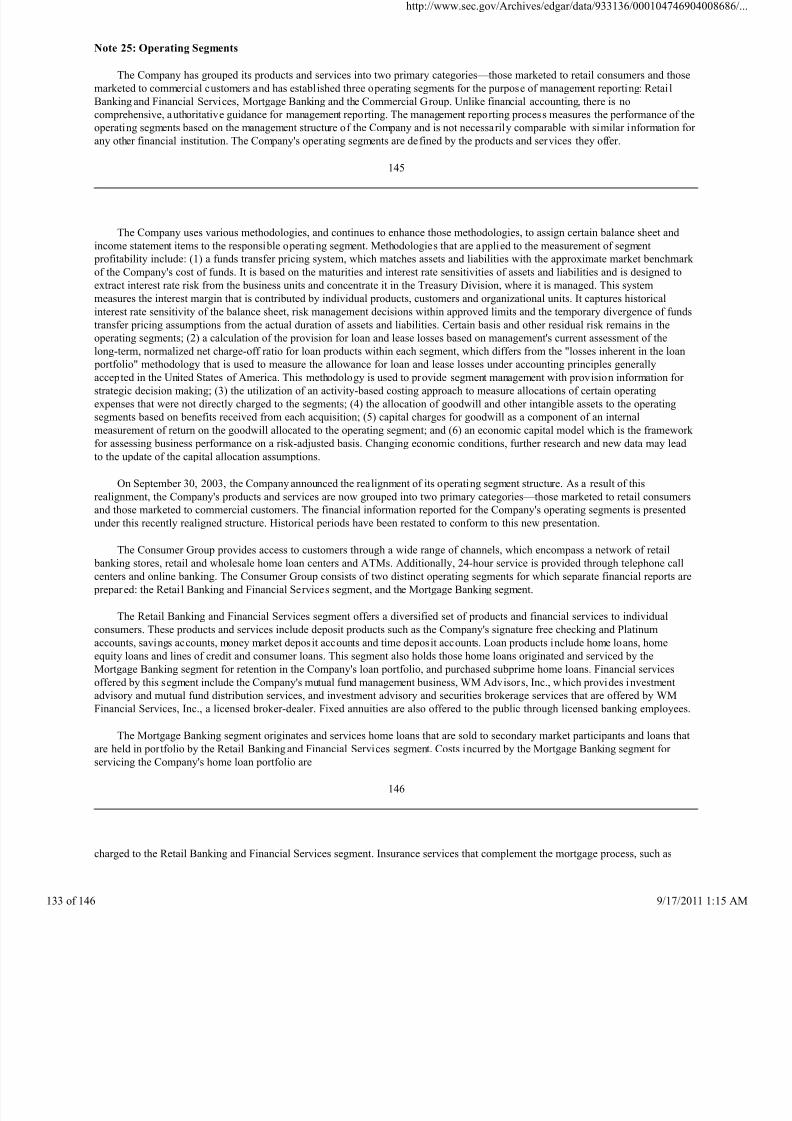
8/4/2019 Wamu 10-k 2003 Subprime
http://slidepdf.com/reader/full/wamu-10-k-2003-subprime 133/146
Note 25: Operating Segments
The Company has grouped its products and services into two primary categories—those marketed to retail consumers and those
marketed to commercial customers and has established three operating segments for the purpose of management reporting: Retai l
Banking and Financial Services, Mortgage Banking and the Commercial Group. Unlike financial accounting, there is no
comprehensive, authoritative guidance for management reporting. The management reporting process measures the performance of the
operating segments based on the management structure of the Company and is not necessarily comparable with similar information for
any other financial institution. The Company's operating segments are defined by the products and services they offer.
145
The Company uses various methodologies, and continues to enhance those methodologies, to assign certain balance sheet and
income statement items to the responsible operating segment. Methodologies that are applied to the measurement of segment
profitability include: (1) a funds transfer pricing system, which matches assets and liabilities with the approximate market benchmark
of the Company's cost of funds. It is based on the maturities and interest rate sensitivities of assets and liabilities and is designed to
extract interest rate risk from the business units and concentrate it in the Treasury Division, where it is managed. This system
measures the interest margin that is contributed by individual products, customers and organizational units. It captures historical
interest rate sensitivity of the balance sheet, risk management decisions within approved limits and the temporary divergence of funds
transfer pricing assumptions from the actual duration of assets and liabilities. Certain basis and other residual risk remains in the
operating segments; (2) a calculation of the provision for loan and lease losses based on management's current assessment of the
long-term, normalized net charge-off ratio for loan products within each segment, which differs from the "losses inherent in the loan portfolio" methodology that is used to measure the allowance for loan and lease losses under accounting principles generally
accepted in the United States of America. This methodology is used to provide segment management with provision information for
strategic decision making; (3) the utilization of an activity-based costing approach to measure allocations of certain operating
expenses that were not directly charged to the segments; (4) the allocation of goodwill and other intangible assets to the operating
segments based on benefits received from each acquisition; (5) capital charges for goodwill as a component of an internal
measurement of return on the goodwill allocated to the operating segment; and (6) an economic capital model which is the framework
for assessing business performance on a risk-adjusted basis. Changing economic conditions, further research and new data may lead
to the update of the capital allocation assumptions.
On September 30, 2003, the Company announced the realignment of its operating segment structure. As a result of this
realignment, the Company's products and services are now grouped into two primary categories—those marketed to retail consumers
and those marketed to commercial customers. The financial information reported for the Company's operating segments is presented
under this recently realigned structure. Historical periods have been restated to conform to this new presentation.
The Consumer Group provides access to customers through a wide range of channels, which encompass a network of retail
banking stores, retail and wholesale home loan centers and ATMs. Additionally, 24-hour service is provided through telephone call
centers and online banking. The Consumer Group consists of two distinct operating segments for which separate financial reports are
prepared: the Retail Banking and Financial Services segment, and the Mortgage Banking segment.
The Retail Banking and Financial Services segment offers a diversified set of products and financial services to individual
consumers. These products and services include deposit products such as the Company's signature free checking and Platinum
accounts, savings accounts, money market deposit accounts and time deposit accounts. Loan products include home loans, home
equity loans and lines of credit and consumer loans. This segment also holds those home loans originated and serviced by the
Mortgage Banking segment for retention in the Company's loan portfolio, and purchased subprime home loans. Financial services
offered by this segment include the Company's mutual fund management business, WM Advisors, Inc., which provides investment
advisory and mutual fund distribution services, and investment advisory and securities brokerage services that are offered by WMFinancial Services, Inc., a licensed broker-dealer. Fixed annuities are also offered to the public through licensed banking employees.
The Mortgage Banking segment originates and services home loans that are sold to secondary market participants and loans that
are held in portfolio by the Retail Banking and Financial Services segment. Costs incurred by the Mortgage Banking segment for
servicing the Company's home loan portfolio are
146
charged to the Retail Banking and Financial Services segment. Insurance services that complement the mortgage process, such as
http://www.sec.gov/Archives/edgar/data/933136/000104746904
f 146 9/17/2011
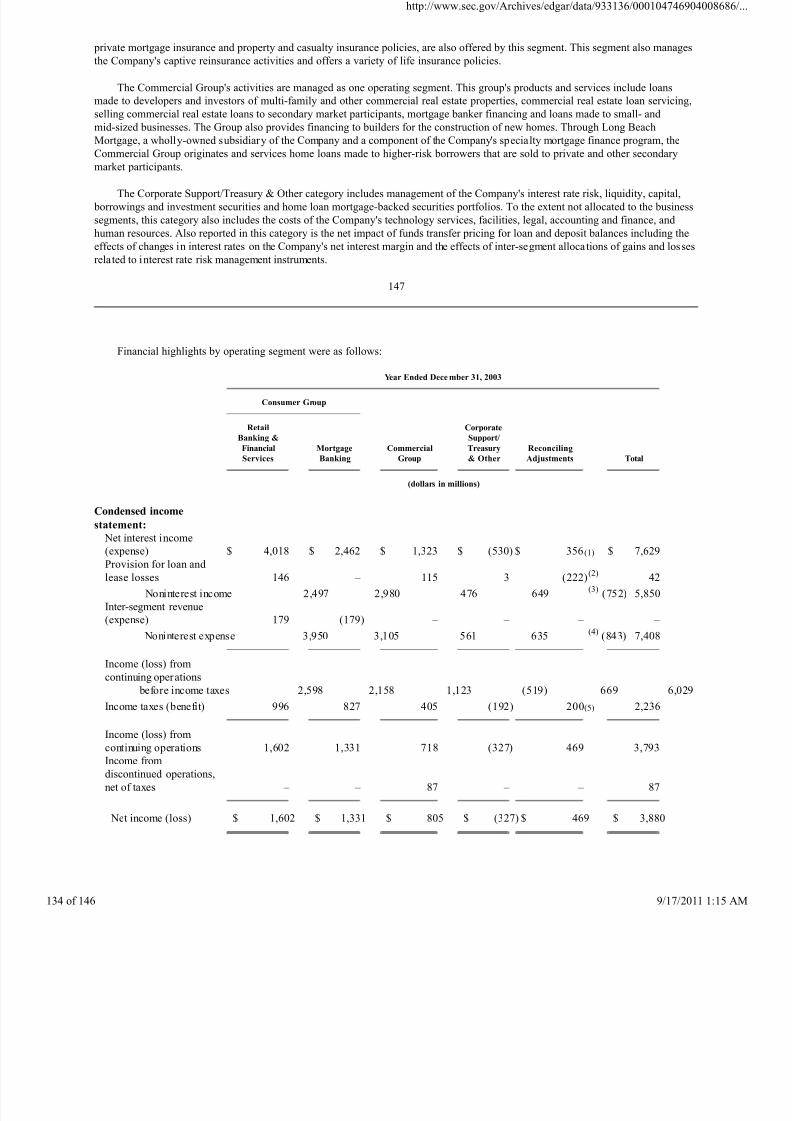
8/4/2019 Wamu 10-k 2003 Subprime
http://slidepdf.com/reader/full/wamu-10-k-2003-subprime 134/146
private mortgage insurance and property and casualty insurance policies, are also offered by this segment. This segment also manages
the Company's captive reinsurance activities and offers a variety of life insurance policies.
The Commercial Group's activities are managed as one operating segment. This group's products and services include loans
made to developers and investors of multi-family and other commercial real estate properties, commercial real estate loan servicing,
selling commercial real estate loans to secondary market participants, mortgage banker financing and loans made to small- and
mid-sized businesses. The Group also provides financing to builders for the construction of new homes. Through Long Beach
Mortgage, a wholly-owned subsidiary of the Company and a component of the Company's specialty mortgage finance program, the
Commercial Group originates and services home loans made to higher-risk borrowers that are sold to private and other secondary
market participants.
The Corporate Support/Treasury & Other category includes management of the Company's interest rate risk, liquidity, capital,
borrowings and investment securities and home loan mortgage-backed securities portfolios. To the extent not allocated to the business
segments, this category also includes the costs of the Company's technology services, facilities, legal, accounting and finance, and
human resources. Also reported in this category is the net impact of funds transfer pricing for loan and deposit balances including the
effects of changes in interest rates on the Company's net interest margin and the effects of inter-segment allocations of gains and losses
related to interest rate risk management instruments.
147
Financial highlights by operating segment were as follows:
Year Ended Dece mber 31, 2003
Consumer Group
Retail
Banking &
Financial
Services
Mortgage
Banking
Commercial
Group
Corporate
Support/
Treasury
& Other
Reconciling
Adjustments
Total
(dollars in millions)
Condensed income
statement: Net interest income
(expense) $ 4,018 $ 2,462 $ 1,323 $ (530) $ 356(1) $ 7,629
Provision for loan and
lease losses 146 – 115 3 (222)(2) 42
Noninterest income 2,497 2,980 476 649 (752)(3) 5,850
Inter-segment revenue
(expense) 179 (179) – – – –
Noninterest expense 3,950 3,105 561 635 (843)(4) 7,408
Income (loss) from
continuing operations
before income taxes 2,598 2,158 1,123 (519) 669 6,029
Income taxes (benefit) 996 827 405 (192) 200(5) 2,236
Income (loss) from
continuing operations 1,602 1,331 718 (327) 469 3,793
Income from
discontinued operations,
net of taxes – – 87 – – 87
Net income (loss) $ 1,602 $ 1,331 $ 805 $ (327) $ 469 $ 3,880
http://www.sec.gov/Archives/edgar/data/933136/000104746904
f 146 9/17/2011
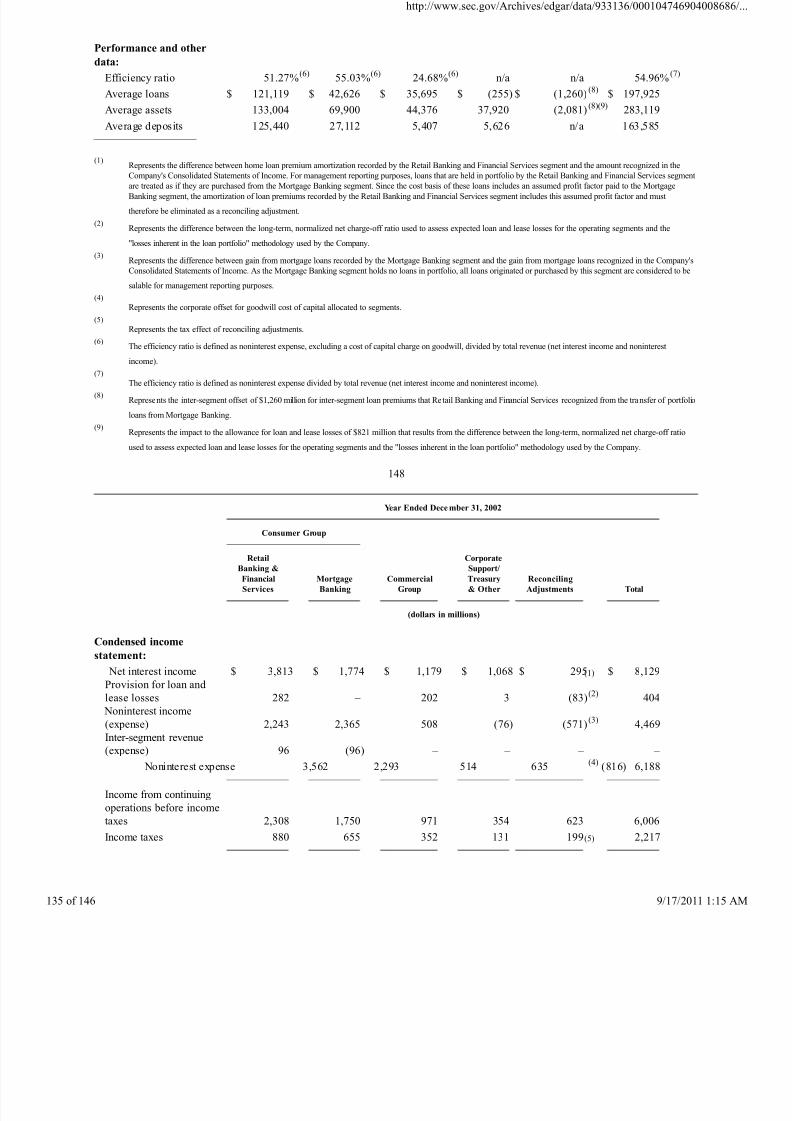
8/4/2019 Wamu 10-k 2003 Subprime
http://slidepdf.com/reader/full/wamu-10-k-2003-subprime 135/146
Performance and other
data:
Efficiency ratio 51.27%(6) 55.03%(6) 24.68%(6) n/a n/a 54.96% (7)
Average loans $ 121,119 $ 42,626 $ 35,695 $ (255) $ (1,260)(8) $ 197,925
Average assets 133,004 69,900 44,376 37,920 (2,081)(8)(9) 283,119
Average deposits 125,440 27,112 5,407 5,626 n/a 163,585
(1)Represents the difference between home loan premium amortization recorded by the Retail Banking and Financial Services segment and the amount recognized in the
Company's Consolidated Statements of Income. For management reporting purposes, loans that are held in portfolio by the Retail Banking and Financial Services segmentare treated as if they are purchased from the Mortgage Banking segment. Since the cost basis of these loans includes an assumed profit factor paid to the Mortgage
Banking segment, the amortization of loan premiums recorded by the Retail Banking and Financial Services segment includes this assumed profit factor and must
therefore be eliminated as a reconciling adjustment.
(2)Represents the difference between the long-term, normalized net charge-off ratio used to assess expected loan and lease losses for the operating segments and the
"losses inherent in the loan portfolio" methodology used by the Company.
(3)Represents the difference between gain from mortgage loans recorded by the Mortgage Banking segment and the gain from mortgage loans recognized in the Company's
Consolidated Statements of Income. As the Mortgage Banking segment holds no loans in portfolio, all loans originated or purchased by this segment are considered to be
salable for management reporting purposes.
(4)
Represents the corporate offset for goodwill cost of capital allocated to segments.
(5)
Represents the tax effect of reconciling adjustments.
(6)
The efficiency ratio is defined as noninterest expense, excluding a cost of capital charge on goodwill, divided by total revenue (net interest income and noninterestincome).
(7)
The efficiency ratio is defined as noninterest expense divided by total revenue (net interest income and noninterest income).
(8)Represents the inter-segment offset of $1,260 million for inter-segment loan premiums that Re tail Banking and Financial Services recognized from the transfer of portfolio
loans from Mortgage Banking.
(9)Represents the impact to the allowance for loan and lease losses of $821 million that results from the difference between the long-term, normalized net charge-off ratio
used to assess expected loan and lease losses for the operating segments and the "losses inherent in the loan portfolio" methodology used by the Company.
148
Year Ended Dece mber 31, 2002
Consumer Group
Retail
Banking &
Financial
Services
Mortgage
Banking
Commercial
Group
Corporate
Support/
Treasury
& Other
Reconciling
Adjustments
Total
(dollars in millions)
Condensed income
statement:
Net interest income $ 3,813 $ 1,774 $ 1,179 $ 1,068 $ 295(1) $ 8,129
Provision for loan and
lease losses 282 – 202 3 (83)(2)
404 Noninterest income
(expense) 2,243 2,365 508 (76) (571)(3) 4,469
Inter-segment revenue
(expense) 96 (96) – – – –
Noninterest expense 3,562 2,293 514 635 (816)(4) 6,188
Income from continuing
operations before income
taxes 2,308 1,750 971 354 623 6,006
Income taxes 880 655 352 131 199(5) 2,217
http://www.sec.gov/Archives/edgar/data/933136/000104746904
f 146 9/17/2011
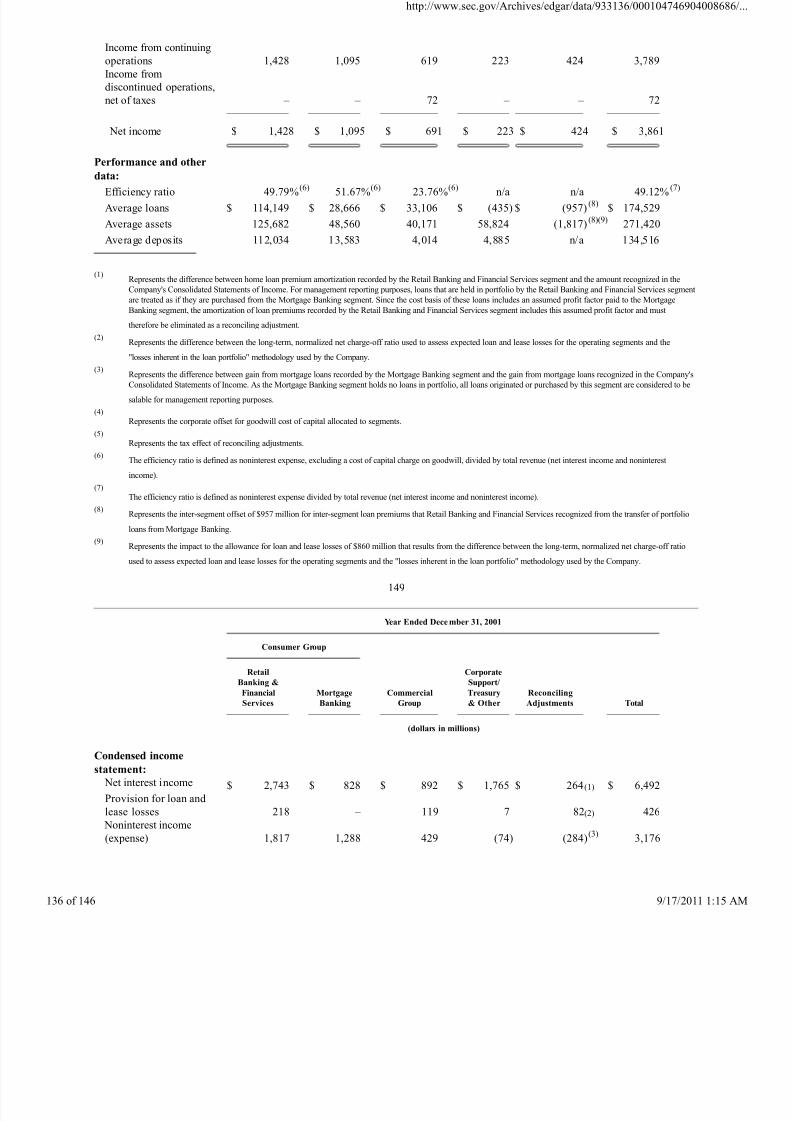
8/4/2019 Wamu 10-k 2003 Subprime
http://slidepdf.com/reader/full/wamu-10-k-2003-subprime 136/146
Income from continuing
operations 1,428 1,095 619 223 424 3,789
Income from
discontinued operations,
net of taxes – – 72 – – 72
Net income $ 1,428 $ 1,095 $ 691 $ 223 $ 424 $ 3,861
Performance and other
data: Efficiency ratio 49.79%(6) 51.67%(6) 23.76%(6) n/a n/a 49.12% (7)
Average loans $ 114,149 $ 28,666 $ 33,106 $ (435) $ (957)(8) $ 174,529
Average assets 125,682 48,560 40,171 58,824 (1,817)(8)(9) 271,420
Average deposits 112,034 13,583 4,014 4,885 n/a 134,516
(1)Represents the difference between home loan premium amortization recorded by the Retail Banking and Financial Services segment and the amount recognized in the
Company's Consolidated Statements of Income. For management reporting purposes, loans that are held in portfolio by the Retail Banking and Financial Services segment
are treated as if they are purchased from the Mortgage Banking segment. Since the cost basis of these loans includes an assumed profit factor paid to the Mortgage
Banking segment, the amortization of loan premiums recorded by the Retail Banking and Financial Services segment includes this assumed profit factor and must
therefore be eliminated as a reconciling adjustment.
(2)Represents the difference between the long-term, normalized net charge-off ratio used to assess expected loan and lease losses for the operating segments and the
"losses inherent in the loan portfolio" methodology used by the Company.
(3)Represents the difference between gain from mortgage loans recorded by the Mortgage Banking segment and the gain from mortgage loans recognized in the Company's
Consolidated Statements of Income. As the Mortgage Banking segment holds no loans in portfolio, all loans originated or purchased by this segment are considered to be
salable for management reporting purposes.
(4)
Represents the corporate offset for goodwill cost of capital allocated to segments.
(5)
Represents the tax effect of reconciling adjustments.
(6)The efficiency ratio is defined as noninterest expense, excluding a cost of capital charge on goodwill, divided by total revenue (net interest income and noninterest
income).
(7)
The efficiency ratio is defined as noninterest expense divided by total revenue (net interest income and noninterest income).
(8)Represents the inter-segment offset of $957 million for inter-segment loan premiums that Retail Banking and Financial Services recognized from the transfer of portfolio
loans from Mortgage Banking.
(9)Represents the impact to the allowance for loan and lease losses of $860 million that results from the difference between the long-term, normalized net charge-off ratio
used to assess expected loan and lease losses for the operating segments and the "losses inherent in the loan portfolio" methodology used by the Company.
149
Year Ended Dece mber 31, 2001
Consumer Group
Retail
Banking &
Financial
Services
Mortgage
Banking
Commercial
Group
Corporate
Support/
Treasury
& Other
Reconciling
Adjustments
Total
(dollars in millions)
Condensed income
statement:
Net interest income $ 2,743 $ 828 $ 892 $ 1,765 $ 264(1) $ 6,492
Provision for loan and
lease losses
218 – 119 7 82(2) 426
Noninterest income
(expense)
1,817 1,288 429 (74) (284)(3) 3,176
http://www.sec.gov/Archives/edgar/data/933136/000104746904
f 146 9/17/2011
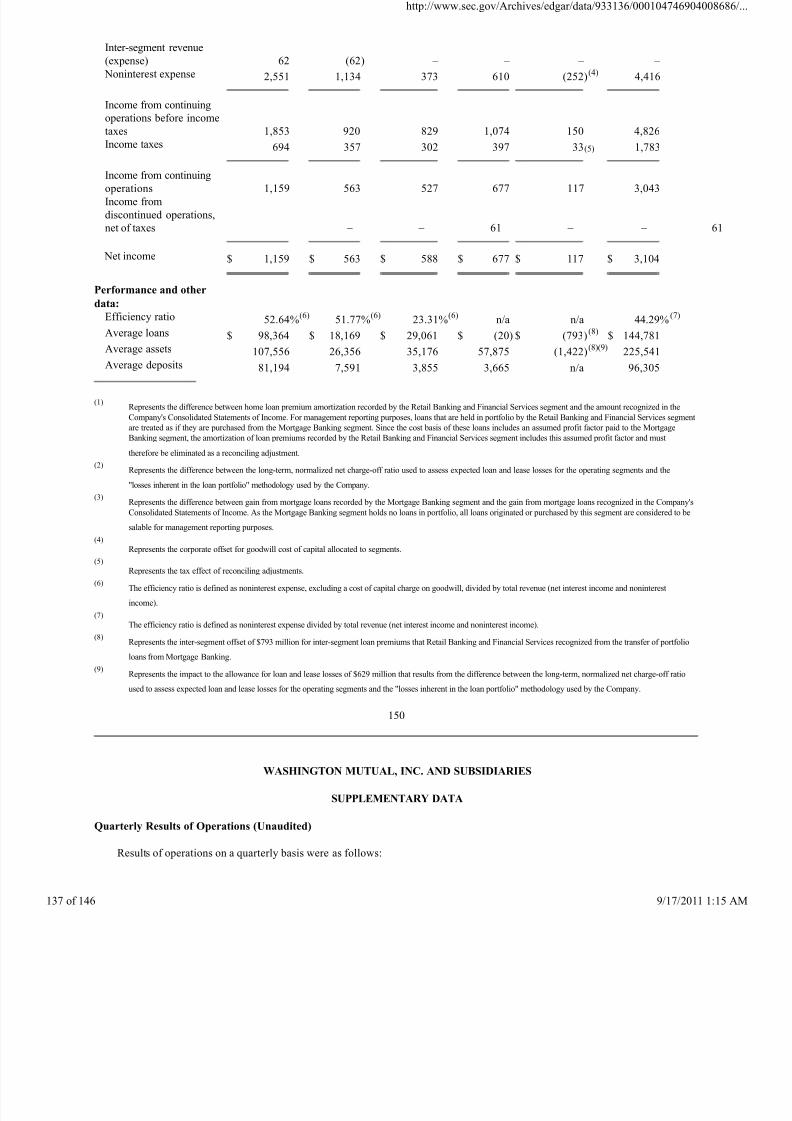
8/4/2019 Wamu 10-k 2003 Subprime
http://slidepdf.com/reader/full/wamu-10-k-2003-subprime 137/146
Inter-segment revenue
(expense)
62 (62) – – – –
Noninterest expense 2,551 1,134 373 610 (252)(4) 4,416
Income from continuing
operations before income
taxes
1,853 920 829 1,074 150 4,826
Income taxes 694 357 302 397 33(5) 1,783
Income from continuingoperations
1,159 563 527 677 117 3,043
Income from
discontinued operations,
net of taxes
– – 61 – –
Net income $ 1,159 $ 563 $ 588 $ 677 $ 117 $ 3,104
Performance and other
data:
Efficiency ratio 52.64%(6) 51.77%(6) 23.31%(6) n/a n/a 44.29% (7)
Average loans $ 98,364 $ 18,169 $ 29,061 $ (20) $ (793)(8) $ 144,781
Average assets 107,556 26,356 35,176 57,875 (1,422)(8)(9) 225,541Average deposits 81,194 7,591 3,855 3,665 n/a 96,305
(1)Represents the difference between home loan premium amortization recorded by the Retail Banking and Financial Services segment and the amount recognized in the
Company's Consolidated Statements of Income. For management reporting purposes, loans that are held in portfolio by the Retail Banking and Financial Services segment
are treated as if they are purchased from the Mortgage Banking segment. Since the cost basis of these loans includes an assumed profit factor paid to the Mortgage
Banking segment, the amortization of loan premiums recorded by the Retail Banking and Financial Services segment includes this assumed profit factor and must
therefore be eliminated as a reconciling adjustment.
(2)Represents the difference between the long-term, normalized net charge-off ratio used to assess expected loan and lease losses for the operating segments and the
"losses inherent in the loan portfolio" methodology used by the Company.
(3)Represents the difference between gain from mortgage loans recorded by the Mortgage Banking segment and the gain from mortgage loans recognized in the Company's
Consolidated Statements of Income. As the Mortgage Banking segment holds no loans in portfolio, all loans originated or purchased by this segment are considered to be
salable for management reporting purposes.
(4)
Represents the corporate offset for goodwill cost of capital allocated to segments.
(5)
Represents the tax effect of reconciling adjustments.
(6)The efficiency ratio is defined as noninterest expense, excluding a cost of capital charge on goodwill, divided by total revenue (net interest income and noninterest
income).
(7)
The efficiency ratio is defined as noninterest expense divided by total revenue (net interest income and noninterest income).
(8)Represents the inter-segment offset of $793 million for inter-segment loan premiums that Retail Banking and Financial Services recognized from the transfer of portfolio
loans from Mortgage Banking.
(9)Represents the impact to the allowance for loan and lease losses of $629 million that results from the difference between the long-term, normalized net charge-off ratio
used to assess expected loan and lease losses for the operating segments and the "losses inherent in the loan portfolio" methodology used by the Company.
150
WASHINGTON MUTUAL, INC. AND SUBSIDIARIES
SUPPLEMENTARY DATA
Quarterly Results of Operations (Unaudited)
Results of operations on a quarterly basis were as follows:
http://www.sec.gov/Archives/edgar/data/933136/000104746904
f 146 9/17/2011
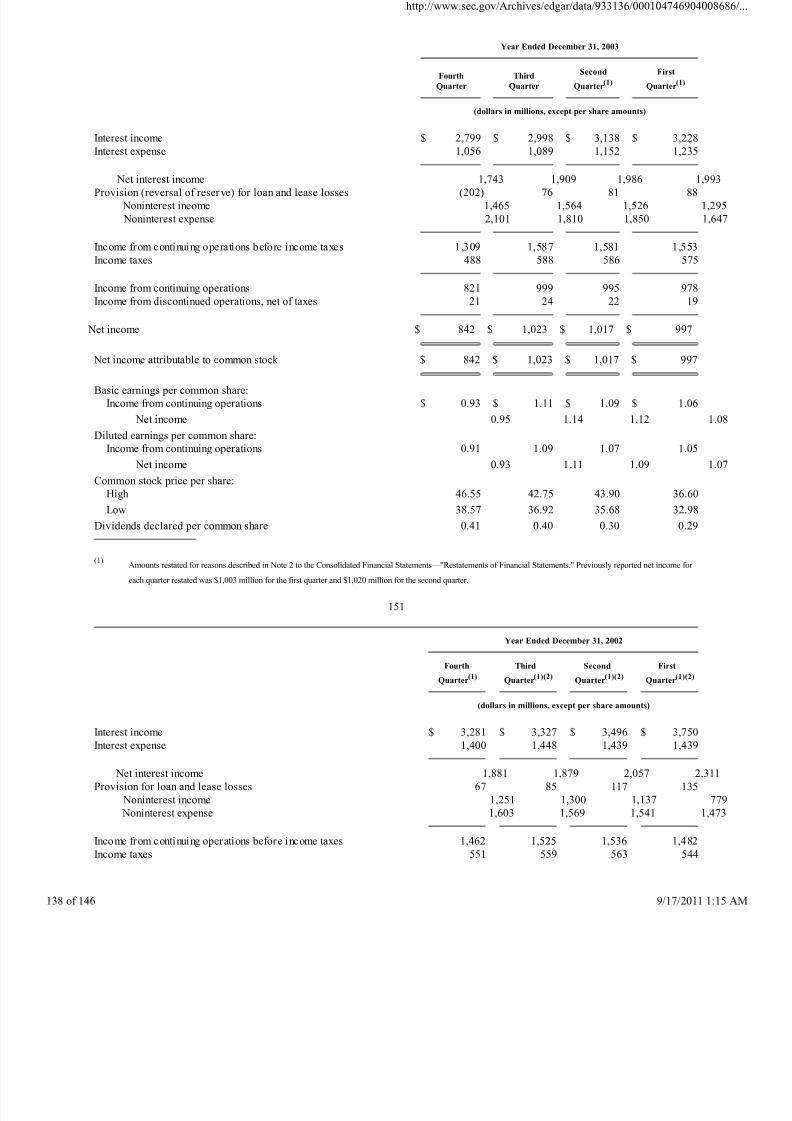
8/4/2019 Wamu 10-k 2003 Subprime
http://slidepdf.com/reader/full/wamu-10-k-2003-subprime 138/146
Year Ended December 31, 2003
Fourth
Quarter
Third
Quarter
Second
Quarter(1)
First
Quarter(1)
(dollars in millions, except per share amounts)
Interest income $ 2,799 $ 2,998 $ 3,138 $ 3,228
Interest expense 1,056 1,089 1,152 1,235
Net interest income 1,743 1,909 1,986 1
Provision (reversal of reserve) for loan and lease losses (202) 76 81 88
Noninterest income 1,465 1,564 1,526
Noninterest expense 2,101 1,810 1,850
Income from continuing operations before income taxes 1,309 1,587 1,581 1,553
Income taxes 488 588 586 575
Income from continuing operations 821 999 995 978
Income from discontinued operations, net of taxes 21 24 22 19
Net income $ 842 $ 1,023 $ 1,017 $ 997
Net income attributable to common stock $ 842 $ 1,023 $ 1,017 $ 997
Basic earnings per common share:
Income from continuing operations $ 0.93 $ 1.11 $ 1.09 $ 1.06
Net income 0.95 1.14 1.12
Diluted earnings per common share:
Income from continuing operations 0.91 1.09 1.07 1.05
Net income 0.93 1.11 1.09
Common stock price per share:
High 46.55 42.75 43.90 36.60
Low 38.57 36.92 35.68 32.98
Dividends declared per common share 0.41 0.40 0.30 0.29
(1)Amounts restated for reasons described in Note 2 to the Consolidated Financial Statements—"Restatements of Financial Statements." Previously reported net income for
each quarter restated was $1,003 million for the first quarter and $1,020 million for the second quarter.
151
Year Ended December 31, 2002
Fourth
Quarter(1)
Third
Quarter(1)(2)
Second
Quarter(1)(2)
First
Quarter(1)(2)
(dollars in millions, except per share amounts)
Interest income $ 3,281 $ 3,327 $ 3,496 $ 3,750
Interest expense 1,400 1,448 1,439 1,439
Net interest income 1,881 1,879 2,057 2,
Provision for loan and lease losses 67 85 117 135
Noninterest income 1,251 1,300 1,137
Noninterest expense 1,603 1,569 1,541
Income from continuing operations before income taxes 1,462 1,525 1,536 1,482
Income taxes 551 559 563 544
http://www.sec.gov/Archives/edgar/data/933136/000104746904
f 146 9/17/2011
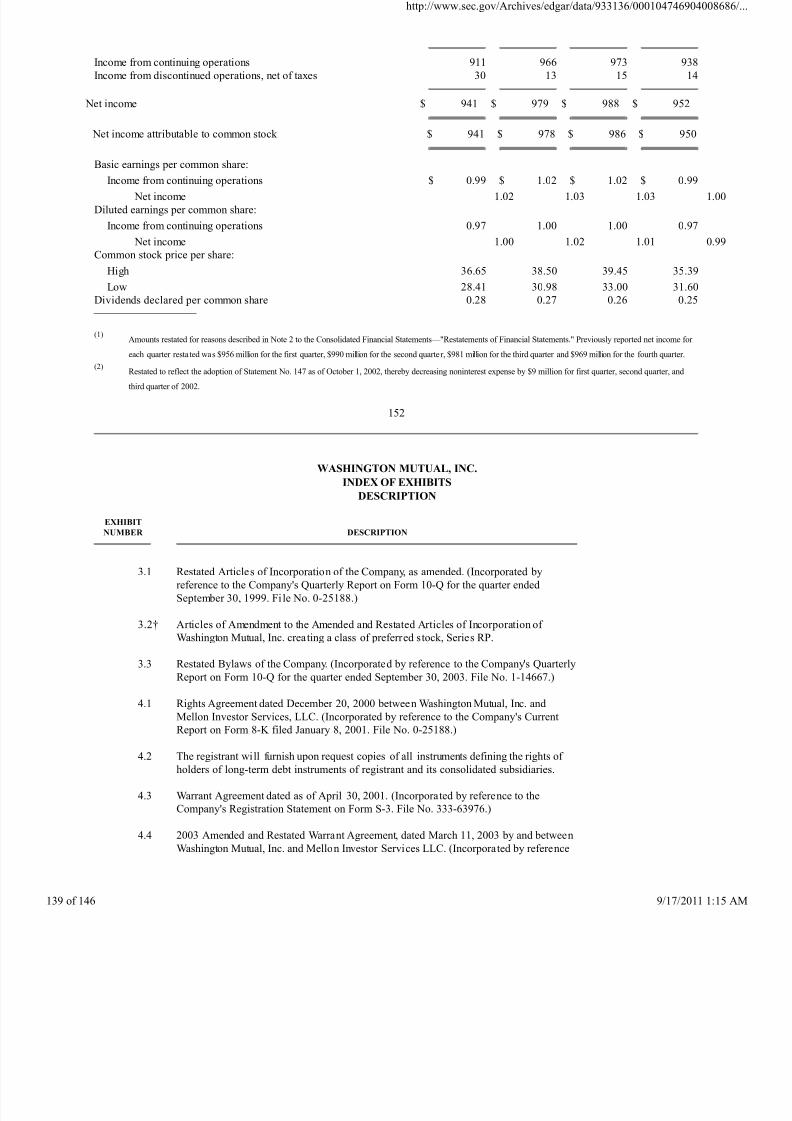
8/4/2019 Wamu 10-k 2003 Subprime
http://slidepdf.com/reader/full/wamu-10-k-2003-subprime 139/146
Income from continuing operations 911 966 973 938
Income from discontinued operations, net of taxes 30 13 15 14
Net income $ 941 $ 979 $ 988 $ 952
Net income attributable to common stock $ 941 $ 978 $ 986 $ 950
Basic earnings per common share:
Income from continuing operations $ 0.99 $ 1.02 $ 1.02 $ 0.99
Net income 1.02 1.03 1.03
Diluted earnings per common share:
Income from continuing operations 0.97 1.00 1.00 0.97
Net income 1.00 1.02 1.01
Common stock price per share:
High 36.65 38.50 39.45 35.39
Low 28.41 30.98 33.00 31.60
Dividends declared per common share 0.28 0.27 0.26 0.25
(1)Amounts restated for reasons described in Note 2 to the Consolidated Financial Statements—"Restatements of Financial Statements." Previously reported net income for
each quarter restated was $956 million for the first quarter, $990 million for the second quarte r, $981 million for the third quarter and $969 million for the fourth quarter.
(2)Restated to reflect the adoption of Statement No. 147 as of October 1, 2002, thereby decreasing noninterest expense by $9 million for first quarter, second quarter, and
third quarter of 2002.
152
WASHINGTON MUTUAL, INC.
INDEX OF EXHIBITS
DESCRIPTION
EXHIBITNUMBER
DESCRIPTION
3.1 Restated Articles of Incorporation of the Company, as amended. (Incorporated by
reference to the Company's Quarterly Report on Form 10-Q for the quarter ended
September 30, 1999. Fi le No. 0-25188.)
3.2† Articles of Amendment to the Amended and Restated Articles of Incorporation of
Washington Mutual, Inc. creating a class of preferred stock, Series RP.
3.3 Restated Bylaws of the Company. (Incorporated by reference to the Company's Quarterly
Report on Form 10-Q for the quarter ended September 30, 2003. File No. 1-14667.)
4.1 Rights Agreement dated December 20, 2000 between Washington Mutual, Inc. andMellon Investor Services, LLC. (Incorporated by reference to the Company's Current
Report on Form 8-K filed January 8, 2001. File No. 0-25188.)
4.2 The registrant will furnish upon request copies of all instruments defining the rights of
holders of long-term debt instruments of registrant and its consolidated subsidiaries.
4.3 Warrant Agreement dated as of April 30, 2001. (Incorporated by reference to the
Company's Registration Statement on Form S-3. File No. 333-63976.)
4.4 2003 Amended and Restated Warrant Agreement, dated March 11, 2003 by and between
Washington Mutual, Inc. and Mellon Investor Services LLC. (Incorporated by reference
http://www.sec.gov/Archives/edgar/data/933136/000104746904
f 146 9/17/2011
8/4/2019 Wamu 10-k 2003 Subprime
http://slidepdf.com/reader/full/wamu-10-k-2003-subprime 140/146
to the Company's Current Report on Form 8-K, dated March 12, 2003. File
No. 1-14667.)
10.1* Lease Agreement between Third and University Limited Partnership and Washington
Mutual Savings Bank, dated September 1, 1988.
10.2††† Three-Year Credi t Agreement dated as of August 12, 2002 between Washington
Mutual, Inc. and Washington Mutual Finance Corporation, as borrowers, the lenders
party thereto, and JPMorgan Chase Bank, as administrative agent.
10.2.1 Amendment No. 1 dated as of December 17, 2003 to Three-Year Credit Agreement
between Washington Mutual, Inc. and Washington Mutual Finance Corporation, as
borrowers, the lenders party thereto, and JPMorgan Chase Bank, as administrative agent
(filed herewith).
Management Contracts and Compensatory Plans and Arrangements (Exhibits 10.3-10.44.3)
10.3 Washington Mutual, Inc. 2003 Equity Incentive Plan (filed herewith).
10.3.1 Amendment No. 1 to the Washington Mutual, Inc. 2003 Equity Incentive Plan (filed
herewith).
10.4† Washington Mutual 1994 Stock Option Plan as Amended and Restated as of February 15,
2000.
10.4.1† First Amendment to the Washington Mutual 1994 Stock Option Plan Amended and
Restated as of February 15, 2000.
10.4.2†† Second Amendment to the Washington Mutual 1994 Stock Option Plan Amended and
Restated as of February 15, 2000.
E-1
10.5†† Washington Mutual Equity Incentive Plan (formerly known as Washington Mutual
Restricted Stock Plan) as Amended and Restated as of January 16, 2001.
10.6 Amended and Restated 2002 Employee Stock Purchase Plan (filed herewith).
10.6.1 Amendment No. 1 to the Amended and Restated 2002 Employee Stock Purchase Plan
(filed herewith).
10.6.2 Amendment No. 2 to the Amended and Restated 2002 Employee Stock Purchase Plan
(filed herewith).
10.7 WaMu Savings Plan, formerly known as Washington Mutual, Inc. Retirement Savings and
Investment Plan amended and Restated Effective October 1, 1998. (Incorporated byreference to the Company's Current Report on Form 8-K dated December 22, 1998. File
No. 0-25188.)
10.7.1† Amendment to the WaMu Savings Plan, formerly known as Washington Mutual, Inc.
Retirement Savings and Investment Plan Amended and Restated Effective October 1,
1998.
10.7.2† Amendment to the WaMu Savings Plan, formerly known as Washington Mutual, Inc.
Retirement Savings and Investment Plan Amended and Restated Effective October 1,
1998.
http://www.sec.gov/Archives/edgar/data/933136/000104746904
f 146 9/17/2011
8/4/2019 Wamu 10-k 2003 Subprime
http://slidepdf.com/reader/full/wamu-10-k-2003-subprime 141/146
10.7.3† Amendment to the WaMu Savings Plan, formerly known as Washington Mutual, Inc.
Retirement Savings and Investment Plan Amended and Restated Effective October 1,
1998.
10.7.4† Amendment to the WaMu Savings Plan, formerly known as Washington Mutual, Inc.
Retirement Savings and Investment Plan Amended and Restated Effective October 1,
1998.
10.7.5†† Amendment to the WaMu Savings Plan, formerly known as Washington Mutual, Inc.
Retirement Savings and Investment Plan Amended and Restated Effective October 1,
1998.
10.7.6††† Amendment to the WaMu Savings Plan, formerly known as Washington Mutual, Inc.
Retirement Savings and Investment Plan Amended and Restated Effective October 1,
1998.
10.7.7††† Amendment to the WaMu Savings Plan, formerly known as Washington Mutual, Inc.
Retirement Savings and Investment Plan Amended and Restated Effective October 1,
1998.
10.7.8 Amendment No. 6 to the WaMu Savings Plan, formerly known as Washington
Mutual, Inc. Retirement Savings and Investment Plan Amended and Restated Effective
October 1, 1998 (filed herewith).
10.7.9 Amendment No. 9 to the WaMu Savings Plan, formerly known as Washington
Mutual, Inc. Retirement Savings and Investment Plan Amended and Restated Effective
October 1, 1998 (filed herewith).
10.8* Washington Mutual Employee Service Award Plan.
10.9** Supplemental Employee's Retirement Plan for Salaried Employees of Washington
Mutual.
10.10** Washington Mutual Supplemental Executive Retirement Accumulation Plan.
E-2
10.11††† Washington Mutual Deferred Compensation Plan for Directors and Certain Highly
Compensated Employees as Amended and Restated Effective November 1, 2002.
10.11.1 Amendment No. 1 to the Washington Mutual, Inc. Deferred Compensation Plan for
Directors and Certain Highly Compensated Employees as Amended and Restated
Effective November 1, 2002 (filed herewith).
10.12 Washington Mutual Leadership Bonus Program (filed herewith).
10.13*** Employment Agreement of Kerry K. Killinger.
10.14*** Employment Agreement for Executive Officers.
10.15 Form of Employment Agreement for Senior Vice Presidents. (Incorporated by reference
to the Washington Mutual, Inc. Annual Report on Form 10-K for the year ended
December 31, 1998. File No. 0-25188.)
10.16 The 1988 Stock Option and Incentive Plan (as amended effective July 26, 1994).
(Incorporated by reference to the Quarterly Report of Great Western Financial
Corporation ("Great Western"), on Form 10-Q for the quarter ended September 30,
1994. File No. 001-04075.)
http://www.sec.gov/Archives/edgar/data/933136/000104746904
f 146 9/17/2011
8/4/2019 Wamu 10-k 2003 Subprime
http://slidepdf.com/reader/full/wamu-10-k-2003-subprime 142/146
10.16.1 Amendment No. 1996-1 to the Great Western Financial Corporation 1988 Stock Option
and Incentive Plan, effective December 10, 1996. (Incorporated by reference to Great
Western's Annual Report on Form 10-K for the year ended December 31, 1996. File
No. 001-04075.)
10.16.2 Form of Director Stock Option Agreement. (Incorporated by reference to Great
Western's Registration Statement on Form S-8 Registration No. 33-21469 pertaining to
Great Western's 1988 Stock Option and Incentive Plan.)
10.16.3 Form of Director Stock Option Agreement effective January 3, 1994. (Incorporated by
reference to Great Western's Annual Report on Form 10-K for the year ended
December 31, 1993. File No. 001-04075.)
10.17 Great Western Financial Corporation Directors' Deferred Compensation Plan (1992
Restatement). (Incorporated by reference to Great Western's Annual Report on
Form 10-K for the year ended December 31, 1991. File No. 001-04075.)
10.17.1 Amendment to Great Western Financial Corporation Directors' Senior Officers' and
basic Deferred Compensation Plans (1992 Restatement). (Incorporated by reference to
Great Western's Annual Report on Form 10-K for the year ended December 31, 1994.
File No. 001-04075.)
10.17.2 Amendment No. 2 to Directors' Deferred Compensation Plan (1992 Restatement).(Incorporated by reference to Great Western's Quarterly Report on Form 10-Q for the
quarter ended March 31, 1996. File No. 001-04075.)
10.17.3 Amendment No. 1996-2 to Directors' Deferred Compensation Plan, dated December 10,
1996. (Incorporated by reference to Great Western's Annual Report on Form 10-K for
the year ended December 31, 1996. File No. 001-04075.)
10.18 Restated Retirement Plan for Directors. (Incorporated by reference to Great Western's
Quarterly Report on Form 10-Q for the quarter ended June 30, 1993. File
No. 001-04075.)
E-3
10.19 Employee Home Loan Program. (Incorporated by reference to Great Western's Quarterly
Report on Form 10-Q for the quarter ended June 30, 1993. File No. 001-04075.)
10.19.1 Amendment No. 1996-1 to Employee Home Loan Program, effective December 10,
1996. (Incorporated by reference to Great Western's Annual Report on Form 10-K for
the year ended December 31, 1996. File No. 001-04075.)
10.20 Omnibus Amendment 1997-1 amending the definition of change in control in the Great
Western Financial Corporation 1988 Stock Option and Incentive Plan, as amended
December 10, 1996, the Great Western Financial Corporation Directors' Deferred
Compensation Plan (1992 Restatement), as amended December 10, 1996, and the
Employee Home Loan Program (revised and restated as of April 27, 1993), as amended
December 10, 1996. (Incorporated by reference to Great Western's Annual Report on
Form 10-K for the year ended December 31, 1996. File No. 001-04075.)
10.21 H.F. Ahmanson & Company 1993 Stock Incentive Plan as amended. (Incorporated by
reference to Ahmanson's Annual Report on Form 10-K for the year ended December 31,
1996. File No. 1-08930.)
10.22 H.F. Ahmanson & Company 1996 Nonemployee Directors' Stock Incentive Plan.
(Incorporated by reference to Ahmanson's Annual Report on Form 10-K for the year
http://www.sec.gov/Archives/edgar/data/933136/000104746904
f 146 9/17/2011
8/4/2019 Wamu 10-k 2003 Subprime
http://slidepdf.com/reader/full/wamu-10-k-2003-subprime 143/146
ended December 31, 1995. File No. 1-08930.)
10.23 Executive Life Insurance Plan of H.F. Ahmanson & Company. (Incorporated by reference
to Ahmanson's Annual Report on Form 10-K for the year ended December 31, 1989. File
No. 1-08930.)
10.23.1 First Amendment to Executive Life Insurance Plan of H.F. Ahmanson & Company.
(Incorporated by reference to Ahmanson's Annual Report on Form 10-K for the year
ended December 31, 1995. File No. 1-08930.)
10.23.2 Second Amendment to Executive Life Insurance Plan of H.F. Ahmanson & Company.
(Incorporated by reference to Ahmanson's Annual Report on Form 10-K for the year
ended December 31, 1996. File No. 1-08930.)
10.24 Senior Executive Life Insurance Plan of H.F. Ahmanson & Company, as amended and
restated. (Incorporated by reference to Ahmanson's Annual Report on Form 10-K for the
year ended December 31, 1995. File No. 1-08930.)
10.25 H.F. Ahmanson & Company Supplemental Long Term Disability Plan. (Incorporated by
reference to Ahmanson's Annual Report on Form 10-K for the year ended December 31,
1989. File No. 1-08930.)
10.26 Outside Directors' Elective Deferred Compensation Plan of H.F. Ahmanson & Company.
(Incorporated by reference to Ahmanson's Quarterly Report on Form 10-Q for thequarter ended June 30, 1991. File No. 1-08930.)
10.26.1 First Amendment to Outside Directors' Elective Deferred Compensation Plan of H.F.
Ahmanson & Company. (Incorporated by reference to Ahmanson's Annual Report on
Form 10-K for the year ended December 31, 1995. File No. 1-08930.)
10.26.2 Second Amendment to Outside Directors' Elective Deferred Compensation Plan of H.F.
Ahmanson & Company. (Incorporated by reference to Ahmanson's Annual Report on
Form 10-K for the year ended December 31, 1996. File No. 1-08930.)
E-4
10.27 Outside Directors' Capital Accumulation Plan of H.F. Ahmanson & Company.
(Incorporated by reference to Ahmanson's Annual Report on Form 10-K for the year
ended December 31, 1996. File No. 1-08930.)
10.27.1 First Amendment to Outside Directors' Capital Accumulation Plan of H.F. Ahmanson &
Company. (Incorporated by reference to Ahmanson's Annual Report on Form 10-K for
the year ended December 31, 1996. File No. 1-08930.)
10.28 Outside Director Retirement Plan of H.F. Ahmanson & Company, as amended and
restated. (Incorporated by reference to Ahmanson's Quarterly Report on Form 10-Q for
the quarter ended June 30, 1991. File No. 1-08930.)
10.28.1 First Amendment to Outside Director Retirement Plan of H.F. Ahmanson & Company.
(Incorporated by reference to Ahmanson's Annual Report on Form 10-K for the year
ended December 31, 1995. File No. 1-08930.)
10.29 Amended Form of Indemnity Agreement between H.F. Ahmanson & Company and
directors and executive officers. (Incorporated by reference to Ahmanson's Annual
Report on Form 10-K for the year ended December 31, 1989. File No. 1-08930.)
10.30 Board of Directors Retirement Plan of Coast. (Incorporated by reference to the Current
Report of Coast Savings Financial Inc. ("Coast") on Form 8-K dated September 1, 1989.
File No. 1-10264.)
http://www.sec.gov/Archives/edgar/data/933136/000104746904
f 146 9/17/2011
8/4/2019 Wamu 10-k 2003 Subprime
http://slidepdf.com/reader/full/wamu-10-k-2003-subprime 144/146
10.31 Form of Post-Retirement Compensation Arrangement of Coast. (Incorporated by
reference to Coast's Annual Report on Form 10-K for the year ended December 31,
1989. File No. 1-10264.)
10.32 Amended and Restated Executive Supplemental Retirement Plan of Coast, dated
February 28, 1996. (Incorporated by reference to Coast's Annual Report on Form 10-K
for the year ended December 31, 1995. File No. 1-10264.)
10.33 Long Beach Financial Corporation 1997 Stock Incentive Plan. (Incorporated by
reference to the Long Beach Financial Corporation's Registration Statement on
Form S-1. File No. 333-22013.)
10.34 Bank United Corp. ("Bank United") 1996 Stock Incentive Plan. (Incorporated by
reference to Bank United's Registration Statement on Form S-1 dated July 25, 1996. File
No. 333-06229.)
10.35†† Bank United 1999 Stock Incentive Plan.
10.36†† Bank United 2000 Stock Incentive Plan.
10.37 Bank United Director Stock Plan. (Incorporated by reference to Bank United's
Registration Statement on Form S-1 dated July 25, 1996. File No. 333-06229.)
10.37.1 Bank United Director Stock Plan, Amended and Restated as of March 16, 2000.
(Incorporated by reference to Bank United's Quarterly Report on Form 10-Q for the
quarter ended June 30, 2000. File No. 0-21017.)
10.38 Deferred Compensation Plan for Board Members of DSB (the "DSB Director Deferred
Compensation Plan"), as amended and restated effective as of July 24, 1997
(Incorporated by reference to Dime's 1997 10-K), as amended by an Amendment to the
DSB Director Deferred Compensation Plan, effective May 18, 2000. (Incorporated by
reference to the 14d-9 Amendment No. 11.)
E-5
10.39 Retainer Continuation Plan for Independent Directors of DSB (the "Retainer
Continuation Plan") (Incorporated by reference to DSB's Annual Report on Form 10-K
for the fiscal year ended December 31, 1993, filed on September 16, 1994 as Exhibit A
to Dime's Report on Form 8-K dated that date. File No. 001- 13094), as amended by
(i) an Amendment, effective as of January 13, 1995, to the Retainer Continuation Plan
(Incorporated by reference to Dime's Annual Report on Form 10-K for the fiscal year
ended December 31, 1995. File No. 001-13094), (ii) an Amendment, effective as of
December 31, 1996, to the Retainer Continuation Plan. (Incorporated by reference to
Dime's 1996 10-K), (iii) an Amendment, effective March 1, 1997, to the Retainer
Continuation Plan (Incorporated by reference to Dime's 1996 10-K), (iv) an Amendment,
effective July 24, 1997, to the Retainer Continuation Plan (Incorporated by reference to
Dime's 1997 10-K), and (v) an Amendment to the Retainer Continuation Plan, effective
May 18, 2000. (Incorporated by reference to the 14d-9 Amendment No. 11)
10.40 Dime Voluntary Deferred Compensation Plan for Directors (the "Bancorp Director
Deferred Compensation Plan"), as amended and restated effective as of July 24, 1997
(Incorporated by reference to Dime's 1997 10-K), as amended by (i) an Amendment,
effective March 26, 1998, to the Bancorp Director Deferred Compensation Plan
(Incorporated by reference to Dime's 1998 10-K), (ii) an Amendment, effective
October 1, 1999, to the Bancorp Director Deferred Compensation Plan (Incorporated by
reference to Dime's 1999 10-K), and (iii) an Amendment to the Bancorp Director
Deferred Compensation Plan, effective May 18, 2000. (Incorporated by reference to the
http://www.sec.gov/Archives/edgar/data/933136/000104746904
f 146 9/17/2011
8/4/2019 Wamu 10-k 2003 Subprime
http://slidepdf.com/reader/full/wamu-10-k-2003-subprime 145/146
14d-9 Amendment No. 11.)
10.41 Dime 1997 Stock Incentive Plan for Outside Directors, as amended and restated
effective March 27, 1998 (the "1997 Outside Director Plan"). (Incorporated by
reference to Dime's 1998 10-K.)
10.41.1 Amendment to the Dime 1997 Outside Director Plan, effective December 12, 2000.
(Incorporated by reference to Dime's Annual Report on Form 10-K for the year ended
December 31, 2000. File No. 1-13094.)
10.42††† Washington Mutual, Inc. WAMU Shares program.
10.43††† January 1999 WAMU Shares program.
10.43.1 Amendments to the January 1999 WAMU Shares Plan (See Exhibit 10.44.3).
10.44††† February 2001 WAMU Shares Plan.
10.44.1 Amendment No. 1 to February 2001 WAMU Shares Plan (filed herewith).
10.44.2 Amendment No. 3 to February 2001 WAMU Shares Plan (filed herewith).
10.44.3 Amendments to the January 1999 WAMU Shares Plan and the February 2001 WAMU
Shares Plan (collectively, the "Plans") (filed herewith).
12.1 Computation of Ratios of Earnings to Fixed Charges (filed herewith).
12.2 Computation of Ratios of Earnings to Fixed Charges and Preferred Dividends (filed
herewith).
21 List of Subsidiaries of the Registrant (filed herewith).
23 Consent of Deloitte & Touche LLP (filed herewith).
E-6
31.1 Certification of the Chief Executive Officer pursuant to Section 302 of the
Sarbanes-Oxley Act of 2002 (filed herewith).
31.2 Certification of the Chief Financial Officer pursuant to Section 302 of the
Sarbanes-Oxley Act of 2002 (filed herewith).
32.1 Certification of the Chief Executive Officer pursuant to Section 906 of the
Sarbanes-Oxley Act of 2002 (furnished herewith).
32.2 Certification of the Chief Financial Officer pursuant to Section 906 of the
Sarbanes-Oxley Act of 2002 (furnished herewith).
* Incorporated by reference to the Company's Current Report on Form 8-K dated November 29, 1994. File No. 0-25188.
** Incorporated by reference to the Company's Annual Report on Form 10-K for the year ended December 31, 1996. File
No. 0-25188.
*** Incorporated by reference to the Company's Annual Report on Form 10-K for the year ended December 31, 1997. File
No. 0-25188.
† Incorporated by reference to the Company's Annual Report on Form 10-K for the year ended December 31, 2000. File
No. 1-14667.
http://www.sec.gov/Archives/edgar/data/933136/000104746904
f 146 9/17/2011
8/4/2019 Wamu 10-k 2003 Subprime
http://slidepdf.com/reader/full/wamu-10-k-2003-subprime 146/146
†† Incorporated by reference to the Company's Annual Report on Form 10-K for the year ended December 31, 2001. File
No. 1-14667.
††† Incorporated by reference to the Company's Annual Report on Form 10-K for the year ended December 31, 2002. File
No. 1-14667.
Exhibits followed by a parenthetical reference are incorporated by reference herein from the documents described therein.
Documents relating to Ahmanson filed prior to May 1985 were filed by H.F. Ahmanson & Company, a Cal ifornia corporation,
File No. 1-7108.
E-7
QuickLinks
WASHINGTON MUTUAL, INC. 2003 ANNUAL REPORT ON FORM 10-K/A TABLE OF CONTENTS
Explanatory Note
PART I
PART II
PART III
PART IV
SIGNATURES
INDEX TO CONSOLIDATED FINANCIAL STATEMENTS
INDEPENDENT AUDITORS' REPORT
WASHINGTON MUTUAL, INC. AND SUBSIDIARIES CONSOLIDATED STATEMENTS OF INCOME
WASHINGTON MUTUAL, INC. AND SUBSIDIARIES CONSOLIDATED STATEMENTS OF FINANCIAL CONDITION
WASHINGTON MUTUAL, INC. AND SUBSIDIARIES CONSOLIDATED STATEMENTS OF STOCKHOLDERS' EQUITY AND
COMPREHENSIVE INCOME
WASHINGTON MUTUAL, INC. AND SUBSIDIARIES CONSOLIDATED STATEMENTS OF CASH FLOWS
WASHINGTON MUTUAL INC AND SUBSIDIARIES NOTES TO CONSOLIDATED FINANCIAL STATEMENTS
http://www.sec.gov/Archives/edgar/data/933136/000104746904