Embed Size (px)
Citation preview
1
Watching the Watchdog 2.0 Utusan Malaysia Section 1: Coverage of Political Parties and Coalitions
1.1 Volume of Coverage of Parties & Coalitions Figure 1: Volume of Coverage of Political Parties & Coalitions
• BN received the most coverage (20.68%), followed by DAP (9.28%) and PKR (8.84%).
20.689.28
8.846.50
6.305.19
4.493.77
3.233.03
2.662.382.31
2.062.041.96
1.410.94
0.820.60
0.420.40
0.220.120.050.000.000.000.00
0.00 5.00 10.00 15.00 20.00 25.00
BN
PKR
UMNO
PAS
PBRS
PCM
IKATAN
Gagasan Sejahtera
Other
PBS
PRM
STAR
Warisan
SUPP
USNO
2
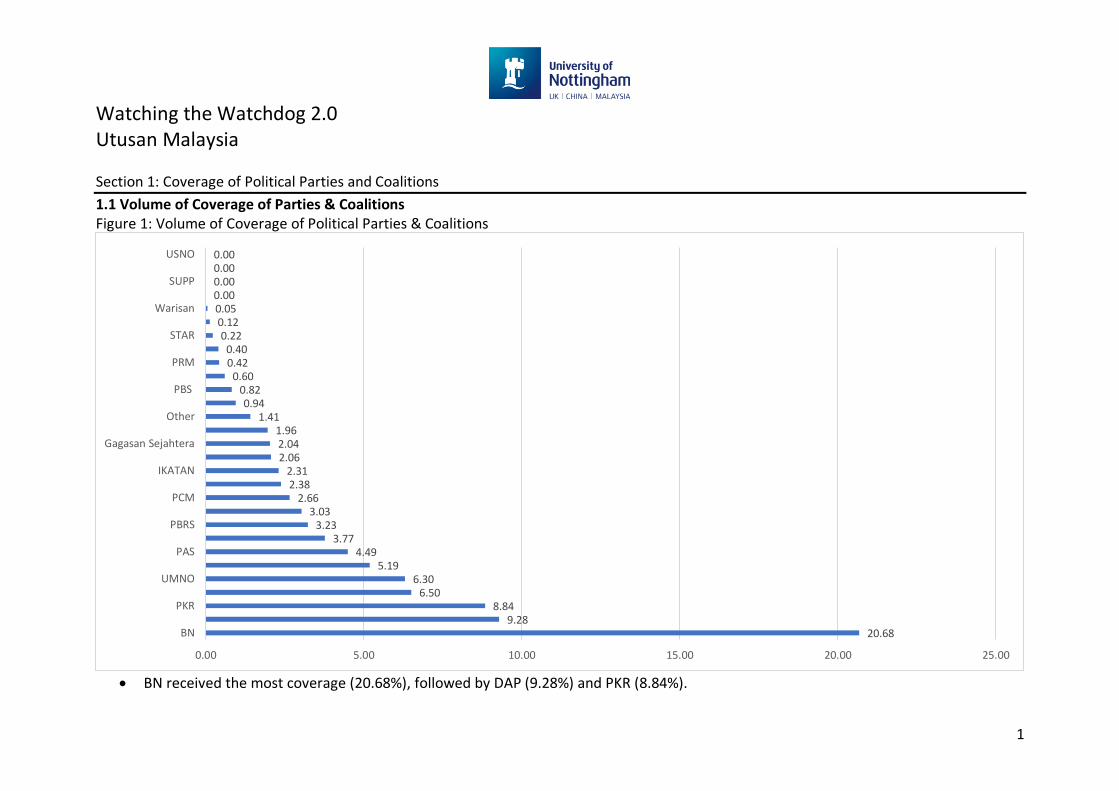
Figure 2: Volume of Coverage of Political Parties & Coalitions: Government vs. Opposition vs. Independent/Other
• Once parties/coalitions’ coverage volumes are combined, BN received the highest
level of coverage (59.52%), followed by PH (26.29%) and GS (10.01%). 1.2 Tone of Coverage of Political Parties & Coalitions Figure 3: Raw Tonal Coverage Volume of Political Parties & Coalitions
• The Neutral tone was used the most (72%), followed by Negative (19%) and Positive
(8%).
59.52
26.29
4.19
10.01
0.00 10.00 20.00 30.00 40.00 50.00 60.00 70.00
BN
PH
Independent
GS
Positive8%
Negative19%
Neutral72%
Attacked1%
3
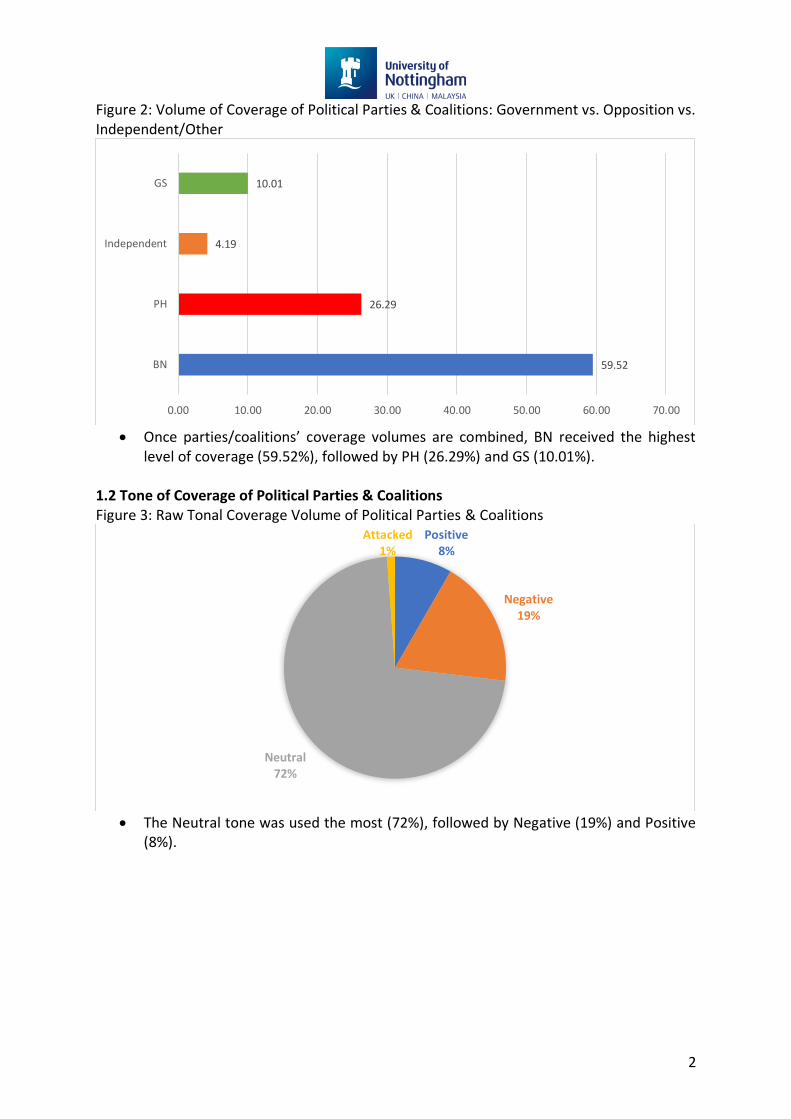
Figure 4.1: Attacked Political Party & Coalition Coverage
• PKR received the highest coverage of Attacked tones (15.79%), with DAP and PBRS receiving (14.04%) respectively.
15.79
14.04
14.04
8.77
7.02
7.02
5.26
1.75
1.75
1.75
1.75
1.75
0.00
0.00
0.00
0.00
0.00
0.00
0.00
0.00
0.00
0.00
0.00
0.00
0.00
0.00
0.00
0.00
0.00
0.00 2.00 4.00 6.00 8.00 10.00 12.00 14.00 16.00 18.00
PKR
DAP
PBRS
PPBM
IKATAN
STAR
PBB
BN
PAS
PDP
PH
AMANAH
Gagasan Sejahtera
Gerakan
MCA
MIC
PBS
PCM
PRS
PRM
PSM
SAPP
SUPP
UMNO
UPKO
Other
LDP
Warisan
USNO
4
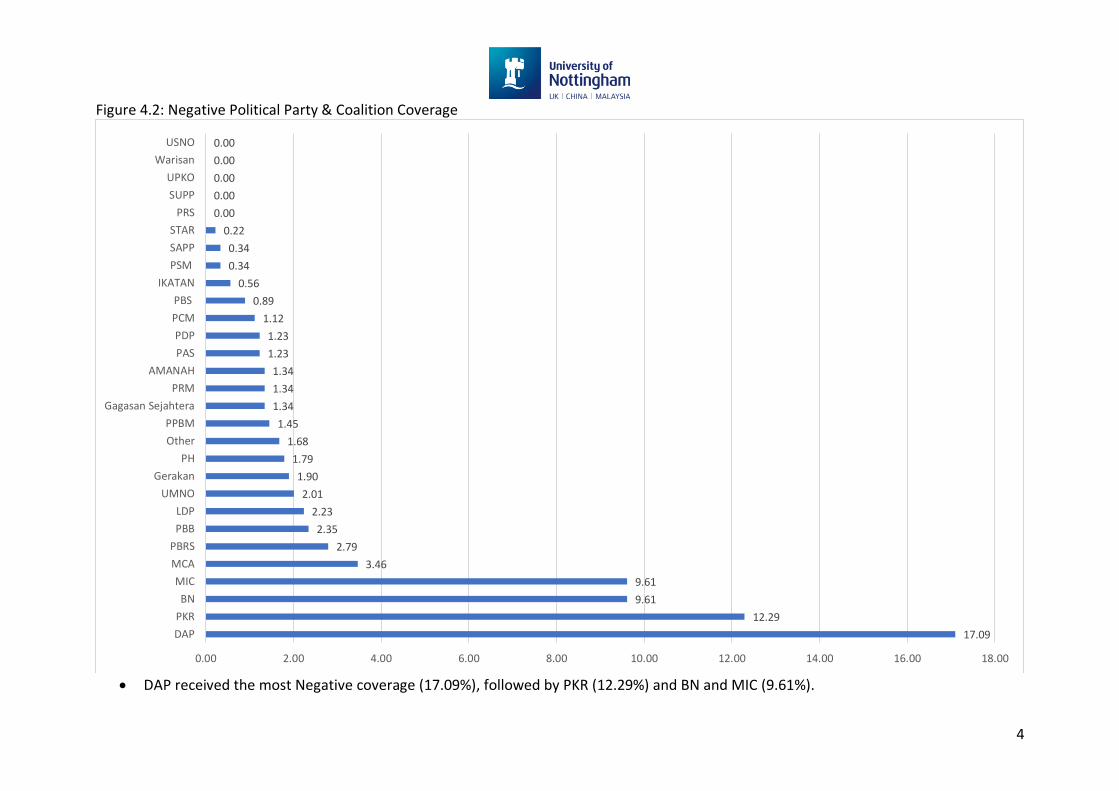
Figure 4.2: Negative Political Party & Coalition Coverage
• DAP received the most Negative coverage (17.09%), followed by PKR (12.29%) and BN and MIC (9.61%).
17.09
12.29
9.61
9.61
3.46
2.79
2.35
2.23
2.01
1.90
1.79
1.68
1.45
1.34
1.34
1.34
1.23
1.23
1.12
0.89
0.56
0.34
0.34
0.22
0.00
0.00
0.00
0.00
0.00
0.00 2.00 4.00 6.00 8.00 10.00 12.00 14.00 16.00 18.00
DAP
PKR
BN
MIC
MCA
PBRS
PBB
LDP
UMNO
Gerakan
PH
Other
PPBM
Gagasan Sejahtera
PRM
AMANAH
PAS
PDP
PCM
PBS
IKATAN
PSM
SAPP
STAR
PRS
SUPP
UPKO
Warisan
USNO
5
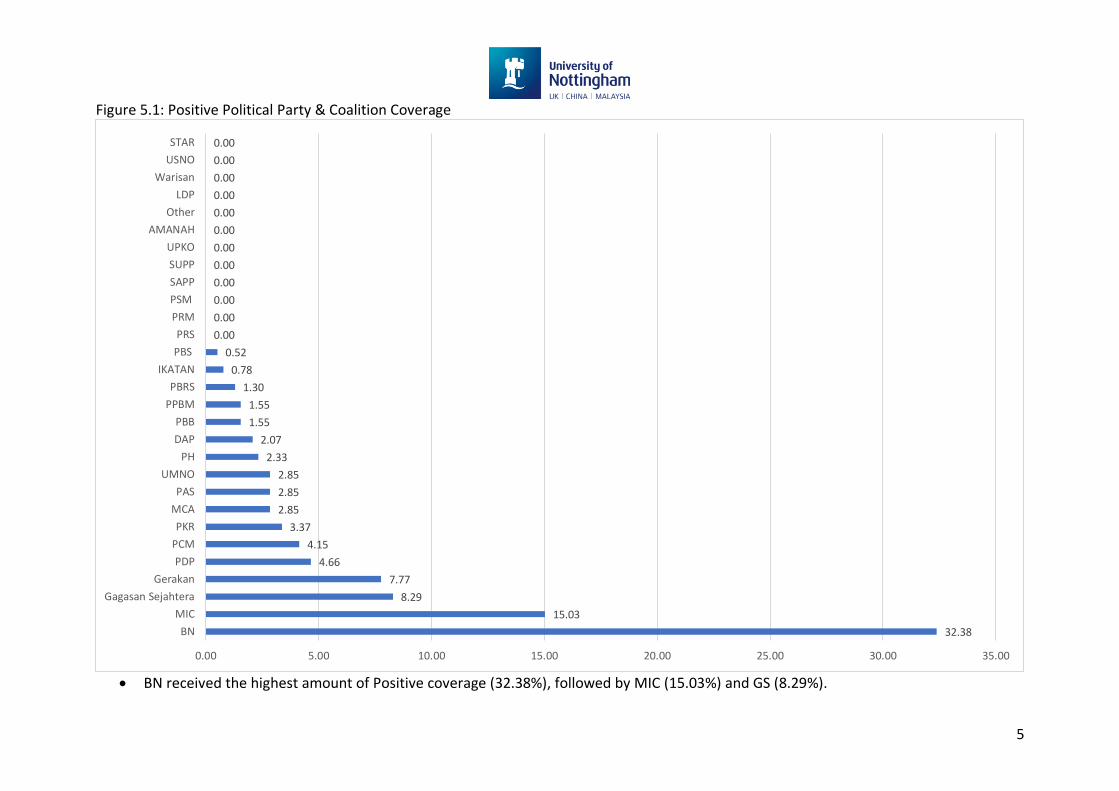
Figure 5.1: Positive Political Party & Coalition Coverage
• BN received the highest amount of Positive coverage (32.38%), followed by MIC (15.03%) and GS (8.29%).
32.38
15.03
8.29
7.77
4.66
4.15
3.37
2.85
2.85
2.85
2.33
2.07
1.55
1.55
1.30
0.78
0.52
0.00
0.00
0.00
0.00
0.00
0.00
0.00
0.00
0.00
0.00
0.00
0.00
0.00 5.00 10.00 15.00 20.00 25.00 30.00 35.00
BN
MIC
Gagasan Sejahtera
Gerakan
PDP
PCM
PKR
MCA
PAS
UMNO
PH
DAP
PBB
PPBM
PBRS
IKATAN
PBS
PRS
PRM
PSM
SAPP
SUPP
UPKO
AMANAH
Other
LDP
Warisan
USNO
STAR
6
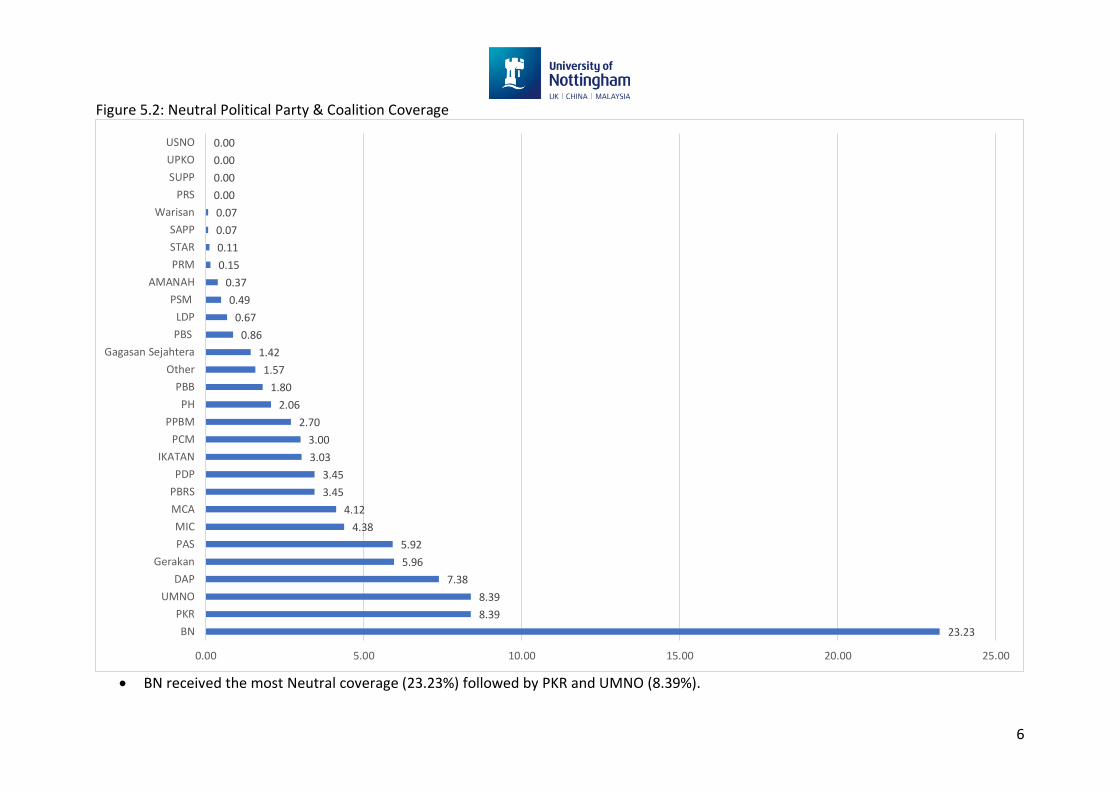
Figure 5.2: Neutral Political Party & Coalition Coverage
• BN received the most Neutral coverage (23.23%) followed by PKR and UMNO (8.39%).
23.23
8.39
8.39
7.38
5.96
5.92
4.38
4.12
3.45
3.45
3.03
3.00
2.70
2.06
1.80
1.57
1.42
0.86
0.67
0.49
0.37
0.15
0.11
0.07
0.07
0.00
0.00
0.00
0.00
0.00 5.00 10.00 15.00 20.00 25.00
BN
PKR
UMNO
DAP
Gerakan
PAS
MIC
MCA
PBRS
PDP
IKATAN
PCM
PPBM
PH
PBB
Other
Gagasan Sejahtera
PBS
LDP
PSM
AMANAH
PRM
STAR
SAPP
Warisan
PRS
SUPP
UPKO
USNO
7
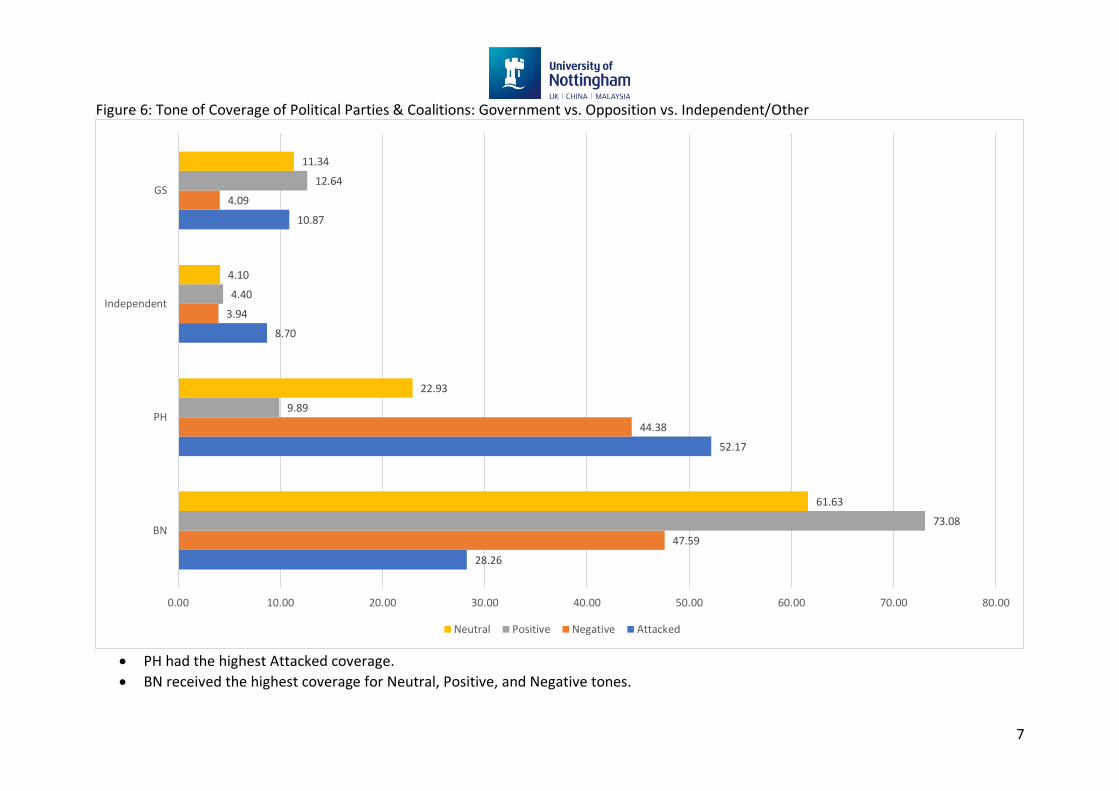
Figure 6: Tone of Coverage of Political Parties & Coalitions: Government vs. Opposition vs. Independent/Other
• PH had the highest Attacked coverage.
• BN received the highest coverage for Neutral, Positive, and Negative tones.
28.26
52.17
8.70
10.87
47.59
44.38
3.94
4.09
73.08
9.89
4.40
12.64
61.63
22.93
4.10
11.34
0.00 10.00 20.00 30.00 40.00 50.00 60.00 70.00 80.00
BN
PH
Independent
GS
Neutral Positive Negative Attacked
8
Section 2: Coverage of Politicians and Political Figures
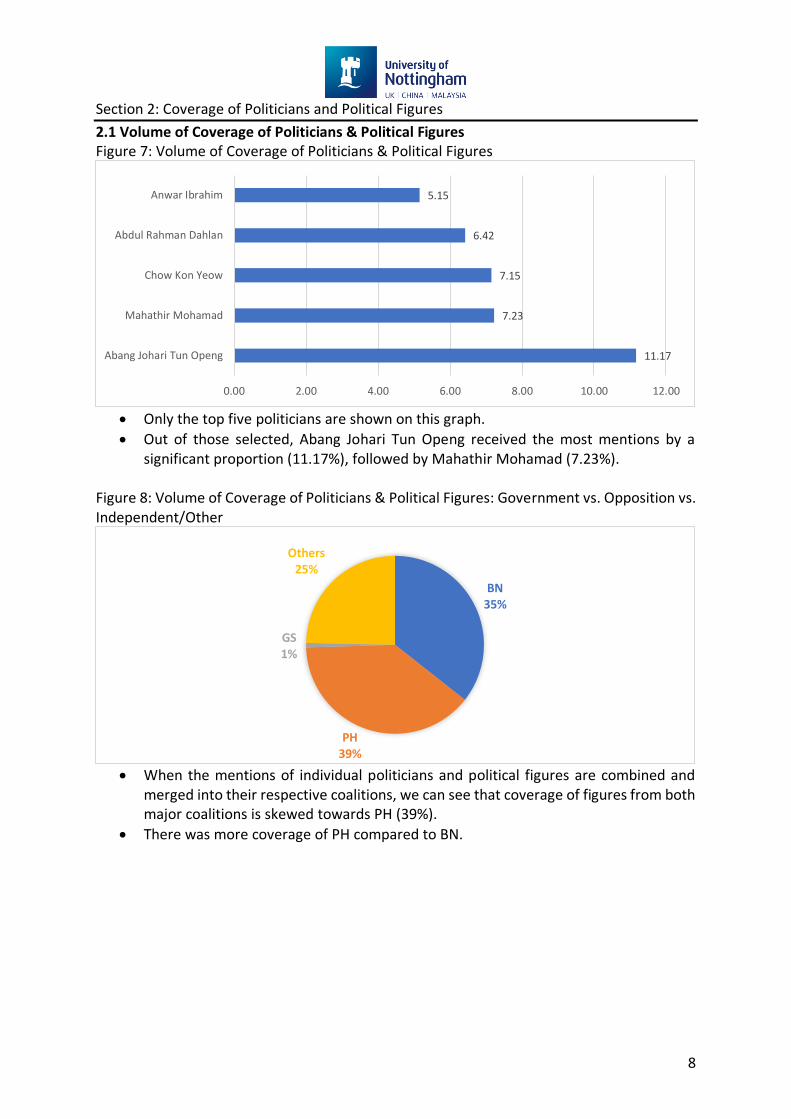
2.1 Volume of Coverage of Politicians & Political Figures Figure 7: Volume of Coverage of Politicians & Political Figures
• Only the top five politicians are shown on this graph.
• Out of those selected, Abang Johari Tun Openg received the most mentions by a significant proportion (11.17%), followed by Mahathir Mohamad (7.23%).
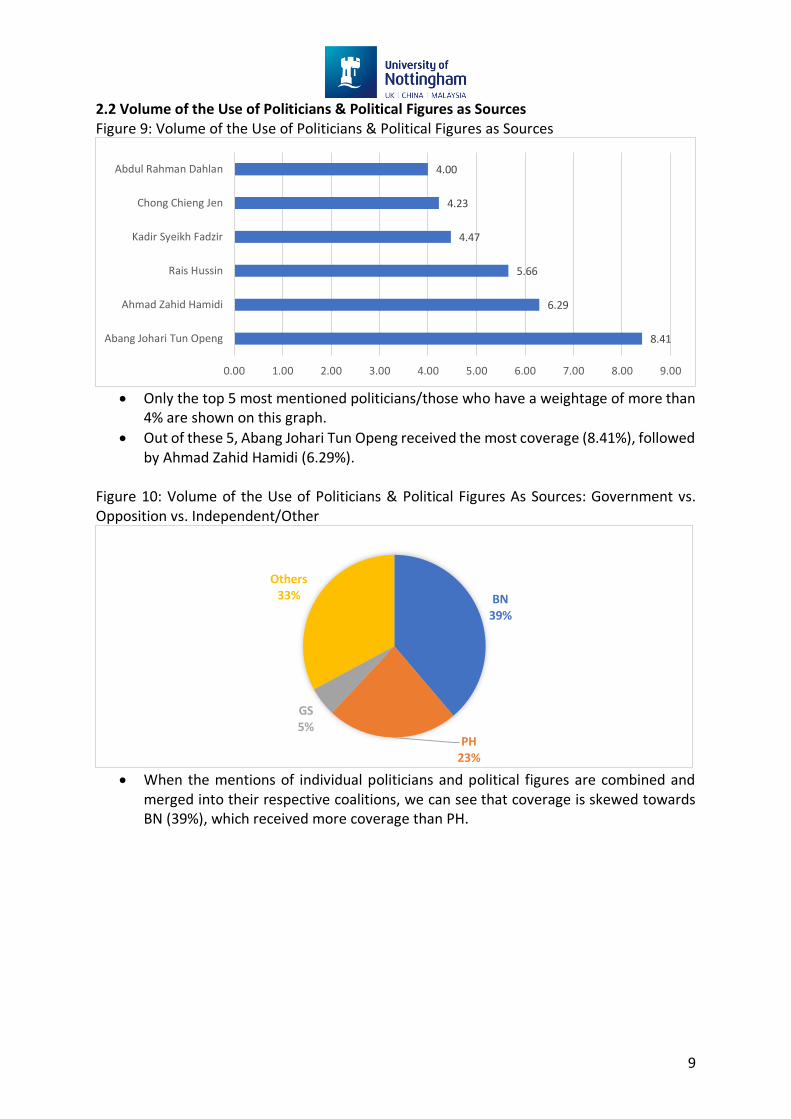
Figure 8: Volume of Coverage of Politicians & Political Figures: Government vs. Opposition vs. Independent/Other
• When the mentions of individual politicians and political figures are combined and
merged into their respective coalitions, we can see that coverage of figures from both major coalitions is skewed towards PH (39%).
• There was more coverage of PH compared to BN.
11.17
7.23
7.15
6.42
5.15
0.00 2.00 4.00 6.00 8.00 10.00 12.00
Abang Johari Tun Openg
Mahathir Mohamad
Chow Kon Yeow
Abdul Rahman Dahlan
Anwar Ibrahim
BN35%
PH39%
GS1%
Others25%
9
2.2 Volume of the Use of Politicians & Political Figures as Sources Figure 9: Volume of the Use of Politicians & Political Figures as Sources
• Only the top 5 most mentioned politicians/those who have a weightage of more than
4% are shown on this graph.
• Out of these 5, Abang Johari Tun Openg received the most coverage (8.41%), followed by Ahmad Zahid Hamidi (6.29%).
Figure 10: Volume of the Use of Politicians & Political Figures As Sources: Government vs. Opposition vs. Independent/Other
• When the mentions of individual politicians and political figures are combined and
merged into their respective coalitions, we can see that coverage is skewed towards BN (39%), which received more coverage than PH.
8.41
6.29
5.66
4.47
4.23
4.00
0.00 1.00 2.00 3.00 4.00 5.00 6.00 7.00 8.00 9.00
Abang Johari Tun Openg
Ahmad Zahid Hamidi
Rais Hussin
Kadir Syeikh Fadzir
Chong Chieng Jen
Abdul Rahman Dahlan
BN39%
PH23%
GS5%
Others33%
10
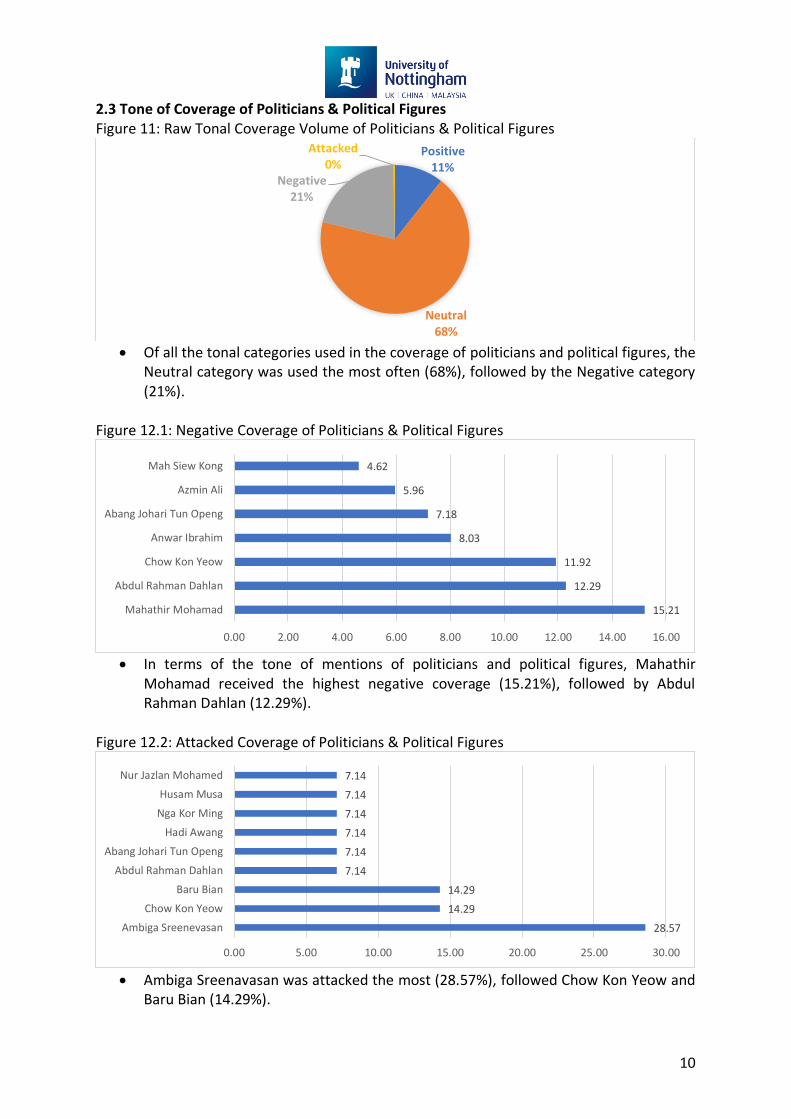
2.3 Tone of Coverage of Politicians & Political Figures Figure 11: Raw Tonal Coverage Volume of Politicians & Political Figures
• Of all the tonal categories used in the coverage of politicians and political figures, the
Neutral category was used the most often (68%), followed by the Negative category (21%).
Figure 12.1: Negative Coverage of Politicians & Political Figures
• In terms of the tone of mentions of politicians and political figures, Mahathir
Mohamad received the highest negative coverage (15.21%), followed by Abdul Rahman Dahlan (12.29%).
Figure 12.2: Attacked Coverage of Politicians & Political Figures
• Ambiga Sreenavasan was attacked the most (28.57%), followed Chow Kon Yeow and
Baru Bian (14.29%).
Positive11%
Neutral68%
Negative21%
Attacked0%
15.21
12.29
11.92
8.03
7.18
5.96
4.62
0.00 2.00 4.00 6.00 8.00 10.00 12.00 14.00 16.00
Mahathir Mohamad
Abdul Rahman Dahlan
Chow Kon Yeow
Anwar Ibrahim
Abang Johari Tun Openg
Azmin Ali
Mah Siew Kong
28.57
14.29
14.29
7.14
7.14
7.14
7.14
7.14
7.14
0.00 5.00 10.00 15.00 20.00 25.00 30.00
Ambiga Sreenevasan
Chow Kon Yeow
Baru Bian
Abdul Rahman Dahlan
Abang Johari Tun Openg
Hadi Awang
Nga Kor Ming
Husam Musa
Nur Jazlan Mohamed
11
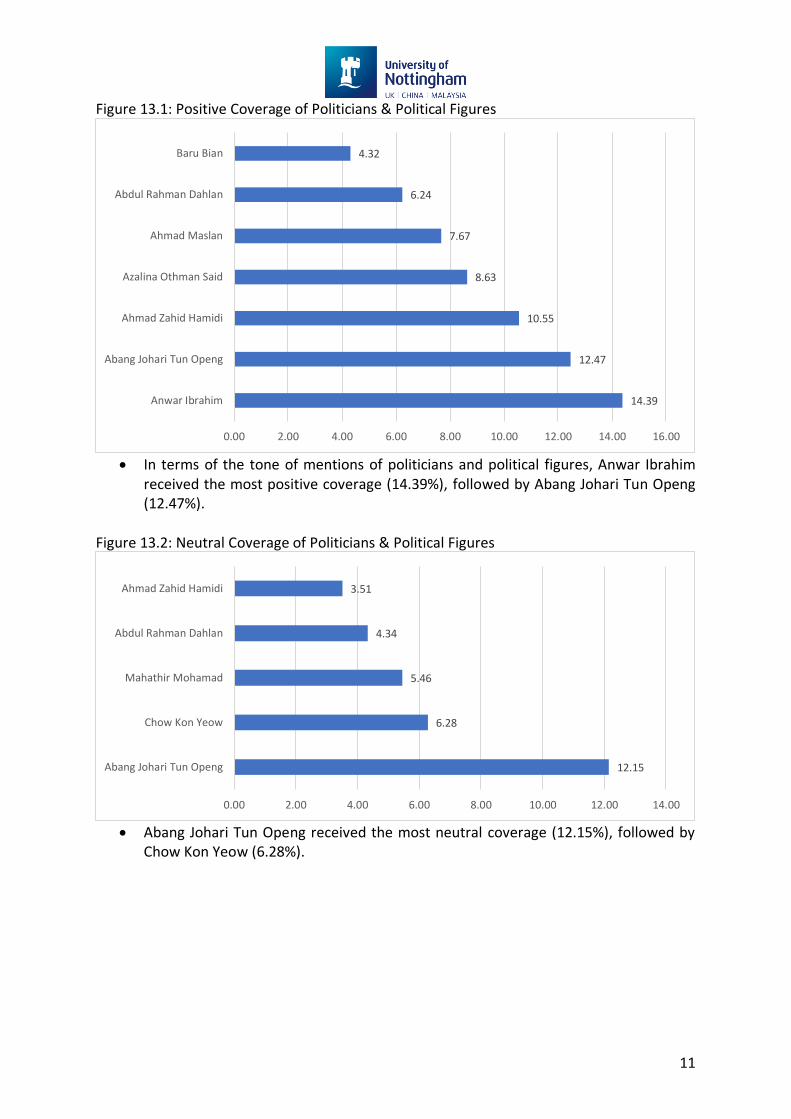
Figure 13.1: Positive Coverage of Politicians & Political Figures
• In terms of the tone of mentions of politicians and political figures, Anwar Ibrahim
received the most positive coverage (14.39%), followed by Abang Johari Tun Openg (12.47%).
Figure 13.2: Neutral Coverage of Politicians & Political Figures
• Abang Johari Tun Openg received the most neutral coverage (12.15%), followed by
Chow Kon Yeow (6.28%).
14.39
12.47
10.55
8.63
7.67
6.24
4.32
0.00 2.00 4.00 6.00 8.00 10.00 12.00 14.00 16.00
Anwar Ibrahim
Abang Johari Tun Openg
Ahmad Zahid Hamidi
Azalina Othman Said
Ahmad Maslan
Abdul Rahman Dahlan
Baru Bian
12.15
6.28
5.46
4.34
3.51
0.00 2.00 4.00 6.00 8.00 10.00 12.00 14.00
Abang Johari Tun Openg
Chow Kon Yeow
Mahathir Mohamad
Abdul Rahman Dahlan
Ahmad Zahid Hamidi
12
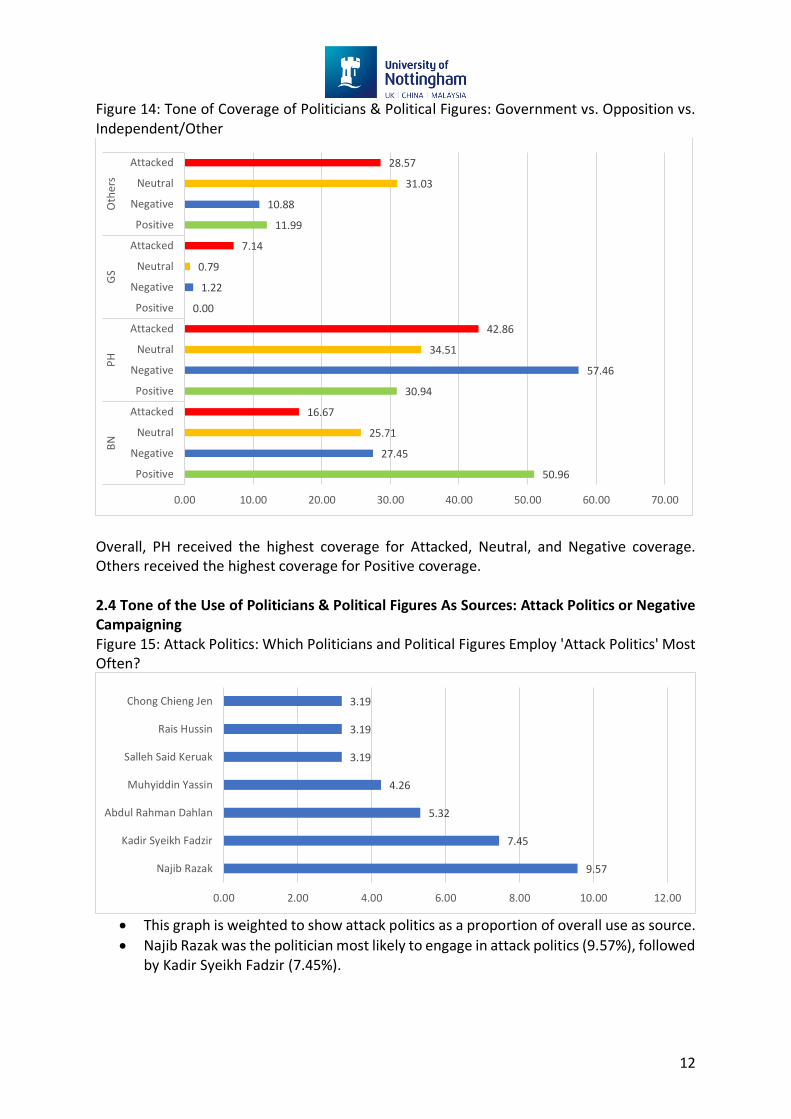
Figure 14: Tone of Coverage of Politicians & Political Figures: Government vs. Opposition vs. Independent/Other
Overall, PH received the highest coverage for Attacked, Neutral, and Negative coverage. Others received the highest coverage for Positive coverage.
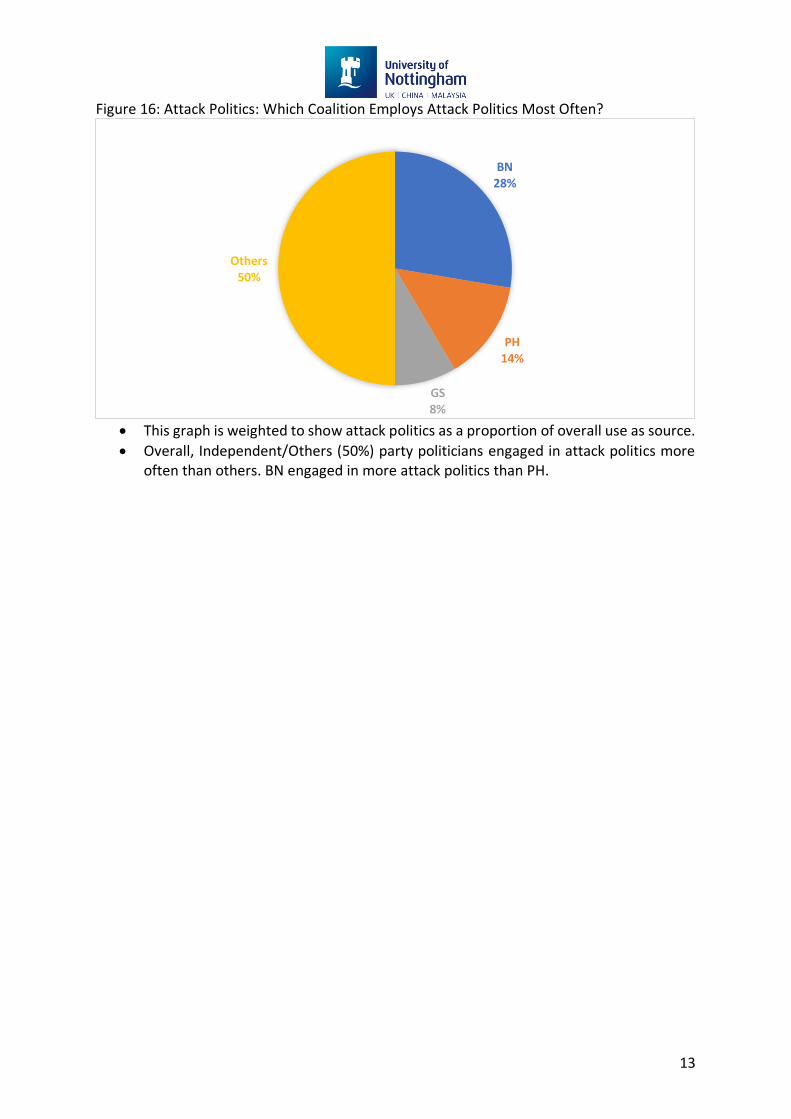
2.4 Tone of the Use of Politicians & Political Figures As Sources: Attack Politics or Negative Campaigning Figure 15: Attack Politics: Which Politicians and Political Figures Employ 'Attack Politics' Most Often?
• This graph is weighted to show attack politics as a proportion of overall use as source.
• Najib Razak was the politician most likely to engage in attack politics (9.57%), followed by Kadir Syeikh Fadzir (7.45%).
50.96
27.45
25.71
16.67
30.94
57.46
34.51
42.86
0.00
1.22
0.79
7.14
11.99
10.88
31.03
28.57
0.00 10.00 20.00 30.00 40.00 50.00 60.00 70.00
Positive
Negative
Neutral
Attacked
Positive
Negative
Neutral
Attacked
Positive
Negative
Neutral
Attacked
Positive
Negative
Neutral
Attacked
BN
PH
GS
Oth
ers
9.57
7.45
5.32
4.26
3.19
3.19
3.19
0.00 2.00 4.00 6.00 8.00 10.00 12.00
Najib Razak
Kadir Syeikh Fadzir
Abdul Rahman Dahlan
Muhyiddin Yassin
Salleh Said Keruak
Rais Hussin
Chong Chieng Jen
13
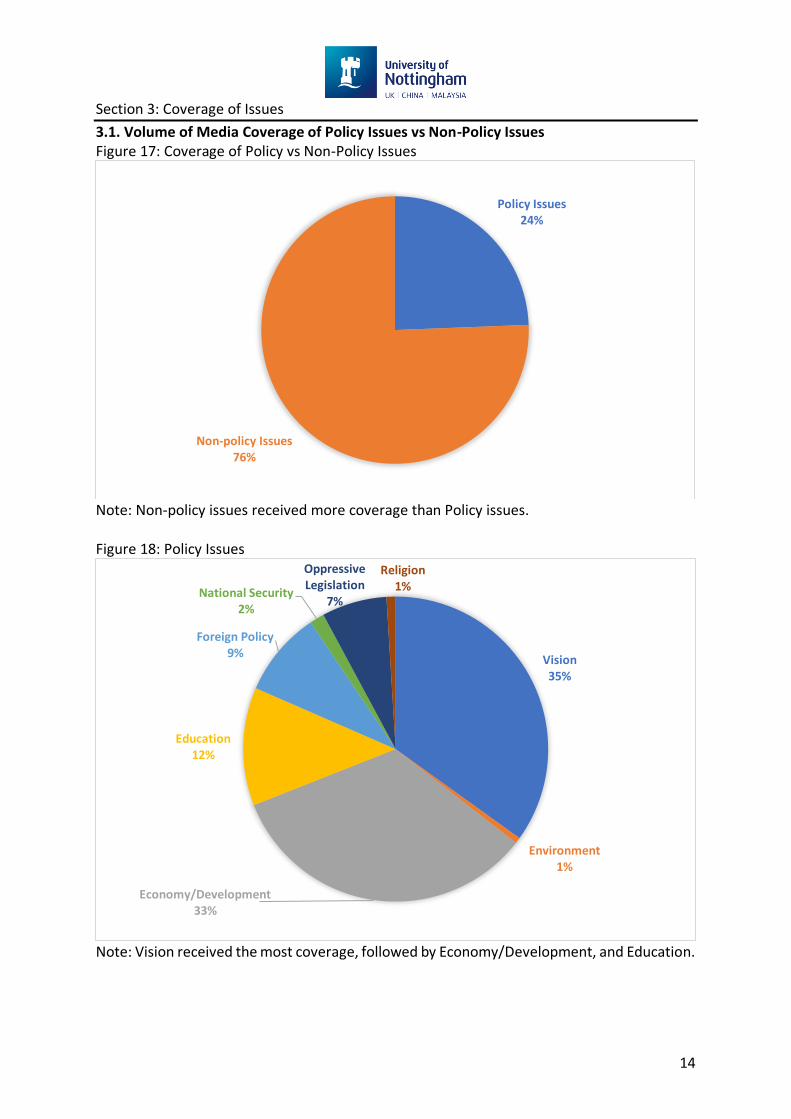
Figure 16: Attack Politics: Which Coalition Employs Attack Politics Most Often?
• This graph is weighted to show attack politics as a proportion of overall use as source.
• Overall, Independent/Others (50%) party politicians engaged in attack politics more often than others. BN engaged in more attack politics than PH.
BN28%
PH14%
GS8%
Others50%
14
Section 3: Coverage of Issues
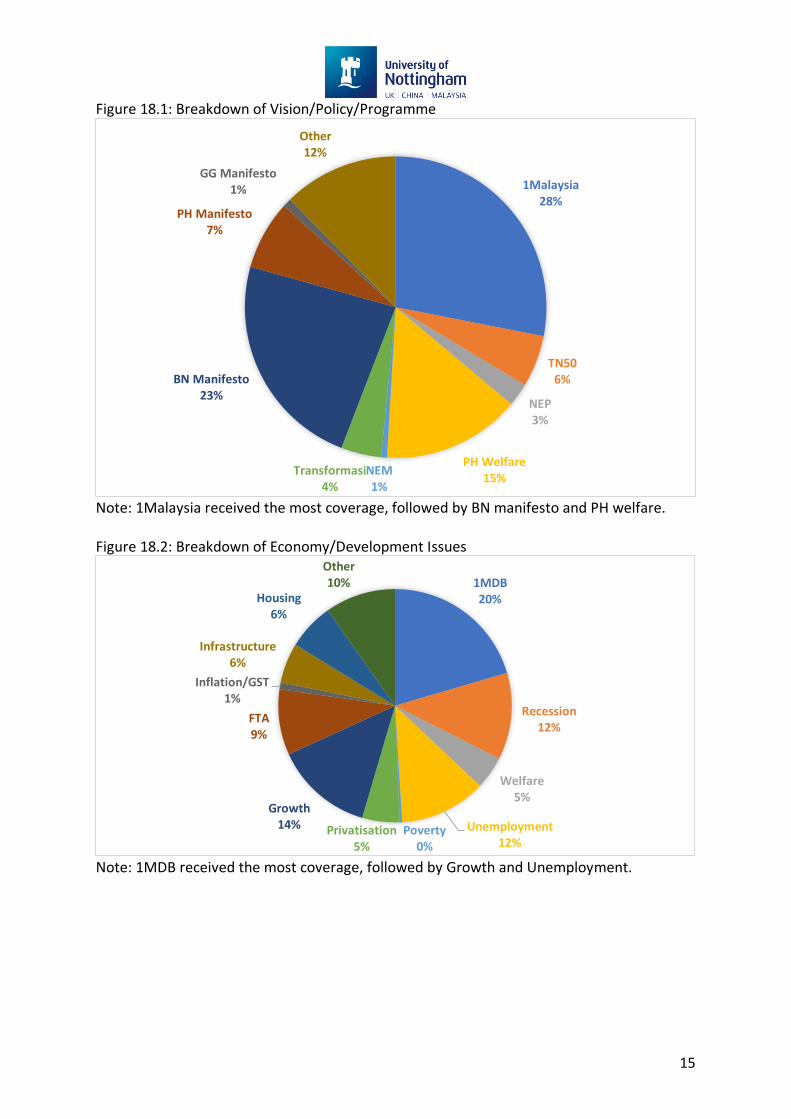
3.1. Volume of Media Coverage of Policy Issues vs Non-Policy Issues Figure 17: Coverage of Policy vs Non-Policy Issues
Note: Non-policy issues received more coverage than Policy issues. Figure 18: Policy Issues
Note: Vision received the most coverage, followed by Economy/Development, and Education.
Policy Issues24%
Non-policy Issues76%
Vision35%
Environment1%
Economy/Development33%
Education12%
Foreign Policy9%
National Security2%
Oppressive Legislation
7%
Religion1%
15
Figure 18.1: Breakdown of Vision/Policy/Programme
Note: 1Malaysia received the most coverage, followed by BN manifesto and PH welfare. Figure 18.2: Breakdown of Economy/Development Issues
Note: 1MDB received the most coverage, followed by Growth and Unemployment.
1Malaysia28%
TN506%
NEP3%
PH Welfare15%
NEM1%
Transformasi4%
BN Manifesto23%
PH Manifesto7%
GG Manifesto1%
Other12%
1MDB20%
Recession12%
Welfare5%
Unemployment12%
Poverty0%
Privatisation5%
Growth14%
FTA9%
Inflation/GST1%
Infrastructure6%
Housing6%
Other10%
16
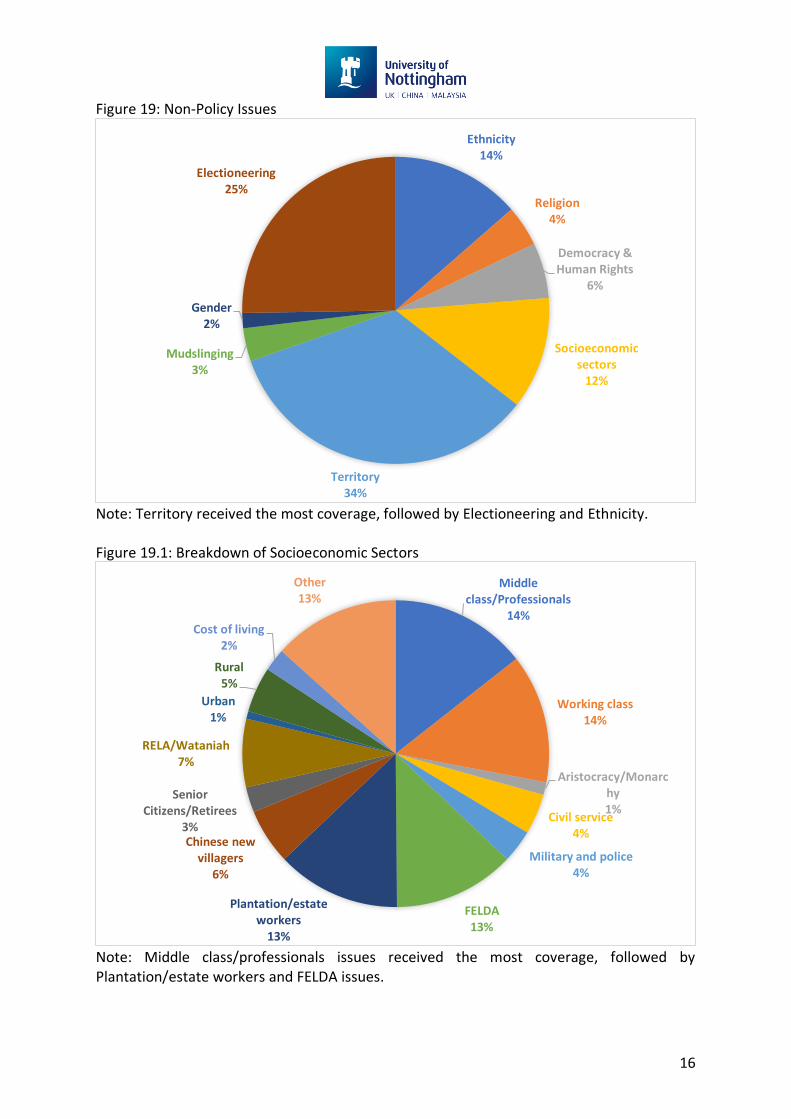
Figure 19: Non-Policy Issues
Note: Territory received the most coverage, followed by Electioneering and Ethnicity. Figure 19.1: Breakdown of Socioeconomic Sectors
Note: Middle class/professionals issues received the most coverage, followed by Plantation/estate workers and FELDA issues.
Ethnicity14%
Religion4%
Democracy & Human Rights
6%
Socioeconomic sectors
12%
Territory34%
Mudslinging3%
Gender2%
Electioneering25%
Middle class/Professionals
14%
Working class14%
Aristocracy/Monarchy1%
Civil service4%
Military and police4%
FELDA13%
Plantation/estate workers
13%
Chinese new villagers
6%
Senior Citizens/Retirees
3%
RELA/Wataniah7%
Urban1%
Rural5%
Cost of living2%
Other13%
17
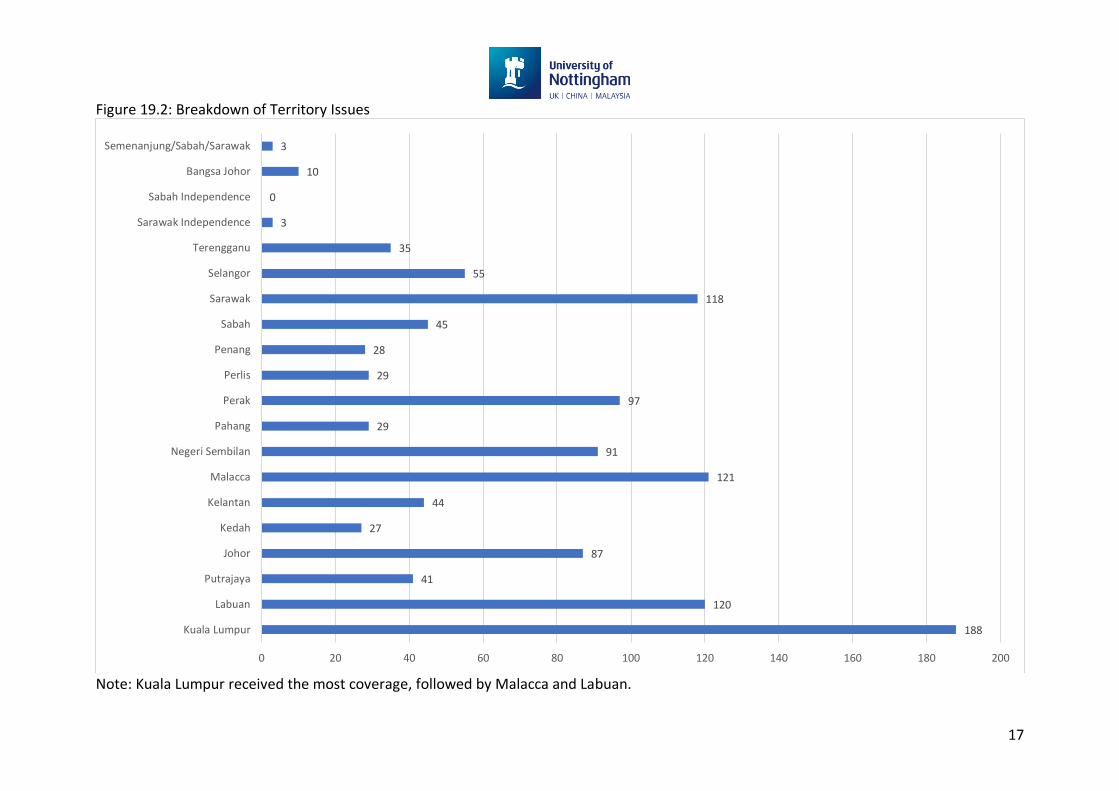
Figure 19.2: Breakdown of Territory Issues
Note: Kuala Lumpur received the most coverage, followed by Malacca and Labuan.
188
120
41
87
27
44
121
91
29
97
29
28
45
118
55
35
3
0
10
3
0 20 40 60 80 100 120 140 160 180 200
Kuala Lumpur
Labuan
Putrajaya
Johor
Kedah
Kelantan
Malacca
Negeri Sembilan
Pahang
Perak
Perlis
Penang
Sabah
Sarawak
Selangor
Terengganu
Sarawak Independence
Sabah Independence
Bangsa Johor
Semenanjung/Sabah/Sarawak