Embed Size (px)
Citation preview
Int. J. of GEOMATE, Sept., 2015, Vol. 9, No. 1 (Sl. No. 17), pp. 1434-1440 Geotech., Const. Mat. and Env., ISSN:2186-2982(P), 2186-2990(O), Japan
WATER BALANCE ANALYSIS CONSIDERING RUNOFF OF UNGAUGED CATCHMENTS IN IWAKI RIVER BASIN,
NORTHERN JAPAN
Soichiro Kageyama1, Shingo Tomiyama2 Makoto Ikeda3 and Hiroyuki Ii4
1,3Mitsubishi Materials Techno Corporation, Japan; 2Mitsubishi Materials Corporation, Japan; 4Faculty of Systems Engineering, Wakayama University, Japan
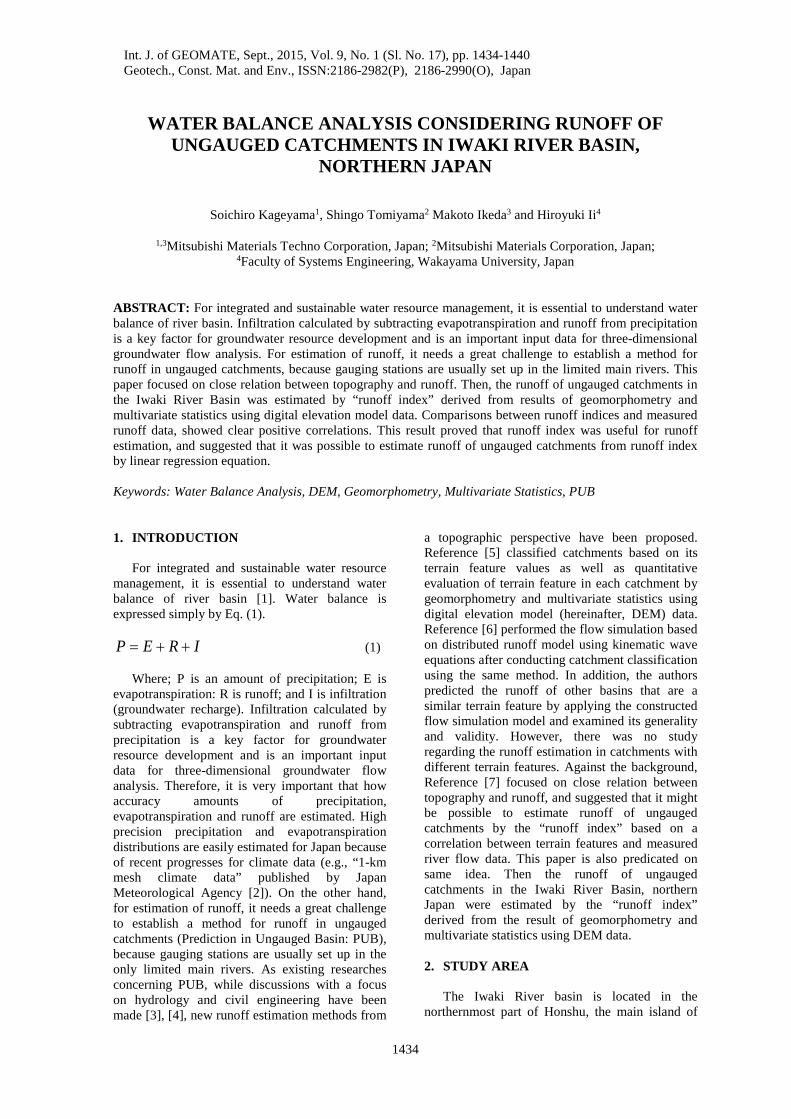
ABSTRACT: For integrated and sustainable water resource management, it is essential to understand water balance of river basin. Infiltration calculated by subtracting evapotranspiration and runoff from precipitation is a key factor for groundwater resource development and is an important input data for three-dimensional groundwater flow analysis. For estimation of runoff, it needs a great challenge to establish a method for runoff in ungauged catchments, because gauging stations are usually set up in the limited main rivers. This paper focused on close relation between topography and runoff. Then, the runoff of ungauged catchments in the Iwaki River Basin was estimated by “runoff index” derived from results of geomorphometry and multivariate statistics using digital elevation model data. Comparisons between runoff indices and measured runoff data, showed clear positive correlations. This result proved that runoff index was useful for runoff estimation, and suggested that it was possible to estimate runoff of ungauged catchments from runoff index by linear regression equation. Keywords: Water Balance Analysis, DEM, Geomorphometry, Multivariate Statistics, PUB 1. INTRODUCTION
For integrated and sustainable water resource
management, it is essential to understand water balance of river basin [1]. Water balance is expressed simply by Eq. (1).
IREP ++= (1)
Where; P is an amount of precipitation; E is
evapotranspiration: R is runoff; and I is infiltration (groundwater recharge). Infiltration calculated by subtracting evapotranspiration and runoff from precipitation is a key factor for groundwater resource development and is an important input data for three-dimensional groundwater flow analysis. Therefore, it is very important that how accuracy amounts of precipitation, evapotranspiration and runoff are estimated. High precision precipitation and evapotranspiration distributions are easily estimated for Japan because of recent progresses for climate data (e.g., “1-km mesh climate data” published by Japan Meteorological Agency [2]). On the other hand, for estimation of runoff, it needs a great challenge to establish a method for runoff in ungauged catchments (Prediction in Ungauged Basin: PUB), because gauging stations are usually set up in the only limited main rivers. As existing researches concerning PUB, while discussions with a focus on hydrology and civil engineering have been made [3], [4], new runoff estimation methods from
a topographic perspective have been proposed. Reference [5] classified catchments based on its terrain feature values as well as quantitative evaluation of terrain feature in each catchment by geomorphometry and multivariate statistics using digital elevation model (hereinafter, DEM) data. Reference [6] performed the flow simulation based on distributed runoff model using kinematic wave equations after conducting catchment classification using the same method. In addition, the authors predicted the runoff of other basins that are a similar terrain feature by applying the constructed flow simulation model and examined its generality and validity. However, there was no study regarding the runoff estimation in catchments with different terrain features. Against the background, Reference [7] focused on close relation between topography and runoff, and suggested that it might be possible to estimate runoff of ungauged catchments by the “runoff index” based on a correlation between terrain features and measured river flow data. This paper is also predicated on same idea. Then the runoff of ungauged catchments in the Iwaki River Basin, northern Japan were estimated by the “runoff index” derived from the result of geomorphometry and multivariate statistics using DEM data. 2. STUDY AREA
The Iwaki River basin is located in the
northernmost part of Honshu, the main island of
1434
Int. J. of GEOMATE, Sept., 2015, Vol. 9, No. 1 (Sl. No. 17), pp. 1434-1440
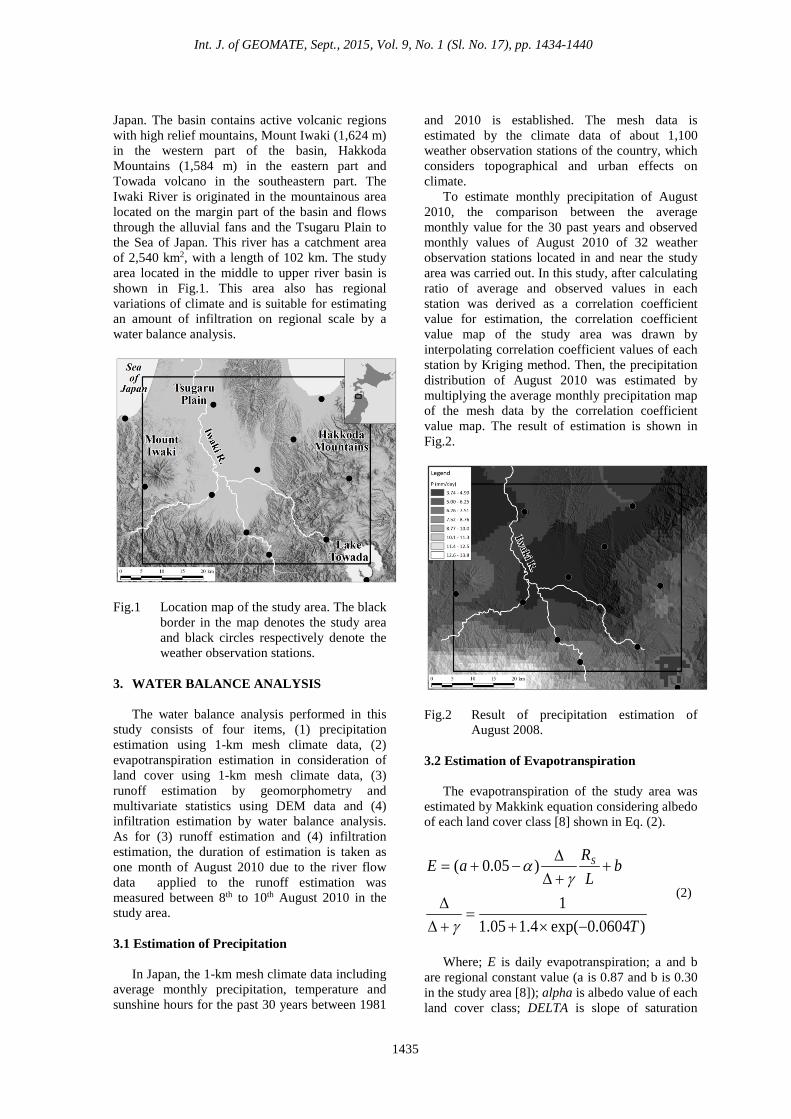
Japan. The basin contains active volcanic regions with high relief mountains, Mount Iwaki (1,624 m) in the western part of the basin, Hakkoda Mountains (1,584 m) in the eastern part and Towada volcano in the southeastern part. The Iwaki River is originated in the mountainous area located on the margin part of the basin and flows through the alluvial fans and the Tsugaru Plain to the Sea of Japan. This river has a catchment area of 2,540 km2, with a length of 102 km. The study area located in the middle to upper river basin is shown in Fig.1. This area also has regional variations of climate and is suitable for estimating an amount of infiltration on regional scale by a water balance analysis.
Fig.1 Location map of the study area. The black border in the map denotes the study area and black circles respectively denote the weather observation stations.
3. WATER BALANCE ANALYSIS
The water balance analysis performed in this
study consists of four items, (1) precipitation estimation using 1-km mesh climate data, (2) evapotranspiration estimation in consideration of land cover using 1-km mesh climate data, (3) runoff estimation by geomorphometry and multivariate statistics using DEM data and (4) infiltration estimation by water balance analysis. As for (3) runoff estimation and (4) infiltration estimation, the duration of estimation is taken as one month of August 2010 due to the river flow data applied to the runoff estimation was measured between 8th to 10th August 2010 in the study area.
3.1 Estimation of Precipitation
In Japan, the 1-km mesh climate data including
average monthly precipitation, temperature and sunshine hours for the past 30 years between 1981
and 2010 is established. The mesh data is estimated by the climate data of about 1,100 weather observation stations of the country, which considers topographical and urban effects on climate.
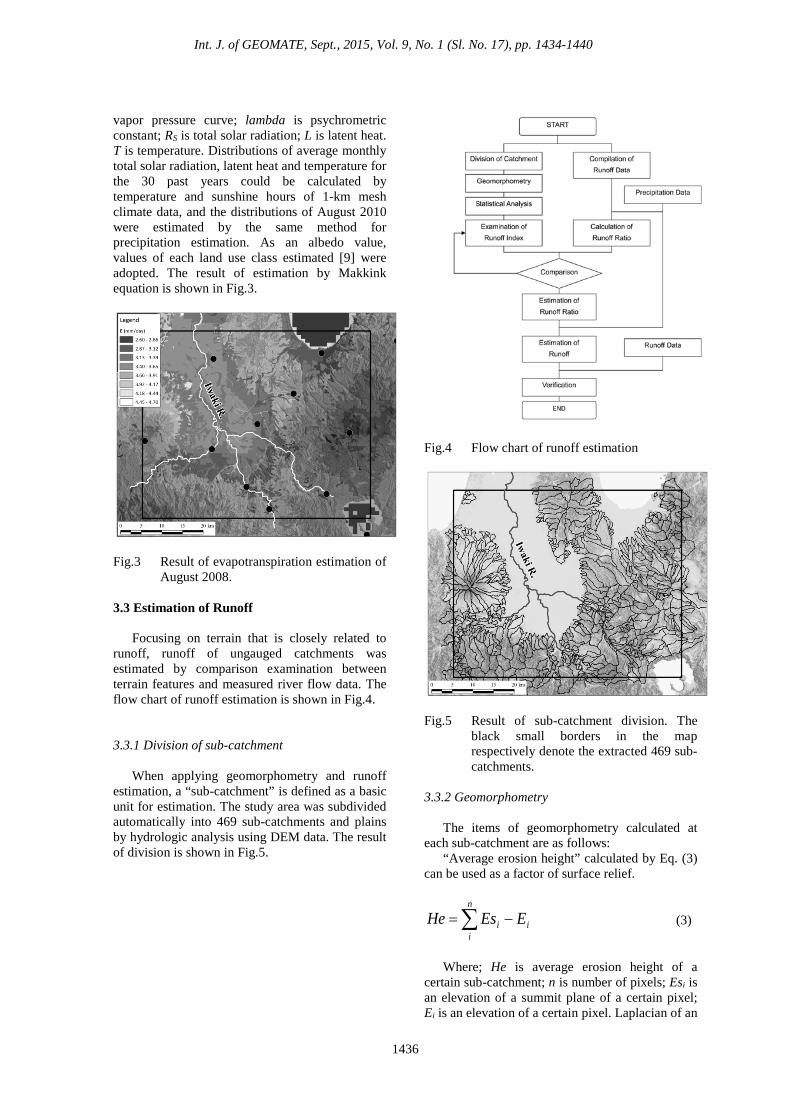
To estimate monthly precipitation of August 2010, the comparison between the average monthly value for the 30 past years and observed monthly values of August 2010 of 32 weather observation stations located in and near the study area was carried out. In this study, after calculating ratio of average and observed values in each station was derived as a correlation coefficient value for estimation, the correlation coefficient value map of the study area was drawn by interpolating correlation coefficient values of each station by Kriging method. Then, the precipitation distribution of August 2010 was estimated by multiplying the average monthly precipitation map of the mesh data by the correlation coefficient value map. The result of estimation is shown in Fig.2.
Fig.2 Result of precipitation estimation of August 2008.
3.2 Estimation of Evapotranspiration
The evapotranspiration of the study area was
estimated by Makkink equation considering albedo of each land cover class [8] shown in Eq. (2).
)0604.0exp(4.105.11
)05.0(
T
bL
RaE S
−×+=
+∆∆
++∆∆
−+=
γ
γα
(2)
Where; E is daily evapotranspiration; a and b
are regional constant value (a is 0.87 and b is 0.30 in the study area [8]); alpha is albedo value of each land cover class; DELTA is slope of saturation
1435
Int. J. of GEOMATE, Sept., 2015, Vol. 9, No. 1 (Sl. No. 17), pp. 1434-1440
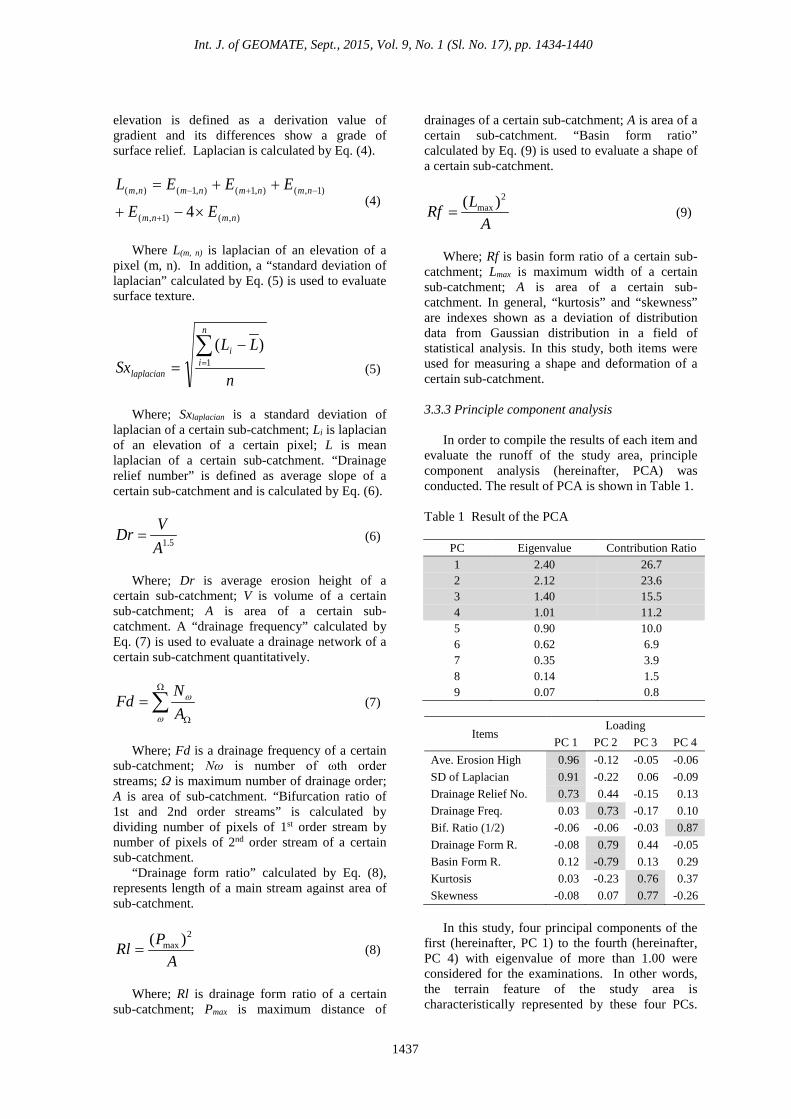
vapor pressure curve; lambda is psychrometric constant; RS is total solar radiation; L is latent heat. T is temperature. Distributions of average monthly total solar radiation, latent heat and temperature for the 30 past years could be calculated by temperature and sunshine hours of 1-km mesh climate data, and the distributions of August 2010 were estimated by the same method for precipitation estimation. As an albedo value, values of each land use class estimated [9] were adopted. The result of estimation by Makkink equation is shown in Fig.3.
Fig.3 Result of evapotranspiration estimation of August 2008.
3.3 Estimation of Runoff
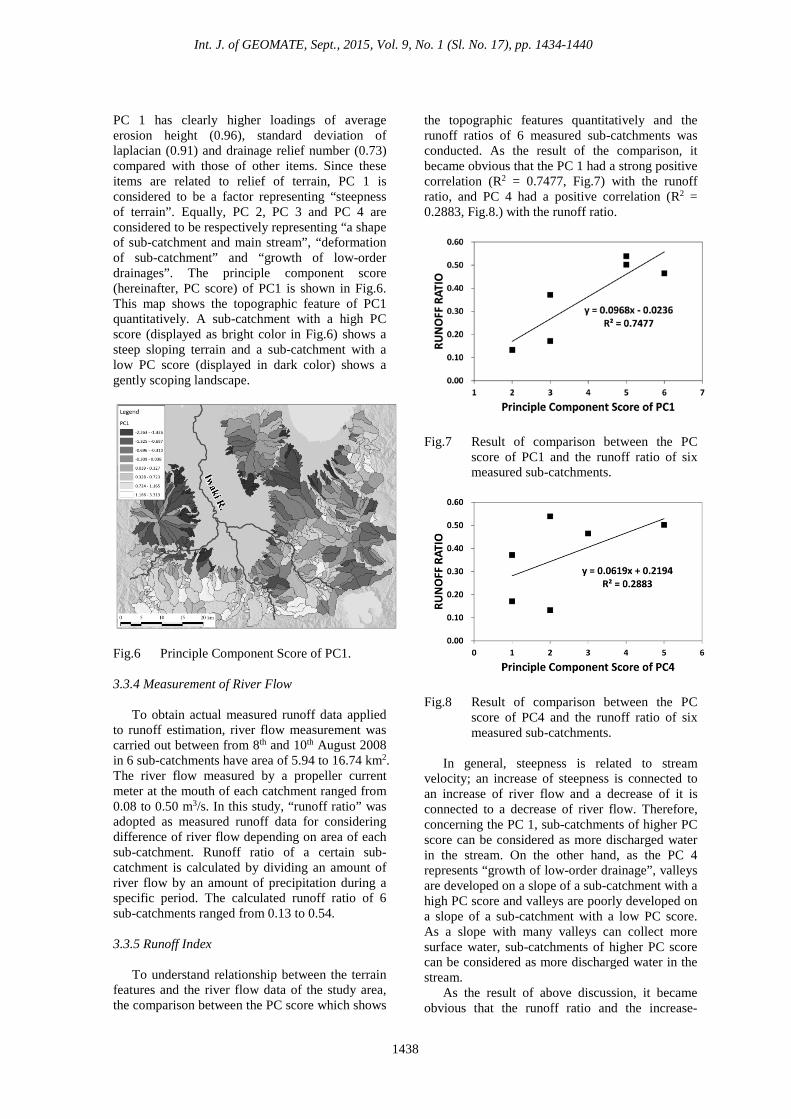
Focusing on terrain that is closely related to
runoff, runoff of ungauged catchments was estimated by comparison examination between terrain features and measured river flow data. The flow chart of runoff estimation is shown in Fig.4. 3.3.1 Division of sub-catchment
When applying geomorphometry and runoff
estimation, a “sub-catchment” is defined as a basic unit for estimation. The study area was subdivided automatically into 469 sub-catchments and plains by hydrologic analysis using DEM data. The result of division is shown in Fig.5.
Fig.4 Flow chart of runoff estimation
Fig.5 Result of sub-catchment division. The black small borders in the map respectively denote the extracted 469 sub-catchments.
3.3.2 Geomorphometry
The items of geomorphometry calculated at
each sub-catchment are as follows: “Average erosion height” calculated by Eq. (3)
can be used as a factor of surface relief.
∑ −=n
iii EEsHe (3)
Where; He is average erosion height of a
certain sub-catchment; n is number of pixels; Esi is an elevation of a summit plane of a certain pixel; Ei is an elevation of a certain pixel. Laplacian of an
1436
Int. J. of GEOMATE, Sept., 2015, Vol. 9, No. 1 (Sl. No. 17), pp. 1434-1440
elevation is defined as a derivation value of gradient and its differences show a grade of surface relief. Laplacian is calculated by Eq. (4).
),()1,(
)1,(),1(),1(),(
4 nmnm
nmnmnmnm
EEEEEL
×−+
++=
+
−+− (4)
Where L(m, n) is laplacian of an elevation of a
pixel (m, n). In addition, a “standard deviation of laplacian” calculated by Eq. (5) is used to evaluate surface texture.
n
LLSx
n
ii
laplacian
∑=
−= 1
)( (5)
Where; Sxlaplacian is a standard deviation of
laplacian of a certain sub-catchment; Li is laplacian of an elevation of a certain pixel; L is mean laplacian of a certain sub-catchment. “Drainage relief number” is defined as average slope of a certain sub-catchment and is calculated by Eq. (6).
5.1AVDr = (6)
Where; Dr is average erosion height of a
certain sub-catchment; V is volume of a certain sub-catchment; A is area of a certain sub-catchment. A “drainage frequency” calculated by Eq. (7) is used to evaluate a drainage network of a certain sub-catchment quantitatively.
∑Ω
Ω
=ω
ω
AN
Fd (7)
Where; Fd is a drainage frequency of a certain
sub-catchment; Nω is number of ωth order streams; Ω is maximum number of drainage order; A is area of sub-catchment. “Bifurcation ratio of 1st and 2nd order streams” is calculated by dividing number of pixels of 1st order stream by number of pixels of 2nd order stream of a certain sub-catchment.
“Drainage form ratio” calculated by Eq. (8), represents length of a main stream against area of sub-catchment.
APRl
2max )(
= (8)
Where; Rl is drainage form ratio of a certain
sub-catchment; Pmax is maximum distance of
drainages of a certain sub-catchment; A is area of a certain sub-catchment. “Basin form ratio” calculated by Eq. (9) is used to evaluate a shape of a certain sub-catchment.
ALRf
2max )(
= (9)
Where; Rf is basin form ratio of a certain sub-
catchment; Lmax is maximum width of a certain sub-catchment; A is area of a certain sub-catchment. In general, “kurtosis” and “skewness” are indexes shown as a deviation of distribution data from Gaussian distribution in a field of statistical analysis. In this study, both items were used for measuring a shape and deformation of a certain sub-catchment.
3.3.3 Principle component analysis
In order to compile the results of each item and
evaluate the runoff of the study area, principle component analysis (hereinafter, PCA) was conducted. The result of PCA is shown in Table 1.
Table 1 Result of the PCA
PC Eigenvalue Contribution Ratio 1 2.40 26.7 2 2.12 23.6 3 1.40 15.5 4 1.01 11.2 5 0.90 10.0 6 0.62 6.9 7 0.35 3.9 8 0.14 1.5 9 0.07 0.8
Items Loading
PC 1 PC 2 PC 3 PC 4 Ave. Erosion High 0.96 -0.12 -0.05 -0.06 SD of Laplacian 0.91 -0.22 0.06 -0.09 Drainage Relief No. 0.73 0.44 -0.15 0.13 Drainage Freq. 0.03 0.73 -0.17 0.10 Bif. Ratio (1/2) -0.06 -0.06 -0.03 0.87 Drainage Form R. -0.08 0.79 0.44 -0.05 Basin Form R. 0.12 -0.79 0.13 0.29 Kurtosis 0.03 -0.23 0.76 0.37 Skewness -0.08 0.07 0.77 -0.26
In this study, four principal components of the
first (hereinafter, PC 1) to the fourth (hereinafter, PC 4) with eigenvalue of more than 1.00 were considered for the examinations. In other words, the terrain feature of the study area is characteristically represented by these four PCs.
1437
Int. J. of GEOMATE, Sept., 2015, Vol. 9, No. 1 (Sl. No. 17), pp. 1434-1440
PC 1 has clearly higher loadings of average erosion height (0.96), standard deviation of laplacian (0.91) and drainage relief number (0.73) compared with those of other items. Since these items are related to relief of terrain, PC 1 is considered to be a factor representing “steepness of terrain”. Equally, PC 2, PC 3 and PC 4 are considered to be respectively representing “a shape of sub-catchment and main stream”, “deformation of sub-catchment” and “growth of low-order drainages”. The principle component score (hereinafter, PC score) of PC1 is shown in Fig.6. This map shows the topographic feature of PC1 quantitatively. A sub-catchment with a high PC score (displayed as bright color in Fig.6) shows a steep sloping terrain and a sub-catchment with a low PC score (displayed in dark color) shows a gently scoping landscape.
Fig.6 Principle Component Score of PC1.
3.3.4 Measurement of River Flow To obtain actual measured runoff data applied
to runoff estimation, river flow measurement was carried out between from 8th and 10th August 2008 in 6 sub-catchments have area of 5.94 to 16.74 km2. The river flow measured by a propeller current meter at the mouth of each catchment ranged from 0.08 to 0.50 m3/s. In this study, “runoff ratio” was adopted as measured runoff data for considering difference of river flow depending on area of each sub-catchment. Runoff ratio of a certain sub-catchment is calculated by dividing an amount of river flow by an amount of precipitation during a specific period. The calculated runoff ratio of 6 sub-catchments ranged from 0.13 to 0.54.
3.3.5 Runoff Index
To understand relationship between the terrain
features and the river flow data of the study area, the comparison between the PC score which shows
the topographic features quantitatively and the runoff ratios of 6 measured sub-catchments was conducted. As the result of the comparison, it became obvious that the PC 1 had a strong positive correlation (R2 = 0.7477, Fig.7) with the runoff ratio, and PC 4 had a positive correlation (R2 = 0.2883, Fig.8.) with the runoff ratio.
Fig.7 Result of comparison between the PC score of PC1 and the runoff ratio of six measured sub-catchments.
Fig.8 Result of comparison between the PC score of PC4 and the runoff ratio of six measured sub-catchments.
In general, steepness is related to stream
velocity; an increase of steepness is connected to an increase of river flow and a decrease of it is connected to a decrease of river flow. Therefore, concerning the PC 1, sub-catchments of higher PC score can be considered as more discharged water in the stream. On the other hand, as the PC 4 represents “growth of low-order drainage”, valleys are developed on a slope of a sub-catchment with a high PC score and valleys are poorly developed on a slope of a sub-catchment with a low PC score. As a slope with many valleys can collect more surface water, sub-catchments of higher PC score can be considered as more discharged water in the stream.
As the result of above discussion, it became obvious that the runoff ratio and the increase-
1438
Int. J. of GEOMATE, Sept., 2015, Vol. 9, No. 1 (Sl. No. 17), pp. 1434-1440
decrease rate of river flow were related to terrain features (“steepness of terrain” and “growth of low-order drainage”) in the study area. Therefore, it suggests that the runoff ratio and river flow of the study area can be estimated by evaluating the PC scores which show two terrain features as above. In this study, the “Runoff Index” [7] was calculated as the indicator of river flow on the basis of PC scores of PC 1 and PC 4, and the runoff index was calculated by Eq. (10).
4411 PCPCPCPC WSWSRI ×+×= (10) Where; RI is runoff index; SPCx is a PC score in
PC x; WPCx is weighting of PC x. Weightings of each PC were calculated by Eq. (11).
)()(
4144
4111
PCPCPCPC
PCPCPCPC
CCCWCCCW+÷=+÷=
(11)
Where; CPCx is contribution ratio in PC x in
Table 1. Then, the runoff index map of the study area is shown in Fig.9. In the map, the sub-catchments with high runoff index are presented by bright colors and ones with the low runoff index are shown as dark colors.
Fig.9 Result of runoff index estimation. The black triangles in the map respectively denote the measuring points of 6 sub-catchments. The black quadrangle denotes Kuzukawa Gauging Station and the black border denotes its catchment.
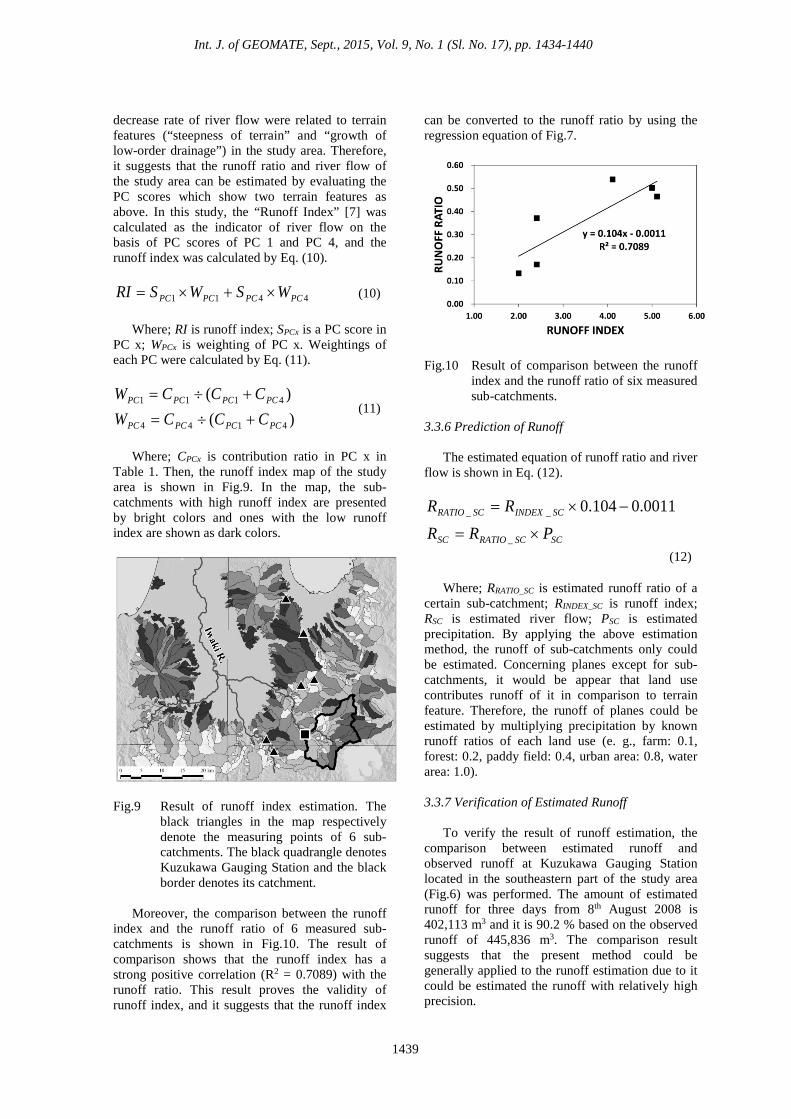
Moreover, the comparison between the runoff
index and the runoff ratio of 6 measured sub-catchments is shown in Fig.10. The result of comparison shows that the runoff index has a strong positive correlation (R2 = 0.7089) with the runoff ratio. This result proves the validity of runoff index, and it suggests that the runoff index
can be converted to the runoff ratio by using the regression equation of Fig.7.
Fig.10 Result of comparison between the runoff index and the runoff ratio of six measured sub-catchments.
3.3.6 Prediction of Runoff
The estimated equation of runoff ratio and river
flow is shown in Eq. (12).
SCSCRATIOSC
SCINDEXSCRATIO
PRRRR
×=
−×=
_
__ 0011.0104.0
(12) Where; RRATIO_SC is estimated runoff ratio of a
certain sub-catchment; RINDEX_SC is runoff index; RSC is estimated river flow; PSC is estimated precipitation. By applying the above estimation method, the runoff of sub-catchments only could be estimated. Concerning planes except for sub-catchments, it would be appear that land use contributes runoff of it in comparison to terrain feature. Therefore, the runoff of planes could be estimated by multiplying precipitation by known runoff ratios of each land use (e. g., farm: 0.1, forest: 0.2, paddy field: 0.4, urban area: 0.8, water area: 1.0).
3.3.7 Verification of Estimated Runoff
To verify the result of runoff estimation, the
comparison between estimated runoff and observed runoff at Kuzukawa Gauging Station located in the southeastern part of the study area (Fig.6) was performed. The amount of estimated runoff for three days from 8th August 2008 is 402,113 m3 and it is 90.2 % based on the observed runoff of 445,836 m3. The comparison result suggests that the present method could be generally applied to the runoff estimation due to it could be estimated the runoff with relatively high precision.
1439
Int. J. of GEOMATE, Sept., 2015, Vol. 9, No. 1 (Sl. No. 17), pp. 1434-1440
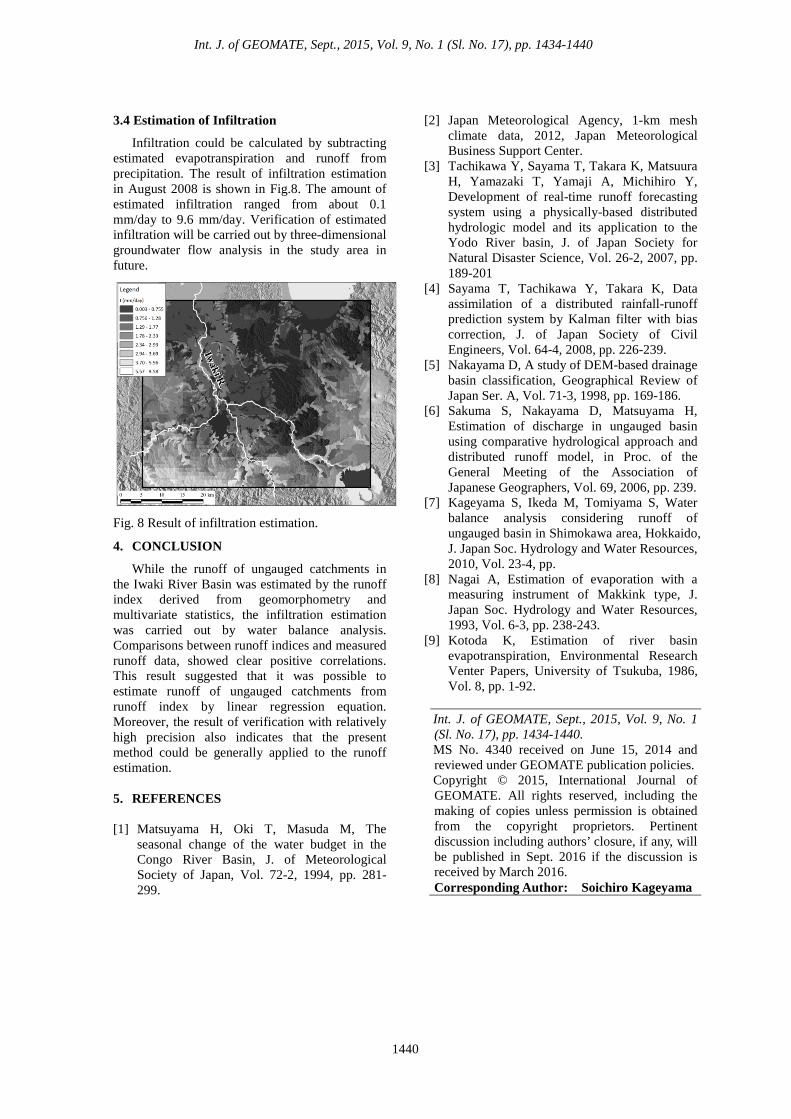
3.4 Estimation of Infiltration Infiltration could be calculated by subtracting
estimated evapotranspiration and runoff from precipitation. The result of infiltration estimation in August 2008 is shown in Fig.8. The amount of estimated infiltration ranged from about 0.1 mm/day to 9.6 mm/day. Verification of estimated infiltration will be carried out by three-dimensional groundwater flow analysis in the study area in future.
Fig. 8 Result of infiltration estimation.
4. CONCLUSION
While the runoff of ungauged catchments in
the Iwaki River Basin was estimated by the runoff index derived from geomorphometry and multivariate statistics, the infiltration estimation was carried out by water balance analysis. Comparisons between runoff indices and measured runoff data, showed clear positive correlations. This result suggested that it was possible to estimate runoff of ungauged catchments from runoff index by linear regression equation. Moreover, the result of verification with relatively high precision also indicates that the present method could be generally applied to the runoff estimation.
5. REFERENCES
[1] Matsuyama H, Oki T, Masuda M, The
seasonal change of the water budget in the Congo River Basin, J. of Meteorological Society of Japan, Vol. 72-2, 1994, pp. 281-299.
[2] Japan Meteorological Agency, 1-km mesh climate data, 2012, Japan Meteorological Business Support Center.
[3] Tachikawa Y, Sayama T, Takara K, Matsuura H, Yamazaki T, Yamaji A, Michihiro Y, Development of real-time runoff forecasting system using a physically-based distributed hydrologic model and its application to the Yodo River basin, J. of Japan Society for Natural Disaster Science, Vol. 26-2, 2007, pp. 189-201
[4] Sayama T, Tachikawa Y, Takara K, Data assimilation of a distributed rainfall-runoff prediction system by Kalman filter with bias correction, J. of Japan Society of Civil Engineers, Vol. 64-4, 2008, pp. 226-239.
[5] Nakayama D, A study of DEM-based drainage basin classification, Geographical Review of Japan Ser. A, Vol. 71-3, 1998, pp. 169-186.
[6] Sakuma S, Nakayama D, Matsuyama H, Estimation of discharge in ungauged basin using comparative hydrological approach and distributed runoff model, in Proc. of the General Meeting of the Association of Japanese Geographers, Vol. 69, 2006, pp. 239.
[7] Kageyama S, Ikeda M, Tomiyama S, Water balance analysis considering runoff of ungauged basin in Shimokawa area, Hokkaido, J. Japan Soc. Hydrology and Water Resources, 2010, Vol. 23-4, pp.
[8] Nagai A, Estimation of evaporation with a measuring instrument of Makkink type, J. Japan Soc. Hydrology and Water Resources, 1993, Vol. 6-3, pp. 238-243.
[9] Kotoda K, Estimation of river basin evapotranspiration, Environmental Research Venter Papers, University of Tsukuba, 1986, Vol. 8, pp. 1-92.
Int. J. of GEOMATE, Sept., 2015, Vol. 9, No. 1 (Sl. No. 17), pp. 1434-1440. MS No. 4340 received on June 15, 2014 and reviewed under GEOMATE publication policies. Copyright © 2015, International Journal of GEOMATE. All rights reserved, including the making of copies unless permission is obtained from the copyright proprietors. Pertinent discussion including authors’ closure, if any, will be published in Sept. 2016 if the discussion is received by March 2016. Corresponding Author: Soichiro Kageyama
1440