Embed Size (px)
Citation preview

WATER SAVING AND YIELD WATER SAVING AND YIELD ENHANCING TECHNOLOGIES:ENHANCING TECHNOLOGIES:
How far can they contribute to water How far can they contribute to water productivity enhancement in Indian productivity enhancement in Indian
Agriculture?Agriculture?
M. Dinesh Kumar, Madar M. Dinesh Kumar, Madar Samad, Upali Amarasinghe Samad, Upali Amarasinghe
and O. P. Singh and O. P. Singh

Introduction Introduction
• The spread of water-saving irrigation The spread of water-saving irrigation technologies is very low in Indiatechnologies is very low in India
• The objectives:The objectives:– to analyze the potential of water saving to analyze the potential of water saving
technologies in terms of spread and in terms technologies in terms of spread and in terms of enhancement in water productivityof enhancement in water productivity
– To analyze the institutional and policy optionsTo analyze the institutional and policy options
• The Study to bank on knowledge and The Study to bank on knowledge and expertise on this technologies and their expertise on this technologies and their impacts, the extensive literature availableimpacts, the extensive literature available

Nature of Water Saving for Different Crops under Different Types of Nature of Water Saving for Different Crops under Different Types of Efficient Irrigation TechnologiesEfficient Irrigation Technologies
Sr. No
Name of Water-Saving and Yield Enhancing Irrigation Technology
Names of crops for which the technology can be used ideally
Nature of Saving in Applied Water
1 Pressurized drip systems (inline and on-line drippers, drip taps)
All fruit crops; cotton; castor; fennel; maize; coconut; aracnut; chilly; cauliflower; cabbage; ladies finger; tomatoes; brinjal; gourds; mulberry; sugarcane; water melon; flowers
1. Reduces non-beneficial evaporation (E) from the area not covered by canopy
2. Reduces deep percolation3. Water saving also comes from reduction in evaporation from fallow after
harvest4. Extent of water saving higher during initial stages of plant growth 5. Yield growth significant
2 Overhead sprinklers (including sprinkler guns)
Wheat; pearl millet; sorghum; cumin; mustard; cow pea; chick pea
1.Reduces the losses in conveyance 2. Improves the distribution efficiency slightly3. Reduces deep percolation3. Yield growth marginal
3 Micro sprinklers Potato; ground nut; alfalfa; 1. Reduces the seepage and evaporation losses in conveyance through open channels.
2. Reduces deep percolation over furrow irrigation and small border irrigation
3. Yield growth significant
4 Plastic mulching Potato; ground nut; cotton; castor; fennel; brinjal; chilly; cauliflower; cabbage; ladies finger; flowers
1. Completes checks the evaporation component of ET2. Stops non-beneficial evaporation (E)3. Extent of water saving higher over drip irrigation4. Faster germination and significant yield growth
5 Green houses All vegetables, high valued fruits such as strawberry; and exotic flowers
1. Controls the ambient temperature and humidity, 2. checks the wind, thereby reducing transpirative demand of plant.3. The water-saving is highest as compared to other technologies 4. Substantial yield growth
6 Micro tube drips All horticultural crops 1.Reduces non-beneficial evaporation2. Distribution uniformity is poor and depends on number of micro tubes on
a lateral

Current Contribution of Water Current Contribution of Water Saving TechnologiesSaving Technologies
• Present spread of water-saving irrigation Present spread of water-saving irrigation technologies in Indian agriculturetechnologies in Indian agriculture– 9.18 lac ha under sprinklers9.18 lac ha under sprinklers– 2.6 under drip systems2.6 under drip systems– Rate of adoption of MI system during 2001-05Rate of adoption of MI system during 2001-05
• Contribution of water-saving technologies Contribution of water-saving technologies in Indian river basinsin Indian river basins – Physical impact of WSTs on Water Demand DriversPhysical impact of WSTs on Water Demand Drivers
• Area and cropping systemsArea and cropping systems• Efficiency Efficiency • Water Saving and Water Productivity Water Saving and Water Productivity • Return flows Return flows • Aggregate water consumption from the system in crop Aggregate water consumption from the system in crop
productionproduction– Economic impactsEconomic impacts
Potential Future Potential Future Improvements in Water Improvements in Water
Productivity through Productivity through WSTs… WSTs…
• Opportunities and Constraints in Adoption of Opportunities and Constraints in Adoption of Water-Saving Irrigation TechnologiesWater-Saving Irrigation Technologies – Physical Constraints in Adopting in Water Saving Physical Constraints in Adopting in Water Saving
Technologies Technologies – Physical Opportunities for Creating “Wet Water”Physical Opportunities for Creating “Wet Water”– Socioeconomic and Institutional ConstraintsSocioeconomic and Institutional Constraints– Socioeconomic and Institutional Opportunities for Water Socioeconomic and Institutional Opportunities for Water
Saving TechnologiesSaving Technologies• Crops Conducive to Water-Saving TechnologiesCrops Conducive to Water-Saving Technologies
• Water-scarce River Basins that can benefit Water-scarce River Basins that can benefit from WSTsfrom WSTs
• Area that can be brought under Water-Saving Area that can be brought under Water-Saving Irrigation TechnologiesIrrigation Technologies

Potential Potential improvements…improvements…
• Basins Conducive to Water-Saving Basins Conducive to Water-Saving Irrigation TechnologiesIrrigation Technologies from adoption from adoption perspectiveperspective– West flowing rivers north of Tapi in Gujarat and West flowing rivers north of Tapi in Gujarat and
RajasthanRajasthan– Sabarmati, Banas, Narmada Sabarmati, Banas, Narmada – East flowing rivers of Peninsular IndiaEast flowing rivers of Peninsular India– MahanadiMahanadi– Parts of Indus basinParts of Indus basin
• Quantification of Actual System-Level Quantification of Actual System-Level Water-use and Water-saving ImpactsWater-use and Water-saving Impacts

Enabling environment for Enabling environment for spreading water saving spreading water saving
technologiestechnologies • Analysis of Existing Water & Energy PoliciesAnalysis of Existing Water & Energy Policies
– Crop area based pricing of surface water for Crop area based pricing of surface water for irrigation; irrigation;
– Un-scientific water delivery schedules followed Un-scientific water delivery schedules followed in irrigation systems; in irrigation systems;
– Flat rate system of pricing of electricity or free Flat rate system of pricing of electricity or free electricity followed by many Indian states for electricity followed by many Indian states for farm sector; farm sector;
– Power supply restrictions for farm sector Power supply restrictions for farm sector (constraint in expanding area under irrigation)(constraint in expanding area under irrigation)

Enabling environment…Enabling environment…
• Institutional and Policy AlternativesInstitutional and Policy Alternatives– Pro rata pricing of electricityPro rata pricing of electricity– Metering & cash incentivesMetering & cash incentives– High quality powerHigh quality power– Reforms in the administration of subsidyReforms in the administration of subsidy
• What do we do in Canal Command Areas?What do we do in Canal Command Areas?– Delivery system design (advanced stage of system design Delivery system design (advanced stage of system design
like in Israel)like in Israel)– Efficient pricingEfficient pricing– Proper incentive for creating intermediate storages as Proper incentive for creating intermediate storages as
alternativealternative


Rate of Adoption of MI Systems during Rate of Adoption of MI Systems during 2001-05 Under Various Programmes2001-05 Under Various ProgrammesSr. No.
Name of State Area Under Micro Irrigation Systems in the year
2001-02 2002-03 2003-04 2004-05 Total
1 Andhra Pradesh 9117 4227 12 4200 17556
2 Arunachal Pradesh 110 100 248 500 958
3 Assam 22 16 17 350 405
4 Bihar 500 141 0 0 641
5 Chhatisgarh 444 227 0 100 771
6 Goa 70 48 0 305 423
7 Gujarat 2130 2109 1035 3650 8924
8 Haryana 226 0 236 230 692
9 Karnataka 9480 397 2635 4219 16731
10 Kerala 939 457 180 488.88 2064.88
11 Madhya Pradesh 1190 1007 200 375 2772
12 Maharashtra 14391 6875 248 844 22358
13 Orissa 250 0 285 650 1185
14 Rajasthan 1400 1000 1700 1200 5300
15 Tamil Nadu 814 635 25 1986 3460
16 Tripura 118 0 278 300 696
17 Uttar Pradesh 454 264 0 235 953
India Total 42173 17928 7329 20441.88 87871.88

Irrigation Efficiencies under DifferIrrigation Efficiencies under Different Methods of Irrigationent Methods of Irrigation
Irrigation Efficiencies Method of Irrigation
Surface Sprinkler
Drip
Conveyance Efficiency 40-50 (canal)
60-70 (well)
Application Efficiency 60-70 70-80 90
Surface water moisture evaporation
30-40 30-40 20-25
Overall efficiency 30-35 50-60 80-90

Impact of Drip Irrigation on Applied Impact of Drip Irrigation on Applied Water, Yield and Applied Water Water, Yield and Applied Water Productivity in Castor in MankaProductivity in Castor in Manka
Plot No.
Method of Irrigation
Agronomic Practices
Plot Size (M2)
Plant Distance [R x P] (m)
No. of Watering
Water Application Rate (mm/ irrigation)
Per Sq. Meter Area
Water use (m3)
Production (Kg)
Water Productivity (kg/m3)
C - 1
Micro-tube P M
1110 4 x 2 96 2.09 0.201 0.135 0.67
C - 2
Micro-tube O M
1110 4 x 2 96 2.35 0.225 0.099 0.44
C - 3
Micro-tube
1110 4 x 2 96 3.14 0.302 0.113 0.37
C - 4
Flooding
1110 4 x 2 9 40.64 0.366 0.126 0. 34
PM = Plastic Mulching; OM = Organic Mulching
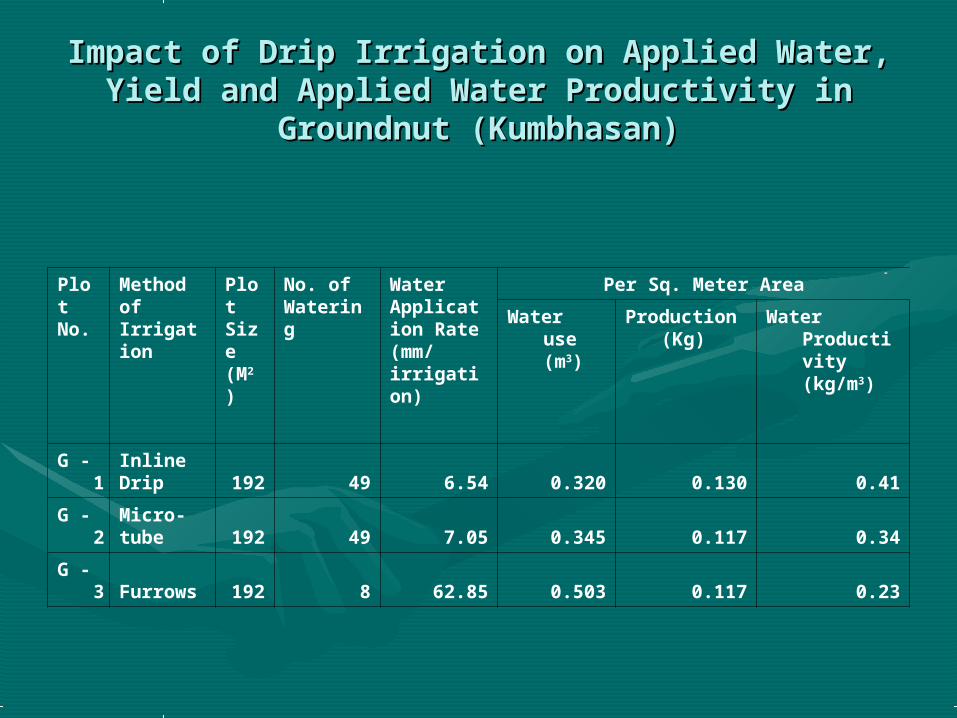
Impact of Drip Irrigation on Applied Water, Impact of Drip Irrigation on Applied Water, Yield and Applied Water Productivity in Yield and Applied Water Productivity in
Groundnut (Kumbhasan)Groundnut (Kumbhasan)
Plot No.
Method of Irrigation
Plot Size (M2
)
No. of Watering
Water Application Rate (mm/ irrigation)
Per Sq. Meter Area
Water use (m3)
Production (Kg)
Water Productivity (kg/m3)
G - 1
Inline Drip 192 49 6.54 0.320 0.130 0.41
G - 2
Micro-tube 192 49 7.05 0.345 0.117 0.34
G - 3 Furrows 192 8 62.85 0.503 0.117 0.23

Impact of Drip Irrigation on Applied WaImpact of Drip Irrigation on Applied Water, Yield and Applied Water Productivitter, Yield and Applied Water Productivity in Potato (Manka)y in Potato (Manka)
Plot No. Method of Irrigation
Plot Size (M2)
WST (cm)
No. of Watering
Water Application Rate (mm/ irrigation)
Per Sq. Meter Area
Water use (m3)
Production (Kg)
Water Productivity (kg/m3)
P - 1 Inline drip 304 52.5 x 30 56 7.50 0.420 0.375 0.893
P - 2 Easy drip 304 52.5 x 30 56 7.50 0.420 0.411 0.979
P - 3Micro-tube drip 304 52.5 x 30 56 7.50 0.420 0.148 0.352
P - 4Micro-Sprinkler 304
310 x 290 59 15.96 0.942 1.316 1.397
P - 5Mini-Sprinkler 304
730 x 720 59 15.96 0.942 0.905 0.961
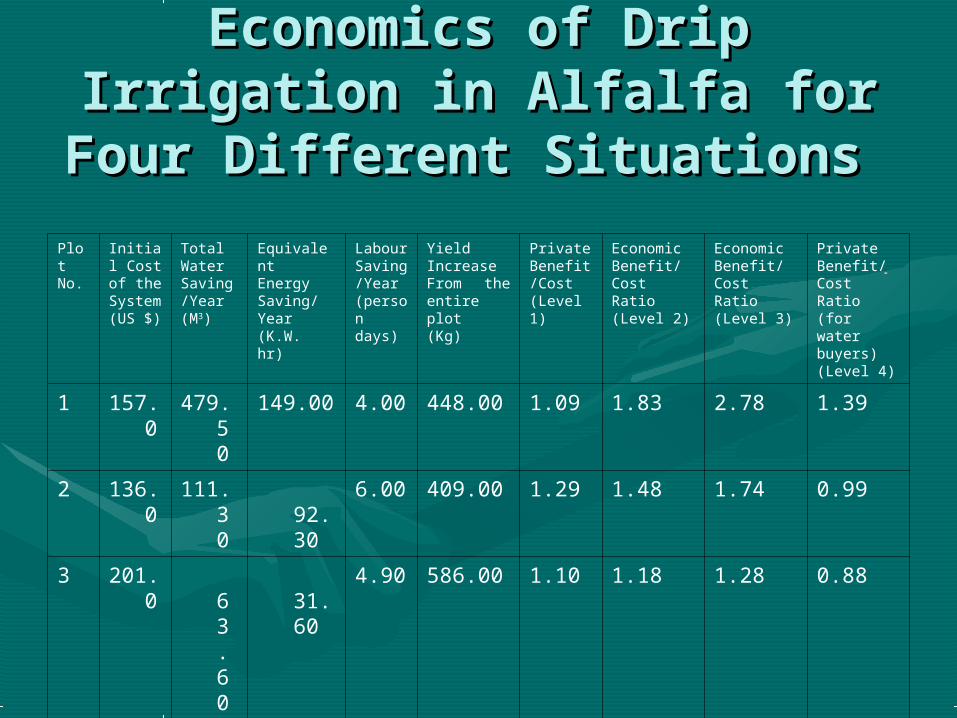
Economics of Drip Economics of Drip Irrigation in Alfalfa for Irrigation in Alfalfa for
Four Different Situations Four Different Situations
Plot No.
Initial Cost of the System(US $)
Total Water Saving/Year(M3)
Equivalent Energy Saving/Year(K.W. hr)
Labour Saving /Year(person days)
Yield IncreaseFrom the entire plot(Kg)
Private Benefit/Cost(Level 1)
Economic Benefit/Cost Ratio(Level 2)
Economic Benefit/Cost Ratio(Level 3)
Private Benefit/Cost Ratio(for water buyers)(Level 4)
1 157.0
479.50
149.00 4.00 448.00 1.09 1.83 2.78 1.39
2 136.0
111.30
92.30 6.00 409.00 1.29 1.48 1.74 0.99
3 201.0
63.60
31.60 4.90 586.00 1.10 1.18 1.28 0.88
4 168.0
468.00
232.80 6.00 414.00 1.05 1.73 2.59 1.33

Figure 1: Total Water Use Vs Own Irrigation
0.00
500.00
1000.00
1500.00
2000.00
2500.00
3000.00
3500.00
1 2 3 4 5 6 7 8 9 10 11 12 13 14 15 16 17 18 19 20
Hou
rs o
f W
ater
Sal
e
Total Hours of Water Use
Hours of Water Use for Irrigating Own Farm

Crops conducive to WSTsCrops conducive to WSTsCrop Category Different crops conducive for
WSTsType of WSTs that can be
usedRegions*
Tree crops and orchards
Mango, Guava, Gooseberry, Pomegranate, Sapote, Orange, Coconut, Banana, Date palm, Grapes, Papaya, Citrus and Kinnow, Drumstick
Drips (for all); and also Sprinklers (Banana, Mango) and plastic mulching in case of extreme water stress
Maharashtra, Andhra Pradesh, Kerala, Karnataka, Tamil Nadu, and Punjab
Row field crops Potato and Groundnut Drips; and also mulching (for groundnut and potato)
Gujarat, Maharashtra and Punjab
Plantation Crops
Coconut, Coffee, Tea, Teak Drips (for coconut and teak); and sprinklers (for tea and coffee)
Kerala and Karnataka (coconut, tea and coffee), Orissa (tea); Tamil Nadu (coconut)
Field Crops Wheat, Pearl millet, Sorghum, Maize, Alfalfa, Mustard
Overhead sprinklers (wheat, pearl millet, maize and sorghum) and mini and micro sprinklers for alfalfa
Punjab, Haryana, Gujarat, Maharashtra, Rajasthan and Madhya Pradesh, Andhra Pradesh, and Karnataka
Fruit/Vegetables
Tomatoes, Brinjal, Gourds, Chilly, Cabbage, Cauliflower, Strawberry
Drips, and plastic mulching Maharashtra, Gujarat, Rajasthan, Andhra Pradesh, Tamil Nadu, Karnataka
Cash crops Cotton, Fennel, Castor, Sugarcane, Vanilla and Cumin
Drips for sugarcane; fogger sprinklers for Vanilla; and micro sprinklers for cumin
Maharashtra, Tamil Nadu and Gujarat (for cotton, sugarcane and ground nut), Gujarat for cumin and fennel, and Kerala for vanilla

Estimated Area under Crops Estimated Area under Crops Conducive to Water Saving Conducive to Water Saving
Irrigation TechnologiesIrrigation TechnologiesSr. No. Name of the State Total Area under
crops conducive to WSTs
Percentage Area under the Crop
1 Andhra Pradesh 557,000 21.8
2 Bihar 192000 6.94
3 Gujarat 1327000 48.23
4 Haryana 374000 14.43
5 Himachal Pradesh 2000 8.28
6 Jammu and Kashmir 0 0
7 Karnataka 449000 39.61
8 Kerala 60000 43.23
9 Madhya Pradesh 241000 8.2
10 Maharashtra 1012000 42.38
11 Orissa 112000 13.12
12 Punjab 600000 9.8
13 Rajasthan 533000 12.27
14 Tamil Nadu 582000 33.23
15 Uttar Pradesh 1884000 14.86
16 West Bengal 5000 0.23
Total 79,30,000 17.45*

Aggregate Saving in Water Aggregate Saving in Water Possible with Drip Irrigation Possible with Drip Irrigation
SystemsSystems
Sr. No
Name of Crop
Current Yield
(ton/ha)
Expected Yield Coming from the Potential States*(Million ton)
Water Use Efficiency(Kg/m3)
Modified Water Use Efficiency(Kg/m3)
Water Saving
(BCM)
1 Sugarcane 128.0 170.0 5.950 18.09 31.00
2 Cotton 2.600 4.391 0.303 1.080 10.42
3 Groundnut 1.710 2.840 0.340 0.950 1.453
4 Potato 23.57 34.47 11.79 17.21 0.127
5 Castor 1.260 1.350 0.340 0.670 0.497
6 Onion 9.300 12.20 1.544 2.700 0.963
7 Total 44.46