Embed Size (px)
Citation preview

Direction de l’Ingénierie, de la Technologie et de l’InformatiqueGénie OcéaniqueSystèmes et Ouvrages en Mer
Marc PREVOSTO
Mars 1995 - DITI/GO/SOM 95-99
Tâche 2.1: The high frequency tail of the wave spectrum- Greek site data base analysis -
WAVEMOD

Rapport numéro
Titre :
Date :
Nbre pages :
Nbre figures :
Projet IFREMER N0 :Intitulé :
Auteur(s) :
Origine :
Résumé :
Mots-clés :
Diffusion :
Ce document, propriété de l’IFREMER, ne peut être reproduit ou communiqué sans son autorisation
INSTITUT FRANCAIS DE RECHERCHE POUR L’EXPLOITATION DE LA MER (IFREMER) - 155, rue Jean-Jacques Rousseau, - 92138 Issy-Les-Moulinaux Cedex - Tel : (1) 46 48 21 00
DITI/GO/ SOM 95-99
The high frequency tail of the wave spectrum- Greek site data base analysis -
25/03/95
24
2
Marc PREVOSTO
DITI/GO/SOM
340621MAST2 Contract CT92/0025 - WAVEMODReport TEC 2.1-06 (0)
Ce document s’inscrit dans le sous-projet 2 et la tâche 2.1 du projet WAVEMOD.Subproject 1: Short-Term Models.Task 2.3 : Model for Point Spectrum
L’ajustement de modèles de queue de spectre a été réalisé par plusieurs partenaires du projet surdifférentes bases de données pour comparaison et analyse. Dans ce rapport les résultats obtenussur la base de donnée du site grec sont décrits. Une particulière attention a été donnée aux phénomènes modificateurs de la forme spectrale: mesu-re par bouée ou au point fixe, filtrage. L’importante évolution de la pente du spectre fréquentiel en fonction de la fréquence, ceci dû à laprofondeur finie, est montrée et indique que l’ajustement des queues de spectre devrait s’effectuersur les spectres transformés en nombre d’onde.
Houle, modèle spectral, mesure, bouée
Restreinte aux partenaires du projet

IST - IFREMER - LHF - MARTEDEC - NTUA - SINTEF - OCEANOR - PCM - DUT
MAST2 Contract CT92/0025 - WAVEMOD
PROBABILISTIC METHODOLOGY FOR COASTAL SITE INVESTIGATIONBASED ON STOCHASTIC MODELLING OF WAVES AND CURRENTS
Project document classification code: Performing organization:Distribution:
Supplementary notes:
5
4
3
2
1
0
REV DATE DESCRIPTION PAGES CHECKED APPROVED
No part of this document may be reproduced or transmitted in any form or by anymeans, whether electronic, mechanical, photocopying, recording or otherwise;not stored in any information retrieval system or any kind, nor used for tenderingor manufacturing; nor communicated to any other person without the writtenpermission of the Consortium of Contract CT92/0025 Steering Committee.
Title :
Author(s) :
IST - IFREMER - LHF - MARTEDEC - NTUA - SINTEF - OCEANOR - PCM - DUT - STNMTE - STCPMVN - IH
IFREMER
The high frequency tail of the wave spectrum - Greek site data base analysis -
Marc PREVOSTO
TEC 2.1-06 (0)
3/7/06 Issued for comments

Page i
IFREMER DITI/GO/SOM MAST2 CONTRACT CT92/0025 - WAVEMOD
The high frequency tail of the wave spectrum - Greek site data base analysis -
MAST WAVEMOD Project.
Service Structures et Ouvrages en MerDépartement Génie Océanique
IFREMER Brest


Page ii
IFREMER DITI/GO/SOM MAST2 CONTRACT CT92/0025 - WAVEMOD
1. INTRODUCTION........................................................................................1
2. ANALYSIS OF THE DATA SET..................................................................22.1 WAVEMOD Crete site ............................................................................22.2 Spectrum tail estimation .........................................................................22.3 Analysis ..............................................................................................3
3. DISCUSSION.............................................................................................5References .................................................................................................6Figures .......................................................................................................7Tables.........................................................................................................9List of Tables ............................................................................................22List of Figures...........................................................................................23


INTRODUCTION Page 1
IFREMER DITI/GO/SOM MAST2 CONTRACT CT92/0025 - WAVEMOD
1. INTRODUCTION
The aim of this study is to compare the results of the fitting of tail spectrum model on the Greeksite data base with theoretical models which has been proposed in the literature and are describedin a companion report [7].
So, following the later developments of Kitaigorodskii and Phillips explained in [1], the frequencyband has been splitted into two parts with a boundary frequency defined by three times the peakfrequency.
We explain the differences of tail slope obtained between the three buoys which were deployedduring the Greek instrumentation campaign and between the measurements and the theory. Inparticular we analyse the influence on the slope of a measurement with a free floating buoy.
At last, the fitting of a tail in the frequency domain not taking into account the actual dispersionrelation is commented.

ANALYSIS OF THE DATA SET Page 2
IFREMER DITI/GO/SOM MAST2 CONTRACT CT92/0025 - WAVEMOD
2. ANALYSIS OF THE DATA SET
2.1 WAVEMOD Crete site
The Mediterranean site situated on the north-western coast of the island of Crete is a small bay,exposed to the north and situated on the western side of the town of RETHYMNON. It is exposedto relatively long fetches in the Aegean sea (~ 200km) and has a simple topography (slope ~2.5%) [3].
Although summer and winter climatology are quite different, severe sea conditions (Hs>4m) nearshore may occur at any season. Wave directions at the site are predominantly north west to northeast.
Tides are not significant in this area and local currents are essentially wind generated. Thegeneral water circulation amounts to a few centimetres per second.
Three wave buoys were deployed during a ten month period along a line approximatelyperpendicular to the coast. Two Directional Waveriders were located at 10 and 100 m depth andone non-directional Waverider buoy was located at 20 m depth.
In this study we show results from 600 time series (for each buoy) of 20mn sampled to 1.28Hz(2.56Hz for the non directional buoy) and which correspond to Hs superior to 1.5m.
2.2 Spectrum tail estimation
On each of the raw data a model of spectrum tail has been fitted on the square modulus of theFourier transform by a Maximum Likelihood procedure based on the asymptotic hypothesis thatthe Fourier transform follows a complex Normal law.
The classical tail model used is:
S(f) = β.f-n , with f ∈[fmin,fmax]
and the estimation of the spectrum
with F the Fourier transform and X(t) the elevation time serie.
with a model based density law,
S f( ) F X t( )( )F X t( )( )=
so, S(fi) follows a 2 d.o.f. χ2
p(S(fi))1
βfin–
------------S fi( )
βfin–
------------–
exp=

ANALYSIS OF THE DATA SET Page 3
IFREMER DITI/GO/SOM MAST2 CONTRACT CT92/0025 - WAVEMOD
β and n are obtained by maximizing the likelihood function on all the fi.
2.3 Analysis
The power n of the model has been estimated on all the data set and on two frequency ranges:Fr1=[Fz,3Fp] and Fr2=[3Fp,0.6Hz], (Fz=1/Tz).
Extensive results are given in the tables 1-27. Concerning the estimation of the slope on thesecond frequency range we have to take into account the fact that for small peak period the rangeis very short (sometimes equal zero) and so we have to analyse the results only on the right part ofthe tables. Global statistical values on the subset Tp>8.5s and Hs>2.5m are given in the tables 28-29.
Precision of the estimator. The simulation of 100 realizations (20mn and fsamp=1.28Hz) ofwave processes based on a random component method and corresponding to a Jonswapspectrum (Hs=4m, Tp=8.5s, γ=5) has been realized to evaluate the accuracy of the estimator. Itgave:
Fr1 = [Fz,3Fp] -> n = -4.52 , st.dev. = 0.29
Fr2 = [3Fp,0.6Hz] ->n = -4.87 , st.dev. = 0.46
When the standard deviations on the experimental data are compared to these values, we observecomparable variability between measurements and the theoretical Jonswap model, what provedthe homogeneity of the analysed data base. We remark too that if a Jonswap spectrum is
asymptotically f-5, in the frequency band we are interested in and with γ parameter whichcorresponds to the mean γ of the measurement, the slope is slightly increasing from -4.5 to -5.
High frequency range perturbations. Two particularities can disturb the estimation of theslope in the high frequency range: Anti-aliasing filter and heave transfer function of the buoy.
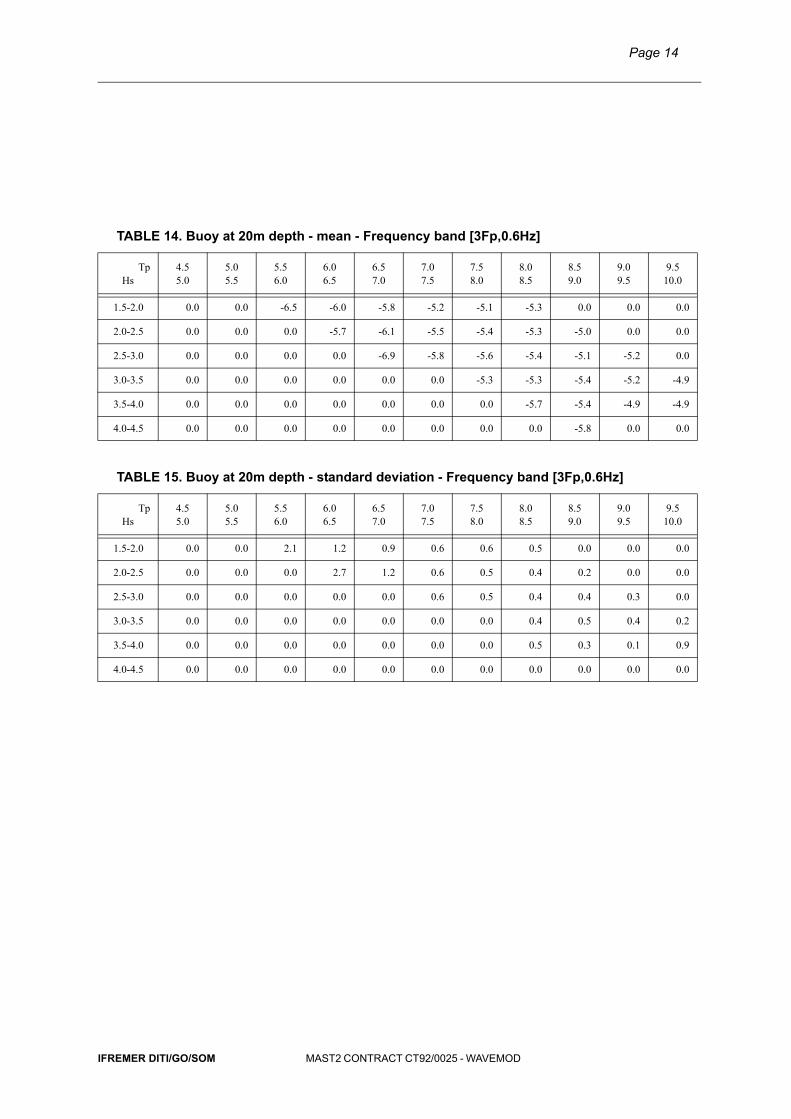
Anti-aliasing filter: A filter is apply on the waverider to avoid aliasing effect. It consists of a 5thorder with a cut-off frequency (3db) at 0.6Hz. This filter has a non negligible effect on the slope ofthe spectrum (increasing effect) around this cut-off frequency which is clear in the tables 14-17and 29 where we observe a mean decreasing of the slope from -5.2 to -4.9 when we go from amaximum frequency bound of 0.6Hz to 0.55Hz.
Heave transfer function: The measurement of the vertical displacement of the free surface ismodified by the heave transfer function of the buoy which depends of its radius (here 0.7m for thenon-directional, 0.9m for the two others) and of the mooring force [4]. It contributes in adecreasing of the slope in the frequency band upper to 0.5Hz and this in a greater extent in thecase of the 0.9m radius buoys. This can explain the differences we obtain between the threebuoys (different radius and mooring) in the highest frequencies of the tail.

ANALYSIS OF THE DATA SET Page 4
IFREMER DITI/GO/SOM MAST2 CONTRACT CT92/0025 - WAVEMOD
Particle-like behaviour of the buoys. Due to diffraction phenomena the buoys do not followthe elevation of the free surface without horizontal displacements. The magnitude of thisdisplacement depends on the type of the buoy and the stiffness of the mooring. In theinstrumentation which has been deployed the movements of the buoys have been measured veryclose to the orbital motion of the surface particles [5], so the tail of the spectrum can be influencedby such a behaviour compared with what can be obtain through a fixed point probe. Suchperturbation has been already observed [6] and analysed [7].
We have proceeded to the simulation of a fixed location wave elevation starting from the verticalmovement of the buoy [5]. The hypothesis is that the buoy follows exactly the verticaldisplacement of the particle with rest coordinates giving the fixed point coordinates and that theorbital motion is elliptic (what is correct to second order), the ellipticity following the water depth.
All the time series of the two directional buoys have been so processed before the fitting of thenew spectrum tails. The results are given in tables 18-27 and 28-29. In deep water there is noinfluence in the first frequency band but a 10% decreasing of the slope in the high frequency band.This conclusion is in agreement with the results of measurement given in [6(fig. 10)]. In shallowwater, in the first frequency band we observe a slight 6% decreasing of the slope and as in deepwater a more important decreasing of 17% of the slope in the upper frequency band.

DISCUSSION Page 5
IFREMER DITI/GO/SOM MAST2 CONTRACT CT92/0025 - WAVEMOD
3. DISCUSSION
In the frequency band after the peak frequency the decrease of the spectrum is close to f-4 in deep
water and reduces to f-3.4 when we go to more shallow water and correct the effect of buoydisplacement. In the higher frequency band (above 3 times the peak frequency) the effect of filterand heave transfer function do not permit, with this data base where the peak periods are not solow, to conclude precisely. But meanwhile, when corrected from the buoy displacement effect the
slope seems much closer to f-4 than to f-5.
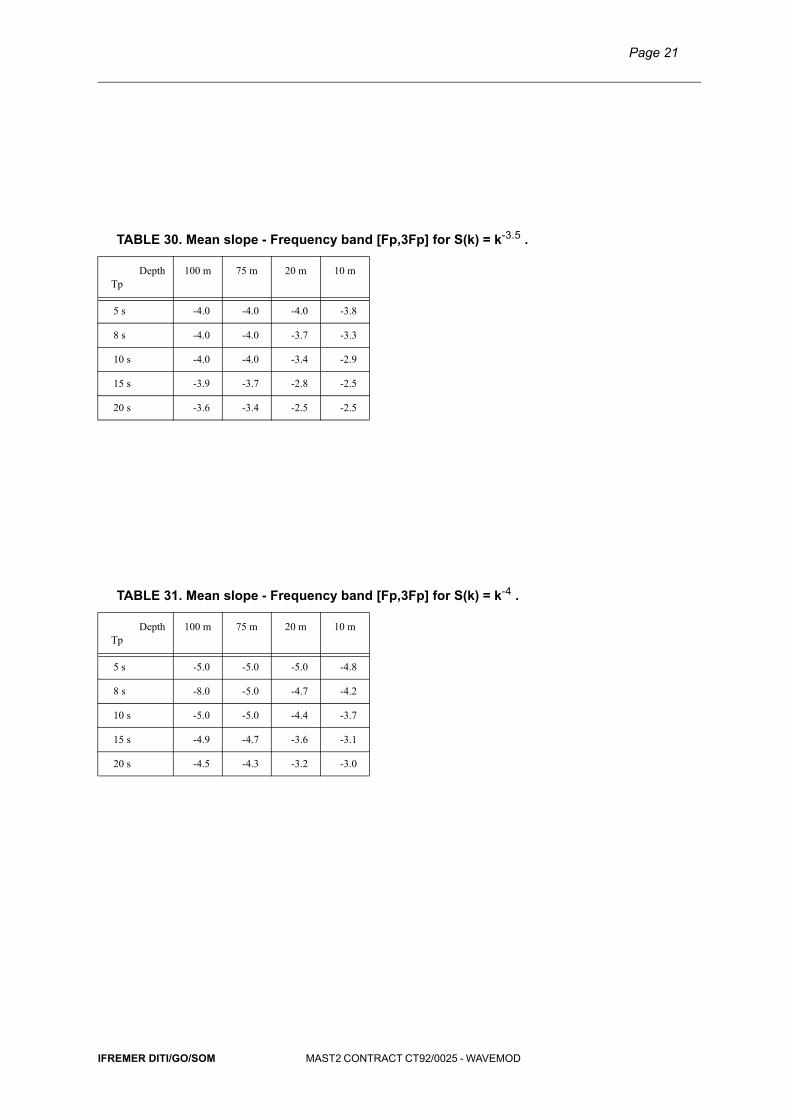
Wavenumber Spectrum versus Frequency spectrum. The models of tail spectrum proposedin the literature are in fact wavenumber spectrum and are given like independent of the waterdepth. So when we work on frequency spectrum, specifically in shallow water but also in deepwater with great wavelength. The slope of the tail of the frequency spectrum deduced from thesetheoretical wavenumber spectra is no more constant.
The figures 1(resp. 2) gives the slope dlog(S(f))/dlog(f) for S(k)=k-3.5 (resp. S(k)=k-4). S(f) hasbeen obtained by the well-known transformation
S(f) = S(k)kdk/df , (1)
with k and f related by the dispersion relation (2πf)2 = gktanh(hk).
So we observe that the power of the tail of the spectrum varies with the frequency. At 100 meterdepth the result is not affected by the dispersion considering the frequency band analysed in theGreek data base (f>0.1Hz). But at 20 and 10 meter depths the variation of the slope is veryimportant in the frequency band. The powers which have been obtained in the previous results areso a mean of this slope on the band studied [1/Tz,3Fp].
As an example the mean slope obtained for several Tp and water depths is given intables 30 & 31. We find the same order of difference between 100 m depth and 10 m depth thanthat given in table 28 in the low frequency band. This effect explains too the variation of the slopewith the Tp which has been observed in a companion report [7].
In fact, it will be better to fit and to analyse the spectral shape in the wavenumber domain, andfurnish in a second step by the transformation (1) the frequency spectrum.


Page 6
IFREMER DITI/GO/SOM MAST2 CONTRACT CT92/0025 - WAVEMOD
References
[1] LONGUET-HIGGINS, M. S. 1963 «The effect of non-linearities on statistical distributions in thetheory of sea waves», J. Fluid. Mech. , Vol. 17, pp. 459-480.
[2] S. BARSTOW, M. PAILLARD, C. GUEDES SOARES, «Field Measurements of Coastal Wavesand Currents in the WAVEMOD Project» Proc. OCEANS 94 Conf., Brest, France, Sept. 1994
[3] Datawell documentation on Waverider.[4] M. PREVOSTO, 1995 «Influence of the Behavior of Buoys on Wave Characteristics» WAVEMOD
project, Report n° TEC-2.3-02.[5] J. ALLENDER, T. AUDUNSON, S.F. BARSTOW, S. BJERKEN, H.E. KROGSTAD, P. STEIN-
BAKKE, L. VARTDAL, L.E. BORGMAN and C. GRAHAM, «The WADIC project: a comprehensivefield evaluation of directional wave instrumentation», Ocean Engng, Vol. 16, pp. 505-536, 1989.
[6] P.J. RADEMAKERS, «Technical note: Waverider-Wavestaff comparison», Ocean Engng, Vol. 20,No 2, pp. 187-193, 1993.
[7] GUEDES SOARES, C., COELHO, J.E., 1995 «Analysis of the High-Frequency Range in Spectraof Figueira da Foz», WAVEMOD Report n° TEC-2.1-03.

Page 7
IFREMER DITI/GO/SOM MAST2 CONTRACT CT92/0025 - WAVEMOD
Figures
FIGURE 1. : Slope dlog(S(f))/dlog(f) for S(k)=k-3.5 and different water depths
100m
75m
20m
10m
0.06 0.08 0.1 0.2 0.3 0.4 0.5−4.2
−4
−3.8
−3.6
−3.4
−3.2
−3
−2.8
−2.6
−2.4
Frequency (Hz)
slop
e

Page 8
IFREMER DITI/GO/SOM MAST2 CONTRACT CT92/0025 - WAVEMOD
FIGURE 2. : Slope dlog(S(f))/dlog(f) for S(k)=k-4 and different water depths
100m
75m
20m
10m
0.06 0.08 0.1 0.2 0.3 0.4 0.5−5.5
−5
−4.5
−4
−3.5
−3
−2.5
Frequency (Hz)
slop
e
Page 9
IFREMER DITI/GO/SOM MAST2 CONTRACT CT92/0025 - WAVEMOD
Tables
TABLE 1. Buoy at 100m depth - mean value - Frequency band [Fz,3Fp]
TpHs
4.55.0
5.05.5
5.56.0
6.06.5
6.57.0
7.07.5
7.58.0
8.08.5
8.59.0
9.09.5
9.510.0
1.5-2.0 -4.0 -3.8 -3.8 -3.7 -3.6 -3.6 -3.9 -4.0 0.0 0.0 0.0
2.0-2.5 0.0 0.0 0.0 -3.9 -3.9 -3.8 -3.8 -3.7 -3.7 0.0 0.0
2.5-3.0 0.0 0.0 0.0 0.0 -4.0 -4.0 -3.8 -3.9 -3.8 -4.3 0.0
3.0-3.5 0.0 0.0 0.0 0.0 0.0 0.0 -4.0 -3.9 -3.9 -3.8 -3.8
3.5-4.0 0.0 0.0 0.0 0.0 0.0 0.0 -4.4 -4.0 -4.0 -4.0 -3.5
4.0-4.5 0.0 0.0 0.0 0.0 0.0 0.0 0.0 -3.9 -4.1 -4.0 -4.3
TABLE 2. Buoy at 100m depth - standard deviation - Frequency band [Fz,3Fp]
TpHs
4.55.0
5.05.5
5.56.0
6.06.5
6.57.0
7.07.5
7.58.0
8.08.5
8.59.0
9.09.5
9.510.0
1.5-2.0 0.2 0.2 0.3 0.2 0.3 0.4 0.7 0.3 0.0 0.0 0.0
2.0-2.5 0.0 0.0 0.0 0.2 0.3 0.3 0.3 0.4 0.7 0.0 0.0
2.5-3.0 0.0 0.0 0.0 0.0 0.3 0.3 0.3 0.3 0.5 0.5 0.0
3.0-3.5 0.0 0.0 0.0 0.0 0.0 0.0 0.4 0.4 0.4 0.4 0.0
3.5-4.0 0.0 0.0 0.0 0.0 0.0 0.0 0.0 0.4 0.3 0.3 0.0
4.0-4.5 0.0 0.0 0.0 0.0 0.0 0.0 0.0 0.0 0.1 0.4 0.0
TABLE 3. Buoy at 100m depth - number of samples
TpHs
4.55.0
5.05.5
5.56.0
6.06.5
6.57.0
7.07.5
7.58.0
8.08.5
8.59.0
9.09.5
9.510.0
1.5-2.0 5 13 14 50 66 24 12 4 0 0 0
2.0-2.5 0 0 0 5 17 30 29 20 2 0 0
2.5-3.0 0 0 0 0 2 23 35 44 20 3 0
3.0-3.5 0 0 0 0 0 0 14 40 43 14 1
3.5-4.0 0 0 0 0 0 0 1 4 12 7 1
4.0-4.5 0 0 0 0 0 0 0 1 3 5 1

Page 10
IFREMER DITI/GO/SOM MAST2 CONTRACT CT92/0025 - WAVEMOD
TABLE 4. Buoy at 100m depth - mean - Frequency band [3Fp,0.6Hz]
TpHs
4.55.0
5.05.5
5.56.0
6.06.5
6.57.0
7.07.5
7.58.0
8.08.5
8.59.0
9.09.5
9.510.0
1.5-2.0 -6.4 -5.1 -4.8 -4.4 -4.2 -3.6 0.0 0.0 0.0
2.0-2.5 0.0 0.0 0.0 -5.8 -4.7 -4.5 -4.4 -4.3 -4.0 0.0 0.0
2.5-3.0 0.0 0.0 0.0 0.0 -4.0 -4.8 -4.7 -4.5 -4.3 -4.0 0.0
3.0-3.5 0.0 0.0 0.0 0.0 0.0 0.0 -4.6 -4.6 -4.4 -4.3 -4.5
3.5-4.0 0.0 0.0 0.0 0.0 0.0 0.0 -4.8 -5.0 -4.5 -4.7 -4.4
4.0-4.5 0.0 0.0 0.0 0.0 0.0 0.0 0.0 -5.0 -4.8 -4.5 -4.2
TABLE 5. Buoy at 100m depth - standard deviation - Frequency band [3Fp,0.6Hz]
TpHs
4.55.0
5.05.5
5.56.0
6.06.5
6.57.0
7.07.5
7.58.0
8.08.5
8.59.0
9.09.5
9.510.0
1.5-2.0 1.5 1.4 0.9 0.8 0.8 0.5 0.0 0.0 0.0
2.0-2.5 0.0 0.0 0.0 0.8 1.0 0.5 0.5 0.4 0.1 0.0 0.0
2.5-3.0 0.0 0.0 0.0 0.0 0.4 0.8 0.6 0.5 0.4 0.4 0.0
3.0-3.5 0.0 0.0 0.0 0.0 0.0 0.0 0.4 0.4 0.3 0.3 0.0
3.5-4.0 0.0 0.0 0.0 0.0 0.0 0.0 0.0 0.1 0.4 0.3 0.0
4.0-4.5 0.0 0.0 0.0 0.0 0.0 0.0 0.0 0.0 0.4 0.2 0.0
Page 11
IFREMER DITI/GO/SOM MAST2 CONTRACT CT92/0025 - WAVEMOD
TABLE 6. Buoy at 10m depth - mean value - Frequency band [Fz,3Fp]
TpHs
4.55.0
5.05.5
5.56.0
6.06.5
6.57.0
7.07.5
7.58.0
8.08.5
8.59.0
9.09.5
9.510.0
1.5-2.0 -4.1 -4.1 -3.8 -3.5 -3.5 -3.5 -3.7 -3.4 -3.5 0.0 0.0
2.0-2.5 0.0 0.0 0.0 -3.7 -3.8 -3.7 -3.6 -3.4 -3.4 -3.6 0.0
2.5-3.0 0.0 0.0 0.0 0.0 0.0 -3.8 -3.7 -3.8 -3.5 -3.5 -3.1
3.0-3.5 0.0 0.0 0.0 0.0 0.0 0.0 -3.8 -3.8 -3.7 -3.8 -3.7
3.5-4.0 0.0 0.0 0.0 0.0 0.0 0.0 0.0 -3.9 -4.1 -3.7 0.0
4.0-4.5 0.0 0.0 0.0 0.0 0.0 0.0 0.0 0.0 0.0 0.0 0.0
TABLE 7. Buoy at 10m depth - standard deviation - Frequency band [Fz,3Fp]
TpHs
4.55.0
5.05.5
5.56.0
6.06.5
6.57.0
7.07.5
7.58.0
8.08.5
8.59.0
9.09.5
9.510.0
1.5-2.0 0.3 0.2 0.4 0.3 0.3 0.4 0.5 0.3 0.0 0.0 0.0
2.0-2.5 0.0 0.0 0.0 0.0 0.3 0.3 0.3 0.4 0.4 0.0 0.0
2.5-3.0 0.0 0.0 0.0 0.0 0.0 0.4 0.3 0.4 0.3 0.3 0.0
3.0-3.5 0.0 0.0 0.0 0.0 0.0 0.0 0.5 0.4 0.3 0.4 0.0
3.5-4.0 0.0 0.0 0.0 0.0 0.0 0.0 0.0 0.1 0.1 0.3 0.0
4.0-4.5 0.0 0.0 0.0 0.0 0.0 0.0 0.0 0.0 0.0 0.0 0.0
TABLE 8. Buoy at 10m depth - number of samples
TpHs
4.55.0
5.05.5
5.56.0
6.06.5
6.57.0
7.07.5
7.58.0
8.08.5
8.59.0
9.09.5
9.510.0
1.5-2.0 2 3 11 23 27 38 24 10 1 0 0
2.0-2.5 0 0 0 1 12 15 39 30 9 1 0
2.5-3.0 0 0 0 0 0 7 22 45 45 7 1
3.0-3.5 0 0 0 0 0 0 7 11 15 3 1
3.5-4.0 0 0 0 0 0 0 0 2 3 4 0
4.0-4.5 0 0 0 0 0 0 0 0 0 0 0

Page 12
IFREMER DITI/GO/SOM MAST2 CONTRACT CT92/0025 - WAVEMOD
TABLE 9. Buoy at 10m depth - mean - Frequency band [3Fp,0.6Hz]
TpHs
4.55.0
5.05.5
5.56.0
6.06.5
6.57.0
7.07.5
7.58.0
8.08.5
8.59.0
9.09.5
9.510.0
1.5-2.0 0.0 -6.2 -4.7 -4.8 -4.8 -4.1 -4.1 -4.0 0.0 0.0 0.0
2.0-2.5 0.0 0.0 0.0 -5.0 -5.0 -4.4 -4.6 -4.2 -4.2 0.0 0.0
2.5-3.0 0.0 0.0 0.0 0.0 -4.7 -4.4 -4.6 -4.7 -4.6 -4.9 0.0
3.0-3.5 0.0 0.0 0.0 0.0 0.0 0.0 -4.8 -4.7 -4.8 -4.5 -5.0
3.5-4.0 0.0 0.0 0.0 0.0 0.0 0.0 0.0 -5.2 -5.1 -5.1 -5.3
4.0-4.5 0.0 0.0 0.0 0.0 0.0 0.0 0.0 0.0 -3.2 0.0 0.0
TABLE 10. Buoy at 10m depth - standard deviation - Frequency band [3Fp,0.6Hz]
TpHs
4.55.0
5.05.5
5.56.0
6.06.5
6.57.0
7.07.5
7.58.0
8.08.5
8.59.0
9.09.5
9.510.0
1.5-2.0 0.0 0.0 0.9 0.7 0.8 0.7 0.4 0.3 0.0 0.0 0.0
2.0-2.5 0.0 0.0 0.0 0.3 1.1 0.6 0.5 0.5 0.3 0.0 0.0
2.5-3.0 0.0 0.0 0.0 0.0 0.0 0.5 0.4 0.5 0.6 0.5 0.0
3.0-3.5 0.0 0.0 0.0 0.0 0.0 0.0 0.0 0.4 0.5 0.6 0.1
3.5-4.0 0.0 0.0 0.0 0.0 0.0 0.0 0.0 0.0 0.4 0.0 0.4
4.0-4.5 0.0 0.0 0.0 0.0 0.0 0.0 0.0 0.0 0.0 0.0 0.0
Page 13
IFREMER DITI/GO/SOM MAST2 CONTRACT CT92/0025 - WAVEMOD
TABLE 11. Buoy at 20m depth - mean value - Frequency band [Fz,3Fp]
TpHs
4.55.0
5.05.5
5.56.0
6.06.5
6.57.0
7.07.5
7.58.0
8.08.5
8.59.0
9.09.5
9.510.0
1.5-2.0 -4.3 -4.4 -4.1 -3.8 -3.6 -3.7 -3.8 -3.6 0.0 0.0 0.0
2.0-2.5 0.0 0.0 0.0 -4.1 -3.9 -3.8 -3.8 -3.7 -3.5 0.0 0.0
2.5-3.0 0.0 0.0 0.0 0.0 -4.1 -3.9 -3.9 -3.8 -3.7 -3.6 0.0
3.0-3.5 0.0 0.0 0.0 0.0 0.0 0.0 -3.7 -4.1 -3.9 -3.6 -3.8
3.5-4.0 0.0 0.0 0.0 0.0 0.0 0.0 0.0 -3.8 -3.9 -3.9 -4.0
4.0-4.5 0.0 0.0 0.0 0.0 0.0 0.0 0.0 0.0 -4.2 0.0 0.0
TABLE 12. Buoy at 20m depth - standard deviation - Frequency band [Fz,3Fp]
TpHs
4.55.0
5.05.5
5.56.0
6.06.5
6.57.0
7.07.5
7.58.0
8.08.5
8.59.0
9.09.5
9.510.0
1.5-2.0 0.4 0.3 0.3 0.4 0.3 0.3 0.4 0.5 0.0 0.0 0.0
2.0-2.5 0.0 0.0 0.0 0.3 0.2 0.3 0.4 0.5 0.7 0.0 0.0
2.5-3.0 0.0 0.0 0.0 0.0 0.0 0.3 0.4 0.3 0.4 0.3 0.0
3.0-3.5 0.0 0.0 0.0 0.0 0.0 0.0 0.0 0.3 0.3 0.4 0.1
3.5-4.0 0.0 0.0 0.0 0.0 0.0 0.0 0.0 0.1 0.3 0.6 0.2
4.0-4.5 0.0 0.0 0.0 0.0 0.0 0.0 0.0 0.0 0.0 0.0 0.0
TABLE 13. Buoy at 20m depth - number of samples
TpHs
4.55.0
5.05.5
5.56.0
6.06.5
6.57.0
7.07.5
7.58.0
8.08.5
8.59.0
9.09.5
9.510.0
1.5-2.0 2 7 16 41 57 29 16 6 0 0 0
2.0-2.5 0 0 0 3 11 24 37 25 6 0 0
2.5-3.0 0 0 0 0 1 12 29 62 52 6 0
3.0-3.5 0 0 0 0 0 0 1 8 36 8 3
3.5-4.0 0 0 0 0 0 0 0 3 8 3 2
4.0-4.5 0 0 0 0 0 0 0 0 1 0 0
Page 14
IFREMER DITI/GO/SOM MAST2 CONTRACT CT92/0025 - WAVEMOD
TABLE 14. Buoy at 20m depth - mean - Frequency band [3Fp,0.6Hz]
TpHs
4.55.0
5.05.5
5.56.0
6.06.5
6.57.0
7.07.5
7.58.0
8.08.5
8.59.0
9.09.5
9.510.0
1.5-2.0 0.0 0.0 -6.5 -6.0 -5.8 -5.2 -5.1 -5.3 0.0 0.0 0.0
2.0-2.5 0.0 0.0 0.0 -5.7 -6.1 -5.5 -5.4 -5.3 -5.0 0.0 0.0
2.5-3.0 0.0 0.0 0.0 0.0 -6.9 -5.8 -5.6 -5.4 -5.1 -5.2 0.0
3.0-3.5 0.0 0.0 0.0 0.0 0.0 0.0 -5.3 -5.3 -5.4 -5.2 -4.9
3.5-4.0 0.0 0.0 0.0 0.0 0.0 0.0 0.0 -5.7 -5.4 -4.9 -4.9
4.0-4.5 0.0 0.0 0.0 0.0 0.0 0.0 0.0 0.0 -5.8 0.0 0.0
TABLE 15. Buoy at 20m depth - standard deviation - Frequency band [3Fp,0.6Hz]
TpHs
4.55.0
5.05.5
5.56.0
6.06.5
6.57.0
7.07.5
7.58.0
8.08.5
8.59.0
9.09.5
9.510.0
1.5-2.0 0.0 0.0 2.1 1.2 0.9 0.6 0.6 0.5 0.0 0.0 0.0
2.0-2.5 0.0 0.0 0.0 2.7 1.2 0.6 0.5 0.4 0.2 0.0 0.0
2.5-3.0 0.0 0.0 0.0 0.0 0.0 0.6 0.5 0.4 0.4 0.3 0.0
3.0-3.5 0.0 0.0 0.0 0.0 0.0 0.0 0.0 0.4 0.5 0.4 0.2
3.5-4.0 0.0 0.0 0.0 0.0 0.0 0.0 0.0 0.5 0.3 0.1 0.9
4.0-4.5 0.0 0.0 0.0 0.0 0.0 0.0 0.0 0.0 0.0 0.0 0.0

Page 15
IFREMER DITI/GO/SOM MAST2 CONTRACT CT92/0025 - WAVEMOD
TABLE 16. Buoy at 20m depth - mean - Frequency band [3Fp,0.55Hz]
TpHs
4.55.0
5.05.5
5.56.0
6.06.5
6.57.0
7.07.5
7.58.0
8.08.5
8.59.0
9.09.5
9.510.0
1.5-2.0 0.0 0.0 -5.3 -5.4 -5.2 -4.6 -4.8 -5.1 0.0 0.0 0.0
2.0-2.5 0.0 0.0 0.0 -5.9 -5.7 -5.1 -5.0 -4.9 -4.5 0.0 0.0
2.5-3.0 0.0 0.0 0.0 0.0 0.0 -5.4 -5.3 -5.0 -4.8 -4.7 0.0
3.0-3.5 0.0 0.0 0.0 0.0 0.0 0.0 -4.6 -4.8 -5.0 -4.9 -4.5
3.5-4.0 0.0 0.0 0.0 0.0 0.0 0.0 0.0 -5.6 -5.1 -4.5 -4.4
4.0-4.5 0.0 0.0 0.0 0.0 0.0 0.0 0.0 0.0 -5.9 0.0 0.0
TABLE 17. Buoy at 20m depth - standard deviation - Frequency band [3Fp,0.55Hz]
TpHs
4.55.0
5.05.5
5.56.0
6.06.5
6.57.0
7.07.5
7.58.0
8.08.5
8.59.0
9.09.5
9.510.0
1.5-2.0 0.0 0.0 1.3 2.5 1.5 0.9 0.8 0.6 0.0 0.0 0.0
2.0-2.5 0.0 0.0 0.0 2.6 1.8 0.6 0.7 0.7 0.4 0.0 0.0
2.5-3.0 0.0 0.0 0.0 0.0 0.0 0.6 0.5 0.5 0.5 0.6 0.0
3.0-3.5 0.0 0.0 0.0 0.0 0.0 0.0 0.0 0.6 0.6 0.5 0.3
3.5-4.0 0.0 0.0 0.0 0.0 0.0 0.0 0.0 0.4 0.4 0.3 1.0
4.0-4.5 0.0 0.0 0.0 0.0 0.0 0.0 0.0 0.0 0.0 0.0 0.0

Page 16
IFREMER DITI/GO/SOM MAST2 CONTRACT CT92/0025 - WAVEMOD
TABLE 18. Fixed point at 100m depth - mean value - Frequency band [Fz,3Fp]
TpHs
4.55.0
5.05.5
5.56.0
6.06.5
6.57.0
7.07.5
7.58.0
8.08.5
8.59.0
9.09.5
9.510.0
1.5-2.0 -3.9 -3.8 -3.7 -3.6 -3.6 -3.6 -3.9 -4.0 0.0 0.0 0.0
2.0-2.5 0.0 0.0 0.0 -3.9 -3.9 -3.9 -3.7 -3.6 -3.7 0.0 0.0
2.5-3.0 0.0 0.0 0.0 0.0 -3.9 -4.0 -3.8 -3.9 -3.9 -4.3 0.0
3.0-3.5 0.0 0.0 0.0 0.0 0.0 0.0 -4.0 -3.9 -3.9 -3.8 -3.8
3.5-4.0 0.0 0.0 0.0 0.0 0.0 0.0 -4.4 -4.1 -3.9 -3.9 -3.7
4.0-4.5 0.0 0.0 0.0 0.0 0.0 0.0 0.0 -3.9 -4.0 -4.1 -4.4
TABLE 19. Fixed point at 100m depth - standard deviation - Frequency band [Fz,3Fp]
TpHs
4.55.0
5.05.5
5.56.0
6.06.5
6.57.0
7.07.5
7.58.0
8.08.5
8.59.0
9.09.5
9.510.0
1.5-2.0 0.1 0.2 0.2 0.2 0.4 0.3 0.6 0.3 0.0 0.0 0.0
2.0-2.5 0.0 0.0 0.0 0.2 0.2 0.4 0.3 0.5 0.6 0.0 0.0
2.5-3.0 0.0 0.0 0.0 0.0 0.3 0.2 0.3 0.4 0.5 0.4 0.0
3.0-3.5 0.0 0.0 0.0 0.0 0.0 0.0 0.3 0.3 0.4 0.4 0.0
3.5-4.0 0.0 0.0 0.0 0.0 0.0 0.0 0.0 0.3 0.3 0.3 0.0
4.0-4.5 0.0 0.0 0.0 0.0 0.0 0.0 0.0 0.0 0.3 0.4 0.0
TABLE 20. Fixed point at 100m depth - number of samples
TpHs
4.55.0
5.05.5
5.56.0
6.06.5
6.57.0
7.07.5
7.58.0
8.08.5
8.59.0
9.09.5
9.510.0
1.5-2.0 5 13 14 50 66 24 12 4 0 0 0
2.0-2.5 0 0 0 5 17 30 29 20 2 0 0
2.5-3.0 0 0 0 0 2 23 35 44 20 3 0
3.0-3.5 0 0 0 0 0 0 14 40 43 14 1
3.5-4.0 0 0 0 0 0 0 1 4 12 7 1
4.0-4.5 0 0 0 0 0 0 0 1 3 5 1
Page 17
IFREMER DITI/GO/SOM MAST2 CONTRACT CT92/0025 - WAVEMOD
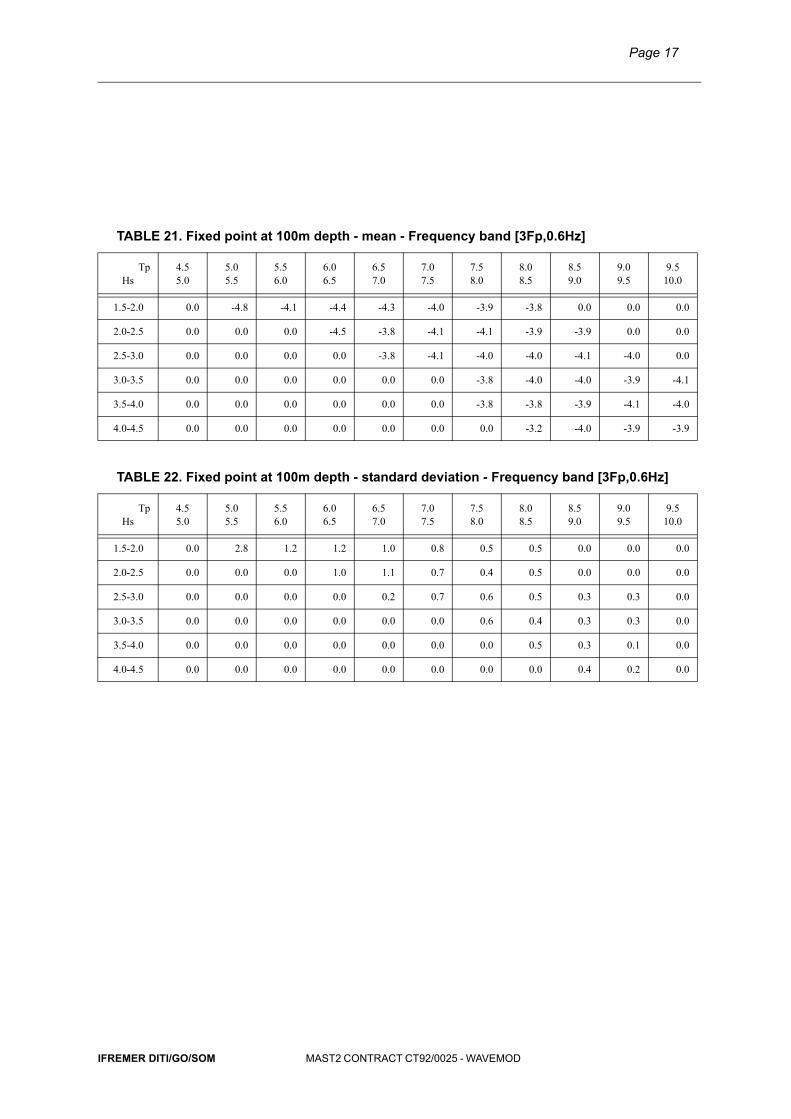
TABLE 21. Fixed point at 100m depth - mean - Frequency band [3Fp,0.6Hz]
TpHs
4.55.0
5.05.5
5.56.0
6.06.5
6.57.0
7.07.5
7.58.0
8.08.5
8.59.0
9.09.5
9.510.0
1.5-2.0 0.0 -4.8 -4.1 -4.4 -4.3 -4.0 -3.9 -3.8 0.0 0.0 0.0
2.0-2.5 0.0 0.0 0.0 -4.5 -3.8 -4.1 -4.1 -3.9 -3.9 0.0 0.0
2.5-3.0 0.0 0.0 0.0 0.0 -3.8 -4.1 -4.0 -4.0 -4.1 -4.0 0.0
3.0-3.5 0.0 0.0 0.0 0.0 0.0 0.0 -3.8 -4.0 -4.0 -3.9 -4.1
3.5-4.0 0.0 0.0 0.0 0.0 0.0 0.0 -3.8 -3.8 -3.9 -4.1 -4.0
4.0-4.5 0.0 0.0 0.0 0.0 0.0 0.0 0.0 -3.2 -4.0 -3.9 -3.9
TABLE 22. Fixed point at 100m depth - standard deviation - Frequency band [3Fp,0.6Hz]
TpHs
4.55.0
5.05.5
5.56.0
6.06.5
6.57.0
7.07.5
7.58.0
8.08.5
8.59.0
9.09.5
9.510.0
1.5-2.0 0.0 2.8 1.2 1.2 1.0 0.8 0.5 0.5 0.0 0.0 0.0
2.0-2.5 0.0 0.0 0.0 1.0 1.1 0.7 0.4 0.5 0.0 0.0 0.0
2.5-3.0 0.0 0.0 0.0 0.0 0.2 0.7 0.6 0.5 0.3 0.3 0.0
3.0-3.5 0.0 0.0 0.0 0.0 0.0 0.0 0.6 0.4 0.3 0.3 0.0
3.5-4.0 0.0 0.0 0.0 0.0 0.0 0.0 0.0 0.5 0.3 0.1 0.0
4.0-4.5 0.0 0.0 0.0 0.0 0.0 0.0 0.0 0.0 0.4 0.2 0.0

Page 18
IFREMER DITI/GO/SOM MAST2 CONTRACT CT92/0025 - WAVEMOD
TABLE 23. Fixed point at 10m depth - mean value - Frequency band [Fz,3Fp]
TpHs
4.55.0
5.05.5
5.56.0
6.06.5
6.57.0
7.07.5
7.58.0
8.08.5
8.59.0
9.09.5
9.510.0
1.5-2.0 -3.9 -4.2 -3.8 -3.5 -3.5 -3.4 -3.7 -3.4 -3.4 0.0 0.0
2.0-2.5 0.0 0.0 0.0 -3.7 -3.7 -3.6 -3.6 -3.4 -3.3 -3.4 0.0
2.5-3.0 0.0 0.0 0.0 0.0 0.0 -3.7 -3.6 -3.6 -3.4 -3.4 -3.1
3.0-3.5 0.0 0.0 0.0 0.0 0.0 0.0 -3.6 -3.5 -3.4 -3.3 -3.6
3.5-4.0 0.0 0.0 0.0 0.0 0.0 0.0 0.0 -3.5 -3.7 -3.5 0.0
4.0-4.5 0.0 0.0 0.0 0.0 0.0 0.0 0.0 0.0 0.0 0.0 0.0
TABLE 24. Fixed point at 10m depth - standard deviation - Frequency band [Fz,3Fp]
TpHs
4.55.0
5.05.5
5.56.0
6.06.5
6.57.0
7.07.5
7.58.0
8.08.5
8.59.0
9.09.5
9.510.0
1.5-2.0 0.3 0.4 0.2 0.3 0.3 0.4 0.5 0.3 0.0 0.0 0.0
2.0-2.5 0.0 0.0 0.0 0.0 0.2 0.3 0.3 0.4 0.5 0.0 0.0
2.5-3.0 0.0 0.0 0.0 0.0 0.0 0.3 0.3 0.3 0.3 0.3 0.0
3.0-3.5 0.0 0.0 0.0 0.0 0.0 0.0 0.4 0.4 0.3 0.2 0.0
3.5-4.0 0.0 0.0 0.0 0.0 0.0 0.0 0.0 0.1 0.1 0.3 0.0
4.0-4.5 0.0 0.0 0.0 0.0 0.0 0.0 0.0 0.0 0.0 0.0 0.0
TABLE 25. Fixed point at 10m depth - number of samples
TpHs
4.55.0
5.05.5
5.56.0
6.06.5
6.57.0
7.07.5
7.58.0
8.08.5
8.59.0
9.09.5
9.510.0
1.5-2.0 2 3 11 23 27 38 24 10 1 0 0
2.0-2.5 0 0 0 1 12 15 38 29 8 1 0
2.5-3.0 0 0 0 0 0 7 22 45 44 6 1
3.0-3.5 0 0 0 0 0 0 7 11 15 3 1
3.5-4.0 0 0 0 0 0 0 0 2 3 4 0
4.0-4.5 0 0 0 0 0 0 0 0 0 0 0

Page 19
IFREMER DITI/GO/SOM MAST2 CONTRACT CT92/0025 - WAVEMOD
TABLE 26. Fixed point at 10m depth - mean - Frequency band [3Fp,0.6Hz]
TpHs
4.55.0
5.05.5
5.56.0
6.06.5
6.57.0
7.07.5
7.58.0
8.08.5
8.59.0
9.09.5
9.510.0
1.5-2.0 0.0 -7.9 -5.3 -4.7 -4.2 -4.0 -3.6 -3.8 -3.6 0.0 0.0
2.0-2.5 0.0 0.0 0.0 -4.6 -3.9 -4.0 -3.8 -3.9 -3.9 -4.0 0.0
2.5-3.0 0.0 0.0 0.0 0.0 0.0 -3.8 -3.9 -3.9 -4.0 -3.9 -4.4
3.0-3.5 0.0 0.0 0.0 0.0 0.0 0.0 -3.6 -4.0 -4.0 -4.0 -4.3
3.5-4.0 0.0 0.0 0.0 0.0 0.0 0.0 0.0 -3.3 -4.0 -4.1 0.0
4.0-4.5 0.0 0.0 0.0 0.0 0.0 0.0 0.0 0.0 0.0 0.0 0.0
TABLE 27. Fixed point at 10m depth - standard deviation - Frequency band [3Fp,0.6Hz]
TpHs
4.55.0
5.05.5
5.56.0
6.06.5
6.57.0
7.07.5
7.58.0
8.08.5
8.59.0
9.09.5
9.510.0
1.5-2.0 0.0 0.1 2.8 1.2 0.8 0.6 0.5 0.5 0.0 0.0 0.0
2.0-2.5 0.0 0.0 0.0 0.0 0.8 0.8 0.5 0.4 0.4 0.0 0.0
2.5-3.0 0.0 0.0 0.0 0.0 0.0 0.4 0.5 0.4 0.3 0.4 0.0
3.0-3.5 0.0 0.0 0.0 0.0 0.0 0.0 0.4 0.4 0.3 0.4 0.0
3.5-4.0 0.0 0.0 0.0 0.0 0.0 0.0 0.0 0.1 0.2 0.2 0.0
4.0-4.5 0.0 0.0 0.0 0.0 0.0 0.0 0.0 0.0 0.0 0.0 0.0

Page 20
IFREMER DITI/GO/SOM MAST2 CONTRACT CT92/0025 - WAVEMOD
TABLE 28. Frequency band [Fz,3Fp] - Tp > 8.5s - Hs > 2.5m
mean standard deviation
number of samples
Buoy at 100m depth -3.89 0.38 110
Buoy at 20m depth -3.80 0.37 119
Buoy at 10m depth -3.59 0.31 79
Fixed point at 100m depth -3.89 0.38 110
Fixed point at 10m depth -3.40 0.26 77
TABLE 29. Frequency band [3Fp,0.6Hz] - Tp > 8.5s - Hs > 2.5m
mean standard deviation
number of samples
Buoy at 100m depth -4.42 0.36 110
Buoy at 20m depth -5.24 0.45 118
Buoy at 20m depth [3Fp,0.55Hz] -4.88 0.52 119
Buoy at 10m depth -4.71 0.56 95
Fixed point at 100m depth -3.99 0.32 110
Fixed point at 10m depth -4.02 0.32 84
Page 21
IFREMER DITI/GO/SOM MAST2 CONTRACT CT92/0025 - WAVEMOD
TABLE 30. Mean slope - Frequency band [Fp,3Fp] for S(k) = k-3.5 .
DepthTp
100 m 75 m 20 m 10 m
5 s -4.0 -4.0 -4.0 -3.8
8 s -4.0 -4.0 -3.7 -3.3
10 s -4.0 -4.0 -3.4 -2.9
15 s -3.9 -3.7 -2.8 -2.5
20 s -3.6 -3.4 -2.5 -2.5
TABLE 31. Mean slope - Frequency band [Fp,3Fp] for S(k) = k-4 .
DepthTp
100 m 75 m 20 m 10 m
5 s -5.0 -5.0 -5.0 -4.8
8 s -8.0 -5.0 -4.7 -4.2
10 s -5.0 -5.0 -4.4 -3.7
15 s -4.9 -4.7 -3.6 -3.1
20 s -4.5 -4.3 -3.2 -3.0

Page 22
IFREMER DITI/GO/SOM MAST2 CONTRACT CT92/0025 - WAVEMOD
List of Tables
TABLE 1. Buoy at 100m depth - mean value - Frequency band [Fz,3Fp] ................................... 9TABLE 2. Buoy at 100m depth - standard deviation - Frequency band [Fz,3Fp] ........................ 9TABLE 3. Buoy at 100m depth - number of samples .................................................................. 9TABLE 4. Buoy at 100m depth - mean - Frequency band [3Fp,0.6Hz] ..................................... 10TABLE 5. Buoy at 100m depth - standard deviation - Frequency band [3Fp,0.6Hz] ................. 10TABLE 6. Buoy at 10m depth - mean value - Frequency band [Fz,3Fp] ................................... 11TABLE 7. Buoy at 10m depth - standard deviation - Frequency band [Fz,3Fp] ........................ 11TABLE 8. Buoy at 10m depth - number of samples .................................................................. 11TABLE 9. Buoy at 10m depth - mean - Frequency band [3Fp,0.6Hz] ....................................... 12TABLE 10. Buoy at 10m depth - standard deviation - Frequency band [3Fp,0.6Hz] ................... 12TABLE 11. Buoy at 20m depth - mean value - Frequency band [Fz,3Fp] ................................... 13TABLE 12. Buoy at 20m depth - standard deviation - Frequency band [Fz,3Fp] ........................ 13TABLE 13. Buoy at 20m depth - number of samples .................................................................. 13TABLE 14. Buoy at 20m depth - mean - Frequency band [3Fp,0.6Hz] ....................................... 14TABLE 15. Buoy at 20m depth - standard deviation - Frequency band [3Fp,0.6Hz] ................... 14TABLE 16. Buoy at 20m depth - mean - Frequency band [3Fp,0.55Hz] ..................................... 15TABLE 17. Buoy at 20m depth - standard deviation - Frequency band [3Fp,0.55Hz] ................. 15TABLE 18. Fixed point at 100m depth - mean value - Frequency band [Fz,3Fp]........................ 16TABLE 19. Fixed point at 100m depth - standard deviation - Frequency band [Fz,3Fp] ............. 16TABLE 20. Fixed point at 100m depth - number of samples ....................................................... 16TABLE 21. Fixed point at 100m depth - mean - Frequency band [3Fp,0.6Hz] ............................ 17TABLE 22. Fixed point at 100m depth - standard deviation - Frequency band [3Fp,0.6Hz]........ 17TABLE 23. Fixed point at 10m depth - mean value - Frequency band [Fz,3Fp].......................... 18TABLE 24. Fixed point at 10m depth - standard deviation - Frequency band [Fz,3Fp] ............... 18TABLE 25. Fixed point at 10m depth - number of samples ......................................................... 18TABLE 26. Fixed point at 10m depth - mean - Frequency band [3Fp,0.6Hz] .............................. 19TABLE 27. Fixed point at 10m depth - standard deviation - Frequency band [3Fp,0.6Hz].......... 19TABLE 28. Frequency band [Fz,3Fp] - Tp > 8.5s - Hs > 2.5m .................................................... 20TABLE 29. Frequency band [3Fp,0.6Hz] - Tp > 8.5s - Hs > 2.5m............................................... 20
TABLE 30. Mean slope - Frequency band [Fp,3Fp] for S(k) = k-3.5 . .......................................... 21
TABLE 31. Mean slope - Frequency band [Fp,3Fp] for S(k) = k-4 . ............................................. 21

Page 23
IFREMER DITI/GO/SOM MAST2 CONTRACT CT92/0025 - WAVEMOD
List of Figures
FIGURE 1. : Slope dlog(S(f))/dlog(f) for S(k)=k-3.5 and different water depths........................ 7
FIGURE 2. : Slope dlog(S(f))/dlog(f) for S(k)=k-4 and different water depths .......................... 8