Embed Size (px)
Citation preview
Rebuilding Europe’s Competitiveness Findings from The Global Competitiveness Report Rome, October 30, 2012
The World Economic Forum has developed and produced
global, regional and topical competitiveness reports for
over 30 years
0
10,000
20,000
30,000
40,000
50,000
60,000
GD
P pe
r cap
ita (P
PP In
t.$)
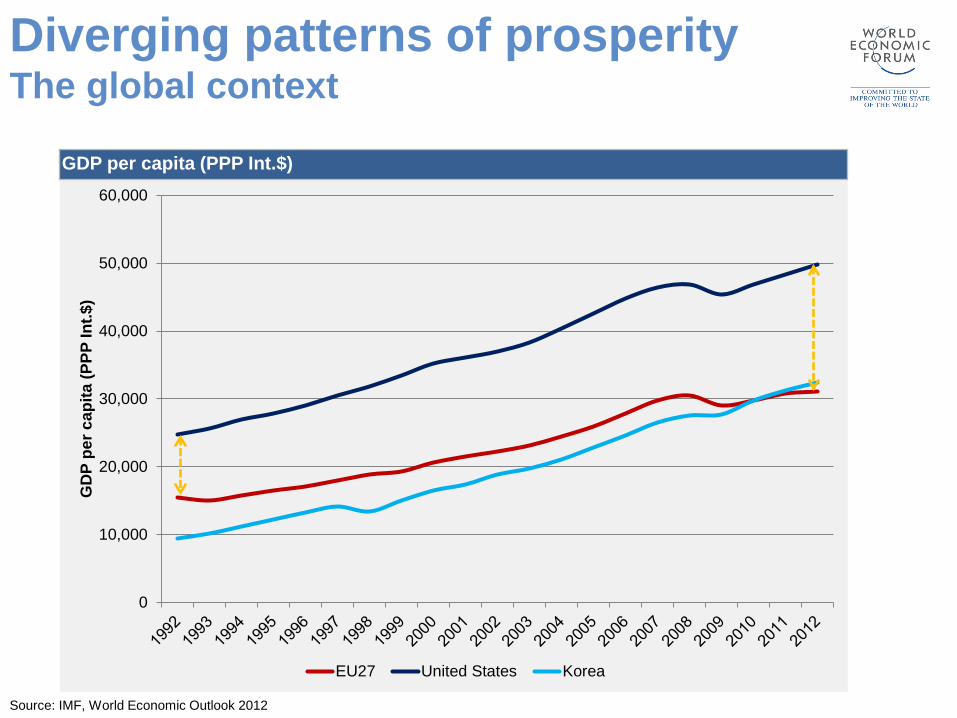
EU27 United States Korea
Source: IMF, World Economic Outlook 2012
GDP per capita (PPP Int.$)
Diverging patterns of prosperity The global context
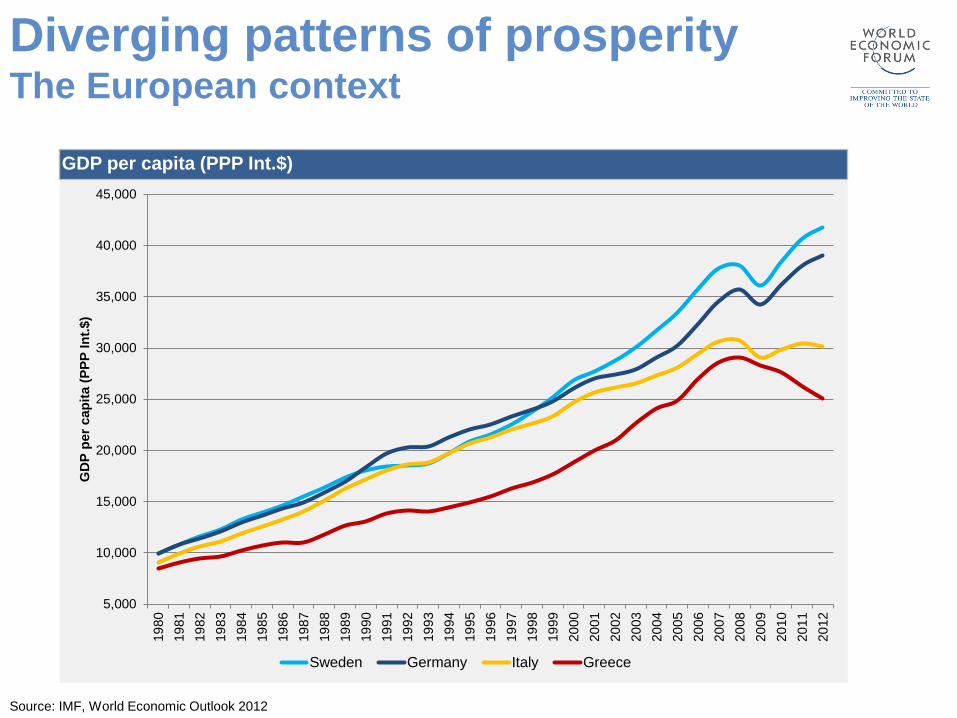
Source: IMF, World Economic Outlook 2012
GDP per capita (PPP Int.$)
Diverging patterns of prosperity The European context
5,000
10,000
15,000
20,000
25,000
30,000
35,000
40,000
45,000
1980
1981
1982
1983
1984
1985
1986
1987
1988
1989
1990
1991
1992
1993
1994
1995
1996
1997
1998
1999
2000
2001
2002
2003
2004
2005
2006
2007
2008
2009
2010
2011
2012
GD
P pe
r cap
ita (P
PP In
t.$)
Sweden Germany Italy Greece

How we define competitiveness: “The set of institutions, policies, and factors that determine the level of
productivity of a country”
The level of productivity, in turn, sets the level of prosperity that can be
earned by an economy.
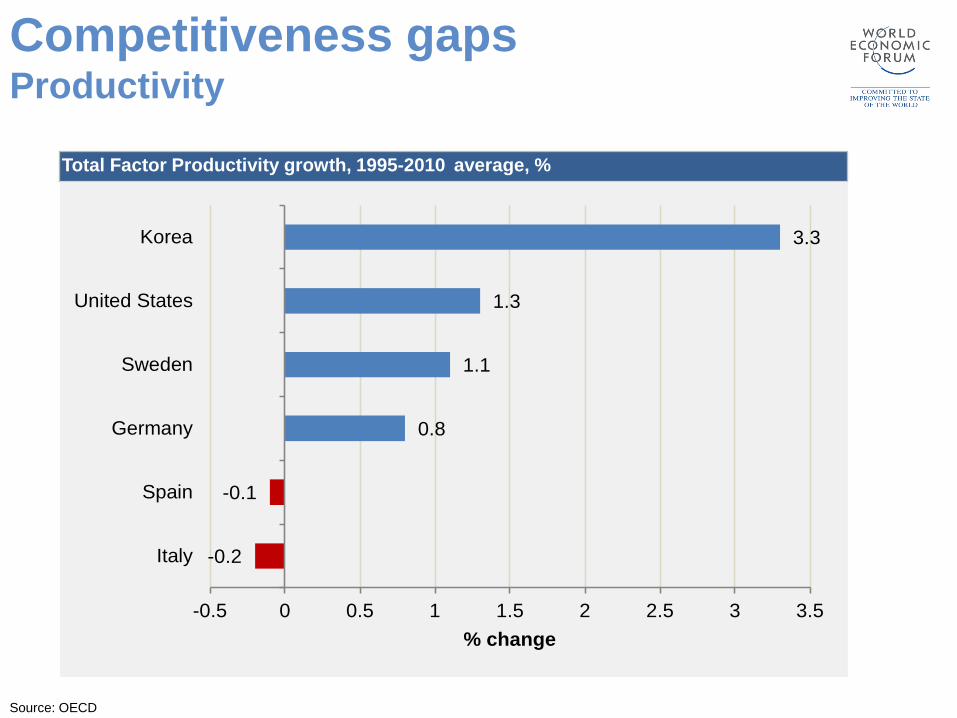
Source: OECD
Total Factor Productivity growth, 1995-2010 average, %
-0.2
-0.1
0.8
1.1
1.3
3.3
-0.5 0 0.5 1 1.5 2 2.5 3 3.5
Italy
Spain
Germany
Sweden
United States
Korea
% change
Competitiveness gaps Productivity
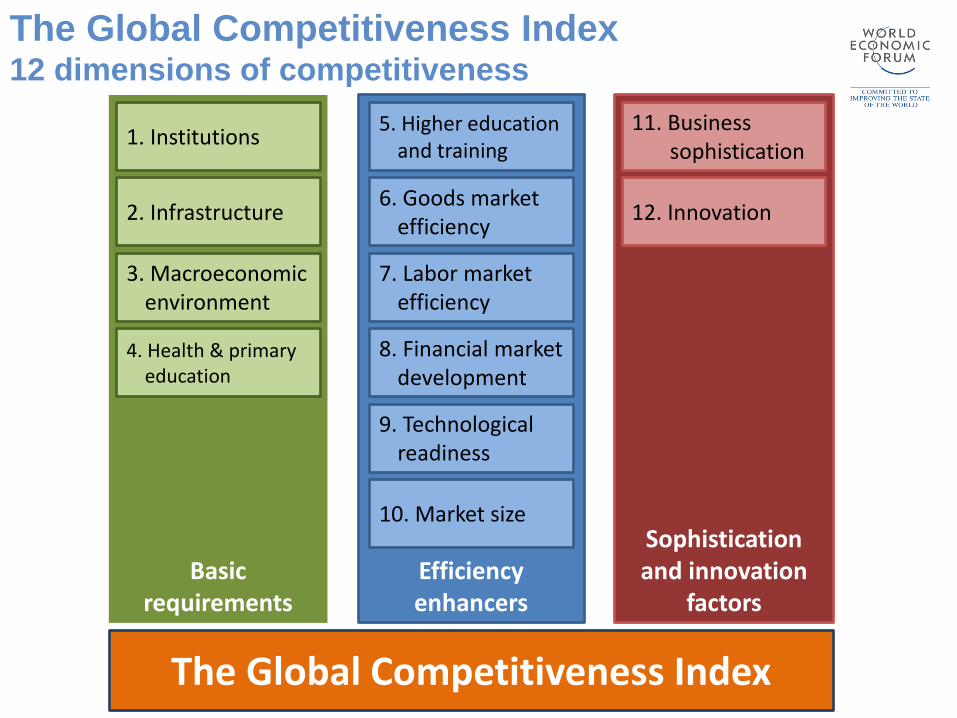
Basic requirements
Efficiency enhancers
Sophistication and innovation
factors
1. Institutions
2. Infrastructure
3. Macroeconomic environment
4. Health & primary education
5. Higher education and training
6. Goods market efficiency
7. Labor market efficiency
8. Financial market development
9. Technological readiness
11. Business sophistication
12. Innovation
10. Market size
The Global Competitiveness Index
The Global Competitiveness Index 12 dimensions of competitiveness
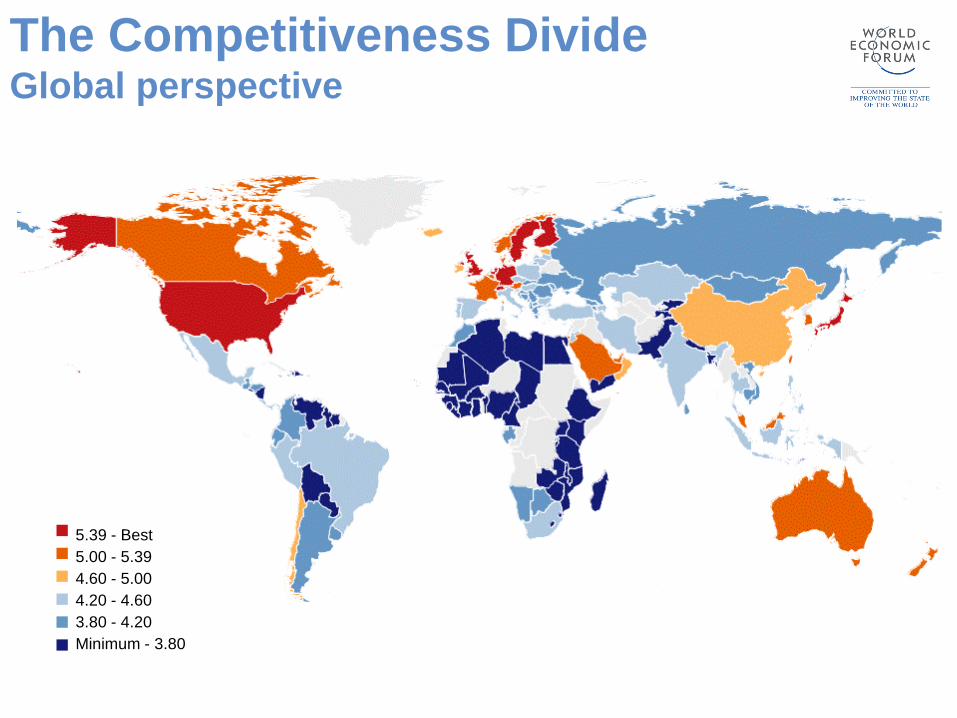
5.39 - Best 5.00 - 5.39 4.60 - 5.00 4.20 - 4.60 3.80 - 4.20 Minimum - 3.80
The Competitiveness Divide Global perspective
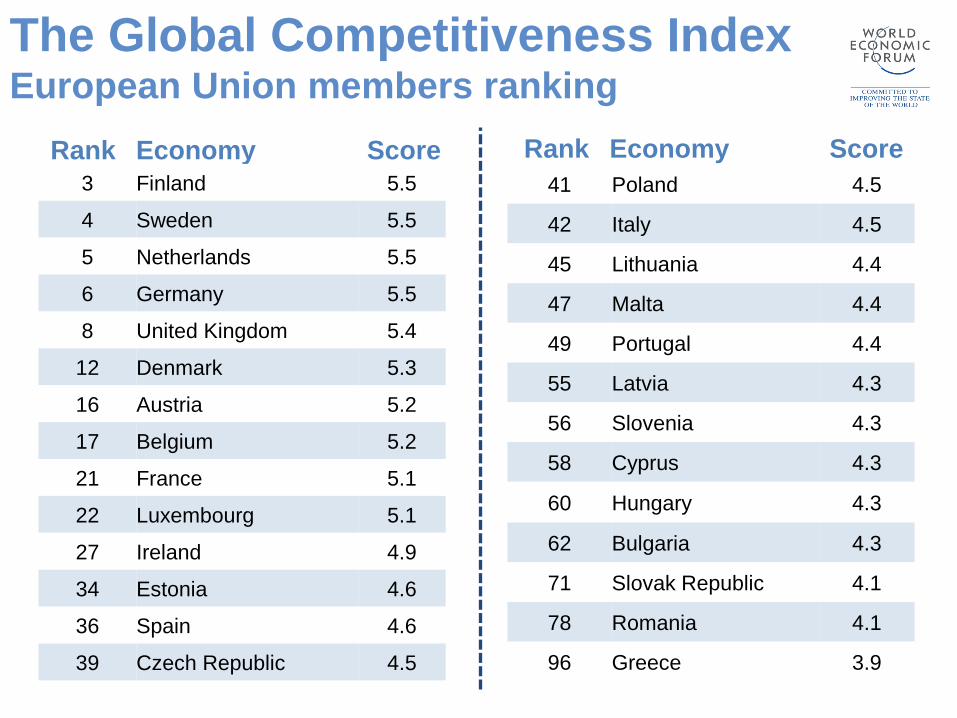
The Global Competitiveness Index European Union members ranking
Rank Economy Score Rank Economy Score 3 Finland 5.5
4 Sweden 5.5
5 Netherlands 5.5
6 Germany 5.5
8 United Kingdom 5.4
12 Denmark 5.3
16 Austria 5.2
17 Belgium 5.2
21 France 5.1
22 Luxembourg 5.1
27 Ireland 4.9
34 Estonia 4.6
36 Spain 4.6
39 Czech Republic 4.5
41 Poland 4.5
42 Italy 4.5
45 Lithuania 4.4
47 Malta 4.4
49 Portugal 4.4
55 Latvia 4.3
56 Slovenia 4.3
58 Cyprus 4.3
60 Hungary 4.3
62 Bulgaria 4.3
71 Slovak Republic 4.1
78 Romania 4.1
96 Greece 3.9
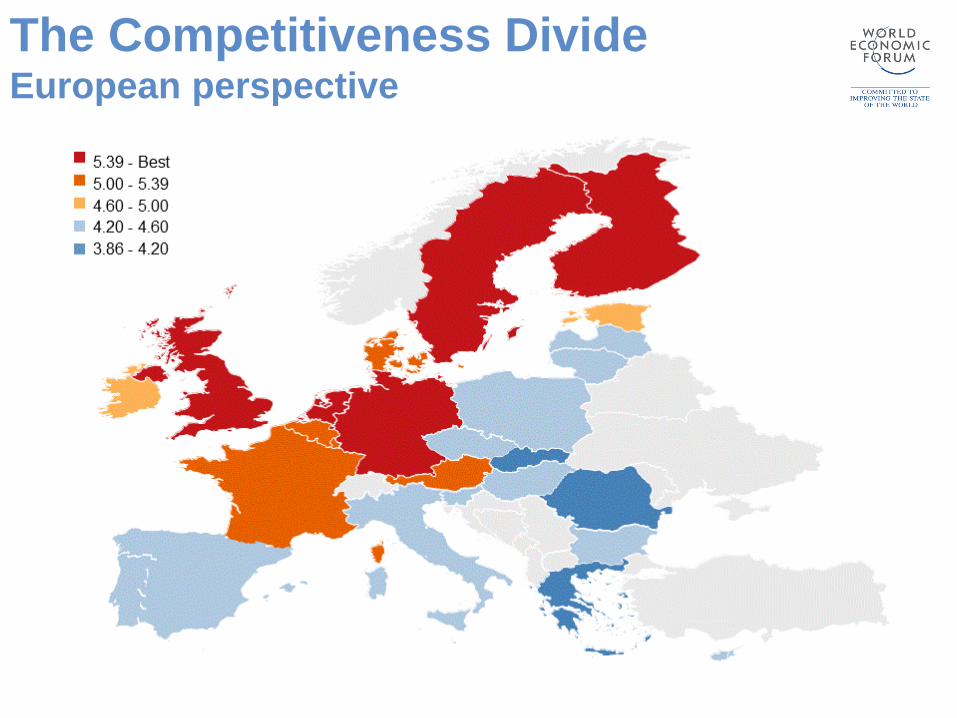
The Competitiveness Divide European perspective

1
2
3
4
5
6
7Institutions
Infrastructure
Macroeconomicenvironment
Health and primaryeducation
Higher education andtraining
Goods marketefficiencyLabor market efficiency
Financial marketdevelopment
Technologicalreadiness
Business sophistication
Innovation
United States EU 27 weighted average
Source: World Economic Forum
The Global Competitiveness Index United States and European Union
The Global Competitiveness Index, pillar scores (1-7 scale)
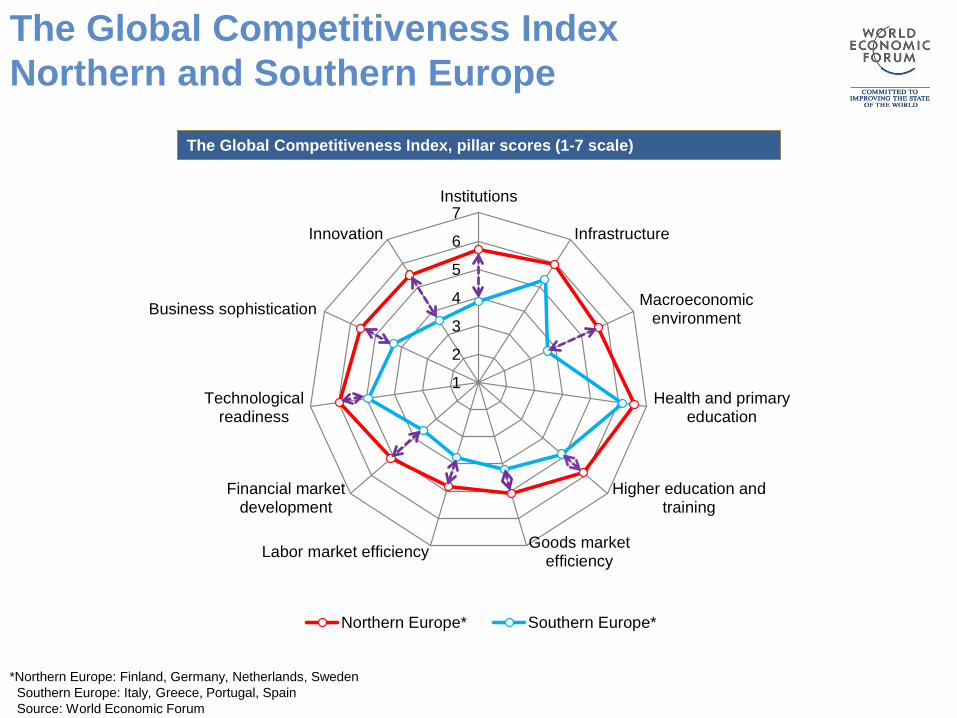
1
2
3
4
5
6
7Institutions
Infrastructure
Macroeconomicenvironment
Health and primaryeducation
Higher education andtraining
Goods marketefficiencyLabor market efficiency
Financial marketdevelopment
Technologicalreadiness
Business sophistication
Innovation
Northern Europe* Southern Europe*
*Northern Europe: Finland, Germany, Netherlands, Sweden Southern Europe: Italy, Greece, Portugal, Spain Source: World Economic Forum
The Global Competitiveness Index Northern and Southern Europe
The Global Competitiveness Index, pillar scores (1-7 scale)
Source: World Economic Forum
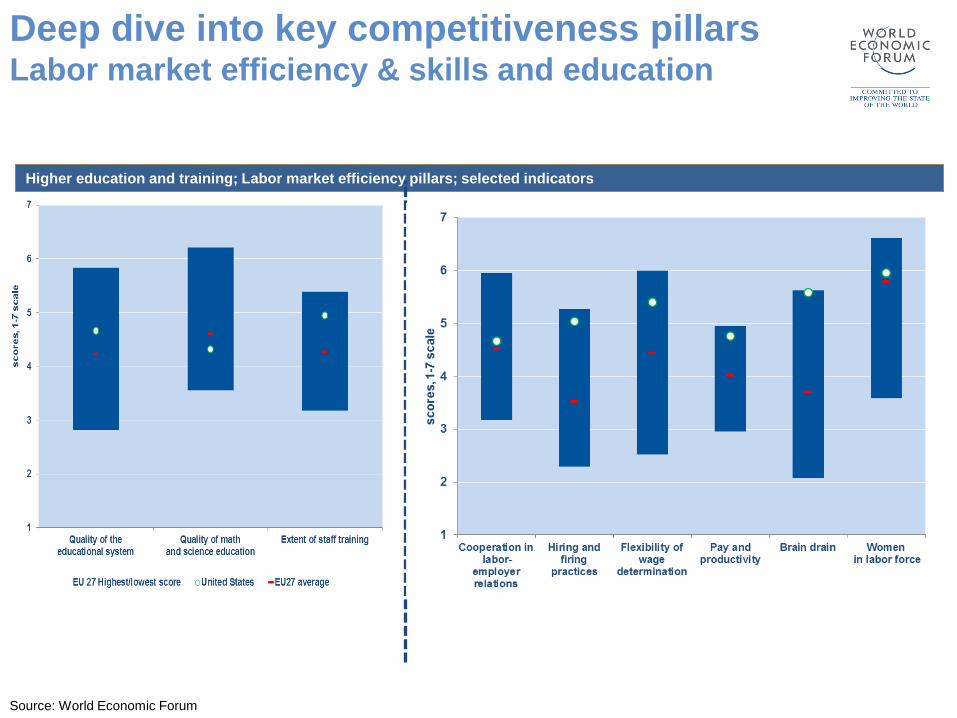
Deep dive into key competitiveness pillars Labor market efficiency & skills and education
Higher education and training; Labor market efficiency pillars; selected indicators
Source: World Economic Forum
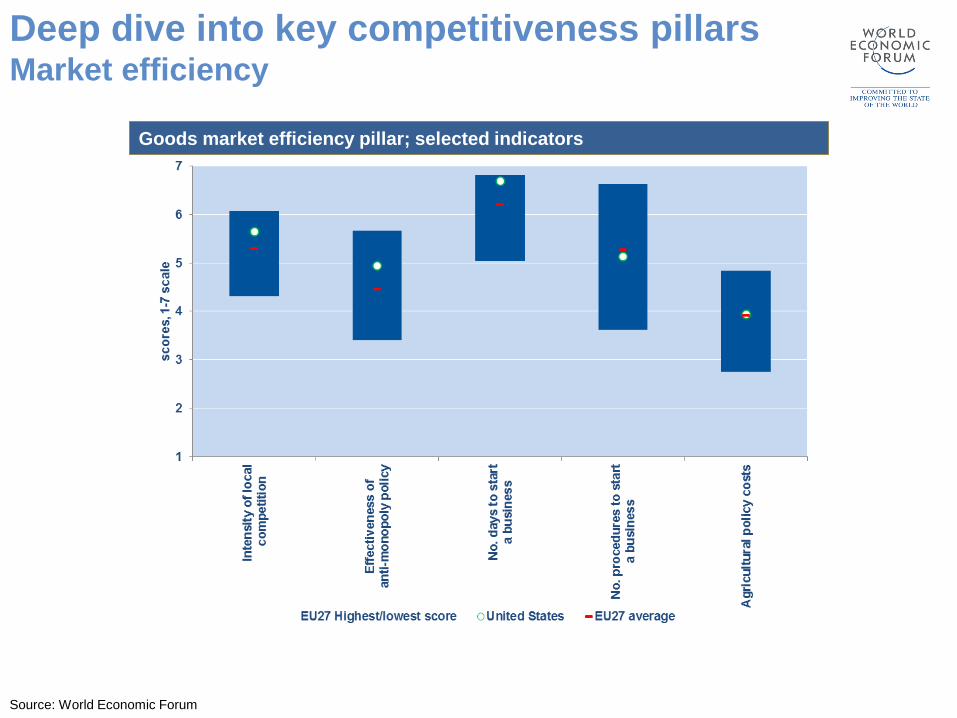
Deep dive into key competitiveness pillars Market efficiency
Goods market efficiency pillar; selected indicators
Source: World Economic Forum
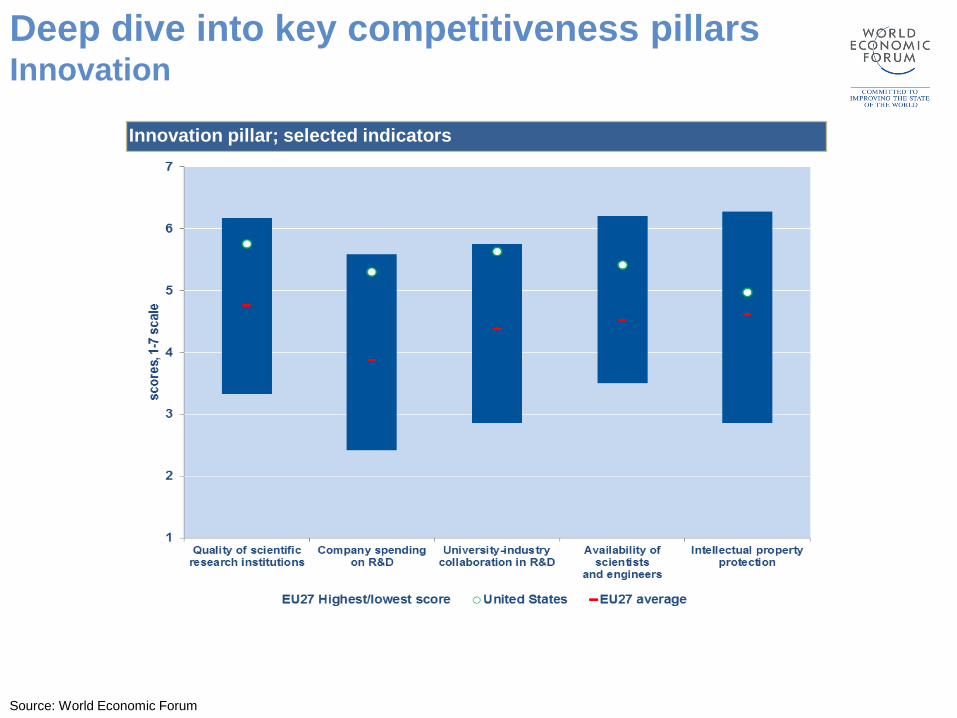
Innovation pillar; selected indicators
Deep dive into key competitiveness pillars Innovation
Concluding remarks
Without addressing the present weaknesses, Europe will continue to face difficulties in providing rising living standards and sustainable employment to its citizens.
At the core of the EU’s present economic and financial difficulties is its competitiveness gap. Europe as a whole has lost competitiveness in a global context, and the gap is widening among European economies.
Better mobilizing talent, increasing market efficiency, and harnessing Europe’s potential for innovation and entrepreneurship will be critical in this effort.
All countries and regions should be able to contribute to raising Europe’s competitiveness; especially those that are particularly lagging behind.