Embed Size (px)
Citation preview

What’s wrong with Hypothesis Testing?
Dr. Wolfgang Rolke
Seminar – Department of Mathematical Sciences
September 29, 2015
University of Puerto Rico - Mayaguez
How I got interested in this topic
2011: Madrid - TEST2011 – Conference on the Null Hypothesis Significance Testing (NHST) controversy
2014 Basic and Applied Social Psychology (BASP) puts NHST “on probation”
2015 BASP bans use of NHST in any paper published
→ so, what’s wrong with hypothesis testing?
and no, it’s not (just) the usual Frequentist vs Bayesian thing
Table of Contents
1) An example of a hypothesis test
2) A bit of history on hypothesis testing
3) The Fisher – Neyman controversy
4) The Frequentist – Bayesian controversy
5) The issues with NHST
6) What others propose as a solution
7) What I propose as a solution
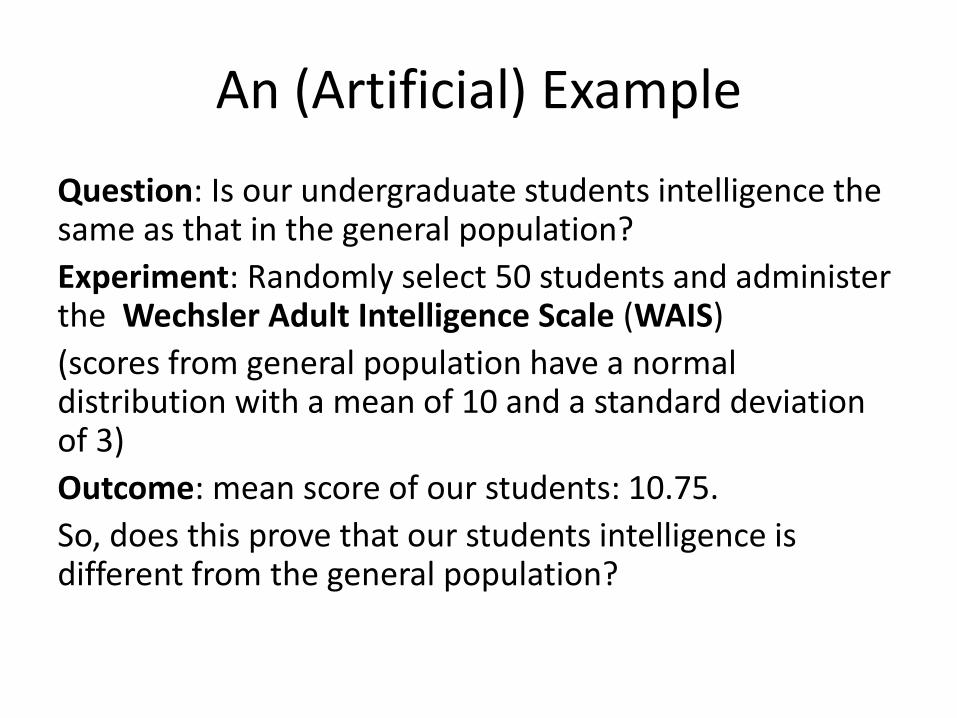
An (Artificial) Example
Question: Is our undergraduate students intelligence the same as that in the general population?
Experiment: Randomly select 50 students and administer the Wechsler Adult Intelligence Scale (WAIS)
(scores from general population have a normal distribution with a mean of 10 and a standard deviation of 3)
Outcome: mean score of our students: 10.75.
So, does this prove that our students intelligence is different from the general population?
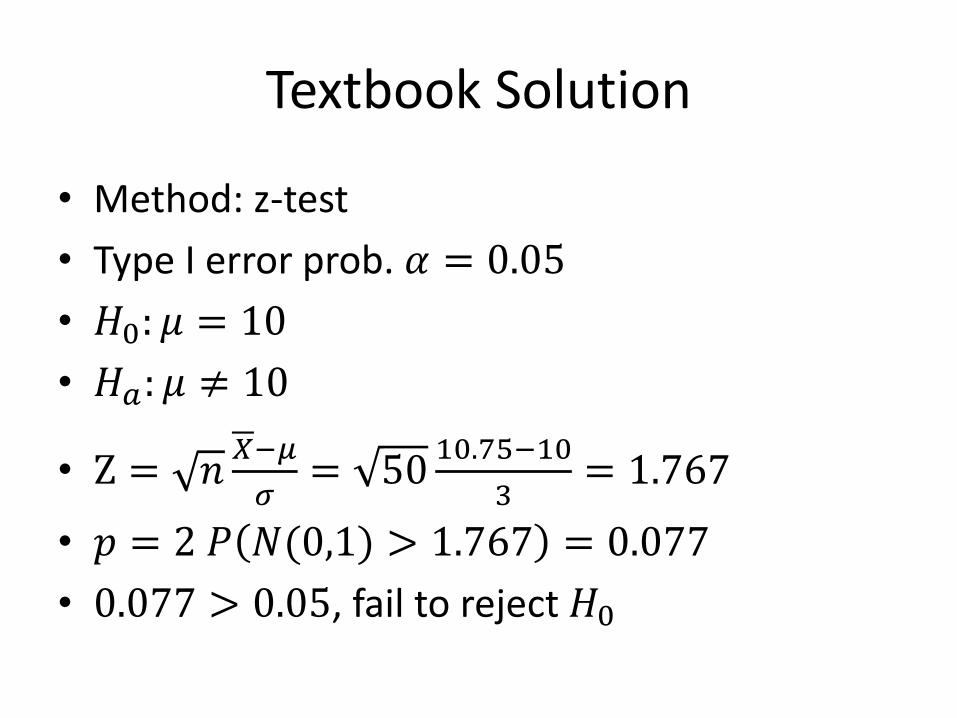
Textbook Solution
• Method: z-test
• Type I error prob. 𝛼 = 0.05
• 𝐻0: 𝜇 = 10
• 𝐻𝑎: 𝜇 ≠ 10
• Z = 𝑛𝑋−𝜇
𝜎= 50
10.75−10
3= 1.767
• 𝑝 = 2 𝑃 𝑁(0,1) > 1.767 = 0.077
• 0.077 > 0.05, fail to reject 𝐻0
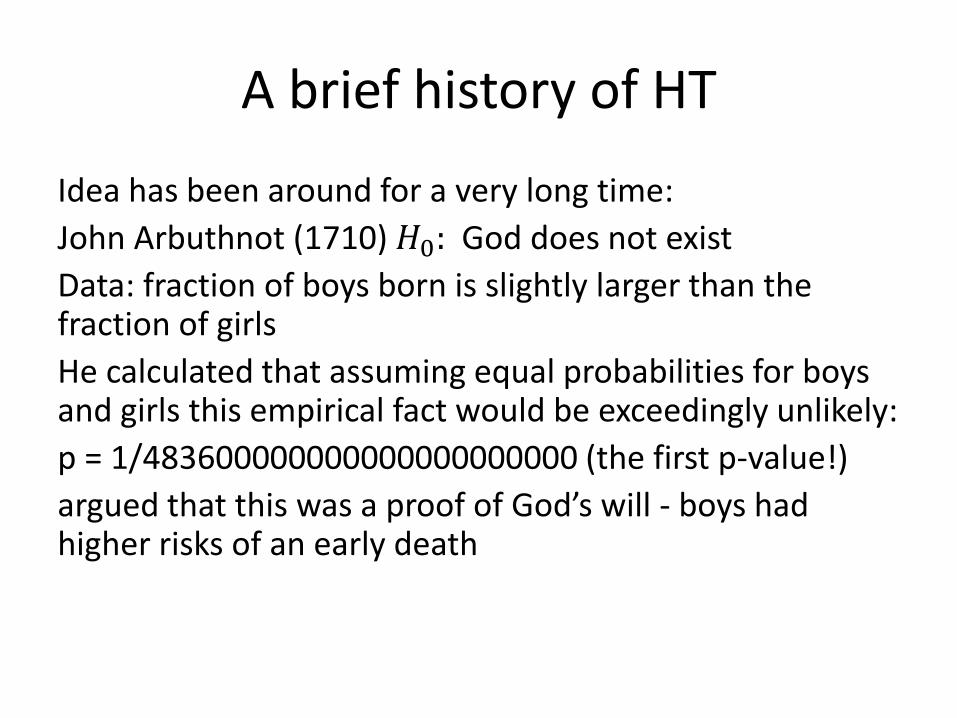
A brief history of HT
Idea has been around for a very long time:
John Arbuthnot (1710) 𝐻0: God does not exist
Data: fraction of boys born is slightly larger than the fraction of girls
He calculated that assuming equal probabilities for boys and girls this empirical fact would be exceedingly unlikely:
p = 1/483600000000000000000000 (the first p-value!)
argued that this was a proof of God’s will - boys had higher risks of an early death
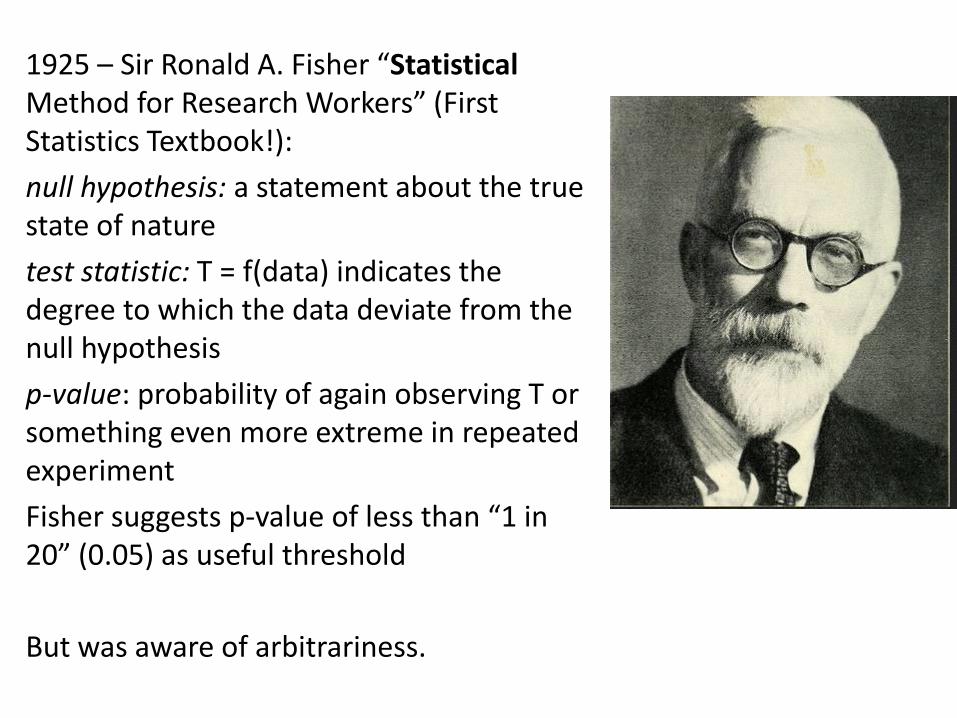
1925 – Sir Ronald A. Fisher “Statistical Method for Research Workers” (First Statistics Textbook!):
null hypothesis: a statement about the true state of nature
test statistic: T = f(data) indicates the degree to which the data deviate from the null hypothesis
p-value: probability of again observing T or something even more extreme in repeated experiment
Fisher suggests p-value of less than “1 in 20” (0.05) as useful threshold
But was aware of arbitrariness.
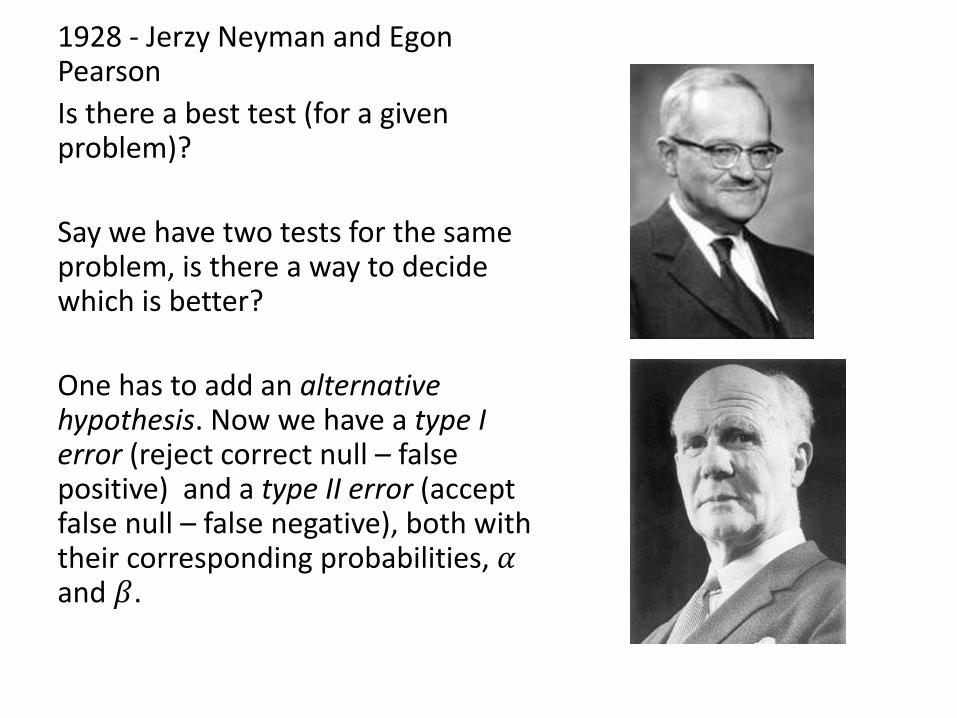
1928 - Jerzy Neyman and Egon Pearson
Is there a best test (for a given problem)?
Say we have two tests for the same problem, is there a way to decide which is better?
One has to add an alternative hypothesis. Now we have a type I error (reject correct null – false positive) and a type II error (accept false null – false negative), both with their corresponding probabilities, 𝛼 and 𝛽.
If two tests have the same 𝛼 but one has a lower 𝛽, it is better!
Usually one studies Power of test = 1 − 𝛽
In simple cases it is possible to find best test (Likelihood ratio test, Neyman-Pearson lemma)
Another way to view this testing procedure: it is a decision problem: decide which hypothesis is true
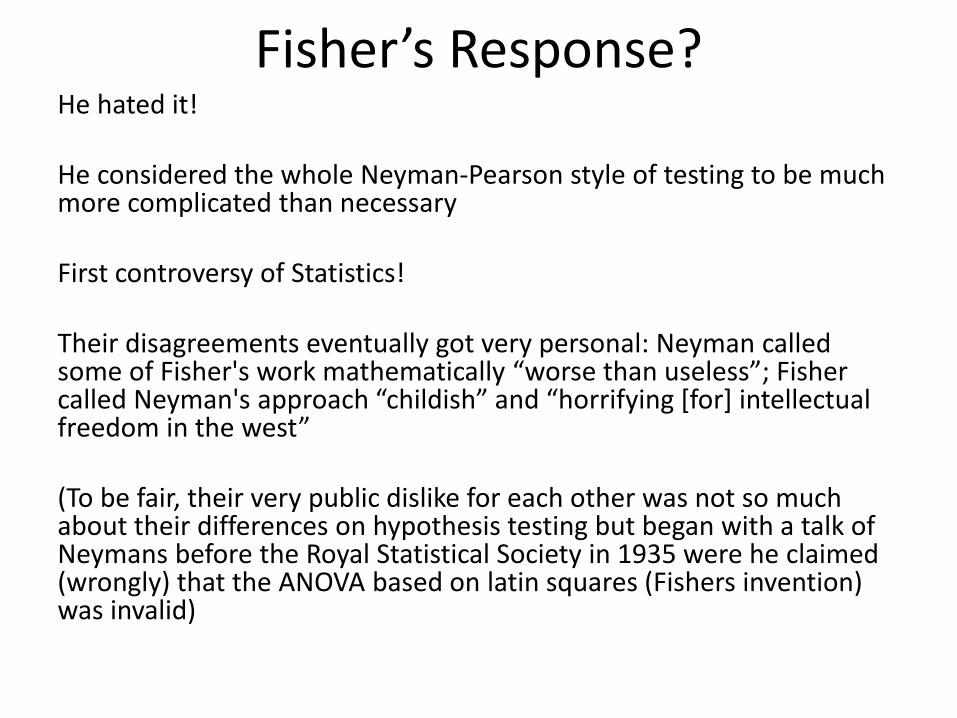
Fisher’s Response? He hated it! He considered the whole Neyman-Pearson style of testing to be much more complicated than necessary First controversy of Statistics! Their disagreements eventually got very personal: Neyman called some of Fisher's work mathematically “worse than useless”; Fisher called Neyman's approach “childish” and “horrifying [for] intellectual freedom in the west” (To be fair, their very public dislike for each other was not so much about their differences on hypothesis testing but began with a talk of Neymans before the Royal Statistical Society in 1935 were he claimed (wrongly) that the ANOVA based on latin squares (Fishers invention) was invalid)
Fisher vs Neyman Fisher was a working Scientist first (Rothamstead experimental station, biology and genetics)
Most important question for him: does my theory agree with my data?
Neyman was a Mathematician (student of Sergei Bernstein), interested in the theory of testing and optimality.
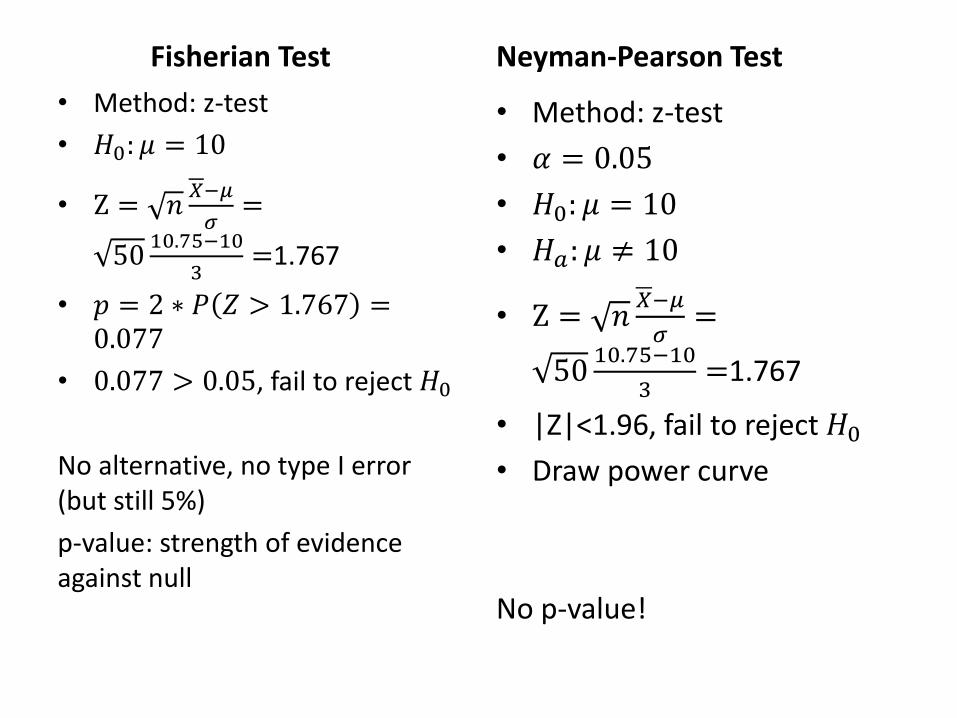
Fisherian Test
• Method: z-test
• 𝐻0: 𝜇 = 10
• Z = 𝑛𝑋−𝜇
𝜎=
5010.75−10
3=1.767
• 𝑝 = 2 ∗ 𝑃 𝑍 > 1.767 =0.077
• 0.077 > 0.05, fail to reject 𝐻0
No alternative, no type I error (but still 5%)
p-value: strength of evidence against null
Neyman-Pearson Test
• Method: z-test
• 𝛼 = 0.05
• 𝐻0: 𝜇 = 10
• 𝐻𝑎: 𝜇 ≠ 10
• Z = 𝑛𝑋−𝜇
𝜎=
5010.75−10
3=1.767
• |Z|<1.96, fail to reject 𝐻0
• Draw power curve
No p-value!
Who won?
Today’s hypothesis testing is a hybrid of both, which neither would have liked. It is, however much closer to Neyman-Pearson than Fisher. Fisherian testing survives in Goodness-of-fit tests (𝐻0: Data comes from normal distribution) because there the space of alternatives is just to large to be useful.
They both agreed on one thing, though:
No Bayesian Statistics! (back then called inverse probability)
Fisher: “The theory of inverse probability is founded up on an error, and must be wholly rejected” (1925, Statistical Methods for Research Workers)
→ The second controversy in Statistics: Frequentist vs Bayesian Statistics
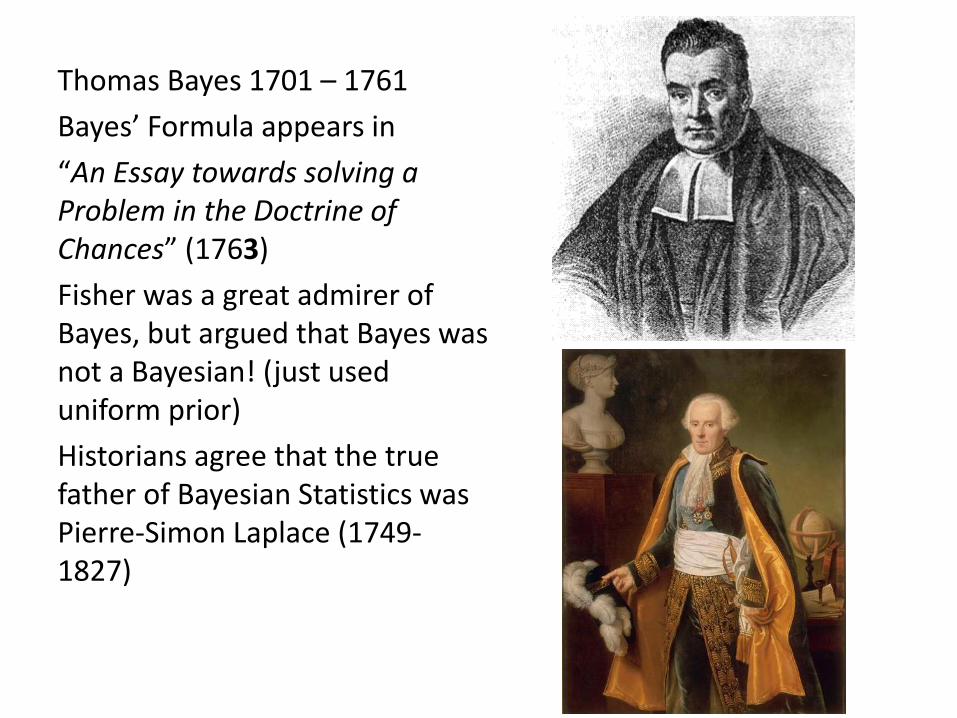
Thomas Bayes 1701 – 1761
Bayes’ Formula appears in
“An Essay towards solving a Problem in the Doctrine of Chances” (1763)
Fisher was a great admirer of Bayes, but argued that Bayes was not a Bayesian! (just used uniform prior)
Historians agree that the true father of Bayesian Statistics was Pierre-Simon Laplace (1749-1827)
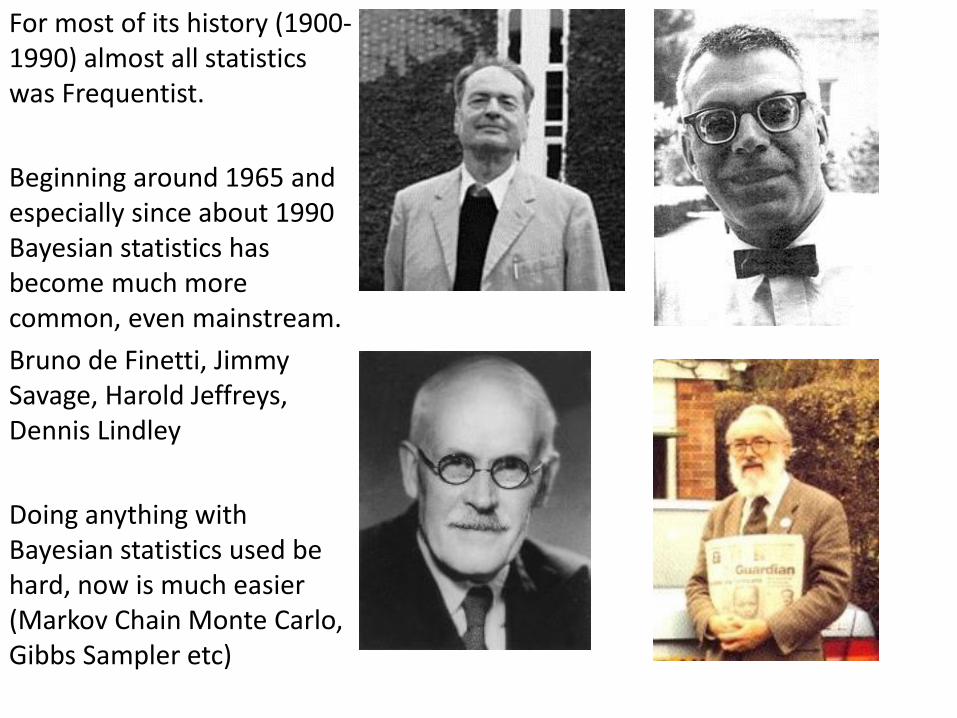
For most of its history (1900-1990) almost all statistics was Frequentist.
Beginning around 1965 and especially since about 1990 Bayesian statistics has become much more common, even mainstream.
Bruno de Finetti, Jimmy Savage, Harold Jeffreys, Dennis Lindley
Doing anything with Bayesian statistics used be hard, now is much easier (Markov Chain Monte Carlo, Gibbs Sampler etc)
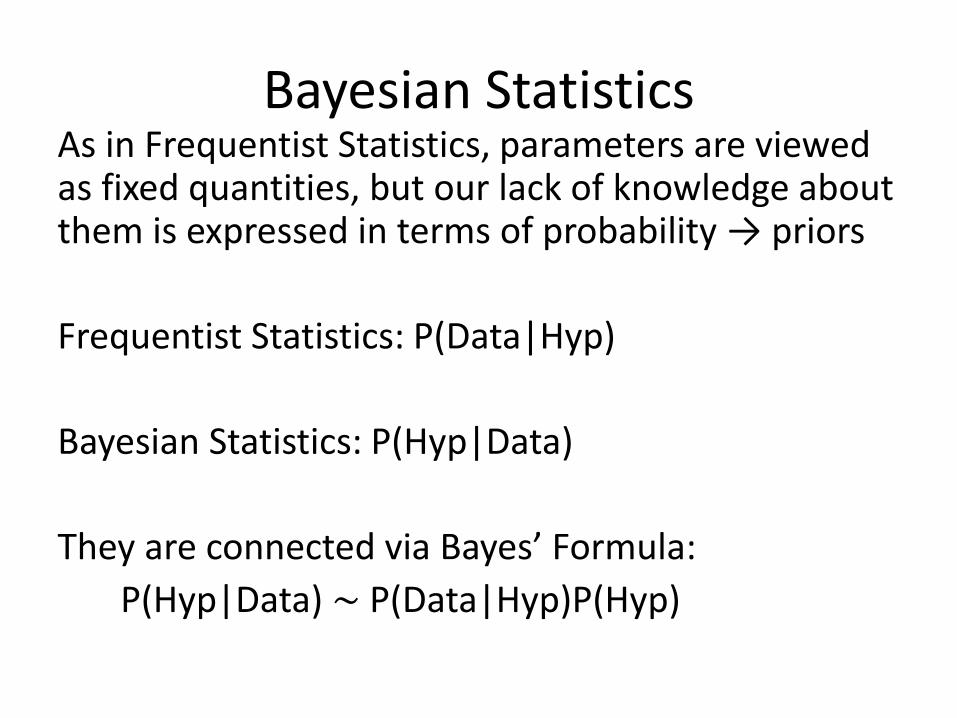
Bayesian Statistics As in Frequentist Statistics, parameters are viewed as fixed quantities, but our lack of knowledge about them is expressed in terms of probability → priors
Frequentist Statistics: P(Data|Hyp)
Bayesian Statistics: P(Hyp|Data)
They are connected via Bayes’ Formula:
P(Hyp|Data) ~ P(Data|Hyp)P(Hyp)
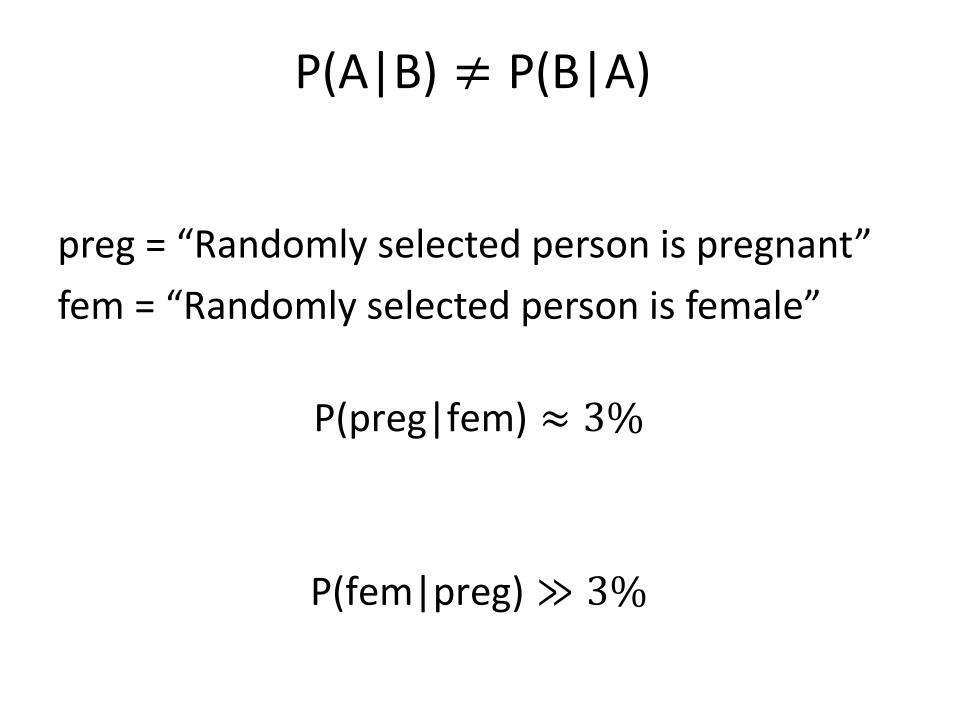
P(A|B) ≠ P(B|A)
preg = “Randomly selected person is pregnant”
fem = “Randomly selected person is female”
P(preg|fem) ≈ 3%
P(fem|preg) ≫ 3%
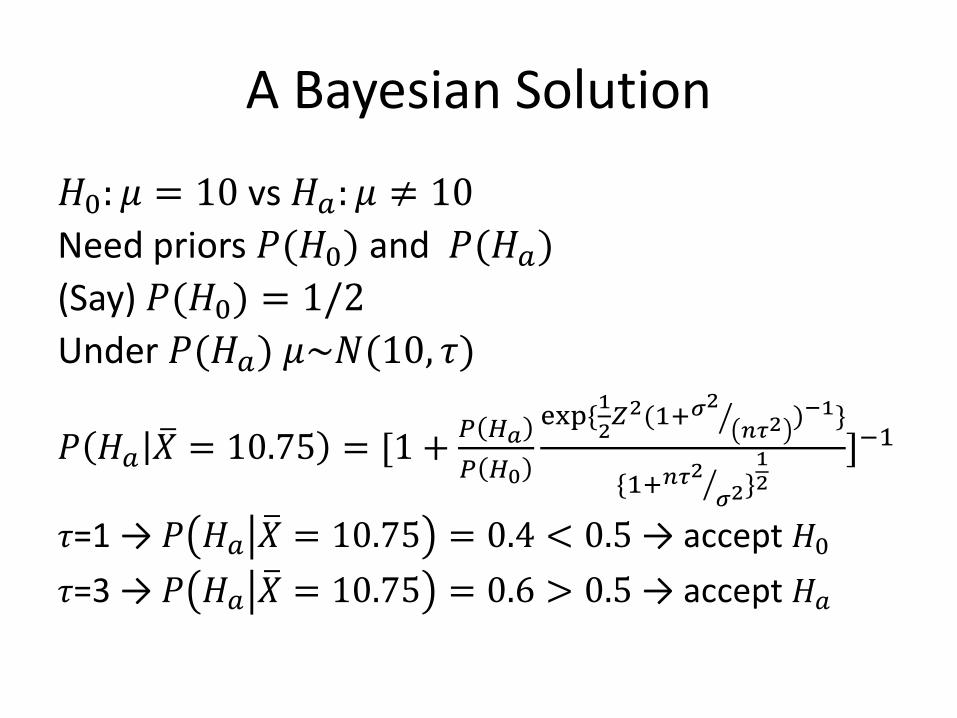
A Bayesian Solution
𝐻0: 𝜇 = 10 vs 𝐻𝑎: 𝜇 ≠ 10 Need priors 𝑃(𝐻0) and 𝑃(𝐻𝑎)
(Say) 𝑃(𝐻0) = 1/2
Under 𝑃(𝐻𝑎) 𝜇~𝑁(10, 𝜏)
𝑃 𝐻𝑎 𝑋 = 10.75 = [1 +𝑃 𝐻𝑎
𝑃 𝐻0
exp {1
2𝑍2(1+𝜎2
𝑛𝜏2 )−1}
{1+𝑛𝜏2
𝜎2 }
12
]−1
𝜏=1 → 𝑃 𝐻𝑎 𝑋 = 10.75 = 0.4 < 0.5 → accept 𝐻0
𝜏=3 → 𝑃 𝐻𝑎 𝑋 = 10.75 = 0.6 > 0.5 → accept 𝐻𝑎
Issues with Bayesian Hypothesis Testing
Intrinsically subjective: 𝑃(𝐻0) and 𝑃(𝐻𝑎)
Needs different prior from corresponding estimation problem
Math is much harder
But gives the right answer: P(Hyp|Data)
Is there a problem with NHST?
Lakatos (1978) I wonder whether the function of statistical techniques in the social sciences is not primarily to provide a machinery for producing phony corroborations and thereby a semblance of “scientific progress” where, in fact, there is nothing but an increase in pseudo-intellectual garbage Rozeboom (1997) NHST is surely the most bone-headedly misguided procedure ever institutionalized in the rote training of science students
So what’s wrong with NHST?
First of all: p-values! Misinterpretation of p-values as probability that null hypothesis is true This would be P(Hyp|Data)!! Only Bayesians can calculate this Historically in part to blame on confusion of Fisherian and Neyman-Pearson testing
p - value
What’s so special about p<0.05?
Absolutely nothing!! But used as a hard cut-off
Lack of understanding that a p-value is a random variable, with its own (often surprisingly large) standard deviation
No real difference between p=0.04 and p=0.06
It can make a huge difference in real live, though:
p-hacking Hard to get paper with non-significant result (p>0.05) accepted for publication (This issue is problematic on its own: it ignores the fact that on occasion the fact that nothing was found might actually be interesting. This practice also can lead others to repeat the same research, which they might not have done if they had known about the unsuccessful one. Finally it leads to a bias towards stat. sign results, which makes any meta-analysis hard) So you worked hard on your research, had a good theory, did an experiment, but got p=0.1 All that effort wasted! But hold on: just do the experiment again, hopefully then p<0.05! Saved! Let’s get that Nobel…
Problem: probability theory says if null is true, p value has uniform distribution, so eventually we are guaranteed to get p<0.05!
→ p hacking
Also known as torturing the data until it confesses
A related claim: p-values are not reproducible
So say you did an experiment and got p=0.03, now you repeat the exact same experiment, should you get p=0.03 again?
Of course not, p value is a random variable! And if 𝐻0 is true, or almost so, p has uniform distribution
But many people think they should
Why 𝛼 = 0.05?
Because Fisher said so in his book
But is it reasonable to use the same discovery threshold if
Commit type I error → loose some money
Commit type I error → people die
Or in these cases:
𝐻0: men and women is USA have the same income (a null which we all are pretty sure is wrong)
𝐻0: Aliens have never visited planet earth
(a null which most of us would be quite surprised if it turns out to be wrong)
“Extraordinary claims require extraordinary evidence”
The straw-person null
Our null hypothesis: 𝐻0: 𝜇 = 10 But in fact we all know that 𝜇 ≠ 10 After all, 10.0001 ≠ 10 In many sciences null hypotheses are known a-priori to be false – so why test them? Not all sciences: High Energy Physics 2011
𝐻0: Higgs Boson does not exist
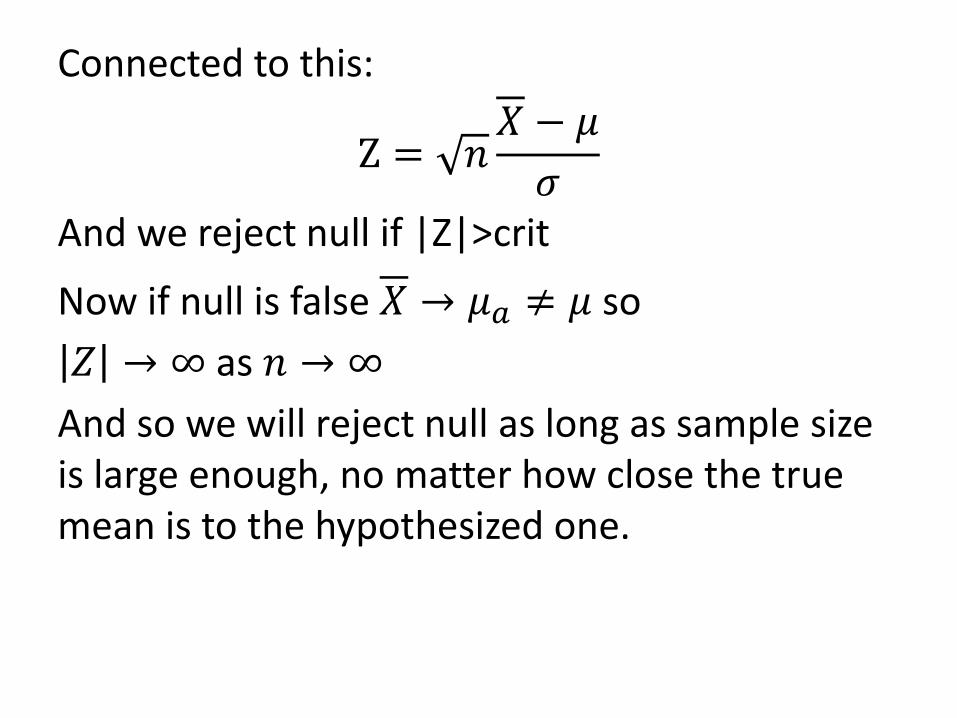
Connected to this:
Z = 𝑛𝑋 − 𝜇
𝜎
And we reject null if |Z|>crit
Now if null is false 𝑋 → 𝜇𝑎 ≠ 𝜇 so
𝑍 → ∞ as 𝑛 → ∞
And so we will reject null as long as sample size is large enough, no matter how close the true mean is to the hypothesized one.
Statistical vs Practical Significance
So let’s say it were true that 𝜇 = 10.1 for our students.
This would be statistically significant if we tested about 3000 students
But what does it matter?
Such a tiny difference could not possibly have any practical consequences
What has been the response to the BASP ban?
Mostly negative: ban is silly
Misused doesn’t mean wrong
Typical Example:
I share the editors’ concerns that inferential statistical methods are open to misuse and misinterpretation , but do not feel that a blanket ban on any particular
inferential method is the most constructive response. Peter Diggle – President, Royal Statistical Society
So what is the solution?
Use confidence intervals instead of testing
A Statisticians response: What????
For us hypothesis testing and confidence interval estimation are two sides of the same coin, if you got one you got the other…
But not a great solution either:
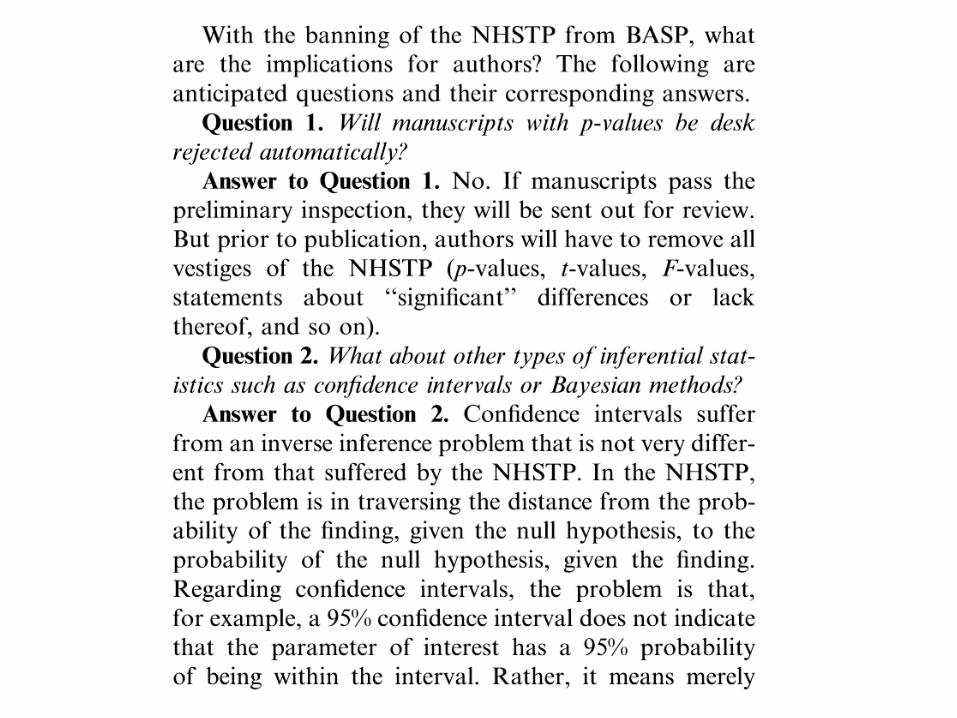
Confidence intervals are also routinely misinterpreted: A 95% CI for the true mean intelligence score of URP undergraduate students is (9.92, 11.58) Ah, so the probability that the true iq is in (9.92, 11.58) is 0.95! NO!!!!!! Again, this is P(Hyp|Data), and only Bayesians are allowed to talk about those (they call theirs credible intervals) In fact, the new editorial policy of BASP does not allow the use of CI’s either (see Question 2):
So not even confidence intervals?
This one is fairly new, replacing NHST with confidence intervals used to be the recommendation of most critics of NHST
What’s left? Just giving effect sizes (point estimates)
But as Statisticians know, without standard errors these are useless, and with standard errors we are (almost) back at confidence intervals!
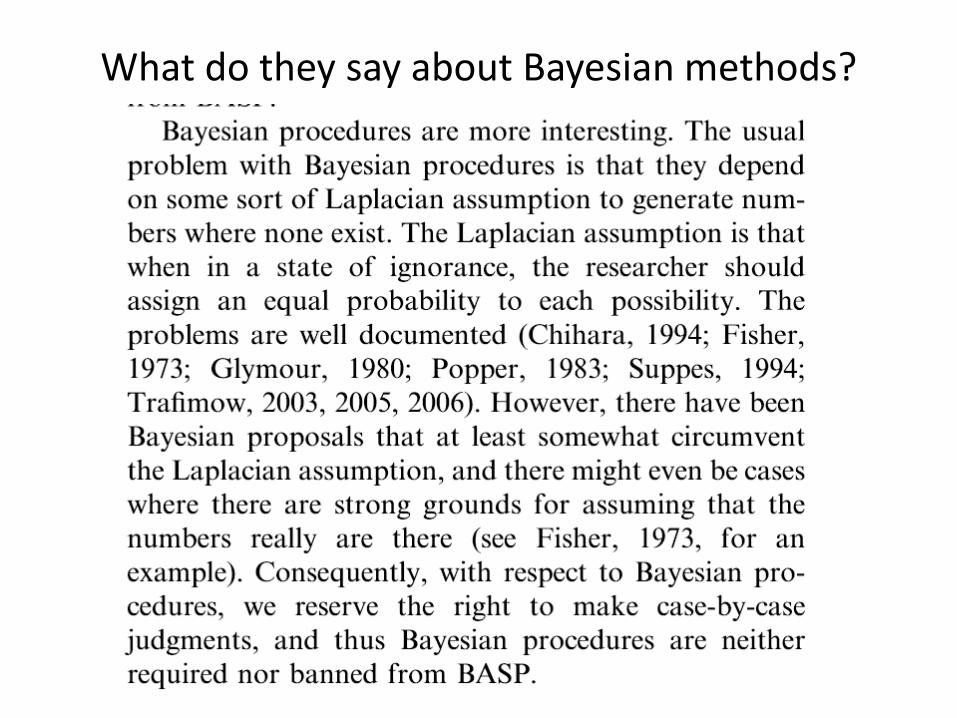
What do they say about Bayesian methods?
So, Bayes it is?
Except… Yes, it does give the right answer, P(Hyp|Data), but at the price of a prior, and a subjective one at that. Even a Bayesian test will not solve all the problems: Will also always reject a false null if sample size is large enough → does not solve straw-person null problem Also needs an arbitrary cut-off for accepting null or alternative Is a lot of work even for very simple problems Needs a lot of mathematical sophistication to be properly understood (and correctly applied) I will not try to teach the formula for 𝑃 𝐻𝑎 𝑋 to students who have troubles with calculating a standard deviation!

What I think
In most cases a confidence interval is better than a hypothesis test As long as everyone is clear on their limitations (P(Data|Hyp) only) Frequentist methods work just fine There should always be a discussion of what 𝛼 is appropriate (consequences of wrong decisions) and what effect size is interesting (power of test). Bayesian methods are always better (if you can agree on a prior, if you understand the math and if you know about things like MCMC, sensitivity analysis etc.)
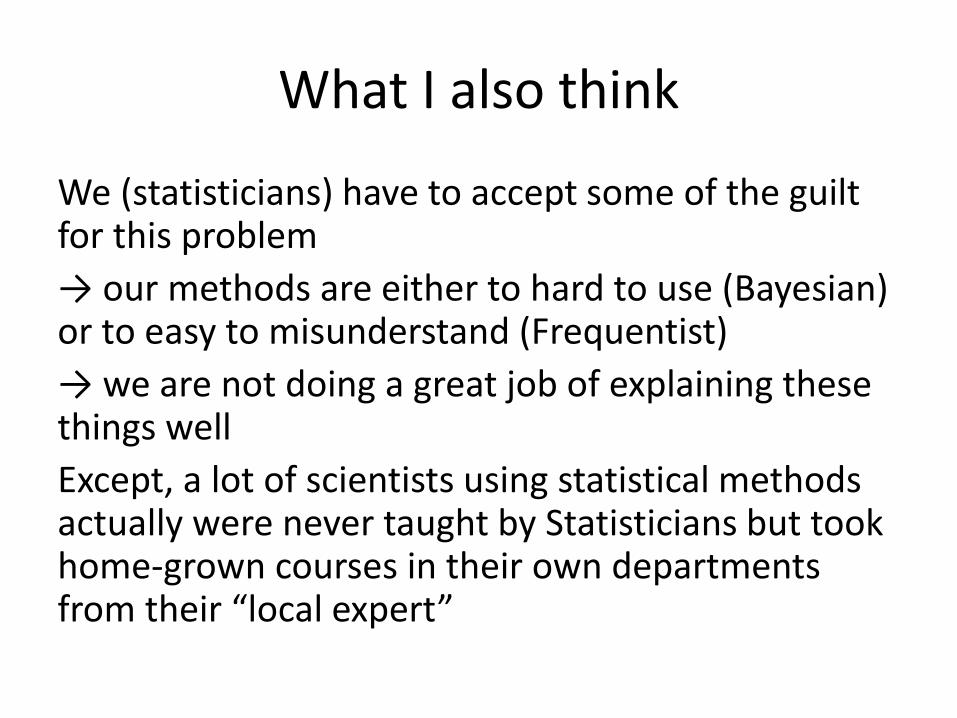
What I also think
We (statisticians) have to accept some of the guilt for this problem
→ our methods are either to hard to use (Bayesian) or to easy to misunderstand (Frequentist)
→ we are not doing a great job of explaining these things well
Except, a lot of scientists using statistical methods actually were never taught by Statisticians but took home-grown courses in their own departments from their “local expert”
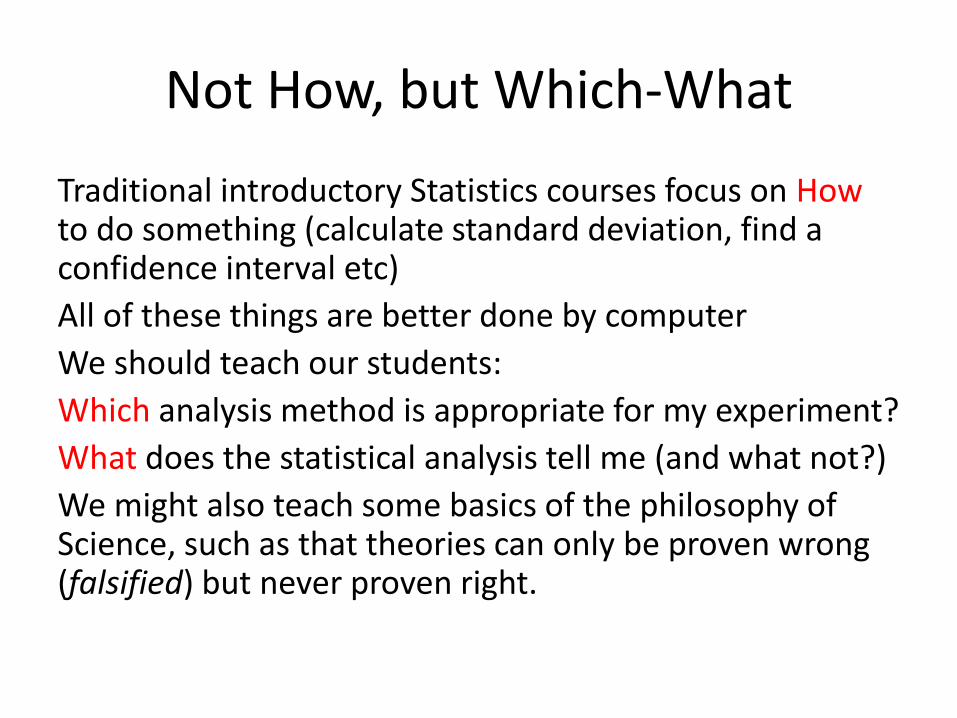
Not How, but Which-What
Traditional introductory Statistics courses focus on How to do something (calculate standard deviation, find a confidence interval etc)
All of these things are better done by computer
We should teach our students:
Which analysis method is appropriate for my experiment?
What does the statistical analysis tell me (and what not?)
We might also teach some basics of the philosophy of Science, such as that theories can only be proven wrong (falsified) but never proven right.
But it is hard enough to teach our students the How, is it not impossible to teach concepts like the meaning of a p-value?
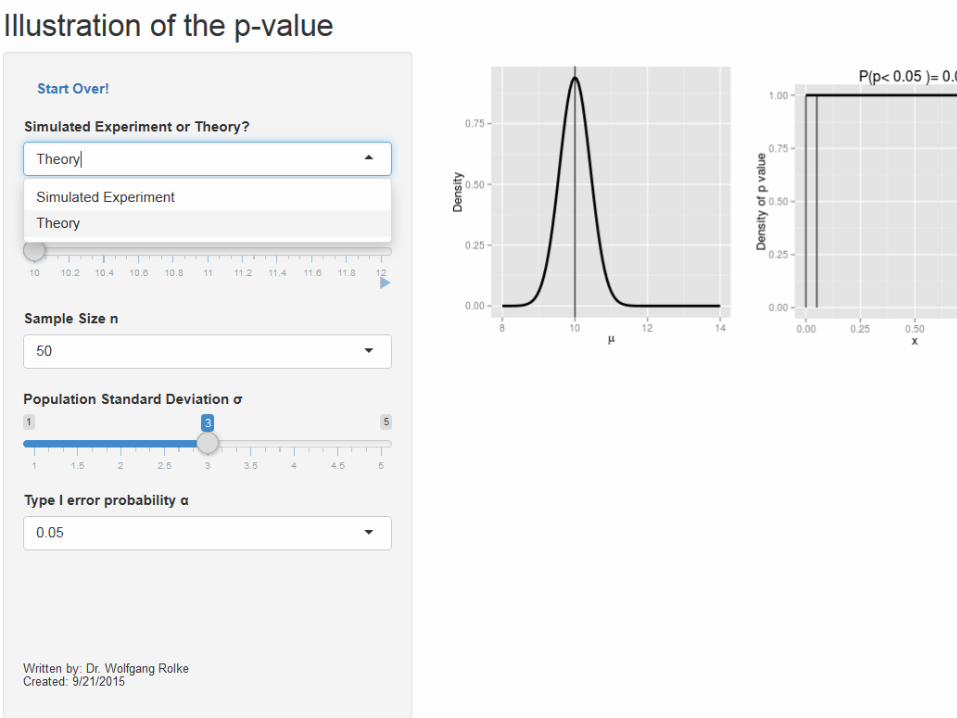
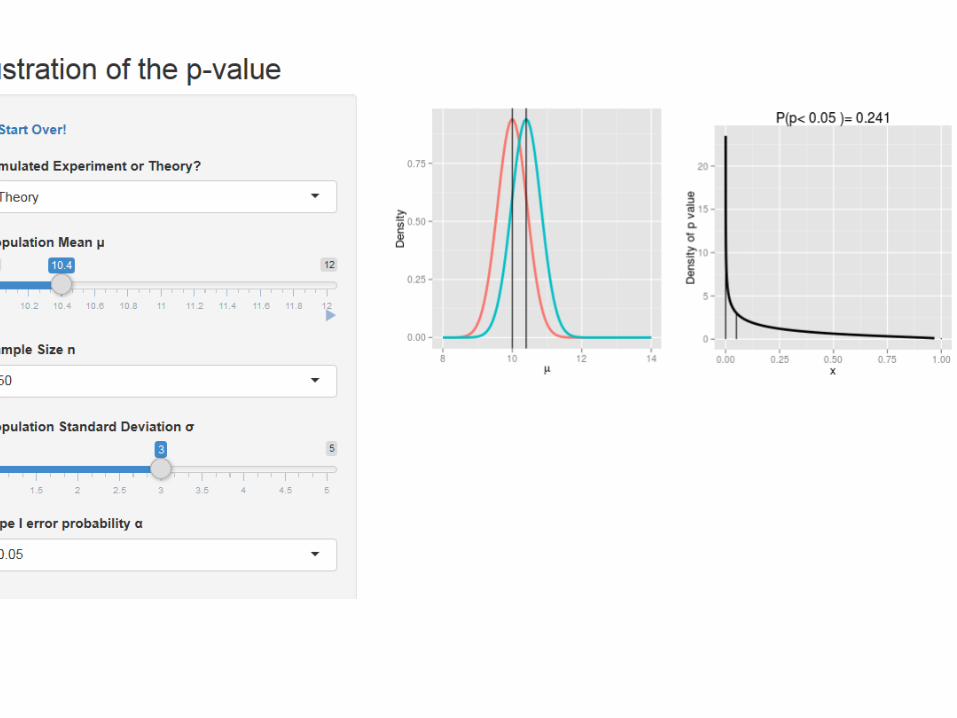
Technology to the rescue!
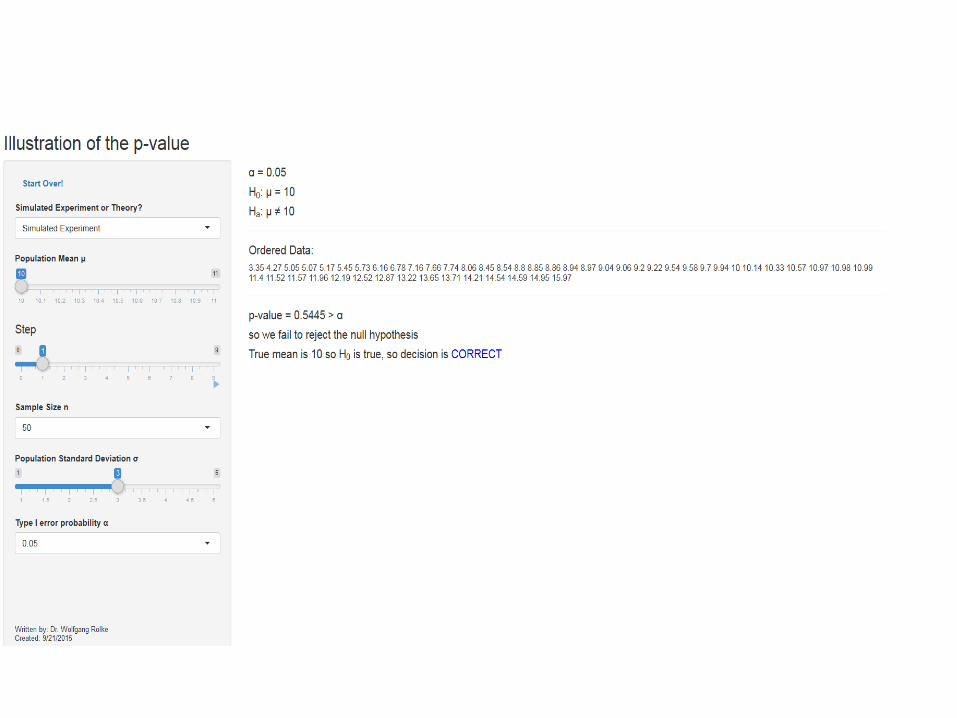
Example: Shiny apps
For our testing problem:
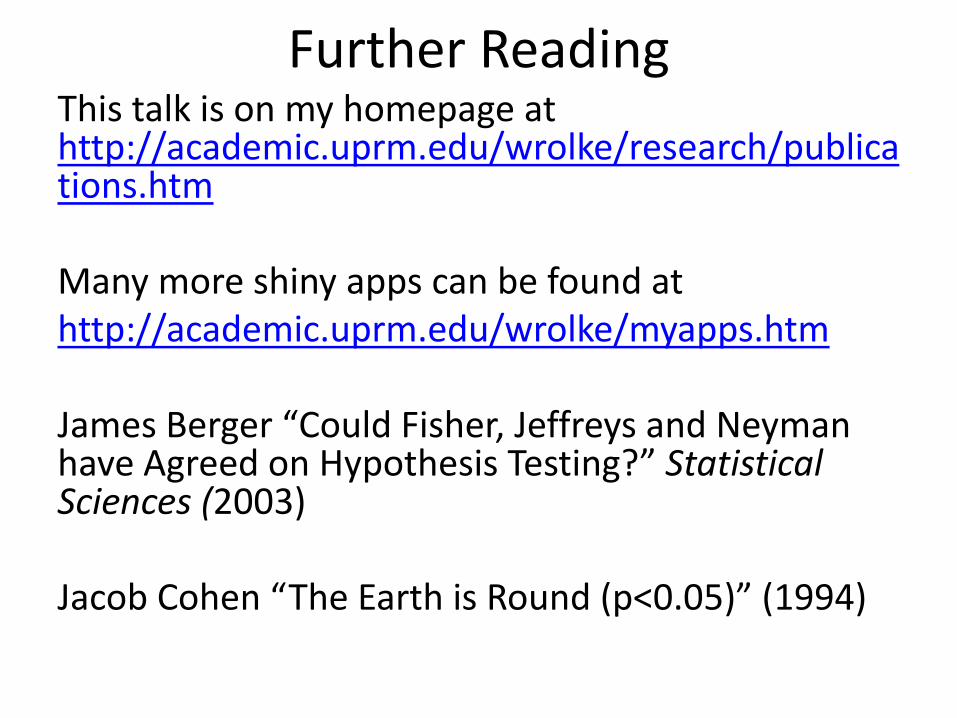
Further Reading This talk is on my homepage at http://academic.uprm.edu/wrolke/research/publications.htm Many more shiny apps can be found at http://academic.uprm.edu/wrolke/myapps.htm James Berger “Could Fisher, Jeffreys and Neyman have Agreed on Hypothesis Testing?” Statistical Sciences (2003) Jacob Cohen “The Earth is Round (p<0.05)” (1994)
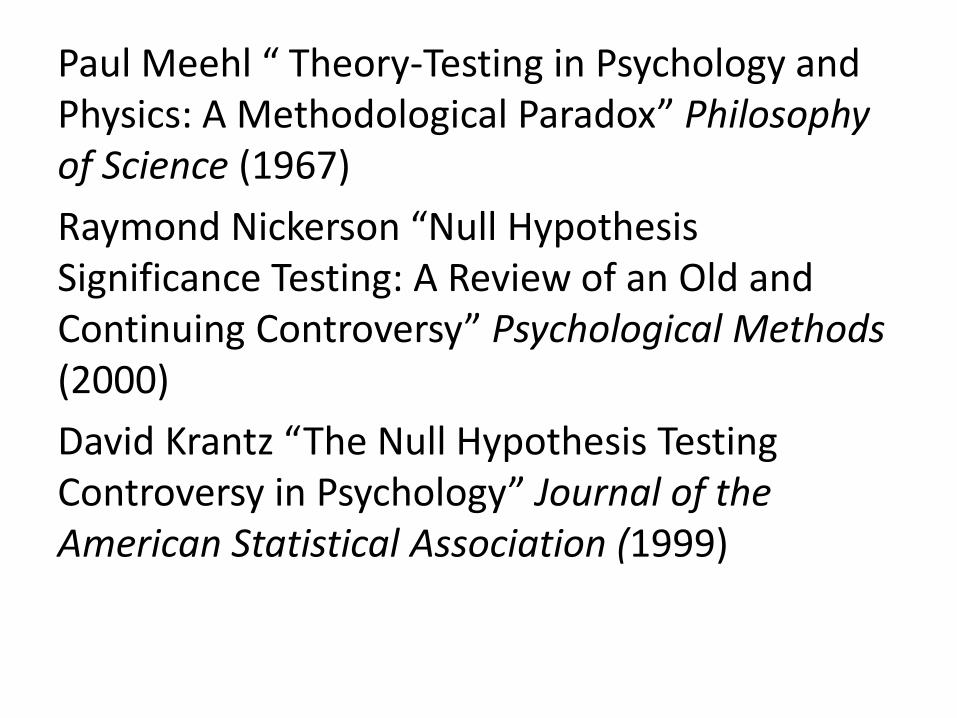
Paul Meehl “ Theory-Testing in Psychology and Physics: A Methodological Paradox” Philosophy of Science (1967)
Raymond Nickerson “Null Hypothesis Significance Testing: A Review of an Old and Continuing Controversy” Psychological Methods (2000)
David Krantz “The Null Hypothesis Testing Controversy in Psychology” Journal of the American Statistical Association (1999)

Thanks!