Embed Size (px)
Citation preview

Why Natural Gas? Why Now?
© 2013 Energy Solutions Center, All Rights Reserved
An overview of Natural Gas and its Benefits
November 13,2013
2
Natural Gas and its Benefits North American Natural Gas and Projected
Reserves
Natural Gas In the United States
From the Well to the Customer
Economical Energy
Efficient Energy
Clean Energy
Benefits of Gas Technologies
‹#› 3 Source: www.cga.ca/wp-content/uploads/2011/02/CGA-CERI-Presentation-final-feb-27.pdf
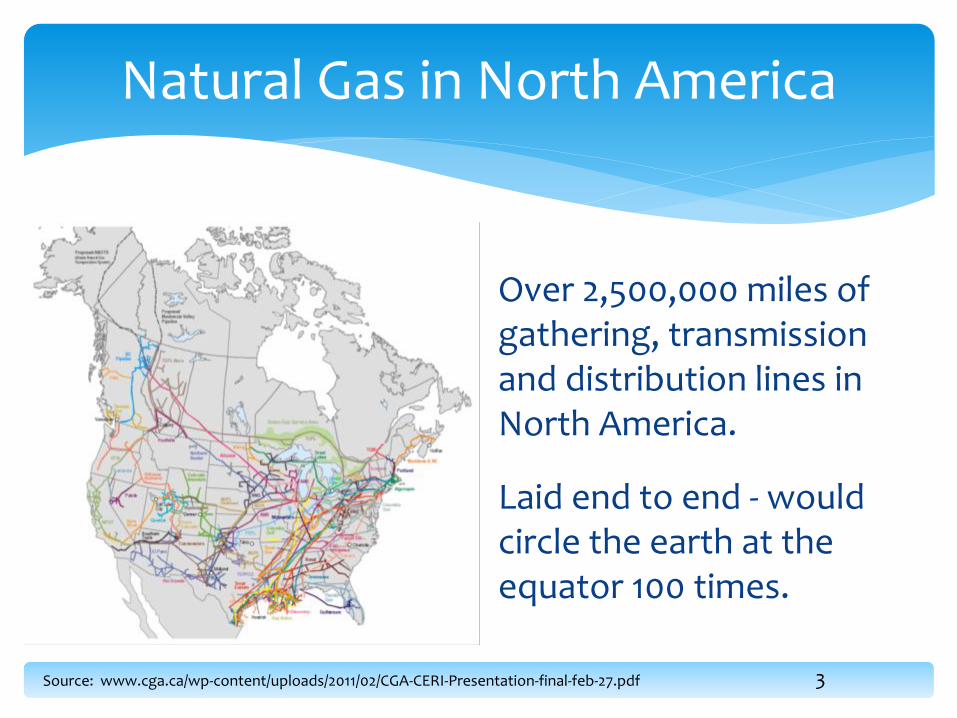
Natural Gas in North America
Over 2,500,000 miles of gathering, transmission and distribution lines in North America.
Laid end to end - would circle the earth at the equator 100 times.
4
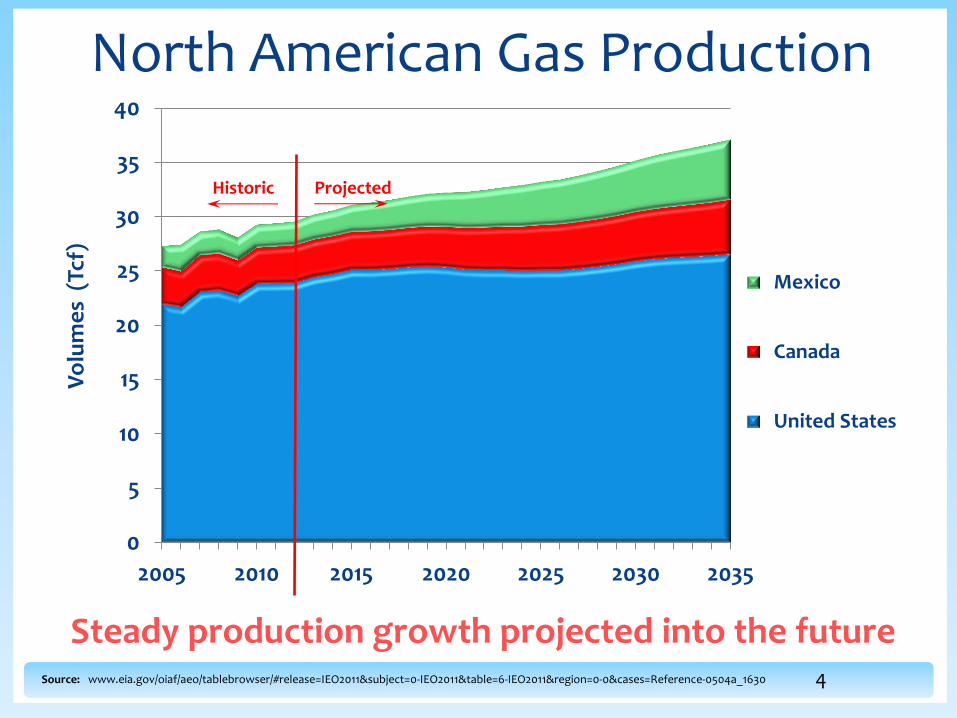
North American Gas Production
Source: www.eia.gov/oiaf/aeo/tablebrowser/#release=IEO2011&subject=0-IEO2011&table=6-IEO2011®ion=0-0&cases=Reference-0504a_1630
0
5
10
15
20
25
30
35
40
2005 2010 2015 2020 2025 2030 2035
Vo
lum
es
(Tc
f)
Mexico
Canada
United States
Historic Projected
Steady production growth projected into the future
‹#› 5 Source: www.eia.gov/tools/faqs/faq.cfm?id=58&t=8
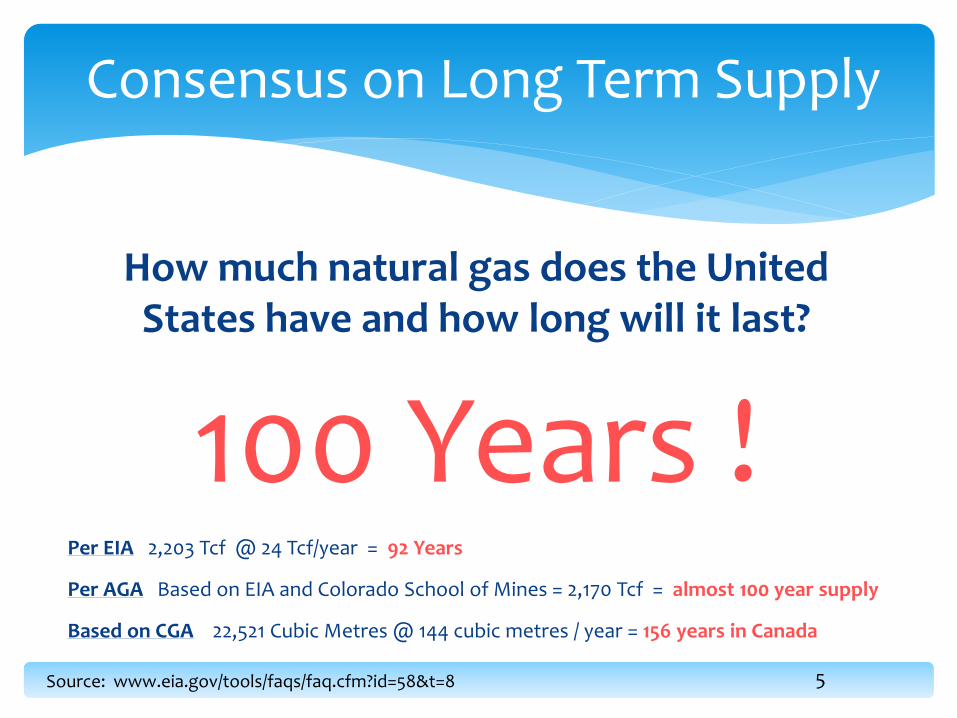
Consensus on Long Term Supply
How much natural gas does the United States have and how long will it last?
100 Years !
Per EIA 2,203 Tcf @ 24 Tcf/year = 92 Years
Per AGA Based on EIA and Colorado School of Mines = 2,170 Tcf = almost 100 year supply
Based on CGA 22,521 Cubic Metres @ 144 cubic metres / year = 156 years in Canada
6
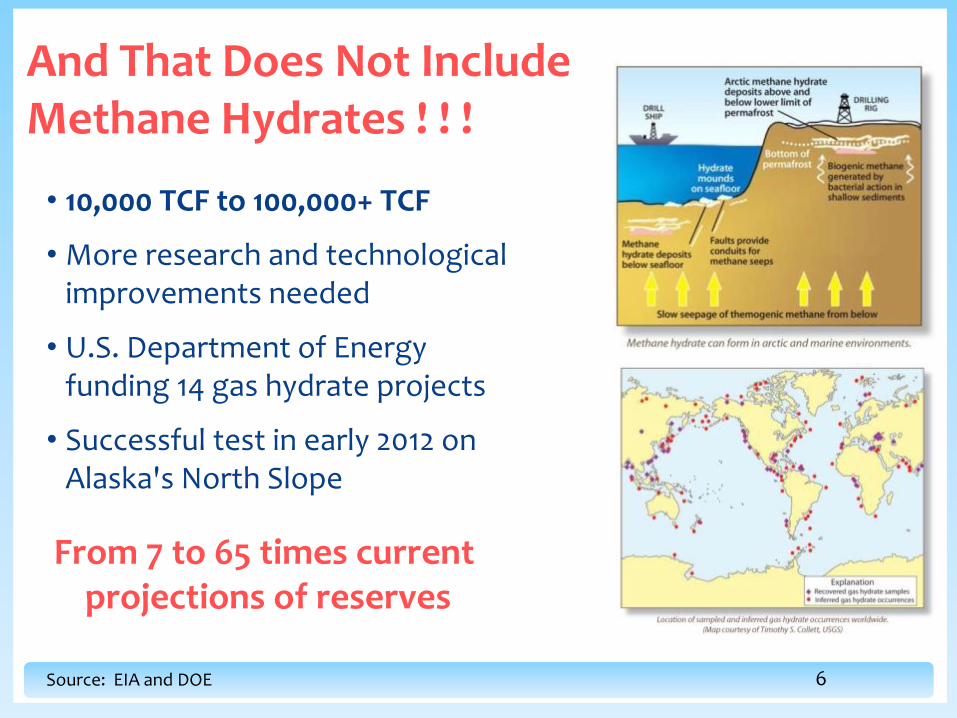
Hydrates – Not Included in Projections
From 7 to 65 times current projections of reserves
And That Does Not Include Methane Hydrates ! ! !
Source: EIA and DOE
• 10,000 TCF to 100,000+ TCF
• More research and technological improvements needed
• U.S. Department of Energy funding 14 gas hydrate projects
• Successful test in early 2012 on Alaska's North Slope
‹#› 7
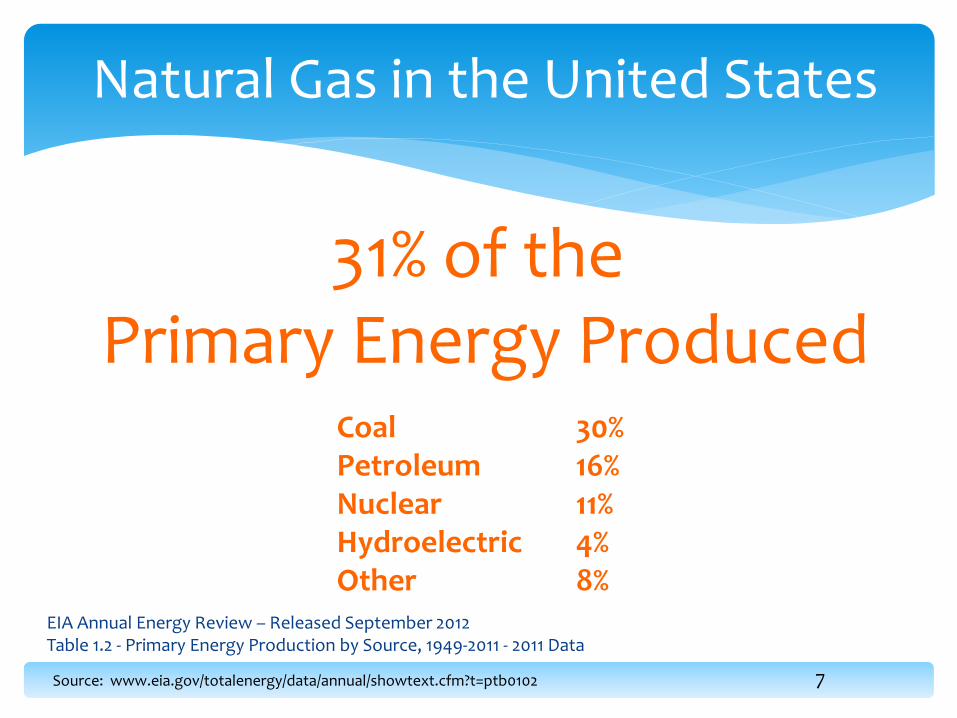
Natural Gas in the United States
31% of the Primary Energy Produced
Coal 30% Petroleum 16% Nuclear 11% Hydroelectric 4% Other 8%
EIA Annual Energy Review – Released September 2012 Table 1.2 - Primary Energy Production by Source, 1949-2011 - 2011 Data
Source: www.eia.gov/totalenergy/data/annual/showtext.cfm?t=ptb0102
8 Source: EIA Annual Energy Review
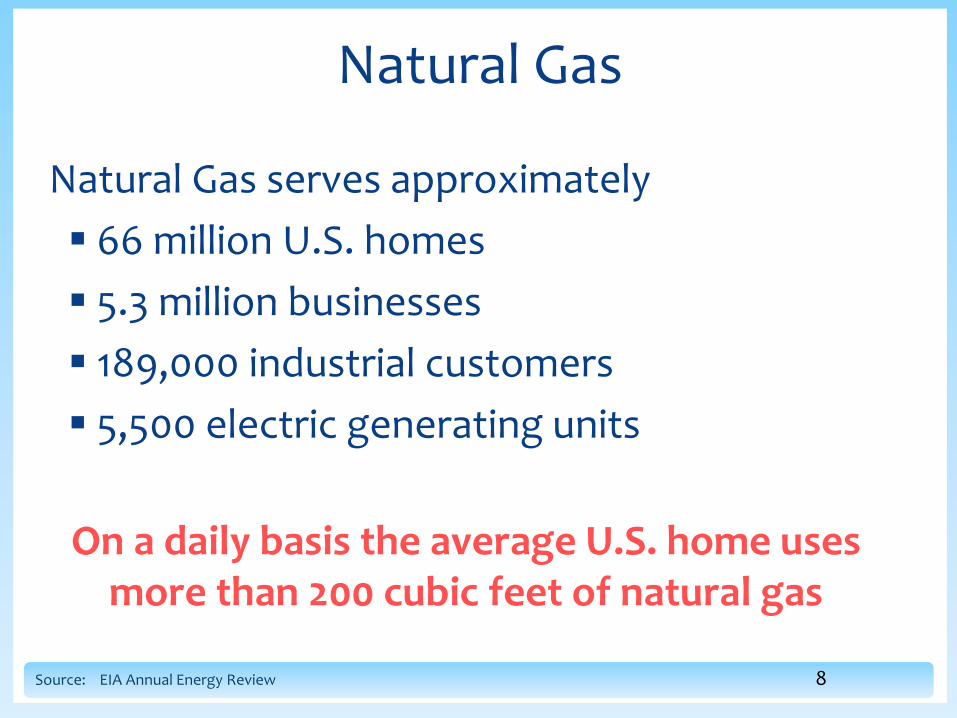
Natural Gas
Natural Gas serves approximately
66 million U.S. homes
5.3 million businesses
189,000 industrial customers
5,500 electric generating units
On a daily basis the average U.S. home uses more than 200 cubic feet of natural gas
9 Source: www.aga.org/Newsroom/factsheets/Documents/Facts%20About%20Natural%20Gas%20(JAN%202012).pdf
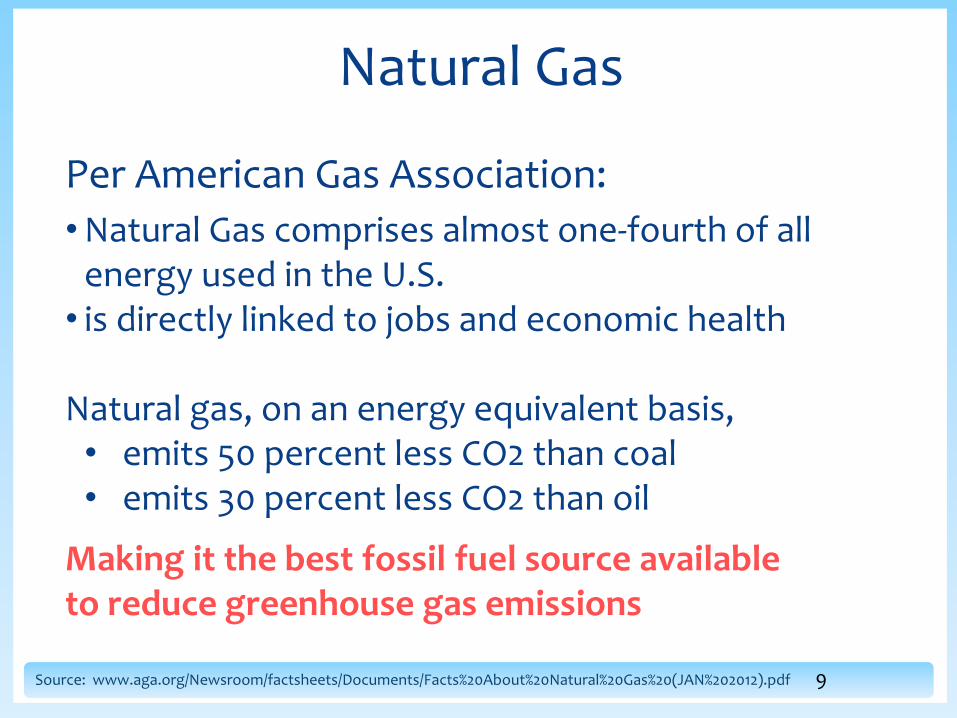
Natural Gas
Per American Gas Association:
•Natural Gas comprises almost one-fourth of all energy used in the U.S.
• is directly linked to jobs and economic health Natural gas, on an energy equivalent basis, • emits 50 percent less CO2 than coal • emits 30 percent less CO2 than oil
Making it the best fossil fuel source available to reduce greenhouse gas emissions
10 Source: www.eia.gov/pressroom/presentations/howard_01232012.pdf
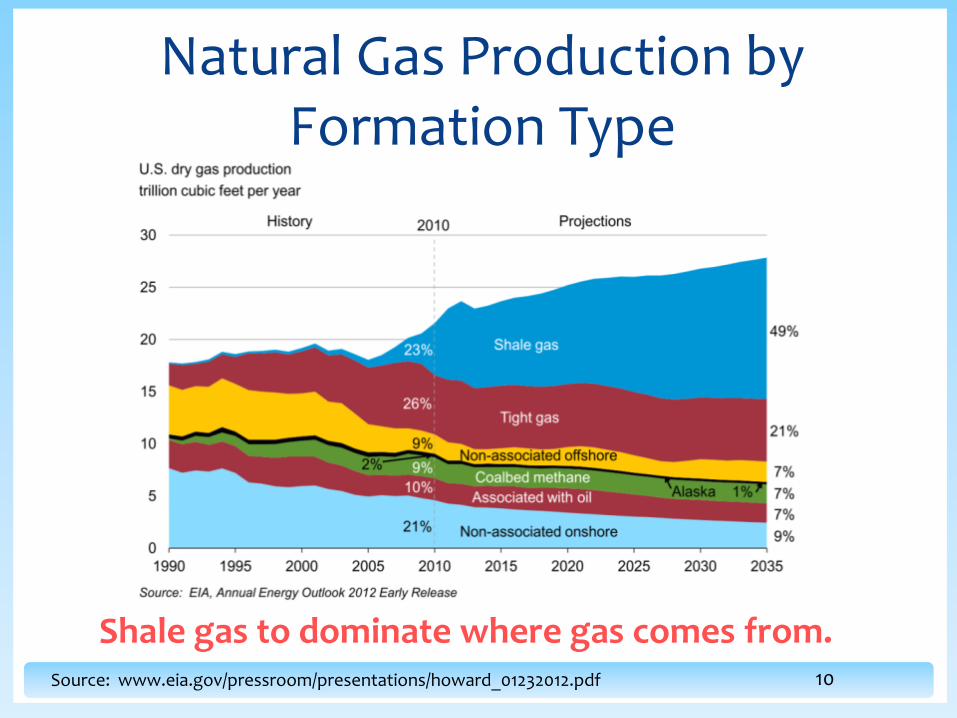
Natural Gas Production by Formation Type
Shale gas to dominate where gas comes from.

11
Natural Gas Consumption by Market
-
5
10
15
20
25
1997 2000 2003 2006 2009 2012
An
nu
al C
on
sum
pti
on
(T
CF)
Electric Power Gen
Industrial
Commercial
Residential
Source: www.eia.gov/dnav/ng/ng_cons_sum_dcu_nus_a.htm
12
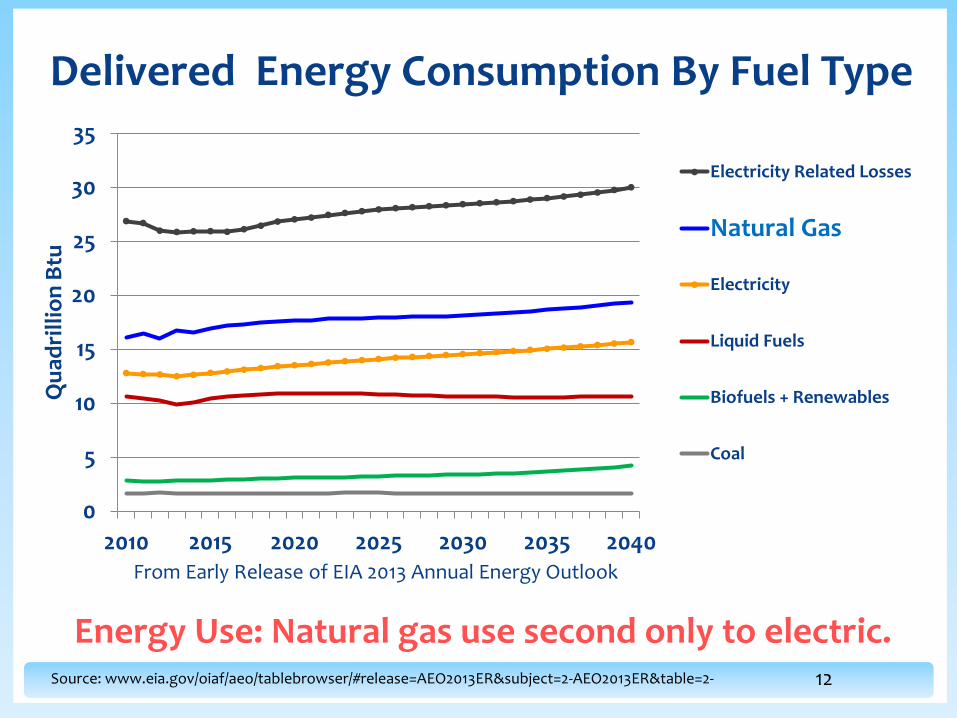
Delivered Energy Consumption By Fuel Type
0
5
10
15
20
25
30
35
2010 2015 2020 2025 2030 2035 2040
Qu
adri
llio
n B
tu
Electricity Related Losses
Natural Gas
Electricity
Liquid Fuels
Biofuels + Renewables
Coal
Source: www.eia.gov/oiaf/aeo/tablebrowser/#release=AEO2013ER&subject=2-AEO2013ER&table=2-
From Early Release of EIA 2013 Annual Energy Outlook
Energy Use: Natural gas use second only to electric.

‹#› 13
Natural Gas
From the Well to the Customer
14
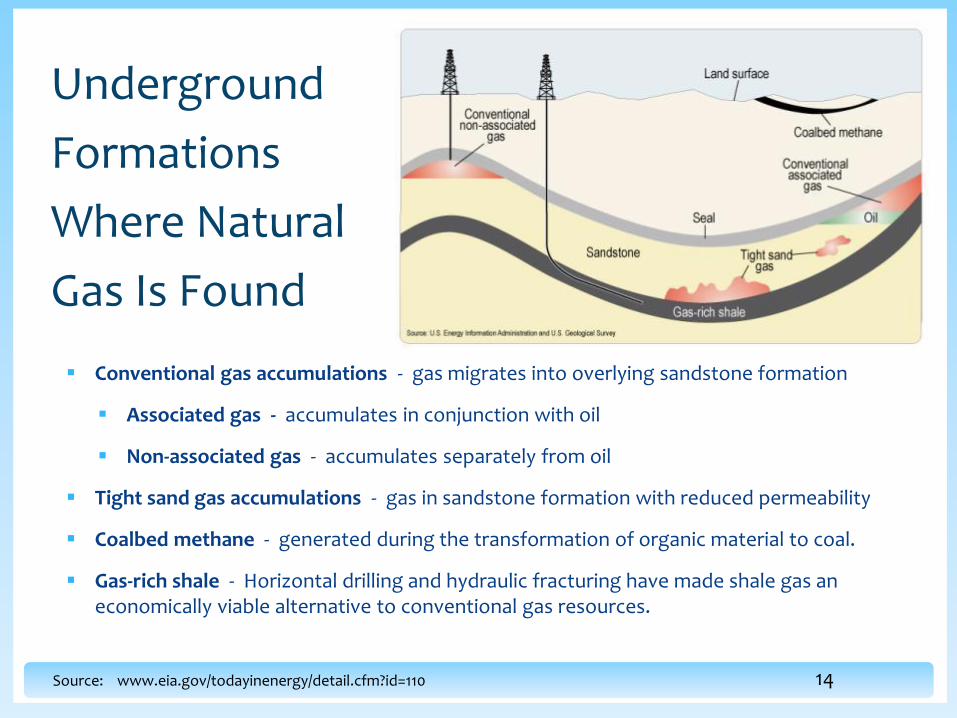
Conventional gas accumulations - gas migrates into overlying sandstone formation
Associated gas - accumulates in conjunction with oil
Non-associated gas - accumulates separately from oil
Tight sand gas accumulations - gas in sandstone formation with reduced permeability
Coalbed methane - generated during the transformation of organic material to coal.
Gas-rich shale - Horizontal drilling and hydraulic fracturing have made shale gas an economically viable alternative to conventional gas resources.
Underground
Formations
Where Natural
Gas Is Found
Source: www.eia.gov/todayinenergy/detail.cfm?id=110
15
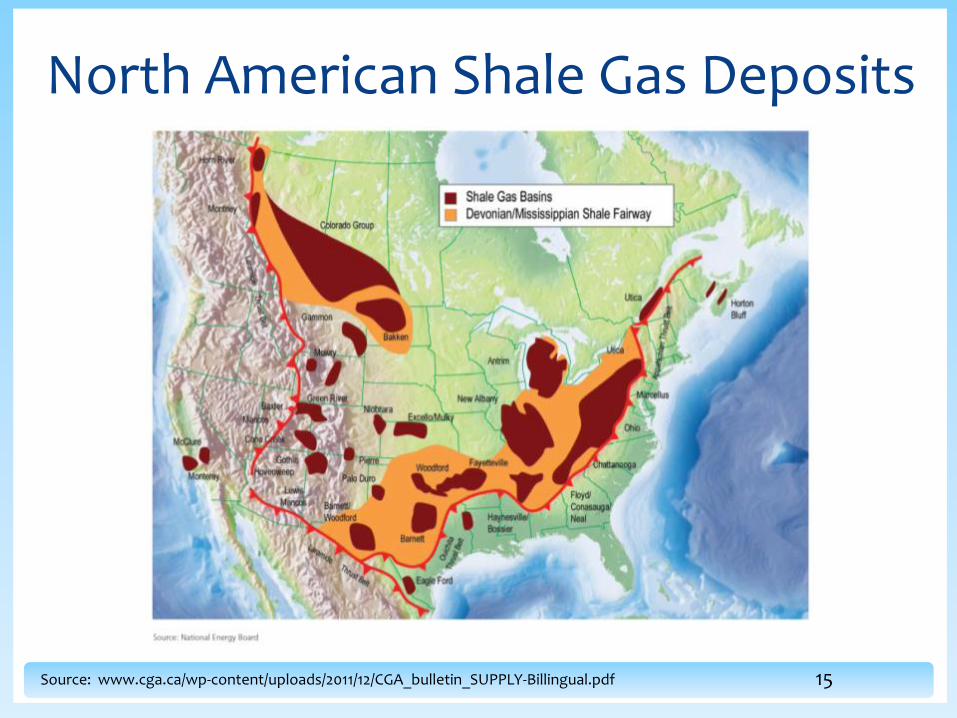
North American Shale Gas Deposits
Source: www.cga.ca/wp-content/uploads/2011/12/CGA_bulletin_SUPPLY-Billingual.pdf
16
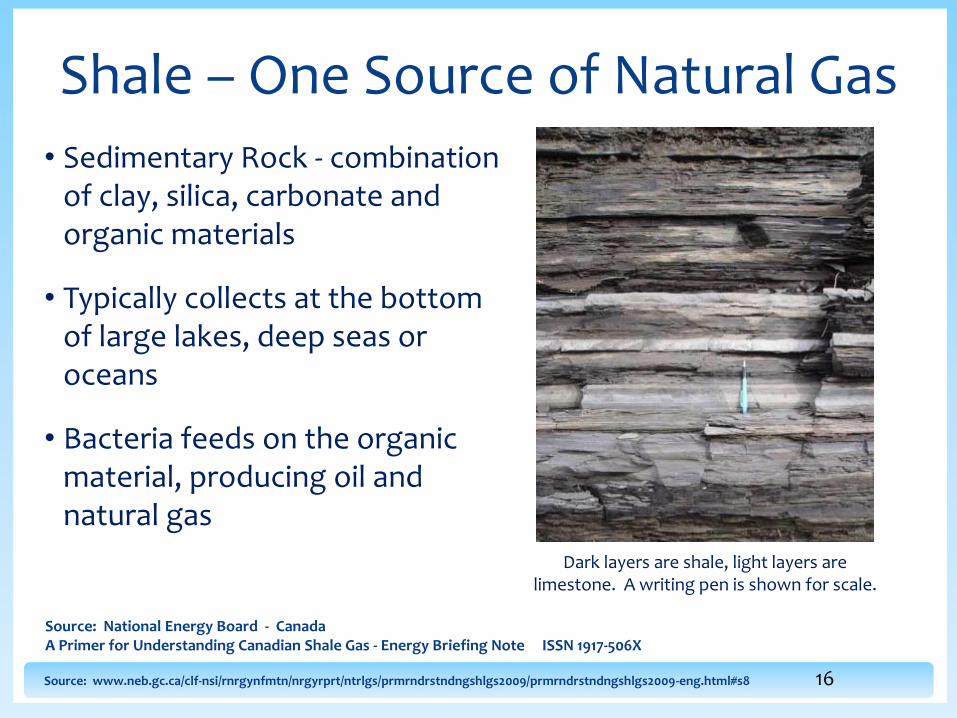
Shale – One Source of Natural Gas
• Sedimentary Rock - combination of clay, silica, carbonate and organic materials
• Typically collects at the bottom of large lakes, deep seas or oceans
• Bacteria feeds on the organic material, producing oil and natural gas
Dark layers are shale, light layers are limestone. A writing pen is shown for scale.
Source: National Energy Board - Canada A Primer for Understanding Canadian Shale Gas - Energy Briefing Note ISSN 1917-506X
Source: www.neb.gc.ca/clf-nsi/rnrgynfmtn/nrgyrprt/ntrlgs/prmrndrstndngshlgs2009/prmrndrstndngshlgs2009-eng.html#s8
17
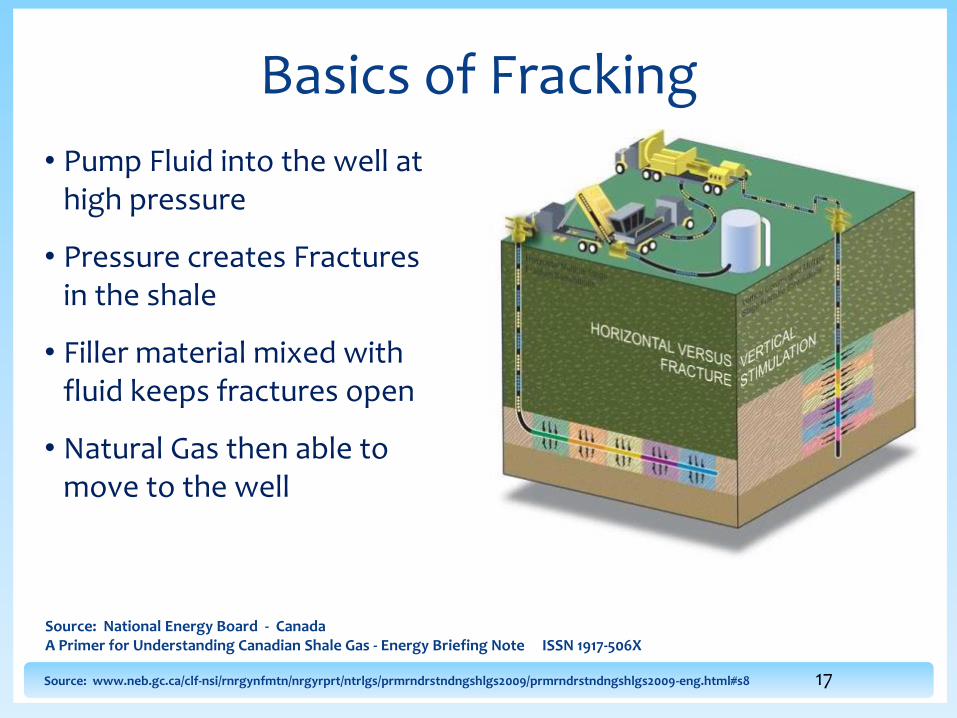
Basics of Fracking
Source: National Energy Board - Canada A Primer for Understanding Canadian Shale Gas - Energy Briefing Note ISSN 1917-506X
Source: www.neb.gc.ca/clf-nsi/rnrgynfmtn/nrgyrprt/ntrlgs/prmrndrstndngshlgs2009/prmrndrstndngshlgs2009-eng.html#s8
• Pump Fluid into the well at high pressure
• Pressure creates Fractures in the shale
• Filler material mixed with fluid keeps fractures open
• Natural Gas then able to move to the well
18
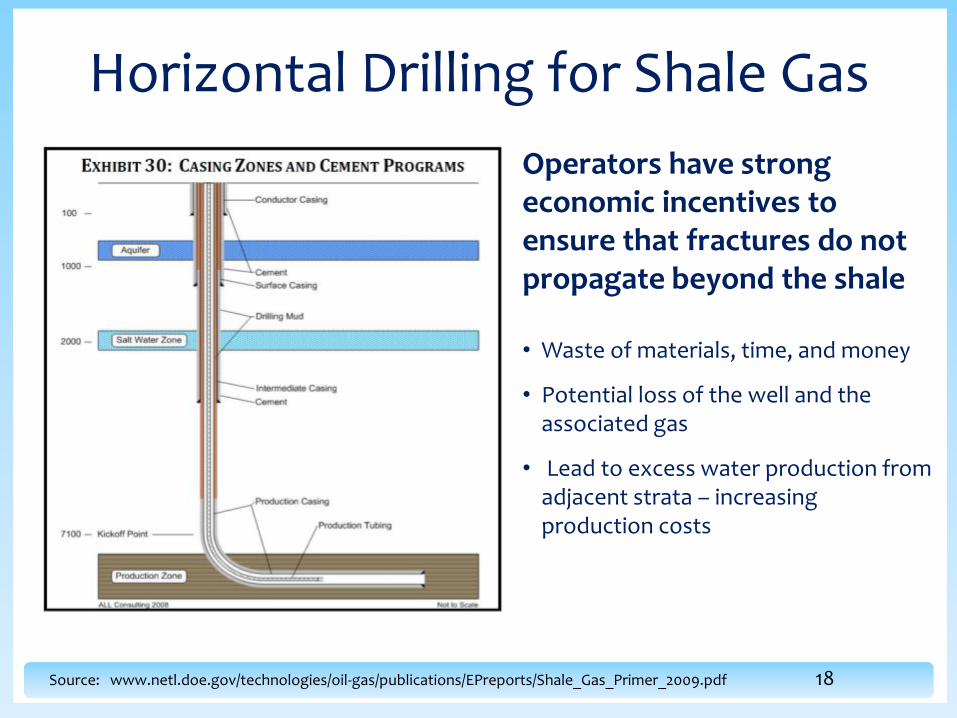
Horizontal Drilling for Shale Gas
Operators have strong economic incentives to ensure that fractures do not propagate beyond the shale
• Waste of materials, time, and money
• Potential loss of the well and the associated gas
• Lead to excess water production from adjacent strata – increasing production costs
Source: www.netl.doe.gov/technologies/oil-gas/publications/EPreports/Shale_Gas_Primer_2009.pdf
19
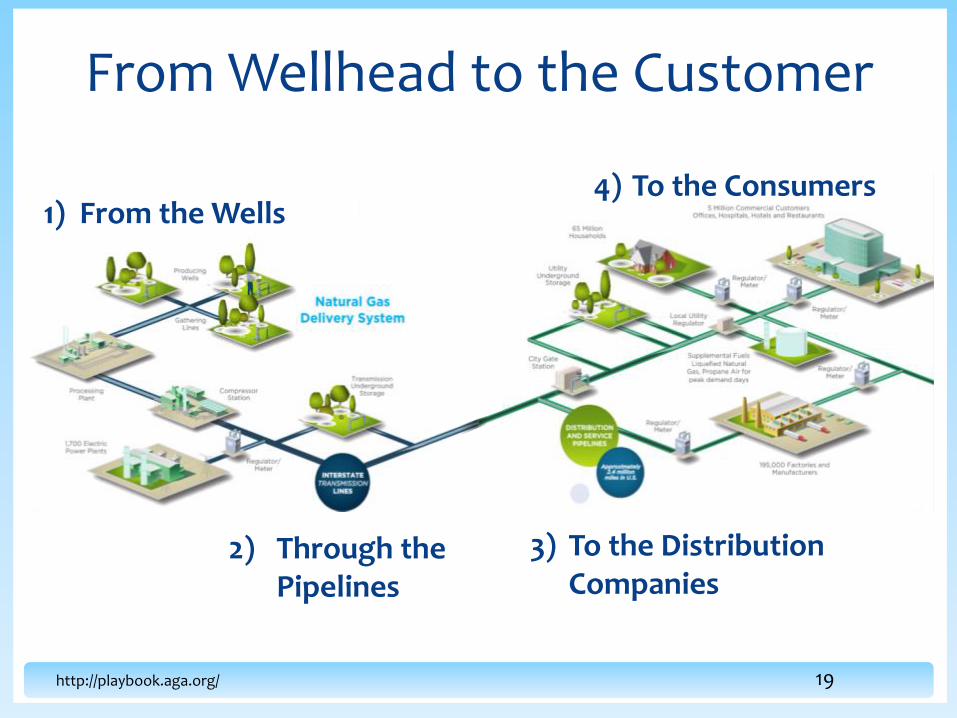
From Wellhead to the Customer
http://playbook.aga.org/
1) From the Wells
2) Through the Pipelines
3) To the Distribution Companies
4) To the Consumers
20
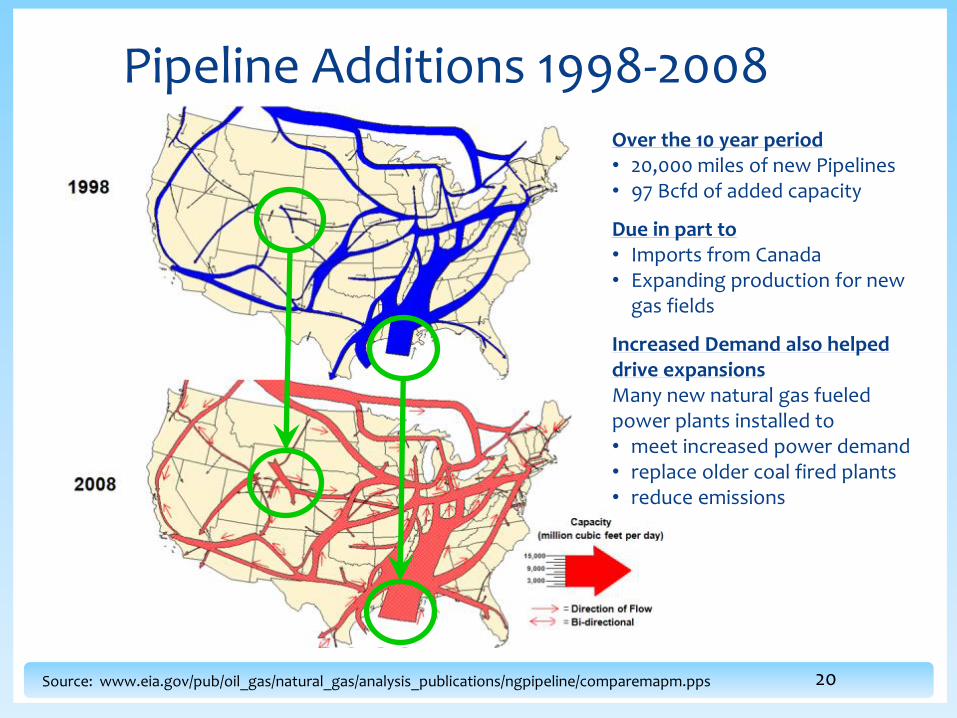
Pipeline Additions 1998-2008 Over the 10 year period • 20,000 miles of new Pipelines • 97 Bcfd of added capacity
Due in part to • Imports from Canada • Expanding production for new
gas fields
Increased Demand also helped drive expansions Many new natural gas fueled power plants installed to • meet increased power demand • replace older coal fired plants • reduce emissions
Source: www.eia.gov/pub/oil_gas/natural_gas/analysis_publications/ngpipeline/comparemapm.pps
‹#› 21
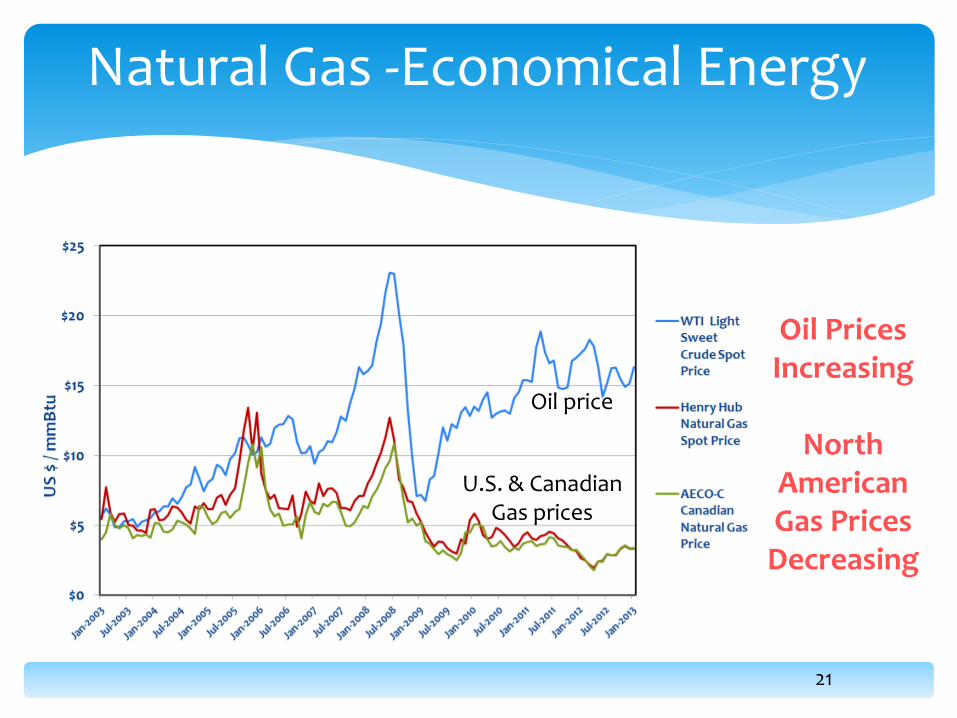
Natural Gas -Economical Energy
Oil Prices Increasing
North
American Gas Prices
Decreasing
U.S. & Canadian Gas prices
Oil price
22
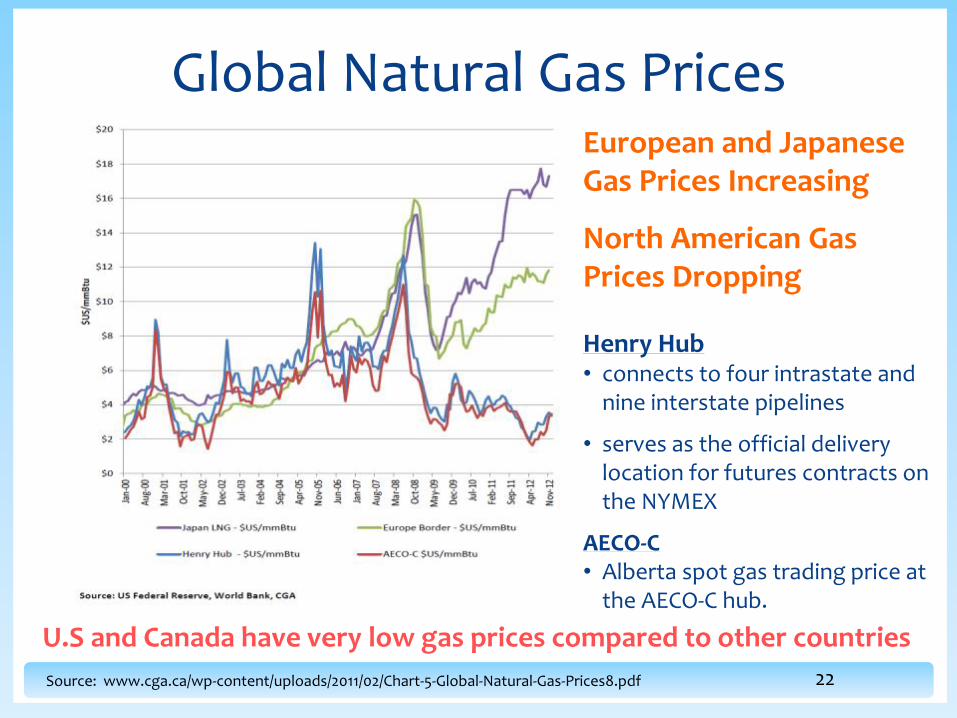
Global Natural Gas Prices
Source: www.cga.ca/wp-content/uploads/2011/02/Chart-5-Global-Natural-Gas-Prices8.pdf
European and Japanese Gas Prices Increasing
North American Gas Prices Dropping Henry Hub • connects to four intrastate and
nine interstate pipelines
• serves as the official delivery location for futures contracts on the NYMEX
AECO-C • Alberta spot gas trading price at
the AECO-C hub.
U.S and Canada have very low gas prices compared to other countries
23
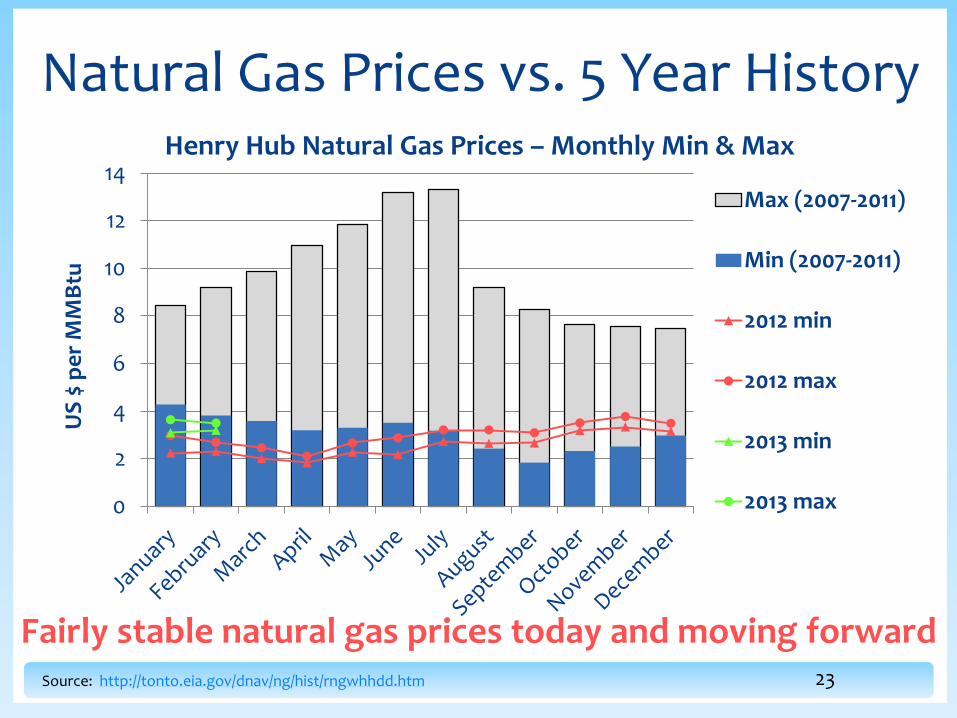
Natural Gas Prices vs. 5 Year History
0
2
4
6
8
10
12
14
US
$ p
er
MM
Btu
Henry Hub Natural Gas Prices – Monthly Min & Max
Max (2007-2011)
Min (2007-2011)
2012 min
2012 max
2013 min
2013 max
Source: http://tonto.eia.gov/dnav/ng/hist/rngwhhdd.htm
Fairly stable natural gas prices today and moving forward
24
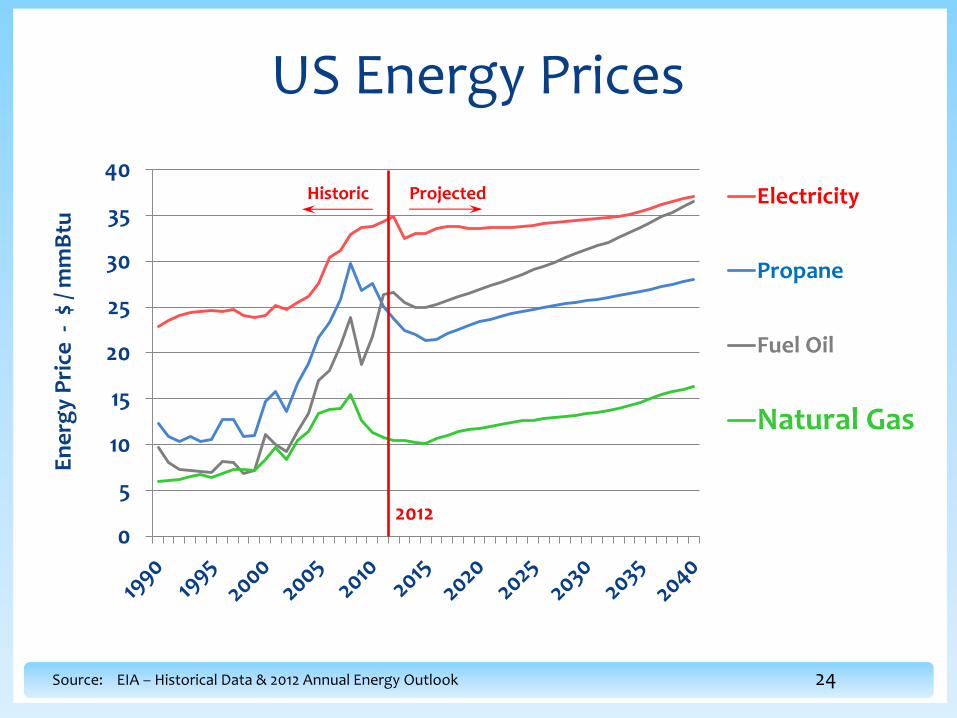
US Energy Prices
0
5
10
15
20
25
30
35
40
En
erg
y P
rice
- $
/ m
mB
tu Electricity
Propane
Fuel Oil
Natural Gas
Source: EIA – Historical Data & 2012 Annual Energy Outlook
Historic Projected
2012
‹#› 25
Natural Gas - Efficient Energy
• More Energy to the Customer
• Electric Grid Reliability Decreasing
• Efficiency of Electric Power Generation by State
• Natural Gas Fueled Generators - the Most Efficient
• Natural Gas Appliances and Equipment Efficiencies Improving Over Time – Reducing Gas Consumption
26
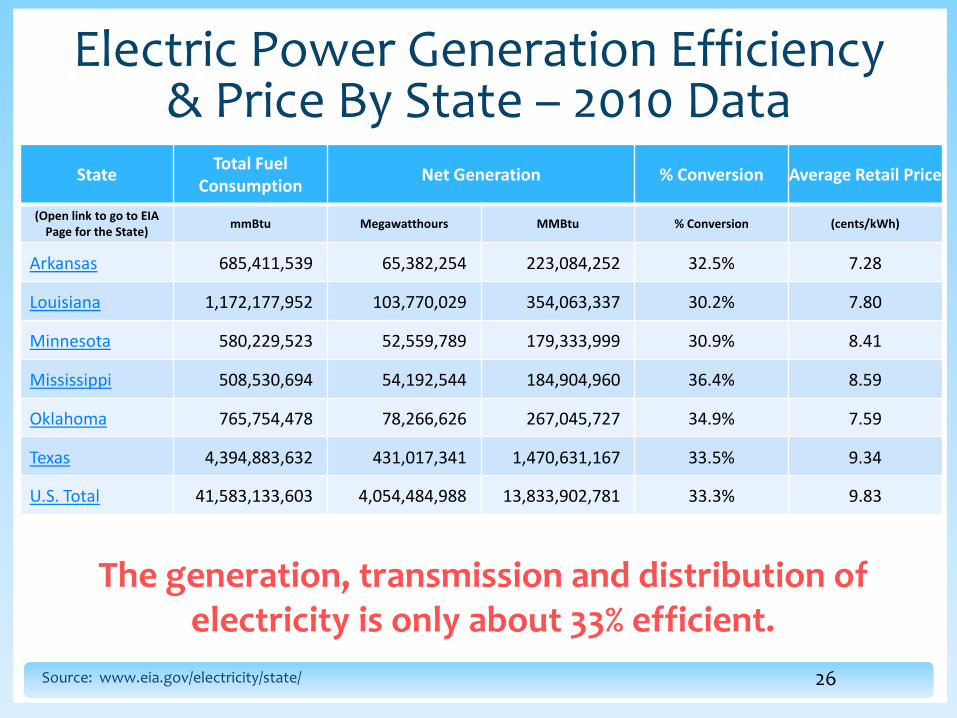
Electric Power Generation Efficiency & Price By State – 2010 Data
Source: www.eia.gov/electricity/state/
Table of Data To Extract State Data From – Plus get US overall
State Total Fuel
Consumption Net Generation % Conversion Average Retail Price
(Open link to go to EIA Page for the State)
mmBtu Megawatthours MMBtu % Conversion (cents/kWh)
Arkansas 685,411,539 65,382,254 223,084,252 32.5% 7.28
Louisiana 1,172,177,952 103,770,029 354,063,337 30.2% 7.80
Minnesota 580,229,523 52,559,789 179,333,999 30.9% 8.41
Mississippi 508,530,694 54,192,544 184,904,960 36.4% 8.59
Oklahoma 765,754,478 78,266,626 267,045,727 34.9% 7.59
Texas 4,394,883,632 431,017,341 1,470,631,167 33.5% 9.34
U.S. Total 41,583,133,603 4,054,484,988 13,833,902,781 33.3% 9.83
The generation, transmission and distribution of electricity is only about 33% efficient.
27
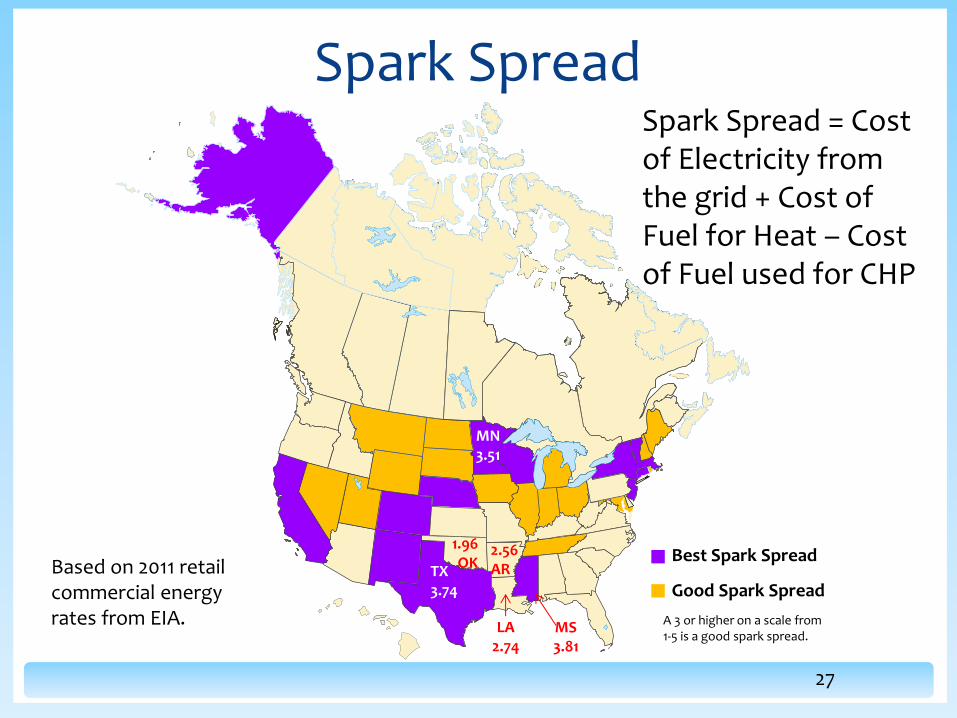
Best Spark Spread
Good Spark Spread
A 3 or higher on a scale from 1-5 is a good spark spread.
Spark Spread
2.56 AR TX
3.74
MN 3.51
LA 2.74
MS 3.81
1.96 OK Based on 2011 retail
commercial energy rates from EIA.
Spark Spread = Cost of Electricity from the grid + Cost of Fuel for Heat – Cost of Fuel used for CHP
28
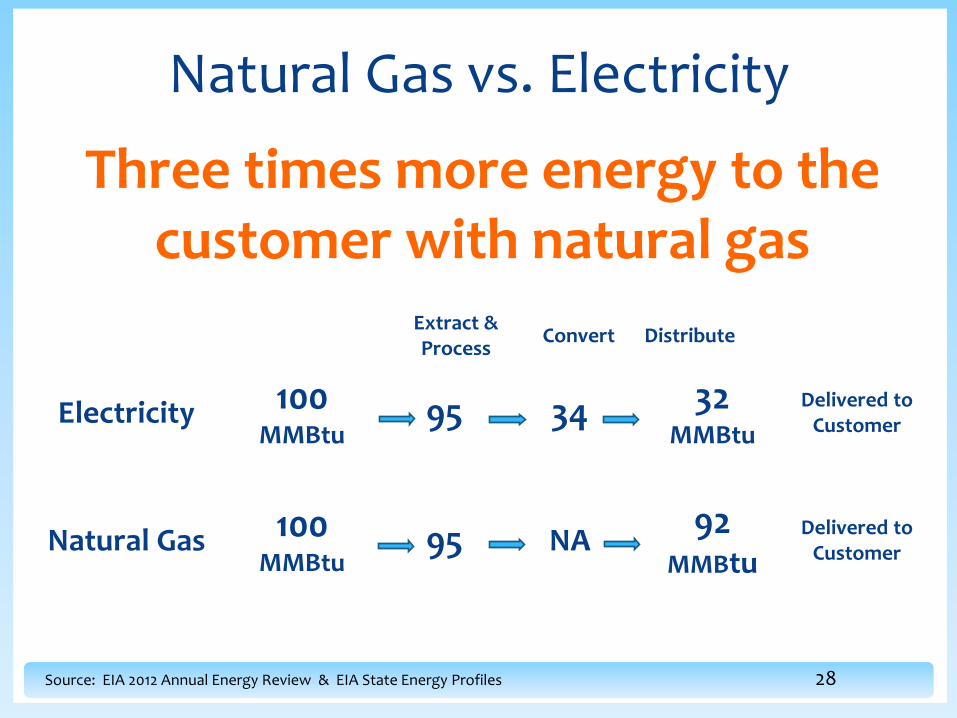
Natural Gas vs. Electricity
Source: EIA 2012 Annual Energy Review & EIA State Energy Profiles
Three times more energy to the customer with natural gas
Electricity 100 MMBtu
95 34 32
MMBtu
Delivered to Customer
Natural Gas 100 MMBtu
95 NA 92
MMBtu Delivered to
Customer
Extract & Process
Convert Distribute
29
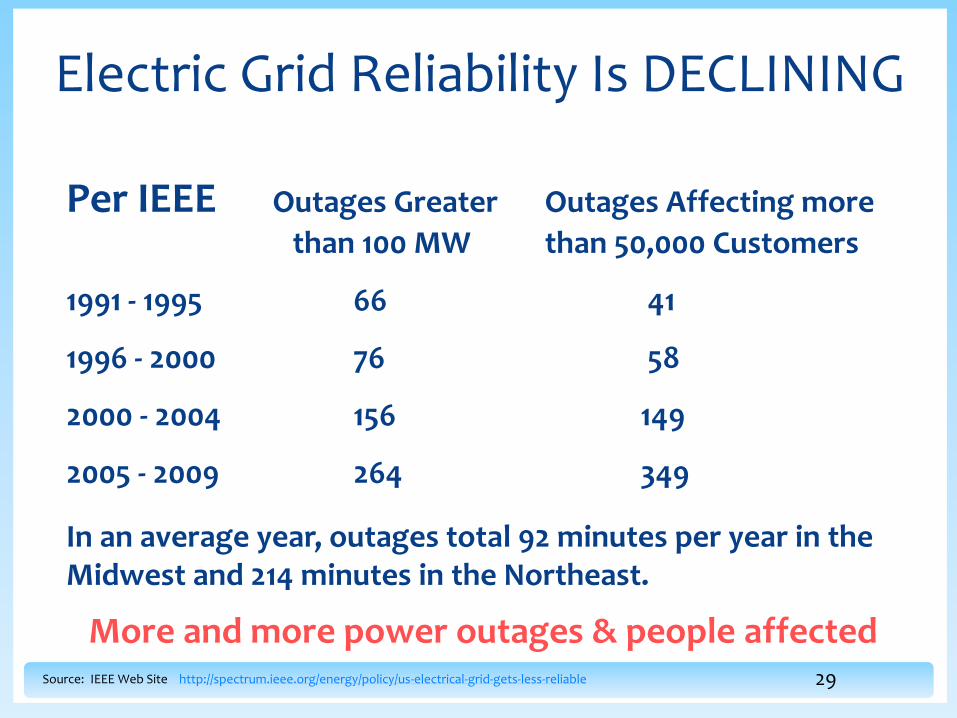
Electric Grid Reliability Is DECLINING
Per IEEE Outages Greater Outages Affecting more
than 100 MW than 50,000 Customers
1991 - 1995 66 41
1996 - 2000 76 58
2000 - 2004 156 149
2005 - 2009 264 349
In an average year, outages total 92 minutes per year in the Midwest and 214 minutes in the Northeast.
Source: IEEE Web Site http://spectrum.ieee.org/energy/policy/us-electrical-grid-gets-less-reliable
More and more power outages & people affected
30
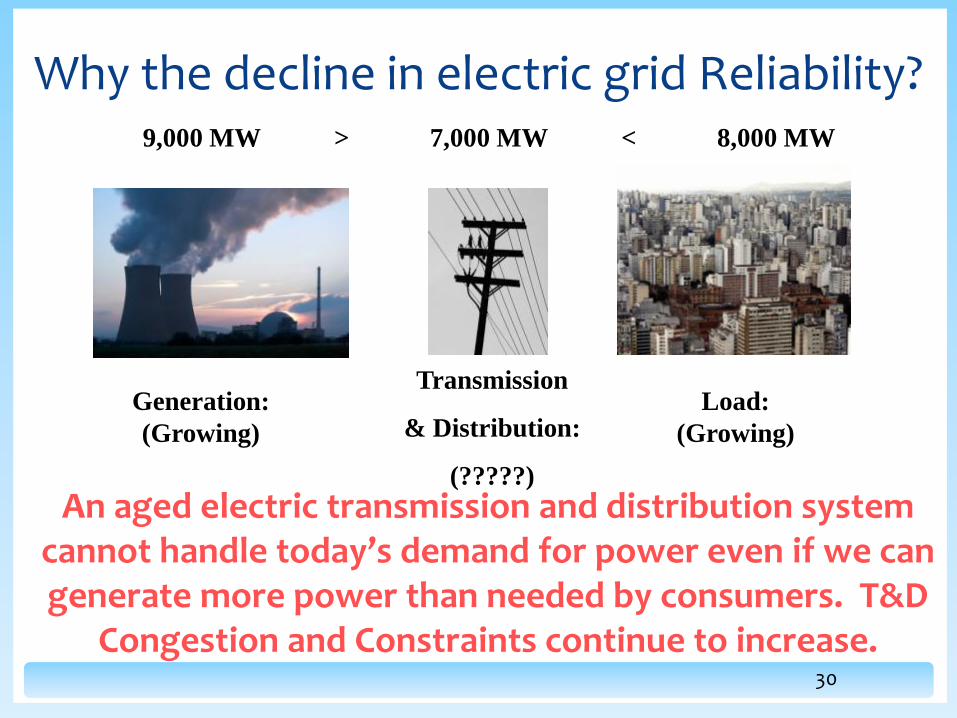
9,000 MW > 7,000 MW < 8,000 MW
Generation:
(Growing)
Transmission
& Distribution:
(?????)
Load:
(Growing)
Why the decline in electric grid Reliability?
An aged electric transmission and distribution system cannot handle today’s demand for power even if we can generate more power than needed by consumers. T&D
Congestion and Constraints continue to increase.
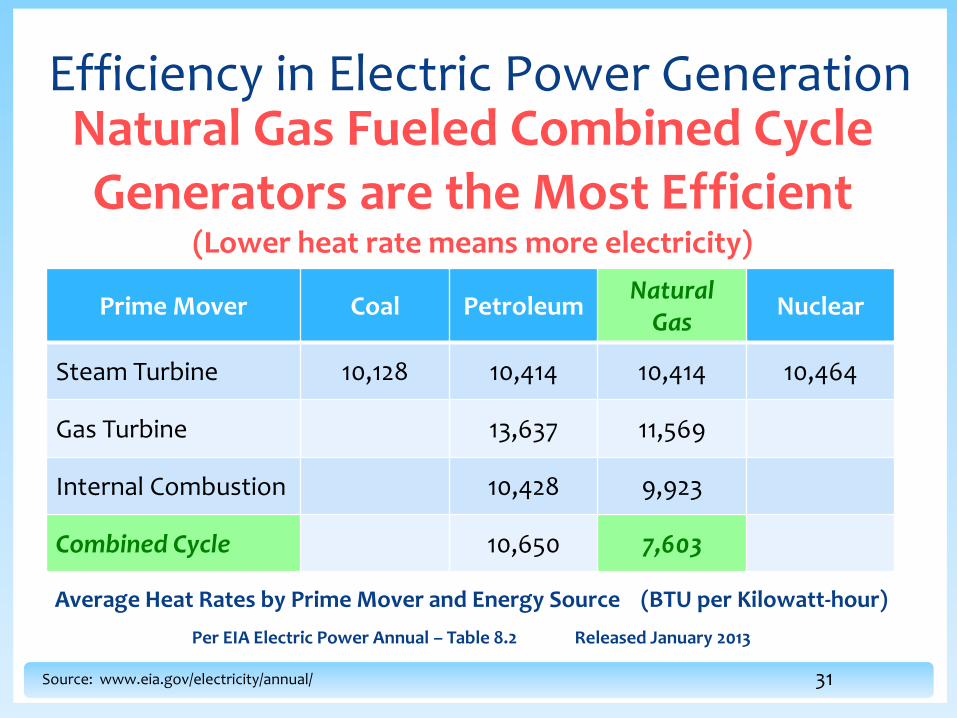
31 Source: www.eia.gov/electricity/annual/
Average Heat Rates by Prime Mover and Energy Source (BTU per Kilowatt-hour)
Per EIA Electric Power Annual – Table 8.2 Released January 2013
Prime Mover Coal Petroleum Natural
Gas Nuclear
Steam Turbine 10,128 10,414 10,414 10,464
Gas Turbine 13,637 11,569
Internal Combustion 10,428 9,923
Combined Cycle 10,650 7,603
Efficiency in Electric Power Generation Natural Gas Fueled Combined Cycle Generators are the Most Efficient
(Lower heat rate means more electricity)
32
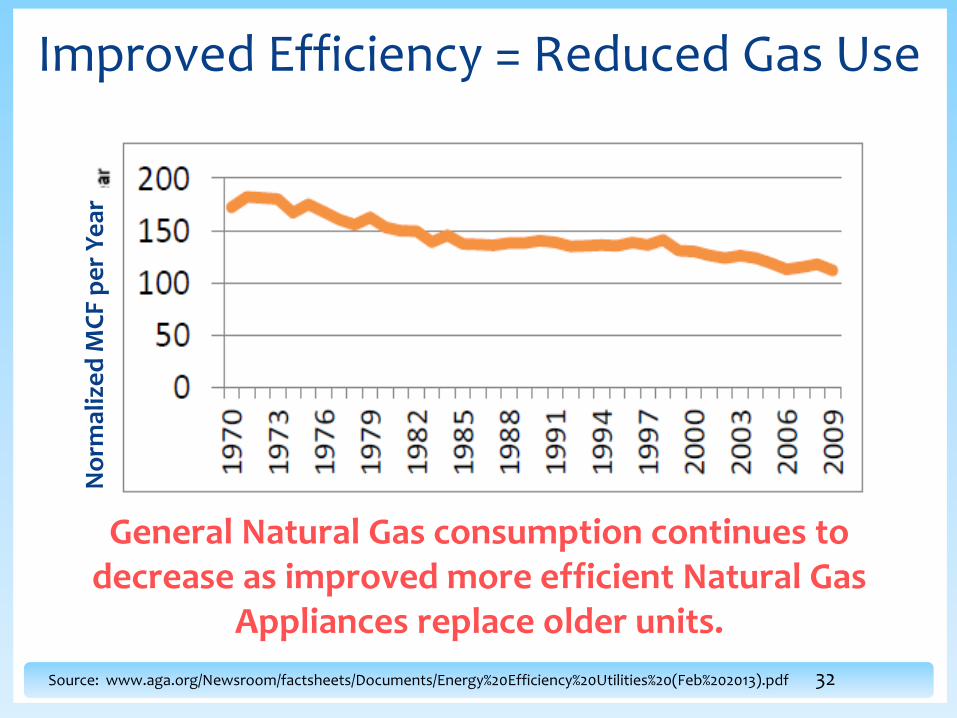
Improved Efficiency = Reduced Gas Use
Source: www.aga.org/Newsroom/factsheets/Documents/Energy%20Efficiency%20Utilities%20(Feb%202013).pdf
No
rmal
ize
d M
CF
pe
r Y
ear
General Natural Gas consumption continues to decrease as improved more efficient Natural Gas
Appliances replace older units.

‹#› 33
Natural Gas
Clean Energy
34
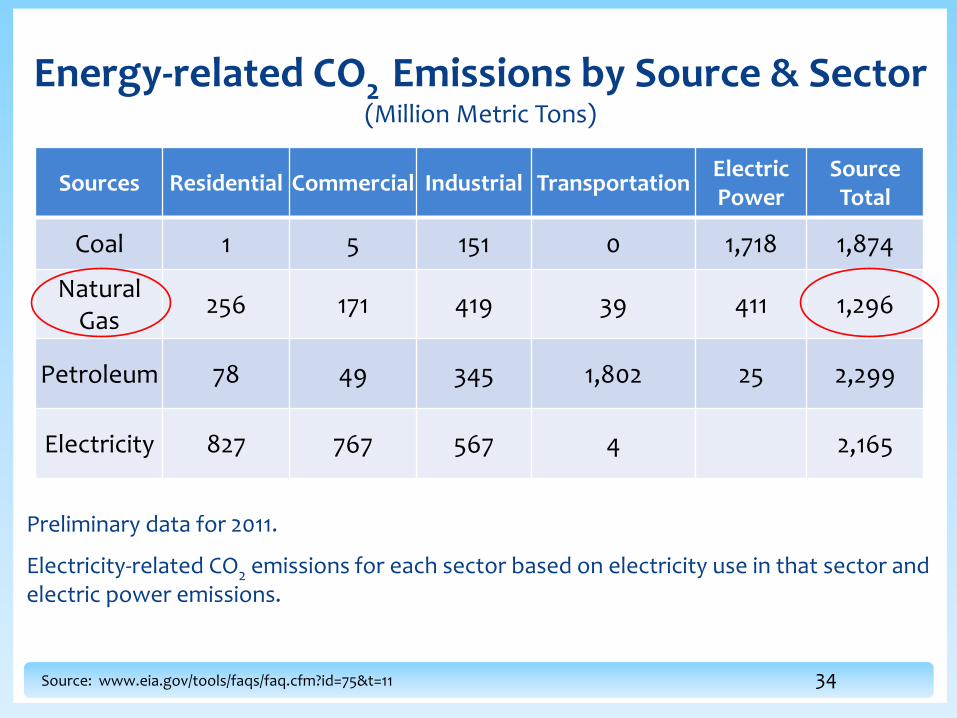
Energy-related CO2 Emissions by Source & Sector (Million Metric Tons)
Sectors
Preliminary data for 2011.
Electricity-related CO2 emissions for each sector based on electricity use in that sector and electric power emissions.
Source: www.eia.gov/tools/faqs/faq.cfm?id=75&t=11
Sources Residential Commercial Industrial Transportation Electric Power
Source Total
Coal 1 5 151 0 1,718 1,874
Natural Gas
256 171 419 39 411 1,296
Petroleum 78 49 345 1,802 25 2,299
Electricity 827 767 567 4 2,165
35
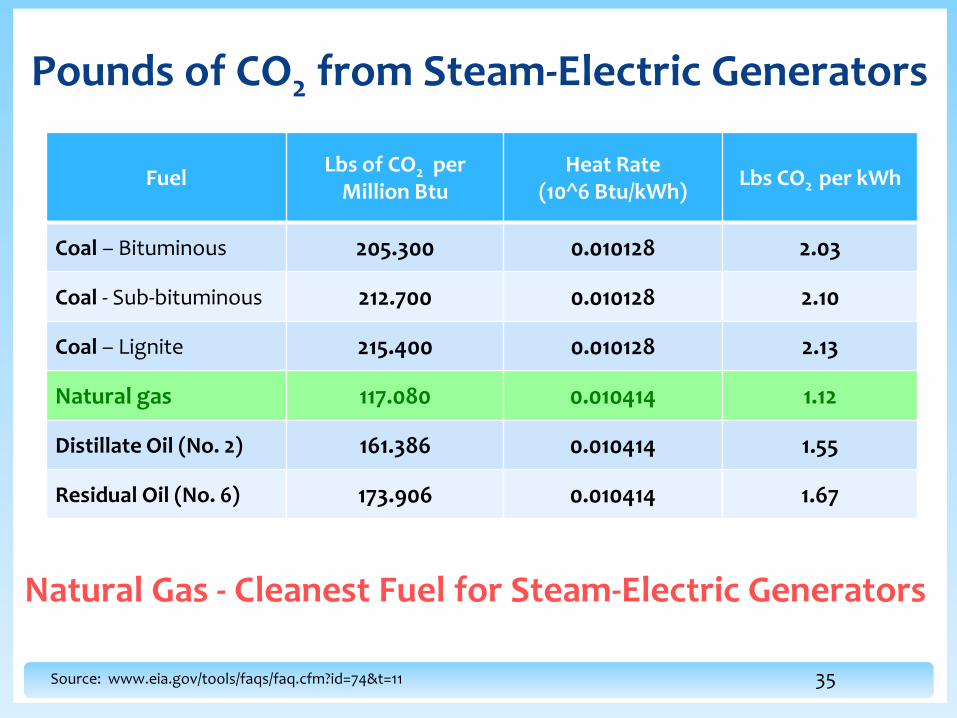
Natural Gas - Cleanest Fuel for Steam-Electric Generators
Pounds of CO2 from Steam-Electric Generators
Source: www.eia.gov/tools/faqs/faq.cfm?id=74&t=11
Fuel Lbs of CO2 per
Million Btu Heat Rate
(10^6 Btu/kWh) Lbs CO2 per kWh
Coal – Bituminous 205.300 0.010128 2.03
Coal - Sub-bituminous 212.700 0.010128 2.10
Coal – Lignite 215.400 0.010128 2.13
Natural gas 117.080 0.010414 1.12
Distillate Oil (No. 2) 161.386 0.010414 1.55
Residual Oil (No. 6) 173.906 0.010414 1.67
36
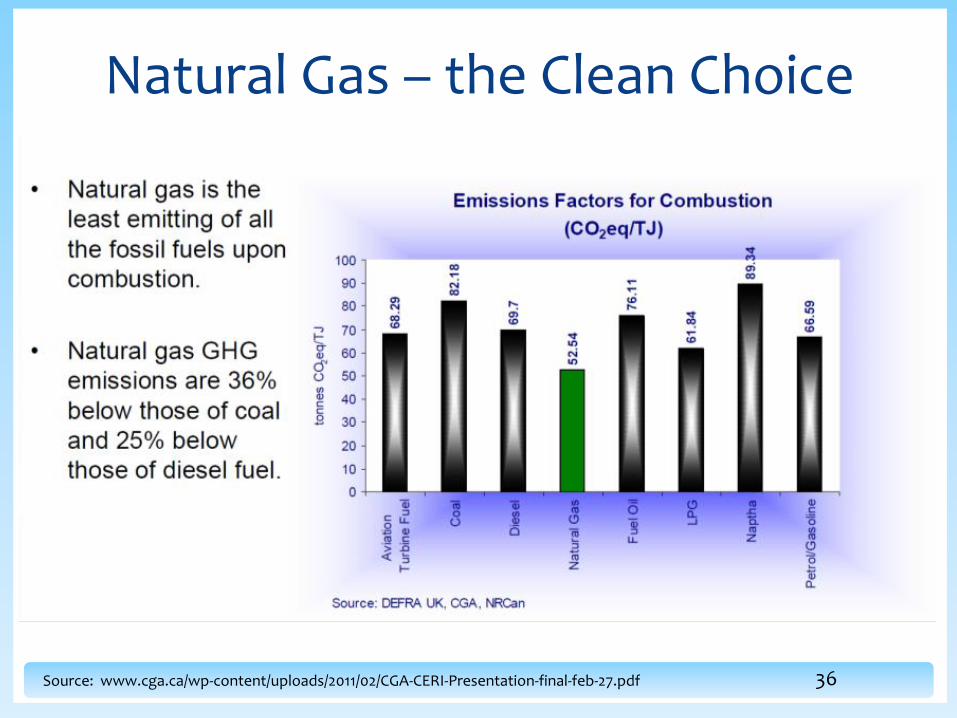
Natural Gas – the Clean Choice
Source: www.cga.ca/wp-content/uploads/2011/02/CGA-CERI-Presentation-final-feb-27.pdf
37
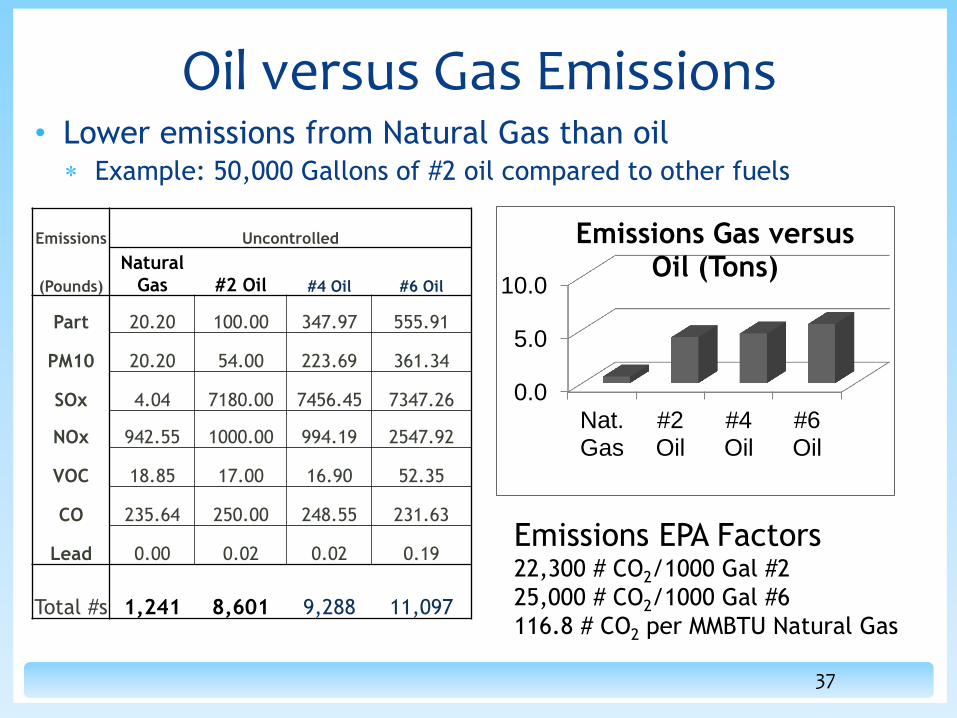
Oil versus Gas Emissions • Lower emissions from Natural Gas than oil
Example: 50,000 Gallons of #2 oil compared to other fuels
0.0
5.0
10.0
Nat.Gas
#2Oil
#4Oil
#6Oil
Emissions Gas versus Oil (Tons)
Emissions Uncontrolled
(Pounds)
Natural
Gas #2 Oil #4 Oil #6 Oil
Part 20.20 100.00 347.97 555.91
PM10 20.20 54.00 223.69 361.34
SOx 4.04 7180.00 7456.45 7347.26
NOx 942.55 1000.00 994.19 2547.92
VOC 18.85 17.00 16.90 52.35
CO 235.64 250.00 248.55 231.63
Lead 0.00 0.02 0.02 0.19
Total #s
1,241
8,601
9,288
11,097
Emissions EPA Factors 22,300 # CO2/1000 Gal #2
25,000 # CO2/1000 Gal #6
116.8 # CO2 per MMBTU Natural Gas

‹#› 38
Benefits of using Natural Gas for: • Cogeneration • Gas versus Oil • Gas Cooling • Humidity Control
39
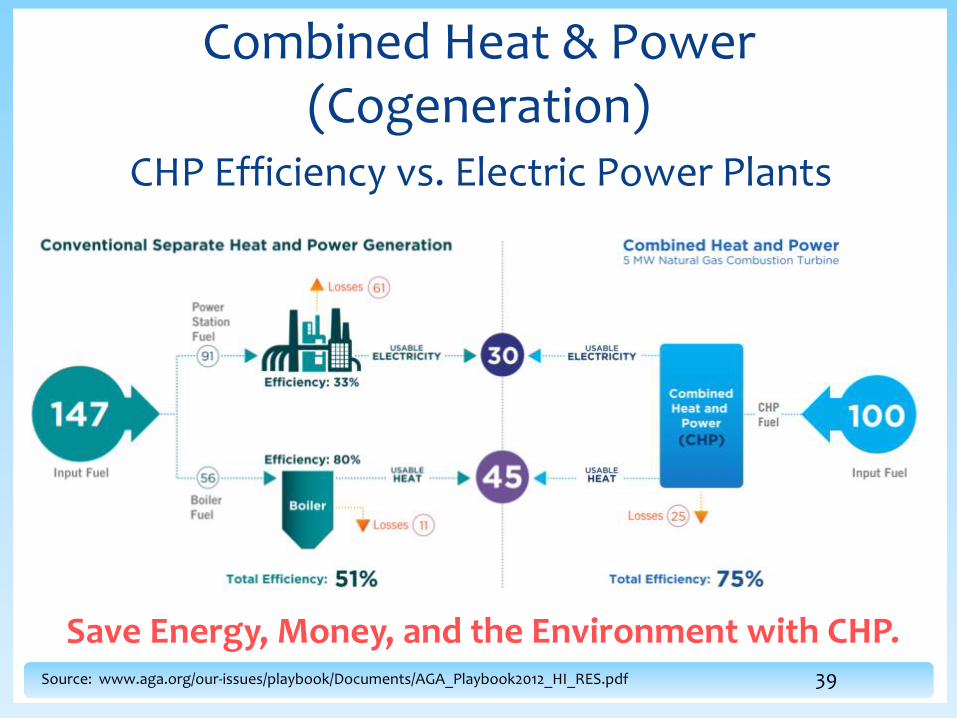
CHP Efficiency vs. Electric Power Plants
Combined Heat & Power (Cogeneration)
Source: www.aga.org/our-issues/playbook/Documents/AGA_Playbook2012_HI_RES.pdf
Save Energy, Money, and the Environment with CHP.
40
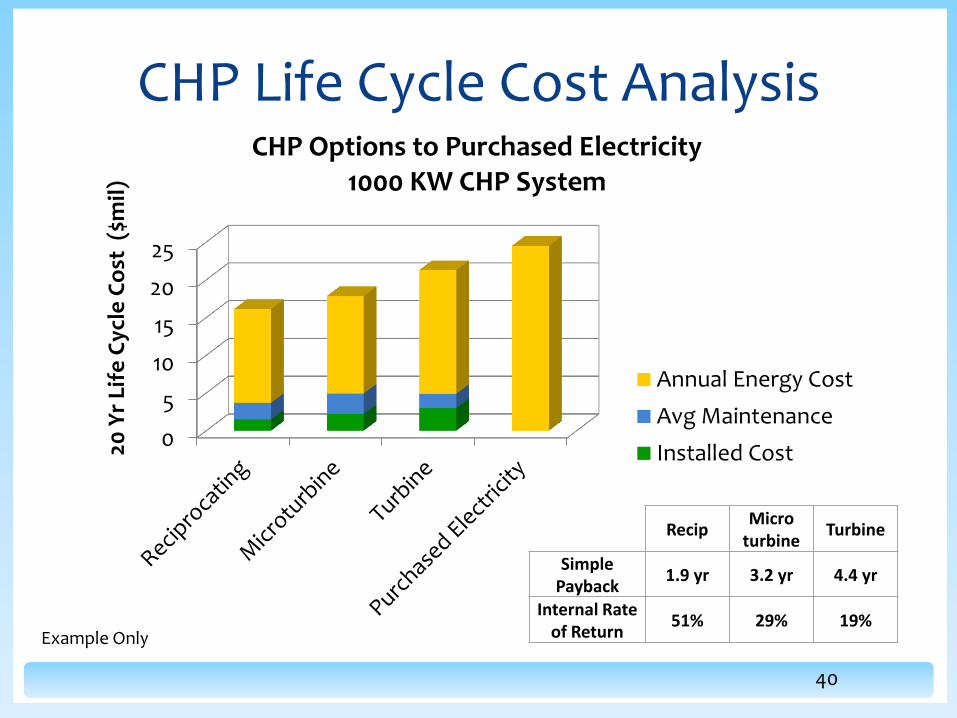
CHP Life Cycle Cost Analysis
0
5
10
15
20
25
20 Y
r Li
fe C
ycle
Co
st (
$mil
)
CHP Options to Purchased Electricity 1000 KW CHP System
Annual Energy Cost
Avg Maintenance
Installed Cost
Recip Micro
turbine Turbine
Simple Payback
1.9 yr 3.2 yr 4.4 yr
Internal Rate of Return
51% 29% 19% Example Only
41
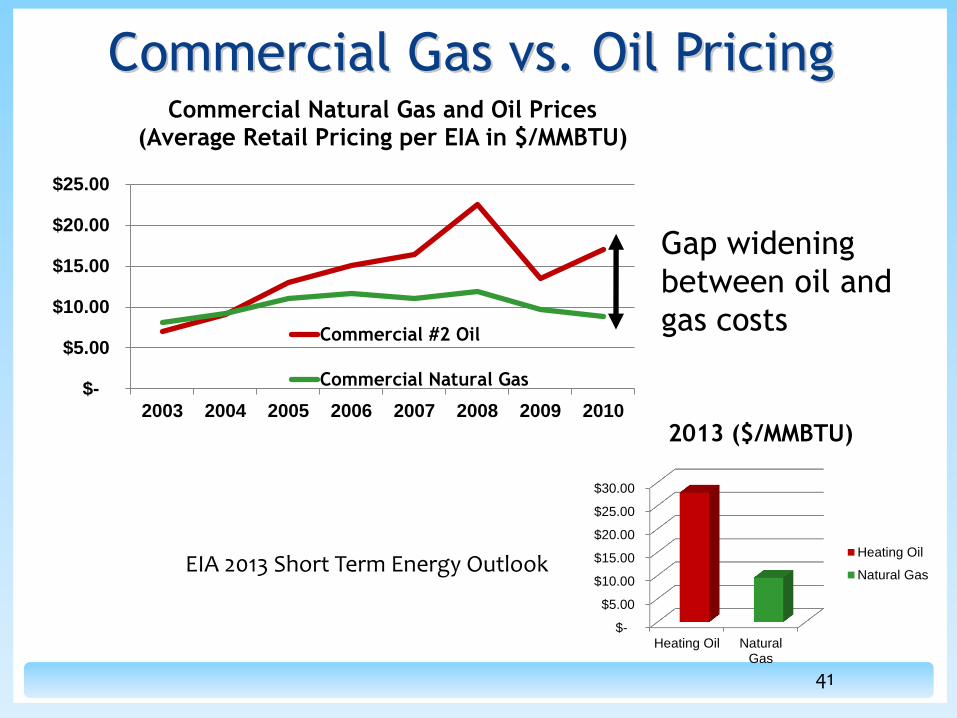
Commercial Gas vs. Oil Pricing
$-
$5.00
$10.00
$15.00
$20.00
$25.00
2003 2004 2005 2006 2007 2008 2009 2010
Commercial Natural Gas and Oil Prices (Average Retail Pricing per EIA in $/MMBTU)
Commercial #2 Oil
Commercial Natural Gas
Gap widening
between oil and
gas costs
$-
$5.00
$10.00
$15.00
$20.00
$25.00
$30.00
Heating Oil NaturalGas
2013 ($/MMBTU)
Heating Oil
Natural GasEIA 2013 Short Term Energy Outlook
42
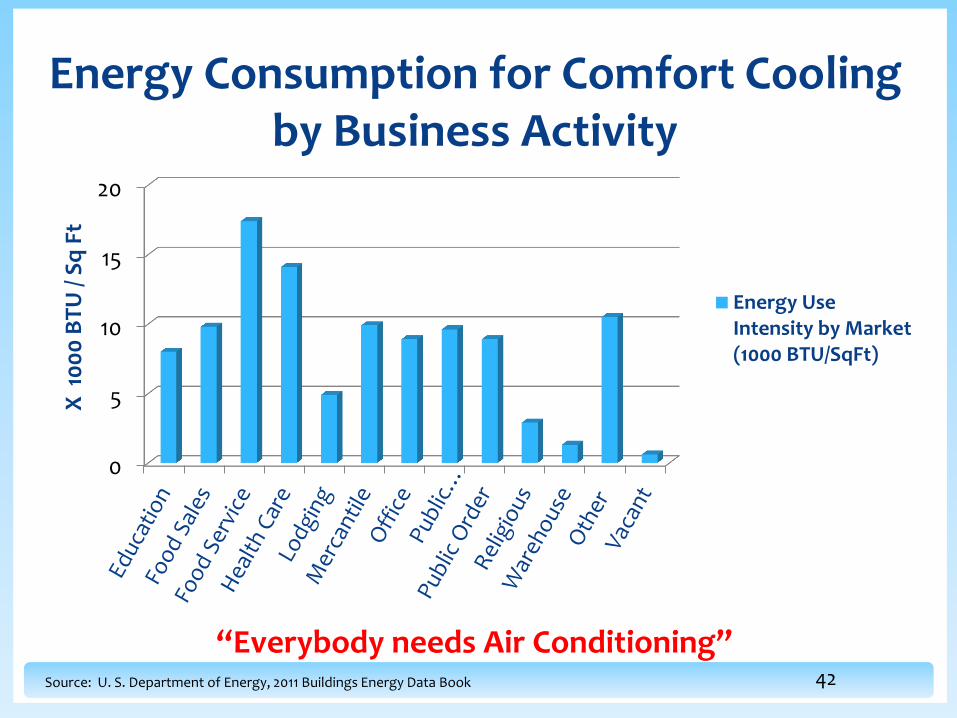
Energy Consumption for Comfort Cooling by Business Activity
Source: U. S. Department of Energy, 2011 Buildings Energy Data Book
0
5
10
15
20
X 1
00
0 B
TU
/ S
q F
t
Energy UseIntensity by Market(1000 BTU/SqFt)
“Everybody needs Air Conditioning”
43
0.0
0.5
1.0
1.5
2.0
2.5
3.0
ElectricCentrifugal
Absorption- SingleEffectDirectFired
Absorption- Single Eff
/ usingWasteHeat
Absorption- Double
Effect
EngineDrivenChiller
EngineDriven w/
HeatRecovery
20 Y
r Li
fe C
ycle
Co
st (
$mil
)
AnnualEnergy Cost
AverageMaintenance
Installed Cost
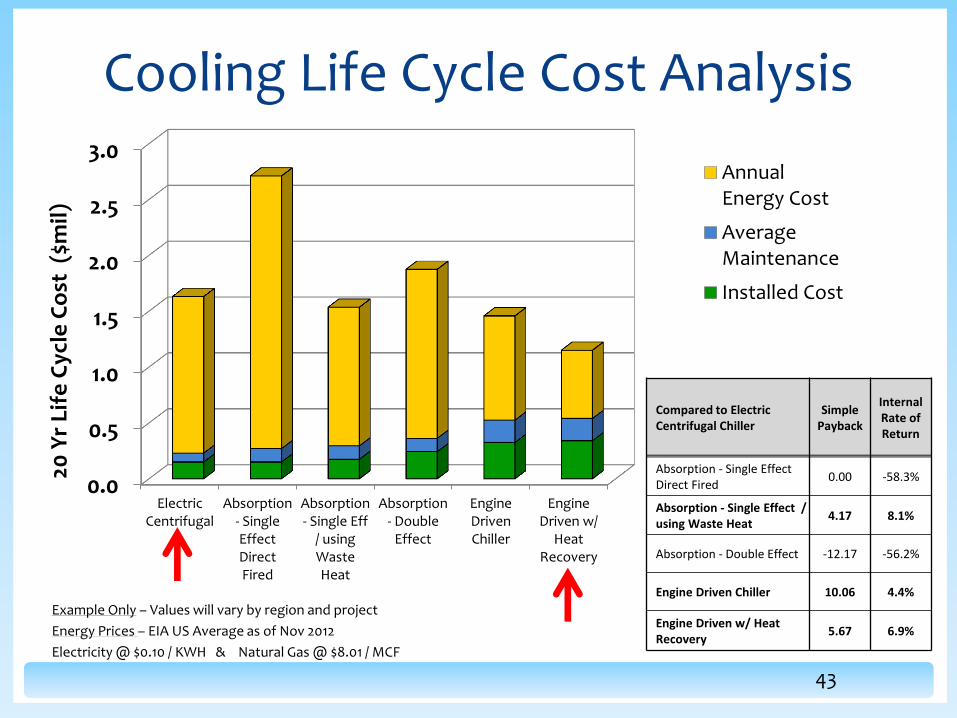
Cooling Life Cycle Cost Analysis
Example Only – Values will vary by region and project
Energy Prices – EIA US Average as of Nov 2012
Electricity @ $0.10 / KWH & Natural Gas @ $8.01 / MCF
Compared to Electric Centrifugal Chiller
Simple Payback
Internal Rate of Return
Absorption - Single Effect Direct Fired
0.00 -58.3%
Absorption - Single Effect / using Waste Heat
4.17 8.1%
Absorption - Double Effect -12.17 -56.2%
Engine Driven Chiller 10.06 4.4%
Engine Driven w/ Heat Recovery
5.67 6.9%
44
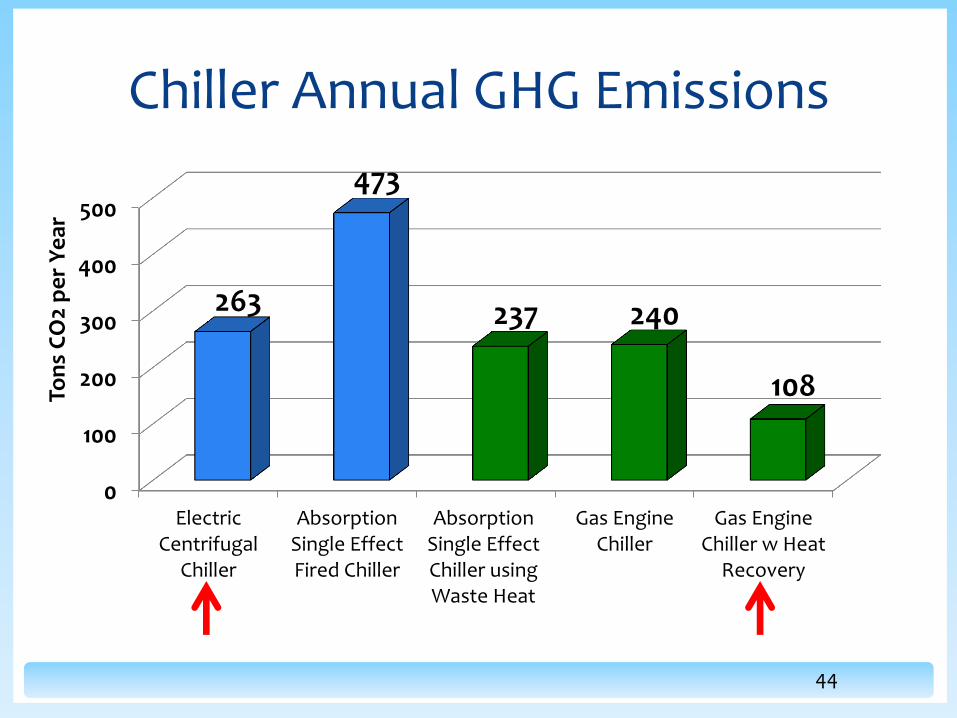
Chiller Annual GHG Emissions
0
100
200
300
400
500
ElectricCentrifugal
Chiller
AbsorptionSingle EffectFired Chiller
AbsorptionSingle EffectChiller usingWaste Heat
Gas EngineChiller
Gas EngineChiller w Heat
Recovery
263
473
237 240
108 Ton
s C
O2
pe
r Y
ear

45
Optimum humidity level – 45% to 55%
Uncontrolled humidity negatively impacts:
• HVAC systems
• Energy costs
• Building structure and systems
• Furnishings, equipment and supplies
• Comfort of building occupants
• Health of building occupants
Why Control Humidity?

46
H1N1 Influenza
Health Impact of Uncontrolled Humidity
Optimum Level
% Relative Humidity
Gas fired desiccants & humidifiers are available to help
‹#› 47
CenterPoint Energy Conservation Improvement Program rebates Rebates for boilers, boiler system components, other heating systems, water heaters, foodservice equipment, and custom equipment. Availability, details and contact info: Minnesota: Business Customer Hotline: 612-321-4939, 877-809-3803 CenterPointEnergy.com/BusinessRebates Arkansas: Lance Orton: 501-377-4548 CenterPointEnergy.com/ARBusinessRebates Oklahoma: Robin Slater: 580-250-5426 CenterPointEnergy.com/OKBusinessRebates

‹#› 48
Questions?