Embed Size (px)
Citation preview

1
WiFi Offloading 기술동향
Kyunghan Lee
Assistant Professor
ECE
UNIST
제3회 WLAN 최신기술 워크숍
2
Mobile Data Explosion□ Continuous Growth of Mobile Data Volume
61% CAGR during 2013-2018 (CISCO VNI 2014) ( 78% CAGR predicted at 2012)
3
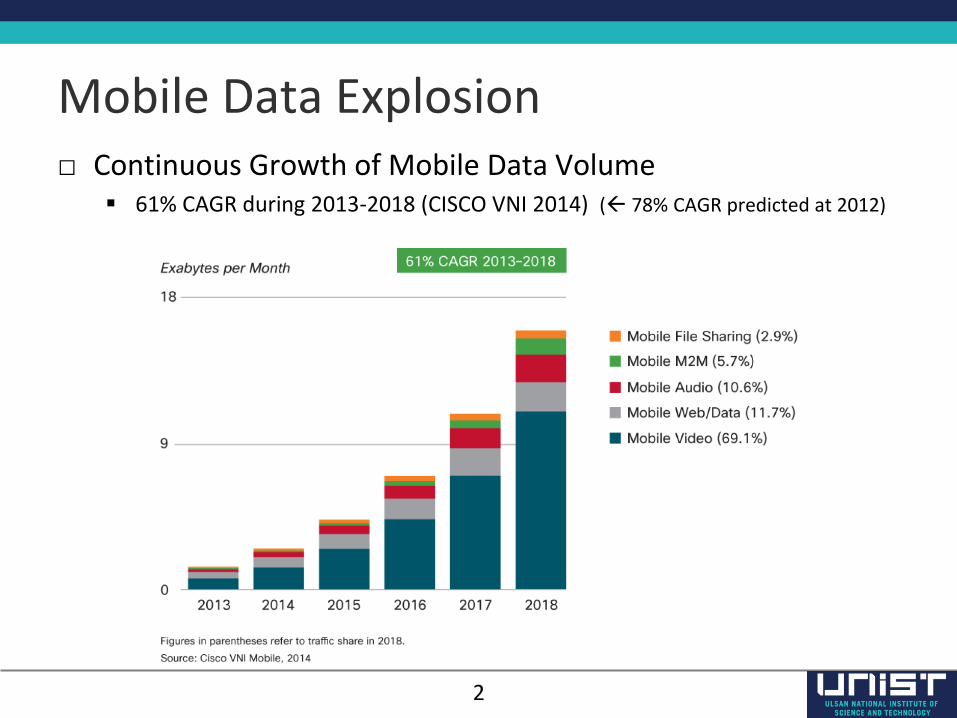
Slow 4G Adoption□ LTE is provided in only limited countries
As of 2014, about 4% of users subscribe LTE networks.
LTE Subscribers (27 millions) (Aug. 2013 – GSMA Intelligence)
LTE Coverage
As of Jan. 2014 South Korea alone has 27 million subscribers
(MSIP.go.kr)
4
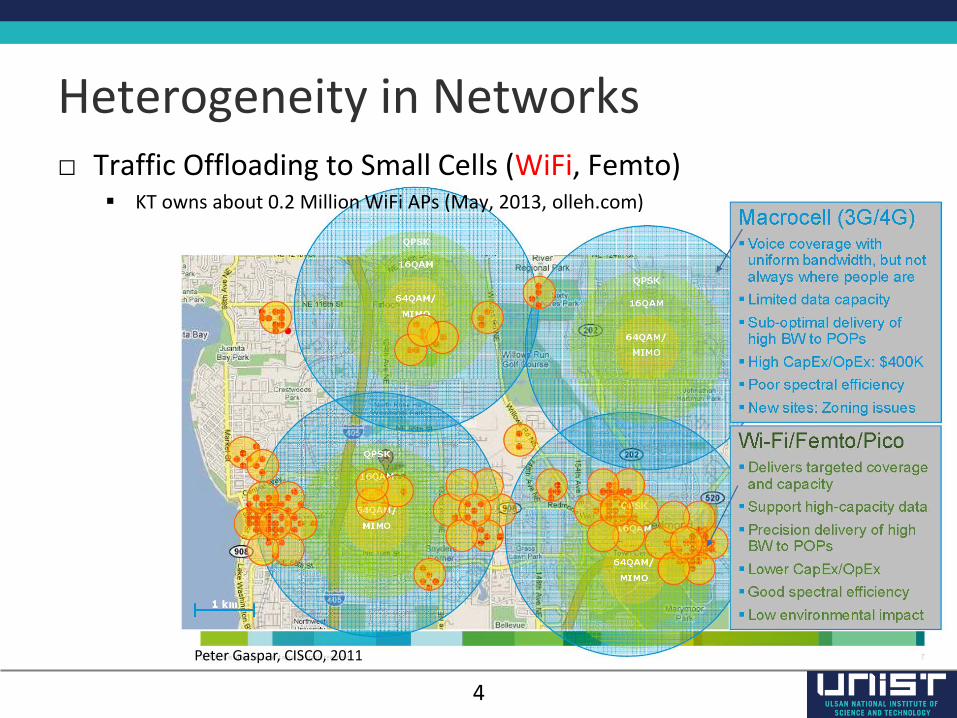
Heterogeneity in Networks
Peter Gaspar, CISCO, 2011
□ Traffic Offloading to Small Cells (WiFi, Femto) KT owns about 0.2 Million WiFi APs (May, 2013, olleh.com)
5
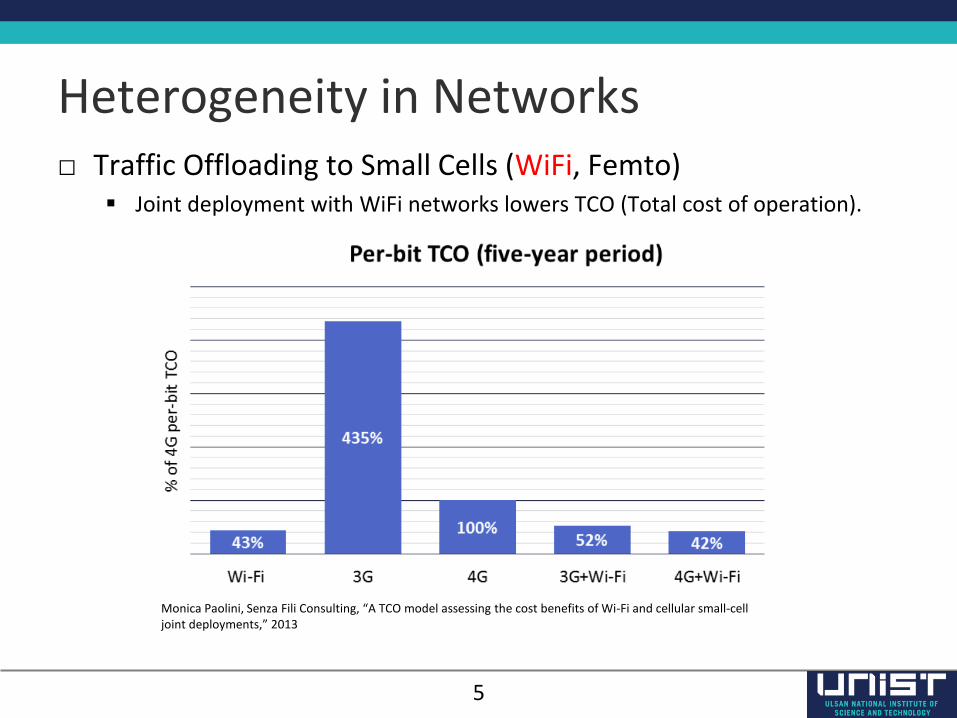
Heterogeneity in Networks□ Traffic Offloading to Small Cells (WiFi, Femto)
Joint deployment with WiFi networks lowers TCO (Total cost of operation).
Monica Paolini, Senza Fili Consulting, “A TCO model assessing the cost benefits of Wi-Fi and cellular small-cell joint deployments,” 2013
6
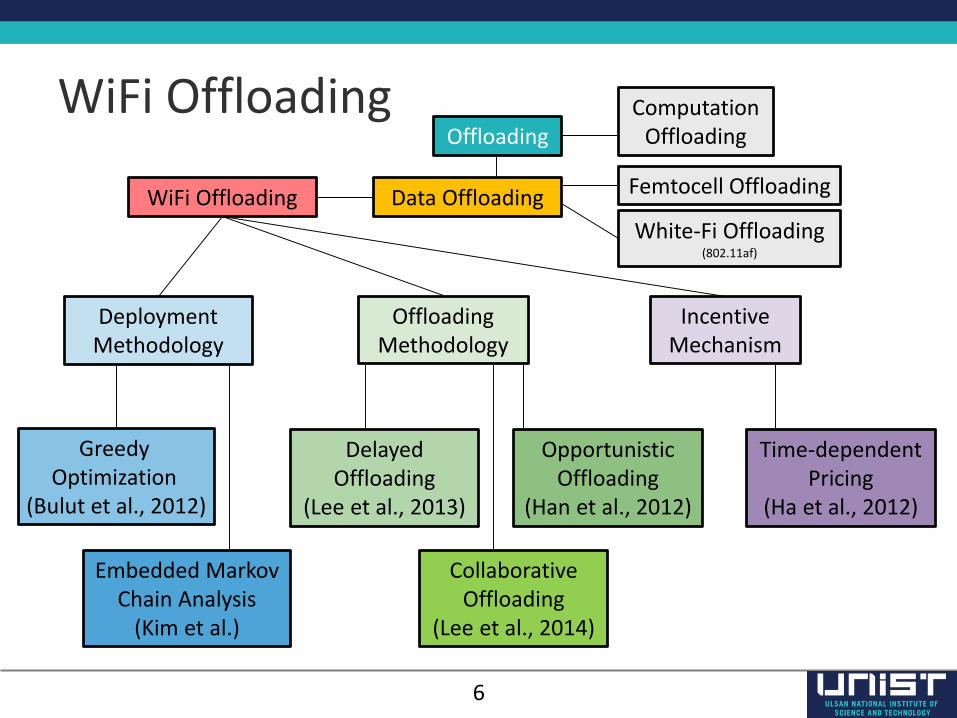
WiFi OffloadingOffloading
ComputationOffloading
Data Offloading Femtocell OffloadingWiFi Offloading
White-Fi Offloading(802.11af)
DelayedOffloading
(Lee et al., 2013)
Opportunistic Offloading
(Han et al., 2012)
CollaborativeOffloading
(Lee et al., 2014)
Time-dependentPricing
(Ha et al., 2012)
Embedded Markov Chain Analysis
(Kim et al.)
GreedyOptimization
(Bulut et al., 2012)
Offloading Methodology
IncentiveMechanism
DeploymentMethodology
7
Offloading Methodology
[Lee et al. 2013] Kyunghan Lee, Joohyun Lee, Yung Yi, Injong Rhee, and Song Chong, “Mobile data offloading: How much can WiFi deliver?” IEEE/ACM Transactions on Networking, vol. 21, no. 2, pp. 536-550, Apr. 2013.
[Han et al. 2012] Bo Han, Pan Hui, V.S. Anil Kumar, Madhav V. Marathe, Jianhua Shao, and Aravind Srinivasan, “Mobile Data Offloading through Opportunistic Communications and Social Participation,” IEEE Transactions on Mobile Computing, vol. 11, no. 5, pp. 821-834, May. 2012
[Lee et al. 2014] Joohyun Lee, Kyunghan Lee, Youngjin Kim, and Song Chong, “PhonePool: On Energy-efficient Mobile Network Collaboration with Provider Aggregation,” IEEE SECON 2014
88
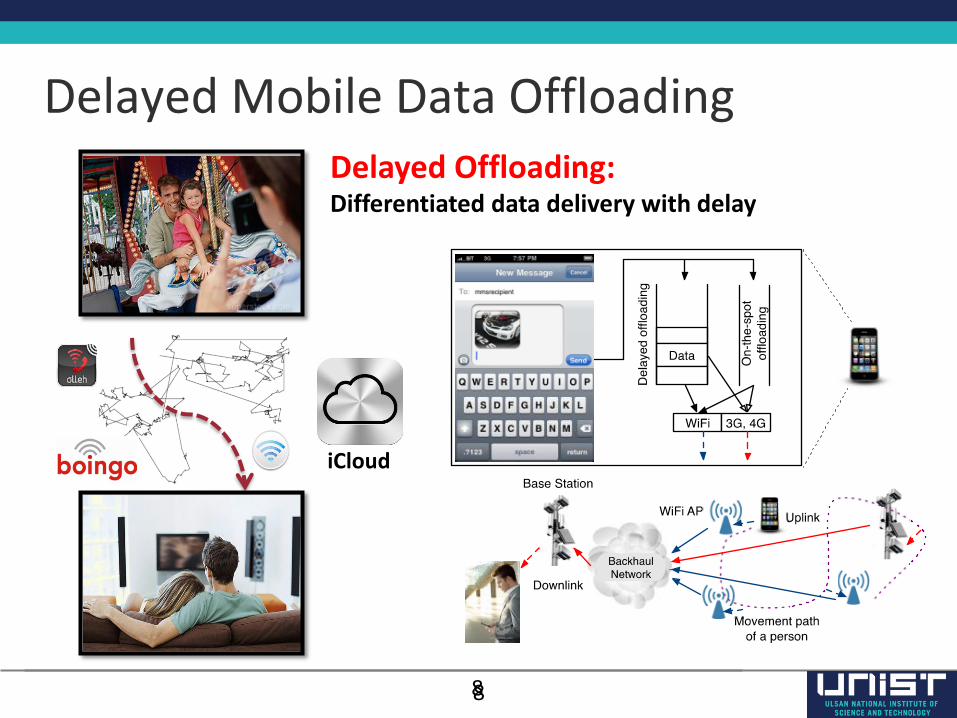
iCloud
Delayed Mobile Data OffloadingDelayed Offloading:Differentiated data delivery with delay
9
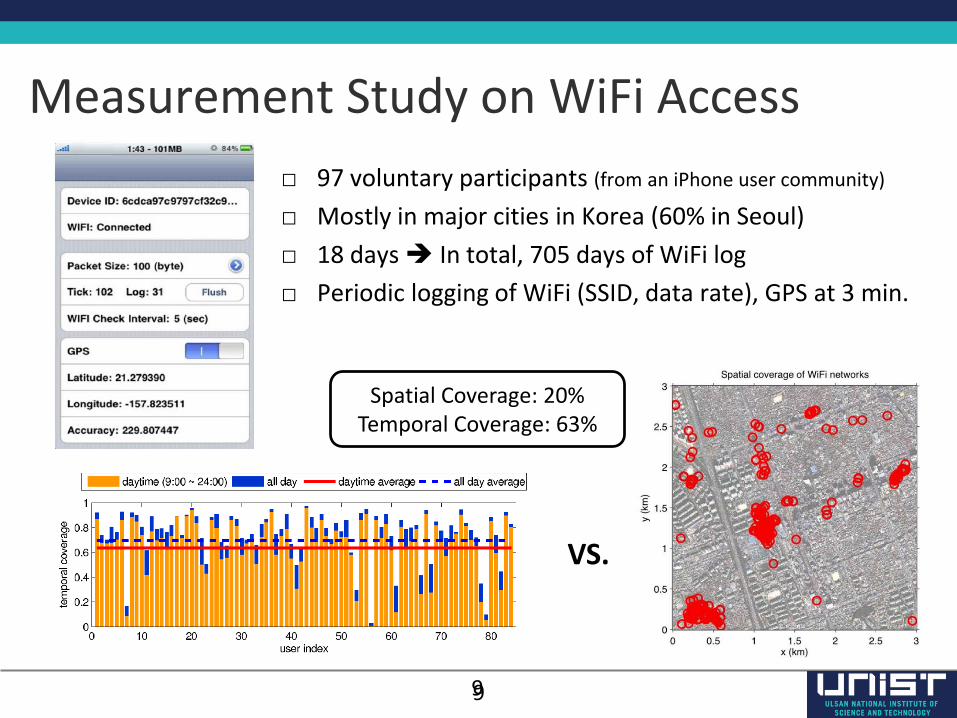
Measurement Study on WiFi Access
□ 97 voluntary participants (from an iPhone user community)
□ Mostly in major cities in Korea (60% in Seoul)
□ 18 days In total, 705 days of WiFi log
□ Periodic logging of WiFi (SSID, data rate), GPS at 3 min.
9
VS.
Spatial Coverage: 20%Temporal Coverage: 63%
10
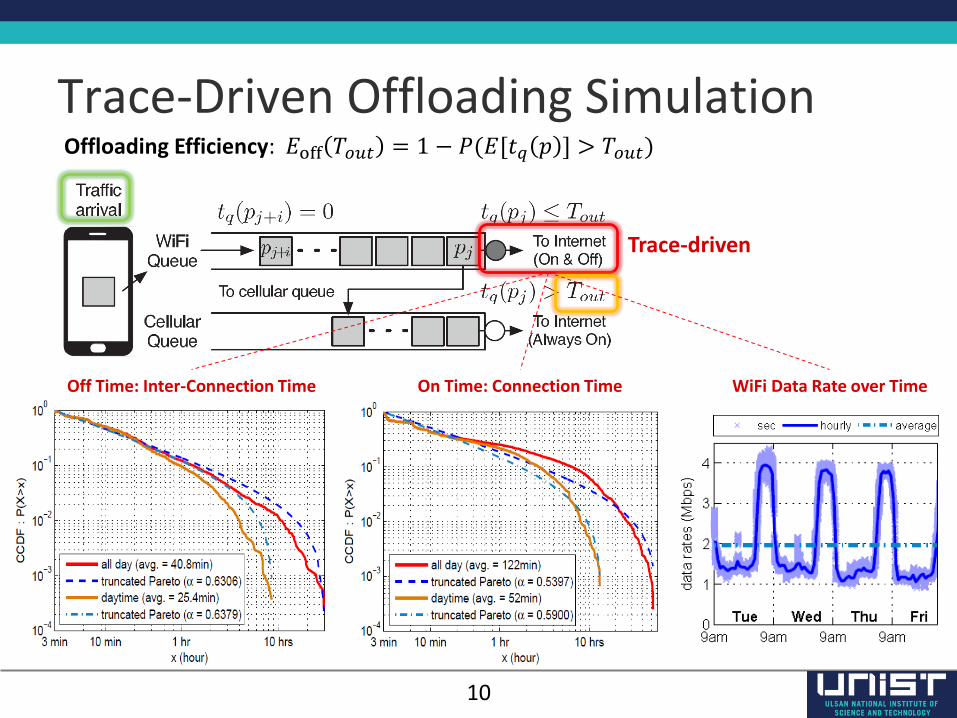
Trace-Driven Offloading Simulation
Trace-driven
Off Time: Inter-Connection Time On Time: Connection Time WiFi Data Rate over Time
Offloading Efficiency: 𝐸off 𝑇𝑜𝑢𝑡 = 1 − 𝑃(𝐸[𝑡𝑞 𝑝 ] > 𝑇𝑜𝑢𝑡)
11
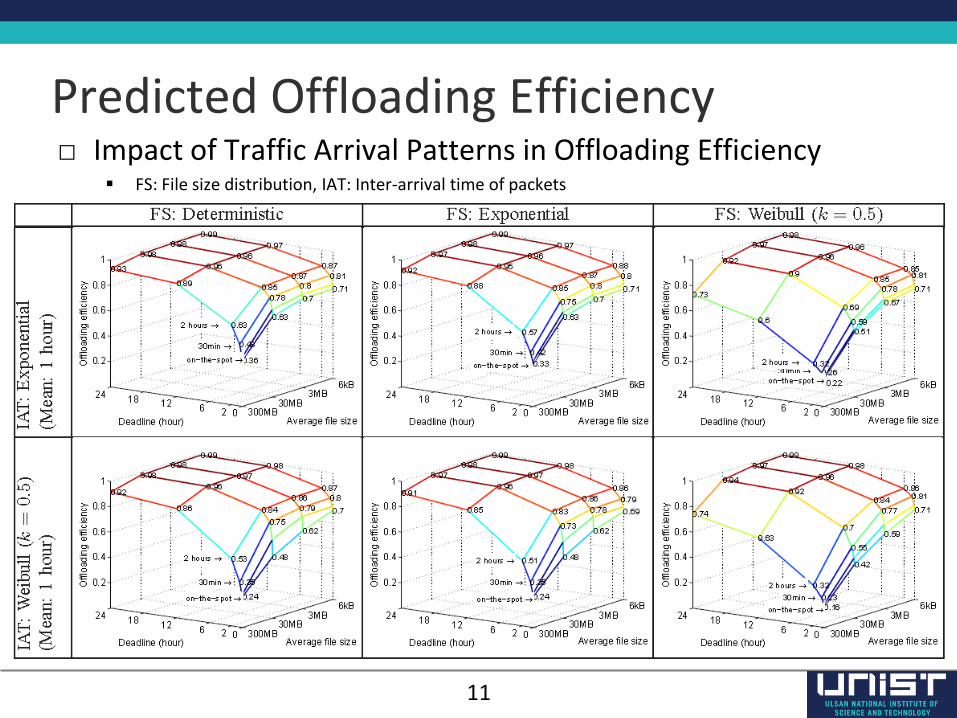
Predicted Offloading Efficiency□ Impact of Traffic Arrival Patterns in Offloading Efficiency
FS: File size distribution, IAT: Inter-arrival time of packets
12
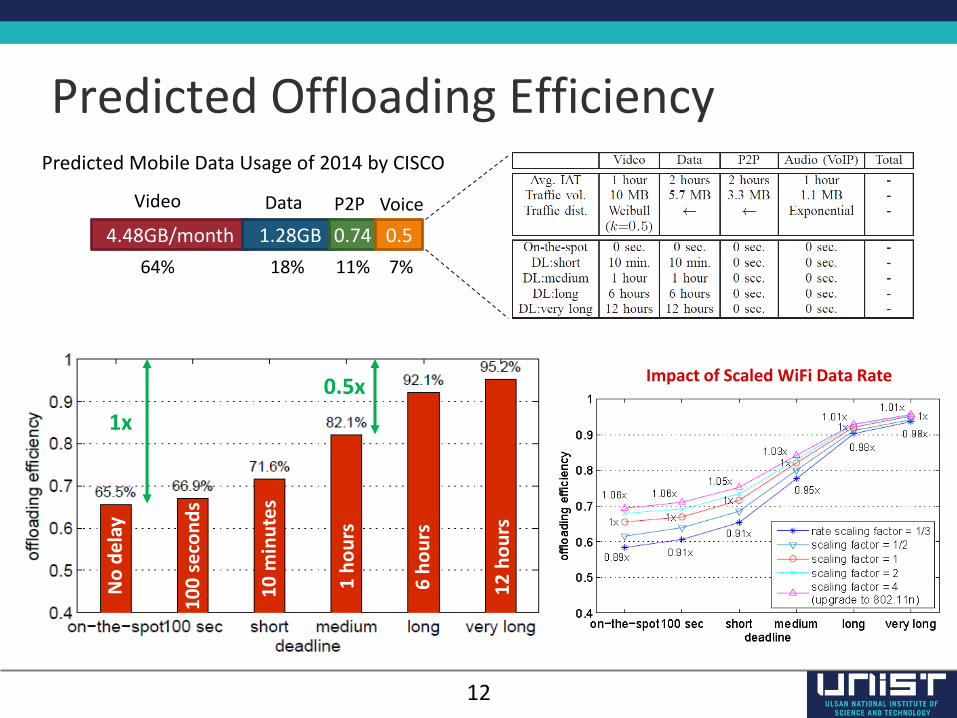
Predicted Offloading Efficiency
4.48GB/month 1.28GB 0.74 0.5
Video Data P2P Voice
64% 11% 7%18%
6 h
ou
rs
No
de
lay
1 h
ou
rs
10
min
ute
s
10
0 s
eco
nd
s
12
ho
urs
1x
0.5x
Predicted Mobile Data Usage of 2014 by CISCO
Impact of Scaled WiFi Data Rate
13
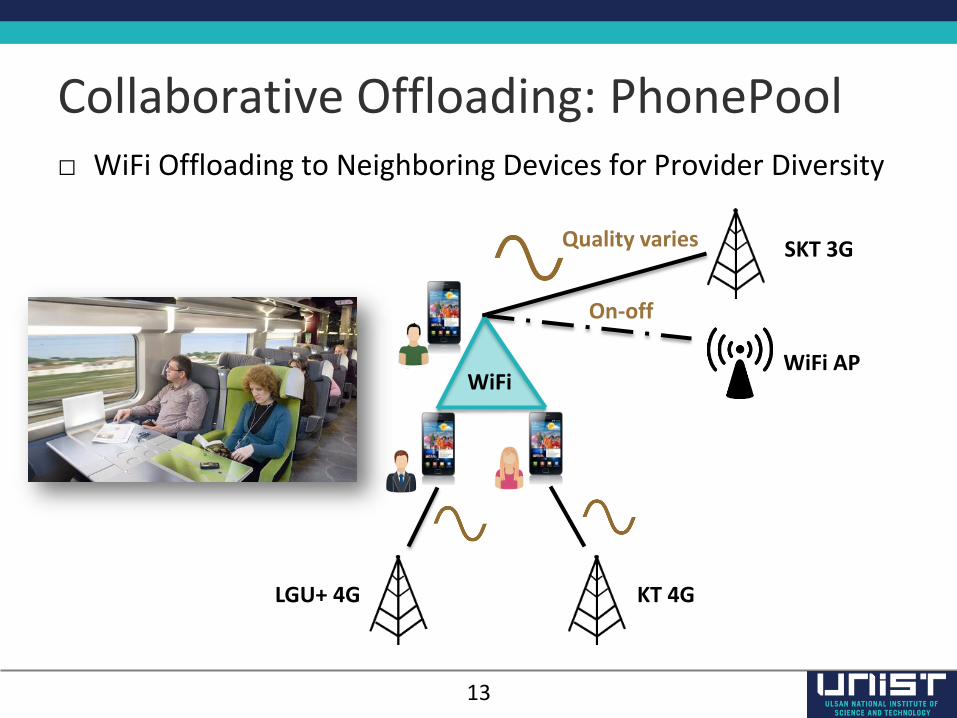
Collaborative Offloading: PhonePool
SKT 3G
On-off
Quality varies
□ WiFi Offloading to Neighboring Devices for Provider Diversity
KT 4GLGU+ 4G
WiFiWiFi AP
14
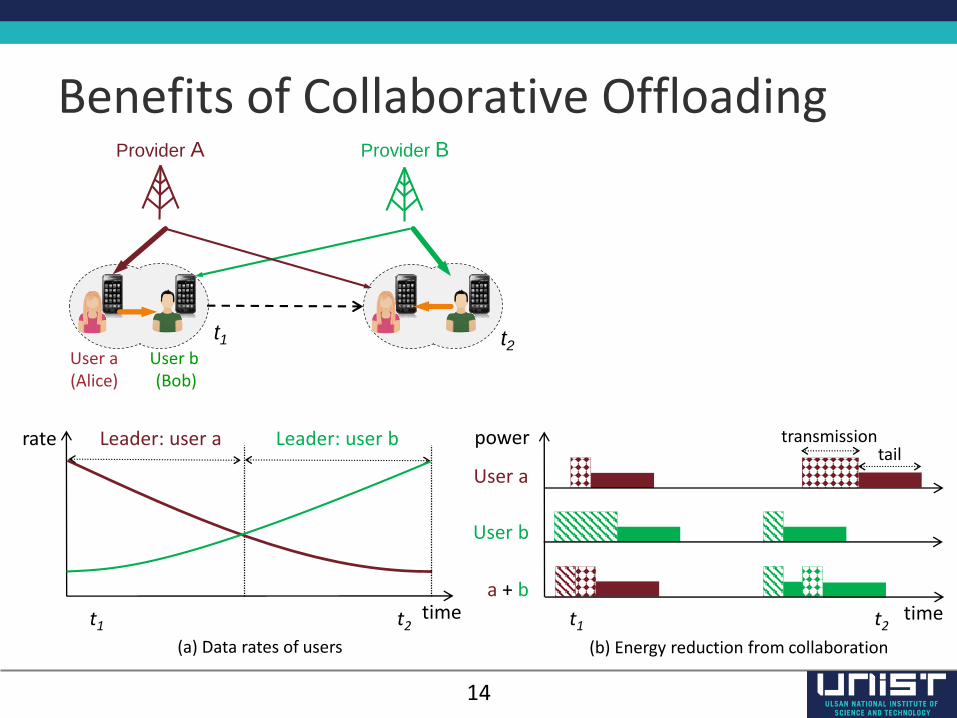
Benefits of Collaborative Offloading
t1 t2time
rate Leader: user a Leader: user b
(a) Data rates of users
t1 t2
Provider A Provider B
User b (Bob)
User a(Alice)
t1 t2 time
power
User a
User b
a + b
tailtransmission
(b) Energy reduction from collaboration
15
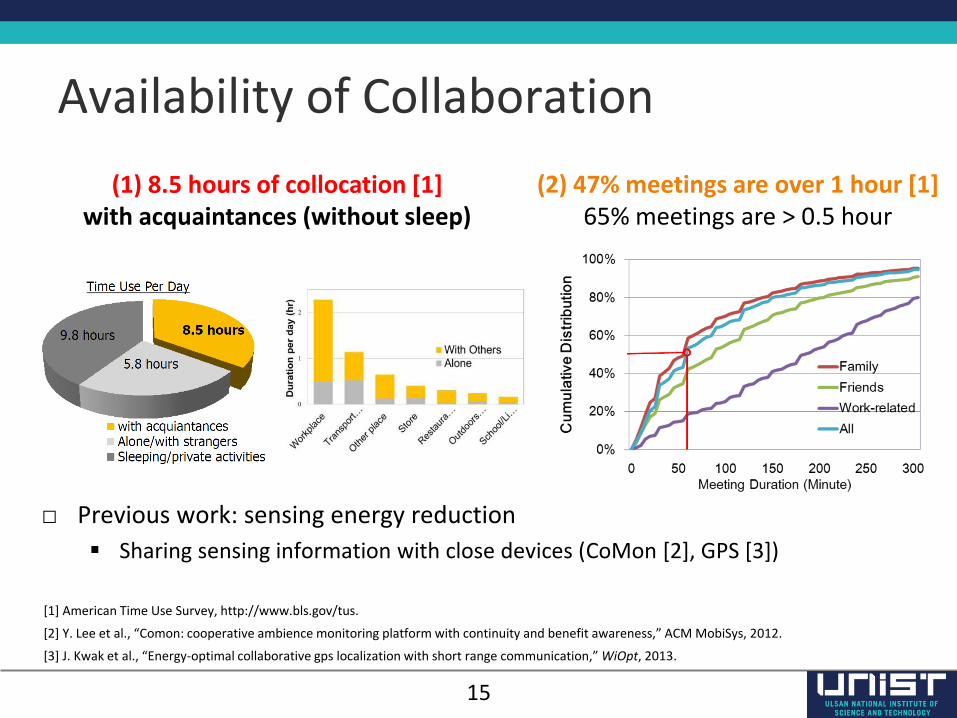
Availability of Collaboration
□ Previous work: sensing energy reduction
Sharing sensing information with close devices (CoMon [2], GPS [3])
[1] American Time Use Survey, http://www.bls.gov/tus.
[2] Y. Lee et al., “Comon: cooperative ambience monitoring platform with continuity and benefit awareness,” ACM MobiSys, 2012.
[3] J. Kwak et al., “Energy-optimal collaborative gps localization with short range communication,” WiOpt, 2013.
(1) 8.5 hours of collocation [1]with acquaintances (without sleep)
(2) 47% meetings are over 1 hour [1]65% meetings are > 0.5 hour
16
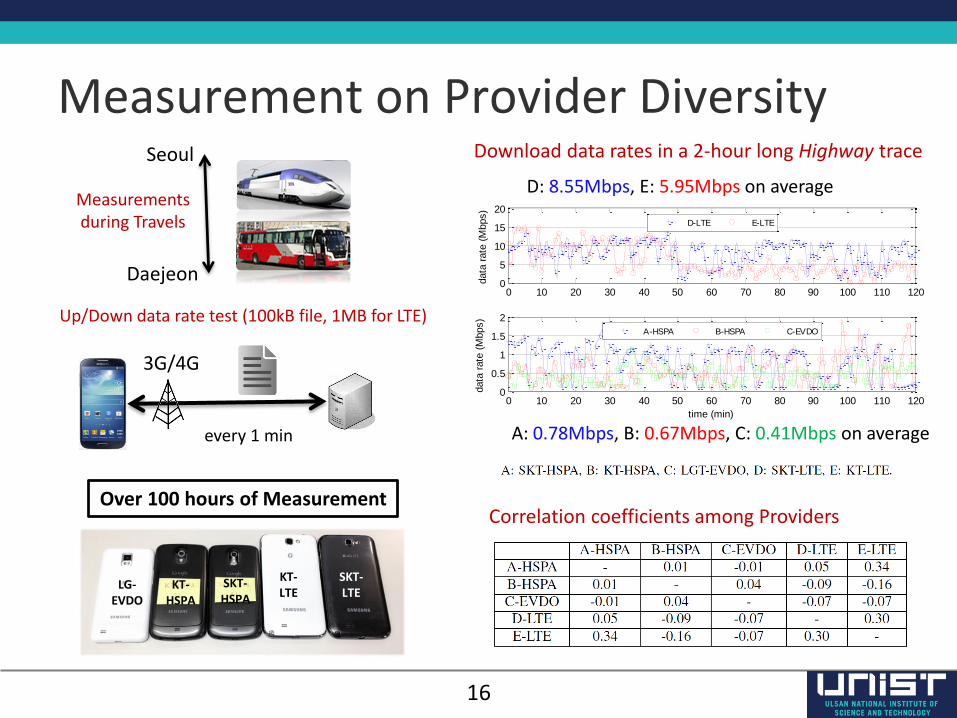
Measurement on Provider Diversity
0 10 20 30 40 50 60 70 80 90 100 110 1200
5
10
15
20
data
rate
(M
bps)
D-LTE E-LTE
0 10 20 30 40 50 60 70 80 90 100 110 1200
0.5
1
1.5
2
time (min)
data
rate
(M
bps)
A-HSPA B-HSPA C-EVDO
Seoul
Daejeon
LG-EVDO
KT-HSPA
SKT-HSPA
KT-LTE
SKT-LTE
Download data rates in a 2-hour long Highway trace
Over 100 hours of Measurement
A: 0.78Mbps, B: 0.67Mbps, C: 0.41Mbps on average
D: 8.55Mbps, E: 5.95Mbps on average
Up/Down data rate test (100kB file, 1MB for LTE)
every 1 min
3G/4G
Correlation coefficients among Providers
Measurementsduring Travels
17
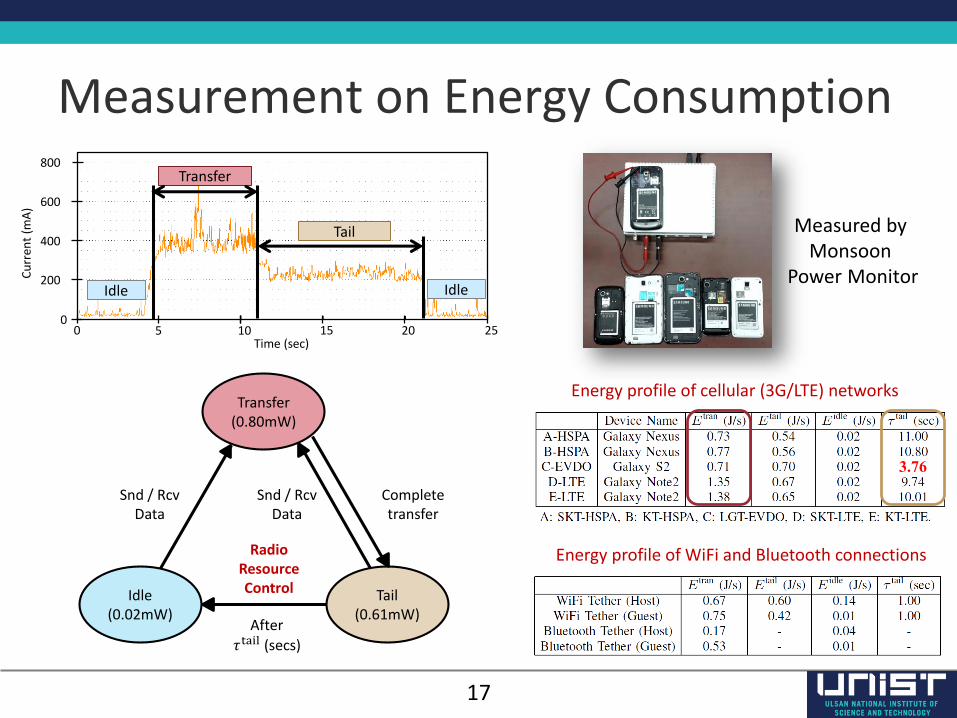
Measurement on Energy Consumption
Transfer(0.80mW)
Tail(0.61mW)
Idle(0.02mW)
After
𝜏tail (secs)
Snd / RcvData
Completetransfer
Snd / RcvData
0 5 10 15 20 250
200
400
600
800
Time (sec)
Cu
rren
t (m
A)
Idle
Transfer
Tail
Idle
Energy profile of cellular (3G/LTE) networks
Energy profile of WiFi and Bluetooth connections
3.76
Measured by Monsoon
Power Monitor
Radio Resource Control
18
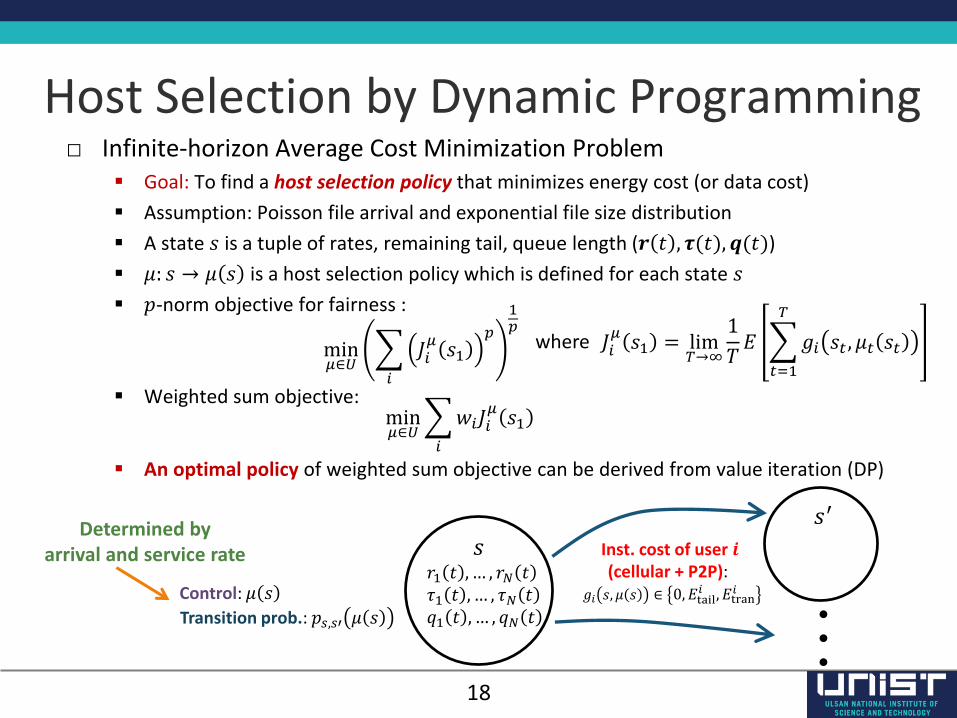
Host Selection by Dynamic Programming □ Infinite-horizon Average Cost Minimization Problem
Goal: To find a host selection policy that minimizes energy cost (or data cost)
Assumption: Poisson file arrival and exponential file size distribution
A state 𝑠 is a tuple of rates, remaining tail, queue length (𝒓 𝑡 , 𝝉(𝑡), 𝒒(𝑡))
𝜇: 𝑠 → 𝜇 𝑠 is a host selection policy which is defined for each state 𝑠
𝑝-norm objective for fairness :
Weighted sum objective:
An optimal policy of weighted sum objective can be derived from value iteration (DP)
𝑠𝑟1 𝑡 ,… , 𝑟𝑁 𝑡𝜏1 𝑡 ,… , 𝜏𝑁 𝑡𝑞1 𝑡 ,… , 𝑞𝑁 𝑡
𝑠′
Control: 𝜇 𝑠
Transition prob.: 𝑝𝑠,𝑠′ 𝜇 𝑠
Inst. cost of user 𝒊(cellular + P2P):
𝑔𝑖 𝑠, 𝜇 𝑠 ∈ 0, 𝐸tail𝑖 , 𝐸tran
𝑖 …
Determined byarrival and service rate
min𝜇∈𝑈
𝑖
𝑤𝑖𝐽𝑖𝜇𝑠1
min𝜇∈𝑈
𝑖
𝐽𝑖𝜇𝑠1𝑝
1𝑝
𝐽𝑖𝜇𝑠1 = lim
𝑇→∞
1
𝑇𝐸
𝑡=1
𝑇
𝑔𝑖 𝑠𝑡 , 𝜇𝑡 𝑠𝑡where
19
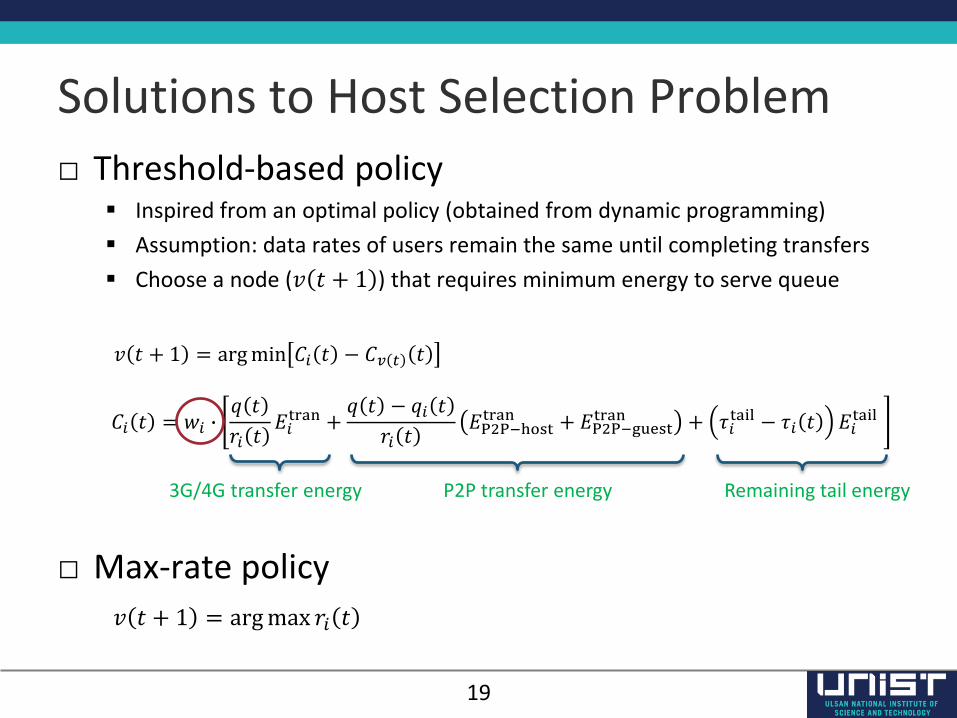
Solutions to Host Selection Problem
□ Threshold-based policy Inspired from an optimal policy (obtained from dynamic programming)
Assumption: data rates of users remain the same until completing transfers
Choose a node (𝑣 𝑡 + 1 ) that requires minimum energy to serve queue
□ Max-rate policy
𝑣 𝑡 + 1 = argmax 𝑟𝑖 𝑡
𝑣 𝑡 + 1 = argmin 𝐶𝑖 𝑡 − 𝐶𝑣 𝑡 𝑡
P2P transfer energy Remaining tail energy3G/4G transfer energy
𝐶𝑖 𝑡 = 𝑤𝑖 ∙𝑞 𝑡
𝑟𝑖 𝑡𝐸𝑖tran +
𝑞 𝑡 − 𝑞𝑖 𝑡
𝑟𝑖 𝑡𝐸P2P−hosttran + 𝐸P2P−guest
tran + 𝜏𝑖tail − 𝜏𝑖 𝑡 𝐸𝑖
tail
20
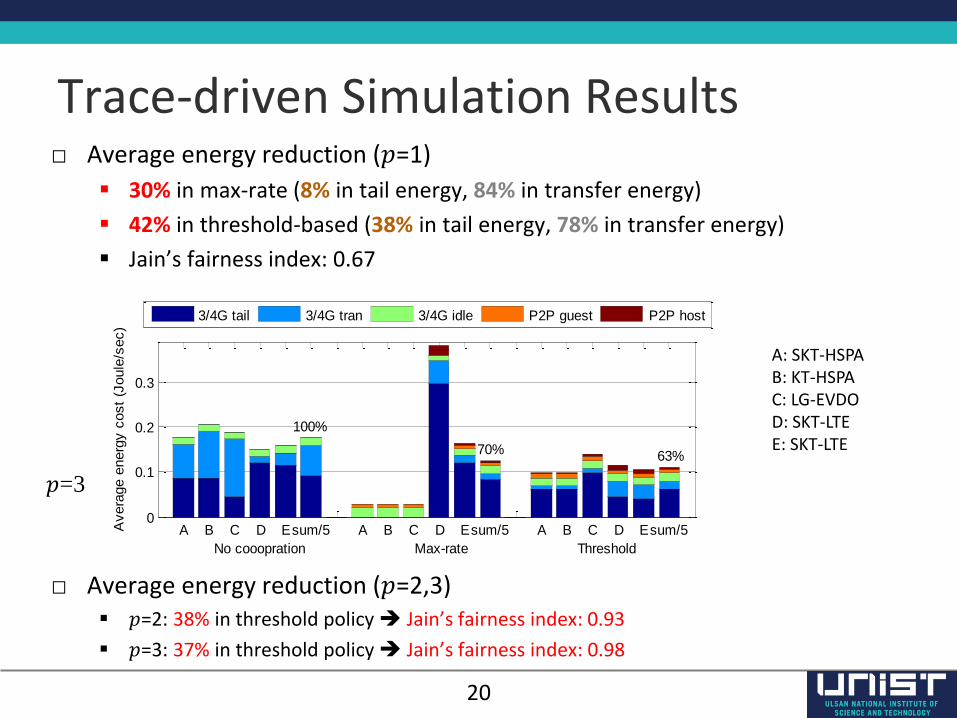
Trace-driven Simulation Results□ Average energy reduction (𝑝=1)
30% in max-rate (8% in tail energy, 84% in transfer energy)
42% in threshold-based (38% in tail energy, 78% in transfer energy)
Jain’s fairness index: 0.67
□ Average energy reduction (𝑝=2,3) 𝑝=2: 38% in threshold policy Jain’s fairness index: 0.93
𝑝=3: 37% in threshold policy Jain’s fairness index: 0.98
30%Reduction
42%Reduction
A: SKT-HSPAB: KT-HSPAC: LG-EVDOD: SKT-LTEE: SKT-LTE
A B C D Esum/5 A B C D Esum/5 A B C D Esum/50
0.1
0.2
0.3
No cooopration Max-rate Threshold
Avera
ge e
nerg
y c
ost
(Joule
/sec)
100%
70%62%
3/4G tail 3/4G tran 3/4G idle P2P guest P2P host
A B C D Esum/5 A B C D Esum/5 A B C D Esum/50
0.1
0.2
0.3
No cooopration Max-rate Threshold
Avera
ge e
nerg
y c
ost
(Joule
/sec)
100%
70% 63%
3/4G tail 3/4G tran 3/4G idle P2P guest P2P host
𝑝=1
𝑝=2
𝑝=3
21
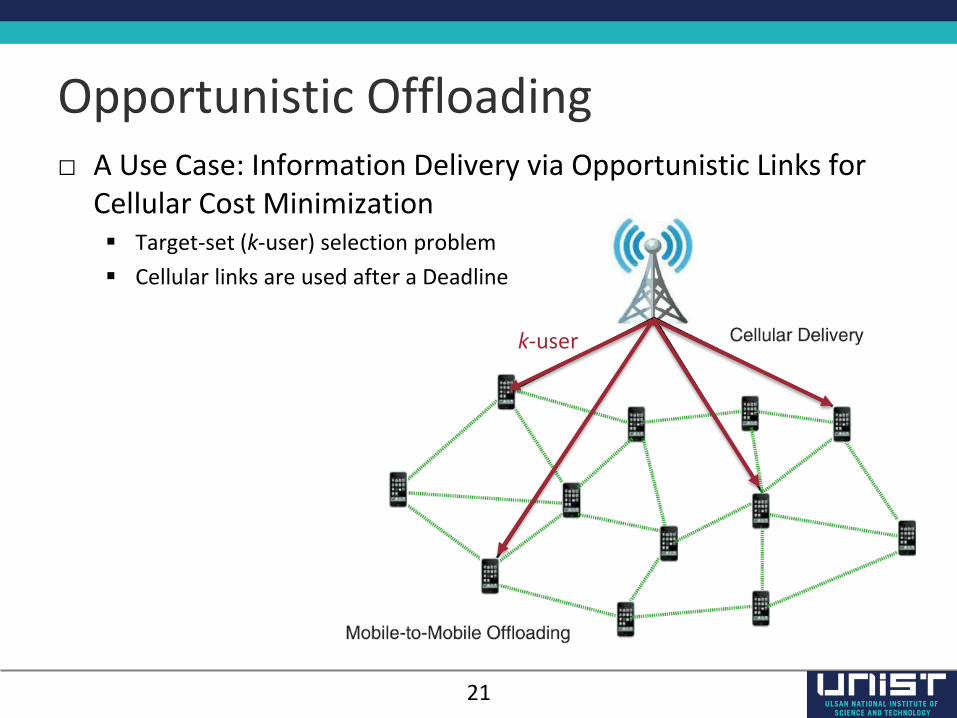
Opportunistic Offloading□ A Use Case: Information Delivery via Opportunistic Links for
Cellular Cost Minimization Target-set (k-user) selection problem
Cellular links are used after a Deadline
k-user
22
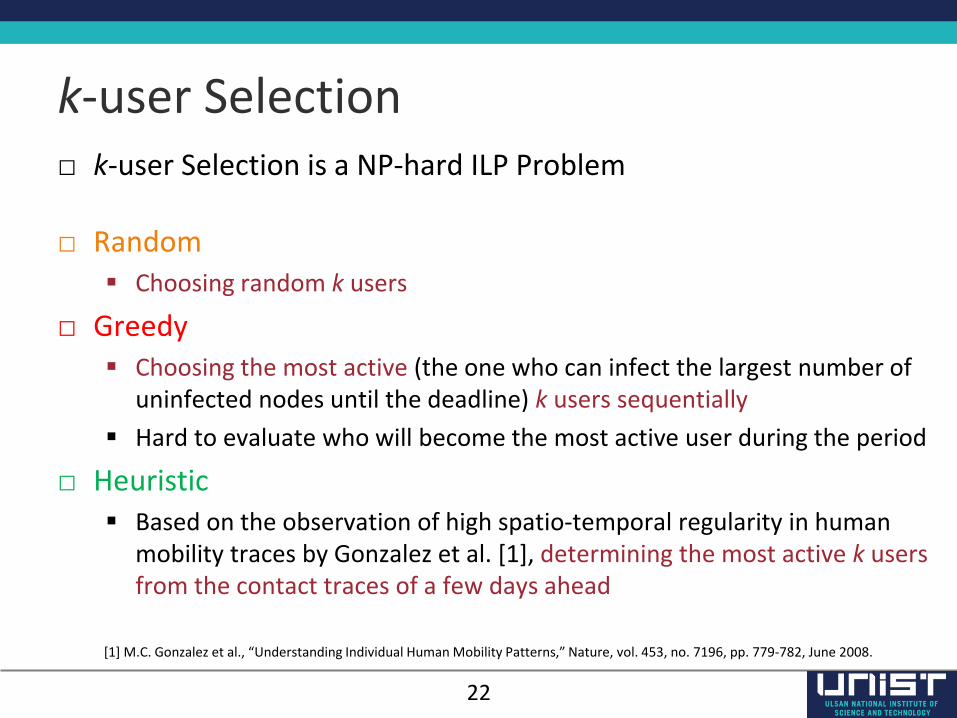
k-user Selection□ k-user Selection is a NP-hard ILP Problem
□ Random Choosing random k users
□ Greedy Choosing the most active (the one who can infect the largest number of
uninfected nodes until the deadline) k users sequentially
Hard to evaluate who will become the most active user during the period
□ Heuristic Based on the observation of high spatio-temporal regularity in human
mobility traces by Gonzalez et al. [1], determining the most active k users from the contact traces of a few days ahead
[1] M.C. Gonzalez et al., “Understanding Individual Human Mobility Patterns,” Nature, vol. 453, no. 7196, pp. 779-782, June 2008.
23
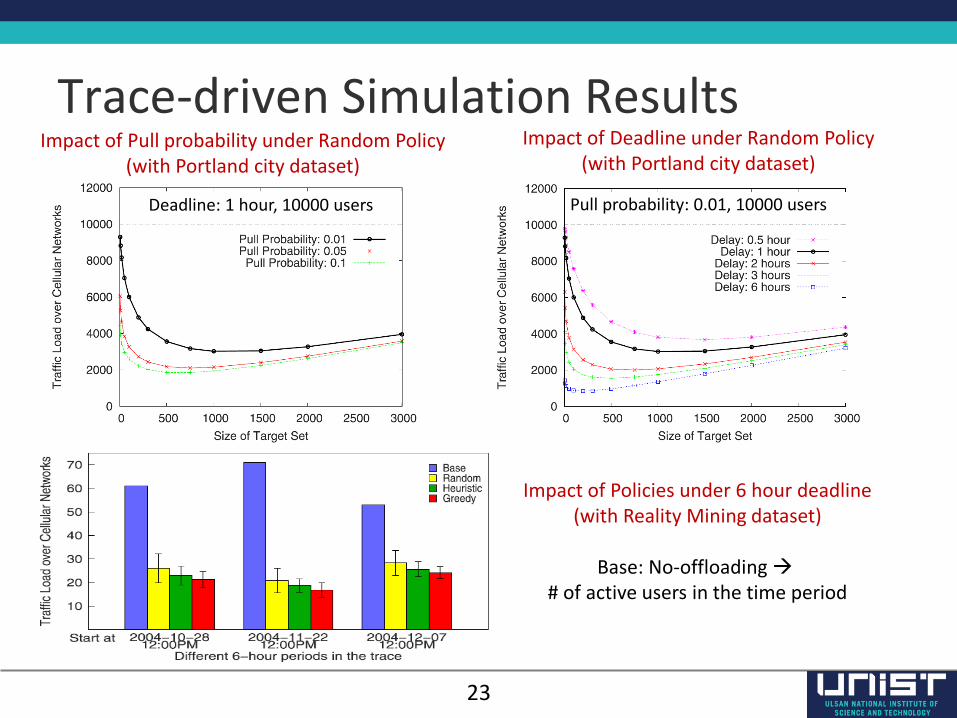
Trace-driven Simulation ResultsImpact of Deadline under Random Policy
(with Portland city dataset)
Impact of Policies under 6 hour deadline(with Reality Mining dataset)
Base: No-offloading # of active users in the time period
Impact of Pull probability under Random Policy(with Portland city dataset)
Deadline: 1 hour, 10000 users Pull probability: 0.01, 10000 users
24
Deployment Methodology
[Bulut et al. 2012] Eyuphan Bulut, and Boleslaw K. Szymanski, “WiFi Access Point Deployment for Efficient Mobile Data Offloading,” ACM Workshop PINGEN (collocated with MobiCom), 2012.
[Kim et al. 2012] Yoora Kim, Kyunghan Lee, and Ness B. Shroff, “An Embedded Markov Chain Analysis for a Mobile Offloading System,” submitted to an ACM conference, 2014
25
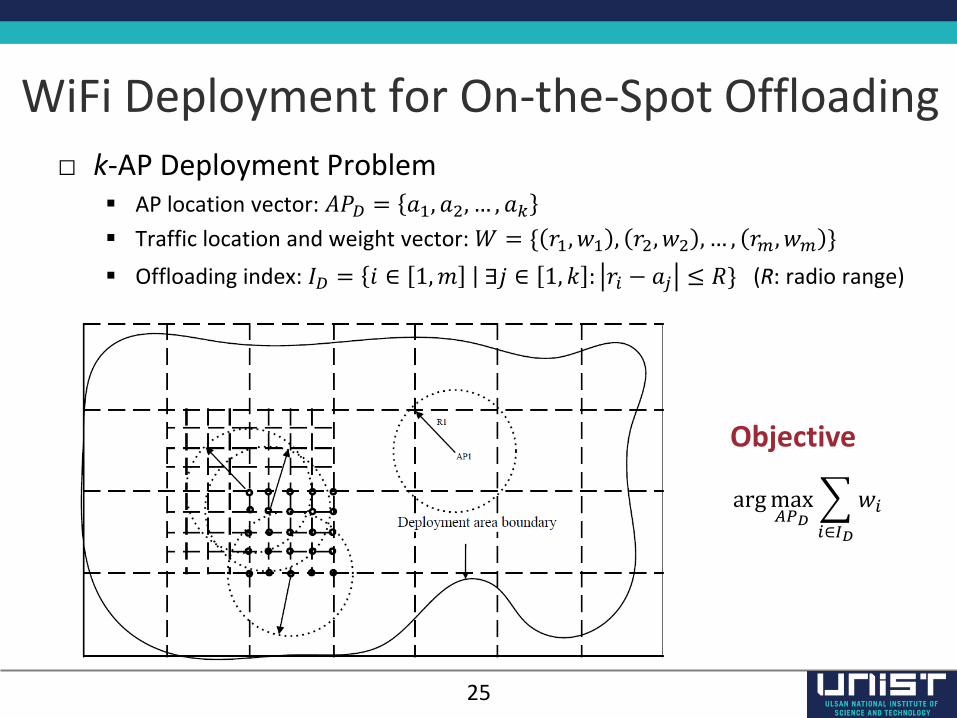
WiFi Deployment for On-the-Spot Offloading □ k-AP Deployment Problem
AP location vector: 𝐴𝑃𝐷 = 𝑎1, 𝑎2, … , 𝑎𝑘 Traffic location and weight vector: 𝑊 = { 𝑟1, 𝑤1 , 𝑟2, 𝑤2 , … , 𝑟𝑚, 𝑤𝑚 }
Offloading index: 𝐼𝐷 = 𝑖 ∈ 1,𝑚 ∃𝑗 ∈ 1, 𝑘 : 𝑟𝑖 − 𝑎𝑗 ≤ 𝑅} (R: radio range)
argmax𝐴𝑃𝐷
𝑖∈𝐼𝐷
𝑤𝑖
Objective
26
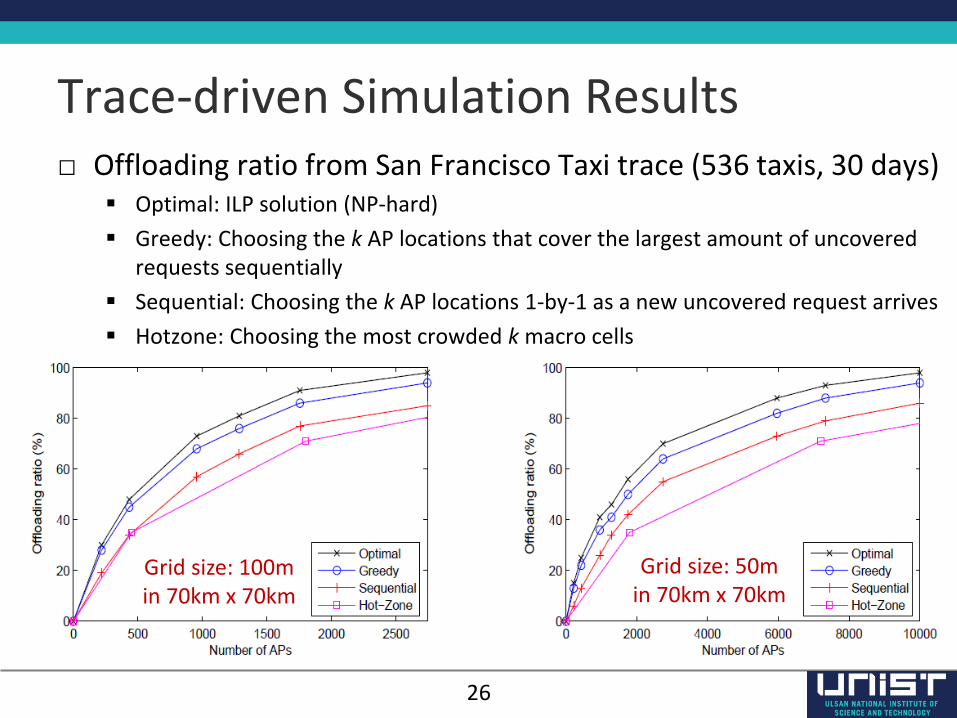
Trace-driven Simulation Results□ Offloading ratio from San Francisco Taxi trace (536 taxis, 30 days)
Optimal: ILP solution (NP-hard)
Greedy: Choosing the k AP locations that cover the largest amount of uncovered requests sequentially
Sequential: Choosing the k AP locations 1-by-1 as a new uncovered request arrives
Hotzone: Choosing the most crowded k macro cells
Grid size: 100min 70km x 70km
Grid size: 50min 70km x 70km
27
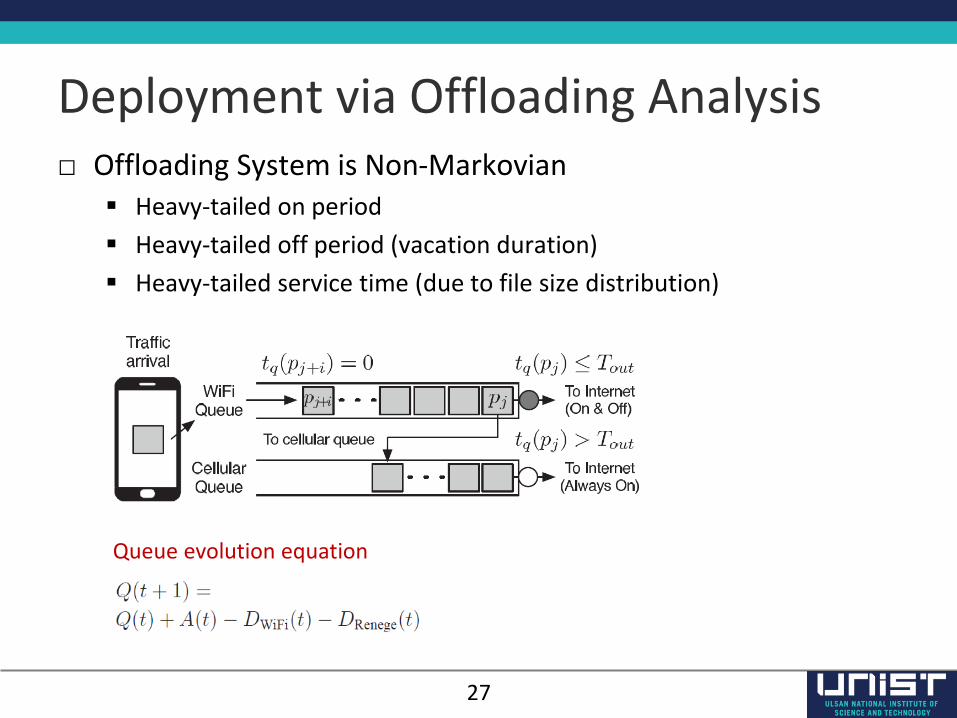
Deployment via Offloading Analysis
Queue evolution equation
□ Offloading System is Non-Markovian Heavy-tailed on period
Heavy-tailed off period (vacation duration)
Heavy-tailed service time (due to file size distribution)
28
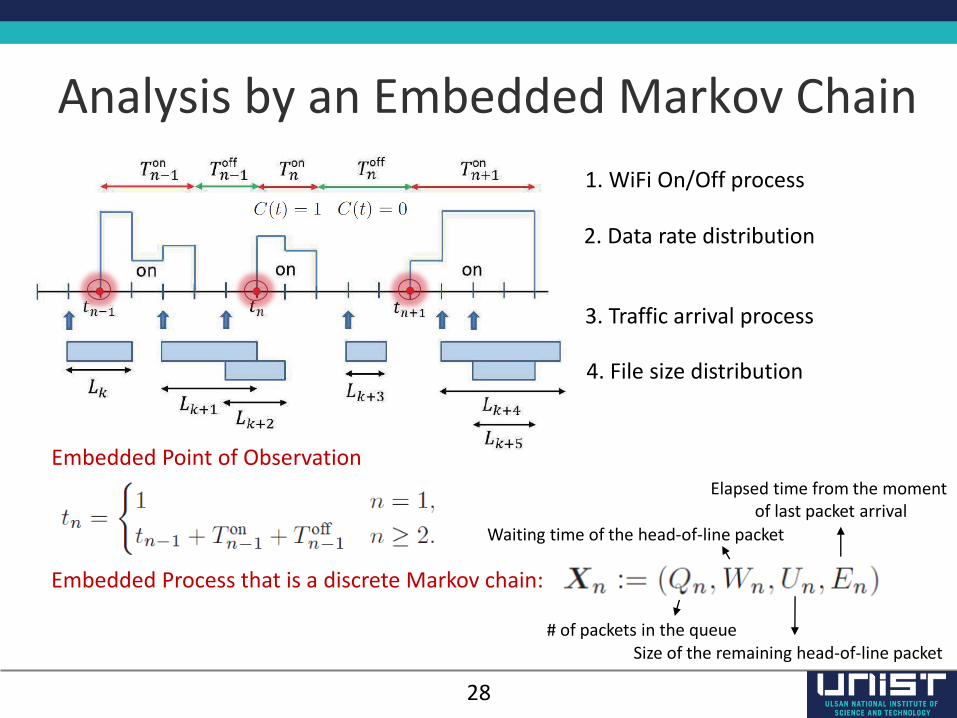
Analysis by an Embedded Markov Chain
3. Traffic arrival process
1. WiFi On/Off process
2. Data rate distribution
4. File size distribution
Embedded Point of Observation
Embedded Process that is a discrete Markov chain:
# of packets in the queue
Waiting time of the head-of-line packet
Size of the remaining head-of-line packet
Elapsed time from the moment of last packet arrival
29
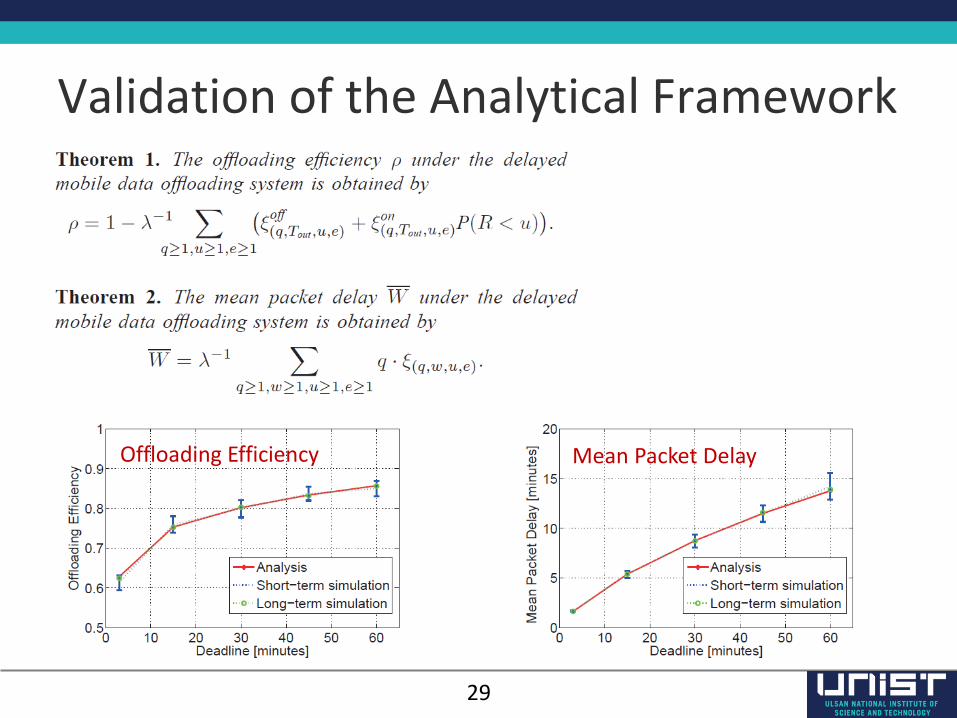
Validation of the Analytical Framework
Offloading Efficiency Mean Packet Delay
30
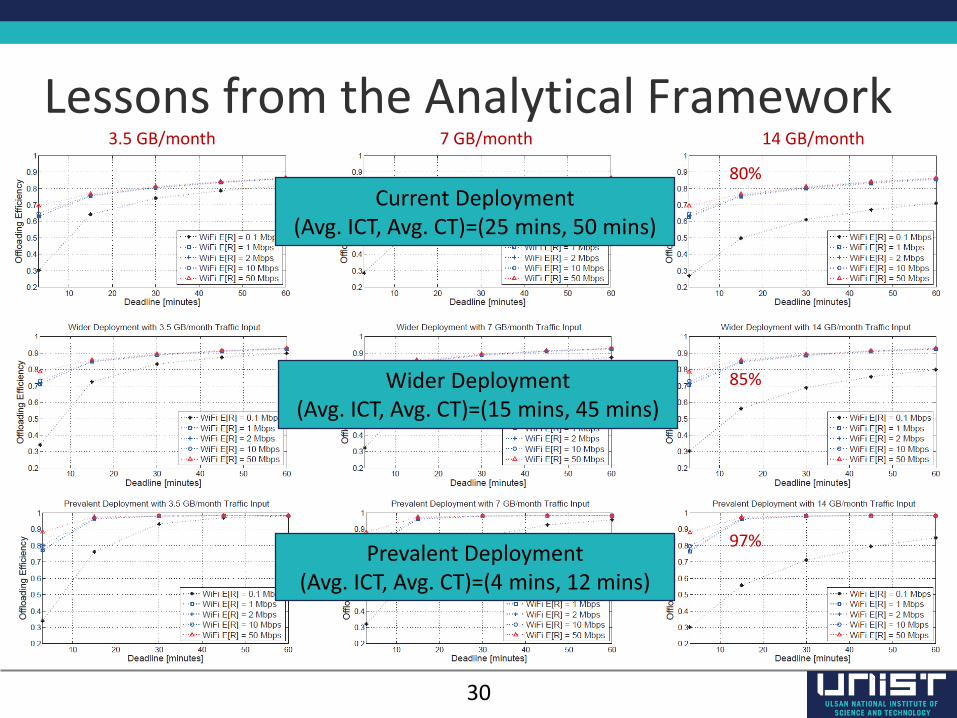
Lessons from the Analytical Framework
Current Deployment(Avg. ICT, Avg. CT)=(25 mins, 50 mins)
Wider Deployment(Avg. ICT, Avg. CT)=(15 mins, 45 mins)
Prevalent Deployment(Avg. ICT, Avg. CT)=(4 mins, 12 mins)
3.5 GB/month 7 GB/month 14 GB/month
80%
85%
97%
31
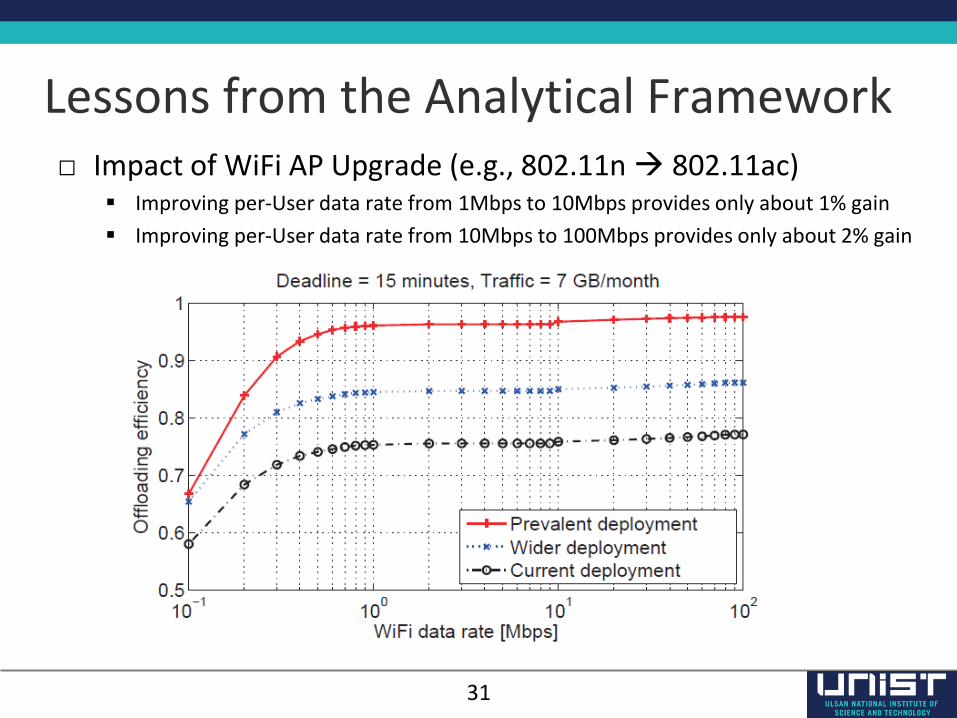
Lessons from the Analytical Framework□ Impact of WiFi AP Upgrade (e.g., 802.11n 802.11ac)
Improving per-User data rate from 1Mbps to 10Mbps provides only about 1% gain
Improving per-User data rate from 10Mbps to 100Mbps provides only about 2% gain
32
Incentive Mechanism
[Ha et al. 2012] Sangtae Ha, Soumya Sen, Carlee Joe-Wong, Youngbin Im, and Mung Chiang, “TUBE: Time Dependent Pricing for Mobile Data,” ACM SIGCOMM 2012
33
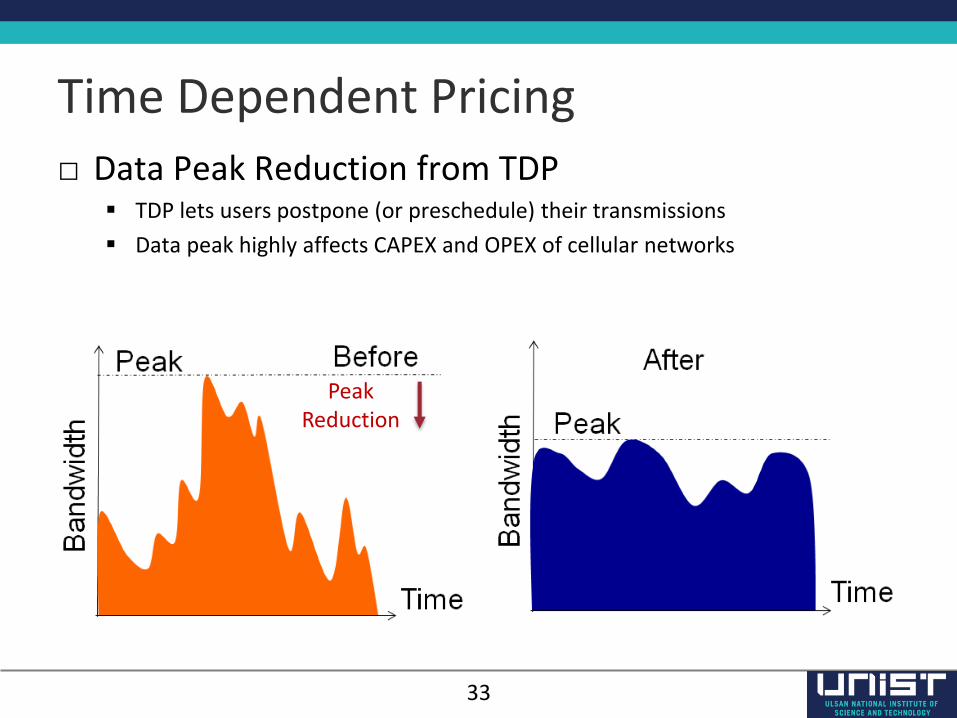
Time Dependent Pricing
□ Data Peak Reduction from TDP TDP lets users postpone (or preschedule) their transmissions
Data peak highly affects CAPEX and OPEX of cellular networks
PeakReduction
34
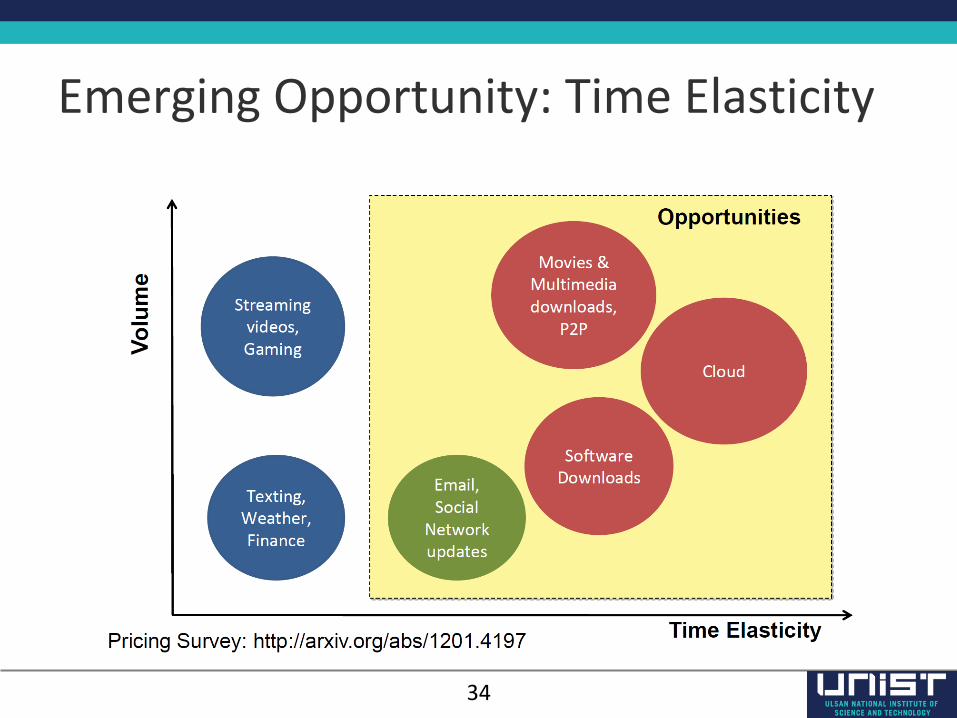
Emerging Opportunity: Time Elasticity
35
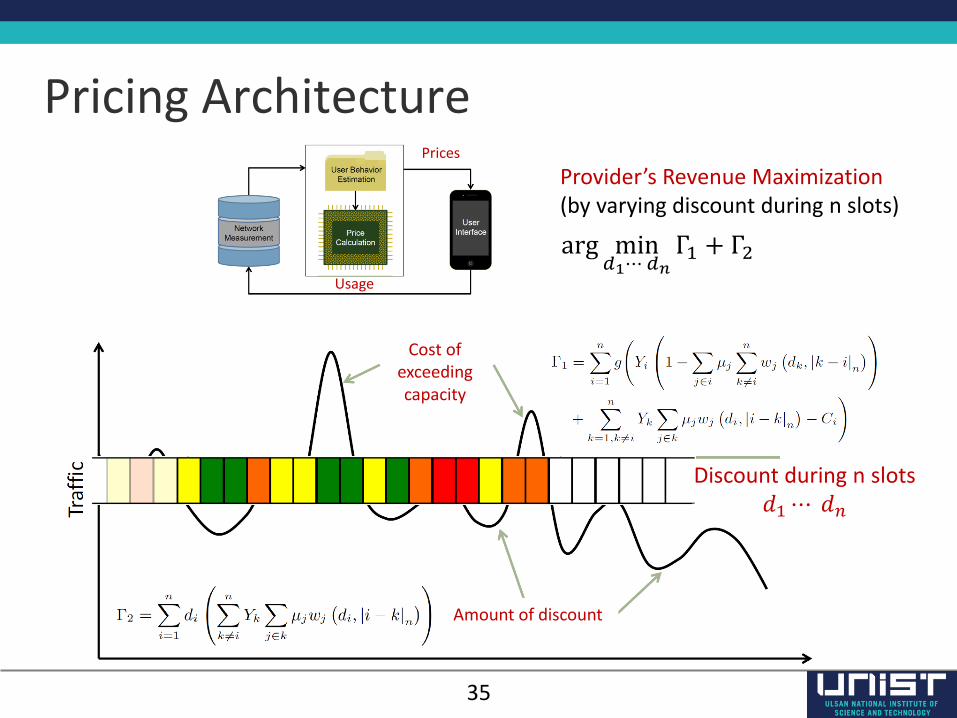
Pricing ArchitecturePrices
Usage
Cost of exceedingcapacity
Amount of discount
arg min𝑑1⋯𝑑𝑛
Γ1 + Γ2
Provider’s Revenue Maximization(by varying discount during n slots)
Discount during n slots𝑑1⋯ 𝑑𝑛
36
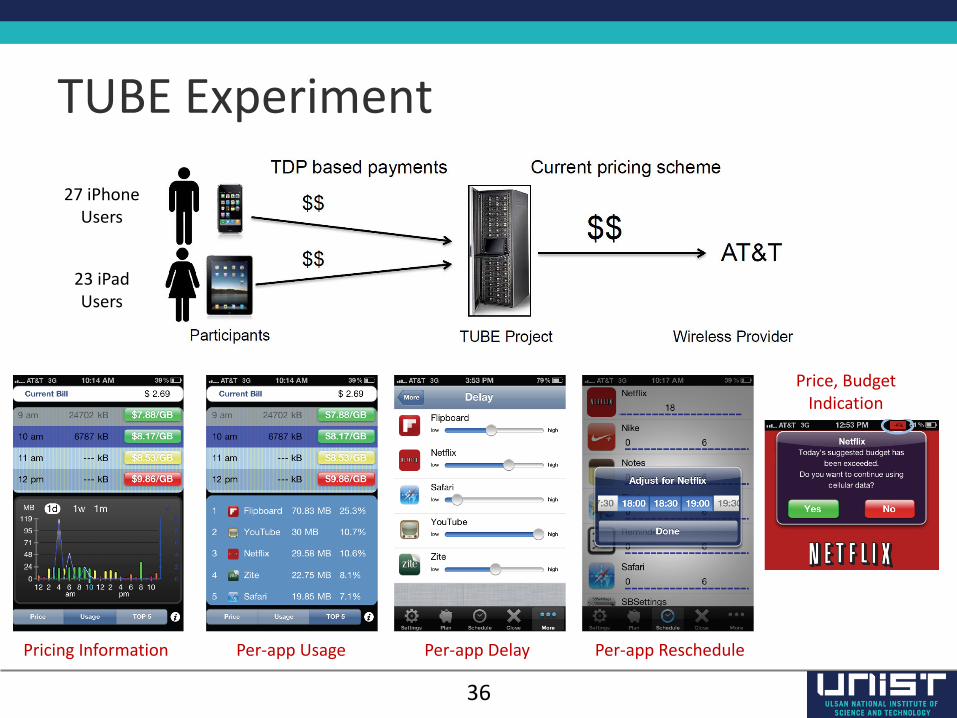
TUBE Experiment
Pricing Information Per-app Usage Per-app Delay Per-app Reschedule
Price, Budget Indication
27 iPhoneUsers
23 iPadUsers
37
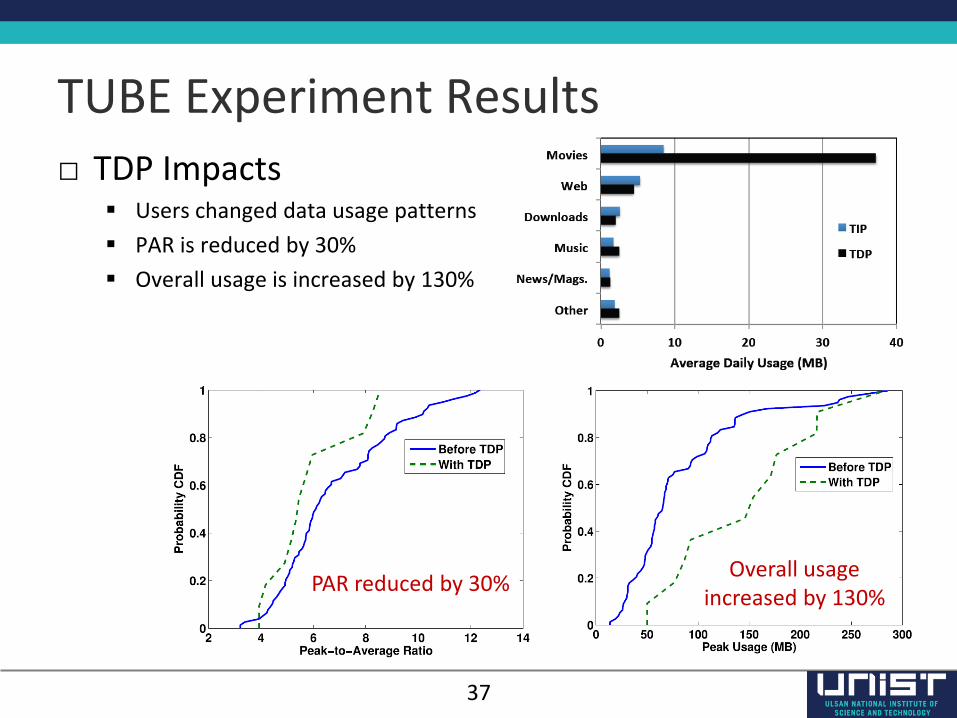
TUBE Experiment Results
□ TDP Impacts Users changed data usage patterns
PAR is reduced by 30%
Overall usage is increased by 130%
Overall usageincreased by 130%
PAR reduced by 30%
38
□ WiFi offloading is a promising technique for relieving cellular data deluge (hence reducing provider’s cost) as well as for improving battery life of mobile devices
□ For more efficient (delayed) WiFi offloading, scattering WiFiAPs for more prevalent availability (even with short connection time) can be preferred over upgrading the data rate of each AP
□ Time dependent pricing actually affects user behavior of data usage hence giving high chance of revenue increase of cellular providers
Concluding Remarks