Embed Size (px)
Citation preview
Barriers to Accelerating Wind Energy in India Chetan Mehra Managing Director, Wiezmann Limited Jami Hossain Chief Mentor, Windforce Mangement Services Private Limited
Part I: Status
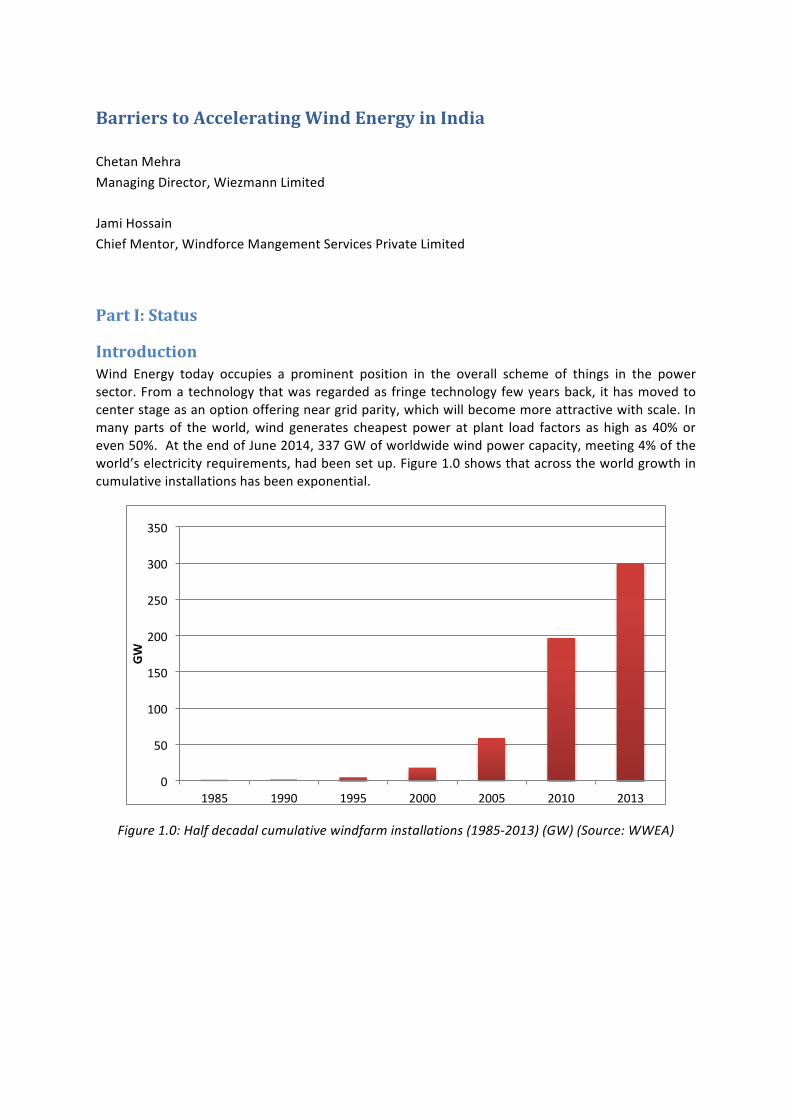
Introduction Wind Energy today occupies a prominent position in the overall scheme of things in the power sector. From a technology that was regarded as fringe technology few years back, it has moved to center stage as an option offering near grid parity, which will become more attractive with scale. In many parts of the world, wind generates cheapest power at plant load factors as high as 40% or even 50%. At the end of June 2014, 337 GW of worldwide wind power capacity, meeting 4% of the world’s electricity requirements, had been set up. Figure 1.0 shows that across the world growth in cumulative installations has been exponential.
Figure 1.0: Half decadal cumulative windfarm installations (1985-‐2013) (GW) (Source: WWEA)
0
50
100
150
200
250
300
350
1985 1990 1995 2000 2005 2010 2013
GW
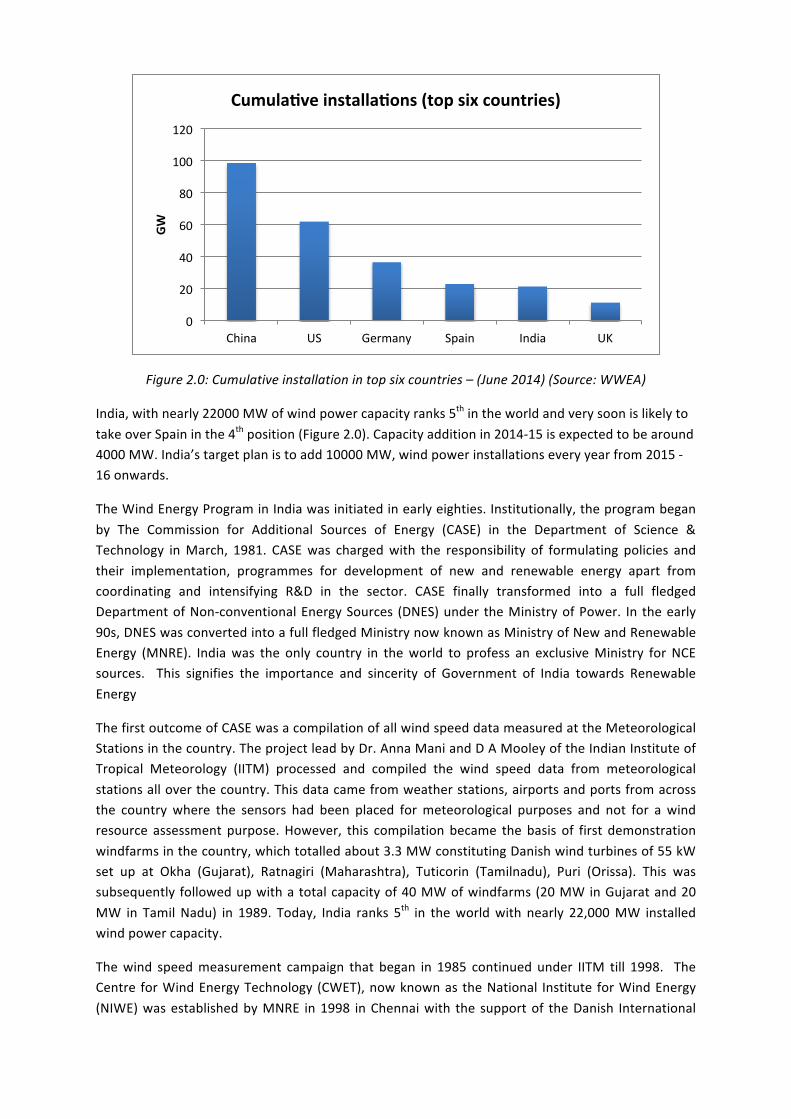
Figure 2.0: Cumulative installation in top six countries – (June 2014) (Source: WWEA)
India, with nearly 22000 MW of wind power capacity ranks 5th in the world and very soon is likely to take over Spain in the 4th position (Figure 2.0). Capacity addition in 2014-‐15 is expected to be around 4000 MW. India’s target plan is to add 10000 MW, wind power installations every year from 2015 -‐16 onwards.
The Wind Energy Program in India was initiated in early eighties. Institutionally, the program began by The Commission for Additional Sources of Energy (CASE) in the Department of Science & Technology in March, 1981. CASE was charged with the responsibility of formulating policies and their implementation, programmes for development of new and renewable energy apart from coordinating and intensifying R&D in the sector. CASE finally transformed into a full fledged Department of Non-‐conventional Energy Sources (DNES) under the Ministry of Power. In the early 90s, DNES was converted into a full fledged Ministry now known as Ministry of New and Renewable Energy (MNRE). India was the only country in the world to profess an exclusive Ministry for NCE sources. This signifies the importance and sincerity of Government of India towards Renewable Energy
The first outcome of CASE was a compilation of all wind speed data measured at the Meteorological Stations in the country. The project lead by Dr. Anna Mani and D A Mooley of the Indian Institute of Tropical Meteorology (IITM) processed and compiled the wind speed data from meteorological stations all over the country. This data came from weather stations, airports and ports from across the country where the sensors had been placed for meteorological purposes and not for a wind resource assessment purpose. However, this compilation became the basis of first demonstration windfarms in the country, which totalled about 3.3 MW constituting Danish wind turbines of 55 kW set up at Okha (Gujarat), Ratnagiri (Maharashtra), Tuticorin (Tamilnadu), Puri (Orissa). This was subsequently followed up with a total capacity of 40 MW of windfarms (20 MW in Gujarat and 20 MW in Tamil Nadu) in 1989. Today, India ranks 5th in the world with nearly 22,000 MW installed wind power capacity.
The wind speed measurement campaign that began in 1985 continued under IITM till 1998. The Centre for Wind Energy Technology (CWET), now known as the National Institute for Wind Energy (NIWE) was established by MNRE in 1998 in Chennai with the support of the Danish International
0
20
40
60
80
100
120
China US Germany Spain India UK
GW
Cumula)ve installa)ons (top six countries)
Development Agency (DANIDA) and Risø National Energy Laboratory of Denmark. The wind measurement program was transferred to NIWE and still continues today with 793 wind monitoring stations set up across the country (NIWE, 2014). However, the main objective of NIWE was to serve as a wind turbine test station and standards & certification centre, though now it undertakes management of R&D projects on behalf of the government.
Today, there are 20 wind turbine manufacturers in India with about 52 turbine models certified by NIWE for grid connection. The total manufacturing capacity established in the country is about 10,000 MW annually. Major wind turbine manufacturers are present in the country such as Vestas, GE, Gamesa, etc. having set up manufacturing plants in different parts of the country. The Indian market is dominated by the Indian Original Equipment Manufacturer (OEM), Suzlon which was the world’s 5th largest turbine manufacturer by the end of 2013. Suzlon acquired complete ownership of the German wind turbine manufacturer REpower in 2012 (renamed in 2012 as Senvion), becoming a major player in offshore wind power with turbines in the 5 MW+ series as well.
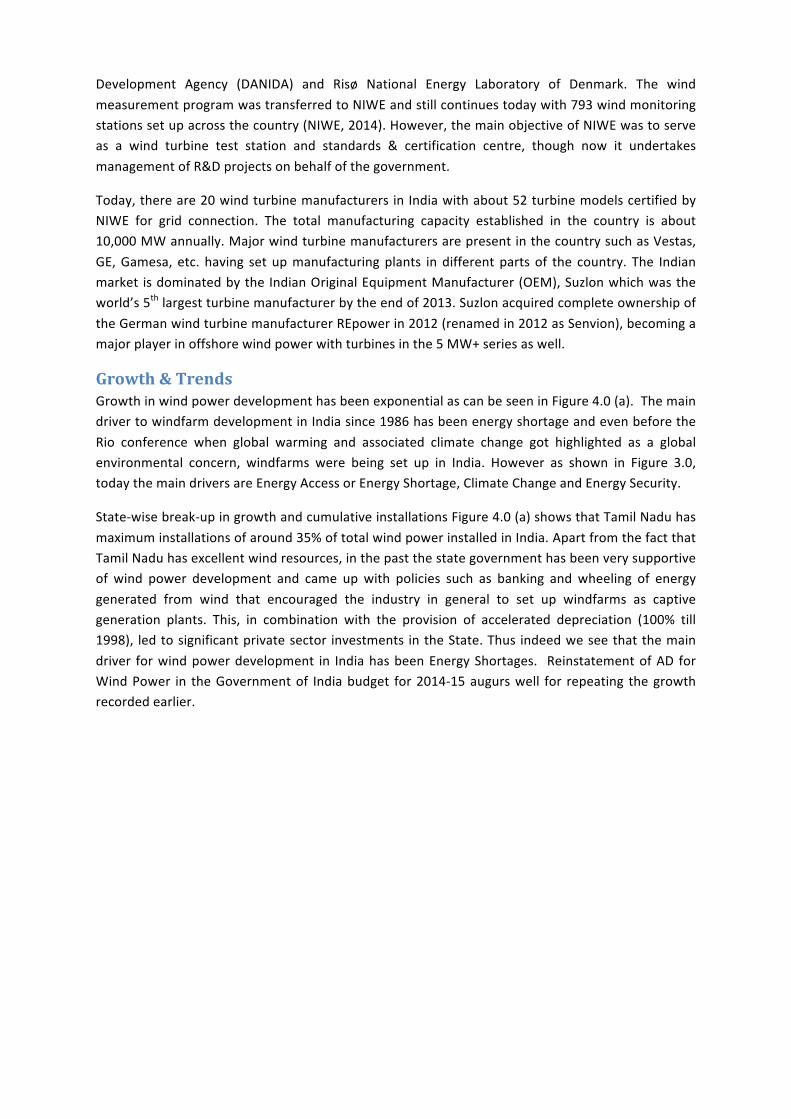
Growth & Trends Growth in wind power development has been exponential as can be seen in Figure 4.0 (a). The main driver to windfarm development in India since 1986 has been energy shortage and even before the Rio conference when global warming and associated climate change got highlighted as a global environmental concern, windfarms were being set up in India. However as shown in Figure 3.0, today the main drivers are Energy Access or Energy Shortage, Climate Change and Energy Security.
State-‐wise break-‐up in growth and cumulative installations Figure 4.0 (a) shows that Tamil Nadu has maximum installations of around 35% of total wind power installed in India. Apart from the fact that Tamil Nadu has excellent wind resources, in the past the state government has been very supportive of wind power development and came up with policies such as banking and wheeling of energy generated from wind that encouraged the industry in general to set up windfarms as captive generation plants. This, in combination with the provision of accelerated depreciation (100% till 1998), led to significant private sector investments in the State. Thus indeed we see that the main driver for wind power development in India has been Energy Shortages. Reinstatement of AD for Wind Power in the Government of India budget for 2014-‐15 augurs well for repeating the growth recorded earlier.
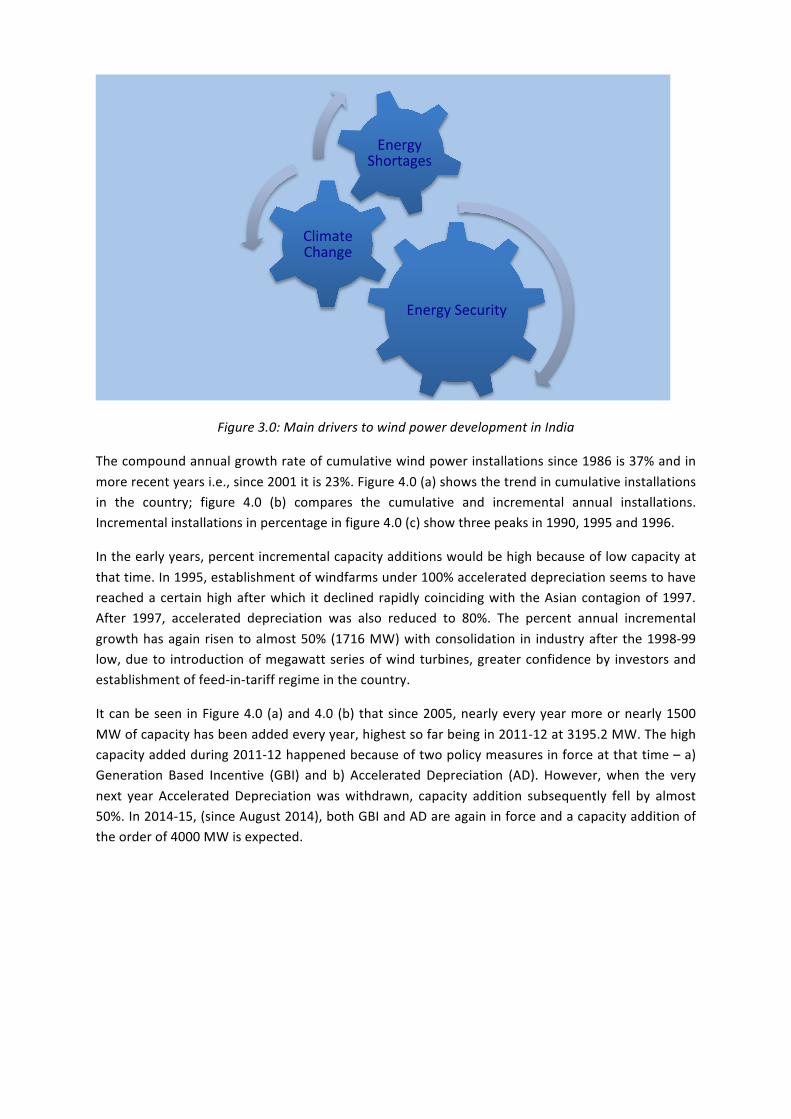
Figure 3.0: Main drivers to wind power development in India
The compound annual growth rate of cumulative wind power installations since 1986 is 37% and in more recent years i.e., since 2001 it is 23%. Figure 4.0 (a) shows the trend in cumulative installations in the country; figure 4.0 (b) compares the cumulative and incremental annual installations. Incremental installations in percentage in figure 4.0 (c) show three peaks in 1990, 1995 and 1996.
In the early years, percent incremental capacity additions would be high because of low capacity at that time. In 1995, establishment of windfarms under 100% accelerated depreciation seems to have reached a certain high after which it declined rapidly coinciding with the Asian contagion of 1997. After 1997, accelerated depreciation was also reduced to 80%. The percent annual incremental growth has again risen to almost 50% (1716 MW) with consolidation in industry after the 1998-‐99 low, due to introduction of megawatt series of wind turbines, greater confidence by investors and establishment of feed-‐in-‐tariff regime in the country.
It can be seen in Figure 4.0 (a) and 4.0 (b) that since 2005, nearly every year more or nearly 1500 MW of capacity has been added every year, highest so far being in 2011-‐12 at 3195.2 MW. The high capacity added during 2011-‐12 happened because of two policy measures in force at that time – a) Generation Based Incentive (GBI) and b) Accelerated Depreciation (AD). However, when the very next year Accelerated Depreciation was withdrawn, capacity addition subsequently fell by almost 50%. In 2014-‐15, (since August 2014), both GBI and AD are again in force and a capacity addition of the order of 4000 MW is expected.
Energy Security
Climate Change
Energy Shortages
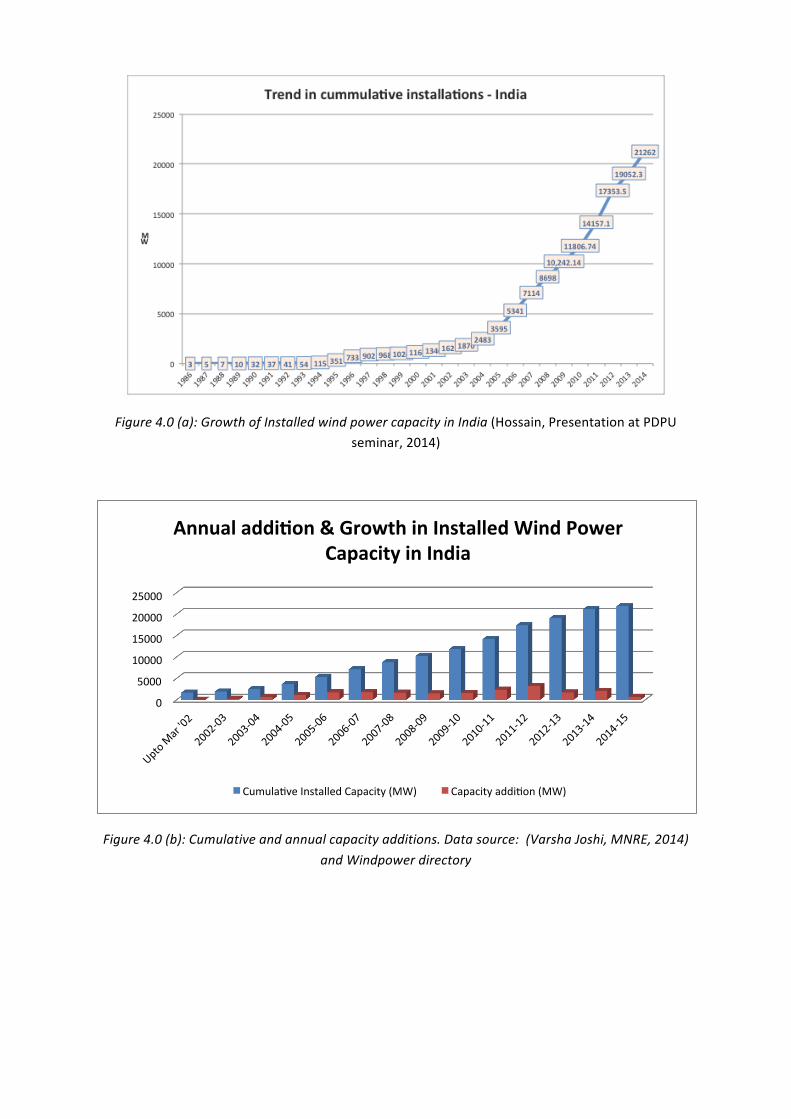
Figure 4.0 (a): Growth of Installed wind power capacity in India (Hossain, Presentation at PDPU seminar, 2014)
Figure 4.0 (b): Cumulative and annual capacity additions. Data source: (Varsha Joshi, MNRE, 2014) and Windpower directory
0
5000
10000
15000
20000
25000
Annual addi)on & Growth in Installed Wind Power Capacity in India
Cumulahve Installed Capacity (MW) Capacity addihon (MW)
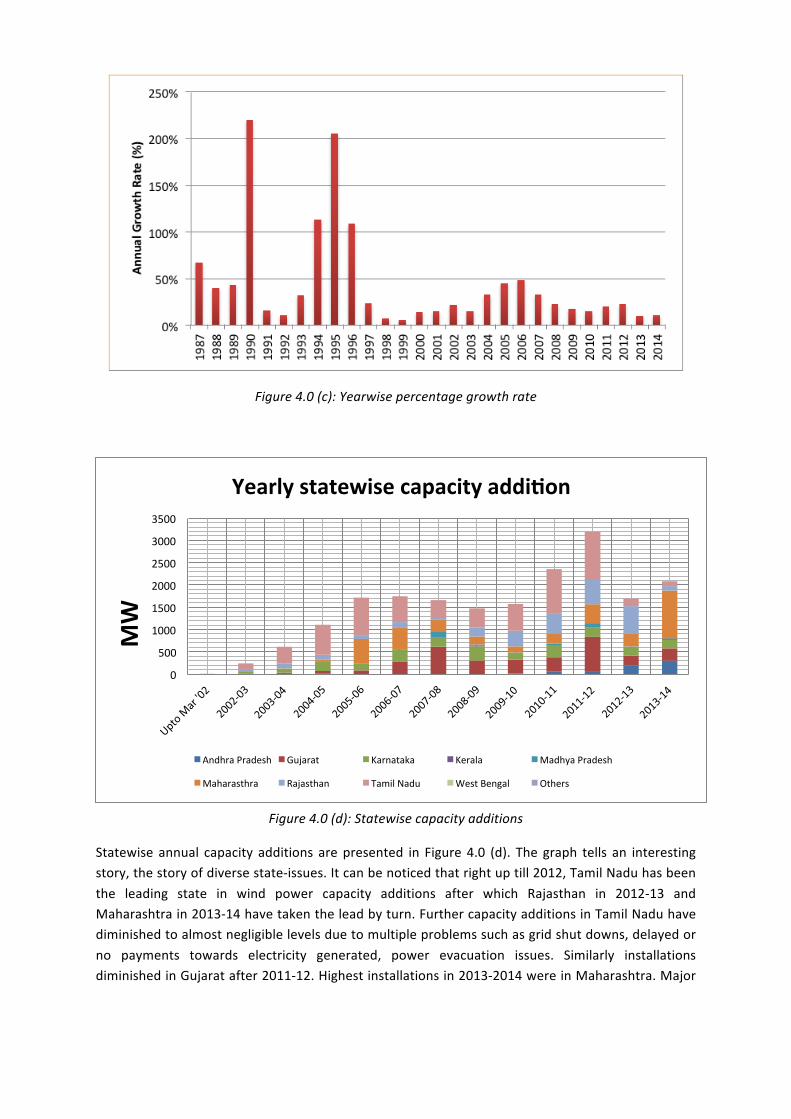
Figure 4.0 (c): Yearwise percentage growth rate
Figure 4.0 (d): Statewise capacity additions
Statewise annual capacity additions are presented in Figure 4.0 (d). The graph tells an interesting story, the story of diverse state-‐issues. It can be noticed that right up till 2012, Tamil Nadu has been the leading state in wind power capacity additions after which Rajasthan in 2012-‐13 and Maharashtra in 2013-‐14 have taken the lead by turn. Further capacity additions in Tamil Nadu have diminished to almost negligible levels due to multiple problems such as grid shut downs, delayed or no payments towards electricity generated, power evacuation issues. Similarly installations diminished in Gujarat after 2011-‐12. Highest installations in 2013-‐2014 were in Maharashtra. Major
0
500
1000
1500
2000
2500
3000
3500
MW
Yearly statewise capacity addi)on
Andhra Pradesh Gujarat Karnataka Kerala Madhya Pradesh
Maharasthra Rajasthan Tamil Nadu West Bengal Others
barriers have cropped up in every other state – every now and then, these state barriers are the main barriers for slow down in one state or the other.
However, on the other hand, it is very interesting to also note that wind power installations have often exceeded the plan targets. 1.5 GW of wind power capacity addition was targeted in the 10th five year plan but 5.427 GW of capacity addition was achieved. The target of 9 GW during the 11th five year plan (2007-‐2012) was also surpassed with 10.26 GW of capacity addition. Currently, India is in its 12th five year plan (2012-‐17) and a wind power capacity addition of 15 GW was initially set and already this figure has undergone many revisions. It is only in the current five year plan that a number of issues from policy uncertainty to state related barriers have slowed down wind power development (Table 1.0). As of mid 2014, only 30.473% (3782 MW) of this target has been achieved.
Table 1.0 – Yearwise wind power targets and achievement (Urvish Dave, 2014)
2010-‐11 2011-‐12 2012-‐13 2013-‐14 2014-‐15
Target Achieved Target Achieved Target Achieved Target Achieved Target Achieved
2000 MW
2350 MW
2400 MW
3197 MW
2500 MW
1699 MW
2500 MW
2084 MW
2000 MW
864.95 MW*
*as of Sep 2014.
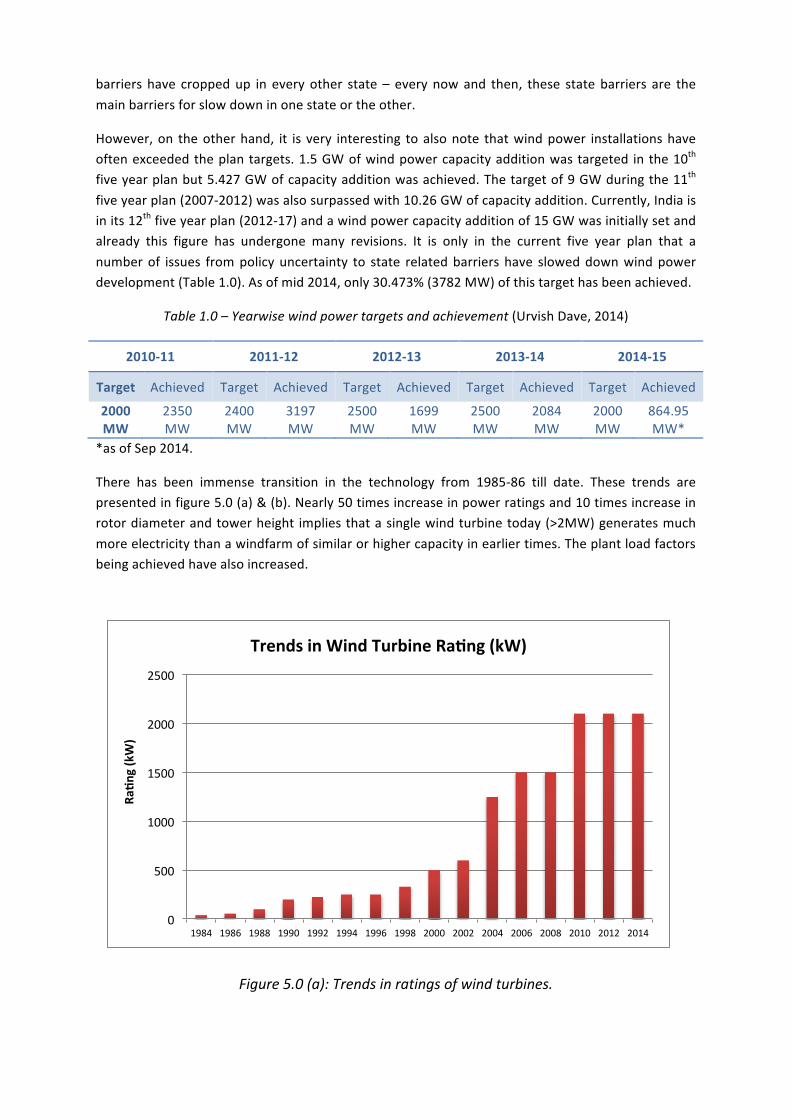
There has been immense transition in the technology from 1985-‐86 till date. These trends are presented in figure 5.0 (a) & (b). Nearly 50 times increase in power ratings and 10 times increase in rotor diameter and tower height implies that a single wind turbine today (>2MW) generates much more electricity than a windfarm of similar or higher capacity in earlier times. The plant load factors being achieved have also increased.
Figure 5.0 (a): Trends in ratings of wind turbines.
0
500
1000
1500
2000
2500
1984 1986 1988 1990 1992 1994 1996 1998 2000 2002 2004 2006 2008 2010 2012 2014
Ra)n
g (kW)
Trends in Wind Turbine Ra)ng (kW)
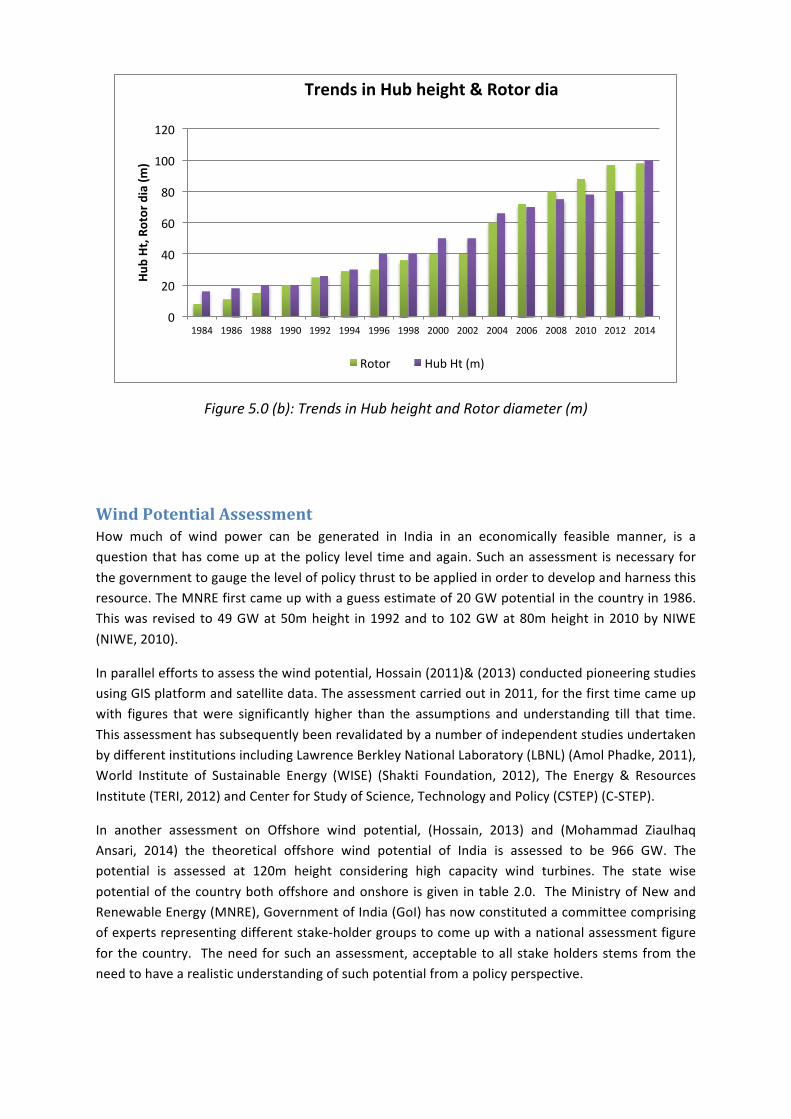
Figure 5.0 (b): Trends in Hub height and Rotor diameter (m)
Wind Potential Assessment How much of wind power can be generated in India in an economically feasible manner, is a question that has come up at the policy level time and again. Such an assessment is necessary for the government to gauge the level of policy thrust to be applied in order to develop and harness this resource. The MNRE first came up with a guess estimate of 20 GW potential in the country in 1986. This was revised to 49 GW at 50m height in 1992 and to 102 GW at 80m height in 2010 by NIWE (NIWE, 2010).
In parallel efforts to assess the wind potential, Hossain (2011)& (2013) conducted pioneering studies using GIS platform and satellite data. The assessment carried out in 2011, for the first time came up with figures that were significantly higher than the assumptions and understanding till that time. This assessment has subsequently been revalidated by a number of independent studies undertaken by different institutions including Lawrence Berkley National Laboratory (LBNL) (Amol Phadke, 2011), World Institute of Sustainable Energy (WISE) (Shakti Foundation, 2012), The Energy & Resources Institute (TERI, 2012) and Center for Study of Science, Technology and Policy (CSTEP) (C-‐STEP).
In another assessment on Offshore wind potential, (Hossain, 2013) and (Mohammad Ziaulhaq Ansari, 2014) the theoretical offshore wind potential of India is assessed to be 966 GW. The potential is assessed at 120m height considering high capacity wind turbines. The state wise potential of the country both offshore and onshore is given in table 2.0. The Ministry of New and Renewable Energy (MNRE), Government of India (GoI) has now constituted a committee comprising of experts representing different stake-‐holder groups to come up with a national assessment figure for the country. The need for such an assessment, acceptable to all stake holders stems from the need to have a realistic understanding of such potential from a policy perspective.
0
20
40
60
80
100
120
1984 1986 1988 1990 1992 1994 1996 1998 2000 2002 2004 2006 2008 2010 2012 2014
Hub Ht, R
otor dia (m
)
Trends in Hub height & Rotor dia
Rotor Hub Ht (m)
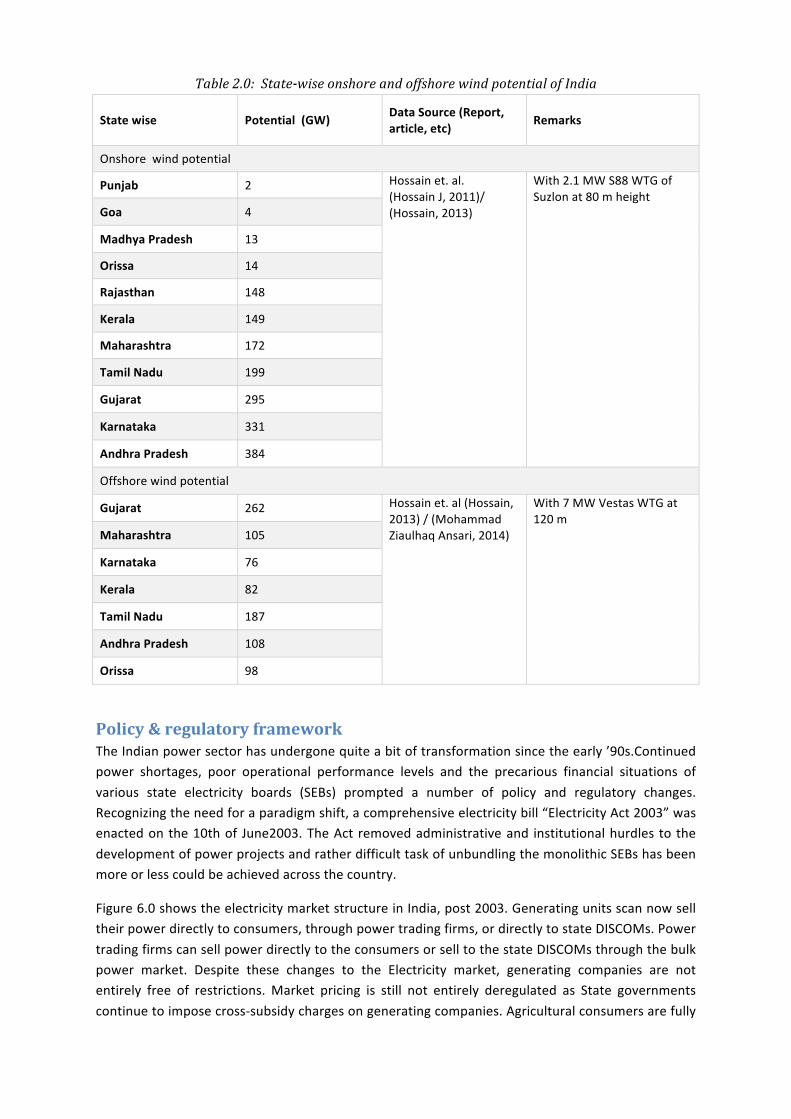
Table 2.0: State-‐wise onshore and offshore wind potential of India
State wise Potential (GW) Data Source (Report, article, etc)
Remarks
Onshore wind potential
Punjab 2 Hossain et. al. (Hossain J, 2011)/ (Hossain, 2013)
With 2.1 MW S88 WTG of Suzlon at 80 m height
Goa 4
Madhya Pradesh 13
Orissa 14
Rajasthan 148
Kerala 149
Maharashtra 172
Tamil Nadu 199
Gujarat 295
Karnataka 331
Andhra Pradesh 384
Offshore wind potential
Gujarat 262 Hossain et. al (Hossain, 2013) / (Mohammad Ziaulhaq Ansari, 2014)
With 7 MW Vestas WTG at 120 m
Maharashtra 105
Karnataka 76
Kerala 82
Tamil Nadu 187
Andhra Pradesh 108
Orissa 98
Policy & regulatory framework The Indian power sector has undergone quite a bit of transformation since the early ’90s.Continued power shortages, poor operational performance levels and the precarious financial situations of various state electricity boards (SEBs) prompted a number of policy and regulatory changes. Recognizing the need for a paradigm shift, a comprehensive electricity bill “Electricity Act 2003” was enacted on the 10th of June2003. The Act removed administrative and institutional hurdles to the development of power projects and rather difficult task of unbundling the monolithic SEBs has been more or less could be achieved across the country.
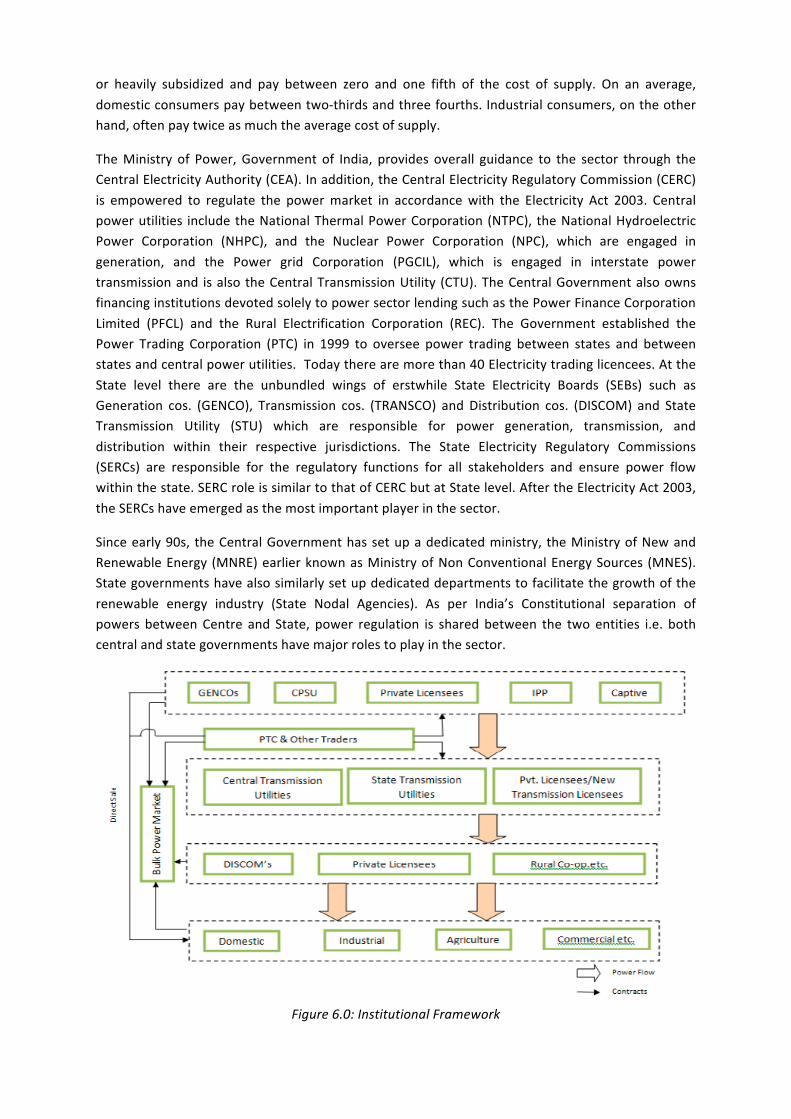
Figure 6.0 shows the electricity market structure in India, post 2003. Generating units scan now sell their power directly to consumers, through power trading firms, or directly to state DISCOMs. Power trading firms can sell power directly to the consumers or sell to the state DISCOMs through the bulk power market. Despite these changes to the Electricity market, generating companies are not entirely free of restrictions. Market pricing is still not entirely deregulated as State governments continue to impose cross-‐subsidy charges on generating companies. Agricultural consumers are fully
or heavily subsidized and pay between zero and one fifth of the cost of supply. On an average, domestic consumers pay between two-‐thirds and three fourths. Industrial consumers, on the other hand, often pay twice as much the average cost of supply.
The Ministry of Power, Government of India, provides overall guidance to the sector through the Central Electricity Authority (CEA). In addition, the Central Electricity Regulatory Commission (CERC) is empowered to regulate the power market in accordance with the Electricity Act 2003. Central power utilities include the National Thermal Power Corporation (NTPC), the National Hydroelectric Power Corporation (NHPC), and the Nuclear Power Corporation (NPC), which are engaged in generation, and the Power grid Corporation (PGCIL), which is engaged in interstate power transmission and is also the Central Transmission Utility (CTU). The Central Government also owns financing institutions devoted solely to power sector lending such as the Power Finance Corporation Limited (PFCL) and the Rural Electrification Corporation (REC). The Government established the Power Trading Corporation (PTC) in 1999 to oversee power trading between states and between states and central power utilities. Today there are more than 40 Electricity trading licencees. At the State level there are the unbundled wings of erstwhile State Electricity Boards (SEBs) such as Generation cos. (GENCO), Transmission cos. (TRANSCO) and Distribution cos. (DISCOM) and State Transmission Utility (STU) which are responsible for power generation, transmission, and distribution within their respective jurisdictions. The State Electricity Regulatory Commissions (SERCs) are responsible for the regulatory functions for all stakeholders and ensure power flow within the state. SERC role is similar to that of CERC but at State level. After the Electricity Act 2003, the SERCs have emerged as the most important player in the sector.
Since early 90s, the Central Government has set up a dedicated ministry, the Ministry of New and Renewable Energy (MNRE) earlier known as Ministry of Non Conventional Energy Sources (MNES). State governments have also similarly set up dedicated departments to facilitate the growth of the renewable energy industry (State Nodal Agencies). As per India’s Constitutional separation of powers between Centre and State, power regulation is shared between the two entities i.e. both central and state governments have major roles to play in the sector.
Figure 6.0: Institutional Framework
The Accelerated Depreciation (AD) scheme
Accelerated Depreciation (AD) has been a major fiscal incentive offered to the wind sector from 1992 to March 2012 and then August 2014 onwards, wherein the project owner can claim depreciation to the tune of 80% on the gross asset block as tax-‐deductible expenditure during the first year of operations of a project in case the project gets commissioned before 30thSeptember of the same financial year; the project owner can claim 40% in case the project gets commissioned before 31stMarch of the same financial year. Generally, a project under AD is financed on recourse basis or on the basis of balance sheet financing. AD benefit can substantially reduce the stated income of the investing company for income tax purposes during the first year, thereby deferring income tax payout applicable the project income. Also, losses in the books of a wind project could be offset by profits in other businesses of the entity, thereby leading to savings in income tax. AD is not a direct subsidy from the Government but deferment of probable revenues. It is a deft case of ploughing in profit generated from successful operations in investment of energy security.
Many experts in financial sector have opined that AD as an instrument to attract investments in wind sector is much superior and powerful than other measures such as GBI. Most importantly, AD targets a different class of investors of Small & Medium Scale enterprises to Large corporates and even PSUs. This investor class is different from that of IPPs who attract investments from Funds, Equities and Investors in new companies to be set up as Wind IPPs.
This tax shelter had been one of the major factors responsible for improving the attractiveness of the wind energy sector. This is apparent from the fact that AD had resulted in attracting sizeable private investment in the wind sector. As per figures put out by MNRE, around 2,000 MW of the 3,100 MW wind capacity during FY 11-‐12 came up via the AD route. It is also to be noted that more than about 70% of the total investment under AD has been contributed by small-‐scale and captive investors. AD helps small-‐scale industries, SMEs and the manufacturing sector by creating assets and increasing their net worth with minimum level of investment thereby helping them to potentially raise higher levels of working capital for the business. AD has also promoted captive power production with more than 90% of installations in Tamil Nadu being used for captive consumption by textile, cement and allied industries having an average capacity of 1.25 MW with more than 160 firms. The AD scheme resulted in aggressive capacity addition (more than 70% of total capacity addition) in the form of a large number of small capacities averaging around 2.5 MW.
The AD scheme was withdrawn on 1st April 2012, a move which led to lower capacity addition during 2012-‐13. With just 35% Depreciation allowed in the 1st year of a wind power project (15% normal under Income Tax Act of 1961 + 20% additional depreciation for infrastructure projects introduced in April 2012), 2012-‐13 was one of the challenging years for the Indian wind power industry. Following the reintroduction of the original AD benefit in September 2014, there is optimism that capacity additions during 2014-‐15 are likely to cross 2,500 MW, according to the Global Wind Energy Council (GWEC, 2014).
The Generation Based Incentive (GBI) scheme
The GBI scheme was conceptualized and introduced by MNRE for grid interactive wind power projects to primarily provide equal opportunities to IPPs and other investors who are not able to avail of AD benefits as they usually invest in wind projects through Special Purpose Vehicles (SPV), new companies, Funds and project finance route. The scheme was initially introduced in June 2008
on a pilot basis. In view of the reasonably good response GBI elicited, with over 300 MW of projects applying for the 49 MW pilot project, the scheme was launched in all earnestness in December 2009, enlarging the size for 4,000 MW projects to be commissioned till the end of 11thFive-‐Year Plan (2011-‐12). An incentive of INR 0.50 per unit of electricity generation was provided to the generator through the nodal agency of the scheme – Indian Renewable Energy Development Authority (IREDA). The projects availing of AD benefits were not eligible under the GBI scheme, much in accordance with the spirit of GBI. The GBI scheme also promoted investments in large-‐sized windfarms. GBI aimed to shift the yardstick of incentives from tax-‐induced capital investment to productivity-‐linked revenue. With GBI, achieving minimum Project Cost/MW and generating maximum Annual Energy Production (AEP) is the goal.
The discontinuation of both the AD and GBI scheme in 2012 led to a policy shock and drop in capacity addition from 3 GW in 2011-‐12 to 1.7 GW in 2012-‐2013 as investors displayed a ‘wait & watch’ attitude until policy uncertainty cleared up. The reintroduction of GBI in 2013 helped to slowly revive the market. Capacity additions in 2013-‐14 were to the tune of over 2 GW. Higher installation numbers of over 2.5 GW are expected in 2014-‐15. (GWEC, 2014)
Foreign Direct Investment (FDI) in wind
100% FDI is allowed in the Indian wind power sector and has helped greatly in bringing investment. Post the introduction of GBI, FDI has increased in the wind sector.
Renewable Purchase Obligations (RPO) and Renewable Energy Certificates (REC)
In order to gradually increase the penetration of renewable energy in the Electricity supply systems, CERC came up with the provision for designated entities such as Generators and Discoms to source a certain percentage of their electricity from renewable energy sources. The extent to which energy could be sourced from different renewable energy sources depended on the extent of potential for renewable energy in each state. Some have more potential for renewable energy and some have less. The Renewable Purchase Obligation (RPO) varies from state to state and is generally in the range 5-‐10% and can go higher depending on orders of SERCs. However, there are some states that are not able to even achieve RPO levels required by the SERCs (Greenpeace, 2013). In order that all the states may benefit from renewable energy sources of the country, CERC also came up with Renewable Energy Certificate (REC) provisions where in a Discom in a state can either procure renewable energy or procure from wind power projects in different states. These RECs are to be procured from a centralised REC exchange. One REC certificate is equal to 1 MWh of wind energy (renewable energy) generated. The floor price for trading of REC is set up by CERC and currently it is Rs. 1.5/kWh and the max allowable trading price is Rs. 3.30/kWh. This obviously adds to the revenue stream of wind power projects.
A major problem in RPO and REC provisions has been the inability of the regulators to enforce these provisions or to make them legally binding. The designated entities appear to be not in any hurry to fulfill their obligation, as a result, the REC market has not taken off, though institutionally it is established.
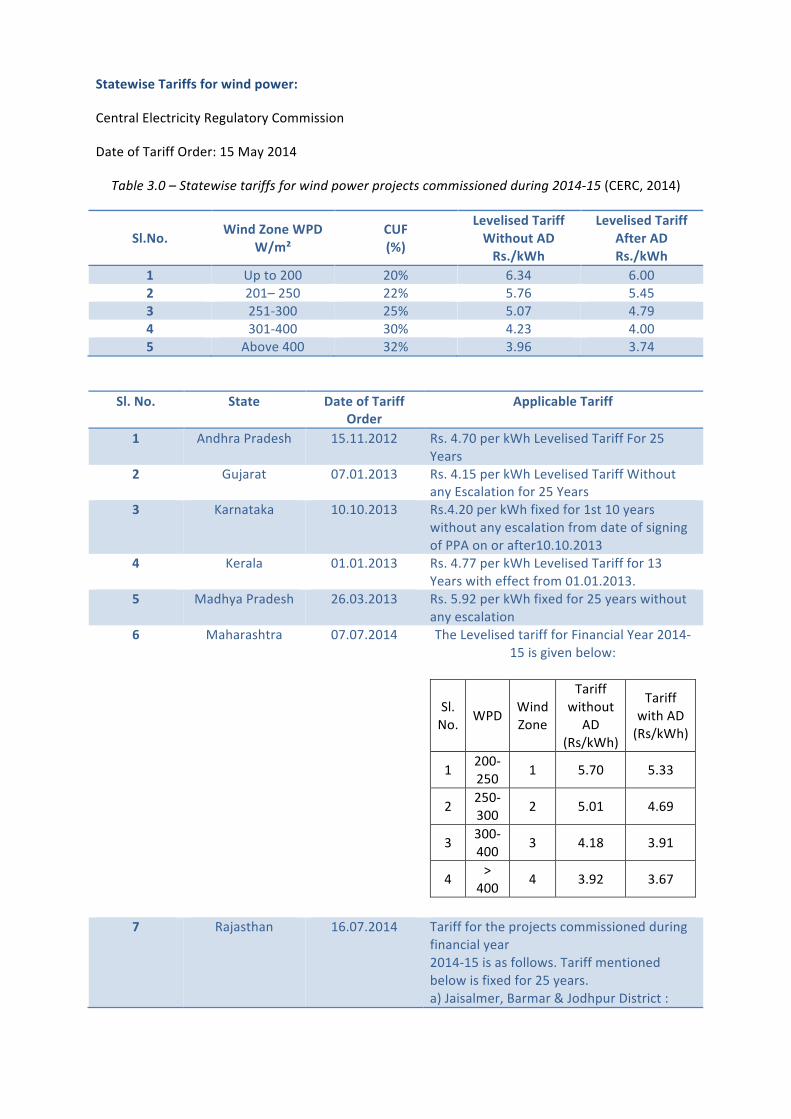
Statewise Tariffs for wind power:
Central Electricity Regulatory Commission
Date of Tariff Order: 15 May 2014
Table 3.0 – Statewise tariffs for wind power projects commissioned during 2014-‐15 (CERC, 2014)
Sl.No. Wind Zone WPD W/m²
CUF (%)
Levelised Tariff Without AD Rs./kWh
Levelised Tariff After AD Rs./kWh
1 Up to 200 20% 6.34 6.00 2 201– 250 22% 5.76 5.45 3 251-‐300 25% 5.07 4.79 4 301-‐400 30% 4.23 4.00 5 Above 400 32% 3.96 3.74
Sl. No. State Date of Tariff Order
Applicable Tariff
1 Andhra Pradesh 15.11.2012 Rs. 4.70 per kWh Levelised Tariff For 25 Years
2 Gujarat 07.01.2013 Rs. 4.15 per kWh Levelised Tariff Without any Escalation for 25 Years
3 Karnataka 10.10.2013 Rs.4.20 per kWh fixed for 1st 10 years without any escalation from date of signing of PPA on or after10.10.2013
4 Kerala 01.01.2013 Rs. 4.77 per kWh Levelised Tariff for 13 Years with effect from 01.01.2013.
5 Madhya Pradesh 26.03.2013 Rs. 5.92 per kWh fixed for 25 years without any escalation
6 Maharashtra 07.07.2014 The Levelised tariff for Financial Year 2014-‐15 is given below:
Sl. No. WPD Wind
Zone
Tariff without
AD (Rs/kWh)
Tariff with AD (Rs/kWh)
1 200-‐250 1 5.70 5.33
2 250-‐300 2 5.01 4.69
3 300-‐400 3 4.18 3.91
4 > 400 4 3.92 3.67
7 Rajasthan 16.07.2014 Tariff for the projects commissioned during financial year 2014-‐15 is as follows. Tariff mentioned below is fixed for 25 years. a) Jaisalmer, Barmar & Jodhpur District :
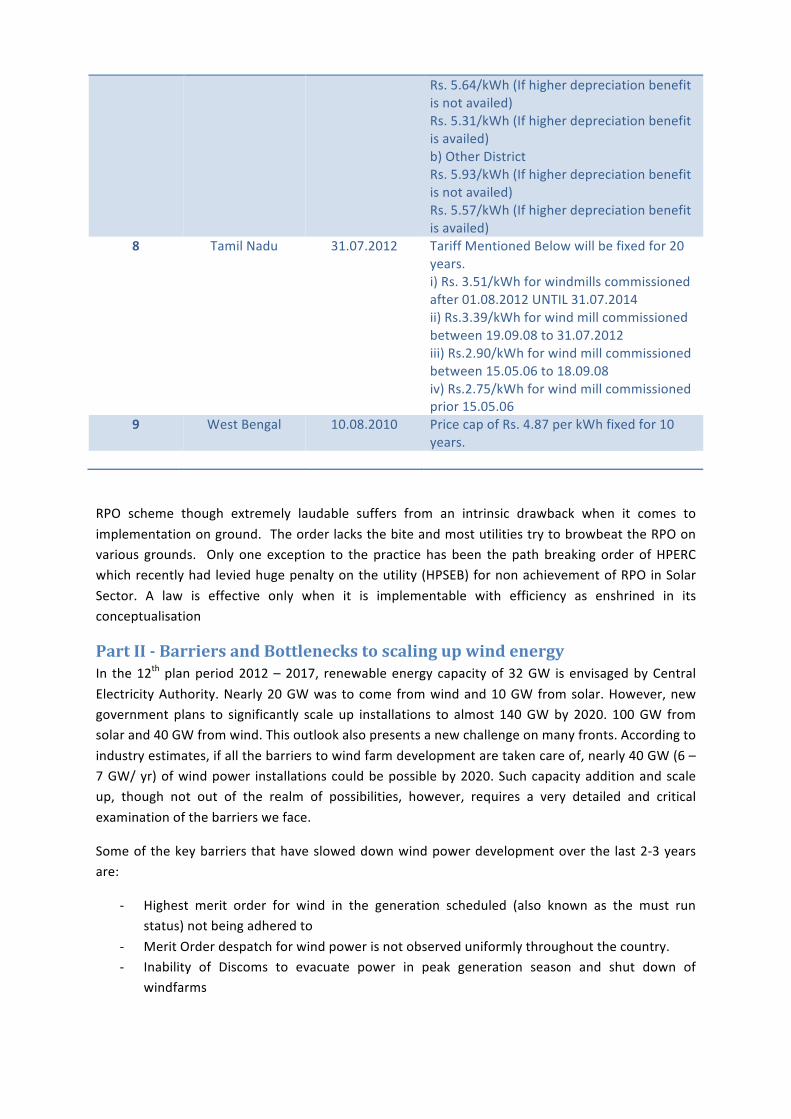
Rs. 5.64/kWh (If higher depreciation benefit is not availed) Rs. 5.31/kWh (If higher depreciation benefit is availed) b) Other District Rs. 5.93/kWh (If higher depreciation benefit is not availed) Rs. 5.57/kWh (If higher depreciation benefit is availed)
8 Tamil Nadu 31.07.2012 Tariff Mentioned Below will be fixed for 20 years. i) Rs. 3.51/kWh for windmills commissioned after 01.08.2012 UNTIL 31.07.2014 ii) Rs.3.39/kWh for wind mill commissioned between 19.09.08 to 31.07.2012 iii) Rs.2.90/kWh for wind mill commissioned between 15.05.06 to 18.09.08 iv) Rs.2.75/kWh for wind mill commissioned prior 15.05.06
9 West Bengal 10.08.2010 Price cap of Rs. 4.87 per kWh fixed for 10 years.
RPO scheme though extremely laudable suffers from an intrinsic drawback when it comes to implementation on ground. The order lacks the bite and most utilities try to browbeat the RPO on various grounds. Only one exception to the practice has been the path breaking order of HPERC which recently had levied huge penalty on the utility (HPSEB) for non achievement of RPO in Solar Sector. A law is effective only when it is implementable with efficiency as enshrined in its conceptualisation
Part II -‐ Barriers and Bottlenecks to scaling up wind energy In the 12th plan period 2012 – 2017, renewable energy capacity of 32 GW is envisaged by Central Electricity Authority. Nearly 20 GW was to come from wind and 10 GW from solar. However, new government plans to significantly scale up installations to almost 140 GW by 2020. 100 GW from solar and 40 GW from wind. This outlook also presents a new challenge on many fronts. According to industry estimates, if all the barriers to wind farm development are taken care of, nearly 40 GW (6 – 7 GW/ yr) of wind power installations could be possible by 2020. Such capacity addition and scale up, though not out of the realm of possibilities, however, requires a very detailed and critical examination of the barriers we face.
Some of the key barriers that have slowed down wind power development over the last 2-‐3 years are:
-‐ Highest merit order for wind in the generation scheduled (also known as the must run status) not being adhered to
-‐ Merit Order despatch for wind power is not observed uniformly throughout the country. -‐ Inability of Discoms to evacuate power in peak generation season and shut down of
windfarms
-‐ Fast tracking of Green Corridor implementation and strengthening of the transmission network not yet carried out.
-‐ Non availability of deemed generation benefits for grid loss. -‐ Absence of centralised renewable energy management centre for better grid management
and high RE infusion. -‐ Payment default by Discoms and inability to adhere to payment schedules for electricity
generated from windfarms and significantly delayed payments up to six months -‐ Refusal to sign PPAs in time and in some cases in flagrant violation of approved norms. -‐ Technical and administrative hindrances in allowing open access (encouraged in the
electricity Act but discouraged by State governments) -‐ Delays in project implementation due to Right of way and land issues -‐ TARDY clearance process for Forest land required for wind projects. -‐ Complex and varied land related legislations hindering conversion of forest land. -‐ Cross subsidy surcharge levels that have prevented sale to third party or even captive usage
of windfarms -‐ Frequent changes in policies, practices and provisions -‐ Failure in implementation of RPO/REC and Scheduling and Forecasting regulations -‐ Lack of a common Renewable Energy Act solely for renewable energy projects which can
exempt application of other laws of the land to wind power
These issues are discussed in detail in following broad areas.
Grid A major barrier to wind power installations is the limitation of the grid, its limited power evacuation capacity and seemingly its inability to absorb very high penetration levels of wind power. Shutting down of large windfarms is a common practice adopted by Tamil Nadu utilities in the peak season when load demand in the region of windfarms is less than wind generation. Power evacuation system, which includes, sub-‐stations, transformers and transmission links are not adequate to carry the power generated from high wind areas to load centres. According to an estimate of IWPA a generation of around 2.0 billion kWh was lost because Tamil Nadu resorted to shut-‐down of windfarms in peak generation period. This is part of the problem. The other part is that frequent fluctuation in wind generation leads to frequent unscheduled interchanges at the state level and from a grid discipline and grid security it becomes a major issue.
To achieve high penetrations of wind, one would not only need strengthening and expansion of grid but also operations and management would have to be completely revamped. Scheduling and forecasting of wind power generation from windfarms, a much debated topic, can resolve some of the problem but only to an extent. Additional storages (reservoirs and pumped hydro), Low Voltage Ride Through (LVRT) and High Voltage Ride Through (HVRT) capabilities, harmonic filters and the ability of the grid operator to adjust the generation from windfarms, keeping in view the grid conditions would also be required in order to address this problem in totality.
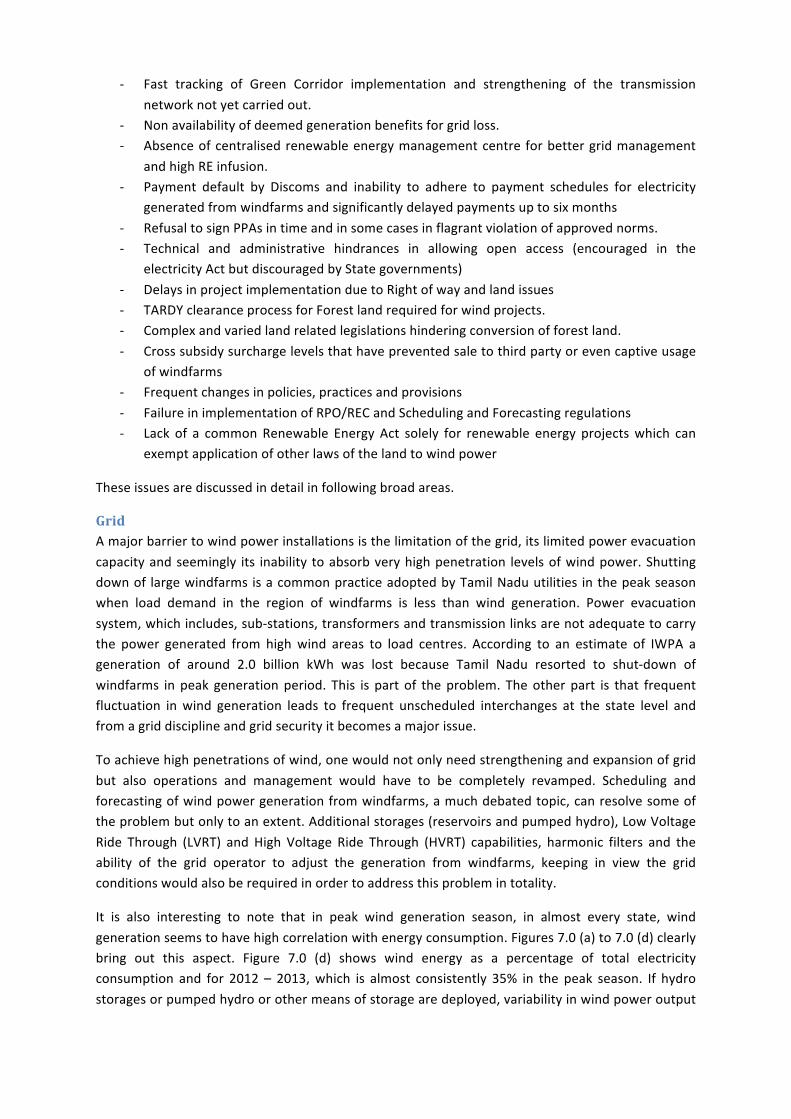
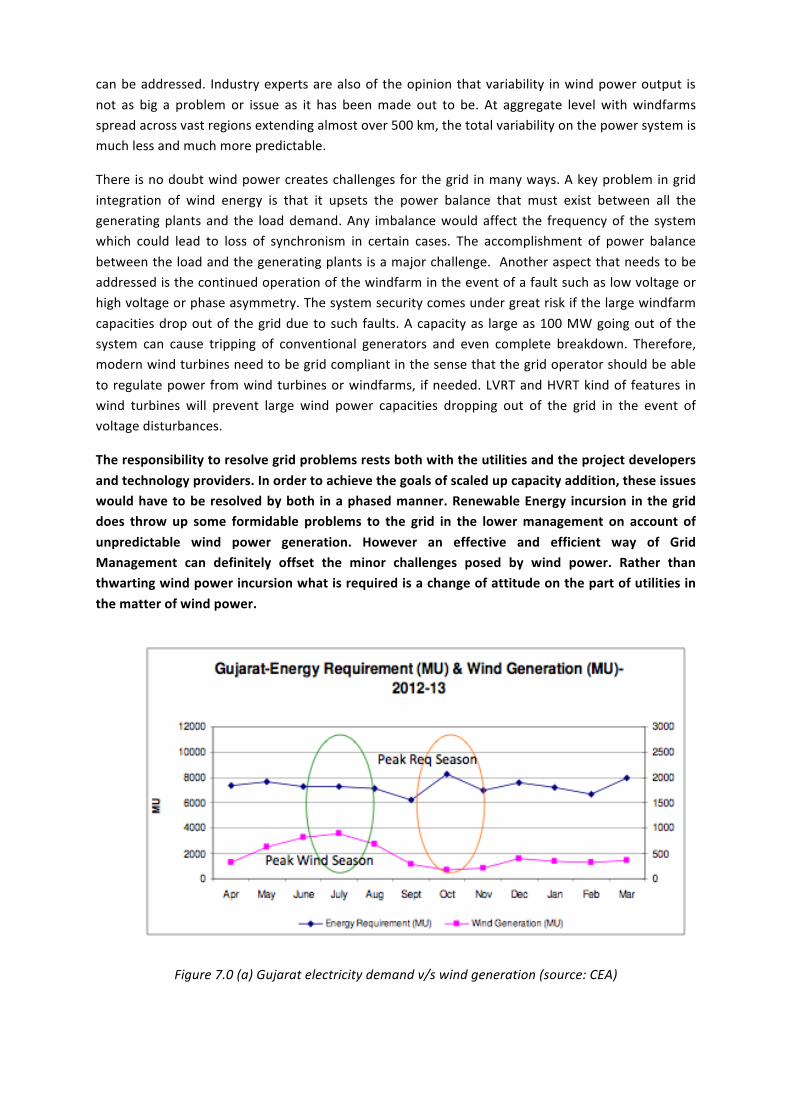
It is also interesting to note that in peak wind generation season, in almost every state, wind generation seems to have high correlation with energy consumption. Figures 7.0 (a) to 7.0 (d) clearly bring out this aspect. Figure 7.0 (d) shows wind energy as a percentage of total electricity consumption and for 2012 – 2013, which is almost consistently 35% in the peak season. If hydro storages or pumped hydro or other means of storage are deployed, variability in wind power output
can be addressed. Industry experts are also of the opinion that variability in wind power output is not as big a problem or issue as it has been made out to be. At aggregate level with windfarms spread across vast regions extending almost over 500 km, the total variability on the power system is much less and much more predictable.
There is no doubt wind power creates challenges for the grid in many ways. A key problem in grid integration of wind energy is that it upsets the power balance that must exist between all the generating plants and the load demand. Any imbalance would affect the frequency of the system which could lead to loss of synchronism in certain cases. The accomplishment of power balance between the load and the generating plants is a major challenge. Another aspect that needs to be addressed is the continued operation of the windfarm in the event of a fault such as low voltage or high voltage or phase asymmetry. The system security comes under great risk if the large windfarm capacities drop out of the grid due to such faults. A capacity as large as 100 MW going out of the system can cause tripping of conventional generators and even complete breakdown. Therefore, modern wind turbines need to be grid compliant in the sense that the grid operator should be able to regulate power from wind turbines or windfarms, if needed. LVRT and HVRT kind of features in wind turbines will prevent large wind power capacities dropping out of the grid in the event of voltage disturbances.
The responsibility to resolve grid problems rests both with the utilities and the project developers and technology providers. In order to achieve the goals of scaled up capacity addition, these issues would have to be resolved by both in a phased manner. Renewable Energy incursion in the grid does throw up some formidable problems to the grid in the lower management on account of unpredictable wind power generation. However an effective and efficient way of Grid Management can definitely offset the minor challenges posed by wind power. Rather than thwarting wind power incursion what is required is a change of attitude on the part of utilities in the matter of wind power.
Figure 7.0 (a) Gujarat electricity demand v/s wind generation (source: CEA)
Figure 7.0 (b) Tamil Nadu electricity demand v/s wind generation (source: CEA)
Figure 7.0 (c) Rajasthan electricity demand v/s wind generation (source: CEA)
Figure 7.0 (d) Tamil Nadu wind generation as a %age of consumption (source: CEA)
The Indian government recently announced plans for a ‘Green Energy Corridor’ project to address grid integration and transmission constraints impacting renewables based electricity generation. A comprehensive report has been prepared by Power Grid Corporation of India Limited (PGCIL). The government announced an initial allocation of INR 430 billion (i.e. INR 43,000 Crore). Germany has committed technical and financial assistance for the green energy corridor under the Indo-‐German bilateral development cooperation programme and will be investing almost EUR 1/USD 1.4 billion (The Hindu, 2014). In January 2014, KfW, the German Development Bank provided Tamil Nadu’s transmission utility TANTRANSCO with INR 15.9 billion (approximately EUR 18/USD 25 million) to strengthen the state’s transmission network. (GWEC, 2014)
Policy Uncertainty The industry is still recovering from the recent experience of withdrawal of both AD and GBI. At the state level also there have been frequent changes in policies on open access, cross subsidy surcharge, banking and wheeling, group captive etc. These changes are often made with utter disregard towards projects that have been built and invested in based on certain assumptions of policy. Such changes can make businesses completely unviable. These changes in policies also have a detrimental impact on investors who are sitting on the fence to assess the overall investment environment. Often even announcements such as those of competitive bidding by a state can have an impact on investments.
There are policies that are declared and announced by the State governments but there are also policies that are not announced but practiced in silence. Refusal to allow open access to generation projects within the state or a heavy cross subsidy burden on third-‐party sales are such state policies which are not publicised but are implemented. Such curbs have slowed down project development at state level significantly.
There is a need for uniform policies across the country as much as possible and these policies should be applicable over a reasonable period of time (5 years) to achieve fruitful results. Changes in tariffs and any other charges should be transparent and there should be a long-‐term visibility.
Wind projects should be considered as critical assets or as prohibited area to minimise thefts and related damage as the installations are located in inhospitable/sparsely populated far flung areas.
Wind power projects need to be exempted from obtaining “Consent to Establish” from individual departments as the allotments are made by the single window Nodal Agency of the states.
There is a specific need for separate legislative enactment in the form of Renewable Electricity Act to be in place in the quickest possible time.
RPO Compliance RPO compliance has not been strictly enforced or properly monitored, directly affecting the REC mechanism. Although many projects have been registered under the REC registry and an increasing no. of RECs has been issued, the prices have been low with a majority of RECs being sold at the floor price or not sold at all. About 10.12 million RECs had been issued by the REC Registry as of March 2014. This consisted of 9.9 million non-‐solar RECs. Wind power accounted for over 50% of the total accredited capacity of 4,548 MW under the REC Registry (REC Registry, 2014) (GWEC, 2014).RPO compliance made binding will immediately result in much relief to a large number of IPPs and will pave the way for more investments.
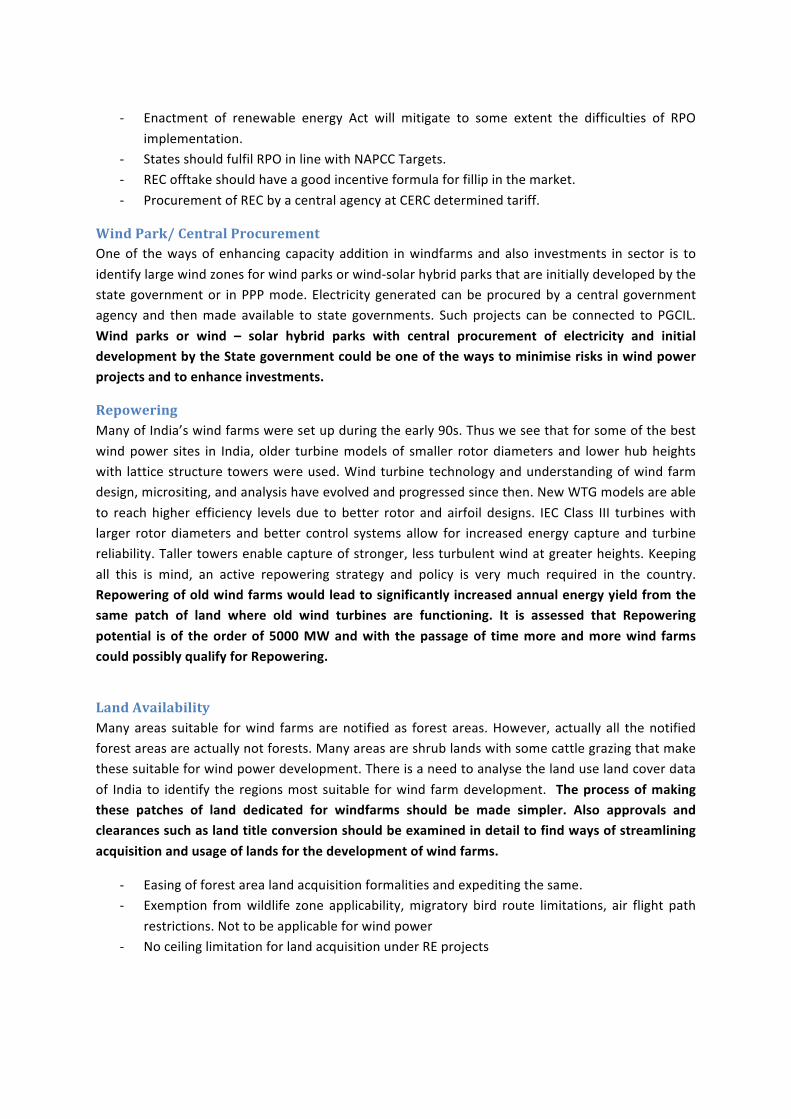
-‐ Enactment of renewable energy Act will mitigate to some extent the difficulties of RPO implementation.
-‐ States should fulfil RPO in line with NAPCC Targets. -‐ REC offtake should have a good incentive formula for fillip in the market. -‐ Procurement of REC by a central agency at CERC determined tariff.
Wind Park/ Central Procurement One of the ways of enhancing capacity addition in windfarms and also investments in sector is to identify large wind zones for wind parks or wind-‐solar hybrid parks that are initially developed by the state government or in PPP mode. Electricity generated can be procured by a central government agency and then made available to state governments. Such projects can be connected to PGCIL. Wind parks or wind – solar hybrid parks with central procurement of electricity and initial development by the State government could be one of the ways to minimise risks in wind power projects and to enhance investments.
Repowering Many of India’s wind farms were set up during the early 90s. Thus we see that for some of the best wind power sites in India, older turbine models of smaller rotor diameters and lower hub heights with lattice structure towers were used. Wind turbine technology and understanding of wind farm design, micrositing, and analysis have evolved and progressed since then. New WTG models are able to reach higher efficiency levels due to better rotor and airfoil designs. IEC Class III turbines with larger rotor diameters and better control systems allow for increased energy capture and turbine reliability. Taller towers enable capture of stronger, less turbulent wind at greater heights. Keeping all this is mind, an active repowering strategy and policy is very much required in the country. Repowering of old wind farms would lead to significantly increased annual energy yield from the same patch of land where old wind turbines are functioning. It is assessed that Repowering potential is of the order of 5000 MW and with the passage of time more and more wind farms could possibly qualify for Repowering.
Land Availability Many areas suitable for wind farms are notified as forest areas. However, actually all the notified forest areas are actually not forests. Many areas are shrub lands with some cattle grazing that make these suitable for wind power development. There is a need to analyse the land use land cover data of India to identify the regions most suitable for wind farm development. The process of making these patches of land dedicated for windfarms should be made simpler. Also approvals and clearances such as land title conversion should be examined in detail to find ways of streamlining acquisition and usage of lands for the development of wind farms.
-‐ Easing of forest area land acquisition formalities and expediting the same. -‐ Exemption from wildlife zone applicability, migratory bird route limitations, air flight path
restrictions. Not to be applicable for wind power -‐ No ceiling limitation for land acquisition under RE projects
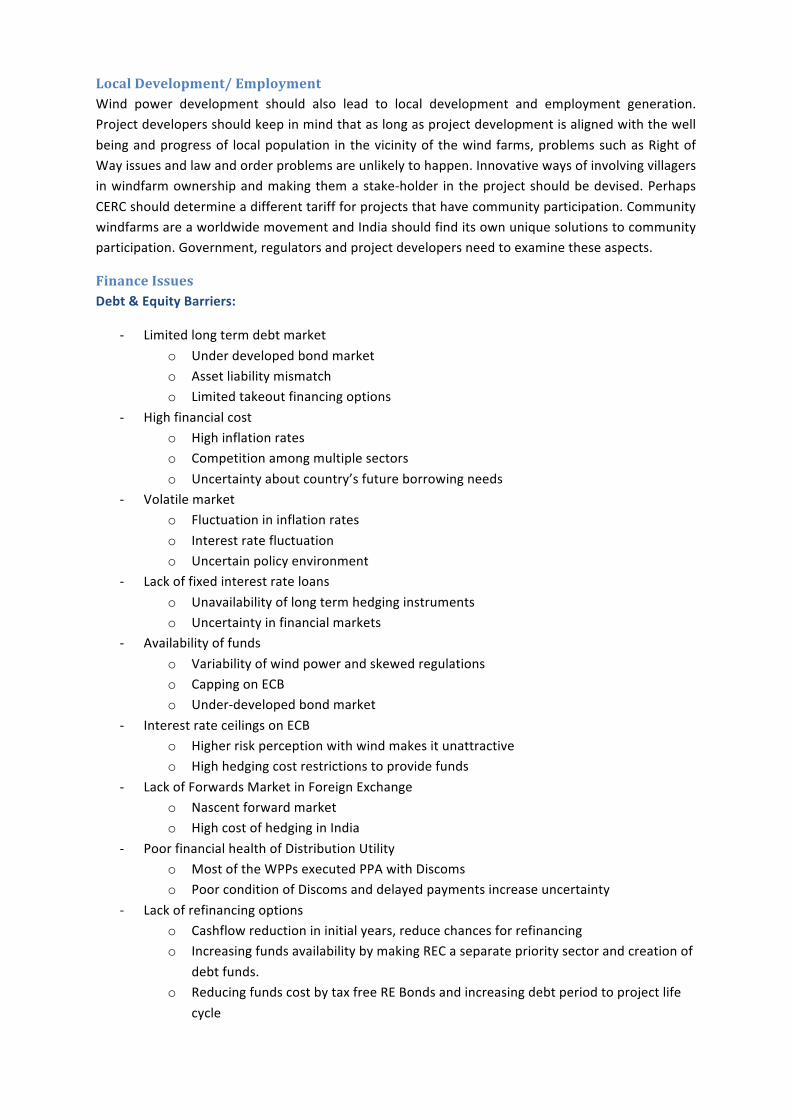
Local Development/ Employment Wind power development should also lead to local development and employment generation. Project developers should keep in mind that as long as project development is aligned with the well being and progress of local population in the vicinity of the wind farms, problems such as Right of Way issues and law and order problems are unlikely to happen. Innovative ways of involving villagers in windfarm ownership and making them a stake-‐holder in the project should be devised. Perhaps CERC should determine a different tariff for projects that have community participation. Community windfarms are a worldwide movement and India should find its own unique solutions to community participation. Government, regulators and project developers need to examine these aspects.
Finance Issues Debt & Equity Barriers:
-‐ Limited long term debt market o Under developed bond market o Asset liability mismatch o Limited takeout financing options
-‐ High financial cost o High inflation rates o Competition among multiple sectors o Uncertainty about country’s future borrowing needs
-‐ Volatile market o Fluctuation in inflation rates o Interest rate fluctuation o Uncertain policy environment
-‐ Lack of fixed interest rate loans o Unavailability of long term hedging instruments o Uncertainty in financial markets
-‐ Availability of funds o Variability of wind power and skewed regulations o Capping on ECB o Under-‐developed bond market
-‐ Interest rate ceilings on ECB o Higher risk perception with wind makes it unattractive o High hedging cost restrictions to provide funds
-‐ Lack of Forwards Market in Foreign Exchange o Nascent forward market o High cost of hedging in India
-‐ Poor financial health of Distribution Utility o Most of the WPPs executed PPA with Discoms o Poor condition of Discoms and delayed payments increase uncertainty
-‐ Lack of refinancing options o Cashflow reduction in initial years, reduce chances for refinancing o Increasing funds availability by making REC a separate priority sector and creation of
debt funds. o Reducing funds cost by tax free RE Bonds and increasing debt period to project life
cycle
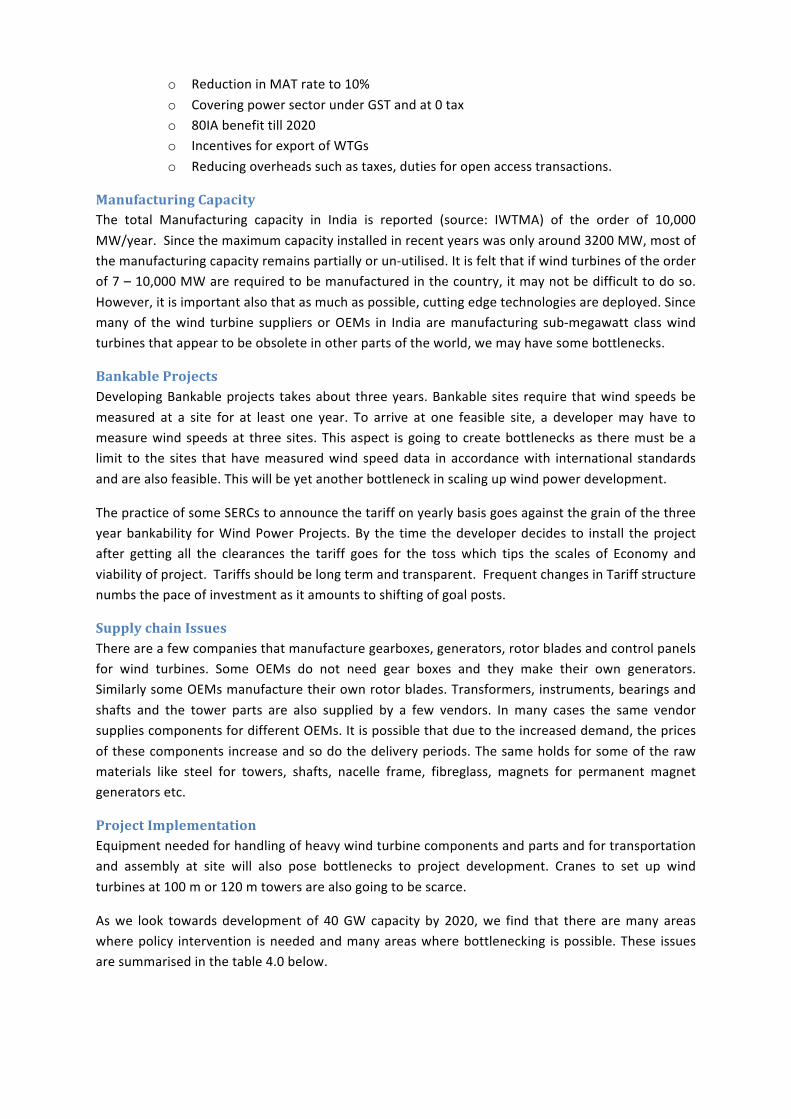
o Reduction in MAT rate to 10% o Covering power sector under GST and at 0 tax o 80IA benefit till 2020 o Incentives for export of WTGs o Reducing overheads such as taxes, duties for open access transactions.
Manufacturing Capacity The total Manufacturing capacity in India is reported (source: IWTMA) of the order of 10,000 MW/year. Since the maximum capacity installed in recent years was only around 3200 MW, most of the manufacturing capacity remains partially or un-‐utilised. It is felt that if wind turbines of the order of 7 – 10,000 MW are required to be manufactured in the country, it may not be difficult to do so. However, it is important also that as much as possible, cutting edge technologies are deployed. Since many of the wind turbine suppliers or OEMs in India are manufacturing sub-‐megawatt class wind turbines that appear to be obsolete in other parts of the world, we may have some bottlenecks.
Bankable Projects Developing Bankable projects takes about three years. Bankable sites require that wind speeds be measured at a site for at least one year. To arrive at one feasible site, a developer may have to measure wind speeds at three sites. This aspect is going to create bottlenecks as there must be a limit to the sites that have measured wind speed data in accordance with international standards and are also feasible. This will be yet another bottleneck in scaling up wind power development.
The practice of some SERCs to announce the tariff on yearly basis goes against the grain of the three year bankability for Wind Power Projects. By the time the developer decides to install the project after getting all the clearances the tariff goes for the toss which tips the scales of Economy and viability of project. Tariffs should be long term and transparent. Frequent changes in Tariff structure numbs the pace of investment as it amounts to shifting of goal posts.
Supply chain Issues There are a few companies that manufacture gearboxes, generators, rotor blades and control panels for wind turbines. Some OEMs do not need gear boxes and they make their own generators. Similarly some OEMs manufacture their own rotor blades. Transformers, instruments, bearings and shafts and the tower parts are also supplied by a few vendors. In many cases the same vendor supplies components for different OEMs. It is possible that due to the increased demand, the prices of these components increase and so do the delivery periods. The same holds for some of the raw materials like steel for towers, shafts, nacelle frame, fibreglass, magnets for permanent magnet generators etc.
Project Implementation Equipment needed for handling of heavy wind turbine components and parts and for transportation and assembly at site will also pose bottlenecks to project development. Cranes to set up wind turbines at 100 m or 120 m towers are also going to be scarce.
As we look towards development of 40 GW capacity by 2020, we find that there are many areas where policy intervention is needed and many areas where bottlenecking is possible. These issues are summarised in the table 4.0 below.
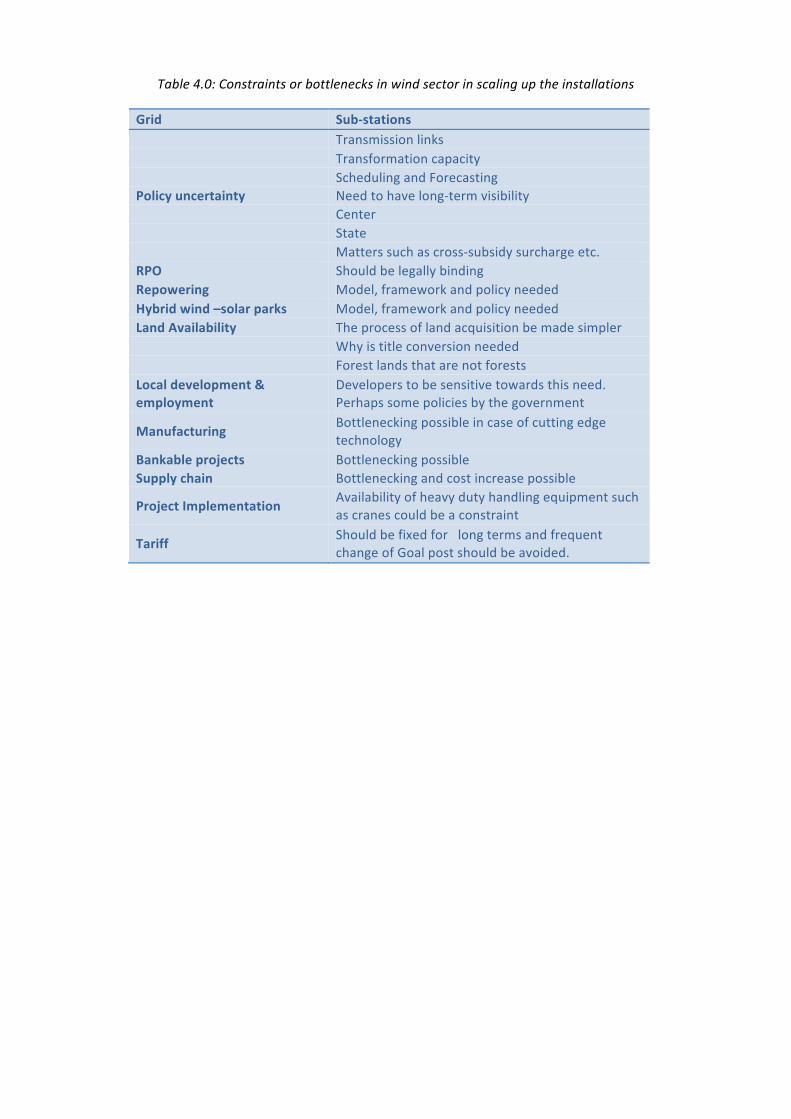
Table 4.0: Constraints or bottlenecks in wind sector in scaling up the installations
Grid Sub-‐stations Transmission links Transformation capacity Scheduling and Forecasting Policy uncertainty Need to have long-‐term visibility Center State Matters such as cross-‐subsidy surcharge etc. RPO Should be legally binding Repowering Model, framework and policy needed Hybrid wind –solar parks Model, framework and policy needed Land Availability The process of land acquisition be made simpler Why is title conversion needed Forest lands that are not forests Local development & employment
Developers to be sensitive towards this need. Perhaps some policies by the government
Manufacturing Bottlenecking possible in case of cutting edge technology
Bankable projects Bottlenecking possible Supply chain Bottlenecking and cost increase possible
Project Implementation Availability of heavy duty handling equipment such as cranes could be a constraint
Tariff Should be fixed for long terms and frequent change of Goal post should be avoided.
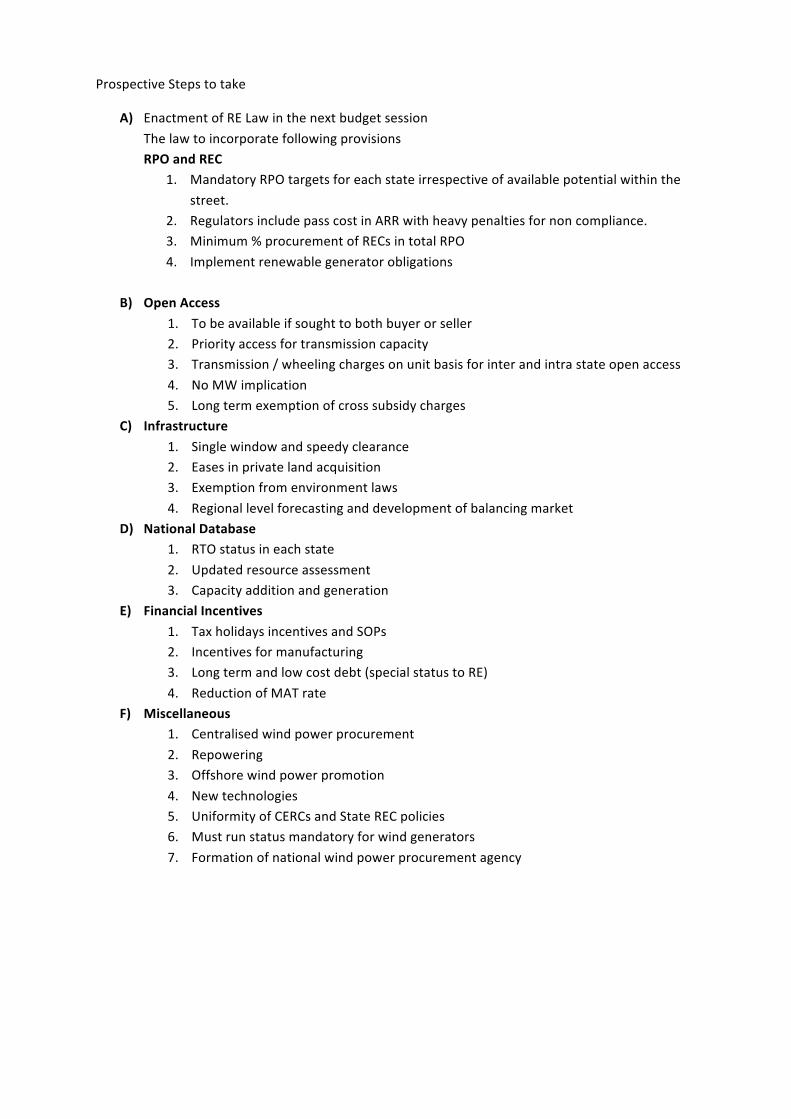
Prospective Steps to take
A) Enactment of RE Law in the next budget session The law to incorporate following provisions RPO and REC
1. Mandatory RPO targets for each state irrespective of available potential within the street.
2. Regulators include pass cost in ARR with heavy penalties for non compliance. 3. Minimum % procurement of RECs in total RPO 4. Implement renewable generator obligations
B) Open Access
1. To be available if sought to both buyer or seller 2. Priority access for transmission capacity 3. Transmission / wheeling charges on unit basis for inter and intra state open access 4. No MW implication 5. Long term exemption of cross subsidy charges
C) Infrastructure 1. Single window and speedy clearance 2. Eases in private land acquisition 3. Exemption from environment laws 4. Regional level forecasting and development of balancing market
D) National Database 1. RTO status in each state 2. Updated resource assessment 3. Capacity addition and generation
E) Financial Incentives 1. Tax holidays incentives and SOPs 2. Incentives for manufacturing 3. Long term and low cost debt (special status to RE) 4. Reduction of MAT rate
F) Miscellaneous 1. Centralised wind power procurement 2. Repowering 3. Offshore wind power promotion 4. New technologies 5. Uniformity of CERCs and State REC policies 6. Must run status mandatory for wind generators 7. Formation of national wind power procurement agency
BIBLIOGRAPHY
1. (2014). From REC Registry: https://www.recregistryindia.nic.in/index.php/general/publics/ 2. Amol Phadke, R. B. (2011). Reassessing Wind Potential Estimates for India: Economic and
Policy Implications. Lawrence Berkerley National Laboratory. 3. CERC. (2014, 15-‐May). Govt. Agencies & Tariff. Retrieved 2014 йил 28-‐November from Wind
Power India: http://www.windpowerindia.com/index.php?option=com_content&view=article&id=64&Itemid=80
4. C-‐STEP. (n.d.). Retrieved from Centre for Study of Science Technology and Policy: https://cstep.in/node/418
5. Greenpeace. (2013 йил April). Retrieved 2014 йил 28-‐November from Greenpeace: http://www.greenpeace.org/india/Global/india/report/2013/powering-‐ahead-‐with-‐renewables.pdf
6. GWEC. (2014). Global Wind Energy Outlook. 7. Hossain J, S. V. (2011). A GIS based assessment of potential for wind farms in India.
Renewable Energy , 36 (12), 3257-‐3267. 8. Hossain, J. (2013). A GIS based approach to reassessment of potential for wind energy
utilization in India_PhD Thesis. TERI University. 9. Hossain, J. (2014, September). Presentation at PDPU seminar. 10. MNRE. (2014 йил September). achievements. Retrieved 2014 йил 28-‐November from MNRE:
http://mnre.gov.in/mission-‐and-‐vision-‐2/achievements/ 11. Mohammad Ziaulhaq Ansari, D. S. (2014, Jan). Offshore wind power development in India.
Windpro_Journal of Indian Wind Power Association . 12. NIWE. (2010). Estimation of Installable Wind Power Potential at 80 m level in India. Retrieved
2014 йил 30-‐November from National Institute for Wind Energy: http://www.cwet.tn.nic.in/html/departments_ewpp.html
13. NIWE. (2014, November 11). List of wind monitoring stations. Retrieved from National Institute of Wind Energy: http://www.cwet.tn.nic.in/html/departments_wms.html
14. Shakti Foundation. (2012). Action Plan for Comprehensive Renewable Energy Development in Tamilnadu. Retrieved from http://shaktifoundation.in/wp-‐content/uploads/2014/02/tamil%20nadu_re%20action%20plan_jan%202013.pdf
15. TERI. (2012). Integrated renewable energy resource assessment for Gujarat. Shakti Foundation.
16. The Hindu. (2014 йил 16-‐February). Retrieved 2014 йил 27-‐November from The Hindu: http://www.thehindu.com/news/national/tamil-‐nadu/german-‐bank-‐to-‐fund-‐green-‐energy-‐corridors-‐project/article5694235.ece
17. Urvish Dave. (2014 йил 8-‐January). Page 2. Retrieved 2014 йил 28-‐November from Urvish Dave blog: http://urvishdave.wordpress.com/2014/01/08/wind-‐energy-‐sector-‐in-‐india-‐overview-‐state-‐wise-‐wind-‐feed-‐in-‐tariffs-‐fit-‐in-‐india-‐along-‐with-‐benefits-‐incentives-‐for-‐windmill-‐power-‐projects-‐in-‐india/
18. Varsha Joshi, MNRE. (2014 йил 11-‐October). Retrieved 2014 йил 28-‐November from Slideshare: http://www.slideshare.net/varshajoshi95/wind-‐power-‐in-‐india-‐an-‐ongoing-‐success-‐story-‐40134571

Chetan D Mehra
Mr. Chetan D Mehra is the Managing Director of Weizmann Limited, a Listed entity, and Promoter of Weizmann Group and has over 28 years of experience in guiding the Group which is presently engaged in
• Textile Processing and Exports • Authorized Dealer Category-II • Western Union Money Transfer Business • Western Union Business Solutions for cross
border remittances • Renewable Energy Projects
§ Wind Power § Hydro Power
Weizmann Forex, a listed company in the Group is spearheading money changing and money transfer business over 300 own locations Pan India and is by far the largest in terms of locations i.e. about 55000 for Western Union Money Transfer in the world. Karma Energy, another listed company with group companies have set up over 40 MW capacity wind farms in Andhra Pradesh, Tamil Nadu and Maharashtra and further projects of are under implementation in Gujarat, Karnataka, Maharashtra and Tamil Nadu. The group has commissioned a 3.5 MW Small Hydro Project in Himachal Pradesh and development of over 12 MW is in progress in the same state. Successfully tied up Joint Ventures (both financial and technical) with leading international business houses for wind farm development, manufacture of Wind Electric Generators and financial tie-ups in the form of infusion of capital by international financial institutions and leading public sector banks in Housing finance and profitably sold the entire stake in housing finance to the World’s largest Insurance Group “AIG”. Mr. Mehra has been associated with a number of trade organizations having synergy with his group business activities and this includes
• National Council Secretary of Indian Wind Power Association. • President of Renewable Energy Developers Association of Maharashtra (REDAM) –
a body representing over 100 wind farm developers in the state of Maharashtra. • Member governing Council of World Institute of Sustainable Energy (WISE) • Ex-Member of Co-Ordination Committee constituted by Government of Maharashtra
for development of Electricity System in the state of Maharashtra. • Ex-Chairman of CII-GBC Sub Committee for development of Wind Energy • Member of financial services sub-committee and energy sub-committee of
Confederation of Indian Industries. • Ex-Chairman of Laxmi Finance and Leasing Companies Commercial Premises Co-
operative Society Ltd. which implemented commercial project of over 4.00 lac Sq.ft. in Bandra Kurla Complex.
Dr. Jami Hossain
Jami Hossain is a wind energy expert, known internationally for his work in wind resource assessment, policy, technologies and deep involvement with wind industry. He is currently Technical Chair of World Wind Energy Association.
Work carried out by him in the recent times includes potential assessment for wind energy utilization in India (2011). This work has been the basis for recognition of the true wind energy potential for India by the policy making bodies such as Ministry of New and Renewable Energy (MNRE) and Planning Commission as well as by international agencies like Lawrence Berkley National Laboratory (LBNL). This work is now being cited as fundamental work in use of GIS for Renewable Energy planning and has been cited in around 50 scientific publications.
Experience Jami Hossain, a mechanical engineer of 1985 batch from National Institute Technology, Srinagar and PhD from TERI University, New Delhi is currently Chief Mentor and Co-founder of WinDForce Management Services Private Limited, a company he co-founded with Emergent Ventures India (EVI) in 2008. WinDForce has evolved as a leading wind energy consulting firm under his guidance and leadership.
He has been associated with the implementation of the first windfarms in India in the states of Gujarat, Maharashtra and Tamil Nadu in 1986. He initiated wind energy research at the Tata Energy Research Institute (Now The Energy Research Institute (TERI)) in 1986 and is known for pioneering work on wind resource potential, site assessment, policy and grid integration. In 1990 he worked as a visiting scientist at the Energy Research Unit, Rutherford Appleton Laboratory, UK. In 1994-95, he was involved in a JV, Enercon (India) Ltd. between Indian promoters (Mehras) and Enercon GmbH as its Chief Executive (Projects) and also initially as an advisor to Mehras. Enercon India turned out to be one of the most successful renewable energy businesses in India and today is one of the largest IPPs as well as manufacturer of wind turbines.
Positions 2014 – Present: Member, MNRE R&D Committee
2014: Elected Vice President, Imamia Chamber of Commerce & Industry
2013 – Present: Technical Chair, World Wind Energy Association, Bonn
2013 – Present: Elected President, Northern Regional Council, Indian Wind Power Association
2012 – Present: Elected National Council Member, Indian Wind Power Association
2008 – Present: Chief Mentor & Co-founder, Windforce Management Services Private Limited
2012 – Present: Chief Mentor, Renewables, Emergent Ventures India
2011 – 2013: Elected Treasurer, World Wind Energy Association
2007 – 2012: Elected Member, National Governing Council, Indian Wind Energy Association
2007 – 2008: Chief Executive, Wind Vertical, Gujarat Fuorochemicals Ltd.
2003 – 2005: Director (Technical), Indian Wind Energy Association
2001 – 2003: Senior Program Manager, Winrock International India
1999 – 2001: Independent Consulting & Advisory
1996 – 1999: Vice President, Independent Power Producers Association
1994 – 1996: Chief Executive (Projects) Enercon India Ltd.
1990: Visiting Scientist, Energy Research Unit, Rutherford Appleton Laboratory, Oxfordshire, UK
1986 – 1994: Coordinator & Research Associate, Renewable Energy Technologies Area, TERI
1985 – 1986: Project Engineer, RRB Consultants & Engineers
Education 2012: PhD, TERI University, New Delhi
1985: BE (Mech), NIT, Srinagar
1969 – 1979: Kendriya Vidyalaya, Srinagar/ Jammu