Embed Size (px)
Citation preview

8/14/2019 Wo r k i n g Pa P e r
http://slidepdf.com/reader/full/wo-r-k-i-n-g-pa-p-e-r 1/42
Working PaPer Ser i eS
no 1095 / SePTeMBer 2009
MeMorieS of high
inflaTion
by Michael Ehrmann
and Panagiota Tzamourani

8/14/2019 Wo r k i n g Pa P e r
http://slidepdf.com/reader/full/wo-r-k-i-n-g-pa-p-e-r 2/42
WORKING PAPER SER IES
NO 1095 / SEPTEMBER 200 9
This paper can be downloaded without charge from
http://www.ecb.europa.eu or from the Social Science Research Network
electronic library at http://ssrn.com/abstract_id=1476196.
In 2009 all ECB publications
feature a motif taken from the
€200 banknote.
MEMORIES OF HIGH INFLATION 1
by Michael Ehrmann 2
and Panagiota Tzamourani 3
1 We would like to thank an anonymous referee, Dimitris Georgarakos, Bernd Hayo and seminar participants at the ECB for helpful comments and
suggestions. This paper presents the authors’ personal opinions and does not necessarily reflect the views of the European Central Bank,
the Bank of Greece or the Eurosystem.
2 European Central Bank, Kaiserstrasse 29, D-60311 Frankfurt am Main, Germany; e-mail: [email protected]
3 Bank of Greece, 21, E. Venizelos Avenue, GR-10250 Athens, Greece; e-mail: [email protected]
8/14/2019 Wo r k i n g Pa P e r
http://slidepdf.com/reader/full/wo-r-k-i-n-g-pa-p-e-r 3/42
© European Central Bank, 2009
Address
Kaiserstrasse 29
60311 Frankfurt am Main, Germany
Postal address
Postfach 16 03 19
60066 Frankfurt am Main, Germany
Telephone
+49 69 1344 0
Website
http://www.ecb.europa.eu
Fax
+49 69 1344 6000
All rights reserved.
Any reproduction, publication and
reprint in the form of a different
publication, whether printed or
produced electronically, in whole or in
part, is permitted only with the explicit
written authorisation of the ECB or the
author(s).
The views expressed in this paper do not
necessarily re fl ect those of the European
Central Bank.
The statement of purpose for the ECB
Working Paper Series is available fromthe ECB website, http://www.ecb.europa.
eu/pub/scientific/wps/date/html/index.
en.html
ISSN 1725-2806 (online)
8/14/2019 Wo r k i n g Pa P e r
http://slidepdf.com/reader/full/wo-r-k-i-n-g-pa-p-e-r 4/42
3ECB
Working Paper Series No 1095September 2009
Abstract 4
Non-technical summary 5
1 Introduction 6
2 The data and the econometric model 7
3 Inflation experience and inflation concerns 15
3.1 Determinants of respondents’ first priority 15
3.2 The relevant horizon for agents’ memories 19
3.3 Determinants of respondents’ second priority 19
4 Conclusions 20
References 22
Figures and tables 24
Appendix 35
European Central Bank Working Paper Series 39
CONTENTS
8/14/2019 Wo r k i n g Pa P e r
http://slidepdf.com/reader/full/wo-r-k-i-n-g-pa-p-e-r 5/42
4ECBWorking Paper Series No 1095September 2009
Abstract
Inflation has been well contained over the last decades in most industrialized
countries. This implies, however, that memories of high inflation are likely to fade,
because over time larger parts of the population have never experienced highinflation, whereas those who have might forget. This paper tests whether memories of
high inflation affect agents’ preferences about the importance attached to price
stability, using a large database covering over 52,000 survey responses from 23
countries over the years 1981-2000. It finds that memories of hyperinflation are there
to last, whereas those of less drastic inflation experiences tend to erode after around
10 to 15 years. The recent decline in the importance attached to price stability does
therefore most likely reflect mitigated inflation concerns in an environment of low
and stable inflation, but also the consequences of fading memories of high inflation.
The longer central banks have successfully delivered price stability, the more
important it is for them to engage in a proactive communication, especially with the
younger generations, about the merits of low and stable inflation.
Keywords: inflation aversion, inflation memories, hyperinflation, World Values
Survey, inflation targeting
JEL classification: D10, E31, E52
8/14/2019 Wo r k i n g Pa P e r
http://slidepdf.com/reader/full/wo-r-k-i-n-g-pa-p-e-r 6/42
5ECB
Working Paper Series No 1095September 2009
Non-technical summary
Inflation outcomes are very likely to, at least partially, reflect the preferences of societies. Without
public support, central banks will find it much more difficult to disinflate a high inflation economy, or
to prevent inflation from rising in the first place. The different inflation experiences across countries in
the 1980s, for instance, have often been explained by variations in the inflation aversion of the generalpublic. In that debate, references have typically been made to the German case, where allegedly public
support for the Bundesbank’s anti-inflationary stance was high due to the German experience of
hyperinflation in 1923.
This discussion suggests that memories of high inflation are a relevant factor in shaping a society’s
preferences. If this is the case, industrialized countries might be about to experience a reduced inflation
aversion among their citizens, given the fact that inflation has been moderate over the recent past. Over
time, fewer and fewer members of the societies of industrialized countries will have a vivid memory of
the great inflation of the 1970s/1980s (and of course even more so of the hyperinflation episodes, which
date back much longer) – either because they have not experienced it, or because they forget over time.
This paper tests for the role of inflation memories in shaping the preferences of economic agents. It uses
data obtained from the World Values Survey, covering over 52,000 responses obtained in 4 waves of
the survey, conducted over the years 1981-2000 in 23 industrialized countries, to illustrate that over the
more recent period, the importance attached to fighting rising prices has generally and steadily declined.
While this could simply reflect that agents pick other priorities in times when inflation is not seen to be
a current problem, and as such might not be indicative of a declining inflation aversion among the
general public, the paper goes further to show that the likelihood of being concerned about rising prices
is closely related to the extent to which an individual has already experienced high inflation. In
particular, having lived through hyperinflation during adult lifetime implies a substantially larger
concern about inflation, which furthermore does not tend to erode. Less drastic experiences of high
inflation, in contrast, are found to be in agents’ minds for around 10 to 15 years, and subsequently fade.
These findings have important implications for central banks. They suggest that public support for their
mandate could possibly erode over time, due to the central banks’ own successes in taming inflation,
thus lowering the sensitivity of the public towards rising prices. The longer central banks have
successfully delivered price stability, the more important it is for them to engage in a pro-active
communication, especially with the younger generations, about the merits of low and stable inflation.
Fortunately, the findings in this paper suggest that central banks have tools at their disposal to shape
public views about inflation, as the general public appears to be perceptive to central bank
communication.
8/14/2019 Wo r k i n g Pa P e r
http://slidepdf.com/reader/full/wo-r-k-i-n-g-pa-p-e-r 7/42
6ECBWorking Paper Series No 1095September 2009
1. IntroductionIn democracies, agents’ preferences about policy priorities are an important input into the decision-
making process of politicians. With regard to macroeconomic policies, a society’s inflation aversion has
often been seen as a major determinant of the design of the monetary institutions and of macroeconomic
outcomes. For instance, the granting of independence to the Deutsche Bundesbank and the avoidance of
the great inflation of the 1970s/1980s in Germany have often been ascribed to a high inflation aversionof the German society, which itself is usually assumed to have resulted from the fact that Germany had
experienced hyperinflation in 1923 (Beyer et al. 2009, Issing 2005, Hayo 1998, Cukierman 1992).
Inflation aversion is most likely not constant over time. For central banks (including the Bundesbank),
inflation aversion as revealed from their policy conduct has been found to vary (Kuzin 2006, Cecchetti
and Ehrmann 2002); at the same time, the preferences of society are likely not time invariant either, due
to i) time-varying preferences of individuals, or ii) a changing composition of the population. With
inflation having been well contained in most industrialized economies over the last decades, it is
important to understand whether this will affect inflation aversion of individuals, and thus the evolution
of the aggregate views about how to conduct monetary policy. With memories of high inflation fading
(because society is composed of more agents who have never experienced high inflation themselves,
and because agents who have experienced high inflation might start forgetting), public support for the
pursuit of price stability might also erode. To understand the possible evolution of societal preferences
over time, and the possibilities for a decline in inflation aversion on the background of low and stable
inflation in most industrialized economies over a prolonged period of time, it is crucial to study the
relevant issues at the microeconomic level.
In this paper, we will use data obtained from the World Values Survey, covering over 52,000 responses
obtained in 4 waves of the survey, conducted over the years 1981-2000 in 23 industrialized countries, to
illustrate that over the more recent period, the importance attached to fighting rising prices has generally
and steadily declined. While this could simply reflect that agents pick other priorities in times when
inflation is not seen to be a current problem, and as such might not be indicative of a declining inflation
aversion among the general public, the paper goes further to show that the likelihood of being concernedabout rising prices is closely related to the extent to which an individual has already experienced high
inflation. In particular, having lived through hyperinflation during adult lifetime implies a substantially
larger concern about inflation, which furthermore does not tend to erode. Less drastic experiences of
high inflation, in contrast, are found to be in agents’ minds for around 10 to 15 years, and subsequently
fade.
This implies that young agents in industrialized economies, by not having been exposed to spells of
high inflation, are substantially less likely to consider the combat of inflation as a societal priority.
These findings have important implications for central banks. They are suggestive that there is a
possibility of an eroding support for their mandate over time, which is brought about by the central
banks’ own success in taming inflation, thus lowering the sensitivity of the public towards rising prices.
The longer central banks have successfully delivered price stability, the more important it is for them toengage in a pro-active communication, especially with the younger generations.
The paper is related to various strands of the literature. In modern macroeconomic theory, the conduct
of monetary policy is typically analyzed under the assumption that central banks set monetary policy in
relation to a social loss function, with inflation aversion affecting the weight given to inflation
stabilization (Woodford 2003). However, given that these models are typically based on the assumption
of representative agents, heterogeneous preferences are not generally taken into account. Aggregation
issues have received somewhat more attention in the definition of the appropriate inflation measure that
a central bank should target. Mankiw and Reis (2003) model this problem, using representative
consumers, yet heterogeneous sectors that can differ with regard to their size, cyclical sensitivity, price
rigidities or magnitude of sectoral shocks. The assumption of a representative consumer is of course
questionable, and becomes important in the discussion of plutocratic versus democratic price indices(Prais 1959). Both approaches compute the consumer price index as an aggregation of household price
8/14/2019 Wo r k i n g Pa P e r
http://slidepdf.com/reader/full/wo-r-k-i-n-g-pa-p-e-r 8/42
7ECB
Working Paper Series No 1095September 2009
indices, but they use different weights: in the former, the weight of each household is determined by its
expenditure share, whereas for the latter each household receives the same weight.
Another strand of the literature studies the determinants of inflation aversion of economic agents. Shiller
(1997) analyses the results of a survey about why people dislike inflation, and discovers differences in
opinions across countries, as well as between generations. With regard to intergenerational differences,he finds (p. 59) that “in answering questions about what is really important and what our national
leaders really ought to pay attention to”, people are influenced by their previous experiences of inflation
and possible undesired effects of high inflation periods. In line with this, it has consistently been found
that inflation affects self-reported well-being of economic agents (Alesina et al. 2004, Di Tella et al.
2003, Wolfers 2003). Also in that regard, earlier experience matters: Blanchflower (2007) shows that
having experienced episodes of high inflation over their adult lifetime lowers the levels of happiness of
economic agents, while Lombardelli and Saleheen (2003) as well as Malmendier and Nagel (2009) find
that inflation expectations vary positively with inflation experience. Finally, Malmendier and Nagel
(2007) show that having experienced high inflation leads households to invest less in bonds.
The notion that societal preferences have important repercussions on economic outcomes is also dealt
with in the recent literature on culture in economics. Tabellini (2009), for instance, provides compelling
evidence that there is a causal link between culture and economic development. Guiso et al. (2006)
provide an overview of the relevant contributions to this literature, and remark that very little is known
at the current stage about the factors that shape culture and make it persist. The concept of culture in this
literature relates to values that are transmitted from generation to generation, and is therefore broader
than the idea of inflation aversion in this paper (given that we do not analyze the intergenerational
patterns); at the same time, an understanding of the determinants and the persistence of inflation
aversion for a given individual is a first step in studying the determinants of cultural developments. A
closely related paper to ours is Hayo (1998), who finds – using the same survey question as we do, yet
based on the Eurobarometer survey – evidence for a “stability culture”, whereby survey respondents in
low inflation countries tend to be more sensitive to increasing inflation rates than people in higher-
inflation countries.
The present paper attempts to contribute to these lines of research. It describes the data and the
methodology underlying our empirical analysis in Section 2. Section 3 provides the empirical results.
Section 4 concludes.
2. The data and the econometric modelAs mentioned above, we will test for the role of inflation experience in assessing the importance to fight
rising prices using data from the World Values Survey (WVS). The WVS consists of representative
national surveys of the basic values and beliefs of the general public in a large number of countries. It is
conducted by a network of social scientists at leading universities all around world, coordinated by a
central body, the World Values Survey Association1. The WVS builds on the European Values Surveys,first carried out in 1981. The subsequent waves, 1989-1993, 1994-1998 and 1999-2000 covered overall
some 80 countries. For each country there are interviews with a representative national sample2
of about
1000 people. The data are weighted so as to adjust for the survey design within the country and also
weighted when pooled together so as to equalize the contribution of each country/wave in the sample.
1 See http://www.worldvaluessurvey.org/ . Data for the 2005 wave has just recently been made available publicly
for a subset of the countries analyzed in this paper. We have not updated the dataset, first due to the partial
coverage (currently, only data for 13 out of our 23 countries are available), and second because the inclusion of
data after the euro cash changeover might complicate the analysis due to possible gaps between actual and
perceived inflation (see, e.g., European Central Bank 2005).2 Some cases where the samples are non-representative are described in Stevenson and Wolfers (2008). Our data
do not include any non-representative samples.
8/14/2019 Wo r k i n g Pa P e r
http://slidepdf.com/reader/full/wo-r-k-i-n-g-pa-p-e-r 9/42
8ECBWorking Paper Series No 1095September 2009
The data, apart from the questions on various values and beliefs, contain information on
sociodemographic characteristics of the individuals, such as age, gender, marital status, educational
level, employment status, income. Numerous studies have been based on the World Values Survey,
exploring a wealth of topics, covering for instance the change of cultural values of societies in the globe,
as for example, Inglehart (1997), or the relationship of income and health, as in Jen et al (2009). While
the survey is mainly of a sociological and political nature, it has recently been increasingly studied alsoby the economics profession. For instance, Stevenson and Wolfers (2008) and Layard (2008) have
analyzed the relationship of happiness and economic growth; Guiso et al. (2003) use it to investigate the
effect of religion on economic attitudes, and Georgarakos and Pasini (2009) employ the data on trust
contained in the WVS to understand determinants of stock market participation.
Among the various belief questions, the survey contains a block of questions regarding respondents’
views about what should be the most important policy priorities in the country of residence for the next
10 years. In that context, respondents are asked to indicate which of the following goals is considered to
be the most important:
Maintaining order in the nation
Giving people more say in important government decisions Fighting rising prices
Protecting freedom of speech
In a subsequent question, the respondent has the possibility to nominate a second priority from the same
choice set. We will base our empirical analysis on these questions. Their exact wording entails a number
of advantages and disadvantages for our study, several of which have already been highlighted by Hayo
(1998). A first issue relates to the fact that respondents need to pick from a set of choices, rather than
indicating the importance they attach to price stability as such. A disadvantage in that regard is that we
do not observe respondents’ priority sets fully – whether the fight against inflation takes the third or
fourth rank is not observed. Furthermore, the alternatives that are on offer might not imply serious
trade-offs (as would be the case if respondents needed to give priority to fighting inflation over reducing
unemployment, for instance). At the same time, the advantage of the phrasing of this question is that itdoes force a choice. If respondents were asked to assign importance to various alternative goals
independently, they might as well give all of them a priority status, a possibility that is excluded here.3
A second issue to note is that current events or developments can “crowd out” the other priorities. A
drop in the share of respondents who pick the fight against inflation as priority could therefore arise
either because they see inflation as less of a problem, or alternatively because another option of the list
has gained in importance. What is important for our empirical analysis is therefore to properly control
for current developments (both in inflation as well as in factors that might affect the likelihood to opt for
another goal). Only controlling for such effects will allow us to treat the answers to this question as a
proxy for the inflation aversion of individuals.
The dataset we use covers over 52,000 answers to these questions, in 4 waves of the survey conductedover the years 1981-2000 in 23 industrialized countries. Table 1 provides an overview of the coverage.
We restricted the sample to industrialized countries, as a pooling of their data is only admissible if it is
plausible to assume that the coefficients to be estimated are not too different between countries. For a
relatively homogeneous group, this assumption seems more plausible. In any case, we will test for the
homogeneity assumption by further splitting the sample of countries to those belonging to the European
Union and all others. Another advantage of restricting the sample to industrialized countries is that all of
these are long-established democracies, such that we would expect the political situation in each country
to remain broadly stable over time compared to developing or emerging economies. While this cannot
resolve the problem that concurrent political events could lead to shifts of respondents’ priorities over
time, it should at least make substantial shifts less likely.
3 Please note that non-response for this question is very limited. Only 0.25% (2%) of respondents do not provide a
first (second) priority.
8/14/2019 Wo r k i n g Pa P e r
http://slidepdf.com/reader/full/wo-r-k-i-n-g-pa-p-e-r 10/42
9ECB
Working Paper Series No 1095September 2009
In most countries, we have data for 2 or 3 of the survey waves. In Greece, Luxembourg, Portugal,
Australia, Canada and New Zealand only one wave is available, whereas all four waves are contained
for Germany, Spain and Japan. Some country waves are not included in our sample, namely if our
dependent or explanatory variables have not been asked in that particular wave. This is, for instance, the
case for the wave conducted in 1982 in the United States, such that our dataset comprises only three US
waves, starting in 1990.
TABLE 1 HERE
A first look at the importance attached to price stability is provided in Table 2. A first thing to note is
that fighting rising prices is on average not the most important concern of respondents. A random
allocation would lead to a 25% share of respondents picking each choice. Instead, this number stands at
only 15% for inflation as the first priority. Furthermore, inflation concerns have clearly abated when
compared to the 1980s – inflation was chosen as first or second choice by 50% of respondents in the
first wave, but only by 30% and 35% in the third and fourth waves, respectively. This implies a slight
pickup in the most recent wave, albeit to levels substantially lower than those observed in the first wave.
Furthermore, such a reconsideration of inflation concerns has not occurred in all countries alike. In the
United States, for instance, numbers have steadily declined, from 43% of respondents giving inflation
either first or second priority status in 1990, to a very low – also by international comparison – 27% in
1999.
TABLE 2 HERE
Another interesting feature is the breakdown by cohorts according to the year of birth. The more
recently born cohorts show a much reduced inclination to put the fight against inflation on top of their
list, especially when compared to the cohort born in 1925 or before.4
Importantly, splits by age rather
than by year of birth show much less of a declining pattern. The difference in results arises because the
survey waves spread over 20 years, from 1981 to 2000, such that over time, individuals get assigned to
different age groups. This suggests that (beyond a possible age factor), lifetime experience of anindividual can possibly be important in the way this question gets answered.
Responses are clearly linked to the level of inflation prevailing at the time of the survey. Figure 1 plots
the share of respondents mentioning fighting rising prices as first or second priority in each country and
wave against contemporaneous inflation. A positive relationship is clearly discernible, although with a
substantial variation, suggesting that other factors are also important in shaping these responses.
FIGURE 1 HERE
In order to model how the importance to price stability relates to current inflation and an individual’s
inflation experience, it is crucial to properly control for other possible determinants. In particular, given
that the respondents are not asked to rank the importance of fighting rising prices on a given scale, butrather need to decide whether or not to prioritize inflation in a list of alternative choices, it is important
to simultaneously control for possible determinants of the alternative choices. We do so in the following
way:
The survey contains a large number of other questions, some of which could potentially be interesting
for our purposes. In particular, we will employ the data on gender, on education, on income and on the
age of the respondent to cover the most important demographic characteristics. In addition, we know
from the survey whether the respondent is the “chief wage earner in the house”, how often she discusses
4
E.g., the share of respondents giving priority to fighting rising prices is statistically significantly larger for thecohort born prior to 1926 than for the cohort born after 1970 at the 1% level, for all waves jointly as well as for
every wave individually, for first or second priority (with only one exception, namely fighting rising prices as
second priority in the 1994-1999 wave, where the difference is statistically significant at the 5% level).
8/14/2019 Wo r k i n g Pa P e r
http://slidepdf.com/reader/full/wo-r-k-i-n-g-pa-p-e-r 11/42
10ECBWorking Paper Series No 1095September 2009
political matters with friends, and finally the respondents’ self-positioning on the political scale from
right to left.
The demographic controls are important, given earlier evidence that females tend to have higher
inflation perceptions and inflation expectations than men, and that age, income as well as education are
important in that regard (Bryan and Venkatu 2001, Lombardelli and Saleheen 2003, Christensen et al.2006). Income is also known to affect the importance attached to combating inflation: Easterly and
Fischer (2001) have shown that the poor are more likely to mention inflation as a national concern in a
similar survey covering 38 countries. Furthermore, each of the demographic factors might also affect
the importance attached to any of the other choices in the survey.
Table 3 provides summary statistics for each of our explanatory variables. Our control for gender is a
dummy variable that is equal to one for females. As Table 3 shows, 49% of all respondents are female.
We measure age at the time of the survey, aggregated in age groups (18-24, 25-34, 35-44, 45-54, 55-64,
65+), and differentiate three levels of education, low (elementary school or below), middle (completed
secondary school), upper (with some university education, with or without degree)5. With regard to
income, our variable considers 9 relative income levels. Respondents were asked to assess their income
on a ten band scale of income relative to the respondent’s national norm. We further collapsed the two
upper deciles as for some countries and waves they contained very few responses. To account for the
fact that income is measured in relative terms to the current national income distribution, we allow for
country-specific slope coefficients in our regression models.
TABLE 3 HERE
The other three variables obtained from the WVS are less standard, and were chosen in the light of the
alternative choices available to respondents. All other answer categories relate to political concepts,
such that it is important to control for the importance that the individual attaches to political questions
(proxied by the frequency of political discussions), where we would expect a more politically active
person to be less likely to pick inflation as a priority. An individual’s political views might be importantfor which of the three political priorities a respondent chooses. Accordingly, we enter the self-
positioning of the individual on the political spectrum as a possible control variable (see also van
Lelyveld 1999). Last, we also control for whether or not a respondent is the main wage earner in the
household, as this might affect the importance attached to price stability.
These variables are measured as follows. The importance of political discussions is defined on a range
from 1 (frequent discussions) to 3 (the respondent never discusses political matters with friends), such
that a higher value for this variable denotes less political interest. The self-positioning of respondents in
the political spectrum is performed on a scale from 1 to 10, where 1 indicates the left, and 10 the right
end of the spectrum.
An important variable for our hypotheses relates to the inflation experience that respondents havegained prior to the survey. We confine the analysis to inflation experience during an individual’s adult
lifetime (i.e., as of the age of 18), but results are robust to further expanding this horizon, e.g. to the
experience as of the age of 12. In particular, we are interested in the maximum annual inflation rate that
the respondent has experienced up until the survey. This variable is therefore specific to all individuals
of a given year of birth in a given country, for a given survey wave. To construct such a variable, long
historical data series of inflation are required. We have availed ourselves of Global Financial Data6, a
5 For some countries and waves only ‘age when completed education’ was recorded instead of ‘educational level’.
Since the relationship between the two was not entirely clear-cut (for example, there were many cases with
recorded ‘age when completed education’ above 14 or even 18 and yet ‘lower’ educational level’), we imputed
educational level based on ‘age completed education’ and employment status. The imputation models wereestimated from the country waves where both education variables were observed. Our final results are stable
whether we use the imputed educational level or the ‘age when completed education’.6 https://www.globalfinancialdata.com/
8/14/2019 Wo r k i n g Pa P e r
http://slidepdf.com/reader/full/wo-r-k-i-n-g-pa-p-e-r 12/42
11ECB
Working Paper Series No 1095September 2009
database which contains historical and financial data for about 200 countries (some going back to the
thirteenth century). A caveat is in order here. We base respondents’ inflation experience on the national
historical data of the country where the interview took place. In case of immigrants, this might,
however, not reflect the actual inflation experience. For that reason, we have eliminated all cases where
the respondent has indicated that the country of birth is not the one of the interview. This can only
mitigate the issue, though, for a number of reasons. First, the relevant question on the country of birth isnot available for all respondents. Second, respondents might have spent parts of their life abroad, even if
they were born in the country of the interview.
Table 3 shows the enormous heterogeneity across individuals: very few of them have experienced
negative inflation as their maximum (namely 16 respondents who were aged either 18 or 19 at the time
of the survey), whereas at the other extreme, some have experienced hyperinflation, up to astronomical
rates of 302,000,000% p.a., as measured in Greece in 1944. 5% of the respondents have lived through
inflation rates above 80%. The enormous rates at the very tail of the distribution raise the mean inflation
experience to a level of 18,475,070%, whereas the median is a much more modest 15.2%. Of course,
this variable differs strongly across the various cohorts. Figure 2 plots histograms by year of birth. In
order to visualize the distribution, the chart does not display any rate above the 95th
percentile, i.e. above
80%, a treatment that affects the two oldest cohorts only, i.e. those born prior to 1926, or in between
1926 and 1940. Despite the deletion of these outliers, the figure demonstrates that the more recently
born cohorts clearly have had more uniform experiences, with a much reduced dispersion, and
furthermore a substantially lower mean.
FIGURE 2 HERE
In our benchmark specifications, we will consider the maximum annual inflation rate that the
respondent has experienced over the last 15 years (rather than over the entire adult lifetime, as
underlying Figure 2 and Table 3), but we will vary this time span in a robustness test from 5 years to the
entire adult life. For the benchmark specification, this amounts to first choosing the beginning of the
relevant time span, which is given either by the year the respondent was turning 18, or by the year of thesurvey minus 15. The maximum inflation over the time window from this determined starting point
until the survey year is then calculated, and assigned to the individual for that particular survey. Given
the enormous heterogeneity in this variable, we transform it for our econometric analyses into a more
tractable format, by calculating the deciles of the distribution over the entire sample, and by assigning
each individual a value of 1 to 10, depending on her position in the distribution (e.g., a value of 1 is
assigned for individuals whose inflation experience is below the first decile).
In addition, we are interested in the hypothesis whether having lived through hyperinflation has a lasting
effect on people’s attitudes. As there is no commonly agreed definition of hyperinflation, we have
arbitrarily decided on a threshold of 200% annual inflation (but will discuss how changing this
threshold affects our results). There are 770 individuals in the sample with such an experience, i.e. 1.5%
of our sample, in Austria and Germany (around 1922-1923) and in Greece, Italy and Japan (around1944-1946).7 For these individuals, our dummy variable “hyperinflation” takes the value of 1, for all
others it is equal to zero.
In analogy to our hypothesis that past experience matters for the choice of inflation in the survey, other
experiences might also be important when it comes to choosing the political alternatives maintaining
order in the nation, giving people more say in important government decisions, or protecting freedom of
speech. By definition, however, the relevant factors that might explain the choice of these priorities are
much more difficult to control for, and much harder to quantify. Furthermore, as for inflation, long
historical time series are called for. One possibility is the data contained in the Cross-National Time
Series Data Archive8, an archive which contains data for over 200 countries, some going back to the
7 We have verified the occurrence of hyperinflation in these countries using other publicly available information,
such as Wikipedia, or the websites and publications of the respective central banks.8 http://www.databanksinternational.com/
8/14/2019 Wo r k i n g Pa P e r
http://slidepdf.com/reader/full/wo-r-k-i-n-g-pa-p-e-r 13/42
12ECBWorking Paper Series No 1095September 2009
nineteenth century, covering, among other, historical national data on the number of assassinations,
general strikes, guerrilla warfare, government crises, purges, riots and revolutions as well as anti-
government demonstrations p.a.. Of these, only the latter turned out to be relevant for our analysis. Just
as in the case of inflation experience, we have constructed a variable that contains the maximum number
of anti-government demonstrations in a year that an individual has experienced over his lifetime or
various different horizons, always only taking into account the experience as of the age of 18. Figure 3shows the distribution of respondents’ lifetime experience, suggesting that there is less heterogeneity
than for inflation, but a similar variation across cohorts: more recently born cohorts have less dispersed
experiences, and the distribution tends to have a lower mean.
The life time experience for this variable is reasonably well behaved, such that we do not rearrange
individuals according to their position on the distribution, but rather use the underlying variable itself in
the regression. As with inflation, we will use the experience over 15 years in our benchmark
regressions, but provide an assessment of the robustness to this assumption.
FIGURE 3 HERE
To analyze the responses to the question of interest described above (say, ‘priority 1’), which
encompasses four alternatives, we use a multinomial logit approach. The model is formulated in terms
of the log of the odds of an outcome relative to a base category/outcome. For a dependent variable y
with J alternatives, and explanatory variables xk , summarized in the vector x, the model can be written
as
(1) b m b m x x
x x ||
)|Pr(
)|Pr(ln)(ln
b y
m yfor m = 1 to J-1, and m b,
where b is the base category. For convenience we chose the base category to be ‘fighting rising prices’
(in short ‘inflation’), thus we examine the odds of the three other alternatives relative to this one.
The model can be interpreted in terms of factor (multiplicative) changes in the odds. Exponentiating the
two sides of the model above, we have a multiplicative model in terms of the odds of outcome m
relative to the base category b,
(2) )exp()|Pr(
)|Pr()( || b m b m x
x
x x
b y
m y
Holding other variables constant, a unit increase in the value of, say, xk will lead to a factor change in
the odds of m relative to b by exp( k m/b), or, an increase in the value of xk to xk + , will lead to a factor
change to these odds by exp( k m/b × ). The exp( k m/b) - which we will report in our tables containing
the econometric results – can also be interpreted as odds ratios:
(3) )exp()(
)(|,
|
k |
b m k
b m
b m
x
x
x
A value greater than one indicates that the odds of m vs. b increase as the explanatory variable
increases, whereas a value below one implies that the odds decrease. Choosing ‘inflation’ as the
benchmark category, we would therefore expect that a relatively high inflation experience (which
should increase the importance placed on fighting inflation) leads to coefficients that are smaller than
one. In the case of categorical variables, the coefficient for category n (say females) is the ratio of the
odds of m vs. b for that category (females) relative to the same odds for the base category (males).
As discussed above, our primary interest is the effect of the inflation experience of an individual on her
propensity to choose ‘inflation’, but it is important to control for the effects of other possible
,
8/14/2019 Wo r k i n g Pa P e r
http://slidepdf.com/reader/full/wo-r-k-i-n-g-pa-p-e-r 14/42
13ECB
Working Paper Series No 1095September 2009
determinants. We will therefore explore alternative combinations of explanatory variables, starting from
a simplest model (Model 1) containing only the inflation experience as well as country fixed effects,
wave fixed effects, and country-wave fixed effects. The subsequent models control for the
sociodemographic characteristics of the individuals (gender, age, education, income), and the other
personal characteristics discussed above, namely political position, participation in political discussions,
whether they are the chief wage earner or not and their exposure to antigovernment demonstrations(Model 2). In a further extension, we also include whether or not an individual has experienced
hyperinflation (Model 3).
Subsequently, we will drop the country-wave fixed effects (leaving country fixed effects and wave fixed
effects) and try to explain the variation across countries and waves by the macroeconomic environment
and the recent political unrest (as expressed with the index of antigovernment demonstrations; Model 4).
As a final possible explanatory variable, we add the control for whether the country employs an
inflation targeting strategy (Model 5). Finally, since the country-specific variables are also time specific
and thus explain some of the time variation, we also drop the wave fixed effects (Models 6 and 7).9
The multinomial logit model rests on the assumption known as the independence of irrelevant
alternatives (IIA), which prescribes that the odds of two alternatives should not depend on other
alternatives available, and in that sense they are ‘irrelevant’. The two most well known formal tests for
this assumption are the Hausman-McFadden (1984) test and the Small-Hsiao test (1985). The tests on
our data show more often than not, applied on the various models that we have used, that the IIA
assumption holds, the Small-Hsiao test always being favorable. However, since the usefulness of these
tests in assessing violations of the IIA assumption has been doubted (Cheng and Long 2005) we also
tested the robustness of our results by applying the multinomial probit model and results are indeed very
similar. Moreover, since the question we analyze has been included continuously in the WVS and has
thus been tested for over twenty years and analyzed extensively in the context of cultural values
literature (for example, Inglehart 1997), we are confident that the alternatives seem sufficiently distinct
to the respondents.
To test the robustness of the effects of our explanatory variables with regard to the importance attributed
to fighting inflation, we also model separately the responses to the same question when asked as a
second priority, ‘priority 2’, and also the probability of choosing ‘inflation’ as first or second priority,
irrespective of the other alternatives that get chosen by the individual.
To model ‘priority 2’ we use again a multinomial logit model. Now, conditioning on each chosen
alternative of ‘priority 1’, there are three remaining alternatives. Taking again ‘inflation’ as our base
category, we model for each chosen alternative of ‘priority 1’ the two odds vs. ‘inflation’. The set of
explanatory variables is that of Model 7. We only omit the hyperinflation variable because once the
responses are conditioned on the response to ‘priority 1’, there are too few respondents having
experienced hyperinflation in each subsample.
The probability of choosing ‘inflation’, irrespective of the other alternatives, is modeled in two settings:
We first model choosing ‘inflation’ either as first or second priority; secondly, we take the order of this
choice into account. For the first setting, we use a logit model, where the dependent variable is 1 if
‘inflation’ was chosen either as a first or second choice and 0 if it was not chosen at all. The logit model
is derived in terms of an underlying variable where the probability of a positive response is observed
when the underlying variable exceeds some threshold.
Assuming an underlying ‘importance attributed to inflation’
(4) ii x *
y ,
9 We maintain the country fixed effects, as these are required to differentiate the slope of the income variable
across countries.
8/14/2019 Wo r k i n g Pa P e r
http://slidepdf.com/reader/full/wo-r-k-i-n-g-pa-p-e-r 15/42
14ECBWorking Paper Series No 1095September 2009
whether an individual chooses ‘inflation’ as a priority in the survey or not, is indicated by the
observable variable y, where
(5) 0i y if 0*i y and 1i y if 0
*i y
The probability of a positive response conditional on the vector of explanatory variables x, is given by
(6) )(1)|0Pr()|0Pr()|1Pr( * x F x x x x y y
Assuming that the is distributed logistically with Var() = 2 /3 leads to the binary logit model
)exp(1
)exp()|1Pr(
x
x x
y , or, in terms of the odds of response 1 relative to response 0,
(7) )exp(
)|0Pr(
)|1Pr()( x
x
x x
y
y
Thus, for a unit change in xk , the odds are expected to change by a factor of exp( k ), holding all other
variables constant. Like for the multinomial logit models, we will report the exponentiated coefficients
exp( k ). A value greater than 1 indicates that an increase in the explanatory variable, for instance in
inflation experience, will increase the odds of choosing ‘inflation’.
In the second setting, making now use of the order of choice, we fit an ordered logit model, where the
dependent variable is 2 if ‘inflation’ was chosen as a first priority, 1 if ‘inflation’ was indicated as a
second choice and 0 if it was not chosen at all. Assuming again an underlying variable determining the
observed response - an underlying ‘importance attributed to inflation’ by an individual, the
measurement model for binary outcomes is expanded to divide y* into K (3 in our case) ordinal
categories,
(8) m yi if mim y
*1 for m = 1 to K
where the thresholds 1 through K-1 are estimated. As usual, we assume 0 = - and K = . The
probability of observing y = m for given values of the x’s corresponds to the region of the distribution
where y* falls between m-1 and m:
(9) )|Pr()|Pr( *
1 x y x m m
m y .
Substituting x + for y*, we have
(10) )()()|Pr( 1 x F x F x m m
m y ,
where F is the cumulative distribution function for . Assuming again the logistic distribution for F with
Var() = 2 /3 we obtain the ordinal logit model. For the ordered logit model, we can define the odds that
an outcome is less than or equal to m versus greater than m given x:
(11) )exp()|Pr(
)|Pr()(| x
x
x x m m m
m y
m y, for m =1, K -1.
The effect of a unitary change in xk equals
8/14/2019 Wo r k i n g Pa P e r
http://slidepdf.com/reader/full/wo-r-k-i-n-g-pa-p-e-r 16/42
15ECB
Working Paper Series No 1095September 2009
(12) )exp()(
)(
|
|
k
m m
m m
x
x
x
x
Thus exp(- k ) can be interpreted as indicating the factor change in the odds of the outcome of y being
less than or equal
tom
if x
k increases by 1, holding all other variables constant. Factor changes in theodds of higher vs. lower values, )(| x m m would equal exp( k ). The exp( k ) can be interpreted as the
factor change in the odds of choosing inflation with higher importance rather than lower if, say, xk
increases by one unit, holding the other variables constant.
Since our observations are clustered by country and wave the standard errors have been estimated taking
the cluster structure into account.
3. Inflation experience and inflation concernsWhat determines the inflation concerns expressed in the World Values Survey? This section presents
the empirical results. We will first establish a benchmark regression that analyzes the determinants of
respondents’ first priority, focusing initially on the variation within each country and each wave of the
survey, and subsequently broadening the model to simultaneously identify the factors that moveresponse patterns over time. Following this, we will test for the relevant horizon after which inflation
memories fade, and test for robustness of our results by analyzing also the second choice in a number of
ways.
3.1 Determinants of respondents’ first priority
Table 4 provides the results for the benchmark model, showing the odds ratios of picking maintaining
order in the nation (“order”) as opposed to fighting rising prices (“inflation”) as first priority in the first
panel, of answering giving people more say in important government decisions (“say”) rather than
inflation in the second panel, and finally of prioritizing the protection of freedom of speech (“freedom of
speech”) over the fight against inflation in the third panel.10
TABLE 4 HERE
For each category, the model is built up consecutively, first only including respondents’ inflation
experience, and subsequently adding more controls, as discussed in the preceding section. Model (1)
provides a first indication that inflation memories matter: while there is no evidence that the odds of
picking order over inflation are affected by inflation experience, the odds ratio is significantly below
one for say and freedom of speech.11
For all further extensions of the model, also the odds ratio of order
relative to inflation turns out to be significantly different from one. The magnitude of this effect is
sizable, and turns out to be rather robust for all three options, and across various model specifications, in
the order of 0.9. This implies that the odds for all three political categories relative to inflation decrease
by around 10% if an individual moves by one decile in the inflation experience distribution, or byaround 30% in the case of a move by three deciles.
12
All subsequent models control for demographics, with a number of these being relevant determinants
for the choices of respondents. Their interpretation is in several cases not straightforward, as they refer
to the odds ratios of option pairs. It could therefore be that a control variable has independent effects on
the importance an individual attaches to both options, while our estimates would eventually only
highlight which effect dominates. This notwithstanding, a number of results can be meaningfully
10 A variant of each of these models using the inflation experience of individuals in its categorical form ispresented in the Appendix.11 Note that the stars in all tables indicate whether or not a variable is statistically significantly different from one.12 A move of three steps can be considered equivalent to a one-standard deviation change. The number is obtained
as follows: An odds ratio of 0.9 is based on a parameter estimate of -0.105. A change in the independent variable
of 3 implies an effect on the dependent variable of -0.32, which leads to an odds ratio of 0.729.
,
, k
k
8/14/2019 Wo r k i n g Pa P e r
http://slidepdf.com/reader/full/wo-r-k-i-n-g-pa-p-e-r 17/42
16ECBWorking Paper Series No 1095September 2009
interpreted. For instance, females are substantially more likely to mention the fight against rising prices
as their priority, with odds ratios in the order of 0.8 for all other choices over inflation. This is entirely
consistent with the fact that females tend to have higher inflation expectations and inflation perceptions
(Bryan and Venkatu 2001). Accordingly, they should also be more likely to be inflation averse. Being
the chief wage earner of a household does affect choice outcomes, although less consistently so. It does
not affect the odds of choosing say over inflation; however, and contrary to our priors, chief wageearners are somewhat less likely to see inflation as a concern relative to order and freedom of speech.
With regard to age, we find strong effects that differ across the various options: older respondents are
significantly more likely to opt for order as their first priority, while they are also more likely to
prioritize the fight against inflation over say and freedom of speech. Although we are differentiating 6
different age categories, the effect of age seems to be well described by a continuous process, given that
our estimated odds ratios decline (for say and freedom of speech over inflation) or increase (for order
over inflation) nearly monotonically with increasing age13
. Another important factor relates to the
education of respondents: the higher their level of education, the larger their tendency to prioritize the
political goals. Also here, effects are not only statistically significant, but also quantitatively large, with
odds ratios of 2 and 3 for say over inflation and freedom of speech over inflation, respectively.
Also income affects the answer probabilities in a significant way. While the model is estimated allowing
for different slope coefficients in each country (by interacting the income variable with the country
fixed effects), for presentational ease, Table 4 only reports the average effect across countries. Only
little information is lost in that regard, given that the effect has the same direction in all countries, and is
statistically significant in the vast majority of them. Accordingly, it holds that on average as well as in
practically every country in our sample, higher income tends to reduce the importance attached to
fighting rising prices relative to order and say (consistent with earlier results in the literature, e.g.
Easterly and Fischer, 2001), whereas it lowers the tendency to prioritize freedom of speech over fighting
rising prices.
Moving on to the next set of variables, which relate to the role of politics, we find an intriguing effect of political opinions on survey responses. More conservative respondents tend to prioritize order, whereas
they are less likely to prefer freedom of speech or say over the fight against inflation. The magnitude of
this effect is sizable, with odds ratios of around 1.1 for order relative to inflation, and of around 0.9 to
0.95 for the other combinations. Accordingly, the odds for order over inflation rise by around 10% if an
individual moves political views by one notch, and by around 20% in the case of a one standard-
deviation move of 2 points.
As expected, more politically-minded individuals are much more likely to prioritize the political choices
over inflation: those who never discuss political issues, for instance, have 15% and 60% smaller odds
ratios for order over inflation and freedom of speech or say over inflation, respectively, than those
respondents with frequent political discussions.
All except the first model include as possible determinant the respondents’ last 15 years’ experience of
anti-government demonstrations, which does indeed affect the answer patterns in a statistically
significant way, and with a non-negligible, yet not overly large magnitude: a one-standard deviation
change (of around 4) changes the odds ratio by around 10 to 20%, in the expected direction: having
experienced more political unrest increases the likelihood of choosing the political priorities over
inflation.
Another addition to the model, included in all specifications as of (3), relates to the experience of
hyperinflation. Having lived through such drastic episodes (remember, hyperinflation is defined for
annual inflation rates larger or equal to 200%) has lasting effects on respondents’ choices: opting for the
13 These findings are robust if we include cohorts instead of age in our model: earlier cohorts are more likely to
prioritize order over inflation than the more recently born cohorts, whereas the latter are more likely to prioritize
say or freedom of speech over inflation than the earlier ones.
8/14/2019 Wo r k i n g Pa P e r
http://slidepdf.com/reader/full/wo-r-k-i-n-g-pa-p-e-r 18/42
17ECB
Working Paper Series No 1095September 2009
fight against inflation is much more likely, with odds ratios of around 0.8 for order relative to inflation,
of around 0.6 for say versus inflation, and of around 0.7 for freedom of speech versus inflation. It is
important to note that these effects come on top of the concern about current inflation, and are exerting
effects on respondents’ priorities despite the hyperinflation experience having been very long ago.
Varying the definition of hyperinflation to more extreme levels leads to substantially larger effects,
which are furthermore estimated to be extremely statistically significant (despite the fact that they areestimated on increasingly fewer observations). Setting the threshold for hyperinflation to 400% p.a.
(which leaves 443 respondents with such an experience in the sample), we find odds ratios of around 0.7
for order relative to inflation, and of around 0.5 for say versus inflation and for freedom of speech
versus inflation. An even stricter definition of, say, 5000% p.a. (which leaves 40 respondents with such
a dramatic experience in the sample) generates odd ratios of 0.4 for order relative to inflation, of 0.3 for
say versus inflation, and a stunningly low 0.05 for freedom of speech versus inflation.14
As argued above, it is crucial to properly control for current events or developments that can affect the
choice of respondents. Models (1) to (3) do so in the most stringent way, by including country fixed
effects, wave fixed effects, as well as country-wave fixed effects. This eliminates all effects that vary
across countries, over time for all countries, and over time for a given country. As a consequence, all
other determinants explain only the remaining variation, i.e. they relate to within-country differences in
response patterns for a given survey wave.
While this is the most stringent way to ensure that our results are not driven by concurrent events, we
would like to investigate to what extent current conditions can explain the variation across waves, as
this allows testing whether the declining importance attached to price stability over time is related to the
macroeconomic and political conditions prevailing at the time of the survey. For that purpose, we
remove the country-wave fixed effects in models (4) and (5), leaving only wave fixed effects and
country fixed effects, and subsequently removing also the wave fixed effects in models (6) and (7).15
Current economic conditions (as measured by the maximum annual inflation rate over the last 5 years
and the lowest annual GDP growth rate
16
recorded over the last 5 years prior to the survey) moveresponse patterns in the expected direction: higher recent inflation leads more respondents to be
concerned about inflation developments, and lower recent GDP growth implies that inflation is regarded
as less of an issue than giving people more say in government decisions.
Current political conditions have less of an effect, although suggesting an interesting pattern: whereas
having been confronted with many anti-government demonstrations earlier in life leads respondents to
give high priority to giving people more say, and to protecting freedom of speech, more recent
demonstrations lead respondents to favor maintaining order in the nation over inflation, but does not
affect the relative likelihood of choosing freedom of speech or say.
14 The addition of a similar dummy variable that denotes whether or not a respondent has lived through
deflationary periods (defined as negative annual inflation rates over two – or alternatively four – consecutive
years) does not lead to statistically significant effects, while leaving all other results unaffected. The absence of
any such effect might arise due to the one-sided formulation of the survey question, which does not relate to the
stabilization of prices, but rather the fight against rising prices.15 For brevity, we do not report the individual country fixed effects. Given the widespread belief that there is a
particularly strong inflation aversion in the German society, we tested whether the fixed effect for Germany is
statistically different from the average of the fixed effects of all other countries in our sample. This is indeed the
case; while the magnitude depends somewhat on the precise model, we find that the average of the countries’ fixed
effects (relative to Germany as the base category) is larger than 1, for all the three odds we examine - order, say
and freedom of speech over inflation. The difference is statistically significant, often at the 1% level, and
coefficients range in between 1.3 and 2.2, suggesting that Germans are considerably more likely to prioritizeinflation over the alternative options than citizens of the other countries.16 GDP growth rates are calculated based on PPP-adjusted GDP data as provided by the OECD, to allow for
comparable figures across countries.
8/14/2019 Wo r k i n g Pa P e r
http://slidepdf.com/reader/full/wo-r-k-i-n-g-pa-p-e-r 19/42
18ECBWorking Paper Series No 1095September 2009
A final test in this modeling framework, reported in columns (5) and (7), investigates the role that
central bank policies might play in mitigating inflation concerns of the general public. Over the recent
decade, inflation targeting has become an increasingly popular monetary policy framework. Inflation
targeting comprises a publicly announced inflation target (which has generally helped central banks in
anchoring inflation expectations), as well as a particular emphasis on communication (which might
contribute to making the central bank better known and above all better understood by the generalpublic). It is thus an interesting hypothesis whether inflation targeting mitigates concerns about price
stability in the public.17
There is no clear theoretical prior – agents in inflation targeting countries might
be more aware about the importance to fight rising prices, being sensitized by corresponding central
bank communication, or they might see inflation as less of a concern, if they trust that the central bank
properly takes care of the problem. The expected sign is therefore ambiguous, and it remains an
empirical issue which effect prevails. However, it should be stressed that in both cases, inflation
targeting central banks seem to have managed to get through to the general public, by either raising their
inflation awareness, or by building trust in the central bank’s determination to fight inflation. A
significant effect in either direction would therefore suggest that inflation targeting does affect the
attitudes of the general public.
Looking at the results contained in Table 4, it is evident that the second effect prevails: the introduction
of inflation targeting lowers inflation concerns in the general public, to a non-negligible extent: the odds
ratio for picking order over inflation is estimated significantly at around 1.4 to 1.7. Note that this effect
comes on top of a possible inflation-reduction achieved by inflation targeting central banks, given that
the model controls for the recent inflation performance. A second point to note is that the model
contains country-fixed effects, such that the coefficient on inflation targeting cannot be interpreted as a
differential effect between targeters and non-targeters. Rather, it refers exclusively to the comparison
across time within given countries, prior to and after the introduction of inflation targeting.
A first robustness test for these results is contained in Appendix Table A2, where the sample of
countries is split into the 15 countries belonging to the European Union, and all other countries. The
pooling of countries might be problematic if they are too heterogeneous, as then the restriction of allparameters to be equal across countries was not plausible. Although we have restricted our sample to
industrialized countries, such a concern could arise, for instance, because the sample includes Japan,
which has experienced deflation, as well as Iceland, which has seen comparatively high levels of
inflation relative to the rest of the sample. Homogeneity might therefore be more easily acceptable for
the subset of European Union countries (especially given that we do not include the Eastern European
countries in the sample). Table A2 provides the corresponding estimates, and shows that results are
robust to the sample split. The only exception relates to the role of inflation targeting, which for the EU
countries – as before – implies a mitigation of inflation concerns, whereas for the non-EU countries, the
introduction of inflation targeting seems to have reduced the odds of picking order relative to inflation.
As mentioned above, there is no clear prior as to the sign of the effect, whereas the existence of any
effect signals that the communication of an inflation target is capable of affecting the views of the
general public.
Taken together, these results suggest that memories of high inflation can heighten inflation concerns of
economic agents, in a statistically and economically significant fashion. In particular the experience of
hyperinflation triggers a long-lasting inflation aversion among individuals (although this effect has been
estimated on very few observations only). It is furthermore apparent that the reduced importance
attached to fighting rising prices in more recent years is at least partially driven by a favorable
concurrent inflation environment. A number of stylized facts that have been discovered in earlier work
are replicated in this sample, namely the increased inflation concerns of females and the poor. Finally,
17
For a survey on the literature on central bank communication, including an assessment of the evidence on theeffectiveness of inflation targeting, see Blinder et al. (2008). We have defined countries as inflation targeters as
follows: Australia in the survey wave of 1996, Canada in 2000, Spain in 1996, Finland in 1996, United Kingdom
in 1996 and 2000, New Zealand in 1996, Sweden in 1996 and 2000.

8/14/2019 Wo r k i n g Pa P e r
http://slidepdf.com/reader/full/wo-r-k-i-n-g-pa-p-e-r 20/42
19ECB
Working Paper Series No 1095September 2009
central banks can shape the degree to which the general public is concerned about inflation by means of
their monetary policy and communication strategies.
3.2 The relevant horizon for agents’ memories
In the preceding subsection, agents’ experiences had referred to a 15 year horizon. It remains to be seenwhether this is the most relevant horizon, or whether inflation memories fade earlier, or last even longer.
A first indication that memories might still be well and alive beyond 15 years is given by the fact that
agents who lived through hyperinflation continue to be more concerned about inflationary pressures for
as long as we observe them in our sample. Note that the hyperinflations took place around 1922-1923
(Austria and Germany) and around 1944-1946 (Greece, Italy and Japan), respectively, and that for the
various individuals, in between 55 and 68 years had passed by the time of the survey, such that it is
probably fair to say that these extreme events stay in agents’ memories, and affect their attitudes, over
their entire lifetime.
With less drastic inflation experiences, people are more likely to forget, though, and this is the question
we address in this subsection. We will test for the relevant horizon in an indirect way, namely by
calculating inflation experiences over different horizons, starting from 5 years until the entire adult
lifetime, and by studying which of these variants generates the best statistical fit in our models. Table 5
shows the corresponding results, based on the full models as estimated in column (7) of Table 4. For
convenience, we show only the relevant parameters, noting that all other parameters are remarkably
robust.
The various horizons turn out to affect the statistical fit only marginally. In terms of the magnitude of
odds ratios, an inverse hump shape emerges for order relative to inflation and for say relative to
inflation, with the largest effects estimated over the benchmark horizon of 15 years. In contrast, for
freedom of speech relative to inflation, a linear pattern is apparent, with the largest effect at the very
short end, i.e. at a 5-year horizon. The measures of statistical fit, such as the AIC and BIC criteria,
reflect this, and accordingly are minimized for the 10 to 15 year horizon.
TABLES 5 AND 6 HERE
Results with regard to the maximum number of anti-government demonstrations show a very similar
picture: as shown in Table 6, we find the largest effects at the 15 year horizon when it comes to say
relative to inflation, whereas the effects are maximized for the 10 year horizon with regard to the other
two choice sets.
To summarize, the evidence on the relevant horizon suggests that inflation memories fade after
approximately 10 to 15 years, if they refer to moderate inflation rates. Having experienced
hyperinflation, however, is an extreme event that will last in people’s mind, and shape their preferences
accordingly.
3.3 Determinants of respondents’ second priority
As mentioned above, the relevant question that has been the focus of the analysis so far is followed by
another question, where respondents are allowed to pick a second choice, from the same set of options.
In this subsection, we will conduct a series of tests that serve as robustness checks, by studying whether
the relevant determinants for the first priority can similarly explain the second choice, and by
subsequently modeling both choices simultaneously.
In a first step, we re-estimate identical models to the one portrayed in column (7) of Table 4, but with
the second priority as dependent variable, and conditioning on the first priority. We will estimate three
different models, one for all respondents who have picked order as first choice, another one for all caseswhere the main priority was freedom of speech, and a third one with those observations where say was
the first expressed priority. The only difference compared to our earlier model specification is that we
8/14/2019 Wo r k i n g Pa P e r
http://slidepdf.com/reader/full/wo-r-k-i-n-g-pa-p-e-r 21/42
20ECBWorking Paper Series No 1095September 2009
no longer include a dummy variable for hyperinflation experience – after all, nearly all respondents with
such an experience have picked inflation as first choice, thus leaving no meaningful variation in the
remaining cases.
TABLE 7 HERE
Results are remarkably robust, as shown in columns (1) to (6) in Table 7. As before, the odds ratios for
inflation experience (now again at the 15 year horizon, as used in the estimates underlying Table 4) are
estimated in the order of 0.9, and significantly so. Recent inflation affects, as above, in particular the
odds of order relative to inflation and the odds of giving people more say in important government
decision relative to inflation, albeit with much stronger reactions, suggesting that if inflation has been
relatively high recently, respondents who have not picked inflation as first priority are considerably
more likely to opt for it as second choice than if inflation has been contained over the last years.
Moving on to a simultaneous modeling of the first and second choices, columns (7) and (8) of Table 7
show the results of estimating a logit model (where inflation as first or second priority is modeled as
one, and inflation having resulted as neither first nor second choice is equal to zero) and of an ordered
logit model (for a variable that is equal to two if inflation is given first priority, equal to one if it is given
second priority, and equal to zero otherwise).18
Note that in this case, we would expect the coefficients
for inflation experience to be greater than 1 (in contrast to the multinomial logit models, where the odds
of picking inflation were in the denominator, such that a higher likelihood to pick inflation would show
up in coefficients smaller than 1). This is indeed what we find, indicating that having experienced
higher inflation increases the odds of choosing ‘inflation’, or the odds of choosing inflation with a
higher priority rather than a lower one. Furthermore, all other relevant results obtained previously are
confirmed also in this specification.
4. Conclusions
Inflation outcomes are very likely to, at least partially, reflect the preferences of societies. Withoutpublic support, central banks will find it much more difficult to disinflate a high inflation economy, or
to prevent inflation from rising in the first place. The different inflation experiences across countries in
the 1980s, for instance, have often been explained by variations in the inflation aversion of the general
public. In that debate, references have typically been made to the German case, where allegedly public
support for the Bundesbank’s anti-inflationary stance was high due to the German experience of
hyperinflation in 1923.
This discussion suggests that memories of high inflation are a relevant factor in shaping a society’s
preferences. If this is the case, industrialized countries might be about to experience a reduced inflation
aversion among their citizens, given the fact that inflation has been moderate over the recent past. Over
time, fewer and fewer members of the societies of industrialized countries will have a vivid memory of
the great inflation of the 1970s/1980s (and of course even more so of the hyperinflation episodes, whichdate back much longer) – either because they have not experienced it, or because they forget over time.
This paper has tested for the role of inflation memories in shaping the preferences of economic agents,
and has confirmed that such memories do indeed play an important role. While memories of moderately
high inflation tend to fade after around 10 to 15 years, the paper has also identified a lasting effect of
hyperinflation experiences on individuals. The recent decline in the number of individuals who
prioritize the fight against rising prices is therefore most likely not only due to the fact that inflation
should indeed be less of a concern in an environment of low and stable inflation rates, but also due to
the fading memories of high inflation.
18 All results are robust to using probit and ordered probit models, respectively.

8/14/2019 Wo r k i n g Pa P e r
http://slidepdf.com/reader/full/wo-r-k-i-n-g-pa-p-e-r 22/42
21ECB
Working Paper Series No 1095September 2009
These findings have important implications for central banks. They suggest that public support for their
mandate could possibly erode over time, due to the central banks’ own successes in taming inflation,
thus lowering the sensitivity of the public towards rising prices. The longer central banks have
successfully delivered price stability, the more important it is for them to engage in a pro-active
communication, especially with the younger generations, about the merits of low and stable inflation.
Fortunately, the findings in this paper suggest that central banks have tools at their disposal to shapepublic views about inflation, as the general public appears to be perceptive to central bank
communication.
8/14/2019 Wo r k i n g Pa P e r
http://slidepdf.com/reader/full/wo-r-k-i-n-g-pa-p-e-r 23/42
22ECBWorking Paper Series No 1095September 2009
References
Alesina, A., Di Tella, R. and R. MacCulloch (2004). Inequality and Happiness: Are Europeans and
Americans Different? Journal of Public Economics 88, 2009–2042.
Beyer, A., Gaspar, V., Gerberding, C. and O. Issing (2009). Opting Out of the Great Inflation: GermanMonetary Policy After the Break Down of Bretton Wood. ECB Working Paper No. 1020.
Blanchflower, D.G. (2007). Is Unemployment More Costly Than Inflation? NBER Working Paper No.
13505.
Blinder, A., Ehrmann, M., Fratzscher, M., de Haan, J. and D.-J. Jansen (2008). Central Bank
Communication and Monetary Policy: A Survey of Theory and Evidence. Journal of Economic
Literature 46(4), 910–945.
Bryan, M.F. and G. Venkatu (2001). The Demographics of Inflation Opinion Surveys. Federal Reserve
Bank of Cleveland Economic Commentary, October 2001.
Cecchetti, S.G. and M. Ehrmann (2002). Does Inflation Targeting Increase Output Volatility? An
International Comparison of Policymakers’ Preferences and Outcomes, in: N. Loayza and K.
Schmidt-Hebbel (eds.). Monetary Policy: Rules and Transmission Mechanisms. Central Bank of Chile, 247-274.
Cheng, S. and J.S. Long (2005). Testing for the IIA in the Multinomial Logit Model. University of
Connecticut, Working Paper.
Christensen, C., van Els, P. and M. van Rooij (2006). Dutch Households’ Perceptions of Economic
Growth and Inflation. De Economist 154, 277-294.
Cukierman, A. (1992). Central Bank Strategy, Credibility, and Independence Theory and Evidence.
Cambridge, MA: MIT Press.
Di Tella, R., MacCulloch, R. and A. Oswald (2003). The Macroeconomics of Happiness. Review of
Economics and Statistics 85(4), 809–827.
Easterly, W. and S. Fischer (2001). Inflation and the Poor. Journal of Money, Credit and Banking 33(2),
160-178.
European Central Bank (2005). Consumers’ Inflation Perceptions. Still at Odds with Official Statistics?
Monthly Bulletin, April 2005, 30-32.
Georgarakos, D. and G. Pasini (2009). Trust, Sociability and Stock Market Participation. Mimeo,
Goethe University Frankfurt.
Guiso, L., Sapienza, P. and L. Zingales (2003). People’s Opium. The Economic Effects of Religion.
Journal of Monetary Economics 50(1), 225–282.
Guiso, L., Sapienza, P. and L. Zingales (2006). Does Culture Affect Economic Outcomes?. Journal of
Economic Perspectives 20(2), 23-48.
Hausman, J. and D. McFadden (1984). Specification Tests for the Multinomial Logit Model.
Econometrica 52, 1219-1240.Hayo, B. (1998). Inflation Culture, Central Bank Independence and Price Stability. European Journal of
Political Economy 14, 241-263.
Issing, O. (2005). Why Did the Great Inflation Not Happen in Germany? Federal Reserve Bank of St.
Louis Review, 87(2), 329-335.
Inglehart, R. (1997). Modernization and Postmodernization: Cultural, Economic and Political Change
in 43 Societies. Princeton: Princeton University Press.
Jen, M.H., Jones, K. and R. Johnston (2009). Global Variations in Health: Evaluating Wilkinson’s
Income Inequality Hypothesis Using the World Values Survey. Social Science and Medicine 68,
643-653.
Kuzin, V. (2006). The Inflation Aversion of the Bundesbank: A State Space Approach. Journal of
Economic Dynamics and Control 30, 1671-1686.
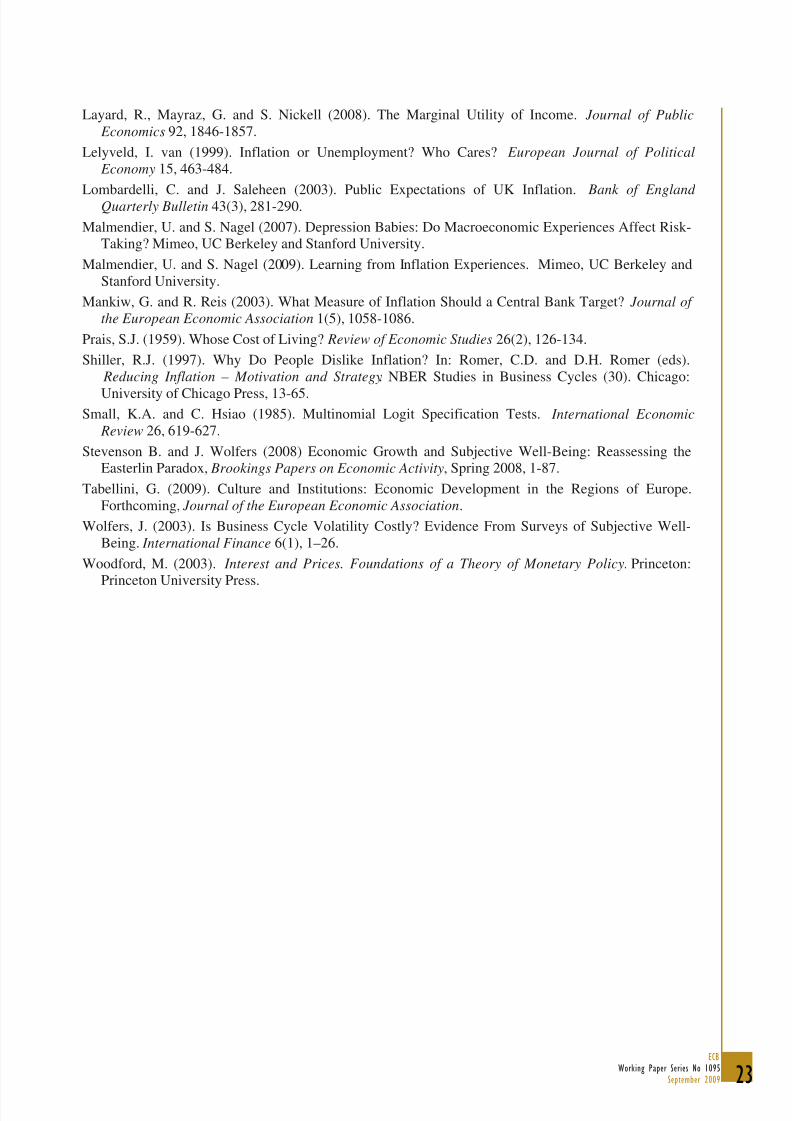
8/14/2019 Wo r k i n g Pa P e r
http://slidepdf.com/reader/full/wo-r-k-i-n-g-pa-p-e-r 24/42
23ECB
Working Paper Series No 1095September 2009
Layard, R., Mayraz, G. and S. Nickell (2008). The Marginal Utility of Income. Journal of Public
Economics 92, 1846-1857.
Lelyveld, I. van (1999). Inflation or Unemployment? Who Cares? European Journal of Political
Economy 15, 463-484.
Lombardelli, C. and J. Saleheen (2003). Public Expectations of UK Inflation. Bank of England Quarterly Bulletin 43(3), 281-290.
Malmendier, U. and S. Nagel (2007). Depression Babies: Do Macroeconomic Experiences Affect Risk-
Taking? Mimeo, UC Berkeley and Stanford University.
Malmendier, U. and S. Nagel (2009). Learning from Inflation Experiences. Mimeo, UC Berkeley and
Stanford University.
Mankiw, G. and R. Reis (2003). What Measure of Inflation Should a Central Bank Target? Journal of
the European Economic Association 1(5), 1058-1086.
Prais, S.J. (1959). Whose Cost of Living? Review of Economic Studies 26(2), 126-134.
Shiller, R.J. (1997). Why Do People Dislike Inflation? In: Romer, C.D. and D.H. Romer (eds).
Reducing Inflation – Motivation and Strategy. NBER Studies in Business Cycles (30). Chicago:
University of Chicago Press, 13-65.Small, K.A. and C. Hsiao (1985). Multinomial Logit Specification Tests. International Economic
Review 26, 619-627.
Stevenson B. and J. Wolfers (2008) Economic Growth and Subjective Well-Being: Reassessing the
Easterlin Paradox, Brookings Papers on Economic Activity, Spring 2008, 1-87.
Tabellini, G. (2009). Culture and Institutions: Economic Development in the Regions of Europe.
Forthcoming, Journal of the European Economic Association.
Wolfers, J. (2003). Is Business Cycle Volatility Costly? Evidence From Surveys of Subjective Well-
Being. International Finance 6(1), 1–26.
Woodford, M. (2003). Interest and Prices. Foundations of a Theory of Monetary Policy. Princeton:
Princeton University Press.
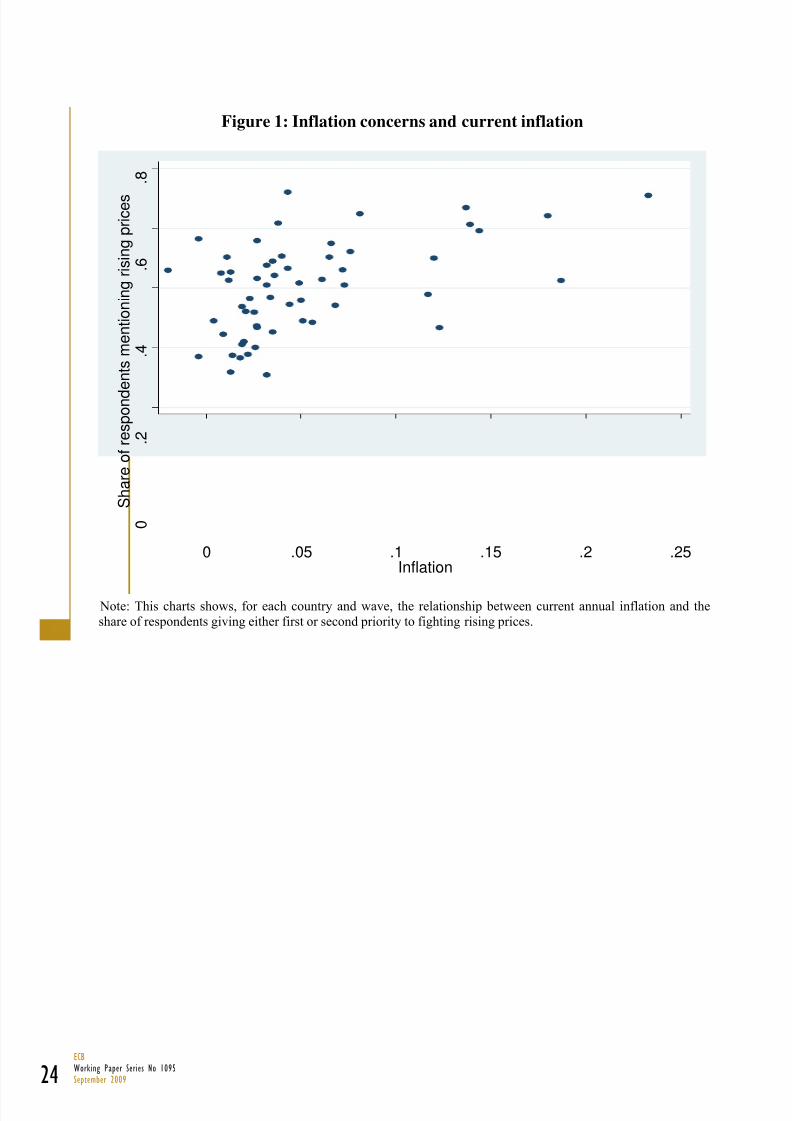
8/14/2019 Wo r k i n g Pa P e r
http://slidepdf.com/reader/full/wo-r-k-i-n-g-pa-p-e-r 25/42
24ECBWorking Paper Series No 1095September 2009
Figure 1: Inflation concerns and current inflation
0
.2
.4
.6
.8
Shareofrespondentsmentioningrisingprices
0 .05 .1 .15 .2 .25
Inflation
Note: This charts shows, for each country and wave, the relationship between current annual inflation and the
share of respondents giving either first or second priority to fighting rising prices.
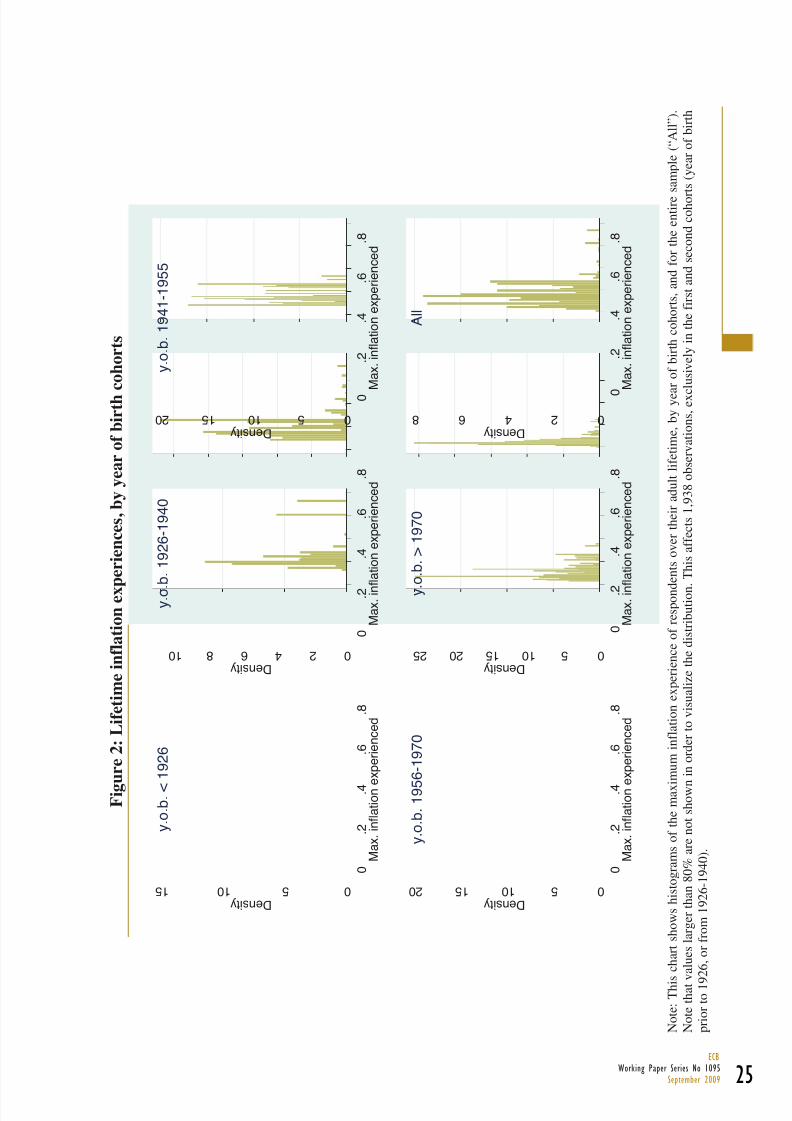
8/14/2019 Wo r k i n g Pa P e r
http://slidepdf.com/reader/full/wo-r-k-i-n-g-pa-p-e-r 26/42
25ECB
Working Paper Series No 1095September 2009
F i g u r e
2 :
L i f e t i m e
i n f l a t i o n e x p e r
i e n c e s ,
b y y e a r o
f b i r t h c o
h o r
t s
0 5 1 0 1 5 D e n s i t y
0
. 2
. 4
. 6
. 8
M a x .
i n f l a t i o n e x p e r i e n c e d
y . o . b . <
1 9 2 6
0 2 4 6 8 1 0 D e n s i t y
0
. 2
. 4
. 6
. 8
M a x . i n
f l a t i o n e x p e r i e n c e d
y . o . b .
1 9 2 6 - 1 9 4 0
0 5 1 0 1 5 2 0 D e n s i t y
0
. 2
. 4
. 6
. 8
M a x .
i n f l a t i o n e x p e r i e n c e d
y . o . b .
1 9 4 1 - 1 9 5 5
0 5 1 0 1 5 2 0 D e n s i t y
0
. 2
. 4
. 6
. 8
M a x .
i n f l a t i o n e x p e r i e n c e d
y . o . b .
1 9 5
6 - 1 9 7 0
0 5 1 0 1 5 2 0 2 5 D e n s i t y
0
. 2
. 4
. 6
. 8
M a x . i n
f l a t i o n e x p e r i e n c e d
y . o . b . > 1 9 7 0
0 2 4 6 8 D e n s i t y
0
. 2
. 4
. 6
. 8
M a x .
i n f l a t i o n e x p e r i e n c e d
A l l
N o t e : T h i s c h a r t s h o w s h i s t o g r a m s o f t h e m a x i m u m
i n f l a t i o n e x p e r i e n c e o f r e s p o n d
e n t s o v e r t h e i r a d u l t l i f e t i m e , b y y e a
r o f b i r t h c o h o r t s , a n d f o r t h e e n t i r e
s a m p l e ( “ A l l ” ) .
N o t e t h a t v a l u e s l a r g e r t h a n 8 0 % a r e n o t s h o w n
i n o r d e r t o v i s u a l i z e t h e d i s t r i b u t i o n
. T h i s a f f e c t s 1 , 9 3 8 o b s e r v a t i o n s , e x c
l u s i v e l y i n t h e f i r s t a n d s e c o n d c o h o r
t s ( y e a r o f b i r t h
p r i o r t o 1 9
2 6 , o r f r o m
1 9 2 6 - 1 9 4 0 ) .
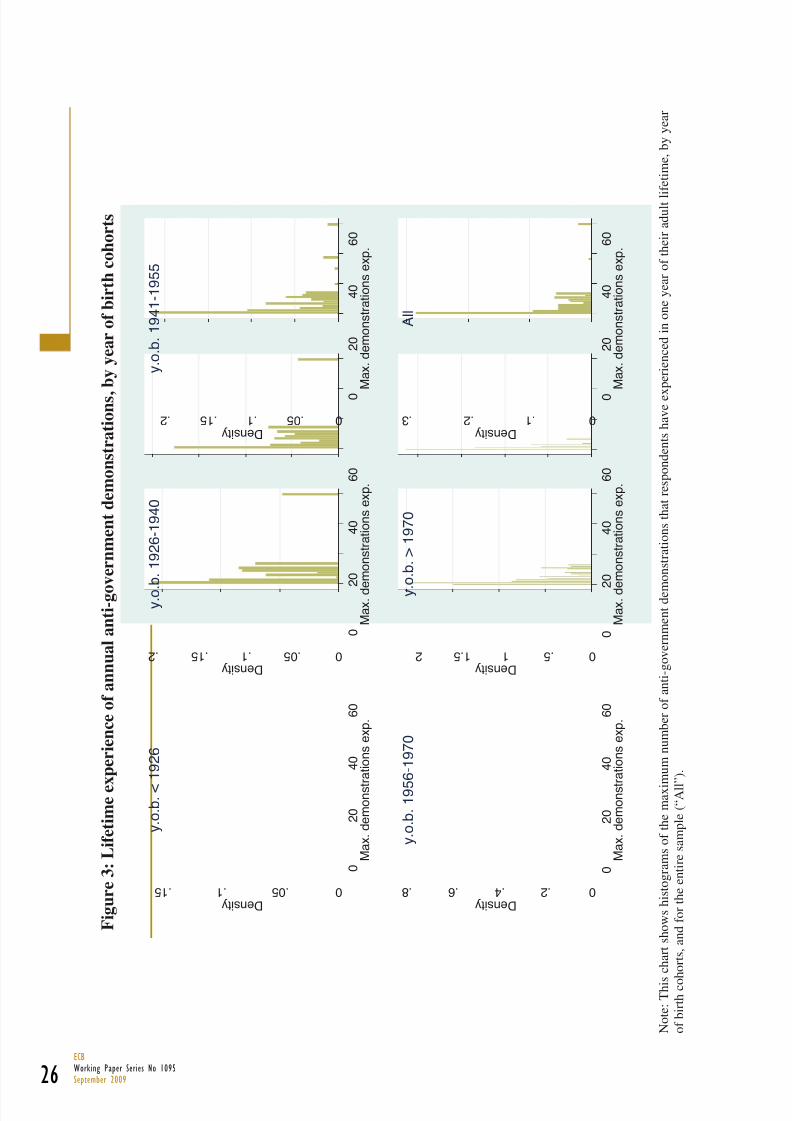
8/14/2019 Wo r k i n g Pa P e r
http://slidepdf.com/reader/full/wo-r-k-i-n-g-pa-p-e-r 27/42
26ECBWorking Paper Series No 1095September 2009
F i g u r e
3 :
L i f e t i m e e x p e r
i e n c e o
f a n n u a
l a n
t i - g o
v e r n m e n
t d e m o n s t r a
t i o n s ,
b y y e a r o
f b i r t h c o
h o r
t s
0 . 0 5 . 1 . 1 5 D e n s i t y
0
2 0
4 0
6 0
M a x .
d e m o n s t
r a t i o n s e x p .
y . o . b . <
1 9 2 6
0 . 0 5 . 1 . 1 5 . 2 D e n s i t y
0
2 0
4 0
6 0
M a x . d e m o n s t r a t i o n s e x p .
y . o . b .
1 9 2 6 - 1 9 4 0
0 . 0 5 . 1 . 1 5 . 2 D e n s i t y
0
2 0
4 0
6 0
M a x .
d e m o n s t r a t i o n s e x p .
y . o . b .
1 9 4 1 - 1 9 5 5
0 . 2 . 4 . 6 . 8 D e n s i t y
0
2 0
4 0
6 0
M a x .
d e m o n s t
r a t i o n s e x p .
y . o . b .
1 9 5
6 - 1 9 7 0
0 . 5 1 1 . 5 2 D e n s i t y
0
2 0
4 0
6 0
M a x . d e m o n s t r a t i o n s e x p .
y . o . b . > 1 9 7 0
0 . 1 . 2 . 3 D e n s i t y
0
2 0
4 0
6 0
M a x .
d e m o n s t r a t i o n s e x p .
A l l
N o t e : T h i s c h a r t s h o w s h i s t o g r a m s o f t h e m a x i m u m
n u m b e r o f a n t i - g o v e r n m e n t d e m
o n s t r a t i o n s t h a t r e s p o n d e n t s h a v e e x
p e r i e n c e d i n o n e y e a r o f t h e i r a d u l t l i f e t i m e , b y y e a r
o f b i r t h c o
h o r t s , a n d f o r t h e e n t i r e s a m p l e ( “ A l l
” ) .
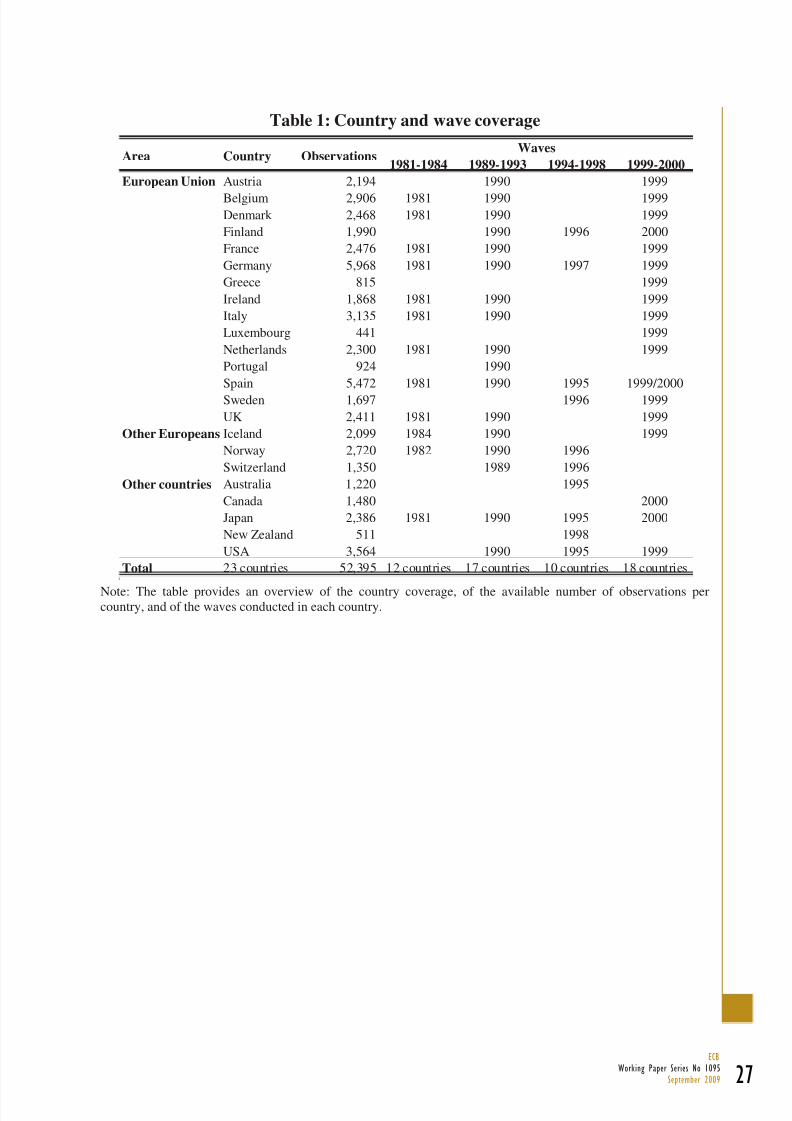
8/14/2019 Wo r k i n g Pa P e r
http://slidepdf.com/reader/full/wo-r-k-i-n-g-pa-p-e-r 28/42
27ECB
Working Paper Series No 1095September 2009
Table 1: Country and wave coverage
1981-1984 1989-1993 1994-1998 1999-2000
European Union Austria 2,194 1990 1999
Belgium 2,906 1981 1990 1999Denmark 2,468 1981 1990 1999
Finland 1,990 1990 1996 2000
France 2,476 1981 1990 1999
Germany 5,968 1981 1990 1997 1999
Greece 815 1999
Ireland 1,868 1981 1990 1999
Italy 3,135 1981 1990 1999
Luxembourg 441 1999
Netherlands 2,300 1981 1990 1999
Portugal 924 1990
Spain 5,472 1981 1990 1995 1999/2000
Sweden 1,697 1996 1999
UK 2,411 1981 1990 1999
Other Europeans Iceland 2,099 1984 1990 1999
Norway 2,720 1982 1990 1996
Switzerland 1,350 1989 1996
Other countries Australia 1,220 1995
Canada 1,480 2000
Japan 2,386 1981 1990 1995 2000
New Zealand 511 1998
USA 3,564 1990 1995 1999
Total 23 countries 52,395 12 countries 17 countries 10 countries 18 countries
WavesObservationsCountryArea
Note: The table provides an overview of the country coverage, of the available number of observations percountry, and of the waves conducted in each country.
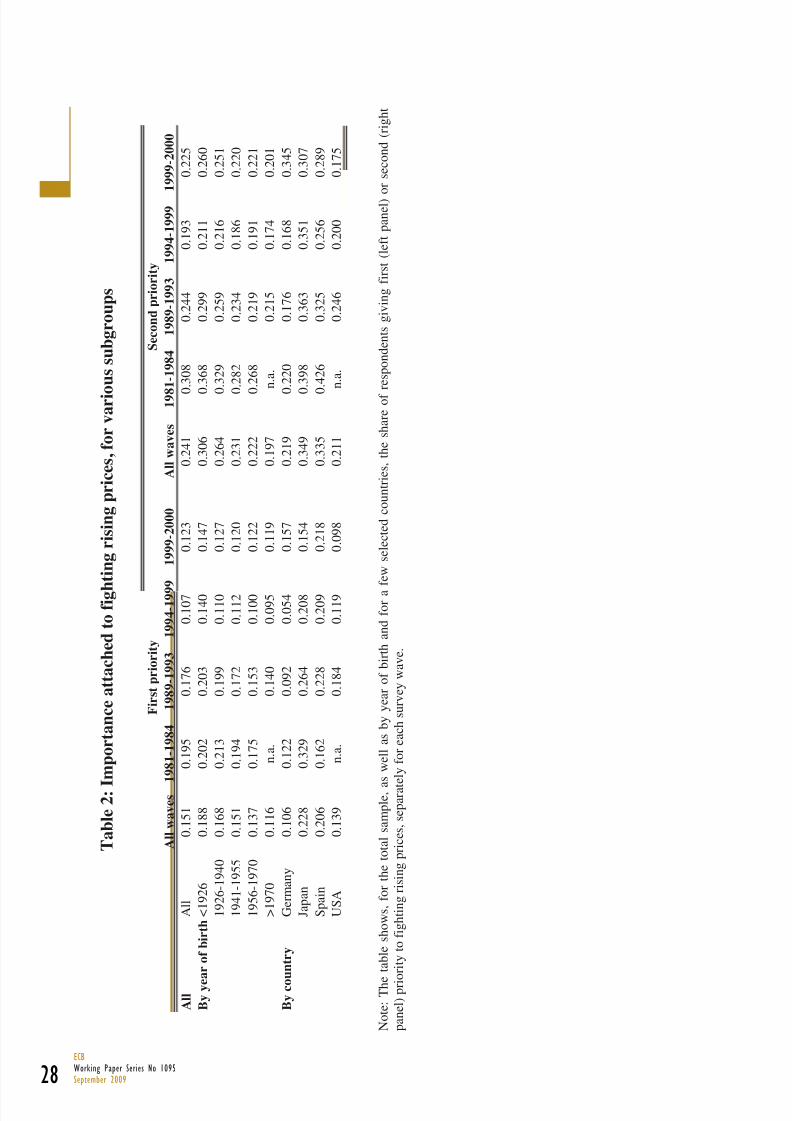
8/14/2019 Wo r k i n g Pa P e r
http://slidepdf.com/reader/full/wo-r-k-i-n-g-pa-p-e-r 29/42
28ECBWorking Paper Series No 1095September 2009
T a
b l e 2 : I
m p o r
t a n c e a
t t a c
h e
d t o f i g h
t i n g r
i s i n g p r
i c e s ,
f o r v a r i o
u s s u
b g r o u p s
A l l w a v e s
1 9 8 1 - 1 9 8 4
1 9 8 9 - 1 9 9 3
1 9 9 4 - 1 9 9
9
1 9 9 9 - 2 0 0 0
A l l w a v e s
1 9 8
1 - 1 9 8 4
1 9 8 9 - 1 9 9 3
1 9 9 4 - 1 9 9 9
1 9 9 9 - 2 0 0 0
A l l
A l l
0 . 1
5 1
0 . 1
9 5
0 . 1
7 6
0 . 1
0 7
0 . 1
2 3
0 . 2
4 1
0
. 3 0 8
0 . 2
4 4
0 . 1
9 3
0 . 2
2 5
B y y e
a r o f b i r t h < 1 9 2 6
0 . 1
8 8
0 . 2
0 2
0 . 2
0 3
0 . 1
4 0
0 . 1
4 7
0 . 3
0 6
0
. 3 6 8
0 . 2
9 9
0 . 2
1 1
0 . 2
6 0
1 9 2 6 - 1 9 4 0
0 . 1
6 8
0 . 2
1 3
0 . 1
9 9
0 . 1
1 0
0 . 1
2 7
0 . 2
6 4
0
. 3 2 9
0 . 2
5 9
0 . 2
1 6
0 . 2
5 1
1 9 4 1 - 1 9 5 5
0 . 1
5 1
0 . 1
9 4
0 . 1
7 2
0 . 1
1 2
0 . 1
2 0
0 . 2
3 1
0
. 2 8 2
0 . 2
3 4
0 . 1
8 6
0 . 2
2 0
1 9 5 6 - 1 9 7 0
0 . 1
3 7
0 . 1
7 5
0 . 1
5 3
0 . 1
0 0
0 . 1
2 2
0 . 2
2 2
0
. 2 6 8
0 . 2
1 9
0 . 1
9 1
0 . 2
2 1
> 1 9 7 0
0 . 1
1 6
n . a .
0 . 1
4 0
0 . 0
9 5
0 . 1
1 9
0 . 1
9 7
n . a .
0 . 2
1 5
0 . 1
7 4
0 . 2
0 1
B y c o
u n t r y
G e r m a n y
0 . 1
0 6
0 . 1
2 2
0 . 0
9 2
0 . 0
5 4
0 . 1
5 7
0 . 2
1 9
0
. 2 2 0
0 . 1
7 6
0 . 1
6 8
0 . 3
4 5
J a p a n
0 . 2
2 8
0 . 3
2 9
0 . 2
6 4
0 . 2
0 8
0 . 1
5 4
0 . 3
4 9
0
. 3 9 8
0 . 3
6 3
0 . 3
5 1
0 . 3
0 7
S p a i n
0 . 2
0 6
0 . 1
6 2
0 . 2
2 8
0 . 2
0 9
0 . 2
1 8
0 . 3
3 5
0
. 4 2 6
0 . 3
2 5
0 . 2
5 6
0 . 2
8 9
U S A
0 . 1
3 9
n . a .
0 . 1
8 4
0 . 1
1 9
0 . 0
9 8
0 . 2
1 1
n . a .
0 . 2
4 6
0 . 2
0 0
0 . 1
7 5
S e c o n d p r i o r i t y
F i r s t p r i o r i t y
N o t e : T h e
t a b l e s h o w s , f o r t h e t o t a l s a m p l e , a
s w e l l a s b y y e a r o f b i r t h a n d f o r a
f e w
s e l e c t e d c o u n t r i e s , t h e s h a r e o f
r e s p o n d e n t s g i v i n g f i r s t ( l e f t p a n e l ) o r s e c o n d ( r i g h t
p a n e l ) p r i o r i t y t o f i g h t i n g r i s i n g p r i c e s , s e p a r a t e l y f o r e a c h s u r v e y w a v e .
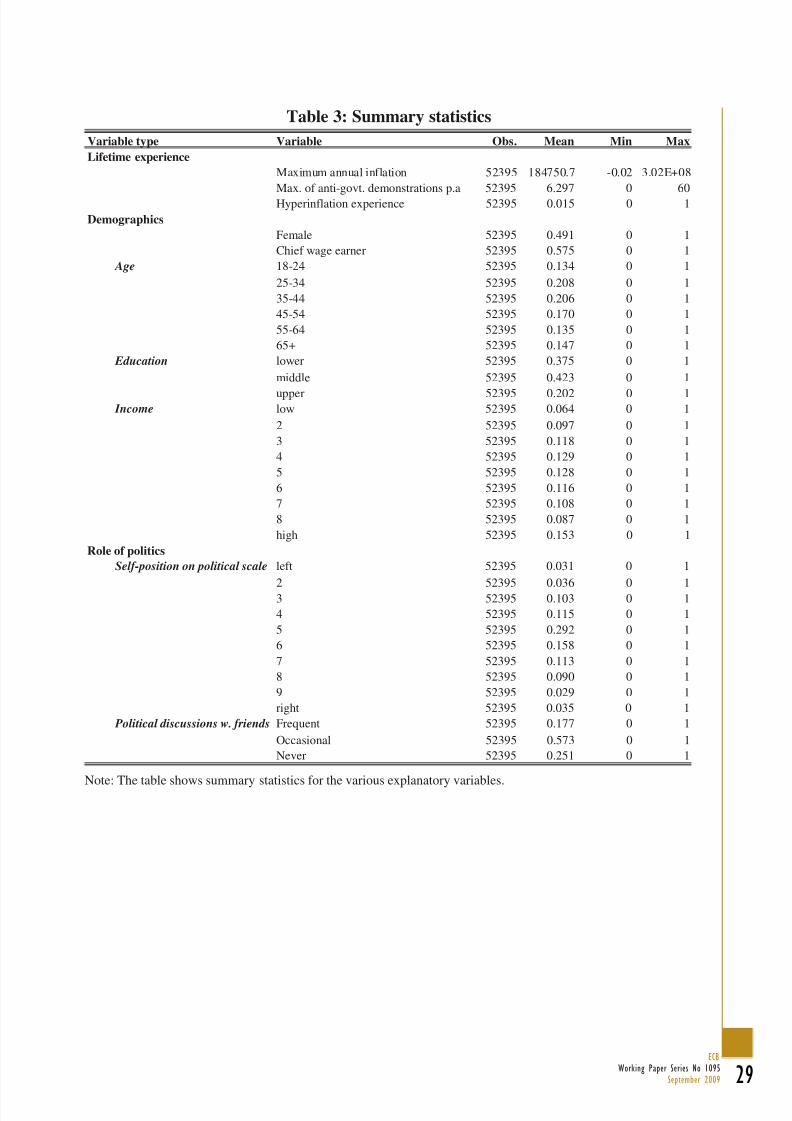
8/14/2019 Wo r k i n g Pa P e r
http://slidepdf.com/reader/full/wo-r-k-i-n-g-pa-p-e-r 30/42
29ECB
Working Paper Series No 1095September 2009
Table 3: Summary statistics
Variable type Variable Obs. Mean Min Max
Lifetime experience
Maximum annual inflation 52395 184750.7 -0.02 3.02E+08
Max. of anti-govt. demonstrations p.a 52395 6.297 0 60
Hyperinflation experience 52395 0.015 0 1
Demographics
Female 52395 0.491 0 1
Chief wage earner 52395 0.575 0 1
Age 18-24 52395 0.134 0 1
25-34 52395 0.208 0 1
35-44 52395 0.206 0 1
45-54 52395 0.170 0 1
55-64 52395 0.135 0 1
65+ 52395 0.147 0 1
Education lower 52395 0.375 0 1
middle 52395 0.423 0 1
upper 52395 0.202 0 1Income low 52395 0.064 0 1
2 52395 0.097 0 1
3 52395 0.118 0 1
4 52395 0.129 0 1
5 52395 0.128 0 1
6 52395 0.116 0 1
7 52395 0.108 0 1
8 52395 0.087 0 1
high 52395 0.153 0 1
Role of politics
Self-position on political scale left 52395 0.031 0 1
2 52395 0.036 0 13 52395 0.103 0 1
4 52395 0.115 0 1
5 52395 0.292 0 1
6 52395 0.158 0 1
7 52395 0.113 0 1
8 52395 0.090 0 1
9 52395 0.029 0 1
right 52395 0.035 0 1
Political discussions w. friends Frequent 52395 0.177 0 1
Occasional 52395 0.573 0 1
Never 52395 0.251 0 1
Note: The table shows summary statistics for the various explanatory variables.
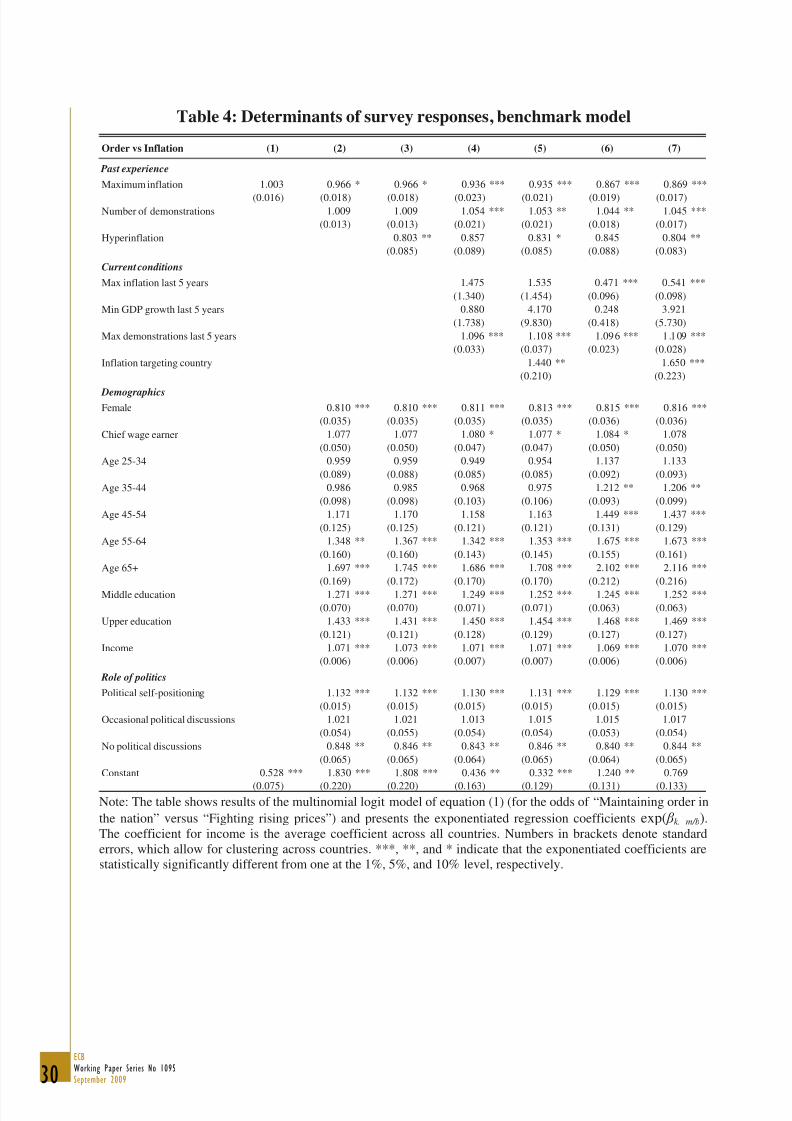
8/14/2019 Wo r k i n g Pa P e r
http://slidepdf.com/reader/full/wo-r-k-i-n-g-pa-p-e-r 31/42
30ECBWorking Paper Series No 1095September 2009
Table 4: Determinants of survey responses, benchmark model
Order vs Inflation
Past experience
1.003 0.966 * 0.966 * 0.936 *** 0.935 *** 0.867 *** 0.869 ***
(0.016) (0.018) (0.018) (0.023) (0.021) (0.019) (0.017)1.009 1.009 1.054 *** 1.053 ** 1.044 ** 1.045 ***
(0.013) (0.013) (0.021) (0.021) (0.018) (0.017)
0.803 ** 0.857 0.831 * 0.845 0.804 **
(0.085) (0.089) (0.085) (0.088) (0.083)
Current conditions
1.475 1.535 0.471 *** 0.541 ***
(1.340) (1.454) (0.096) (0.098)
0.880 4.170 0.248 3.921
(1.738) (9.830) (0.418) (5.730)
1.096 *** 1.108 *** 1.096 *** 1.109 ***
(0.033) (0.037) (0.023) (0.028)
1.440 ** 1.650 ***
(0.210) (0.223)
Demographics0.810 *** 0.810 *** 0.811 *** 0.813 *** 0.815 *** 0.816 ***
(0.035) (0.035) (0.035) (0.035) (0.036) (0.036)
1.077 1.077 1.080 * 1.077 * 1.084 * 1.078
(0.050) (0.050) (0.047) (0.047) (0.050) (0.050)
0.959 0.959 0.949 0.954 1.137 1.133
(0.089) (0.088) (0.085) (0.085) (0.092) (0.093)
0.986 0.985 0.968 0.975 1.212 ** 1.206 **
(0.098) (0.098) (0.103) (0.106) (0.093) (0.099)
1.171 1.170 1.158 1.163 1.449 *** 1.437 ***
(0.125) (0.125) (0.121) (0.121) (0.131) (0.129)
1.348 ** 1.367 *** 1.342 *** 1.353 *** 1.675 *** 1.673 ***
(0.160) (0.160) (0.143) (0.145) (0.155) (0.161)
1.697 *** 1.745 *** 1.686 *** 1.708 *** 2.102 *** 2.116 ***
(0.169) (0.172) (0.170) (0.170) (0.212) (0.216)
1.271 *** 1.271 *** 1.249 *** 1.252 *** 1.245 *** 1.252 ***
(0.070) (0.070) (0.071) (0.071) (0.063) (0.063)
1.433 *** 1.431 *** 1.450 *** 1.454 *** 1.468 *** 1.469 ***
(0.121) (0.121) (0.128) (0.129) (0.127) (0.127)
1.071 *** 1.073 *** 1.071 *** 1.071 *** 1.069 *** 1.070 ***
(0.006) (0.006) (0.007) (0.007) (0.006) (0.006)
Role of politics
1.132 *** 1.132 *** 1.130 *** 1.131 *** 1.129 *** 1.130 ***
(0.015) (0.015) (0.015) (0.015) (0.015) (0.015)
1.021 1.021 1.013 1.015 1.015 1.017
(0.054) (0.055) (0.054) (0.054) (0.053) (0.054)
0.848 ** 0.846 ** 0.843 ** 0.846 ** 0.840 ** 0.844 **
(0.065) (0.065) (0.064) (0.065) (0.064) (0.065)
0.528 *** 1.830 *** 1.808 *** 0.436 ** 0.332 *** 1.240 ** 0.769
(0.075) (0.220) (0.220) (0.163) (0.129) (0.131) (0.133)
Upper education
Political self-positioning
Income
Constant
No political discussions
Occasional political discussions
Age 45-54
Age 55-64
Age 65+
Middle education
Chief wage earner
Age 25-34
Age 35-44
Max demonstrations last 5 years
Inflation targeting country
Female
Number of demonstrations
Hyperinflation
Max inflation last 5 years
Min GDP growth last 5 years
(5) (6) (7)
Maximum inflation
(1) (2) (3) (4)
Note: The table shows results of the multinomial logit model of equation (1) (for the odds of “Maintaining order in
the nation” versus “Fighting rising prices”) and presents the exponentiated regression coefficients exp( k, m/b).The coefficient for income is the average coefficient across all countries. Numbers in brackets denote standard
errors, which allow for clustering across countries. ***, **, and * indicate that the exponentiated coefficients are
statistically significantly different from one at the 1%, 5%, and 10% level, respectively.
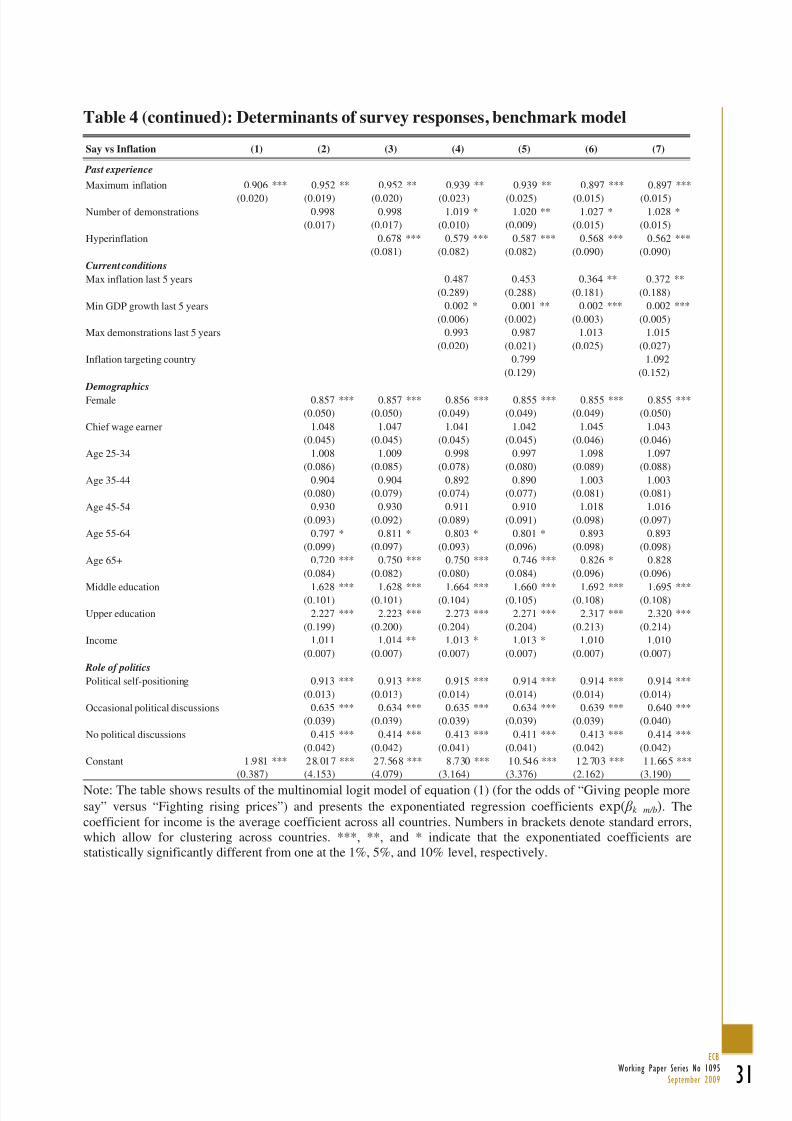
8/14/2019 Wo r k i n g Pa P e r
http://slidepdf.com/reader/full/wo-r-k-i-n-g-pa-p-e-r 32/42
31ECB
Working Paper Series No 1095September 2009
Table 4 (continued): Determinants of survey responses, benchmark model
Say vs Inflation
Past experience
0.906 *** 0.952 ** 0.952 ** 0.939 ** 0.939 ** 0.897 *** 0.897 ***
(0.020) (0.019) (0.020) (0.023) (0.025) (0.015) (0.015)0.998 0.998 1.019 * 1.020 ** 1.027 * 1.028 *
(0.017) (0.017) (0.010) (0.009) (0.015) (0.015)
0.678 *** 0.579 *** 0.587 *** 0.568 *** 0.562 ***
(0.081) (0.082) (0.082) (0.090) (0.090)
Current conditions
0.487 0.453 0.364 ** 0.372 **
(0.289) (0.288) (0.181) (0.188)
0.002 * 0.001 ** 0.002 *** 0.002 ***
(0.006) (0.002) (0.003) (0.005)
0.993 0.987 1.013 1.015
(0.020) (0.021) (0.025) (0.027)
0.799 1.092
(0.129) (0.152)
Demographics
0.857 *** 0.857 *** 0.856 *** 0.855 *** 0.855 *** 0.855 ***
(0.050) (0.050) (0.049) (0.049) (0.049) (0.050)
1.048 1.047 1.041 1.042 1.045 1.043
(0.045) (0.045) (0.045) (0.045) (0.046) (0.046)
1.008 1.009 0.998 0.997 1.098 1.097
(0.086) (0.085) (0.078) (0.080) (0.089) (0.088)
0.904 0.904 0.892 0.890 1.003 1.003
(0.080) (0.079) (0.074) (0.077) (0.081) (0.081)
0.930 0.930 0.911 0.910 1.018 1.016
(0.093) (0.092) (0.089) (0.091) (0.098) (0.097)
0.797 * 0.811 * 0.803 * 0.801 * 0.893 0.893
(0.099) (0.097) (0.093) (0.096) (0.098) (0.098)
0.720 *** 0.750 *** 0.750 *** 0.746 *** 0.826 * 0.828
(0.084) (0.082) (0.080) (0.084) (0.096) (0.096)
1.628 *** 1.628 *** 1.664 *** 1.660 *** 1.692 *** 1.695 ***(0.101) (0.101) (0.104) (0.105) (0.108) (0.108)
2.227 *** 2.223 *** 2.273 *** 2.271 *** 2.317 *** 2.320 ***
(0.199) (0.200) (0.204) (0.204) (0.213) (0.214)
1.011 1.014 ** 1.013 * 1.013 * 1.010 1.010
(0.007) (0.007) (0.007) (0.007) (0.007) (0.007)
Role of politics
0.913 *** 0.913 *** 0.915 *** 0.914 *** 0.914 *** 0.914 ***
(0.013) (0.013) (0.014) (0.014) (0.014) (0.014)
0.635 *** 0.634 *** 0.635 *** 0.634 *** 0.639 *** 0.640 ***
(0.039) (0.039) (0.039) (0.039) (0.039) (0.040)
0.415 *** 0.414 *** 0.413 *** 0.411 *** 0.413 *** 0.414 ***
(0.042) (0.042) (0.041) (0.041) (0.042) (0.042)
1.981 *** 28.017 *** 27.568 *** 8.730 *** 10.546 *** 12.703 *** 11.665 ***
(0.387) (4.153) (4.079) (3.164) (3.376) (2.162) (3.190)
Constant
Income
Political self-positioning
Occasional political discussions
No political discussions
Age 55-64
Age 65+
Middle education
Upper education
Chief wage earner
Age 25-34
Age 35-44
Age 45-54
Min GDP growth last 5 years
Max demonstrations last 5 years
Inflation targeting country
Female
Maximum inflation
Number of demonstrations
Hyperinflation
Max inflation last 5 years
(5) (6) (7)(1) (2) (3) (4)
Note: The table shows results of the multinomial logit model of equation (1) (for the odds of “Giving people more
say” versus “Fighting rising prices”) and presents the exponentiated regression coefficients exp( k m/b). The
coefficient for income is the average coefficient across all countries. Numbers in brackets denote standard errors,
which allow for clustering across countries. ***, **, and * indicate that the exponentiated coefficients are
statistically significantly different from one at the 1%, 5%, and 10% level, respectively.
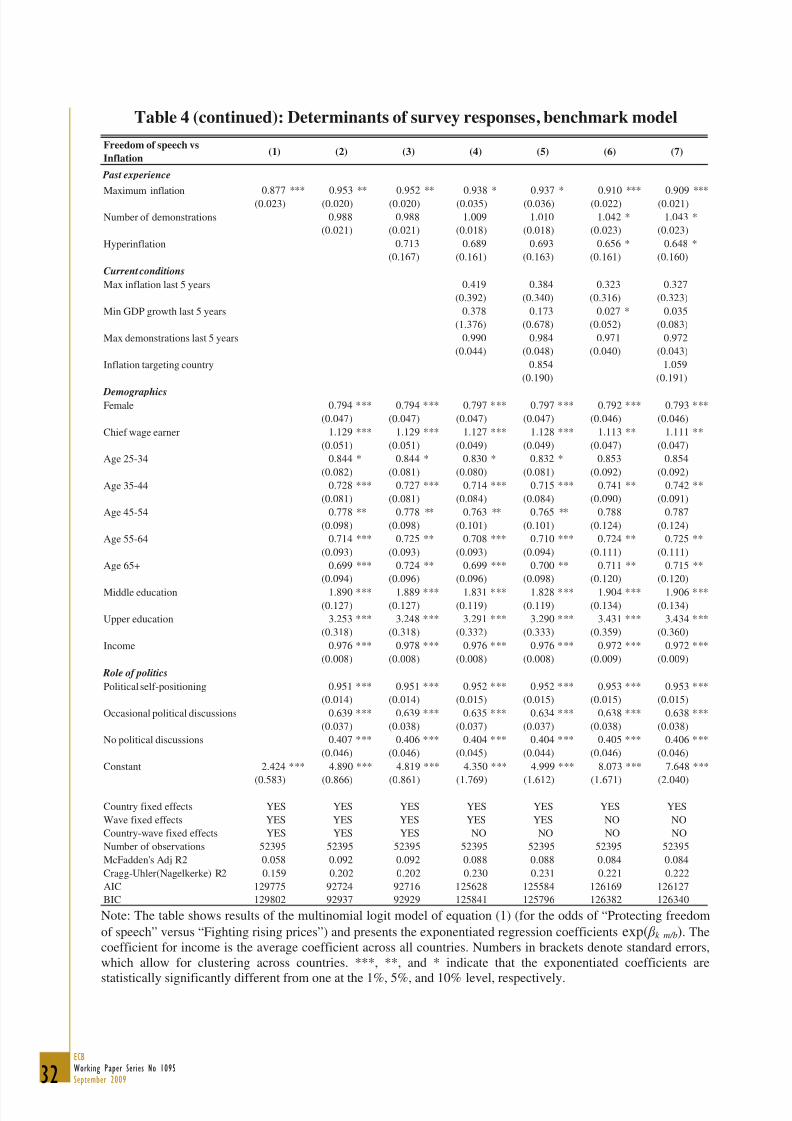
8/14/2019 Wo r k i n g Pa P e r
http://slidepdf.com/reader/full/wo-r-k-i-n-g-pa-p-e-r 33/42
32ECBWorking Paper Series No 1095September 2009
Table 4 (continued): Determinants of survey responses, benchmark model
Freedom of speech vs
Inflation
Past experience
0.877 *** 0.953 ** 0.952 ** 0.938 * 0.937 * 0.910 *** 0.909 ***
(0.023) (0.020) (0.020) (0.035) (0.036) (0.022) (0.021)
0.988 0.988 1.009 1.010 1.042 * 1.043 *
(0.021) (0.021) (0.018) (0.018) (0.023) (0.023)
0.713 0.689 0.693 0.656 * 0.648 *
(0.167) (0.161) (0.163) (0.161) (0.160)
Current conditions
0.419 0.384 0.323 0.327
(0.392) (0.340) (0.316) (0.323)
0.378 0.173 0.027 * 0.035
(1.376) (0.678) (0.052) (0.083)
0.990 0.984 0.971 0.972
(0.044) (0.048) (0.040) (0.043)
0.854 1.059
(0.190) (0.191)
Demographics0.794 *** 0.794 *** 0.797 *** 0.797 *** 0.792 *** 0.793 ***
(0.047) (0.047) (0.047) (0.047) (0.046) (0.046)
1.129 *** 1.129 *** 1.127 *** 1.128 *** 1.113 ** 1.111 **
(0.051) (0.051) (0.049) (0.049) (0.047) (0.047)
0.844 * 0.844 * 0.830 * 0.832 * 0.853 0.854
(0.082) (0.081) (0.080) (0.081) (0.092) (0.092)
0.728 *** 0.727 *** 0.714 *** 0.715 *** 0.741 ** 0.742 **
(0.081) (0.081) (0.084) (0.084) (0.090) (0.091)
0.778 ** 0.778 ** 0.763 ** 0.765 ** 0.788 0.787
(0.098) (0.098) (0.101) (0.101) (0.124) (0.124)
0.714 *** 0.725 ** 0.708 *** 0.710 *** 0.724 ** 0.725 **
(0.093) (0.093) (0.093) (0.094) (0.111) (0.111)
0.699 *** 0.724 ** 0.699 *** 0.700 ** 0.711 ** 0.715 **
(0.094) (0.096) (0.096) (0.098) (0.120) (0.120)
1.890 *** 1.889 *** 1.831 *** 1.828 *** 1.904 *** 1.906 ***
(0.127) (0.127) (0.119) (0.119) (0.134) (0.134)
3.253 *** 3.248 *** 3.291 *** 3.290 *** 3.431 *** 3.434 ***
(0.318) (0.318) (0.332) (0.333) (0.359) (0.360)
0.976 *** 0.978 *** 0.976 *** 0.976 *** 0.972 *** 0.972 ***
(0.008) (0.008) (0.008) (0.008) (0.009) (0.009)
Role of politics
0.951 *** 0.951 *** 0.952 *** 0.952 *** 0.953 *** 0.953 ***
(0.014) (0.014) (0.015) (0.015) (0.015) (0.015)
0.639 *** 0.639 *** 0.635 *** 0.634 *** 0.638 *** 0.638 ***
(0.037) (0.038) (0.037) (0.037) (0.038) (0.038)
0.407 *** 0.406 *** 0.404 *** 0.404 *** 0.405 *** 0.406 ***
(0.046) (0.046) (0.045) (0.044) (0.046) (0.046)
2.424 *** 4.890 *** 4.819 *** 4.350 *** 4.999 *** 8.073 *** 7.648 ***
(0.583) (0.866) (0.861) (1.769) (1.612) (1.671) (2.040)
Country fixed effects YES YES YES YES YES YES YES
Wave fixed effects YES YES YES YES YES NO NO
Country-wave fixed effects YES YES YES NO NO NO NO
Number of observations 52395 52395 52395 52395 52395 52395 52395
McFadden's Adj R2 0.058 0.092 0.092 0.088 0.088 0.084 0.084
Cragg-Uhler(Nagelkerke) R2 0.159 0.202 0.202 0.230 0.231 0.221 0.222
AIC 129775 92724 92716 125628 125584 126169 126127
BIC 129802 92937 92929 125841 125796 126382 126340
No political discussions
Constant
Upper education
Income
Political self-positioning
Occasional political discussions
Age 45-54
Age 55-64
Age 65+
Middle education
Female
Chief wage earner
Age 25-34
Age 35-44
Max inflation last 5 years
Min GDP growth last 5 years
Max demonstrations last 5 years
Inflation targeting country
Maximum inflation
Number of demonstrations
Hyperinflation
(1) (2) (3) (4) (5) (6) (7)
Note: The table shows results of the multinomial logit model of equation (1) (for the odds of “Protecting freedom
of speech” versus “Fighting rising prices”) and presents the exponentiated regression coefficients exp( k m/b). The
coefficient for income is the average coefficient across all countries. Numbers in brackets denote standard errors,
which allow for clustering across countries. ***, **, and * indicate that the exponentiated coefficients are
statistically significantly different from one at the 1%, 5%, and 10% level, respectively.
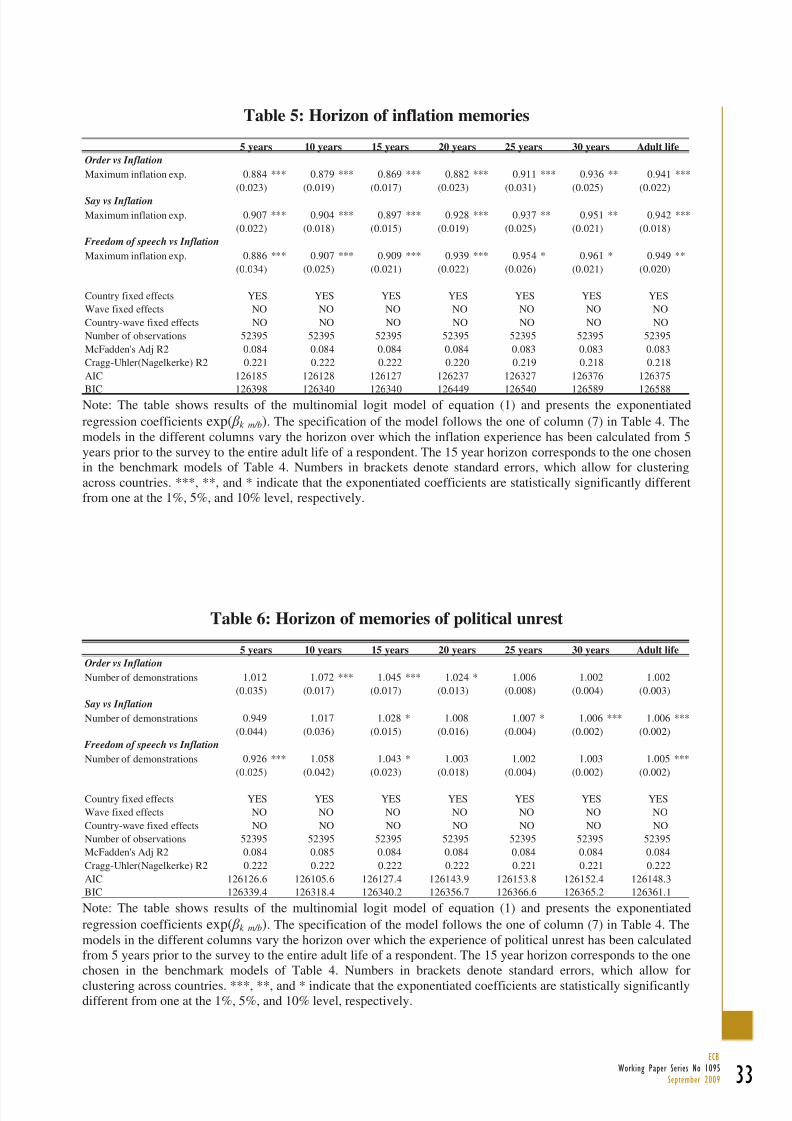
8/14/2019 Wo r k i n g Pa P e r
http://slidepdf.com/reader/full/wo-r-k-i-n-g-pa-p-e-r 34/42
33ECB
Working Paper Series No 1095September 2009
Table 5: Horizon of inflation memories
Order vs Inflation
0.884 *** 0.879 *** 0.869 *** 0.882 *** 0.911 *** 0.936 ** 0.941 ***
(0.023) (0.019) (0.017) (0.023) (0.031) (0.025) (0.022)
Say vs Inflation
0.907 *** 0.904 *** 0.897 *** 0.928 *** 0.937 ** 0.951 ** 0.942 ***
(0.022) (0.018) (0.015) (0.019) (0.025) (0.021) (0.018)
Freedom of speech vs Inflation
0.886 *** 0.907 *** 0.909 *** 0.939 *** 0.954 * 0.961 * 0.949 **
(0.034) (0.025) (0.021) (0.022) (0.026) (0.021) (0.020)
Country fixed effects YES YES YES YES YES YES YES
Wave fixed effects NO NO NO NO NO NO NO
Country-wave fixed effects NO NO NO NO NO NO NO
Number of observations 52395 52395 52395 52395 52395 52395 52395
McFadden's Adj R2 0.084 0.084 0.084 0.084 0.083 0.083 0.083
Cragg-Uhler(Nagelkerke) R2 0.221 0.222 0.222 0.220 0.219 0.218 0.218
AIC 126185 126128 126127 126237 126327 126376 126375
BIC 126398 126340 126340 126449 126540 126589 126588
25 years 30 years Adult life5 years 10 years 15 years 20 years
Maximum inflation exp.
Maximum inflation exp.
Maximum inflation exp.
Note: The table shows results of the multinomial logit model of equation (1) and presents the exponentiated
regression coefficients exp( k m/b). The specification of the model follows the one of column (7) in Table 4. The
models in the different columns vary the horizon over which the inflation experience has been calculated from 5
years prior to the survey to the entire adult life of a respondent. The 15 year horizon corresponds to the one chosenin the benchmark models of Table 4. Numbers in brackets denote standard errors, which allow for clustering
across countries. ***, **, and * indicate that the exponentiated coefficients are statistically significantly different
from one at the 1%, 5%, and 10% level, respectively.
Table 6: Horizon of memories of political unrest
Order vs Inflation
1.012 1.072 *** 1.045 *** 1.024 * 1.006 1.002 1.002
(0.035) (0.017) (0.017) (0.013) (0.008) (0.004) (0.003)
Say vs Inflation
0.949 1.017 1.028 * 1.008 1.007 * 1.006 *** 1.006 ***
(0.044) (0.036) (0.015) (0.016) (0.004) (0.002) (0.002)
Freedom of speech vs Inflation
0.926 *** 1.058 1.043 * 1.003 1.002 1.003 1.005 ***
(0.025) (0.042) (0.023) (0.018) (0.004) (0.002) (0.002)
Country fixed effects YES YES YES YES YES YES YES
Wave fixed effects NO NO NO NO NO NO NO
Country-wave fixed effects NO NO NO NO NO NO NO
Number of observations 52395 52395 52395 52395 52395 52395 52395
McFadden's Adj R2 0.084 0.085 0.084 0.084 0.084 0.084 0.084
Cragg-Uhler(Nagelkerke) R2 0.222 0.222 0.222 0.222 0.221 0.221 0.222
AIC 126126.6 126105.6 126127.4 126143.9 126153.8 126152.4 126148.3
BIC 126339.4 126318.4 126340.2 126356.7 126366.6 126365.2 126361.1
25 years 30 years Adult life5 years 10 years 15 years 20 years
Number of demonstrations
Number of demonstrations
Number of demonstrations
Note: The table shows results of the multinomial logit model of equation (1) and presents the exponentiated
regression coefficients exp( k m/b). The specification of the model follows the one of column (7) in Table 4. The
models in the different columns vary the horizon over which the experience of political unrest has been calculated
from 5 years prior to the survey to the entire adult life of a respondent. The 15 year horizon corresponds to the one
chosen in the benchmark models of Table 4. Numbers in brackets denote standard errors, which allow for
clustering across countries. ***, **, and * indicate that the exponentiated coefficients are statistically significantlydifferent from one at the 1%, 5%, and 10% level, respectively.
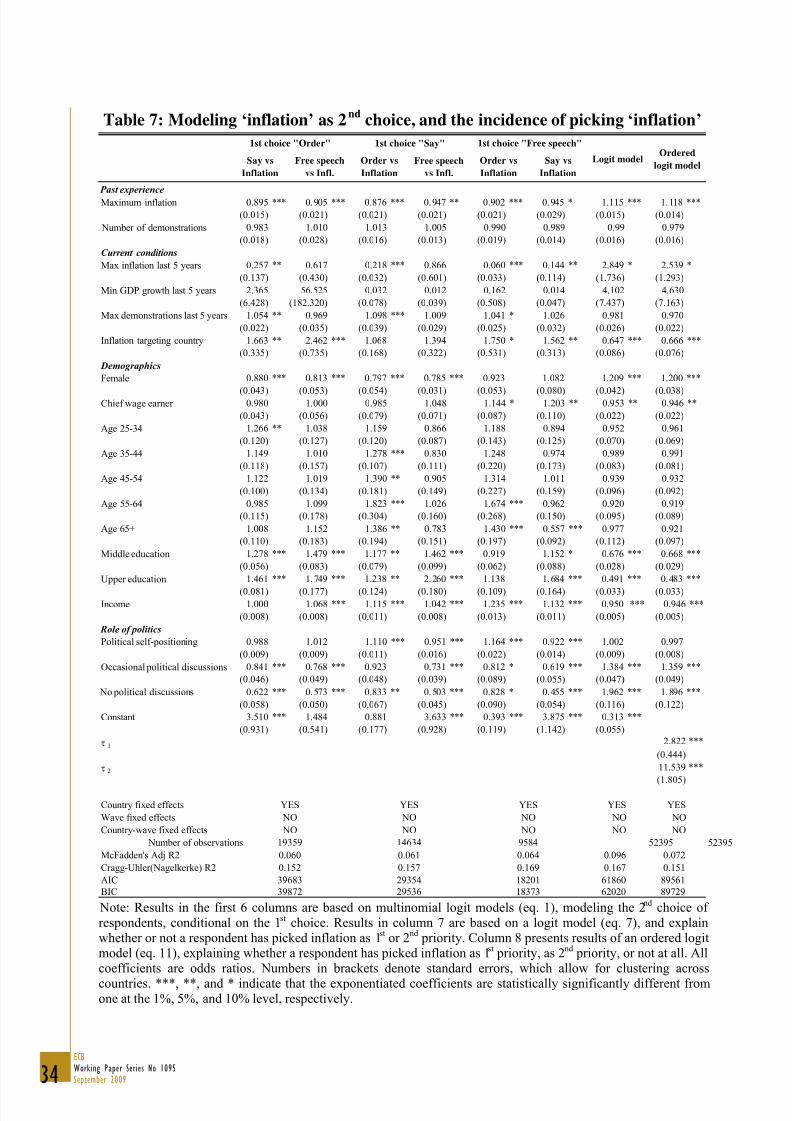
8/14/2019 Wo r k i n g Pa P e r
http://slidepdf.com/reader/full/wo-r-k-i-n-g-pa-p-e-r 35/42
34ECBWorking Paper Series No 1095September 2009
Table 7: Modeling ‘inflation’ as 2nd
choice, and the incidence of picking ‘inflation’
Past experience
0.895 *** 0.905 *** 0.876 *** 0.947 ** 0.902 *** 0.945 * 1.115 *** 1.118 ***
(0.015) (0.021) (0.021) (0.021) (0.021) (0.029) (0.015) (0.014)
0.983 1.010 1.013 1.005 0.990 0.989 0.99 0.979
(0.018) (0.028) (0.016) (0.013) (0.019) (0.014) (0.016) (0.016)
Current conditions
0.257 ** 0.617 0.218 *** 0.866 0.060 *** 0.144 ** 2.849 * 2.539 *
(0.137) (0.430) (0.032) (0.601) (0.033) (0.114) (1.736) (1.293)
2.365 56.525 0.032 0.012 0.162 0.014 4.102 4.630
(6.428) (182.320) (0.078) (0.039) (0.508) (0.047) (7.437) (7.163)
1.054 ** 0.969 1.098 *** 1.009 1.041 * 1.026 0.981 0.970
(0.022) (0.035) (0.039) (0.029) (0.025) (0.032) (0.026) (0.022)
1.663 ** 2.462 *** 1.068 1.394 1.750 * 1.562 ** 0.647 *** 0.666 ***
(0.335) (0.735) (0.168) (0.322) (0.531) (0.313) (0.086) (0.076)
Demographics
0.880 *** 0.813 *** 0.797 *** 0.785 *** 0.923 1.082 1.209 *** 1.200 ***
(0.043) (0.053) (0.054) (0.031) (0.053) (0.080) (0.042) (0.038)0.980 1.000 0.985 1.048 1.144 * 1.203 ** 0.953 ** 0.946 **
(0.043) (0.056) (0.079) (0.071) (0.087) (0.110) (0.022) (0.022)
1.266 ** 1.038 1.159 0.866 1.188 0.894 0.952 0.961
(0.120) (0.127) (0.120) (0.087) (0.143) (0.125) (0.070) (0.069)
1.149 1.010 1.278 *** 0.830 1.248 0.974 0.989 0.991
(0.118) (0.157) (0.107) (0.111) (0.220) (0.173) (0.083) (0.081)
1.122 1.019 1.390 ** 0.905 1.314 1.011 0.939 0.932
(0.100) (0.134) (0.181) (0.149) (0.227) (0.159) (0.096) (0.092)
0.985 1.099 1.823 *** 1.026 1.674 *** 0.962 0.920 0.919
(0.115) (0.178) (0.304) (0.160) (0.268) (0.150) (0.095) (0.089)
1.008 1.152 1.386 ** 0.783 1.430 *** 0.557 *** 0.977 0.921
(0.110) (0.183) (0.194) (0.151) (0.197) (0.092) (0.112) (0.097)
1.278 *** 1.479 *** 1.177 ** 1.462 *** 0.919 1.152 * 0.676 *** 0.668 ***
(0.056) (0.083) (0.079) (0.099) (0.062) (0.088) (0.028) (0.029)
1.461 *** 1.749 *** 1.238 ** 2.260 *** 1.138 1.684 *** 0.491 *** 0.483 ***
(0.081) (0.177) (0.124) (0.180) (0.109) (0.164) (0.033) (0.033)1.000 1.068 *** 1.115 *** 1.042 *** 1.235 *** 1.132 *** 0.950 *** 0.946 ***
(0.008) (0.008) (0.011) (0.008) (0.013) (0.011) (0.005) (0.005)
Role of politics
0.988 1.012 1.110 *** 0.951 *** 1.164 *** 0.922 *** 1.002 0.997
(0.009) (0.009) (0.011) (0.016) (0.022) (0.014) (0.009) (0.008)
0.841 *** 0.768 *** 0.923 0.731 *** 0.812 * 0.619 *** 1.384 *** 1.359 ***
(0.046) (0.049) (0.048) (0.039) (0.089) (0.055) (0.047) (0.049)
0.622 *** 0.573 *** 0.833 ** 0.503 *** 0.828 * 0.455 *** 1.962 *** 1.896 ***
(0.058) (0.050) (0.067) (0.045) (0.090) (0.054) (0.116) (0.122)
3.510 *** 1.484 0.881 3.633 *** 0.393 *** 3.875 *** 0.313 ***
(0.931) (0.541) (0.177) (0.928) (0.119) (1.142) (0.055)
2.822 ***
(0.444)
11.539 ***
(1.805)
Country fixed effects YES YES
Wave fixed effects NO NO
Country-wave fixed effects NO NO
Number of observations 52395 52395
McFadden's Adj R2 0.096 0.072
Cragg-Uhler(Nagelkerke) R2 0.167 0.151
AIC 61860 89561
BIC 62020 89729
Ordered
logit model
0.064
0.169
18201
Logit model
18373
YES
NO
NO
958414634
NO
NO
YES
29536
29354
0.157
0.0610.060
0.152
39683
39872
YES
NO
NO
19359
1st choice "Order" 1st choice "Say" 1st choice "Free speech"
Order vs
Inflation
Say vs
Inflation
Say vs
Inflation
Free speech
vs Infl.
Order vs
Inflation
Free speech
vs Infl.
τ 2
Age 65+
Middle education
Upper education
Income
Political self-positioning
Occasional political discussions
Age 45-54
Age 55-64
τ 1
Female
Chief wage earner
Age 25-34
Age 35-44
No political discussions
Constant
Max demonstrations last 5 years
Inflation targeting country
Maximum inflation
Number of demonstrations
Max inflation last 5 years
Min GDP growth last 5 years
Note: Results in the first 6 columns are based on multinomial logit models (eq. 1), modeling the 2nd
choice of respondents, conditional on the 1st choice. Results in column 7 are based on a logit model (eq. 7), and explainwhether or not a respondent has picked inflation as 1
stor 2
ndpriority. Column 8 presents results of an ordered logit
model (eq. 11), explaining whether a respondent has picked inflation as 1st priority, as 2nd priority, or not at all. Allcoefficients are odds ratios. Numbers in brackets denote standard errors, which allow for clustering across
countries. ***, **, and * indicate that the exponentiated coefficients are statistically significantly different fromone at the 1%, 5%, and 10% level, respectively.
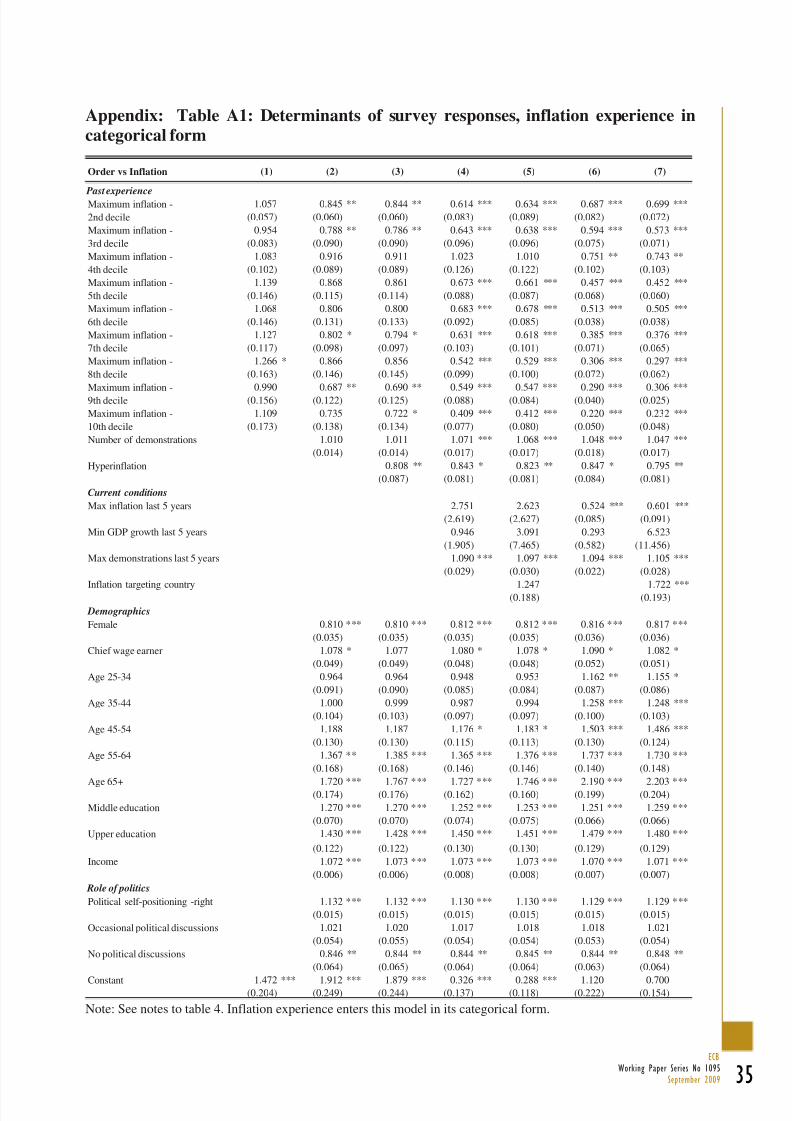
8/14/2019 Wo r k i n g Pa P e r
http://slidepdf.com/reader/full/wo-r-k-i-n-g-pa-p-e-r 36/42
35ECB
Working Paper Series No 1095September 2009
Appendix: Table A1: Determinants of survey responses, inflation experience in
categorical form
Order vs Inflation
Past experience
1.057 0.845 ** 0.844 ** 0.614 *** 0.634 *** 0.687 *** 0.699 ***
(0.057) (0.060) (0.060) (0.083) (0.089) (0.082) (0.072)
0.954 0.788 ** 0.786 ** 0.643 *** 0.638 *** 0.594 *** 0.573 ***
(0.083) (0.090) (0.090) (0.096) (0.096) (0.075) (0.071)
1.083 0.916 0.911 1.023 1.010 0.751 ** 0.743 **
(0.102) (0.089) (0.089) (0.126) (0.122) (0.102) (0.103)
1.139 0.868 0.861 0.673 *** 0.661 *** 0.457 *** 0.452 ***
(0.146) (0.115) (0.114) (0.088) (0.087) (0.068) (0.060)
1.068 0.806 0.800 0.683 *** 0.678 *** 0.513 *** 0.505 ***
(0.146) (0.131) (0.133) (0.092) (0.085) (0.038) (0.038)
1.127 0.802 * 0.794 * 0.631 *** 0.618 *** 0.385 *** 0.376 ***
(0.117) (0.098) (0.097) (0.103) (0.101) (0.071) (0.065)
1.266 * 0.866 0.856 0.542 *** 0.529 *** 0.306 *** 0.297 ***
(0.163) (0.146) (0.145) (0.099) (0.100) (0.072) (0.062)
0.990 0.687 ** 0.690 ** 0.549 *** 0.547 *** 0.290 *** 0.306 ***
(0.156) (0.122) (0.125) (0.088) (0.084) (0.040) (0.025)
1.109 0.735 0.722 * 0.409 *** 0.412 *** 0.220 *** 0.232 ***
(0.173) (0.138) (0.134) (0.077) (0.080) (0.050) (0.048)
1.010 1.011 1.071 *** 1.068 *** 1.048 *** 1.047 ***
(0.014) (0.014) (0.017) (0.017) (0.018) (0.017)
0.808 ** 0.843 * 0.823 ** 0.847 * 0.795 **
(0.087) (0.081) (0.081) (0.084) (0.081)
Current conditions
2.751 2.623 0.524 *** 0.601 ***
(2.619) (2.627) (0.085) (0.091)
0.946 3.091 0.293 6.523
(1.905) (7.465) (0.582) (11.456)
1.090 *** 1.097 *** 1.094 *** 1.105 ***
(0.029) (0.030) (0.022) (0.028)
1.247 1.722 ***(0.188) (0.193)
Demographics
0.810 *** 0.810 *** 0.812 *** 0.812 *** 0.816 *** 0.817 ***
(0.035) (0.035) (0.035) (0.035) (0.036) (0.036)
1.078 * 1.077 1.080 * 1.078 * 1.090 * 1.082 *
(0.049) (0.049) (0.048) (0.048) (0.052) (0.051)
0.964 0.964 0.948 0.953 1.162 ** 1.155 *
(0.091) (0.090) (0.085) (0.084) (0.087) (0.086)
1.000 0.999 0.987 0.994 1.258 *** 1.248 ***
(0.104) (0.103) (0.097) (0.097) (0.100) (0.103)
1.188 1.187 1.176 * 1.183 * 1.503 *** 1.486 ***
(0.130) (0.130) (0.115) (0.113) (0.130) (0.124)
1.367 ** 1.385 *** 1.365 *** 1.376 *** 1.737 *** 1.730 ***
(0.168) (0.168) (0.146) (0.146) (0.140) (0.148)
1.720 *** 1.767 *** 1.727 *** 1.746 *** 2.190 *** 2.203 ***(0.174) (0.176) (0.162) (0.160) (0.199) (0.204)
1.270 *** 1.270 *** 1.252 *** 1.253 *** 1.251 *** 1.259 ***
(0.070) (0.070) (0.074) (0.075) (0.066) (0.066)
1.430 *** 1.428 *** 1.450 *** 1.451 *** 1.479 *** 1.480 ***
(0.122) (0.122) (0.130) (0.130) (0.129) (0.129)
1.072 *** 1.073 *** 1.073 *** 1.073 *** 1.070 *** 1.071 ***
(0.006) (0.006) (0.008) (0.008) (0.007) (0.007)
Role of politics
Political self-positioning -right 1.132 *** 1.132 *** 1.130 *** 1.130 *** 1.129 *** 1.129 ***
(0.015) (0.015) (0.015) (0.015) (0.015) (0.015)
1.021 1.020 1.017 1.018 1.018 1.021
(0.054) (0.055) (0.054) (0.054) (0.053) (0.054)
0.846 ** 0.844 ** 0.844 ** 0.845 ** 0.844 ** 0.848 **
(0.064) (0.065) (0.064) (0.064) (0.063) (0.064)
1.472 *** 1.912 *** 1.879 *** 0.326 *** 0.288 *** 1.120 0.700(0.204) (0.249) (0.244) (0.137) (0.118) (0.222) (0.154)
(5) (6) (7)(1) (2) (3) (4)
Income
Occasional political discussions
No political discussions
Constant
Age 55-64
Age 65+
Middle education
Upper education
Chief wage earner
Age 25-34
Age 35-44
Age 45-54
Min GDP growth last 5 years
Max demonstrations last 5 years
Inflation targeting country
Female
Maximum inflation -
10th decile
Number of demonstrations
Hyperinflation
Max inflation last 5 years
Maximum inflation -
6th decile
Maximum inflation -
7th decile
Maximum inflation -
8th decile
Maximum inflation -9th decile
Maximum inflation -
2nd decile
Maximum inflation -
3rd decile
Maximum inflation -
4th decile
Maximum inflation -
5th decile
Note: See notes to table 4. Inflation experience enters this model in its categorical form.
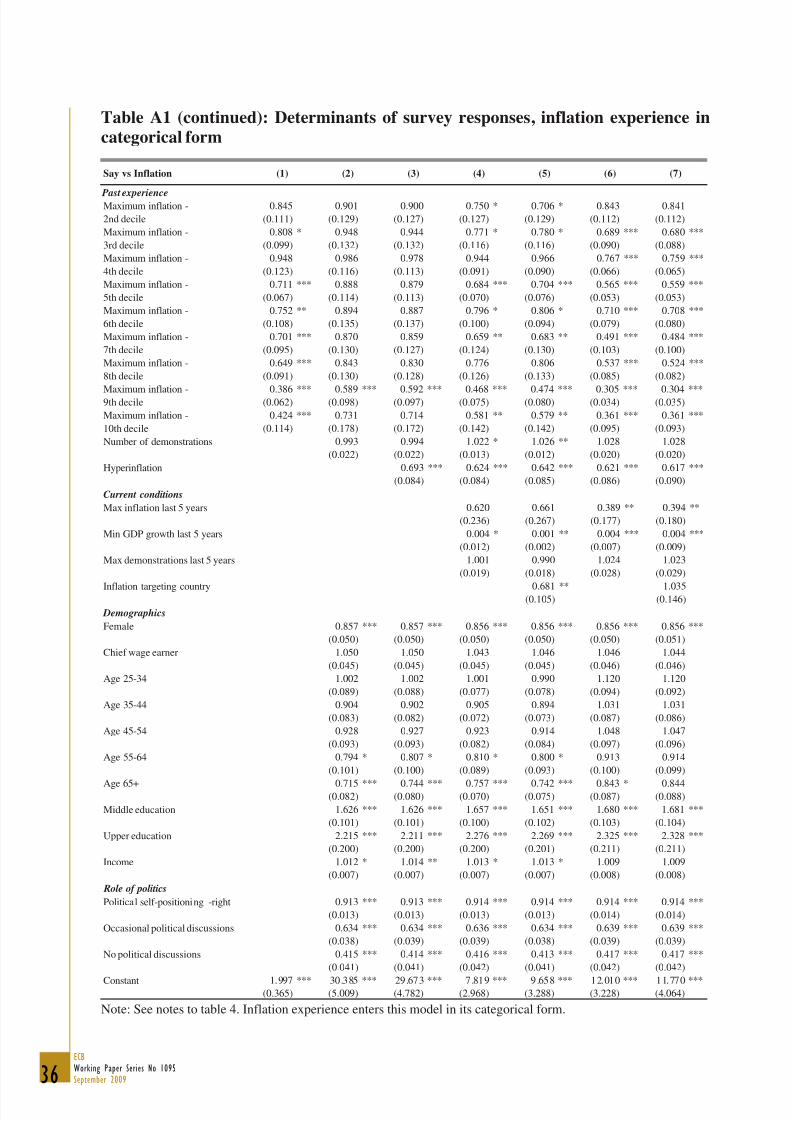
8/14/2019 Wo r k i n g Pa P e r
http://slidepdf.com/reader/full/wo-r-k-i-n-g-pa-p-e-r 37/42
36ECBWorking Paper Series No 1095September 2009
Table A1 (continued): Determinants of survey responses, inflation experience in
categorical form
Say vs Inflation
Past experience0.845 0.901 0.900 0.750 * 0.706 * 0.843 0.841
(0.111) (0.129) (0.127) (0.127) (0.129) (0.112) (0.112)
0.808 * 0.948 0.944 0.771 * 0.780 * 0.689 *** 0.680 ***
(0.099) (0.132) (0.132) (0.116) (0.116) (0.090) (0.088)
0.948 0.986 0.978 0.944 0.966 0.767 *** 0.759 ***
(0.123) (0.116) (0.113) (0.091) (0.090) (0.066) (0.065)
0.711 *** 0.888 0.879 0.684 *** 0.704 *** 0.565 *** 0.559 ***
(0.067) (0.114) (0.113) (0.070) (0.076) (0.053) (0.053)
0.752 ** 0.894 0.887 0.796 * 0.806 * 0.710 *** 0.708 ***
(0.108) (0.135) (0.137) (0.100) (0.094) (0.079) (0.080)
0.701 *** 0.870 0.859 0.659 ** 0.683 ** 0.491 *** 0.484 ***
(0.095) (0.130) (0.127) (0.124) (0.130) (0.103) (0.100)
0.649 *** 0.843 0.830 0.776 0.806 0.537 *** 0.524 ***
(0.091) (0.130) (0.128) (0.126) (0.133) (0.085) (0.082)
0.386 *** 0.589 *** 0.592 *** 0.468 *** 0.474 *** 0.305 *** 0.304 ***(0.062) (0.098) (0.097) (0.075) (0.080) (0.034) (0.035)
0.424 *** 0.731 0.714 0.581 ** 0.579 ** 0.361 *** 0.361 ***
(0.114) (0.178) (0.172) (0.142) (0.142) (0.095) (0.093)
0.993 0.994 1.022 * 1.026 ** 1.028 1.028
(0.022) (0.022) (0.013) (0.012) (0.020) (0.020)
0.693 *** 0.624 *** 0.642 *** 0.621 *** 0.617 ***
(0.084) (0.084) (0.085) (0.086) (0.090)
Current conditions
0.620 0.661 0.389 ** 0.394 **
(0.236) (0.267) (0.177) (0.180)
0.004 * 0.001 ** 0.004 *** 0.004 ***
(0.012) (0.002) (0.007) (0.009)
1.001 0.990 1.024 1.023
(0.019) (0.018) (0.028) (0.029)
0.681 ** 1.035(0.105) (0.146)
Demographics
0.857 *** 0.857 *** 0.856 *** 0.856 *** 0.856 *** 0.856 ***
(0.050) (0.050) (0.050) (0.050) (0.050) (0.051)
1.050 1.050 1.043 1.046 1.046 1.044
(0.045) (0.045) (0.045) (0.045) (0.046) (0.046)
1.002 1.002 1.001 0.990 1.120 1.120
(0.089) (0.088) (0.077) (0.078) (0.094) (0.092)
0.904 0.902 0.905 0.894 1.031 1.031
(0.083) (0.082) (0.072) (0.073) (0.087) (0.086)
0.928 0.927 0.923 0.914 1.048 1.047
(0.093) (0.093) (0.082) (0.084) (0.097) (0.096)
0.794 * 0.807 * 0.810 * 0.800 * 0.913 0.914
(0.101) (0.100) (0.089) (0.093) (0.100) (0.099)
0.715 *** 0.744 *** 0.757 *** 0.742 *** 0.843 * 0.844(0.082) (0.080) (0.070) (0.075) (0.087) (0.088)
1.626 *** 1.626 *** 1.657 *** 1.651 *** 1.680 *** 1.681 ***
(0.101) (0.101) (0.100) (0.102) (0.103) (0.104)
2.215 *** 2.211 *** 2.276 *** 2.269 *** 2.325 *** 2.328 ***
(0.200) (0.200) (0.200) (0.201) (0.211) (0.211)
1.012 * 1.014 ** 1.013 * 1.013 * 1.009 1.009
(0.007) (0.007) (0.007) (0.007) (0.008) (0.008)
Role of politics
Political self-positioning -right 0.913 *** 0.913 *** 0.914 *** 0.914 *** 0.914 *** 0.914 ***
(0.013) (0.013) (0.013) (0.013) (0.014) (0.014)
0.634 *** 0.634 *** 0.636 *** 0.634 *** 0.639 *** 0.639 ***
(0.038) (0.039) (0.039) (0.038) (0.039) (0.039)
0.415 *** 0.414 *** 0.416 *** 0.413 *** 0.417 *** 0.417 ***
(0.041) (0.041) (0.042) (0.041) (0.042) (0.042)
1.997 *** 30.385 *** 29.673 *** 7.819 *** 9.658 *** 12.010 *** 11.770 ***(0.365) (5.009) (4.782) (2.968) (3.288) (3.228) (4.064)
(1) (2) (3) (4) (5) (6) (7)
Income
Occasional political discussions
No political discussions
Constant
Age 55-64
Age 65+
Middle education
Upper education
Chief wage earner
Age 25-34
Age 35-44
Age 45-54
Min GDP growth last 5 years
Max demonstrations last 5 years
Inflation targeting country
Female
Maximum inflation -
10th decile
Number of demonstrations
Hyperinflation
Max inflation last 5 years
Maximum inflation -
6th decile
Maximum inflation -
7th decile
Maximum inflation -
8th decile
Maximum inflation -9th decile
Maximum inflation -
2nd decile
Maximum inflation -
3rd decile
Maximum inflation -
4th decile
Maximum inflation -
5th decile
Note: See notes to table 4. Inflation experience enters this model in its categorical form.
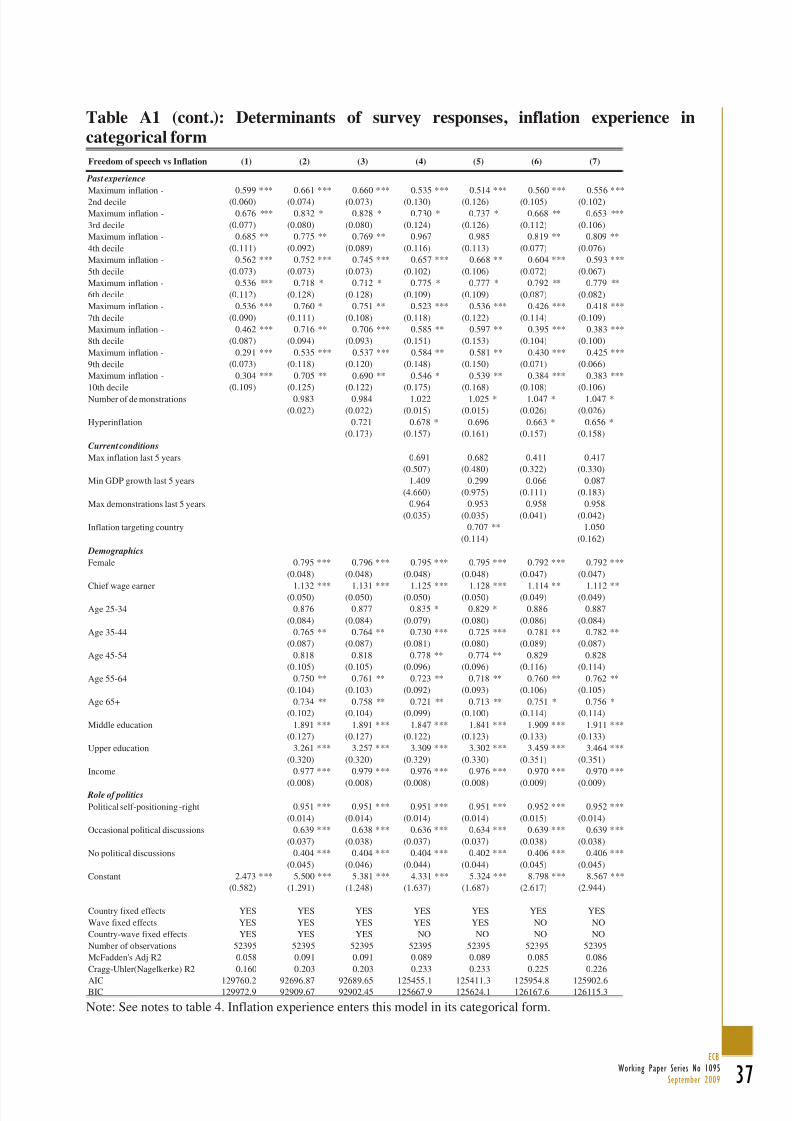
8/14/2019 Wo r k i n g Pa P e r
http://slidepdf.com/reader/full/wo-r-k-i-n-g-pa-p-e-r 38/42
37ECB
Working Paper Series No 1095September 2009
Table A1 (cont.): Determinants of survey responses, inflation experience in
categorical form
Freedom of speech vs Inflation
Past experience
0.599 *** 0.661 *** 0.660 *** 0.535 *** 0.514 *** 0.560 *** 0.556 ***
(0.060) (0.074) (0.073) (0.130) (0.126) (0.105) (0.102)
0.676 *** 0.832 * 0.828 * 0.730 * 0.737 * 0.668 ** 0.653 ***
(0.077) (0.080) (0.080) (0.124) (0.126) (0.112) (0.106)
0.685 ** 0.775 ** 0.769 ** 0.967 0.985 0.819 ** 0.809 **
(0.111) (0.092) (0.089) (0.116) (0.113) (0.077) (0.076)
0.562 *** 0.752 *** 0.745 *** 0.657 *** 0.668 ** 0.604 *** 0.593 ***
(0.073) (0.073) (0.073) (0.102) (0.106) (0.072) (0.067)
0.536 *** 0.718 * 0.712 * 0.775 * 0.777 * 0.792 ** 0.779 **
(0.112) (0.128) (0.128) (0.109) (0.109) (0.087) (0.082)
0.536 *** 0.760 * 0.751 ** 0.523 *** 0.536 *** 0.426 *** 0.418 ***
(0.090) (0.111) (0.108) (0.118) (0.122) (0.114) (0.109)
0.462 *** 0.716 ** 0.706 *** 0.585 ** 0.597 ** 0.395 *** 0.383 ***
(0.087) (0.094) (0.093) (0.151) (0.153) (0.104) (0.100)
0.291 *** 0.535 *** 0.537 *** 0.584 ** 0.581 ** 0.430 *** 0.425 ***
(0.073) (0.118) (0.120) (0.148) (0.150) (0.071) (0.066)
0.304 *** 0.705 ** 0.690 ** 0.546 * 0.539 ** 0.384 *** 0.383 ***
(0.109) (0.125) (0.122) (0.175) (0.168) (0.108) (0.106)
0.983 0.984 1.022 1.025 * 1.047 * 1.047 *
(0.022) (0.022) (0.015) (0.015) (0.026) (0.026)
0.721 0.678 * 0.696 0.663 * 0.656 *
(0.173) (0.157) (0.161) (0.157) (0.158)
Current conditions
0.691 0.682 0.411 0.417
(0.507) (0.480) (0.322) (0.330)
1.409 0.299 0.066 0.087
(4.660) (0.975) (0.111) (0.183)
0.964 0.953 0.958 0.958
(0.035) (0.035) (0.041) (0.042)
0.707 ** 1.050
(0.114) (0.162)
Demographics
0.795 *** 0.796 *** 0.795 *** 0.795 *** 0.792 *** 0.792 ***
(0.048) (0.048) (0.048) (0.048) (0.047) (0.047)
1.132 *** 1.131 *** 1.125 *** 1.128 *** 1.114 ** 1.112 **(0.050) (0.050) (0.050) (0.050) (0.049) (0.049)
0.876 0.877 0.835 * 0.829 * 0.886 0.887
(0.084) (0.084) (0.079) (0.080) (0.086) (0.084)
0.765 ** 0.764 ** 0.730 *** 0.725 *** 0.781 ** 0.782 **
(0.087) (0.087) (0.081) (0.080) (0.089) (0.087)
0.818 0.818 0.778 ** 0.774 ** 0.829 0.828
(0.105) (0.105) (0.096) (0.096) (0.116) (0.114)
0.750 ** 0.761 ** 0.723 ** 0.718 ** 0.760 ** 0.762 **
(0.104) (0.103) (0.092) (0.093) (0.106) (0.105)
0.734 ** 0.758 ** 0.721 ** 0.713 ** 0.751 * 0.756 *
(0.102) (0.104) (0.099) (0.100) (0.114) (0.114)
1.891 *** 1.891 *** 1.847 *** 1.841 *** 1.909 *** 1.911 ***
(0.127) (0.127) (0.122) (0.123) (0.133) (0.133)
3.261 *** 3.257 *** 3.309 *** 3.302 *** 3.459 *** 3.464 ***
(0.320) (0.320) (0.329) (0.330) (0.351) (0.351)
0.977 *** 0.979 *** 0.976 *** 0.976 *** 0.970 *** 0.970 ***
(0.008) (0.008) (0.008) (0.008) (0.009) (0.009) Role of politics
Political self-positioning -right 0.951 *** 0.951 *** 0.951 *** 0.951 *** 0.952 *** 0.952 ***
(0.014) (0.014) (0.014) (0.014) (0.015) (0.014)
0.639 *** 0.638 *** 0.636 *** 0.634 *** 0.639 *** 0.639 ***
(0.037) (0.038) (0.037) (0.037) (0.038) (0.038)
0.404 *** 0.404 *** 0.404 *** 0.402 *** 0.406 *** 0.406 ***
(0.045) (0.046) (0.044) (0.044) (0.045) (0.045)
2.473 *** 5.500 *** 5.381 *** 4.331 *** 5.324 *** 8.798 *** 8.567 ***
(0.582) (1.291) (1.248) (1.637) (1.687) (2.617) (2.944)
Country fixed effects YES YES YES YES YES YES YES
Wave fixed effects YES YES YES YES YES NO NO
Country-wave fixed effects YES YES YES NO NO NO NO
Number of observations 52395 52395 52395 52395 52395 52395 52395
McFadden's Adj R2 0.058 0.091 0.091 0.089 0.089 0.085 0.086
Cragg-Uhler(Nagelkerke) R2 0.160 0.203 0.203 0.233 0.233 0.225 0.226
AIC 129760.2 92696.87 92689.65 125455.1 125411.3 125954.8 125902.6BIC 129972.9 92909.67 92902.45 125667.9 125624.1 126167.6 126115.3
(5) (6) (7)(1) (2) (3) (4)
Income
Occasional political discussions
No political discussions
Constant
Age 55-64
Age 65+
Middle education
Upper education
Chief wage earner
Age 25-34
Age 35-44
Age 45-54
Min GDP growth last 5 years
Max demonstrations last 5 years
Inflation targeting country
Female
Maximum inflation -
10th decile
Number of demonstrations
Hyperinflation
Max inflation last 5 years
Maximum inflation -
6th decile
Maximum inflation -
7th decile
Maximum inflation -
8th decile
Maximum inflation -
9th decile
Maximum inflation -
2nd decile
Maximum inflation -
3rd decile
Maximum inflation -
4th decile
Maximum inflation -
5th decile
Note: See notes to table 4. Inflation experience enters this model in its categorical form.
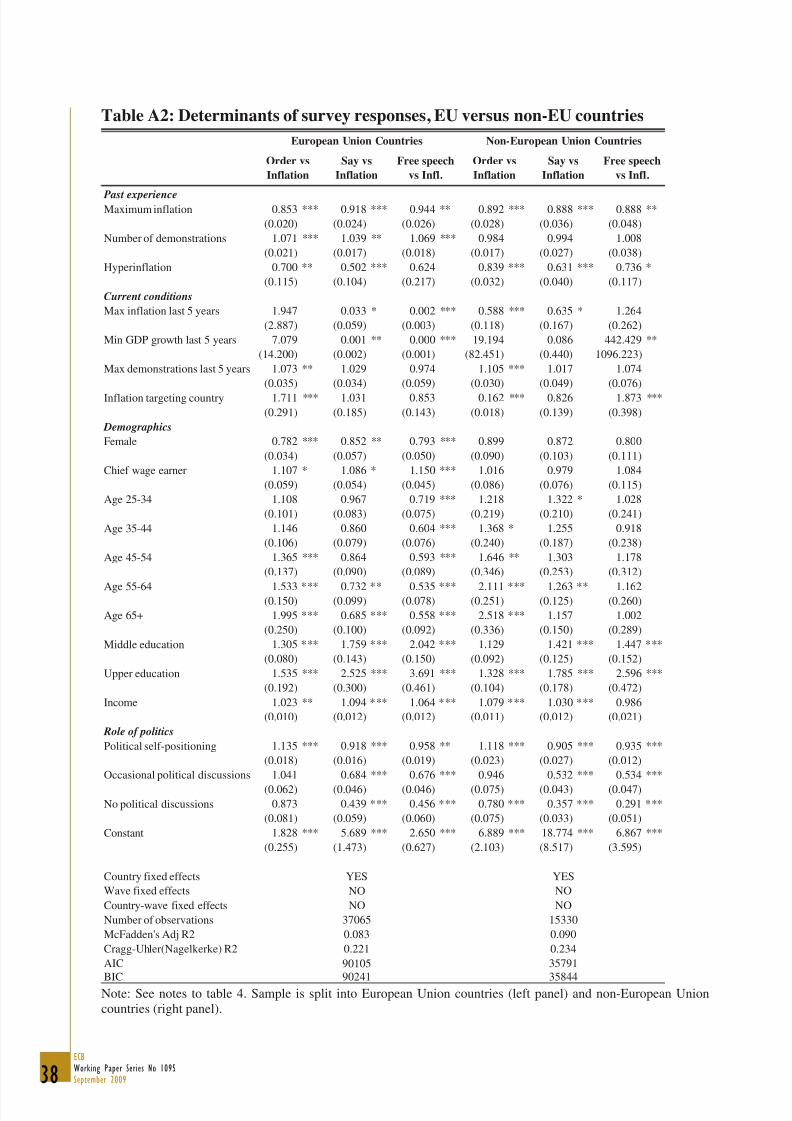
8/14/2019 Wo r k i n g Pa P e r
http://slidepdf.com/reader/full/wo-r-k-i-n-g-pa-p-e-r 39/42
38ECBWorking Paper Series No 1095September 2009
Table A2: Determinants of survey responses, EU versus non-EU countries
Past experience0.853 *** 0.918 *** 0.944 ** 0.892 *** 0.888 *** 0.888 **
(0.020) (0.024) (0.026) (0.028) (0.036) (0.048)
1.071 *** 1.039 ** 1.069 *** 0.984 0.994 1.008
(0.021) (0.017) (0.018) (0.017) (0.027) (0.038)
0.700 ** 0.502 *** 0.624 0.839 *** 0.631 *** 0.736 *
(0.115) (0.104) (0.217) (0.032) (0.040) (0.117)
Current conditions
1.947 0.033 * 0.002 *** 0.588 *** 0.635 * 1.264
(2.887) (0.059) (0.003) (0.118) (0.167) (0.262)
7.079 0.001 ** 0.000 *** 19.194 0.086 442.429 **
(14.200) (0.002) (0.001) (82.451) (0.440) 1096.223)
1.073 ** 1.029 0.974 1.105 *** 1.017 1.074
(0.035) (0.034) (0.059) (0.030) (0.049) (0.076)
1.711 *** 1.031 0.853 0.162 *** 0.826 1.873 ***
(0.291) (0.185) (0.143) (0.018) (0.139) (0.398)
Demographics
0.782 *** 0.852 ** 0.793 *** 0.899 0.872 0.800
(0.034) (0.057) (0.050) (0.090) (0.103) (0.111)
1.107 * 1.086 * 1.150 *** 1.016 0.979 1.084
(0.059) (0.054) (0.045) (0.086) (0.076) (0.115)
1.108 0.967 0.719 *** 1.218 1.322 * 1.028
(0.101) (0.083) (0.075) (0.219) (0.210) (0.241)
1.146 0.860 0.604 *** 1.368 * 1.255 0.918
(0.106) (0.079) (0.076) (0.240) (0.187) (0.238)
1.365 *** 0.864 0.593 *** 1.646 ** 1.303 1.178
(0.137) (0.090) (0.089) (0.346) (0.253) (0.312)
1.533 *** 0.732 ** 0.535 *** 2.111 *** 1.263 ** 1.162(0.150) (0.099) (0.078) (0.251) (0.125) (0.260)
1.995 *** 0.685 *** 0.558 *** 2.518 *** 1.157 1.002
(0.250) (0.100) (0.092) (0.336) (0.150) (0.289)
1.305 *** 1.759 *** 2.042 *** 1.129 1.421 *** 1.447 ***
(0.080) (0.143) (0.150) (0.092) (0.125) (0.152)
1.535 *** 2.525 *** 3.691 *** 1.328 *** 1.785 *** 2.596 ***
(0.192) (0.300) (0.461) (0.104) (0.178) (0.472)
1.023 ** 1.094 *** 1.064 *** 1.079 *** 1.030 *** 0.986
(0.010) (0.012) (0.012) (0.011) (0.012) (0.021)
Role of politics
1.135 *** 0.918 *** 0.958 ** 1.118 *** 0.905 *** 0.935 ***
(0.018) (0.016) (0.019) (0.023) (0.027) (0.012)
1.041 0.684 *** 0.676 *** 0.946 0.532 *** 0.534 ***
(0.062) (0.046) (0.046) (0.075) (0.043) (0.047)
0.873 0.439 *** 0.456 *** 0.780 *** 0.357 *** 0.291 ***
(0.081) (0.059) (0.060) (0.075) (0.033) (0.051)
1.828 *** 5.689 *** 2.650 *** 6.889 *** 18.774 *** 6.867 ***
(0.255) (1.473) (0.627) (2.103) (8.517) (3.595)
Country fixed effects
Wave fixed effects
Country-wave fixed effects
Number of observations
McFadden's Adj R2
Cragg-Uhler(Nagelkerke) R2
AIC
BIC
Maximum inflation
Hyperinflation
Max inflation last 5 years
Min GDP growth last 5 years
Number of demonstrations
No political discussions
Constant
Max demonstrations last 5 years
Inflation targeting country
Female
Chief wage earner
Age 25-34
Age 35-44
Political self-positioning
Occasional political discussions
Age 45-54
Age 55-64
Age 65+
Middle education
Upper education
Income
YES
NO
NO
37065
0.083
0.221
90105
90241
Order vs
Inflation
European Union Countries Non-European Union Countries
Order vs
Inflation
Say vs
Inflation
Free speech
vs Infl.
Say vs
Inflation
Free speech
vs Infl.
YES
NO
NO
15330
0.090
0.234
35791
35844 Note: See notes to table 4. Sample is split into European Union countries (left panel) and non-European Union
countries (right panel).

8/14/2019 Wo r k i n g Pa P e r
http://slidepdf.com/reader/full/wo-r-k-i-n-g-pa-p-e-r 40/42
39ECB
Working Paper Series No 1095September 2009
European Central Bank Working Paper Series
For a complete list of Working Papers published by the ECB, please visit the ECB’s website
(http://www.ecb.europa.eu).
1059 “Forecasting the world economy in the short-term” by A. Jakaitiene and S. Dées, June 2009.
1060 “What explains global exchange rate movements during the financial crisis?” by M. Fratzscher, June 2009.
1061 “The distribution of households consumption-expenditure budget shares” by M. Barigozzi, L. Alessi,
M. Capasso and G. Fagiolo, June 2009.
1062 “External shocks and international inflation linkages: a global VAR analysis” by A. Galesi and M. J. Lombardi,
June 2009.
1063 “Does private equity investment spur innovation? Evidence from Europe” by A. Popov and P. Roosenboom,
June 2009.
1064 “Does it pay to have the euro? Italy’s politics and financial markets under the lira and the euro” by M. Fratzscher
and L. Stracca, June 2009.
1065 “Monetary policy and inflationary shocks under imperfect credibility” by M. Darracq Pariès and S. Moyen,
June 2009.
1066 “Universal banks and corporate control: evidence from the global syndicated loan market” by M. A. Ferreira
and P. Matos, July 2009.
1067 “The dynamic effects of shocks to wages and prices in the United States and the euro area” by R. Duarte
and C. R. Marques, July 2009.
1068 “Asset price misalignments and the role of money and credit” by D. Gerdesmeier, H.-E. Reimers and B. Roffia,
July 2009.
1069 “Housing finance and monetary policy” by A. Calza, T. Monacelli and L. Stracca, July 2009.
1070 “Monetary policy committees: meetings and outcomes” by J. M. Berk and B. K. Bierut, July 2009.
1071 “Booms and busts in housing markets: determinants and implications” by L. Agnello and L. Schuknecht, July 2009.
1072 “How important are common factors in driving non-fuel commodity prices? A dynamic factor analysis”
by I.Vansteenkiste, July 2009.
1073 “Can non-linear real shocks explain the persistence of PPP exchange rate disequilibria?” by T. Peltonen,
M. Sager and A. Popescu, July 2009.
1074 “Wages are flexible, aren’t they? Evidence from monthly micro wage data” by P. Lünnemann and L. Wintr,
July 2009.
1075 “Bank risk and monetary policy” by Y. Altunbas, L. Gambacorta and D. Marqués-Ibáñez, July 2009.
1076 “Optimal monetary policy in a New Keynesian model with habits in consumption” by C. Leith, I. Moldovan
and R. Rossi, July 2009.
1077 “The reception of public signals in financial markets – what if central bank communication becomes stale?”
by M. Ehrmann and D. Sondermann, August 2009.
8/14/2019 Wo r k i n g Pa P e r
http://slidepdf.com/reader/full/wo-r-k-i-n-g-pa-p-e-r 41/42
40ECBWorking Paper Series No 1095September 2009
1078 “On the real effects of private equity investment: evidence from new business creation” by A. Popov
and P. Roosenboom, August 2009.
1079 “EMU and European government bond market integration” by P. Abad and H. Chuliá, and M. Gómez-Puig,
August 2009.
1080 “Productivity and job flows: heterogeneity of new hires and continuing jobs in the business cycle”
by J. Kilponen and J. Vanhala, August 2009.
1081 “Liquidity premia in German government bonds” by J. W. Ejsing and J. Sihvonen, August 2009.
1082 “Disagreement among forecasters in G7 countries” by J. Dovern, U. Fritsche and J. Slacalek, August 2009.
1083 “Evaluating microfoundations for aggregate price rigidities: evidence from matched firm-level data on product
prices and unit labor cost” by M. Carlsson and O. Nordström Skans, August 2009.
1084 “How are firms’ wages and prices linked: survey evidence in Europe” by M. Druant, S. Fabiani, G. Kezdi,
A. Lamo, F. Martins and R. Sabbatini, August 2009.
1085 “An empirical study on the decoupling movements between corporate bond and CDS spreads”
by I. Alexopoulou, M. Andersson and O. M. Georgescu, August 2009.
1086 “Euro area money demand: empirical evidence on the role of equity and labour markets” by G. J. de Bondt,
September 2009.
1087 “Modelling global trade flows: results from a GVAR model” by M. Bussière, A. Chudik and G. Sestieri,
September 2009.
1088 “Inflation perceptions and expectations in the euro area: the role of news” by C. Badarinza and M. Buchmann,September 2009.
1089 “The effects of monetary policy on unemployment dynamics under model uncertainty: evidence from the US
and the euro area” by C. Altavilla and M. Ciccarelli, September 2009.
1090 “New Keynesian versus old Keynesian government spending multipliers” by J. F. Cogan, T. Cwik, J. B. Taylor
and V. Wieland, September 2009.
1091 “Money talks” by M. Hoerova, C. Monnet and T. Temzelides, September 2009.
1092 “Inflation and output volatility under asymmetric incomplete information” by G. Carboni and M. Ellison,
September 2009.
1093 “Determinants of government bond spreads in new EU countries” by I. Alexopoulou, I. Bunda and A. Ferrando,
September 2009.
1094 “Signals from housing and lending booms” by I. Bunda and M. Ca’ Zorzi, September 2009.
1095 “Memories of high inflation” by M. Ehrmann and P. Tzamourani, September 2009.

8/14/2019 Wo r k i n g Pa P e r
http://slidepdf.com/reader/full/wo-r-k-i-n-g-pa-p-e-r 42/42