Embed Size (px)
Citation preview
Zirconium in Rutile Thermometry: Temperature Estimates for Metamorphic Rocks of the Catalina Schist
Hollie McBride
GEOL 394 April 26, 2013
Advisors: Dr. Sarah Penniston-Dorland and Dr. Phil Piccoli
1
Table of Contents
Abstract…………………………………………………………………………………………2 Introduction……………………………………………………………………………………..2 Geologic Setting………………………………………...……………………………………3-4 Zirconium in Rutile Thermometer……………………………………………………………...4 Method of Analysis..…………………………………………………………………………4-5 Uncertainty……………………………………………………………………………..5 Presentation of Data…………………………………………………………….……………5-7
A10-3d: Garnet Amphibolite Core…………………………………………………...5-6 A10-3a: Actinolite Schist Rind………………………………………………..………..6 A12A-5: Garnet Quartzite……………………………………………………….……..6 GB12-1a: Garnet Blueschist…………………………………….……………………..6 Possible Influence of Fe and Cr….………………………………………………......6-7
Discussion of Results…………………………………………………………………………..7 Suggestions for Future Work…………………………………………………………………..7 Conclusions…………………………………………………………………………………….8 Acknowledgments……..……………………………………………………………………….8 References..……………………………………………………………………….………….8-9 Appendix A: Data Tables………………………………………………………………….10-16 Appendix B: Garnet Amphibolite Core……………………………………………………17-21 Appendix C: Actinolite Schist Rind……………………………………….………………21-27 Appendix D: Garnet Quartzite………………………………………………….………….28-31 Appendix E: Garnet Blueschist……………………………………………………………29-34
1
Abstract
The Zr concentration of rutile grains was measured by EPMA for four metamorphic rock samples from the Catalina Schist. These samples include the garnet amphibolite core and actinolite schist rind of a single metasomatized amphibolite block, a garnet quartzite block, and a garnet blueschist block, all of which originate from mélange zones. The Zr in rutile thermometer calibrated by Tomkins et al. (2007) was used to obtain temperature estimates for each sample. At P = 1.0 GPa, the garnet amphibolite records a temperature range of 633 – 686 °C; the actinolite schist records a temperature range of 614 – 697 °C; the garnet quartzite records a temperature range of 648 – 708 °C, and the garnet blueschist records a temperature range of 567 – 601 °C, This is the first temperature estimate for garnet blueschist from the Catalina Schist. Statistical analyses show that there is no significant difference in the temperature recorded by the core and rind of the amphibolite block, indicating that the metasomatization of the block did not affect the concentration of Zr in rutile in the block as a whole. Although the amphibolite block and the garnet quartzite block originate from the same unit, the garnet quartzite records a higher temperature, which may reflect a differing metamorphic and tectonic history for different parts of the unit.
Introduction
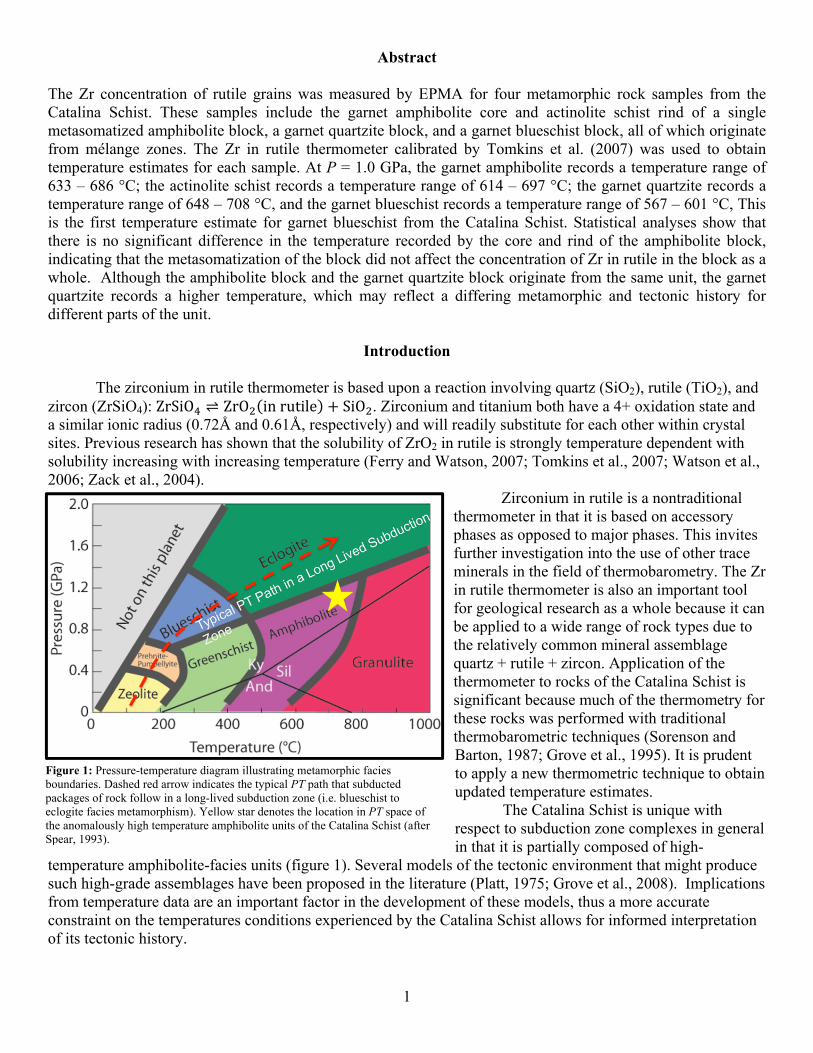
The zirconium in rutile thermometer is based upon a reaction involving quartz (SiO2), rutile (TiO2), and zircon (ZrSiO4): ZrSiO ⇌ ZrO inrutile SiO . Zirconium and titanium both have a 4+ oxidation state and a similar ionic radius (0.72Å and 0.61Å, respectively) and will readily substitute for each other within crystal sites. Previous research has shown that the solubility of ZrO2 in rutile is strongly temperature dependent with solubility increasing with increasing temperature (Ferry and Watson, 2007; Tomkins et al., 2007; Watson et al., 2006; Zack et al., 2004).
Zirconium in rutile is a nontraditional thermometer in that it is based on accessory phases as opposed to major phases. This invites further investigation into the use of other trace minerals in the field of thermobarometry. The Zr in rutile thermometer is also an important tool for geological research as a whole because it can be applied to a wide range of rock types due to the relatively common mineral assemblage quartz + rutile + zircon. Application of the thermometer to rocks of the Catalina Schist is significant because much of the thermometry for these rocks was performed with traditional thermobarometric techniques (Sorenson and Barton, 1987; Grove et al., 1995). It is prudent to apply a new thermometric technique to obtain updated temperature estimates.
The Catalina Schist is unique with respect to subduction zone complexes in general in that it is partially composed of high-
temperature amphibolite-facies units (figure 1). Several models of the tectonic environment that might produce such high-grade assemblages have been proposed in the literature (Platt, 1975; Grove et al., 2008). Implications from temperature data are an important factor in the development of these models, thus a more accurate constraint on the temperatures conditions experienced by the Catalina Schist allows for informed interpretation of its tectonic history.
Figure 1: Pressure-temperature diagram illustrating metamorphic facies boundaries. Dashed red arrow indicates the typical PT path that subducted packages of rock follow in a long-lived subduction zone (i.e. blueschist to eclogite facies metamorphism). Yellow star denotes the location in PT space of the anomalously high temperature amphibolite units of the Catalina Schist (after Spear, 1993).

2
Geologic Setting
The Catalina Schist is a subduction-related metamorphic terrane located on Santa Catalina Island off the southern coast of California. It formed during the mid-Cretaceous and comprises five different metamorphic facies. In order of highest to lowest metamorphic grade, they are the amphibolite, albite-epidote amphibolite, epidote blueschist, lawsonite blueschist, and lawsonite-albite facies (figure 2). Both coherent and mélange-dominated units make up the Catalina Schist. These units are separated by a series of thrust faults (Platt, 1975).
Sorenson and Barton (1987) constrained the peak conditions of amphibolite facies metamorphism of the Catalina Schist to P = ~0.8-1.1 GPa and T =
~640-750 °C. They did so by applying traditional thermobarometric techniques to migmatitic, i.e. partially melted, amphibolite blocks from the mélange-dominated amphibolite unit. The techniques that were used include garnet-clinopyroxene thermometry and analysis of fluid inclusions. Grove and Bebout (1995) determined stability fields for all units of the Catalina Schist (figure 3). These stability fields are predicted based on thermodynamic data for the mineral assemblage found in each rock type.
Rutile grains in four rock types from the Catalina Schist were analyzed in order to estimate the temperatures that they record. Three of these samples come from the mélange-dominated amphibolite unit. The mélange consists of meter- to kilometer- scale blocks of varying lithology suspended in a serpentinite matrix. One type of metamorphic block present is constructed of a garnet amphibolite core surrounded by an actinolite schist reaction rind (figure 4). Rutile from both the core (A10-3d) and the rind (A10-3a) were chosen for analysis in order to determine if they record the same temperature, as they compose a single block. The garnet quartzite block (A12A-5) originates from the same mélange-dominated amphibolite unit as the amphibolite block, but has a
different lithology. It was selected for analysis in order to establish whether there is consistency in the temperature recorded by these two different blocks from the same mélange unit.
The garnet blueschist block (GB12-1a) was chosen for analysis because, to date, no thermometry work has been performed on this particular lithology in the Catalina Schist. This study is the first to do so, and as such, makes an important contribution to the overall body of knowledge of the Catalina Schist. This block is located in the low-grade lawsonite blueschist unit. An additional reason this sample was
selected for study was to determine whether or not it records a temperature consistent with the lawsonite blueschist stability field (figure 3).
Figure 2: Geologic map of Santa Catalina Island outlining the different metamorphic facies present. Colored dots denote the units from which the four samples of this study originate (Grove and Bebout, 1995).
Figure 3: PT diagram showing stability fields for the different metamorphic facies of the Catalina Schist. AM: Amphibolite EA: Albite-Epidote Amphibolite EBS: Epidote Blueschist LBS: Lawsonite Blueschist LA: Lawsonite-Albite (Bebout, 2007).
Figure 4: Field photograph of the amphibolite block that comprises a garnet amphibolite core (A10-3d) and actinolite schist reaction rind (A10-3a). Rutile grains in both the core and the rind were analyzed to determine whether or not this block as a whole records the same temperature. Photo credit: S. Penniston-Dorland

3
Zirconium in Rutile Thermometer
Several calibrations of the Zr in rutile thermometer have been derived over the course of the past decade.
One of the first calibrations was empirical, and was developed by Zack et al. (2004). In their study, the authors measured the Zr content of rutile in 31 natural samples with previously published temperature estimates made by traditional thermometry techniques. An inherent problem with this approach is that the calibration can only be as accurate as the previous temperature estimates used to define it. Watson et al. (2006) developed a more refined thermometer by using synthetic samples in addition to natural samples. Subsequently, Ferry and Watson
(2007) noted that in the absence of quartz, temperature estimates can still be made, provided that the activity of SiO2 in quartz is known. In this study, temperature estimates for rocks from the Catalina Schist were made using the calibration of Tomkins et al. (2007), which takes into account the pressure dependence of Zr-Ti
substitution. The calibration is ° . .
. where P is
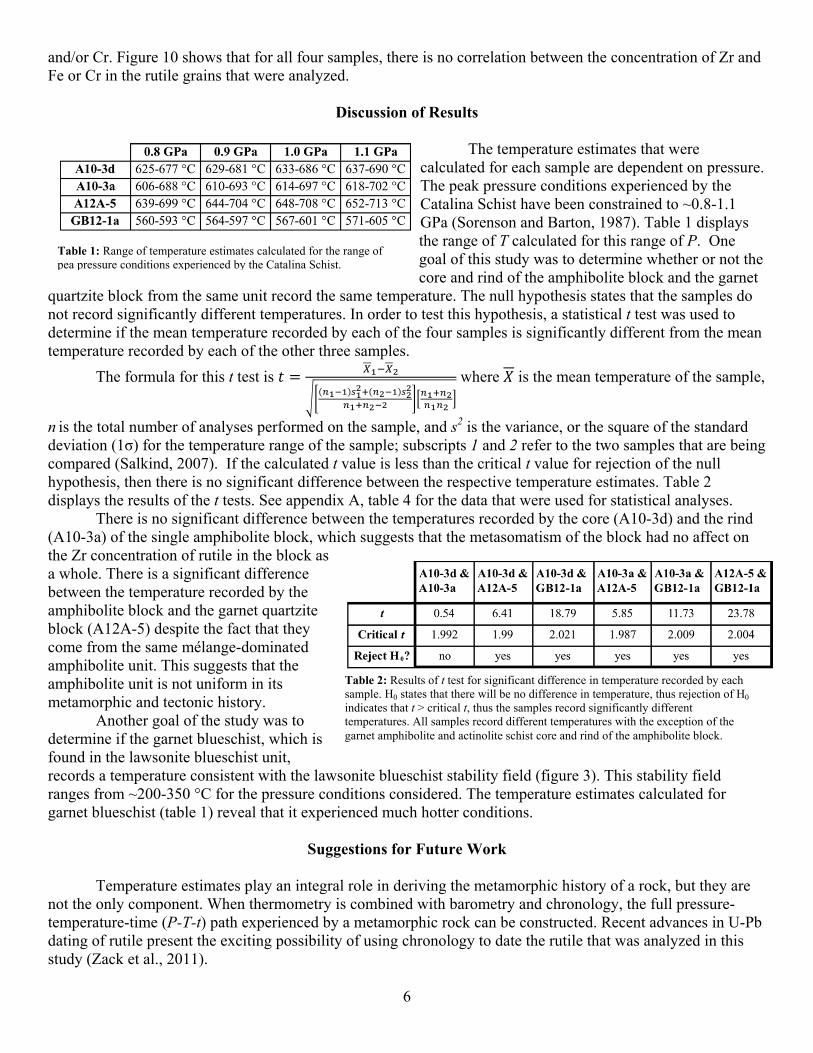
pressure in kbar, R is the gas constant (0.0083144 kJ/K), and ϕ is Zr concentration in ppm. Values of 0.8 GPa, 0.9 GPa, 1.0 GPa, and 1.1 GPa will be used for P because the peak pressure conditions experienced by the Catalina Schist have been constrained to ~0.8-1.1 GPa (Sorenson and Barton, 1987).
Method of Analysis
The starting point for analysis of the four samples is to review the thin sections under a petrographic microscope. Mineral
abundances and textural relationships are documented with photomicrographs. A principal goal of the petrographic characterization is to determine which rutile grains are best suited for analysis with the electron probe microanalyzer (EPMA). Considerations include size, crystal habit, alteration, location, and proximity to zircon and quartz. Once suitable grains have been identified, their location is noted on a thin section map. This map, in turn, is used to navigate to the grain and measure its zirconium concentration on the EPMA.
For each sample, it is essential to document the presence of the equilibrium mineral assemblage that defines the Zr in rutile thermometer, i.e. quartz, rutile, and zircon. Figures 5-8 demonstrate that all four samples contain this assemblage.
Under the guidance of Dr. Phil Piccoli, the probe used for
this study was a JEOL JXA 8900R microanalyzer. The operating conditions were as follows: accelerating voltage of 20 kV, beam current of 120 nA, beam diameter of 5 μm, and counting times of 300s on the peak and 300s on the background. Synthetic crystals of
TiO2 and ZrSiO4 were used as standards for Ti and Zr, respectively. The five WDS spectrometers were set up to measure the concentration of Ti, Zr, V, Fe, Cr, Al, and Si in rutile.
Figure 5: Back scattered electron image documenting the presence of rutile, zircon, and quartz in garnet blueschist.
Figure 6: Back scattered electron image documenting the presence of rutile, zircon, and quartz in garnet amphibolite.

4
The concentration of Si is measured as a check to ensure that only rutile is being analyzed. Rutile is expected to have very low concentrations of Si. However, if a silicate phase such as zircon or garnet is unintentionally analyzed along with rutile, the Si concentration will be high. Following the protocol developed by Zack et al. (2004), analyses with Si concentrations greater than 300 ppm are excluded from further analysis.
Uncertainty
The uncertainties due to counting statistics on elemental concentrations
measured with the EPMA are approximated by
a modified version on the equation 1 √
100where N is the number of X-ray counts detected by the probe for a given element. This relative uncertainty is reported in percent, but can be converted to absolute uncertainty in ppm.
For example: the concentration of Zr that was measured in grain number one during run number one in A10-3d was 321 ppm ± 5.47% (table 3). At the 1σ level, the absolute uncertainty for this measurement is 321 ppm ×
0.0547, or 17.6 ppm. At the 2σ level, the uncertainty is 2 × 17.6 ppm, or 35.1 ppm. For each run, the uncertainty on Zr concentration can be used to define a range of temperatures calculated from the Zr in rutile thermometer. If the concentration of Zr in run #1 is 321 ± 35 ppm, then the corresponding temperature range is 637-655 °C. Lower and upper temperature estimates for ϕ = 321 – 35 ppm (i.e. 286 ppm) and ϕ = 321 + 35 ppm (i.e. 356 ppm) were calculated using the Tomkins et al. calibration (2007). This process was repeated for each run. See appendix A, table 3 for Zr concentration, relative uncertainty, absolute uncertainty, and corresponding temperature range for all rutile grains that were analyzed in A10-3d, A10-3a, A12A-5, and GB12-1a.
Presentation of Data
A10-3d: Garnet Amphibolite Core
A total of 34 analyses were made on nine rutile grains in sample A10-3d (appendix B). The concentration of Zr in these grains ranges from 243 ± 35 ppm to 463 ± 46 ppm. The interquartile range of Zr concentration is 376 – 428 ppm, which represents a T range of range 668 - 679 °C at P = 1.0 GPa (figure 9). The absolute uncertainty on the Zr concentration was used to determine if any of the seven grains are heterogeneous with respect to their Zr concentration. If the lowest and highest Zr concentrations measured in each grain differ beyond the statistical uncertainty, then the grain has a heterogeneous Zr concentration. Of the eight grains upon which multiple analyses were performed, three are heterogeneous and four are homogenous;
Figure 7: Back scattered electron image and photomicrophraphs documenting the presence of rutile, zircon, and quartz in garnet quartzite.
Figure 8: Back scattered electron image and photomicrophraphs documenting the presence of rutile, zircon, and quartz in actinolite schist.
5
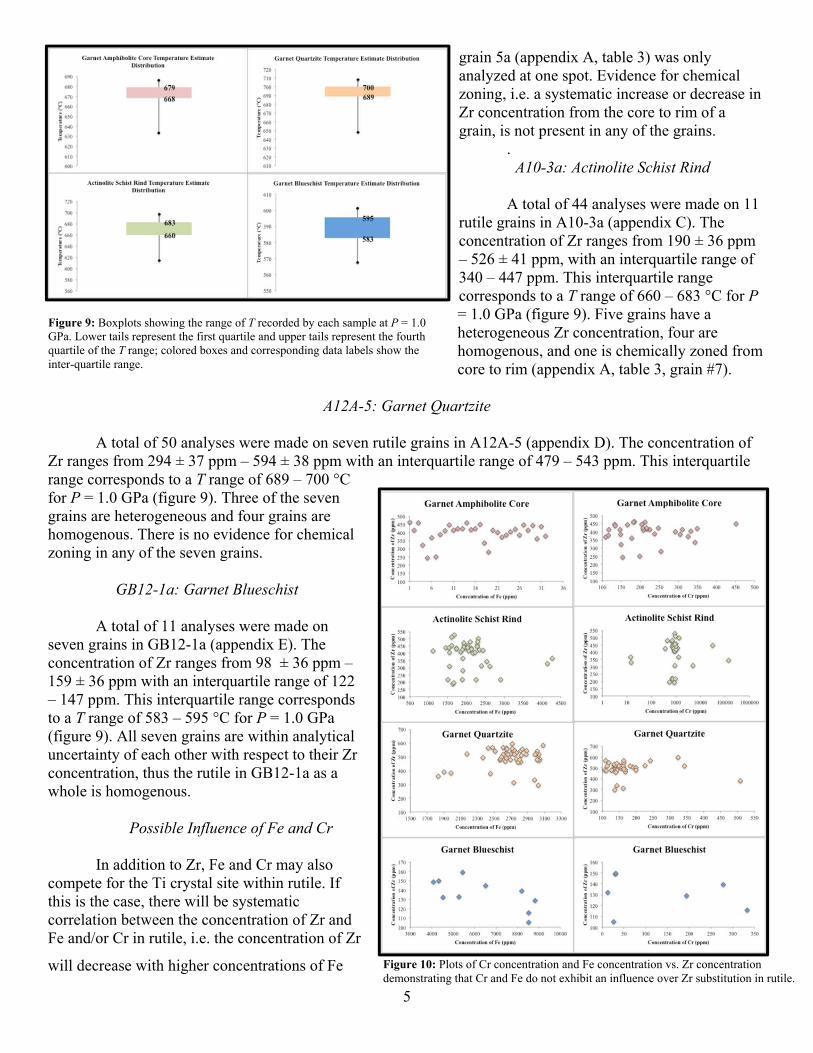
grain 5a (appendix A, table 3) was only analyzed at one spot. Evidence for chemical zoning, i.e. a systematic increase or decrease in Zr concentration from the core to rim of a grain, is not present in any of the grains.
. A10-3a: Actinolite Schist Rind
A total of 44 analyses were made on 11
rutile grains in A10-3a (appendix C). The concentration of Zr ranges from 190 ± 36 ppm – 526 ± 41 ppm, with an interquartile range of 340 – 447 ppm. This interquartile range corresponds to a T range of 660 – 683 °C for P = 1.0 GPa (figure 9). Five grains have a heterogeneous Zr concentration, four are homogenous, and one is chemically zoned from core to rim (appendix A, table 3, grain #7).
A12A-5: Garnet Quartzite
A total of 50 analyses were made on seven rutile grains in A12A-5 (appendix D). The concentration of
Zr ranges from 294 ± 37 ppm – 594 ± 38 ppm with an interquartile range of 479 – 543 ppm. This interquartile range corresponds to a T range of 689 – 700 °C for P = 1.0 GPa (figure 9). Three of the seven grains are heterogeneous and four grains are homogenous. There is no evidence for chemical zoning in any of the seven grains.
GB12-1a: Garnet Blueschist
A total of 11 analyses were made on seven grains in GB12-1a (appendix E). The concentration of Zr ranges from 98 ± 36 ppm – 159 ± 36 ppm with an interquartile range of 122 – 147 ppm. This interquartile range corresponds to a T range of 583 – 595 °C for P = 1.0 GPa (figure 9). All seven grains are within analytical uncertainty of each other with respect to their Zr concentration, thus the rutile in GB12-1a as a whole is homogenous.
Possible Influence of Fe and Cr
In addition to Zr, Fe and Cr may also compete for the Ti crystal site within rutile. If this is the case, there will be systematic correlation between the concentration of Zr and Fe and/or Cr in rutile, i.e. the concentration of Zr
will decrease with higher concentrations of Fe
Figure 9: Boxplots showing the range of T recorded by each sample at P = 1.0 GPa. Lower tails represent the first quartile and upper tails represent the fourth quartile of the T range; colored boxes and corresponding data labels show the inter-quartile range.
Figure 10: Plots of Cr concentration and Fe concentration vs. Zr concentration demonstrating that Cr and Fe do not exhibit an influence over Zr substitution in rutile.
6
and/or Cr. Figure 10 shows that for all four samples, there is no correlation between the concentration of Zr and Fe or Cr in the rutile grains that were analyzed.
Discussion of Results
The temperature estimates that were calculated for each sample are dependent on pressure. The peak pressure conditions experienced by the Catalina Schist have been constrained to ~0.8-1.1 GPa (Sorenson and Barton, 1987). Table 1 displays the range of T calculated for this range of P. One goal of this study was to determine whether or not the core and rind of the amphibolite block and the garnet
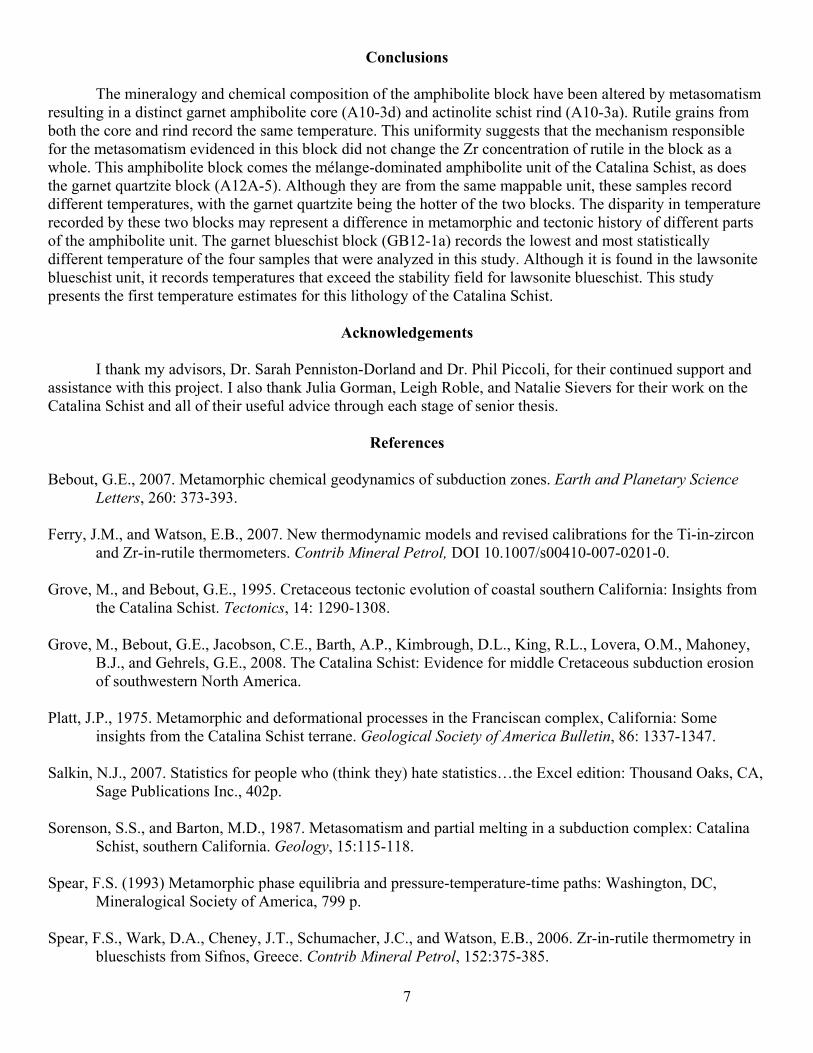
quartzite block from the same unit record the same temperature. The null hypothesis states that the samples do not record significantly different temperatures. In order to test this hypothesis, a statistical t test was used to determine if the mean temperature recorded by each of the four samples is significantly different from the mean temperature recorded by each of the other three samples.
The formula for this t test is where is the mean temperature of the sample,
n is the total number of analyses performed on the sample, and s2 is the variance, or the square of the standard deviation (1σ) for the temperature range of the sample; subscripts 1 and 2 refer to the two samples that are being compared (Salkind, 2007). If the calculated t value is less than the critical t value for rejection of the null hypothesis, then there is no significant difference between the respective temperature estimates. Table 2 displays the results of the t tests. See appendix A, table 4 for the data that were used for statistical analyses.
There is no significant difference between the temperatures recorded by the core (A10-3d) and the rind (A10-3a) of the single amphibolite block, which suggests that the metasomatism of the block had no affect on the Zr concentration of rutile in the block as a whole. There is a significant difference between the temperature recorded by the amphibolite block and the garnet quartzite block (A12A-5) despite the fact that they come from the same mélange-dominated amphibolite unit. This suggests that the amphibolite unit is not uniform in its metamorphic and tectonic history.
Another goal of the study was to determine if the garnet blueschist, which is found in the lawsonite blueschist unit, records a temperature consistent with the lawsonite blueschist stability field (figure 3). This stability field ranges from ~200-350 °C for the pressure conditions considered. The temperature estimates calculated for garnet blueschist (table 1) reveal that it experienced much hotter conditions.
Suggestions for Future Work
Temperature estimates play an integral role in deriving the metamorphic history of a rock, but they are not the only component. When thermometry is combined with barometry and chronology, the full pressure-temperature-time (P-T-t) path experienced by a metamorphic rock can be constructed. Recent advances in U-Pb dating of rutile present the exciting possibility of using chronology to date the rutile that was analyzed in this study (Zack et al., 2011).
Table 2: Results of t test for significant difference in temperature recorded by each sample. H0 states that there will be no difference in temperature, thus rejection of H0 indicates that t > critical t, thus the samples record significantly different temperatures. All samples record different temperatures with the exception of the garnet amphibolite and actinolite schist core and rind of the amphibolite block.
Table 1: Range of temperature estimates calculated for the range of pea pressure conditions experienced by the Catalina Schist.
7
Conclusions The mineralogy and chemical composition of the amphibolite block have been altered by metasomatism resulting in a distinct garnet amphibolite core (A10-3d) and actinolite schist rind (A10-3a). Rutile grains from both the core and rind record the same temperature. This uniformity suggests that the mechanism responsible for the metasomatism evidenced in this block did not change the Zr concentration of rutile in the block as a whole. This amphibolite block comes the mélange-dominated amphibolite unit of the Catalina Schist, as does the garnet quartzite block (A12A-5). Although they are from the same mappable unit, these samples record different temperatures, with the garnet quartzite being the hotter of the two blocks. The disparity in temperature recorded by these two blocks may represent a difference in metamorphic and tectonic history of different parts of the amphibolite unit. The garnet blueschist block (GB12-1a) records the lowest and most statistically different temperature of the four samples that were analyzed in this study. Although it is found in the lawsonite blueschist unit, it records temperatures that exceed the stability field for lawsonite blueschist. This study presents the first temperature estimates for this lithology of the Catalina Schist.
Acknowledgements
I thank my advisors, Dr. Sarah Penniston-Dorland and Dr. Phil Piccoli, for their continued support and assistance with this project. I also thank Julia Gorman, Leigh Roble, and Natalie Sievers for their work on the Catalina Schist and all of their useful advice through each stage of senior thesis.
References
Bebout, G.E., 2007. Metamorphic chemical geodynamics of subduction zones. Earth and Planetary Science Letters, 260: 373-393.
Ferry, J.M., and Watson, E.B., 2007. New thermodynamic models and revised calibrations for the Ti-in-zircon
and Zr-in-rutile thermometers. Contrib Mineral Petrol, DOI 10.1007/s00410-007-0201-0. Grove, M., and Bebout, G.E., 1995. Cretaceous tectonic evolution of coastal southern California: Insights from
the Catalina Schist. Tectonics, 14: 1290-1308. Grove, M., Bebout, G.E., Jacobson, C.E., Barth, A.P., Kimbrough, D.L., King, R.L., Lovera, O.M., Mahoney,
B.J., and Gehrels, G.E., 2008. The Catalina Schist: Evidence for middle Cretaceous subduction erosion of southwestern North America.
Platt, J.P., 1975. Metamorphic and deformational processes in the Franciscan complex, California: Some
insights from the Catalina Schist terrane. Geological Society of America Bulletin, 86: 1337-1347. Salkin, N.J., 2007. Statistics for people who (think they) hate statistics…the Excel edition: Thousand Oaks, CA,
Sage Publications Inc., 402p. Sorenson, S.S., and Barton, M.D., 1987. Metasomatism and partial melting in a subduction complex: Catalina
Schist, southern California. Geology, 15:115-118. Spear, F.S. (1993) Metamorphic phase equilibria and pressure-temperature-time paths: Washington, DC,
Mineralogical Society of America, 799 p. Spear, F.S., Wark, D.A., Cheney, J.T., Schumacher, J.C., and Watson, E.B., 2006. Zr-in-rutile thermometry in
blueschists from Sifnos, Greece. Contrib Mineral Petrol, 152:375-385.
8
Tomkins, H.S., Powell, R., and Ellis, D.J., 2007. The pressure dependence of the zirconium-in-rutile thermometer. Journal of Metamorphic Petrology, 25: 703-713.
Watson, E.B., Wark, D.A., and Thomas, J.B., 2006. Crystallization thermometers for zircon and rutile. Contrib
Mineral Petrol, 151: 413-433. Zack, T., Moraes, R., and Kronz, A., 2004. Temperature dependence of Zr in rutile: empirical calibration of a
rutile thermometer. Contrib Mineral Petrol, 148: 471-488. Zack, T., Stockli, D.F., Luvizotto, G.L., Barth, M.G., Belousova, E., Wolfe, M.R., Hinton, R.W., 2011. In situ
U–Pb rutile dating by LA-ICP-MS: 208Pb correction and prospects for geological applications. Contrib Mineral Petrol, 165: 515-530.

9
Appendix A: Data Tables
T (°C)
Grain No.
Run No.
Zr (ppm)
Cr (ppm)
Fe (ppm)
Si (ppm)
Zr Rel. Uncert.
(%)
Zr 2σ Abs.
Uncert. (ppm)
P = 0.8 GPa P = 0.9 GPa P = 1.0 GPa P = 1.1 GPa Sample#_Grain#_Relative Location
Upper Lower Upper Lower Upper Lower Upper Lower
\ 1
8 463 184 2647 2 5 46 685 668 690 673 694 677 699 681 A10-3D_1_Garnet Center
9 415 117 3409 38 3.99 33 674 661 679 665 683 669 687 674 A10-3D_1_Garnet Center_Rutile Rim
10 458 182 3022 23 4.49 41 684 668 688 673 693 677 697 681 A10-3D_1_Garnet Center_Rutile Rim
2
1 321 149 * 0 5.47 35 655 637 659 642 664 646 668 650 A10-3D_2_Matrix
2 243 154 * 29 7.28 35 635 613 639 617 644 621 648 625 A10-3D_2_Matrix
23 369 109 3064 29 4.97 37 666 649 670 654 675 658 679 662 A10-3D_2_Matrix_Rutile Rim
24 249 199 2700 0 7.16 36 637 615 641 619 646 623 650 627 A10-3D_2_Matrix_ Rutile Rim
3a
18 389 237 4672 39 4.89 38 670 654 674 658 679 662 683 667 A10-3D_3a_Garnet Rim_Rutile Rim
19 411 208 4238 20 4.75 39 675 658 679 663 683 667 688 672 A10-3D_3a_Garnet Rim_Rutile Center
20 448 204 4351 9 4.52 40 682 666 686 671 691 675 695 679 A10-3D_3a_Garnet Rim_Rutile Center
21 415 225 4301 0 4.1 34 674 660 679 665 683 669 688 674 A10-3D_3a_Garnet Rim_Rutile Center
22 423 207 4454 6 4.43 38 677 662 681 666 686 670 690 675 A10-3D_3a_Garnet Rim_Rutile Rim
3b
31 422 248 3838 67 4.4 37 676 661 681 666 685 670 690 675 A10-3D_3b_Garnet Rim_Rutile Rim
32 460 212 3366 0 4.2 39 684 669 688 673 693 678 697 682 A10-3D_3b_Garnet Rim_Rutile Center
33 416 217 3367 43 4.19 35 675 661 679 665 684 669 688 674 A10-3D_3b_Garnet Rim_Rutile Center
34 425 216 3557 9 3.85 33 676 663 680 667 685 672 689 676 A10-3D_3b_Garnet Rim_Rutile Rim
5a 6 451 451 4935 107 4.18 38 682 667 686 672 691 676 695 681 A10-3D_5a_Garnet Center
5b
3 335 343 2269 27 5.42 36 658 641 663 645 667 649 671 654 A10-3D_5b_Garnet Rim_Rutile Center
4 281 255 3025 36 6.38 36 645 625 650 629 654 634 658 638 A10-3D_5b_Garnet Rim_Rutile Rim
12 415 310 3449 44 4.21 35 675 660 679 665 684 669 688 674 A10-3D_5b_Garnet Center_Rutile Rim
6
26 402 292 3740 24 4.34 35 672 657 676 662 681 666 685 671 A10-3D_6_Garnet Rim_Rutile Rim
27 370 326 3425 34 5.8 43 667 648 672 652 676 657 681 661 A10-3D_6_Garnet Rim_Rutile Center
28 386 304 3214 48 4.57 35 669 654 673 658 678 662 682 667 A10-3D_6_Garnet Rim_Rutile Center
29 403 333 3327 0 4.95 40 673 656 678 661 682 665 686 670 A10-3D_6_Garnet Rim_Rutile Center
30 420 349 3620 24 4.77 40 677 660 681 665 685 669 690 674 A10-3D_6_Garnet Rim_Rutile Rim
7 13 386 148 2838 86 4.73 37 681 667 685 671 690 676 694 680 A10-3D_7_Matrix_Rutile Rim
14 447 133 2896 0 4.1 37 675 660 679 664 684 669 688 673 A10-3D_7_Matrix_Rutile Center
10
15 415 147 2932 0 4.41 37 680 666 684 670 689 674 693 679 A10-3D_7_Matrix_Rutile Center
16 442 166 2849 89 4.16 37 669 653 674 658 678 662 683 667 A10-3D_7_Matrix_Rutile Rim
8
7 363 177 2751 0 4.1 30 663 649 667 654 672 658 676 662 A10-3D_8_Garnet Center
11 438 134 4482 78 4.06 36 679 665 683 670 688 674 692 678 A10-3D_8_Garnet Center_Rutile Rim
17 378 116 2292 49 4.42 33 667 652 671 656 676 661 680 665 A10-3D_8_Garnet Center_Rutile Rim
A10
-3a
1
101 309 5016 2626 163 6.46 40 653 632 658 637 662 641 666 645 A10-3A_1_Matrix_Rutile Edge
102 281 0 1905 36 6.51 37 646 625 650 629 654 633 659 638 A10-3A_1_Matrix_Rutile Center
103 344 138656 2538 93 5.5 38 661 643 665 647 670 651 674 656 A10-3A_1_Matrix_Rutile Center
104 218 0 2906 215 8.32 36 628 603 632 607 636 611 641 615 A10-3A_1_Matrix_Rutile Edge
2
105 408 0 1841 126 4.55 37 674 658 678 663 683 667 687 671 A10-3A_2_Matrix_Rutile Edge
106 433 1091 2128 31 4.33 38 678 664 683 668 687 672 692 677 A10-3A_2_Matrix_Rutile Center
107 452 0 2026 19 4.15 38 682 667 686 672 691 676 695 681 A10-3A_2_Matrix_Rutile Center
108 403 0 2169 107 4.63 37 673 657 677 662 682 666 686 670 A10-3A_2_Matrix_Rutile Edge
3
109 365 1288 1897 58 5.09 37 665 648 669 653 674 657 678 661 A10-3A_3_Matrix_Rutile Edge
110 427 1197 2131 82 4.41 38 677 662 682 667 686 671 691 675 A10-3A_3_Matrix_Rutile Center
111 448 31454 1957 72 4.21 38 681 667 686 671 690 675 695 680 A10-3A_3_Matrix_Rutile Center
112 457 1022 1940 129 4.48 41 683 668 688 672 692 677 697 681 A10-3A_3_Matrix_Rutile Edge
4
62 478 442 2095 11 3.95 38 686 673 691 677 695 682 700 686 A10-3A_4_Matrix_Rutile Edge
63 471 699 1929 16 4 38 685 671 690 676 694 680 699 685 A10-3A_4_Matrix_Rutile Center
64 499 1349 2315 14 3.78 38 690 677 694 681 699 686 704 690 A10-3A_4_Matrix_Rutile Center
65 458 0 2280 0 4.13 38 683 669 687 673 692 678 696 682 A10-3A_4_Matrix_Rutile Edge
5
81 438 866 1445 127 4.28 37 679 665 684 669 688 674 693 678 A10-3A_5_Matrix_Rutile Edge
82 526 916 1677 15 3.92 41 695 681 699 685 704 690 708 694 A10-3A_5_Matrix_Rutile Center
83 436 768 1737 1 4.32 38 679 664 684 669 688 673 692 677 A10-3A_5_Matrix_Rutile Center
84 431 957 1740 69 4.37 38 678 663 683 667 687 672 692 676 A10-3A_5_Matrix_Rutile Center
85 440 814 1964 22 4.31 38 680 665 684 669 689 674 693 678 A10-3A_5_Matrix_Rutile Edge
7
76 480 694 2301 57 3.97 38 687 673 691 677 696 682 700 686 A10-3A_7_Matrix_Rutile Edge
77 447 751 2285 44 4.23 38 681 666 685 671 690 675 694 680 A10-3A_7_Matrix_Rutile Center
78 219 695 2253 56 8.24 36 628 603 633 607 637 612 641 616 A10-3A_7_Matrix_Rutile Center
79 216 753 1893 54 8.45 37 628 602 632 606 636 610 640 614 A10-3A_7_Matrix_Rutile Center
80 441 718 1929 318 4.25 38 A10-3A_7_Matrix_Rutile Edge
8 66 329 15 4144 122 5.6 37 657 639 662 643 666 647 670 652 A10-3A_8_Garnet Edge_Rutile Edge

11
67 190 17929 3902 68 9.53 36 A10-3A_8_Garnet Edge_Rutile Center
68 365 15 4272 99 5.12 37 665 648 669 653 674 657 678 661 A10-3A_8_Garnet Edge_Rutile Center
69 291 0 6181 9005 6.34 37 A10-3A_8_Garnet Edge_Rutile Edge
9
70 391 778 923 575 4.77 37 A10-3A_9_Matrix_Rutile Edge
71 391 719 853 1788 4.77 37 A10-3A_9_Matrix_Rutile Center
72 309 888 1548 32 5.93 37 653 633 657 638 661 642 666 646 A10-3A_9_Matrix_Rutile Center
73 190 864 1630 0 9.47 36 619 591 623 595 627 599 632 603 A10-3A_9_Matrix_Rutile Center
74 217 942 1511 75 8.33 36 628 602 632 607 636 611 640 615 A10-3A_9_Matrix_Rutile Center
75 11984 109 10927 161223 0.39 93 A10-3A_9_Matrix_Rutile Edge
11
97 315 0 2401 20 5.88 37 654 635 658 639 663 644 667 648 A10-3A_11_Matrix_Rutile Edge
98 423 376 2342 52 4.46 38 677 661 681 666 686 670 690 675 A10-3A_11_Matrix_Rutile Center
99 380 554 2375 6900 4.91 37 A10-3A_11_Matrix_Rutile Center
100 251 781 2820 363 8.04 40 A10-3A_11_Matrix_Rutile Edge
12
86 416 936 2054 21 4.49 37 675 660 680 664 684 669 689 673 A10-3A_12_Matrix_Rutile Edge
87 421 875 2441 22 4.48 38 676 661 681 665 685 670 690 674 A10-3A_12_Matrix_Rutile Center
88 405 858 2221 0 4.6 37 673 658 677 662 682 666 686 671 A10-3A_12_Matrix_Rutile Center
89 440 825 2032 18 4.24 37 680 665 684 670 689 674 693 678 A10-3A_12_Matrix_Rutile Center
90 424 841 1894 23 4.41 37 677 662 681 666 686 671 690 675 A10-3A_12_Matrix_Rutile Center
91 406 901 1548 2 4.6 37 673 658 678 662 682 667 687 671 A10-3A_12_Matrix_Rutile Edge
13
92 417 1002 1112 66 4.51 38 676 660 680 664 684 669 689 673 A10-3A_13_Matrix_Rutile Edge
93 510 936 1608 40 3.75 38 692 679 696 683 701 688 705 692 A10-3A_13_Matrix_Rutile Center
94 440 1030 1538 33 4.27 38 680 665 684 669 689 674 693 678 A10-3A_13_Matrix_Rutile Center
95 452 921 1600 58 4.19 38 682 667 686 672 691 676 695 681 A10-3A_13_Matrix_Rutile Center
96 195 562 1668 246 9.32 36 621 593 625 597 629 601 633 605 A10-3A_13_Matrix_Rutile Edge
A12
A-5
1
1 495 156 2368 187 3.83 38 689 676 694 680 698 685 703 689 A12A-5_1_Matrix_Rut Edge
2 523 139 2695 4 3.7 39 694 681 699 685 703 690 708 694 A12A-5_1_Matrix_Rut Center
3 529 135 2643 53 3.64 38 695 682 699 686 704 691 708 695 A12A-5_1_Matrix_Rut Center
4 479 144 2567 0 3.97 38 687 673 691 677 696 682 700 686 A12A-5_1_Matrix_Rut Center
5 523 139 2638 0 3.67 38 694 681 698 685 703 690 707 694 A12A-5_1_Matrix_Rut Center
6 505 190 2630 90 3.79 38 691 678 695 682 700 687 705 691 A12A-5_1_Matrix_Rut Edge
2 7 531 135 2764 12 3.64 39 695 682 700 687 704 691 709 696 A12A-5_2_Matrix_Rut Edge
8 483 129 2764 19 4 39 687 674 692 678 696 682 701 687 A12A-5_2_Matrix_Rut Center
12
9 512 156 2823 27 3.78 39 692 679 697 683 701 688 706 692 A12A-5_2_Matrix_Rut Center
10 520 151 3028 33 3.69 38 693 680 698 685 702 689 707 694 A12A-5_2_Matrix_Rut Center
11 483 107 2574 46 3.94 38 687 674 692 678 696 682 701 687 A12A-5_2_Matrix_Rut Edge
12 583 88 3081 18 3.27 38 703 691 708 696 712 700 717 705 A12A-5_2_Matrix_Rut Center
13 540 143 3015 231 3.49 38 696 684 701 689 706 693 710 698 A12A-5_2_Matrix_Rut Center
14 521 156 4665 18594 3.67 38 A12A-5_2_Matrix_Rut Center
15 464 168 2815 79 4.09 38 684 670 689 674 693 679 698 683 A12A-5_2_Matrix_Rut Edge
16 468 93 2629 125 4.05 38 685 671 689 675 694 680 698 684 A12A-5_2_Matrix_Rut Edge
17 458 140 2785 0 4.16 38 683 669 688 673 692 678 697 682 A12A-5_2_Matrix_Rut Center
18 312 162 2732 22 5.92 37 653 634 658 638 662 643 666 647 A12A-5_2_Matrix_Rut Center
19 543 84 2886 30 3.52 38 697 685 702 689 706 694 711 698 A12A-5_2_Matrix_Rut Edge
20 166290 0 2448 61914 0.09 299 A12A-5_2_Matrix_Inclusion in Rutile
3
21 479 128 2804 55 3.95 38 687 673 691 677 696 682 700 686 A12A-5_3_Matrix_Rutile Edge
22 523 226 2997 25 3.68 39 694 681 699 685 703 690 708 694 A12A-5_3_Matrix_Rutile Center
23 482 168 3043 69 3.93 38 687 673 692 678 696 682 701 687 A12A-5_3_Matrix_Rutile Center
24 517 161 2876 0 3.68 38 693 680 697 684 702 689 706 693 A12A-5_3_Matrix_Rutile Center
25 474 112 3028 34 4 38 686 672 690 676 695 681 699 685 A12A-5_3_Matrix_Rutile Center
26 294 136 3028 40 6.21 37 649 629 653 633 657 638 662 642 A12A-5_3_Matrix_Rutile Edge
27 519 115 2664 68 3.69 38 693 680 698 685 702 689 707 694 A12A-5_3_Matrix_Rutile Edge
28 519 183 2984 0 3.7 38 693 680 698 685 702 689 707 694 A12A-5_3_Matrix_Rutile Center
29 545 164 2727 29 3.52 38 697 685 702 689 706 694 711 698 A12A-5_3_Matrix_Rutile Center
30 480 98 3013 0 3.98 38 687 673 691 677 696 682 700 686 A12A-5_3_Matrix_Rutile Center
31 333 144 2980 27 5.55 37 658 640 662 644 667 649 671 653 A12A-5_3_Matrix_Rutile Edge
32 564 164 2430 240 3.41 38 700 688 705 693 709 697 714 702 A12A-5_3_Matrix_Rutile Edge
33 568 109 2606 79 3.4 39 701 689 705 693 710 698 715 702 A12A-5_3_Matrix_Rutile Center
34 548 119 2738 90 3.52 39 698 685 702 690 707 694 711 699 A12A-5_3_Matrix_Rutile Edge
4
35 523 0 2176 257 3.6 38 694 681 698 686 703 690 707 695 A12A-5_4_Matrix_Rutile Edge
36 566 242 2644 43 3.37 38 701 688 705 693 710 698 714 702 A12A-5_4_Matrix_Rutile Center
37 594 325 2716 11 3.23 38 705 693 709 698 714 702 718 707 A12A-5_4_Matrix_Rutile Center
38 560 75 2712 20 3.41 38 700 687 704 692 709 696 713 701 A12A-5_4_Matrix_Rutile Center
39 541 83 2510 85 3.51 38 697 684 701 689 706 693 710 698 A12A-5_4_Matrix_Rutile Edge
5 40 380 507 2452 83 4.82 37 668 652 672 656 677 661 681 665 A12A-5_5_Matrix_Rutile Edge

13
41 546 70 2818 21 3.49 38 697 685 702 689 706 694 711 698 A12A-5_5_Matrix_Rutile Center
42 557 98 2832 0 3.42 38 699 687 704 691 708 696 713 700 A12A-5_5_Matrix_Rutile Center
43 519 343 2608 33 3.64 38 693 680 698 685 702 689 707 694 A12A-5_5_Matrix_Rutile Center
44 570 0 2481 5 3.32 38 701 689 706 694 710 698 715 703 A12A-5_5_Matrix_Rutile Center
45 555 0 2648 0 3.4 38 699 687 703 691 708 696 712 700 A12A-5_5_Matrix_Rutile Edge
6
53 383 0 1983 268 4.86 37 669 652 673 657 678 661 682 666 A12A-5_6_Matrix_Rutile Edge
54 359 55 1833 165 5.14 37 664 647 668 651 673 655 677 660 A12A-5_6_Matrix_Rutile Center
55 389 0 1902 220 4.71 37 670 654 674 659 679 663 683 667 A12A-5_6_Matrix_Rutile Center
56 399 0 1756 1273 4.57 36 A12A-5_6_Matrix_Rutile Edge
7
57 505 147 2520 635 3.78 38
A12A-5_7_Matrix_Rutile Edge
58 519 149 2737 187 3.68 38 693 680 698 685 702 689 707 694 A12A-5_7_Matrix_Rutile Center
59 500 200 2585 202 3.81 38 690 677 695 681 699 686 704 690 A12A-5_7_Matrix_Rutile Center
60 480 200 2693 257 3.97 38 687 673 691 677 696 682 700 686 A12A-5_7_Matrix_Rutile Center
61 489 164 2645 528 3.89 38 688 675 693 679 697 684 702 688 A12A-5_7_Matrix_Rutile Edge
8 49 195 0 3887 63499 9.46 37 A12A-5_8_Garnet Center_Rutile Center
9
46 288 0 6085 2347 6.58 38 A12A-5_9_Garnet Center_Rutile Edge
47 226 28 5225 4868 8.37 38 A12A-5_9_Garnet Center_Rutile Center
48 56 0 175108 162951 36.52 41 A12A-5_9_Garnet Center_Rutile Edge
10
50 0 13694 16319 36836 100 0 A12A-5_10_Garnet Center_Rutile Edge
51 24 0 83101 59957 75.83 36 A12A-5_10_Garnet Center_Rutile Center
52 0 141317 31441 31197 100 0 A12A-5_10_Garnet Center_Rutile Edge
GB
12-1
a
1
1 115 333 8528 109 15.13 35 589 547 593 551 597 555 601 559 GB12-1a_1_Rutile Rim_Garnet Center
2 139 278 8216 55 12.55 35 600 564 604 568 608 572 612 576 GB12-1a_1_Rutile Center_Garnet Center
3 81 0 113646 88504 22.93 37 GB12-1a_1_Rutile Edge_Garnet Edge
2 4 103 0 50663 33657 17.42 36 GB12-1a_2_Rutile Edge_Garnet Center
5 144 0 10272 1771 12.03 35 GB12-1a_2_Rutile Center_Garnet Center
3
18 132 13 4526 18 13.68 36 597 558 601 562 605 566 609 570 GBS12-1a_3_gt edge_rut edge
19 149 30 4070 172 12.06 36 604 569 608 573 612 577 616 581 GBS12-1a_3_gt edge_rut ctr
20 150 31 4341 136 12.03 36 604 570 608 574 613 578 617 582 GBS12-1a_3_gt edge_rut edge
5 15 118 153 15363 3875 15.1 36 GBS12-1a_5_gt ctr_rut ctr
5a 16 132 146 12429 3197 13.55 36 GBS12-1a_5a_gt ctr_rut ctr
14
10
9 129 0 8834 256 13.97 36 596 556 600 560 604 564 608 568 GBS12-1a_10_gt edge_rut edge
10 105 0 8535 287 16.98 36 585 537 589 541 593 545 597 549 GBS12-1a_10_gt edge_rut ctr
11 141 0 8665 1115 12.64 36 GBS12-1a_10_gt edge_rut ctr
12 28 112 0 6499 2727 15.85 35 GBS12-1a_12_gt ctr_rut edge
13 29 144 0 6508 112 12.41 36 602 567 606 570 610 574 615 578 GBS12-1a_13_gt ctr_rut ctr
14 30 98 194 7543 277 18.31 36 581 530 585 534 589 538 593 542 GBS12-1a_14_host edge_rut ctr
15 32 159 26 5450 257 11.21 36 608 575 612 579 616 583 620 587 GBS12-1a_15_gt edge_rut ctr
16 33 133 0 5275 265 13.49 36 597 559 601 563 605 567 610 571 GBS12-1a_16_gt ctr_rut ctr
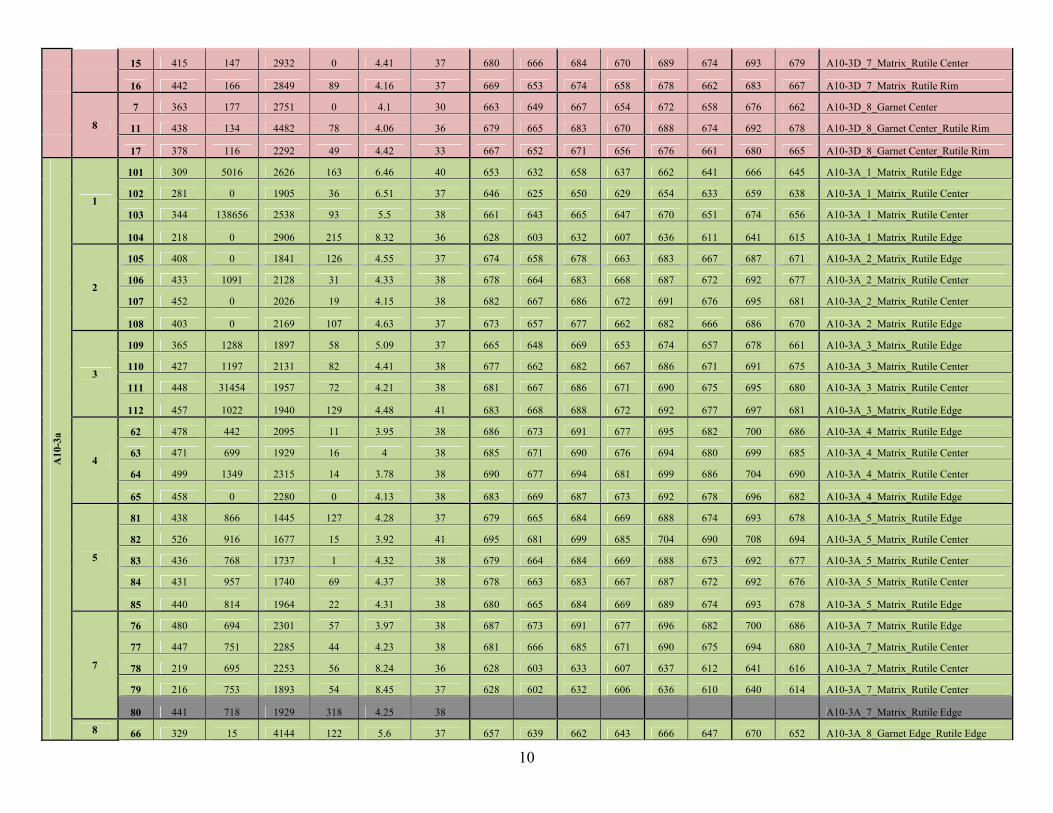
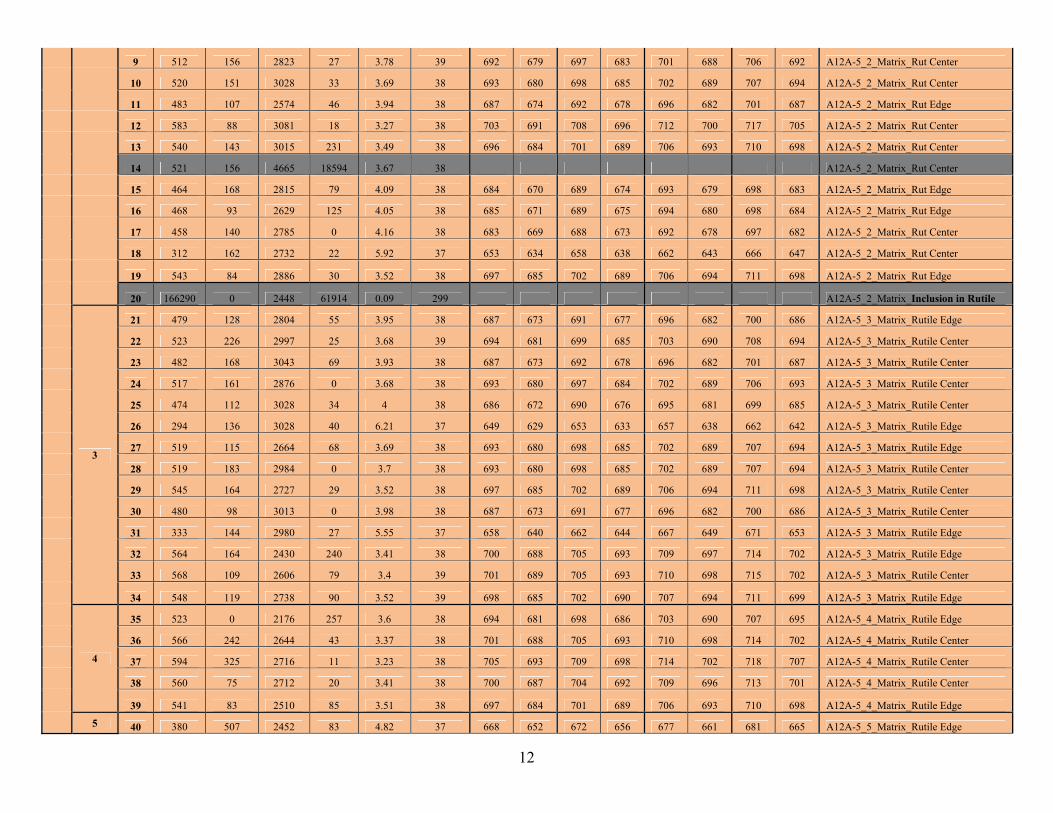
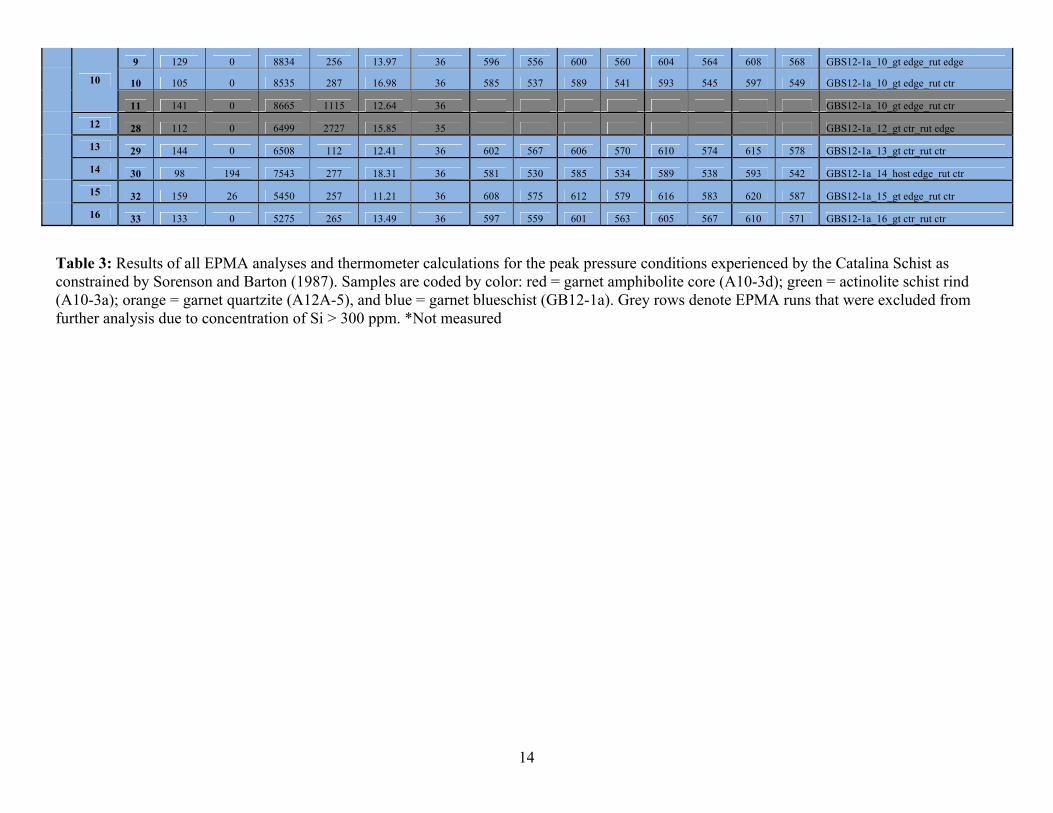
Table 3: Results of all EPMA analyses and thermometer calculations for the peak pressure conditions experienced by the Catalina Schist as constrained by Sorenson and Barton (1987). Samples are coded by color: red = garnet amphibolite core (A10-3d); green = actinolite schist rind (A10-3a); orange = garnet quartzite (A12A-5), and blue = garnet blueschist (GB12-1a). Grey rows denote EPMA runs that were excluded from further analysis due to concentration of Si > 300 ppm. *Not measured
15
8 463 686 101 309 652 1 495 692 1 115 579
9 415 677 102 281 644 2 523 697 2 139 592
10 458 685 103 344 661 3 529 698 18 132 588
1 321 655 104 218 625 4 479 689 19 149 597
2 243 633 105 408 675 5 523 697 20 150 597
23 369 667 106 433 680 6 505 694 9 129 586
24 249 635 107 452 684 7 531 698 10 105 572
18 389 671 108 403 674 8 483 690 13 29 144 594
19 411 676 109 365 666 9 512 695 14 30 98 567
20 448 683 110 427 679 10 520 696 15 32 159 601
21 415 677 111 448 683 11 483 690 16 33 133 588
22 423 678 112 457 685 12 583 706 Mean 587
31 422 678 62 478 689 13 540 699 Std Dev 11
32 460 685 63 471 687 15 464 686 Variance 113
33 416 677 64 499 692 16 468 687 n 11
34 425 679 65 458 685 17 458 685
5a 6 451 684 81 438 681 18 312 653
3 335 659 82 526 697 19 543 700
4 281 644 83 436 681 21 479 689
12 415 677 84 431 680 22 523 697
26 402 674 85 440 682 23 482 689
27 370 667 76 480 689 24 517 696
28 386 670 77 447 683 25 474 688
29 403 674 78 219 625 26 294 648
30 420 678 79 216 624 27 519 696
13 386 670 80 441 682 28 519 696
14 447 683 66 329 657 29 545 700
15 415 677 68 365 666 30 480 689
16 442 682 72 309 652 31 333 658
7 363 665 73 190 614 32 564 703
11 438 681 74 217 624 33 568 704
17 378 669 97 315 654 34 548 701
Mean 672 98 423 678 35 523 697
Std Dev 13 86 416 677 36 566 704
Variance 181 87 421 678 37 594 708
n 32 88 405 674 38 560 703
89 440 682 39 541 700
90 424 678 40 380 669
91 406 675 41 546 700
92 417 677 42 557 702
93 510 694 43 519 696
94 440 682 44 570 704
95 452 684 45 555 702
96 195 616 53 383 670
Mean 669 54 359 664
Std Dev 22 55 389 671
Variance 501 58 519 696
n 44 59 500 693
60 480 689
61 489 691
Mean 691
Std Dev 14
Variance 184
n 50
1
GB
12-1
a
8
9
11
A10
-3a
1
2
6
7
A12
A-5
10
Grain No.
Run No.
1
5
7
12
13
3
Grain No.
Grain No.
4
5
Run No.
Zr (ppm)T (°C) @ 1.0 GPa
2
3
4
Run No.
Grain No.
Run No.
Zr (ppm)T (°C) @ 1.0 GPa
A10
-3d
1
2
3a
3b
5b
6
7
8
Zr (ppm)Zr (ppm)T (°C) @ 1.0 GPa
3
T (°C) @ 1.0 GPa
Appendix A: Data Tables
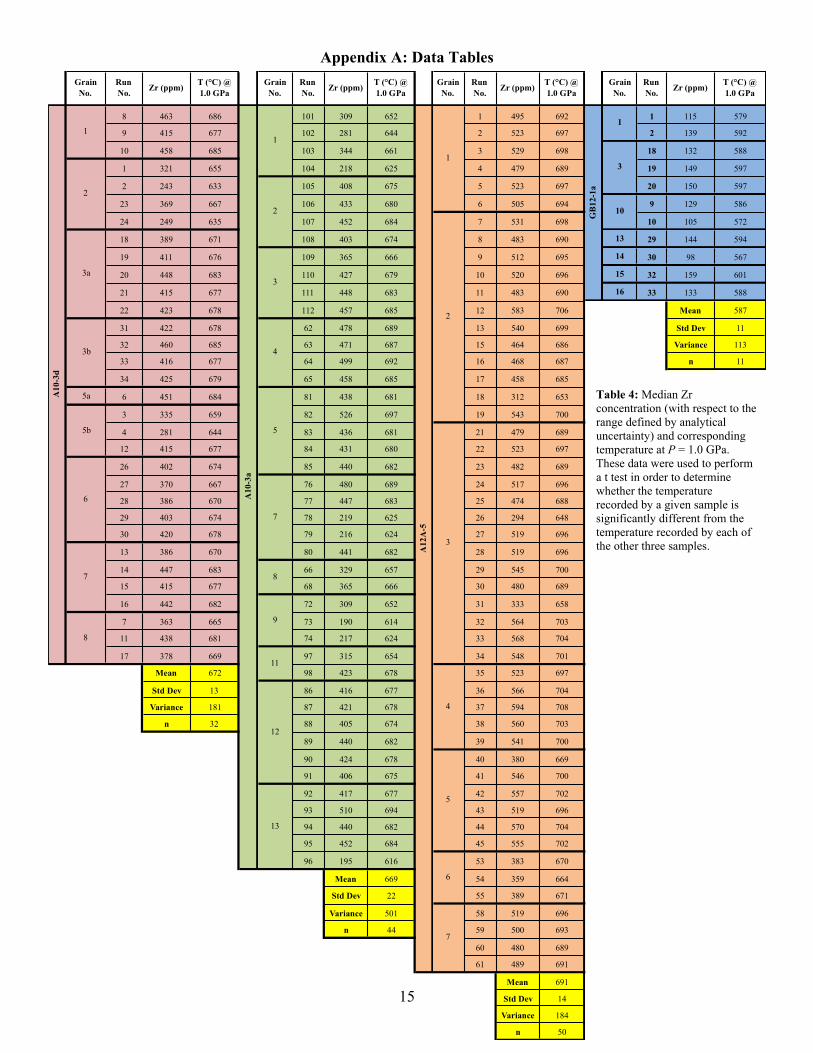
Table 4: Median Zr concentration (with respect to the range defined by analytical uncertainty) and corresponding temperature at P = 1.0 GPa. These data were used to perform a t test in order to determine whether the temperature recorded by a given sample is significantly different from the temperature recorded by each of the other three samples.
16
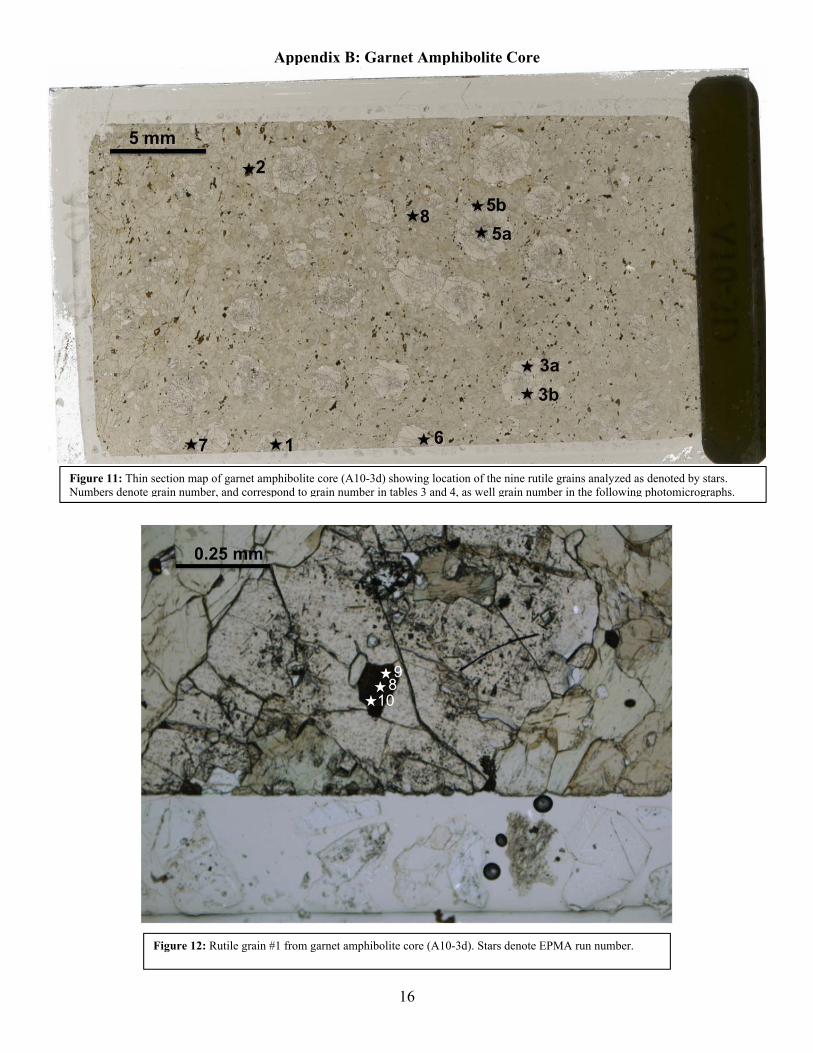
Appendix B: Garnet Amphibolite Core
Figure 11: Thin section map of garnet amphibolite core (A10-3d) showing location of the nine rutile grains analyzed as denoted by stars. Numbers denote grain number, and correspond to grain number in tables 3 and 4, as well grain number in the following photomicrographs.
Figure 12: Rutile grain #1 from garnet amphibolite core (A10-3d). Stars denote EPMA run number.
17
Appendix B: Garnet Amphibolite Core
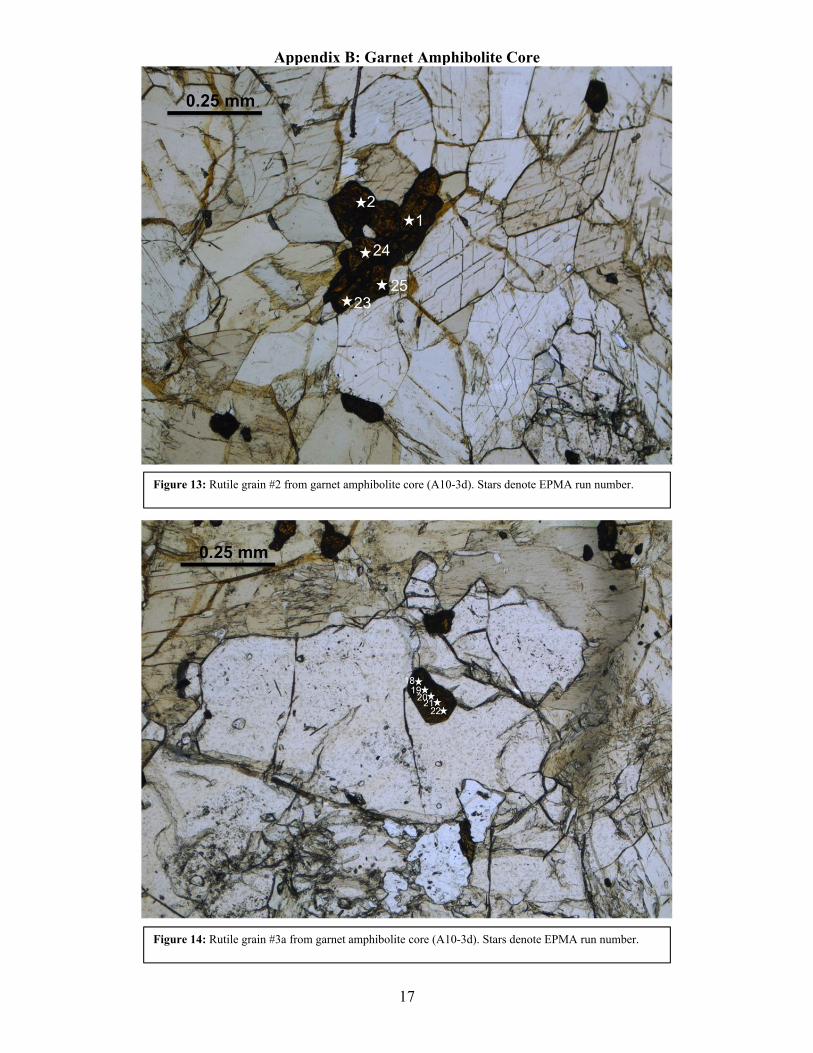
Figure 13: Rutile grain #2 from garnet amphibolite core (A10-3d). Stars denote EPMA run number.
Figure 14: Rutile grain #3a from garnet amphibolite core (A10-3d). Stars denote EPMA run number.
18
Appendix B: Garnet Amphibolite Core
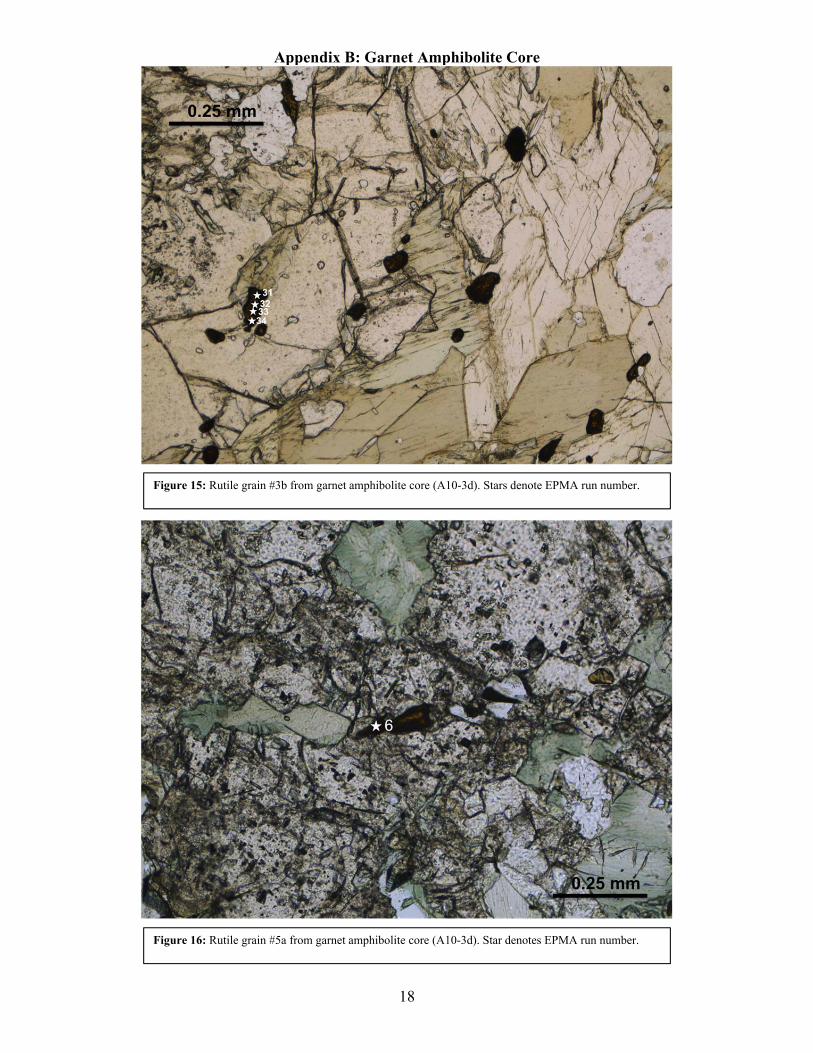
Figure 15: Rutile grain #3b from garnet amphibolite core (A10-3d). Stars denote EPMA run number.
Figure 16: Rutile grain #5a from garnet amphibolite core (A10-3d). Star denotes EPMA run number.
19
Appendix B: Garnet Amphibolite Core
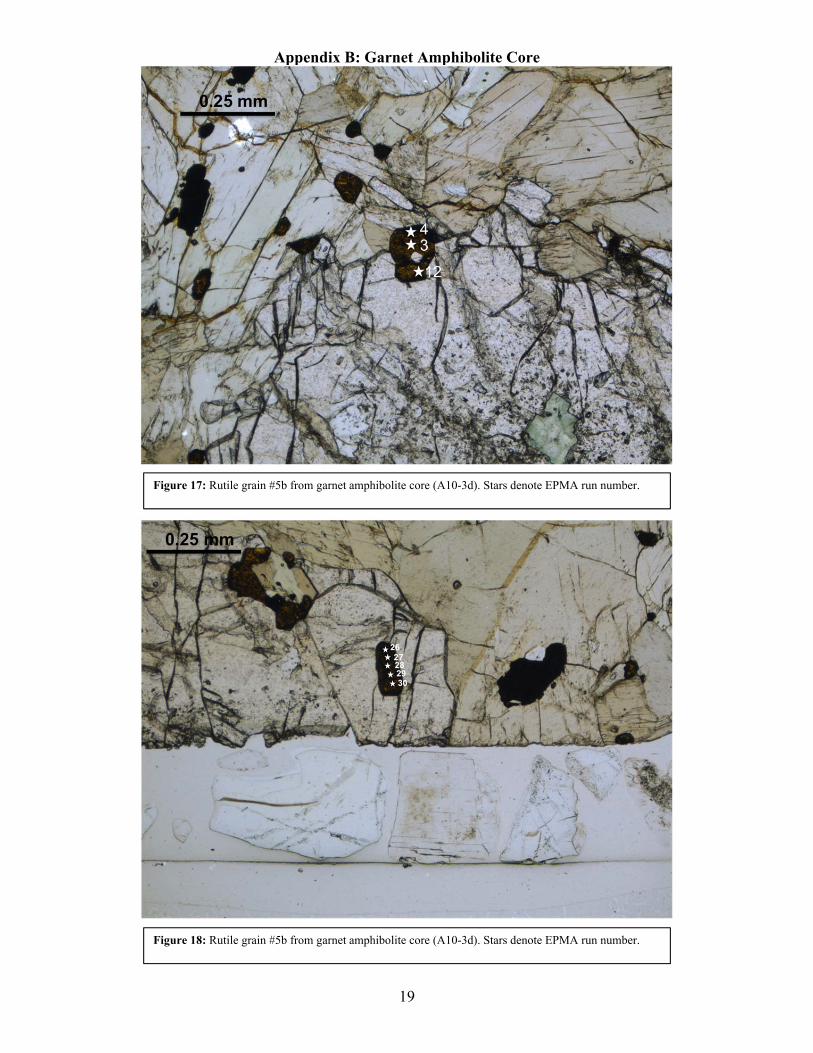
Figure 17: Rutile grain #5b from garnet amphibolite core (A10-3d). Stars denote EPMA run number.
Figure 18: Rutile grain #5b from garnet amphibolite core (A10-3d). Stars denote EPMA run number.
20
Appendix B: Garnet Amphibolite Core
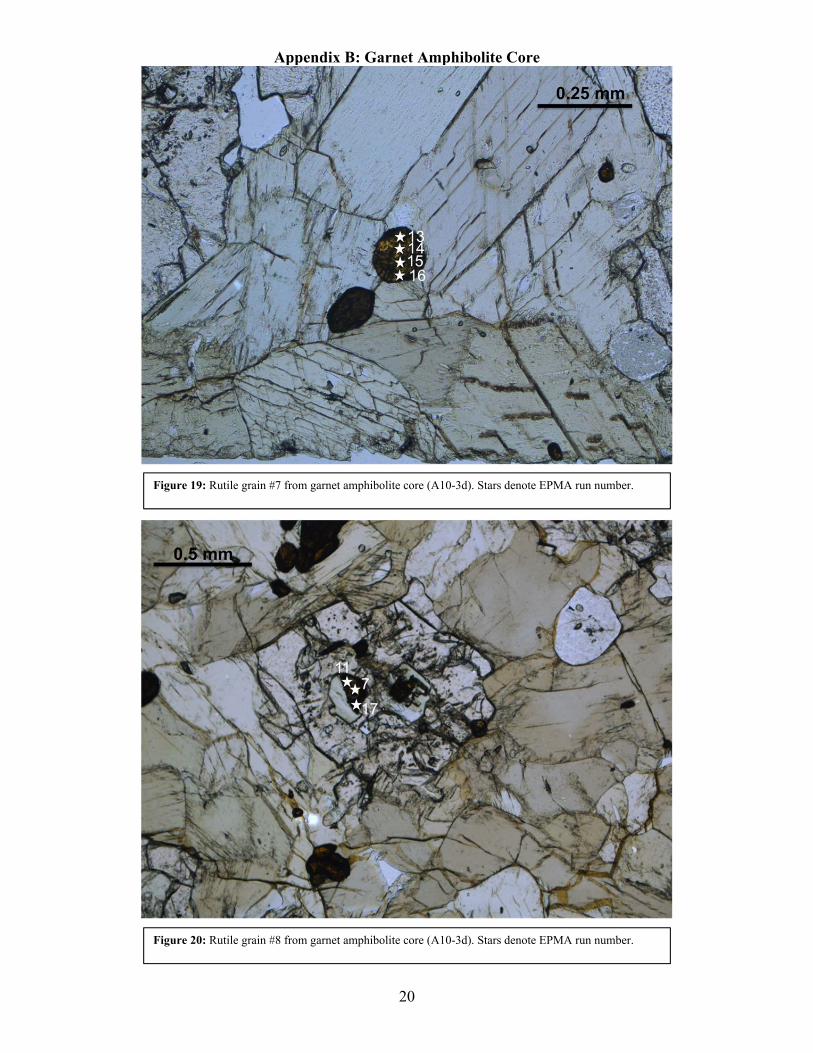
Figure 19: Rutile grain #7 from garnet amphibolite core (A10-3d). Stars denote EPMA run number.
Figure 20: Rutile grain #8 from garnet amphibolite core (A10-3d). Stars denote EPMA run number.
21
Appendix C: Actinolite Schist Rind
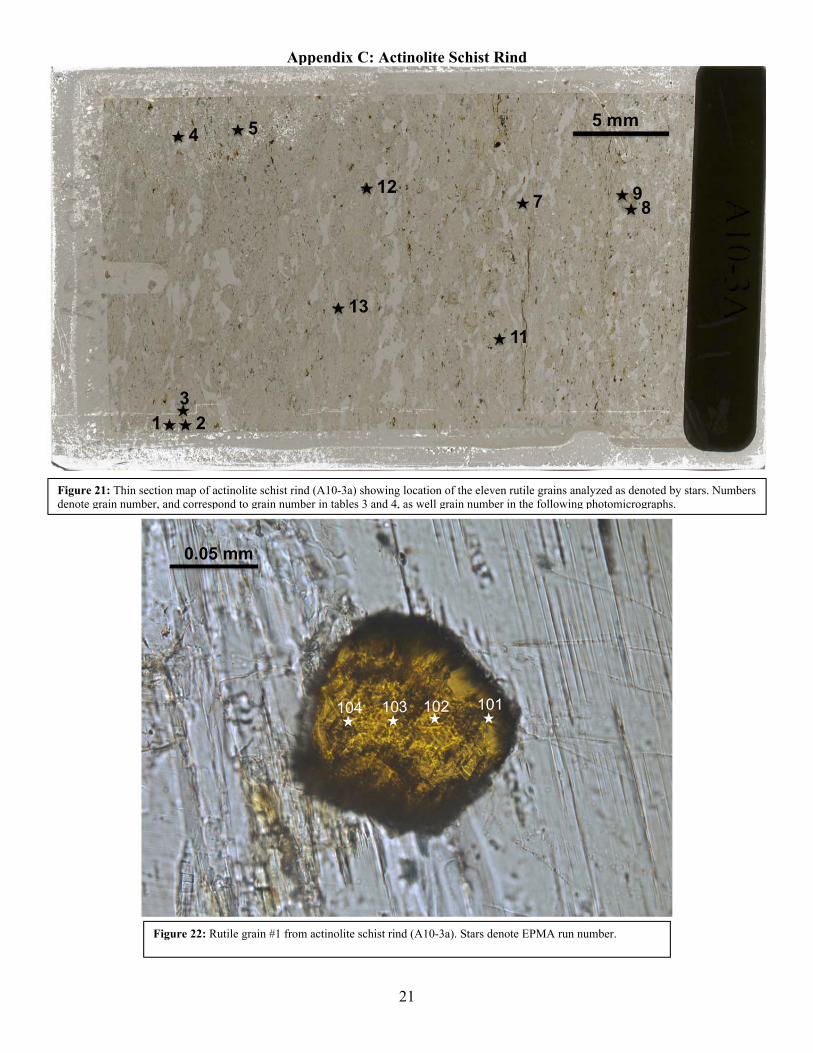
Figure 21: Thin section map of actinolite schist rind (A10-3a) showing location of the eleven rutile grains analyzed as denoted by stars. Numbers denote grain number, and correspond to grain number in tables 3 and 4, as well grain number in the following photomicrographs.
Figure 22: Rutile grain #1 from actinolite schist rind (A10-3a). Stars denote EPMA run number.
22
Appendix C: Actinolite Schist Rind
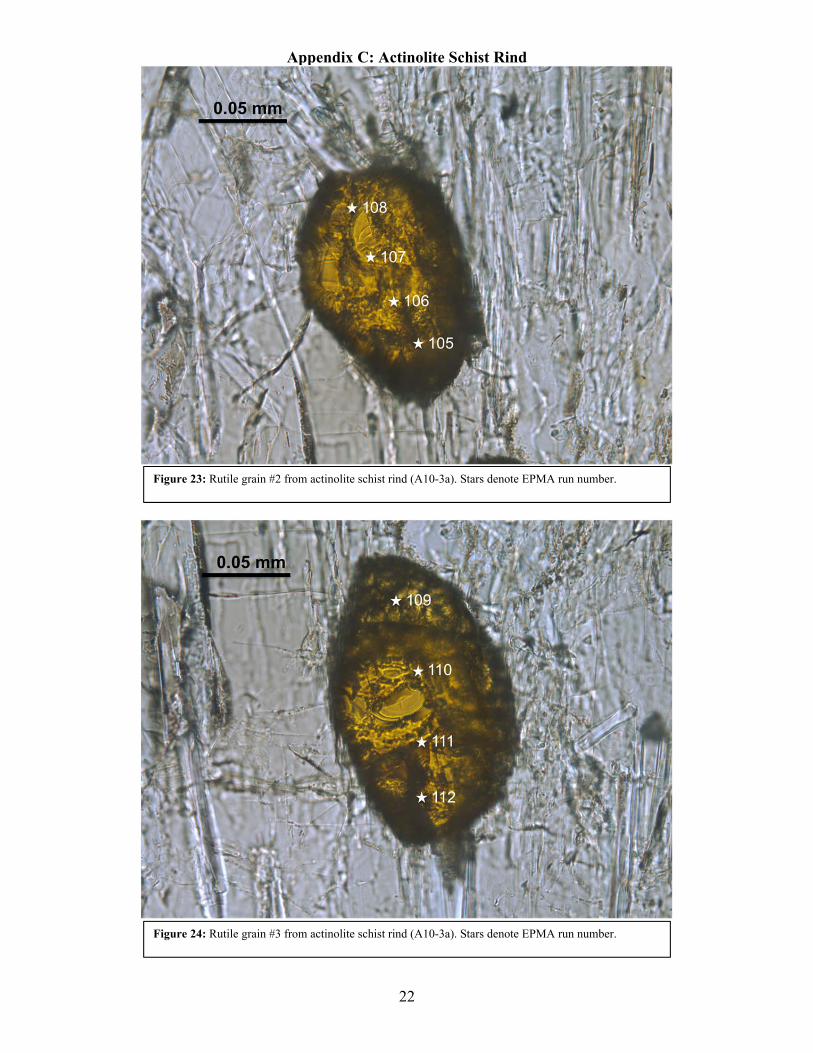
Figure 23: Rutile grain #2 from actinolite schist rind (A10-3a). Stars denote EPMA run number.
Figure 24: Rutile grain #3 from actinolite schist rind (A10-3a). Stars denote EPMA run number.

23
Appendix C: Actinolite Schist Rind
Figure 25: Rutile grain #4 from actinolite schist rind (A10-3a). Stars denote EPMA run number.
Figure 26: Rutile grain #5 from actinolite schist rind (A10-3a). Stars denote EPMA run number.
24
Appendix C: Actinolite Schist Rind
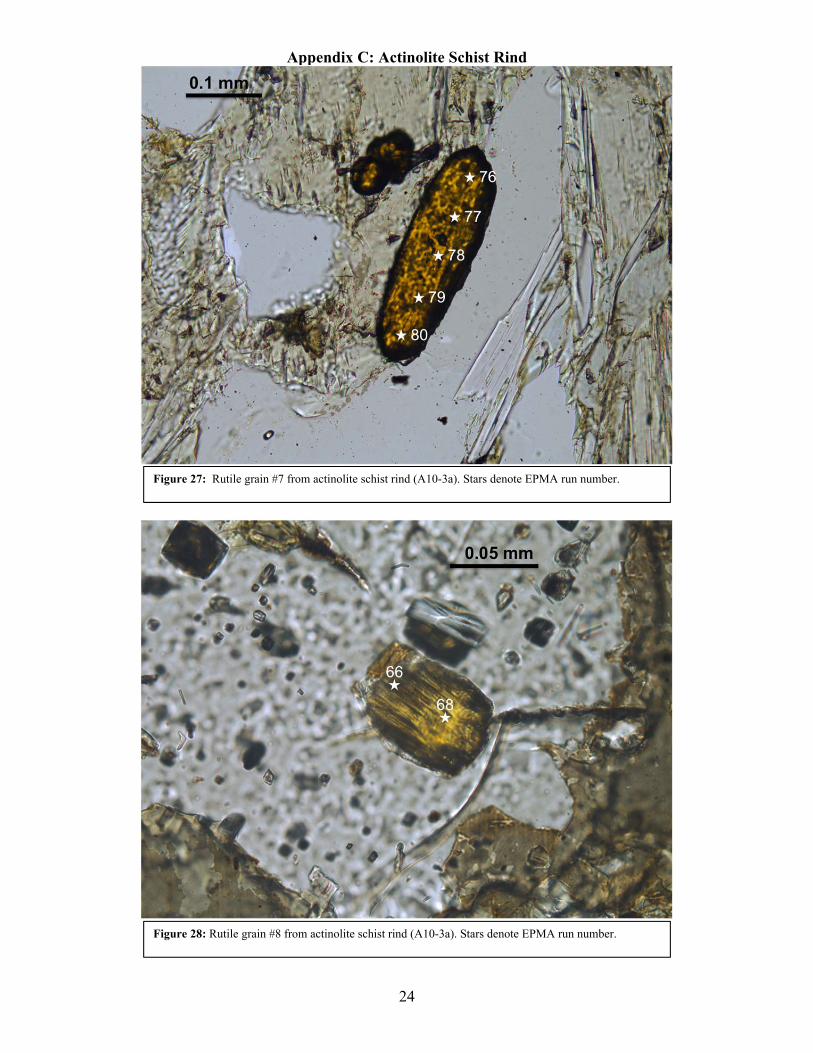
Figure 27: Rutile grain #7 from actinolite schist rind (A10-3a). Stars denote EPMA run number.
Figure 28: Rutile grain #8 from actinolite schist rind (A10-3a). Stars denote EPMA run number.

25
Appendix C: Actinolite Schist Rind
Figure 29: Rutile grain #9 from actinolite schist rind (A10-3a). Stars denote EPMA run number.
Figure 30: Rutile grain #10 from actinolite schist rind (A10-3a). Stars denote EPMA run number.
26
Appendix C: Actinolite Schist Rind
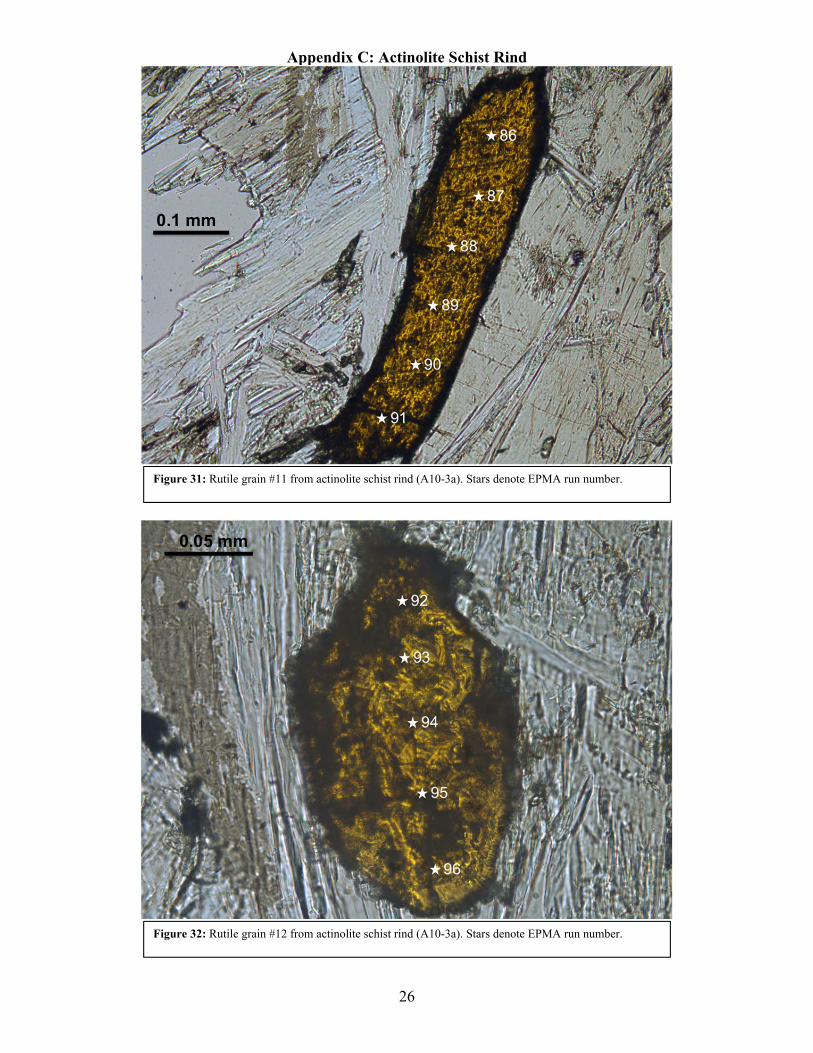
Figure 31: Rutile grain #11 from actinolite schist rind (A10-3a). Stars denote EPMA run number.
Figure 32: Rutile grain #12 from actinolite schist rind (A10-3a). Stars denote EPMA run number.
27
Appendix D: Garnet Quartzite
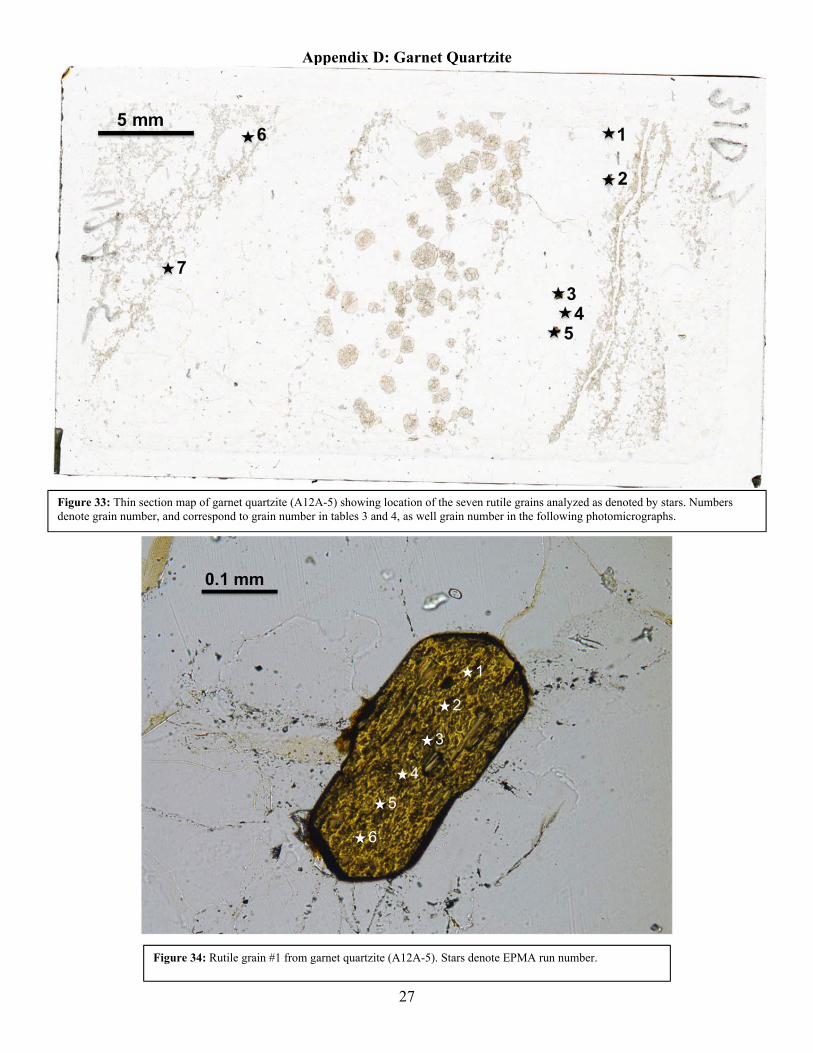
Figure 33: Thin section map of garnet quartzite (A12A-5) showing location of the seven rutile grains analyzed as denoted by stars. Numbers denote grain number, and correspond to grain number in tables 3 and 4, as well grain number in the following photomicrographs.
Figure 34: Rutile grain #1 from garnet quartzite (A12A-5). Stars denote EPMA run number.
28
Appendix D: Garnet Quartzite
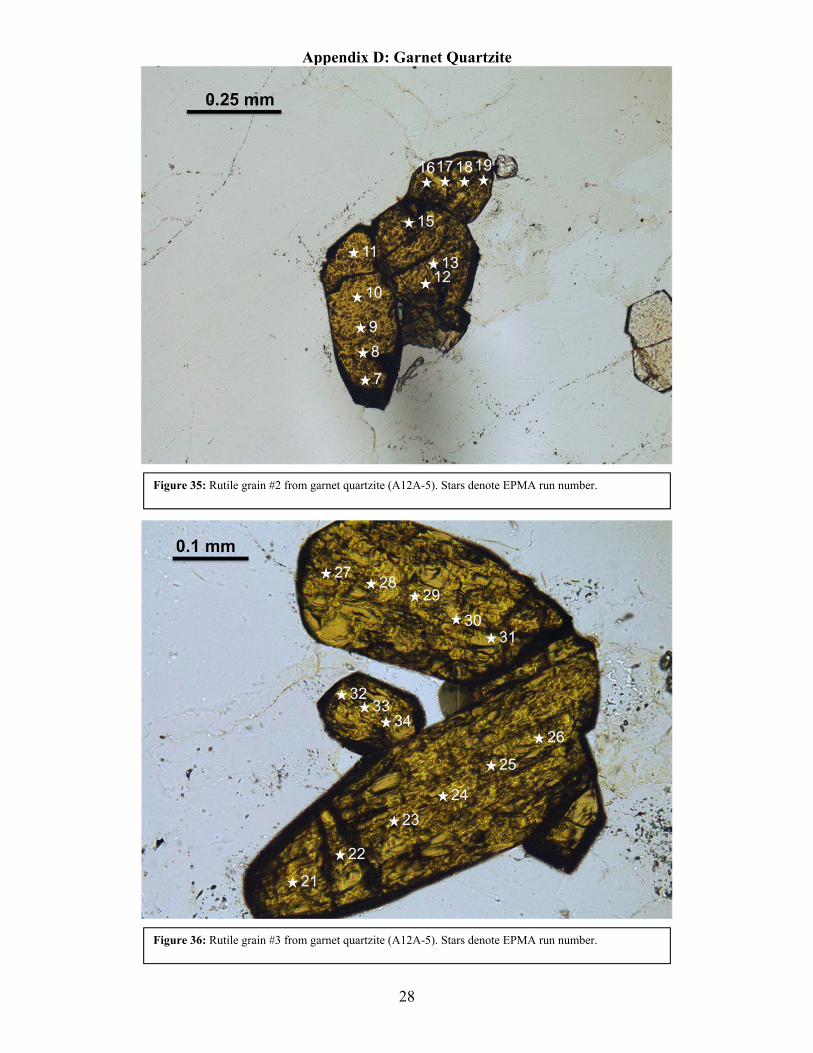
Figure 35: Rutile grain #2 from garnet quartzite (A12A-5). Stars denote EPMA run number.
Figure 36: Rutile grain #3 from garnet quartzite (A12A-5). Stars denote EPMA run number.
29
Appendix D: Garnet Quartzite
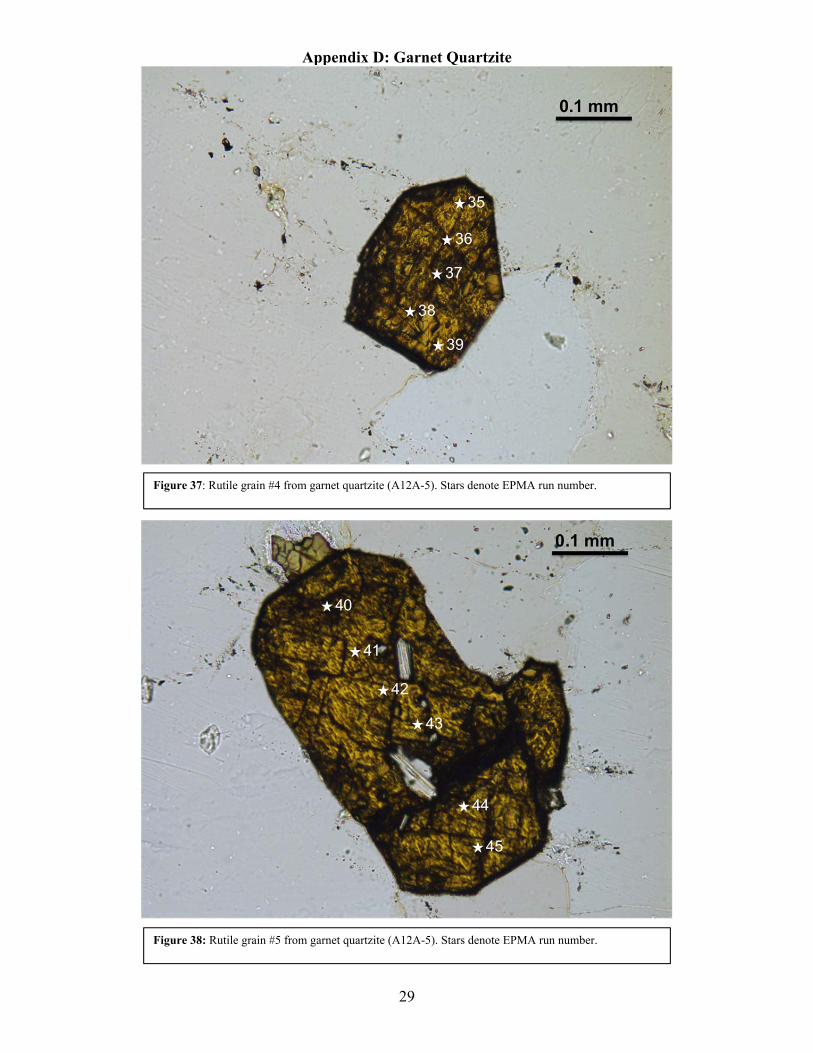
Figure 37: Rutile grain #4 from garnet quartzite (A12A-5). Stars denote EPMA run number.
Figure 38: Rutile grain #5 from garnet quartzite (A12A-5). Stars denote EPMA run number.

30
Appendix D: Garnet Quartzite
Figure 39: Rutile grain #6 from garnet quartzite (A12A-5). Stars denote EPMA run number.
Figure 40: Rutile grain #7 from garnet quartzite (A12A-5). Stars denote EPMA run number.
31
Appendix E: Garnet Blueschist
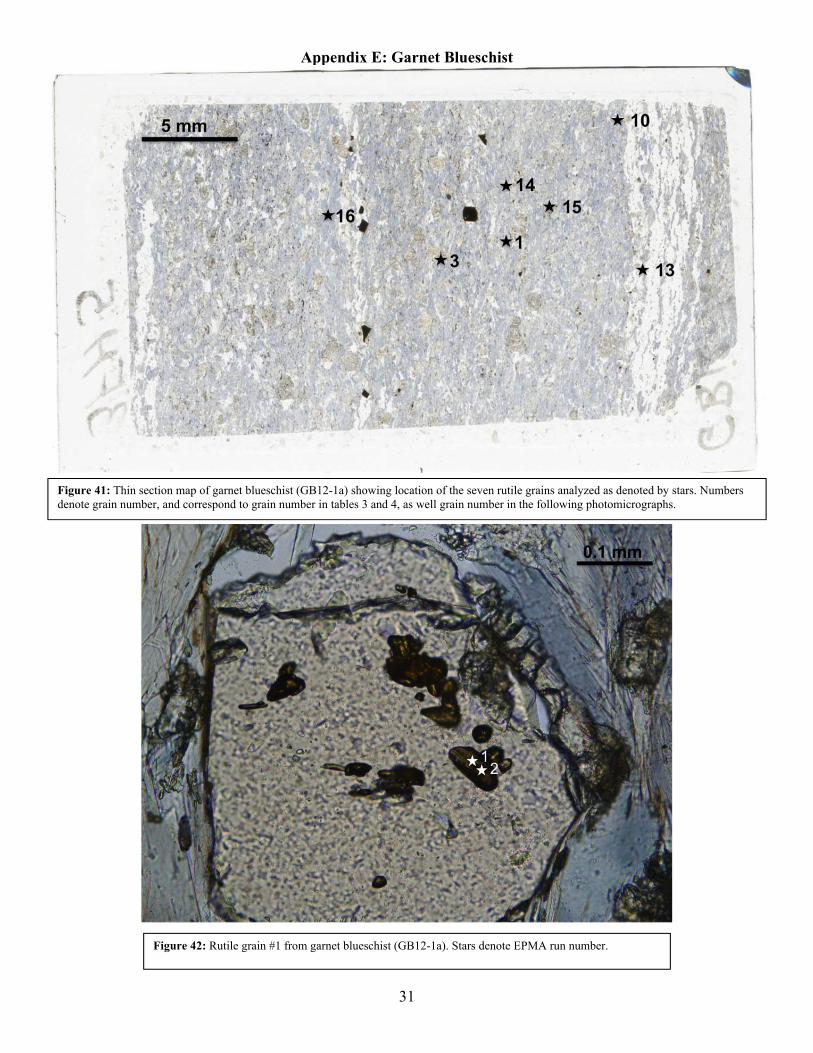
Figure 41: Thin section map of garnet blueschist (GB12-1a) showing location of the seven rutile grains analyzed as denoted by stars. Numbers denote grain number, and correspond to grain number in tables 3 and 4, as well grain number in the following photomicrographs.
Figure 42: Rutile grain #1 from garnet blueschist (GB12-1a). Stars denote EPMA run number.

32
Appendix E: Garnet Blueschist
Figure 43: Rutile grain #3 from garnet blueschist (GB12-1a). Stars denote EPMA run number.
Figure 44: Rutile grain #10 from garnet blueschist (GB12-1a). Stars denote EPMA run number.
33
Appendix E: Garnet Blueschist
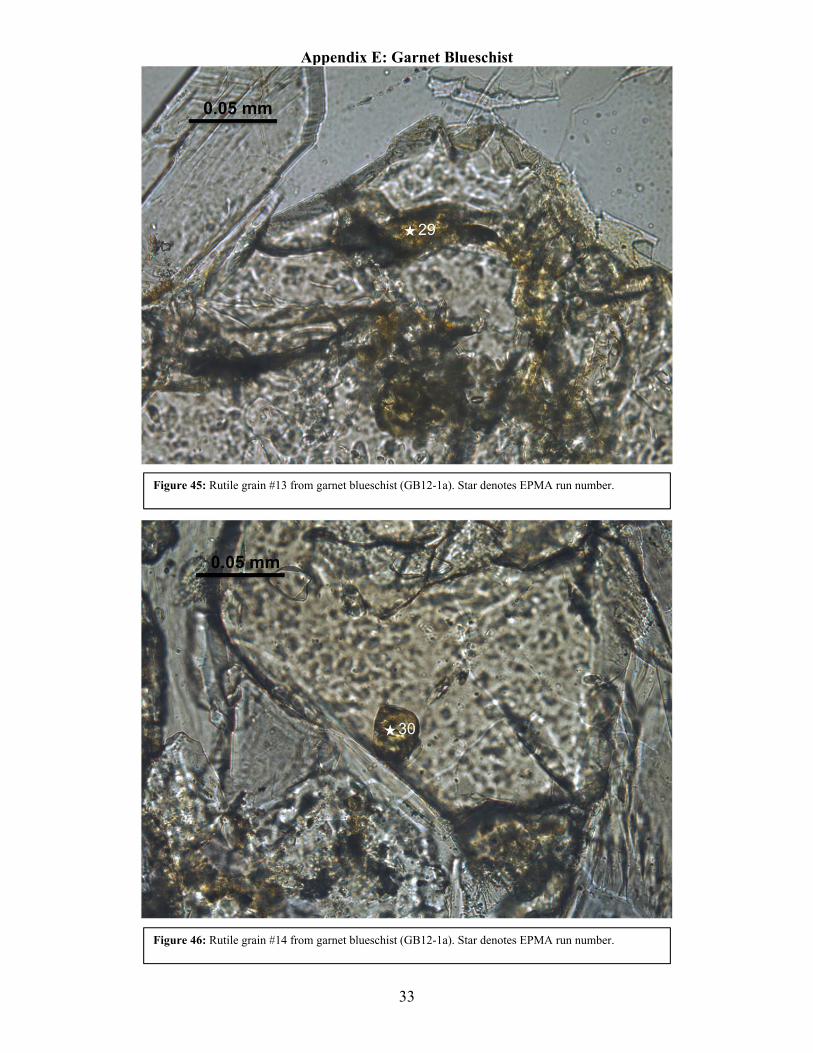
Figure 45: Rutile grain #13 from garnet blueschist (GB12-1a). Star denotes EPMA run number.
Figure 46: Rutile grain #14 from garnet blueschist (GB12-1a). Star denotes EPMA run number.
34
Appendix E: Garnet Blueschist
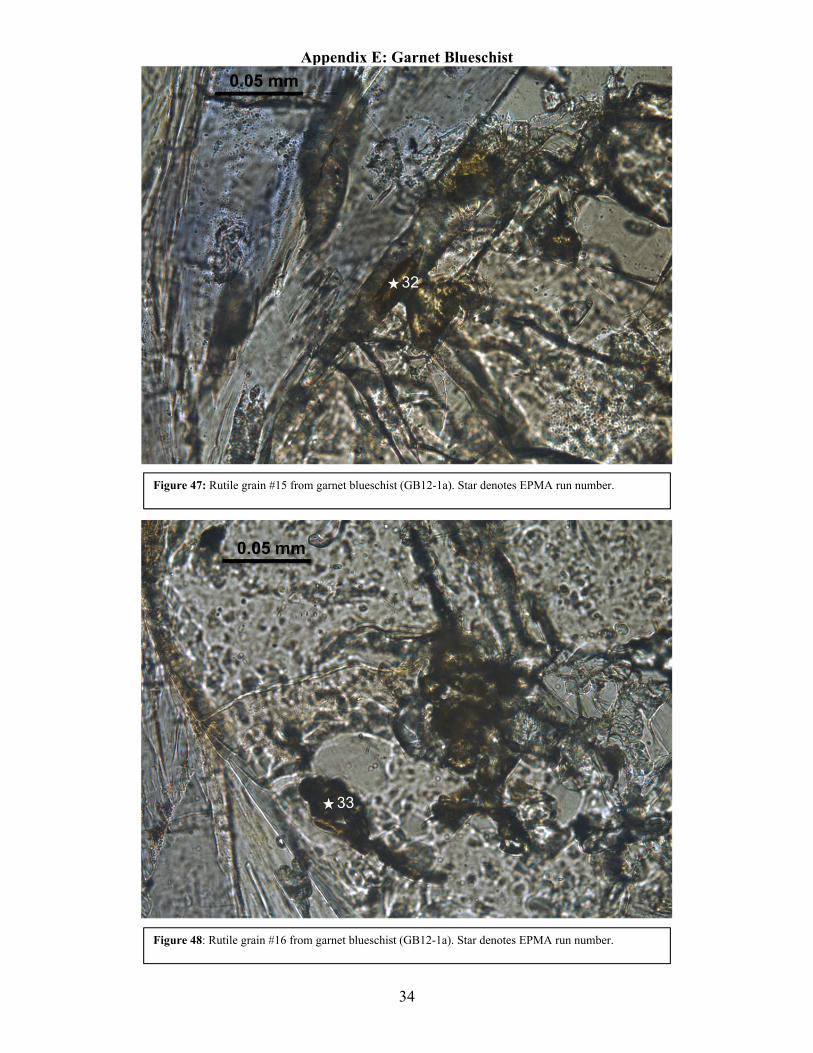
Figure 47: Rutile grain #15 from garnet blueschist (GB12-1a). Star denotes EPMA run number.
Figure 48: Rutile grain #16 from garnet blueschist (GB12-1a). Star denotes EPMA run number.


![Molecular gas thermometry on acetylene using dual-comb ...Dual-comb spectroscopy (DCS) [1817] is an attrac, - tive spectroscopic tool that enables us to observe multiple absorption](https://img.pdfslide.tips/doc/110x75/5e6f07a46a688c265779e52b/molecular-gas-thermometry-on-acetylene-using-dual-comb-dual-comb-spectroscopy.jpg)

![No. 2 ジルコニウム Zirconium - JIM元素名Zirconium,原子番号40,質量数91.22 g mol-1,電子配置[Kr]4d25s2,密度6.507 Mg・m-3(293 K),結晶構造a Zr 六方最密(~1143](https://img.pdfslide.tips/doc/110x75/6028445c97f8530f6846b1d8/no-2-fff-zirconium-jim-fczirconiumioec40ioeee9122.jpg)


![INTELLIGENT NETWORKED SENSORS FOR INCREASED TRAFFIC …460376/FULLTEXT01.pdf · Paper III Infrared Thermometry in winter road maintenance [3] Patrik Jonsson, Mats Riehm Manuscript](https://img.pdfslide.tips/doc/110x75/5ffe55604b37640a6277a7f7/intelligent-networked-sensors-for-increased-traffic-460376fulltext01pdf-paper.jpg)